Temi di Discussione - COnnecting REpositories · PDF fileThe purpose of the Temi di...
34
Temi di Discussione (Working Papers) Public sector efficiency and political culture by Raffaela Giordano and Pietro Tommasino Number 786 January 2011
Transcript of Temi di Discussione - COnnecting REpositories · PDF fileThe purpose of the Temi di...

Temi di Discussione(Working Papers)
Public sector efficiency and political culture
by Raffaela Giordano and Pietro Tommasino
Num
ber 786Ja
nu
ary
2011


Temi di discussione(Working papers)
Public sector efficiency and political culture
by Raffaela Giordano and Pietro Tommasino
Number 786 - January 2011

The purpose of the Temi di discussione series is to promote the circulation of workingpapers prepared within the Bank of Italy or presented in Bank seminars by outside economists with the aim of stimulating comments and suggestions.
The views expressed in the articles are those of the authors and do not involve the responsibility of the Bank.
Editorial Board: MARCELLO PERICOLI, SILVIA MAGRI, LUISA CARPINELLI, EMANUELA CIAPANNA, DANIELA MARCONI, ANDREA NERI, MARZIA ROMANELLI, CONCETTA RONDINELLI,TIZIANO ROPELE, ANDREA SILVESTRINI.
Editorial Assistants: ROBERTO MARANO, NICOLETTA OLIVANTI.

PUBLIC SECTOR EFFICIENCY AND POLITICAL CULTURE by Raffaela Giordano* and Pietro Tommasino*
Abstract
The capability of a country's public sector to provide high-quality goods and services in a cost-effective way is crucial to fostering long-term growth. In this paper we study the determinants of public service efficiency (PSE) and in particular the role of citizens' political values. Indeed, we argue that citizens' willingness to invest time and effort monitoring public affairs is necessary if policy-makers are to be held accountable for what they do and deterred from wasting public resources. Contrary to other papers, our empirical analysis exploits within-country variation, therefore reducing the risk of omitted variable bias and implicitly controlling for differences in formal institutions. First, we compute PSE measures for several public services (namely education, civil justice, healthcare, childcare and waste disposal) for the 103 Italian provinces; then we show that a higher degree of political engagement increases PSE. This remains true even after controlling for the possible endogeneity of political culture. In our analysis, values specifically related to the political sphere are kept distinct from generically pro-social values. Our results suggest that the latter have no independent impact on PSE.
JEL Classification: C14, H50, H77, Z13. Keywords: public spending, efficiency, culture.
Contents 1. Introduction.......................................................................................................................... 5 2. Public sector efficiency in the Italian provinces.................................................................. 7
2.1 Defining (in)efficiency ................................................................................................. 7 2.2 Estimating the frontier .................................................................................................. 8 2.3 Input and output measures for the Italian public sector................................................ 9 2.4 The map of public sector efficiency in Italy............................................................... 11
3. The determinants of public sector efficiency..................................................................... 12 3.1 A simple framework ................................................................................................... 12 3.2 Measuring interest in politics ..................................................................................... 14
4. Empirical analysis.............................................................................................................. 15 4.1 OLS estimation ........................................................................................................... 15 4.2 Instrumental variables estimation............................................................................... 16
5. Extension: the role of decentralization .............................................................................. 17 6. Conclusions ....................................................................................................................... 18 References .............................................................................................................................. 19 Tables ..................................................................................................................................... 23
_______________________________________
* Bank of Italy, Structural Economic Analysis Department.

1 Introduction1
The capability of a country's public sector to provide high-quality goods and services in a cost-e�ective way is crucial to foster long-term growth. It's up to politicians and bureaucrats to setrules and practices which increase e�ciency and reduce slack, delivering the highest possible valuefor money to taxpayers.
The literature on political economy and public choice stresses that one cannot take for grantedthat public decision-makers will always use public resources in the most appropriate way. The rela-tionship between citizens and politicians is to some extent similar to a principal-agent relationship,which creates risks of opportunistic behaviour and moral hazard.2
As we cannot have unquestioning faith in the honesty and competence of public decision-makers,there is the need for well-designed formal rules for the political and administrative system: electoralrules, term limits, checks and balances, etc.
However, citizens' willingness to invest time and e�ort monitoring public a�airs is also necessaryif policy-makers are to be held accountable for what they do and deterred from wasting publicresources. This in turn requires both a shared set of values which go beyond narrow self-interestand, in particular, a widespread concern for public a�airs. Indeed, there is a well-known free-ridingproblem inherent in the political sphere: the impact of a single individual on outcomes is negligible,whereas mobilizing for elections and other political activities redirects time and resources from thecare of one's private a�airs, and can be quite costly.
The �rst and foremost goal of this paper is to assess empirically the importance of citizens'political engagement for public sector e�ciency (PSE). To this aim, we �rst compute measures ofe�ciency for several public services (namely childcare, education, healthcare, civil justice and wastedisposal), for the 103 Italian provinces, Then we relate these PSE indicators to the propensity tobe politically active. Looking at within-country di�erences, our approach implicitly controls fordi�erences in formal institutions, and limits omitted variable bias. As we document in the �rstpart of the paper, we are helped by the fact that there are big di�erences in PSE across Italy'sregions and provinces, despite 150 years elapsing since the political and administrative uni�cationof the country.
Measuring people's values is obviously problematic, but we rely on proxies used in severalprevious studies. Besides measurement problems, however, there is the concern that the degreeof political engagement may be endogenous. This is a common problem with any attempt to usevalues to explain political or economic outcomes (Guiso et al. 2006). We would ideally like tocapture only the e�ects of the truly exogenous component of values, which is really part of the
1The views expressed in the paper are those of the authors and do not necessarily re ect those of the Bank ofItaly. We are grateful, without implications, to Massimo Bordignon, Piero Cipollone, Silvia Giacomelli, CristinaGiorgiantonio, Veronica Grembi, Luigi Guiso, Giovanna Messina and Marzia Romanelli for data and advice. Specialthanks go to Marco Casiraghi, who provided PSE estimates for a previous version of the paper. We also thank seminarparticipants at the Bank of Italy, the European Commission (DG ECFIN), the Annual Meeting of the EuropeanPublic Choice Society, the 8th Journ�ees Louis-Andr�e G�erard-Varet, the Annual Meeting of the European EconomicAssociation, the XXI SIEP Conference and the Annual meeting of the American Political Science Association foruseful comments and suggestions.
2The literature on the agency relationship between citizens and politicians is thoroughly surveyed by Besley (2006).Of course, by focusing on this relationship we do not mean to downplay the other con icts that shape political life, inparticular that between groups of citizens with con icting goals and values. However, in a context in which e�ciencyis the main dependent variable, the latter problem seems less pressing: even if people disagree about the size and thecomposition of public sector activities, they should all agree on the fact that public resources should not be wasted.
5
society's cultural heritage, that is \those customary beliefs and values that ethnic, religious andsocial groups transmit fairly unchanged from generation to generation" (Guiso et al., 2006).3 Inorder to address the endogeneity of political values (as well as measurement error) we instrumentthem with two sets of variables: measures of political and social participation in early 20th centuryItaly (from Nuzzo, 2006), and features of formal political institutions in place in the 14th century(from de Blasio and Nuzzo, 2006). Indeed, while Italy is still quite homogenenous ethnically and interms of religion, the Italian regions are deeply di�erent with respect to their century-long politicalhistory, and there is a vast literature arguing that Italy's ancient vicissitudes still partly shape itscontemporary political life (Putnam, 1993).
Our paper relates to a growing body of literature assessing the e�ects of culture on governmentperformance. The seminal papers on this issue are Knack and Keefer (1997) and La Porta et al.(1997).4 Both studies use a cross section of about 40 countries, and take indicators of trust andcivicness from the World Value Survey. However, drawing inferences from cross-country data isproblematic, due to the high number of possibly relevant variables. Moreover, as pointed out byGuiso et al. (2006), these early contributions did not control for the endogeneity of trust. Ourpaper is more closely related to Knack (2002), which uses data from US states (and controls forpossible endogeneity). Our approach di�ers from his because we use objective e�ciency indicatorsas our dependent variable instead of perceived quality. We believe this is appropriate given thatexpectations concerning government performance might be unreliable: individuals in areas in whichshort-sighted sel�shness and distrust are widespread, and governments consistently under-perform,will probably expect less from their politicians and public o�cials. Objective measures analogousto ours have recently been computed for a cross-section of countries by international organizations,such as the OECD (Hakkinen and Joumard, 2007, Sutherland et al, 2007), the IMF (Verhoeven etal. 2007) and the European Commission (European Commission, 2008).5A paper in many respectssimilar ro ours is the one by Borge et al. (2008) . The authors build an aggregate objective index ofpublic sector e�ciency for almost 400 Norwegian provinces, for the years 2001-2005, encompassingsix service sectors (elderly care, primary and lower secondary education, daycare, welfare bene�ts,child custody and primary healthcare). The index is a simple ratio of a performance indicator(expressed in relation to the sample mean) and the amount of available �scal resources. Theyrelate this index to local government revenues and to local political characteristics such as partyfragmentation, the left-wing majority, voter turnout, and top-down vs bottom-up budgetary proce-dures. They �nd in particular that more cohesive government and stronger democratic participationincrease e�ciency but do not address the issue of endogeneity.
More generally, our paper aims to contribute to the broader debate on the impact of culturaltraits on economic outcomes (Tabellini, 2008a, 2010). With respect to this literature, we try tokeep distinct generically pro-social values (so-called \generalized morality") from values inherent
3This is actually the de�nition of culture that we adopt in this paper. Furthermore, we follow the political scienceliterature and call "political culture" that particular subset of beliefs and values speci�cally related to the politicalsphere: views about how the political system should function and beliefs about the ways it actually functions, viewsabout how people should behave in the political sphere and beliefs about they actually behave. In the paper we focuson a crucial item in any political culture, namely the extent to which citizens feel a moral obligation to participateto political life. We refer to this sense of obligation indi�erently as "political engagement", "interest in politics", or"propensity to participate".
4See also La Porta et al. (1999).5See also OECD (2008) and Afonso et al. (2005). Within-country studies are also frequent. Afonso and Scaglioni
(2007) provide e�ciency measures for Italy at the Region level.
6
to the political sphere. We adhere to the idea, well-established in political science at least sinceAlmond and Verba (1963), that political values (and more generally political culture), should bedistinguished by morals. For example, it may well be possible that in recent decades there hasbeen an increase in people's willingness to participate in pro-social activities (e.g. volunteering forNGOs) together with a growing disillusion and detachment from politics (Inglehart, 1977).6As wewill argue below, at least in the in the case of Italy, it seems that political participation is muchmore relevant than generalized morality per se in explaining di�erences in PSE.7
The rest of the paper is structured as follows: in the second section we compute and discuss ourmeasures of PSE for �ve public services; in the third section we present and justify our baselineeconometric exercise; in section 4 we report the results; section 5 discusses the role of decentraliza-tion in service provision; and section 6 concludes.
2 Public sector e�ciency in the Italian provinces
2.1 De�ning (in)e�ciency
There are several well-established de�nitions of (in)e�ciency of a production unit (be it an industrialplant, a �rm or a public entity) in the microeconomic literature (see e.g. Fried et al. 2008). Inthis paper we use concepts of technical e�ciency, all of which boil down to a comparison betweenactual and potential performance. More formally, suppose that several production units produce acertain (vector of ) output y with a certain (vector of) input x, where T is the set of all technicallypossible input-output combinations. De�ne:
L(y) = fxj(x; y) 2 Tg
P (x) = fyj(x; y) 2 Tg
F (x) =Maxfyjy 2 P (x)g
Then a natural measure of ine�ciency for a production unit i, which produces output yi withinput xi, is:
IneffOUTi =Maxf� 2 R+jyi� 2 P (xi)g:
Basically, it de�nes ine�ciency as the ratio between potential (given technology and inputs)and actual performance. In turn, the inverse of IneffOUTi can be taken as a measure of e�ciency:
EffOUTi =1
IneffOUTi
:
Another widely used measure is provided by:
Eff INPi =Minf� 2 R+jxi� 2 L(yi)g:6In the same vein, people in a community might have a high degree of interpersonal trust, but be sceptical about
the possibility of e�ectively in uencing public policies.7Of course, pro-social values can also have a positive indirect in uence on public service e�ciency, if they increase
political engagement (for example raising the likelihood of having honest politicians).
7
It measures how much less input unit i could use to produce the level of output it actuallyproduces.8IneffOUTi and Eff INPi are also referred to, respectively, as output-oriented and input-oriented Debreu-Farrell indices, while EffOUTi is known as the Shephard index.9
In the rest of the paper, unless otherwise stated, we focus on EffOUTi as our preferred de�nitionof e�ciency. We check that our results do not change with di�erent de�nitions of e�ciency.
2.2 Estimating the frontier
Whatever the de�nition of e�ciency adopted, the main problem encountered in measuring e�-ciency is how to �nd out the production frontier. In practice e�cient performances are de�ned asun-dominated performances, i.e. performances located on the \best practice frontier". To constructthis frontier from the observed input-output pairs (xi; yi), two approaches have been used in the lit-erature: the parametric and the non-parametric approaches. The advantage of the non-parametricapproach is of course that it does not require the speci�cation of a functional form, so that it avoidsthe risk of confusing the e�ects of misspeci�cation of the functional form with those of ine�ciency.The basic idea underlying non parametric methods is quite simple. Given our sample of productionunits (xi; yi), we use this sample to deduce the production possibility set T. Once we have thisapproximation of T - let us call it T 0- we will also have approximations of the sets L(x), P(x) andF(x):
L0(y) =�xj(x; y) 2 T 0
P 0(x) =
�yj(x; y) 2 T 0
F 0(x) =Maxfyjy 2 P 0(x)g:
Non-parametric methods di�er in how they build T 0. Our baseline measure of the e�ciency ofpublic spending in the Italian provinces is constructed applying a commonly used non-parametricmethod, called Data Envelopment Analysis (DEA). In the DEA approach, T 0 is identi�ed as theintersection of all the production sets which satisfy the following list of assumptions: (1) all the(xi; yi) belong to the set; (2) free disposability; (3) convexity; (4) a strictly positive amount ofinput is needed to produce a strictly positive amount of output.10 In practice, the various e�ciencyindexes in a non-parametric setting are computed solving linear programming problems.11
8In the presence of constant return to scale the two scores coincide.9As IneffOUTi takes values between 1 and +1, EffOUTi takes values in (0,1). When we use e�ciency as the
dependent variable in our econometric exercises, we actually use the ratio of EffOUTi to the average level.10Another non-parametric approach that can be used to assess productive e�ciency is the FDH (Free Disposal
Hull) technique. The main di�erence between the two methodologies is that in the FDH assumption 1 (convexity) isdropped. The DEA e�ciency frontier always encompasses the FDH frontier, so that some units which are e�cientaccording to the FDH method are instead ine�cient according the DEA technique (see Tanassoulis et al. 2008 forfurther details).11In the case of 1 input, 1 output and N productive units, EffINPi equals:
EffINPi =Min
(� subject to :
NXj=1
xj�j � �xi;NXj=1
yj�j � yi;�j � 08j;NXj=1
�j = 1
):
IneffOUTi is instead computed as:
8
Moreover, to check further the robustness of our results, we also use parametric tecniques. Inparticular, we follow most of the literature by assuming a log-linear relationship:
lnyi = �0 + �1lnxi + ui:
We �rst assume that ui � 0 (known as the \deterministic approach"). As a further exercise, wealso make the alternative assumption that the error term is decomposable into a truly ine�ciencycomponent and a random error:
ui = u1i + u2i
where u1i � 0 is half-normal and u2i is a standard normal error term (the \stochastic approach").12In both cases, the frontier is then given by the function:
lny = �̂0 + �̂1lnx:
2.3 Input and output measures for the Italian public sector
In assessing the e�ciency of the public sector in the 103 Italian provinces we focus on �ve spendingcategories. Two of them are the responsibility of the central government (the judiciary and edu-cation); one is within the remit of the regional governments (health); the remaining two (childcareand waste collection) are administered by the local governments.13 Depending on the sector, weconsider averages over a given period of time (assuming that it takes time for public interventionto in uence outcomes) or the most recent year for which data are available (when we have morestraightforward output measures). In what follows we provide information about how we measureinputs and outputs for each of the �ve spending categories and our data sources.
Health { We use as input per capita public health expenditure adjusted for the age structureof the population. We take averages over the years 1985-2007. Our computation is based on o�cialexpenditure and population statistics, and on coe�cients provided by the Ministry of Health tocompute the equivalent population (intuitively, these coe�cients correct for the fact that healthexpenditure is concentrated in particular age-groups, so that regions with a higher share of elderlypeople tend to have higher per capita spending). All these data refer to the 20 Italian regions.Given the lack of province-level data, we assume here that our input measure does not vary acrossprovinces within the same region. Our health performance indicator is the change in life expectancy
IneffOUTi =Max
(� subject to :
NXj=1
xj�j � xi;NXj=1
yj�j � �yi;�j � 08j;NXj=1
�j = 1
):
In both expressions the last constraint implies variable returns to scale (non-increasing returns to scale if it holdswith �). Dropping this constraint amounts to assuming a production function with constant returns to scale. In ourbaseline calculation, we assume non-increasing returns to scale. We also provide PSE estimates in which constantreturns to scale are assumed.12To implement the deterministic approach we performed the two-step procedure called Corrected Ordinary Least
Squares, which delivers consistent estimates of the parameters �0 and �1 (Greene, 2008). To implement the stochasticapproach we resorted to ML techniques, which again ensure consistency of �̂0 and �̂1 .13Besides the Provinces and the State, the other administrative units in Italy are the 20 Regions and the approxi-
mately 8100 municipalities.
9
between the years 1981-1983 and 2003-2005 (as customary, we use averages to reduce the in uenceof temporary and exceptional events on mortality rates, such as particularly cold winters). We takevariations in life expectancy instead of levels to at least partially control for environmental factorswhich in uence outcomes independently of public healthcare. Data for each province from 1992onward are available from Istat (the National Institute of Statistics); for the previous years, we usedata from Lipsi and Caselli (2002), who compute mortality tables for the Italian provinces in theyears 1971-73, 1981-83, 1991-93. We also experiment with the inclusion of a second input, namelyGDP growth over the period considered, to take into account the fact that a better standard ofliving can have a positive in uence on behaviour and ultimately on health outcomes: it turns outthat di�erences between the two e�ciency measures are negligible (correlation between them isequal to 0.94).
Education { Our input measure is the number of teachers per pupil in the primary and �rstthree years of secondary school (school year 2005-06). These data are published for each provinceby the Ministry of Education. Basing our calculations on teachers instead of on spending, forwhich we do not have province-level data, should not a�ect our results. In fact, about 97% ofeducation expenditure in Italy is accounted for by compensation of employees. As a measure ofoutput, we use the performance of 6th and 9th grade students in tests carried out by INValSI(the public institute in charge of evaluating the Italian educational system) during the school year2005-06.14 Performance is measured by the average score (i.e. the percentage of correct answersin a multiple choice questionnaire) obtained in the Italian, Maths and Science tests. In contrast toevaluation exercises carried out by international institutions (e.g. OECD-PISA, TIMSS, PIRLS),whose sample of pupils cannot be used for our purposes as it is not representative at the provincelevel, INValSI evaluations encompass a much larger number of schools. Actually, for the 6th gradebasically all the schools have been tested, while for the 9th grade we have access to a very largerepresentative sample.15 We also computed an alternative e�ciency index, including as a secondinput the average educational attainment of adults in the province, to take into account the factthat parents' educational background may have an impact on child attainment; results are howeververy similar under both speci�cations (the correlation between the two measures of e�ciency isequal to 0.96).
14In a very interesting study, Cipollone et al. (2010) use the scores for the 9th and the 11th grades. Instead oftaking, as we do, the averages of the two measures, they consider the di�erences between the two scores which theyinterpret as the "value-added" indicators of the school (even if they use only the 2005-2006 cross section, as we do).We believe that the two papers nicely complement each other. As a general method to allow for the possibilitythat di�erent starting points have an impact on the performance of the school system as a whole, the Cipollone etal. (2010) idea of using for individual-level longitudinal data a method that has previously been applied to class-level cross-section data seems promising. However, we preferred to address this issue in a more traditional way (seeSutherland et al. 2007 and, with special reference to Italy, Boarini, 2009 and OECD, 2009), i.e. trying to control forthe educational background of adults (see below). Interestingly, we �nd a quite similar geographical gradient as inCipollone et al. (2010).15The 2005-2006 survey is the last one for which a census approach as been followed. Afterwards, INValSI surveyed
only a sample of schools. Although on average the results reported by INValSI do not di�er substantially from thoseof other international tests, the outcomes in the South, particularly those obtained in primary schools, seem morefavourable than those resulting from other evaluation exercises. Some observers argue that this might be due to somecheating by teachers administering the test in the Southern area. While we are unable to correct for this potentialproblem - INValSI has indeed recently devised a procedure that corrects for the possibility of cheating, but these dataare available only for a small sample of schools and so cannot be used for our purposes - the existence of cheating inthe South would imply an even steeper north-south gradient in e�ciency, and therefore would strengthen our results.
10

Civil Justice { We take the number of judges per 1,000 new trials in 2006 as our input. Tworemarks are in order about this measure. First, lower-level court districts in Italy do not perfectlyoverlap with provinces (there are 103 provinces and 165 tribunali16), so we restrict ourselves to thejudges working in the main court (tribunale) of the province (typically located in the main city,even if it there are sometimes other subsidiaries inside the province, which we consider as well).Second, in many districts it is not clear how many judges work in the civil sector, and how manyin the criminal sector. We use estimates of this ratio, computed using the available data.17 Ourmeasure for output in the civil justice sector is the average length of trials in 2006, as estimated byIstat.
childcare { Our input is expenditure for child daycare provided by municipalities in 2007 (weonly consider the capital of the province). Our output is given by the number of children in daycarein 2007. Data come from the Ministry of the Interior (Certi�cati di conto consuntivo dei comuni).As a robustness check, we added as a second output the best avaliable proxy for the quality ofthe service, that is the number of nurses available for each child: while this reduces the numberof observations (as the information is only available for a subset of provinces) results are basicallyunchanged (correlation between the quality-adjusted and the unadjusted measure is 0.95).
Waste Collection { We take as our input the amount of expenditure for waste collection.We consider separately two outputs, namely tons of wastecollected and recycled and tons of wastesimply taken to waste disposal sites or incinerated. This distinction is necessary as the �rst processhas of course much higher unit costs, so using the average amount of waste disposal as a singleoutput would certainly be misleading. For both input and outputs we use o�cial data from theGovernment's Enviromental Protection Agency (APAT, Rapporto ri�uti 2006).
2.4 The map of public sector e�ciency in Italy
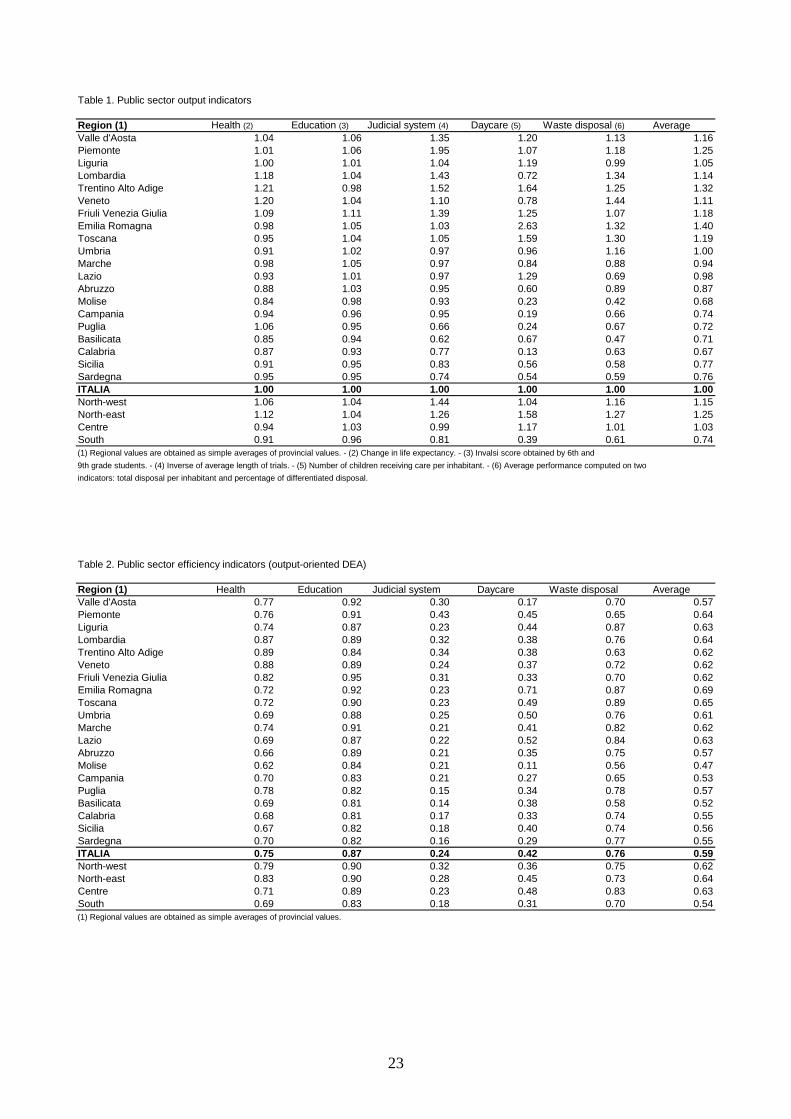
In Table 1 we report regional averages of public sector output indicators for each of the �ve spendingitems. In the last column we also report a summary measure of regional public sector output,obtained as a simple average of the indicators in each spending area. The indicators show notabledi�erences across Italian regions. In all service categories, regions in the South exhibit the lowestoutput level. Overall, public sector output in the South is 74 per cent of the Italian average. Thegap is higher for services supplied by municipalities (childcare and waste collection).
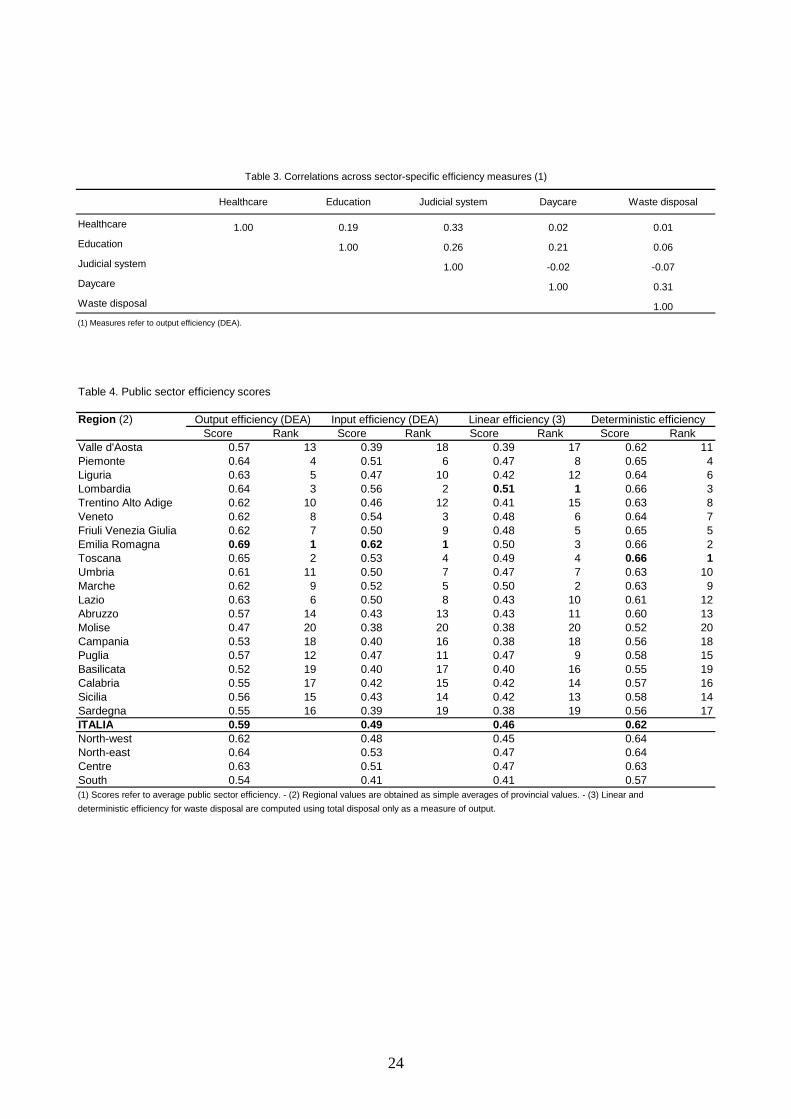
A similar picture emerges if we look at PSE. In Table 2 we report our baseline measures ofe�ciency. Again, average public sector e�ciency in the South is about 10% below the Italianaverage. Geographical di�erences in e�ciency are generally more pronounced in the sectors wherethe service is delivered by municipal authorities: the standard deviation-to-mean ratio rangesbetween 0.53 (childcare) and 0.08 (education). Interestingly, however, the dispersion in judiciale�ciency scores is quite high as well (0.45), mainly due to the high e�ciency of courts in the North-west (particularly, in Piemonte). Overall, the correlation between e�ciency scores in di�erent publicservices is not strong (Table 3).
Finally, we compare our baseline measure of average public sector e�ciency with other indices,obtained by using di�erent de�nitions of e�ciency and frontier estimation methodologies (Table
16Lower-level court districts (circondari di tribunali) are in turn grouped into 29 higher-level districts (distretti dicorte d'appello).17We are grateful to our colleague C. Giorgiantonio for providing us with these �gures, based on data from the
Consiglio Superiore della Magistratura website.
11
4). The results just described for the baseline measure seem extremely robust. In particular, thecorrelation coe�cient between the output-oriented DEA-based e�ciency measures and the valuesobtained by estimating the frontier by means of the parametric approach is 0.91 for the deterministiccase and 0.68 for the stochastic case (Table 5).
3 The determinants of public sector e�ciency
What determines the e�ciency of a public service? Our hypothesis is that strong oversight ofcitizens and users is crucial in keeping politicians accountable. However, political participation hasthe nature of a public good: all citizens bene�t from it in a non-rival, non-excludable way. This istrue even for the most basic form of political participation, i.e. the act of voting: as highlightedby the literature on the so-called voting paradox, for narrowly self-interested citizens the costs ofgoing to vote are likely to outweigh the expected bene�ts. This is even more true for other moreresource-consuming forms of political participation, such as �nding out about politics or activelycollaborating with others in an e�ort to in uence political decisions.18 A political culture in whichpolitical engagement is a highly-considered value must provide for politicians' oversight.19
In what follows we �rst provide a very simple model in which these ideas are spelled out moreformally. Then we move from theory to data, describing our preferred measure of preferences forpolitical participation.
3.1 A simple framework
We propose a straightforward extension of the retrospective voting model of Barro (1973) andFerejohn (1986). In this model, the only relevant dimension of political con ict is the agencyrelationship between citizens and the political decisionmaker. In particular, there is no con ict ofinterests among citizens (who are assumed to behave in a coordinated manner), and there are nodi�erences in competence or talent between politicians (so the problem is one of moral hazard).
A politician (e.g. the prime minister, a regional governor, a mayor) is in charge of providing aservice s in a certain province p. He can either provide the service in an e�cient way, by exertingan e�ort which costs him C in utility terms, or he can shirk, and provide the service ine�ciently,but at no cost to himself. However, shirking may have a cost for him on election day, when he runsagainst an opponent. Suppose that a fraction q of citizens knows that he has shirked. In line withthe literature on retrospective voting we assume that the citizens will punish this candidate andvote for his opponent. The uninformed voters will instead randomize between the two candidates.If there are no relevant di�erences between candidates, this voting rule is (weakly) individuallyrational. Let the incumbent utility be increasing in the fraction of votes received in the province(according to a concave twice di�erenciable function U(:)). Then the politician's pay-o� will beequal to:
U
�q +
1� q2
�� C
if e�ort is exerted in providing the public good, and to
U
�1� q2
�18On the di�erent channels of political participation, an authoritative reference is Verba et al. (1995).19Needless to say, this is a recurring theme in political science and political theory (see e.g. Almond, 1978).
12
if not. Therefore, the politician will behave if and only if q > q�, where q� is de�ned as the uniquevalue of q for which:20
U
�q� +
1� q�2
�� C = U
�1� q�2
�Ex ante, citizens can decide whether to acquire information about the actions of the politician.
In particular, suppose that they can see whether the politician shirks or not at a cost cs. If thepolitician does not shirk, and the public service is provided e�ciently, each citizen will get a higherlevel of utility (say, uh) than if the politician shirks (say ul). However, from a purely self-interestedpoint of view, of course, no citizen will �nd it optimal to acquire information, because it is clearthat the impact of one vote at the electoral stage will be negligible. As it is often done in theliterature on turnout, we assume that the overall utility of citizens does not only depend on thee�ciency of the public service, but since citizens also have a sense of duty, they get utility from thevery act of �nding out about politics.21 In particular, the utility of citizen i is set equal to:
u�Xi(cs � vi);
where u = uh if the politician behaves and u = ul if the politician shirks, vi represents the \psychicgains" that individual i gets from participating in politics, Xi is an indicator that is equal to 1if the citizen acquires information and zero otherwise. Moreover, we assume that in the provincep vi is distributed in the population according to a uniform distribution with support [0; vp] (soprovinces with higher vp have a higher degree of civicness). Thus the the fraction of people thatacquire information about service s in province p is equal to min[0,1 � cs=vp], and this in turnimplies that service s will be provided e�ciently in province p if and only if:
1� csvp> q�:
In words, service s in province p will be provided e�ciently if cs is su�ciently low, and/or if vpis su�ciently high (i.e. if the province is su�ciently imbued with civic values).
One can easily extend the basic framework to take into account another element that is con-sidered relevant to determine PSE levels, namely the quality of politicians (Besley, 2006). Whilein our basic framework all politicians are purely self-interested, one could introduce a fraction of\good-spirited" politicians who always behave honestly, irrespectively of incentives. Let us set thefraction of \good" politicians in province p equal to �p, let self-interested politicians di�er withrespect to their level of C (which is continuously distributed according to a cumulative distributionfunction FC (.)), and assume that the quality of the politicians is unobservable, so that an adverseselection component is added to that of moral hazard. In such a framework, the incentives of self-interested politicians change, because behaving honestly now has the further bene�t of improvingone's reputation with the well-informed citizens. In particular, in equilibrium the informed citizens
20We assume that U(1)� C > U(0), so that q* is between 0 and 1.21This "consumption bene�t" from voting was �rst introduced by Ricker and Ordeshook (1968) to address the
well-known "voter paradox" (the fact that people go to the polls even if the probability for any one of them to bepivotal is negligible). In the literature, several other explanations of the "paradox" have been advanced (for a survey,see Feddersen, 2004). Up to now there seems to be a consensus that voters are indeed motivated to vote by a senseof duty and that it varies sistematically across social groups (see Blais, 2000 for a review of the empirical evidence).Of course, for our purposes we do not need to argue that this is the only or even the main motivation to vote.
13
understand that the probability that the incumbent is good, given the latter exerts e�ort, is:
�p�p + (1� �p)FC(C�)
> �p
(while it is obviously 0 otherwise), where C� is the level of C such that
U
�q +
1� q2
�� C = U
�1� q2
�and the probability of a high e�ort is �p+(1��p)FC(C�), which is decreasing in cs
vpand increasing
in �p.22
3.2 Measuring interest in politics
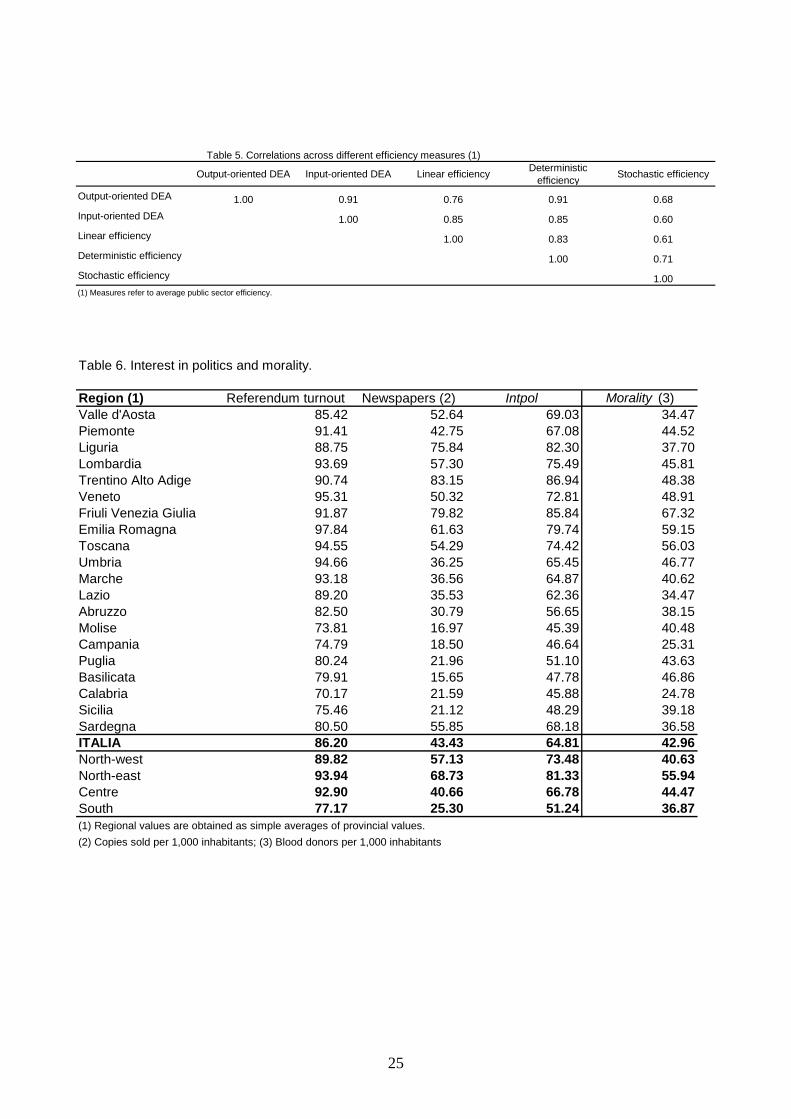
It goes without saying that measuring cultural variables is bound to be di�cult and controversial,and political engagement is no exception. We try to capture the degree of political engagementusing two proxies borrowed from previous highly in uential work. First, we consider the numberof newspapers sold in the province (�rst used by Putnam 1993; updated �gures for Italy are takenfrom Cartocci, 2007) and turnout for referenda from 1946 to 1989 (as in Putnam 1993 and Guisoet al. 2004).23 We use the simple average of the two indicators as our index of \interest in politics"(intpol).Referendum turnout is a more accurate measure of participative attitudes than electionturnout, because patronage motivations are absent (we do not consider post-1989 referenda because,given the existence of a minimum turnout threshold, in recent years abstention has been used bythose contrary to the referendum objective as a means to make it fail). We checked that results arerobust to the use of alternative measures. In particular we also built a more comprehensive indexusing opinion data from the 2004 Bank of Italy Survey on Household Income and Wealth (SHIW),concerning a representative sample of the Italian population (Banca d'Italia, 2006). In a specialsection of the 2004 wave a subgroup of the sample (about 10,000 respondents) was asked: \Howinterested are you in politics?". Four answers (Very, fairly, not very, not at all) were possible. Weused answers to this question (averaged at the province-level), together with newspaper circulation�gures and referendum turnout to build a more comprehensive measure of interest in politics. Theresults (available on request) are qualitatively and quantitatively analogous to those presented inthe paper.
To assess the role of \generalized morality" (morality) we use as a proxy the amount of blooddonations in the province, used among others by Guiso et al. (2004) and Nannicini et al. (2010).For morality, as for intpol, we experimented with other proxies, and in particular we exploitedthe fact that in the 2004 SHIW respondents were asked to what extent they deemed the followingthree behaviours acceptable: a) not paying for one's ticket on public transport: b) keeping moneyobtained by accident when it would be possible to return it to the rightful owner (for example, ifyou found a wallet with the owner's name and address, or if you were given too much change at thesupermarket check-out); c) not leaving your name for the owner of a car you accidentally scraped
22Here we make the standard assumption that the informed voters compare the incumbent's reputation with thereputation of an outsider chosen at random from the population, so they vote for the incumbent as long as hisreputation is better.23The importance of the press for political accountability is stressed, among others, by Snyder and Stromberg
(2010).
14

while parking. Using answers to these questions (province averages) together with blood donationsas an alternative index of generalized morality did not change our results.
Table 6 displays region averages for our baseline intpol (together with its sub-indices) andmorality measures, all showing as expexted that the Southern part of the country lags behind withrespect to both indicators.
4 Empirical analysis
In our theoretical framework, the degree of citizens' concerns for public a�airs has an impact one�ciency (due to the pressure that vigilant citizens put on politicians). In our empirical analysiswe capture this link estimating the following equation:
Effp = �0 + �1intpolp + �2Xp + �p; (1)
where Effp stands for PSE in province p (expressed as a ratio of its sector-speci�c mean); intpolpis our \interest in politics" indicator, and Xp is a vector of controls. In our baseline speci�cation,and unless otherwise stated, it consists of the province population and of a dummy for the Southernprovinces (the latter variable is meant to capture any other factor, besides political participation,which could drive the north-south divide24): �1 is the parameter we are primarily interested in.
4.1 OLS estimation
As our point of departure, we estimate equation (1) by OLS, using average PSE as our dependentvariable: the impact of intpol is positive and signi�cant at 1% con�rming our hypothesis thatinterest in politics has a positive impact on e�ciency (Table 7a, column 1). As a robustnessexercise, we also show the results of regressions in which on the left-hand side are the �ve PSEsub-indices (Table 7b; for all the �ve dependent variables, the set of controls is the same as in thebaseline regression). This helps to identify whether our result is driven by the way in which averagePSE is computed. Reassuringly, the coe�cient on intpol is positive and signi�cant in four out of�ve sectors (the exception being civil justice).
Our second step is to include morality among the regressors, which however turns out to be nonsigni�cant (Table 7a, column 2). This �nding suggests that pro-social values are important for PSEonly to the extent that they translate into higher political participation.25 It seems indeed that,as remarked by Putnam, \citizens in the civic community are not required to be altruists", andaltruism is neither su�cient nor necessary to participate in politics. Ine�cient public action in theless developed areas of Italy might have more to do with political apathy and discouragement, witha sense of political ine�ectiveness, than to the often quoted \amoral familism" (Ban�eld, 1958).
24This is in the same vein as in Guiso et al. (2008), which focus on the e�ects of di�erent levels of social capitalwithin the North.25As we remarked in the introduction, several political scientists (e.g. Inglehart 1977) tend to be sceptical about
the existence of such a direct link between the two set of values, at least in advanced post-industrial societies.Interestingly, Almond and Powell (1963, chapter IX) noticed that in their dataset (coming from surveys conductedin 5 Western nations) this link was particularly weak in the case of Italy.
15
4.2 Instrumental variables estimation
While it is plausible that preferences shape political and economic outcomes, one cannot takefor granted that preferences themselves are exogenous. Concerning our subject matter, there aremany reasons why current PSE may in uence current interest in politics. Low quality governmentsmay indeed breed discouragement and apathy with respect to politics in some citizens, instead ofpressure for change.
Ideally, we would like to capture the e�ects of the truly exogenous components of politicalvalues. To this aim, we resort to IV estimation.
First, we instrument intpol with measures of political engagement of earlier generations ofItalians, consistent with recent research which shows that several cultural traits are transmittedacross time from one generation to the next (Tabellini, 2008b). So we consider indices of politicaland social participation in the early 20th century, given respectively by electoral turnout in the lastpre-fascism election and by the fraction of people participating in pro-social associations (both aretaken from Nuzzo, 2006).
A second complementary possibility is to argue that the degree of political engagement observedin a community is due to past political institutions. Therefore, we also try to identify the exogenouscomponent of intpol using as instruments the features of formal political institutions in place inthe XIV century (taken from de Blasio and Nuzzo, 2006). The idea here is that while in themedieval repubbliche civic liberties and political engagement were ourishing, in the rest of theItalian provinces institutional arrangements were characterized by weaker democracies and lessdeveloped political life. In particular, de Blasio and Nuzzo (2006) identify four other kinds ofgovernment, namely, the dictatorial signorie, the absolutist kingdom of the church (ponti�cio), thesouthern Regno delle due sicilie, and a residual group of provinces governed by foreign powers(periferiche). The assumption is that even a short experience of democracy and participation inthe very distant past is able to shape citizens' attitudes towards politics today (as in Guiso et al.,2007), while it is unlikely to have had a direct impact on today's PSE.
Results are shown in Table 8a (average PSE is the dependent variable). The �rst stage regres-sions are quite encouraging: the �t is good and values of the F statistics are always well above thethresholds usually required (Table 8b).
The second stage regressions con�rm that political values matter in explaining PSE. Indeed,the component of intpol explained by political history is again positive and signi�cant at 1%, (thecoe�cient is actually higher than in the OLS estimation, suggesting that instruments go some wayin solving measurement error problems for our independent variables). For both sets of instruments,the Hansen test cannot reject the null that instruments are clean.
The economic signi�cance of higher levels of civic engagement is non negligible: a 10% increaseof intpol from its average level implies an increase in PSE of more than 3%.
Our next step is to run the IV estimation adding morality as a further regressor. Even in thiscase, intpol turns out to be strongly signi�cant, whereas morality is not (Table 8a). This is trueeven when morality is instrumented with the same set of instruments used to instrument intpol,although our instruments seem weaker in this case (see Table 8b, last two columns: the R-squareand the F statistics are somewhat lower then in the other �rst stage regressions, especially whenwe use the set of political history dummies).26
26In a way, the very fact that the historical roots of today's generalized morality seem quite di�erent from those oftoday's political culture lends weight to our argument that the two concepts should be kept distinct.
16
As a �nal robustness exercise, we try to address the concern that our instruments, whichperform quite well in explaining today's political participation, do not have a direct impact on PSEtoday, making our IV strategy invalid. Of course, this possibility can never be ruled out or tested.However, we try to relax our identi�cation assumption including among the regressors (an estimateof) the level of GDP per capita at the province level. These widely used data (the only onesavailable for Italy) are provided by the Italian Chamber of Commerce, and are de�nitely not freefrom measurement errors. In any case, the results of our further empirical exercise are reassuring,as even with the inclusion of GDP per capita among the regressors the (historically determined)component of intpol remains signi�cant (Table 8a and Table 8b).
5 Extension: the role of decentralization
Due to the institutional characteristics of the Italian public sector, our data-set can also shedsome light on a second possible determinant of PSE besides political culture, namely the degree ofcentralization in public sector provision.
Indeed, the decentralization of service provision may a�ect PSE through several channels (seefor example Treisman, 2002; Rodden, 2006; Lockwood, 2006, Oates, 2005). On the one hand, it isoften emphasized that local politicians are more easily monitored, so that (using the framework putforward in the previous section) cs is lower if service s is provided by a lower level of government.On the other hand, there might be diseconomies of scale in providing services in a decentralizedmanner: C could be higher if the service is provided locally. This last point has an obvious impacton incentives: as C is higher for the decentralized providers (let us assume that for each politicianthe cost of e�ort is increased by a quantity �C > 0 equal for all of them), q� and C� are higher aswell, so that the probability that self-interested politicians will behave in an honest way tends tobe lower. Finally, the bene�ts from decentralization are likely to depend on the quality of the localpool of politicians. Thus, decentralization is bene�cial if and only if:
(�p � �mean)(1� FC(C�dec)) + (1� �mean)(FC(C�dec)� FC(C�cen)) > 0: (2)
which can be true or false depending on the parameters, and on the speci�c characteristics ofthe province considered. In particular, the �rst term is positive in areas in which the politiciansare more honest than average, and negative otherwise. The second term is positive if and only ifC�dec > C�cen27, i.e. if the increase in the bene�ts stemming from honest behaviour due to stricteroversight is higher than the increase in the cost of e�ort, due to diseconomies of scale. To sumup, whether on average decentralized service provision enhances e�ciency remains an empiricalquestion.
Moreover, it is not even certain on a priori grounds whether the net bene�ts of decentralizationincrease with the degree of political engagement. Indeed, while this is true for (�p � �mean)(1 �FC(C
�dec)), it can be easily shown that FC(C�dec) � FC(C�dec) decreases as vp rises (intuitively,
the decrease in cs due to decentralization is less important in those provinces in which there is ahigh level of vp: in these provinces, people monitor politicians' behaviour in any case).
27The two thresholds are de�ned by the following indi�erence conditions:
C�cen = U(qcen +1� qcen
2)� U(1� q
cen
2);C�dec = U(qdec +
1� qdec2
)� U(1� qdec
2)��C
17
As the �ve public services that we study are delivered by di�erent levels of government (thecentral government provides education and administrates justice, regions provide healthcare, mu-nicipalities provide child daycare and waste collection), our data-set allows us to shed some light onthe impact of decentralization on PSE. Indeed, we can relate our service-speci�c measures of publicsector e�ciency to decentralization in service provision. To this end, we use a pooled sample, inwhich each sector-province data point is considered as a distinct observation. On this expandedsample, we estimate our baseline speci�cation, augmented by a dummy variable which is equal toone if the service is provided at the municipal level and zero otherwise. It turns out that the e�ectof decentralization is statistically insigni�cant (Table 9, column 1).
However, this result might conceal opposite e�ects of decentralization on the lower and theupper tails of the e�ciency distribution. To detect such e�ects, we perform quantile regressions.28
Results indicate that the e�ect of decentralization is indeed signi�cant and negative for the lowerquantiles (Table 9, columns 2 to 5). It becomes positive (and signi�cant) in the upper part of thee�ciency distribution. That is, being managed by central or regional governments improves PSE inareas where e�ciency is low. In contrast, within the provinces where the average quality of publicservices is higher, locally-provided services are more e�cient than centrally-provided ones.
Needless to say this result is potentially of great policy relevance. As decentralization mightamplify di�erences between regions, forms of \two-speed decentralization", where only the moste�cient regions are allowed to provide certain services, seem advisable.29
6 Conclusions
In this paper we build objective measures of PSE for the Italian provinces and show that theypositively depend on the citizens' willingness to participate in politics. Using within-country dataallows us to control for di�erences in formal rules, reduces omitted variable bias, and also gives usthe possibility to exploit the unique peculiarities of Italy's extremely long and rich political history.Indeed, it turns out that, as Putnam (1993) imagined, this history still has an impact on today'spolitical life. We �nd that historically-determined political values still in uence the quality of theItalian public sector. In particular, it seems con�rmed that, whatever the level of governmentinvolved, a well-functioning public sector requires active citizens, able and willing to monitor andsanction ine�cient politicians. As Putnam puts it: \citizens in civic communities expect bettergovernment, and (in part through their own e�ort) they get it [...] if decision makers expect citizensto hold them politically accountable, they are more inclined to temper their worst impulses ratherthan face the public protests". We also provide evidence which suggests that pro-social values perse seem neither necessary nor su�cient to have a well-functioning government. Finally, shifting ourfocus from cultural to institutional variables, we �nd that service decentralization is something ofa mixed blessing: it is likely to bene�t areas in which PSE is already strong, at the risk of furtherdepressing PSE in areas in which is already very low.
28Koenker and Hallok (2001) provide a very readable introduction to the literature on this technique, as well as acomprehensive set of readings.29A similar arrangement is in place in Spain, and has been proposed in Italy as well.
18

7 References
Afonso, A. and Scaglioni, C. (2007), \E�ciency in Italian regional public utilities' provision", inMarrelli, M., Padovano, F. and Rizzo, I. (eds), Servizi publici: nuove tendenze nella regola-mentazione, nella produzione e nel �nanziamento, FrancoAngeli, Milan.
Afonso, A., Schucknecht, L. and Tanzi, V. (2005), \Public sector e�ciency: an internationalcomparison", Public Choice, vol. 123, pp. 321-347.
Almond, G. and Verba, S. (1963), The civic culture: political attitudes and democracy in �venations, Princeton University Press, Princeton.
Almond, G. (1978), \The intellectual history of the civic culture concept", in Almond, G. andVerba, S. (eds), The civic culture revisited, Little, Brown and co., Boston, Mass.
Banca d'Italia (2006), \I bilanci delle famiglie italiane nell'anno 2004", in Supplementi al BollettinoStatistico, anno XVI, N. 7, 17 gennaio.
Ban�eld, E. C. (1958), The moral basis of a backward society, The Free Press, New York.
Barro, R. (1973), \The control of politicians: an economic model", Journal of Political Economy,vol. 87, pp. 940-971.
Besley, T. (2006), Principled agents? The political economy of good government, Oxford UniversityPress, Oxford.
Blais, A.(2000), To vote or not to vote: merits and limits of rational choice theory, University ofPittsburgh Press, Pittsburgh, Pa.
Boarini, Romina (2009), \Towards better schools and more equal opportunities for learning inItaly", OECD Economics Department working paper, no. 727.
Borge, L. E., Falch, T. and Tvomo, P. (2008), \Public sector e�ciency: the roles of politicaland budgetary institutions, �scal capacity, and democratic participation", Public Choice, vol.136, pp. 475-495.
Cipollone, P., Montanaro, P. and Sestito, P. (2010), \Misure di valore aggiunto per le scuolesuperiori italiane: i problemi esistenti e alcune prime evidenze", Banca d'Italia, Temi didiscussione (working paper), no. 754.
Cartocci, R. (2007), Mappe del tesoro: atlante del capitale sociale in Italia, Il Mulino, Bologna.
De Blasio, G. and Nuzzo, G. (2006), \The legacy of history in economic development: the case ofPutnam's social capital", Banca d'Italia, Temi di discussione (working paper), no. 591.
European Commission (2008), Public �nances in EMU { 2008, European Economy, no. 10/2008,European Commission, Brussels.
Feddersen, T. (2004), \Rational choice theory and the paradox of not voting", Journal of EconomicPerspectives, vol. 18 (1), pp. 99-112.
19
Ferejohn, J. (1986), \Incumbent performance and electoral control", Public Choice, vol. 50, pp.5-25.
Fried, H. O., Knox Lovell, C. A., Schmidt, S. S. (2008), \E�ciency and productivity", in Fried,H. O., Knox Lovell, C. A., Schmidt, S. S. (eds), The measurement of productive e�ciencyand productivity growth, Oxford University Press, Oxford.
Greene, W. H. (2008), \The econometric approach to e�ciency analysis", in Fried, H. O., KnoxLovell, C. A., Schmidt, S. S. (eds), The measurement of productive e�ciency and productivitygrowth, Oxford University Press, Oxford.
Guiso, L., Sapienza, P. and Zingales, L. (2004), \The role of social capital in �nancial develop-ment", American Economic Review, vol. 94 (3), pp. 526-556.
Guiso, L., Sapienza, P. and Zingales, L. (2006), \Does culture a�ect economic outcomes?", Journalof Economic Perspectives, vol. 20 (2), pp. 23-48.
Guiso, L., Sapienza, P. and Zingales, L. (2007), \Social capital as good culture", NBER workingpaper, no. 13712.
Guiso, L., Sapienza, P. and Zingales, L. (2008), \Long term persistence", mimeo.
H�akkinen, U. and Joumard, I. (2007), \Cross-country analysis of e�ciency in OECD healthcaresectors: options for research," OECD Economics Department Working Papers 554.
Inglehart, R. (1977), The silent revolution: changes in values and political styles among Westernpublics, Princeton University Press, Princeton.
Knack, S. (2002), \Social capital and the quality of government: evidence from the States",American Journal of Political Science, vol. 46(4), pp. 772-785.
Knack, S. and Keefer, P. (1997), \Does social capital have an economic pay-o� ?", QuarterlyJournal of Economics, vol. 112 (4), pp. 1251-1288.
Koenker, R. and Hallok, K. F. (2001), \Quantile regression", Journal of Economic Perspectives,vol. 15(4), pp. 143-156.
La Porta, R., Lopes-de-Silanes, F., Shleifer, A. and Vishny, R. W. (1997), \Trust in large organi-zation", American Economic Review, vol. 87, pp. 333-338.
La Porta, R., Lopes-de-Silanes, F., Shleifer, A. and Vishny, R. W. (1999), \The quality of govern-ment", Journal of Law, Economics and Organization, vol. 15 (1), pp. 222-279.
Lipsi, R. M. and Caselli, G. (2002), Evoluzione della geogra�a della mortalit�a in Italia. Tav-ole di mortalit�a e probabilit�a di morte per causa. Anni: 1971-1973, 1981-1983, 1991-1993,Dipartimento di scienze demogra�che { Universit�a degli studi di Roma \La Sapienza", Rome.
Lockwood, B. (2006), \Fiscal decentralization: a political economy perspective", in Ahmad, E.and Brosio, G. (eds), The Handbook of Fiscal Federalism, Edward Elgar, Cheltenham.
20
Nannicini, T., Stella, A., Tabellini, G. and Troiano, U. (2010), \Social capital and political ac-countability", Bocconi University, Mimeo.
Nuzzo, G. (2006), \Un secolo di statistiche sociali: persistenza o divergenza tra le regioni italiane?",Banca d'Italia, Quaderni dell'U�cio ricerche storiche, no. 11.
Oates, W. E. (2005), \Toward a second-generation theory of �scal federalism", International taxand public �nance, vol. 12, pp. 349-373.
OECD (2008), Going for growth 2008, OECD, Paris.
OECD (2009), Economic Survey of Italy 2009, OECD, Paris.
Putnam, R. (1993), Making democracy work, Princeton University Press, Princeton.
Ricker, W. and Ordeshook, P. (1968), \A theory of the calculus of voting", American PoliticalScience Review, vol. 62, pp. 25-42.
Rodden, J. (2006), \The political economy of federalism", in Weingast, B. and Wittman, D. (eds.),Oxford Handbook of Political Economy, Oxford University Press, Oxford.
Snyder, J. M. and Stromberg, D. (2010), "Press coverage and political accountability", Journalof Political Economy, vol. 118(2), pp. 355-408.
Sutherland, D., Price, R., Joumard, I. and Nicq, C. (2007), \Performance indicators for pub-lic spending e�ciency in primary and secondary education," OECD Economics DepartmentWorking Papers 546.
Tabellini, G. (2010), \Culture and institutions: economic development in the regions of Europe",Journal of the European Economic Association, vol. 8 (4), pp. 677-716.
Tabellini, G. (2008a), \Institutions and culture", Journal of the European Economic Association,vol. 6 (2-3), pp. 255-294.
Tabellini, G. (2008b), \The scope of cooperation: values and incentives", Quarterly Journal ofEconomics, vol. 123 (3), pp. 905-950.
Tanassoulis, E., Portela, M. C. S. and Despic, O. (2008), \Data envelopment analysis: the math-ematical programming approach to e�ciency analysis", in Fried, H. O., Knox Lovell, C.A., Schmidt, S. S. (eds), The measurement of productive e�ciency and productivity growth,Oxford University Press, Oxford.
Treisman, D. (2002), \Decentralization and the quality of government", UCLA Department ofPolitical Science, mimeo.
Verba, S., Schlozman, K. L. and Brady, H. E. (1995), Voice and equality: civic voluntarism inAmerican politics, Harvard University Press, Cambridge, Mass.
Verhoeven, M., Gunnarsson, V. and Carcillo, S. (2007), \Education and health in G7 countries:achieving better outcomes with less spending", IMF working paper, no. 267 .
21
23
Table 1. Public sector output indicators
Region (1) Health (2) Education (3) Judicial system (4) Daycare (5) Waste disposal (6) AverageValle d'Aosta 1.04 1.06 1.35 1.20 1.13 1.16Piemonte 1.01 1.06 1.95 1.07 1.18 1.25Liguria 1.00 1.01 1.04 1.19 0.99 1.05Lombardia 1.18 1.04 1.43 0.72 1.34 1.14Trentino Alto Adige 1.21 0.98 1.52 1.64 1.25 1.32Veneto 1.20 1.04 1.10 0.78 1.44 1.11Friuli Venezia Giulia 1.09 1.11 1.39 1.25 1.07 1.18Emilia Romagna 0.98 1.05 1.03 2.63 1.32 1.40Toscana 0.95 1.04 1.05 1.59 1.30 1.19Umbria 0.91 1.02 0.97 0.96 1.16 1.00Marche 0.98 1.05 0.97 0.84 0.88 0.94Lazio 0.93 1.01 0.97 1.29 0.69 0.98Abruzzo 0.88 1.03 0.95 0.60 0.89 0.87Molise 0.84 0.98 0.93 0.23 0.42 0.68Campania 0.94 0.96 0.95 0.19 0.66 0.74Puglia 1.06 0.95 0.66 0.24 0.67 0.72Basilicata 0.85 0.94 0.62 0.67 0.47 0.71Calabria 0.87 0.93 0.77 0.13 0.63 0.67Sicilia 0.91 0.95 0.83 0.56 0.58 0.77Sardegna 0.95 0.95 0.74 0.54 0.59 0.76ITALIA 1.00 1.00 1.00 1.00 1.00 1.00North-west 1.06 1.04 1.44 1.04 1.16 1.15North-east 1.12 1.04 1.26 1.58 1.27 1.25Centre 0.94 1.03 0.99 1.17 1.01 1.03South 0.91 0.96 0.81 0.39 0.61 0.74(1) Regional values are obtained as simple averages of provincial values. - (2) Change in life expectancy. - (3) Invalsi score obtained by 6th and
9th grade students. - (4) Inverse of average length of trials. - (5) Number of children receiving care per inhabitant. - (6) Average performance computed on two
indicators: total disposal per inhabitant and percentage of differentiated disposal. Table 2. Public sector efficiency indicators (output-oriented DEA)
Region (1) Health Education Judicial system Daycare Waste disposal AverageValle d'Aosta 0.77 0.92 0.30 0.17 0.70 0.57Piemonte 0.76 0.91 0.43 0.45 0.65 0.64Liguria 0.74 0.87 0.23 0.44 0.87 0.63Lombardia 0.87 0.89 0.32 0.38 0.76 0.64Trentino Alto Adige 0.89 0.84 0.34 0.38 0.63 0.62Veneto 0.88 0.89 0.24 0.37 0.72 0.62Friuli Venezia Giulia 0.82 0.95 0.31 0.33 0.70 0.62Emilia Romagna 0.72 0.92 0.23 0.71 0.87 0.69Toscana 0.72 0.90 0.23 0.49 0.89 0.65Umbria 0.69 0.88 0.25 0.50 0.76 0.61Marche 0.74 0.91 0.21 0.41 0.82 0.62Lazio 0.69 0.87 0.22 0.52 0.84 0.63Abruzzo 0.66 0.89 0.21 0.35 0.75 0.57Molise 0.62 0.84 0.21 0.11 0.56 0.47Campania 0.70 0.83 0.21 0.27 0.65 0.53Puglia 0.78 0.82 0.15 0.34 0.78 0.57Basilicata 0.69 0.81 0.14 0.38 0.58 0.52Calabria 0.68 0.81 0.17 0.33 0.74 0.55Sicilia 0.67 0.82 0.18 0.40 0.74 0.56Sardegna 0.70 0.82 0.16 0.29 0.77 0.55ITALIA 0.75 0.87 0.24 0.42 0.76 0.59North-west 0.79 0.90 0.32 0.36 0.75 0.62North-east 0.83 0.90 0.28 0.45 0.73 0.64Centre 0.71 0.89 0.23 0.48 0.83 0.63South 0.69 0.83 0.18 0.31 0.70 0.54(1) Regional values are obtained as simple averages of provincial values.
24
Healthcare Education Judicial system Daycare Waste disposal
Healthcare 1.00 0.19 0.33 0.02 0.01
Education 1.00 0.26 0.21 0.06
Judicial system 1.00 -0.02 -0.07
Daycare 1.00 0.31
Waste disposal 1.00
(1) Measures refer to output efficiency (DEA).
Table 3. Correlations across sector-specific efficiency measures (1)
Table 4. Public sector efficiency scores
Region (2) Output efficiency (DEA) Input efficiency (DEA) Linear efficiency (3) Deterministic efficiency Score Rank Score Rank Score Rank Score Rank
Valle d'Aosta 0.57 13 0.39 18 0.39 17 0.62 11Piemonte 0.64 4 0.51 6 0.47 8 0.65 4Liguria 0.63 5 0.47 10 0.42 12 0.64 6Lombardia 0.64 3 0.56 2 0.51 1 0.66 3Trentino Alto Adige 0.62 10 0.46 12 0.41 15 0.63 8Veneto 0.62 8 0.54 3 0.48 6 0.64 7Friuli Venezia Giulia 0.62 7 0.50 9 0.48 5 0.65 5Emilia Romagna 0.69 1 0.62 1 0.50 3 0.66 2Toscana 0.65 2 0.53 4 0.49 4 0.66 1Umbria 0.61 11 0.50 7 0.47 7 0.63 10Marche 0.62 9 0.52 5 0.50 2 0.63 9Lazio 0.63 6 0.50 8 0.43 10 0.61 12Abruzzo 0.57 14 0.43 13 0.43 11 0.60 13Molise 0.47 20 0.38 20 0.38 20 0.52 20Campania 0.53 18 0.40 16 0.38 18 0.56 18Puglia 0.57 12 0.47 11 0.47 9 0.58 15Basilicata 0.52 19 0.40 17 0.40 16 0.55 19Calabria 0.55 17 0.42 15 0.42 14 0.57 16Sicilia 0.56 15 0.43 14 0.42 13 0.58 14Sardegna 0.55 16 0.39 19 0.38 19 0.56 17ITALIA 0.59 0.49 0.46 0.62North-west 0.62 0.48 0.45 0.64North-east 0.64 0.53 0.47 0.64Centre 0.63 0.51 0.47 0.63South 0.54 0.41 0.41 0.57(1) Scores refer to average public sector efficiency. - (2) Regional values are obtained as simple averages of provincial values. - (3) Linear and
deterministic efficiency for waste disposal are computed using total disposal only as a measure of output.
25
Output-oriented DEA Input-oriented DEA Linear efficiencyDeterministic
efficiencyStochastic efficiency
Output-oriented DEA 1.00 0.91 0.76 0.91 0.68
Input-oriented DEA 1.00 0.85 0.85 0.60
Linear efficiency 1.00 0.83 0.61
Deterministic efficiency 1.00 0.71
Stochastic efficiency 1.00(1) Measures refer to average public sector efficiency.
Table 5. Correlations across different efficiency measures (1)
Table 6. Interest in politics and morality.
Region (1) Referendum turnout Newspapers (2) Intpol Morality (3)Valle d'Aosta 85.42 52.64 69.03 34.47Piemonte 91.41 42.75 67.08 44.52Liguria 88.75 75.84 82.30 37.70Lombardia 93.69 57.30 75.49 45.81Trentino Alto Adige 90.74 83.15 86.94 48.38Veneto 95.31 50.32 72.81 48.91Friuli Venezia Giulia 91.87 79.82 85.84 67.32Emilia Romagna 97.84 61.63 79.74 59.15Toscana 94.55 54.29 74.42 56.03Umbria 94.66 36.25 65.45 46.77Marche 93.18 36.56 64.87 40.62Lazio 89.20 35.53 62.36 34.47Abruzzo 82.50 30.79 56.65 38.15Molise 73.81 16.97 45.39 40.48Campania 74.79 18.50 46.64 25.31Puglia 80.24 21.96 51.10 43.63Basilicata 79.91 15.65 47.78 46.86Calabria 70.17 21.59 45.88 24.78Sicilia 75.46 21.12 48.29 39.18Sardegna 80.50 55.85 68.18 36.58ITALIA 86.20 43.43 64.81 42.96North-west 89.82 57.13 73.48 40.63North-east 93.94 68.73 81.33 55.94Centre 92.90 40.66 66.78 44.47South 77.17 25.30 51.24 36.87(1) Regional values are obtained as simple averages of provincial values.
(2) Copies sold per 1,000 inhabitants; (3) Blood donors per 1,000 inhabitants

26
Table 7a. OLS estimation (robust standard errors in parentheses)
Constant 0.800 *** 0.784 ***(0.076) (0.0781)
Intpol 0.003 *** 0.003 **(0.001) (0.001)
Pop 0.002 *** 0.003 ***(0.001) (0.001)
D_South -0.094 *** -0.091 ***(0.032) (0.031)
Morality 0.001 (0.001)
R20.46 0.47
Observations 103 103
Total PSE
Table 7b. OLS estimation by sector (robust standard errors in parentheses)
Education Health Civil Justice Child Care Waste coll.Constant 0.957 *** 0.787 *** 1.116 *** 0.092 0.779
(0.042) (0.073) (0.290) (0.342) (0.116)Intpol 0.001 * 0.003 *** 0.000 0.011 ** 0.003 **
(0.001) (0.001) (0.003) (0.005) (0.002)Pop 0.000 * 0.001 0.001 0.015 *** 0.001
(0.000) (0.001) (0.002) (0.002) (0.001)D_South -0.066 *** -0.024 -0.409 *** -0.075 0.000
(0.018) (0.032) (0.118) (0.135) (0.050)
R2 0.31 0.20 0.17 0.32 0.08
Observations 103 103 103 95 103
PSE

27
Constant 0.656 *** 0.634 *** 0.602 *** 0.585 *** 0.369 ** 0.590 ** 0.635 *** 0.634 ***
(0.0873) (0.096) (0.0929) (0.1072) (0.378) (.2599) (0.0754) (0.080)Intpol 0.005 *** 0.005 *** 0.005 *** 0.005 *** 0.004 ** 0.005 *** 0.005 ** 0.005 *
(0.0012) (0.001) (0.0013) (0.0013) (0.0018) (.0018) (0.0019) (0.003)Pop 0.002 *** 0.002 *** 0.002 *** 0.002 *** 0.003 *** 0.002 *** 0.002 *** 0.002 ***
(0.001) (0.001) (0.0006) (0.0006) (0.0006) (0.0007) (0.0006) (0.001)D_South -0.044 -0.043 -0.040 -0.043 -0.025 -0.043 -0.036 -0.042 (0.0336) (0.03) (0.0031) (0.0326) (0.0387) (0.0339) (0.0333) (0.0321)Morality 0.001 0.001 0.006 0.001
(0.0012) (0.0012) (0.0078) (0.0056)GDP per capita 0.001 0.001
(0.0046) (0.007)
Hansen test (p-value) 0.969 0.979 0.478 0.837 0.386 just identified 0.950 0.795
(1) Only intpol" is instrumented; (2) Both intpol" and "morality" are instrumented.
Instruments: Political history
Instruments: Past political participation
Instruments: Political history (2)
Instruments: Past political participation (2)
Table 8a. Instrumental variables estimation (robust standard errors in parentheses)
Instruments: Political history (1)
Instruments: Past political participation (1)
Instruments: Political history
Instruments: Past political participation
Table 8b. First stage regressions (robust standard errors in parenthesis)
Repubbliche 0.738 0.396 2.162 3.827(3.757) (3.8148) (3.135) (3.259)
Signorie 0.771 0.484 1.674 3.221(3.959) (3.9211) (3.369) (2.837)
Pontificio -11.564 *** -11.461 *** -6.806 ** -1.149 (3.801) (3.791) (3.249) (3.110)
DueSicilie -21.258 *** -21.141 *** -15.112 *** -1.310 (2.877) (2.896) (2.822) (2.3701)
Election 0.494 *** 0.474 *** 0.313 *** 0.232 ***
(0.086) (0.0841) (0.0823) (0.0867)Associations 0.015 * 0.016 * 0.002 -0.010 *
(0.0087) (0.009) (0.0062) (0.006)Morality 0.089 0.087
(0.0798) (0.0856)GDP per capita 1.026 *** 1.489 ***
(0.295) (0.302)
R20.75 0.66 0.75 0.67 0.78 0.73 0.17 0.21
F statistic 72.63 49.42 60.93 39.40 66.04 66.15 3.29 6.11
Observations 103 103 103 103 103 103 103 103
In the first stage D_south, Pop, and a Constant are always included among the regressors.
Dependent variable: "intpol" Dependent variable: "morality"

28
Table 9. OLS and quantile regression estimation (robust standard errors in parentheses)
OLS0.1 0.25 0.75 0.9
Constant 0.471 *** 0.614 *** 0.716 *** 0.845 *** 0.901 ***(0.089) (0.148) (0.085) (0.079) (0.188)
Intpol 0.002 * 0.003 * 0.003 ** 0.003 *** 0.003(0.001) (0.002) (0.001) (0.001) (0.003)
Pop 0.001 * 0.001 * 0.001 ** 0.002 0.011 ***(0.001) (0.001) (0.001) (0.003) (0.003)
D_South -0.032 -0.218 *** -0.081 * -0.080 *** -0.128 *(0.038) (0.077) (0.047) (0.026) (0.066)
D_Municipality -0.026 -0.226 *** -0.123 *** 0.055 0.163 **(0.024) (0.044) (0.042) (0.042) (0.069)
Observations 507 507 507 507 507
Quantile regression: deciles

(*) Requestsforcopiesshouldbesentto:Bancad’Italia–ServizioStudidistrutturaeconomicaefinanziaria–DivisioneBibliotecaeArchiviostorico–ViaNazionale,91–00184Rome–(fax00390647922059).TheyareavailableontheInternetwww.bancaditalia.it.
RECENTLYPUBLISHED“TEMI”(*)
N. 762 – A public guarantee of a minimum return to defined contribution pension scheme members,byGiuseppeGrandeandIgnazioVisco(June2010).
N. 763 – Debt restructuring and the role of lending technologies,byGiacintoMicucciandPaolaRossi(June2010).
N. 764 – Disentangling demand and supply in credit developments: a survey-based analysis for Italy,byPaoloDelGiovane,GinetteEramoandAndreaNobili(June2010).
N. 765 – Information uncertainty and the reaction of stock prices to news,byPaoloAngeliniandGiovanniGuazzarotti(July2010).
N. 766 – With a little help from abroad: the effect of low-skilled immigration on the female labor supply,byGuglielmoBaroneandSauroMocetti(July2010).
N. 767 – Real time forecasts of inflation: the role of financial variables,byLiberoMonteforteandGianlucaMoretti(July2010).
N. 768 – The effect of age on portfolio choices: evidence from an Italian pension fund, byGiuseppeG.L.Cappelletti,GiovanniGuazzarottiandPietroTommasino(July2010).
N. 769 – Does investing abroad reduce domestic activity? Evidence from Italian manufacturing firms,byRaffaelloBronzini(July2010).
N. 770 – The EAGLE. A model for policy analysis of macroeconomics interdependence in the euro area,bySandraGomes,PascalJacquinotandMassimilianoPisani(July2010).
N. 771 – Modelling Italian potential output and the output gap, by Antonio Bassanetti,MicheleCaivanoandAlbertoLocarno(September2010).
N. 772 – Relationship lending in a financial turmoil,byStefaniaDeMitri,GiorgioGobbiandEnricoSette(September2010).
N. 773 – Firm entry, competitive pressures and the US inflation dynamics, by MartinaCecioni(September2010).
N. 774 – Credit ratings in structured finance and the role of systemic risk,byRobertoVioli(September2010).
N. 775 – Entrepreneurship and market size. The case of young college graduates in Italy,bySabrinaDiAddarioandDanielaVuri(September2010).
N. 776 – Measuring the price elasticity of import demand in the destination markets of Italian exports,byAlbertoFelettighandStefanoFederico(October2010).
N. 777 – Income reporting behaviour in sample surveys,byAndreaNeriandRobertaZizza(October2010).
N. 778 – The rise of risk-based pricing of mortgage interest rates in Italy,bySilviaMagriandRaffaellaPico(October2010).
N. 779 – On the interaction between market and credit risk: a factor-augmented vector autoregressive (FAVAR) approach, by Roberta Fiori and Simonetta Iannotti(October2010).
N. 780 – Under/over-valuation of the stock market and cyclically adjusted earnings, byMarcoTaboga(December2010).
N. 781 – Changing institutions in the European market: the impact on mark-ups and rents allocation, byAntonio Bassanetti, Roberto Torrini and Francesco Zollino(December2010).
N. 782 – Central bank’s macroeconomic projections and learning,byGiuseppeFerreroandAlessandroSecchi(December2010).
N. 783 – (Non)persistent effects of fertility on female labour supply,byConcettaRondinelliandRobertaZizza(December2010).

"TEMI" LATER PUBLISHED ELSEWHERE
2008
P. ANGELINI, Liquidity and announcement effects in the euro area, Giornale degli Economisti e Annali di Economia, v. 67, 1, pp. 1-20, TD No. 451 (October 2002).
P. ANGELINI, P. DEL GIOVANE, S. SIVIERO and D. TERLIZZESE, Monetary policy in a monetary union: What role for regional information?, International Journal of Central Banking, v. 4, 3, pp. 1-28, TD No. 457 (December 2002).
F. SCHIVARDI and R. TORRINI, Identifying the effects of firing restrictions through size-contingent Differences in regulation, Labour Economics, v. 15, 3, pp. 482-511, TD No. 504 (June 2004).
L. GUISO and M. PAIELLA,, Risk aversion, wealth and background risk, Journal of the European Economic Association, v. 6, 6, pp. 1109-1150, TD No. 483 (September 2003).
C. BIANCOTTI, G. D'ALESSIO and A. NERI, Measurement errors in the Bank of Italy’s survey of household income and wealth, Review of Income and Wealth, v. 54, 3, pp. 466-493, TD No. 520 (October 2004).
S. MOMIGLIANO, J. HENRY and P. HERNÁNDEZ DE COS, The impact of government budget on prices: Evidence from macroeconometric models, Journal of Policy Modelling, v. 30, 1, pp. 123-143 TD No. 523 (October 2004).
L. GAMBACORTA, How do banks set interest rates?, European Economic Review, v. 52, 5, pp. 792-819, TD No. 542 (February 2005).
P. ANGELINI and A. GENERALE, On the evolution of firm size distributions, American Economic Review, v. 98, 1, pp. 426-438, TD No. 549 (June 2005).
R. FELICI and M. PAGNINI, Distance, bank heterogeneity and entry in local banking markets, The Journal of Industrial Economics, v. 56, 3, pp. 500-534, No. 557 (June 2005).
S. DI ADDARIO and E. PATACCHINI, Wages and the city. Evidence from Italy, Labour Economics, v.15, 5, pp. 1040-1061, TD No. 570 (January 2006).
S. SCALIA, Is foreign exchange intervention effective?, Journal of International Money and Finance, v. 27, 4, pp. 529-546, TD No. 579 (February 2006).
M. PERICOLI and M. TABOGA, Canonical term-structure models with observable factors and the dynamics of bond risk premia, Journal of Money, Credit and Banking, v. 40, 7, pp. 1471-88, TD No. 580 (February 2006).
E. VIVIANO, Entry regulations and labour market outcomes. Evidence from the Italian retail trade sector, Labour Economics, v. 15, 6, pp. 1200-1222, TD No. 594 (May 2006).
S. FEDERICO and G. A. MINERVA, Outward FDI and local employment growth in Italy, Review of World Economics, Journal of Money, Credit and Banking, v. 144, 2, pp. 295-324, TD No. 613 (February 2007).
F. BUSETTI and A. HARVEY, Testing for trend, Econometric Theory, v. 24, 1, pp. 72-87, TD No. 614 (February 2007).
V. CESTARI, P. DEL GIOVANE and C. ROSSI-ARNAUD, Memory for prices and the Euro cash changeover: an analysis for cinema prices in Italy, In P. Del Giovane e R. Sabbatini (eds.), The Euro Inflation and Consumers’ Perceptions. Lessons from Italy, Berlin-Heidelberg, Springer, TD No. 619 (February 2007).
B. H. HALL, F. LOTTI and J. MAIRESSE, Employment, innovation and productivity: evidence from Italian manufacturing microdata, Industrial and Corporate Change, v. 17, 4, pp. 813-839, TD No. 622 (April 2007).
J. SOUSA and A. ZAGHINI, Monetary policy shocks in the Euro Area and global liquidity spillovers, International Journal of Finance and Economics, v.13, 3, pp. 205-218, TD No. 629 (June 2007).
M. DEL GATTO, GIANMARCO I. P. OTTAVIANO and M. PAGNINI, Openness to trade and industry cost dispersion: Evidence from a panel of Italian firms, Journal of Regional Science, v. 48, 1, pp. 97-129, TD No. 635 (June 2007).
P. DEL GIOVANE, S. FABIANI and R. SABBATINI, What’s behind “inflation perceptions”? A survey-based analysis of Italian consumers, in P. Del Giovane e R. Sabbatini (eds.), The Euro Inflation and Consumers’ Perceptions. Lessons from Italy, Berlin-Heidelberg, Springer, TD No. 655 (January
2008).
R. BRONZINI, G. DE BLASIO, G. PELLEGRINI and A. SCOGNAMIGLIO, La valutazione del credito d’imposta per gli investimenti, Rivista di politica economica, v. 98, 4, pp. 79-112, TD No. 661 (April 2008).

B. BORTOLOTTI, and P. PINOTTI, Delayed privatization, Public Choice, v. 136, 3-4, pp. 331-351, TD No. 663 (April 2008).
R. BONCI and F. COLUMBA, Monetary policy effects: New evidence from the Italian flow of funds, Applied Economics , v. 40, 21, pp. 2803-2818, TD No. 678 (June 2008).
M. CUCCULELLI, and G. MICUCCI, Family Succession and firm performance: evidence from Italian family firms, Journal of Corporate Finance, v. 14, 1, pp. 17-31, TD No. 680 (June 2008).
A. SILVESTRINI and D. VEREDAS, Temporal aggregation of univariate and multivariate time series models: a survey, Journal of Economic Surveys, v. 22, 3, pp. 458-497, TD No. 685 (August 2008).
2009
F. PANETTA, F. SCHIVARDI and M. SHUM, Do mergers improve information? Evidence from the loan market, Journal of Money, Credit, and Banking, v. 41, 4, pp. 673-709, TD No. 521 (October 2004).
M. BUGAMELLI and F. PATERNÒ, Do workers’ remittances reduce the probability of current account reversals?, World Development, v. 37, 12, pp. 1821-1838, TD No. 573 (January 2006).
P. PAGANO and M. PISANI, Risk-adjusted forecasts of oil prices, The B.E. Journal of Macroeconomics, v. 9, 1, Article 24, TD No. 585 (March 2006).
M. PERICOLI and M. SBRACIA, The CAPM and the risk appetite index: theoretical differences, empirical similarities, and implementation problems, International Finance, v. 12, 2, pp. 123-150, TD No. 586 (March 2006).
U. ALBERTAZZI and L. GAMBACORTA, Bank profitability and the business cycle, Journal of Financial Stability, v. 5, 4, pp. 393-409, TD No. 601 (September 2006).
S. MAGRI, The financing of small innovative firms: the Italian case, Economics of Innovation and New Technology, v. 18, 2, pp. 181-204, TD No. 640 (September 2007).
V. DI GIACINTO and G. MICUCCI, The producer service sector in Italy: long-term growth and its local determinants, Spatial Economic Analysis, Vol. 4, No. 4, pp. 391-425, TD No. 643 (September 2007).
F. LORENZO, L. MONTEFORTE and L. SESSA, The general equilibrium effects of fiscal policy: estimates for the euro area, Journal of Public Economics, v. 93, 3-4, pp. 559-585, TD No. 652 (November 2007).
R. GOLINELLI and S. MOMIGLIANO, The Cyclical Reaction of Fiscal Policies in the Euro Area. A Critical Survey of Empirical Research, Fiscal Studies, v. 30, 1, pp. 39-72, TD No. 654 (January 2008).
P. DEL GIOVANE, S. FABIANI and R. SABBATINI, What’s behind “Inflation Perceptions”? A survey-based analysis of Italian consumers, Giornale degli Economisti e Annali di Economia, v. 68, 1, pp. 25-52, TD No. 655 (January 2008).
F. MACCHERONI, M. MARINACCI, A. RUSTICHINI and M. TABOGA, Portfolio selection with monotone mean-variance preferences, Mathematical Finance, v. 19, 3, pp. 487-521, TD No. 664 (April 2008).
M. AFFINITO and M. PIAZZA, What are borders made of? An analysis of barriers to European banking integration, in P. Alessandrini, M. Fratianni and A. Zazzaro (eds.): The Changing Geography of Banking and Finance, Dordrecht Heidelberg London New York, Springer, TD No. 666 (April 2008).
A. BRANDOLINI, On applying synthetic indices of multidimensional well-being: health and income inequalities in France, Germany, Italy, and the United Kingdom, in R. Gotoh and P. Dumouchel (eds.), Against Injustice. The New Economics of Amartya Sen, Cambridge, Cambridge University Press, TD No. 668 (April 2008).
G. FERRERO and A. NOBILI, Futures contract rates as monetary policy forecasts, International Journal of Central Banking, v. 5, 2, pp. 109-145, TD No. 681 (June 2008).
P. CASADIO, M. LO CONTE and A. NERI, Balancing work and family in Italy: the new mothers’ employment decisions around childbearing, in T. Addabbo and G. Solinas (eds.), Non-Standard Employment and Qualità of Work, Physica-Verlag. A Sprinter Company, TD No. 684 (August 2008).
L. ARCIERO, C. BIANCOTTI, L. D'AURIZIO and C. IMPENNA, Exploring agent-based methods for the analysis of payment systems: A crisis model for StarLogo TNG, Journal of Artificial Societies and Social Simulation, v. 12, 1, TD No. 686 (August 2008).
A. CALZA and A. ZAGHINI, Nonlinearities in the dynamics of the euro area demand for M1, Macroeconomic Dynamics, v. 13, 1, pp. 1-19, TD No. 690 (September 2008).
L. FRANCESCO and A. SECCHI, Technological change and the households’ demand for currency, Journal of Monetary Economics, v. 56, 2, pp. 222-230, TD No. 697 (December 2008).
G. ASCARI and T. ROPELE, Trend inflation, taylor principle, and indeterminacy, Journal of Money, Credit and Banking, v. 41, 8, pp. 1557-1584, TD No. 708 (May 2007).

S. COLAROSSI and A. ZAGHINI, Gradualism, transparency and the improved operational framework: a look at overnight volatility transmission, International Finance, v. 12, 2, pp. 151-170, TD No. 710 (May 2009).
M. BUGAMELLI, F. SCHIVARDI and R. ZIZZA, The euro and firm restructuring, in A. Alesina e F. Giavazzi (eds): Europe and the Euro, Chicago, University of Chicago Press, TD No. 716 (June 2009).
B. HALL, F. LOTTI and J. MAIRESSE, Innovation and productivity in SMEs: empirical evidence for Italy, Small Business Economics, v. 33, 1, pp. 13-33, TD No. 718 (June 2009).
2010
A. PRATI and M. SBRACIA, Uncertainty and currency crises: evidence from survey data, Journal of Monetary Economics, v, 57, 6, pp. 668-681, TD No. 446 (July 2002).
S. MAGRI, Debt maturity choice of nonpublic Italian firms , Journal of Money, Credit, and Banking, v.42, 2-3, pp. 443-463, TD No. 574 (January 2006).
R. BRONZINI and P. PISELLI, Determinants of long-run regional productivity with geographical spillovers: the role of R&D, human capital and public infrastructure, Regional Science and Urban Economics, v. 39, 2, pp.187-199, TD No. 597 (September 2006).
E. IOSSA and G. PALUMBO, Over-optimism and lender liability in the consumer credit market, Oxford Economic Papers, v. 62, 2, pp. 374-394, TD No. 598 (September 2006).
S. NERI and A. NOBILI, The transmission of US monetary policy to the euro area, International Finance, v. 13, 1, pp. 55-78, TD No. 606 (December 2006).
F. ALTISSIMO, R. CRISTADORO, M. FORNI, M. LIPPI and G. VERONESE, New Eurocoin: Tracking Economic Growth in Real Time, Review of Economics and Statistics, v. 92, 4, pp. 1024-1034, TD No. 631 (June 2007).
A. CIARLONE, P. PISELLI and G. TREBESCHI, Emerging Markets' Spreads and Global Financial Conditions, Journal of International Financial Markets, Institutions & Money, v. 19, 2, pp. 222-239, TD No. 637 (June 2007).
U. ALBERTAZZI and L. GAMBACORTA, Bank profitability and taxation, Journal of Banking and Finance, v. 34, 11, pp. 2801-2810, TD No. 649 (November 2007).
M. IACOVIELLO and S. NERI, Housing market spillovers: evidence from an estimated DSGE model, American Economic Journal: Macroeconomics, v. 2, 2, pp. 125-164, TD No. 659 (January 2008).
F. BALASSONE, F. MAURA and S. ZOTTERI, Cyclical asymmetry in fiscal variables in the EU, Empirica, TD No. 671, v. 37, 4, pp. 381-402 (June 2008).
F. D'AMURI, O. GIANMARCO I.P. and P. GIOVANNI, The labor market impact of immigration on the western german labor market in the 1990s, European Economic Review, v. 54, 4, pp. 550-570, TD No. 687 (August 2008).
A. ACCETTURO, Agglomeration and growth: the effects of commuting costs, Papers in Regional Science, v. 89, 1, pp. 173-190, TD No. 688 (September 2008).
S. NOBILI and G. PALAZZO, Explaining and forecasting bond risk premiums, Financial Analysts Journal, v. 66, 4, pp. 67-82, TD No. 689 (September 2008).
A. B. ATKINSON and A. BRANDOLINI, On analysing the world distribution of income, World Bank Economic Review , v. 24, 1 , pp. 1-37, TD No. 701 (January 2009).
R. CAPPARIELLO and R. ZIZZA, Dropping the Books and Working Off the Books, Labour, v. 24, 2, pp. 139-162 ,TD No. 702 (January 2009).
C. NICOLETTI and C. RONDINELLI, The (mis)specification of discrete duration models with unobserved heterogeneity: a Monte Carlo study, Journal of Econometrics, v. 159, 1, pp. 1-13, TD No. 705 (March 2009).
V. DI GIACINTO, G. MICUCCI and P. MONTANARO, Dynamic macroeconomic effects of public capital: evidence from regional Italian data, Giornale degli economisti e annali di economia, v. 69, 1, pp. 29-66, TD No. 733 (November 2009).
F. COLUMBA, L. GAMBACORTA and P. E. MISTRULLI, Mutual Guarantee institutions and small business finance, Journal of Financial Stability, v. 6, 1, pp. 45-54, TD No. 735 (November 2009).
A. GERALI, S. NERI, L. SESSA and F. M. SIGNORETTI, Credit and banking in a DSGE model of the Euro Area, Journal of Money, Credit and Banking, v. 42, 6, pp. 107-141, TD No. 740 (January 2010).
M. AFFINITO and E. TAGLIAFERRI, Why do (or did?) banks securitize their loans? Evidence from Italy, Journal of Financial Stability, v. 6, 4, pp. 189-202, TD No. 741 (January 2010).

S. FEDERICO, Outsourcing versus integration at home or abroad and firm heterogeneity, Empirica, v. 37, 1, pp. 47-63, TD No. 742 (February 2010).
V. DI GIACINTO, On vector autoregressive modeling in space and time, Journal of Geographical Systems, v. 12, 2, pp. 125-154, TD No. 746 (February 2010).
A. DI CESARE and G. GUAZZAROTTI, An analysis of the determinants of credit default swap spread changes before and during the subprime financial turmoil, Journal of Current Issues in Finance, Business and Economics, v. 3, 4, pp., TD No. 749 (March 2010).
A. BRANDOLINI, S. MAGRI and T. M SMEEDING, Asset-based measurement of poverty, Journal of Policy Analysis and Management, v. 29, 2 , pp. 267-284, TD No. 755 (March 2010).
G. CAPPELLETTI, A Note on rationalizability and restrictions on beliefs, The B.E. Journal of Theoretical Economics, v. 10, 1, pp. 1-11,TD No. 757 (April 2010).
S. DI ADDARIO and D. VURI, Entrepreneurship and market size. the case of young college graduates in Italy, Labour Economics, v. 17, 5, pp. 848-858, TD No. 775 (September 2010).
FORTHCOMING
L. MONTEFORTE and S. SIVIERO, The Economic Consequences of Euro Area Modelling Shortcuts, Applied Economics, TD No. 458 (December 2002).
M. BUGAMELLI and A. ROSOLIA, Produttività e concorrenza estera, Rivista di politica economica, TD No. 578 (February 2006).
G. DE BLASIO and G. NUZZO, Historical traditions of civicness and local economic development, Journal of Regional Science, TD No. 591 (May 2006).
S. DI ADDARIO, Job search in thick markets, Journal of Urban Economics, TD No. 605 (December 2006).
F. SCHIVARDI and E. VIVIANO, Entry barriers in retail trade, Economic Journal, TD No. 616 (February 2007).
G. FERRERO, A. NOBILI and P. PASSIGLIA, Assessing excess liquidity in the Euro Area: the role of sectoral distribution of money, Applied Economics, TD No. 627 (April 2007).
P. E. MISTRULLI, Assessing financial contagion in the interbank market: maximun entropy versus observed interbank lending patterns, Journal of Banking & Finance, TD No. 641 (September 2007).
Y. ALTUNBAS, L. GAMBACORTA and D. MARQUÉS, Securitisation and the bank lending channel, European Economic Review, TD No. 653 (November 2007).
E. CIAPANNA, Directed matching with endogenous markov probability: clients or competitors?, The RAND Journal of Economics, TD No. 665 (April 2008).
M. BUGAMELLI and F. PATERNÒ, Output growth volatility and remittances, Economica, TD No. 673 (June 2008).
V. DI GIACINTO e M. PAGNINI, Local and global agglomeration patterns: two econometrics-based indicators, Regional Science and Urban Economics, TD No. 674 (June 2008).
P. SESTITO and E. VIVIANO, Reservation wages: explaining some puzzling regional patterns, Labour, TD No. 696 (December 2008).
P. PINOTTI, M. BIANCHI and P. BUONANNO, Do immigrants cause crime?, Journal of the European Economic Association, TD No. 698 (December 2008).
L. FORNI, A. GERALI and M. PISANI, Macroeconomic effects of greater competition in the service sector: the case of Italy, Macroeconomic Dynamics, TD No. 706 (March 2009).
Y. ALTUNBAS, L. GAMBACORTA, and D. MARQUÉS-IBÁÑEZ, Bank risk and monetary policy, Journal of Financial Stability, TD No. 712 (May 2009).
P. ANGELINI, A. NOBILI e C. PICILLO, The interbank market after August 2007: What has changed, and why?, Journal of Money, Credit and Banking, TD No. 731 (ottobre 2009).
L. FORNI, A. GERALI and M. PISANI, The macroeconomics of fiscal consolidations in euro area countries, Journal of Economic Dynamics and Control, TD No. 747 (March 2010).
A. DI CESARE and G. GUAZZAROTTI, An analysis of the determinants of credit default swap spread changes before and during the subprime financial turmoil, in C. V. Karsone (eds.), Finance and Banking Developments, Nova Publishers, New York., TD No. 749 (March 2010).
G. GRANDE and I. VISCO, A public guarantee of a minimum return to defined contribution pension scheme members, Journal of Risk, TD No. 762 (June 2010).
S. MAGRI and R. PICO, The rise of risk-based pricing of mortgage interest rates in Italy, Journal of Banking and Finance, TD No. 696 (October 2010).