
Temi di Discussione - Banca D'Italia · Temi di Discussione (Working Papers) Relationship and...
77
Temi di Discussione (Working Papers) Relationship and transaction lending in a crisis by Patrick Bolton, Xavier Freixas, Leonardo Gambacorta and Paolo Emilio Mistrulli Number 917 July 2013
Transcript of Temi di Discussione - Banca D'Italia · Temi di Discussione (Working Papers) Relationship and...

Temi di Discussione(Working Papers)
Relationship and transaction lending in a crisis
by Patrick Bolton, Xavier Freixas, Leonardo Gambacorta and Paolo Emilio Mistrulli
Num
ber 917Ju
ly 2
013


Temi di discussione(Working papers)
Relationship and transaction lending in a crisis
by Patrick Bolton, Xavier Freixas, Leonardo Gambacorta and Paolo Emilio Mistrulli
Number 917 - July 2013

The purpose of the Temi di discussione series is to promote the circulation of working papers prepared within the Bank of Italy or presented in Bank seminars by outside economists with the aim of stimulating comments and suggestions.
The views expressed in the articles are those of the authors and do not involve the responsibility of the Bank.
Editorial Board: Massimo Sbracia, Stefano Neri, Luisa Carpinelli, Emanuela Ciapanna, Francesco D’Amuri, Alessandro Notarpietro, Pietro Rizza, Concetta Rondinelli, Tiziano Ropele, Andrea Silvestrini, Giordano Zevi.Editorial Assistants: Roberto Marano, Nicoletta Olivanti.
ISSN 1594-7939 (print)ISSN 2281-3950 (online)
Printed by the Printing and Publishing Division of the Bank of Italy

RELATIONSHIP AND TRANSACTION LENDING IN A CRISIS
by Patrick Bolton*, Xavier Freixas†, Leonardo Gambacorta‡ and Paolo Emilio Mistrulli
Abstract
We study how relationship lending and transaction lending vary over the business cycle. We develop a model in which relationship banks gather information on their borrowers, which allows them to provide loans for profitable firms during a crisis. Due to the services they provide, operating costs of relationship banks are higher than those of transaction banks. In our model, where relationship banks compete with transaction banks, a key result is that relationship banks charge a higher intermediation spread in normal times, offering continuation-lending at more favourable terms than transaction banks to profitable firms in a crisis. Using detailed credit register information for Italian banks before and after the Lehman Brothers’ default, we are able to study how both types of bank responded to the crisis and we test existing theories of relationship banking. Our empirical analysis confirms the basic prediction of the model that relationship banks charged a higher spread before the crisis, offered more favourable continuation-lending terms in response to the crisis, and suffered fewer defaults, thus confirming the informational advantage of relationship banking.
JEL Classification: E44, G21
Keywords: relationship banking, transaction banking, crisis.
Contents
1. Introduction.......................................................................................................................... 5 2. The model ............................................................................................................................ 9 3. Equilibrium funding........................................................................................................... 13 4. Optimal funding choice ..................................................................................................... 15 5. Empirical analysis.............................................................................................................. 18 6. Conclusion ......................................................................................................................... 31 References .............................................................................................................................. 32 Appendix A. Mathematical proofs ......................................................................................... 36 Appendix B. Technical details regarding the data.................................................................. 45 Appendix C. Robustness checks............................................................................................. 46 Figures and tables ................................................................................................................... 50
_______________________________________ * Columbia University, NBER and CEPR. Email: [email protected] † Universitat Pompeu Fabra, Barcelona Graduate School of Economics and CEPR. Email:
[email protected] ‡ Bank for International Settlements, MED. Email: [email protected] Bank of Italy, Economic Research Unit, Potenza Branch. Email: [email protected]


Z score in 2008:Q4 Obs. T-bank (1)
Credit History
(2)LTD Log
Loans
Spread 2007:Q2
(3)
Spread 2010:Q1
(3)1=Safe 4,045 0.68 10.92 0.991 7.48 3.81 5.382=Solvent 7,968 0.69 10.36 0.995 7.65 3.94 5.653=Vulnerable 67,614 0.71 10.33 0.981 7.89 4.39 6.334=Risky 106,697 0.72 9.35 0.963 7.91 4.88 7.33Total 186,324 0.72 9.78 0.971 7.88 4.64 6.86
Note: (1) Share of loans that is granted by a bank that has its headquarter outside the same province where the firm has its headquarter. (2) Number of years elapsed since the first time a borrower was reported to the Credit register. (2) Interest rate on credit lines minus one month interbank rate.


50
Figure 1
Average firm cash flows in state S

51
Figure 2
100% Transactional Banks Payoff

52
Figure 3
Bank lending, interest rates and the business cycle in Italy
(a) Bank lending to the private sector1, 2
–5
0
5
10
15
20
2003 2004 2005 2006 2007 2008 2009 2010
Medium and large non-financial firmsSmall non-financial firmsHouseholds
(b) Interest rate on overdraft and interbank rate1, 3
0
2
4
6
8
2003 2004 2005 2006 2007 2008 2009 2010
Interest on overdrafts (a)3-month interbank rate (b)Spread (a) - (b)
(c) Real GDP and stock market capitalization4, 5
750
1,000
1,250
1,500
1,750
2,000
2,250
345
350
355
360
365
370
375
2003 2004 2005 2006 2007 2008 2009 2010
Real GDP (right axis)Stock market capitalization
Notes. The vertical line indicates Lehman’s default. 1 Monthly data. 2 Annual growth rates. Bad loans are excluded. The series are corrected for the impact of securitization activity. 3 Percentage points. Current account overdrafts are expressed in euro. 4 Quarterly data. 5 Real GDP in billions of euro. Stock market capitalization refers to the COMIT Globale Index, 31 Dec. 1972 = 100.
Sources: Bank of Italy; Bloomberg.

53
Figure 4 Lending supply and interest rate setting by banks’ type and state of the world1
(a1) Interest rate: good times (2007:q2) (a2) Interest rate: bad times (2010:q1)
(b1) Lending: good times (2007:q2) (b2) Lending: bad times (2010:q1)
1 This figure reports a graphical representation of the results in Table 5. The horizontal axis of each graph reports the Z-score, an indicator of the probability of default of firms. These scores can be mapped into four levels of risk: 1) safe; 2) solvent; 3) vulnerable; 4) risky. The vertical axis of graphs (a1) and (a2) indicate the level of the interest rate applied by the two bank types on credit lines to the 4 different kinds of firms; those of graphs (b1) and (b2) report the log of lending in real terms supplied by the two bank types.

54
Figure 5 Graphical analysis of the results in Table 5 without fixed effects1
(a1) Interest rate: good times (2007:q2) (a2) Interest rate: bad times (2010:q1)
(b1) Lending: good times (2007:q2) (b2) Lending: bad times (2010:q1)
1 This figure reports a graphical representation of the results obtained re-running the same models reported in Table 5 without fixed effects. The horizontal axis of each graph reports the Z-score, an indicator of the probability of default of firms. These scores can be mapped into four levels of risk: 1) safe; 2) solvent; 3) vulnerable; 4) risky. The vertical axis of graphs (a1) and (a2) indicate the level of the interest rate applied by the two bank types on credit lines to the 4 different kinds of firms; those of graphs (b1) and (b2) report the log of lending in real terms supplied by the two bank types.

55
Table 1 Relationship vs transactional lending: Theory
Possible explanations of
relationship vs transactional
lending
I.
Delinquency rate
II.
Lending rates
III.
Lending quantities
Bad time Good time Bad time Good time Bad time
1. Risk-sharing R=T R>T R>T R>T R>T
2. Interim monitoring R>T R>T R>T ? ?
3. Ex-ante screening R<T R>T R>T R=T R=T
4. Learning R<T R>T R<T ? ?
Notes: R= Relationship bank (R-bank); T= Transaction bank (T-bank)

56
Table 2 Descriptive statistics. Bank-firm relationship
Bank-firm loan types
Obs.
%
Spread good time(2007:q2)
(a)
Spread bad time (2010:q1)
(b)
(b) -(a)
Log Loans good time (2007:q2)
(c )
Log Loansbad time (2010:q1)
(d)
(d) -(c)
Capital to asset ratio(2007:q2)
(e)
Capital to asset ratio (2010:q1)
(f)
(f)-(e)
ALL FIRMS i) Relationship only 18693 10.1% 4.3 6.2 1.9 7.74 7.73 -0.011 9.103 8.794 -0.31 ii) Both types 84598 45.8% 4.5 6.7 2.2 7.96 8.00 0.036 8.843 8.743 -0.10 iii) Transactional only 81604 44.1% 4.8 7.1 2.3 7.78 7.81 0.029 8.547 8.793 0.25 Total 184895 100.0% 4.6 6.8 2.2 7.86 7.89 0.028 8.739 8.770 0.03
H-FIRMS i) Relationship only 18489 10.1% 4.2 6.2 1.9 7.74 7.73 -0.006 9.096 8.79 -0.30 ii) Both types 84129 45.9% 4.5 6.7 2.2 7.95 7.99 0.039 8.543 8.56 0.02 iii) Transactional only 80493 44.0% 4.8 7.1 2.3 7.77 7.80 0.032 8.842 8.79 -0.05 Total 183111 100.0% 4.6 6.8 2.2 7.85 7.88 0.031 8.730 8.69 -0.04
L-FIRMS i) Relationship only 206 11.6% 6.0 9.0 3.0 8.07 7.90 -0.169 8.98 8.70 -0.28 ii) Both types 439 24.6% 5.9 9.4 3.5 8.54 8.33 -0.207 8.949 9.04 0.09 iii) Transactional only 1139 63.8% 6.3 9.7 3.5 8.17 8.06 -0.113 8.648 8.88 0.24 Total 1784 100.0% 6.2 9.6 3.4 8.25 8.11 -0.143 8.760 8.90 0.14 Note: L-Firms are those that went into default in the period 2008:q3-2010:q1, H-Firms are the remaining ones.

57
Table 3 Effect of Bank-firm relationship on the marginal probability of a firm’s default
Dependent variable: P(defaultk=1)
(I) Baseline equation
(II) Firm specific characteristics
(III) Alternative
Weight
Coef. Sig. Coef. Sig. Coef. Sig.
T-share (in value) 0.0032 *** 0.0029 ***
(0.0008) (0.0007) T-share (number of banks) 0.0028 ***
(0.0007) 0.0051 *** 0.0051 *** (0.0005) (0.0001) LTD -0.0002 -0.0002
(0.0018) (0.0018) Small firm -0.0021 -0.0021
(0.0034) (0.0034) CREDIT_HISTORY -0.0002 *** -0.0001 *** (0.0000) (0.0000) Bank fixed effects Yes Yes Yes
Industry-province dummies Yes Yes Yes
Number of obs. 72,489 72,489 72,489
Pseudo R2 0.1273 0.1395 0.1397
The models estimate the marginal probability for a firm k to go into default in the period 2008:q3-2010:q1. All explanatory variables are evaluated at 2008:q2, prior Lehman's default. The variable T- Share indicates the proportion of loans that firm k has borrowed from a transactional bank. We report the share both in loan value and in terms of number of T-banks. Parameter estimates are reported with robust standard errors in brackets (cluster at individual bank level). The symbols *, **, and *** represent significance levels of 10%, 5%, and 1% respectively. Coefficients for industry-province dummies and bank fixed effects are not reported.
58
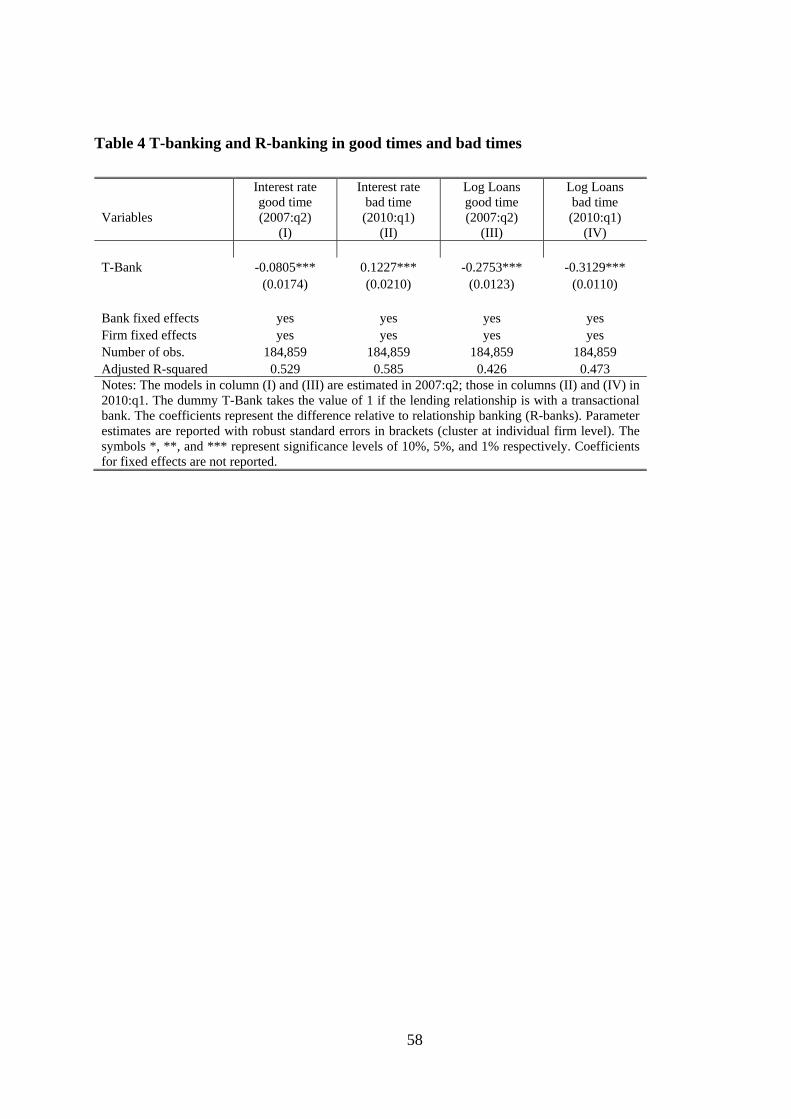
Table 4 T-banking and R-banking in good times and bad times
Variables
Interest rate good time (2007:q2)
(I)
Interest rate bad time (2010:q1)
(II)
Log Loans good time (2007:q2)
(III)
Log Loans bad time (2010:q1)
(IV) T-Bank -0.0805*** 0.1227*** -0.2753*** -0.3129*** (0.0174) (0.0210) (0.0123) (0.0110) Bank fixed effects yes yes yes yes Firm fixed effects yes yes yes yes Number of obs. 184,859 184,859 184,859 184,859 Adjusted R-squared 0.529 0.585 0.426 0.473 Notes: The models in column (I) and (III) are estimated in 2007:q2; those in columns (II) and (IV) in 2010:q1. The dummy T-Bank takes the value of 1 if the lending relationship is with a transactional bank. The coefficients represent the difference relative to relationship banking (R-banks). Parameter estimates are reported with robust standard errors in brackets (cluster at individual firm level). The symbols *, **, and *** represent significance levels of 10%, 5%, and 1% respectively. Coefficients for fixed effects are not reported.

59
Table 5 Comparing T-banking, R-banking and firms’ quality
Variables
Interest rategood time (2007:q2)
(I)
Interest ratebad time (2010:q1)
(II)
Log Loans good time (2007:q2)
(III)
Log Loans bad time (2010:q1)
(IV) T-Bank -0.3309*** -0.3977*** 0.0795* 0.1023** (0.0604) (0.0737) (0.0393) (0.0413) R-Bank*Z 0.3479*** 0.5016*** 0.1036*** 0.1329*** (0.0148) (0.0178) (0.0115) (0.0096) T-Bank*Z 0.4238*** 0.7076*** 0.0575*** 0.0577*** (0.0119) (0.0151) (0.0092) (0.0062) US>GR 0.8825*** 1.5181*** 0.6887*** 0.5667*** (0.0193) (0.0192) (0.0093) (0.0075) LTD -0.3697*** -0.3760*** -0.0603* -0.0796*** (0.0453) (0.0561) (0.0330) (0.0213) Small firm -0.0854 0.2037 -0.3993*** -0.4688*** (0.2295) (0.2463) (0.0968) (0.0784) CREDIT_HISTORY -0.0475*** -0.0619*** 0.0460*** 0.0404*** (0.0020) (0.0023) (0.0013) (0.0009) Bank fixed effects yes yes yes yes Firm fixed effects no no no no Industry-province dummies yes yes yes yes Number of obs. 184,859 184,859 184,859 184,859 Adjusted R-squared 0.1776 0.2065 0.0865 0.0857 Notes: The models in column (I) and (III) are estimated in 2007:q2; those in columns (II) and (IV) in 2010:q1. The dummy T-Bank takes the value of 1 if the lending relationship is with a transactional bank. The coefficients represent the difference relative to relationship banking (R-banks). Parameter estimates are reported with robust standard errors in brackets (cluster at individual bank level). The symbols *, **, and *** represent significance levels of 10%, 5%, and 1% respectively. Coefficients for industry-province dummies and fixed effects are not reported.
60
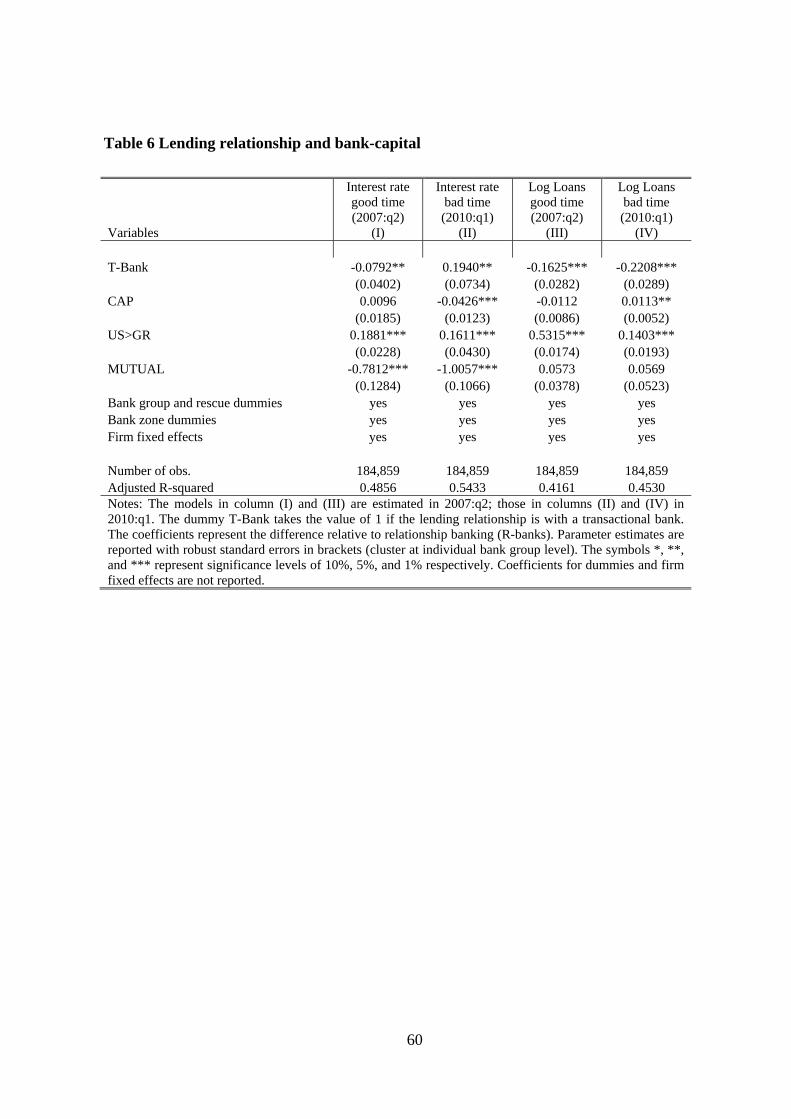
Table 6 Lending relationship and bank-capital
Variables
Interest rate good time (2007:q2)
(I)
Interest rate bad time (2010:q1)
(II)
Log Loans good time (2007:q2)
(III)
Log Loans bad time (2010:q1)
(IV) T-Bank -0.0792** 0.1940** -0.1625*** -0.2208*** (0.0402) (0.0734) (0.0282) (0.0289) CAP 0.0096 -0.0426*** -0.0112 0.0113** (0.0185) (0.0123) (0.0086) (0.0052) US>GR 0.1881*** 0.1611*** 0.5315*** 0.1403*** (0.0228) (0.0430) (0.0174) (0.0193) MUTUAL -0.7812*** -1.0057*** 0.0573 0.0569 (0.1284) (0.1066) (0.0378) (0.0523) Bank group and rescue dummies yes yes yes yes Bank zone dummies yes yes yes yes Firm fixed effects yes yes yes yes Number of obs. 184,859 184,859 184,859 184,859 Adjusted R-squared 0.4856 0.5433 0.4161 0.4530 Notes: The models in column (I) and (III) are estimated in 2007:q2; those in columns (II) and (IV) in 2010:q1. The dummy T-Bank takes the value of 1 if the lending relationship is with a transactional bank. The coefficients represent the difference relative to relationship banking (R-banks). Parameter estimates are reported with robust standard errors in brackets (cluster at individual bank group level). The symbols *, **, and *** represent significance levels of 10%, 5%, and 1% respectively. Coefficients for dummies and firm fixed effects are not reported.

61
Table 7 Capital endowment and bank type
Variables
Baseline model
(I)
Bank-specific characteristics
(II)
Firm-specific characteristics
(III)
Financially constrained
firms (IV)
T-share -3.839*** -3.276** -3.091** -3.203** (0.890) (1.301) (1.267) (1.265) Bank size -0.040 0.090 0.092 (0.280) (0.268) (0.264) Bank liquidity ratio -0.009 -0.011 -0.003 (0.016) (0.019) (0.017) Retail ratio 0.049*** 0.031* 0.029* (0.017) (0.017) (0.017) Proportion of small firms in the bank’s credit portfolio 6.169 5.972 (4.248) (4.115) Proportion of LTD firms in the bank’s credit portfolio -2.422 -2.141 (3.723) (3.712) Average Z-score of the bank’s credit portfolio -1.611 -1.337 (2.468) (2.563) Proportion of financially constrained firms (US>GR) 5.392 (6.603) Bank zone dummies yes yes yes yes Number of obs. 179 179 179 179 Adjusted R-squared 0.130 0.185 0.217 0.218 Notes: The dependent variable is the regulatory capital/risk-weighted asset ratio at 2008:q2 prior to Lehman’s default. The variable T-share represents the proportion of transactional loans (in value) for bank j. It takes the value from 0 (pure R-bank) to 1 (pure T-bank). All bank-specific characteristics and credit portfolio characteristic are at 2008:q1. Parameter estimates are reported with robust standard errors in brackets (cluster at individual bank level). The symbols *, **, and *** represent significance levels of 10%, 5%, and 1% respectively. Coefficients for bank zone dummies are not reported.

62
Table C1 Effect of Bank-firm relationship on the marginal probability of a firm’s default. Including Main bank dummy and its interaction with T-share.
Dependent variable: P(defaultk=1)
(I) Baseline equation
(II) Firm specific characteristics
(III) Alternative
Weight
Coef. Sig. Coef. Sig. Coef. Sig.
T-share (in value) 0.0042 *** 0.0036 ***
(0.0011) (0.0009) T-share (number of banks) 0.0036 ***
(0.0015) Maxsh -0.0123 *** -0.0108 *** -0.0106 *** (0.0022) (0.0018) (0.0019) Maxsh*T-share(in value) -0.0041 * -0.0033 *
(0.0023) (0.0019) Maxsh*T-share(number of banks) -0.0035 *
(0.0020) 0.0048 *** 0.0048 *** (0.0004) (0.0004) LTD -0.0006 -0.0006
(0.0017) (0.0017) Small firm -0.0020 -0.0020
(0.0032) (0.0032) CREDIT_HISTORY -0.0002 *** -0.0002 *** (0.0001) (0.0001) Bank fixed effects Yes Yes Yes
Industry-province dummies Yes Yes Yes
Number of obs. 72,489 72,489 72,489
Pseudo R2 0.0782 0.1190 0.1190 The models estimate the marginal probability for a firm k to go into default in the period 2008:q3-2010:q1. All explanatory variables are evaluated at 2008:q2, prior Lehman's default. The variable T- Share indicates the proportion of loans that firm k has borrowed from a transactional bank. We report the share both in loan value and in terms of number of T-banks. The variable Maxsh indicates the highest share of lending that is granted by the main bank. Parameter estimates are reported with robust standard errors in brackets (cluster at individual bank level). The symbols *, **, and *** represent significance levels of 10%, 5%, and 1% respectively. Coefficients for industry-province dummies and bank fixed effects are not reported.

63
Table C2 T-banking and R-banking in good times and bad times. Including Main bank dummy and its interaction with T-bank.
Variables
Interest rate good time (2007:q2)
(I)
Interest rate bad time (2010:q1)
(II)
Log Loans good time (2007:q2)
(III)
Log Loans bad time (2010:q1)
(IV) T-Bank -0.0896*** 0.1086*** -0.1504*** -0.2067*** (0.0201) (0.0243) (0.0121) (0.0116) Main -0.0969*** -0.1705*** 1.1652*** 0.8594*** (0.0232) (0.0281) (0.0130) (0.0130) Main*T-Bank -0.0080 -0.0233 0.0325 0.0125 (0.0301) (0.0361) (0.0366) (0.0164) Bank fixed effects yes yes yes yes Firm fixed effects yes yes yes yes Number of obs. 184,859 184,859 184,859 184,859 Adjusted R-squared 0.529 0.586 0.585 0.570 Notes: The models in column (I) and (III) are estimated in 2007:q2; those in columns (II) and (IV) in 2010:q1. The dummy T-Bank takes the value of 1 if the lending relationship is with a transactional bank. The coefficients represent the difference relative to relationship banking (R-banks). The dummy Main is equal to one if that bank grants the highest share of lending to that firm. Parameter estimates are reported with robust standard errors in brackets (cluster at individual firm level). The symbols *, **, and *** represent significance levels of 10%, 5%, and 1% respectively. Coefficients for fixed effects are not reported.

64
Table C3 Effect of Bank-firm relationship on the marginal probability of a firm’s default. Changing relationship lending definition from province to region.
Dependent variable: P(defaultk=1)
(I) Baseline equation
(II) Firm specific characteristics
(III) Alternative
Weight
Coef. Sig. Coef. Sig. Coef. Sig.
T-share (in value) 0.0024 *** 0.0024 ***
(0.0007) (0.0007) T-share (number of banks) 0.0034 ***
(0.0007) 0.0051 *** 0.0051 *** (0.0004) (0.0004) LTD -0.0002 -0.0002
(0.0018) (0.0018) Small firm -0.0020 -0.0018
(0.0034) (0.0035) CREDIT_HISTORY -0.0001 ** -0.0002 ** (0.0000) (0.0000) Bank fixed effects Yes Yes Yes
Industry-province dummies Yes Yes Yes
Number of obs. 72,489 72,489 72,489
Pseudo R2 0.0612 0.1004 0.1003
The models estimate the marginal probability for a firm k to go into default in the period 2008:q3-2010:q1. All explanatory variables are evaluated at 2008:q2, prior Lehman's default. The variable T- Share indicates the proportion of loans that firm k has borrowed from a transactional bank. We report the share both in loan value and in terms of number of T-banks. Parameter estimates are reported with robust standard errors in brackets (cluster at individual bank level). The symbols *, **, and *** represent significance levels of 10%, 5%, and 1% respectively. Coefficients for industry-province dummies and bank fixed effects are not reported.

65
Table C4 T-banking and R-banking in good times and bad times. Changing relationship lending definition from province to region.
Variables
Interest rate good time (2007:q2)
(I)
Interest rate bad time (2010:q1)
(II)
Log Loans good time (2007:q2)
(III)
Log Loans bad time (2010:q1)
(IV) T-Bank -0.0748*** 0.1038*** -0.2428*** -0.256*** (0.0182) (0.0217) (0.0123) (0.0110) Bank fixed effects yes yes yes yes Firm fixed effects yes yes yes yes Number of obs. 184,859 184,859 184,859 184,859 Adjusted R-squared 0.529 0.585 0.426 0.472 Notes: The models in column (I) and (III) are estimated in 2007:q2; those in columns (II) and (IV) in 2010:q1. The dummy T-Bank takes the value of 1 if the lending relationship is with a transactional bank. The coefficients represent the difference relative to relationship banking (R-banks). Parameter estimates are reported with robust standard errors in brackets (cluster at individual firm level). The symbols *, **, and *** represent significance levels of 10%, 5%, and 1% respectively. Coefficients for fixed effects are not reported.

66
Table C5 Effect of Bank-firm relationship on the marginal probability of a firm’s default. All foreign banks subsidiaries are T-banks.
Dependent variable: P(defaultk=1)
(I) Baseline equation
(II) Firm specific characteristics
(III) Alternative
Weight
Coef. Sig. Coef. Sig. Coef. Sig.
T-share (in value) 0.0031 *** 0.0027 ***
(0.0009) (0.0007) T-share (number of banks) 0.0027 ***
(0.0007) 0.0051 *** 0.0051 *** (0.0004) (0.0004) LTD -0.0002 -0.0002
(0.0018) (0.0018) Small firm -0.0021 -0.0021
(0.0034) (0.0034) CREDIT_HISTORY -0.0002 ** -0.0002 ** (0.0000) (0.0000) Bank fixed effects Yes Yes Yes
Industry-province dummies Yes Yes Yes
Number of obs. 72,489 72,489 72,489
Pseudo R2 0.0600 0.0994 0.0994
The models estimate the marginal probability for a firm k to go into default in the period 2008:q3-2010:q1. All explanatory variables are evaluated at 2008:q2, prior Lehman's default. The variable T- Share indicates the proportion of loans that firm k has borrowed from a transactional bank. We report the share both in loan value and in terms of number of T-banks. Parameter estimates are reported with robust standard errors in brackets (cluster at individual bank level). The symbols *, **, and *** represent significance levels of 10%, 5%, and 1% respectively. Coefficients for industry-province dummies and bank fixed effects are not reported.

67
Table C6 T-banking and R-banking in good times and bad times. All foreign
banks subsidiaries are T-banks.
Variables
Interest rate good time (2007:q2)
(I)
Interest rate bad time (2010:q1)
(II)
Log Loans good time (2007:q2)
(III)
Log Loans bad time (2010:q1)
(IV) T-Bank -0.0844*** 0.1030*** -0.2737*** -0.2970*** (0.0180) (0.0218) (0.0128) (0.0115) Bank fixed effects yes yes yes yes Firm fixed effects yes yes yes yes Number of obs. 184,859 184,859 184,859 184,859 Adjusted R-squared 0.529 0.585 0.426 0.473 Notes: The models in column (I) and (III) are estimated in 2007:q2; those in columns (II) and (IV) in 2010:q1. The dummy T-Bank takes the value of 1 if the lending relationship is with a transactional bank. The coefficients represent the difference relative to relationship banking (R-banks). Parameter estimates are reported with robust standard errors in brackets (cluster at individual firm level). The symbols *, **, and *** represent significance levels of 10%, 5%, and 1% respectively. Coefficients for fixed effects are not reported.
68
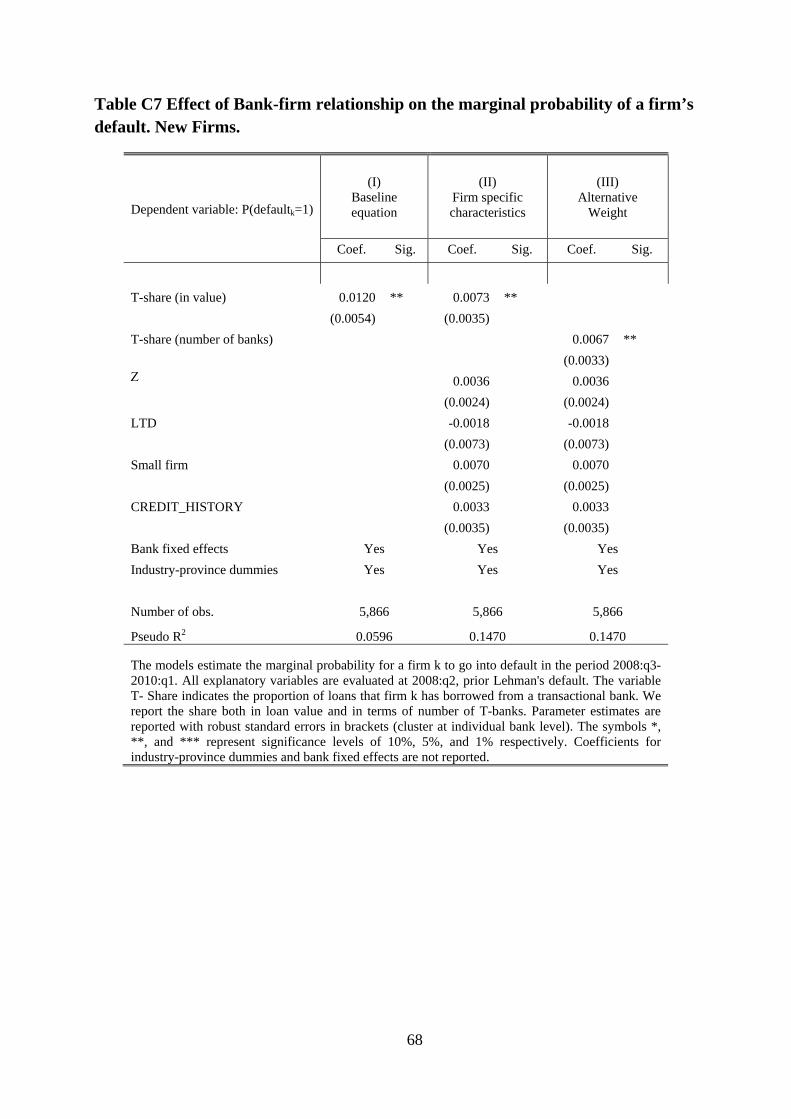
Table C7 Effect of Bank-firm relationship on the marginal probability of a firm’s default. New Firms.
Dependent variable: P(defaultk=1)
(I) Baseline equation
(II) Firm specific characteristics
(III) Alternative
Weight
Coef. Sig. Coef. Sig. Coef. Sig.
T-share (in value) 0.0120 ** 0.0073 **
(0.0054) (0.0035)
T-share (number of banks) 0.0067 **
(0.0033) 0.0036 0.0036 (0.0024) (0.0024)
LTD -0.0018 -0.0018
(0.0073) (0.0073)
Small firm 0.0070 0.0070
(0.0025) (0.0025)
CREDIT_HISTORY 0.0033 0.0033 (0.0035) (0.0035)
Bank fixed effects Yes Yes Yes
Industry-province dummies Yes Yes Yes
Number of obs. 5,866 5,866 5,866
Pseudo R2 0.0596 0.1470 0.1470
The models estimate the marginal probability for a firm k to go into default in the period 2008:q3-2010:q1. All explanatory variables are evaluated at 2008:q2, prior Lehman's default. The variable T- Share indicates the proportion of loans that firm k has borrowed from a transactional bank. We report the share both in loan value and in terms of number of T-banks. Parameter estimates are reported with robust standard errors in brackets (cluster at individual bank level). The symbols *, **, and *** represent significance levels of 10%, 5%, and 1% respectively. Coefficients for industry-province dummies and bank fixed effects are not reported.
69
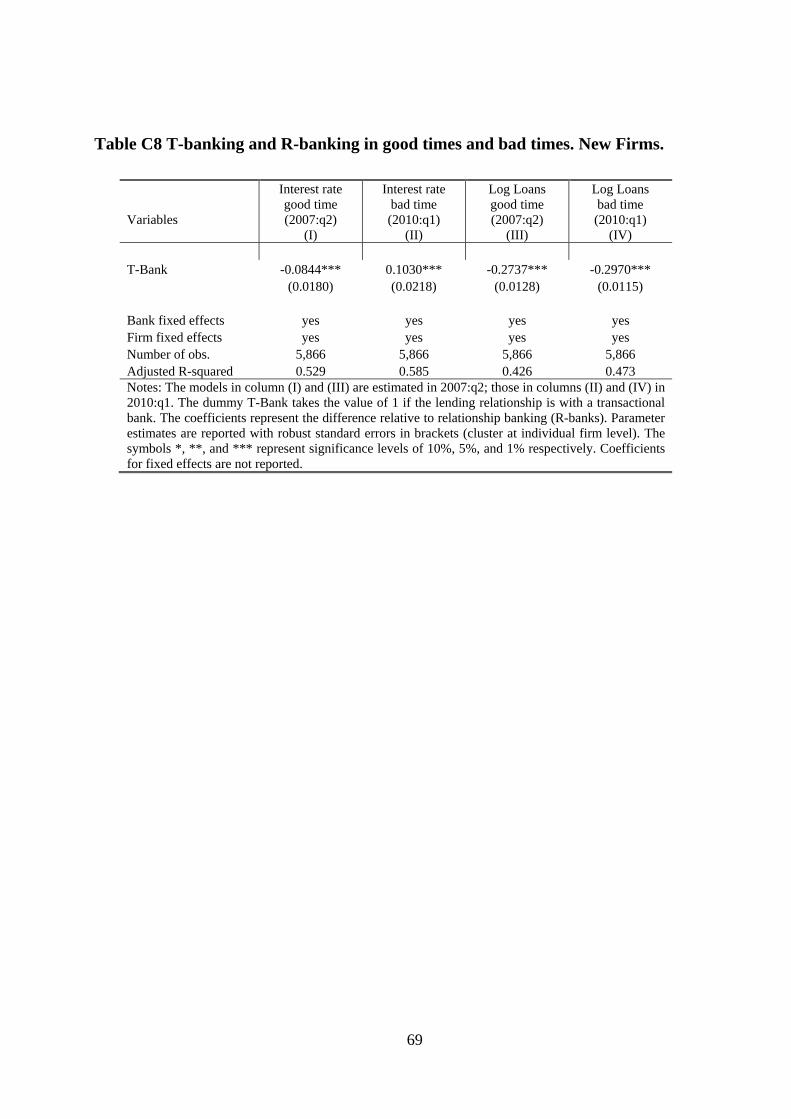
Table C8 T-banking and R-banking in good times and bad times. New Firms.
Variables
Interest rate good time (2007:q2)
(I)
Interest rate bad time (2010:q1)
(II)
Log Loans good time (2007:q2)
(III)
Log Loans bad time (2010:q1)
(IV) T-Bank -0.0844*** 0.1030*** -0.2737*** -0.2970*** (0.0180) (0.0218) (0.0128) (0.0115) Bank fixed effects yes yes yes yes Firm fixed effects yes yes yes yes Number of obs. 5,866 5,866 5,866 5,866 Adjusted R-squared 0.529 0.585 0.426 0.473 Notes: The models in column (I) and (III) are estimated in 2007:q2; those in columns (II) and (IV) in 2010:q1. The dummy T-Bank takes the value of 1 if the lending relationship is with a transactional bank. The coefficients represent the difference relative to relationship banking (R-banks). Parameter estimates are reported with robust standard errors in brackets (cluster at individual firm level). The symbols *, **, and *** represent significance levels of 10%, 5%, and 1% respectively. Coefficients for fixed effects are not reported.

(*) Requests for copies should be sent to: Banca d’Italia – Servizio Studi di struttura economica e finanziaria – Divisione Biblioteca e Archivio storico – Via Nazionale, 91 – 00184 Rome – (fax 0039 06 47922059). They are available on the Internet www.bancaditalia.it.
RECENTLY PUBLISHED “TEMI” (*)
N. 895 – What is a prime bank? A Euribor – OIS spread perspective, by Marco Taboga (January 2013).
N. 896 – Short-term GDP forecasting with a mixed frequency dynamic factor model with stochastic volatility, by Massimiliano Marcellino, Mario Porqueddu and Fabrizio Venditti (January 2013).
N. 897 – Collective action clauses: how do they weigh on sovereigns?, by Alfredo Bardozzetti and Davide Dottori (January 2013).
N. 898 – Firm size and judicial efficiency: evidence from the neighbour’s Court, by Silvia Giacomelli and Carlo Menon (January 2013).
N. 899 – A spatial competitive analysis: the carbon leakage effect on the cement industry under the European Emissions Trading Scheme, by Elisabetta Allevi, Giorgia Oggioni, Rossana Riccardi and Marco Rocco (January 2013).
N. 900 – The causal effect of credit guarantees for SMEs: evidence from Italy, by Alessio D’Ignazio and Carlo Menon (February 2013).
N. 901 – Banking consolidation and bank-firm credit relationships: the role of geographical features and relationship characteristics, by Enrico Beretta and Silvia Del Prete (February 2013).
N. 902 – Evaluating the efficacy of European regional funds for R&D, by Davide Fantino and Giusy Cannone (February 2013).
N. 903 – Limited credit records and market outcomes, by Margherita Bottero and Giancarlo Spagnolo (February 2013).
N. 904 – Pure or wake-up-call contagion? Another look at the EMU sovereign debt crisis, by Raffaela Giordano, Marcello Pericoli and Pietro Tommasino (April 2013).
N. 905 – Family firms and the Great Recession: out of sight, out of mind?, by Leandro D’Aurizio and Livio Romano (April 2013).
N. 906 – Price discovery in the Italian sovereign bonds market: the role of order flow, by Alessandro Girardi and Claudio Impenna (April 2013).
N. 907 – Public-private wage differentials in euro area countries: evidence from quantile decomposition analysis, by Domenico Depalo and Raffaela Giordano (April 2013).
N. 908 – Asking income and consumption questions in the same survey: what are the risks?, by Giulia Cifaldi and Andrea Neri (April 2013).
N. 909 – Credit supply during a sovereign debt crisis, by Marcello Bofondi, Luisa Carpinelli and Enrico Sette (April 2013).
N. 910 – Geography, productivity and trade: does selection explain why some locations are more productive than others?, by Antonio Accetturo, Valter Di Giacinto, Giacinto Micucci and Marcello Pagnini (April 2013).
N. 911 – Trust and preferences: evidence from survey data, by Giuseppe Albanese, Guido de Blasio and Paolo Sestito (April 2013).
N. 912 – Tempered stable Ornstein-Uhlenbeck processes: a practical view, by Michele Leonardo Bianchi, Svetlozar T. Rachev and Frank J. Fabozzi (June 2013).
N. 913 – Forward-looking robust portfolio selection, by Sara Cecchetti and Laura Sigalotti (June 2013).
N. 914 – When the baby cries at night. Inelastic buyers in non-competitive markets, by Giacomo Calzolari, Andrea Ichino, Francesco Manaresi and Viki Nellas (June 2013).
N. 915 – Local development that money can’t buy: Italy’s Contratti di Programma, by Monica Andini and Guido de Blasio (June 2013).
N. 916 – The effect of organized crime on public funds, by Guglielmo Barone and Gaia Narciso (June 2013).
"TEMI" LATER PUBLISHED ELSEWHERE
2010
A. PRATI and M. SBRACIA, Uncertainty and currency crises: evidence from survey data, Journal of Monetary Economics, v, 57, 6, pp. 668-681, TD No. 446 (July 2002).
L. MONTEFORTE and S. SIVIERO, The Economic Consequences of Euro Area Modelling Shortcuts, Applied Economics, v. 42, 19-21, pp. 2399-2415, TD No. 458 (December 2002).
S. MAGRI, Debt maturity choice of nonpublic Italian firms , Journal of Money, Credit, and Banking, v.42, 2-3, pp. 443-463, TD No. 574 (January 2006).
G. DE BLASIO and G. NUZZO, Historical traditions of civicness and local economic development, Journal of Regional Science, v. 50, 4, pp. 833-857, TD No. 591 (May 2006).
E. IOSSA and G. PALUMBO, Over-optimism and lender liability in the consumer credit market, Oxford Economic Papers, v. 62, 2, pp. 374-394, TD No. 598 (September 2006).
S. NERI and A. NOBILI, The transmission of US monetary policy to the euro area, International Finance, v. 13, 1, pp. 55-78, TD No. 606 (December 2006).
F. ALTISSIMO, R. CRISTADORO, M. FORNI, M. LIPPI and G. VERONESE, New Eurocoin: Tracking Economic Growth in Real Time, Review of Economics and Statistics, v. 92, 4, pp. 1024-1034, TD No. 631 (June 2007).
U. ALBERTAZZI and L. GAMBACORTA, Bank profitability and taxation, Journal of Banking and Finance, v. 34, 11, pp. 2801-2810, TD No. 649 (November 2007).
L. GAMBACORTA and C. ROSSI, Modelling bank lending in the euro area: a nonlinear approach, Applied Financial Economics, v. 20, 14, pp. 1099-1112 ,TD No. 650 (November 2007).
M. IACOVIELLO and S. NERI, Housing market spillovers: evidence from an estimated DSGE model, American Economic Journal: Macroeconomics, v. 2, 2, pp. 125-164, TD No. 659 (January 2008).
F. BALASSONE, F. MAURA and S. ZOTTERI, Cyclical asymmetry in fiscal variables in the EU, Empirica, TD No. 671, v. 37, 4, pp. 381-402 (June 2008).
F. D'AMURI, GIANMARCO I.P. OTTAVIANO and G. PERI, The labor market impact of immigration on the western german labor market in the 1990s, European Economic Review, v. 54, 4, pp. 550-570, TD No. 687 (August 2008).
A. ACCETTURO, Agglomeration and growth: the effects of commuting costs, Papers in Regional Science, v. 89, 1, pp. 173-190, TD No. 688 (September 2008).
S. NOBILI and G. PALAZZO, Explaining and forecasting bond risk premiums, Financial Analysts Journal, v. 66, 4, pp. 67-82, TD No. 689 (September 2008).
A. B. ATKINSON and A. BRANDOLINI, On analysing the world distribution of income, World Bank Economic Review , v. 24, 1 , pp. 1-37, TD No. 701 (January 2009).
R. CAPPARIELLO and R. ZIZZA, Dropping the Books and Working Off the Books, Labour, v. 24, 2, pp. 139-162 ,TD No. 702 (January 2009).
C. NICOLETTI and C. RONDINELLI, The (mis)specification of discrete duration models with unobserved heterogeneity: a Monte Carlo study, Journal of Econometrics, v. 159, 1, pp. 1-13, TD No. 705 (March 2009).
L. FORNI, A. GERALI and M. PISANI, Macroeconomic effects of greater competition in the service sector: the case of Italy, Macroeconomic Dynamics, v. 14, 5, pp. 677-708, TD No. 706 (March 2009).
V. DI GIACINTO, G. MICUCCI and P. MONTANARO, Dynamic macroeconomic effects of public capital: evidence from regional Italian data, Giornale degli economisti e annali di economia, v. 69, 1, pp. 29-66, TD No. 733 (November 2009).
F. COLUMBA, L. GAMBACORTA and P. E. MISTRULLI, Mutual Guarantee institutions and small business finance, Journal of Financial Stability, v. 6, 1, pp. 45-54, TD No. 735 (November 2009).
A. GERALI, S. NERI, L. SESSA and F. M. SIGNORETTI, Credit and banking in a DSGE model of the Euro Area, Journal of Money, Credit and Banking, v. 42, 6, pp. 107-141, TD No. 740 (January 2010).
M. AFFINITO and E. TAGLIAFERRI, Why do (or did?) banks securitize their loans? Evidence from Italy, Journal of Financial Stability, v. 6, 4, pp. 189-202, TD No. 741 (January 2010).
S. FEDERICO, Outsourcing versus integration at home or abroad and firm heterogeneity, Empirica, v. 37, 1, pp. 47-63, TD No. 742 (February 2010).
V. DI GIACINTO, On vector autoregressive modeling in space and time, Journal of Geographical Systems, v. 12, 2, pp. 125-154, TD No. 746 (February 2010).

L. FORNI, A. GERALI and M. PISANI, The macroeconomics of fiscal consolidations in euro area countries, Journal of Economic Dynamics and Control, v. 34, 9, pp. 1791-1812, TD No. 747 (March 2010).
S. MOCETTI and C. PORELLO, How does immigration affect native internal mobility? new evidence from Italy, Regional Science and Urban Economics, v. 40, 6, pp. 427-439, TD No. 748 (March 2010).
A. DI CESARE and G. GUAZZAROTTI, An analysis of the determinants of credit default swap spread changes before and during the subprime financial turmoil, Journal of Current Issues in Finance, Business and Economics, v. 3, 4, pp., TD No. 749 (March 2010).
P. CIPOLLONE, P. MONTANARO and P. SESTITO, Value-added measures in Italian high schools: problems and findings, Giornale degli economisti e annali di economia, v. 69, 2, pp. 81-114, TD No. 754 (March 2010).
A. BRANDOLINI, S. MAGRI and T. M SMEEDING, Asset-based measurement of poverty, Journal of Policy Analysis and Management, v. 29, 2 , pp. 267-284, TD No. 755 (March 2010).
G. CAPPELLETTI, A Note on rationalizability and restrictions on beliefs, The B.E. Journal of Theoretical Economics, v. 10, 1, pp. 1-11,TD No. 757 (April 2010).
S. DI ADDARIO and D. VURI, Entrepreneurship and market size. the case of young college graduates in Italy, Labour Economics, v. 17, 5, pp. 848-858, TD No. 775 (September 2010).
A. CALZA and A. ZAGHINI, Sectoral money demand and the great disinflation in the US, Journal of Money, Credit, and Banking, v. 42, 8, pp. 1663-1678, TD No. 785 (January 2011).
2011
S. DI ADDARIO, Job search in thick markets, Journal of Urban Economics, v. 69, 3, pp. 303-318, TD No. 605 (December 2006).
F. SCHIVARDI and E. VIVIANO, Entry barriers in retail trade, Economic Journal, v. 121, 551, pp. 145-170, TD No. 616 (February 2007).
G. FERRERO, A. NOBILI and P. PASSIGLIA, Assessing excess liquidity in the Euro Area: the role of sectoral distribution of money, Applied Economics, v. 43, 23, pp. 3213-3230, TD No. 627 (April 2007).
P. E. MISTRULLI, Assessing financial contagion in the interbank market: maximun entropy versus observed interbank lending patterns, Journal of Banking & Finance, v. 35, 5, pp. 1114-1127, TD No. 641 (September 2007).
E. CIAPANNA, Directed matching with endogenous markov probability: clients or competitors?, The RAND Journal of Economics, v. 42, 1, pp. 92-120, TD No. 665 (April 2008).
M. BUGAMELLI and F. PATERNÒ, Output growth volatility and remittances, Economica, v. 78, 311, pp. 480-500, TD No. 673 (June 2008).
V. DI GIACINTO e M. PAGNINI, Local and global agglomeration patterns: two econometrics-based indicators, Regional Science and Urban Economics, v. 41, 3, pp. 266-280, TD No. 674 (June 2008).
G. BARONE and F. CINGANO, Service regulation and growth: evidence from OECD countries, Economic Journal, v. 121, 555, pp. 931-957, TD No. 675 (June 2008).
R. GIORDANO and P. TOMMASINO, What determines debt intolerance? The role of political and monetary institutions, European Journal of Political Economy, v. 27, 3, pp. 471-484, TD No. 700 (January 2009).
P. ANGELINI, A. NOBILI e C. PICILLO, The interbank market after August 2007: What has changed, and why?, Journal of Money, Credit and Banking, v. 43, 5, pp. 923-958, TD No. 731 (October 2009).
G. BARONE and S. MOCETTI, Tax morale and public spending inefficiency, International Tax and Public Finance, v. 18, 6, pp. 724-49, TD No. 732 (November 2009).
L. FORNI, A. GERALI and M. PISANI, The Macroeconomics of Fiscal Consolidation in a Monetary Union: the Case of Italy, in Luigi Paganetto (ed.), Recovery after the crisis. Perspectives and policies, VDM Verlag Dr. Muller, TD No. 747 (March 2010).
A. DI CESARE and G. GUAZZAROTTI, An analysis of the determinants of credit default swap changes before and during the subprime financial turmoil, in Barbara L. Campos and Janet P. Wilkins (eds.), The Financial Crisis: Issues in Business, Finance and Global Economics, New York, Nova Science Publishers, Inc., TD No. 749 (March 2010).
A. LEVY and A. ZAGHINI, The pricing of government guaranteed bank bonds, Banks and Bank Systems, v. 6, 3, pp. 16-24, TD No. 753 (March 2010).
G. BARONE, R. FELICI and M. PAGNINI, Switching costs in local credit markets, International Journal of Industrial Organization, v. 29, 6, pp. 694-704, TD No. 760 (June 2010).

G. BARBIERI, C. ROSSETTI e P. SESTITO, The determinants of teacher mobility: evidence using Italian teachers' transfer applications, Economics of Education Review, v. 30, 6, pp. 1430-1444, TD No. 761 (marzo 2010).
G. GRANDE and I. VISCO, A public guarantee of a minimum return to defined contribution pension scheme members, The Journal of Risk, v. 13, 3, pp. 3-43, TD No. 762 (June 2010).
P. DEL GIOVANE, G. ERAMO and A. NOBILI, Disentangling demand and supply in credit developments: a survey-based analysis for Italy, Journal of Banking and Finance, v. 35, 10, pp. 2719-2732, TD No. 764 (June 2010).
G. BARONE and S. MOCETTI, With a little help from abroad: the effect of low-skilled immigration on the female labour supply, Labour Economics, v. 18, 5, pp. 664-675, TD No. 766 (July 2010).
S. FEDERICO and A. FELETTIGH, Measuring the price elasticity of import demand in the destination markets of italian exports, Economia e Politica Industriale, v. 38, 1, pp. 127-162, TD No. 776 (October 2010).
S. MAGRI and R. PICO, The rise of risk-based pricing of mortgage interest rates in Italy, Journal of Banking and Finance, v. 35, 5, pp. 1277-1290, TD No. 778 (October 2010).
M. TABOGA, Under/over-valuation of the stock market and cyclically adjusted earnings, International Finance, v. 14, 1, pp. 135-164, TD No. 780 (December 2010).
S. NERI, Housing, consumption and monetary policy: how different are the U.S. and the Euro area?, Journal of Banking and Finance, v.35, 11, pp. 3019-3041, TD No. 807 (April 2011).
V. CUCINIELLO, The welfare effect of foreign monetary conservatism with non-atomistic wage setters, Journal of Money, Credit and Banking, v. 43, 8, pp. 1719-1734, TD No. 810 (June 2011).
A. CALZA and A. ZAGHINI, welfare costs of inflation and the circulation of US currency abroad, The B.E. Journal of Macroeconomics, v. 11, 1, Art. 12, TD No. 812 (June 2011).
I. FAIELLA, La spesa energetica delle famiglie italiane, Energia, v. 32, 4, pp. 40-46, TD No. 822 (September 2011).
R. DE BONIS and A. SILVESTRINI, The effects of financial and real wealth on consumption: new evidence from OECD countries, Applied Financial Economics, v. 21, 5, pp. 409–425, TD No. 837 (November 2011).
F. CAPRIOLI, P. RIZZA and P. TOMMASINO, Optimal fiscal policy when agents fear government default, Revue Economique, v. 62, 6, pp. 1031-1043, TD No. 859 (March 2012).
2012
F. CINGANO and A. ROSOLIA, People I know: job search and social networks, Journal of Labor Economics, v. 30, 2, pp. 291-332, TD No. 600 (September 2006).
G. GOBBI and R. ZIZZA, Does the underground economy hold back financial deepening? Evidence from the italian credit market, Economia Marche, Review of Regional Studies, v. 31, 1, pp. 1-29, TD No. 646 (November 2006).
S. MOCETTI, Educational choices and the selection process before and after compulsory school, Education Economics, v. 20, 2, pp. 189-209, TD No. 691 (September 2008).
M. PERICOLI and M. TABOGA, Bond risk premia, macroeconomic fundamentals and the exchange rate, International Review of Economics and Finance, v. 22, 1, pp. 42-65, TD No. 699 (January 2009).
F. LIPPI and A. NOBILI, Oil and the macroeconomy: a quantitative structural analysis, Journal of European Economic Association, v. 10, 5, pp. 1059-1083, TD No. 704 (March 2009).
G. ASCARI and T. ROPELE, Disinflation in a DSGE perspective: sacrifice ratio or welfare gain ratio?, Journal of Economic Dynamics and Control, v. 36, 2, pp. 169-182, TD No. 736 (January 2010).
S. FEDERICO, Headquarter intensity and the choice between outsourcing versus integration at home or abroad, Industrial and Corporate Chang, v. 21, 6, pp. 1337-1358, TD No. 742 (February 2010).
I. BUONO and G. LALANNE, The effect of the Uruguay Round on the intensive and extensive margins of trade, Journal of International Economics, v. 86, 2, pp. 269-283, TD No. 743 (February 2010).
S. GOMES, P. JACQUINOT and M. PISANI, The EAGLE. A model for policy analysis of macroeconomic interdependence in the euro area, Economic Modelling, v. 29, 5, pp. 1686-1714, TD No. 770 (July 2010).
A. ACCETTURO and G. DE BLASIO, Policies for local development: an evaluation of Italy’s “Patti Territoriali”, Regional Science and Urban Economics, v. 42, 1-2, pp. 15-26, TD No. 789 (January 2006).
F. BUSETTI and S. DI SANZO, Bootstrap LR tests of stationarity, common trends and cointegration, Journal of Statistical Computation and Simulation, v. 82, 9, pp. 1343-1355, TD No. 799 (March 2006).

S. NERI and T. ROPELE, Imperfect information, real-time data and monetary policy in the Euro area, The Economic Journal, v. 122, 561, pp. 651-674, TD No. 802 (March 2011).
G. CAPPELLETTI, G. GUAZZAROTTI and P. TOMMASINO, What determines annuity demand at retirement?, The Geneva Papers on Risk and Insurance – Issues and Practice, pp. 1-26, TD No. 805 (April 2011).
A. ANZUINI and F. FORNARI, Macroeconomic determinants of carry trade activity, Review of International Economics, v. 20, 3, pp. 468-488, TD No. 817 (September 2011).
M. AFFINITO, Do interbank customer relationships exist? And how did they function in the crisis? Learning from Italy, Journal of Banking and Finance, v. 36, 12, pp. 3163-3184, TD No. 826 (October 2011).
R. CRISTADORO and D. MARCONI, Household savings in China, Journal of Chinese Economic and Business Studies, v. 10, 3, pp. 275-299, TD No. 838 (November 2011).
P. GUERRIERI and F. VERGARA CAFFARELLI, Trade Openness and International Fragmentation of Production in the European Union: The New Divide?, Review of International Economics, v. 20, 3, pp. 535-551, TD No. 855 (February 2012).
V. DI GIACINTO, G. MICUCCI and P. MONTANARO, Network effects of public transposrt infrastructure: evidence on Italian regions, Papers in Regional Science, v. 91, 3, pp. 515-541, TD No. 869 (July 2012).
A. FILIPPIN and M. PACCAGNELLA, Family background, self-confidence and economic outcomes, Economics of Education Review, v. 31, 5, pp. 824-834, TD No. 875 (July 2012).
2013
F. CINGANO and P. PINOTTI, Politicians at work. The private returns and social costs of political connections,
Journal of the European Economic Association, v. 11, 2, pp. 433-465, TD No. 709 (May 2009).
F. BUSETTI and J. MARCUCCI, Comparing forecast accuracy: a Monte Carlo investigation, International Journal of Forecasting, v. 29, 1, pp. 13-27, TD No. 723 (September 2009).
A. FINICELLI, P. PAGANO and M. SBRACIA, Ricardian Selection, Journal of International Economics, v. 89, 1, pp. 96-109, TD No. 728 (October 2009).
L. MONTEFORTE and G. MORETTI, Real-time forecasts of inflation: the role of financial variables, Journal of Forecasting, v. 32, 1, pp. 51-61, TD No. 767 (July 2010).
E. GAIOTTI, Credit availablility and investment: lessons from the "Great Recession", European Economic Review, v. 59, pp. 212-227, TD No. 793 (February 2011).
A. ACCETTURO e L. INFANTE, Skills or Culture? An analysis of the decision to work by immigrant women in Italy, IZA Journal of Migration, v. 2, 2, pp. 1-21, TD No. 815 (July 2011).
G. BARONE and G. DE BLASIO, Electoral rules and voter turnout, International Review of Law and Economics, v. 36, 1, pp. 25-35, TD No. 833 (November 2011).
FORTHCOMING
M. BUGAMELLI and A. ROSOLIA, Produttività e concorrenza estera, Rivista di politica economica, TD No. 578 (February 2006).
M. BRATTI, D. CHECCHI and G. DE BLASIO, Does the expansion of higher education increase the equality of educational opportunities? Evidence from Italy, in R. Matoušek; D. Stavárek (eds.), Labour, TD No. 679 (June 2008).
A. MERCATANTI, A likelihood-based analysis for relaxing the exclusion restriction in randomized experiments with imperfect compliance, Australian and New Zealand Journal of Statistics, TD No. 683 (August 2008).
P. SESTITO and E. VIVIANO, Reservation wages: explaining some puzzling regional patterns, Labour, TD No. 696 (December 2008).
P. PINOTTI, M. BIANCHI and P. BUONANNO, Do immigrants cause crime?, Journal of the European Economic Association, TD No. 698 (December 2008).
Y. ALTUNBAS, L. GAMBACORTA and D. MARQUÉS-IBÁÑEZ, Bank risk and monetary policy, Journal of Financial Stability, TD No. 712 (May 2009).

M. TABOGA, The riskiness of corporate bonds, Journal of Money, Credit and Banking, TD No. 730 (October 2009).
F. D’AMURI, Gli effetti della legge 133/2008 sulle assenze per malattia nel settore pubblico, Rivista di Politica Economica, TD No. 787 (January 2011).
E. COCOZZA and P. PISELLI, Testing for east-west contagion in the European banking sector during the financial crisis, in R. Matoušek; D. Stavárek (eds.), Financial Integration in the European Union, Taylor & Francis, TD No. 790 (February 2011).
F. NUCCI and M. RIGGI, Performance pay and changes in U.S. labor market dynamics, Journal of Economic Dynamics and Control, TD No. 800 (March 2011).
A. DE SOCIO, Squeezing liquidity in a “lemons market” or asking liquidity “on tap”, Journal of Banking and Finance, TD No. 819 (September 2011).
O. BLANCHARD and M. RIGGI, Why are the 2000s so different from the 1970s? A structural interpretation of changes in the macroeconomic effects of oil prices, Journal of the European Economic Association, TD No. 835 (November 2011).
E. GENNARI and G. MESSINA, How sticky are local expenditures in Italy? Assessing the relevance of the flypaper effect through municipal data, International Tax and Public Finance, TD No. 844 (January 2012).
S. FEDERICO, Industry dynamics and competition from low-wage countries: evidence on Italy, Oxford Bulletin of Economics and Statistics, TD No. 879 (September 2012).
F. D’AMURI and G. PERI, Immigration, jobs and employment protection: evidence from Europe before and during the Great Recession, Journal of the European Economic Association, TD No. 886 (October 2012).


