Telecom Argentina Plan 2011-13 · PDF filethe Private Securities Litigation Reform Act of...
18
Telecom Argentina Plan 2011-13 FRANCO BERTONE
Transcript of Telecom Argentina Plan 2011-13 · PDF filethe Private Securities Litigation Reform Act of...

Telecom ArgentinaPlan 2011-13
FRANCO BERTONE

1FRANCO BERTONE
These presentations contain statements that constitute forward-looking statements within the meaning of the Private Securities Litigation Reform Act of 1995. These statements appear in a number of places in this presentation and include statements regarding the intent, belief or current expectations of the customer base, estimates regarding future growth in the different business lines and the global business, market share, financial results and other aspects of the activities and situation relating to the Company and the Group. Such forward looking statements are not guarantees of future performance and involve risks and uncertainties, and actual results may differ materially from those projected or implied in the forward looking statements as a result of various factors. Forward-looking information is based on certain key assumptions which we believe to be reasonable as of the date hereof, but forward looking information by its nature involves risks and uncertainties, which are outside our control, and could significantly affect expected results.Analysts are cautioned not to place undue reliance on those forward looking statements, which speak only as of the date of this presentation. Telecom Italia S.p.A. undertakes no obligation to release publicly the results of any revisions to these forward looking statements which may be made to reflect events and circumstances after the date of this presentation, including, without limitation, changes in Telecom Italia S.p.A. business or acquisition strategy or planned capital expenditures or to reflect the occurrence of unanticipated events. Analysts and investors are encouraged to consult the Company's Annual Report on Form 20-F as well as periodic filings made on Form 6-K, which are on file with the United States Securities and Exchange Commission.Furthermore, the data and information contained in this presentation only refer to Telecom Argentina group and do not include data from its controlling companies Sofora Telecomunicaciones and Nortel Inversora; such companies are part of the business unit Argentina that is consolidated in the Telecom Italia Group.
Safe Harbour

2FRANCO BERTONE
Telecom Argentina Group 2010 Results (IFRS)
Telecom Argentina Plan
Agenda

3FRANCO BERTONE
2,022
Increasing revenues and customer base in all businesses4Q10 revenues growth accelerationVAS+Data+BB accounting for 35% of revenues and growing at a 2x the rate2010 mobile market leadership with est. 46% of net addsBundled BB fixed and mobile offerStrong financial position
Euros, in million
+126M€+16%
+483M€+21%
1,697
640798
0
500
1.000
1.500
2.000
2.500
3.000
FY09 FY10
2,8202,337
4Q
9M
589680
211246
0
200
400
600
800
1.000
FY09 FY10
926800
4Q
9M
EBITDA
Reported Revenues Key Highlights
Net Financial Position Evolution (+Cash/-Debt)
-831
-430
-185
86
231
FY06 FY07 FY08 FY09 FY10
2010 Main Results
+25%
+19%
+17%
+15%

4FRANCO BERTONE
10.7
12.6
14.5 14.9 15.316.0 16.3
2007 2008 2009 1Q10 2Q10 3Q10 4Q10
(1) Argentinean Operation only(2) Estimated, data not available for 4Q10(3) Net of Intercompany
Market Share(2)
46% of estimated 2010 market net adds ; 1.2% market share increase YoY
Over 50% market share of smartphones sales
9% ARPU growth YoY
3G devices approaching 10% of base
VAS reaching 40% of service revenues (46% increase YoY)
High 30/70 postpaid-prepaid mix
+36% +34%+46%
+23%+17%
+24%Pesos, in billion
VAS includes: SMS, MMS, SMS revenue sharing, Contents, Mobile internet & others
KPI’s
Mobile Customers(1) 2010 Highlights
Service Revenues & VAS(1)(3)
1.3 1.7 2.33.4
3.54.1
4.5
5.14.8
5.86.8
8.5
2007 2008 2009 2010VAS revenues Non-VAS revenues
85 103 101 10291 125
222299
$ 39$ 41 $ 41
$ 44
2007 2008 2009 2010
MOU SMS ARPU (pesos)
Mobile Business
Mln, %
28.3%29.4%
30.6% 30.8% 30.9% 31.6% 31.8%
+18%+10%
+13%
Figures are in Argentinean GAAP, with no material difference in terms of growth under IFRS for 2009 and 2010.

5FRANCO BERTONE
Fixed Revenues Breakdown
2010 Highlights
BB ARPU & Churn
Fixed & BB Access
FixedVoice
Fixed BB
MarketShare (1)
Total Lines in market (In millions)
Lines in services and market share maintain marginal growth
Regulated revenues participation down 7 p.p. to 44%
Fixed ARBU up 5% despite frozen tariffs
BB revenues reached 30% of fixed business passing voice revenues (net of monthly fee)
BB ARPU up 14%
BB churn down to 1.4% from 1.8% in FY09
30% of BB net adds in voice bundled offers
0.77 1.03 1.21 1.23 1.27 1.33 1.38
3.92 4.01 4.06 4.06 4.07 4.09 4.11
45.6%46.6% 46.8% 46.8% 46.9% 46.9% 46.9%
2007 2008 2009 1Q10 2Q10 3Q10 4Q10e
Fixed Business
56 5767
76
1.8%2.0%
1.8%1.4%
2007 2008 2009 2010
ARPU (in Pesos) CHURN (monthly)
(1) Estimated, data not available for 4Q10
Figures are in Argentinean GAAP, with no material difference in terms of growth under IFRS for 2009 and 2010.

6FRANCO BERTONE
Agenda
Telecom Argentina Group 2010 Results (IFRS)
Telecom Argentina Plan

7FRANCO BERTONE
Latam Market
Argentina's Telecoms Market in a Regional Context
Fixe
d B
B P
enet
rati
on
Pay
TV
Pen
etra
tion
Mob
ile P
enet
rati
on
USD GDP per capita (2010)
Ser
vice
Rev
enue
s (C
agr
‘10
-’13
)
Source: Pyramid Research. Residential population only
Venezuela Venezuela Venezuela
8FRANCO BERTONE
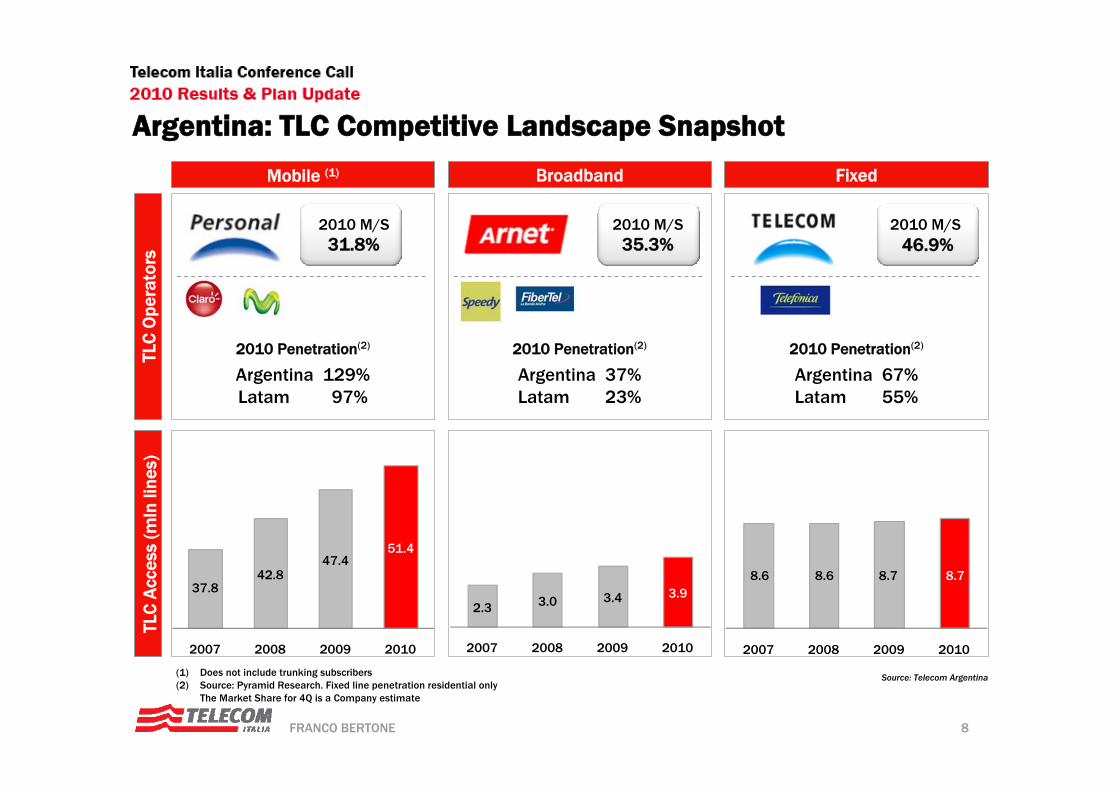
Argentina: TLC Competitive Landscape Snapshot
Source: Telecom Argentina (1) Does not include trunking subscribers(2) Source: Pyramid Research. Fixed line penetration residential only
The Market Share for 4Q is a Company estimate
2010 Penetration(2)
Argentina 37%Latam 23%
2010 Penetration(2)
Argentina 129%Latam 97%
2010 Penetration(2)
Argentina 67%Latam 55%
2010 M/S31.8%
2010 M/S35.3%
2010 M/S46.9%
Mobile (1) Broadband FixedTL
C A
cces
s (m
ln li
nes)
TLC
Ope
rato
rs
37.842.8
47.451.4
2007 2008 2009 2010
2.3 3.0 3.4 3.9
2007 2008 2009 2010
8.6
2007 2008 2009 2010
8.6 8.7 8.7

9FRANCO BERTONE
Regulatory Environment
Current Regulatory Framework
Fixed voice tariffs frozen since Jan 2002
BB unregulated prices
Universal Service implemented as incumbent: no cash contribution required
Triple play currently not allowed to Telcos
Expectations over the next three years
Number Portability
Video incorporated into VAS licences
Growing interest of federal and local Government in the telecommunications infrastructure
Current Regulatory Framework
Number Portability by YE 2011
Unregulated prices
50 MHz frequency cap
Limited MVNO participation
Universal Service partly contributed with shared mobile access infrastructure
Expectations over the next three years
850–1.900MHz spectrum auction with current frequency cap
AWS (Advanced Wireless Service) 1.700 -2.100Mhz spectrum auction with separate frequency cap
Shift from CPP F2M to mobile termination rates
Fixed Business Mobile Business
10FRANCO BERTONE
ARPU
(ARS per month)
Mobile Lines
(Millions)
Business Model
+Capture
+ A
RP
U V
AS
+ Customer Development
Obiettivi Strategici
Action Plan
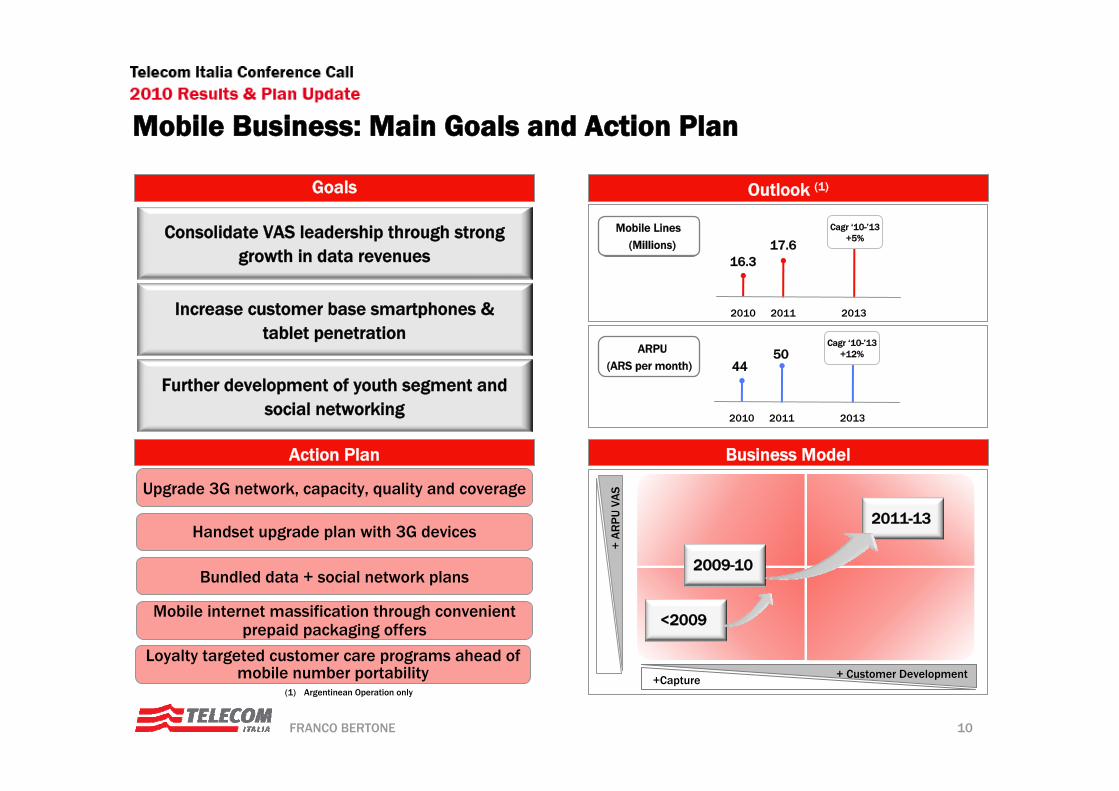
Goals Outlook (1)
Consolidate VAS leadership through strong growth in data revenues
Increase customer base smartphones & tablet penetration
Further development of youth segment and social networking
Mobile Business: Main Goals and Action Plan
16.317.6
4450
(1) Argentinean Operation only
2009-10
2011-13
Upgrade 3G network, capacity, quality and coverage
Handset upgrade plan with 3G devices
Mobile internet massification through convenient prepaid packaging offers
Bundled data + social network plans
Loyalty targeted customer care programs ahead of mobile number portability
<2009
2010 2011 2013
Cagr ‘10-’13+5%
2010 2011 2013
Cagr ‘10-’13+12%

11FRANCO BERTONE
Internet & Data over Fixed Revenues(1)
Obiettivi Strategici
Action Plan
Goals Outlook (1)
Develop ICT market
Introduce video services
Fixed Business: Main Goals and Action Plan
Fixed BB Lines
(Millions)
ARPU
(ARS per month)
37%
42%
2010 2011 2013
(1) Net of Intercompany
Upgrade local loop capacity to increase bandwidth
Introduce VoD, content delivery and Connected Home applications
Develop supplementary service offers on top of basic telephony
Migrate from per minute charging to flat pricing
Increase BB penetration of existing customer base 1.4
1.5
2010 2011 2013
Cagr ‘10-’13+7%
7687
2010 2011 2013
Cagr ‘10-’13+14%

12FRANCO BERTONE
Revenues per Product & per Business
Revenues & Ebitda Outlook
Consolidated
ARS, Bln
2010
EBITDA Cost Structure
ARS, Bln VAS+data+ADSL as %of Revenues
35% 38%
Focus on efficiency:
Leaner cost structure through unified operation
Lower incidence of ITX costs
Growth in labor related costs
4.8
>5.5
2010 2011
14.6>17.7
14.6>17.7
>+21%
>+32%
>+21%
>+24%
>+12%
14%
28%
13%%
20%
25%
ITX Costs
Marketing and sales
Taxes
Labor Costs
Others

13FRANCO BERTONE
Expand backhaul IP deployment to improve mobile broadband footprint and user experienceImprove mobile coverage to reduce domestic roaming costExpand, secure and integrate backbone networks and IT platforms.Upgrade fixed access network to increase bandwithDeploy content delivery capabilitiesUpdate IT solutions to improve customer care, provisioning and business operations
Capex as % of Revenues
17% 18%
2,5Capex (ARS, in billions)
*Include SAC Mobile & Internet
Key Drivers
CAPEX Plan
2.6∼3.2

14FRANCO BERTONE
Telecom Argentina – Main Takeaways
Ebitda-Capex Evolution
Mobile business
Fixed BB
Mobile BB
ICT and Data
OTT and Video
Focus on innovation and customer care
State -of -the -art infrastructure
Top-brand recognition
Fully integrated operation
Proven track record of sustainable growth in revenues, margins and market share
Strong cash flow generation
Reduced FX exposure
Convergence
CAPEX & OPEX efficiency gains from integrated operations
Convergent view on product development
Market Growth
Competitive Edge Convergence Business
Model
Cum’11-13 OFCF:
>7 Bln ARSEbitda
Capex
ARS, Bln
>5.5
∼3.2

15FRANCO BERTONE
Back Up

16
Telecom Italia Conference Call2010 Results & Plan Update
FRANCO BERTONE
Telecom Argentina Presence
Telecom Argentina Footprint
AMBAMetropolitan Area
of Buenos Aires
Nord
Sud
Population: 18 mln
GDP per capita: 6k $
Cities with >20k inh.: 96
Population:9 mln
GDP per capita: 13k $
Population:14 mln
GDP per capita: 9k $
Cities with >20k inh.: 69
Strong presence in this region
Higher penetration of BB in LIS
Higher penetration of mobile
Fixed: 4.1 mln lines
BB: 1.4 mln lines
Mobile: 11 mln lines
Increasing coverage
Expanding network
Increasing presence in the region
High density region
Most wealthiest region
Business segment is mostly in AMBA
Strong competitive region
Fixed: 0.1 mln lines
BB: 0.1 mln lines
Mobile: 6 mln lines

17
Telecom Italia Conference Call2010 Results & Plan Update
FRANCO BERTONE
2,5Shareholders Structure – ex ante Shareholders Structure – ex post
Telecom Argentina – Shareholders Structure
(1) % of capital ownership; (2) % economic interest;
~41%
~4%
48.96% (2)32.21% (1)
67.79% (1)51.04% (2)
Employees
25.5 % 42.0%
100%
Telecom Italia Spa
Sofora Telecomunicaciones S.A.
Werthein de Argentina Inversiones
S.L
Public
54.74%
99.99%
67.50%
Preferred A & B Shares
Nortel Common Stock
Telecom Personal
Nucleo (Paraguay)
Telecom Argentina
Nortel Inversora
Telecom Italia International
32.5%58.0%
TI Economic Interest in TA: ∼16.2%
~41%
~4%
48.96% (2)32.21% (1)
67.79% (1)51.04% (2)
Employees
25.5 % 42.0%
100%
Telecom Italia Spa
Sofora Telecomunicaciones S.A.
Werthein de Argentina Inversiones
S.L
Public
54.74%
99.99%
67.50%
Preferred A & B Shares
Nortel Common Stock
Telecom Personal
Nucleo (Paraguay)
Telecom Argentina
Nortel Inversora
Telecom Italia International
32.5%58.0%
TII 8% of Nortel Preferred B
TI Economic Interest in TA: ∼18.3%
as of 24 January 2011