Technology Roadmap Solar PhotovoltaicEnergy_2014edition
60
Secure Sustai nable T ogether 2035 2040 2045 2050 Technology Roadmap Solar Photovoltaic Energy 2014 edition E n e r g y T e c h n o l o g y P e r s p e c t i v e s
-
Upload
supertierra -
Category
Documents
-
view
216 -
download
0
Transcript of Technology Roadmap Solar PhotovoltaicEnergy_2014edition
8/9/2019 Technology Roadmap Solar PhotovoltaicEnergy_2014edition
http://slidepdf.com/reader/full/technology-roadmap-solar-photovoltaicenergy2014edition 1/60

8/9/2019 Technology Roadmap Solar PhotovoltaicEnergy_2014edition
http://slidepdf.com/reader/full/technology-roadmap-solar-photovoltaicenergy2014edition 2/60
INTERNATIONAL ENERGY AGENCY
The International Energy Agency (IEA), an autonomous agency, was established in November 1974.Its primary mandate was – and is – two-fold: to promote energy security amongst its member
countries through collective response to physical disruptions in oil supply, and provide authoritative
research and analysis on ways to ensure reliable, affordable and clean energy for its 29 membercountries and beyond. The IEA carries out a comprehensive programme of energy co-operation amongits member countries, each of which is obliged to hold oil stocks equivalent to 90 days of its net imports.The Agency’s aims include the following objectives:
n Secure member countries’ access to reliable and ample supplies of all forms of energy; in particular,through maintaining effective emergency response capabilities in case of oil supply disruptions.
n Promote sustainable energy policies that spur economic growth and environmental protectionin a global context – particularly in terms of reducing greenhouse-gas emissions that contributeto climate change.
n Improve transparency of international markets through collection and analysis ofenergy data.
n Support global collaboration on energy technology to secure future energy supplies
and mitigate their environmental impact, including through improved energyefficiency and development and deployment of low-carbon technologies.
n Find solutions to global energy challenges through engagement anddialogue with non-member countries, industry, international
organisations and other stakeholders.IEA member countries:
Australia
Austria
Belgium
Canada
Czech Republic
Denmark
Estonia
Finland
France
Germany
Greece
Hungary
Ireland
Italy
Japan
Korea (Republic of)
LuxembourgNetherlands
New Zealand
Norway
Poland
Portugal
Slovak Republic
Spain
Sweden
Switzerland
Turkey
United KingdomUnited States
The European Commission
also participates in
the work of the IEA.
© OECD/IEA, 2014
International Energy Agency9 rue de la Fédération
75739 Paris Cedex 15, France
www.iea.org
Secure Sustainable Together
Please note that this publicationis subject to specific restrictionsthat limit its use and distribution.
The terms and conditions are available online athttp: // www.iea.org / termsandconditionsuseandcopyright /
8/9/2019 Technology Roadmap Solar PhotovoltaicEnergy_2014edition
http://slidepdf.com/reader/full/technology-roadmap-solar-photovoltaicenergy2014edition 3/60
1Foreword
Current trends in energy supply and use are
unsustainable – economically, environmentally and
socially. Without decisive action, energy-related
greenhouse-gas (GHG) emissions would lead to
considerable climate degradation with an average
6°C global warming. We can and must change the
path we are now on; sustainable and low-carbon
energy technologies will play a crucial role in the
energy revolution required to make this change
happen. Energy Efficiency, many types of renewable
energy, carbon capture and storage (CCS), nuclear
power and new transport technologies will all
require widespread deployment if we are to achieve
a global energy-related CO2 target in 2050 of 50%
below current levels and limit global temperature
rise by 2050 to 2°C above pre-industrial levels.
This will require significant global investment into
decarbonisation, which will largely be offset by
reduced expenditures on fuels. Nonetheless, this
supposes an important reallocation of capital. To
address this challenge, the International Energy
Agency (IEA) is leading the development of a
series of technology roadmaps which identify the
steps needed to accelerate the implementation of
technology changes. These roadmaps will enable
governments, industry and financial partners to
make the right choices – and in turn help societies
to make the right decision.
Photovoltaic (PV) energy is one of the most
promising emerging technologies. The cost of PV
modules has been divided by five in the last six
years; the cost of full PV systems has been div ided
by almost three. The levelised cost of electricity of
decentralised solar PV systems is approaching or
falling below the variable portion of retail electricity
prices that system owners pay in some markets,
across residential and commercial segments. For
bulk power on grid, PV electricity can already be
competitive at times of peak demand, especially inareas where peak electricity is provided by burning
oil products. And there remains ample room for
improvements, as this roadmap details.
Much has happened since our 2010 IEA technology
roadmap for PV energy. PV has been deployed
faster than anticipated and by 2020 will probably
reach twice the level previously expected. Rapid
deployment and falling costs have each been
driving the other. This progress, together with other
important changes in the energy landscape, notably
concerning the status and progress of nuclear power
and CCS, have led the IEA to reassess the role of
solar PV in mitigating climate change. This updated
roadmap envisions PV’s share of global electricity
rising up to 16% by 2050, compared with 11% in the
2010 roadmap.
As PV spreads beyond Europe, where most
deployment was concentrated until 2012, it faces a
number of barriers, economic and non-economic.
To help overcome such potential obstacles, this
updated roadmap provides renewed proposals
on technology, system integration, legislative andregulatory issues, based on analyses of the lessons
learned by pioneering countries.
In mature PV markets – currently still only a handful
of countries – greater market exposure is necessary
as PV becomes more competitive. However,
changes in legislative frameworks and support
policies must be as transparent and predictable
as possible. Like most renewable energy sources
and energy efficiency improvements, PV is very
capital-intensive: almost all expenditures are made
up-front. Keeping the cost of capital low is thus of
primary importance for achieving this roadmap’svision. But investment and finance are very
responsive to the quality of policy making. Clear
and credible signals from policy makers lower risks
and inspire confidence. By contrast, where there is
a record of policy incoherence, confusing signals or
stop-and-go policy cycles, investors end up paying
more for their finance, consumers pay more for their
energy, and some projects that are needed simply
will not go ahead.
I strongly hope that the analysis and
recommendations in this roadmap will play a part
in ensuring the continued success of PV deployment
and, more broadly, a decarbonised energy system.
This publication is produced under my authority as
Executive Director of the IEA.
Maria van der HoevenExecutive Director
International Energy Agency
Foreword
This publication reflects the views of the International Energy Agency (IEA) Secretariat but does not necessarily reflectthose of individual IEA member countries. The IEA makes no representation or warranty, express or implied, in respectto the publication’s contents (including its completeness or accuracy) and shall not be responsible for any use of, orreliance on, the publication.

8/9/2019 Technology Roadmap Solar PhotovoltaicEnergy_2014edition
http://slidepdf.com/reader/full/technology-roadmap-solar-photovoltaicenergy2014edition 4/60
2 Technology Roadmap Solar photovoltaic energy
Table of contents
Foreword 1
Table of contents 2
Acknowledgements 4
Key findings and actions 5
Key actions in the next five years 6
Introduction 7
Rationale for solar photovoltaic power in the overall energy context 7
Purpose of the roadmap update 7
Roadmap process, content and structure 8
Progress since 2009 9
Recent market developments 9
Technology improvements 11
Advances toward competitiveness 12
Barriers encountered, overcome or outstanding 16
Medium-term outlook 17
Vision for deployment 18
CO2 reduction targets from the ETP 2014 hi-Ren Scenario 18
Revised solar PV goals 20
Potential for cost reductions 22
Global investment to 2050 25
Beyond 2050 26
Solar PV technology development: Actions and milestones 27
Cells and modules 28
Non-module costs 30
Life-cycle analysis 31
System integration: Actions and milestones 32
Variability and uncertainty 32
System-friendly PV deployment 32
Integrating large PV shares 33
Decentralised PV generation 37
System level GHG emissions 39
Policy, finance and international collaboration: Actions and milestones 41
Removing non-economic barriers 41
Setting predictable financial schemes and regulatory frameworks 42
Policy options 43
Financing 47
International collaboration 49
Roadmap action plan 51
Near-term actions for stakeholders 51
Implementation 52
Abbreviations and acronyms 53
References 54

8/9/2019 Technology Roadmap Solar PhotovoltaicEnergy_2014edition
http://slidepdf.com/reader/full/technology-roadmap-solar-photovoltaicenergy2014edition 5/60
3Table of contents
List of tables
Table 1. Progress in solar PV markets and installation since 2009 10
Table 2. Typical PV system prices in 2013 in selected countries 15
Table 3. PV capacities by region in 2030 and 2050 in the hi-Ren Scenario 20
Table 4. Projections for LCOE for new-built utility-scale PV plants to 2050 in the hi-Ren Scenario 24
Table 5. Projections for LCOE for new-built rooftop PV systems to 2050 in the hi-Ren Scenario 24
Table 6. CO2 prices in the climate-friendly scenarios of ETP 2014 26
List of figures
Figure 1. Global cumulative growth of PV capacity 9
Figure 2. PV manufacturing by countries 10
Figure 3. System prices in Italy, 2008-2013 14
Figure 4. Grid parity was reached in 2013 in various countries 15
Figure 5. Global electricity mix in 2011 and in 2050 in three ETP 2014 scenarios 18
Figure 6. Cumulative technology contributions to power sector emission reductions
in ETP 2014 hi-Ren Scenario, relative to 6DS, up to 2050 19
Figure 7. Additional CO2 emission reductions due to PV in 2050 in the hi-Ren Scenario (over the 6DS) 20
Figure 8. Regional production of PV electricity envisioned in this roadmap 21
Figure 9. Generation mix by 2050 in the hi-Ren Scenario by region (in annual energy) 22
Figure 10. Past modules prices and projection to 2035 based on learning curve 23
Figure 11. PV investments cost projections in the hi-Ren Scenario 23
Figure 12. The share of the costs of capital in the LCOE of PV systems 25
Figure 13. Commercial 1-sun module eff iciencies (actual and expected) 27
Figure 14. How different climate zones in the United States affect the lifetime of PV modules 29
Figure 15. Hourly planned versus actual solar generat ion in Germany, 2013 33
Figure 16. Weekly production of solar and wind in Germany in 2013 34
Figure 17. Expected evolution of the net load of a typical spring day in California 34
Figure 18. Controlled versus uncontrolled EV charging effects on load net of PV 36
Figure 19 Self-consumption of stylised household and rooftop PV system during a sunny day 37
Figure 20. Hourly electricity consumption profiles for different building types in Germany 38
Figure 21 Increasing self-consumption with load management (+10%) and small storage (+10%) 39
Figure 22. Feed-in tarif f levels and LCOE of small rooftop in Germany 44
List of boxes
Box 1. Efficiency and performance ratio 12
Box 2. Solar radiat ion relevant for PV 13
Box 3. ETP Scenarios. 6DS, 2DS, hi-Ren 19
Box 4. Sustainable PV energy for all 25
Box 5. “Soft costs” in the United States 42
Box 6. Value-of-solar tarif fs in Minnesota 46
Box 7. Financing off-grid solar electrification 48
8/9/2019 Technology Roadmap Solar PhotovoltaicEnergy_2014edition
http://slidepdf.com/reader/full/technology-roadmap-solar-photovoltaicenergy2014edition 6/60
4 Technology Roadmap Solar photovoltaic energy
Paul Denholm (NREL), Paul Gauché (Stellenbosch
University), Winfried Hoffmann (ASE), Véronique
Jolivet (Total Energies Nouvelles), Thierry Lepercq
(Solairedirect), Daniel Lincot (IPVF-IRDEP), Philippe
Malbranche (CEA-INES), Gaëtan Masson (EPIA),
Johannes Mayer (Fraunhofer-ISE), Paula Mints (SPV
Market Research), Stefan Nowak (PVPS) and Wim
Sinke (ECN).
Review comments were received from Luca
Benedetti (GSE), Simon Philipps (Fraunhofer-ISE),
Paul Denholm (NREL), Winfried Hoffmann (ASE),
Arnulf Jaeger-Waldau (EU JRC), Veronique Jolivet
(Total Energies Nouvelles), Jean-Pierre Joly (CEA-
INES), Daniel Kammen (University of California),
Manoël Rekinger (EPIA), Ioannis-Thomas Theologitis(EPIA), Lou Trippel (First Solar), Wim Sinke (ECN),
Roberto Vigotti (IEA REWP) and Eric Westerhoff
(Soitec).
This publication was made possible also thanks to
the support of Soitec and the French government
through ADEME.
For more information on this document, contact:
Technology Roadmaps
International Energy Agency
9, rue de la Fédération
75739 Paris Cedex 15France
Email: [email protected]
This publication was prepared by the Renewable
Energy Division (RED) of the International Energy
Agency (IEA). Cédric Philibert was the main author
of this update, based on the original published
in 2010. Paolo Frankl, Head of RED, provided
important comments and inputs. Cecilia Tam, in
her role as Technology Roadmap Co-ordinator,
made significant contributions throughout the
drafting process. Several other IEA colleagues also
provided important contributions, in particular
Yasmina Abdeli lah, Heymi Bahar, Quentin Marchais,
Simon Mueller, Uwe Remme, Michael Waldron and
Hoël Wiesner. The author is also grateful to Keisuke
Sadamori, Director of Energy Markets and Security
at the IEA, for his guidance.
The author would also like to thank Andrew
Johnston for skilfully editing the manuscript; the
IEA Publication Unit, in particular Muriel Custodio,
Therese Walsh and Astrid Dumond; and Bertrand
Sadin for executing the layout.
Finally, this roadmap would not be effective without
all of the comments and support received from the
industry, government and non-government experts
who attended the workshop at IEA headquarters in
Paris on February 3, 2013, reviewed and commented
on the drafts, and provided overall guidance and
support. The authors wish to thank all of thosewho contributed through discussions and early
comments, in particular: Fabrizio Bizzarri (Enel),
Frédéric Bouvier (Soitec), Jenny Chase (BNEF),
Acknowledgements

8/9/2019 Technology Roadmap Solar PhotovoltaicEnergy_2014edition
http://slidepdf.com/reader/full/technology-roadmap-solar-photovoltaicenergy2014edition 7/60
5Key findings and actions
z Since 2010, the world has added more solar
photovoltaic (PV) capacity than in the previous
four decades. New systems were installed in 2013
at a rate of 100 megawatts (MW) of capacity per
day. Total global capacity overtook 150 gigawatts
(GW) in early 2014.
z The geographical pattern of deployment
is rapidly changing. While a few European
countries, led by Germany and Italy, initiated
large-scale PV development, PV systems are now
expanding in other parts of the world, often
under sunnier skies. Since 2013, the People’s
Republic of China has led the global PV market,
followed by Japan and the United States.
z
PV system prices have been divided by three insix years in most markets, while module prices
have been divided by five. The cost of electricity
from new built systems varies from USD 90 to
USD 300/MWh depending on the solar resource;
the type, size and cost of systems; maturity of
markets and costs of capital.
z This roadmap envisions PV’s share of global
electricity reaching 16% by 2050, a significant
increase from the 11% goal in the 2010 roadmap.
PV generation would contribute 17% to all clean
electricity, and 20% of all renewable electricity.
China is expected to continue leading the global
market, accounting for about 37% of global
capacity by 2050.
z Achieving this roadmap’s vision of 4 600 GW of
installed PV capacity by 2050 would avoid the
emission of up to 4 gigatonnes (Gt) of carbon
dioxide (CO2) annually.
z This roadmap assumes that the costs of electr icity
from PV in different parts of the world will
converge as markets develop, with an average
cost reduction of 25% by 2020, 45% by 2030, and
65% by 2050, leading to a range of USD 40 to
160/MWh, assuming a cost of capital of 8%.
z To achieve the vision in this roadmap, the total PV
capacity installed each year needs to r ise rapidly,
from 36 GW in 2013 to 124 GW per year on
average, with a peak of 200 GW per year between
2025 and 2040. Including the cost of repowering
– the replacement of older installations – annual
investment needs to reach an average of about
USD 225 billion, more than twice that of 2013.
z Utility-scale systems and rooftop systems will
each have roughly half of the global market.
Rooftop systems are currently more expensive but
the value of electricity delivered on consumptionsites or nearby is greater. However, as PV
expansion is driven more and more by self-
consumption – the use of PV electricity directly
at the same site where it is generated – grids
may carry smaller amounts of traded electricity,
raising concerns over how to recover the fixed
costs of grids. Grid operators, regulators and
policy makers should monitor the impact of rapid
expansion of distributed PVs on distribution
networks. Rate changes ensuring full grid cost
recovery and fair allocation of costs might be
considered but should be carefully designed in
order to maintain incentives for energy eff iciency
and the deployment of rooftop PV.
z The variability of the solar resource, as of wind
energy, is a challenge. All flexibility options
– including interconnections, demand-side
response, flexible generation, and storage –need
to be developed to meet this challenge so that
the share of global electricity envisioned for PV in
this roadmap can be reached by 2050.
z PV has to be deployed as part of a balanced
portfolio of all renewables. In temperate
countries, wind power tends to be stronger
during winter and hence compensate for low
solar irradiance. In hot and wet countries,
hydropower offers considerable resource in
complement to solar PV. In hot and arid countries,
solar thermal electricity with built-in thermal
storage capabilities can generate electricity aftersunset, complementing the variability of PV and
thus adding more solar electricity to systems –
potentially making solar the leading source of
electricity by 2040. 1
z Despite recent falls in the cost of PV electricity,
transitional policy support mechanisms will be
needed in most markets to enable PV electricity
costs to reach competitive levels, as long as
electricity prices do not reflect climate change
or other environmental factors. The vision in this
roadmap is consistent with global CO2 prices of
USD 46/tCO2 in 2020, USD 115/tCO2 in 2030, andUSD 152/tCO2 in 2040.
z In the last few years, manufacturing of PV systems
has been concentrated in Asia, particularly in
China and Chinese Taipei, mainly based on
economies of scale in large new production
facilities. Future progress is likely to be driven
mainly by technology innovation, which keeps
open the possibility of global deployment of
manufacturing capabilities if research and
development (R&D) efforts and international
collaboration are strengthened.
1. See the companion Technology Roadmap: Solar Thermal Electricity
(IEA, 2014a).
Key findings and actions

8/9/2019 Technology Roadmap Solar PhotovoltaicEnergy_2014edition
http://slidepdf.com/reader/full/technology-roadmap-solar-photovoltaicenergy2014edition 8/60
6 Technology Roadmap Solar photovoltaic energy
z Appropriate regulatory frameworks – and well-
designed electricity markets, in particular – will
be critical to achieve the vision in this roadmap.
PV costs are incurred almost exclusively up-front,
when the power plant is built. Once built, PV
generates electricity almost for free. This means
that investors need to be able to rely on future
revenue streams so that they can recover their
initial capital investments. Market structures and
regulatory frameworks that fail to provide robust
long-term price signals – beyond a few months
or years – are thus unlikely to deliver investments
in volumes consistent with this roadmap in
particular and timely decarbonisation of the
global energy system in general.
Key actions in the
next five years
z Set or update long-term targets for PV
deployment, consistent with national energy
strategies and national contributions to global
climate change mitigation efforts.
z Support these targets with predictable market
structures and regulatory frameworks to drive
investment.
z Address non-economic barriers. Develop
streamlined procedures for providing permits.
z Identify the cost structure of current projects and
any anomalies in comparison with projects in
other jurisdictions. Implement specific actions to
reduce anomalous costs.
z Work with financing circles and other
stakeholders to reduce financing costs for PV
deployment, in particular involving private
money and institutional investors.
z Reduce the costs of capital and favour innovation
in providing loan guarantees, and concessionalloans in emerging economies.
z Strengthen research, development and
demonstration (RD&D) efforts to further reduce
costs.
z Strengthen international collaboration on RD&D
and exchanges of best practices.
z In emerging PV markets:
z Implement priority connection to the grid and
priority dispatch of PV electricity.
z Implement support schemes with fair
remuneration for investors but predictable
decrease of the level of support.
z When parity with retail electricity prices is
achieved in some market segments, provide
incentives for distributed PV generation
through net energy metering and/or tariffs for
energy (total generation or only injections into
the grid) based on a value of solar electricity
determined through a transparent process
open to all interested parties.
z In mature markets:
z Progressively increase short-term market
exposure of PV electricity while ensuring fair
remuneration of investment, for example withsliding feed-in premiums and/or auctions with
time-of-delivery and locational pricing.
z Provide incentives for generation at peak
times through time-of-delivery payments.
z Provide incentives for self-consumption during
peaks through time-of-use electricity rates.
z Improve forecasts and reform energy-only
electricity markets for better synchronisation
of supply and demand.
z Design and implement investment markets for
new-built PV systems and other renewables,
and markets for ancillary services.
z Progressively reform rate structures to
encourage generation and discourage
consumption during peak times, ensuring
the recovery of fixed costs of the transmission
and distribution grids while preserving the
incentives for efficiency and distributed PV.
z Avoid retroactive legislative changes.
z Work with financing circles and other
interested parties to reduce financing costs for
PV deployment, in particular involving private
money and institutional investors. z Strengthen research, development and
demonstration (RD&D) efforts to further reduce
costs.
z Improve quality via more diversified module
qualification, and certification of developers,
designers and installers.
z Strengthen international collaboration on RD&D
and exchanges of best practices.
z Support best practices in developing economies,
in particular for providing access to electricity
based on off-grid and mini-grid PV systems.

8/9/2019 Technology Roadmap Solar PhotovoltaicEnergy_2014edition
http://slidepdf.com/reader/full/technology-roadmap-solar-photovoltaicenergy2014edition 9/60
7Introduction
Introduction
There is a pressing need to accelerate the
development of advanced energy technologies
in order to address the global challenges of
clean energy, climate change and sustainable
development. To achieve the necessary reductions
in energy-related CO2 emissions, the IEA has
developed a series of global technology roadmaps,
under international guidance and in close
consultation with industry. These technologies are
evenly divided among demand-side and supply-side
technologies and include several renewable energy
roadmaps (www.iea.org/roadmaps/).
The overall aim is to advance global development
and uptake of key technologies to limit the global
mean temperature increase to 2 degrees Celsius(°C) in the long term. The roadmaps will enable
governments, industry and financial partners to
identify and implement the measures needed to
accelerate the required technology development
and uptake.
The roadmaps take a long-term view, but highlight
the key actions that need to be taken in the next five
years, which will be cri tical to achieving long-term
emission reductions. Existing conventional plants
and those under construction may lock in CO2
emissions, as they will be operating for decades.
According to the IEA Energy Technology Perspectives2014 (ETP 2014) (IEA, 2014b), early retirement of
850 GW of existing coal capacity would be required
to reach the goal of limiting climate change to
2°C. Therefore, it is crucial to build up low-carbon
energy supply today.
Rationale for solar
photovoltaic power in the
overall energy context
ETP 2014 projects that in the absence of new
policies to accelerate the uptake of low-carbon
solutions, CO2 emissions from the energy sector
would increase by 61% over 2011 levels by 2050
(IEA, 2014b). The ETP 2014 model examines a range
of technology solutions that can contribute to
preventing this increase: greater energy efficiency,
renewable energy, nuclear power and the near-
decarbonisation of fossil fuel-based power
generation. Rather than projecting the maximum
possible deployment of any given solution, the
ETP 2014 model calculates the least-cost mix to
achieve the CO2 emission reduction needed to limit
climate change to 2°C (the ETP 2014 2°C Scenario
[2DS]). The hi-Ren Scenario is a variant of the 2DS
with slower deployment of nuclear and carbon
capture and storage (CCS) technologies, and more
rapid deployment of renewables, notably solar and
wind energy.
Based on the ETP 2014 hi-Ren Scenario, this roadmap
envisions up to 16% of global electricity for solar
PV with 6 300 TWh generated in 2050, up from
the 4 500 TWh foreseen in the 2010 roadmap. This
increase in PV compensates for slower progress in
the intervening years in CCS and higher costs for
nuclear power. It also reflects faster-than-expected
rollout and cost reductions for solar PV.
Solar energy is widely available throughout the
world and can contribute to reduced dependence
on energy imports. As it entails no fuel price risk
or constraints, it also improves security of supply.
Solar power enhances energy diversity and hedges
against price volatility of fossil fuels, thus stabilising
costs of electricity generation in the long term.
Solar PV entails no greenhouse gas (GHG) emissions
during operation and does not emit other
pollutants (such as oxides of sulphur and nitrogen);
additionally, it consumes no or little water. As local
air pollution and extensive use of fresh water for
cooling of thermal power plants are becomingserious concerns in hot or dry regions, these
benefits of solar PV become increasingly important.
Purpose of
the roadmap update
The solar PV roadmap was one of the first roadmaps
developed by the IEA, in 2009/10. Since then, the
world has added more PV capacity than it had in
the previous four decades, and more rapidly than
expected. The 210 GW of cumulative capacityexpected to be reached by 2020 is now likely to be
achieved five years earlier, and the capacity now
expected for 2020 will be over twice what was
foreseen in the 2010 roadmap. Moreover, the system
cost milestones for 2020 in the original roadmap
have already been reached in the most advanced
markets, except for the smallest rooftop capacities.
This updated roadmap thus presents a new
vision that takes into account this considerable
progress of PV technologies, as well as changing
trends in the overall energy mix. It presents a
detailed assessment of the technology milestones
that PV energy will need to reach to attain this
8/9/2019 Technology Roadmap Solar PhotovoltaicEnergy_2014edition
http://slidepdf.com/reader/full/technology-roadmap-solar-photovoltaicenergy2014edition 10/60
8 Technology Roadmap Solar photovoltaic energy
ambitious vision. The key objective is to improve PV
technology performance and reduce costs in order
to achieve the competitiveness needed for the large
investments foreseen.
The roadmap also examines numerous economic
and non-economic barriers that hamper
deployment and identifies policy actions to
overcome them. About half of overall capacity is
likely to be deployed on buildings, so this roadmap
considers critical issues arising from the complex
relationships between PV generation, on-the-spot
consumption and electricity networks.
This roadmap thus identifies actions and time
frames to achieve the higher PV deployment
needed for global emission reductions. In some
markets, certain actions have already been taken,
or are under way. Many countries, particularly
in emerging regions, are only just beginning to
develop PV systems. Accordingly, milestone dates
should be considered as indicative of urgency,
rather than as absolutes. Each country will have to
choose which actions to prioritise, based on its mix
of energy sources and industrial policies.
This roadmap is addressed to a variety of audiences,
including policy makers, industry, utilities,
researchers and other interested parties. As well asproviding a consistent overall picture of PV power
at global and continental levels, it aims at providing
encouragement and information to individual
countries to elaborate action plans, set or update
targets, and formulate roadmaps for PV power
deployment.
Roadmap process,
content and structure
This roadmap was developed with the helpof contributions from representatives of the
solar industry, the power sector, research and
development (R&D) institutions, the finance
community and government institutions. An expert
workshop was held in Paris in February 2014 at IEA
headquarters in Paris, focusing on technology and
“vision” for both solar PV and STE2. A draft was then
circulated to experts and stakeholders for further
contributions and comments.
2. See www.iea.org/workshop/solarelectricity
roadmapworkshop.html.
The roadmap also takes into account other regional
and national efforts to investigate the potential of
PV, including:
z the SunShot initiative of the US Department
of Energy
z the EU Strategic Energy Technology Plan
(SET Plan)
z the international technology roadmap
for PV (ITRPV)
z the Chinese 12th five-year plan for the solar
PV industry.
This roadmap is organised into six major sections.First, the current state of the PV industry and
progress since 2009 is discussed, followed by a
section that describes the vision for PV deployment
between 2015 and 2050 based on ETP 2014. This
discussion includes information on the regional
distribution of PV generation projects and the
associated investment needs, as well as the
potential for cost reductions.
The next three sections describe approaches
and specific tasks required to address the major
challenges facing large-scale PV deployment in
three major areas: PV technology development;system integration; and policy frameworks, public
engagement and international collaboration. The
final section sets out next steps and categorises the
actions in the previous sections that policy makers,
industry, power system actors and financing circles
need to take to implement the roadmap’s vision for
PV deployment.
8/9/2019 Technology Roadmap Solar PhotovoltaicEnergy_2014edition
http://slidepdf.com/reader/full/technology-roadmap-solar-photovoltaicenergy2014edition 11/60
9Progress since 2009
The PV industry has experienced a sea change
in only five years, with considerable increases in
manufacturing capacities, and a move of module
manufacturing from European countries and the
United States to Asia, notably China and Chinese
Taipei. Market prices have been drastically reduced
– by factor of five for modules, and by a factor of
almost three for systems. The global rate of annual
new-built capacities, which was 7 GW in 2009, was
5 times higher in 2013.
Recent market
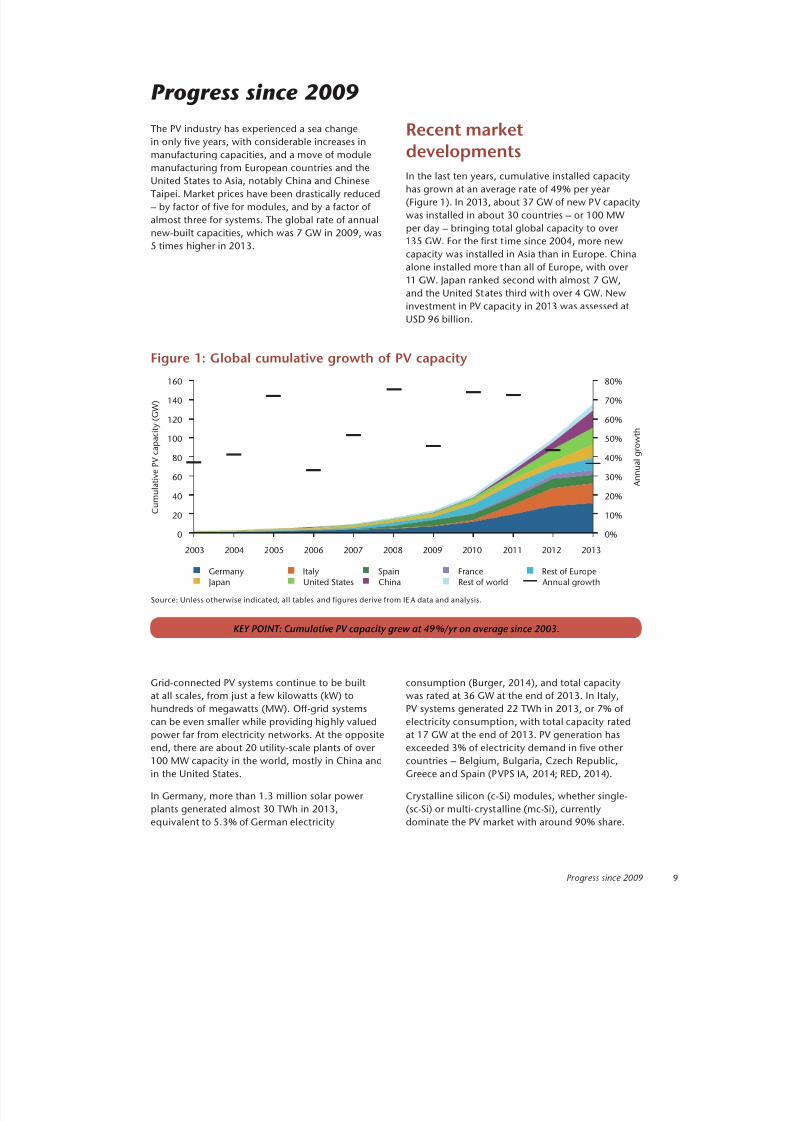
developmentsIn the last ten years, cumulative installed capacity
has grown at an average rate of 49% per year
(Figure 1). In 2013, about 37 GW of new PV capacity
was installed in about 30 countries – or 100 MW
per day – bringing total global capacity to over
135 GW. For the first t ime since 2004, more new
capacity was installed in Asia than in Europe. China
alone installed more than all of Europe, with over
11 GW. Japan ranked second with almost 7 GW,
and the United States third with over 4 GW. New
investment in PV capacity in 2013 was assessed at
USD 96 billion.
Progress since 2009
Figure 1: Global cumulative growth of PV capacity
Source: Unless otherwise indicated, all tables and figures derive from IE A data and analysis.
KEY POINT: Cumulative PV capacity grew at 49%/yr on average since 2003.
0
20
40
60
80
100
120
140
160
2003 2004 2005 2006 2007 2008 2009 2010 2011 2012 2013
C u m u l a t
i v e
P V
c a p a c i t y
( G W )
0%
10%
20%
30%
40%
50%
60%
70%
80%
A
n n u a l
g r o w t h
Germany Italy Spain France Rest of Europe
Japan United States China Rest of world Annual growth
Grid-connected PV systems continue to be built
at all scales, from just a few kilowatts (kW) to
hundreds of megawatts (MW). Off-grid systems
can be even smaller while providing highly valued
power far from electricity networks. At the opposite
end, there are about 20 utility-scale plants of over
100 MW capacity in the world, mostly in China and
in the United States.
In Germany, more than 1.3 million solar power
plants generated almost 30 TWh in 2013,
equivalent to 5.3% of German electricity
consumption (Burger, 2014), and total capacity
was rated at 36 GW at the end of 2013. In Italy,
PV systems generated 22 TWh in 2013, or 7% of
electricity consumption, with total capacity rated
at 17 GW at the end of 2013. PV generation has
exceeded 3% of electricity demand in five other
countries – Belgium, Bulgaria, Czech Republic,
Greece and Spain (PVPS IA, 2014; RED, 2014).
Crystalline silicon (c-Si) modules, whether single-
(sc-Si) or multi-crystalline (mc-Si), currently
dominate the PV market with around 90% share.
8/9/2019 Technology Roadmap Solar PhotovoltaicEnergy_2014edition
http://slidepdf.com/reader/full/technology-roadmap-solar-photovoltaicenergy2014edition 12/60
10 Technology Roadmap Solar photovoltaic energy
Thin films (TF) of various sorts now represent only
about 10% of the market, down from 16% in 2009,
and concentrating photovoltaics (CPV), although
growing significantly, represent less than 1%.
Decentralised systems represent approximately 60%
of the global market, while centralised, utility-scale
systems represent close to 40%. Off-grid systems,
which once dominated a much smaller market, now
account for 1% at most.
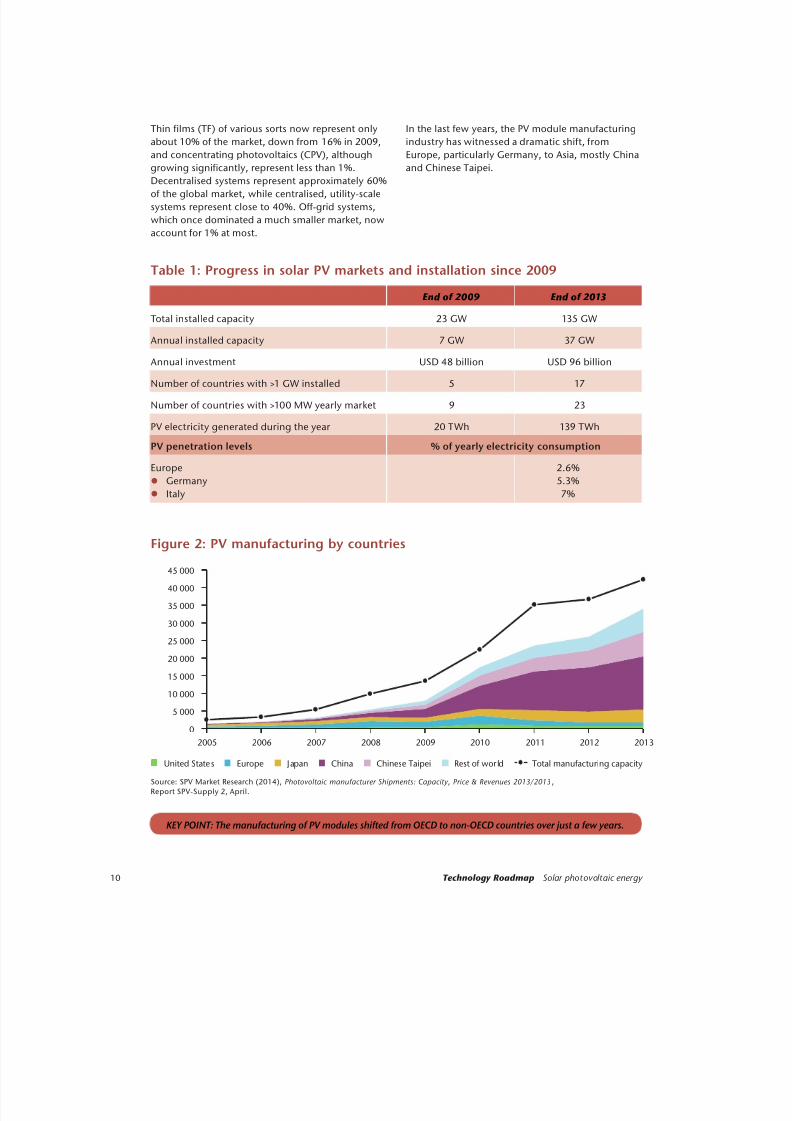
In the last few years, the PV module manufacturing
industry has witnessed a dramatic shift, from
Europe, particularly Germany, to Asia, mostly China
and Chinese Taipei.
Table 1: Progress in solar PV markets and installation since 2009
End of 2009 End of 2013
Total installed capacity 23 GW 135 GW
Annual installed capacity 7 GW 37 GW
Annual investment USD 48 billion USD 96 billion
Number of countries with >1 GW installed 5 17
Number of countries with >100 MW yearly market 9 23
PV electricity generated during the year 20 TWh 139 TWh
PV penetration levels % of yearly electricity consumption
Europe
z Germany z Italy
2.6%
5.3%7%
Figure 2: PV manufacturing by countries
Source: SPV Market Research (2014), Photovoltaic manufacturer Shipments: Capacity, Price & Revenues 2013/2013 ,
Report SPV-Supply 2, April.
KEY POINT: The manufacturing of PV modules shifted from OECD to non-OECD countries over just a few years.
0
5 000
10 000
15 000
20 000
25 000
30 000
35 000
40 000
45 000
2005 2006 2007 2008 2009 2010 2011 2012 2013
United States Europe Japan China Chinese Taipei Rest of world Total manufacturing capacity
8/9/2019 Technology Roadmap Solar PhotovoltaicEnergy_2014edition
http://slidepdf.com/reader/full/technology-roadmap-solar-photovoltaicenergy2014edition 13/60
11Progress since 2009
In 2012, the PV industry employed approximately
88 000 people in Germany to manufacture
materials (silicon, wafers, metal pastes, plastic films,
solar glass), and intermediate and final products
(cells, modules, inverters, supports, cables, coated
glass), and to build manufacturing plants and install
PV systems. About a quarter of this production has
since been lost, as the German PV market declined
and as manufacturing moved to Asia. This shift was
primarily a result of huge investments in production
capacity in Asia. Labour costs only played a
marginal role, as PV production is highly automated;
other variable costs, including energy costs, played
a more important role. Fast technology transfer was
facilitated by the availability of turn-key production
lines producing very good quality PV modules.
Manufacturing PV cells and modules now accounts
for less than hal f the value chain, however, although
it remains the largest single element. Upstream
activities, from research and development (R&D)
to building production lines, and downstream
activities linked to installation and services,
together account for the largest part. In many
European countries, in particular those where PV
manufacturing has never been important, such
as Spain, thousands of PV-related jobs have been
created and eliminated more because of on-again
off-again renewable energy policies than because of
competition from Asia.
At a global level, the PV industry has been estimated
to represent about 1.4 million full-time jobs,
including 300 000 to 500 000 in China, 312 000
in Europe, 112 000 in India and 90 000 in the
United States (REN21, 2014), but these figures
must be taken with caution as data collection is not
homogenous and, more important, may change
rapidly as markets evolve.
A detailed analysis of the cost trends of c-Si modules
and the shift of manufacturing to China suggests
that the historical price advantage of a China-based
factory over a US-based factory is driven not by
country-specific factors, but by scale, supply-chain
development and access to finance. Technology
innovations may result in effectively equivalent
minimum sustainable manufacturing prices for the
two locations (Goodrich et al., 2013) – and this may
hold true for many other locations.
Technology improvements
PV cells are semiconductor devices that generate
direct current (DC) electricity. Silicon cells are
usually sliced from ingots or castings of highly
purified silicon. The manufacturing process creates
a charge- separating junction, deposits passivation
layers and an anti-reflective coating, and adds metal
contacts. Cells are then grouped into modules,
with transparent glass for the front, a weatherproof
material for the back and often a surrounding frame.
The modules are then combined to form strings,
arrays and systems.
PV can be used for on-grid and off-grid applications
of capacities ranging from less than 1 watt togigawatts. Grid-connected systems require
inverters to transform DC power into alternating
current (AC). The balance of system (BOS) includes
inverters, transformers, wiring and monitoring
equipment, as well as structural components for
installing modules, whether on building rooftops
or facades, above parking lots, or on the ground.
Installations can be fixed or track the sun on one
axis (for non- or low-concentrating systems) or two
axes (for high-concentrating systems).
Alternative PV technologies, including thin films,
had been expected to gain an increasing share ofthe market, but instead their share shrank from 15%
in 2009 to about 10% in 2013. Thin films (TF) are
based on cadmium telluride (CdTe), copper-indium-
gallium-selenide (CIGS), or amorphous silicon (a-Si),
plus some variants. They are usually manufactured
in highly automated processes to produce
complete modules, with no need to assemble
modules from individual cells. Multi-junction cells,
which are the standard PV technology in space
applications, recently entered the terrestrial market
in concentrating photovoltaics (CPV) systems with
several large-scale plants (50 MW each) in operationor under construction. Some manufacturers also sell
hybrid PV-thermal panels that deliver both heat and
electricity.
8/9/2019 Technology Roadmap Solar PhotovoltaicEnergy_2014edition
http://slidepdf.com/reader/full/technology-roadmap-solar-photovoltaicenergy2014edition 14/60
12 Technology Roadmap Solar photovoltaic energy
The average efficiency of commercial silicon
modules has improved in the last ten years by
about 0.3% per year, reaching 16% in 2013. Thebest-performing commercial modules, based on
back-junction, interdigitated back-contact (IBC)
offer efficiencies of 21%, with heterojunction (HTJ)
technologies close behind at over 19% efficiency,
and excellent performance ratios. Modules are
usually guaranteed for a lifetime of 25 years at
minimum 80% of their rated output, and sometimes
for 30 years at 70%. TF modules also saw increases
in efficiencies, with commercial CdTe TF, in
part icular, reaching 15%. Moreover, CdTe modules,
especially in hot and humid climates, and possibly
CIGS TF modules, have higher performance ratiosthan average c-Si modules of similar prices. CPV
modules offer efficiencies of 25% to 35%, but only
make use of direct normal irradiance (DNI), which
is lower than global normal irradiance (see Box 2).
Therefore CPV performs best in high DNI locations.
Even more impressive progress has been made with
respect to manufacturing. The amount of specific
materials (silicon, metal pastes, etc.), the energy
consumption and the amount of labour required to
assemble modules were all significantly reduced.
Advances toward
competitivenessThe emergence of the global PV market has
coincided with rapid reductions in the costs of
modules and systems. The levelised cost of energy
(LCOE)3 from PV systems is already below retail
electricity prices (per-kWh charge) in several
countries, and rapidly approaching the level of
generation costs from conventional alternatives,
especially new coal with strict air pollutant emission
standards, new nuclear plants with increased safety
standards, or new gas plants in areas with high gas
prices.
Investment costs
From 2008 to 2012, PV module prices were divided
by five, and PV system prices divided by three in
mature markets such as Italy (Figure 3). In 2013
and 2014, module prices more or less stabilised,
indicating that prices were not fully reflecting
underlying costs. As too many modules began
3. The LCOE represents the present value of the total cost
(overnight capital cost, fuel cost, fixed and variable operation
and maintenance costs, and financing costs) of building and
operating a generating plant over an assumed financial lifeand duty cycle, converted to equal annual payments, given an
assumed utilisation, and expressed in terms of real money to
remove inflation.
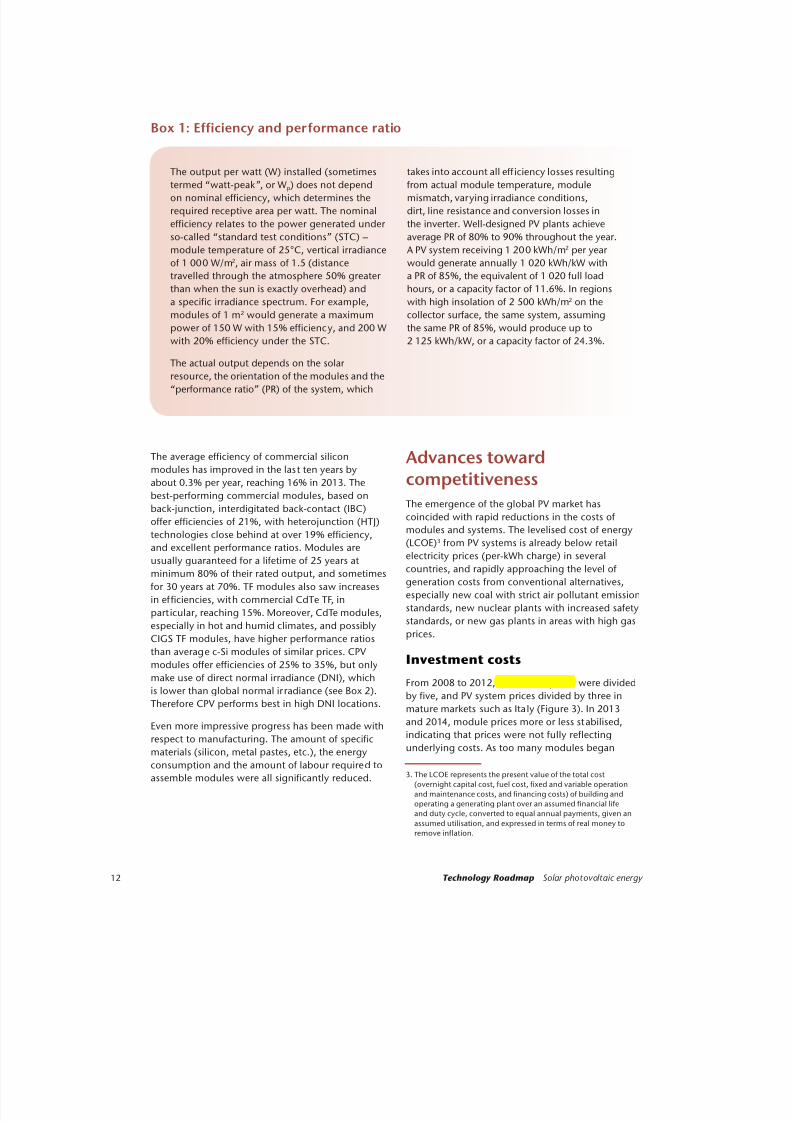
The output per watt (W) installed (sometimes
termed “watt-peak”, or Wp) does not depend
on nominal efficiency, which determines the
required receptive area per watt. The nominal
efficiency relates to the power generated under
so-called “standard test conditions” (STC) –
module temperature of 25°C, vertical irradiance
of 1 000 W/m2, air mass of 1.5 (distance
travelled through the atmosphere 50% greater
than when the sun is exactly overhead) and
a specific irradiance spectrum. For example,
modules of 1 m2 would generate a maximum
power of 150 W with 15% efficiency, and 200 W
with 20% efficiency under the STC.
The actual output depends on the solar
resource, the orientation of the modules and the
“performance ratio” (PR) of the system, which
takes into account all eff iciency losses resulting
from actual module temperature, module
mismatch, varying irradiance conditions,
dirt, line resistance and conversion losses in
the inverter. Well-designed PV plants achieve
average PR of 80% to 90% throughout the year.
A PV system receiving 1 200 kWh/m2 per year
would generate annually 1 020 kWh/kW with
a PR of 85%, the equivalent of 1 020 full load
hours, or a capacity factor of 11.6%. In regions
with high insolation of 2 500 kWh/m2 on the
collector surface, the same system, assuming
the same PR of 85%, would produce up to
2 125 kWh/kW, or a capacity factor of 24.3%.
Box 1: Efficiency and performance ratio

8/9/2019 Technology Roadmap Solar PhotovoltaicEnergy_2014edition
http://slidepdf.com/reader/full/technology-roadmap-solar-photovoltaicenergy2014edition 15/60
13Progress since 2009
to be produced, many were sold at prices too
low to recover investment, as the deterioration
of the balance sheets of most PV companies
(up to bankruptcy for some) demonstrated. But
improvements in technology and the scaling up of
manufacturing were by far the main factors driving
cost reductions.
Solar energy is the most abundant energy
resource on earth, with about 885 million
terawatt hours (TWh) reaching the surface
of the planet every year – 6 200 times the
commercial primary energy consumed by
humankind in 2008, and 3 500 times theenergy that humankind would consume in
2050 according to the ETP 2014 6-degree
Scenario (IEA, 2011; 2014b).
The solar radiation reaching the earth’s surface
is about 1 kilowatt per square metre (kW/m2)
in clear conditions when the sun is near the
zenith. It has two components: direct or
“beam” radiation, which comes directly from
the sun’s disk; and diffuse radiation, which
comes indirectly after being scattered by the
atmosphere. PV systems, with the exception
of concentrating PV (CPV), make use of the
“global” irradiance, which is the sum of direct
and diffuse radiations.
All places on earth receive 4 380 daylight hours
per year — i.e. half the total duration of one
year. Different areas, however, receive different
yearly average amounts of energy from the sun.
When the sun is lower in the sky, its energy is
spread over a larger area, and more is also lost
when passing through the atmosphere, because
of increased air mass; it is therefore weaker
per horizontal surface area: inter-tropical areasshould thus receive more radiation per land
area than places north of the Tropic of Cancer
or south of the Tropic of Capricorn. However,
atmospheric absorption characteristics
affect the amount of this surface radiation
significantly, and the sunniest places on Earth
are usually arid and semi-arid areas close to the
tropics but distant from the Equator.
The average energy received in Europe,
measured in global horizontal irradiance (GHI),
is about 1 200 kilowatt hours per square metre
per year (kWh/m2/y). This amount compares
with 1 800 kWh.m2/y to 2 300 kWh/m2/y in the
Middle East. The United States, Africa, most
of Latin America, Australia, most of India, and
parts of China and other Asian countries also
have good to excellent solar resource; these are
broadly the regions where energy demand is
expected to rise most in the coming decades.
Alaska, Northern Europe, Canada, Russia andSoutheast China receive less solar energy.
But tilting equator-facing modules can
reduce disparities and increase the annual
energy received on PV systems, especially
at high latitudes, although this varies with
meteorological patterns and the ratio of diffuse
versus direct light. For example, modules
in La Rochelle, in France, where the GHI is
1 300 kWh/m2/y, receive up to 1 500 kWh/m2/y
if optimally tilted and oriented. Tracking the
sun on one axis or two axes further increases
the amount of energy receives by the modules.Global normal irradiance (GNI) is the relevant
resource for two-axis sun-tracking “1-sun” (i.e.
non-concentrating) PV systems.
Box 2: Solar radiation relevant for PV
Production of PV modules in China has st imulated
competition and reduced prices. In the United
States, however, the installed price of Chinese and
non-Chinese modules was roughly the same for
any given module e fficienc y (Barbose et al., 2013).In the f irst half of 2014, Chinese Tier 1 module
players were selling at USD 0.59-0.60/W in China,
and USD 0.67-0.79/W in other countries (Bnef,
2014). German modules were selling at
EUR 0.69 (USD 0.95)/W.
The learning experience for complete PV systems is
usually considered slower than that for modules and
other hardware parts (inverters, support structures,

8/9/2019 Technology Roadmap Solar PhotovoltaicEnergy_2014edition
http://slidepdf.com/reader/full/technology-roadmap-solar-photovoltaicenergy2014edition 16/60
14 Technology Roadmap Solar photovoltaic energy
cables, etc) – a phenomenon with both national and
global dimensions. However, in emerging markets,
non-module costs often shrink rapidly as installers
gain experience — and also as project density
increases, saving significant travel times for sales
and marketing staff, and skilled workers.
The costs of PV systems have fallen considerably over
the last six years in several markets. In Italy, prices
for non-module components of PV systems dropped
significantly (Figure 3). In other countries, notably in
the United States, the reductions were much smaller,
and the fall in module costs was the main driver of
the decline in system costs up to 2012.
In 2013, the cheapest large-scale, ground-mounted
PV systems could cost less than USD 1.50/W, a price
that most market analysts expected, just two years
previously, to apply in 2019 or 2017 at the earliest.
Although module prices seem to have stabilised
in 2013, system costs have continued to decline,
with cost reductions in California, for example,
ranging from 10% to 15% depending on system
size in the f irst hal f of 2013 (Barbose et al., 2013).
Both the investment cost difference and the output
gap between fixed-tilted PV systems and one-axis
sun-tracking systems have narrowed in the last few
years. In Japan, cost s of residential PV systems fell
from USD 5.9/W in 2012 to USD 4.64/W in 2013 – a
21% reduction.
Figure 3: System prices in Italy, 2008-2013
Source: Gestore d ei Ser vizi energetici (GSE) (2014), PV in Italy: Generation Costs and Value Chain, May, Rome.
KEY POINT: In 2013, PV systems in Italy cost 30% to 44% of what they cost in 2008.
0
1
2
3
4
5
6
2 0 0 8
2 0 0 9
2 0 1 0
2 0 1 1
2 0 1 2
2 0 1 3
2 0 0 8
2 0 0 9
2 0 1 0
2 0 1 1
2 0 1 2
2 0 1 3
2 0 0 8
2 0 0 9
2 0 1 0
2 0 1 1
2 0 1 2
2 0 1 3
2 0 0 8
2 0 0 9
2 0 1 0
2 0 1 1
2 0 1 2
2 0 1 3
2 0 0 8
2 0 0 9
2 0 1 0
2 0 1 1
2 0 1 2
2 0 1 3
1-3 kW 3-20 kW 20-200 kW 200-1000 kW Above 1000 kW
E U R / W
Modules Inverters Others
Prices for entire PV systems range more widely
than those of cells and modules, which tend to be
global commodities. Small systems, such as rooftop
systems, are usually more expensive than larger
ones, especially ground-based, utility-scale systems
(Australia and China being possible exceptions
due to connection costs). Prices vary significantly
among countries for similar system types (Table 2).
Most of the gap comes from dif ferences in “soft
costs”, which include customer acquisition;permitting, inspection and interconnection;
installation labour; and financing costs, especially
for small systems (Seel et al., 2013). Generous
incentive frameworks in some countries keep prices
higher than raw costs plus a reasonable margin.
Even greater differences are evident in the costs of
commercial PV systems from country to country;
such systems are more than twice as expensive in
the United States than in Germany.

8/9/2019 Technology Roadmap Solar PhotovoltaicEnergy_2014edition
http://slidepdf.com/reader/full/technology-roadmap-solar-photovoltaicenergy2014edition 17/60
15
Levelised costof electricity (LCOE)
PV power plants reached LCOE of EUR 78
(USD 110)/MWh to EUR 142 (USD 190)/MWh in
the third quar ter of 2013 in Germany, depending
on the type of power plant and irradiance (Kost et
al., 2013). At higher irradiation ranges (e.g. 1 450-
2 000 kWh/m2/y), assuming same system costs
but slightly higher costs of capital, the LCOE from
PV in 2013 lies under EUR 120 (USD 162)/MWh for
all PV power plant types. At 2 000 kWh/m2/y, PV
utility-scale power plants under similar assumptions
relative to system costs and costs of capital wouldbe already able to produce power for EUR 60
(USD 80)/MWh and therefore have a LCOE that is
comparable to power generated from oil and gas,
or even new-built coal (Kost et al., 2013). However,
in countries where PV deployment has barely
begun, PV system costs and costs of capital may
be significantly higher, preventing PV from being
immediately competitive.
PV can be built and operated in millions of small,
decentralised systems, often characterised as
“rooftop”. When the LCOE of decentralised solar
Progress since 2009
Figure 4: Grid parity was reached in 2013 in various countries
Note: Household electricity tarif fs exclude fixed charges. LCOEs are calculated using average residential system costs (including value-
added tax and sales tax in where applicable, and investment tax credit in California); ranges mostly reflect differences in financing
costs. The tiered tarif fs in California are those of Pacific Gas and Electric. Tiers 3 to 4 or 5 are tariffs paid on monthly consumption when
it exceeds given percentages of a set baseline. All costs and prices are in 2012 USD.
KEY POINT: Grid parity underpins PV self-consumption in Germany, and net metering in California.
0
100
200
300
400
500
600
700
800
900
1 000
1 100
2010 2013 2010 2013 2010 2013 2010 2013 2010 2013
California Australia Germany Italy Netherlands
U
S D / M W h
Variable portion of tariff Tiered tariffsLCOE
Table 2: Typical PV system prices in 2013 in selected countries (USD)
Sources: Friedman et al. (2014), Comparing PV Costs and Deployment Drivers in the Japanese and U.S. Residential and Commercial
Markets, Februar y, NREL/TP-6A20-60360; PV-PS IA (2014a), PV Cost Data for the IEA, personal communication, January.
USD/W Australia China France Germany Italy Japan United
Kingdom
United
States
Residential 1.8 1.5 4.1 2.4 2.8 4.2 2.8 4.9
Commercial 1.7 1.4 2.7 1.8 1.9 3.6 2.4 4.5
Utility-scale 2.0 1.4 2.2 1.4 1.5 2.9 1.9 3.3
8/9/2019 Technology Roadmap Solar PhotovoltaicEnergy_2014edition
http://slidepdf.com/reader/full/technology-roadmap-solar-photovoltaicenergy2014edition 18/60
16 Technology Roadmap Solar photovoltaic energy 16
PV systems becomes lower than the variable
portion of the retail electricity price (i.e. per kWh)
(Figure 4), the situation is known as “grid parity”
or “socket parity”. Grid parity provides an incentive
to electricity customers to build a PV system and to
generate part of the electricity they consume, and
to consume part of the electricity they generate
(as more extensively discussed in the System
Integration section below). In virtually all power
systems, the variable, per-kWh portion of retail
prices covers energy costs, most transmission and
distribution (T&D) costs, utility or grid operator
margins, and various fees and taxes. Grid parity
already drives part of the PV deployment in several
countries. In the ETP model, the electricity from
rooftop PV systems has to compete with bulk powercosts from competitors, which is augmented by the
T&D costs.
Barriers encountered,
overcome or outstanding
The quality of PV products has generally increased
over the last few years, with reduced variance in PR
(Nowak, 2014), but as competition has intensif ied,
some manufacturers have been able to sell lower-
quality modules at very low costs. Most commondefects were broken interconnections, solder
bonds and diodes, or encapsulant discoloration
or delamination. Other problems arose because
local installers lacked the required skills or the
initial design was poor. Conceiving and building
PV systems requires a variety of skills, some very
specific to PV.
Standards established by International Electricity
Commission (IEC 61215 for c-Si, IEA 61646 for TF,
IEC 62108 for CPV modules) have proven useful
in reducing early failure – or “infant mortality”
– of PV modules, but they were not designed to
identify how modules wear out or fail in different
climates and system configurations, or differentiate
between products with short or long lifetimes, or
quantify module lifetime for different applications
or climates.
There are no widely recognised standards, norms
or labels that would tell customers about the
behaviour, performance and longevity of various
PV products in specific environments. Most of
today’s commercial modules pass qualification
tests with minimum changes required, so the testsdo not provide a means of rankings. Furthermore,
depending on the robustness of the quality
assurance system, certification of a module type
may only provide insurance with respect to one
module out of millions.
In several countries, notably Germany and Italy,
deploying PV rapidly has created technical issues
(as well as policy cost issues, which are discussed
below in the section on policy and finance). When
the concentration of significant PV capacities in
rural areas created “hot spots”, low-voltage grids
needed to be strengthened to evacuate the power.
To mitigate the problem, in 2012 Germany revised
its Renewable Energy Sources Act to oblige new
PV plants to allow remote curtailment, except for
systems below 30 kW, which could instead opt forreducing feed-in to 70% of peak capacity
(IEA, 2013a).
Grid codes have created other issues. The European
power grid functions at a frequency of 50 Hertz
(Hz). When more energy is fed in to the power
grid than is removed from it, the grid frequency
increases. Excessively high frequencies render the
grid unstable. Until 2011, inverters for PV systems
were equipped with an automatic switch-off
function triggered at a fixed frequency of 50.2 Hz.
As the number of PV systems in Germany increased,
however, this requirement meant to protect the gridcould have paradoxically put its stability at risk as PV
systems switched off abruptly.
To ensure network security and handle the “50.2
Hz issue”, Germany’s System Stabilit y Act of May
2012 scheduled the retrofit of PV systems until the
end of 2014. Power inverters must be able to reduce
output when frequency rises too high or to turn
themselves off smoothly. If PV systems do not meet
the technical requirements necessary to meet this
obligation, the law requires that they be switched
off at different frequencies. In March 2012, Italy
required that PV systems over 50 kW and connected
to the medium-voltage grid carry out retrofits
by the end of March 2013 to solve a problem of
under-frequency threshold for disconnection.
This resulted in the saturation of the market for
interface protection of medium voltage, leading to a
suspension of incentives for plants that did not met
the deadline.

8/9/2019 Technology Roadmap Solar PhotovoltaicEnergy_2014edition
http://slidepdf.com/reader/full/technology-roadmap-solar-photovoltaicenergy2014edition 19/60
17Progress since 2009
In March 2013, the European Network of
Transmission System Operators for Electricity
(ENTSO-E) released its latest network code on
“requirements for generators”. When the new
network code is formally approved and turned into
laws, it will apply to all new generators and address
the key issues of fault ride-through, frequency
stability, voltage stability and remote control.
Obtaining permits and, more specifically, getting
access to the grid has remained an obstacle for PV
in many countries, because PV is not allowed at
various voltage levels, or because grid operators
have instituted complex, slow or expensive (or all of
the above) connecting procedures. The replacement
of feed-in tariffs (FiTs) by auctions has sometimesled to increases in overall costs, especially for
low system sizes, as uncertain results increase
development and financing costs.
Medium-term outlook
Based on a detailed analysis of all main PV markets,
the IEA Medium-Term Renewable Energy Market
Report (IEA 2014c) conservatively estimates that
cumulative installed PV capacity will likely exceed
400 GW worldwide by 2020. China, which recently
adopted a target of 70 GW PV capacity by 2017,
would lead the world, with over 110 GW. Japan and
Germany would each reach around 50 GW, followed
by the United States at over 40 GW. Italy and India
would rank fif th and sixth with 25 GW and 15 GW,
followed by the United Kingdom, France and
Australia, all nearing 10 GW.
With respect to annual markets, by 2020 Chinawould be leading with about 14 GW/y, followed by
the United States (5 GW/y) and Japan (3 to 4 GW/y).
In 2020, global PV capacity that had been installed
by the end of 2019 would be generating 530 TWh
to 580 TWh, or about 2% of global electricity
consumption. In the “enhanced case”, global
installed capacity could reach 465 GW to 515 GW by
2020 (IEA, 2014c).

8/9/2019 Technology Roadmap Solar PhotovoltaicEnergy_2014edition
http://slidepdf.com/reader/full/technology-roadmap-solar-photovoltaicenergy2014edition 20/60
18 Technology Roadmap Solar photovoltaic energy 18
Since the IEA’s original PV roadmap was published
in 2010, technology has improved and costs have
fallen more than expected, partly because PV
systems have been rolled out faster than expected.
Meanwhile, because of slower progress in carbon
capture and storage (CCS) and persistent increased
costs for nuclear power, ETP 2014 envisages lower
deployment of those technologies between now
and 2050 than ETP 2012 estimated (IEA, 2014b).
While the original roadmap set a goal for PV of
11% of total electricity generation by 2050, this
roadmap, based on the hi-Ren Scenario of ETP 2014,
aims for as much as 16%. PV generation would
contribute 17% to all clean electricity, and 20% of
all renewable electr icity. In both variants of the
2DS, global electricity production in 2050 is almost
entirely based on zero-carbon emitting technologies
mostly renewables (65% in the 2DS, 79% in the hi-
Ren), in sharp contrast with the unsustainable 6DS
and 4DS (Figure 5).
It is also worth noting that the greater expansion of
PV is not expected to harm the deployment of solar
thermal electricity (STE) generated in concentrating
solar power (CSP) plants; in this year’s update of
the 2010 STE/CSP roadmap, estimates of STE’s share
of total electricity generation have barely changed
(IEA, 2014a).
Vision for deployment
CO2 reduction targets
from the ETP 2014
hi-Ren Scenario
PV systems installed by the end of 2013 are
generating 160 TWh/yr of clean electricity and thus
avoiding about 140 million tonnes of CO2 per year
(MtCO2/yr). Annual emissions from the power sector
would increase from 13 GtCO2 in 2011 to about
22 GtCO2 in 2050 in the ETP 2014 6DS (IEA, 2014b,see Box 3). By contrast, in the hi-Ren Scenario, they
are reduced to a mere 1 GtCO2 in 2050. Solar PV
would be responsible for avoiding 4 GtCO2/yr of
emissions, or 19% of the total power sector emission
reductions, by 2050, and 20% of cumulative
emission reductions over the entire scenario period.
Figure 5: Global electricity mix in 2011 and in 2050 in three ETP 2014 scenarios
KEY POINT: in the hi-Ren Scenario, renewables provide 79% of global electricity by 2050,variable renewables provide 38%, and PV provides 16%.
0
10 000
20 000
30 000
40 000
50 000
60 000
2011 6DS 2DS hi-Ren
Solar PV Wind offshore Ocean
T W h
Oil Coal Coal with CCS Natural gas Natural gas with CCS Nuclear Waste Biomass Biomass with CCS Hydro Geothermal STE
Land-based wind
Renewables 27%
65%
79%
20%
Variable 8%
38%29%
2%
8/9/2019 Technology Roadmap Solar PhotovoltaicEnergy_2014edition
http://slidepdf.com/reader/full/technology-roadmap-solar-photovoltaicenergy2014edition 21/60
19Vision for deployment
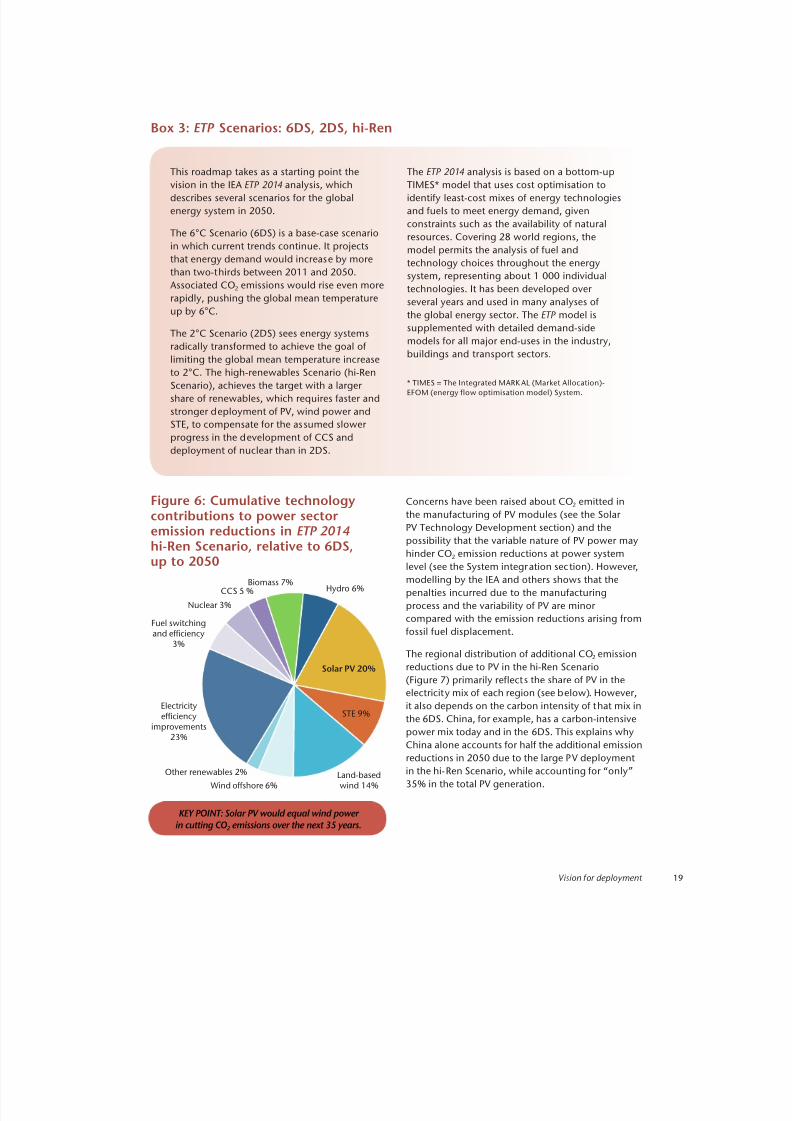
KEY POINT: Solar PV would equal wind powerin cutting CO2 emissions over the next 35 years.
Figure 6: Cumulative technologycontributions to power sectoremission reductions in ETP 2014hi-Ren Scenario, relative to 6DS,up to 2050
Fuel switchingand efficiency
3%
CCS 5 %
Nuclear 3%
Biomass 7%Hydro 6%
Solar PV 20%
STE 9%
Land-basedwind 14% Wind offshore 6%
Other renewables 2%
Electricityefficiency
improvements23%
This roadmap takes as a starting point the
vision in the IEA ETP 2014 analysis, which
describes several scenarios for the global
energy system in 2050.
The 6°C Scenario (6DS) is a base-case scenario
in which current trends continue. It projects
that energy demand would increase by more
than two-thirds between 2011 and 2050.
Associated CO2 emissions would rise even more
rapidly, pushing the global mean temperature
up by 6°C.
The 2°C Scenario (2DS) sees energy systems
radically transformed to achieve the goal of
limiting the global mean temperature increase
to 2°C. The high-renewables Scenario (hi-Ren
Scenario), achieves the target with a larger
share of renewables, which requires faster and
stronger deployment of PV, wind power and
STE, to compensate for the assumed slower
progress in the development of CCS and
deployment of nuclear than in 2DS.
The ETP 2014 analysis is based on a bottom-up
TIMES* model that uses cost optimisation to
identify least-cost mixes of energy technologies
and fuels to meet energy demand, given
constraints such as the availability of natural
resources. Covering 28 world regions, the
model permits the analysis of fuel and
technology choices throughout the energy
system, representing about 1 000 individual
technologies. It has been developed over
several years and used in many analyses of
the global energy sector. The ETP model is
supplemented with detailed demand-side
models for all major end-uses in the industry,
buildings and transport sectors.
* TIMES = The Integrated MARK AL (Market Allocation)-
EFOM (energy flow optimisation model) System.
Box 3: ETP Scenarios: 6DS, 2DS, hi-Ren
Concerns have been raised about CO2 emitted in
the manufacturing of PV modules (see the Solar
PV Technology Development section) and the
possibility that the variable nature of PV power may
hinder CO2 emission reductions at power system
level (see the System integration section). However,
modelling by the IEA and others shows that the
penalties incurred due to the manufacturing
process and the variability of PV are minor
compared with the emission reductions arising from
fossil fuel displacement.
The regional distribution of additional CO2 emission
reductions due to PV in the hi-Ren Scenario
(Figure 7) primarily reflects the share of PV in the
electricity mix of each region (see below). However,
it also depends on the carbon intensity of that mix in
the 6DS. China, for example, has a carbon-intensive
power mix today and in the 6DS. This explains why
China alone accounts for half the additional emission
reductions in 2050 due to the large PV deployment
in the hi-Ren Scenario, while accounting for “only”
35% in the total PV generation.
8/9/2019 Technology Roadmap Solar PhotovoltaicEnergy_2014edition
http://slidepdf.com/reader/full/technology-roadmap-solar-photovoltaicenergy2014edition 22/60
20 Technology Roadmap Solar photovoltaic energy 20
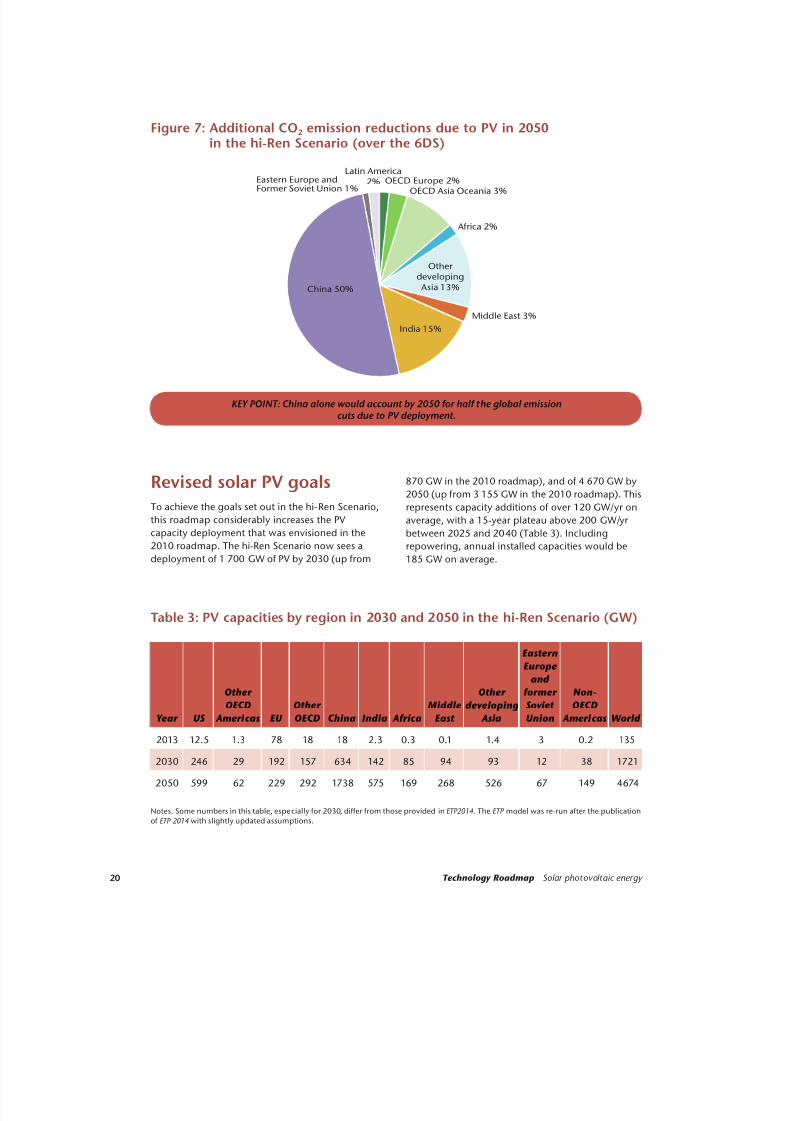
Figure 7: Additional CO2 emission reductions due to PV in 2050in the hi-Ren Scenario (over the 6DS)
KEY POINT: China alone would account by 2050 for half the global emissioncuts due to PV deployment.
Latin America2% OECD Europe 2%
OECD Asia Oceania 3%
UnitedStates
9%
Africa 2%
Middle East 3%
Eastern Europe andFormer Soviet Union 1%
China 50%
India 15%
Other developing
Asia 13%
Revised solar PV goalsTo achieve the goals set out in the hi-Ren Scenario,
this roadmap considerably increases the PV
capacity deployment that was envisioned in the
2010 roadmap. The hi-Ren Scenario now sees a
deployment of 1 700 GW of PV by 2030 (up from
870 GW in the 2010 roadmap), and of 4 670 GW by2050 (up from 3 155 GW in the 2010 roadmap). This
represents capacity additions of over 120 GW/yr on
average, with a 15-year plateau above 200 GW/ yr
between 2025 and 2040 (Table 3). Including
repowering, annual installed capacities would be
185 GW on average.
Table 3: PV capacities by region in 2030 and 2050 in the hi-Ren Scenario (GW)
Year US
Other
OECD
Americas EU
Other
OECD China India Africa
Middle
East
Other
developing
Asia
Eastern
Europe
and
former
Soviet
Union
Non-
OECD
Americas World
2013 12.5 1.3 78 18 18 2.3 0.3 0.1 1.4 3 0.2 135
2030 246 29 192 157 634 142 85 94 93 12 38 1721
2050 599 62 229 292 1738 575 169 268 526 67 149 4674
Notes. Some numbers in this table, especially for 2030, differ from those provided in ETP2014. The ETP model was re-run after the publication
of ETP 2014 with slightly updated assumptions.

8/9/2019 Technology Roadmap Solar PhotovoltaicEnergy_2014edition
http://slidepdf.com/reader/full/technology-roadmap-solar-photovoltaicenergy2014edition 23/60
21Vision for deployment
Figure 8: Regional production of PV electricity envisioned in this roadmap
KEY POINT: in the hi-Ren scenario, PV provides 16% of global electricity by 2050,
and China has a 35% share of the total PV electricity production.
United States Other OECD Americas European Union Other OECD China India Africa
Middle East Other developing Asia Eastern Europe and FSU Non-OECD Americas 2DS Share of total
0%
2%
4%
6%
8%
10%
12%
14%
16%
18%
0
1 000
2 000
3 000
4 000
5 000
6 000
7 000
2015 2020 2025 2030 2035 2040 2045 2050
S h a r e
o f
t o t a l e
l e c t r i c i t y
g e n e r a t i o n
P V
e l e c t r i c i t y
g e n e r a t i o n
( T W h )
As for electricity generation (Figure 8), the hi-
Ren Scenario foresees 2 370 TWh by 2030 and
6 300 TWh by 2050 (a 39% increase over the 2010
roadmap), so that PV achieves a 16% share in the
global electricity mix (up from 11% in the 2010
roadmap or the ETP 2014 2DS).
China is expected to overtake Europe as the largest
producer of PV electricity soon after 2020, with
its share regularly increasing from 18% of global
generat ion by 2015 to 40% by 2030 then slowly
declining to 35% by 2050. From 2030 to 2050, the
share of India and other Asian countries is expected
to rise from 13% to 25%. By contrast, the United
States’ share is expected to remain at about 15%
from 2020 on, and Europe’s share to decrease
constantly from 44% in 2015 to 4% in 2045.
This reflects widely different situations with respect
to the power mix, and more specifically differences
in the mix of renewables by 2050 (see Figure 9),
based on the variety of resources available in
different parts of the world, but also on different
electricity load profiles In non-OECD Americas, for
example, the large availability of hydro power eases
the integration of variable PV but combines with
very competitive land-based wind power to limit PV
penetration.
In Europe, the solar resource is high in the southbut significantly lower in the north, while electricity
demand is on average greater in winter than in
summer (IEA, 2011). Demand peaks often occur in
late afternoon or early evening, so the “capacity
credit”4 of PV at winter peak times is close to zero
in most countries. Wind power in Europe offers a
better match with daily and seasonal variations in
demand, at competitive costs, and thus limits the
penetration of PV to about 8% by 2050 in ETP 2014
hi-Ren Scenario.
PV power could be more widely deployed in Europeif the costs of decentralised electricity storage
(beyond transportation uses) fell significantly
(IEA, 2014e). UBS estimates, for example, that i f
battery costs fell in line with the most optimistic
assumptions, 14% to 18% of electricity demand
in Germany, Spain and Italy could be met by
self-produced solar electricity – with 6% to 9% of
electricity demand replaced on these markets by
2020 (Hummel and Lekander, 2013)
4. The capacity credit of variable renewables is the reduction ofpeak capacity required to satisfy the power demand with the
same loss-of-load probability, as a percentage of the variable
renewable capacity installed.
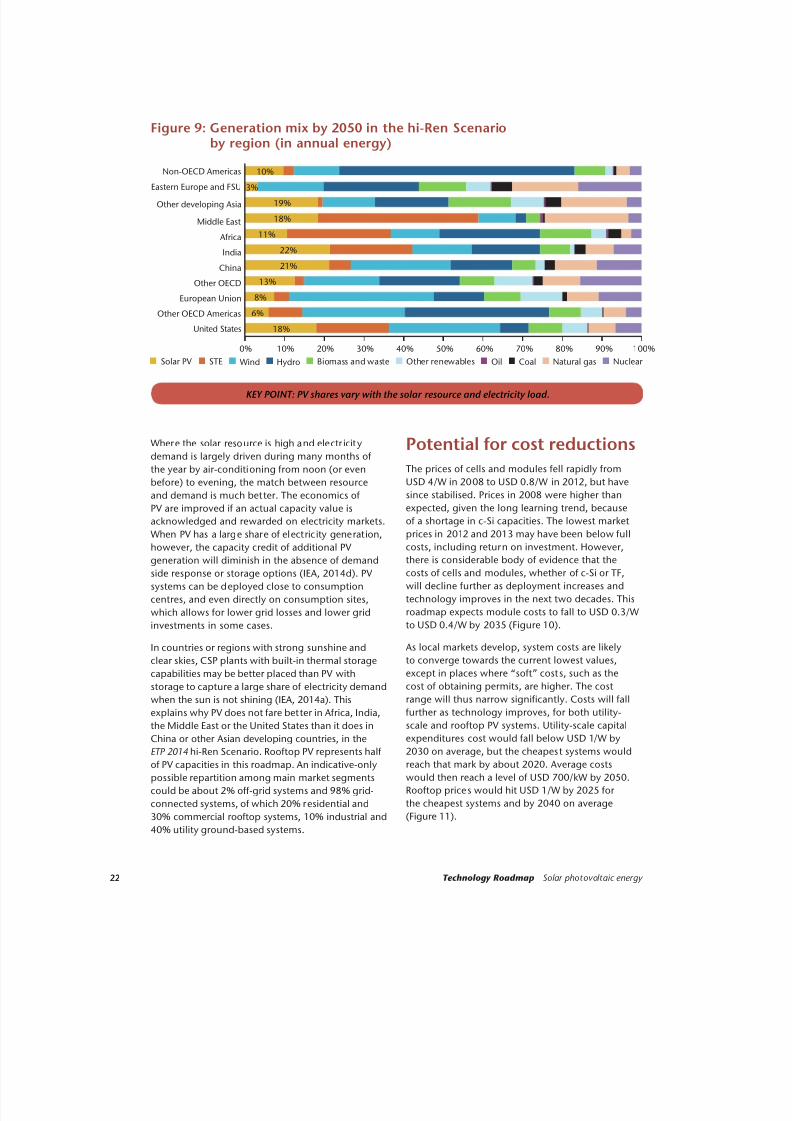
8/9/2019 Technology Roadmap Solar PhotovoltaicEnergy_2014edition
http://slidepdf.com/reader/full/technology-roadmap-solar-photovoltaicenergy2014edition 24/60
22 Technology Roadmap Solar photovoltaic energy 22
Figure 9: Generation mix by 2050 in the hi-Ren Scenarioby region (in annual energy)
KEY POINT: PV shares vary with the solar resource and electricity load.
18%
6%
8%
13%
21%
22%
11%
18%
19%
3%
10%
United States
Other OECD Americas
European Union
Other OECD
China
India
Africa
Middle East
Other developing Asia
Eastern Europe and FSU
Non-OECD Americas
Solar PV Wind Hydro Biomass and waste Other renewables Coal Natural gasSTE Nuclear
0% 10% 20% 30% 40% 50% 60% 70% 80% 90% 100%
Oil
Where the solar resource is high and electr icity
demand is largely driven during many months of
the year by air-conditioning from noon (or even
before) to evening, the match between resourceand demand is much better. The economics of
PV are improved if an actual capacity value is
acknowledged and rewarded on electricity markets.
When PV has a large share of electricity generation,
however, the capacity credit of additional PV
generation will diminish in the absence of demand
side response or storage options (IEA, 2014d). PV
systems can be deployed close to consumption
centres, and even directly on consumption sites,
which allows for lower grid losses and lower grid
investments in some cases.
In countries or regions with strong sunshine and
clear skies, CSP plants with built-in thermal storage
capabilities may be better placed than PV with
storage to capture a large share of electricity demand
when the sun is not shining (IEA, 2014a). This
explains why PV does not fare better in Africa, India,
the Middle East or the United States than it does in
China or other Asian developing countries, in the
ETP 2014 hi-Ren Scenario. Rooftop PV represents half
of PV capacities in this roadmap. An indicative-only
possible repartition among main market segments
could be about 2% off-grid systems and 98% grid-
connected systems, of which 20% residential and30% commercial rooftop systems, 10% industrial and
40% utility ground-based systems.
Potential for cost reductions
The prices of cells and modules fell rapidly from
USD 4/W in 2008 to USD 0.8/W in 2012, but havesince stabilised. Prices in 2008 were higher than
expected, given the long learning trend, because
of a shortage in c-Si capacities. The lowest market
prices in 2012 and 2013 may have been below full
costs, including return on investment. However,
there is considerable body of evidence that the
costs of cells and modules, whether of c-Si or TF,
will decline further as deployment increases and
technology improves in the next two decades. This
roadmap expects module costs to fall to USD 0.3/W
to USD 0.4/W by 2035 (Figure 10).
As local markets develop, system costs are likelyto converge towards the current lowest values,
except in places where “soft” costs, such as the
cost of obtaining permits, are higher. The cost
range will thus narrow significantly. Costs will fall
further as technology improves, for both utility-
scale and rooftop PV systems. Utility-scale capital
expenditures cost would fall below USD 1/W by
2030 on average, but the cheapest systems would
reach that mark by about 2020. Average costs
would then reach a level of USD 700/kW by 2050.
Rooftop prices would hit USD 1/W by 2025 for
the cheapest systems and by 2040 on average(Figure 11).

8/9/2019 Technology Roadmap Solar PhotovoltaicEnergy_2014edition
http://slidepdf.com/reader/full/technology-roadmap-solar-photovoltaicenergy2014edition 25/60
23Vision for deployment
Figure 10: Past modules prices and projection to 2035 based on learning curve
Notes: Orange dots indicate past module prices; purple dots are expectations. The oval dots correspond to the deployment starting in
2025, comparing the 2DS (left end of oval) and 2DS hi-Ren (right end).
Figure 11: PV investments cost projections in the hi-Ren Scenario
KEY POINT: This roadmap expects the cost of modules to halve in the next 20 years.
KEY POINT: The price ranges of PV systems will narrow, and the average cost will be halved by 2040 or before.
1976
1980
1990
2013
2000
2020
2015
0.1
1
10
100
0.00 0.00 0.01 0.10 1.00 10.00 100.00 1 000.00 10 000.00
Cumulative manufactured capacity (GW)
p v
m o d u l e
p r i c e
( U S D / W )
2030
2035
2025
Experience curve Observations Targets
0
1 000
2 000
USD/kW
3 000
4 000
5 000
2015 2020 2030 2040 2050
Utility-scale PV system
Range
2015 2020 2030 2040 2050
Rooftop PV system
Weigthed average

8/9/2019 Technology Roadmap Solar PhotovoltaicEnergy_2014edition
http://slidepdf.com/reader/full/technology-roadmap-solar-photovoltaicenergy2014edition 26/60
24 Technology Roadmap Solar photovoltaic energy 24
As capital expenditures fall, performance ratios
increase, and the bulk of PV moves from Europe to
sunnier skies, the average PV LCOE will continue to
diminish – and the range of LCOE across countries
will continue to narrow. The average LCOE of
new-built, large-scale, ground-based PV plants is
expected to fall on average below USD 100/MWh
by 2025, and to gradually reach USD 60/MWh
(Table 4).
The LCOE of new-built rooftop PV systems will fall
on average below USD 100/MWh soon af ter 2030,
and gradually reach USD 80/MWh (Table 5).
For a given site and irradiation, setting aside
performance ratio and its evolution over time, the
most important levers for cost reductions are capital
expenditures and costs of capital (Figure 12). When
the weighted average capital cost (WACC) exceeds
9%, more than half the LCOE represents the burden
of financing.
The LCOE projections in this roadmap rest on a
WACC of 8%. More optimist ic assumptions lead
to lower costs. For example, a WACC of 2.4% to
2.8% in Germany and 4.7% in high solar irradiation
countries could reduce the LCOE of PV power plants
to EUR 55 to 94/MWh (USD 74 to 127/MWh) by
2020, so that “even small rooftop PV systems willbe able to compete with onshore wind power and
the increased LCOE from brown coal hard coal and
combined cycle gas turbine (CCGT) power plants”
(Kost et al., 2013). Where solar irradiation is high
(2 000 kWh/m2/.m-2.y-1), the same study computes
the LCOE of utility-scale PV at EUR 59/MWh
(USD 80/MWh) today, and EUR 43 to 64/MWh
(USD 58 to 87/MWh) by 2030.
Table 4: Projections for LCOE for new-built utility-scale PV plants to 2050(USD/MWh) in the hi-Ren Scenario
Table 5: Projections for LCOE for new-built rooftop PV systems to 2050(USD/MWh) in the hi-Ren Scenario
USD/MWh 2013 2020 2025 2030 2035 2040 2045 2050
Minimum 119 96 71 56 48 45 42 40
Average 177 133 96 81 72 68 59 56
Maximum 318 250 180 139 119 109 104 97
Note: All LCOE calculations in this table rest on 8% real discount rates as in ETP 2014 (IEA, 2014b). Actual LCOE might be lower with
lower WACC.
USD/MWh 2013 2020 2025 2030 2035 2040 2045 2050
Minimum 135 108 80 63 55 51 48 45
Average 201 157 121 102 96 91 82 78
Maximum 539 422 301 231 197 180 171 159
Note: All LCOE calculations in this table rest on 8% real discount rates as in ETP 2014 (IEA, 2014b).

8/9/2019 Technology Roadmap Solar PhotovoltaicEnergy_2014edition
http://slidepdf.com/reader/full/technology-roadmap-solar-photovoltaicenergy2014edition 27/60
25Vision for deployment
Figure 12: The share of the costs of capital in the LCOE of PV systems
Notes: This example is based on output of 1 360 kWh/kW/y, investment costs of USD 1 500/ W, annual operations and maintenance
(O&M) of 1% of investment, projec t lifetime of 20 years, and residual value of 0.
KEY POINT: When the WACC exceeds 9%, over half the LCOE of PV is made of nancial expenditures.
0.00
0.05
0.10
0.15
0.20
0.25
0% 1% 2% 3% 4% 5% 6% 7% 8% 9% 10% 11% 12% 13% 14% 15% 16% 17% 18% 19% 20%
WACC
L C O E
U S D / k W h
0%
10%
20%
30%
40%
50%
60%
70%
80%
S h a r e
o f
c o s t
o f
c a p i t a l
i n L
C O E
Investment O&M Cost of capital Percentage cost of capital
Nearly 1.3 billion people did not have access
to electr icity in 2011, mostly in Afr ica and
developing Asia. By 2050, although population
growth will concentrate in cities, hundreds
of millions of people will still live in sparsely
-populated rural areas where off-grid solar
systems would likely be the most suitable
solution for minimum electrification. The IEA
Energy for All case of the 2012 World Energy
Outlook (IEA, 2012a) assumes grid extension for
all urban zones and around 30% of rural areas,
and for the remainder, mini-grids and stand-alone solutions.
In both on-grid and off-grid situations, solar
PV has considerable merits, sometimes in
combination with other energy sources. It can
improve life considerably for those who earn
USD 1 to USD 2 per day and spend as much
as USD 0.4 per day on dry batteries, kerosene
and other energy products (IEA, 2011). PV
could prove competitive if financing costs can
be reduced, given the high share of up-front
investment costs. This roadmap thus assumes
by 2030 a PV capacity of 200 W per capita for
500 million people lacking other access to
electricity. Mini-grids and of f-grid PV capacity
would thus total 100 GW, representing about
5% of total capacity by 2030 (2% by 2050), asignificant increase from current trends.
Box 4: Sustainable PV energy for all
Global investment to 2050
To decarbonise the entire energy system in the
2DS by 2050 will require about USD 44 tri llion
of additional spending. This investment is more
than offset by over USD 115 trillion in fuel savings,
resulting in net savings of USD 71 trillion. Even with
a 10% discount rate, the net savings are more than
USD 5 trillion (IEA, 2014b).
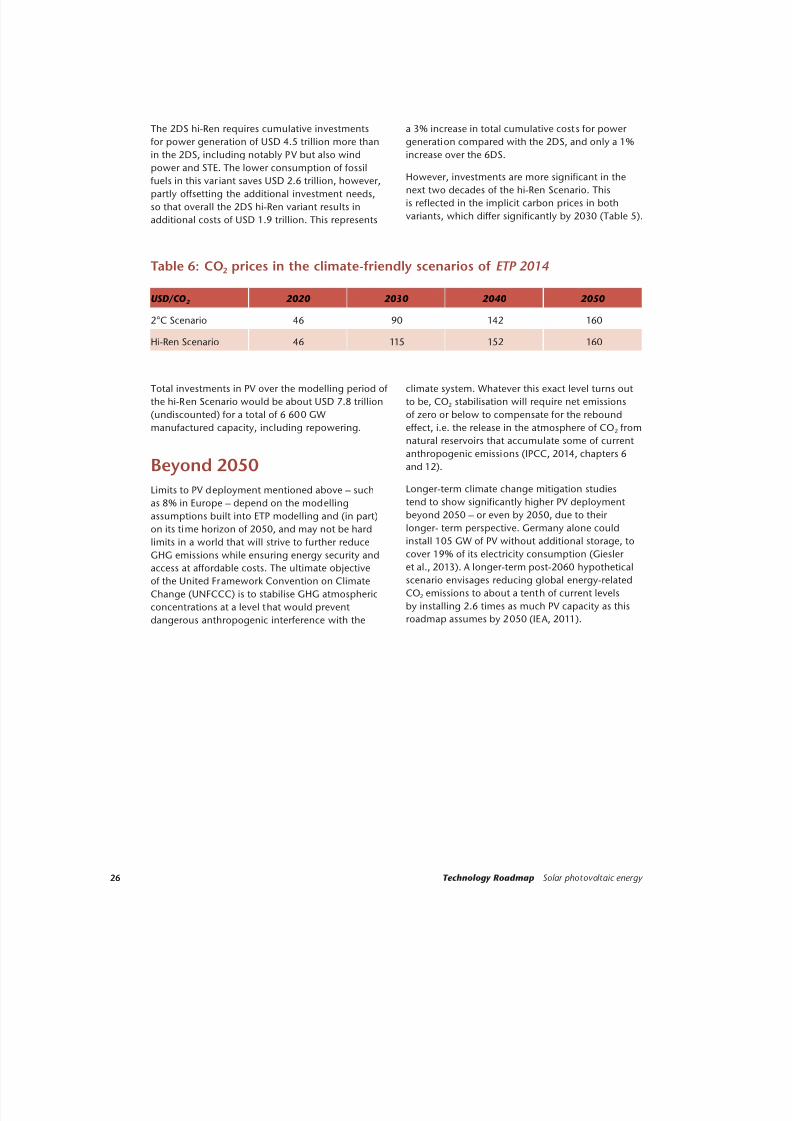
8/9/2019 Technology Roadmap Solar PhotovoltaicEnergy_2014edition
http://slidepdf.com/reader/full/technology-roadmap-solar-photovoltaicenergy2014edition 28/60
26 Technology Roadmap Solar photovoltaic energy 26
The 2DS hi-Ren requires cumulative investments
for power generation of USD 4.5 trillion more than
in the 2DS, including notably PV but also wind
power and STE. The lower consumption of fossil
fuels in this var iant saves USD 2.6 trillion, however,
partly offsetting the additional investment needs,
so that overall the 2DS hi-Ren variant results in
additional costs of USD 1.9 trillion. This represents
a 3% increase in total cumulative costs for power
generation compared with the 2DS, and only a 1%
increase over the 6DS.
However, investments are more significant in the
next two decades of the hi-Ren Scenario. This
is reflected in the implicit carbon prices in both
variants, which differ significantly by 2030 (Table 5).
USD/CO2 2020 2030 2040 2050
2°C Scenario 46 90 142 160
Hi-Ren Scenario 46 115 152 160
Table 6: CO2 prices in the climate-friendly scenarios of ETP 2014
Total investments in PV over the modelling period of
the hi-Ren Scenario would be about USD 7.8 trillion
(undiscounted) for a total of 6 600 GW
manufactured capacity, including repowering.
Beyond 2050
Limits to PV deployment mentioned above – such
as 8% in Europe – depend on the modelling
assumptions built into ETP modelling and (in part)
on its time horizon of 2050, and may not be hard
limits in a world that will strive to further reduce
GHG emissions while ensuring energy security and
access at affordable costs. The ultimate objective
of the United Framework Convention on Climate
Change (UNFCCC) is to stabilise GHG atmospheric
concentrations at a level that would prevent
dangerous anthropogenic interference with the
climate system. Whatever this exact level turns out
to be, CO2 stabilisation will require net emissions
of zero or below to compensate for the rebound
effect, i.e. the release in the atmosphere of CO2 from
natural reservoirs that accumulate some of current
anthropogenic emissions (IPCC, 2014, chapters 6
and 12).
Longer-term climate change mitigation studies
tend to show significantly higher PV deployment
beyond 2050 – or even by 2050, due to their
longer- term perspective. Germany alone could
install 105 GW of PV without additional storage, to
cover 19% of its electricity consumption (Giesler
et al., 2013). A longer-term post-2060 hypothetical
scenario envisages reducing global energy-related
CO2 emissions to about a tenth of current levels
by installing 2.6 times as much PV capacity as this
roadmap assumes by 2050 (IEA, 2011).

8/9/2019 Technology Roadmap Solar PhotovoltaicEnergy_2014edition
http://slidepdf.com/reader/full/technology-roadmap-solar-photovoltaicenergy2014edition 29/60
27Solar PV technology development: actions and milestones
Solar PV technology development: Actions and milestones
The era of rapid price decreases for PV cells and
modules is probably over. All types of PV modules
still have significant room for improvement,
however, star ting with c-Si modules, which
dominate the market with a share of 90%. TF
manufacturers plan to increase efficiencies and
durability. Low- and high-concentrating PV
providers strive to reduce costs and compete with
“1-sun” PV (i.e. PV without concentration) in high-
irradiance areas.
The lowest PV costs are not necessarily achieved
with the highest efficiencies, and small
improvements in efficiency can come at too high a
cost to be worthwhile, even accounting for lower
BOS costs driven by higher efficiencies. Record
cell efficiencies5 achieved on very small surface
areas do not immediately translate into affordable
commercial high-efficiency modules. Nevertheless,
the PV industry has constantly demonstrated it
can reduce costs while increasing the efficiency of
commercial modules (Figure 13). Furthermore, while
greater deployment has driven most cost reduct ions
over the past decade, technology improvements are
likely to return as a major factor behind future cost
reductions (Zheng and Kammen, 2014).
5. See for example the well-known graph of best research-cell
efficiencies that the NREL regularly updates and makes availableat www.nrel.gov/ncpv/images/efficiency_chart.jpg.
Figure 13: Commercial 1-sun module efficiencies (actual and expected)
Note: SPW stands for SunPower , HIT S/P stands for Heterojunction Intrisic T hin layer Sanyo/Panasonic .
Source: De Wild-Scholten, M. (2013), “Energy payback time and carbon footprint of commercial PV systems”, Solar Energy Materials &
Solar Cells, No. 119, pp. 296-305.
KEY POINT: PV efciencies have been rising constantly, and still have room for improvement.
0.0
5.0
10.0
15.0
20.0
25.0
1997 1999 2001 2003 2005 2007 2009 2011 2013 2015
A v e r a g e
m o
d u
l e e
f f i c i e n c y
( % )
SPW X-series SPW E-series SPW 1st HIT S/P sc-Si Yingli mc-Si Yingli sc-Si (Photon Int)
ms-Si (Photon Int) CdTe, FirstSolar CiGS, Solar Frontier a-Si/µc-Si, Oerlikon Solar Fabs a-Si, Tsolar, ES
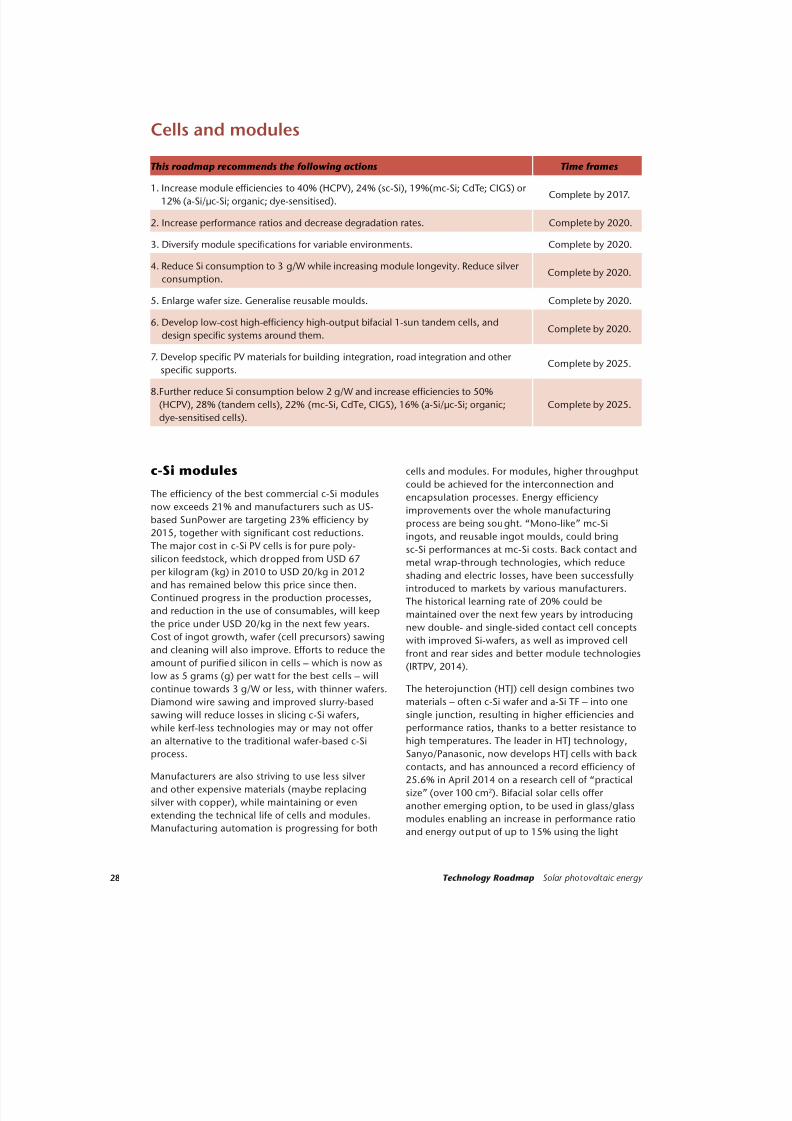
8/9/2019 Technology Roadmap Solar PhotovoltaicEnergy_2014edition
http://slidepdf.com/reader/full/technology-roadmap-solar-photovoltaicenergy2014edition 30/60
28 Technology Roadmap Solar photovoltaic energy 28
Cells and modules
This roadmap recommends the following actions Time frames
1. Increase module efficiencies to 40% (HCPV), 24% (sc-Si), 19%(mc-Si; CdTe; CIGS) or
12% (a-Si/µc-Si; organic; dye-sensitised).Complete by 2017.
2. Increase performance ratios and decrease degradation rates. Complete by 2020.
3. Diversify module specifications for variable environments. Complete by 2020.
4. Reduce Si consumption to 3 g/W while increasing module longevity. Reduce silver
consumption.Complete by 2020.
5. Enlarge wafer size. Generalise reusable moulds. Complete by 2020.
6. Develop low-cost high-efficiency high-output bifacial 1-sun tandem cells, anddesign specific systems around them.
Complete by 2020.
7. Develop specific PV materials for building integration, road integration and other
specific supports.Complete by 2025.
8.Further reduce Si consumption below 2 g/W and increase efficiencies to 50%
(HCPV), 28% (tandem cells), 22% (mc-Si, CdTe, CIGS), 16% (a-Si/µc-Si; organic;
dye-sensitised cells).
Complete by 2025.
c-Si modules
The efficiency of the best commercial c-Si modules
now exceeds 21% and manufacturers such as US-
based SunPower are targeting 23% efficiency by
2015, together with significant cost reductions.
The major cost in c-Si PV cells is for pure poly-
silicon feedstock, which dropped from USD 67
per kilogram (kg) in 2010 to USD 20/kg in 2012
and has remained below this price since then.
Continued progress in the production processes,
and reduction in the use of consumables, will keep
the price under USD 20/kg in the next few years.
Cost of ingot growth, wafer (cell precursors) sawing
and cleaning will also improve. Efforts to reduce the
amount of purified silicon in cells – which is now as
low as 5 grams (g) per watt for the best cells – will
continue towards 3 g/W or less, with thinner wafers.
Diamond wire sawing and improved slurry-based
sawing will reduce losses in slicing c-Si wafers,
while kerf-less technologies may or may not offer
an alternative to the traditional wafer-based c-Si
process.
Manufacturers are also striving to use less silver
and other expensive materials (maybe replacing
silver with copper), while maintaining or evenextending the technical life of cells and modules.
Manufacturing automation is progressing for both
cells and modules. For modules, higher throughput
could be achieved for the interconnection andencapsulation processes. Energy efficiency
improvements over the whole manufacturing
process are being sought. “Mono-like” mc-Si
ingots, and reusable ingot moulds, could bring
sc-Si performances at mc-Si costs. Back contact and
metal wrap-through technologies, which reduce
shading and electric losses, have been successfully
introduced to markets by various manufacturers.
The historical learning rate of 20% could be
maintained over the next few years by introducing
new double- and single-sided contact cell concepts
with improved Si-wafers, as well as improved cellfront and rear sides and better module technologies
(IRTPV, 2014).
The heterojunction (HTJ) cell design combines two
materials – often c-Si wafer and a-Si TF – into one
single junction, resulting in higher efficiencies and
performance ratios, thanks to a better resistance to
high temperatures. The leader in HTJ technology,
Sanyo/Panasonic, now develops HTJ cells with back
contacts, and has announced a record efficiency of
25.6% in April 2014 on a research cell of “practical
size” (over 100 cm2). Bifacial solar cells offer
another emerging option, to be used in glass/glassmodules enabling an increase in performance ratio
and energy output of up to 15% using the light
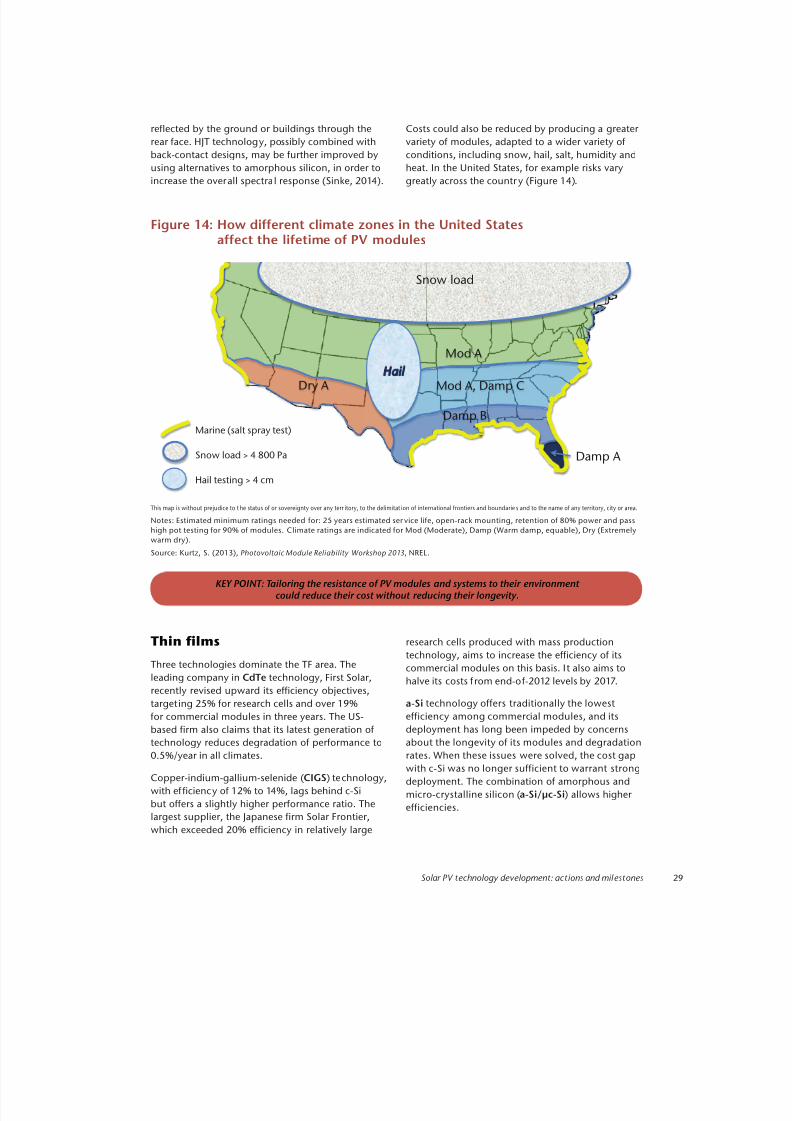
8/9/2019 Technology Roadmap Solar PhotovoltaicEnergy_2014edition
http://slidepdf.com/reader/full/technology-roadmap-solar-photovoltaicenergy2014edition 31/60
29Solar PV technology development: actions and milestones
reflected by the ground or buildings through the
rear face. HJT technology, possibly combined with
back-contact designs, may be further improved by
using alternatives to amorphous silicon, in order to
increase the overall spectral response (Sinke, 2014).
Costs could also be reduced by producing a greater
variety of modules, adapted to a wider variety of
conditions, including snow, hail, salt, humidity and
heat. In the United States, for example risks vary
greatly across the countr y (Figure 14).
Figure 14: How different climate zones in the United Statesaffect the lifetime of PV modules
This map is without prejudice to t he status of or sovereignty over any terr itory, to the delimitat ion of international frontiers and boundarie s and to the name of any territory, city or area.
Notes: Estimated minimum ratings needed for: 25 years estimated ser vice life, open-rack mounting, retention of 80% power and pass
high pot testing for 90% of modules. Climate ratings are indicated for Mod (Moderate), Damp (Warm damp, equable), Dry (Extremely
warm dry).
Source: Kurtz, S. (2013), Photovoltaic Module Reliability Workshop 2013, NREL.
KEY POINT: Tailoring the resistance of PV modules and systems to their environmentcould reduce their cost without reducing their longevity.
Mod A
Hail testing > 4 cm
Snow load
Snow load > 4 800 Pa
Marine (salt spray test)
Dry A Mod A, Damp CHail
Damp B .
Damp A
Thin filmsThree technologies dominate the TF area. The
leading company in CdTe technology, First Solar,
recently revised upward its efficiency objectives,
target ing 25% for research cells and over 19%
for commercial modules in three years. The US-
based firm also claims that its latest generation of
technology reduces degradation of performance to
0.5%/year in all climates.
Copper-indium-gallium-selenide (CIGS) technology,
with ef ficiency of 12% to 14%, lags behind c-Si
but offers a slightly higher performance ratio. Thelargest supplier, the Japanese firm Solar Frontier,
which exceeded 20% efficiency in relatively large
research cells produced with mass productiontechnology, aims to increase the efficiency of its
commercial modules on this basis. I t also aims to
halve its costs from end-of-2012 levels by 2017.
a-Si technology offers traditionally the lowest
efficiency among commercial modules, and its
deployment has long been impeded by concerns
about the longevity of its modules and degradation
rates. When these issues were solved, the cost gap
with c-Si was no longer sufficient to warrant strong
deployment. The combination of amorphous and
micro-crystalline silicon (a-Si/µc-Si) allows higher
efficiencies.

8/9/2019 Technology Roadmap Solar PhotovoltaicEnergy_2014edition
http://slidepdf.com/reader/full/technology-roadmap-solar-photovoltaicenergy2014edition 32/60
30 Technology Roadmap Solar photovoltaic energy 30
Multi-junction cells
Multi-junction cell design involves superposing
several cells in a stack. In the case of two cells, it
will form a double junction, also called a tandem
cell. Stacking more cells together forms a triple or
a quadruple junction. In all cases, the upper cell(s)
must be as transparent as possible to enable the
lower cells to still be active. This approach enables
a broader spectrum of sunlight to be captured, and
overall efficiency to be increased. Record research-
cell three-junction efficiencies of 38.8% under 1-sun
exposure, and 44.4% under high concentration
(>300 suns), have been achieved by Spectrolab, a
Boeing subsidiary, and Sharp, respectively. Four-
or five-junction cells could reach even higherefficiencies, such as the 44.7% achieved by Soitec
and Fraunhofer ISE. Multi-junction cells have been
so far mainly used for space applications and high-
concentration solar cells (see below), reducing the
semiconductor area to a small fraction and therefore
allowing the use of more expensive materials. Niche
markets exist however, for 1-sun multi-junction
cells, such as unmanned aerial vehicles.
The rapid cost decline of c-Si, however, opens
the door for mass-production of high-ef ficiency
tandem cells, where TF would be deposited on c-Si
wafers. Reviewing a broad range of material options– “III-V” alloys, chalcogenides and perovskites
– and relevant production processes, Green et
al. (2013) suggest that Si wafer-based tandem
cells could represent a very cost-effective long-
term combination. Such cells would probably be
best used under 1-sun or low concentration with
simplified tracking devices.
CPV
CPV technologies include low-concentrating PV
(LCPV), which tracks the sun on one axis with
a concentration ratio of around 10, and high-
concentrating PV (HCPV), which tracks the sun
on two axes with a concentration ratio in the
hundreds. LCPV can be based on best-in-class c-Si
cells. HCPV uses very high concentration factors,
at or above 300, which allows the use of more
expensive but highly efficient multi-junction cells.
HCPV requires more precise tracking devices than
LCPV or 1-sun devices. At locations with high DNI,
both LCPV and HCPV already today compete with
PV. Unlike dispatchable STE, CPV output varies like
that of other sun-tracking PV systems while the
higher efficiency significantly reduces the installedmodule surface per MW.
Advanced solar cells
under development
Novel PV devices, such as quantum dots, dye-
sensitised cells, organic cells and thermoelectric
devices hold great promise for the future, but
for mainstream applications they need to reach
specific performance and cost levels to enter the
market. That is why “stepping stones” in the form of
markets that require specific properties (such as low
weight, transparency, flexibility, colour and freedom
of form) may help these new options to enter the
market successfully. Efficiencies of 11% for organic
cells and 12% for dye-sensitised cells have recently
been achieved by Mitsubishi Chemical and Sharp,
respectively.
Non-module costs
Non-module costs relate to non-module hardware,
including fixed supports or tracking systems,
cables, inverters and soft costs, including customer
acquisition, permitting, installation, connection,
and financing. The latter are investigated in the
Policy and Finance section of this roadmap.
Inverters have followed an impressive learning
curve, similar to that of PV modules. The reduction
in material has been dramatic in the last ten years,
from 12 kg/W to 2 kg/W. Manufacturers expect
this trend to continue. Other hardware costs –
materials, such as support and cables, or labour,
such as installation – relate to the area of the
solar PV systems and thus depend mostly on the
efficiency of the modules. Increased efficiencies
thus drive system cost reductions, which become
progressively more important as the cost of PV
modules diminishes and other costs rise above half
the total system costs.
Systems designed to be integrated into the
envelopes of buildings, or building-integrated PV
(BIPV), currently cost more than standard rooftop
systems. The BIPV concept raises the possibility,
however, that a thin layer of PV-active material,
possibly deposited as a paint, could become a
standard feature of building elements such as roof
tiles, façade materials, glasses and windows, just as
double-glazed windows have become standard in
most countries. Given that such elements comprise
a large part of building envelopes, mass production
could enable the cost of PV to almost vanish in this
market segment where it currently costs the most.

8/9/2019 Technology Roadmap Solar PhotovoltaicEnergy_2014edition
http://slidepdf.com/reader/full/technology-roadmap-solar-photovoltaicenergy2014edition 33/60
31Solar PV technology development: actions and milestones
Thin films and advanced solar cells are the primary
candidates for such applications. Other integrated
applications, such as PV materials for roads and
similar surfaces, are also under development.
Life-cycle analysis
Manufacturing PV cells, modules and installing
systems consumes energy and results in greenhouse
gas emissions. Questions have been raised about
the life-cycle assessment of PV systems with respect
to climate change. Often-quoted estimates of
energy pay-back times of two to five years, and
GHG emissions of about 50 gCO2-eq/kWh for mc-Si
modules and 75 gCO2-eq/kWh for sc-Si modules(e.g. IPCC, 2011, p.372) are already outdated and on
steep downward trends. Technical improvements
rapidly decrease energy consumption in the PV
manufacturing process, while efficiency and
performance ratios of new PV systems continuously
increase. Recent studies show energy payback
times of commercial PV systems under Southern
Europe sunshine of 0.7 to 2.5 years, depending on
technology and the power mix in manufacturing
countries; the carbon footprint of PV electricity
ranges from 20 to 81 gCO2-eq/kWh, one order of
magnitude below electricity from fossil fuels (de
Wild-Scholten, 2013).
During the production of thin-film PV and flat
screens, nitrogen trifluoride (NF3) is still used by
some manufacturers to clean the coating systems.
Residues of this gas can escape into the atmosphere.
NF3 is more than 17 000 times as harmful to the
environment as carbon dioxide. Current emission
quantities are not known. As of 2013, NF3 emissions
are to be determined in 37 countries according to
the revised Kyoto Protocol.
Some companies, such as FirstSolar, have long-
established recycling schemes with facilities
operational at all manufacturing plants and
recovery rates of up to 95% of the semiconductor
material and 90% of the glass. PV producers set
up a manufacturer-independent recycling system
in June 2010 (PV Cycle), which currently has more
than 300 members. The version of the European
WEEE Directive (Waste Electrical and Electronic
Equipment Directive), which came into force on
August 13, 2012, must be implemented in all EU
states by the end of February 2014. This directive
makes it compulsory for manufacturers to take back
and recycle at least 85% of their PV modules free of
charge.
Task 12 of the Implementing Agreement for a
Co-operative Programme on Photovoltaic Power
Systems of the IEA (PVPS IA) includes ongoing
work on recycling of manufacturing waste and
spent modules, as well as further work on life-cycle
inventories and assessment.

8/9/2019 Technology Roadmap Solar PhotovoltaicEnergy_2014edition
http://slidepdf.com/reader/full/technology-roadmap-solar-photovoltaicenergy2014edition 34/60

8/9/2019 Technology Roadmap Solar PhotovoltaicEnergy_2014edition
http://slidepdf.com/reader/full/technology-roadmap-solar-photovoltaicenergy2014edition 35/60
33System integration: actions and milestones
Modern electronics allow PV systems, via
their inverters, to perform a number of tasks
autonomously, however, such as riding through
wide ranges of voltage and frequency fluctuations,
actively counteracting voltage changes (volt-
var control) in providing reactive power, and
reconnecting softly to avoid sharp spikes when
disconnecting dur ing power outages (SIWG, 2014).
Telecommunication skills of modern inverters
would greatly expand the possibilities and enable
decentralised PV systems to support the grid. The
system services capabilities of PV systems (and wind
turbines), and the costs associated with providing
these services, are the focus of the EU-funded
REserviceS project (Kreutzkamp et al., 2013).
Changes in PV system design can better match
supply and demand. PV developers can opt for
sun-tracking systems. Developers can adjust the
tilt and orientation of panels to maximise output at
certain times of day or year, instead of maximising
the annual output, if they receive appropriate time-
of-delivery (TOD) price signals. Another option,
which recent module cost cuts have made possible,
is to design fixed-tilted PV systems with panels at
different orientations and a greater DC/AC ratio —
i.e. increased total capacity of modules (generating
DC current) with respect to the capacity of the
inverters (delivering AC current to the grid).
Modules would not all face the equator; some could
be oriented southeast and others southwest, thus
delivering a more regular output throughout the
day and increased capacity factors for the inverter.6
Multiple orientation systems, while not necessarily
optimal, also offer additional opportunities for
deployment on buildings.
System-friendly PV deployment should also be
part of a broader system-friendly deployment of
renewables, especially variable renewables. The
balance between wind power and PV must beconsidered carefully, to take advantage of these
complementary resources over time, as illustrated
by the German case (Figure 16) – and possibly also
the balance between PV and STE, if the latter is
available at reasonable distance.
6. Wind power follows a similar path with higher hubs and greater
swept area/capacity ratios (IEA, 2013b).
Figure 15: Hourly planned versus actualsolar generation in Germany, 2013
Source: Burger, B. (2014), Electricity Production from Solar and
Wind in Germany in 2013, Fraunhofer Institute for Solar Energy
Systems, January, Freiburg, Germany.
Real production solar (MW)
P l a n n e d
p r o d u c t i o n
s o l a r
( M W )
+ 5 G W
+ 1 0
G W
- 5 G W
- 1 0
G W
25 000
30 000
20 000
15 000
5 000
10 000
25 000 30 00020 00015 0005 0000 10 000
KEY POINT: Over country-sized areas, solarenergy generation is largely foreseeable.
Integrating large PV shares
When PV makes up a large share of elec tricity
generation, systems may require more reserves
to ensure balancing than would otherwise be
developed on the basis of the unpredictability and
variability of electricity demand, and the risks of
failures of some generating plants or connecting
lines. The possibility of long periods with little
solar resource — more frequent in winter — calls for
adequate firm capacities. Eventually, integrating
large shares of PV electricity requires technical andeconomic flexibility from the rest of the system (IEA,
2014). This need for flexibility can be illustrated
by the foreseen evolution of the net load curve
of spring days in California, nicknamed the “duck
chart” (Figure 17), which reveals how PV is expected
to modify the curve during daytime but keep almost
unchanged the demand peak of the early evening
– unless other measures, such as demand-side
management, are taken (see e.g., Lazar, 2014).
Load management, including electricity efficiency
improvements and load shifting, offers affordable
options for integrating variable PV output. Thisstrategy has great potential, but is not infinite —
people will always need light at night. Electricity
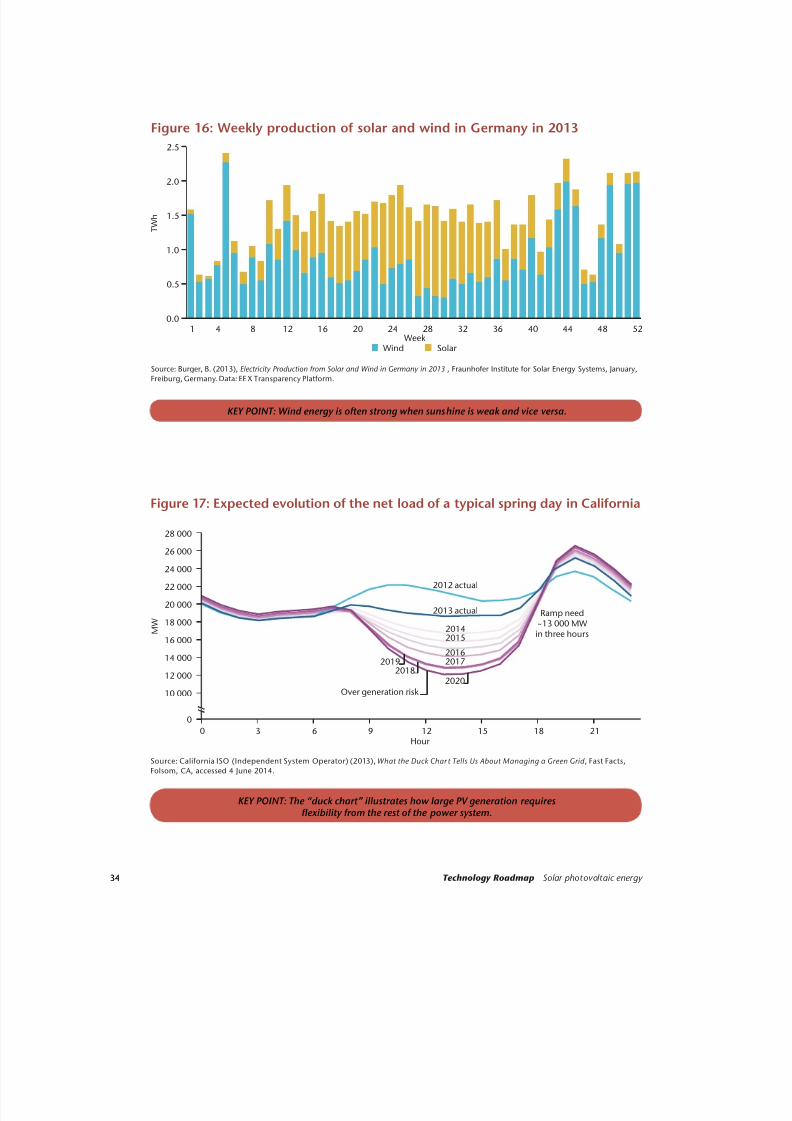
8/9/2019 Technology Roadmap Solar PhotovoltaicEnergy_2014edition
http://slidepdf.com/reader/full/technology-roadmap-solar-photovoltaicenergy2014edition 36/60
34 Technology Roadmap Solar photovoltaic energy 34
Figure 17: Expected evolution of the net load of a typical spring day in California
Source: California ISO (Independent System Operator) (2013), What the Duck Char t Tells Us About Managing a Green Grid , Fast Facts,
Folsom, CA, accessed 4 June 2014.
KEY POINT: The “duck chart” illustrates how large PV generation requiresexibility from the rest of the power system.
M W
28 000
26 000
24 000
22 000
20 000
18 000
16 00014 000
12 000
10 000
0
Over generation risk
0 3 6 9 12Hour
15 18 21
Ramp need~13 000 MW
in three hours
2020
20192018
20172016
20152014
2013 actual
2012 actual
Figure 16: Weekly production of solar and wind in Germany in 2013
Source: Burger, B. (2013), Electricity Production from Solar and Wind in Germany in 2013 , Fraunhofer Institute for Solar Energy Systems, January,
Freiburg, Germany. Data: EE X Transparency Platform.
KEY POINT: Wind energy is often strong when sunshine is weak and vice versa.
41 8 12 16 20 24 28 32 36 40 44 48 52
T W h
2.5
2.0
1.5
1.0
0.5
0.0
Week
Wind Solar
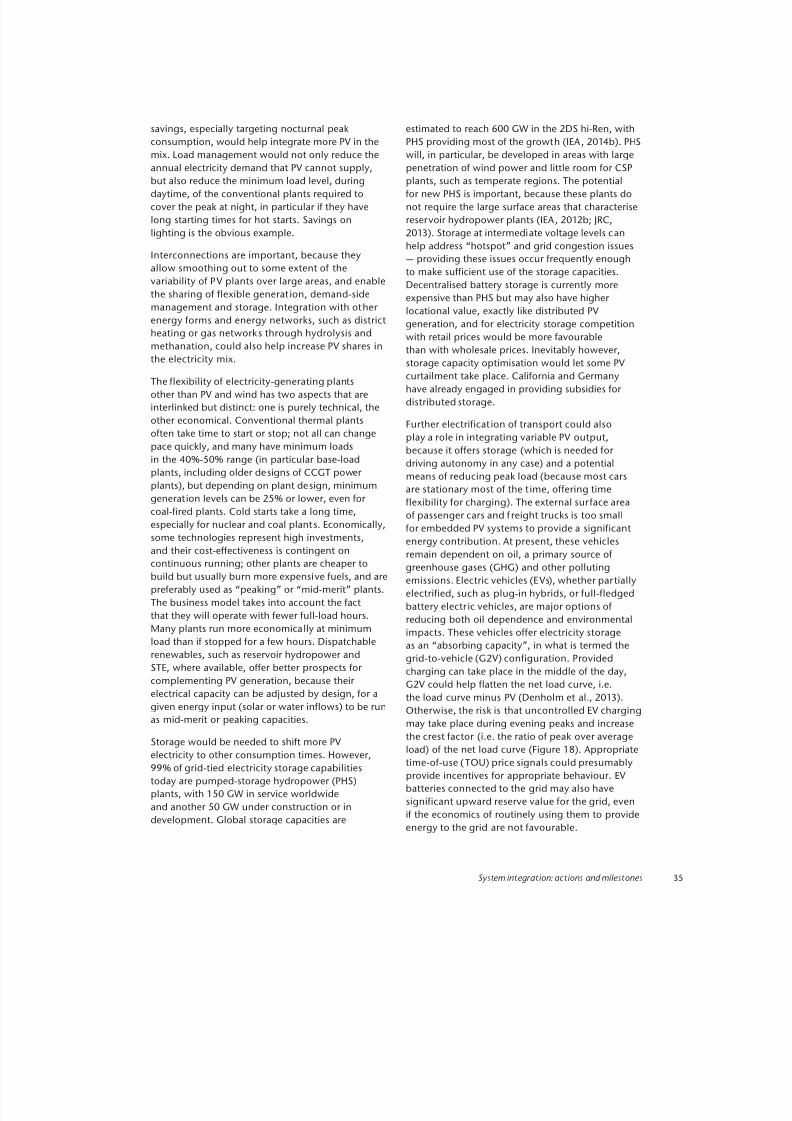
8/9/2019 Technology Roadmap Solar PhotovoltaicEnergy_2014edition
http://slidepdf.com/reader/full/technology-roadmap-solar-photovoltaicenergy2014edition 37/60
35System integration: actions and milestones
savings, especially targeting nocturnal peak
consumption, would help integrate more PV in the
mix. Load management would not only reduce the
annual electricity demand that PV cannot supply,
but also reduce the minimum load level, during
daytime, of the conventional plants required to
cover the peak at night, in particular if they have
long starting times for hot starts. Savings on
lighting is the obvious example.
Interconnections are important, because they
allow smoothing out to some extent of the
variability of PV plants over large areas, and enable
the sharing of flexible generat ion, demand-side
management and storage. Integration with other
energy forms and energy networks, such as districtheating or gas networks through hydrolysis and
methanation, could also help increase PV shares in
the electricity mix.
The flexibility of electricity-generating plants
other than PV and wind has two aspects that are
interlinked but distinct: one is purely technical, the
other economical. Conventional thermal plants
often take time to start or stop; not all can change
pace quickly, and many have minimum loads
in the 40%-50% range (in particular base-load
plants, including older designs of CCGT power
plants), but depending on plant design, minimumgenerat ion levels can be 25% or lower, even for
coal-fired plants. Cold starts take a long time,
especially for nuclear and coal plants. Economically,
some technologies represent high investments,
and their cost-effectiveness is contingent on
continuous running; other plants are cheaper to
build but usually burn more expensive fuels, and are
preferably used as “peaking” or “mid-merit” plants.
The business model takes into account the fact
that they will operate with fewer full-load hours.
Many plants run more economically at minimum
load than if stopped for a few hours. Dispatchablerenewables, such as reservoir hydropower and
STE, where available, offer better prospects for
complementing PV generation, because their
electrical capacity can be adjusted by design, for a
given energy input (solar or water inflows) to be run
as mid-merit or peaking capacities.
Storage would be needed to shift more PV
electricity to other consumption times. However,
99% of grid-tied electricity storage capabilities
today are pumped-storage hydropower (PHS)
plants, with 150 GW in service worldwide
and another 50 GW under construction or indevelopment. Global storage capacities are
estimated to reach 600 GW in the 2DS hi-Ren, with
PHS providing most of the growth (IEA, 2014b). PHS
will, in particular, be developed in areas with large
penetration of wind power and little room for CSP
plants, such as temperate regions. The potential
for new PHS is important, because these plants do
not require the large surface areas that characterise
reservoir hydropower plants (IEA, 2012b; JRC,
2013). Storage at intermediate voltage levels can
help address “hotspot” and grid congestion issues
— providing these issues occur frequently enough
to make sufficient use of the storage capacities.
Decentralised battery storage is currently more
expensive than PHS but may also have higher
locational value, exactly like distributed PV
generation, and for electricity storage competitionwith retail prices would be more favourable
than with wholesale prices. Inevitably however,
storage capacity optimisation would let some PV
curtailment take place. California and Germany
have already engaged in providing subsidies for
distributed storage.
Further electrificat ion of transport could also
play a role in integrating variable PV output,
because it offers storage (which is needed for
driving autonomy in any case) and a potential
means of reducing peak load (because most cars
are stationary most of the t ime, offering time
flexibility for charging). The external sur face area
of passenger cars and f reight trucks is too small
for embedded PV systems to provide a significant
energy contribution. At present, these vehicles
remain dependent on oil, a primary source of
greenhouse gases (GHG) and other polluting
emissions. Electric vehicles (EVs), whether partially
electrified, such as plug-in hybrids, or full-fledged
battery electr ic vehicles, are major options of
reducing both oil dependence and environmental
impacts. These vehicles offer electricity storage
as an “absorbing capacity”, in what is termed thegrid-to-vehicle (G2V) configuration. Provided
charging can take place in the middle of the day,
G2V could help flatten the net load curve, i.e.
the load curve minus PV (Denholm et al., 2013).
Otherwise, the risk is that uncontrolled EV charging
may take place during evening peaks and increase
the crest factor (i.e. the ratio of peak over average
load) of the net load curve (Figure 18). Appropriate
time-of-use (TOU) price signals could presumably
provide incentives for appropriate behaviour. EV
batteries connected to the grid may also have
significant upward reserve value for the grid, evenif the economics of routinely using them to provide
energy to the grid are not favourable.

8/9/2019 Technology Roadmap Solar PhotovoltaicEnergy_2014edition
http://slidepdf.com/reader/full/technology-roadmap-solar-photovoltaicenergy2014edition 38/60
36 Technology Roadmap Solar photovoltaic energy 36
EV charging can increase PV self-consumption.
Experiments in southeast France have shown thata PV system installed over the parking space for
one car could produce enough electricity to run a
four-passenger car over 10 000 kilometres per year.
Midday charging is more likely to happen at officesand other work sites using PV charging stations.
Charging during daylight would also increase if
Figure 18: Controlled versus uncontrolled EV charging effects on load net of PV
Notes: stylised elect ricity system for a f ive-day period with PV generation (top figure), with additional uncontrolled PV charging
(middle figure) and controlled charging (lower figure).
KEY POINT: Controlled charging of electric vehicles would reduce the volatilityof net load and thus facilitate the integration of solar PV.
0
10
20
30
40
50
0 24 48 72 96 120Hours
G W
Solar PV
0
10
20
30
40
50
0 24 48 72 96 120Hours
G W
Solar PV and uncontrolled EV charging
0
10
20
30
40
50
0 24 48 72 96 120Hours
G W
Solar PV and controlled EV charging
Solar PV generation EV charging Net loadElectricity demand

8/9/2019 Technology Roadmap Solar PhotovoltaicEnergy_2014edition
http://slidepdf.com/reader/full/technology-roadmap-solar-photovoltaicenergy2014edition 39/60
37System integration: actions and milestones
proposals were implemented to feed electricity
into electric vehicles, notably heavy trucks, while
they are on the move, via induction or trolleys (see
transport chapter in IEA, 2014b).
A recent IEA publication, The Power of Transformation
(IEA 2014d), investigates in detail the economics of
integrating large shares of variable renewables such
as wind power and solar PV into power systems. It
shows that with timely re-optimisation of power
systems, less inflexible base-load power, and more
flexible mid-merit and peaking generat ion, total
electricity costs at 45% of variable renewables would
be increased by about 10% to 15% with current
wind and PV technology costs. With assumptions
relative to the decline of costs of these technologiesconsistent with the level of deployment in the hi-Ren
Scenario, total electricity costs would eventually
increase by about 3% only as a result of the
expansion of solar PV (IEA, 2014b).
Decentralised PV generation
About half the large PV deployment considered
in this roadmap would take place on buildings or
nearby (such as over parking lots). It rests in part
on the concept of grid parity – when the cost of
distributed PV generation is equal or below the per-
kWh component of retail electricity prices – and on
self-consumption.
Grid parity holds potential but may also create
illusions and raise concerns. The variability of the
solar resource, together with the variability of
electricity demand, limits self-consumption and
its related benefits for electricity consumers who
are also PV producers (known as “prosumers”),
especially in the residential sector. For example, in
temperate countries, most PV electricity generated
in winter will be self-consumed, but the bulk of
electricity consumption will still be drawn from the
grid. On sunny summer days, the opposite holds
true: less than half of PV electricity is self-consumed,
but some electricity must still be drawn from the
grid, especially during the evening peak (Figure 19).
In practice, even reaching the suggested levels of
self-consumption may require the development of“mini-grids” or “solar gardens”, where very short-
term demand variations of dozens of customers
would largely cancel out, while communities,
including renters and owners, would share the
investment in larger and cheaper, well-oriented,
well-designed and well-managed PV systems.
The prospects for self-consumption are higher in
sunnier countries, where consumption is partly
driven by air-cooling loads, and for buildings other
than residential. The load profile of office buildings
or supermarkets suggests a better match with the
solar resource, which reaches its maximum in the
middle of the day (Figure 20).
Figure 19: Self-consumption of stylised householdand rooftop PV system during a sunny day
KEY POINT: Variability of both solar power and electricity demand limits self-consumption.
Without self-consumption With self-consumption
0.0
0.5
1.0
1.5
2.0
2.5
0 04 48 812 1216 1620 2024 24
kW
Solar PV Consumption To the grid From the grid
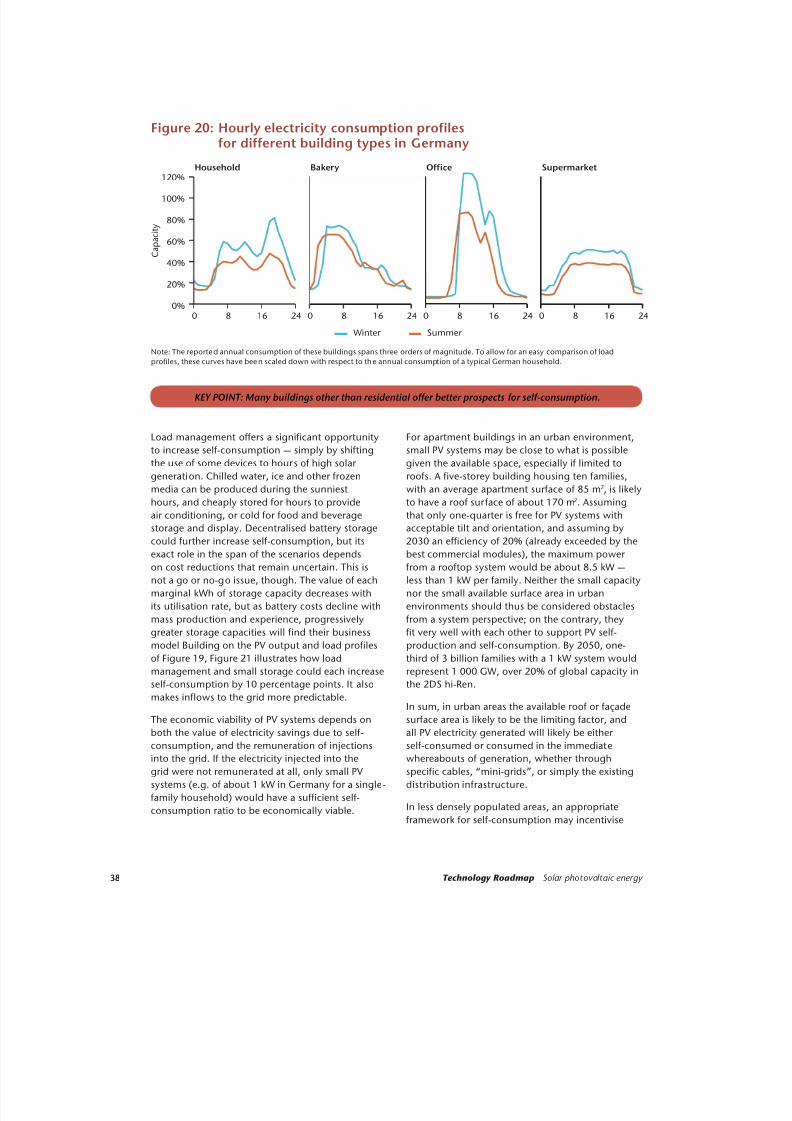
8/9/2019 Technology Roadmap Solar PhotovoltaicEnergy_2014edition
http://slidepdf.com/reader/full/technology-roadmap-solar-photovoltaicenergy2014edition 40/60
38 Technology Roadmap Solar photovoltaic energy 38
Figure 20: Hourly electricity consumption profilesfor different building types in Germany
Note: The reported annual consumption of these buildings spans three orders of magnitude. To allow for an easy comparison of load
profiles, these curves have been scaled down with respect to the annual consumption of a typical German household.
KEY POINT: Many buildings other than residential offer better prospects for self-consumption.
Household Bakery Office
0%
20%
40%
60%
80%
100%
120%
0 0 0 08 8 8 816 16 16 1624 24 24 24
C a p a c
i t y
Winter Summer
Supermarket
Load management offers a significant opportunity
to increase self-consumption — simply by shifting
the use of some devices to hours of high solar
generation. Chilled water, ice and other frozen
media can be produced during the sunniest
hours, and cheaply stored for hours to provide
air conditioning, or cold for food and beverage
storage and display. Decentralised battery storage
could further increase self-consumption, but its
exact role in the span of the scenarios depends
on cost reductions that remain uncertain. This is
not a go or no-go issue, though. The value of each
marginal kWh of storage capacity decreases with
its utilisation rate, but as battery costs decline with
mass production and experience, progressively
greater storage capacities will find their business
model Building on the PV output and load profilesof Figure 19, Figure 21 illustrates how load
management and small storage could each increase
self-consumption by 10 percentage points. It also
makes inflows to the grid more predictable.
The economic viability of PV systems depends on
both the value of electricity savings due to self-
consumption, and the remuneration of injections
into the grid. If the electricity injected into the
grid were not remunerated at all, only small PV
systems (e.g. of about 1 kW in Germany for a single-
family household) would have a sufficient self-
consumption ratio to be economically viable.
For apartment buildings in an urban environment,
small PV systems may be close to what is possible
given the available space, especially if limited to
roofs. A five-storey building housing ten families,
with an average apartment surface of 85 m2, is likely
to have a roof surface of about 170 m2. Assuming
that only one-quarter is free for PV systems with
acceptable tilt and orientation, and assuming by
2030 an efficiency of 20% (already exceeded by the
best commercial modules), the maximum power
from a rooftop system would be about 8.5 kW —
less than 1 kW per family. Neither the small capacity
nor the small available surface area in urban
environments should thus be considered obstacles
from a system perspective; on the contrary, they
fit very well with each other to support PV self-
production and self-consumption. By 2050, one-third of 3 billion families with a 1 kW system would
represent 1 000 GW, over 20% of global capacity in
the 2DS hi-Ren.
In sum, in urban areas the available roof or façade
surface area is likely to be the limiting factor, and
all PV electricity generated will likely be either
self-consumed or consumed in the immediate
whereabouts of generation, whether through
specific cables, “mini-grids”, or simply the existing
distribution infrastructure.
In less densely populated areas, an appropriateframework for self-consumption may incentivise
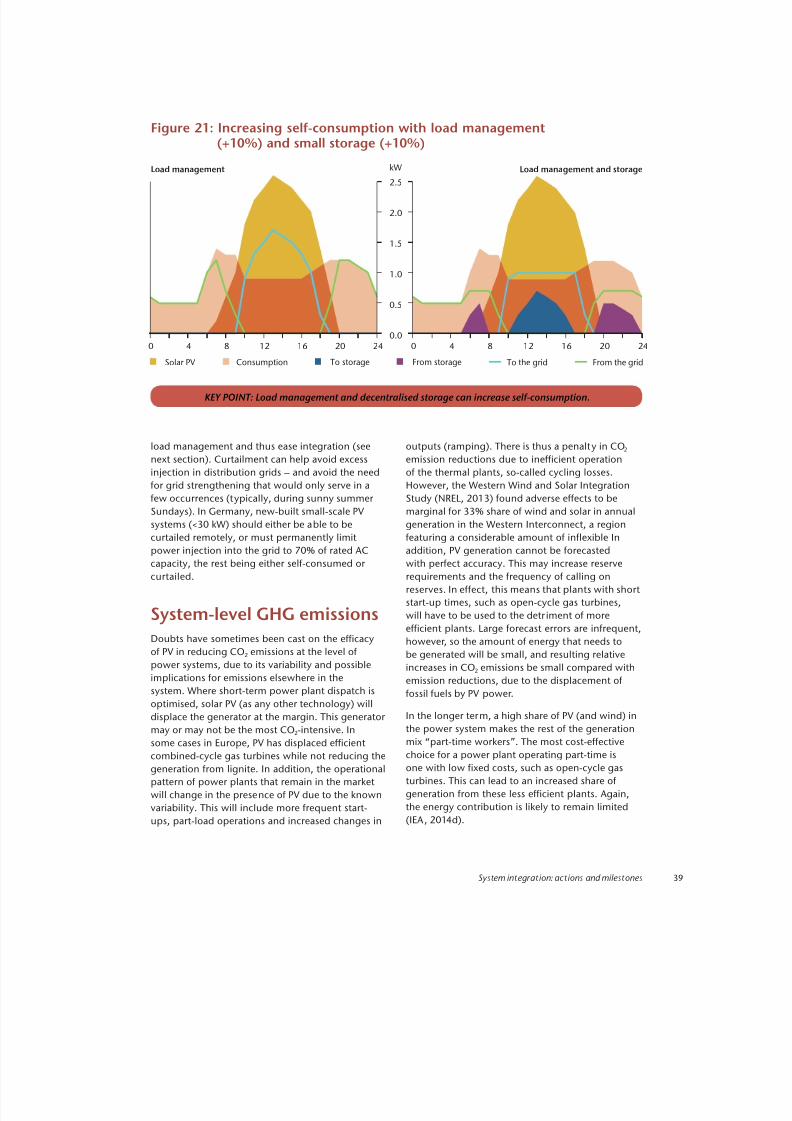
8/9/2019 Technology Roadmap Solar PhotovoltaicEnergy_2014edition
http://slidepdf.com/reader/full/technology-roadmap-solar-photovoltaicenergy2014edition 41/60
39System integration: actions and milestones
load management and thus ease integration (see
next section). Curtailment can help avoid excess
injection in distribution grids – and avoid the need
for grid strengthening that would only serve in afew occurrences (typically, during sunny summer
Sundays). In Germany, new-built small-scale PV
systems (<30 kW) should either be able to be
curtailed remotely, or must permanently limit
power injection into the grid to 70% of rated AC
capacity, the rest being either self-consumed or
curtailed.
System-level GHG emissions
Doubts have sometimes been cast on the efficacyof PV in reducing CO2 emissions at the level of
power systems, due to its variability and possible
implications for emissions elsewhere in the
system. Where short-term power plant dispatch is
optimised, solar PV (as any other technology) will
displace the generator at the margin. This generator
may or may not be the most CO2-intensive. In
some cases in Europe, PV has displaced efficient
combined-cycle gas turbines while not reducing the
generation from lignite. In addition, the operational
pattern of power plants that remain in the market
will change in the presence of PV due to the known
variability. This will include more frequent start-ups, part-load operations and increased changes in
outputs (ramping). There is thus a penalty in CO2
emission reductions due to inefficient operation
of the thermal plants, so-called cycling losses.
However, the Western Wind and Solar IntegrationStudy (NREL, 2013) found adverse effects to be
marginal for 33% share of wind and solar in annual
generation in the Western Interconnect, a region
featuring a considerable amount of inflexible In
addition, PV generation cannot be forecasted
with perfect accuracy. This may increase reserve
requirements and the frequency of calling on
reserves. In effect, this means that plants with short
start-up times, such as open-cycle gas turbines,
will have to be used to the detr iment of more
efficient plants. Large forecast errors are infrequent,
however, so the amount of energy that needs tobe generated will be small, and resulting relative
increases in CO2 emissions be small compared with
emission reductions, due to the displacement of
fossil fuels by PV power.
In the longer term, a high share of PV (and wind) in
the power system makes the rest of the generation
mix “part-time workers”. The most cost-effective
choice for a power plant operating part-time is
one with low fixed costs, such as open-cycle gas
turbines. This can lead to an increased share of
generation from these less efficient plants. Again,
the energy contribution is likely to remain limited(IEA, 2014d).
Figure 21: Increasing self-consumption with load management(+10%) and small storage (+10%)
KEY POINT: Load management and decentralised storage can increase self-consumption.
From the grid
kWLoad management Load management and storage
Solar PV Consumption To storage From storage To the grid
0.0
0.5
1.0
1.5
2.0
2.5
0 04 48 812 1216 1620 2024 24
8/9/2019 Technology Roadmap Solar PhotovoltaicEnergy_2014edition
http://slidepdf.com/reader/full/technology-roadmap-solar-photovoltaicenergy2014edition 42/60
40 Technology Roadmap Solar photovoltaic energy
In some countries, the displacement by more flexible
fossil-fuelled plants of capacities that are carbon-free
but insufficiently flexible, from either a technical or
economic standpoint – e.g. nuclear power in France
or Germany – also raises concerns about increased
CO2 emissions from the “non-renewable” part of
the electr ic systems. However, interconnections
among countries, and other flexibility options such
as demand-side management, hydroelectr icity, solar
thermal electricity and electricity storage, would
limit the potential for emission increases that exist in
few countries.
In sum, large emission reductions arising from the
substitution of PV electricity for fossil fuel-based
electricity generation are orders of magnitude more
important than emission increases that the variability
of PV may drive in the rest of power systems.

8/9/2019 Technology Roadmap Solar PhotovoltaicEnergy_2014edition
http://slidepdf.com/reader/full/technology-roadmap-solar-photovoltaicenergy2014edition 43/60
41Policy, finance and international collaboration: actions and milestones
As PV costs plummet, the need for high-cost
subsidies per unit of energy recedes. However,
the highly capital-intensive cost structure of PV is
at odds with most current liberalised electricity
markets. Strong and stable frameworks are needed,
along with support to minimise investors’ risks and
reduce capital costs.
Deploying PV according to the vision of this
roadmap requires strong, consistent and
balanced policy support. The main areas of policy
intervention include:
z Removing or alleviating non-economic barriers
such as costly, lengthy and heavy permitting
and connecting procedures; establishing
internationally recognised standards and
certification to increase customers’ confidence in
performance and durability of PV systems under a
great variety of weather conditions.
z Creating or updating a policy framework for
market deployment, including tailoring incentive
schemes and reconsidering electricity market
design to accompany transition to market
competitiveness; policy frameworks should be
based on targets for deployment set at country
level; regulatory changes should be as predictable
as possible, and avoid retroactive changes.
z Facilitating integration of larger shares of PV in
electric systems by fostering their transformation
toward greater flexibility.
z Providing innovative financing schemes to reduce
costs of capital for a wide variety of potential
customers.
Policy, finance and internationalcollaboration: Actions and milestones
This roadmap recommends the following actions Time frames
1. Ensure the legal framework authorises electricity generation by independent
power producers at all scales and voltage levels (if not already implemented).
2015-20
2. Streamline permitting and connecting, including permissions on buildings.
Phase out unnecessary bureaucratic administrative processes that add costs
and waiting time.
2015-20
3. Elaborate and enforce performance standards for PV modules and systems in
various climatic environments.2015-20
4. Elaborate training and certification schemes for PV installers. 2015-20
Removing non-economic barriers
Permitting and connecting remain two major
issues in a wide number of jurisdictions – not tomention those countries that have yet to allow plant
development by independent producers, or are
restricting power injection into the grid to high-
voltage levels, or high- and medium-voltage levels.
Administrative and transaction costs can be
specially burdensome for small projects, unlessor until particularly simple and rapid “fast-track”
approval and connecting processes are put in place,
such as in Germany, Italy and some US states, such
as Vermont.

8/9/2019 Technology Roadmap Solar PhotovoltaicEnergy_2014edition
http://slidepdf.com/reader/full/technology-roadmap-solar-photovoltaicenergy2014edition 44/60
42 Technology Roadmap Solar photovoltaic energy
Certification and normalisation
Customers in a great variety of climatic situations
should have confidence in the performance and thelongevity of the PV systems they acquire. A greater
coverage of internationally recognised standards
would be needed, based on a wider variety of
accelerated stress tests. Not all modules need to
withstand snow, hail or extreme heat, but some do.
In a large, mature global market, tailoring modules
to different environments would help keep costs
low while improving performance. This could
include adding indications of actual performance
in different ambient temperatures and different
air masses. Certification of developers, designers
and installers, regularly updated, may also improve
customer confidence. Finally, grid codes and other
regulation could facilitate smoother integration of
PV systems into grids.
Industry associations, research institutes,
government agencies and international
collaboration, notably through the PVPS IA, all
have important roles to play in certification and
normalisation.
Setting predictable financial
schemes and regulatory
frameworksDespite the recent cost reductions for PV systems,
financial incentives are still needed in most
markets to support the deployment of solar power
technologies, but at significantly lower levels
than just a few years ago: as the costs of systems
plummet, the gap between market prices and
LCOE of PV shrinks even faster. However, current
electricity market designs may not be conducive to
capital-intensive investments in power generation.
PV is a capital-intensive technology, highly sensitive
to investment risks, which are increased by a lack oflong-term price visibility.
In countries where PV markets are already mature,
however, a move towards greater market exposure
would ease integration of variable PV power, by
exposing PV systems to price signals that reflect the
different values of electricity, which depends on
time and location of generation, and on the level of
PV deployment already achieved
The appropriate market design and policy
framework must strike a delicate balance between
these conflicting objectives. In any case, retroactivechanges must be avoided.
This roadmap assumes a certain degree of
convergence of “soft costs” – costs other than
hardware such as panels, mounting systems
and inverters – towards the lowest end of the
range, represented by Germany, whose softs
costs are themselves expected to decrease
over time. However, in the United States, soft
costs in 2012 were virtually unchanged since
2010, at USD 3.32/W for residential systems,
USD 3.01/W for small commercial systems and
USD 2.10/W for large commercial systems.
They represented growing shares of the total
system prices, from 52% for large commercial
systems to 63.5% for residential systems,
while hardware costs were almost cut by half
(Friedman et al., 2013).
Ardani et al. (2013) have provided in the US
context a specific soft cost reduction roadmap
for the years 2013-2020, which aims at
identifying the cost reduction opportunities
to reach the targets of the SunShot Initiative
with respect to soft costs by 2020, which
are USD 0.65/W for residential systems, and
USD 0.44/W for commercial systems. The
interaction of significant market opportunities,
such as for the entire United States, with
the production of solar cells has significant
feedback and benefits, of which assessment
of the SunShot programme is an excellent
example (Mileva et al., 2013 ).
Box 5: “Soft costs” in the United States

8/9/2019 Technology Roadmap Solar PhotovoltaicEnergy_2014edition
http://slidepdf.com/reader/full/technology-roadmap-solar-photovoltaicenergy2014edition 45/60
43Policy, finance and international collaboration: actions and milestones
Policy options
There is a great variety of policy options to consider.
They might differ for large-scale, ground-based
systems, and for smaller-scale systems on (or close
to) buildings, as the latter tend to favour self-
consumption. Some policy options may also entail
transaction costs that are only acceptable for large
projects.
For utility-scale PV plants, feed-in tariffs (FiTs),
feed-in-premiums (FiPs), as well as auctions have
prevailed in Europe, Australia, Canada, Japan; in
the United States, long-term power-purchase
agreements (PPA) have been signed by utilities to
respond to renewable energy portfolio standards
(RPS), with or without solar carve-outs. They
have been complemented with production and/or investment tax credits. Auctions are common in
many emerging economies, from Brazil to South
Africa.
For distr ibuted PV, FiTs again, in Europe and Asia,
and net energy metering (NEM), notably in the
United States, have been so far the most widely
used policies, often in combination with various
fiscal incentives such as investment tax credits
(ITC) or production tax credits (PTC). In some
jurisdictions, 7 renewable energy certifcates (REC)
or solar REC (SREC) are a driving force.
As the cost of PV electricity has plummeted and
deployment volumes reached scale, both FiTs and
net metering are now under scrutiny.
Well-managed FiTs have proven effective in
stimulating deployment, while providing fair but
not excessive remuneration to investors, especially
in Germany, as suggests a comparison of the
remuneration for PV electricity under the German
FiT for small rooftops, and the LCOE of small system
(Figure 22).
7. Notably a few European countries and some US s tates (Delaware,
Massachusetts, Maryland, New Jersey, Ohio, Pennsylvania) and
the District of Columbia.
Attract investment to solar PV and reduce soft costs in new or emerging PV markets Time frames
1. Adopt or update medium and long term targets for PV deployment. 2015
2. Implement or update incentives and support mechanisms that provide
sufficient confidence to investors; create a stable, predictable financing
environment to lower costs for financing. These may notably include FITs and
auctions for long term PPAs.
2015-20
3. Implement priority dispatch to jump-start PV deployment in new or nascent
markets, until market maturity has sufficiently reduced costs for making
greater market exposure compatible with sound deployment.
2015-30
depending on countries
4. Facilitate distributed PV generation, either using feed-in tariffs
or net-metering.
2015-30
depending on countries
5. Identify the cost structure of current projects and anomalies by comparisonwith other jurisdictions, and implement specific actions to reduce anomalous
soft costs, depending on country’s circumstances.
2015-30
6. Work with financing circles and other stakeholders to reduce financing costs
for PV deployment.2015-30
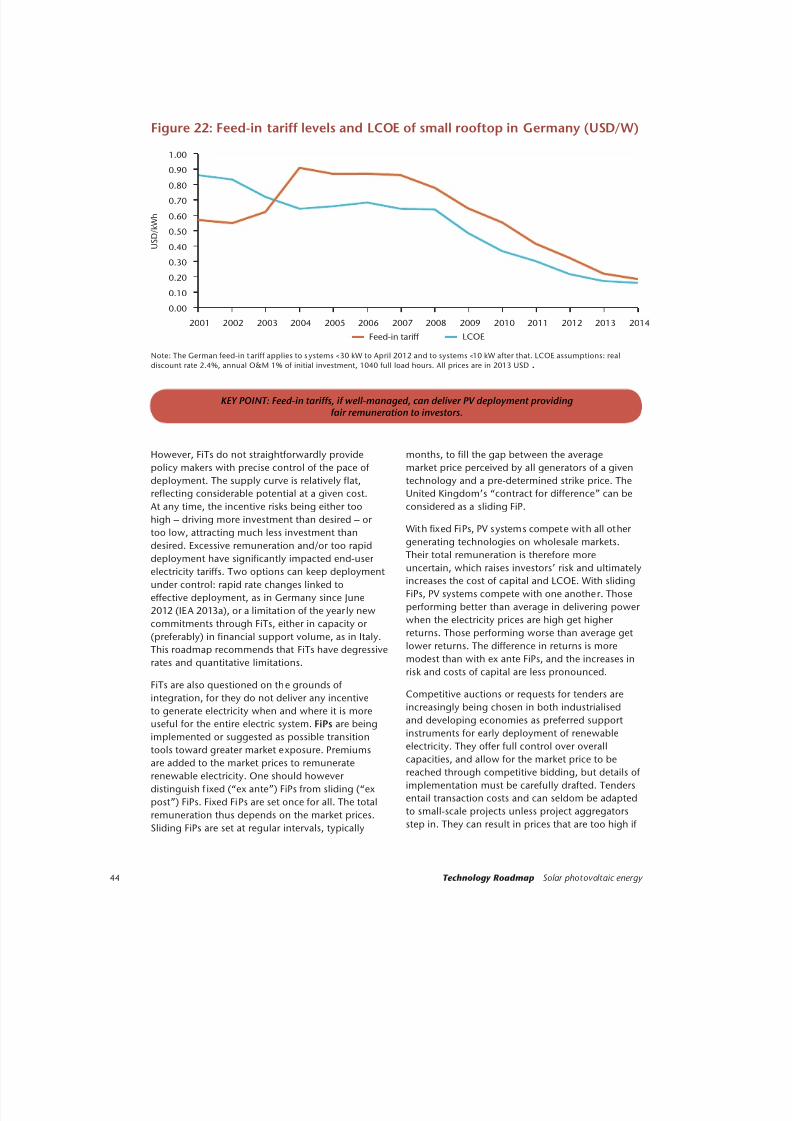
8/9/2019 Technology Roadmap Solar PhotovoltaicEnergy_2014edition
http://slidepdf.com/reader/full/technology-roadmap-solar-photovoltaicenergy2014edition 46/60
44 Technology Roadmap Solar photovoltaic energy
However, FiTs do not straightforwardly provide
policy makers with precise control of the pace of
deployment. The supply curve is relatively flat,reflecting considerable potential at a given cost.
At any time, the incentive risks being either too
high – driving more investment than desired – or
too low, attracting much less investment than
desired. Excessive remuneration and/or too rapid
deployment have significantly impacted end-user
electricity tariffs. Two options can keep deployment
under control: rapid rate changes linked to
effective deployment, as in Germany since June
2012 (IEA 2013a), or a limitation of the yearly new
commitments through FiTs, either in capacity or
(preferably) in financial support volume, as in Italy.
This roadmap recommends that FiTs have degressive
rates and quantitative limitations.
FiTs are also questioned on the grounds of
integration, for they do not deliver any incentive
to generate electricity when and where it is more
useful for the entire electric system. FiPs are being
implemented or suggested as possible transition
tools toward greater market exposure. Premiums
are added to the market prices to remunerate
renewable electricity. One should however
distinguish f ixed (“ex ante”) FiPs from sliding (“ex
post”) FiPs. Fixed FiPs are set once for all. The totalremuneration thus depends on the market prices.
Sliding FiPs are set at regular intervals, typically
months, to fill the gap between the average
market price perceived by all generators of a given
technology and a pre-determined strike price. TheUnited Kingdom’s “contract for difference” can be
considered as a sliding FiP.
With fixed FiPs, PV systems compete with all other
generating technologies on wholesale markets.
Their total remuneration is therefore more
uncertain, which raises investors’ risk and ultimately
increases the cost of capital and LCOE. With sliding
FiPs, PV systems compete with one another. Those
performing better than average in delivering power
when the electricity prices are high get higher
returns. Those performing worse than average get
lower returns. The difference in returns is moremodest than with ex ante FiPs, and the increases in
risk and costs of capital are less pronounced.
Competitive auctions or requests for tenders are
increasingly being chosen in both industrialised
and developing economies as preferred support
instruments for early deployment of renewable
electricity. They offer full control over overall
capacities, and allow for the market price to be
reached through competitive bidding, but details of
implementation must be carefully drafted. Tenders
entail transaction costs and can seldom be adapted
to small-scale projects unless project aggregators
step in. They can result in prices that are too high if
Figure 22: Feed-in tariff levels and LCOE of small rooftop in Germany (USD/W)
Note: The German feed-in t ariff applies to s ystems <30 kW to April 2012 and to systems <10 kW after that. LCOE assumptions: real
discount rate 2.4%, annual O&M 1% of initial investment, 1040 full load hours. All prices are in 2013 USD .
KEY POINT: Feed-in tariffs, if well-managed, can deliver PV deployment providingfair remuneration to investors.
0.00
0.10
0.20
0.30
0.40
0.50
0.60
0.70
0.80
0.90
1.00
2001 2002 2003 2004 2005 2006 2007 2008 2009 2010 2011 2012 2013 2014
U S D
/ k W h
Feed-in tariff LCOE
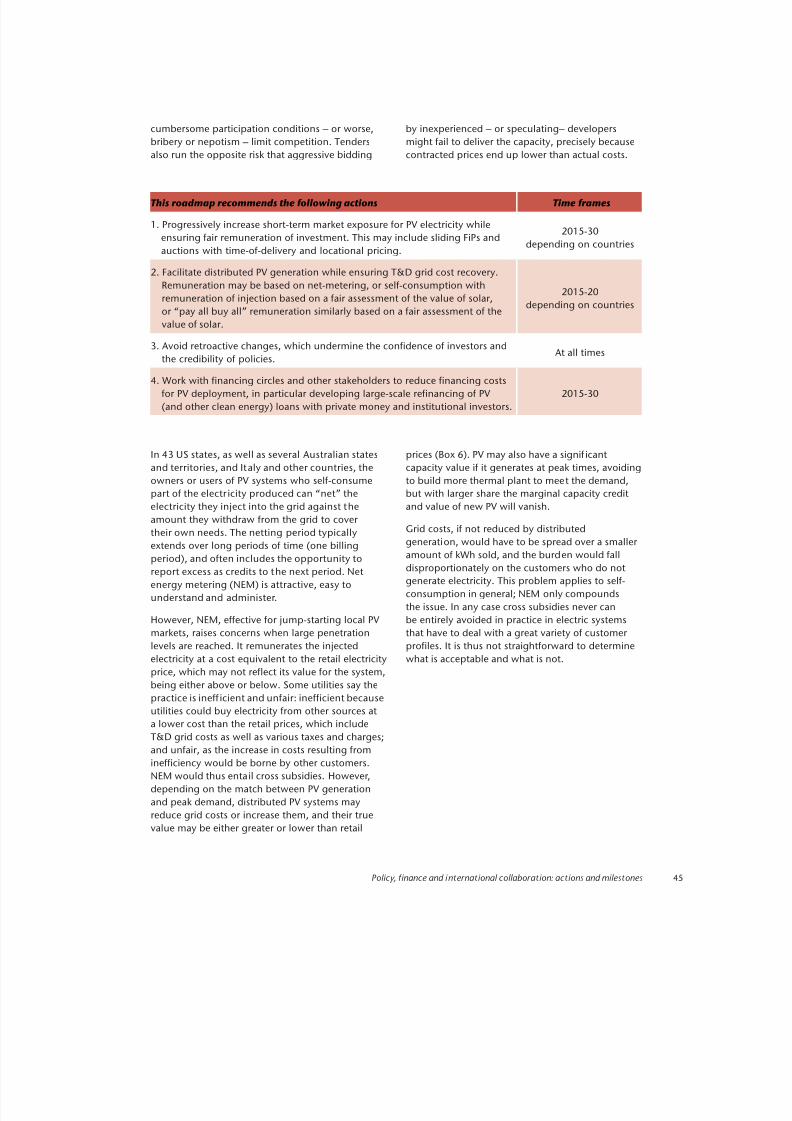
8/9/2019 Technology Roadmap Solar PhotovoltaicEnergy_2014edition
http://slidepdf.com/reader/full/technology-roadmap-solar-photovoltaicenergy2014edition 47/60
45Policy, finance and international collaboration: actions and milestones
cumbersome participation conditions – or worse,
bribery or nepotism – limit competition. Tenders
also run the opposite risk that aggressive bidding
by inexperienced – or speculating– developers
might fail to deliver the capacity, precisely because
contracted prices end up lower than actual costs.
This roadmap recommends the following actions Time frames
1. Progressively increase short-term market exposure for PV electricity while
ensuring fair remuneration of investment. This may include sliding FiPs and
auctions with time-of-delivery and locational pricing.
2015-30
depending on countries
2. Facilitate distributed PV generation while ensuring T&D grid cost recovery.
Remuneration may be based on net-metering, or self-consumption with
remuneration of injection based on a fair assessment of the value of solar,
or “pay all buy all” remuneration similarly based on a fair assessment of the
value of solar.
2015-20
depending on countries
3. Avoid retroactive changes, which undermine the confidence of investors and
the credibility of policies.At all times
4. Work with financing circles and other stakeholders to reduce financing costs
for PV deployment, in particular developing large-scale refinancing of PV
(and other clean energy) loans with private money and institutional investors.
2015-30
In 43 US states, as well as several Australian states
and territories, and Italy and other countries, the
owners or users of PV systems who self-consumepart of the electr icity produced can “net” the
electricity they inject into the grid against the
amount they withdraw from the grid to cover
their own needs. The netting period typically
extends over long periods of time (one billing
period), and often includes the opportunity to
report excess as credits to the next period. Net
energy metering (NEM) is attractive, easy to
understand and administer.
However, NEM, effective for jump-starting local PV
markets, raises concerns when large penetration
levels are reached. It remunerates the injectedelectricity at a cost equivalent to the retail electricity
price, which may not reflect its value for the system,
being either above or below. Some utilities say the
practice is ineff icient and unfair: inefficient because
utilities could buy electricity from other sources at
a lower cost than the retail prices, which include
T&D grid costs as well as various taxes and charges;
and unfair, as the increase in costs resulting from
inefficiency would be borne by other customers.
NEM would thus entail cross subsidies. However,
depending on the match between PV generation
and peak demand, distributed PV systems mayreduce grid costs or increase them, and their true
value may be either greater or lower than retail
prices (Box 6). PV may also have a signif icant
capacity value if it generates at peak times, avoiding
to build more thermal plant to meet the demand,but with larger share the marginal capacity credit
and value of new PV will vanish.
Grid costs, if not reduced by distributed
generation, would have to be spread over a smaller
amount of kWh sold, and the burden would fall
disproportionately on the customers who do not
generate electricity. This problem applies to self-
consumption in general; NEM only compounds
the issue. In any case cross subsidies never can
be entirely avoided in practice in electric systems
that have to deal with a great variety of customer
profiles. It is thus not straightforward to determinewhat is acceptable and what is not.
8/9/2019 Technology Roadmap Solar PhotovoltaicEnergy_2014edition
http://slidepdf.com/reader/full/technology-roadmap-solar-photovoltaicenergy2014edition 48/60
46 Technology Roadmap Solar photovoltaic energy
To reduce cross-subsidisation, and provide
market signals for enhancing the value of
electricity from PV, it has been suggested
to replace net energy metering (NEM) with
“pay all, buy all” systems. Producers also
being consumers, or “prosumers”, would be
remunerated for all energy produced, whether
self-consumed or injected into the grid,
while having to pay for all energy consumed,
whether self-produced or drawn from the
grid. This is at the root of so-called “value-of-
solar” (VOS) tariffs, which were pioneered by
the municipality-owned utility Austin Energy
(Texas) and first implemented at state level
in Minnesota in early 2014. However, the law
finally enacted differs from the proposed
legislation in several aspects, which makes
it closer to NEM. Instead of true payments,
PV owners would be credited against their
electricity bills (in value, if not in energy, as in
the Italian “Scambio sul Posto” system8). They
may not produce more than 120% of on-site
consumption. Furthermore, applying VOS is
not mandatory, but left at the discretion of the
utilities as an alternative to NEM.
The VOS components include “the value of
energy and its delivery, generation capacity,
transmission capacity, transmission and
distribution line losses, and environmental
value”. Analyses are based on an hourly PV
production time-series (Norris, Putnam and
Hoff, 2014). As a final step, the methodology
calls for the conversion of the 25-year levelised
value to an equivalent inflation-adjusted credit.
The utility would then use the first year value
as the credit for solar customers, and would
adjust each year to inflation. The preliminary
VOS is higher than the retail price of the largest
utility in the state – the difference reflects in
particular the environment cost component,
8. See www.gse.it/it/Ritiro%20e%20scambio/Scambio%20
sul%20posto/Pages/default.aspx
notably based on the federal social cost of
carbon (from USD 42 in 2015 to USD 79 in 2050
in constant 2012 USD).
For some analysts, VOS could offer a way out
of controversial NEM for the benefit of solar
developers, utilities and electricity customers
all together (e.g. Forrell, 2014). VOST is set for
25 years, giving greater certainty of return on
investment to solar owners, reducing financing
costs. Utilities may be better off as well, if their
retail rates continue to increase. However, the
opposite might hold true with more solar inthe mix, especially if time-of-use (TOU) pricing
is introduced (Darghouth, Barbose and Wiser,
2013). Other analysts or stakeholder groups
see VOS tariffs more as a way to perpetuate
a monopolistic business model of vertically
integrated utilities by preventing its erosion
through self-consumption (Smart, 2014).
If Minnesota’s utilities actually opt for VOST, an
interesting precedent may be set for others and
attenuate controversies about cross-subsidies.
However, at least at current penetration levels,
the largest difference between the level of
remuneration for PV between VOS tariff and
NEM may well be the inclusion of a carbon
value in PV remuneration. As directly pricing
carbon remains politically difficult, a negative
carbon price for non-emitting CO2 looks like a
pragmatic option. There is also significant merit
in the open public process of establishing and
discussing the value of solar – but i f it comes
close to the retail price, it could paradoxically
reinforce the legitimacy of NEM (Gilliam,
2014). Or it could help define a fair value
for the electricity injected into the grid – adefinition of “avoided costs” not limited to
wholesale electricity market prices – taking
self-consumption in account.
Box 6: Value-of-solar tariffs in Minnesota
NEM raises another issue: as it is usually
implemented with long netting periods, it doesnot encourage self-consumption, while self-
consumption incentivises load management. NEM
puts the burden of managing PV variability onto
the rest of the electricity system. Policy makers andregulators may want to implement progressive
changes to the electricity tariff structure in order

8/9/2019 Technology Roadmap Solar PhotovoltaicEnergy_2014edition
http://slidepdf.com/reader/full/technology-roadmap-solar-photovoltaicenergy2014edition 49/60
47Policy, finance and international collaboration: actions and milestones
to better recover fixed grid investment costs and
decrease system costs. Nevertheless, evolutions
should be conducted with care and strike a balance
between various risks.
Reducing the variable tariff and increasing the
fixed tariff on electricity bills is an option, but may
unfairly burden poorer consumers. It may also
lead some consumers to increase their electricity
consumption at peak times, raising grid and system
costs. Time-based pricing is preferable; it could
more efficiently limit the penetration of variable
renewables to what consumers can absorb, and
incentivise demand-side management and storage.
Just as TOU pricing could be used to incentivise load
management, time-of-delivery (TOD) pricing couldbe used to incentivise the management of injected
power (SEPA, 2013).
Whether through a combination of self-
consumption and FiTs or FiPs, NEM or VOST, as the
Department of Energy of the Republic of South
Africa (RSA DOE, 2013) recently noted, “given
the recent reduction in the cost of photovoltaic
generation it has become highly probable that
electricity consumers (commercial, residential,
and to some extent industrial) will begin installing
small-scale (predominantly roof-top) distributed
generation to meet some or all of their electricityrequirements. This penetration of distributed
generation may occur with or without the support
and approval of national and local government
entities, but it may be prudent to incentivise the
appropriate implementation in order to derive
social benefits from this development rather than a
potentially sub-optimal result because authorities
only considered the risks rather than the benefits.”
Retroactive laws
Except for criminal laws, retroact ive laws are not
unconstitutional in most jurisdictions. With respect
to fiscal decisions, they are even relatively common.
Limited retroactivity usually gets approved by
constitutional judges if the retroactive legislation
has a rational legislative purpose and is not arbitrary,
and if the period of retroact ivity is not excessive.
However, changes in the rules applicable to
investments already being made or in process
can have long-lasting deterrent effects on future
investment if they deeply modify the prospect for
economic returns. In the last few years in Europe,
many such retrospective legislative changes havebeen implemented, often specifically targeting PV
(EPIA, 2013), either because governments realised
their support policies had not kept pace with rapid
PV cost reductions, or because they wanted to
protect the profitability of other players in energy
markets in a context of economic and energy
stagnation. Some were not exclusive to PV or even
renewables, but affected them more as they could
not pass new taxes or fees on to customers. Some
were cancelled by judges, others confirmed, and
other cases are still pending. Some changes strongly
affected the revenues of asset-owners, pushing
some to bankruptcy or loan-repayment default,
while others were relatively minor. But all, arguably,
affected the confidence of investors, and therefore
they should be avoided.
Financing
The residential and, to a lesser degree, commercial
markets in the United States have experienced a
boom in third-party finance backed by tax equity;
industry data suggest third-party finance supported
nearly half of installed residential systems in 2011,
and about three-quarters in 2012. This type of
financing has a high cost of capital, which could
impede the competitiveness of PV (Ardani et al.,
2013). Costs of third party financing have been
assessed at USD 780/kW for a residential portfolio
and USD 670/kW for a commercial portfolio. On
the other hand, while this may or may not be the
best option from a customer viewpoint, third-party
financing supports customer uptake and rapid
market growth. As such it drives some PV cost
reduction (Feldman et al., 2013).
The US DOE’s National Renewable Energy
Laboratory (NREL) recently convened the Banking
on Solar working group to work with lenders
and other stakeholders to make it easier for
homeowners and businesses to secure loans for
installing rooftop PV systems. Banks, credit unionsand other lenders are increasingly offering loans
to enable homeowners and businesses to install
rooftop solar systems; however, the NREL has found
that significant barriers to accessing this growing
market still remain. The group’s principal efforts
centre on standardising contracts and underwriting
processes, as well as educating banks and
regulators about the risks and rewards of the
solar asset class.
Re-financing PV assets from private money looking
for long-term, safe but low-return investment could
help accelerate the deployment of PV and othercapital-intensive renewable energies (or energy
efficiency improvements).

8/9/2019 Technology Roadmap Solar PhotovoltaicEnergy_2014edition
http://slidepdf.com/reader/full/technology-roadmap-solar-photovoltaicenergy2014edition 50/60
48 Technology Roadmap Solar photovoltaic energy
This roadmap recommends the following actions Time frames
1. In countries (or smaller jurisdict ions, such as islands) with highly subsidised retail
electricity prices, progressively reduce these subsidies while developing alternative
energy sources and implementing more targeted financial support to help the poor.
2015
2. In countries with large numbers of people without electricity access, work with
stakeholders to develop and implement suitable business models for deploying off-
grid and mini-grid PV.
2015-20
Small-scale solar electricity systems, most often
PV, can bring considerable benefit to “baseof the pyramid” consumers, i.e. the poor in
poor countries. These people earn very small
amounts of money on an irregular basis, and
spend significant shares of it on dry batteries,
kerosene and other energy products. According
to some estimates, in rural areas those earning
USD 1.25 per day may spend as much as
USD 0.40 per day for energy.
Solar electricity is actually competitive, but up-
front costs, ranging from USD 30 for very small
PV systems to USD 75 000 for village mini-grids,
are usually too high, even if off-grid systems
of several MW are now economically and
technically feasible. The financing dimension of
solar energy deployment is perhaps most acute
in this case. Access to finance to support the
high up-front investment costs of solar systems
for rural electrification is scarce. Transactions
costs are very high, due to the disaggregated
nature of the projects. The risks for potential
third-party investors are also high, especially
given that financial institutions have little
experience on rural electrification projects, and
are not compensated by high rates of return.The main risks are:
z commercial risks: overall uncertainty,
very low experience and lack of specif ic
information on the present state of the
market make it hard to plan and deal with
the future
z customer behaviour: fraud, default on the
payment of bills
z operating risks: credit risk (default or
protracted default on payment from end-user)
z economic risks: inflation risk (affecting end-
user’s ability to pay), exchange rates
z risks affecting the distributor’s ability to
correctly bill the end-user
z political risks: lack of political stability will
affect the long-term assessment of policies to
support rural electrification projects and the
trustworthiness of investment contracts with
states that might default on payments.
Public authorities need to develop and promote
a clear political support scheme to draw on
the support of the private sector and allow thedevelopment of a safe business environment
for the dissemination of solar systems and mini-
grid installations.
Once the risk is alleviated, equity funds and
debt financers from commercial banks and
private funds can be tapped in decentralised
rural electrification projects.
Two distinct business models can then be
put in place, the retail model and the energy
service model. In the retail model, best adapted
to pico PV or solar home systems, the end-userbuys the solar system from a private company.
The cash or credit payment gives the buyer
full ownership of the system. Public funds,
multilateral or bilateral aid and the private
banking sector can offer loans to support the
banking institutions or the entity in charge of
rural electrification. Supporting the purchase
of the equipment by the private retailer and
the end user is essential, as is expanding the
network of retailers so they can supply the
energy poor with affordable solar systems.
Box 7: Financing off-grid solar electrification

8/9/2019 Technology Roadmap Solar PhotovoltaicEnergy_2014edition
http://slidepdf.com/reader/full/technology-roadmap-solar-photovoltaicenergy2014edition 51/60
49Policy, finance and international collaboration: actions and milestones
International collaboration
RD&D and normalisation
Greater co-ordination is needed between national
PV energy RD&D actors across the globe. Increased
collaboration among nations will ensure that
important issues are addressed according to areas
of national expertise, taking advantage of existing
RD&D activities and infrastructure.
Long-term harmonisation of PV energy research
agendas is also needed, as is the establishmentof international testing facilities for materials and
system components.
The current context of intense competition between
manufacturers may make international R&D
collaboration on PV cell and module technologies
more difficult than in the past. However, there
are many other areas in which international
collaboration provides inestimable benefits, in
particular those related to grid integration of both
utility-scale and distributed PV.
One example of international PV energy technologycollaboration is the IEA Implementing Agreement
for a Co-operative Programme on Photovoltaic
Power Systems (PVPS IA). The PVPS IA includes
technology experts from 24 countries and
the European Union, as well as the European
Photovoltaic Industry Association (EPIA), the
International Copper Association and the US-based
Solar Energy Industry Association (SEIA) and Solar
Electr ic Power Association (SEPA). Together PSPS IA
members have developed a research programme
focused on accelerating the development and
deployment of PV energy.
Its ongoing tasks include exchange and
dissemination of information on PV systems (Task1), very large-scale PV power generation systems
in remote areas (Task 8), deploying PV services for
regional development (Task 9), PV hybrid systems
with mini-grids (Task 11), PV environmental health
and safety (Task 12), performance and reliability
of PV systems (task 13), and high penetration of PV
systems in electricity grids (Task 14).
Support best practices in
developing economies
Vast PV potential exist s in many countr ies where
deployment has not begun or has barely begun.
OECD governments are encouraged to assist
Helping end-users break down their payments
into low monthly instalments is of paramountimportance. In some countries, a large network
of micro-financial institutions is present and
established. These financiers can act as an
efficient intermediary between governments,
retailers and international institutions to
promote and disseminate solar systems. They
know the creditworthiness of their clients and
can offer efficient end-user finance solutions
through micro-credit loans (even if the interest
rates are high, the default on payments is
usually very low). In Bangladesh, Grameen
Shakti was successful in offering micro loans
to distribute more than one million solar home
systems by November 2012 – twice the original
target. Installations are continuing at a rate of
2 000 per day.
In the energy service model, best adapted
to mini-grids, the company provides the
equipment to the end-user, who pays for the
service rendered. The ownership of the system
remains in the hands of the company. Theprivate operating company will need capital
to buy the necessary equipment. It can either
buy it using loans from the public or the private
sector or attract equity investors. To support
this intermediary, multilateral and bilateral aid
using concessional soft loans and grants from
donor funds can help decrease the high-front
investment of the private operating company
and reduce the burden on the end client. If a
fee is to be paid by the client, micro-financial
institutions can help spread the first payment.
Policy support could take the form of grants
to lower the price of systems to end-users in
the retail model. In the ser vice model, it could
take the form of subsidies to the company
or to the end-user to reduce the pr ice of
electricity and insure a minimum return on
investment to the investor.

8/9/2019 Technology Roadmap Solar PhotovoltaicEnergy_2014edition
http://slidepdf.com/reader/full/technology-roadmap-solar-photovoltaicenergy2014edition 52/60
50 Technology Roadmap Solar photovoltaic energy
developing economies in the early deployment of
policy frameworks for renewable energy, and to
exchange best practice in PV technology, system
integration, support mechanisms, environmental
protection and the dismantling of deployment
barriers. Multilateral development banks are an
important source of financing for joint development
efforts. Financing facilities can be designed on a
case-by-case basis to support differing needs. In
Africa and Asia, where millions of people lack access
to electricity, specific actions will be necessary to
help develop access through off-grid and mini-grid
PV systems.
The IEA secretariat is helping the Republic of South
Africa to develop its own comprehensive, solarenergy technology roadmap, with the support of
the German government’s development agency
GIZ (Deutsche Gesellschaft für Internationale
Zusammenarbeit). The IEA is also delivering
recommendations to the government of Morocco
with respect to the deployment of PV and other
renewables through an in-depth review of the
kingdom’s energy policy.
Assess and express the value of PV
energy in economic development
The clear expression of the value of PV energy, in
terms of climate protection and other development
challenges, such as rural electrification, is important
for accelerated PV deployment. Benefits in terms
of innovation, employment and environmental
protection should be accurately quantified and
shared with developing economy partners,
particularly in terms of their ability to contribute
towards the fundamental questions of adequateenergy provision and poverty alleviation.

8/9/2019 Technology Roadmap Solar PhotovoltaicEnergy_2014edition
http://slidepdf.com/reader/full/technology-roadmap-solar-photovoltaicenergy2014edition 53/60
51Roadmap action plan
The main milestones to enable PV generation to
reach a share of up to 16% of global electr icity in
2050 are:
z Governments establishing or updating targets for
PV deployment and ensuring a stable, predictable
financing environment and striving to reduce
“soft costs”.
z Industry further reducing PV costs through
technology improvements.
z Power system actors anticipating the deployment
of variable PV generation through evolution of
transmission and distribution grids, and the rest
of the power systems.
Near-term actions
for stakeholders
The most immediate actions are listed below by lead
actors.
Governments, including policy makers at
international, national, regional and local levels,
need to remove deployment barriers; establish
frameworks that promote close collaboration
between the PV industry and the wider powersector; and encourage private sector investment
alongside increased public investment.
Governments, taking the lead, should:
z Set or update long-term targets for PV
deployment, including short-term milestones
consistent with their national energy strategy
and with their contribution to the global climate
mitigation effort.
z Ensure a stable, predictable financing
environment. Where market arrangementsand cost competitiveness do not provide
sufficient incentives for investors, make sure that
predictable, long-term support mechanisms
exist; the level of support should, however, be
progressively reduced as markets mature and PV
system costs decrease.
z Address existing or potential barriers to
deployment, in particular from permitting and
connecting procedures.
z Ensure that a combination of self-consumption
and fair remuneration of injections of electricityinto the grids allows for deployment of
distributed PV generat ion, acknowledging the
value of solar PV generation, and outreach to
consumers about the options.
z Identify and provide a suitable level of public
funding for PV R&D, proportionate to the cost
reduction targets and potential of the technology
in terms of electricity production and CO2
abatement targets.
z Enable greater international R&D collaboration to
make best use of national competencies.
z In mature PV markets, progressively modify
the policy framework for new-built capacities,
as greater market exposure favours better
adaptation to the broader power system.
z In mature PV markets, consider progressive
modification of the rate structure for electricity
customers to ensure full recovery of fixed grid
costs while preserving incentives for deployment
of distributed PV generation, including time-of-
use and locational pricing.
PV Industry includes module manufacturers,
manufacturers of production lines and critical
inputs (e.g. purified silicon), PV system developers,
with strong collaboration with the research actors.
PV industry should:
z Further improve efficiency, performance ratios
and robustness of PV modules and systems.
z Reduce inputs and energy consumption and
identify substitutes for costly inputs, such as silver.
z Consider diversification of products to better suit
various environments.
z Develop low-cost, high-efficiency, bifacial, 1-sun
tandem cells.
z Train system designers and installers.
Power system actors include transmission
companies, system operators and independent
electricity sector regulators as established by
governments, as well as vertically integrated utilities
(where they exist). Their key role is to facilitate the
evolution of transmission and distribution grids
needed to connect utility-scale and distributed PV
systems (and other generators) and move electricity
to load centres. They also play a role in enabling
physical power markets to evolve in a manner that
Roadmap action plan

8/9/2019 Technology Roadmap Solar PhotovoltaicEnergy_2014edition
http://slidepdf.com/reader/full/technology-roadmap-solar-photovoltaicenergy2014edition 54/60
52 Technology Roadmap Solar photovoltaic energy
cost-effectively reduces the impact of variability and
increases the value of PV electricity while ensuring
security of supply.
Power system actors should:
z Develop wide-area transmission plans that
support interconnection, anticipating PV
deployment and the linking of regional power
markets, to ensure security of supply.
z Where not already available, implement grid
codes that will drive inverters to provide voltage
control and frequency regulation; collaborate
with neighbouring areas to enhance balancing.
z Advance progress on the evolution of marketdesign and system operating practices to enable
integration of large shares of variable renewable
energy, shortening gate closure times and trading
block length.
z Improve PV output forecasting and include online
data in control rooms of system operators.
z Develop methods to assess the need for
additional power system flexibility; carry out grid
studies to examine costs and benefits of high
shares of PV power.
z Exploit existing power system flexibility to
increase the value of RES.
z Anticipate further PV deployment through
increased flexibility of the rest of the system when
additional capacity investments are required.
Implementation
The implementation of this roadmap could
take place through national roadmaps, targets,
subsidies and R&D efforts. Based on it s energy and
industrial policies, a country could develop a set of
relevant actions.
Ultimately, international collaboration will be
important and can enhance the success of national
efforts. This roadmap update identifies approaches
and specific tasks regarding PV research,
development and deployment, financing, planning,
grid integration, legal and regulatory framework
development and international collaboration. It also
updates regional projections for PV deploymentfrom 2015 to 2050 based on ETP 2014. Finally, this
roadmap details actions and milestones to aid policy
makers, industry and power system actors in their
efforts to successfully deploy PV.
The PV roadmap is meant to be a process, one that
evolves to take into account new developments
from demonstration projects, policies and
international collaborative efforts. The roadmap
has been designed with milestones that the
international community can use to ensure that
PV development efforts are on track to achieve the
GHG emissions reductions required by 2050. Assuch, the IEA, together with government, industry
and other interested parties will report regularly
on the progress that has been achieved toward this
roadmap’s vision. For more information about the
PV roadmap inputs and implementation,
visit www.iea.org/roadmaps.

8/9/2019 Technology Roadmap Solar PhotovoltaicEnergy_2014edition
http://slidepdf.com/reader/full/technology-roadmap-solar-photovoltaicenergy2014edition 55/60

8/9/2019 Technology Roadmap Solar PhotovoltaicEnergy_2014edition
http://slidepdf.com/reader/full/technology-roadmap-solar-photovoltaicenergy2014edition 56/60
54 Technology Roadmap Solar photovoltaic energy
Ardani, K et al. (2013), Non-Hardware (“Soft”)
Cost-Reduction Roadmap for Residential and Small
Commercial Solar Photovoltaics, 2013-2020, NREL/TP-
7A40-59155, NREL, Golden, CO, United States.
Barbose, G. et al. (2013), Tracking the Sun VI, Berkeley
Laboratories, Berkeley, CA, United States.
Bnef (Bloomberg New Energy Finance)(2014), Solar
Spot Price Index, February.
Burger, B. (2014), Electricity Production from Solar and
Wind in Germany in 2013, Fraunhofer Institute for Solar
Energy Systems, Freiburg, Germany, January.
California ISO (Independent System Operator)
(2013),What the Duck Chart Tells Us About
Managing a Green Grid , Fast Facts, Folsom, CA,United Sates, www.caiso.com/Documents/
FlexibleResourcesHelpRenewables_FastFacts.pdf ,
accessed 4 June 2014.
Darghouth, N., G. Barbose and R. Wiser (2013),
Electricity Bill Savings from Residential Photovoltaic
Systems: Sensitivities to Changes in Future Electricity
Market Conditions, Ernest Orlando Lawrence Berkeley
National Laboratory, Berkeley, CA, January.
Denholm, P., M. Kuss and R.M. Margolis (2013), “Co-
benefits of large scale plug-in hybrid electric vehicle
and solar PV deployment”, Journal of Power Sources, vol2 n°36: 350-356.
De Wild-Scholten, M. (2013), “Energy payback time
and carbon footprint of commercial PV systems”, Solar
Energy Materials & Solar Cells, n°119: 296-305.
ENTSO-E (2012), Network Code “Requirements for
Generators” in View of the Future European Electricity
System and the Third Package Network Codes, available
at www.entsoe.eu/major-projects/network-code-
development/requirements-for-generators/.
EPIA (2013), Retrospective Measures at National Level
And their Impact on the Photovoltaic Sector , December,Brussels.
Farrell, J. (2014), Minnesota’s Value of Solar – Can a
Northern State’s New Solar Policy Defuse Distributed
Generation Battles? Institute for Local Self-Reliance,
April, www.ilsr.org.
Feldman, D., B. Friedman and R. Margolis (2013),
Financing, Overhead, and Profit: An in-depth Discussion
of Costs associated with Third-Party Financing of
Residential and Commercial PV Systems, NREL/TP-
6A20-60401, October.
Friedman, B. et al. (2014), Comparing PV Costs and
Deployment Drivers in the Japanese and U.S. Residential
and Commercial Markets, NREL/TP-6A20-60360,
February.
Friedman, B., et al. (2013), Benchmarking Non-Hardware
Balance-of-System (Soft) Costs for U.S. PV Systems, Using
a Bottom-Up Approach and Installer Survey – Second
Edition, NREL/TP-6A20-60412, October.
Fuller, M., S. Portis, S. and M.D. Kammen (2009),
“Towards a low-carbon economy: municipal financing
for energy efficiency and solar power”, Environment ,
51 (1), 22 – 32.
GE Energy (2012), Analysis of Cycling Costs in Western
Wind and Solar Integration Study , prepared for NREL,
19 March.
Giesler, B. et al. (2013), “Minimising PV electricity
curtailment due to grid management”, 28th European
Photovoltaic Solar Energy Conference and Exhibition,
Paris, September.
Gilliam, R. (2014), “NM value of solar process confirms
that net metering is a fair deal”, The Vote Solar Initiative,
March 21, http://votesolar.org accessed 25 April, 2014.
Goodrich, A.C., et al. (2013), “Assessing the drivers
of regional trends in solar PV manufacturing”, Energy
Environ. Sci., 2013, 6: 2811-2821.Green, M.A., et al. (2013), “Silicon wafer-based
Tandem Cells: the ultimate PV solution?” 28th European
Photovoltaic Solar Energy Conference and Exhibition,
Paris, September.
GSE (Gestore dei Servizi energetici) (2014), PV in Italy.
Generation Costs and Value Chain, Rome, May.
Hummel, P. and P. Lekander (2013), The Unsubsidised
Solar Revolution, UBS Investment Research – European
Utilities, 15 January.
IEA (2014a), Technology Roadmap: Solar Thermal
Electricity, 2014 Edition, OECD/IEA, Paris.
IEA (2014b), Energy Technology Perspectives 2014,
OECD/IEA, Paris.
IEA (2014c), Medium-Term Renewable Energy Market
Report 2014, OECD/IEA, Paris.
IEA (2014d), The Power of Transformation – Wind, Sun
and the Economics of Flexible Power Systems, OECD/IEA,
Paris.
IEA (2014e), Technology Roadmap: Energy Storage,
OECD/IEA, Paris.
IEA (2013a), Energy Policies of IEA Countries – Germany2013 Review, OECD/IEA, Paris.
References

8/9/2019 Technology Roadmap Solar PhotovoltaicEnergy_2014edition
http://slidepdf.com/reader/full/technology-roadmap-solar-photovoltaicenergy2014edition 57/60
55References
IEA (2013b), Technology Roadmap: Wind power, 2013
edition, OECD/IEA, Paris.
IEA (2012a), World Energy Outlook, OECD/IEA, Paris.
IEA (2012b), Technology Roadmap: Hydropower , OECD/
IEA, Paris.
IEA (2011), Solar Energy Perspectives, OECD/IEA, Paris.
IEA (2010a), Energy Technology Perspectives 2010,
OECD/IEA, Paris
IEA (2010b), Technology Roadmap: Solar Photovoltaic
Energy , OECD/IEA, Paris.
IEA (2010c), Technology Roadmap: Concentrating Solar
Power , OECD/IEA, Paris.
IEA (2008), Energy Technology Perspectives 2008, OECD/
IEA, Paris,
IPCC (2014), Climate Change 2013, The Physical Science
Basis, Working Group 1 Contribution to the Fifth
Assessment Report of the IPCC, www.ipcc.ch/report/
ar5/index.shtml
IPCC (Intergovernmental Panel on Climate Change)
(2012), IPCC Special Report on Renewable Energy Sources
and Climate Change Mitigation, Prepared by Working
Group III of the IPCC, Cambridge University Press,
Cambridge, United Kingdom and New York, NY.
ITRPV (International Technology Roadmap for
Photovoltaics) (2014), 2013 Results, Revision 1, Berlin,
www.ITRPV.net , 24 March.
JRC (Joint Research Centre (JRC)(2013), Assessment of
the European potential for pumped hydropower energy
storage, JRC Scientific and Policy Reports, European
Union, Petten, Netherlands.
Kost et al. (2013), Levelized Cost of Electricity Renewable
Energy Technologies, Fraunhofer Institute for Solar
Energy Systems, Freiburg, Germany, November.
Kreutzkamp, P. et al. (2013), Ancillary Services by Solar
PV – Capabilities and Costs of Provision, REserviceS, May,
www.reservices-project.eu.
Kurtz, S. (2013), Photovoltaic Module Reliability
Workshop 2013, NREL.
Lazar, J. (2014), Teaching the “Duck” to Fly”, Regulatory
Assistance Project, Montpellier, VT, January.
Lew, D. et al.(2013), Western Wind and Solar Integration
Study Phase 2,NREL/TP-5500-55588, NREL, September.
Mileva, A., et al. (2013) “SunShot Solar Power Reduces
Costs and Uncertainty in Future Low-Carbon Electricity
Systems,” Environmental Science & Technology , vol. 47n°16: 9053 – 9060. dx.doi.org/10.1021/es401898f.
Norris, B.L., M.C. Putnam and T.E. Hoff (2014),
Minnesota Value of solar: Methodology, Prepared by
Clean Power Research for Minnesota Department of
Commerce, 1 April.
Nowak, S. (2014), PV Systems: Developments and Issues,
presentation at IEA workshop, Paris, 3 February.
PVPS IA (2013), Trends 2013 in Photovoltaic Applications,
report IEA-PVPS T1-23:2013, OECD Publishing, Paris.
PVPS IA (Implementing Agreement for a Co-operative
Programme on Photovoltaic Power Systems) (2014), PV
Cost Data for the IEA, personal communication, January.
PVPS IA (Implementing Agreement for a Co-operative
Programme on Photovoltaic Power Systems) (2014),
PVPS Report Snapshot of Global PV 1992-2013, www.iea-pvps.org.
RED (RED electrica de España) (2014), The Spanish
Electricity System – Preliminary Report 2013, RED, Madrid,
Spain, www.ree.es/sites/default/files/downloadable/
preliminary_report_2013.pdf .
REN21 (Renewable Energy Policy Network for the 21st
Century), Renewables 2013 – Global Status Report, www.
ren21.net/ren21activities/globalstatusreport.aspx.
RSA DoE (2013), Integrated Resource Plan - 2010-2030
Update Report 2013, Pretoria, November.
SEPA (Solar Electric Power Association) (2013),
Ratemaking, Solar Value and Solar Net Energy Metering –
A Primer , SEPA, Washington D.C.
Sinke, W. (2014), Cost-effective High-efficiency 1-sun PV
Modules, presentation at the IEA workshop on solar
electricity roadmaps, 6 February.
SIWG (Smart Inverter Working Group)(2014),
Recommendations for Updating the Technical
Requirements for Inverters in Distributed Energy
Resources, January, Public Utility Commission, CA,
United States.
Smart, A. (2014), “VOST are value of solar taxes”,
The Alliance for Solar Choice, Huffingtonpost, www.
huffingtonpost.com/anne-smart/value-of-solar-power-
tariffs-_b_5051448.html accessed 25 April 2014.
SPV Market Research (2014), Photovoltaic manufacturer
Shipments: Capacity, Price & Revenues 2013/2013, Report
SPV-Supply2, April.
Zheng, C. and D. M. Kammen (2014), “An innovation-
focused roadmap for a sustainable global photovoltaic
industry”, Energy Policy n°67: 159-169.

8/9/2019 Technology Roadmap Solar PhotovoltaicEnergy_2014edition
http://slidepdf.com/reader/full/technology-roadmap-solar-photovoltaicenergy2014edition 58/60
www.iea.org/books
PDF versionsat 20% discount
nline
bookshop
Tel: +33 (0)1 40 57 66 90
E-mail: [email protected]
International Energy Agency
9 rue de la Fédération75739 Paris Cedex 15, France
Secure Sustainable Together

8/9/2019 Technology Roadmap Solar PhotovoltaicEnergy_2014edition
http://slidepdf.com/reader/full/technology-roadmap-solar-photovoltaicenergy2014edition 59/60
This document and any map included herein are without prejudice to the status
of or sovereignty over any territory, to the delimitation of international frontiers
and boundaries and to the name of any territory, city or area.
IEA Publications, 9 rue de la Fédération, 75739 PARIS CEDEX 15
TYPESETTED BY IE A AND PRINTED IN FRANCE BY CORLET, SEPTEMBER 2014
Front cover photo (large): © GraphicObsession
Front cover photo (small): © GraphicObsession
Back cover photo (large): Courtesy of Solar te
Back cover photo (small): © Dreamstime

8/9/2019 Technology Roadmap Solar PhotovoltaicEnergy_2014edition
http://slidepdf.com/reader/full/technology-roadmap-solar-photovoltaicenergy2014edition 60/60
2020
2025
2030
2014
2015
TechnologyRoadmap
SolarPhotovoltaic
Energy