Technology-Driven Foreign Direct Investment within the Global South
9
81 THE GLOBAL INNOVATION INDEX 2016 3: Technology-Driven Foreign Direct Investment within the Global South Technology-Driven Foreign Direct Investment within the Global South CRISTINA CHAMINADE, Lund University, Sweden LUCÍA GÓMEZ, Turku University, Finland CHAPTER 3 South–South technology invest- ments can be important for the devel- opment of the Global South because they can have advantages over the (more conventional) North–South investments. As recently argued in academic literature, the technol- ogy distance between the countries in South–South investments is potentially lower, thus facilitating the assimilation of the technology by the host country and enabling higher degrees of novelty.1 The last decade has seen a proliferation of anecdotal evidence indicating that a gradual change is taking place in the predominant paradigm of innova- tion: emerging economies are now playing a much more prominent role in the international flows of research and development (R&D). However, knowledge about technology-related investments in the Global South has been very limited, partly because technology- driven foreign direct investment (TFDI) from the Global South is a relatively new phenomenon, partly because it is still a very marginal phe- nomenon, and partly because global data on technology-related invest- ments were scarce. This chapter aims to move from anecdotal evidence to worldwide data to investigate the importance of international flows of R&D to, and particularly within, the Global South.2 Data on the number of foreign direct investments announced dur- ing the period 2003–14 as recorded in the fDi Markets database are used in this investigation. The fDi Markets is an online data- base maintained by the Financial Times; it collects information on all greenfield investment projects announced in publicly available information sources.3 These data are the main data source for the United Nations Conference on Trade and Development (UNCTAD)’s World Investment Report. The fDi Markets data trace the changes in cross-border greenfield investment projects by looking at the countries of origin and desti- nation as well as the nature of the investment (manufacturing versus technology-driven investments).4 This chapter follows Chaminade (2015) in defining ‘technology- driven foreign direct investments (TFDI)’ as including investments that are classified in fDi Markets as R&D; design, development, and testing (DDT); technology support centres; and information and com- munication technologies (ICTs) and infrastructure. This chapter is structured as fol- lows. First a condensed review of the literature on the effects of TFDI is provided to try to answer the ques- tion of why TFDI is important for development and why South–South TFDI would be particularly relevant for the growth and transformation of the Global South. Second, the chapter provides a summary of the general trends in TFDI worldwide, followed by a general overview of South–South TFDI. The data reveal that (1) TFDI South–South is a very marginal phenomenon; (2) it is clearly dominated by investments in ICTs; (3) it generally follows the same patterns as global TFDI; (4) important regional differences exist in the nature and geographical scope of the investments; and (5) it is driven by a handful of players who are active in many regions of the Global South. Finally, the chapter discusses the implications of some of the findings, particularly related to the critical role that multinationals from the Global South or emerging market multinationals (EMNEs) can play in bridging the technological gap between North and South. The importance of South–South TFDI for development The impact of foreign direct invest- ment (FDI) on firms and home regions has been largely studied in the international business literature. The main conclusion of this stream of literature is that FDI tends to have positive effects on firm productivity We would like to thank Professor Balaji Parthasarathy (IIITB-Bangalore, India) and Manuel Gonzalo (National University of General Sarmiento, Argentina) for providing us with examples of South–South TFDI. Similarly, our gratitude goes to Professor Davide Castellani and Professor Ronald Wall for the data on cross-border technology- driven investments.
Transcript of Technology-Driven Foreign Direct Investment within the Global South
81
TH
E G
LO
BA
L I
NN
OV
AT
ION
IN
DE
X 2
01
6
3: T
echn
olog
y-D
rive
n Fo
reig
n D
irec
t In
vest
men
t w
ithi
n th
e G
loba
l Sou
thTechnology-Driven Foreign Direct Investment within the Global South
CRISTINA CHAMINADE, Lund University, Sweden
LUCÍA GÓMEZ, Turku University, Finland
CHAPTER 3
South–South technology invest-
ments can be important for the devel-
opment of the Global South because
they can have advantages over the
(more conventional) North–South
investments. As recently argued in
academic literature, the technol-
ogy distance between the countries
in South–South investments is
potentially lower, thus facilitating
the assimilation of the technology
by the host country and enabling
higher degrees of novelty.1 The last
decade has seen a proliferation of
anecdotal evidence indicating that a
gradual change is taking place in the
predominant paradigm of innova-
tion: emerging economies are now
playing a much more prominent role
in the international f lows of research
and development (R&D).
However, knowledge about
technology-related investments in
the Global South has been very
limited, partly because technology-
driven foreign direct investment
(TFDI) from the Global South is a
relatively new phenomenon, partly
because it is still a very marginal phe-
nomenon, and partly because global
data on technology-related invest-
ments were scarce. This chapter aims
to move from anecdotal evidence to
worldwide data to investigate the
importance of international f lows
of R&D to, and particularly within,
the Global South.2
Data on the number of foreign
direct investments announced dur-
ing the period 2003–14 as recorded
in the f Di Markets database are
used in this investigation. The
f Di Markets is an online data-
base maintained by the Financial
Times; it collects information on
all greenf ield investment projects
announced in publicly available
information sources.3 These data are
the main data source for the United
Nations Conference on Trade and
Development (UNCTAD)’s World
Investment Report.
The fDi Markets data trace the
changes in cross-border greenf ield
investment projects by looking at
the countries of origin and desti-
nation as well as the nature of the
investment (manufacturing versus
technology-driven investments).4
This chapter follows Chaminade
(2015) in def ining ‘technology-
driven foreign direct investments
(TFDI)’ as including investments
that are classif ied in f Di Markets
as R&D; design, development, and
testing (DDT); technology support
centres; and information and com-
munication technologies (ICTs) and
infrastructure.
This chapter is structured as fol-
lows. First a condensed review of the
literature on the effects of TFDI is
provided to try to answer the ques-
tion of why TFDI is important for
development and why South–South
TFDI would be particularly relevant
for the growth and transformation
of the Global South. Second, the
chapter provides a summary of the
general trends in TFDI worldwide,
followed by a general overview of
South–South TFDI. The data reveal
that (1) TFDI South–South is a
very marginal phenomenon; (2) it
is clearly dominated by investments
in ICTs; (3) it generally follows
the same patterns as global TFDI;
(4) important regional differences
exist in the nature and geographical
scope of the investments; and (5) it
is driven by a handful of players who
are active in many regions of the
Global South. Finally, the chapter
discusses the implications of some of
the f indings, particularly related to
the critical role that multinationals
from the Global South or emerging
market multinationals (EMNEs) can
play in bridging the technological
gap between North and South.
The importance of South–South TFDI for
development
The impact of foreign direct invest-
ment (FDI) on f irms and home
regions has been largely studied in
the international business literature.
The main conclusion of this stream
of literature is that FDI tends to have
positive effects on firm productivity
We would like to thank Professor Balaji Parthasarathy (IIITB-Bangalore, India) and Manuel Gonzalo (National University of General Sarmiento, Argentina) for providing
us with examples of South–South TFDI. Similarly, our gratitude goes to Professor Davide Castellani and Professor Ronald Wall for the data on cross-border technology-
driven investments.
TH
E G
LOB
AL
INN
OV
AT
ION
IN
DE
X 2
01
6
3: T
echn
olog
y-D
rive
n Fo
reig
n D
irec
t In
vest
men
t w
ithi
n th
e G
loba
l Sou
th
82
because it lowers costs, while it has
a negative effect on the productiv-
ity and growth of the home region
because of its hollowing out effects.
However, the final positive effect on
the f irm or the potential negative
effect on the home region is contin-
gent on a variety of factors, notably
the absorptive capacity of the firm.
TFDI is a special case of FDI that
has been much less studied. In con-
trast with general FDI, existing evi-
dence of the impact of TFDI points
to its potential positive inf luence for
both the firm and the home region.
R&D offshoring can improve over-
all f irm R&D eff iciency;5 it does
this by reducing costs and acquiring
complementary knowledge needed
for innovation.6 At the same time,
TFDI is associated with significantly
higher productivity growth in the
home region than pure offshoring
in manufacturing,7 as well as with
increased innovation capabilities
in the host region.8 However, the
positive impacts are not automatic
and will ultimately depend on a
variety of factors such as the degree
of autonomy of the subsidiary;9 the
absorptive capacity and international
experience of the f irm;10 the pres-
ence of innovation-complementary
assets in the host region;11 and, more
generally, the institutional distance
between the host and the home
countries.12
A critical question is whether
the same pattern can be observed
for technology-driven investments
by multinationals from the Global
South—that is, emerging-market
multinationals (EMNEs). The lit-
erature on the technology-driven
investments of EMNEs is far less
prolif ic and much more recent, and
its impact is still being researched. In
a recent article, Awate et al. (2014)
compare the R&D internationaliza-
tion processes of a multinational
from a developed country with
that of an EMNE. They conclude
that the investments of the multi-
national from the North are made
for competence exploitation to
undertake adaptations or to realize
cost advantages, and that the R&D
conducted in the headquarters is
the main knowledge source of the
subsidiary. In contrast, EMNEs use
their technology investments abroad
to acquire knowledge and catch up,
while the technological level of their
headquarters is usually lower than
that of the subsidiary.13 Minin and
Zhang (2010), however, reach dif-
ferent conclusions when looking at
Chinese investments abroad. They
f ind that multinationals from the
South use different strategies accord-
ing to different learning goals, and
that some investments had the clear
purpose of exploiting technologies
developed elsewhere (in either a
developed or a developing country)
rather than acquiring knowledge.
The extent to which these
EMNEs can benefit from the R&D
and other technology-related invest-
ments abroad depends largely on their
absorptive capacity and previous
experience;14 in this respect, there
are no signif icant differences with
MNCs from the North. However,
some of the limitations of technol-
ogy spillovers derived from the
greater technology distance between
host and home countries in North–
South investments can partially dis-
appear in South–South investments:
the technology distance between the
countries is shorter, facilitating the
assimilation of the technology by the
host country,15 and achieving higher
degrees of novelty.16 Furthermore,
EMNEs seem to have a compara-
tive advantage with respect to their
counterparts in the North: they tend
to perform better in institutionally
different environments than multi-
nationals from the North or, in other
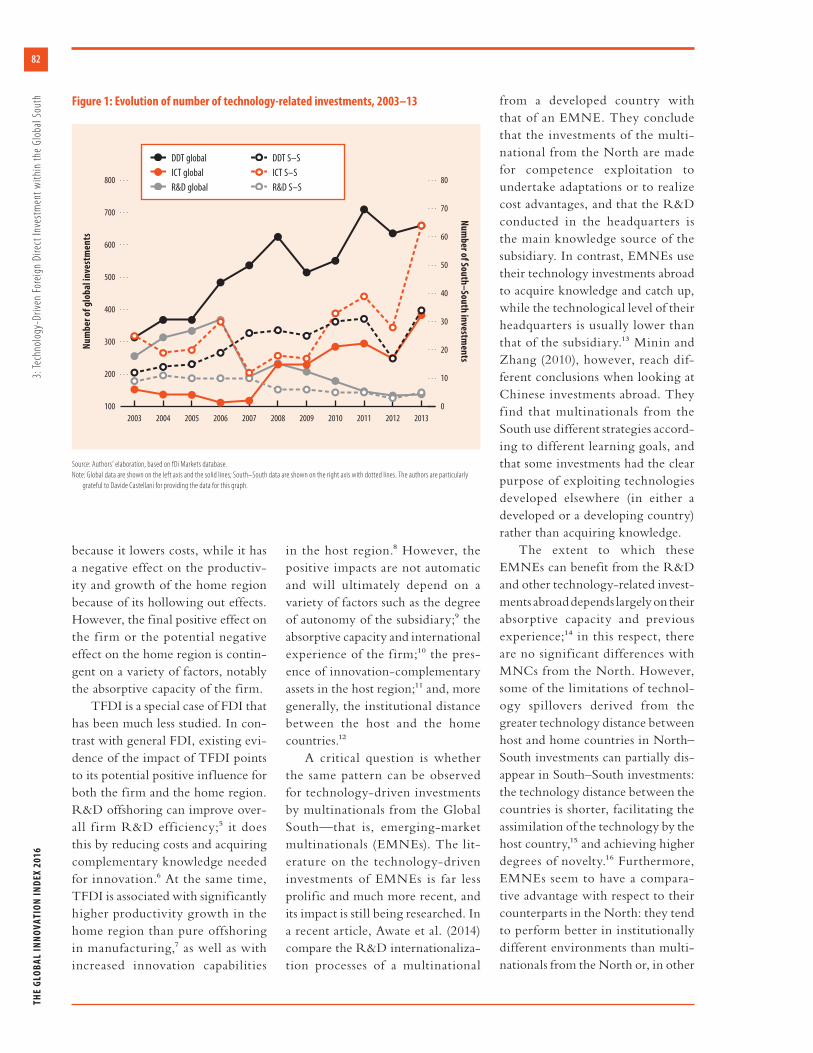
Figure 1: Evolution of number of technology-related investments, 2003–13
100
200
300
400
500
600
700
800
20132012201120102009200820072006200520042003
0
10
20
30
40
50
60
70
80
Nu
mb
er o
f g
lob
al in
vest
men
ts
Nu
mb
er of South
–Sou
th in
vestmen
ts
Source: Authors’ elaboration, based on fDi Markets database.
Note: Global data are shown on the left axis and the solid lines; South–South data are shown on the right axis with dotted lines. The authors are particularly
grateful to Davide Castellani for providing the data for this graph.
DDT global
ICT global
R&D global
DDT S–S
ICT S–S
R&D S–S
83
TH
E G
LO
BA
L I
NN
OV
AT
ION
IN
DE
X 2
01
6
3: T
echn
olog
y-D
rive
n Fo
reig
n D
irec
t In
vest
men
t w
ithi
n th
e G
loba
l Sou
thwords, the institutional distance
seems to matter less for emerging
multinationals.17
In sum, TFDI is generally asso-
ciated with positive impacts for the
firm and the host region. However,
its f inal impact depends on a vari-
ety of factors, including the degree
of autonomy of the subsidiary, the
absorptive capacity of the f irm, its
previous international experience,
and the institutional distance. The
same factors seem to play a role
in the R&D FDI of EMNEs with
one exception—they may be better
endowed to deal with institutional
distance. This is an aspect that will
be further discussed later in this
chapter.
Global trends in TFDI
Using the data from f Di Markets
from 2003 to 2013 and consider-
ing the number of investments by
destination worldwide, Castelli and
Castellani (2013) clearly identify
that the most important destinations
of technology-related projects, both
for applied research (DDT) and basic
research (R&D), were precisely two
countries in the Global South: China
and India. In the period indicated,
China received nearly 17% of all the
R&D cross-border investments and
12.8% of all DDT investment proj-
ects, while India was the recipient of
14.7% of the R&D and 20.3% of the
DDT investment projects.18
However, the investment growth
rate in those two countries for TFDI
has not been steadily growing over
the considered period: the number
of TFDI projects towards China
had dropped 2.3% and towards
India had dropped 7.3% by 2012.19
Interestingly, the data show that the
decline in TFDI projects towards
China and India has occurred in par-
allel with an increase in TFDIs from
China and India, including to the
Global South, as will be discussed
in the next section.
A critical question is whether the
observed decline ref lects a decreas-
ing importance of the Global South,
particularly of China and India as
countries of destination of TFDI,
or is the result of a general decline
in the number of TFDI projects
as a whole. As can be observed in
Figure 1, which compares the trends
in R&D, DDT, and ICT investments
worldwide with their South–South
counterparts, the general trend has
been a decline in the number of
R&D investments (dotted grey line)
while the number of DDT- and
ICT-related investments shows an
increase over the same period.
The graph clearly points out the
relative importance of TFDI South–
South with respect to the total num-
ber of technology related investments
globally: generally only 10% of the
total TFDI is South–South. In other
words, TFDI in the Global South is
still a rather marginal phenomenon.
Most of the EMNEs that invest in
technology tend to go North, prob-
ably for asset seeking, as predicted in
the literature.20
Figure 1 also shows that South–
South TFDI shows a general pat-
tern over time similar to that of
global TFDI. The clear exceptions
here are the investments in ICTs,
which exhibit a growth rate mark-
edly higher in the Global South
(although the number of projects
is still much lower). This result is
rather surprising—the ICT industry
has gradually moved to the South;21
in fact, some of the most important
hubs in the ICT industry are now
located in the Global South,22 and
some of the most important global
actors are also located there.23 The
implications are important. ICTs
comprise important enabling tech-
nologies and their dissemination and
widespread use in the Global South
(as discussed in previous GII reports)
can enable growth and development
through new products, new ser-
vices, new business models, better
information, and so on. This is very
important for less-developed regions
in the Global South, including many
African countries, as discussed next.
South–South investments: Geographical
patterns
The geographical patterns in South–
South TFDI can be useful in assess-
ing the actual extent and nature of
the phenomenon and their implica-
tions for development. The first step
in this process is to determine just
what patterns and main players are
evident from the data. This section
looks f irst at general patterns, and
then considers details of those pat-
terns for different regions.
Geographical patterns
Figure 1 shows that the majority
of South–South TFDI projects are
related to ICTs (47% of total South–
South TFDI) and DDT (36%).
Purely R&D investments comprise
only 10% of the total, while tech-
nical support centres are just 7%.
Taken together, the total number of
South–South TFDI grew at a 14%
rate between 2003 and 2014. DDT
and ICTs were the predominant
activities. R&D and technology
support centres decreased or were
scarce in most of the Southern world
regions.
The Southern world region
receiving the highest number of
inward TFDIs from the Global
South was Asia (51%). However, the
number of overall investments in this
region has remained almost the same
for the whole period, with a growth
rate of 1%. In contrast, investments
to Africa and Latin America and the
Caribbean grew at a much faster rate:
15% and 14%, respectively, almost

TH
E G
LOB
AL
INN
OV
AT
ION
IN
DE
X 2
01
6
3: T
echn
olog
y-D
rive
n Fo
reig
n D
irec
t In
vest
men
t w
ithi
n th
e G
loba
l Sou
th
84
catching up with the number of
investments to Asia. In fact, during
2014 Africa got more TFDIs than
any other Southern world region.
Outward TFDIs grew from
all regions during the considered
period, but especially from Africa at
a rate of 20% and Latin America and
the Caribbean at 14%. This growth
is mainly the result of f lows between
countries within the same world
region, as will be discussed next.
Latin America and the Caribbean is
the extreme case, with only 4% of
outward investments going to other
Southern world regions. Two f ig-
ures illustrate the geography of the
South–South TFDIs: Figure 2 shows
South–South DDT investments,
while Figure 3 shows South–South
ICT investments.
Africa
TFDI in Africa is almost exclusively
related to ICTs: investments in ICTs
represented 80% of all TFDI proj-
ects in the region.24 Furthermore,
these investments grew at a very
high rate between 2003 and 2014—
22%—reaching their peak in 2013.
Notably, half of these investments
came from within Africa (90% of
all ICT investments originating in
Africa remained in Africa), par-
ticularly from Mauritius and South
Africa—which, not surprisingly, are
also ranked 1st and 2nd, respectively,
for Sub-Saharan African countries in
the 2015 Global Innovation Index.
In contrast with the other
regions, Africa has few DDT invest-
ments, instead playing a prominent
role in the network of South–
South technology support centre
investments. Kenya is a major origin
node of investment f lows, together
with India and China. All of Kenya’s
investments were made outside
Africa, towards Asia and Latin
America and the Caribbean. Kenya’s
investment source is just one com-
pany—Comcraft group—which
has a network of subsidiaries in five
countries, primarily in software and
information technology services.
Latin America and the Caribbean
South–South TFDI to Latin America
and the Caribbean is characterized
by high volatility and discontinu-
ity.25 DDT and ICTs account for
90% of all Latin American and the
Caribbean TFDI.
For the period 2003–14, DDT is
the region’s fastest-growing TFDI
activity, with a growth rate of 17%.
Figure 2: Geography of cross-border investments in DDT within the Global South, 2003–14
Source: Authors’ elaboration, based on fDi Markets database.
1–3
22–66
8–21
4–7
1–4
26–82
10–25
5–9
ICT destination nodes
ICT source nodes

85
TH
E G
LO
BA
L I
NN
OV
AT
ION
IN
DE
X 2
01
6
3: T
echn
olog
y-D
rive
n Fo
reig
n D
irec
t In
vest
men
t w
ithi
n th
e G
loba
l Sou
th
About 60% of DDT investments to
Latin America and the Caribbean
came from Asia, 36% from within
Latin America and the Caribbean;
only 2% came from Africa and 2%
from the Middle East. From Asia,
investments came mainly from
India, with investments in software
and information technology services
in Latin America and the Caribbean
since 2003; and from China, with
more recent investments (since 2010)
in communications. Intra-regional
DDT investments originate primar-
ily from Argentina, Brazil, Chile,
and Mexico, with the biggest desti-
nation nodes in Brazil and Mexico.
These investments were mainly in
software and information technol-
ogy services–related projects.
The biggest TFDI activity in
Latin America and the Caribbean is
in ICTs. However, the growth rate
of ICT investments between 2003
and 2014 is a bit slower (12%) than
that of DDT investments. Most ICT
investments in the region (90%)
came from within Latin America
and the Caribbean. The biggest ori-
gin of these investments was Mexico
(the origin of half of all ICT invest-
ments); the main destinations were
Brazil and Colombia.
The Middle East
The Middle East was the world
region with the fewest South–South
TFDI projects,26 and no clear trend
could be identif ied for any of the
TFDI activities during the whole
period. Particular to TFDI to the
Middle East, when compared with
the other Southern world regions,
was the wider range of industry
sectors that it included (ICTs, met-
als, automotive, and life sciences).
Relevant aspects of TFDIs origi-
nating in the Middle East were the
prominence of investments related
to life sciences and the number of
ICT investments destined for Africa
(37%), which was equal to the num-
ber of investments remaining in the
Middle East.
Asia
The number of South–South TFDIs
to Asia grew at a slower rate, 1%,
than that of other world regions.27
This means that DDT, technology
support centres, and ICT invest-
ments grew at a rate of 3% and R&D
dropped at a 14% rate.
Despite this drop, Asia still dom-
inates the investment scene for R&D
in the Global South. Eighty percent
Figure 3: Geography of cross-border investments in ICTs within the Global South, 2003–14
Source: Authors’ elaboration, based on fDi Markets database.
12–21
5–11
1–4
1–7
32–46
18–31
8–17
ICT destination nodes
ICT source nodes
TH
E G
LOB
AL
INN
OV
AT
ION
IN
DE
X 2
01
6
3: T
echn
olog
y-D
rive
n Fo
reig
n D
irec
t In
vest
men
t w
ithi
n th
e G
loba
l Sou
th
86
of all South–South R&D f lows
took place within the Asian region.
The main origin of investments
was India, and the main destination
was China. R&D investments were
mainly in the communications and
pharmaceutical sectors.
Considering the whole period,
DDT has been the predominant
TFDI activity in Asia for South–
South investments. Asia was the
origin for 76% of DDT investment
f lows and the destination for 65% of
them; most investments had China
or India as either their origin or
destination.
Investments in ICTs in the region
rose quickly after 2011, so by the end
of the period this sector was receiving
the most South–South TFDI in the
Global South. Moreover, the num-
ber of ICT investments in 2014 was
twice that of 2013. India, Singapore,
and China were the main origins of
investment f lows; their main des-
tinations were in Asia (76%) and
Africa (23%).
India and China are, therefore,
not only the most important destina-
tion of cross-border TFDI projects
globally but also the most impor-
tant source of TFDIs to the Global
South, particularly DDT and ICTs.
The nature of the investments sug-
gest that EMNEs from China and
India follow predominantly an asset
exploiting strategy—that is, these
investments are more closely related
to the development and adaptation
of products to particular markets
that have been developed somewhere
else. An intriguing question worth
investigating in the future is whether
Chinese and Indian multinationals
may be acting as gatekeepers of tech-
nology from the North to the South,
as technology intermediaries.
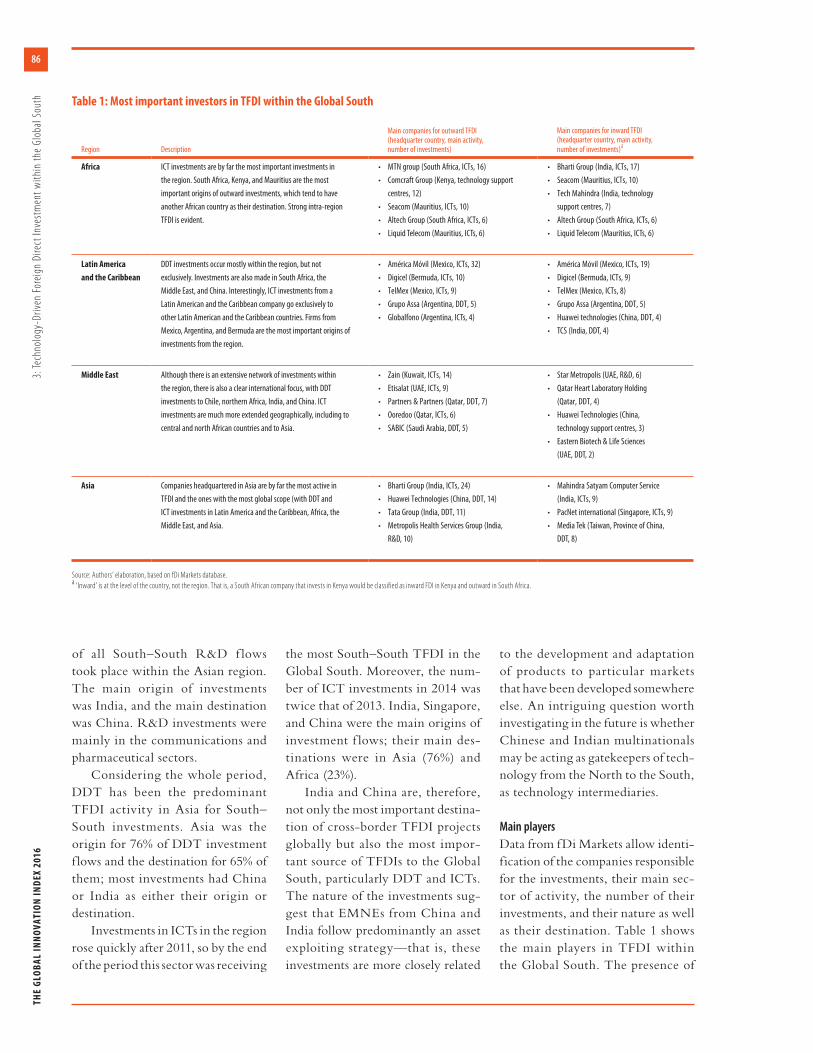
Main players
Data from fDi Markets allow identi-
fication of the companies responsible
for the investments, their main sec-
tor of activity, the number of their
investments, and their nature as well
as their destination. Table 1 shows
the main players in TFDI within
the Global South. The presence of
Region Description
Main companies for outward TFDI (headquarter country, main activity, number of investments)
Main companies for inward TFDI (headquarter country, main activity, number of investments)
a
Africa ICT investments are by far the most important investments in
the region. South Africa, Kenya, and Mauritius are the most
important origins of outward investments, which tend to have
another African country as their destination. Strong intra-region
TFDI is evident.
• MTN group (South Africa, ICTs, 16)
• Comcraft Group (Kenya, technology support
centres, 12)
• Seacom (Mauritius, ICTs, 10)
• Altech Group (South Africa, ICTs, 6)
• Liquid Telecom (Mauritius, ICTs, 6)
• Bharti Group (India, ICTs, 17)
• Seacom (Mauritius, ICTs, 10)
• Tech Mahindra (India, technology
support centres, 7)
• Altech Group (South Africa, ICTs, 6)
• Liquid Telecom (Mauritius, ICTs, 6)
Latin America
and the Caribbean
DDT investments occur mostly within the region, but not
exclusively. Investments are also made in South Africa, the
Middle East, and China. Interestingly, ICT investments from a
Latin American and the Caribbean company go exclusively to
other Latin American and the Caribbean countries. Firms from
Mexico, Argentina, and Bermuda are the most important origins of
investments from the region.
• América Móvil (Mexico, ICTs, 32)
• Digicel (Bermuda, ICTs, 10)
• TelMex (Mexico, ICTs, 9)
• Grupo Assa (Argentina, DDT, 5)
• Globalfono (Argentina, ICTs, 4)
• América Móvil (Mexico, ICTs, 19)
• Digicel (Bermuda, ICTs, 9)
• TelMex (Mexico, ICTs, 8)
• Grupo Assa (Argentina, DDT, 5)
• Huawei technologies (China, DDT, 4)
• TCS (India, DDT, 4)
Middle East Although there is an extensive network of investments within
the region, there is also a clear international focus, with DDT
investments to Chile, northern Africa, India, and China. ICT
investments are much more extended geographically, including to
central and north African countries and to Asia.
• Zain (Kuwait, ICTs, 14)
• Etisalat (UAE, ICTs, 9)
• Partners & Partners (Qatar, DDT, 7)
• Ooredoo (Qatar, ICTs, 6)
• SABIC (Saudi Arabia, DDT, 5)
• Star Metropolis (UAE, R&D, 6)
• Qatar Heart Laboratory Holding
(Qatar, DDT, 4)
• Huawei Technologies (China,
technology support centres, 3)
• Eastern Biotech & Life Sciences
(UAE, DDT, 2)
Asia Companies headquartered in Asia are by far the most active in
TFDI and the ones with the most global scope (with DDT and
ICT investments in Latin America and the Caribbean, Africa, the
Middle East, and Asia.
• Bharti Group (India, ICTs, 24)
• Huawei Technologies (China, DDT, 14)
• Tata Group (India, DDT, 11)
• Metropolis Health Services Group (India,
R&D, 10)
• Mahindra Satyam Computer Service
(India, ICTs, 9)
• PacNet international (Singapore, ICTs, 9)
• Media Tek (Taiwan, Province of China,
DDT, 8)
Source: Authors’ elaboration, based on fDi Markets database. a ‘Inward’ is at the level of the country, not the region. That is, a South African company that invests in Kenya would be classified as inward FDI in Kenya and outward in South Africa.
Table 1: Most important investors in TFDI within the Global South

87
TH
E G
LO
BA
L I
NN
OV
AT
ION
IN
DE
X 2
01
6
3: T
echn
olog
y-D
rive
n Fo
reig
n D
irec
t In
vest
men
t w
ithi
n th
e G
loba
l Sou
th
the same f irm as both inward and
outward FDI indicates that the larg-
est majority of investments are inside
the region. Furthermore it is possible
to see that the majority of the South–
South TFDI is in the hands of a
handful of EMNEs, many of which
belong to large business groups.28
That is the case for the Indian Bharti
Group, Tech Mahindra, and the
Tata Group, as well as the Chinese
Huawei and ZTE. The most domi-
nant players in Latin America and
the Caribbean are América Móvil,
Digicel, TelMex, and Grupo Assa,
while Seacom, Altech, and Liquid
Telecom are the corresponding
African ones.
Towards a win-win strategy
The low number of EMNEs con-
ducting TFDI in the Global South
signif icantly limits the ability to
draw evidence-based conclusions
about the benef its of South–South
TFDI for both the host and the home
countries beyond what was discussed
in the second section of this chap-
ter. This limitation is particularly
evident with regard to long-term
benefits such as upgrading skills and
building up innovation capabilities,
since South–South TFDI is still in
its infancy. However, anecdotal evi-
dence collected from company web-
sites and local newspapers suggests
that a win-win strategy is possible,
with potential benef its both from
the host and the home economies
in line with what the literature sug-
gests. Box 1 provides some examples
of perceived benefits of South–South
TFDI in R&D, DDT, and ICTs and
in different regions of the Global
South.
Asset creation strategies by
EMNEs may provide access to spe-
cialized and complementary knowl-
edge—such as software capabilities
Box 1: Company views on the potential benefits of South–South TFDI
Four examples from companies from three
different Southern world regions are pre-
sented here to illustrate different character-
istics of the potential benefit impact, for both
home and host countries, of South–South
TFDI to product innovation. See also Table 1.
Huawei Technologies opened its first
research and development (R&D) centre
outside China in Bangalore, India, in 1999. 1
The R&D centre in Bangalore has been the
source of some innovative solutions that
later were commercialized worldwide. A
prime example of innovative solutions
developed at its Bangalore centre is the
single-RAN (radio access network) launched
in 2006. This network enabled the telecom-
munication operators to ‘graft’ the latest
technologies—such as a 3G or an LTE (long-
term evolution) service—onto their net-
works. Another product being developed
at the Bangalore centre, which has already
been launched in Latin America and the
Caribbean, is the technology that enables
Voice over LTE. These and many other
examples highlight the key role the Indian
subsidiary is playing in the innovation strat-
egy of Huawei. This has also led the Chinese
giant to further invest US$170 million in R&D
in India in 2015, as has been announced in
the press. 2 This case underlines the impor-
tance of South–South TFDI where both
the host and the home countries benefit
from each other. Although China leveraged
the Indian pool of engineering talent and
expertise to increase its global presence,
India managed to attract investment in R&D
and to engage its workforce to develop
cutting-edge technology.
ZTE Corporation is a Chinese multi-
national telecommunications equipment
and systems manufacturer, headquartered
in Shenzhen, China, founded in 1985. 3 ZTE
has an R&D unit in Bangalore, India, in which
the company has invested approximately
US$40 million in the second half of the
last decade. 4 ZTE India’s R&D enables it to
tap into Bangalore´s world-class expertise
in software. 5 The Bangalore unit develops
a range of telecommunication software
applications in the mobile value-added
service (VAS) space such as caller ring-back
tones, call centre applications, and billing
solutions. 6 The investment in India for R&D
accounts for 10% to 15% of the total global
R&D spend of ZTE. 7
Globant is an Argentina-based infor-
mation technology and software develop-
ment company with four investments in
Latin America, including a DDT investment
in Uruguay. The investments in Uruguay are
considered to be crucial to the development
of innovative software products for the
company. 8
Seacom, an ICT company headquar-
tered in Mauritius, is behind some of the
largest investments in ICTs in Africa, such
as the instalment of the first undersea fibre
optics cable along the east coast of Africa.
The Internet cable is believed to have had a
major impact on the business environment,
for example in Nairobi, Kenya, by cutting
the costs of Internet access by 120% while
increasing access by a factor of 100. 9
Notes
1 Fu, 2015.
2 Sen, 2013.
3 Fu, 2015.
4 live mint, 2010.
5 Chaminade and Vang, 2008.
6 Parbat, 2012.
7 live mint, 2010.
8 Gonzalo et al., 2013.
9 Turak, 2016.

TH
E G
LOB
AL
INN
OV
AT
ION
IN
DE
X 2
01
6
3: T
echn
olog
y-D
rive
n Fo
reig
n D
irec
t In
vest
men
t w
ithi
n th
e G
loba
l Sou
th
88
for ICT telecommunication equip-
ment manufacturers—thus enabling
the development of new products
and services. Those innovations
can subsequently be exploited in a
variety of countries, including other
countries in the Global South, thus
generating economies of scale and
further spillovers. An example of
this is seen in the Huawei Voice over
LTE, developed in Bangalore and
commercialized in Latin America
and the Caribbean and Europe; see
Box 1). Innovations developed in
the South and for the South may be
able to better address the needs of
developing countries and may thus
provide EMNEs with a compara-
tive advantage over the MNEs from
the North. Additionally, these cases
suggest that TFDI may lead to an
upgrading of skills in the host coun-
try (like Huawei in Bangalore).
ICT-related investments—espe-
cially those related to ICT infra-
structure, which characterize the
lion’s share of TFDIs into Africa and
Latin America and the Caribbean—
can also have a signif icant impact
on the host country. ICTs and their
development potential in develop-
ing countries are generally analysed
from three different perspectives.29
First, host countries can catch up to
advanced economies and improve
both their competitiveness capabili-
ties and those of local business orga-
nizations in global markets. ICT
investments are considered to impact
the skills and productivity of labour
as well as to generate more rapid
and long-run economic growth.30
Second, both host countries and
home countries see the emergence
of new ICT-based business models,
expanding their information bases
and lowering the cost of access to
information. And third, the impact
of ICTs is evident as they transform
socioeconomic conditions through
governments going digital in host
countries, thus improving social ser-
vices delivery, increasing democratic
participation, and improving access
to public services.31
In sum, the analysis of South–
South TFDI investments using fDi
Markets data reveals that, although
South–South TFDI is in its infancy,
it is generally growing and is clearly
dominated by investments in ICTs.
Although the limited number of
investments prevents the drawing
of conclusions on their impact, par-
ticularly in the long term, anecdotal
evidence suggests that a win-win
strategy is possible. This strategy has
a positive impact both in the host and
home countries in the form of access
to complementary knowledge, bet-
ter f it of technological solutions to
specif ic development challenges,
economies of scale, development of
skills and capabilities and basic ICT
infrastructure; these in turn can
impact development trajectories.
However, grasping the potential
benef its is not automatic and will
depend on a variety of factors, such
as the absorptive capacity and inter-
national experience of the firm, the
presence of a dynamic innovation
environment in the host country,
and, more generally, the institu-
tional distance between the host and
the home countries.
Notes
1 For a discussion of the assimilation of
technology by the host country, see Amighini
and Sanfilippo, 2014; for a discussion of
higher degrees of novelty, see Harirchi and
Chaminade, 2014.
2 The ‘Global South’ is hereby defined
following the Brandt Report (1980) as
considering all countries in the Southern
hemisphere except Australia, Japan, the
Republic of Korea, and New Zealand. The
Brandt North–South divide is considered
to be not only a geographical but also a
socioeconomic and political division.
3 Information about the fDi Markets database is
available at http://www.fdimarkets.com/.
4 It is important to stress that the data do not
cover other forms of investments, such as
mergers and acquisitions, which may be
quite important in certain industries.
5 Dachs et al., 2012.
6 Criscuolo, 2009; Dachs et al., 2012;
Ebersberger et al., 2011.
7 Castellani and Pieri, 2013.
8 Fu, 2008.
9 Giuliani et al., 2014.
10 Schmiele, 2012.
11 Fu, 2008.
12 Coe et al., 2009.
13 Buckley et al., 2014.
14 Buckley et al., 2014; Fu, 2008.
15 Amighini and Sanfilippo, 2014.
16 Harirchi and Chaminade, 2014.
17 Demir and Hu, 2015.
18 In the same period, the USA was the recipient
of 7.9% of the R&D projects and the same
percentage for DDT projects.
19 Castelli and Castellani, 2013. The growth
trend has not been equal for all types of
projects. For example, the number of R&D
investments that had China or India as the
main country of destination dropped at a
rate of –17% for China and –18% for India. At
the same time, the number of DDT projects
has increased for China at a 4% rate and
decreased for India at the same rate, 4%.
20 Awate et al., 2014; Buckley et al., 2014.
21 Ernst, 2009; Yeung, 2007.
22 Chaminade and Vang, 2008.
23 Lee and Malerba, 2014.
24 African countries involved in South–South
TFDI from 2003 to 2014 according to the fDi
Markets database include Algeria, Angola,
Botswana, Burkina Faso, Burundi, Cameroon,
Central African Republic, Chad, Congo, Côte
d’Ivoire, Democratic Republic of Congo,
Djibouti, Egypt, Ethiopia, Gabon, Gambia,
Ghana, Guinea Bissau, Kenya, Lesotho,
Madagascar, Malawi, Mauritius, Morocco,
Mozambique, Namibia, Niger, Nigeria,
Rwanda, Seychelles, Sierra Leone, Somalia,
South Africa, South Sudan, Sudan, Swaziland,
Tanzania, Tunisia, Uganda, Zambia, and
Zimbabwe.
25 Latin America and the Caribbean countries
involved in South–South TFDI from 2003
to 2014 according to fDi Markets database
include Argentina, Barbados, Brazil, Chile,
Colombia, Costa Rica, the Dominican
Republic, Ecuador, El Salvador, Guadeloupe,
Guatemala, Guyana, Haiti, Honduras, Jamaica,
Martinique, Mexico, Nicaragua, Panama,
Peru, Puerto Rico, Turks and Caicos Islands,
Uruguay, and Venezuela.

89
TH
E G
LO
BA
L I
NN
OV
AT
ION
IN
DE
X 2
01
6
3: T
echn
olog
y-D
rive
n Fo
reig
n D
irec
t In
vest
men
t w
ithi
n th
e G
loba
l Sou
th 26 The Middle East countries involved in South–
South TFDI from 2003 to 2014 according to
fDi Markets database include Bahrain, the
Islamic Republic of Iran, Iraq, Jordan, Kuwait,
Lebanon, Oman, the State of Palestine, Qatar,
Saudi Arabia, the United Arab Emirates, and
Yemen.
27 Asian economies involved in South–South
TFDI from 2003 to 2014 according to fDi
Markets database include Afghanistan,
Armenia, Bangladesh, Brunei, Cambodia,
China, Hong Kong (China), India, Indonesia,
Lao People’s Democratic Republic, Macao
(China), Malaysia, Maldives, Mongolia,
Myanmar, Nepal, the Democratic People’s
Republic of Korea, Pakistan, the Philippines,
Singapore, Sri Lanka, Taiwan (China), Thailand,
and Viet Nam.
28 The concentration of investments in
a handful of companies can be the
consequence of the high costs of FDI in
comparison to other mechanisms to access
knowledge to innovate—only large firms,
mostly part of a larger business group, can
afford this form of mechanism to access
knowledge.
29 Avgerou, 2008.
30 See Szirmai, 2012, and World Bank, 2016, for a
discussion of more rapid growth; see Pradhan
et al., 2015, for a discussion of long-run
economic growth.
31 UNCTAD, 2015.
References
Amighini, A. and M. Sanfilippo. 2014. ‘Impact of
South–South FDI and Trade on the Export
Upgrading of African Economies’. World
Development 64: 1–17.
Avgerou, C. 2008. ‘Information Systems in
Developing Countries: A Critical Research
Review’. Journal of Information Technology
23: 133–46.
Awate, S., M. Larsen, and R. Mudambi. 2014.
‘Accessing vs Sourcing Knowledge:
A Comparative Study of R&D
Internationalization between Emerging
and Advanced Economy Firms’. Journal of
International Business Studies 46 (1): 63–86.
Brandt, W. 1980. North-South: A Programme for
Survival: The Report of the Independent
Commission on International Development
Issues. Cambridge, MA: MIT Press.
Buckley, P. J., S. Elia, and M. Kafouros. 2014.
‘Acquisitions by Emerging Market
Multinationals: Implications for Firm
Performance’. Journal of World Business 49
(4): 611–32.
Castellani, D. and F. Pieri. 2013. ‘R&D Offshoring
and the Productivity Growth of European
Regions’. Research Policy 42 (9): 1581–94.
Castelli, C. and D. Castellani. 2013. ‘The
Internationalisation of R&D: Sectoral and
Geographic Patterns of Cross-Border
Investments’. Economia e Politica Industriale
1: 127–43.
Chaminade, C., ed. 2015. Technology-Driven FDI by
Emerging Multinationals in Europe. Lund: Lund
University.
Chaminade, C. and J. Vang. 2008. ‘Globalisation
of Knowledge Production and Regional
Innovation Policy: Supporting Specialized
Hubs in the Bangalore Software Industry’.
Research Policy 37 (10): 1684–96.
Coe, D. T., E. Helpman, and A. W. Hoffmaister. 2009.
‘International R&D Spillovers and Institutions’.
European Economic Review 53 (7): 723–41.
Cornell University, INSEAD, and WIPO. 2015.
The Global Innovation Index 2015: Effective
Innovation Policies for Development, eds. S.
Dutta, B. Lanvin, and S. Wunsch-Vincent.
Ithaca, Fontainebleau, Ithaca, and Geneva:
Cornell, INSEAD, and WIPO.
Criscuolo, P. 2009. ‘Inter-Firm Reverse Technology
Transfer: The Home Country Effect of R&D
Internationalization’. Industrial and Corporate
Change 18 (5): 869–99.
Dachs, B., F. Kampik, T. Scherngell, D. Hanzl-Weiss,
G. Hunya, N. Foster, S. Leitner, R. Stehrer,
and W. Urban. 2012. Internationalisation of
Business Investments in R&D and Analysis of
Their Economic Impact. Brussels: European
Commission.
Demir, F. and C. Hu. 2015. ‘Institutional Differences
and the Direction of Bilateral Foreign Direct
Investment Flows: Are South–South Flows
any Different than the Rest?’ The World
Economy. doi: 10.1111/twec.12356.
Ebersberger, B., S. J. Herstad, E. Iversen, E. Kirner,
and O. Som. 2011. Open Innovation in Europe:
Effects, Determinants and Policy. PRO INNO
Europe: INNO-Grips II Report. Brussles:
European Commission, DG Enterprise and
Industry.
Ernst, D. 2009. A New Geography of Knowledge in
the Electronics Industry? Asia’s Role in Global
Innovation Networks. Honolulu: East-West
Center.
Fu, X. 2008. ‘Foreign Direct Investment, Absorptive
Capacity and Regional Innovation
Capabilities: Evidence from China’. Oxford
Development Studies 36 (1): 89–110.
———. 2015. China´s Path to Innovation. Cambridge:
Cambridge University Press.
Giuliani, E., S. Gorgoni, C. Günther, and R. Rabellotti.
2014. ‘Emerging versus Advanced Country
MNEs Investing in Europe: A Typology
Of Subsidiary Global–Local Connections’.
International Business Review 23 (4): 680–91.
Gonzalo, M., J. Federico, S. Drucaroff, and H. Kantis.
2013. ‘Post-Investment Trajectories of Latin
American Young Technology-Based Firms:
An Exploratory Study’. Venture Capital: An
International Journal of Entrepreneurial Finance
15 (2): 115–33.
Harirchi, G. and C. Chaminade. 2014. ‘Exploring the
Relation Between the Degree of Novelty of
Innovations and User–Producer Interaction
Across Different Income Regions’. World
Development 57: 19–31.
Lee, K. and F. Malerba. 2014. ‘Changes in Industry
Leadership and Catch-up by the Latecomers:
Toward a Theory of Catch-Up Cycles’. Paper.
Available at http://policydialogue.org/files/
events/Keun_Kee_Paper_2.pdf.
live mint. 2010. ‘ZTE to Invest Rs200 cr on R&D;
Bullish on 3G’. live mint, 14 April. Available
at http://www.livemint.com/Companies/
ziztAghupw9ykYqac3sswI/ZTE-to-invest-
Rs200-cr-on-RampD-bullish-on-3G.html.
Minin, A. D. and J. Zhang. 2010. ‘An Exploratory
Study on International R&D Strategies of
Chinese Companies in Europe’. Review of
Policy Research 27 (4): 433–55.
Parbat, K. 2012. ‘XTE India Scales Down R&D
Operations to Cut Costs; Jobs Losses at
Bangalore Unit on Cards.’ The Economic
Times, 27 October. Available at http://articles.
economictimes.indiatimes.com/2012-10-27/
news/34765204_1_zte-india-cui-liangjun-zte-
corporation.
Pradhan, R. P., M. B. Arvin, and N. R. Norman.
2015. ‘The Dynamics of Information
and Communications Technologies
Infrastructure, Economic Growth, and
Financial Development: Evidence from Asian
Countries’. Technology in Society 42: 135–49.
Schmiele, A. 2012. ‘Drivers for International
Innovation Activities in Developed and
Emerging Countries’. The Journal of
Technology Transfer 37 (1): 98–123.
Sen, S. 2013. ‘Chindian Cheer: Chinese Telecom
Giant Huawei’s Bangalore Research Centre
Is Proving a Crucial Resource in its Global
Telecom Battle’. Business Today, 27 October.
Available at http://www.businesstoday.in/
magazine/features/huawei-bangalore-centre-
key-role-focus-functioning/story/199114.html.
Szirmai, A. 2012. ‘Industrialisation as an Engine of
Growth in Developing Countries, 1950–2005’.
Structural Change and Economic Dynamics 23
(2012): 406–20.
Turak, N. 2016. ‘Can Africa Build the ICT
Infrastructure it Needs to Fulfil its Potential?’
FDIIntelligence, 23 February. Available at
http://www.fdiintelligence.com/Locations/
Middle-East-Africa/Can-Africa-build-the-ICT-
infrastructure-it-needs-to-fulfil-its-potential.
UNCTAD (United Nations Conference on Trade and
Development). 2015. ‘Digital Development’.
Report of the Secretary-General. Commission
on Science and Technology for Development,
Eighteenth Session, Geneva, 4–8 May.
Available at http://unctad.org/meetings/en/
SessionalDocuments/ecn162015d2_en.pdf.
World Bank. 2016. World Development Report 2016:
Digital Dividends. Washington, DC: World
Bank.
Yeung, H. W.-C. 2007. ‘From Followers to Market
Leaders: Asian Electronics Firms in the Global
Economy’. Asia Pacific Viewpoint 48 (1): 1–25.