BP Foreign Direct
21
1 Foreign Direct Investment: Global Trend and Pattern - M. TAHLIL AZIM * Abstract Foreign Direct Investment (FDI) has registered a tremendous growth for the last four decades. The stock of FDI reached about $3.2 trillion in 1996 rising from $2 trillion in 1993 and $1 trillion in 1987. Sales and assets of TNCs are growing faster than world GDP, exports and gross fixed capital formation. The increased flows of FDI indicates the growing internationalisation and integration of economic activities around the globe. At the same time, with the gradual change in the motives for FDI as well as the shift of some location specific advantages from developed to developing countries, the patterns and trends of FDI has been experiencing a significant change in recent past. The motives of the TNCs have been shifting from more conventional resource or market seeking to efficiency or strategic asset seeking. Comparative cost factor has become the principal driving force for international production. Remarkable changes are also visible in the forms and sectorial pattern of international investments. The purpose of this paper is to trace the trajectory of the recent flows of FDI from global and regional perspective and to explore the reasons behind the prevailing trend and patterns. SECTION - 1 Introduction The Phenomenon of Foreign Direct Investment (FDI), 1 as a manifestation of internationalisation and integration of economic life constitutes the basic dictum of our age. With the tremendous explosion in transportation and communication technology along with continuous liberalisation of trade and investment regime, the national economies are undoubtedly becoming steadily more integrated as cross border flows of trade, investment and financial capital increase. The centre of gravity of internationalisation of business activity is shifting from trade to factors of production themselves. Sourcing, manufacturing and assembling outside the home countries in the form of FDI are very much common today. The total value of international production of a company with foreign operations is already set to exceed by far the exports of goods from major countries. This process of internationalisation is going on and seems to have no limit. With the growing importance of FDI, recently it has been receiving serious attention as a Multinational Corporate phenomenon on the one hand * The author is Assistant Professor, Department of Management, and Chittagong University. The views expressed in this article are author's own. 1 'FDI' is defined as an investment, which is made to acquire a lasting interest in an enterprise operating in an economy other than that of the investor, the investor's purpose being to have an effective voice in management of the enterprise. In addition to equity participation, it also includes other non-equity forms of investment and control, such as, sub-contracting, manage- ment contract, turnkey agreement, franchising, licensing and product sharing. [IMF, ( 1993), "Balance of Payment manual"].
-
Upload
rahul-chakrabarti -
Category
Documents
-
view
244 -
download
0
description
Its on fdi
Transcript of BP Foreign Direct
1
Foreign Direct Investment: Global Trend and Pattern
- M. TAHLIL AZIM∗
Abstract
Foreign Direct Investment (FDI) has registered a tremendous growth for the last four decades.The stock of FDI reached about $3.2 trillion in 1996 rising from $2 trillion in 1993 and $1 trillion in1987. Sales and assets of TNCs are growing faster than world GDP, exports and gross fixed capitalformation. The increased flows of FDI indicates the growing internationalisation and integration ofeconomic activities around the globe. At the same time, with the gradual change in the motives forFDI as well as the shift of some location specific advantages from developed to developing countries,the patterns and trends of FDI has been experiencing a significant change in recent past. The motivesof the TNCs have been shifting from more conventional resource or market seeking to efficiency orstrategic asset seeking. Comparative cost factor has become the principal driving force forinternational production. Remarkable changes are also visible in the forms and sectorial pattern ofinternational investments. The purpose of this paper is to trace the trajectory of the recent flows ofFDI from global and regional perspective and to explore the reasons behind the prevailing trend andpatterns.
SECTION - 1
Introduction
The Phenomenon of Foreign Direct Investment (FDI),1 as a manifestation of
internationalisation and integration of economic life constitutes the basic dictum of our age.
With the tremendous explosion in transportation and communication technology along with
continuous liberalisation of trade and investment regime, the national economies are
undoubtedly becoming steadily more integrated as cross border flows of trade, investmentand financial capital increase. The centre of gravity of internationalisation of business activity
is shifting from trade to factors of production themselves. Sourcing, manufacturing and
assembling outside the home countries in the form of FDI are very much common today. The
total value of international production of a company with foreign operations is already set to
exceed by far the exports of goods from major countries. This process of internationalisation
is going on and seems to have no limit. With the growing importance of FDI, recently it has
been receiving serious attention as a Multinational Corporate phenomenon on the one hand
∗ The author is Assistant Professor, Department of Management, and Chittagong University. The views expressed in thisarticle are author's own.1 'FDI' is defined as an investment, which is made to acquire a lasting interest in an enterprise operating in an economy otherthan that of the investor, the investor's purpose being to have an effective voice in management of the enterprise. In additionto equity participation, it also includes other non-equity forms of investment and control, such as, sub-contracting, manage-ment contract, turnkey agreement, franchising, licensing and product sharing. [IMF, ( 1993), "Balance of Payment manual"].
2
and the policies of the Government on the other. At the same time the world has been
experiencing a significant change in the pattern and trend in the flows of FDI. The motives of
the TNCs have been shifting from more conventional resource or market seeking to
efficiency or strategic asset seeking. Production in the host country is no more strictly related
to the resource base or the market size of the economy. Comparative cost factor has become
the principal driving force of such production. Forms of international investment also haveremarkably changed from Greenfield investment to merger & acquisition and from
majority/wholly owned to low equity or non-equity forms of participation. Along with these
waves, the hegemony of developed countries as the source and recipient of FDI is gradually
eroding in favour of their developing counterparts, especially East and South-East Asia. The
objective of this paper is to trace the trajectory of the recent flows of FDI from global and
regional perspective and to explore the reasons behind the prevailing trend and patterns. The
discussion of the issue was mainly centred around the groups of countries based on both state
of economic development (according to IMF/WB) and geographical location. However, the
outstanding performance of individual countries was also discussed separately. The
discussion took place in several sections. Section 2 highlighted the overall trend of FDI in the
world economy, section 3 focused on the FDI outflow and the centres of origin, section 4
covered FDI inflow or destination of FDI, section 5 highlighted the recent shifts in the formof foreign investment in the global economy, section 6 was meant to pore some lights on
sectoral pattern of FDI. Finally in section 7, there would be a brief conclusion about the
general trend and pattern of FDI in the world economy. In our analysis we used data till 1996.
Besides, the study was plagued with some limitations. It did not cover any in-depth economic
analysis of world-wide trend and pattern of FDI. Nor it was meant to justify any theoretical
approach of FDI available in existing literature. The analysis was mainly based on previous
studies on FDI in both developed and developing countries.
SECTION - 2
Overall Trend of FDI
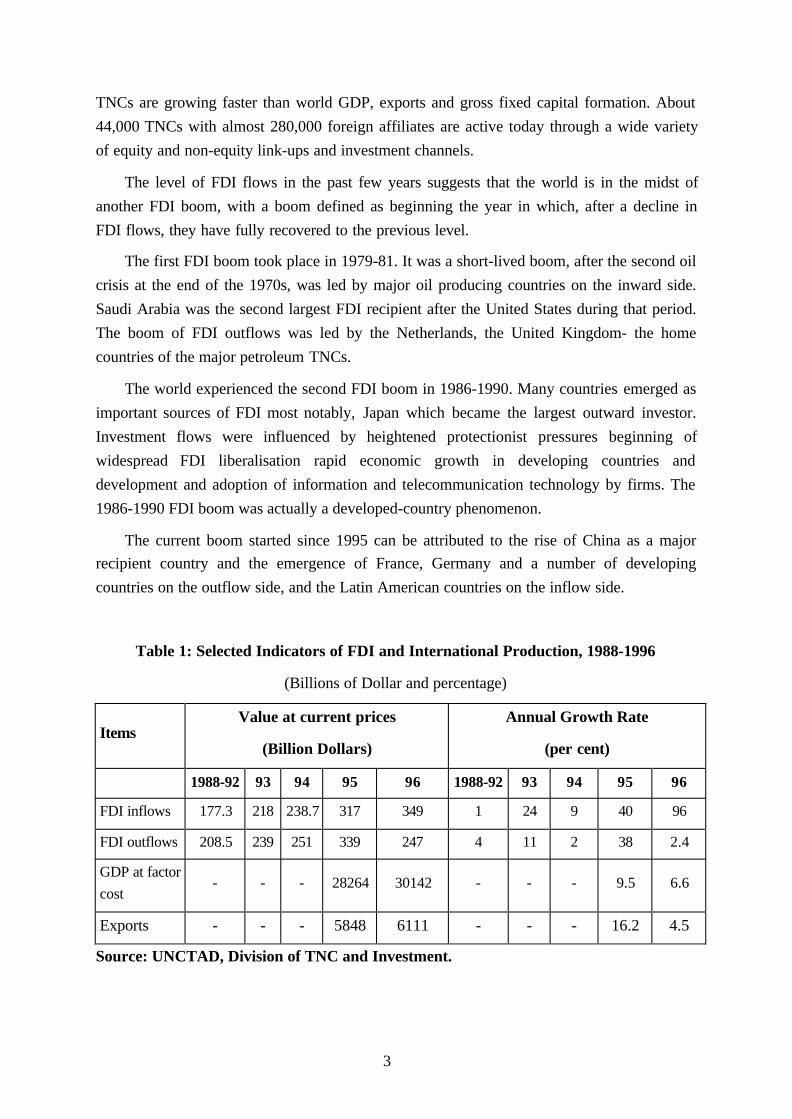
FDI has been growing rapidly in the recent past, faster, indeed than international trade
(See Table 1). FDI flows2 set a new record in 1996 with an increase in inflow by 10% to
$349 billion while outflows rose by 2% to $ 347 billion. Growth rate of FDI inflow (10.3%)exceeded the growth in the nominal value of world GDP and international trade, which
expanded by 6.6% and 4.5% in 1996 respectively. The stock of FDI reached about $ 3.2
trillion in 1996, rising from $ 2 trillion in 1993 and $ 1 trillion in 1987. Sales and assets of
2 Foreign direct investment inflows and outflows comprise capital received and invested in an FDI enterprise respectively.There are three components in FDI: equity capital, reinvested earnings and intra-company loans. (a) Equity capital is theforeign direct investor's purchase of shares of an enterprise in a country other than its own. (b) Retained earnings comprisethe direct investor's share of earnings not distributed as dividends by affiliates or earnings not remitted to the investor. Suchretained profits by affiliates are reinvested. (c) Intra-company loan or intra-company debt transactions refer to short or longterm borrowings and lending of funds between direct investors and affiliate enterprise. (World Investment Report, 1997, P.295).
3
TNCs are growing faster than world GDP, exports and gross fixed capital formation. About
44,000 TNCs with almost 280,000 foreign affiliates are active today through a wide variety
of equity and non-equity link-ups and investment channels.
The level of FDI flows in the past few years suggests that the world is in the midst of
another FDI boom, with a boom defined as beginning the year in which, after a decline in
FDI flows, they have fully recovered to the previous level.
The first FDI boom took place in 1979-81. It was a short-lived boom, after the second oil
crisis at the end of the 1970s, was led by major oil producing countries on the inward side.
Saudi Arabia was the second largest FDI recipient after the United States during that period.
The boom of FDI outflows was led by the Netherlands, the United Kingdom- the home
countries of the major petroleum TNCs.
The world experienced the second FDI boom in 1986-1990. Many countries emerged as
important sources of FDI most notably, Japan which became the largest outward investor.
Investment flows were influenced by heightened protectionist pressures beginning of
widespread FDI liberalisation rapid economic growth in developing countries and
development and adoption of information and telecommunication technology by firms. The
1986-1990 FDI boom was actually a developed-country phenomenon.
The current boom started since 1995 can be attributed to the rise of China as a majorrecipient country and the emergence of France, Germany and a number of developing
countries on the outflow side, and the Latin American countries on the inflow side.
Table 1: Selected Indicators of FDI and International Production, 1988-1996
(Billions of Dollar and percentage)
ItemsValue at current prices
(Billion Dollars)
Annual Growth Rate
(per cent)
1988-92 93 94 95 96 1988-92 93 94 95 96
FDI inflows 177.3 218 238.7 317 349 1 24 9 40 96
FDI outflows 208.5 239 251 339 247 4 11 2 38 2.4
GDP at factorcost
- - - 28264 30142 - - - 9.5 6.6
Exports - - - 5848 6111 - - - 16.2 4.5
Source: UNCTAD, Division of TNC and Investment.
4
SECTION - 3
FDI Outflows : Centre of Origin
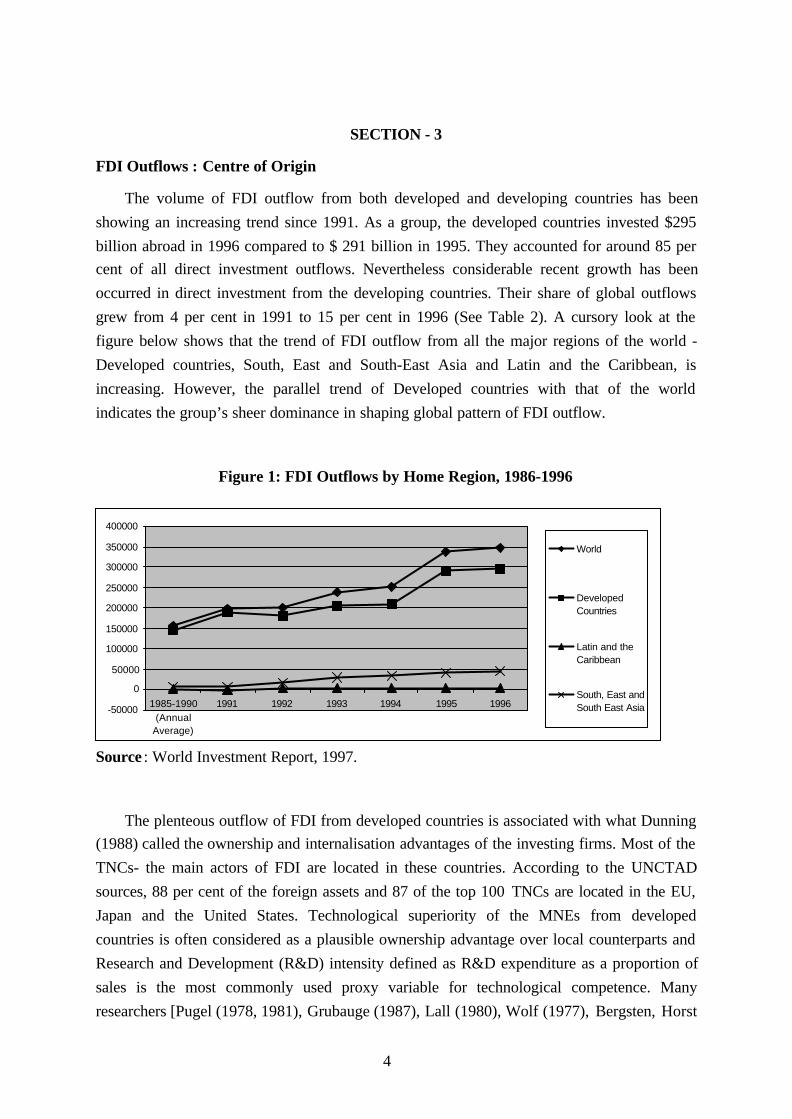
The volume of FDI outflow from both developed and developing countries has been
showing an increasing trend since 1991. As a group, the developed countries invested $295
billion abroad in 1996 compared to $ 291 billion in 1995. They accounted for around 85 percent of all direct investment outflows. Nevertheless considerable recent growth has been
occurred in direct investment from the developing countries. Their share of global outflows
grew from 4 per cent in 1991 to 15 per cent in 1996 (See Table 2). A cursory look at the
figure below shows that the trend of FDI outflow from all the major regions of the world -
Developed countries, South, East and South-East Asia and Latin and the Caribbean, is
increasing. However, the parallel trend of Developed countries with that of the world
indicates the group’s sheer dominance in shaping global pattern of FDI outflow.
Figure 1: FDI Outflows by Home Region, 1986-1996
Source : World Investment Report, 1997.
The plenteous outflow of FDI from developed countries is associated with what Dunning(1988) called the ownership and internalisation advantages of the investing firms. Most of the
TNCs- the main actors of FDI are located in these countries. According to the UNCTAD
sources, 88 per cent of the foreign assets and 87 of the top 100 TNCs are located in the EU,
Japan and the United States. Technological superiority of the MNEs from developed
countries is often considered as a plausible ownership advantage over local counterparts and
Research and Development (R&D) intensity defined as R&D expenditure as a proportion of
sales is the most commonly used proxy variable for technological competence. Many
researchers [Pugel (1978, 1981), Grubauge (1987), Lall (1980), Wolf (1977), Bergsten, Horst
-50000
0
50000
100000
150000
200000
250000
300000
350000
400000
1985-1990(Annual
Average)
1991 1992 1993 1994 1995 1996
World
DevelopedCountries
Latin and theCaribbean
South, East andSouth East Asia
5
and Moran (1978) for US FDI, Pearce (1989) for world leading MNEs and Swedenbourg
(1979) for Swedish FDI] found very clear positive relationship between R&D intensity and
overseas production by the companies. Moreover, technological innovation based on R&D
often gives rise to undesire to protect this advantage through internalisation rather than to
risk unauthorised diffusion through licensing, which in turn motivates FDI.
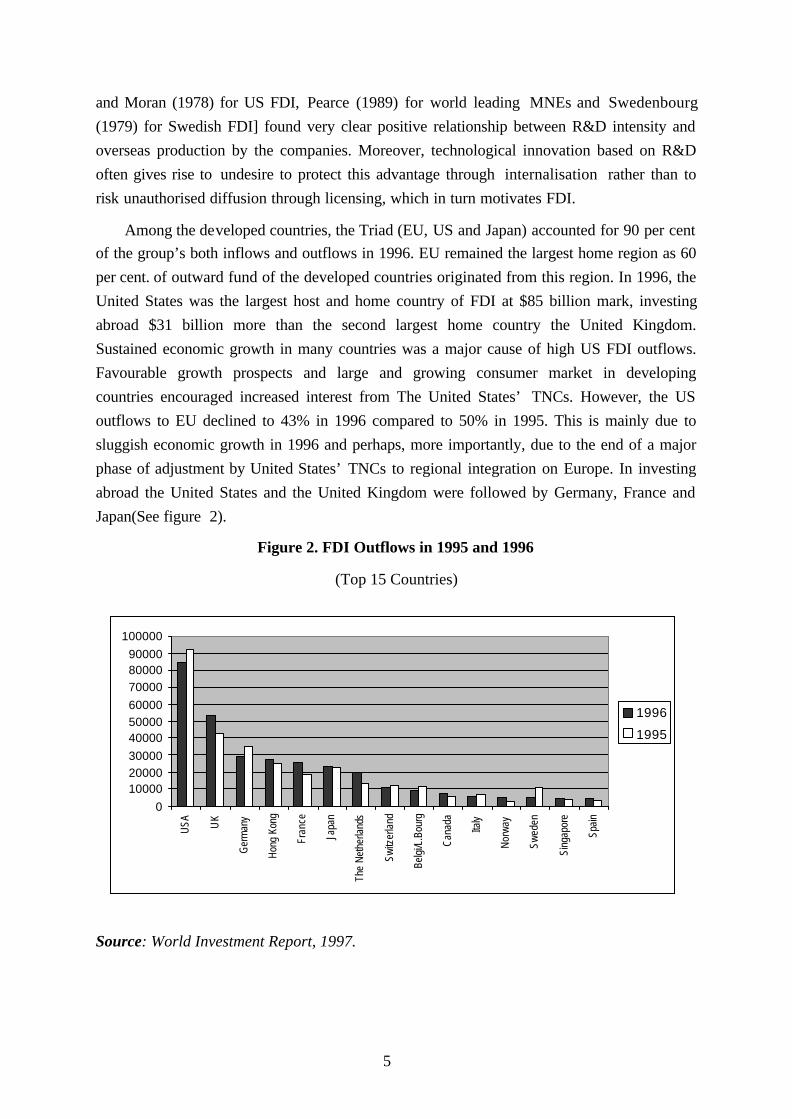
Among the developed countries, the Triad (EU, US and Japan) accounted for 90 per centof the group’s both inflows and outflows in 1996. EU remained the largest home region as 60
per cent. of outward fund of the developed countries originated from this region. In 1996, the
United States was the largest host and home country of FDI at $85 billion mark, investing
abroad $31 billion more than the second largest home country the United Kingdom.
Sustained economic growth in many countries was a major cause of high US FDI outflows.
Favourable growth prospects and large and growing consumer market in developing
countries encouraged increased interest from The United States’ TNCs. However, the US
outflows to EU declined to 43% in 1996 compared to 50% in 1995. This is mainly due to
sluggish economic growth in 1996 and perhaps, more importantly, due to the end of a major
phase of adjustment by United States’ TNCs to regional integration on Europe. In investing
abroad the United States and the United Kingdom were followed by Germany, France and
Japan(See figure 2).
Figure 2. FDI Outflows in 1995 and 1996
(Top 15 Countries)
Source: World Investment Report, 1997.
0100002000030000400005000060000700008000090000
100000
US
A
UK
Ger
man
y
Hon
g Ko
ng
Fran
ce
Japa
n
The
Net
herla
nds
Sw
itzer
land
Bel
gi/L
.Bou
rg
Can
ada
Italy
Nor
way
Sw
eden
Sin
gapo
re
Spa
in
1996
1995
6
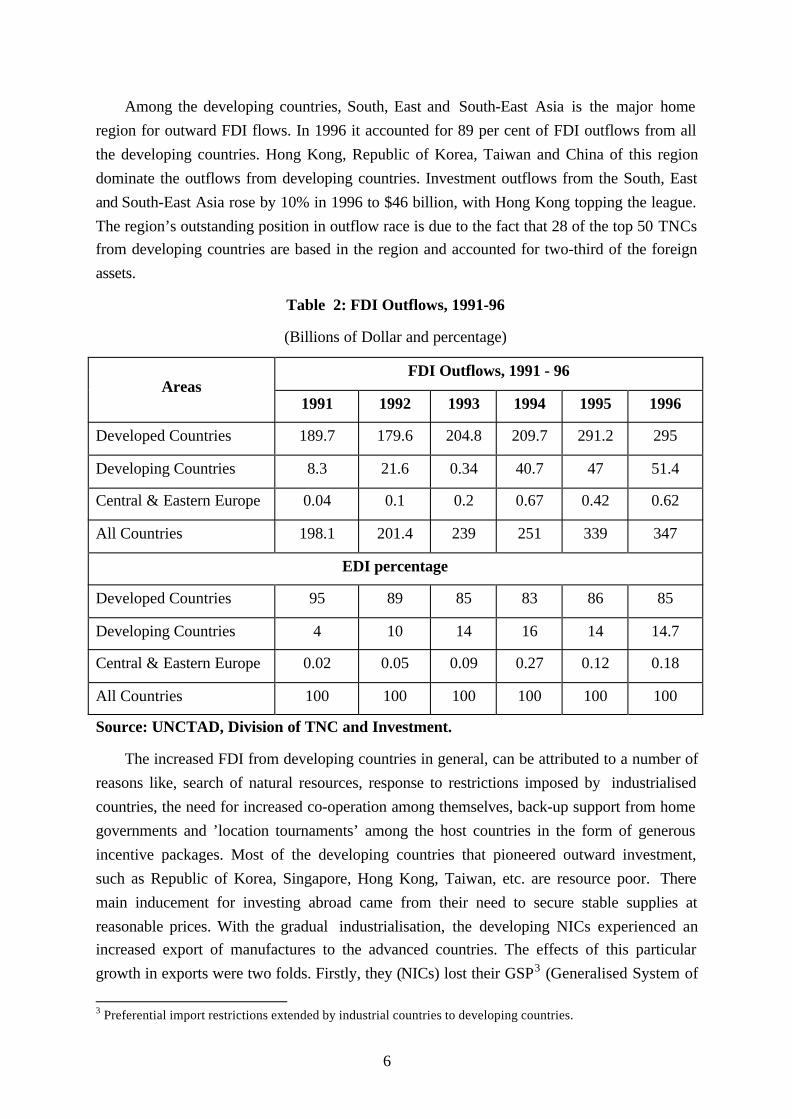
Among the developing countries, South, East and South-East Asia is the major home
region for outward FDI flows. In 1996 it accounted for 89 per cent of FDI outflows from all
the developing countries. Hong Kong, Republic of Korea, Taiwan and China of this region
dominate the outflows from developing countries. Investment outflows from the South, East
and South-East Asia rose by 10% in 1996 to $46 billion, with Hong Kong topping the league.
The region’s outstanding position in outflow race is due to the fact that 28 of the top 50 TNCsfrom developing countries are based in the region and accounted for two-third of the foreign
assets.
Table 2: FDI Outflows, 1991-96
(Billions of Dollar and percentage)
FDI Outflows, 1991 - 96Areas
1991 1992 1993 1994 1995 1996
Developed Countries 189.7 179.6 204.8 209.7 291.2 295
Developing Countries 8.3 21.6 0.34 40.7 47 51.4
Central & Eastern Europe 0.04 0.1 0.2 0.67 0.42 0.62
All Countries 198.1 201.4 239 251 339 347
EDI percentage
Developed Countries 95 89 85 83 86 85
Developing Countries 4 10 14 16 14 14.7
Central & Eastern Europe 0.02 0.05 0.09 0.27 0.12 0.18
All Countries 100 100 100 100 100 100
Source: UNCTAD, Division of TNC and Investment.
The increased FDI from developing countries in general, can be attributed to a number of
reasons like, search of natural resources, response to restrictions imposed by industrialised
countries, the need for increased co-operation among themselves, back-up support from home
governments and ’location tournaments’ among the host countries in the form of generous
incentive packages. Most of the developing countries that pioneered outward investment,
such as Republic of Korea, Singapore, Hong Kong, Taiwan, etc. are resource poor. There
main inducement for investing abroad came from their need to secure stable supplies at
reasonable prices. With the gradual industrialisation, the developing NICs experienced anincreased export of manufactures to the advanced countries. The effects of this particular
growth in exports were two folds. Firstly, they (NICs) lost their GSP3 (Generalised System of
3 Preferential import restrictions extended by industrial countries to developing countries.
7
Preference) status and secondly, they faced newer restrictions on their exports. It eventually
generated export oriented FDI in other developing countries to take advantages of their GSP
status and quota facilities in one hand and FDI in advanced countries to jump over the
restrictions directly on the other. Investments by Korean electronic firms in Europe and US
are an example of this sort. In the wake of development constraints created by the recession
in the industrial countries during the early 1980s especially limitation to market access indeveloped economies for developing country exports and the emergence of trading blocs
among them, regional co-operation efforts gained momentum in the Asia & Pacific region
and elsewhere. In Asia and Pacific region the co-operation effort was further reinforced by
their shared characteristics in development process. Among them the following seem to have
been most significant: a high and rising share of manufactures to total exports, a highly
dynamic private entrepreneur class, a dedicated and generally well trained labour force as
well as governments, willing and able to intervene to ensure continuing high rates of growth.
Such co-operation, in turn induced cross border mutual flows of capital in productive
ventures. One explanation of FDI originating from developing countries is attributed to what
is called ”packing order approach” related to their ability to grafting imported technology to
local economies, both domestic and foreign. Many FDI from Hong Kong, Republic of Korea,
Brazil and India in relatively labour intensive and technologically standardised products suchas textiles, foot wears, etc. and the unsophisticated product lines of electric and electronic
application are of this nature. (Euh and Min, 1987).
SECTION - 4
FDI Inflows: Location of Investment
The major recipients of FDI are industrial countries receiving about 60 per cent of World
FDI inflows in 1996. They received $208 billion in 1996 as compared to $205 billion in
1995. However, their share is steadily decreasing while the share of their developing
counterparts is steadily increasing. The share of developing countries in FDI inflows
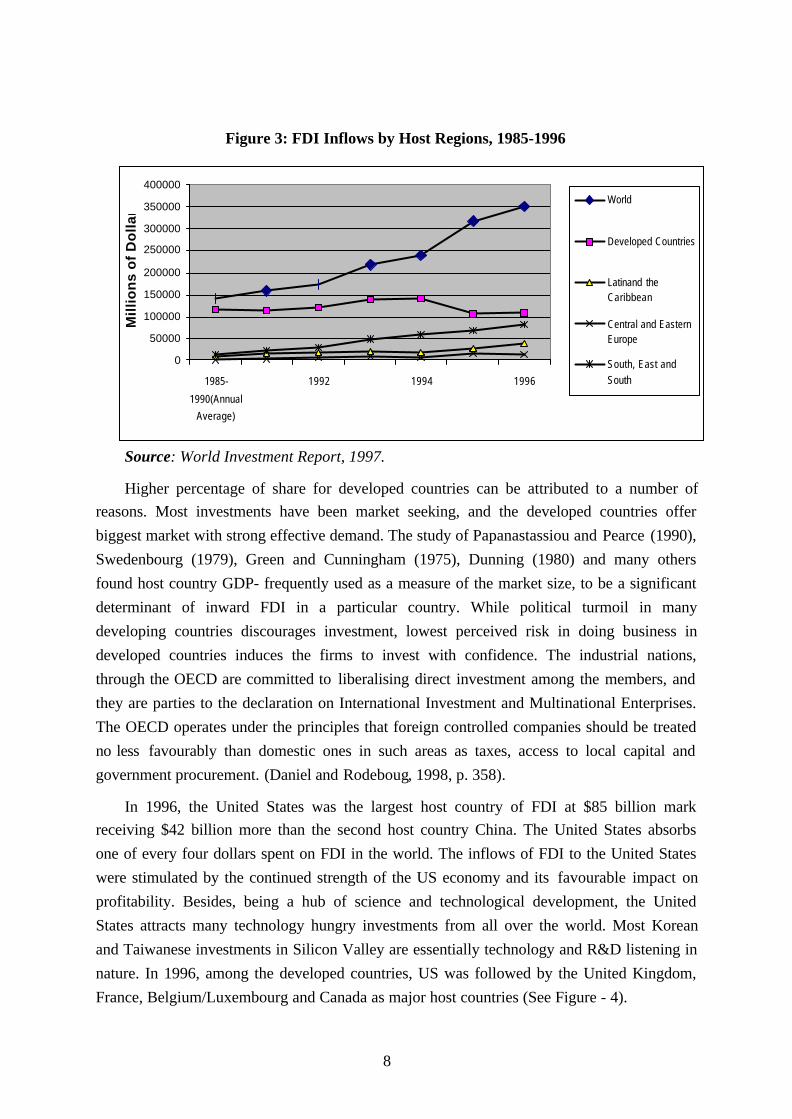
increased from 26% in 1991 to 37% in 1996. (See per centage figures in Table 3). The figurebelow demonstrates the steady growth of FDI inflows to the developing countries, especially
into South, East and South-East Asia while the trend for developed countries is often
fluctuating and at times stagnant.
8
Figure 3: FDI Inflows by Host Regions, 1985-1996
Source: World Investment Report, 1997.
Higher percentage of share for developed countries can be attributed to a number ofreasons. Most investments have been market seeking, and the developed countries offer
biggest market with strong effective demand. The study of Papanastassiou and Pearce (1990),
Swedenbourg (1979), Green and Cunningham (1975), Dunning (1980) and many others
found host country GDP- frequently used as a measure of the market size, to be a significant
determinant of inward FDI in a particular country. While political turmoil in many
developing countries discourages investment, lowest perceived risk in doing business in
developed countries induces the firms to invest with confidence. The industrial nations,
through the OECD are committed to liberalising direct investment among the members, and
they are parties to the declaration on International Investment and Multinational Enterprises.
The OECD operates under the principles that foreign controlled companies should be treated
no less favourably than domestic ones in such areas as taxes, access to local capital and
government procurement. (Daniel and Rodeboug, 1998, p. 358).
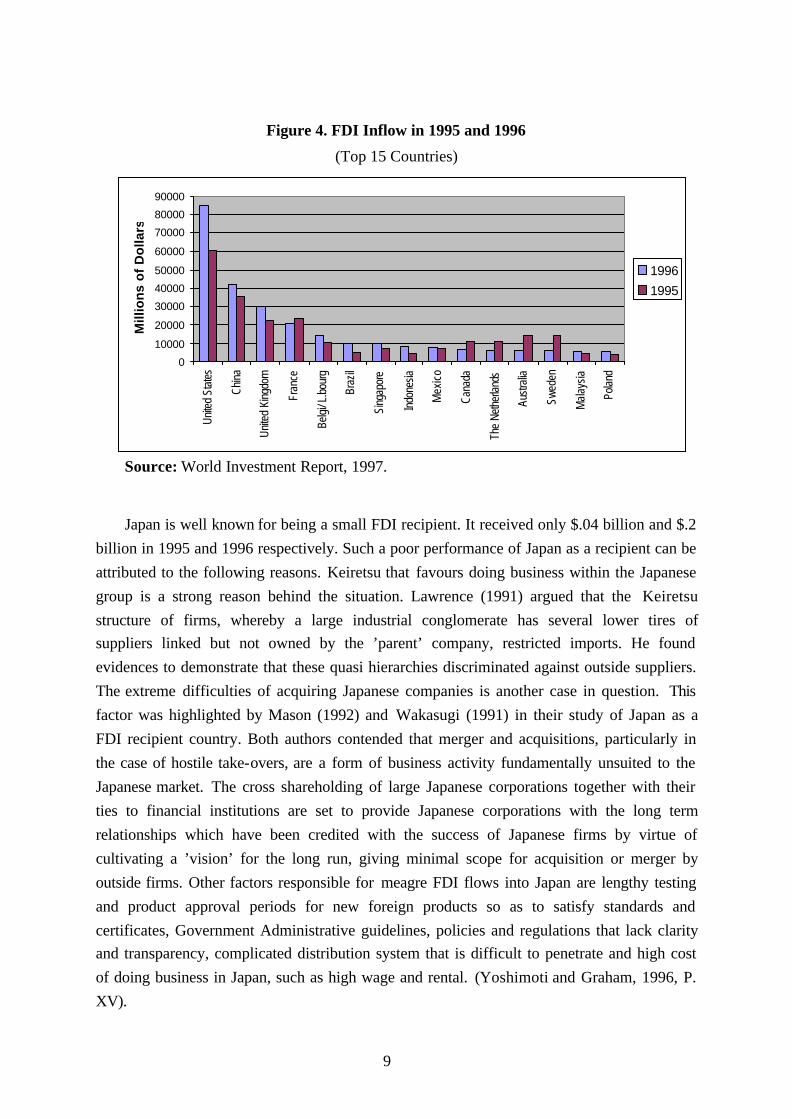
In 1996, the United States was the largest host country of FDI at $85 billion markreceiving $42 billion more than the second host country China. The United States absorbs
one of every four dollars spent on FDI in the world. The inflows of FDI to the United States
were stimulated by the continued strength of the US economy and its favourable impact on
profitability. Besides, being a hub of science and technological development, the United
States attracts many technology hungry investments from all over the world. Most Korean
and Taiwanese investments in Silicon Valley are essentially technology and R&D listening in
nature. In 1996, among the developed countries, US was followed by the United Kingdom,
France, Belgium/Luxembourg and Canada as major host countries (See Figure - 4).
0
50000
100000
150000
200000
250000
300000
350000
400000
1985-
1990(Annual
Average)
1992 1994 1996
Mil
lio
ns
of
Do
lla
r
World
Developed Countries
Latinand theCaribbean
Central and EasternEurope
South, East and
South
9
Figure 4. FDI Inflow in 1995 and 1996
(Top 15 Countries)
Source: World Investment Report, 1997.
Japan is well known for being a small FDI recipient. It received only $.04 billion and $.2
billion in 1995 and 1996 respectively. Such a poor performance of Japan as a recipient can be
attributed to the following reasons. Keiretsu that favours doing business within the Japanese
group is a strong reason behind the situation. Lawrence (1991) argued that the Keiretsu
structure of firms, whereby a large industrial conglomerate has several lower tires ofsuppliers linked but not owned by the ’parent’ company, restricted imports. He found
evidences to demonstrate that these quasi hierarchies discriminated against outside suppliers.
The extreme difficulties of acquiring Japanese companies is another case in question. This
factor was highlighted by Mason (1992) and Wakasugi (1991) in their study of Japan as a
FDI recipient country. Both authors contended that merger and acquisitions, particularly in
the case of hostile take-overs, are a form of business activity fundamentally unsuited to the
Japanese market. The cross shareholding of large Japanese corporations together with their
ties to financial institutions are set to provide Japanese corporations with the long term
relationships which have been credited with the success of Japanese firms by virtue of
cultivating a ’vision’ for the long run, giving minimal scope for acquisition or merger by
outside firms. Other factors responsible for meagre FDI flows into Japan are lengthy testing
and product approval periods for new foreign products so as to satisfy standards and
certificates, Government Administrative guidelines, policies and regulations that lack clarityand transparency, complicated distribution system that is difficult to penetrate and high cost
of doing business in Japan, such as high wage and rental. (Yoshimoti and Graham, 1996, P.
XV).
0
10000
20000
30000
40000
50000
60000
70000
80000
90000U
nite
d St
ates
Chi
na
Uni
ted
King
dom
Fran
ce
Belg
i/ L.
bour
g
Braz
il
Sing
apor
e
Indo
nesia
Mex
ico
Can
ada
The
Net
herla
nds
Aust
ralia
Swed
en
Mal
aysi
a
Pola
nd
Mill
ion
s o
f D
olla
rs
19961995
10
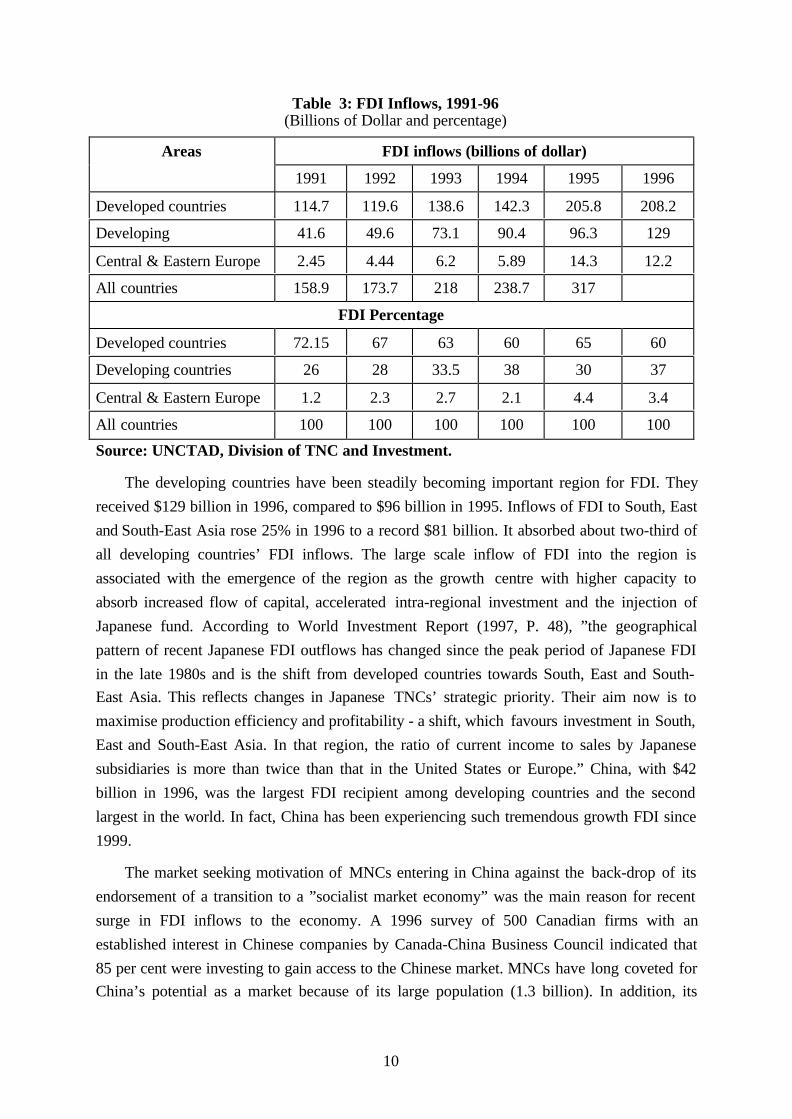
Table 3: FDI Inflows, 1991-96(Billions of Dollar and percentage)
FDI inflows (billions of dollar)Areas
1991 1992 1993 1994 1995 1996
Developed countries 114.7 119.6 138.6 142.3 205.8 208.2
Developing 41.6 49.6 73.1 90.4 96.3 129
Central & Eastern Europe 2.45 4.44 6.2 5.89 14.3 12.2
All countries 158.9 173.7 218 238.7 317
FDI Percentage
Developed countries 72.15 67 63 60 65 60
Developing countries 26 28 33.5 38 30 37
Central & Eastern Europe 1.2 2.3 2.7 2.1 4.4 3.4
All countries 100 100 100 100 100 100
Source: UNCTAD, Division of TNC and Investment.
The developing countries have been steadily becoming important region for FDI. They
received $129 billion in 1996, compared to $96 billion in 1995. Inflows of FDI to South, East
and South-East Asia rose 25% in 1996 to a record $81 billion. It absorbed about two-third of
all developing countries’ FDI inflows. The large scale inflow of FDI into the region is
associated with the emergence of the region as the growth centre with higher capacity to
absorb increased flow of capital, accelerated intra-regional investment and the injection of
Japanese fund. According to World Investment Report (1997, P. 48), ”the geographical
pattern of recent Japanese FDI outflows has changed since the peak period of Japanese FDI
in the late 1980s and is the shift from developed countries towards South, East and South-East Asia. This reflects changes in Japanese TNCs’ strategic priority. Their aim now is to
maximise production efficiency and profitability - a shift, which favours investment in South,
East and South-East Asia. In that region, the ratio of current income to sales by Japanese
subsidiaries is more than twice than that in the United States or Europe.” China, with $42
billion in 1996, was the largest FDI recipient among developing countries and the second
largest in the world. In fact, China has been experiencing such tremendous growth FDI since
1999.
The market seeking motivation of MNCs entering in China against the back-drop of its
endorsement of a transition to a ”socialist market economy” was the main reason for recent
surge in FDI inflows to the economy. A 1996 survey of 500 Canadian firms with an
established interest in Chinese companies by Canada-China Business Council indicated that
85 per cent were investing to gain access to the Chinese market. MNCs have long coveted forChina’s potential as a market because of its large population (1.3 billion). In addition, its
11
purchasing power has been increasing because of economic growth. During the 1980s its
increase in manufacturing output of 14.4 per cent a year was the fastest rate among the
world’s fifty largest economies. This has translated into consumer spending. Besides the
market size, the companies have also been attracted to China because of its resources. For
example, there have been substantial investments in the exploration and production of oil and
coal, and almost 20 per cent of US-owned FDI in China is in the petroleum sector. Inaddition, companies have looked at China as a source of inexpensive labour, particularly as
unemployed labour supplies have decreased and as labour rates have increased in some other
Asian economies (e.g. Singapore, Hong Kong, and Taiwan) that no longer can be considered
cheap labour sources. Finally, many companies have been drown recently to China because
there are few, if any, major countries in which they have not already established a strong
presence. Their earlier exclusion of China from their investment plan was due primarily to
China’s effective prohibition of foreign investment from 1949 to 1979- the first thirty years
of communist rule in China. (Daniel and Rodebaugh, 1998, P. 445).
Foreign direct investment in Central and Eastern Europe has been on rise since the
collapse of communism in the region. It rose from $2.4 billion in 1991 to $14.3 billion in
1995 and fell to $12.2 billion in 1996. The increasing trend of FDI into Central and Eastern
Europe is attributed to its closer trade links with the European Union and the activemarketisation process. However, some efficiency seeking investments are also pouring into
the region. As TNCs, especially automobile manufacturers are taking advantages of the
availability of skilled, low-cost labour in several countries of the region.
In 1996, FDI flows to Latin America and Caribbean increased significantly by 52% to
nearly $39 billion - a record level. The region accounted for 30% of all developing countries.
The driving forces behind this increase in inflow of FDI in Latin America and Caribbean
region are twofold. Firstly, the initiation of comprehensive economic reform including
massive privatisation and significant liberalisation of conditions under which foreign
investors operate. Secondly, the reactivation of regional and sub-regional integration through
bilateral investment treaties and trade and integration agreements.
FDI inflows into Africa increased 5.3% to almost $5 billion in 1996. Nigeria, Egypt and
Morocco topped the African league of largest recipient in 1996. 48 least developed countrieshave captured very little of the increase in FDI flows into developing countries during 1990s.
They received a mere .5% of world FDI flows in 1996. Small size of their domestic markets,
poor infrastructure facilities, adverse climatic conditions, remote geographical or land locked
position (in case of some countries), political instability and poor resource base are their
principal drawbacks accounted for such poor FDI performance.
Gradual increase in FDI inflow to the developing countries, in general, are mainly
associated with their change in attitudes towards FDI and the change of investment climate.
12
Dunning (1997, P.209-211) gave a number of possible explanations for the changing attitudes
to the FDI. The first is the renewed faith of most countries in the working of the market
economy, as demonstrated, for example, by the wholesale privatisation of state owned assets,
and the deregulation and liberalisation of markets over the last 8-10 years. The second
explanation is the increasing globalisation of economic activity and the integration of
international production and cross border markets by MNEs. The third reason is that the keyingredients of contemporary economic growth of created assets, such as technology,
intellectual capital, learning experience and organisational competence, are not only
becoming more mobile across national boundaries, but also becoming increasingly housed in
MNE systems. Fourthly, a growing number of economies- especially in East Asia- are now
approaching the ”take-off” stage in their economic development, and that as a result, the
competition for the world’s scarce resources of capital, technology and organisational skills is
becoming increasingly intensive. The fifth is that the economic structures of the major
industrialised nations are converging, one result of which is that competition between firms
from these nations is becoming both more intra-industry and more pronounced. The sixth
explanation is that the criterion for judging the success of FDI by host governments has
changed over the years, and changed in a way which has made for a less confrontational and
a more co-operative stance between themselves and foreign investors. More particularly, theemphasis of evaluating foreign activity over the past two decades has switched from the
direct contribution of foreign affiliates to its wider impact on the upgrading of the
competitiveness of a host country’s indigenous capabilities and the promotion of its dynamic
comparative advantage. And the last reason is that the learning experience of countries about
what MNEs can and cannot do for host countries has enabled their governments better to
understand and assess its consequences and to take action to ensure that it more efficiently
promotes their economic and social goals. The change of investment climate in the
developing countries are initiated by private sector led growth strategy followed by massive
structural adjustment measures like privatisation of state owned industries, commercialisation
of existing public enterprises, gradual lifting of tariff and non-tariff barriers, financial sector
reform, development of capital markets, infrastructure development, formation of export
processing zones, initiation of generous incentive packages including tax advantages, profitrepatriation facilities and others as well as the promotional measures to attract more FDI. In
short, the change of investment climate in developing countries are marked by the significant
shift of state role in business from an overseer to a facilitator and in case of FDI their role go
even further to be an active marketer. Attracting more FDI is now viewed as an important
part of their foreign diplomacy.
One recent trend very much related to increased inflow of FDI into developing countries
has been the use of specialised export oriented subsidiaries by TNCs. This attempt seeks to
use particular location advantages of host countries (for example efficient low cost labour) to
13
perform distinct elements in the company’s over all operations (for example assembly, labour
intensive processing stages) as effectively as possible. The implementation of these
operations has been supported by institutional factors from both the home country and host
country sides. From the home-country side, the availability of favourable value added tariff
provisions has meant that the cost of transshipment of components etc. involved in this
process are less likely to cancel out the cost saving benefits gained in the overseas operations.From the host country side, the establishment of export processing zones- usually providing
infrastructure, tax concessions and a free trade environment- has also served to assist the
growth of specialised operations of Transnational Corporations. (UNCTAD, 1992, P. 26-27).
One important fact about recent FDI flows is its intra-regional character. More than half of
total FDI inflow to EU has come from EU members over the past decades. In 1996, about 40
per cent of total FDI into South, East and South-East Asia was originated from the region
itself. Around a quarter of FDI into Latin and the Caribbean region in 1996 were of intra-
regional origin. This particular trend in FDI flows is in commensurate with the recent surge
of economic regionalism around the world.
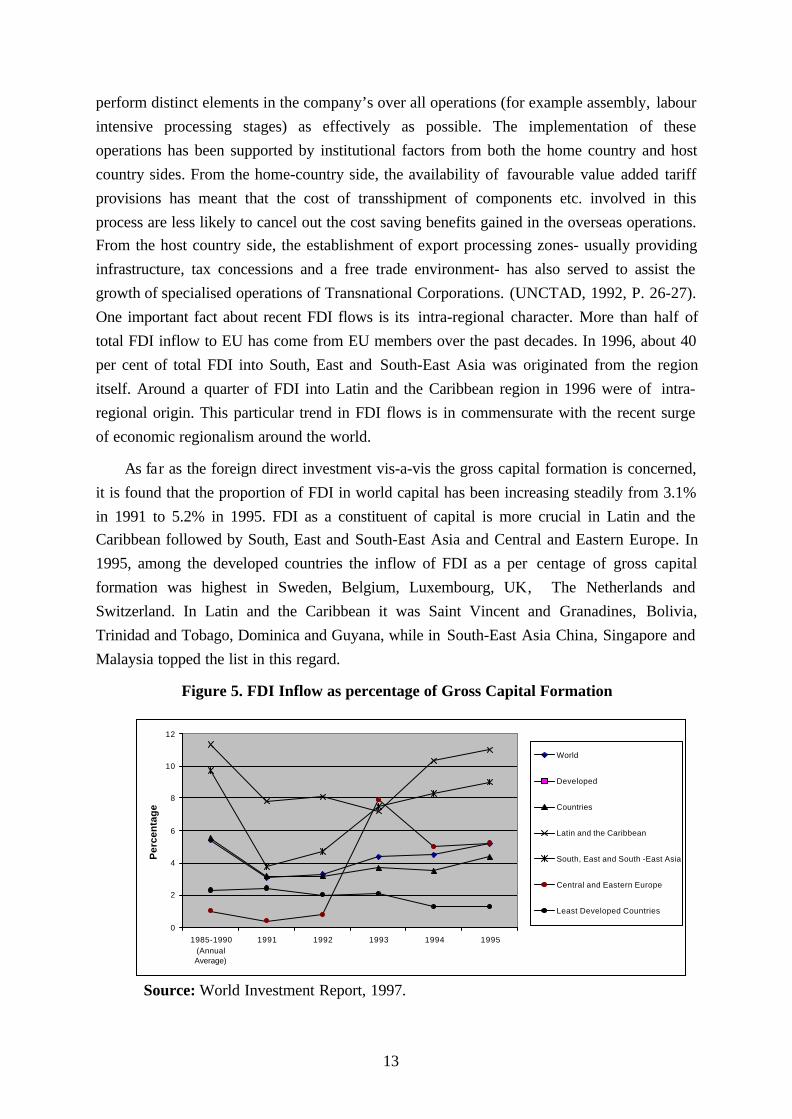
As far as the foreign direct investment vis-a-vis the gross capital formation is concerned,
it is found that the proportion of FDI in world capital has been increasing steadily from 3.1%
in 1991 to 5.2% in 1995. FDI as a constituent of capital is more crucial in Latin and theCaribbean followed by South, East and South-East Asia and Central and Eastern Europe. In
1995, among the developed countries the inflow of FDI as a per centage of gross capital
formation was highest in Sweden, Belgium, Luxembourg, UK, The Netherlands and
Switzerland. In Latin and the Caribbean it was Saint Vincent and Granadines, Bolivia,
Trinidad and Tobago, Dominica and Guyana, while in South-East Asia China, Singapore and
Malaysia topped the list in this regard.
Figure 5. FDI Inflow as percentage of Gross Capital Formation
Source: World Investment Report, 1997.
0
2
4
6
8
10
12
1985-1990(AnnualAverage)
1991 1992 1993 1994 1995
Per
cen
tag
e
World
Developed
Countries
Latin and the Caribbean
South, East and South -East Asia
Central and Eastern Europe
Least Developed Countries
14
The figure above shows the plausible role of FDI inflow in capital formation in Latin and
the Caribbean, Central and Eastern Europe and South-East Asia. However, FDI inflow
constitutes rather meagre portion of capital in the developed countries. The worst case is for
the 48 least developed countries where FDI accounts for only around 2% of their gross
capital.
SECTION - 5
Forms of Foreign Investment
In contrast to the 1950s and 1960s, when Greenfield FDI was the most popular mode of
market entry, cross-border merger and acquisition (M&A) have been used increasingly as a
major means of entering foreign markets since mid-1980s. Cross-border M&A rose during
the past six years, to a record $275 billion (including some minority held transactions
classified as portfolio investment) in 1996, an increase of 16% over the 1995 level ($237
billion). Transnational Corporations based in the United States and the United Kingdom were
the biggest players, accounting for 40% of the value of purchases in majority-held M&A and
57% of sales in 1996. Though Japanese TNCs still prefer Greenfield investments as their
mode of entry, they have been shifting recently to merger and acquisition. In his study of”New Forms of International Investment” on North-South context, Oman (1984) observed
that the independent non-equity (licensing, production sharing, sub-contracting, franchising,
management contract, technical assistance, turnkey contract, etc.) forms of involvement in
developing countries increased relative to traditional majority owned direct investment during
the period 1970-1981. He also noticed that such low-equity or non-equity forms of
involvement were more marked in Asia than in other developing regions. Production sharing
contracts had been very much common in extractive industries, especially in petroleum and
metal mining, turnkey contract and technical assistance in infrastructure projects and sub-
contracting and licensing in manufacturing. Group of Thirty (1987) pointed to the
international sub-contracting as a growing practice of many international companies, what
they called foreign direct investment without investment because it did not represent FDI in
the accepted sense. In such cases, the international company does not have equity in thesubcontractor. However, as often happens, being the biggest single or only customer of the
subcontractor, the local company has in effect been brought into existence and is kept in
being by the international company. In this way, the international company creates, in another
country, a new enterprise, employment and also the generation of foreign exchange earnings
for the subcontractor’s country of domicile.
15
SECTION -6
Sectorial Trend of FDI Flows
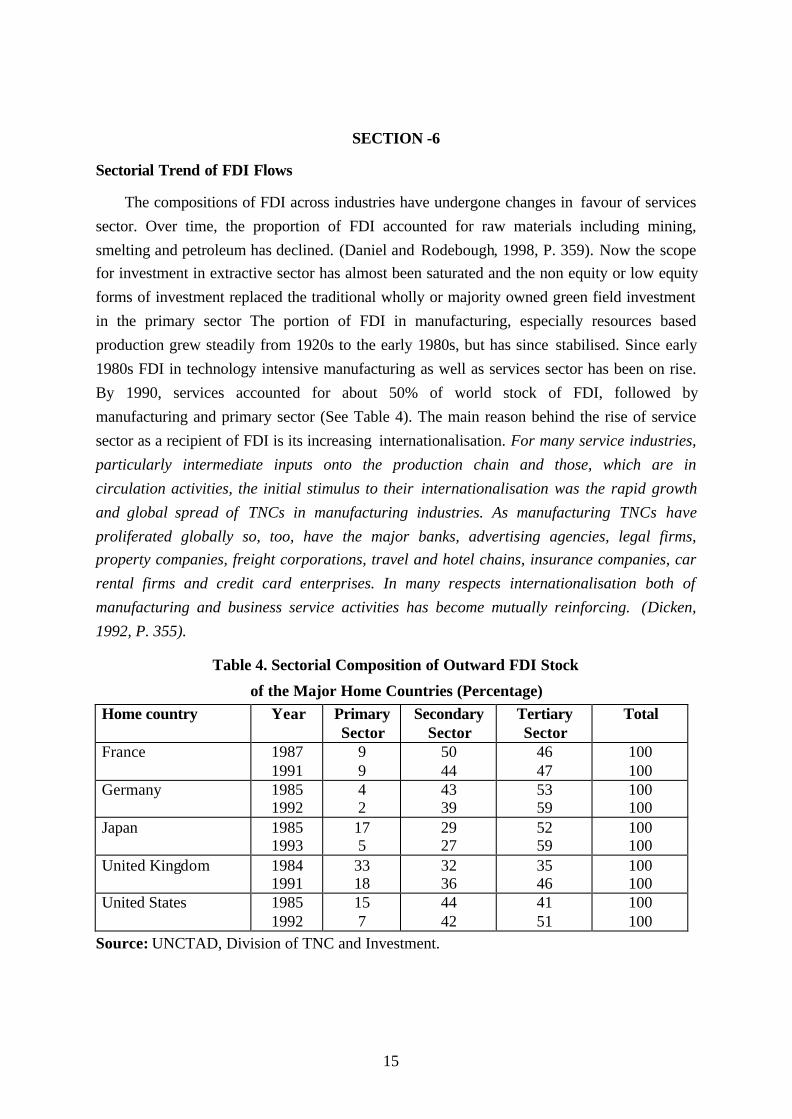
The compositions of FDI across industries have undergone changes in favour of services
sector. Over time, the proportion of FDI accounted for raw materials including mining,
smelting and petroleum has declined. (Daniel and Rodebough, 1998, P. 359). Now the scopefor investment in extractive sector has almost been saturated and the non equity or low equity
forms of investment replaced the traditional wholly or majority owned green field investment
in the primary sector The portion of FDI in manufacturing, especially resources based
production grew steadily from 1920s to the early 1980s, but has since stabilised. Since early
1980s FDI in technology intensive manufacturing as well as services sector has been on rise.
By 1990, services accounted for about 50% of world stock of FDI, followed by
manufacturing and primary sector (See Table 4). The main reason behind the rise of service
sector as a recipient of FDI is its increasing internationalisation. For many service industries,
particularly intermediate inputs onto the production chain and those, which are in
circulation activities, the initial stimulus to their internationalisation was the rapid growth
and global spread of TNCs in manufacturing industries. As manufacturing TNCs have
proliferated globally so, too, have the major banks, advertising agencies, legal firms,
property companies, freight corporations, travel and hotel chains, insurance companies, car
rental firms and credit card enterprises. In many respects internationalisation both of
manufacturing and business service activities has become mutually reinforcing. (Dicken,
1992, P. 355).
Table 4. Sectorial Composition of Outward FDI Stock
of the Major Home Countries (Percentage)
Home country Year PrimarySector
SecondarySector
TertiarySector
Total
France 19871991
99
5044
4647
100100
Germany 19851992
42
4339
5359
100100
Japan 19851993
175
2927
5259
100100
United Kingdom 19841991
3318
3236
3546
100100
United States 19851992
157
4442
4151
100100
Source: UNCTAD, Division of TNC and Investment.
16
SECTION -7
Conclusion
The volume of both outflow and inflow of FDI in the world economy has been
increasing steadily. At times it grows even faster than the world GDP and trade. It indicates
that the economic activities around the world are getting more interconnected throughinvestment networks. In many cases, especially in electronics, automobiles, petro-chemicals
and constructions, the arms length trade transactions are being replaced by the cross border
production of goods and services. From the regional perspective, developed countries still
dominate the FDI scenario. They absorbed around 60 per cent of world inward FDI and
supplied 85 per cent of total outward flows. However their dominance has been dwindling
gradually. On the other hand, the share of developing countries as the recipient of FDI has
been showing an increasing trend. Now they absorbed around 40 per cent of total inward
FDI. Among the developing countries the South, East and South-East Asia has emerged as a
major destination of FDI. Signs of prospects are also on the sight for Latin and the Caribbean
and Central and Eastern Europe as the recipient of FDI. Renewed faith and attitude towards
foreign investment and the change of business climate as well as excellent performance of the
domestic firms in many developing countries are the main reasons behind this growinginflow of FDI. However, the outflow of FDI is still a developed country phenomenon. The
share of developing countries in this regard is still very meagre. Nevertheless, the outward
FDI from ths group, especially from South, East and South-East Asia has been growing,
though the tempo is very slow. Along with the current waves of regional integration, the
intra-regional FDI got its momentum in recent years and has become a vivid future of the
worldwide flows of finance capital. A significant shift also took place in relation to the forms
of foreign investment. Conventional Greenfield investment is giving way to the merger and
acquisition and many other low-equity and non-equity forms of international investment
modes. The sectoral recipe of FDI also underwent a radical change. Service sector replaced
the dominance of primary and manufacturing sectors as the major FDI recipient.
17
REFERENCES
Bergstem, C.F., T. Horst and T. Moran. (1978). American Multinationals and American
Interests. Brookings Institution, Washigton D. C.
Canada-China Business Council. (1996). Whats New: Canadian Investment in China,September 2, 1996. (http://www.ccbc.comIinvestment.phtnil).
Daniel, J. H. and L.H Radebaugh. (1998). International Business. Eight Edition, Addison-
Wesley, USA.
Dicken, P. (1992). Global Shift. 2nd edition, London: Paul Chapman.
Dunning, J.H. (1980). ”Toward an Eclectic Theory of International Production: Some
imperical Tests.” Journal of International Business Studies, 11 (Spring/Summer 1980) Pp. 9-
31.
Dunning, J.H. (1988). Explaining International Production. London: Urwin Hyman.
Dunning, J.H. (1997). Alliance Capitalism and Global Business. New York: Routledge.
Euh, Yoon-dae and Sang, H.Min.(1987). ”Foreign Direct Investment from Developing
Countries” in Singer H.W. et. al (ed.) Foreign Direct Investment. New Delhi: Indus
Publishing Company, Pp. 302-303.
Green, R.T. and W.H. Cunnighani .(1975). ”The Determinants of US Foreign Investment: an
Empirical Examination.” Management International Review. p. 15, Pp. 113-120.
Group of Thirty .(1984). Foreign Direct Investment. 1973- 1987. New York, p. 12.
Grubaugh, S.J.(1987). ”Determinants of Direct Foreign Investment”. Review of Economics
and Statistics. 69 (February 1987), Pp.149-152.
Lall, S. (1980). ”Monopolistic Advantages and Foreign Investment by US Manufacturing
Industry.” Oxford Economic Papers. 32 (March 1980), Pp. 102-122.
Lawrence, R. Z. (1991). ”Efficient or Exclusionist? The import behaviour of Japanese
Corporate Groups”, Brookings Paper of Economic Activity 1, Pp. 311-330.
Mason, M. (1992), American Multinationals in Japan: The Political Economy of Japanese
Capital Controls, 1899-1980. Boston: Harvard University Press.
Oman, C. (1984). New Forms of International Investment in Developing Countries. Paris,OECD.
Papanastassiou, M. and R.D. Pearce .(1990). ”Host Country Characteristics and the Sourcing
Behaviour of UK. Manufacturing Industry.” University of Reading, Department of
18
Economics, Discussion Paper in International Investment and Business Studies, Series B,
Vol. II., No. 140. Reading
Pearce, R. D. (1989). ”The Internalisation of Sales by Leading Enterprises: Some firm
industry and country determinants.” University of Reading, Department of Economics,
Discussion Paper in International Investment and Business Studies, Series B, No. 121.
Reading.
Pugel, T. A. (1981). ”The Determinants of Foreign direct Investment: An analysis of US
Manufacturing Industries.” Managerial and Decision Economics, 2 (December 1981), Pp.
220-228.
Swedenbourg, B.(1979). The Multinational Operations of Swedish Firms: Analysis of
Determinants and Effects. Industrial Institute of Economic and Social Research, Stockholm.
The Economist, Emerging Market Indicators; October 26, 1996, March 1, 1997, October 4,
1997.
The Economist, Financial Indicator, April 12, 1997, July 6, 1997, August 2, 1997.
UNCTAD .(1992). The Determinants of Foreign Direct Investments: A Survey of the
evidence. New York: United Nations, Pp. 26-27.
UNCTAD .(1997). World Investment Report 1997. New York: United Nations.
Wakasugi, R. (1996). ”Why foreign firms entry has been low in Japan: An EmpiricalExamination.” in M. Yoshimoti and E. Graham, (Eds.), Foreign Direct investment in Japan.
London: Edward Elgar, Pp. 11-135.
Wolf, B.M.(1977). ”Industrial Diversification and Intemalisation: Some Empirical
Evidence”. Journal of international Economics, 26, Pp.177-191.
19
Appendix
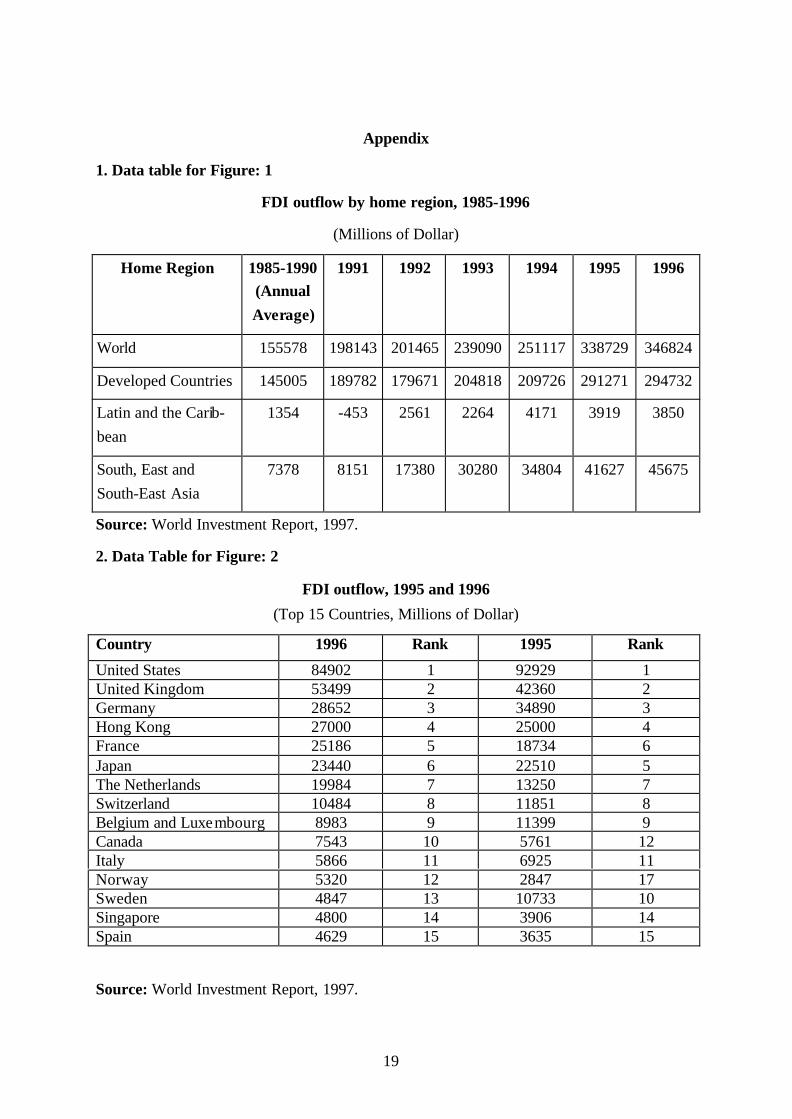
1. Data table for Figure: 1
FDI outflow by home region, 1985-1996
(Millions of Dollar)
Home Region 1985-1990
(Annual
Average)
1991 1992 1993 1994 1995 1996
World 155578 198143 201465 239090 251117 338729 346824
Developed Countries 145005 189782 179671 204818 209726 291271 294732
Latin and the Carib-
bean
1354 -453 2561 2264 4171 3919 3850
South, East and
South-East Asia
7378 8151 17380 30280 34804 41627 45675
Source: World Investment Report, 1997.
2. Data Table for Figure: 2
FDI outflow, 1995 and 1996
(Top 15 Countries, Millions of Dollar)
Country 1996 Rank 1995 Rank
United States 84902 1 92929 1United Kingdom 53499 2 42360 2Germany 28652 3 34890 3Hong Kong 27000 4 25000 4France 25186 5 18734 6Japan 23440 6 22510 5The Netherlands 19984 7 13250 7Switzerland 10484 8 11851 8Belgium and Luxembourg 8983 9 11399 9Canada 7543 10 5761 12Italy 5866 11 6925 11Norway 5320 12 2847 17Sweden 4847 13 10733 10Singapore 4800 14 3906 14Spain 4629 15 3635 15
Source: World Investment Report, 1997.
20
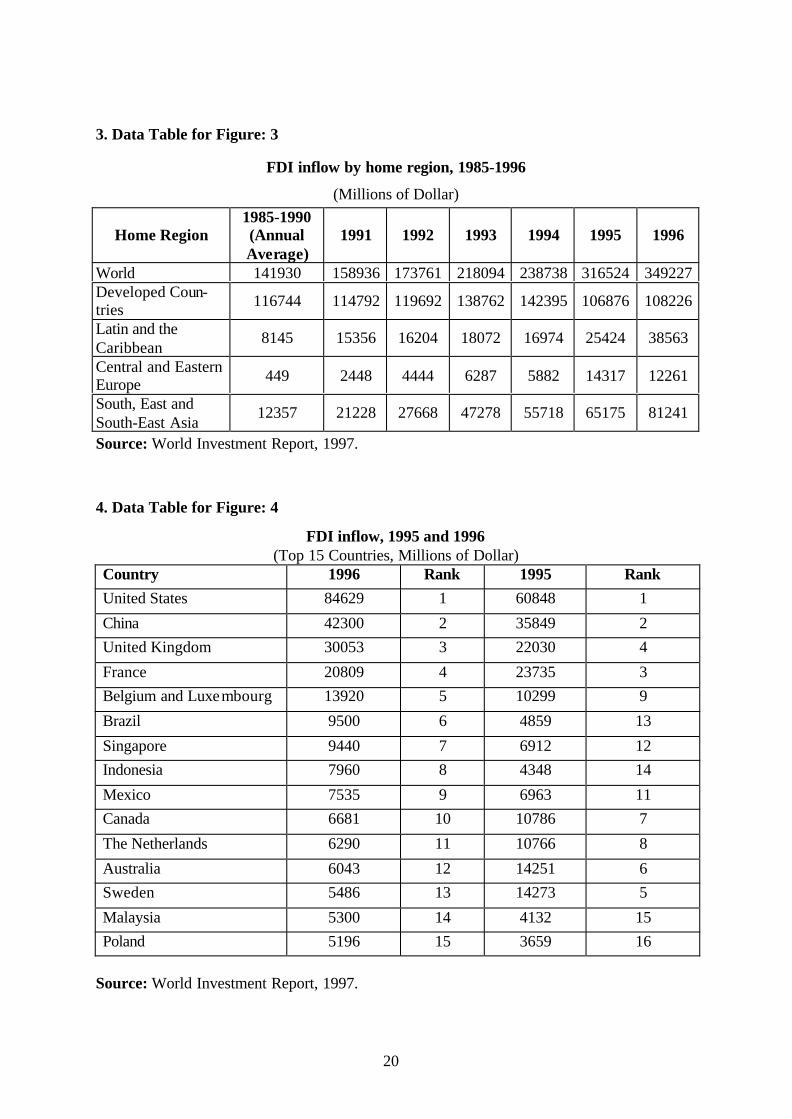
3. Data Table for Figure: 3
FDI inflow by home region, 1985-1996
(Millions of Dollar)
Home Region1985-1990(AnnualAverage)
1991 1992 1993 1994 1995 1996
World 141930 158936 173761 218094 238738 316524 349227Developed Coun-tries 116744 114792 119692 138762 142395 106876 108226
Latin and theCaribbean
8145 15356 16204 18072 16974 25424 38563
Central and EasternEurope 449 2448 4444 6287 5882 14317 12261
South, East andSouth-East Asia
12357 21228 27668 47278 55718 65175 81241
Source: World Investment Report, 1997.
4. Data Table for Figure: 4
FDI inflow, 1995 and 1996(Top 15 Countries, Millions of Dollar)
Country 1996 Rank 1995 Rank
United States 84629 1 60848 1
China 42300 2 35849 2
United Kingdom 30053 3 22030 4
France 20809 4 23735 3
Belgium and Luxembourg 13920 5 10299 9
Brazil 9500 6 4859 13
Singapore 9440 7 6912 12
Indonesia 7960 8 4348 14
Mexico 7535 9 6963 11
Canada 6681 10 10786 7
The Netherlands 6290 11 10766 8
Australia 6043 12 14251 6
Sweden 5486 13 14273 5
Malaysia 5300 14 4132 15
Poland 5196 15 3659 16
Source: World Investment Report, 1997.

21
5. Data Table for Figure: 5
FDI inflow as a percentage of Gross Capital Formation, by Region (1985-1995)
(percentage)
Home Region 1985- 1990(AnnualAverage)
1991 1992 1993 1994 1995
World 5.4 3.1 3.3 4.4 4.5 5.2
Developed
Countries
5.5 3.2 3.2 3.7 3.5 4.4
Latin and the Caribbean 11.3 7.8 8.1 7.2 10.3 11.0
South, East and South -East Asia 9.7 3.8 4.7 7.5 8.3 9.0
Central and Eastern Europe 1.0 0.4 0.8 7.9 5.0 5.2
Least Developed Countries 2.3 2.4 2.0 2.1 1.3 1.3
Source: World Investment Report, 1997.