Techno-Economic Study of Generating/Compressing Hydrogen Electrochemically
7
Techno-Economic Study of Generating/Compressing Hydrogen Electrochemically A.B. LaConti, T. Norman, K.D. Patch. W. Schmitt, & L.J. Gestaut Giner Electrochemical Systems L.L.C. (GES) 89 Rumford Avenue Newton, MA 02466 USA Tel: 781-529-0533 ··E-mail: [email protected] A. Rodrigues General Motors, Fuel Cell Activities (GM) 10 Carriage Street Honeoye Falls, NY 14472 USA Abstract The impending hydrogen economy will utilize hydrogen from a number of sources; most notably reformers and water electrolyzers. In the later case, the primary energy source can be conventional (fossil fuels, hydroelectric, nuclear) or renewable (solar, wind, biomass). However, regardless of the source of the primary energy or the method of hydrogen production, there is a common requirement that the hydrogen be sufficiently compressed to achieve adequate energy density storage and to allow the rapid transfer of gas from central to local or mobile storage systems. In the case of water electrolyzers, the hydrogen can be directly produced at elevated pressures. Independent of the source of the hydrogen, pressurization can also be accomplished subsequent to its production by the use of mechanical or electrochemical compressors. While current electrolyzer developments have targeted hydrogen production at pressures of 340 bar and higher, careful attention must be paid to trade-offs between the electrolyzer system capital costs, operating costs, and system reliability. The technical and economic impact of varying scenarios has a profound effect on the overall economics of the hydrogen production and, ultimately, on the economics of the hydrogen economy. Keywords: electrolysis, economics, pressure, membrane, PEM Introduction The movement to a hydrogen economy requires the development of technologies that make that transition economically viable. This implies that competitiveness with energy derived from carbon-based, non-renewable sources such as coal or oil must be achieved for the new fuels to be adopted. While tax policies can be used to alter the competitive landscape, a far better solution is for hydrogen fuel to be inherently competitive. In the United States the price of a gallon of “unleaded regular” gasoline is approximately $ 0.37/l ($1.40/gallon), including approximately $ 0.40 /gallon ($ 0.11/l) in various federal, state, and local taxes. This price results, in part, from the from a crude oil price of $ 20 – 25/barrel. The average light duty vehicle fuel consumption was 19.6 miles/gallon (8.3 km/l) in 1999.[1] A liter of gasoline contains approximately 32.8 MJ of energy (LHV) [2]. Hydrogen fuel cell vehicles have demonstrated an efficiency improvement 114% compared to equivalent gasoline-powered internal combustion engine vehicles[3]. Thus, an equivalent hydrogen fuel cell vehicle would require only 15.3 MJ of energy (LHV) to move an identical distance. With an energy content of 120 MJ/kg (LHV), this is the equivalent of 0.47 kg of hydrogen. Thus, economic equivalency to gasoline would require a pretax cost of $ 2.20/kg H2. The results of this study indicate that such a cost is I within reach when the hydrogen is produced by water electrolysis.
-
Upload
keith-d-patch -
Category
Engineering
-
view
63 -
download
0
Transcript of Techno-Economic Study of Generating/Compressing Hydrogen Electrochemically

Techno-Economic Study of Generating/Compressing
Hydrogen Electrochemically
A.B. LaConti, T. Norman, K.D. Patch. W. Schmitt, & L.J. Gestaut
Giner Electrochemical Systems L.L.C. (GES)
89 Rumford Avenue
Newton, MA 02466 USA
Tel: 781-529-0533 ··E-mail: [email protected]
A. Rodrigues
General Motors, Fuel Cell Activities (GM)
10 Carriage Street
Honeoye Falls, NY 14472 USA
Abstract
The impending hydrogen economy will utilize hydrogen from a number of sources; most notably reformers
and water electrolyzers. In the later case, the primary energy source can be conventional (fossil fuels,
hydroelectric, nuclear) or renewable (solar, wind, biomass).
However, regardless of the source of the primary energy or the method of hydrogen production, there is a
common requirement that the hydrogen be sufficiently compressed to achieve adequate energy density
storage and to allow the rapid transfer of gas from central to local or mobile storage systems. In the case of
water electrolyzers, the hydrogen can be directly produced at elevated pressures. Independent of the source
of the hydrogen, pressurization can also be accomplished subsequent to its production by the use of
mechanical or electrochemical compressors.
While current electrolyzer developments have targeted hydrogen production at pressures of 340 bar and
higher, careful attention must be paid to trade-offs between the electrolyzer system capital costs, operating
costs, and system reliability. The technical and economic impact of varying scenarios has a profound effect
on the overall economics of the hydrogen production and, ultimately, on the economics of the hydrogen
economy.
Keywords: electrolysis, economics, pressure, membrane, PEM
Introduction The movement to a hydrogen economy requires the development of technologies that make that transition
economically viable. This implies that competitiveness with energy derived from carbon-based, non-renewable
sources such as coal or oil must be achieved for the new fuels to be adopted. While tax policies can be used to alter
the competitive landscape, a far better solution is for hydrogen fuel to be inherently competitive.
In the United States the price of a gallon of “unleaded regular” gasoline is approximately $ 0.37/l
($1.40/gallon), including approximately $ 0.40 /gallon ($ 0.11/l) in various federal, state, and local taxes. This price
results, in part, from the from a crude oil price of $ 20 – 25/barrel. The average light duty vehicle fuel consumption
was 19.6 miles/gallon (8.3 km/l) in 1999.[1]
A liter of gasoline contains approximately 32.8 MJ of energy (LHV) [2]. Hydrogen fuel cell vehicles have
demonstrated an efficiency improvement 114% compared to equivalent gasoline-powered internal combustion
engine vehicles[3]. Thus, an equivalent hydrogen fuel cell vehicle would require only 15.3 MJ of energy (LHV) to
move an identical distance. With an energy content of 120 MJ/kg (LHV), this is the equivalent of 0.47 kg of
hydrogen. Thus, economic equivalency to gasoline would require a pretax cost of $ 2.20/kg H2. The results of this
study indicate that such a cost isI within reach when the hydrogen is produced by water electrolysis.

Description Of Electrolysis Process High-volume water electrolyzers introduce water to the anode side of an electrolytic cell, which utilizes
direct current to electrochemically produce pure, high-pressure hydrogen gas on the opposite (cathode) side of the
cell (Figure 1). High-purity water is provided to the oxygen-evolution electrode (anode), where it is
electrochemically decomposed to provide oxygen gas, hydrogen ions and electrons. The hydrogen ions move
through the proton exchange membrane (PEM) to the hydrogen-evolving electrode (cathode), while the electrons
move through the external circuit. An excess of water is supplied to the oxygen side of the cell and recirculated to
remove any waste heat. A portion of the excess water is electro-osmotically transported across the PEM with the
hydrogen ions. Provisions are required to separate and recover the electrochemically transported water. A PEM
electrolysis cell can withstand large differential pressures (>172 bar) when properly supported, as well as high
absolute pressures.
A PEM electrolyzer stack consists of multiple cells in a series electrical configuration. A complete
electrolyzer is supported by a fluid handling system, power conditioning equipment, and a control package. The
simplified major subsystems (Figure 2) of the high-pressure electrolyzer system include the electrolyzer, the
electrical feed subsystem, the deionized (DI) water feed and deionized water handling system, low-pressure
deionized water pump, oxygen gas/liquid separator and oxygen vent subsystem, and the hydrogen gas train
(hydrogen separator, dryer and high-pressure hydrogen outlet.) These subsystems have been packaged and
demonstrated in a compact 25 kW (0.37 kg H2/hr) hydrogen generator (Figure 3).
Figure 1. Water Electrolysis Cell Cross Section
Figure 2. Process Flow Diagram
DI W ater
Han d lin g
P u m p
H 2 Sep ara tor
H 2 Dr yer
E lec tr olyzer
O 2
V en t
W ater
Feed
5 ,000 p s ig
H2
O u t le tE lec t ric i ty
Feed
O 2 S ep ara to r
DI W ater
Han d lin g
P u m p
H 2 Sep ara tor
H 2 Dr yer
E lec tr olyzer
O 2
V en t
O 2
V en t
O 2
V en t
W ater
Feed
W ater
Feed
W ater
Feed
5 ,000 p s ig
H2
O u t le t
5 ,000 p s ig
H2
O u t le t
5 ,000 p s ig
H2
O u t le tE lec t ric i ty
Feed
E lec t ric i ty
Feed
E lec t ric i ty
Feed
O 2 S ep ara to r

Figure 3. Compact 25 kW water electrolyzer
Current Status Of Development In 1968, PEM electrolyzers were only capable of 3.4 bar differential pressure, and when run at an 85%
electrical efficiency were only capable of operating at a current density of 0.7 kA/m2. By 2002, a differential pressure
capability of 172 bar has been demonstrated in single cells as well as current densities as high as 34 kA/m2 at 1.74V
(an 85% electrical efficiency based on an HHV of 1.48V). Higher current densities allow fewer cells (and lower costs)
for equal hydrogen production. In the period of 1968 to the present, a ratio of 50 to 1 reduction number of cells required
to produce a given amount of hydrogen was achieved. During the same period, total noble metal catalyst loadings
have been decreased from 10 mg/cm2 in 1968 to 1 mg/cm2 in 2002. The electrolyzer performance reported in Figure
4 is for a PEM electrolyzer with these low catalyst loadings.
241 bar
0 bar
Improvements in electrolyzer technology have been accompanied by substantial improvement in the
supporting subsystems which in addition to the electrolyzer include the electrical feed subsystem, the deionized (DI)
water feed and handling system, low-pressure deionized water pump, oxygen gas/liquid separator and oxygen vent
subsystem, and the hydrogen gas train (hydrogen separator, dryer and high-pressure hydrogen outlet.)
0
500
1000
1500
2000
2500
3000
3500
1967 1968 1980 1998 2002
Year
Dif
fere
nti
al P
res
su
re (
ps
id)
or
Cu
rren
t D
en
sit
y a
t 85%
Eff
icie
nc
y
(1.7
4 V
)
Differential Pressure
Current Density
Figure 4. Advancements in Electrolyzers

Future Electrolyzer Developments Electrolyzer improvements are underway to further reduce the energy required for hydrogen production. The
use of elevated temperatures, thinner membranes, alternative membranes, and novel catalysts promise to reduce the
energy required by the electroyzer. Each of these improvements is an active area of research, the potential result of
which is indicated in the accompanying table.
Table. Electrolyzer Improvements
Nafion 117
50 ºC
Nafion
117
80 ºC
Membrane A
80 ºC
Membrane B
80 ºC
Membrane B
80 ºC
Adv. Cat.
Calculated Open-Circuit
Voltage (V)
1.210 1.180 1.180 1.180 1.180
Anode Overpotential (V) 0.300 0.275 0.275 0.275 0.235
Cathode Overpotential (V) 0.015 0.010 0.010 0.010 0.010
Membrane Resistance
(iR voltage loss)
0.450 0.250 0.140 0.080 0.080
Contact resistance
(iR voltage loss)
0.025 0.025 0.025 0.025 0.025
Cell Voltage (V) 2.00 1.74 1.63 1.57 1.53
Energy Consumption
(kW-hr/kg H2)
54 47 44 42 41
High Pressure Hydrogen Production Hydrogen gas occurs only in trace amounts in the atmosphere and, as such, does not itself represent a source
of energy, but rather a material for the storage and transportation of energy. Steam reforming of fossil fuels and
thermal decomposition of water are potential sources of hydrogen [4]. Another is the electrolysis of water to produce
hydrogen and oxygen gas. The prime sources of the electrical energy required for electrolysis can come from
traditional sources such as coal, hydroelectric, nuclear or oil, or it can come from renewable sources such as wind,
solar energy, or biomass.
Hydrogen possesses a relatively low energy content on a volume basis compared to liquid hydrocarbon fuels.
Unlike liquid or solid fuels, these factors make it difficult to store sufficient hydrogen at low pressures to meet
anticipated requirements. Though cryogenic storage, metal hydride storage, and chemical hydride storage have been
identified as potential means of hydrogen containment, currently high pressure storage seems to present the best option
for storing sufficient energy to accomplish transportation objectives with existing technologies.
The efficiency of hydrogen production must consider both the electrolytic and auxiliary energy costs.
Electrolyzer efficiency may be expressed as the electric energy required to generate a specific amount of gas (such as
kW-hr/kg), we can refer to this measure as the energy cost of production. That cost of production is dependent on
factors such as temperature, contact resistance, electrode polarization, and electrolyzer operating pressure. The
operating pressure effects the cross-membrane diffusion of the hydrogen and oxygen. When hydrogen crosses to the
oxygen side (and the reverse) the two reaction products recombine to form water and the product gases are lost.
Membrane permeability is a function of the PEM material, its water content and thickness, cell operating temperature,
and partial pressures. Crossover losses are proportional to membrane permeability and cross-sectional area, which is
dependent on current density for a given production rate. For Membrane A cells at 28 bar, 80C, and 21.5 kA/m² ,
the diffusional losses are equivalent to approximately 1.5 kW-hr/kg. For the Membrane B cells under similar
conditions the back-diffusion losses are 2.0 kW-hr/kg.
The cell must also provide the thermodynamic work required to compress the hydrogen gas. For the 26 bar
differential pressure case, the isothermal compression of hydrogen is equivalent to 46 mV or 1.3 kW-hr/kg, and is a
function of pressure and temperature only. The energy cost of mechanical compressors is higher still. Compressor
manufacturers typically measure their system efficiency against an isentropic compression ideal. Isentropic

compression of an ideal gas(assuming a constant specific heat ratio of 1.4) to a pressure ratio of 26 requires 67% more
energy than isothermal compression. Diaphragm compressors typically operate at efficiencies of 50% (or 4.4 kW-
hr/kg) and considering the cost penalty of the compressors and their associated cooling and drying equipment the
high-pressure electrolyzer is an intriguing choice.
Some strategies for the production of hydrogen anticipate producing the hydrogen at low pressures (<35 bar)
and subsequently mechanically compressing the hydrogen to the storage pressure (~345 bar) while other strategies
seek to produce the hydrogen in the electrolytic cell directly at the pressure required. In this study we have chosen to
model these two strategies as well as an intermediate strategy of producing the hydrogen at moderate pressures
(35 – 345 bar) and utilizing mechanical compression to reach the final storage pressure.
Methods
The first consideration is the electrochemical process. Factors considered include the reversible cell potential,
the target current density, electrode Tafel corrections, membrane types and resistances, Nernstian voltages associated
with the compression of the hydrogen produced, and contact resistances. Next considered is the size of the individual
cells, the number of cells per electrolyzer, and the number of electrolyzers required for a particular production target.
Electric power losses are considered in the power supplies, parasitic losses (pumps, fans, heaters, etc.), and in
supplemental compression requirements and efficiencies. Capital costs for repeating and non-repeating elements of
the electrolyzer stack as well as the labor requirements and rates for assembly are included.
Estimates are included for the costs of balance of plant items such as power supplies, vessels, pumps, controls,
hardware, and supplemental compression equipment. Maintenance and installation labor are included. Economic
factors such as amortization, interest, term, profit, load factors and tax rates are likewise included.
Results
Our proprietary integrated model can be used to calculate the costs of producing electrolytic hydrogen
utilizing differing production strategies. In the specific case of supplying 330 kg H2/day at 345 bar operating at a
typical 70% load factor the comparison of manufacturing hydrogen at low pressures (23 bar) with two-stage
supplemental compression, moderate pressure (138 bar) with one stage of compression, and directly at 345 bar with
no supplemental compression. Within each of these strategies we examined the effects of current density and power
costs to determine the relative economics of hydrogen production, using material and labor estimates consistent with
low volume production of the electrolyzer systems. Those results are illustrated in Figure 5 below.
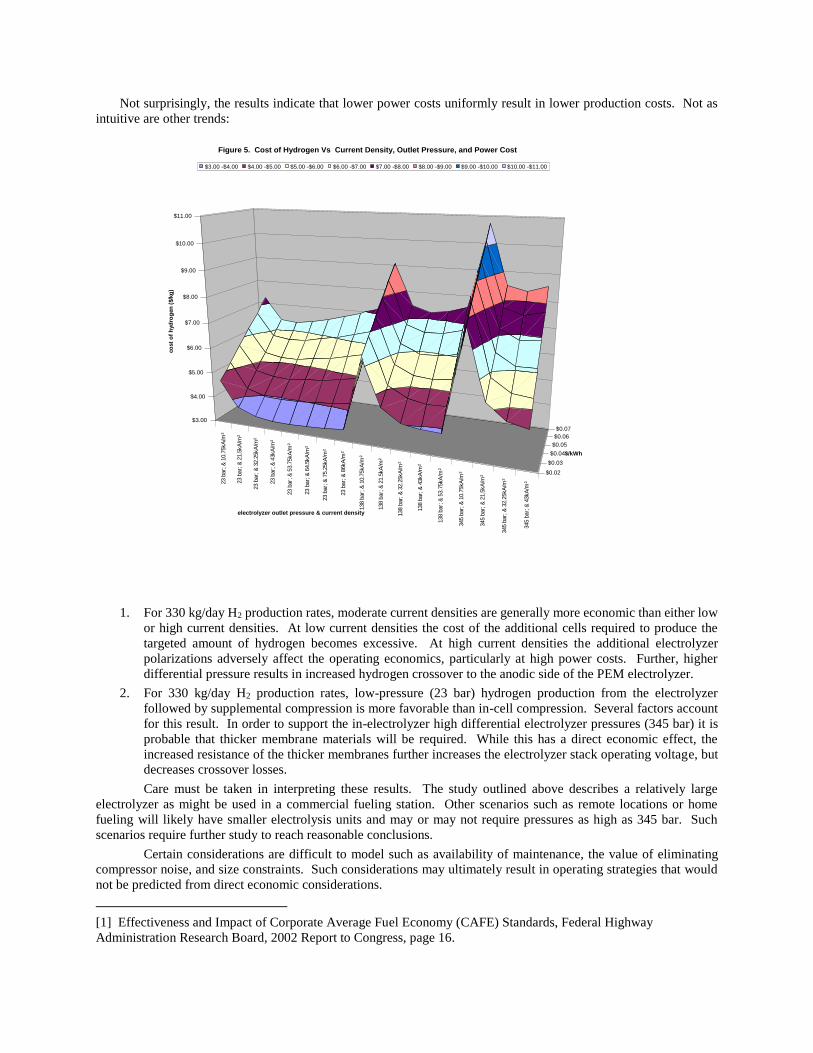
Not surprisingly, the results indicate that lower power costs uniformly result in lower production costs. Not as
intuitive are other trends:
1. For 330 kg/day H2 production rates, moderate current densities are generally more economic than either low
or high current densities. At low current densities the cost of the additional cells required to produce the
targeted amount of hydrogen becomes excessive. At high current densities the additional electrolyzer
polarizations adversely affect the operating economics, particularly at high power costs. Further, higher
differential pressure results in increased hydrogen crossover to the anodic side of the PEM electrolyzer.
2. For 330 kg/day H2 production rates, low-pressure (23 bar) hydrogen production from the electrolyzer
followed by supplemental compression is more favorable than in-cell compression. Several factors account
for this result. In order to support the in-electrolyzer high differential electrolyzer pressures (345 bar) it is
probable that thicker membrane materials will be required. While this has a direct economic effect, the
increased resistance of the thicker membranes further increases the electrolyzer stack operating voltage, but
decreases crossover losses.
Care must be taken in interpreting these results. The study outlined above describes a relatively large
electrolyzer as might be used in a commercial fueling station. Other scenarios such as remote locations or home
fueling will likely have smaller electrolysis units and may or may not require pressures as high as 345 bar. Such
scenarios require further study to reach reasonable conclusions.
Certain considerations are difficult to model such as availability of maintenance, the value of eliminating
compressor noise, and size constraints. Such considerations may ultimately result in operating strategies that would
not be predicted from direct economic considerations.
[1] Effectiveness and Impact of Corporate Average Fuel Economy (CAFE) Standards, Federal Highway
Administration Research Board, 2002 Report to Congress, page 16.
23 b
ar;
& 1
0.7
5kA
/m²
23 b
ar;
& 2
1.5
kA
/m²
23 b
ar;
& 3
2.2
5kA
/m²
23 b
ar;
& 4
3kA
/m²
23 b
ar;
& 5
3.7
5kA
/m²
23 b
ar;
& 6
4.5
kA
/m²
23 b
ar;
& 7
5.2
5kA
/m²
23 b
ar;
& 8
6kA
/m²
138 b
ar;
& 1
0.7
5kA
/m²
138 b
ar;
& 2
1.5
kA
/m²
138 b
ar;
& 3
2.2
5kA
/m²
138 b
ar;
& 4
3kA
/m²
138 b
ar;
& 5
3.7
5kA
/m²
345 b
ar;
& 1
0.7
5kA
/m²
345 b
ar;
& 2
1.5
kA
/m²
345 b
ar;
& 3
2.2
5kA
/m²
345 b
ar;
& 4
3kA
/m²
$0.02
$0.03
$0.04
$0.05
$0.06
$0.07
$3.00
$4.00
$5.00
$6.00
$7.00
$8.00
$9.00
$10.00
$11.00
co
st
of
hyd
rog
en
($/k
g)
electrolyzer outlet pressure & current density
$/kWh
Figure 5. Cost of Hydrogen Vs Current Density, Outlet Pressure, and Power Cost
$3.00 -$4.00 $4.00 -$5.00 $5.00 -$6.00 $6.00 -$7.00 $7.00 -$8.00 $8.00 -$9.00 $9.00 -$10.00 $10.00 -$11.00

[2] Internal Combustion Engine Fundamentals, John B. Heywood, McGraw-Hill Books, New York,1998, p.915
[3] Wheel-to-Wheel Energy Use & Greenhouse Gas Emissions of Advanced Fuel/Vehicle Systems, General
Motors, Argonne National Laboratory, BP, ExxonMobile, Shell, June 2001, Volume 2, p2-10.
[4] “Large-Scale Production of Hydrogen by Nuclear Energy for the Hydrogen Economy”, Lloyd C. Brown, et. al.,
AIChE 2002 Spring National Meeting, New Orleans, LA March 2002.