TECHNICAL REPORT STANDARD TITLE PAGE 1. … · The 1990 AASHTO's A Policy on Geometric Design of...
84
TECHNICAL REPORT STANDARD TITLE PAGE 1. Report No. 2. Government Accession No. 3. Recipient's Catalog No. TX-92/1949-1 4. Title and Subtitle 5. Report Date September 1992 A Historical and Literature Review of Horizontal Curve Design 7. Author(s) Kay Fitzpatrick and Karen Kahl 9. Performing Organization Name and Address Texas Transportation Institute The Texas A&M University System College Station, Texas 77843 12. Sponsoring Agency Name and Address Texas Department of Transportation Transportation Planning Division P.O. Box 5051 Austin, Texas 77863 15. Supplementary Notes Research performed with state funds. 6. Performing Organization Code 8. Performing Organization Report No. Research Report 1949-1 10. Work Unit No. 11. Contract or Grant No. Study No. 2-8-92-1949 13. Type of Report and Period Covered Final _ November 1991 August 1992 14. Sponsoring Agency Code Research Study Title: Material Development -- Superelevation Section -- TxDOT Design Manual 16. Abstract The 1990 AASHTO's A Policy on Geometric Design of Highways and Streets contains information on three superelevation design procedures: rural highways and high-speed urban streets, low-speed urban streets, and curvature of turning roadways and curvature at intersections. This report reviews the history of the horizontal curve design procedures through the published policies (1940 to 1990), presents findings from the literature on key issues, and discusses additional research needs on side friction factors and transition length determination. Side friction factors used in high-speed and low-speed design were determined using vehicle occupant comfort as the selection criterion. This criterion assumes that drivers limit their speed on curves to ensure comfort, and that discomfort is directly related to the unbalanced side-friction. Several concerns or issues accompany these assumptions. For example, the speed at which discomfort (or side pitch) first becomes noticeable may be slower than necessary for comfort or safety and the level of discomfort felt by a driver may not be solely related to side friction only. These assumptions also do not directly consider vehicle characteristics or constant safety factors over the range of design speeds. Transition length determination for high-speed and intersection design is based on appearance and comfort. The criterion was developed to avoid an appearance that results from too rapid a change in superelevation. For low-speed design, a change in acceleration over the change in time factor, known as C, is used to determine superelevation runoff. High-speed design includes factors that are to be used to determine runoff lengths for roads with more than two lanes. Low-speed design does not include similar factors to adjust for wider pavements; however, it does include a method for adjusting runoff length for radii larger than minimum that the high-speed design procedure does not include. 17. Key Words Superelevation, side friction factor, transition length, history of design procedures 18. Distribution Statement No restrictions. This document is available to the public through the National Technical Information Service 5285 Port Royal Road Springfield, Virginia 22161 19. Security Classif. (of this report) Unclassified 20. Security Classif. (of this page) Unclassified 21. No. of Pages 22. Price 82
Transcript of TECHNICAL REPORT STANDARD TITLE PAGE 1. … · The 1990 AASHTO's A Policy on Geometric Design of...
TECHNICAL REPORT STANDARD TITLE PAGE
1. Report No. 2. Government Accession No. 3. Recipient's Catalog No.
TX-92/1949-1
4. Title and Subtitle 5. Report Date September 1992 A Historical and Literature Review of Horizontal Curve Design
7. Author(s) Kay Fitzpatrick and Karen Kahl
9. Performing Organization Name and Address
Texas Transportation Institute The Texas A&M University System College Station, Texas 77843
12. Sponsoring Agency Name and Address
Texas Department of Transportation Transportation Planning Division P.O. Box 5051 Austin, Texas 77863
15. Supplementary Notes
Research performed with state funds.
6. Performing Organization Code
8. Performing Organization Report No.
Research Report 1949-1
10. Work Unit No.
11. Contract or Grant No. Study No. 2-8-92-1949
13. Type of Report and Period Covered
Final _ November 1991 August 1992
14. Sponsoring Agency Code
Research Study Title: Material Development -- Superelevation Section -- TxDOT Design Manual
16. Abstract
The 1990 AASHTO's A Policy on Geometric Design of Highways and Streets contains information on three superelevation design procedures: rural highways and high-speed urban streets, low-speed urban streets, and curvature of turning roadways and curvature at intersections. This report reviews the history of the horizontal curve design procedures through the published policies (1940 to 1990), presents findings from the literature on key issues, and discusses additional research needs on side friction factors and transition length determination.
Side friction factors used in high-speed and low-speed design were determined using vehicle occupant comfort as the selection criterion. This criterion assumes that drivers limit their speed on curves to ensure comfort, and that discomfort is directly related to the unbalanced side-friction. Several concerns or issues accompany these assumptions. For example, the speed at which discomfort (or side pitch) first becomes noticeable may be slower than necessary for comfort or safety and the level of discomfort felt by a driver may not be solely related to side friction only. These assumptions also do not directly consider vehicle characteristics or constant safety factors over the range of design speeds.
Transition length determination for high-speed and intersection design is based on appearance and comfort. The criterion was developed to avoid an appearance that results from too rapid a change in superelevation. For low-speed design, a change in acceleration over the change in time factor, known as C, is used to determine superelevation runoff. High-speed design includes factors that are to be used to determine runoff lengths for roads with more than two lanes. Low-speed design does not include similar factors to adjust for wider pavements; however, it does include a method for adjusting runoff length for radii larger than minimum that the high-speed design procedure does not include.
17. Key Words
Superelevation, side friction factor, transition length, history of design procedures
18. Distribution Statement No restrictions. This document is available to the public through the National Technical Information Service 5285 Port Royal Road Springfield, Virginia 22161
19. Security Classif. (of this report)
Unclassified 20. Security Classif. (of this page)
Unclassified 21. No. of Pages 22. Price
82


A mSTORICAL AND LITERATURE REVIEW OF HORIZONTAL CURVE DESIGN
by
Kay Fitzpatrick, P .E. Assistant Research Engineer
and
Karen Kahl Graduate Research Assistant
Research Report 1949-1
Research Study No. 2-8-92-1949 Task B
Texas Transportation Institute The Texas A&M University System
College Station, Texas 77843
Prepared for the
Texas Department of Transportation
September 1992

METRIC (SI *) CONVERSION FACTORS
APPROXIMATE CONVERSIONS TO SI UNITS APPROXIMATE CONVERSIONS TO SI UNITS
Symbol When You Know Multiply By To Find Symbol Symbol When You Know Multiply By To Find Symbol
LENGTH LENGTH
In Inches 2.54 centimeters cm mm millimeters 0.039 Inches In It feet 0.3048 metere m m meters 3.28 feet It yd yards 0.914 metere m yd meters 1.09 yards yd ml miles 1.61 kilometers km km kilometers 0.621 miles ml
AREA AREA
In 2 square Inches 8.452 centimeters squared 2 2
millimeters equared 0.0016 square Inches In 2 cm mm ftl square feet 0.0929 meters squared m 2 ma meters squared 10.764 square feet ft2 yd 2 square yards 0.836 meters squared mf yd
2 kilometers squared 0.39 square miles mit
mil square miles 2.59 kilometers squared km 2 ha hectares (10.000 m 2 ) 2.53 acres ae
ae acres 0.395 hectares ha
MASS (weight) MASS (weight)
0% ounces 28.35 grams g 9 grame 0.0353 ounces oz Ib pounds 0.454 kilograms kg kg kilograms 2.205 pounds Ib T short tons (2000 Ib) 0.907 megagrams Mg Mg megagrams (1000 kg) 1.103 short lon8 T
VOLUME VOLUME
II oz fluid ounces 29.57 millimeters mL mL millimeters 0.034 fluid ounces fI oz gal gallone 3.785 liters L L liters 0.264 gallons gal ft' cubic feet 0.0328 meters cubed m3 m' meters cubed 35.315 cubic feet ft' yd' cubic yards 0.765 meters cubed m' m' meters cubed 1.308 cubic yards yd 3
Note: Volume. gteale~ than 1000 L shall be shown In m '.
TEMPERATURE (exact) TEMPERATURE (exact)
OF Fahrenheit 5/9 (after Celsius °C °C Celsius 9/5 (then Fahrenheit OF temperature subtracting 32) temperature temperature add 32) temperature
32 98.6 212· F These factors conform to the requirement of FHWA Order 5190.1A -40·F 0 J40 80 120 160 200 J
I I I I I I I I I I I I I I I I I I
·SI Ie the symbol for the International System of Measurements -40·0 ·20 0 20 40 60 80 100·C 31


ABSTRACT
The 1990 AASHTO's A Policy on Geometric Design of Highways and Streets contains information on three superelevation design procedures: rural highways and high-speed urban streets, low-speed urban streets, and curvature of turning roadways and curvature at intersections. This report reviews the history of the horizontal curve design procedures through the published policies (1940 to 1990), presents findings from the literature on key issues, and discusses additional research needs on side friction factors and transition length determination.
Side friction factors used in high-speed and low-speed design were determined using vehicle occupant comfort as the selection criterion. This criterion assumes that drivers limit their speed on curves to ensure comfort, and that discomfort is directly related to the unbalanced side-friction. Several concerns or issues accompany these assumptions. For example, the speed at which discomfort (or side pitch) first becomes noticeable may be slower than necessary for comfort or safety and the level of discomfort felt by a driver may not be solely related to side friction only. These assumptions also do not directly consider vehicle characteristics or constant safety factors over the range of design speeds.
Transition length determination for high-speed and intersection design is based on appearance and comfort. The criterion was developed to avoid an appearance that results from too rapid a change in superelevation. For low-speed design, a change in acceleration over the change in time factor, known as C, is used to determine superelevation runoff. High-speed design includes factors that are to be used to determine runoff lengths for roads with more than two lanes. Low-speed design does not include similar factors to adjust for wider pavements; however, it does include a method for adjusting runoff length for radii larger than minimum that the high-speed design procedure does not include.
v

IMPLEMENTATION STATEMENT
This report provides the reader with an appreciation of the origin and evolution of the superelevation design procedures. This information could be valuable in deciding when to deviate from Green Book procedures. The report concludes with two problem statements that could be advanced to national organizations for possible funding. Funding of these problem statements may change the basis of superelevation design from comfort and appearance to safety and cost effectiveness.
DISCLAIMER
The contents of this report reflect the views of the author who is responsible for the facts and accuracy of the data presented herein. The contents do not necessarily reflect the official views or policies of the Texas Department of Transportation. This report does not constitute a standard, specification, or regulation. This report is not intended for construction, bidding, or permit purposes. This report was prepared by Kay Fitzpatrick (PA-037730-E) and Karen Kahl.
vi

TABLE OF CONTENTS
Chapter
1 INTRODUCTION .......................................... 1 DESIGN PROCEDURES ...................................... 1 REPORT OBJECTIVE ........................................ 2 ORGANIZATION OF REPORT .................................. 2
2 OVERVIEW OF SUPERELEV A TION ............................. 5 DEFINITION OF SUPERELEV ATION ............................. 5 POINT-MASS EQUATION ..................................... 5 SIDE FRICTION ........................................... 5 DISTRIBUTION OF SUPERELEVATION RATE AND SIDE FRICTION FACTORS. 6 SUPERELEVATIONRUNOFF .................................. 8 DESIGN CATEGORIES ....................................... 8
Rural Highways and High-Speed Urban Streets ....................... 8 Low-Speed Urban Streets .................................... 9 Curvature of Turning Roadways and Curvature at Intersections . . . . . . . . . . . . 14
3 HISTORY OF SUPERELEVATION AND THE SUPERELEVATION EQUATION (1800s-1941) . . . . . . . . . . . . . . . . . . . . . . . . . . . . . . . . . . . . . . . . . . . . . 17 SUPERELEVATION ON RAILROADS ............................ 17 INITIAL USE OF SUPERELEV ATION ON HIGHWAYS: CONFLICT BETWEEN
AUTOMOBILES AND HORSE DRAWN CARRIAGES . . . . . . . . . . . . . . . . 17 EARLY SUPERELEVATION EQUATIONS (PRE-1920s) ................. 18 AGG'S TEXTBOOKS ....................................... 19 OTHER PROPOSED EQUATIONS ............................... 20 FRICTION RECOGNIZED AS COUNTERPART FOR SUPERELEVATION ..... 21 EARLY AASHO POLICY ............................. ....... 23
4 SUPERELEVATIONRATES .................................. 25 PRE-AASHO POLICIES . . . . . . . . . . . . . . . . . . . . . . . . . . . ........... 25 RURAL HIGHWAYS AND HIGH-SPEED URBAN STREET DESIGN ........ 26
1941 AASH 0 Policy . . . . . . . . . . . . . . . . . . . . . . . . . . . . . . . . . . . . . . 26 1954 AASHO Policy ...................................... 26 1965 AASHO Policy ...................................... 27 1984 AASHTO Policy ..................................... 27 1990 AASHTO Policy . . . . . . . . . . . . . . . . . . . . . . . . . . . . . . . ...... 28
CURVATURE OF TURNING ROADWAYS AND CURVATURE AT INTERSECTIONS . . . . . . . . . . . . . . . . . . . . . . . . . . . . . . . . . . . . . . . 28 1940 AASHO Policy ...................................... 28 1954 AASHO Policy ...................................... 28 1965, 1984, and 1990 AASHTO Policies ......................... 29
LOW-SPEED URBAN STREETS ................................ 29 1984 and 1990 AASHTO Policies .............................. 29
Vll

TABLE OF CONTENTS (continued)
Chapter
5 FRICTION.............................................. 31 EARLY RESEARCH ON FRICTION (1920s to 1940) ................... 31
Early Studies .......................................... 31 Barnett's Study ......................................... 31 Other Influential Early Studies (see Figure 1) ....................... 32
RURAL HIGHWAYS AND HIGH-SPEED URBAN STREET DESIGN ........ 33 1945 AASHO Policy ...................................... 33 1954 AASHO Policy ...................................... 33 1965 AASHO Policy ...................................... 34 1984 AASHTO Policy ..................................... 34 1990 AASHTO Policy . . . . . . . . . . . . . . . . . . . . . . . . . . . . . . . . . . . . . 34 Comparison of Policies .................................... 35
CURVATURE OF TURNING ROADWAYS AND CURVATURE AT INTERSECTIONS . . . . . . . . . . . . . . . . . . . . . . . . . . . . . . . . . . . . . . . 35 1940 AASHO Policy ...................................... 35 1954 AASHO Policy ...................................... 36 1965, 1984, and 1990 AASHTO Policies ......................... 37
LOW-SPEED URBAN STREETS ................................ 37 1984 and 1990 AASHTO Policies .............................. 37
RECENT RESEARCH ON FRICTION . . . . . . . . . . . . . . . . . . . . . . . . . . . . . 37 Emmerson (1969) . . . . . . . . . . . . . . . . . . . . . . . . . . . . . . . . . . . . . . . . 37 Glennon (1969) . . . . . . . . . . . . . . . . . . . . . . . . . . . . . . . . . . . . . . . . . 38 Glennon and Weaver (1971) ................................. 38 Ivey et al. (1974) ........................................ 40 Bell (1980) ............................................ 40 McLean (1983) ......................................... 41 MacAdam et al. (1985) .................................... 42 Lamm et al. (1991) ....................................... 42
6 TRANSITION DESIGN .............................. ....... 45 PRE-AASHO POLICIES ...................................... 45 RURAL HIGHWAYS AND HIGH-SPEED URBAN STREET DESIGN ........ 46
1941 AASHO Policy ...................................... 46 1954 AASHO Policy ...................................... 46 1965 AASHO Policy . . . . . . . . . . . . . . . . . . . . . . . . . . . . . . . . . ..... 47 1984 AASHTO Policy ..................................... 47 1990 AASHTO Policy ..................................... 47
CURVATURE OF TURNING ROADWAYS AND CURVATURE AT INTERSECTIONS ..................... ' .................. 47 1940 AASHO Policy ...................................... 47 1954 AASHO Policy ...................................... 48 1965 AASHO Policy ...................................... 48 1984 and 1990 AASHTO Policies .............................. 49
Vlll

TABLE OF CONTENTS (continued)
Chapter
LOW-SPEED URBAN STREETS ................................ 49 1984 and 1990 AASHTO Policies .............................. 49
7 POINT-MASS EQUATION ................................... 51 GLENNON (1969) ......................................... 51 MACADAM ET AL. (1980) ................................... 51
8 TRUCK CONCERNS . . . . . . . . . . . . . . . . . . . . . . . . . . . . . . . . . . . . . . . 53 HIGH-SPEED DESIGN ...................................... 53 CURVATURE OF TURNING ROADWAYS AND CURVATURE AT
INTERSECTIONS ....................................... 56
9 SU:MMARY ............................................. 59 HIGH-SPEED DESIGN ...................................... 59
Superelevation Rates . . . . . . . . . . . . . . . . . . . . . . . . . . . . . . . . . . . . . . 59 Friction . . . . . . . . . . . . . . . . . . . . . . . . . . . . . . . . . . . . . . . . . . . . . . 59 Transition Design . . . . . . . . . . . . . . . . . . . . . . . . . . . . . . . . . . . . . . . . 60
INTERSECTION DESIGN .................................... 60 Superelevation Rates . . . . . . . . . . . . . . . . . . . . . . . . . . . . . . . . . . . . . . 60 Friction . . . . . . . . . . . . . . . . . . . . . . . . . . . . . . . . . . . . . . . . . . . . . . 60 Transition Design . . . . . . . . . . . . . . . . . . . . . . . . . . . . . . . . . . . . . . . . 61
LOW-SPEED URBAN STREETS DESIGN .......................... 61 Superelevation Rates ...................................... 61 Friction . . . . . . . . . . . . . . . . . . . . . . . . . . . . . . . . . . . . . . . . . . . . . . 61 Transition Design . . . . . . . . . . . . . . . . . . . . . . . . . . . . . . . . . . . . . . . . 61
RECENT RESEARCH . . . . . . . . . . . . . . . . . . . . . . . . . . . . . . . . . . . . . . . 62 Friction . . . . . . . . . . . . . . . . . . . . . . . . . . . . . . . . . . . . . . . . . . . . . . 62 Point-Mass Equation ...................................... 62 Truck Concerns . . . . . . . . . . . . . . . . . . . . . . . . . . . . . . . . . . . . . . . . . 63
10 PROPOSED RESEARCH PROBLEM STATEMENTS ................. 65
REFERENCES ............................................. 67
ix

x
LIST OF FIGURES
Figure
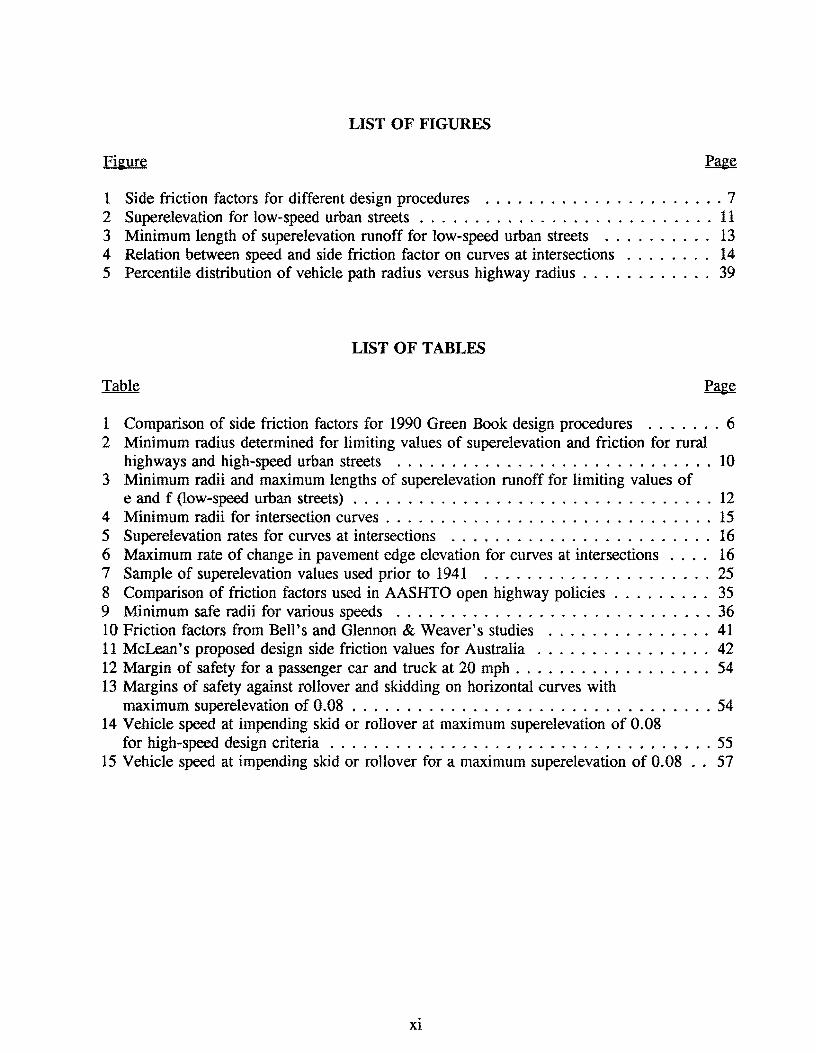
1 Side friction factors for different design procedures ...................... 7 2 Superelevation for low-speed urban streets . . . . . . . . . . . . . . . . . . . . . . . . . . . 11 3 Minimum length of superelevation runoff for low-speed urban streets .......... 13 4 Relation between speed and side friction factor on curves at intersections .. . . . . .. 14 5 Percentile distribution of vehicle path radius versus highway radius . . . . . . . . . . . . 39
LIST OF TABLES
1 Comparison of side friction factors for 1990 Green Book design procedures ....... 6 2 Minimum radius determined for limiting values of superelevation and friction for rural
highways and high-speed urban streets ............................. 10 3 Minimum radii and maximum lengths of superelevation runoff for limiting values of
e and f (low-speed urban streets) . . . . . . . . . . . . . . . . . . . . . . . . . . . . . . . . . 12 4 Minimum radii for intersection curves . . . . . . . . . . . . . . . . . . . . . . . . . . . . . . 15 5 Superelevation rates for curves at intersections ........................ 16 6 Maximum rate of change in pavement edge elevation for curves at intersections . . .. 16 7 Sample of superelevation values used prior to 1941 ..................... 25 8 Comparison of friction factors used in AASHTO open highway policies ......... 35 9 Minimum safe radii for various speeds ............................. 36 10 Friction factors from Bell's and Glennon & Weaver's studies ............... 41 11 McLean's proposed design side friction values for Australia ................ 42 12 Margin of safety for a passenger car and truck at 20 mph .................. 54 13 Margins of safety against rollover and skidding on horizontal curves with
maximum superelevation of 0.08 ................................. 54 14 Vehicle speed at impending skid or rollover at maximum superelevation of 0.08
for high-speed design criteria . . . . . . . . . . . . . . . . . . . . . . . . . . . . . . . . . . . 55 15 Vehicle speed at impending skid or rollover for a maximum superelevation of 0.08 .. 57
Xl

xu

CHAPTER 1
INTRODUCTION
The issues in highway geometric design and safety are a constant challenge. Many of the concerns facing the industry today also were a problem in the 1920s and 1930s. In the early part of the century, the existing system needed reconstruction to accommodate the needs of motor vehicles, rather than horse-drawn traffic. The surfaces needed to be stronger and the alignment redesigned to accommodate higher operating speed. Superelevation and friction are one aspect of the challenges facing the highway engineer in striving for adequate, safe, and economical designs.
As a vehicle traverses a horizontal curve, forces are acting upon it. These forces include the vehicle weight component related to the superelevation of the road and the side friction developed between the vehicles' tires and the road's surface. In the design of roadway curves it is necessary to establish the proper relationship of speed and curvature with superelevation and side friction. Although these relations stem from the laws of mechanics, the actual values for use in design depend on practical limits and factors determined more or less empirically over the range of variables involved.
DESIGN PROCEDURES
The American Association of State Highway and Transportation Officials' (AASHTO) 1990 A Policy on Geometric Design of Highways and Streets l (commonly called the Green Book) includes information on three superelevation design procedures:
• Rural Highways and High-Speed Urban Streets
• Low-Speed Urban Streets
• Curvature of Turning Roadways and Curvature at Intersections
These procedures will be referred to as high-speed, low-speed, or intersection design, respectively, in this report. The high-speed design is for use on all rural highways, on urban freeways, and on urban streets where speed is relatively high and relatively uniform. Low-speed design is used for through roads and streets in urban areas. The centrifugal force is initially counteracted with side friction and then with superelevation up to the maximum superelevation. Low-speed design is applied where the use of superelevation is "impractical" and where drivers "have developed a higher threshold of discomfort". Intersection design is used for curvature of turning roadways and curvature at high-speed, at-grade intersections.
1
Chapter 1: Introduction
REPORT OBJECTIVE
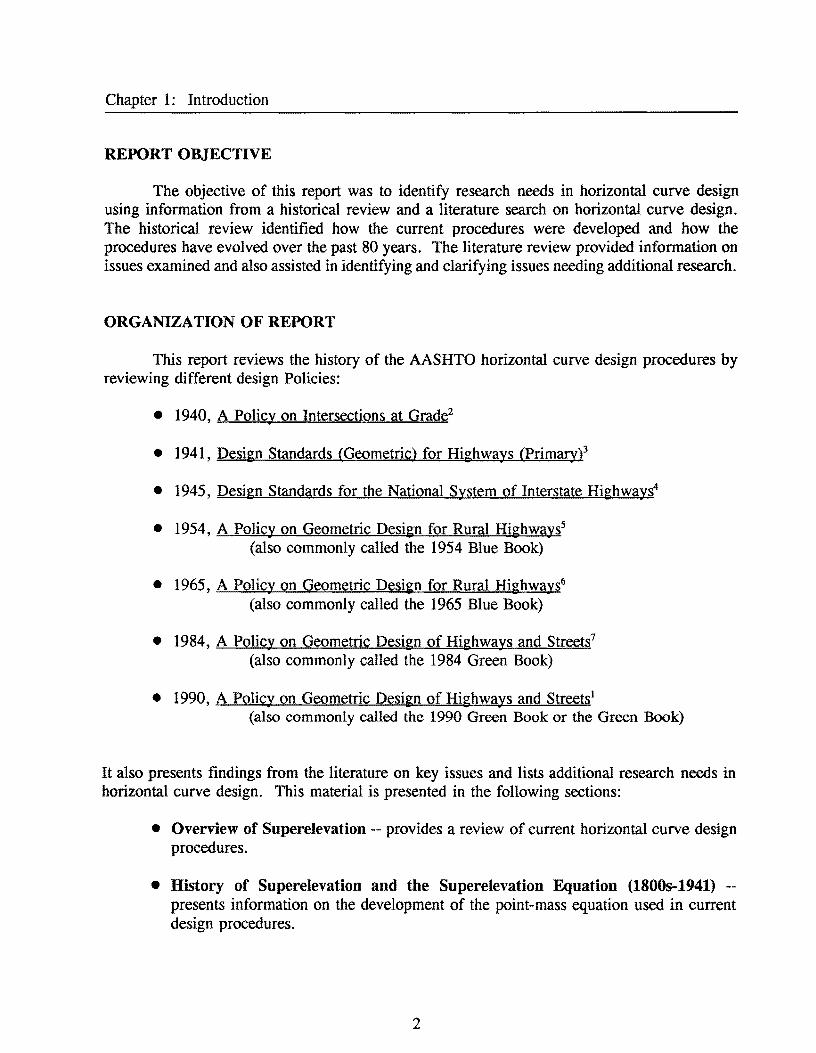
The objective of this report was to identify research needs in horizontal curve design using information from a historical review and a literature search on horizontal curve design. The historical review identified how the current procedures were developed and how the procedures have evolved over the past 80 years. The literature review provided information on issues examined and also assisted in identifying and clarifying issues needing additional research.
ORGANIZATION OF REPORT
This report reviews the history of the AASHTO horizontal curve design procedures by reviewing different design Policies:
• 1940, A Policy on Intersections at Grade2
• 1941, Design Standards {Geometric} for Highways (primary)3
• 1945, Design Standards for the National System of Interstate Highways4
• 1954, A Policy on Geometric Design for Rural Highways5
(also commonly called the 1954 Blue Book)
• 1965, A Policy on Geometric Design for Rural Highways6
(also commonly called the 1965 Blue Book)
• 1984, A Policy on Geometric Design of Highways and Streets7
(also commonly called the 1984 Green Book)
• 1990, A Policy on Geometric Design of Highways and Streets l
(also commonly called the 1990 Green Book or the Green Book)
It also presents findings from the literature on key issues and lists additional research needs in horizontal curve design. This material is presented in the following sections:
• Overview of Superelevation -- provides a review of current horizontal curve design procedures.
• History of Superelevation and the Superelevation Equation (1800s-1941) -presents information on the development of the point-mass equation used in current design procedures.
2

Chapter 1: Introduction
• Superelevation Rates -- traces the superelevation rates used for different design procedures from as early as the 191Os.
• Friction -- begins with discussions on friction research conducted in the 1920s and 1930s, continues with information on values used in the design procedures in each of the AASHTO policies, and concludes with information on friction available from the literature.
• Transition Design -- presents information on transition design, also called superelevation runoff, from pre-AASHTO policies to the 1990 Policy.
• Point-Mass Equation -- includes the findings from two research projects on the validity of the equation.
• Truck Concerns -- includes the findings on two research efforts that examined the use of truck characteristics in AASHTO' s current Policy.
• Summary -- provides a brief review of the issues discussed in this report.
• Proposed Research Prob1em Statements -- provides problem statements on issues needing additional research.
3

Chapter 1; Introduction
4

CHAYfER 2
OVERVIEW OF SUPERELEVATION
DEFINITION OF SUPERELEV ATION
When a vehicle moves in a circular path, it is forced radially outward by centrifugal force. Superelevation is the rotating of the roadway cross-section to offset the centrifugal force acting on a vehicle traversing a curved section. For each combination of curve radius and travel speed, there is a specific superelevation that will precisely balance centrifugal force. When a vehicle travels at speeds greater than those at which the superelevation balances all of the centrifugal force, side friction is needed to keep the vehicle on the curved path.
POINT-MASS EQUATION
In the design of highway curves, a mathematical relationship exists between design speed, curvature, superelevation, and side friction. When a vehicle moves in a circular path, it is forced radially outward by centrifugal force. The centrifugal force is counterbalanced by the vehicle weight component related to the roadway superelevation or the side friction developed between the tires and the surface or by a combination of the two. Using the laws of mechanics, the basic point mass (curve) formula derived to represent vehicle operation on a curve is:
where:
e -f -
V -R -
e+f=
rate of roadway superelevation (ftlft) side friction factor vehicle speed (mph) radius of curve (ft)
(1)
The above equation is used to determine the minImum radius of a curve for a specific superelevation rate and side friction factor. Based on "accumulated research and experience", the Green Book presents limiting values for superelevation and friction. These values vary in the different design categories included in the 1990 Green Book (high-speed, low-speed, and intersection design) and will be discussed in the following sections.
SIDE FRICTION
The side friction factor represents the friction present between the tires and the surface that is counteracting the unbalanced lateral force on a vehicle negotiating a curve. The upper limit of this factor is the point where the tire is skidding, or the point of impending skid.
5

Chapter 2: Overview of Superelevation
Because, as the Green Book states, "highway curves are designed to avoid skidding conditions with a margin of safety, the friction values should be substantially less than the coefficient of friction of impending skid." The Green Book also states that "the portion of the side friction factors that can be used with comfort and safety by the vast majority of drivers should be the maximum allowable value for design." The values present in the 1990 Green Book for highspeed design are at "the point at which the centrifugal force is sufficient to cause the driver to experience a feeling of discomfort and cause him to react instinctively to avoid higher speed." Table 1 and Figure 1 compare the different friction factors for the three design methods.
Table 1. Comparison of side friction factors for 1990 Green Book design procedures.
Design Speed (mph) High Speed Low Speed Intersections
10 .38 15 .32 20 .17 .300 .27 25 .252 .23 30 .16 .221 .20 35 .197 .18 40 .15 .178 .16 45 50 .14 55 .13 60 .12 65 .11 70 .10
Based on: Studies conducted in the 1930s and 1940s 1950s studies that determined the distribution of speed on intersection curves
Source: Tables III-6, 1II-16, and 1II-17 in the 1990 Green Book.
DISTRIBUTION OF SUPERELEVATION RATE AND SIDE FRICTION FACTORS
If a radius selected for a curve is greater than the minimum radius determined from Equation 1 (or available from the appropriate table in the Green Book), then the designer uses a superelevation rate that is less than the maximum superelevation assumed. Tables and/or figures are included in the Green Book for this purpose. These tables were developed based upon an assumed distribution of superelevation rates and side friction factors. Several methods are available for distributing superelevation and friction over a range of curves.
6

.. ~ t; -< ... z 0 i:: u ~ e fIl
.32
.30
.26
.26
.24
.22
.20
.16
.16
.14
.12
.10
Assumed for Low-Speed -+-- Urban Design
for Intersection
• • HRB 1940 Moyer & Berry
~---------+----------~········~------~----~~~~~--------+---------~~HRB 1936
Assumed for Design
Barnett
Meyer 1949
L---------~---·------~----------L-________ _L __________ ·~ ________ ~~HRB 1940 10 20 30 40 50 60 70 Stone>: & Noble
DESIGN SPEED (MPH)
Source: Figure III -7 and Figure III -17 in the 1990 Green Book.
Figure 1. Side friction factors for different design procedures.
Chapter 2: Overview of Superelevation
The Green Book lists five methods: (1) straight line relation, (2) counteracting the centrifugal force with friction up to the maximum friction, then using a straight line relation increasing superelevation as curvature increases up to maximum superelevation, (3) counteracting the centrifugal force with superelevation only until maximum superelevation is reached, then using a straight line relation increasing friction as curvature increases up to maximum friction, (4) same as previous method except based on average running speed instead of design speed, and (5) a curvilinear relation between superelevation and side friction.
The curvilinear relation (Method 5) is assumed for high-speed design. Low-speed design has the centrifugal force counteracted with friction until maximum friction is reached then uses superelevation (Method 2). Method 2 was selected because "drivers [in urban areas] are more tolerant of discomfort, thus permitting employment of an increased amount of side friction for use in design of horizontal curves."
SUPERELEV ATION RUNOFF
The 1990 Green Book defines superelevation runoff as the general term denoting the length of highway needed to accomplish the change in cross slope from a section with adverse crown removed to a fully superelevated section, or vice versa. Tangent runout is the general term denoting the length of highway needed to accomplish the change in cross slope from a normal crown section to a section with the adverse crown removed, or vice versa.
DESIGN CATEGORIES
The 1990 Green Book contains three types of superelevation design: rural highways and high-speed urban streets, low-speed urban streets, and curvature of turning roadways and curvature at intersections. The process used in each of the design methods is briefly discussed below. Most of this information is contained in the Green Book's Chapter III, Elements of Design. Some of the information for at-grade intersections is included in Chapter IX, At-Grade Intersections.
Rural Highways and High-Speed Urban Streets
The design procedure for rural highways and high-speed urban streets uses side friction factors that were selected based upon studies conducted in the 1930s and 1940s. Several of these studies were based on discomfort. One study asked the participants to indicate when they felt a "side pitch outward" while another one made assumptions of when "the driver of a car senses some discomfort and when the hazard of skidding off the curve becomes apparent."
The maximum superelevation rate !lis of the order of 0.10 or sometimes a maximum rate of 0.12 is used. Use of rates above 0.08 invariably are in areas without snow or ice." The
8

Chapter 2: Overview of Superelevation
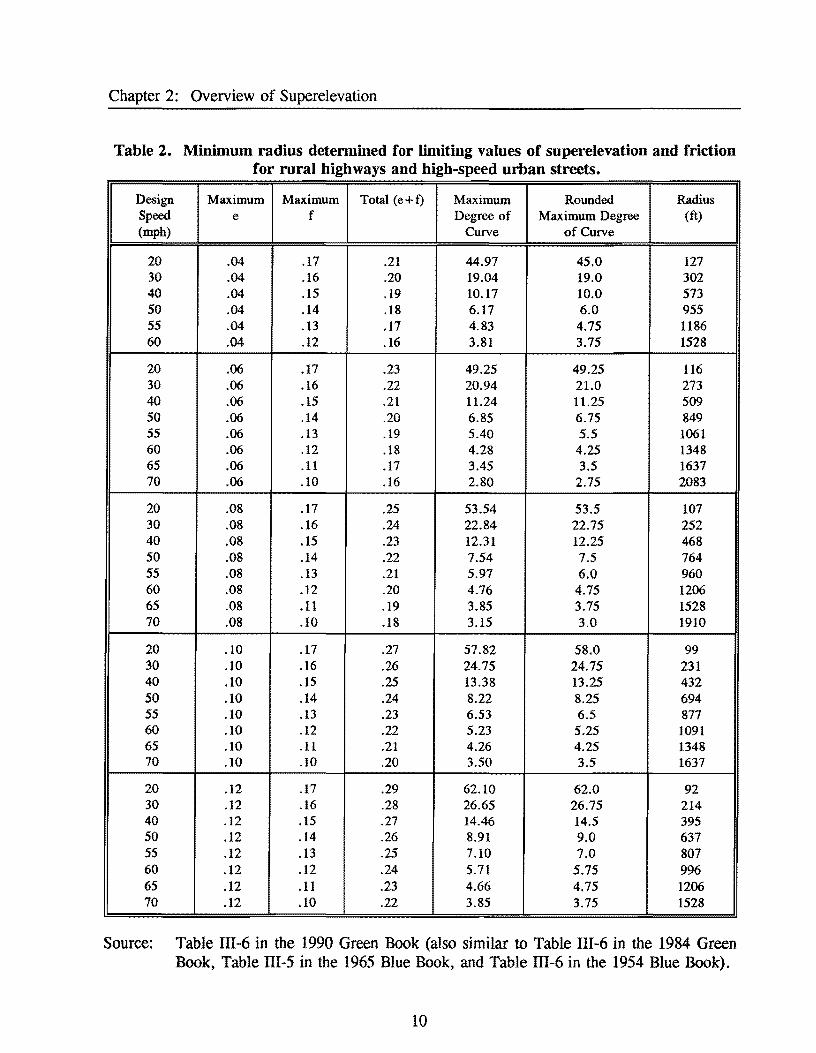
distribution of superelevation rates and side friction factors with degree of curve is determined using a curvilinear relationship. Table 2 lists the minimum radii determined using the assumed side friction factors (listed in Table 1), equation 1, and various design speed and maximum superelevation rates.
Current practice, according to the 1990 Green Book, in designing the superelevation runoff, is based on appearance and comfort. For a design speed of 50 mph and higher, the runoff length should not exceed a longitudinal slope of 1:200. When design speeds are 30 and 40 mph, relative slopes of 1:150 and 1:175, respectively, are used. This practice results in runoff lengths that are directly proportional to the total superelevation, which is the product of the lane width and superelevation rate. Minimum runoff lengths equal to the distance traveled in 2 seconds at the design speed should be used for general appearance and to avoid undesirable abrupt edge-of-pavement profiles. For wider than two-lane pavements the Policy states that "on a purely empirical basis" three-lane pavements are 1.2 times, four-lane undivided pavements are 1.5 times, and six-lane undivided pavements are 2.0 times the corresponding length for two-lane highways.
Low-Speed Urban Streets
Low-speed design policy was first present in the 1984 Green Book. The friction factors used in the procedure are much higher than for high-speed highways (see Table 1 and Figure 1). The Green Book states that "they are based on a tolerable degree of discomfort and provide a reasonable margin of safety against skidding under normal driving conditions in the urban environment. " For low-speed design, none of the centrifugal force is counteracted by superelevation as long as the side friction factor is less than the maximum allowable for the degree of curve and the design speed. For sharper curves friction remains at the maximum and superelevation is used in direct proportion to the continued increase in curvature until superelevation reaches the maximum superelevation. This philosophy supports the concern of designing in developed areas (e.g., the difficulties in meeting grade of adjacent property, surface drainage considerations, and frequency of cross streets) and the idea that drivers have a higher threshold of discomfort on low-speed urban streets.
Figure 2 (also Green Book Figure 1II-19) provides the method to determine superelevation in those cases where the radius used in a design is greater than the minimum radius. Table 3 (also Green Book Table 1II-16) lists minimum radii values.
Superelevation runoff length for low-speed urban streets is based on the following equation:
L = 47.2 f (2)
9
Chapter 2: Overview of Superelevation
Table 2. Minimum radius detennined for limiting values of superelevation and friction for rural highways and high-speed urban streets.
Design Maximum Maximum Total (e+f) Maximum Rounded Radius Speed e f Degree of Maximum Degree (ft) (mph) Curve of Curve
20 .04 .17 .21 44.97 45.0 127 30 .04 .16 .20 19.04 19.0 302 40 .04 .15 .19 10.17 10.0 573 50 .04 .14 .18 6.17 6.0 955 55 .04 .13 .17 4.83 4.75 1186 60 .04 .12 .16 3.81 3.75 1528
20 .06 .17 .23 49.25 49.25 116 30 .06 .16 .22 20.94 21.0 273 40 .06 .15 .21 11.24 11.25 509 50 .06 .14 .20 6.85 6.75 849 55 .06 .13 .19 5.40 5.5 1061 60 .06 .12 .18 4.28 4.25 1348 65 .06 .11 .17 3.45 3.5 1637 70 .06 .10 .16 2.80 2.75 2083
20 .08 .17 .25 53.54 53.5 107 30 .08 .16 .24 22.84 22.75 252 40 .08 .15 .23 12.31 12.25 468 50 .08 .14 .22 7.54 7.5 764 55 .08 .13 .21 5.97 6.0 960 60 .08 .12 .20 4.76 4.75 1206 65 .08 .11 .19 3.85 3.75 1528 70 .08 .10 .18 3.15 3.0 1910
20 .10 .17 .27 57.82 58.0 99 30 .10 .16 .26 24.75 24.75 231 40 .10 .15 .25 13.38 13.25 432 50 .10 .14 .24 8.22 8.25 694 55 .10 .13 .23 6.53 6.5 877 60 .10 .12 .22 5.23 5.25 1091 65 .10 .il .21 4.26 4.25 1348 70 .10 .10 .20 3.50 3.5 1637
20 .12 .17 .29 62.10 62.0 92 30 .12 .16 .28 26.65 26.75 214 40 .12 .15 .27 14.46 14.5 395 50 .12 .14 .26 8.91 9.0 637 55 .12 .13 .25 7.10 7.0 807 60 .12 .12 .24 5.71 5.75 996 65 .12 .11 .23 4.66 4.75 1206 70 .12 .10 .22 3.85 3.75 1528
Source: Table 1II-6 in the 1990 Green Book (also similar to Table III-6 in the 1984 Green Book, Table III-5 in the 1965 Blue Book, and Table 111-6 in the 1954 Blue Book).
10

• 06 ft • 75
QJ .05 ..
QJ +> lIS
0::
c .04
eo
I 0 .... +> < lIS C > - QJ
.03 ..- W ..
N
"" c QJ c.. ::s .8 VI :If
.02
.015 o 85 100
135 215 320
t \ \ 145 \i \? I
N ~~ ~~ II'
~ .e \. :If
'\ \ \ \ \ ISS 200 ZS5 300 385 400
Radius, R(ft.)
For Radii larger Than Mintmum e • R Min. (eMax. + f)
- f R
Source: Figure III -19 in the 1990 Green Book.
Figure 2. Supereievation for low-speed urban streets.
450
'\ L M ....
\ VSOO
k~'" " .0 + ~ ~';{; 1> (Q~ ~ ()o'
\ 500 555 600

Chapter 2: Overview of Superelevation
where:
L = f -
VD -C -
length of superelevation runoff (ft) side friction factor design speed (mph) rate of change of f (ftlse2)
The value for C varies between 4.0 at 20 mph and 3.0 at 40 mph. Table 3 lists maximum lengths of superelevation runoff for minimum radius curves. A method for adjusting lengths of superelevation runoff is provided in Green Book Figure 111-20 (reproduced in this report as Figure 3) which also includes minimum runoff values.
Table 3. Minimum radii and maximum lengths of superelevation runoff for limiting values of e and f (low-speed urban streets).
Design Max e Maxf Total Min R C Min L Speed (e+f) (ft) (ft)
20 0.06 0.300 0.360 75 4.00 75 25 0.06 0.252 0.312 135 3.75 80 30 0.06 0.221 0.281 215 3.50 90 35 0.06 0.197 0.257 320 3.25 100 40 0.06 0.178 0.238 450 3.00 115
20 0.04 0.300 0.340 80 4.00 75 25 0.04 0.252 0.242 145 3.75 80 30 0.04 0.221 0.261 230 3.50 90 35 0.04 0.197 0.237 345 3.25 100 40 0.04 0.178 0.218 490 3.00 115
20 0.00 0.300 0.300 90 4.00 75 25 0.00 0.252 0.252 165 3.75 80 30 0.00 0.221 0.221 275 3.50 90 35 0.00 0.197 0.197 415 3.25 100 40 0.00 0.178 0.178 600 3.00 115
Source: Table 111-16 in the 1990 Green Book (also similar to Table 111-15 in the 1984 Green Book)
12

() ::r ~ fii .... N
0 <:
~ _. lror-------------,--------------r------------~--------------r_------------,_------------,
0 ~ 0 -. en
9S ~ '\j
@ -~ j:).) ..... -. 0 ::3
100 c 0 .... +-II I'tI >-CU • 80 ,.... +-II
f!!:. CU-l C. :::s .. In ....
15,
for "1n. R .... 60 .... 0 oc
:::s .c ICI:: - +-II W tTl
C CU 40 -I
20L--------------L ______________ L-____________ ~--------------+_----________ ~ ____________ ~ o 100 200 300 400 500 600
Radius R. (ft.)
R Min. For Radii Larger Than Minimum L • R x LMax •
Source: Figure III-20 in the 1990 Green Book.
Figure 3. Minimum length of superelevation runoff for low-speed urban st~ts.

Chapter 2: Overview of Superelevation
Curvature of Turning Roadways and Curvature at Intersections
Until the late 1930s little attention was given to the design of curves at intersections. In the late 1930s, the need for two types of design procedures was recognized and developed. These procedures were high speed and intersection. Lower design values were argued for intersection design because drivers had "developed a higher threshold of discomfort", had "various warning provided", and anticipated more critical conditions.
The friction factors for curvatures of turning roadways and high-speed at-grade intersections were based on studies conducted in the 1950s that determined the distribution of speeds on intersection curves (see Figure 4). Minimum radii were calculated with the point -mass equation. The Green Book argues that "it is desirable to establish a single minimum radius for each design speed", which they did by assuming a "likely minimum rate of superelevation that could nearly always be obtained for certain radii." Table 4 lists the minimum radii for intersection curves. The Green Book also states that "if more superelevation than this minimum is actually provided, drivers will either be able to drive the curves a little faster or drive them more comfortably because of less friction. "
70 ~I I I I
LEGEND:
60
~ Ass_d for rural Each symbol represents an , and hfgh speed
• urban streets - Intersection cune studied -J:
i -~ so ... .... .... c: ~
~ 40 ~
0-
In C'I
30 'Q ~ ~ a..
'" 20
\ Open highway Passenger vehicles sampled \ conditfons at each location -, 0 Less tIIan 50 , • 50 to 100
~ A ISO to 300 0 300 or lUre
. ~\ oA 0 0
0
e A \~o °0
0 Assumed for intersection
0)0 0,,", < curve d: i gn
I 10 .....
..... ....... 0
o 0.1 0.2 0.3 0.4 0.5 0.6 0.7 0.8
Side Friction Factor. f
Source: Figure III-21 in 1990 Green Book.
Figure 4. Relation between speed and side friction factor on curves at intersections.
14

Chapter 2: Overview of Superelevation
Table 4. Minimum radii for intersection curves.
Design (turning) speed (mph) 10 15 20 25 30 35 40 Side friction factor, f 0.38 0.32 0.27 0.23 0.20 0.18 0.16 Assumed minimum superelevation,e 0.00 0.00 0.02 0.04 0.06 0.08 0.09 Total e+f 0.38 0.32 0.29 0.27 0.26 0.26 0.25 Calculated minimum radius, R (ft) 18 47 92 154 231 314 426
Suggested curvature for design: Radius--minimum (ft) 25 50 90 150 230 310 430 Degree of curve--maximum --- --- 64 38 25 18 13
Average running speed (mph) 10 14 18 22 26 30 34
Source: Table 111-17 in 1990 Green Book (also similar to Table 111-16 in the 1984 Green Book, Table VII-3 in the 1965 Blue Book, and Table VII-3 in the 1954 Blue Book).
The Green Book indicates that the minimum radii is preferably on the inner edge of the pavement rather than on the middle of the vehicle path or the centerline of the pavement. It also advocates that "as much superelevation as feasible up to a practical limit be developed." The practicaIlimits are 0.08 to 0.12 where snow and/or ice are not a factor. Some cautions are also included: a lesser amount of superelevation "usually is in order" when all traffic comes to a stop (Le., stop signs), and superelevation may have to be limited when large trucks use an intersection because they have difficulty negotiating intersection curves with superelevation.
The Elements of Design chapter in the Green Book (which contains the majority of information on superelevation) did not include any discussion on superelevation runoff for curves at at-grade intersections, however, it did include discussion on length of spirals which has been used as the runoff length in previous policies. The chapter on At-Grade Intersections included suggested superelevation rates (reproduced in Table 5), and superelevation runoff rates that are based on the method used in high-speed design (listed in Table 6).
15

Chapter 2: Overview of Superelevation
Table S. Superelevation rates for curves at intersections.
Radius Degree Range in superelevation rate (foot per foot) for intersection curves (feet) of Curve with design speed, mph of:
15 20 25 30 35 40
50 .02-.10 90 63.6 .02-.07 .02-.10 150 38.2 .02-.05 .02-.08 .04-.10
230 24.8 .02-.04 .02-.06 .03-.08 .06-.10 310 18.5 .02-.03 .02-.04 .03-.06 .05-.09 .08-.10 430 13.3 .02-.03 .02-.03 .03-.05 .04-.07 .06-.09 .09-.10
600 9.6 .02 .02-.03 .02-.04 .03-.05 .05-.07 .07-.09 1000 5.7 .02 .02-.03 .02-.03 .03-.04 .04-.05 .05-.06 1500 3.8 .02 .02 .02 .02-.03 .03-.04 .04-.05
2000 2.9 .02 .02 .02 .02 .02-.03 .03-.04 3000 1.9 .02 .02 .02 .02 .02 .02-.03
Note: Preferably use superelevation rate in upper half or third of indicated range. In areas where snow or ice is frequent, use maximum rate of 0.06 or 0.08.
Source: Table IX-12 in 1990 Green Book (also Table IX-12 in the 1984 Green Book, Table VU-12 in the 1965 Blue Book, and Table VII-12 in the 1954 Blue Book).
Table 6. Maximum rate of change in pavement edge elevation for curves at intersections.
Design Speed (mph) 15-25 30 40 50 55 60 65 70 Maximum relative gradients for profiles
between the edge of two lane pavement 0.71 0.67 0.58 0.50 0.47 0.45 0.41 0.40 and the centerline (percent)
Source: Table IX-13 in the 1990 Green Book.
16
CHAPTER 3
HISTORY OF SUPERELEVATION AND THE SUPERELEVATION EQUATION (1800s-1941)
SUPERELEV ATION ON RAILROADS
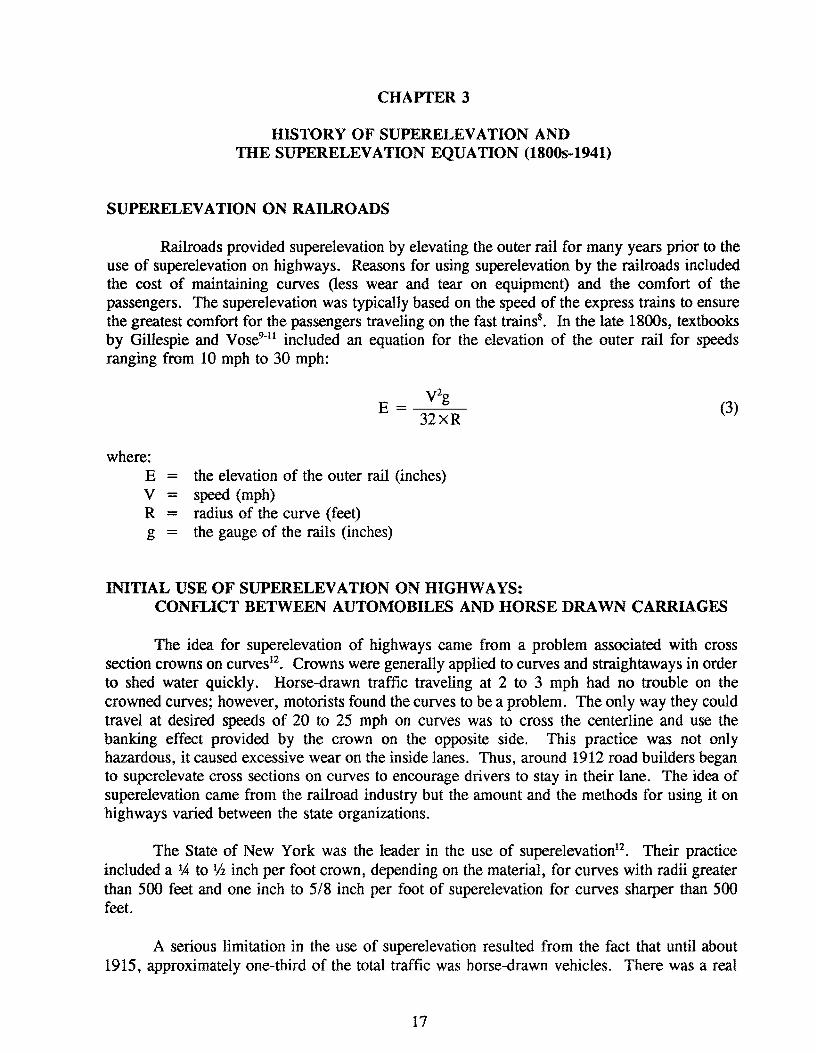
Railroads provided superelevation by elevating the outer rail for many years prior to the use of superelevation on highways. Reasons for using superelevation by the railroads included the cost of maintaining curves (less wear and tear on equipment) and the comfort of the passengers. The supere1evation was typically based on the speed of the express trains to ensure the greatest comfort for the passengers traveling on the fast trains8
• In the late 1800s, textbooks by Gillespie and Yose9-n included an equation for the elevation of the outer rail for speeds ranging from 10 mph to 30 mph:
where:
y2g E=---
32xR
E - the elevation of the outer rail (inches) y - speed (mph) R - radius of the curve (feet) g - the gauge of the rails (inches)
INITIAL USE OF SUPERELEV ATION ON HIGHWAYS:
(3)
CONFLICT BETWEEN AUTOMOBILES AND HORSE DRAWN CARRIAGES
The idea for superelevation of highways came from a problem associated with cross section crowns on curves!2. Crowns were generally applied to curves and straightaways in order to shed water quickly. Horse-drawn traffic traveling at 2 to 3 mph had no trouble on the crowned curves; however, motorists found the curves to be a problem. The only way they could travel at desired speeds of 20 to 25 mph on curves was to cross the centerline and use the banking effect provided by the crown on the opposite side. This practice was not only hazardous, it caused excessive wear on the inside lanes. Thus, around 1912 road builders began to superelevate cross sections on curves to encourage drivers to stay in their lane. The idea of superelevation came from the railroad industry but the amount and the methods for using it on highways varied between the state organizations.
The State of New York was the leader in the use of superelevation12• Their practice included a 1,4 to lh inch per foot crown, depending on the material, for curves with radii greater than 500 feet and one inch to 5/8 inch per foot of superelevation for curves sharper than 500 feet.
A serious limitation in the use of superelevation resulted from the fact that until about 1915, approximately one-third of the total traffic was horse-drawn vehicles. There was a real
17

Chapter 3: History of Superelevation and the Superelevation Equation (18oos-1941)
danger that if a sharp curve were superelevated sufficiently for the vehicles traveling 20 or 30 mph, then the cross slope would be so steep that the horse-drawn vehicles would slide sideways when the surface was slippery. Also, the public was also concerned that superelevation would encourage higher speeds and reckless driving on curves. 12
Highway engineers faced a challenge when they initially considered superelevation. Luedke and Harrison8 in 1920 commented:
" ... the problem of the highway engineer is not merely one of providing such superelevation that all vehicles proceeding at a legal speed can round these curves without danger, but of so designing curves that horse-drawn traffic, for instance, which moves at only 3 or 4 miles an hour can use the highway without danger of sliding to the inside edge of the pavement. "
EARLY SUPERELEV ATION EQUATIONS (PRE-1920s)
Blanchard13 first mentioned the use of superelevation on highways in a 1915 textbook. He quoted the conclusion adopted by the First International Road Congress held in Paris in 1908:
"The radii of curves should be as great as possible, 164 feet at least; the outside of curves should be slight! y raised but so as not to inconvenience ordinary vehicles; no obstructions to the view should be allowed at curves. "
In 1918 Downs14 stated that a purely mathematical determination of superelevation was not possible due to the constraints placed on speed from short sight distances and horse drawn traffic. However, an equation could be used as a basis for determining the most appropriate values:
e=
where: e - superelevation (feet per foot width of road) V - speed (mph) R - radius of the curve (feet) g - gravity
(4)
Downs did not support the results or give any evidence of his experiments beyond stating the equation. He emphasized that the safe speed allowed by a restricted sight distance was the controlling factor for determining the amount of superelevation. He assumed that an average vehicle traveling at 10 mph could be safely brought to a stop in a distance of 50 feet on a comparatively slippery road on a curve of 35 degrees. Using this assumption, a plot of relative
18

Chapter 3: History of Superelevation and the Superelevation Equation (1800s-1941)
safe speeds for different curves was overlaid on graphical results from the theoretical equation. The combined results gave a basis for determining the superelevation. A value chosen for superelevation had to be below a maximum of 0.062 feet per foot because a superelevation above the value could cause the horses to fallon slippery roadways.
With the increasing popularity of the automobile, safety on the roads was strongly encouraged. The assumption that drivers would drive slower on the curves than on the tangents was inaccurate as seen by the increasing number of accidents prior to the 1920s. The decrease in horse-drawn traffic by the late 1910s and the concept of a consistent speed along the entire length of the highway compelled Luedke and Harrison8 to analyze superelevation. Using the centrifugal force and the weight of a moving vehicle they presented the same equation as Downs except they substituted 32.2 for the value of g and combined it with a unit conversion factor:
y2 e=---
15xR (5)
They also realized that the values obtained from the equation were unique for each speed and could cause sliding problems for the slower moving traffic, so they proposed rates. The arbitrary rates were chosen based on the idea that full superelevation was not necessary and the maximum rate was 0.10. Using the proposed research ideas, the Committee on Recommended Practice for Road Construction encouraged a maximum superelevation of 3/4 inch per foot on curves with radii less than 150 feet and 112 inch per foot for radii between 150 and 500 feet. The normal crown was recommended for curves with radii above 500 feet.
In 1921, Harger15 cited typical superelevation rates that were in practice for different geometric conditions and for different jurisdictions. Unlike Downs and Luedke and Harrison, he explained that there were too many variable factors to offer a mathematical explanation but he stated that superelevation was necessary to allow easier driving at reasonable speeds on the curve and to reduce the side thrust of the wheels and the danger of skidding. The values he offered ranged from 1 I,4 inch per foot on radii of 50-200 feet down to 1/2 inch per foot on radii of 800-1000 feet.
AGG'S TEXTBOOKS
The series of textbooks by T.R. Agg were the earliest references of those obtained by the authors that present friction in the superelevation equation. The third edition (1924) of Agg's text16 justified superelevation as enabling vehicles to maintain speed on the curve without danger or discomfort. The equation he proposed was equivalent to:
V2
e + Kf = 15 R
19
(6)

Chapter 3: History of Superelevation and the Superelevation Equation (1800s-1941)
where: e
V R
--=
superelevation (foot per foot of width of traveled way) speed (mph) radius of the curve (feet)
f = coefficient of friction between the tires and surface when sliding is normal to the path of the wheel
K - percent of total weight on the rear wheels, usually 0.6
The coefficient of friction values ranged from 0.245 to 0.431 depending on the type of surface, condition of surface (wet or dry) and size and type of tires.
In the fourth edition of Agg's textbook17, he presented a similar equation (the tfK" term
was replaced with a lip" term). Agg stated that he derived the formula from the centrifugal force and the sliding or rolling force caused by an inclined plane. The coefficient of friction in the superelevation equation was not specifically derived but it was implied through the concept of the inclined plane. A table was included with a summary of coefficients of friction that were different from his earlier edition. The values ranged from 0.52 to 0.96 depending on the type of roadway surface, the condition of the surface, and the state of sliding (Le. four or two wheel start; uniform sliding).
OTHER PROPOSED EQUATIONS
In 1925 Myersl8 proposed a different equation for calculating superelevation which considered the conflict between high and low speed vehicles. For a speed of 30 mph, the equation was:
720 x=-
r
where: x = bank per foot of width (inches) r = radius of the curve (feet)
(7)
For other speeds, the bank varied directly with the square of the speed. For extremely short radius curves, however, the equation gave impractical rates and Myers suggested using the standards of the New York State Bureau of Highways which called for 1.5 inches per foot on curves with radii less than 300 feet. Myers believed that the maximum bank which was safe and comfortable for slow traffic under all conditions was between 0.5 and 0.75 inches per foot.
Myers also had a unique suggestion. He thought that designing the superelevation with parabolic sections on each lane would allow the driver to choose which lane to travel on depending on the speed the vehicle was being driven at: a superelevation of 0.5 inches per foot for slower speeds or 1.5 inches per foot for faster speeds. The design would have decreased
20

Chapter 3: History of Superelevation and the Superelevation Equation (1800s-1941)
the difference in elevation of the two sides which would decrease the amount of excavation and help with drainage. The angle where the two slabs met accentuated the centerline and would help keep traffic on their respective sides.
Through the late 1920s the expanding highway system spurred interest in roadway policy and design. Many highway textbooks were written during this time. Blanchard and Morrison19
stated that superelevation was needed for curves with radii less than 2000 feet. They recommended the equation mentioned by Downs14 and Luedke and Harrison8 and given by the Subcommittee on Design of the American Association of State Highway Officials:
v2
e = 0.067 x R
WileyZ° offered the same equation and briefly commented on friction:
It does not seem necessary to provide the full theoretical superelevation. A certain amount of centrifugal force seems to be unconsciously expected on a curve. A large number of measurements, performed by the author, on earth and gravel roads indicate that these roads naturally develop, under traffic, a superelevation equal to approximately one-half the theoretical superelevation.
(8)
Wiley suggested that the minimum desirable superelevation could be found with the recommended equation and a coefficient of 0.03 (approximately one-half the theoretical rate) rather than 0.067. Bateman21 followed the trend of his contemporaries by offering the superelevation equation in terms of velocity and radius, as well as, mentioning its inadequacies for the traffic mix and presenting the suggested alternative rates.
FRICTION RECOGNIZED AS COUNTERPART FOR SUPERELEVATION
In 1937, Connof2 discussed superelevation among the increasing problems that affected traffic. Although he gave the superelevation equation which included friction:
f 0.067 X V2
e+ =---R
(9)
he pointed out that common practice was to follow AASHO's latest recommendation. For speeds of 35-40 mph, AASHO suggested designing superelevation to counteract all centrifugal force wherever possible. The same formula was used and f was set equal to zero. Maximum curvature was based on volume. The practical maximum superelevation was approximately 1.25 inches per foot. The varying amounts of side friction were utilized when vehicles traveled at speeds greater than 40 mph. A value of 0.16 for friction was suggested for speeds up to 60
21
Chapter 3: History of Superelevation and the Superelevation Equation (1800s-1941)
mph. This method based curvature and superelevation on an assumed design speed by using this formula and the safe side friction.
Through the late 1930's most of the textbooks presented Luedke and Harrison's superelevation equation that was adopted by AASHO. The equation did not consider friction, thus the values overestimated the amount of superelevation needed. Bruce23 commented on the variability in superelevation distribution between the state policies caused by the incomplete equation and the arbitrarily chosen rates. The maximum rate of superelevation in most states was 1 inch per foot (0.08 ftlft) due to the liability of sliding on steeply banked roads covered with ice and snow. In states where these were not prevalent the maximum was 1.25 inches per foot (0.10 ftlft).
Agg's fifth edition24 continued to support the idea of friction in the superelevation equation. The average coefficients of friction changed from previous editions. The rates he suggested were based on the recent studies of friction between the tires and road surface performed at Iowa State College. The values were for wet road surfaces and they range from 0.18 to 1.0 depending on the type of surface, the speed, and the condition of the tires, excluding conditions with packed snow or sleet where friction was less than 0.10 or 0.05, respectively.
Barnett2S used findings from 900 road tests to determine friction factors. The tests were conducted by district engineers of the Public Roads Administration who were asked to determine the speed at which side pitch was felt. Since skidding occurred at much higher speeds than side pitch, Barnett felt that an ample margin of safety against skidding existed when the safe speed was labelled as the speed at which side pitch was first felt.
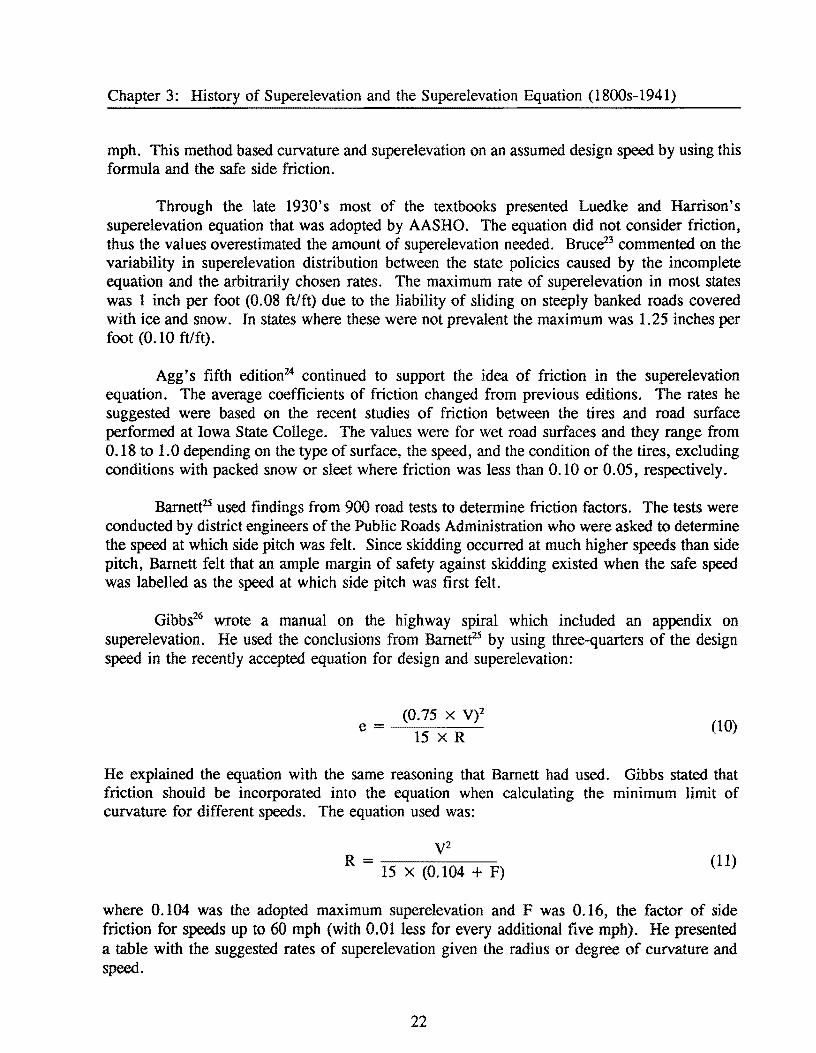
Gibbs26 wrote a manual on the highway spiral which included an appendix on superelevation. He used the conclusions from Barnett2S by using three-quarters of the design speed in the recently accepted equation for design and superelevation:
e= (0.75 X V)2
15 x R (10)
He explained the equation with the same reasoning that Barnett had used. Gibbs stated that friction should be incorporated into the equation when calculating the minimum limit of curvature for different speeds. The equation used was:
v2
R = ------------15 x (0.104 + F)
(11)
where 0.104 was the adopted maximum superelevation and F was 0.16, the factor of side friction for speeds up to 60 mph (with 0.01 less for every additional five mph), He presented a table with the suggested rates of superelevation given the radius or degree of curvature and speed.
22

Chapter 3: History of Superelevation and the Superelevation Equation (18oos-1941)
Beginning in the 1940s, most of the literature offered two equations for superelevation, one with friction and one without it. Bateman27 was one of many to present the entire picture by giving the formula:
v 2
e = -:--:--- - f 15 x R
(12)
where f was the safe coefficient of friction or the safe side friction factor for the speed V. He also referenced Moyer from Iowa State who observed that a maximum side friction factor of 0.30 could be developed before skidding; however, at speeds greater than 50 mph it was difficult to keep the vehicle in control. The Highway Research Board's Project Committee on Relation of Curvature to Speed used Barnett's conclusions for friction and recommended a maximum friction factor of 0.16 for speeds up to and including 60 mph, with a 0.01 reduction for an increase of 5 mph above 60 mph. Bateman pointed out the necessity of a design speed for determining the rate of superelevation and the choice of a friction factor to obtain the minimum radius or degree of curvature where superelevation begins.
EARLY AASHO POLICY
In 1937, AASHO formed a Special Committee on Administrative Design Policies to gather and evaluate the available information on the most urgent design problems 12. The committee later became the Operating Committee on Planning and Design Policies. Through the early 1940s they submitted different policies to AASHO for approval. Seven policies and three sets of standards concerning transportation design issues were published. One of the policies published in 1940, A Policy on Highway Types (Geometric)2, commented on crown and superelevation but did not offer numerical values:
"Four-lane undivided highways and those with flush median strips paved to the general level of the adjoining traffic lanes are treated like 2-lane and 3-lane highways as regards crown and superelevation. They are crowned at the center and drain to both sides. Superelevated cross sections should be continuous from one edge to the other.
Four-lane divided highways without paved flush median strips should be treated like two independent 2-1ane roads, each one crowned to drain to both edges and superelevated independently of the other."
In 1941, Design Standards (Geometric) for Highways (Primary)3 was published. Superelevation was discussed and standard values were suggested:
"The maximum superelevation shall be 0.12 foot per foot. Where snow and ice conditions prevail the maximum superelevation should be 0.08 foot per foot. In attaining superelevation, it is desirable that the slope of the outer edge of
23

Chapter 3: of Superelevation and the Superelevation Equation (1800s-1941)
pavement with respect to the profile of the center line should be not greater than 1 in 200."
Nothing was mentioned in the published policies or standards concerning friction.
24

CHAPTER 4
SUPERELEV ATION RATES
PRE-AASHO POLICIES
In the early 191Os, road builders began superelevating roads to decrease the wear on the inside lane by encouraging drivers to stay in their lane on a horizontal curve. The amount of superelevation used varied between state agencies. Table 7 lists a sample of superelevation values used prior to 1941.
Table 7. Sample of superelevation values used prior to 1941.
Year Superelevation Radius (ft) Source
1910s for concrete, rigid pavements New York State12
normal crown, 114 in/ft or 0.0208 >500 5/8 inlft or 0.0521 <500
1919 1 in 16 or 0.0625 <800 Harger & Bonney as cited in Good28
1920s 3/4 in/ft or 0.0625 <150 Committee on 112 in/ft or 0.0417 150 to 500 Recommended
normal crown >500 Practices for Road Constructions
1921 1 114 in/ft or 0.1042 50 to 200 Harger15
112 or 0.0417 800 to 1000
1924 0.04 819 to 409 North Carolina as 0.06 382 to 160 cited in Good2S
0.08 < 160
1927 0.08 maximum for curves less than 2000 ft Design subcommittee compensate for a speed of 35 mph (current speed limit) of AASHO as cited
in Good28
1937 0.10 maximum recommended for speeds of 35 to Design subcommittee 40 mph (current speed limits) of AASHO as cited
in Good28
1941 0.12 maximum or 0.08 maximum where snow & ice Design Standards conditions prevail (Geometric) for
Highways (Primary)3
25

Chapter 4: Superelevation Rates
RURAL HIGHWAYS AND HIGH-SPEED URBAN STREET DESIGN
1941 AASHO Policy
The Design Standards (Geometric) for Highways (Primary) stated that "the maximum superelevation shall be 0.12 foot per foot. When snow and ice conditions prevail the maximum superelevation should be 0.08 foot per foot.
1954 AASHO Policy
Maximum Superelevation Rate. The 1954 Policy contained more extensive discussion on maximum superelevation rates than the 1941 Policy. The 1954 Policy stated:
"[Rates of 0.12 and 0.13] offer advantage to the group of drivers in the upper speed brackets, [however,] current practice demonstrates that rates of 0.13 and above are beyond practical limits for open highways. This is in recognition of the combined controls of construction processes, maintenance difficulties, operation of vehicles at the lower speed brackets, etc. Thus, a superelevation rate of 0.12 appears to represent a maximum practical value where snow and ice problems do not exist. Where ice and snow are factors, experience has indicated that a superelevation rate of about 0.08 is a logical maximum to minimize slipping across the highway when stopped or when attempting to gain momentum from a stopped position."
Variation of Superelevation with Curvature. The maximum curvature and actual superelevation rates for flatter curves are included in the 1954 Policy for four maximum superelevation rates: 0.06, 0.08, 0.10, and 0.12. The information for 0.10 was included because some states had adopted 0.10 as their maximum rate. The information on 0.06 was included for those situations where the presence of large numbers of vehicles or extensive development acts to curb top speed. The 0.10 rate was referred to "as generally desirable or nationally representative" in the Policy.
In contrast with previous AASHO publications, the 1954 Policy contained an extensive discussion of potential relationships between superelevation and curvature. The policy argued that for radii between the extremes (0 and maximum) and for a given design speed, the superelevation should be distributed in such manner that there is a logical relation between the side friction factor and the applied superelevation rate. Four methods for distributing superelevation were discussed:
1. Superelevation rate is directly proportional to the degree of curve, i.e., a straight-line relation between D = 0 and D = maximum
26

Chapter 4: Superelevation Rates
2. Superelevation rate is such that a vehicle traveling at design speed has all centrifugal force counteracted by superelevation on curves up to that requiring the maximum superelevation, and maximum superelevation provided on all sharper curves.
3. Same as method 2 except based on average running speed.
4. Superelevation rate is in a curvilinear relation with degree of curve, with values between those of methods 1 and 2.
AASHO used method 4 to develop the superelevation rates used in design. The Policy stated that examination of current superelevation practice shows that the values based on method 4 are reasonably representative of the composite current practice and that the resulting friction factors are feasible.
1965 AASHO Policy
The 1965 Policy discussions on maximum superelevation rate and superelevation distribution were not changed from the 1954 Policy. It did include information on 65 and 75 mph design speeds and some rounding of the maximum degrees of curve.
1984 AASHTO Policy
Maximum Superelevation Rate. The maximum superelevation rate for open highways decreased from 0.12 to 0.10 between the 1965 and 1984 Policies. The 1984 Policy argued that "although higher superelevation rates offer an advantage to the group of drivers traveling at high speeds, current practice demonstrates that rates of 0.120 and above are beyond practical limits for open highways. Thus, a superelevation rate of 0.100 appears to represent a maximum practical value where snow and ice do not exist." Information on a maximum superelevation rate of 0.04 was added to the 1984 Policy. It is for use on low-speed urban streets. The value that is "generally desirable or nationally representative" changed between the 1965 and 1984 Policies; it was 0.10 in 1965 and 0.08 in 1984.
Variation of Superelevation with Curvature. The discussion on the procedures for distributing e and f over a range of curves was expanded in the 1984 Policy. A new method was added and several equations and a figure were provided to demonstrate how the finalized e distribution is obtained. The method added in the 1984 Policy has side friction counteracting all the centrifugal force until the maximum friction is reached, then superelevation is used in direct proportion until it reaches the maximum superelevation rate. (This new method was used in the low-speed design procedure, which was also introduced in the 1984 Policy.) Several minor differences (perhaps caused by rounding) exist between the two versions for the superelevation rates used in the high-speed procedure.
27
Chapter 4: Superelevation Rates
1990 AASHTO Policy
Maximum Superelevation Rate. Information on the maximum superelevation rate of 0.12 was returned to the 1990 Policy. While 0.10 is in common use, "sometimes a maximum rate of 0.12 is used". The value of 0.08 was still I/recognized as a reasonable valuel/. The Policy including data for five maximum superelevation rates: 0.04, 0.06, 0.08, 0.10, and 0.12.
Variation of Superelevation with Curvature. The discussion on distributing e and f and the resulting values were similar between the 1984 and 1990 Policies. The 1990 Policies did add information on a design speed of 55 mph.
CURVATURE OF TURNING ROADWAYS AND CURVATURE AT INTERSECTIONS
1940 AASHO Policy
Maximum Superelevation Rates. "For turning speeds of 40 and 50 mph .. Janes can be superelevated to the practical maximum of 0.10 foot per foot. For a turning speed of 30 mph a superelevation of 0.05 foot per foot appears to be reasonable. When turning movements are assumed to be made at 20 mph, the required superelevation is assumed to be zero."
Variation of Super elevation with Curvature. The 1940 Policy considered minimum radius curves only, and gave no guidance as to the appropriate superelevation to be furnished on flatter curves.
1954 AASHO Policy
Maximum Superelevation Rates. The Policy states that "the general factors which control the maximum rates of superelevation for open highway conditions ... also apply to intersection curves. Maximum superelevation rates up to 0.12 foot per foot, and possibly 0.14 on one-way connections, may be used where climatic conditions are favorable. The general range of maximum superelevation rates for curves at intersections, however, is 0.06 to 0.12. A maximum value of 0.06 to 0.08 generally is used where snow and icing conditions prevail. tI
Variation of Superelevation with Curvature. The Policy provides a table that lists suggested superelevation rates in relation to design speed and radius of curve (see Table 5) and states that the rates were "derived in much the same manner as for open highway curves." It also states that "the wide variation in likely speeds on intersection curves, as between periods when speed is affected by traffic volume and periods when traffic is light, precludes need for precision, so a range in superelevation rates is given for each combination of design speed and radius of intersection curve. A maximum rate of 0.12 is shown but the designer can use any other maximum rate."
28
Chapter 4: Superelevation Rates
1965, 1984, and 1990 AASHTO Policies
The 1965 Policy contained similar material to the 1954 Policy. The 1984 and 1990 Policies reduced the maximum rate from 0.12 to 0.10. The 1990 Policy also included a caution about" flatter curves and less superelevation" where there is a significant number of large trucks.
WW-SPEED URBAN STREETS
1984 and 1990 AASHTO Policies
Maximum Superelevation Rates. The 1984 and 1990 Policies state that a maximum superelevation rate of 0.04 or 0.06 is commonly used for low-speed design (high-speed design has maximum superelevation rate of 0.10).
Variation of Superelevation with Curvature. The superelevation rates for low-speed design are determined using a similar procedure that is used for high-speed design. The values selected for high-speed design are based on the assumption that superelevation and side friction vary in a curvilinear relation with the degree of curve. The values for low-speed design were developed under the assumption that the centrifugal forces will be counteracted in direct proportion by side friction up to the maximum assumed friction; then superelevation is used in direct proportion until it reaches maximum superelevation. Because several factors limit the use of superelevation in urban areas (i.e., wide pavement areas, need to meet the grade of adjacent property, surface drainage considerations, and frequency of cross streets, alleys, and driveways), horizontal curves on low-speed urban streets are frequently designed without superelevation, counteracting the centrifugal force solely with side friction.
The 1984 Policy provided an equation (and illustrated the findings in a figure) that could be used to determine the superelevation value that is to be used when a radius is larger than the minimum radius. The equation assumed that the superelevation rate would vary in a straight line relationship with the change in radius. The 1990 Policy included a revised equation and figure (see Figure 2) that was based on the point-mass equation. The revision brought the radii values into agreement with the distribution of superelevation and side friction factors with the curvature assumption discussed in the previous paragraph.
29

Chapter 4: Superelevation Rates
30

CHAPTER 5
FRICTION
EARLY RESEARCH ON FRICTION (1920s to 1940)
Early Studies
The Iowa State Experiment Station, under T. R. Agg conducted experiments in 1922 to determine the tractive resistance of automobiles on various types of road surfaces16. The experiments included studies of the sliding friction of rubber tires on various road surfaces. The coefficients for uniform straight sliding as measured in these tests ranged from 0.179 on hardpacked snow to 0.517 on wet concrete and 0.715 on dry concrete.
In 1934, Moye~9 reported on extensive tests used to determine side-friction factors. He observed blindfolded passengers in vehicles traveling on curves. When driven at speeds that a coefficient of 0.10 was required to counteract centrifugal force, the passengers could not sense clearly whether they were on a curve or a tangent. At faster speeds such that the coefficient was increased to 0.20, passengers could clearly sense that they were on a curve. When the coefficient was increased to 0.30 by further speed increase, passengers felt distinctly uncomfortable. At this speed both passengers and drivers felt a side pitch and some of the cars developed tire squeal on dry pavement. Moyer therefore concluded that " ... the maximum permissible speed on curves should not exceed that for which a useful coefficient of 0.3 to counteract centrifugal force is required." To be sure of developing this coefficient over a wide range of speeds, curvature, and driving practice, he stated that road surfaces should be constructed to provide a side skid coefficient of at least 0.6. at 30 mph. 29
Barnett's Study
A study which strongly influenced the design community was performed by Barnett26 in 1935-1936. He evaluated the findings from 900 road tests conducted by district engineers of the Public Roads Administration that dealt with superelevation, curvature, and the speed at which side pitch was felt. Since skidding occurred at much higher speeds than side pitch, Barnett felt that an ample margin of safety against skidding existed when the safe speed was labelled as the speed at which side pitch was first felt. The results indicated that vehicles traveled safely around curves at speeds that required side friction in addition to superelevation, up to 60 mph with a friction factor of 0.16 and a reduction of 0.01 for every 5 mph increase above 60 (see Figure 1). Adequate test data were not available to confirm the results for speeds above 70 mph. The side pitch was felt more at lower speeds on wet pavements than on dry pavements and on vehicles with individual front wheel suspension than on vehicles with standard front axles.
Good28 in a review of superelevation practices noted several deficiencies in the presentation of the data including a lack of investigation into the variability of individual responses (the findings were reported as "groups of individual observations") and the adoption of average values rather than some higher percentile value.
31

Chapter 5: Friction
Haile30 critiqued Barnett's study and stated that upon analyzing side pitch it was discovered that there is no property of a highway curve that can cause it to occur. A lurch is primarily caused by a spiral section that is too short. A more appropriate criterion for determining the safe speed would be the point when a driver has difficulty controlling the vehicle because it will predict more accurately the speeds that will be driven. This value would allow for a large factor of safety at high speeds rather than at low speeds where it is not as important.
In the second part of Barnett's studf6, he proposed that highways should have superelevation to counteract, where possible, all centrifugal force for three-quarters of the design speed. Rather than designing for the full design speed this new approach would allow easier steering for slower vehicles without penalizing faster moving vehicles, offer safer highways when traffic slows down due to slippery pavement from ice, and give greater uniformity of design for curves with widely differing radii. In addition, the alignment would not be affected when the highway is rehabilitated for higher design speeds.
Haile30 also disagreed with Barnett's conclusions for superelevation. He maintained that superelevated curves should be designed to counteract all centrifugal force, where possible, for the average speed of all vehicles, rather than the arbitrary value of three-quarters of the design speed. Operating speeds depended on many unpredictable factors, and the criteria should be based on the average values.
Moyerl1 supported Barnett's idea for superelevation but he suggested that the maximum safe speed on a curve should be designed for the maximum safe speed permissible on the straightaway because unexpected speed changes due to curves are very hazardous. He felt that it was unsafe to have different safe speeds on the curves and the straightaways. In addition, many drivers were not willing to slow down on the curves; therefore, they would operate at excessive speeds with small margins of safety.
Other Influential Early Studies (see Figure 1)
Moyer and Berry's32 work on advisory speed signs for curves was also influential. Based on a survey of state practices with regard to advisory speed signs, they concluded that "a ball bank indicator reading of 10 degrees was the most satisfactory indication of safe speed on curves." A ball-bank reading of 10 degrees corresponds to a side-friction factor of about 0.14 to 0.16 depending upon the body roll of the vehicle. Moyer and Berry interpreted the 10 degrees reading as the "value at which the driver of a car senses some discomfort and where the hazard of skidding off the curve becomes apparent." They modified the criterion to a 14 degree angle (f=0.21) for speeds up to 20 mph and a 12 degree angle (f=0.18) for speeds from 25 to 30 mph because at "low speeds slight loss of control or variations in the path of the car are not serious because in a short distance the error can be corrected. "
Stonex and Noble (1940)33 conducted high speed tests on the recently completed Pennsylvania Turnpike. Two results were attained during the tests: (1) an average speed of 103 mph with an unbalanced centrifugal ratio (cornering ratio) of 0.30 on a 3 degree curve and (2)
32

Chapter 5: Friction
an average speed of 85 mph with an unbalanced centrifugal ratio of 0.39 on a 6 degree curve. The authors cautioned, however, that the speeds and centrifugal ratios should not be considered as suitable for the traveling public because the tests were conducted with professional drivers and automotive equipment in excellent mechanical condition. The authors concluded that the unbalanced centrifugal ratio of 0.10 should not be exceeded when the design speed is 70 mph or more.
RURAL HIGHWAYS AND HIGH-SPEED URBAN STREETS
1945 AASHO Policy
The AASHO Design Standards for the National System of Interstate Highways adopted August 1, 19454 stated:
"The absolute maximum curvature is based upon a practical maximum superelevation and a safe value for side friction factor of 0.16 for speeds up to 60 mph and 0.14 for a speed of 70 mph. The desirable maximum curvature is based on the same friction factor but approximately half the maximum superelevation. II
These friction values were based on Barnett's25 work.
1954 AASHO Policy
In the 1954 Policy a new friction-design speed relationship was used. A plot was made of several studies conducted prior to 1954. (Figure 1, page 7 contains these curves along with the curves selected for design in the 1990 Green Book.) Based upon the information in the plot a straight-line relationship was assumed. AASHO stated that "[the line] provides a reasonably good margin of safety at the higher speeds and gives somewhat lower rates for the low design speeds than some of the other curves." Good28 in his review of superelevation made several comments concerning the data contained in Figure 1:
• Barnett's (1936) relationship was obtained as a somewhat dubious generalization of the results of tests in which observers were required to report when they felt a "side pitch outward" when traversing a curve. The results were analyzed on the assumption that there was a direct relationship between the calculated side-friction factor and the observer's report on whether or not a "side pitch" was experienced, despite contradictory evidence from some tests. The range of friction values obtained at a given speed was very wide, yet a biased average value was recommended for design, rather than an upper percentile value .
• Moyer and Berry's (1940) curve was based on a ball bank indicator. They interpreted the 10 degree reading as the "value at which the driver of a car senses some
33

Chapter 5: Friction
discomfort and where the hazard of skidding off the curve becomes apparent." They modified the 10 degree criterion for lower speed on the basis that loss of control was less serious at low speeds, and because of observations that a fairly large proportion of drivers exceeded the 10 degree "safe speed" on the lower speed curves. These observations were apparently not quantified in terms of friction, however, and the ball-bank angles suggested for low speeds appear to have been adopted somewhat arbitrarily.
• Stonex and Noble (1940) recommended that the design value of f should not exceed 0.10, for design speeds for 70 mph and higher. This figure was not based on the basis of comfort, but from considerations of the stability of driver control, and the increase in the actual friction demand of vehicles due to the effects of pavement irregularities, wind gusts, and the intermittency of driver control actions observed during tests on the recently completed Pennsylvania Turnpike.
• Meyer's (1949) curve is a smooth curve through Moyer and Berry's tabulated ballbank angles and their suggestion that 10 degrees would be too high for speeds above 50 to 60 mph.
• The Arizona curve, according the AASHO, marked "the values at which comfort ends and discomfort begins. \I How these values were obtained, and whether or not they were derived from Moyer and Berry's recommendations is not known.2S
1965 AASHO Policy
The 1965 version of AASHTO policy was the same as the 1954 material, except that the design speed range was extended to 80 mph (friction of 0.11 was recommended) and intermediate design speeds of 65 and 75 mph were included. The maximum recommended degrees of curve were also rounded to the nearest half degree.
1984 AASHTO Policy
Some of the friction factors in the 1984 Policy were modified slightly. The value at 60 mph was changed from 0.13 to 0.12, at 65 mph from 0.13 to 0.11, and at 70 mph from 0.12 to 0.10. The changes in side-friction values at the higher design speed were a result of adopting the findings from the 1940 study on the Pennsylvania Turnpike. The researchers of the study recommended that the side friction factor should not exceed 0.10 for design speeds of 70 mph or higher. Friction values between 0.14 at 50 mph and 0.10 at 70 mph were determined assuming a straight line relationship. Information on design speeds of 75 and 80 mph were removed from the 1984 Policy.
The Policy also stated that the "recommended values provide a reasonable margin of safety at high speeds ... The lower rates at the low speeds provide a greater margin of safety to
34
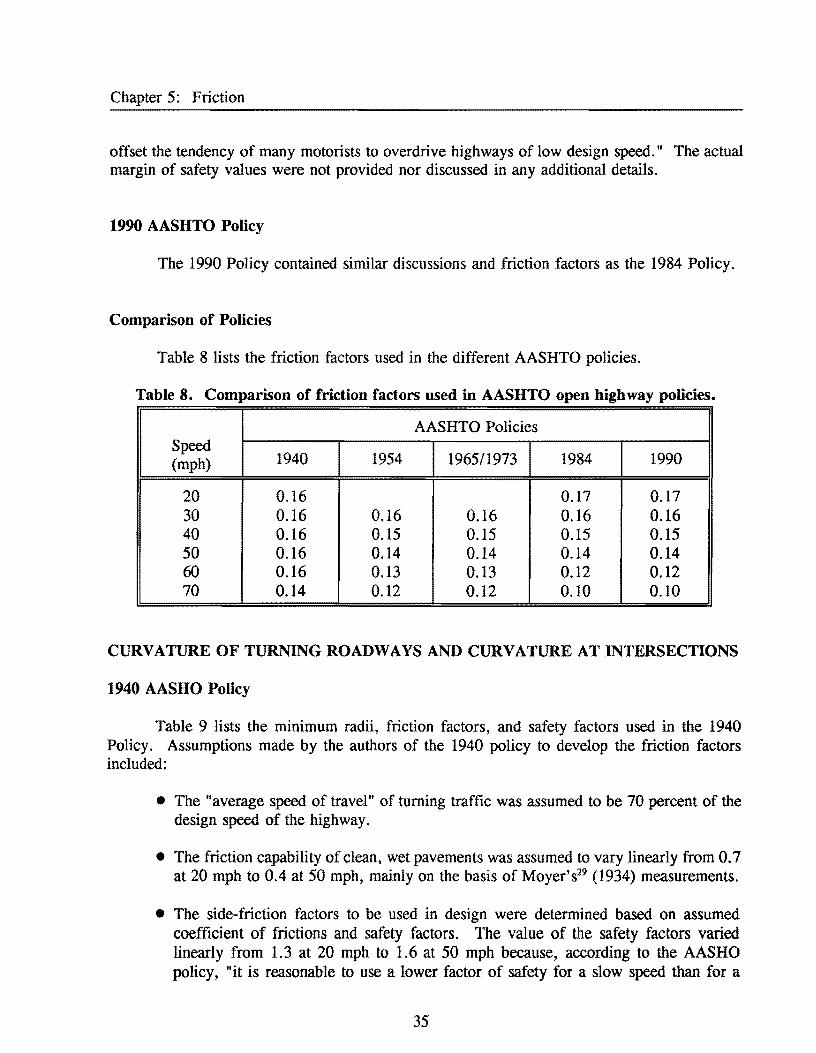
Chapter 5: Friction
offset the tendency of many motorists to overdrive highways of low design speed." The actual margin of safety values were not provided nor discussed in any additional details.
1990 AASHTO Policy
The 1990 Policy contained similar discussions and friction factors as the 1984 Policy.
Comparison of Policies
Table 8 lists the friction factors used in the different AASHTO policies.
Table 8. Comparison of friction factors used in AASHTO open highway policies.
AASHTO Policies Speed
1940 1954 196511973 1990 (mph) ~
20 0.16 0.17 0.17 30 0.16 0.16 0.16 0.16 0.16 40 0.16 0.15 0.15 0.15 0.15 50 0.16 0.14 0.14 0.14 0.14 60 0.16 0.13 0.13 0.12 0.12 70 0.14 0.12 0.12 0.10 0.10
CURVATURE OF TURNING ROADWAYS AND CURVATURE AT INTERSECTIONS
1940 AASHO Policy
Table 9 lists the minimum radii, friction factors, and safety factors used in the 1940 Policy. Assumptions made by the authors of the 1940 policy to develop the friction factors included:
• The" average speed of travel" of turning traffic was assumed to be 70 percent of the design speed of the highway.
• The friction capability of clean, wet pavements was assumed to vary linearly from 0.7 at 20 mph to 0.4 at 50 mph, mainly on the basis of Moyer's29 (1934) measurements.
• The side-friction factors to be used in design were determined based on assumed coefficient of frictions and safety factors. The value of the safety factors varied linearly from 1.3 at 20 mph to 1.6 at 50 mph because, according to the AASHO policy, "it is reasonable to use a lower factor of safety for a slow speed than for a
35
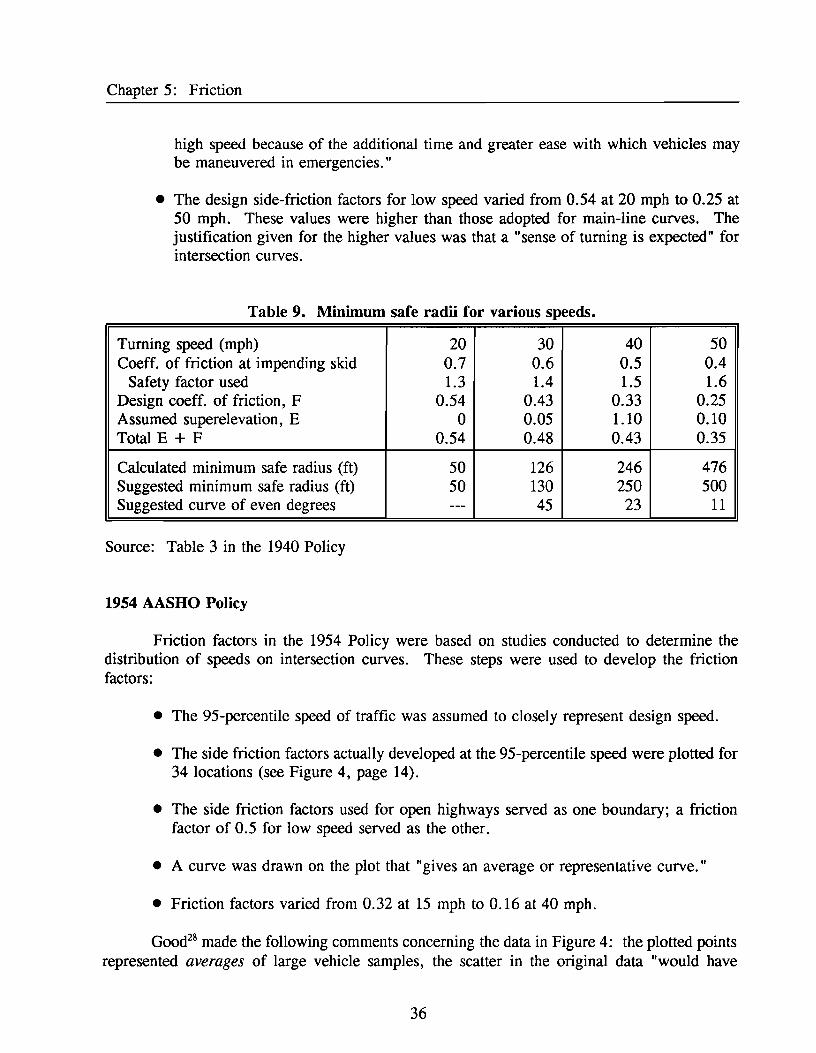
Chapter 5: Friction
high speed because of the additional time and greater ease with which vehicles may be maneuvered in emergencies."
• The design side-friction factors for low speed varied from 0.54 at 20 mph to 0.25 at 50 mph. These values were higher than those adopted for main-line curves. The justification given for the higher values was that a "sense of turning is expected" for intersection curves.
Table 9. Minimum safe radii for various speeds.
Turning speed (mph) 20 30 40 50 Coeff. of friction at impending skid 0.7 0.6 0.5 0.4
Safety factor used 1.3 1.4 1.5 1.6 Design coeff. of friction, F 0.54 0.43 0.33 0.25 Assumed superelevation, E 0 0.05 1.10 0.10 Total E + F 0.54 0.48 0.43 0.35
Calculated minimum safe radius (ft) 50 126 246 476 Suggested minimum safe radius (ft) 50 130 250 500 Suggested curve of even degrees --- 45 23 11
Source: Table 3 in the 1940 Policy
1954 AASHO Policy
Friction factors in the 1954 Policy were based on studies conducted to determine the distribution of speeds on intersection curves. These steps were used to develop the friction factors:
• The 95-percentile speed of traffic was assumed to closely represent design speed.
• The side friction factors actually developed at the 95-percentile speed were plotted for 34 locations (see Figure 4, page 14).
• The side friction factors used for open highways served as one boundary; a friction factor of 0.5 for low speed served as the other.
• A curve was drawn on the plot that "gives an average or representative curve."
• Friction factors varied from 0.32 at 15 mph to 0.16 at 40 mph.
Good28 made the following comments concerning the data in Figure 4: the plotted points represented averages of large vehicle samples, the scatter in the original data "would have
36

Chapter 5: Friction
produced a diagram which defied the drawing of any trend line," and the apparent downward trend in the data depends rather critically on one or two data points.
Table 4 lists the minimum radii calculated using the developed side friction factors and assumed superelevation rates. Good2g also commented that a minimum radius is the result of a maximum assumed side friction factor and a maximum rather than a minimum superelevation rate.
1965, 1984, and 1990 AASHTO Policies
No changes were made from the 1954 Policy for intersection curves in the 1965 Policy. The 1984 and 1990 Policies included information for a 10 mph design speed.
LOW-SPEED URBAN STREETS
1984 and 1990 AASHTO Policies
The 1984 Policy's Low-Speed section includes a modified version of Figure 1; it shows the curves for speeds 10 to 50 mph only. It also shows the friction curve assumed for low-speed urban design (see Figure 1, page 7). This curve is "based on a tolerable degree of discomfort and provides a reasonable margin of safety against skidding under normal driving conditions in the urban environment." Explanations as to why different friction factors for low speed versus high speed design for a particular design speed exist, other than the above statement, are not provided (e.g., at 40 mph, high-speed side friction is 0.15, intersection side friction is 0.16, and low-speed side friction is 0.178).
RECENT RESEARCH ON FRICTION
Emmerson (1969)
In 1969, J. Emmerson34 from the University of Liverpool reported on speeds of cars on six sites with sharp horizontal curves. The point-mass equation was used to determine sidefriction factors for each site using speeds measured at the site. The sites with radii between 1,150 and 642 feet had a mean side friction factor of 0.11. Approximately 80 percent of the vehicles experienced a side friction factor of less than 0.15. The two other sites with radii of 330 and 70 feet, had mean factors of 0.22 and 0.27, respectively. Approximately 90 percent of the cars exceeded the value of 0.15, and factors as high as 0.45 were recorded. The author commented that the significance of these results in relation to design recommendations was complicated by the fact that there is no direct measure of what is "comfortable." For example, just because a large number of drivers use a side friction factor of less than 0.15 does not necessarily mean that this figure represents a "comfortable" limit.
37
..

Chapter 5: Friction
Glennon (1969)
In 1969 Glennon35 reported on his examination of design criteria for horizontal curve design. Concerning the side friction factor, he made the following observations:
• The "typical" relationship between tire-pavement friction capability and vehicle speed [expressed in the 1965 Blue Book] had no objective relation to actual highway conditions. Measurements of 500 pavements throughout one state conducted in 1964 indicated that only 55 percent of the state's pavements satisfied the typical friction capability level.
• The above comment referred to stopping friction capability. Results from efforts to measure cornering friction capability were inconclusive. Glennon concluded that "although it was not readily apparent how cornering capability and stopping capability relate, if at all, it was surmised that the cornering friction capability (for a given tirepavement combination and vehicle speed) could possibly be lower than the stopping friction capability. II
• The use of friction demand design values that correspond to that point at which side forces cause driver discomfort had no objective factor of safety relationship to the side friction capability of the tire-pavement interface.
• For Turning Roadway Design, Glennon commented that "the design friction values ... appear somewhat excessive". He also stated that the data used to generate the friction factors were "experienced" by drivers rather than "accepted". The design friction values were also questionable because they allowed friction demands which would promote rapid degradation of the pavement friction capability.
Glennon and Weaver (1971)
Glennon and Weave~6 conducted a study that examined vehicle paths, lateral skid resistance, and the need for safety margins. Current design practice, stated Glennon and Weaver, assumes that vehicles follow the path of the highway curve with geometric exactness. To test this assumption, the major emphasis of their research was to empirically relate vehicle paths to highway curve paths. Based on their findings, they proposed a new design approach.
They recorded approximately 100 free flowing vehicles at five horizontal curves to relate actual vehicle path to the highway curve radius. To determine this relationship, the point where vehicle speed and radius gave the maximum lateral friction demand was determined for each vehicle. The radius at maximum lateral friction demand was compared to the vehicle speed at that point; a relationship was not found. The relationship between highway curve radii and various percentiles of critical vehicle path radius were then developed (see Figure 5).
38

Chapter 5: Friction
2500r--------------------------------r-----.
i= en I.!.I ::l I.!.I C &&. <I( a: • l: ,
2000
... ,. 't.N Ia: 1500 >110 I.!.I -..J • U _
l: )( I.!.I <I( 1000 > :I ..J
" <I(
~ Z ... :; a: " 500 u ,.
a:
500 1000 1500 2000 2500 3000 . RADIUS OF HIGHWAY CURVE (FEET)
Source: Reference 36.
Figure S. Percentile distribution of vehicle path radius versus highway radius.
Several design practices have between 50 and 80 percent of full superelevation available at the beginning/ending of a curve. Because the data from their study showed that most vehicles experience their critical path maneuvers near the beginning or end of the curve, Glennon and Weaver concluded that the design equation should reflect the reduced superelevation present.
Glennon and Weaver modified the design equation to account for the following:
• Path radii smaller than the highway curve radius. The example Glennon and Weaver used was to select the 10th percentile as the critical level--only 10 percent of the vehicles would have a more severe path.
• Reduced superelevation at the beginning and end of the curve. Glennon and Weaver selected a 0.7 factor--only 70 percent of the superelevation will be present at the beginning/ending of the curve.
• Expressing the side friction factor as the skid number divided by 100 minus a safety margin.
They cautioned that the developed design equation is not usable until a safety margin is selected and a "typical" skid resistance versus speed relation is selected. The skid resistance
39

Chapter 5: Friction
versus speed relationship used for design depends on the minimum level of skid resistance provided by the highway department. Glennon and Weaver argued that the safety margin is required because of several unaccounted variables that may either increase the lateral force demand or decrease available lateral skid resistance such as excessive water on the pavement, pavement bumps, faulty tires, and wind gusts. They stated that "although there is no supporting data, a safety margin in the range of 0.08 to 0.12 should reasonably allow for the unaccounted variables, including the deviation between actual and measured skid resistance. "
Ivey et al. (1974)
NCHRP in the early 70s sponsored a project that evaluated the 1965 AASHTO curve design standards. Ivey et al. 37 reported on the physical characteristics of the vehicle and the pavement that influence the critical cornering maneuver. The results of the study indicated "that the AASHTO geometric design policy will in most cases provide safe, conservative designs for highway curves." When the design speeds were compared to the speeds at which skidding occurs using simulation, the design speed could be achieved without skidding during cornering on approximately 96 percent of the surveyed pavements in one state.
Both Skid Number (SN) and Cornering Slip Number (CSN) were considered as indicators of lateral skid resistance (side friction factor) during cornering. Of these two, SN appears to be the better indicator of the side friction factor for the common understeering vehicle. Differences related to the parameters of study were identifiable only when curve radii exceeded about 800 feet.
Bell (1980)
Be1138 in 1980 reported on observations made of paths and speeds of over 100 vehicles on a "bend on the A3 in Hampshire." The data were used to estimate side friction factors developed by vehicles. Multiple regression was used to find the line of best fit through each set of data. Only cars which were assumed to be unaffected by another vehicle were filmed.
The author evaluated his data as well as the results from Glennon and Weaver'6. Cumulative frequency histograms of number of vehicles against side friction factor were plotted to obtain the 85th and 95th percentile friction factors. These values are listed in Table 10.
A conclusion Bell made based on the information in Table 10 was that "the design speed concept is out of touch with actual driver behavior, because although the designers suppose that friction factors are kept to about 0.15 [U.K. 1968 values], in fact, they are not, and the magnitude of the discrepancy gets worse with decreasing radius." Another important observation he made (that was also made by Glennon and Weaver) was that most vehicles experience their critical path maneuvers near the beginning or ending of the curve and design equations should reflect this information.
40

Chapter 5: Friction
Table 10. Friction factors from Bell's and Glennon & Weaver's studies.
Curve Radius Source of data f85 f95
819 Glennon & Weaver36 .261 .293 1146 Glennon & Weaver6 .265 .292 1432 Glennon & Weaver6 .190 .233 2293 Glennon & Weaver6 .153 .163 2820 Be1l38 .087 .130 2865 Glennon & Weaver6 .137 .155
Bell commented that various highway authorities (including AASHTO) specify maximum friction factors for a given design speed that decrease with increasing design speeds. He indicated that this action supports a "common fallacy" that the maximum friction factor possible before skidding occurs is a function of velocity when really it is only a function of the surface and tire conditions; however, the actual friction factor developed does depend on velocity. So, he concluded, that as velocity increases, the friction factor developed will approach the constant "safe" value for a given surface/tire condition.
Bell concluded that the "whole field of curve design should be seriously reviewed. Old ideas die hard, and those at present used have been built up over 50 years or more. "
McLean (1983)
McLean39 presented an argument that the side friction factor was a result of driver behavior rather than an explanation for it. The two major objections were:
• There is no empirical evidence that drivers respond to actual, or subjectively predicted side friction in the selection of curve speed, rather than some other parameter.
• Owing to the inter-relationship between speed, curve geometry, and side friction, attempts to represent driver behavior as a side-friction/speed relationship may cloud the more fundamental issue of driver speed behavior and road conditions (including curve geometry).
In a review of observational studies McLean found that drivers frequently utilize side friction values much greater than those assumed for design, particularly on low speed standard curves. Values in excess of 0.4 were not uncommon. Based on those studies, McLean developed proposed design side friction factor values listed in Table 11 for use in Australia. He used a "number of rational computations" and an "appreciable amount of subjective judgement" to arrive at the values. Because of the process, McLean commented that further adjustments may prove necessary.
41

Chapter 5: Friction
Table 11. McLean's proposed design side friction values for Australia.
Speed for Design Speed for Design Maximum Side Comparable 1990 V8S VgS Friction Factor Green Book
(km/h) (mph) f85 Values
50 31 .35 .159 60 37 .33 .153 70 44 .31 .146 80 50 .26 .140 90 56 .18 .128 100 62 .10 .108 110 68 .08 .102
Source: Reference 39.
On the issue of safety margins, McLean made the following statement:
"At a superficial level, it might appear that the proposed f85 values [see Table 11] would produce alignments which are less safe than those based on traditional standards, due to the apparent reduction in friction safety margins. This is not the case, as the proposed values are based on the side friction values which are actually being utilized on current alignments. In the lower speed ranges, attempts to increase safety by nominating both lower speeds and lower design side friction values (as per AASHO 1965) are quite fruitless, as drivers have been shown to travel the resulting alignments at a speed greater than the nominated speed standard. "
MacAdam et ale (1985)
An early 1980s study4°,41 conducted for the FHWA addressed the issue of how adequate the point mass representations are in predicting friction requirements for actual vehicles operating along superelevated curves. Chapter 7 contains a discussion on the findings from the study.
Lamm et al. (1991)
R. Lamm and others42 conducted a comparative analysis of side friction demand to side friction assumed. They used geometric design, operating speed, and accident data for 197 curved roadway sections in New York State. Side friction demand (determined based on radius and superelevation present at the site and the 85th percentile speed) and side friction available or assumed (determined based on the procedures presented in the Green Book) were compared
42
Chapter S: Friction
using degree of curve, operating speed, and accident rate as the independent variables. The relationships were determined using regression models. Side friction demand exceeded side friction assumed for degree of curves greater than 6.S degrees. Curves with operating speeds less than SO mph had demand side friction factors greater than assumed side friction factors. Side friction demand begins to exceed side friction assumed when the accident rate is about six or seven accidents per million vehicle-miles. The authors concluded that especially in the lower design speed classes there exists the possibility that friction demand exceeds friction assumed and a high accident risk is present
43

Chapter 5: Friction
44
CHAPTER 6
TRANSITION DESIGN
PRE-AASHO POLICIES
In the early days of road design the changes in horizontal alignment from a tangent section to a circular curve were usually made abruptly. Current practice is to provide a transition distance from the tangent section's normal crown to the superelevation rate that provides for driver comfort and a pleasing appearance. In some cases especially in the early days of highway design, this transition occurred during a spiral curve. Spirals also provided the opportunity for a more gradual introduction of the curvature and the widening used on horizontal curves.
Curvature transitions were used for railroads for several years prior to their use on highways. Prior to the 191Os, the length of transition curves was based on a permissible maximum gradient or time rate of rise of the outer rail. In 1909 Shortt recommended, as an alternative criterion, that a limit should be placed on the rate of change of radial acceleration during the curvature transition. Based on an objective that there should be no discomfort experienced by train passengers when traversing curves, Shortt proposed that the radial jerk (change in acceleration over the change in time) should not exceed 1 ftlse2.
In 1929 A. G. Bruce stated (as reported by Good28) that although there was no standard
practice for developing highway superelevation, "the majority of States start the banking from 100 to 200 ft ahead of the point of curvature and reach full superelevation at the same distance inside the curve. There are several States, however, that reach full superelevation at the point of curvature." He also commented that by the late 1920s, curvature transitions were rarely used, and the practices for developing superelevation and widening differed widely between states.
An extensive set of tables published by the U.S. Public Roads Administration in 1940 for use in transition curve design included the radial jerk, C, as a design control. Barnett, the author of the tables, stated that transitions were necessary "if a uniform speed is to be maintained around a curve and the driver encouraged to keep within his traffic lane." Barnett made the following comment on the value of C selected: "[the value] will vary for different drivers and a great number and variety of tests and observations are needed to determine the maximum average rate that will accommodate almost all drivers. The few observations available indicate that a value of 2 ... will be satisfactory. "
The tables also included an additional constraint on transition length that the longitudinal slope of the outer edge of pavement, relative to the grade control line, be limited so as to "avoid the appearance that results from too rapid a change in superelevation." A maximum slope of 1 in 200 was to be used, however, 1 in 150 and 1 in 175 could be used for design speeds of 30 and 40 mph where necessary.
The criteria of C = 2 ftlsec3 and a relative slope of 1 in 200 were incorporated in the 1941 AASHO Policy for primary highways.
45
Chapter 6: Transition Design
RURAL HIGHWAYS AND HIGH-SPEED URBAN STREETS
1941 AASHO Policy
The transition section in the 1941 Design Standards (Geometric) for Highways (Primary) included a formula for transition length which incorporated the C value of 2 ftlse2 in the constant term and stated:
"Where possible, superelevation should be attained within the limits of the transition which should be of sufficient length that the slope of the outer edge of pavement with respect to the profile of the center line is no greater than 1 in 200."
1954 AASHO Policy
The 1954 Policy included extensive discussions on advantages of spiral curves and the determination of the length of spirals. The length of spiral section included discussions on selecting the appropriate C value (e.g., values ranging from 1 to 3 have been used for highways, C = 2 ftlsec3 is used widely) and the appropriate equation for use in design (e.g., Shortt formula, modified Shortt formula, or the Meyer formula). These issues lost their importance, however, when the Policy stated: "The lengths determined under the heading of Superelevation Runoff can be used directly for the length of spiral curves." The superelevation runoff length is determined by the rate at which cross slope is changed. This rate is based on appearance; the runoff length is to be sufficient to avoid a distorted appearance as the driver approaches.
The Policy states that the length of superelevation runoff should be such that a longitudinal slope (edge compared to centerline of a 2-lane highway) of 1 in 200 is not exceeded. When the design speed is 30 and 40 mph, relative slopes of 1: 150 and 1: 175, respectively, are used. It also stated that "to reflect the importance of the higher design speed and to harmonize the flatter curving elements, both horizontal and vertical, it appears logical to extrapolate the changing relative slope to the higher design speeds, as follows: It 1 :225 for 60 mph and 1 :250 for 70 mph. Minimum runoff lengths (ranging from 100 to 200 feet) that approximate the distance traveled in 2 seconds at the design speed are to be used in those cases where the values calculated using the ratios result in shorter distances.
Barnett's (1940) handbook made the 1 in 200 slope criterion "to avoid the appearance that results from too rapid a change in superelevation." The Handbook also suggested the steeper slopes for 30 and 40 mph only when "the topography or some other condition makes the use of shorter transition advisable. It The rationale for AASHO to extend this variation with speed to the higher speeds (e.g., 60 and 70 mph) was not provided.
For 4-lane or 6-lane highways, the Policy argues that the length of runoff should be subject to the same theoretical derivations, for example, a 4-lane highway would have double the length of superelevation runoff that a 2-lane highway has. The Policy argues, however, it
46

Chapter 6: Transition Design
is frequently not feasible to supply lengths based on such direct ratios. Considering that Umost engineers agree that superelevation runoff lengths for wide pavements should be greater than those for a 2-lane highwayU, the Policy states that "on a purely empirical basis it is concluded that minimum design superelevation runoff lengths for pavements wider than 2 lanes should beu increased by factors of 1.2, 1.5, and 2.0 for three-lane, four-lane, and six-lane highways, respectively. Documentation or explanation to support these factors was not provided.
1965 AASHO Policy
The 1965 Policy was very similar to the 1954 Policy; the major difference was the 1965 Policy eliminated much of the discussion on alternative methods for calculating the length of the spiral.
1984 AASHTO Policy
Discussion on spirals and superelevation runoff was similar to previous Policies. The 1984 Policy added information on a 20 mph design speed and eliminated the information on the 75 and 80 mph design speeds and for maximum superelevation of 0.12. A discussion on determining tangent runout was added.
1990 AASHTO Policy
The 1990 Policy was very similar to the 1984 Policy. Minor changes included adding information for a 55 mph design speed and displaying minimum superelevation runoff values in a table differently.
CURVATURE OF TURNING ROADWAYS AND CURVATURE AT INTERSECTIONS
1940 AASHO Policy
The 1940 A Policy on Intersections at Grade states that "larger values of C may be used for curves at intersections because drivers are more or less prepared for sharp turns ... and it is logical to impose greater limitations on the driver at low speed. The rates for curves at intersections are assumed to increase from 3 ftlsec3 for a tum-out speed of 50 mph up to 7 ft/sec3 for 20 mph." Transition lengths are determined from the following equation:
L = 3.2 V3
(13) RC
where: L - length of transition (ft)
47
Chapter 6: Transition Design
v - turning speed (mph) R - radius of the circular curve (ft) C - rate of change in radial acceleration (ftlsecl)
The length of transitions range between 70 and 250 feet for 20 to 50 mph turning speeds, respectively.
1954 AASHO Policy
The 1954 Policy used the rate of change of radial acceleration (C) to determine length of spirals for intersection curves. As with side-friction factors, it was assumed that higher values could be used for intersections than on the open highway "because drivers accept a more rapid change in direction of travel under intersection conditions". Values of C ranging from 4 ftlsec3 at 20 mph to 2.5 ft/sec3 at 50 mph were assumed. The values represented a significant reduction from the 1940 AASHO values (7 ftlsec3 at 20 mph to 3 ftlse2 at 50 mph); the justification of the reduction was not discussed.
The Superelevation Runoff section provided "rate of cross slope change for curves at intersections." The values were based on the following steps:
• The open highways edge to centerline relative slope recommendation of 1:200 for a design speed of 50 mph was converted into a rate of change in cross slope of 0.04 per 100 feet of length.
• The Policy included an assumption that a value "as high as 0.08 may be used on turning roadways without undue distortion in appearance or hazard in operation. "
• The rate of cross slope change was varied with design speed. The 0.08 per 100 feet was used for the 15 and 20 mph design speeds. The rate was decreased by 0.01 for each 5 mph increase in design speed. The rate for the 35 mph or more design speed was 0.05 per 100 feet.
• Flexibility was provided to the designer in using these values. The Policy stated that "the change in superelevation rate may be varied up to 25 percent above or below the tabulated values, the lower rates being applicable to wide pavements and the higher rates to the very narrow pavements."
1965 AASHO Policy
The spiral lengths and the superelevation runoff discussions in the 1965 Policy were similar to the discussions in the 1954 Policy.
48
Chapter 6: Transition Design
1984 and 1990 AASHTO Policies
The 1984 and 1990 Policies also use the rate of change of cross slopes method to determine superelevation runoff. The latter policies expressed it in terms of change in relative rate between the edge of a two-lane pavement and the centerline in percent (see Table 6, page 6) rather than change in superelevation rate per 100 feet. The 1990 version combined the 15 to 20 mph design speed with the 25 mph design speed and used the former 25 mph value for it. The 1990 Policy also added values for 40, 50, 55, 60, 65, and 70 mph design speeds that corresponded with the rural highway values.
LOW-SPEED URBAN STREETS
1984 and 1990 AASHTO Policies
Superelevation runoff length in the 1984 Policy is calculated using the following formula:
where:
L = 47.2 fVD
C
L - length of superelevation runoff (ft) f - side friction factor
VD - design speed (mph) C - rate of change of f (ftlse2)
(14)
The C values provided in the Policies for this formula range from 4.0 at 20 mph to 3.0 at 40 mph. These C values were similar to the values used in the spiral length calculations in other sections of the Policies. The origin of this formula, and why the formula is used rather than a rate of change in pavement edge used by other design procedures was not discussed in the Green Book
Detailed guidance is provided for adjusting the lengths of superelevation runoff for radii that are larger than minimum. This type of information is not provided in the sections on rural highways or curves at intersections. Reasons for not varying the superelevation runoff lengths by superelevation value or pavement widths or reasons why runoff should be varied due to an increased radius were not provided.
49

Chapter 6: Transition Design
50

CRAYfER 7
POINT-MASS EQUATION
GLENNON (1969)
In November 1969 Glennon35 reported on his examination of design criteria for horizontal curve design. He concluded that the minimum curve design standards do not provide an adequate factor of safety for the range in operational conditions which are encountered. He stated that the equation was a relatively good predictive tool for highways curves of 4 0 or less. For highway curves greater than 200
, the equation appeared to yield incorrectly low values of friction demand. For the region between 4 0 and 200
, the equation explained less as the degree of curve increased.
MACADAM ET AL. (1980)
An early 1980s study conducted for the Federal Highway Administration41,42, addressed
the issue of how adequate the point-mass equation is in predicting friction requirements for actual vehicles operating along superelevated curves. Because current design practice characterizes the vehicle under conditions of steady turning motion as a simple point mass, questions are asked about the friction requirements at individual wheel locations and how they relate to the point mass. The project combined computer analysis and full-scale vehicle testing of two passenger cars and one five-axle tractor-semitrailer. Also, a sensitivity analysis was performed to illustrate the relative importance and interactions of various vehicle parameters and highway geometrics in influencing side friction requirements.
The findings from the study included:
• Despite the presence of wheel-to-wheel friction factor variations, no evidence was found to indicate that the observed friction factor variations would lead to significantly reduced stability margins. Even if the available tire/road friction level was reduced to a value below the demand of the greatest tire friction requirement, no vehicle instability would occur.
• The minimum level of tire/road friction identified for maintaining stability of passenger cars was found to be equal to the "point-mass" design value for the curve. The minimum level of friction necessary for maintaining stability of the five axle tractor-semitrailer, however, was approximately 10 percent higher than the pointmass design value. This conclusion applies to negotiation of horizontal curves well after the PC and does not apply to transition sections or overshoot behavior caused by transitions at the start of a horizontal curve.
• No substantive evidence regarding friction factor dispersion was found to conclude that current highway curve design practice, based upon a point-mass formulation, should be modified to accommodate the observed wheel-to-wheel variations. For example, alteration of the standard design equation is not needed to account for larger
51

Chapter 7: Point-Mass Equation
friction factor values derived from an individual wheel analysis. These conclusions apply to horizontal curve negotiation after completion of the curve transition. Temporary disturbances to driver-vehicle systems during entry in to horizontal curves and due to different curve transition designs were not included in this study.
• Concerns occasional! y expressed in the technical literature about steering reversal requirements by drivers along superelevated curves during conditions of reduced speed are not supported by the analyses and observations conducted within this project. Rather, steering reversals (up the slope) away from the direction of turn, even at very low speeds, are not viewed as generally possible for the great majority of passenger cars and commercial vehicles. Consequently, highway curve designers can use higher rates of superelevation on AASHTO curves without being concerned that lower speed vehicles may require steering motion "up the slope" and away from the direction of turn.
• Mild oscillatory steering behavior and accompanying path curvature variations during steady turning maneuvers were observed in the test data collected in this study. The magnitude of steering oscillations observed during each curve negotiation, well after completion of the transition, was generally small. Consequently these measurements do not suggest a need to modify existing AASHTO horizontal curve design practice. Other studies have observed much greater levels of oscillatory driver-vehicle behavior but almost exclusively during entry transitions to horizontal curves.
• The issue of spiral transitions and associated benefits, while not specifically studied or addressed within this project, was frequently encountered during this study. The transitions to each of the curve sites in the test program were not spirals but superelevated tangents, and as such, generally required mild counter-steering and subsequent overshooting of steering responses upon entry into each curve, especially with the tractor-semitrailer. This type of transition design necessitates the above described behavior which runs counter to the more natural driving process of requiring steering displacements in the direction of the anticipated turn. Use of spiral transitions is supported to (1) introduce curvature and superelevation in a manner consistent with driver expectations, and (2) retain the simple physics of the standard design equation.
52

CHAPTER 8
TRUCK CONCERNS
HIGH-SPEED DESIGN
Harwood and Mason43,44 examined the adequacy of high-speed and intersection curve
design for trucks and for passenger cars. They conducted a sensitivity analysis on the effect of minimum radius of curvature and maximum superelevation rate on the margins of safety against vehicle skidding and rollover and the vehicle speeds at which skidding and rollover will occur. The margin of safety against skidding or rollover for a passenger car or truck on a horizontal curve is defined as the difference between the available tire/pavement friction and the friction demand of the vehicle as it tracks the curve. The margin of safety is equivalent to the additional lateral acceleration that the vehicle could undergo without skidding or rolling over.
Harwood and Mason used findings from NCHRP 27(/5 that indicated that the peak coefficient applicable to cornering at a specific speed is assumed to be 1.45 times the lockedwheel braking value. The braking friction coefficients (used in stopping sight distance) available in the Green Book range from 0.40 at 20 mph to 0.28 at 70 mph for relatively poor wetpavements. Available cornering tire-pavement friction for passenger cars would, therefore, range between 0.58 and 0.41 for the 20 to 70 mph design speeds, respectively. NCHRP 270 also states that tire pavement friction generated by truck tires is only 70 percent of that for passenger car tires, therefore available cornering tire-pavement friction for trucks would range between 0.41 and 0.28 for the 20 to 70 mph design speeds, respectively.
Passenger cars rollover threshold may be as high as 1.2 so a passenger car will normally skid off a road before it would roll over. Tractor-trailer trucks, however, have relatively high centers of gravity. Recent research has determined the rollover thresholds of a number of common trucks with typical loading configurations44,46,47. Values as low as 0.30 are found on the road.
Friction demands for passenger cars are assumed by AASHTO to range between 0.17 and 0.10. As discussed more fully in Chapter 7, a FHWA study from the early 1980s examined the issue of how adequate the point-mass representation is in predicting friction requirements for actual vehicles operating along superelevated curves. The study found that while the friction demands at the four tires of a passenger car are approximately equal, the friction demands at the various tires of a tractor-trailer vary. The minimum level of friction necessary for maintaining stability of the five-axle tractor-semitrailer was approximately 10 percent higher than the pointmass design value.
Using the above assumptions, Harwood and Mason compared the margin of safety for trucks and passenger cars. A sample calculation for 20 mph is listed in Table 12. For this example, a truck could undergo additional lateral acceleration of only 0.22 without skidding in contrast to an additional lateral acceleration of 0.41 that a passenger car could undergo. The margins of safety against skidding and rolling over are listed in Table 13 for a maximum superelevation value of 0.08. Table 14 presents the vehicle speed at the impending skid or rollover.
53

Chapter 8: Truck Concerns
Table 12. Margin of safety for a passenger car and truck at 20 mph.
Passenger Car Truck
Value Source Value Source
Available Tire- 0.04 x 1.45 1.45 times the 0.58xO.70 Tire-pavement Pavement assumed locked- friction for a truck Friction = 0.58 wheel braking = 0.41 is 70 percent of
coefficient (Green that for a PC Book Table III -1)
Friction Demand 0.17 Green Book Table 0.17xO.1O Effective friction III-6 demand is 10
= 0.19 percent higher for trucks
Margin of 0.41 0.58-0.17 0.22 0.41-0.19 Safety
Source: Reference 43.
Table 13. Margins of safety against rollover and skidding on horizontal curves with maximum superelevation of 0.08.
Design Passenger Car Trucks Speed (mph) Rollover margin Skidding Skidding Rollover margin Skidding Skidding
of safety margin of margin of of safety margin of margin of (RT 1.20 g) safety (wet) safety (dry) (RT = 0.30 g) safety (wet) safety (dry)
20 1.03 0.41 0.77 0.13 0.22 0.47 30 1.04 0.35 0.78 0.14 0.18 0.48 40 1.05 0.31 0.79 0.15 0.16 0.49 50 1.06 0.30 0.80 0.16 0.15 0.51 60 1.08 0.30 0.82 0.18 0.16 0.53 70 1.10 0.31 0.84 0.20 0.17 0.55
Source: Reference 44.
At all design speeds, the margin of safety against rollover for a passenger car is much higher than the margin of safety against skidding on either a wet or dry pavement. Thus, rollover is not a major concern for passenger cars because, unless they collide with another vehicle or object, they will skid rather than roll over. Review of the tables indicates that trucks do not have the same margins of safety as passenger cars especially for rollovers. Trucks will roll over before they skid at design speeds of 40 mph and below.
54
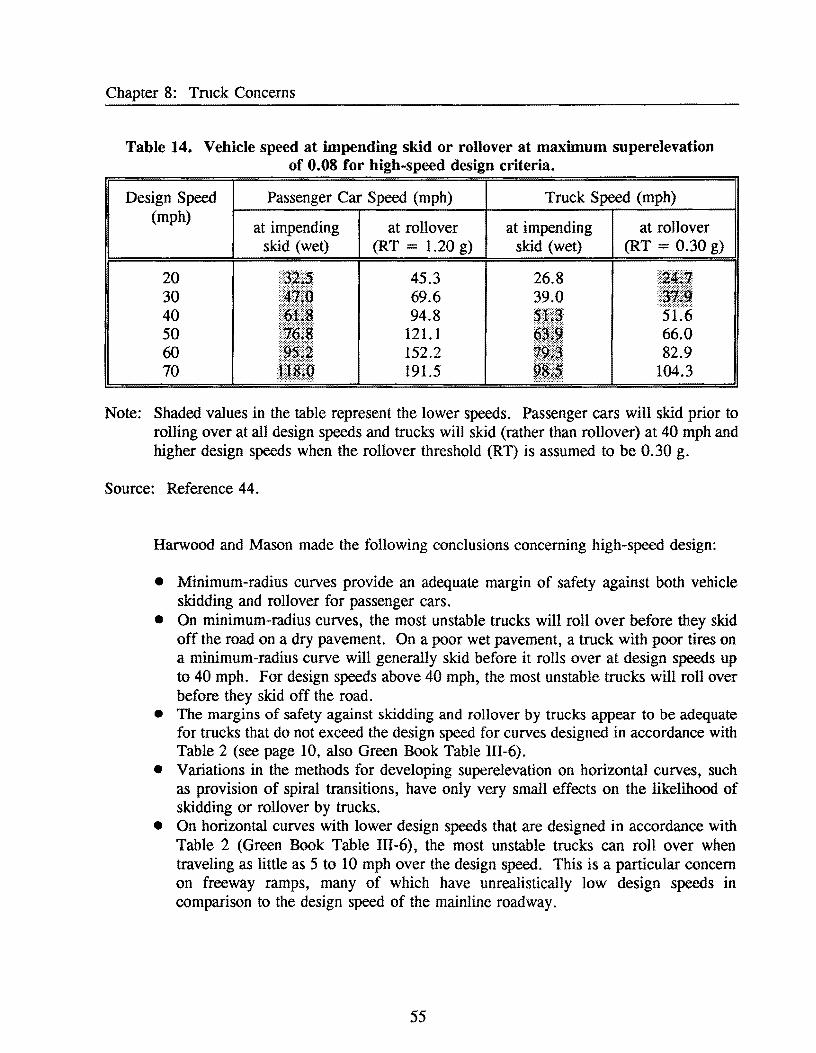
Chapter 8: Truck Concerns
Table 14. Vehicle speed at impending skid or rollover at maximum superelevation of 0.08 for high-speed design criteria.
Design Speed (mph)
20 30 40 50 60 70
Passenger Car Speed (mph)
at impending skid (wet)
at rollover (RT = 1.20 g)
45.3 69.6 94.8
121.1 152.2 191.5
Truck Speed (mph)
at impending skid (wet)
26.8 39.0
at rollover (RT = 0.30 g)
5 66.0 82.9
104.3
Note: Shaded values in the table represent the lower speeds. Passenger cars will skid prior to rolling over at all design speeds and trucks will skid (rather than rollover) at 40 mph and higher design speeds when the rollover threshold (RT) is assumed to be 0.30 g.
Source: Reference 44.
Harwood and Mason made the following conclusions concerning high-speed design:
• Minimum-radius curves provide an adequate margin of safety against both vehicle skidding and rollover for passenger cars.
• On minimum-radius curves, the most unstable trucks will roll over before they skid off the road on a dry pavement. On a poor wet pavement, a truck with poor tires on a minimum-radius curve will generally skid before it rolls over at design speeds up to 40 mph. For design speeds above 40 mph, the most unstable trucks will roll over before they skid off the road.
• The margins of safety against skidding and rollover by trucks appear to be adequate for trucks that do not exceed the design speed for curves designed in accordance with Table 2 (see page 10, also Green Book Table III-6).
• Variations in the methods for developing superelevation on horizontal curves, such as provision of spiral transitions, have only very small effects on the likelihood of skidding or rollover by trucks.
• On horizontal curves with lower design speeds that are designed in accordance with Table 2 (Green Book Table III-6), the most unstable trucks can roll over when traveling as little as 5 to 10 mph over the design speed. This is a particular concern on freeway ramps, many of which have unrealistically low design speeds in comparison to the design speed of the mainline roadway.
55

Chapter 8: Truck Concerns
CURVATURE OF TURNING ROADWAYS AND CURVATURE AT INTERSECTIONS
Harwood and Mason43 (along with Good28) noted that the Green Book Table 111-17
(reproduced as Table 4 in this report, see page 15) is based on an assumed minimum superelevation rate for each design speed rather than a user-selected maximum superelevation rate. The table shows specified values of minimum radius, although it is not clear how a minimum radius can be computed from a maximum side friction factor and a minimum (rather than a maximum) superelevation rate. The Green Book does not make clear whether horizontal curve radii less than those specified in Table III -17 can be used when higher-than-minimum superelevation rates are used.
Table 15 compares the vehicle speed for passenger cars and trucks at impending skidding and rollover for design speeds from 10 to 40 mph for three cases: high-speed design, intersection design using the minimum radii in the Green Book Table III-17, and minimum radii values (when less than values listed in Green Book Table 111-17) determined from the side friction values listed in the Green Book Table III-17 and a maximum superelevation rate of 0.08. Assumptions concerning passenger cars, trucks, and pavement characteristics remain the same as in the previous high-speed design analysis.
Harwood and Mason stated that there do not appear to be any critical skidding or rollover problems for passenger cars. In every case for design speeds of 10 and 20 mph, however, a truck could skid or roll over by exceeding the design speed of a minimum radius curve by 5 mph or less. They stated that this analysis suggests that the intersection design criteria in Green Book Table 1II-17 may not be adequate to safely accommodate trucks in very critical situations. If it is permissible to use a smaller curve radius than shown in Table 1II-17 or a value above the minimum superelevation rate, then Table 15 shows that trucks could skid or rollover at speeds less than the 10 mph design speed, and within I mph above the 20 mph design speed.
Harwood and Mason concluded that for design speeds of 10 and 20 mph, minimum radius horizontal curves may not provide adequate margins of safety for trucks with poor tires on a poor wet pavement or for trucks with low rollover thresholds. Revision of the criteria in Green Book Table III-17 should be considered, especially for locations with substantial truck volumes and the Green Book should be revised to state explicitly that minimum radii smaller than those shown in Table 111-17 should not be used, even where they appear justified by aboveminimum superelevation rates.
56

Chapter 8: Truck Concerns
Table 15. Vehicle speed at impending skid or rollover for a maximum superelevation of 0.08.
Design Radius Passenger Car Trucks speed (mph)
Speed at Speed at Speed at Speed at impending impending impending impending
skid rollover skid rollover
High-speed design -- minimum radius as specified in Green Book Table 111-6
10 -- -- -- -- --20 107 32.5 45.3 26.8 24.7 30 252 47.1 69.6 39.0 37.9 40 468 61.8 94.8 51.3 51.6
Intersection design -- minimum radius as specified in Green Book Table 111-17
10 25 16.6 21.9 13.6 11.9 20 90 29.8 41.6 24.6 22.6 30 230 45.0 66.5 37.3 36.2 40 430· 59.2· 90.9- 49.2· 49.5-
Intersection design -- minimum radius calculated using maximum side friction factor from Green Book Table 111-17 and maximum superelevation of 0.08
10 14 12.6 16.7 lOA 9.1 20 76 27.5 38.2 22.7 20.8 30 214 43.5 64.1 36.0 34.9 40 430· 59.2· 90.9· 49.2· 49.5*
.. This curve would not be permitted by Green Book Table 111-17 because the minimum superelevation required for a 40 mph design speed is 0.09. Data shown for comparison purposes.
Source: Reference 43.
57

Chapter 8: Truck Concerns
58
CHAPrER 9
SUMMARY
Side friction factors that are currently used in the high-speed and low-speed design procedures were determined using vehicle occupant comfort as the selection criterion. This criterion assumes that drivers limit their speed on curves to ensure comfort for the occupants of the vehicles, and discomfort is directly related to the unbalanced side-friction. Several concerns or issues accompany these assumptions. For example, the speed at which discomfort (or side pitch) first becomes noticeable may be slower than necessary for comfort or safety and the level of discomfort felt by a driver may not be solely related to side-friction only. The above assumptions also do not directly consider vehicle characteristics or constant safety factors over the range of design speeds.
The transition distance from a normal crown section to the superelevated curve for highspeed design and for curves at intersections is based on appearance and comfort. The criterion was developed to avoid an appearance that results from too rapid a change in superelevation. For low-speed urban street design, a change in acceleration over the change in time factor, known as C, is used to determine superelevation runoff. This C-factor is similar to the factor used to determine spiral lengths. High-speed design includes factors that are to be used to determine runoff lengths for roads with more than two lanes. Low-speed design does not include similar factors to adjust for wider pavements; however, it does include a method for adjusting runoff length for radii larger than minimum that the high-speed design procedure does not include.
Following are the major findings for the three design areas.
HIGH-SPEED DESIGN
Superelevation Rates
Superelevation rates as high as 0.08 ftlft were used during the 1920s. The 1941 AASHO Policyl stated that the maximum rate is 0.12 ftlft, but if snow and ice conditions prevail then the 0.08 ftlft rate should be used. These recommended rates in high-speed design are also present in the current policy. The method for distributing superelevation rates over radii larger than minimum radii have not changed since they were first introduced in 1954.
Friction
The side friction factors present in the 1990 Green Book were determined from an assumed straight-line relation of data points from several studies conducted in the 1930s and 40s. One of these studies asked observers to report when they felt a "side pitch outward" when traversing a curve, another used a ball bank indicator and assumed the 10 degree reading was the "value at which the driver of a car senses some discomfort and where the hazard of skidding
59

Chapter 9: Summary
off the curve becomes apparent. tI The factors based on these studies were first used in 1954. Only slight modifications of the friction values have occurred since friction values were first included in 1945 (see Table 8).
Transition Design
The 1 in 200 rate of cross slope change that is currently used to calculate superelevation runofflength (at the 50 mph design speed) was included in the 1941 Policy. This rate is based on appearance; it determines a runoff length that is sufficient to avoid distorted appearance as the driver approaches a curve. While the 1941 Policy used the 1 in 200 rate for all design speeds, the 1954 Policy used it for the 50 mph design speed and varied the rate for other design speeds. The 1954 Policy also introduced a minimum runoff length that approximated the distance traveled in 2 seconds at the design speed and factors for use in determining superelevation runoff lengths for roads with more than two lanes. The 1984 Policy included a discussion on determining the tangent runout.
INTERSECTION DESIGN
Superelevation Rates
The maximum superelevation rates listed in the AASHTO Policies have not changed significantly in the past 50 plus years. In 1940, 0.10 ftlft was recommended for turning speeds of 40 and 50 mph and 0.05 ftlft "appears to be reasonable" for a turning speed of 30 mph. The 1954, 1965, 1984, and 1990 Policies contain similar material; the general range of maximum superelevation rates for curves is 0.06 to 0.12. The 1954-1990 Policies include a table that lists suggested superelevation rates in relation to design speed and radius of curve (see Table 5, page 16). These rates were "derived in much the same manner as for open highway curves."
Friction
The 1940 Policy listed safety factors (1.3 at 20 mph to 1.6 at 50 mph) and coefficients of friction at impending skid. These values were multiplied to arrive at the design side friction factor used to determine minimum safe radii. The 1954 Policy contained different friction factors than the 1940 edition and did not include a safety factor. The side friction factors were based on studies conducted to determine the distribution of speeds on intersection curves. A curve was drawn that" gives an average or representative curve" of the data and used high-speed factors for one boundary and 0.5 as the other (see Figure 4). Good28 in his review of superelevation commented that the plotted points represented averages of large vehicle samples, the scatter in the original data "would produce a diagram which defied the drawing of any trend line", and the apparent downward trend in the data depends rather critically on one or two data points. He also commented (along with Harwood and Mason43
) that a minimum radius is the result of a maximum assumed side friction factor and a maximum rather than a minimum
60

Chapter 9: Summary
superelevation rate. No changes to the information in the 1954 Policy were made in 1965, 1984, and 1990 except adding information on a 10 mph design speed in the 1984 and 1990 Policies.
Transition Design
In the 1990 and 1984 Policies, superelevation runoff was calculated using a "change in relative rate between the edge of a two-lane pavement and the centerline (in percent)." Earlier Policies used either an equation commonly used to calculate a spiral (1940, 1954, and 1965) or used a rate of cross slope change per 100 ft of length (1954 and 1965).
LOW-SPEED URBAN STREETS DESIGN
Procedures for low-speed streets were first introduced in the 1984 Policy. Reasons for the inclusion of this new procedure in superelevation design were not included in the 1984 Green Book.
Superelevation Rates
The maximum superelevation rate listed in the 1984 and 1990 Policy is 0.04 or 0.06. The distribution of superelevation with curvature follows the assumption that the centrifugal force is counteracted in direct proportion by side friction up to the maximum assumed friction; then superelevation is used in direct proportion until it reaches maximum superelevation.
Friction
The assumed friction curve (see Figure 1) for low-speed urban design is "based on a tolerable degree of discomfort and provides a reasonable margin of safety against skidding under normal driving conditions in the urban environment." Explanations as to why different friction factors for low speed versus high speed or intersection design for a particular design speed exist, other than the above statement, are not provided (e.g., at 40 mph, high-speed side friction is 0.15, intersection side friction is 0.16, and low-speed side friction is 0.178).
Transition Design
Superelevation runoff length is calculated using an equation that includes a rate of change of the side friction factor called "C". The C values are similar to the values used in the spiral length calculations in other sections of the Policy, however the source of the formula was not discussed in the Policy. Detailed guidance is provided on adjusting the lengths of superelevation runoff for radii that are larger than minimum.
61

Chapter 9: Summary
RECENT RESEARCH
Friction
Emmerson34 in 1969 used car speeds on curves to calculate side friction factors. Approximately 80 percent of the vehicles experienced a side friction factor of less than 0.15 on curves with radii between 1,150 and 642 ft. Sites with very small radii (330 and 70 ft) had mean factors of 0.22 and 0.27. Glennon35 in 1969 commented that the use of friction demand design values that correspond to that point at which side forces cause driver discomfort has no objective factor of safety relationship to the side friction capability of the tire-pavement interface. Glennon in examining the relationship between tire-pavement stopping friction capability and vehicle speed stated that the relationship has no objective relation to actual highway conditions. Measurements of 500 pavements throughout one state conducted in 1964 indicated that only 55 percent of the state's pavements satisfy the typical friction capability level. Glennon and Weaver36 conducted a study that examined vehicle paths, lateral skid resistance, and the need for safety margins. They recorded free flowing vehicles on five horizontal curves to relate actual vehicle paths to the highway curve radius. Their data indicated that most vehicles experience their critical path maneuver near the beginning or end of the curve. Bell's38 United Kingdom study in 1980 found similar results as Glennon and Weaver.
McLean39 in 1983 argued that side friction factor is a result of driver behavior rather than an explanation for it. His two major objections were (1) there is no empirical evidence that drivers respond to actual, or subjectively predicted side friction in the selection of curve speed, rather than some other parameter and (2) owing to the inter-relationship between speed, curve geometry, and side friction, attempts to represent driver behavior as a side friction/speed relationship may cloud the more fundamental issue of driver speed behavior and road conditions. Lamm and others40
, using regression models, compared side friction demand (determined based on radius and superelevation present at the side and the 85th percentile speed) and side friction available or assumed (determined based on the procedures presented in the Green Book) for a range of degree of curve, operating speed, and accident rate values. They found that side friction demand exceeded side friction assumed in the following situations: degree of curves greater than 6.5 degrees, curves with operating speeds less than 50 mph, and curves with accident rates above six to seven accidents per million vehicle-miles.
Point-Mass Equation
A 1980s Federal Highway Administration study41,42 found that the minimum level of tire/road friction identified for maintaining stability of passenger cars was found to be equal to the "point-mass" design value for the curve. The minimum level of friction necessary for maintaining stability of the five axle tractor-semitrailer, however, was approximately 10 percent higher than the point-mass design value. The authors also concluded that no substantive evidence regarding friction factor dispersion was identified to conclude that current highway curve design practice, based upon a point-mass formulation, should be modified to accommodate the observed wheel-to-wheel variations.
62

Chapter 9: Summary
Truck Concerns
Harwood and Mason43,44 determined the margin of safety against skidding or rollover for
a passenger car or truck on a horizontal curve and the speed at which skidding or a rollover would occur. They concluded that on lower design speed horizontal curves designed using the high-speed design criteria, the most unstable trucks can roll over when traveling as little as 5 to 10 mph over the design speed. This is a particular concern, they noted, on freeway ramps, many of which have unrealistically low design speeds in comparison to the design speed of the mainline roadway. In their analysis of superelevation design at intersections, Harwood and Mason found that for design speeds of 10 and 20 mph, a truck could skid or roll over by exceeding the design speed of a minimum radius curve by 5 mph or less. They concluded the revision of the criteria in Green Book Table III-I7 (see Table 4, page 15 in this report) should be considered, especially for locations with substantial truck volumes.
63

Chapter 9: Summary
64

CHAPTER 10
PROPOSED RESEARCH PROBLEM STATEMENTS
This chapter contains three research problem statements that were developed based upon the information contained in this report. The problem statements are on selecting side friction factors, determining transition lengths, and evaluating the need for and basis of the three different design procedures (high-speed, low-speed, and curvature at intersections). Research is needed in these areas because current practice is largely based on limited empirical data and existing practice without supporting material. The reader should note that efforts in addressing the following issues would require substantial funds and efforts.
Title: Side Friction Factors Used in Superelevation Design
Problem Statement:
Side friction factors that are currently used in the high-speed and low-speed design procedures were determined using vehicle occupant comfort (in the 1930s and 1940s) as the selection criterion. This criterion assumes that drivers limit their speed on curves to ensure comfort for the occupants of the vehicles, and discomfort is directly related to the unbalanced side-friction. Several concerns or issues accompany these assumptions. For example, the speed at which discomfort (or side pitch) first becomes noticeable may be slower than necessary for comfort or safety and the level of discomfort felt by a driver may not be solely related to sidefriction only. The above assumptions also do not directly consider vehicle characteristics or constant safety factors over the range of design speeds. Other issues that need investigating include whether vehicles in different lanes of a multilane roadway experience significantly different side friction forces and whether constant margin of safety values are needed, and if so, should they be based on trucks or passenger cars.
Proposed Research:
Evaluate the appropriateness of using comfort for a passenger car occupant in the selection of side friction factors. Identify and evaluate other potential criteria that could be used in selecting the side friction factors.
Title: Different Design Procedures for Horizontal Curve Design
Problem Statement:
Currently the Green Book includes three methods to design the superelevation of a horizontal curve: rural highways and high-speed urban streets, low-speed urban streets, and curvature of turning roadways and curvature at intersections. Are three different procedures justifiable? What should form the basis of each design procedure?
65
Chapter 10: Proposed Research Problem Statements
Proposed Research:
The research should critically evaluate the existing horizontal curve design procedures (e.g., high-speed, low-speed, and curves at intersections) as well as investigate other potential procedures for designing a horizontal curve. It should also critically evaluate the basis of each design procedure. The research should conclude with a recommendation on what design procedures should be included in the AASHTO Green Book.
Title: Transition Design
Problem Statement:
The transition distance from a normal crown section to the superelevated curve for open highways or high speed design and for curves at intersections is based on appearance and comfort. The criterion was developed to avoid an appearance that resulted from too rapid a change in superelevation. For low-speed urban street design, a change in acceleration over the change in time factor, known as C, is used to determine superelevation runoff. This C-factor is similar to the factor used to determine spiral lengths.
High-speed design includes factors that are used to determine runoff lengths for roads with more than two lanes. Low-speed design does not include similar factors to adjust for wider pavements; however, it does include a method for adjusting runoff length for radii larger than minimum which the high-speed design procedure does not include.
Using runoff lengths that are shorter than the values provided in the Green Book could assist engineers in designing horizontal curves in developed areas where meeting existing cross road grades is vital or in areas with high costs for right-of-way purchases. Identifying the consequences of providing superelevation runoffs that are less than the values indicated in the 1990 Green Book is critical in making or supporting these design decisions.
Proposed Research:
The research should critically evaluate current transition design for all three design procedures (high-speed, low-speed, and curvature at intersections) and proposed and justify new transition lengths (or procedures to determine transition length). When transition lengths should or can be adjusted and by how much is also to be investigated and reported.
66

REFERENCES
1. A Policy on Geometric Design of Highways and Streets, American Association of State Highway Officials, Washington, DC, 1990.
2. A Policy on Intersections at Grade, American Association of State Highway Officials, Washington, DC, 1940.
3. Design Standards (Geometric) for Highways (Primary), American Association of State Highway Officials, Washington, DC, 1941.
4. Design Standards for the National System of Interstate Highways, American Association of State Highway Officials, Washington, DC, August 1, 1945.
5. A Policy on Geometric Design of Rural Highways, American Association of State Highway Officials, Washington, DC, 1954.
6. A Policy on Geometric Design of Rural Highways, American Association of State Highway Officials, Washington, DC, 1965.
7. A Policy on Geometric Design of Highways and Streets, American Association of State Highway Officials, Washington, DC, 1984.
8. Ludke, A. E. and J. L. Harrison, "Superelevation and Easement as Applied to Highway Curves," Public Roads, Vol. 3, No. 31, November 1920.
9. Gillespie, W. M., A Manual of the Principles and Practice of Road-Making, A. S. Barnes & Co., New York, NY, 1851.
10. Gillespie, W. M., A Manual of the Principles and Practice of Road-Making, A. S. Barnes & Co., New York, NY, 1871.
11. Vose, G. L., Manual for Railroad Engineers and Engineering Students, Lee and Shepard, Publishers, Boston, MA, 1873.
12. Cron, F. W., "Highway Design for Motor Vehicles--A Historical Review. Part 5: The Dynamics of Highway Curvature." Public Roads, 39(4), March 1976.
13. Blanchard, A. H. Elements of Highway Engineering, John Wiley & Sons, Inc., New York, NY, 1st ed. 1915.
14. Downs, W. S., "Purely Theoretical Superelevations Modified for Roads," Engineering News Record, 80(17), 1918.
15. Harger, W. G., The Location. Grading and Drainage of Highways, McGraw-Hill Book Company, New York, NY, 1921.
67

References
16. Agg, T. R., Construction of Roads and Pavements, McGraw-Hill Book Company, New York, NY, 3rd ed. 1924.
17. Agg, T. R., Construction of Roads and Pavements, McGraw-Hill Book Company, New York, NY, 4th ed. 1929.
18. Myers, C. J., "Designing Banked Highway Curves for Safety," Engineering News Record 95(8), 1925.
19. Blanchard, A. H., and R. L. Morrison, Elements of Highway Engineering, John Wiley & Sons Inc., New York, NY, 2nd ed. 1928.
20. Wiley, C. C., Principles of Highway Engineering, McGraw-Hill Book Company, Inc., New York, NY, 1st ed. 1928.
21. Bateman, J. H., Highway Engineering. A Textbook for Students of Civil Engineering, John Wiley & Sons, Inc., New York, NY, 2nd ed. 1928.
22. Connor, C. N., "Design Trends to Correlation with Traffic Needs," Engineering NewsRecord, January 7, 1937.
23. Bruce, A. G., Highway Design and Construction, International Textbook Company, Scranton, PA, 1937.
24. Agg, T. R., Construction of Roads and Pavements, McGraw-Hill Book Company, New York, NY, 5th ed. 1940.
25. Barnett, J., E. R. Haile, and R. A. Moyer, "Safe Side Friction and Supere1evation Design," Highway Research Board Proceedings, Vol. 16, November 1936.
26. Gibbs, G. I., The Highway Spiral, T. D. Toder, Roanoke, VA, 1941.
27. Bateman, J. H., Highway Engineering. A Textbook for Students of Civil Engineering, John Wiley & Sons Inc., New York, NY, 4th ed. 1942.
28. Good, M. C. Road Curve Geometry and Driver Behaviour Special Report No. 15. Australian Road Research Board. May 1978.
29. Moyer, R. A., "Skidding Characteristics of Automobile Tires on Roadway Surfaces and Their Relation to Highway Safety," Bulletin 120, Iowa Engineering Experiment Station, Ames, Iowa, Aug. 8, 1934.
30. Haile, Jr. E. R., "Discussion on Friction Factors and Superelevation," Highway Research Board Proceedings, Vol. 16, November 1936.
68
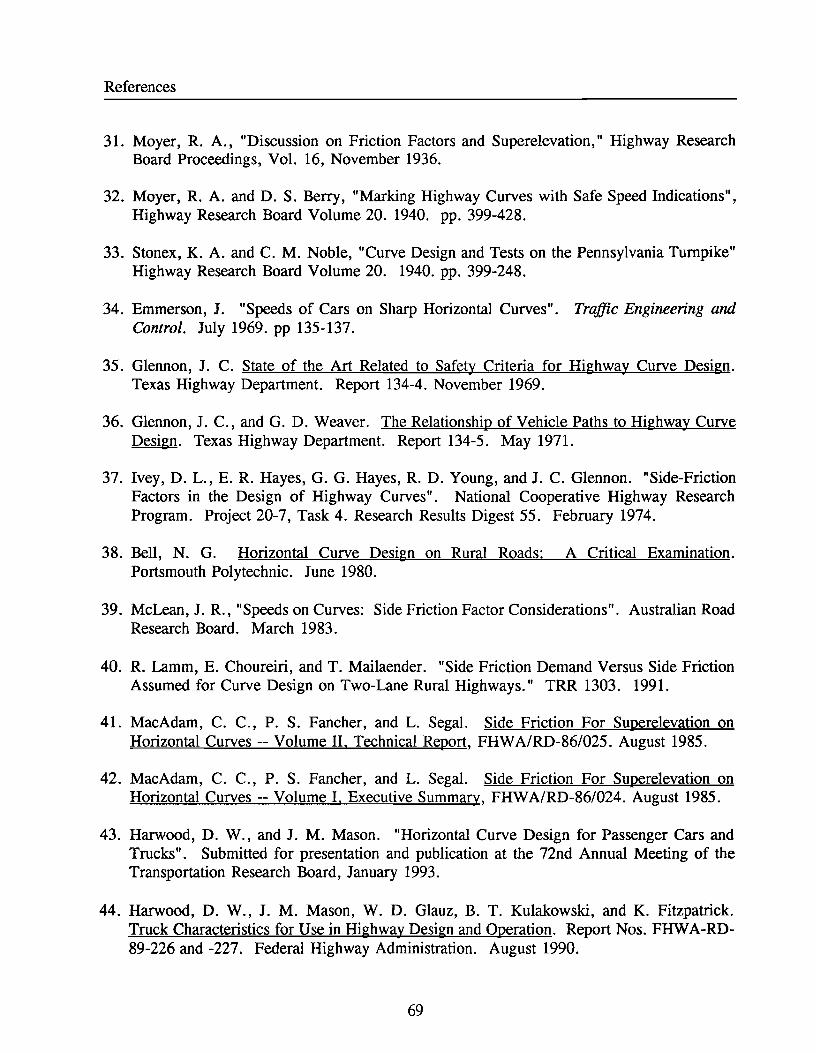
References
31. Moyer, R. A., "Discussion on Friction Factors and Superelevation," Highway Research Board Proceedings, Vol. 16, November 1936.
32. Moyer, R. A. and D. S. Berry, "Marking Highway Curves with Safe Speed Indications", Highway Research Board Volume 20. 1940. pp. 399-428.
33. Stonex, K. A. and C. M. Noble, "Curve Design and Tests on the Pennsylvania Turnpike" Highway Research Board Volume 20. 1940. pp. 399-248.
34. Emmerson, J. "Speeds of Cars on Sharp Horizontal Curves". Traffic Engineering and Control. July 1969. pp 135-137.
35. Glennon, J. C. State of the Art Related to Safety Criteria for Highway Curve Design. Texas Highway Department. Report 134-4. November 1969.
36. Glennon,1. c., and G. D. Weaver. The Relationship of Vehicle Paths to Highway Curve Design. Texas Highway Department. Report 134-5. May 1971.
37. Ivey, D. L., E. R. Hayes, G. G. Hayes, R. D. Young, and J. C. Glennon. "Side-Friction Factors in the Design of Highway Curves". National Cooperative Highway Research Program. Project 20-7, Task 4. Research Results Digest 55. February 1974.
38. Bell, N. G. Horizontal Curve Design on Rural Roads: A Critical Examination. Portsmouth Polytechnic. June 1980.
39. McLean, J. R., "Speeds on Curves: Side Friction Factor Considerations". Australian Road Research Board. March 1983.
40. R. Lamm, E. Choureiri, and T. Mailaender. "Side Friction Demand Versus Side Friction Assumed for Curve Design on Two-Lane Rural Highways." TRR 1303. 1991.
41. MacAdam, C. C., P. S. Fancher, and L. Segal. Side Friction For Superelevation on Horizontal Curves -- Volume II. Technical Report, FHW A/RD-86/025. August 1985.
42. MacAdam, C. C., P. S. Fancher, and L. Segal. Side Friction For Superelevation on Horizontal Curves -- Volume I. Executive Summary, FHWA/RD-86/024. August 1985.
43. Harwood, D. W., and J. M. Mason. "Horizontal Curve Design for Passenger Cars and Trucks". Submitted for presentation and publication at the 72nd Annual Meeting of the Transportation Research Board, January 1993.
44. Harwood, D. W., J. M. Mason, W. D. Glauz, B. T. Kulakowski, and K. Fitzpatrick. Truck Characteristics for Use in Highway Design and Operation. Report Nos. FHWA-RD-89-226 and -227. Federal Highway Administration. August 1990.
69

References
45. Olson, P. L., D. E. Cleveland, P. S. Fancher, L. P. Kostyniuk, and L. W. Scheider. Parameters Affecting Stopping Sight Distance. NCHRP Report 270. Transportation Research Board. June 1984.
46 Ervin, R. D., C. C. MacAdam, and M. Barnes. "Influence of the Geometric Design of Highway Ramps on the Stability and Control of Heavy-Duty Trucks". Transportation Research Record 1052. Transportation Research Board. 1985.
47. Ervin, R. D., R. L. Nisonger, C. C. MacAdam, and P. S. Fancher. Influence of Size and Weight Variables on the Stability and Control Properties of Heavy Trucks. Report No. FHWA/RD-83/029. Federal Highway Administration. July 1986.
70