TECHNICAL REPORT ON THE CHARACTERIZATION OF GATOR BASE EXPANDED ... · LÉTS est une constituante...
24
L’ÉTS est une constituante du réseau de l’Université du Québec 1 TECHNICAL REPORT ON THE CHARACTERIZATION OF GATOR BASE EXPANDED POLYPROPYLENE PANEL (EPP) AND STUDY OF THE MECHANICAL BEHEVIOR OF A TRADITIONAL ICPI APPLICATION VS A GATOR BASE PEDESTRIAN APPLICATION Alan Carter, ing., Ph.D. Michel Vaillancourt, ing. Ph.D. MONTREAL, NOVEMBER 2014
Transcript of TECHNICAL REPORT ON THE CHARACTERIZATION OF GATOR BASE EXPANDED ... · LÉTS est une constituante...

L’ÉTS est une constituante du réseau de l’Université du Québec 1
TECHNICAL REPORT ON THE CHARACTERIZATION OF GATOR BASE EXPANDED POLYPROPYLENE PANEL (EPP) AND STUDY OF THE MECHANICAL BEHEVIOR OF A TRADITIONAL ICPI APPLICATION VS A GATOR BASE PEDESTRIAN APPLICATION
Alan Carter, ing., Ph.D.
Michel Vaillancourt, ing. Ph.D.
MONTREAL, NOVEMBER 2014

L’ÉTS est une constituante du réseau de l’Université du Québec2
École de technologie supérieure1100, rue Notre-Dame Ouest
Montréal (Québec) Canada H3C 1K3
Téléphone : 514 396 88
Construction Engineering Department ALLIANCE DESIGNER PRODUCTSM. Jack Tutino, ing.Vice President 225, Boulevard Bellerose O. Ville de Laval, Québec, CanadaH7L 6A1Tél : (450) 624-1611Fax : (450) 624-1622Courriel : [email protected]
Subject : Proposal for a characterization of the thermal and mechanical properties of Gator Base panels from Alliance Designer Products Inc used under concrete pavers
Dear M. Tutino,
You will find here the results of the tests performed as stated in the reserach contract between you and the Laboratoire sur les Chaussées et matériaux bitumineux (LCMB) of École de Technologie Supérieure, on January 9, 2014. The project was defined as:
Your company, Alliance, wants to put on the market a expended polypropylene panel « Gator Base » to be used in the construction of pedestrian use such as patio made with concrete pavers. You wish that ETS studies some characteristics of those panels so you can promote them. You think that those panels can replace 125 mm (5 in.) of 0-20mm (0-3/4 in.) crushed stone placed under concrete pavers for pedestrian purposes. You will find in the following paragraphs a description of what we plan to do in order to fulfill our mandate (translated from original).
In the following sections, you will find a descriptions of all the tests that were done and a complete analysis of the results.
If you have any enquiries, please do not hesitate to contact us. Regards,
Michel Vaillancourt, ing. Ph.D. Alan Carter, ing. Ph.D.Professors, Construction Engineering Department École de technologie supérieure.

L’ÉTS est une constituante du réseau de l’Université du Québec 3
1. TESTS AND TESTS RESULTS
For this project on the characterization of the Gator Base Expanded Polypropyne Panels (EPP), many tests, some standardized and some not, were performed. Some of those tests were planned initially, many were added. Many tests were performed directly on the panels in order to characterize them. Other tests, used to characterize the mechanical behaviour of the concrete paver – Gator Base foundation system, were performed on a test section in our laboratory.
The tests performed on the Gator Base EPP are part of a relatively standard group of tests for this type of materials. Except for the long term static loading test, which is not standardized, the following tests were performed:
• Density (LC20-067);• Absorption (ASTM D2842-12);• Resistance to chemical (ASTM D543-06);• Flexural properties (ASTM C203-05a);• Compressive properties (ASTM D1621-10);• Coefficient of thermal expansion (ASTM D696-08);• Thermal transmission properties (ASTM C518-04);• Long term static loading.
The test section experiments allowed us to evaluate a concrete paver system with a Gator Base EPP foundation’s behaviour and compare it with a concrete paver system with a standard granular foun-dation. The tests gave us the opportunity to measure the strain of the static Gator Base EPP when subjected to a static or dynamic load, and to evaluate the elastic modulus and a surface modulus.
1.1 Tests on Gator Base EPP
The standardized and non-standardized tests are described in the following paragraphs. The objec-tives of each test, the procedure and the results are presented. A table that summarizes all those results is presented afterwards.
1.1.1 Panel Dimensions
The Gator Base EPP panels studied measure 90 cm by 59.5 cm (36x 24 in.) and have a thickness of 19.05 mm (0.75 in.). Each panel weighs 598.7 gr or 1.32lbs.
1.1.2 Density
The goal of this test is to measure the unit weight or the density of the Gator Base EPP. The density was calculated by determining the ratio of the weight of a given volume of panel to the weight of an equal volume of water, as specified in the LC 21-067 standard of Transport Ministry of Quebec. The test consist of weighing a dry sample before making it saturated surface-dry (SSD) by drying it with a towel after being submersed in water for 24 hours. SSD is defined as the condition of an object in which the surface is dry, but the inter-particle voids are saturated with water. The test was performed several time and the results shown are the average of 5 tests. The results are shown in Table 1. The coefficient of variation, C.O.V., is also shown in Table 1. C.O.V. gives an indication of the variability of the results. A C.O.V. of 0.07% is very low and indicates that there is very little variation in the results.
L’ÉTS est une constituante du réseau de l’Université du Québec4
Table 1. Density test resultsDry weight, g
(once)Volume, cm3
(in3)Density, g/cm³
(once/in3)Test 1 26.2 (0.92) 429.0 (26.2) 0.0611 (0.035)Test 2 25.0 (0.88) 421.9 (25.7) 0.0593 (0.034)Test 3 25.2 (0.89) 419.3 (25.6) 0.0601 (0.035)Test 4 25.2 (0.89) 421.5 (25.7) 0.0598 (0.035)Test 5 25.3 (0.89) 416.6 (25.4) 0.0607 (0.035)
AverageC.O.V.
25.4 (0.90)1.86%
421.7 (25.7)1.10%
0.0602 (0.035)1.21%
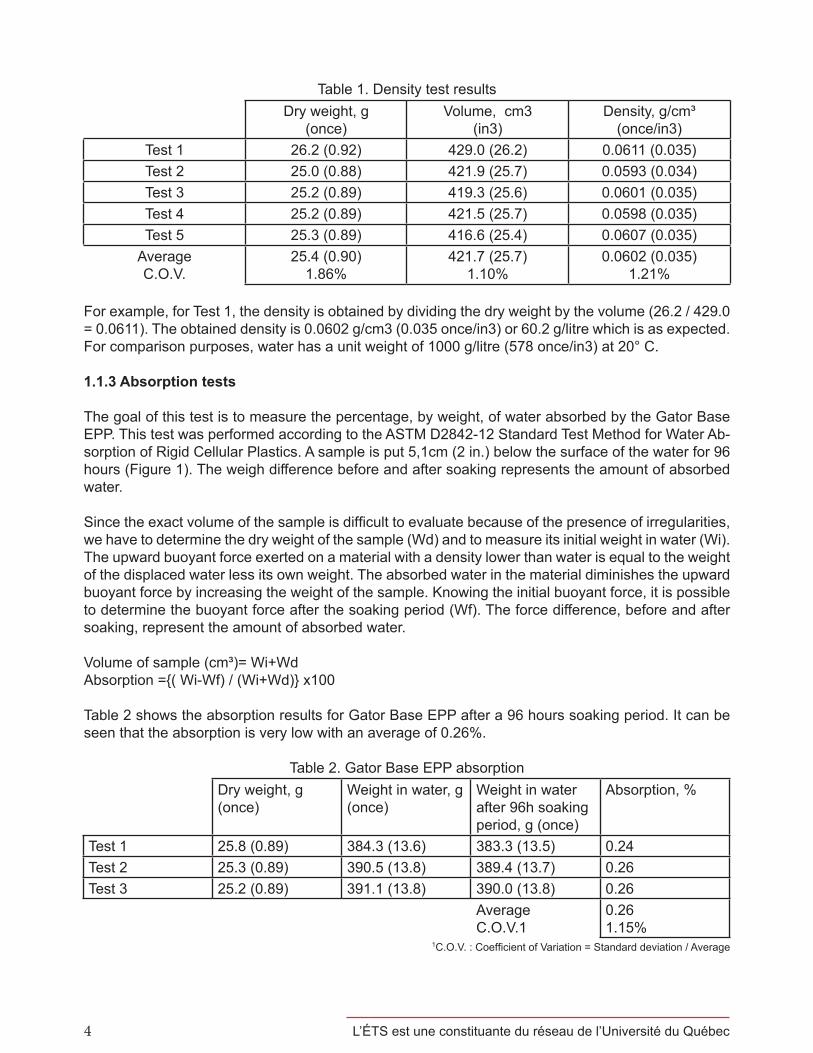
For example, for Test 1, the density is obtained by dividing the dry weight by the volume (26.2 / 429.0 = 0.0611). The obtained density is 0.0602 g/cm3 (0.035 once/in3) or 60.2 g/litre which is as expected. For comparison purposes, water has a unit weight of 1000 g/litre (578 once/in3) at 20° C.
1.1.3 Absorption tests
The goal of this test is to measure the percentage, by weight, of water absorbed by the Gator Base EPP. This test was performed according to the ASTM D2842-12 Standard Test Method for Water Ab-sorption of Rigid Cellular Plastics. A sample is put 5,1cm (2 in.) below the surface of the water for 96 hours (Figure 1). The weigh difference before and after soaking represents the amount of absorbed water.
Since the exact volume of the sample is difficult to evaluate because of the presence of irregularities, we have to determine the dry weight of the sample (Wd) and to measure its initial weight in water (Wi). The upward buoyant force exerted on a material with a density lower than water is equal to the weight of the displaced water less its own weight. The absorbed water in the material diminishes the upward buoyant force by increasing the weight of the sample. Knowing the initial buoyant force, it is possible to determine the buoyant force after the soaking period (Wf). The force difference, before and after soaking, represent the amount of absorbed water.
Volume of sample (cm³)= Wi+WdAbsorption ={( Wi-Wf) / (Wi+Wd)} x100
Table 2 shows the absorption results for Gator Base EPP after a 96 hours soaking period. It can be seen that the absorption is very low with an average of 0.26%.
Table 2. Gator Base EPP absorptionDry weight, g (once)
Weight in water, g (once)
Weight in water after 96h soaking period, g (once)
Absorption, %
Test 1 25.8 (0.89) 384.3 (13.6) 383.3 (13.5) 0.24Test 2 25.3 (0.89) 390.5 (13.8) 389.4 (13.7) 0.26Test 3 25.2 (0.89) 391.1 (13.8) 390.0 (13.8) 0.26
AverageC.O.V.1
0.261.15%
1C.O.V. : Coefficient of Variation = Standard deviation / Average

L’ÉTS est une constituante du réseau de l’Université du Québec 5
Figure 1. Absorption test
1.1.4 Flexural Properties
The goal of this test is to analyse the flexural characteristics of the Gator Base EPP under load. The test was performed according to ASTM C203-05a: Standard Test Methods for Breaking Load and Flexural Properties of Block-Type Thermal Insulation. Rectangular samples were cut in order to fit on the supports which are 200mm (8 in.) apart (Figure 2). The tested samples are 120mm (4.7 in.) wide, 280mm (11 in.) long and 19.05mm (0.75 in.) thick. A load is applied in the center between the sup-ports with a hydraulic press. The relative force-displacement is recorded and a graph is built until the displacement reaches 25mm (1 in.) Since the material is very flexible, no samples were broken during tests. The elastic modulus, E, is calculated with the equation E=PL³/48ID (with a displacement > 5%) in which P is the load, L the length of the sample, I is the moment of inertia, and D is the deflection at the center of the specimen. The average Elastic Modulus obtained is 7.51 MPa (1095 PSI).

L’ÉTS est une constituante du réseau de l’Université du Québec6
Figure 2. Flexion test
1.1.5 Compression Test
The goal of this test is to evaluate the compressive properties of the Gator Base EPP under loads. The tests were performed according to ASTM D1621-10 : Standard Test Method for Compressive Properties of Rigid Cellular Plastics with an MTS 810 (Material Test System) hydraulic press (Figure 3). The test enable us to determinate the force necessary to compress the panel to 25%, 50% and 75% of its initial thickness. The force is applied on an area of 63 cm² (9.8in2) on the 150 mm x 150 mm (6 x 6 in.) panel. The results are presented in Table 3.

L’ÉTS est une constituante du réseau de l’Université du Québec 7
Table 3. Compressive results for Gator Base EPP25% Strain 50 % Strain 75% Strain
Force, kN(lbs)
Stress, kPa (PSI)
Force, kN(lbs)
Stress, kPa (PSI)
Force, kN(lbs)
Stress, kPa (PSI)
Test 1 2.54 (571) 399.26 (57.91)
3.55 (798) 557.55 (80.87)
5.96 (1340) 937.48 (135.97)
Test 2 2.42 (544) 380.40 (55.17)
3.45 (776) 542.31 (78.65)
5.90 (1326) 926.64 (134.40)
Test 3 2.52 (567) 396.12 (57.45)
3.50 (787) 550.17 (79.79)
5.23 (1176) 821.95 (119.21)
Test 4 2.54 (571) 399.26 (57.91)
3.60 (809) 565.88 (82.07)
6.72 (1511) 1056.16 (153.18)
Test 5 2.48 (558) 390.15 (56.59)
3.55 (798) 558.03 (80.93)
6.06 (1362) 952.57 (138.16)
Average 2.50 (562) 393.04 (57.01)
3.53 (794) 554.79 (80.47)
5.97 (1343) 938.96 (136.18)
C.O.V.1 2.0% 2.0% 1.6% 1.6% 8.9% 8.9%C.O.V. 1 (Coefficient of variation)
As it can be seen in Table 3, it takes an average of 393 kPa ( 57 psi) to create a 25% strain on the pan-el. To put that in perspective, one of the smallest pavers used nowadays measure 300mm x 165mm (12 x 6.5 in.) for a total surface area of 495 cm2 (78 in2). To reach the 393 kPa ( 57 psi) stress, a weight of 2182 kg (4800 lbs) is needed solely on the paver. Higher weights are needed to reach the 50% or 75% strain.
The same results are presented in Figure 4. As it can be seen, the relation between stress and strain is linear. With this, it is possible to evaluate the strain that would be measured with different stress. For example, a pressure of 55 kPa (8 PSI), would results in less than 1% strain.
Figure 3. Compression test

L’ÉTS est une constituante du réseau de l’Université du Québec8
1.1.6 Long Term Static Load Test
The objective of this non-standardized test is to evaluate the deformation of a 15cm x 15cm (6 x 6 in.) Gator Base EPP under a load of 11.34 kg (25 lbs) applied during 28 days. This results in a stress of 4.94 kPa or 0.69 PSI. In Table 4, you can see the deformation observed directly after the load was taken off and also 90 days after unloading. It can be seen that there is an average of 0,16 mm (0.006 in.) of deformation directly after unloading and 0.02 mm (0.0007 in.) after 90 days. The Gator Base EPP almost completely regained its initial thickness with only 0.1% of permanent deformation after 90 days.
Table 4. Measured Deformation after Long Term Loading TestInitial thickness mm (inch)
After 28 days mm (inch)
Differences mm (inch)
90 days after unloadingmm (inch)
Differences mm (inch)
Recovery after 90 days %1
Test 1 19.18 (0.76) 19.03 (0.75) 0.15 (0.006) 19.16 (0.76)
0.02 (0.0008)
99.9
Test 2 19.13 (0.75) 18.95 (0.75) 0.18 (0.007) 19.12 (0.75)
0.01 (0.0004)
99.9
Test 3 19.16 (0.76) 19.01 (0.75) 0.15 (0.006) 19.13 (0.75)
0.03 (0.001) 99.8
Test 4 19.07 (0.75) 18.91 (0.74) 0.16 (0.006) 19.06 (0.75)
0.01 (0.0004)
99.9
Average 0.16 (0.006) 0.02 (0.0008)
99.9
C.O.V. 1.41% ( 0.05%)
0.96% (0.03%)
0.05%
1% Recovery = thickness after 90 days / initial thickness
32
L’ÉTS est une constituante du réseau de l’Université du Québec 9
1.1.6 Long Term Static Load Test
The objective of this non-standardized test is to evaluate the deformation of a 15cm x 15cm (6 x 6 in.) Gator Base EPP under a load of 11.34 kg (25 lbs) applied during 28 days. This results in a stress of 4.94 kPa or 0.69 PSI. In Table 4, you can see the deformation observed directly after the load was taken off and also 90 days after unloading. It can be seen that there is an average of 0,16 mm (0.006 in.) of deformation directly after unloading and 0.02 mm (0.0007 in.) after 90 days. The Gator Base EPP almost completely regained its initial thickness with only 0.1% of permanent deformation after 90 days.
Table 4. Measured Deformation after Long Term Loading TestInitial thickness mm (inch)
After 28 days mm (inch)
Differences mm (inch)
90 days after unloadingmm (inch)
Differences mm (inch)
Recovery after 90 days %1
Test 1 19.18 (0.76) 19.03 (0.75) 0.15 (0.006) 19.16 (0.76)
0.02 (0.0008)
99.9
Test 2 19.13 (0.75) 18.95 (0.75) 0.18 (0.007) 19.12 (0.75)
0.01 (0.0004)
99.9
Test 3 19.16 (0.76) 19.01 (0.75) 0.15 (0.006) 19.13 (0.75)
0.03 (0.001) 99.8
Test 4 19.07 (0.75) 18.91 (0.74) 0.16 (0.006) 19.06 (0.75)
0.01 (0.0004)
99.9
Average 0.16 (0.006) 0.02 (0.0008)
99.9
C.O.V. 1.41% ( 0.05%)
0.96% (0.03%)
0.05%
1% Recovery = thickness after 90 days / initial thickness
32
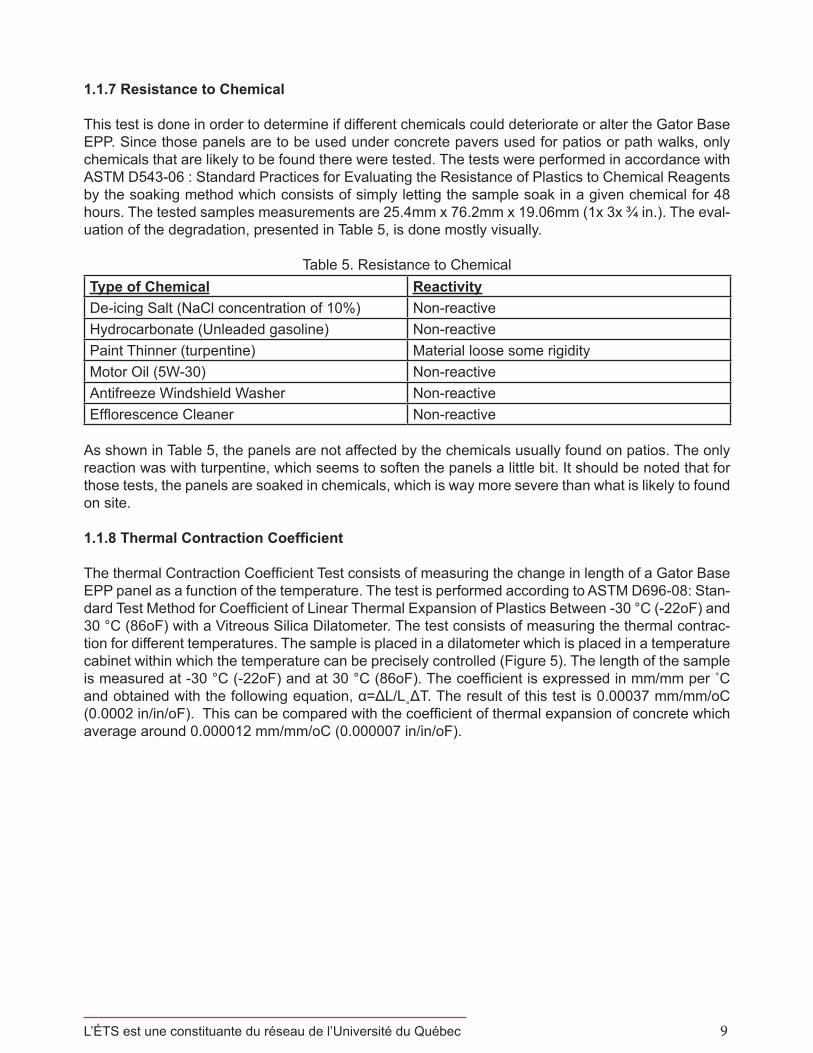
1.1.7 Resistance to Chemical
This test is done in order to determine if different chemicals could deteriorate or alter the Gator Base EPP. Since those panels are to be used under concrete pavers used for patios or path walks, only chemicals that are likely to be found there were tested. The tests were performed in accordance with ASTM D543-06 : Standard Practices for Evaluating the Resistance of Plastics to Chemical Reagents by the soaking method which consists of simply letting the sample soak in a given chemical for 48 hours. The tested samples measurements are 25.4mm x 76.2mm x 19.06mm (1x 3x ¾ in.). The eval-uation of the degradation, presented in Table 5, is done mostly visually.
Table 5. Resistance to ChemicalType of Chemical ReactivityDe-icing Salt (NaCl concentration of 10%) Non-reactiveHydrocarbonate (Unleaded gasoline) Non-reactivePaint Thinner (turpentine) Material loose some rigidityMotor Oil (5W-30) Non-reactiveAntifreeze Windshield Washer Non-reactiveEfflorescence Cleaner Non-reactive
As shown in Table 5, the panels are not affected by the chemicals usually found on patios. The only reaction was with turpentine, which seems to soften the panels a little bit. It should be noted that for those tests, the panels are soaked in chemicals, which is way more severe than what is likely to found on site.
1.1.8 Thermal Contraction Coefficient
The thermal Contraction Coefficient Test consists of measuring the change in length of a Gator Base EPP panel as a function of the temperature. The test is performed according to ASTM D696-08: Stan-dard Test Method for Coefficient of Linear Thermal Expansion of Plastics Between -30 °C (-22oF) and 30 °C (86oF) with a Vitreous Silica Dilatometer. The test consists of measuring the thermal contrac-tion for different temperatures. The sample is placed in a dilatometer which is placed in a temperature cabinet within which the temperature can be precisely controlled (Figure 5). The length of the sample is measured at -30 °C (-22oF) and at 30 °C (86oF). The coefficient is expressed in mm/mm per ˚C and obtained with the following equation, α=ΔL/L˳ΔT. The result of this test is 0.00037 mm/mm/oC (0.0002 in/in/oF). This can be compared with the coefficient of thermal expansion of concrete which average around 0.000012 mm/mm/oC (0.000007 in/in/oF).

L’ÉTS est une constituante du réseau de l’Université du Québec10
Figure 5. Dilatometer
1.1.9 Thermal Transmission Properties
These tests were performed to evaluate the thermal conductivity, the thermal conductance and the thermal resistance according to ASTM C518. It should be noted that those tests were performed outside ETS.
Table 6. Thermal Transmission PropertiesThermal Properties ValuesThermal Conductivity, k 0.03990 W/(m*K)
(0.0231 BTU/(hr*°F*pi))Thermal Conductance. C
1.97815 W/(m2*K)(0.34835 BTU/(hr*°F*pi2))
Thermal Resistance R Value (Pannels) 0.50552 (m2*K)/W (2.87066 hr*°F*pi2/BTU)
R Value per inch of thick-ness
0.6319 (m2*K)/W per 25.4 mm(3.61745 hr*°F*pi2/BTU) per inch
The results of the thermal transmission properties are used in the frost protection part found further in this report.

L’ÉTS est une constituante du réseau de l’Université du Québec 11
Table 7 shows a summary of all the tests mentioned in the previous chapters.Material Type Expanded Polypropylene
Intrinsic propertiesThickness 19.05 mm (0.75’’) LC21-067Density 60 g/l (3.74 lbs/ft3)Panel Size 90cm x 59.5 cm (3ft x 2ft)Panel Weight 598.7g (1.32lbs)Water Absorption 0.255% ASTM D2842-12
Thermal PropertiesThermal conductance 0.506 (m2●K)/W
(0.348 BTU/(hr●oF●pi2)ASTM C518-04
Thermal Resistance R-value per inch thick-ness
0.632 W/(m2●K)(3.62 (hr●oF●pi2/BTU)
ASTM C518-04
Thermal Contraction Coefficient per 1 oC 0.00037 mm/mm(0.0002 in/in/oF)
ASTM D696-08
Panel CharacteristicsElastic Modulus 7.51 MPa (1095 psi) ASTM C203-05aCompression Strength ASTM D1621-10@25% Strength 393 kPa (57psi)@50% Strength 555 kPa (80psi)@75% Strength 939 kPa (136psi)
Resistance to ChemicalDe-icing Salt (NaCl concentration of 10%) Non-reactiveHydrocarbonate (Unleaded gasoline) Non-reactivePaint Thinner (turpentine) Material loose some rigidityMotor Oil (5W-30) Non-reactiveAntifreeze Windshield Washer Non-reactiveEfflorescence Cleaner Non-reactive
1.2 Experiments on Test Bench
1.2.1 Goal of the test Bench
In order to evaluate the behavior of the Gator Base EPP in a concrete paver system, a test bench was built in the laboratory. The tests performed on the test bench, which are not standardized, were done to measure the parameters of the Gator Base EPP when used instead of a granular base. Two types of tests were performed on two different setups. Static and dynamic tests were performed on a first setup with Gator Base EPP and on a second setup with a granular foundation of 125mm (5 in.)
1.2.2 Setup and Instrumentation of the Test Bench

L’ÉTS est une constituante du réseau de l’Université du Québec12
For these tests, it was necessary to build a test bench that could be used with or without Gator Base EPP. First, a container of 1.81m by 1.81m (6’ x 6’) and 0.30m (12 in.) in height with high density polyethylene was used. The container was placed directly on the concrete floor in our laboratory. Pieces of plywood of 2cm (3/4 in.) in thickness and 60 cm (2 feet) in height were installed all around the container to increase its height. Steel angles and straps were used to strengthen the container.
A first layer of 250mm (10 in.) of compacted sandy soil was put in the container to represent subgrade soil. Measure the unit weight by sand-cone method according to ASTM 1556-90 were performed in order to determinate the optimum water content and the dry unit weight.
Three load cells were placed during this step. The first one was put at the bottom of the container, a second one at mid-height, 12.5cm (5 in.) from the bottom, and a third one at the top of the sandy soil layer, 250mm (10 in.) from the bottom. Those load cells were connected to a data acquisition system and were used to determine the stress, in kPa, applied by the weight of the subgrade sandy soil and the rest of the structure on top of it and of the static loads put on the pavers. The subgrade sandy soil was compacted to a modified Proctor value of 93%.
On top of the subgrade sandy soil, a geotextile was installed. On top of it, a bedding sand layer of 20mm (3/4 in.) was compacted manually with a hand tamper. The surface was levelled, with a bubble level, and all the irregularities were smoothed out.
Afterwards, Gator Base EPP were installed as shown on Figure 7. Four strain gauges were glued under the central panel, and connected to a data acquisition system in order to measure the strain under loads.
* Exact measurement of the the complete system was; Traditional installation: 450mm (17.7 in.) and the Gator Base EPP installation was 345mm (13.6 in.)
Figure 6. Test Bench Setup

L’ÉTS est une constituante du réseau de l’Université du Québec 13
Figure 7. Position of the Gator Base EPP
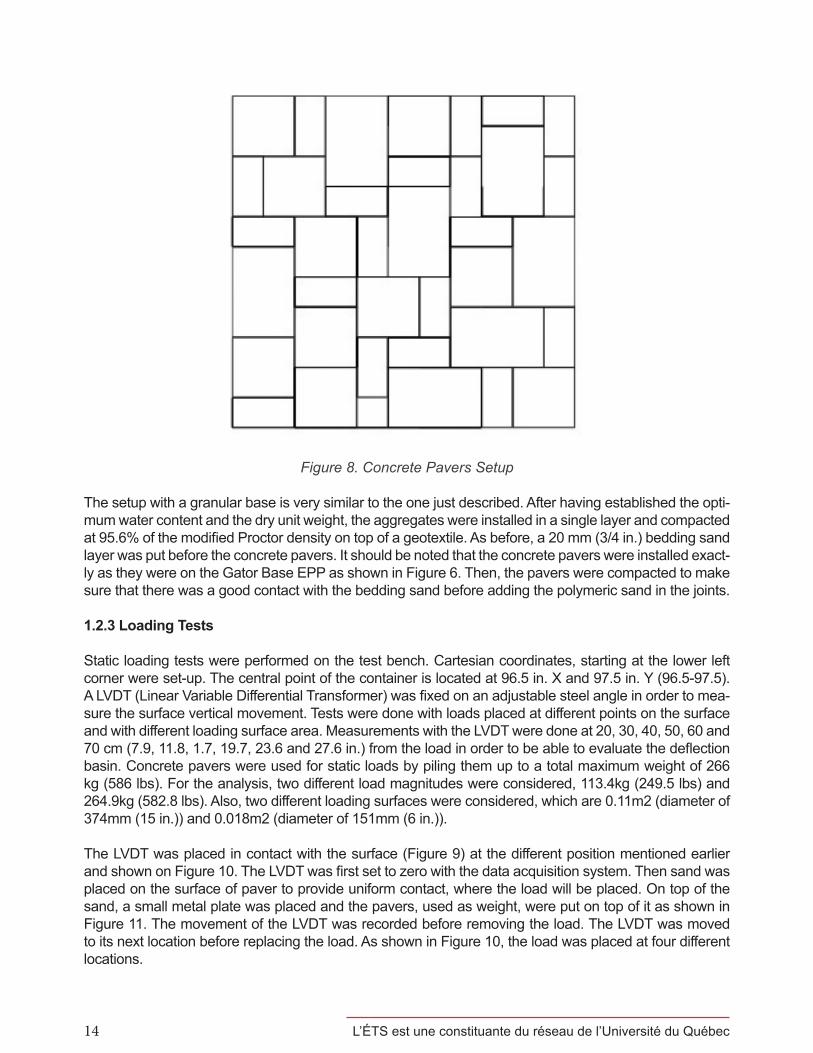
The concrete pavers were then installed as shown in Figure 8. The setup was done according to the different dimensions of the pavers and according to the position of the Gator Base EPP underneath. Once all the pavers were installed, a polymeric sand (Gator Maxx Polymeric Sand) was broomed on top and placed properly in between all the pavers joints and compacted. With a watering can, water was spread on the surface to harden the Gator Maxx polymeric sand.
L’ÉTS est une constituante du réseau de l’Université du Québec14
Figure 8. Concrete Pavers Setup
The setup with a granular base is very similar to the one just described. After having established the opti-mum water content and the dry unit weight, the aggregates were installed in a single layer and compacted at 95.6% of the modified Proctor density on top of a geotextile. As before, a 20 mm (3/4 in.) bedding sand layer was put before the concrete pavers. It should be noted that the concrete pavers were installed exact-ly as they were on the Gator Base EPP as shown in Figure 6. Then, the pavers were compacted to make sure that there was a good contact with the bedding sand before adding the polymeric sand in the joints.
1.2.3 Loading Tests
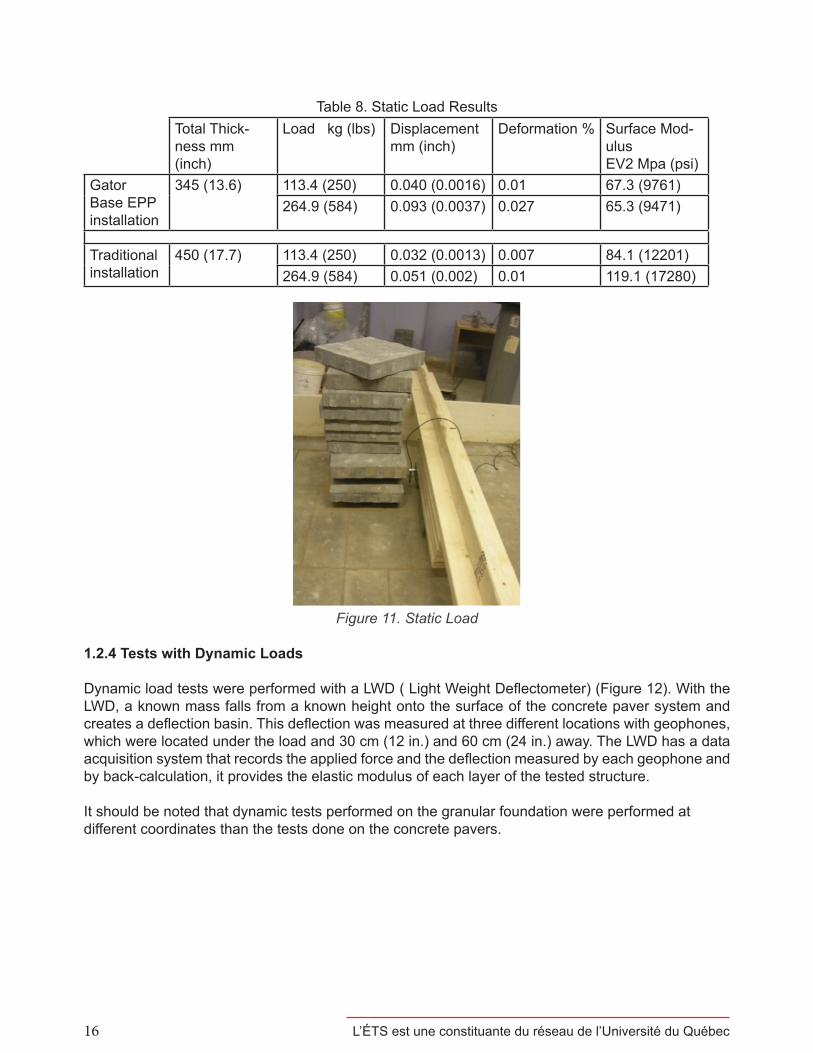
Static loading tests were performed on the test bench. Cartesian coordinates, starting at the lower left corner were set-up. The central point of the container is located at 96.5 in. X and 97.5 in. Y (96.5-97.5). A LVDT (Linear Variable Differential Transformer) was fixed on an adjustable steel angle in order to mea-sure the surface vertical movement. Tests were done with loads placed at different points on the surface and with different loading surface area. Measurements with the LVDT were done at 20, 30, 40, 50, 60 and 70 cm (7.9, 11.8, 1.7, 19.7, 23.6 and 27.6 in.) from the load in order to be able to evaluate the deflection basin. Concrete pavers were used for static loads by piling them up to a total maximum weight of 266 kg (586 lbs). For the analysis, two different load magnitudes were considered, 113.4kg (249.5 lbs) and 264.9kg (582.8 lbs). Also, two different loading surfaces were considered, which are 0.11m2 (diameter of 374mm (15 in.)) and 0.018m2 (diameter of 151mm (6 in.)).
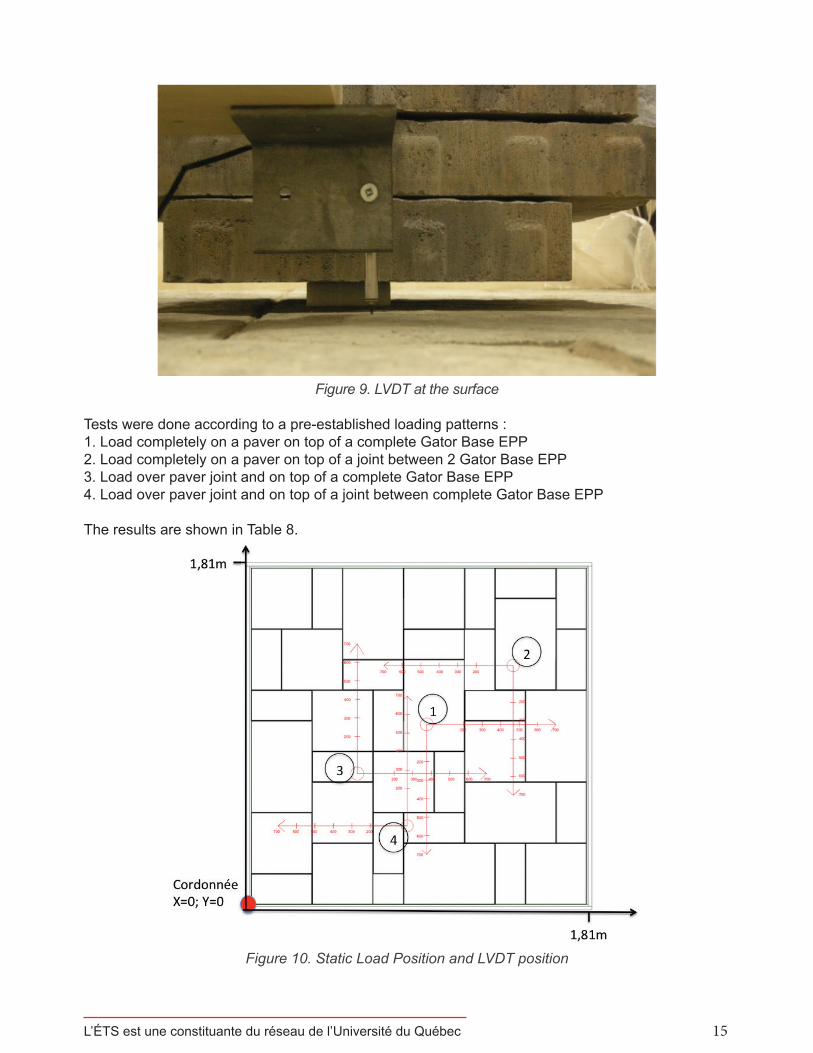
The LVDT was placed in contact with the surface (Figure 9) at the different position mentioned earlier and shown on Figure 10. The LVDT was first set to zero with the data acquisition system. Then sand was placed on the surface of paver to provide uniform contact, where the load will be placed. On top of the sand, a small metal plate was placed and the pavers, used as weight, were put on top of it as shown in Figure 11. The movement of the LVDT was recorded before removing the load. The LVDT was moved to its next location before replacing the load. As shown in Figure 10, the load was placed at four different locations.
L’ÉTS est une constituante du réseau de l’Université du Québec 15
Figure 9. LVDT at the surface
Tests were done according to a pre-established loading patterns : 1. Load completely on a paver on top of a complete Gator Base EPP2. Load completely on a paver on top of a joint between 2 Gator Base EPP 3. Load over paver joint and on top of a complete Gator Base EPP4. Load over paver joint and on top of a joint between complete Gator Base EPP
The results are shown in Table 8.
Figure 10. Static Load Position and LVDT position
L’ÉTS est une constituante du réseau de l’Université du Québec16
Table 8. Static Load ResultsTotal Thick-ness mm (inch)
Load kg (lbs) Displacement mm (inch)
Deformation % Surface Mod-ulus EV2 Mpa (psi)
Gator Base EPP installation
345 (13.6) 113.4 (250) 0.040 (0.0016) 0.01 67.3 (9761)264.9 (584) 0.093 (0.0037) 0.027 65.3 (9471)
Traditional installation
450 (17.7) 113.4 (250) 0.032 (0.0013) 0.007 84.1 (12201)264.9 (584) 0.051 (0.002) 0.01 119.1 (17280)
Figure 11. Static Load
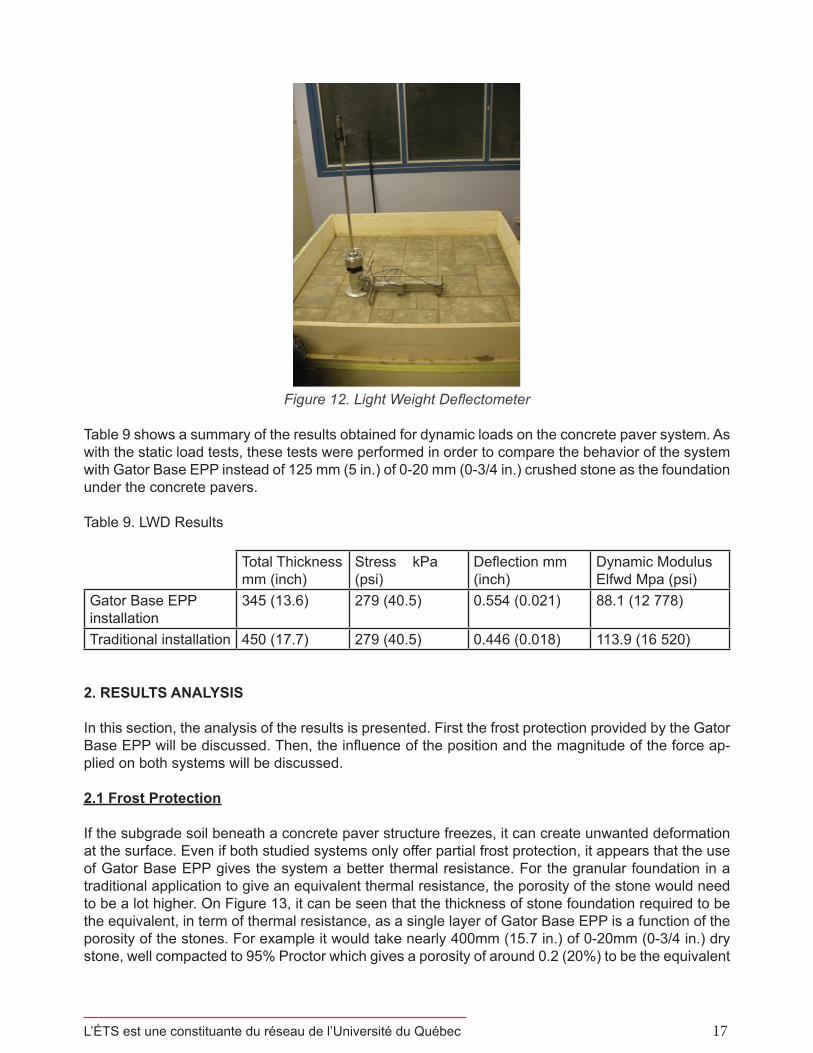
1.2.4 Tests with Dynamic Loads
Dynamic load tests were performed with a LWD ( Light Weight Deflectometer) (Figure 12). With the LWD, a known mass falls from a known height onto the surface of the concrete paver system and creates a deflection basin. This deflection was measured at three different locations with geophones, which were located under the load and 30 cm (12 in.) and 60 cm (24 in.) away. The LWD has a data acquisition system that records the applied force and the deflection measured by each geophone and by back-calculation, it provides the elastic modulus of each layer of the tested structure.
It should be noted that dynamic tests performed on the granular foundation were performed at different coordinates than the tests done on the concrete pavers.
L’ÉTS est une constituante du réseau de l’Université du Québec 17
Figure 12. Light Weight Deflectometer
Table 9 shows a summary of the results obtained for dynamic loads on the concrete paver system. As with the static load tests, these tests were performed in order to compare the behavior of the system with Gator Base EPP instead of 125 mm (5 in.) of 0-20 mm (0-3/4 in.) crushed stone as the foundation under the concrete pavers.
Table 9. LWD Results
Total Thickness mm (inch)
Stress kPa (psi)
Deflection mm (inch)
Dynamic ModulusElfwd Mpa (psi)
Gator Base EPP installation
345 (13.6) 279 (40.5) 0.554 (0.021) 88.1 (12 778)
Traditional installation 450 (17.7) 279 (40.5) 0.446 (0.018) 113.9 (16 520)
2. RESULTS ANALYSIS
In this section, the analysis of the results is presented. First the frost protection provided by the Gator Base EPP will be discussed. Then, the influence of the position and the magnitude of the force ap-plied on both systems will be discussed.
2.1 Frost Protection
If the subgrade soil beneath a concrete paver structure freezes, it can create unwanted deformation at the surface. Even if both studied systems only offer partial frost protection, it appears that the use of Gator Base EPP gives the system a better thermal resistance. For the granular foundation in a traditional application to give an equivalent thermal resistance, the porosity of the stone would need to be a lot higher. On Figure 13, it can be seen that the thickness of stone foundation required to be the equivalent, in term of thermal resistance, as a single layer of Gator Base EPP is a function of the porosity of the stones. For example it would take nearly 400mm (15.7 in.) of 0-20mm (0-3/4 in.) dry stone, well compacted to 95% Proctor which gives a porosity of around 0.2 (20%) to be the equivalent

L’ÉTS est une constituante du réseau de l’Université du Québec18
of the insulation provided by a single layer of Gator Base EPP. It is important to note that if the stone is wet, the thermal resistance diminishes.
Figure 13. 0-20mm (0-3/4 in.) Granular Base Equivalent Thickness of Gator Base EPP in terms of Thermal Resistance as a Function of the Porosity of the Granular Base
2.2 Static Load Tests
As mentioned before, for the static load tests, different load magnitudes and position coordinates were used. This was done in order to cover as many different situations as possible and to make sure to evaluate whether there is a difference if the load is located in the middle of a paver, above a joint or if it matters when the load is above the joints between Gator Base EPP.
Figures 14a, 14b and 14c present the deflection basins for three static loads at four different po-sitions. The first thing to note is that the different deflection basins are very similar to one another regardless of the position of the load. Figures 14a and 14b show deflection of 0.05mm near the load and near zero at 700mm from the load. Once again, we can see, if we compare the deflection along a given axis, that the load position does not matter much.
The main difference between the results shown in Figure 14a and 14b is the amplitude of the stress. In fact, this difference is due to the size of the contact area between the load and the pavers. Looking at Figures 14a and 14b, it can be seen that this does not have a big influence, even if the stress goes from 10.56 kPa on Figure 14a to 63.1 kPa for Figure 14b. Also, the deflection basin shown on Figure 14c is twice the ones shown in 14a and 14b, but with a stress of 23.67 kPa, which is smaller than the one used for 14b. This shows that the surface of contact does not have a great influence, but the magnitude of the load does. For Figure 14c, a load of 264.9 kg was used, which is about twice the load used in the two other cases

L’ÉTS est une constituante du réseau de l’Université du Québec 19
Figure 14a. Deflection Basin for Static Load Tests at two different locations (96.5;97.5) and (58.5;71.5) with an applied stress of 10.56 kPa (1.53 PSI) (113.4 kg (250 lbs) on a 0.11m2 (170.5
in2) surface) on a system with Gator Base EPP
Figure 14b. Deflection Basin for Static Load Tests at two different locations (137.0;120.5) and (85.5;43.5) with an applied stress of 63.1 kPa (9.15 PSI) (113.4 kg on a 0.018m2 surface) on a sys-
tem with Gator Base EPP
Figure 14c. Deflection Basin for Static Load Tests at two different locations (137.0;120.5) and (96.5;97.5) with an applied stress of 23.67 kPa (3.43 PSI) (264.9 kg on a 0.11m2 surface) on a sys-
tem with Gator Base EPP.
Deflection basin with similar shapes were found for the traditional system with granular base. How-ever, the magnitude of the deflections were a little bit smaller than the granular base compared to the

L’ÉTS est une constituante du réseau de l’Université du Québec20
results obtained with the Gator Base EPP. As shown on Figure 15, for equivalent stress, load mag-nitude and positions, the deflections are 0.004mm (0.00015 in.) to 0.019mm (0.00075 in.) smaller. It should be mentioned that those deflection are elastic and are in the domain of small deformation.
Figure 15. Comparison of the deflection Basins, on the Y axis, for Static Load Tests at coordi-nates (137.0;120.5) with an applied stress of 20.56 kPa (2.98 PSI) (113.4 kg (250 lbs) on a 0.11m2
(170in2) surface) between the system with Gator Base EPP and the granular base
2.3 Dynamic Load Tests
The dynamic load tests with the LFWD were performed on every layer of both systems tested. The goal was to measure the deflection and the dynamic modulus ELFWD under impact and to compare a system with Gator Base EPP to a system with the usual 0-20mm (0-3/4in.) traditional granular base.
2.3.1 Tests on Sandy soilTests were done on the subgrade sandy soil compacted to 93% of the modified Proctor density. The results are shown in Figure 16. This figure, and the ones after, show the link between the deflection and the dynamic loads varying from 264 kN (59 350 lbs) to 283 kN (63 621 lbs). This variation in the load is explained by the slight variation in the contact between the LWD 200mm (7.9 in.) load plate and the subgrade. The contact surface does change between each tests. On the sand, the average measured deflection was 0.799mm (0.031 in.) for an average modulus of 60.6 MPa (8789 psi). The obtained modulus is, as expected, a standard value for a sand with this level of compacity.
L’ÉTS est une constituante du réseau de l’Université du Québec 21
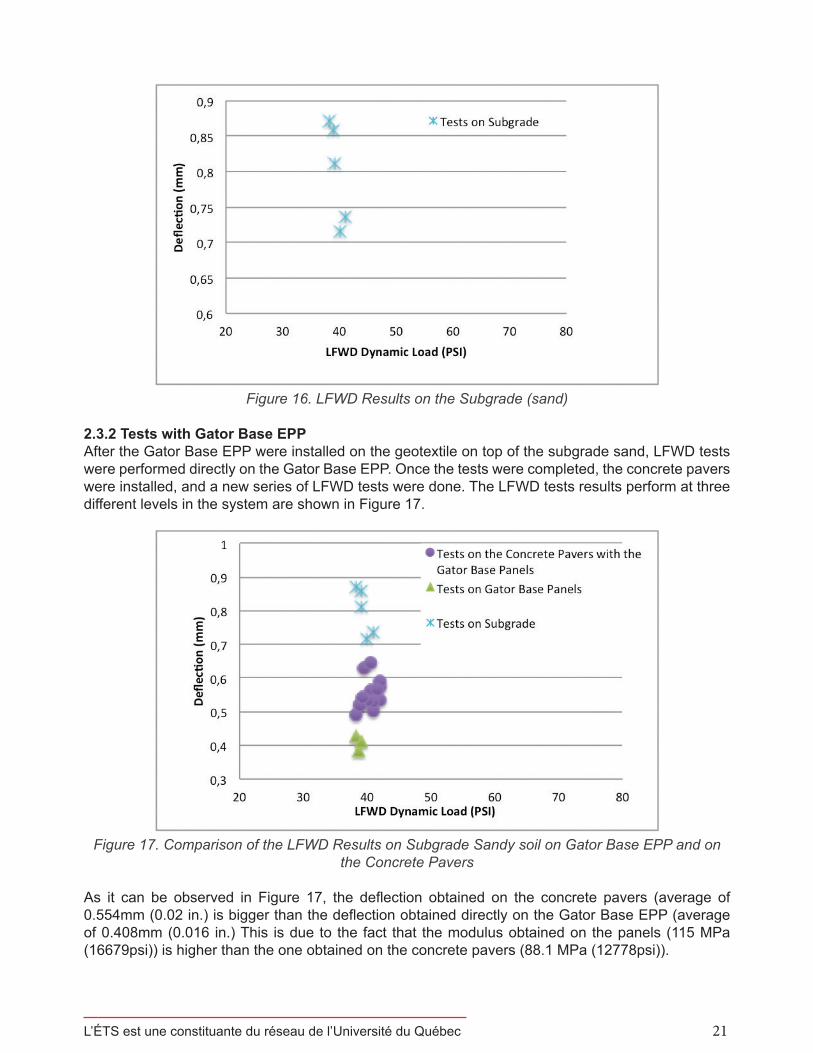
Figure 16. LFWD Results on the Subgrade (sand)
2.3.2 Tests with Gator Base EPP After the Gator Base EPP were installed on the geotextile on top of the subgrade sand, LFWD tests were performed directly on the Gator Base EPP. Once the tests were completed, the concrete pavers were installed, and a new series of LFWD tests were done. The LFWD tests results perform at three different levels in the system are shown in Figure 17.
Figure 17. Comparison of the LFWD Results on Subgrade Sandy soil on Gator Base EPP and on the Concrete Pavers
As it can be observed in Figure 17, the deflection obtained on the concrete pavers (average of 0.554mm (0.02 in.) is bigger than the deflection obtained directly on the Gator Base EPP (average of 0.408mm (0.016 in.) This is due to the fact that the modulus obtained on the panels (115 MPa (16679psi)) is higher than the one obtained on the concrete pavers (88.1 MPa (12778psi)).
L’ÉTS est une constituante du réseau de l’Université du Québec22
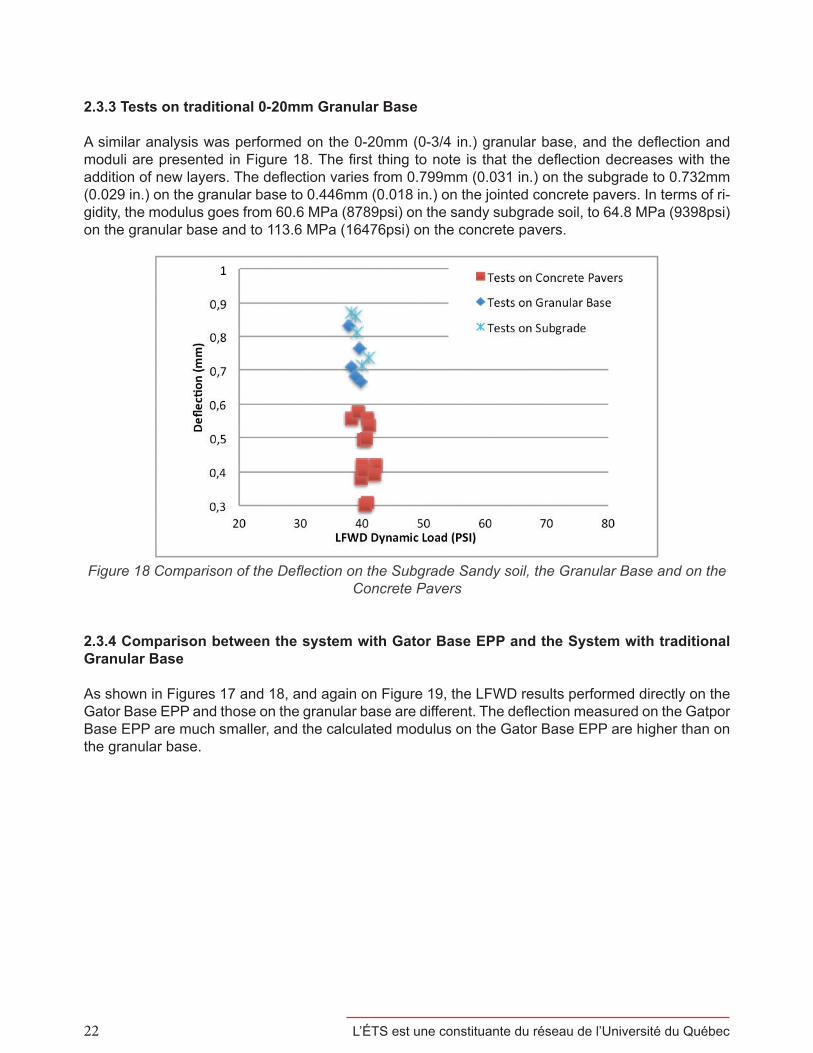
2.3.3 Tests on traditional 0-20mm Granular Base
A similar analysis was performed on the 0-20mm (0-3/4 in.) granular base, and the deflection and moduli are presented in Figure 18. The first thing to note is that the deflection decreases with the addition of new layers. The deflection varies from 0.799mm (0.031 in.) on the subgrade to 0.732mm (0.029 in.) on the granular base to 0.446mm (0.018 in.) on the jointed concrete pavers. In terms of ri-gidity, the modulus goes from 60.6 MPa (8789psi) on the sandy subgrade soil, to 64.8 MPa (9398psi) on the granular base and to 113.6 MPa (16476psi) on the concrete pavers.
Figure 18 Comparison of the Deflection on the Subgrade Sandy soil, the Granular Base and on the Concrete Pavers
2.3.4 Comparison between the system with Gator Base EPP and the System with traditional Granular Base
As shown in Figures 17 and 18, and again on Figure 19, the LFWD results performed directly on the Gator Base EPP and those on the granular base are different. The deflection measured on the Gatpor Base EPP are much smaller, and the calculated modulus on the Gator Base EPP are higher than on the granular base.
L’ÉTS est une constituante du réseau de l’Université du Québec 23
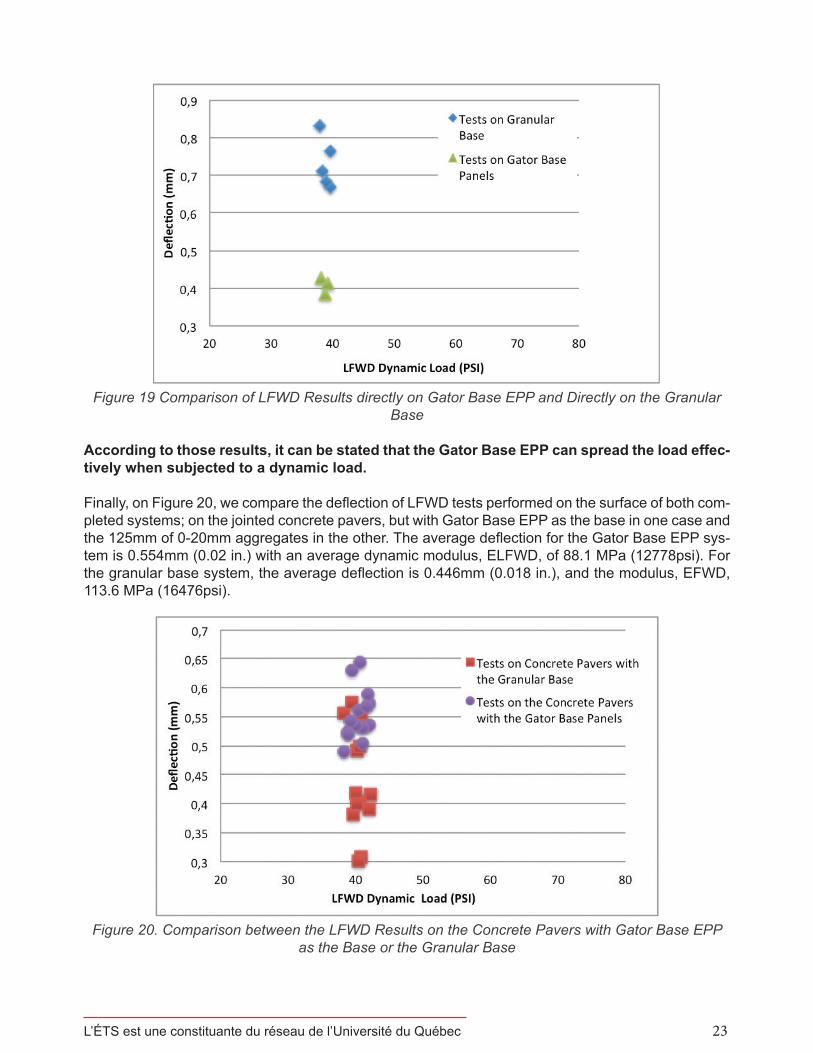
Figure 19 Comparison of LFWD Results directly on Gator Base EPP and Directly on the Granular Base
According to those results, it can be stated that the Gator Base EPP can spread the load effec-tively when subjected to a dynamic load.
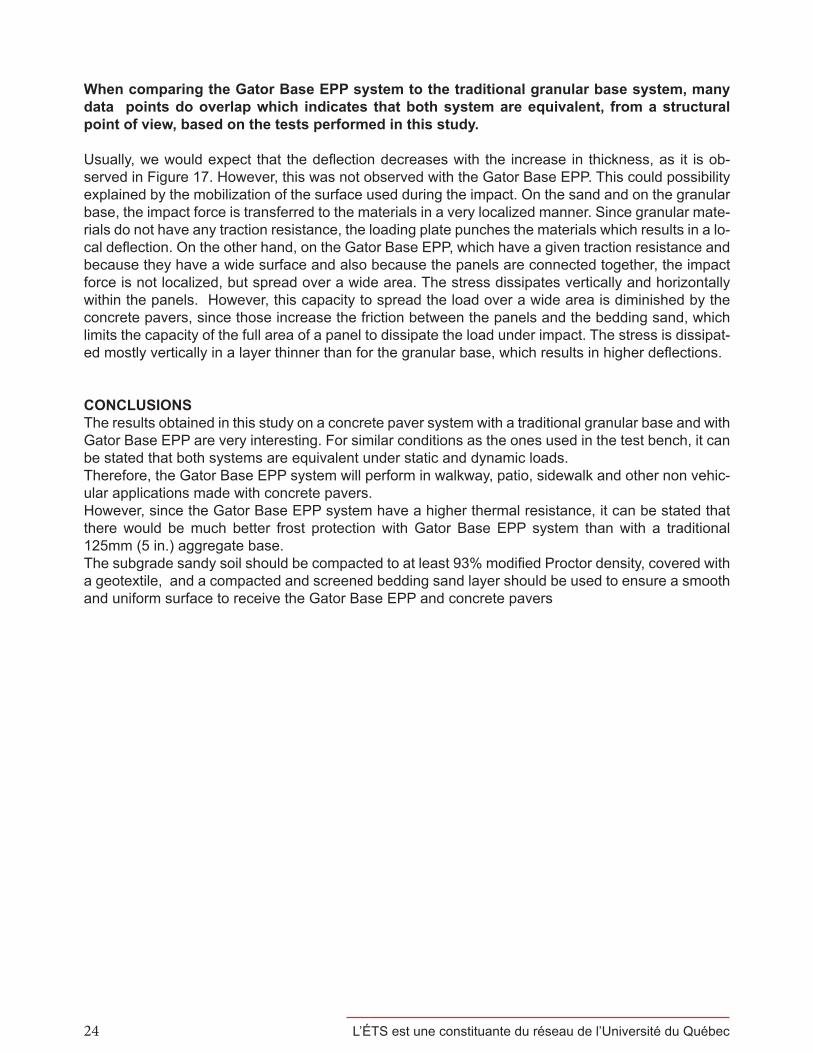
Finally, on Figure 20, we compare the deflection of LFWD tests performed on the surface of both com-pleted systems; on the jointed concrete pavers, but with Gator Base EPP as the base in one case and the 125mm of 0-20mm aggregates in the other. The average deflection for the Gator Base EPP sys-tem is 0.554mm (0.02 in.) with an average dynamic modulus, ELFWD, of 88.1 MPa (12778psi). For the granular base system, the average deflection is 0.446mm (0.018 in.), and the modulus, EFWD, 113.6 MPa (16476psi).
Figure 20. Comparison between the LFWD Results on the Concrete Pavers with Gator Base EPP as the Base or the Granular Base
L’ÉTS est une constituante du réseau de l’Université du Québec24
When comparing the Gator Base EPP system to the traditional granular base system, many data points do overlap which indicates that both system are equivalent, from a structural point of view, based on the tests performed in this study.
Usually, we would expect that the deflection decreases with the increase in thickness, as it is ob-served in Figure 17. However, this was not observed with the Gator Base EPP. This could possibility explained by the mobilization of the surface used during the impact. On the sand and on the granular base, the impact force is transferred to the materials in a very localized manner. Since granular mate-rials do not have any traction resistance, the loading plate punches the materials which results in a lo-cal deflection. On the other hand, on the Gator Base EPP, which have a given traction resistance and because they have a wide surface and also because the panels are connected together, the impact force is not localized, but spread over a wide area. The stress dissipates vertically and horizontally within the panels. However, this capacity to spread the load over a wide area is diminished by the concrete pavers, since those increase the friction between the panels and the bedding sand, which limits the capacity of the full area of a panel to dissipate the load under impact. The stress is dissipat-ed mostly vertically in a layer thinner than for the granular base, which results in higher deflections.
CONCLUSIONSThe results obtained in this study on a concrete paver system with a traditional granular base and with Gator Base EPP are very interesting. For similar conditions as the ones used in the test bench, it can be stated that both systems are equivalent under static and dynamic loads.Therefore, the Gator Base EPP system will perform in walkway, patio, sidewalk and other non vehic-ular applications made with concrete pavers.However, since the Gator Base EPP system have a higher thermal resistance, it can be stated that there would be much better frost protection with Gator Base EPP system than with a traditional 125mm (5 in.) aggregate base. The subgrade sandy soil should be compacted to at least 93% modified Proctor density, covered with a geotextile, and a compacted and screened bedding sand layer should be used to ensure a smooth and uniform surface to receive the Gator Base EPP and concrete pavers