Technical Report Documentation Page 1. Report No. 2. … · · 2017-01-04Chapter 1. Introduction...
59
Technical Report Documentation Page 1. Report No. SWUTC/09/169111-1 2. Government Accession No. 3. Recipient's Catalog No. 4. Title and Subtitle Driver Eye-scanning Behavior at Intersections at Night 5. Report Date October 2009 6. Performing Organization Code 7. Author(s) Laura L. Higgins, Myunghoon Ko, and Susan T. Chrysler 8. Performing Organization Report No. Research Report 169111-1 9. Performing Organization Name and Address Texas Transportation Institute Texas A&M University System College Station, Texas 77843-3135 10. Work Unit No. (TRAIS) 11. Contract or Grant No. 10727 12. Sponsoring Agency Name and Address Southwest Region University Transportation Center Texas Transportation Institute Texas A&M University System College Station, TX 77843-3135 13. Type of Report and Period Covered Research Report: September 2008-August 2009 14. Sponsoring Agency Code 15. Supplementary Notes Supported by general revenues from the State of Texas. 16. Abstract This research project analyzed drivers’ eye scanning behavior at night when approaching signalized and unsignalized intersections using the data from a head-mounted eye-tracking system during open road driving on a prescribed route. During the 1000-ft approaching the intersections, drivers shifted their glance more frequently when approaching the signalized intersections than they did at unsignalized intersections. Among different turning movements, left turns overall seemed to elicit different eye movement patterns than the right-turn or through-movements. When approaching intersections where they would turn left, the drivers glanced most often straight ahead, while glances to the right side decreased in frequency and glances to the left increased in frequency compared to the right-turn and through-movement intersections. This study used a binary logistic regression model to analyze the changes of probabilities of glances to each of four areas of the scene as a function of distance to the intersections. At some intersections, the probabilities of glances at particular areas significantly changed with the distance to the intersection. The report also discusses methodological issues with on-road studies, the coding of eye-tracker data, and problems with eye-tracking equipment. 17. Key Words Driver Behavior, Eye Movement, Turning Movement 18. Distribution Statement No restrictions. This document is available to the public through NTIS: National Technical Information Service 5285 Port Royal Road Springfield, Virginia 22161 19. Security Classification.(of this report) Unclassified 20. Security Classification.(of this page) Unclassified 21. No. of Pages 59 22. Price Form DOT F 1700.7 (8-72) Reproduction of completed page authorized
Transcript of Technical Report Documentation Page 1. Report No. 2. … · · 2017-01-04Chapter 1. Introduction...

Technical Report Documentation Page 1. Report No.
SWUTC/09/169111-1
2. Government Accession No.
3. Recipient's Catalog No.
4. Title and Subtitle
Driver Eye-scanning Behavior at Intersections at Night 5. Report Date
October 2009 6. Performing Organization Code
7. Author(s)
Laura L. Higgins, Myunghoon Ko, and Susan T. Chrysler
8. Performing Organization Report No.
Research Report 169111-1
9. Performing Organization Name and Address
Texas Transportation Institute Texas A&M University System College Station, Texas 77843-3135
10. Work Unit No. (TRAIS)
11. Contract or Grant No.
10727 12. Sponsoring Agency Name and Address
Southwest Region University Transportation Center Texas Transportation Institute Texas A&M University System College Station, TX 77843-3135
13. Type of Report and Period Covered
Research Report: September 2008-August 2009 14. Sponsoring Agency Code
15. Supplementary Notes
Supported by general revenues from the State of Texas. 16. Abstract
This research project analyzed drivers’ eye scanning behavior at night when approaching signalized
and unsignalized intersections using the data from a head-mounted eye-tracking system during open road driving on a prescribed route. During the 1000-ft approaching the intersections, drivers shifted their glance more frequently when approaching the signalized intersections than they did at unsignalized intersections. Among different turning movements, left turns overall seemed to elicit different eye movement patterns than the right-turn or through-movements. When approaching intersections where they would turn left, the drivers glanced most often straight ahead, while glances to the right side decreased in frequency and glances to the left increased in frequency compared to the right-turn and through-movement intersections. This study used a binary logistic regression model to analyze the changes of probabilities of glances to each of four areas of the scene as a function of distance to the intersections. At some intersections, the probabilities of glances at particular areas significantly changed with the distance to the intersection. The report also discusses methodological issues with on-road studies, the coding of eye-tracker data, and problems with eye-tracking equipment.
17. Key Words
Driver Behavior, Eye Movement, Turning Movement
18. Distribution Statement
No restrictions. This document is available to the public through NTIS: National Technical Information Service 5285 Port Royal Road Springfield, Virginia 22161
19. Security Classification.(of this report)
Unclassified
20. Security Classification.(of this page)
Unclassified 21. No. of Pages
59
22. Price
Form DOT F 1700.7 (8-72) Reproduction of completed page authorized


Driver Eye-scanning Behavior at Intersections at Night
by
Laura L. Higgins Assistant Research Scientist
Myunghoon Ko
Graduate Research Assistant
Susan T. Chrysler, Ph.D Senior Research Scientist
Research Report SWUTC/09/169111-1
Sponsored by
Southwest Region University Transportation Center
Texas Transportation Institute Texas A&M University System
College Station, TX 77843-3135
October 2009

v
Acknowledgments
The authors would like to thank Michael Manser, Director of the University of Minnesota HumanFIRST program, who acted as the project monitor for this study. The authors recognize that support for this research was provided by a grant from the U.S. Department of Transportation, University Transportation Centers Program to the Southwest Region University Transportation Center which is funded, in part, with general revenue funds from the State of Texas. The Texas Transportation Institute’s Center for Transportation Safety also contributed in-kind support. The original study from which the data were drawn was funded by the Texas Department of Transportation.
Disclaimer The contents of this report reflect the views of the authors, who are responsible for the facts and the accuracy of the information presented herein. This document is disseminated under the sponsorship of the Department of Transportation, University Transportation Centers Program, in the interest of information exchange. Mention of trade names or commercial products does not constitute endorsement or recommendation for use.


vii
Table of Contents List of Tables ................................................................................................................................viii
List of Figures ................................................................................................................................. ix
Executive Summary ........................................................................................................................ xi
Chapter 1. Introduction and Background ....................................................................................... 1
Chapter 2. Literature Review .......................................................................................................... 3
Chapter 3. Methodology ................................................................................................................. 7
Chapter 4. Results ......................................................................................................................... 13
Chapter 5. Conclusions and Recommendations ........................................................................... 35
References ..................................................................................................................................... 39
Appendix: Intersection list ............................................................................................................ 45

viii
List of Tables
Page TABLE 1 List of Intersections and Characteristics to Each Intersection Used in the
Analysis. ................................................................................................................ 11
TABLE 2 Results from Eye Movement Analyses on Zones at Intersections. ............................. 14
TABLE 3 Number and Percentage of Glances, Average Duration, and Accumulated Distance according to Turning Movements from 10 Analyzed Intersections. .......................................................................................................... 17
TABLE 4 Number of Subjects Related to Lead Vehicle and Signal Conditions. ........................ 19
TABLE 5 Results from Binary Logistic Regression Analyses. ................................................... 25
TABLE 6 Results from Binary Logistic Regression Analyses according to Turning Movement. ............................................................................................................. 33

ix
List of Figures
Page FIGURE 1 Three and Four-Leg Intersections. ............................................................................... 4
FIGURE 2 Driver Wearing the Arrington Viewpoint Eye-Tracking System. ............................... 7
FIGURE 3 Zone Map at the Intersections. ................................................................................... 12
FIGURE 4 Comparison of Percentage of Glances on Zones according to Location of Lead Vehicle at Intersection of FM 2818 and George Bush Drive. ...................... 20
FIGURE 5 Comparison of Percentages of Glances on Zones according to Location of Lead Vehicle at Intersection of FM 2818 and Wellborn Road. ............................. 20
FIGURE 6 Comparison of Percentages of Glances on Zones according to Location of Lead Vehicle at Intersection of Wellborn and George Bush Drive. ...................... 21
FIGURE 7 Comparison of Percentages of Glances on Zones according to Location of Lead Vehicle at Intersection of FM 2818 and F&B Road. .................................... 22
FIGURE 8 Comparison of Percentage of Glances on Zones according to Location of Lead Vehicle at Intersection of FM 2818 and Leonard Road. .............................. 22
FIGURE 9 Comparison of Percentages of Glances according to Signal Condition at Intersection of Wellborn Road and George Bush Drive. ....................................... 23
FIGURE 10 Comparison of Percentages of Glances on Zones according to Signal Condition at Intersection of George Bush Drive and Wellborn Road. .................. 24
FIGURE 11 Probabilities of Glances on Each Zone by Distance to Intersection of SH 47 and Leonard Road. ................................................................................................. 27
FIGURE 12 Probabilities of Glances on Each Zone by Distance to Intersection of FM 2818 and George Bush Drive.......................................................................... 27
FIGURE 13 Probabilities of Glances on Each Zone by Distance to Intersection of FM 2818 and Wellborn Road. ............................................................................... 28
FIGURE 14 Probabilities of Glances on Each Zone by Distance to Intersection of Wellborn Road and George Bush Drive. ............................................................... 29
FIGURE 15 Probabilities of Glances on Each Zone by Distance to Intersection of George Bush Drive and Wellborn Road. ............................................................... 29
FIGURE 16 Probabilities of Glances on Each Zone by Distance to Intersection of George Bush Drive and FM 2818.......................................................................... 30

x
FIGURE 17 Probabilities of Glances on Each Zone by Distance to Intersection of FM 2818 and F&B Road. ...................................................................................... 31
FIGURE 18 Probabilities of Glances on Each Zone by Distance to Intersection of FM 2818 and Leonard Road. ................................................................................. 31
FIGURE 19 Probabilities of Glances on Each Zone by Distance to Intersection of Leonard Road and SH 47....................................................................................... 32
FIGURE 20 Probabilities of Glances on Each Zone by Distance at Intersections having Thru Movement. .................................................................................................... 34
FIGURE 21 Probabilities of Glances on Each Zone by Distance at Intersections having LT Movement. ....................................................................................................... 34
FIGURE 22 Probabilities of Glances on Each Zone by Distance at Intersections having RT Movement. ....................................................................................................... 35

xi
Executive Summary This project analyzed existing video and other data collected from an on-road study of sign legibility conducted by the Texas Transportation Institute (TTI) to study drivers’ eye-scanning behavior at intersections at night. The data were collected using the TTI Instrumented Vehicle and head-mounted eye-tracking system using drivers from the general public driving on open roads in the greater College Station, Texas, area. The research project focused on the following three objectives: 1) to analyze the eye-scanning patterns of drivers at the intersections at night, 2) to examine the effect of traffic and intersection geometric design on eye movement, and 3) to develop efficient data-reduction procedures for eye-tracking and instrumented vehicle data.
Eye glances recorded by the eye-tracker video camera were categorized into four “zones” for data reduction and analysis: zone C (center) for glances ahead at the lane in which the driver is traveling, zone R (right) for glances in the area to the right of the driver’s own lane including the right-side road shoulder or edge, zone L (left) including lanes, road edges, and other objects to the left of the driver’s own lane, and zone O (off-screen) indicating that the driver’s gaze left the field of view of the forward scene camera. The number/frequency, percentage, and average duration of glances to each zone were calculated over the 1000-ft approach to each intersection. The total proportion of glance time to each zone was also calculated, expressed as the “accumulated distance” traveled with the driver’s gaze on each zone. Finally, the probabilities of glances to each zone were analyzed using binary logistic regression modeling.
The analysis of the total number of glances over the 1000-ft approach to each intersection showed that drivers shifted their glance more frequently approaching the signalized intersections than they did at the unsignalized intersections. Also, eye movement patterns were different depending on the type of movement (left turn, right turn, or through) that drivers were instructed to make at upcoming intersections. At the intersections where drivers proceeded straight through or turned right, they glanced much more frequently straight ahead and to the right, in approximately equal proportions, than they did to the left and off-screen. At these intersections, drivers kept their glances fixed on the right side with the longest average durations. However, approaching intersections where they would turn left, the drivers glanced most often straight ahead, while the frequency of glances to the right side decreased and glances to the left increased compared to the right-turn and through-movement intersections. Furthermore, differently than for other movements, the average glance durations straight ahead, to the left, and to the right were similar for left-turn movements; drivers kept similar duration of glances on each of the zones. The left-turn intersections overall seemed to elicit different eye movement patterns than the right-turn or through-movement intersections.
In the logistic regression analyses on the probabilities that a driver glanced at a specific zone as a function of distance to the intersection, the changes in probabilities were more distinct at the intersections where drivers would turn left or right than at the intersections where they would proceed straight through. For the intersections where drivers turned left, the probabilities of glances at the left side significantly increased as drivers approached the intersections and the probabilities of glances to the right decreased significantly. For the intersections where drivers turned right, the probabilities of glances to the left significantly increased as they approached the intersections and the probabilities of glances to the right and off-screen both decreased. The

xii
results indicate that when drivers were preparing to turn left or right they were more likely to scan the area to their left, possibly looking for oncoming traffic from the left and opposite direction. They were also less likely to shift their gaze away from the oncoming roadway to look off-screen; this may have been due in part to the drivers focusing more on the driving environment when they were preparing to make a turn.
The analysis of eye movements in this research project provided evidence that differences in the driving environment correlate to differences in drivers’ eye movements. However, certain characteristics of the data presented some challenges and limitations for these analyses. Originally, eye movement data were recorded from 24 drivers, but the data from only 16 drivers were analyzed due to problems with the calibration of the eye tracker. Although the eye tracker was calibrated to each driver at the beginning of the original data collection, driver head movements during the hour-long test drive sometimes shifted the eye-tracker apparatus and degraded the calibration. Potential methods for minimizing these types of calibration difficulties should be considered when preparing for data acquisition in future research.
1
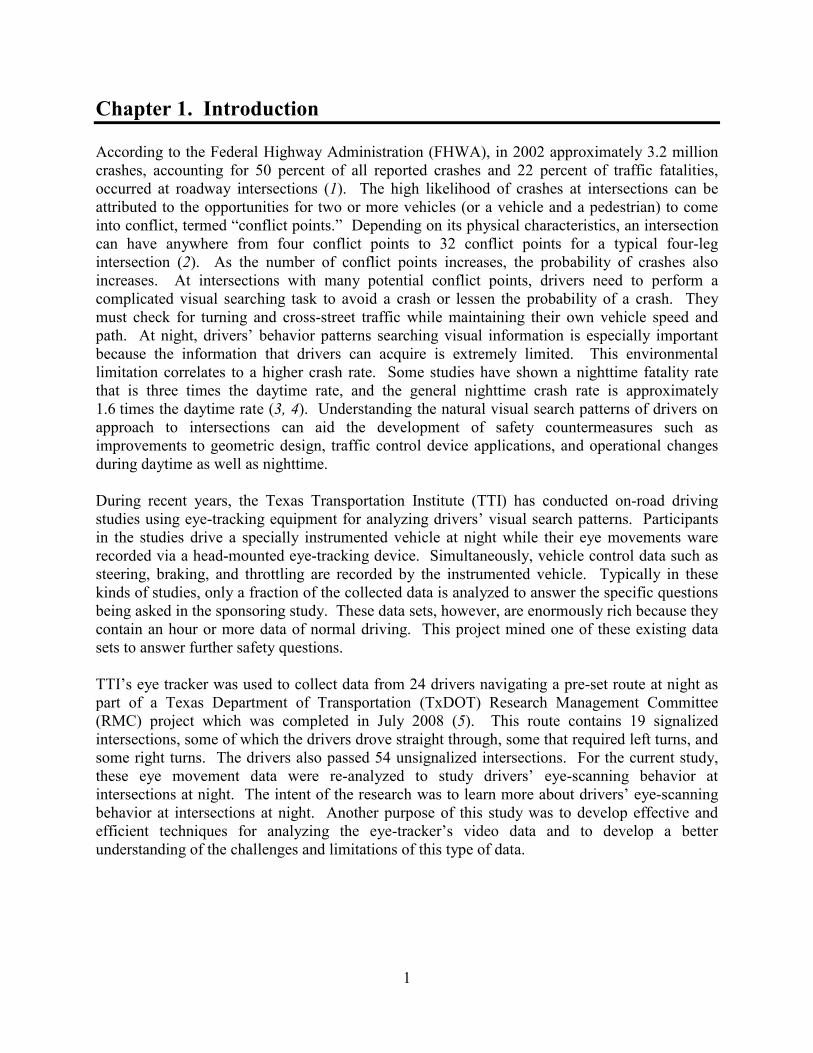
Chapter 1. Introduction According to the Federal Highway Administration (FHWA), in 2002 approximately 3.2 million crashes, accounting for 50 percent of all reported crashes and 22 percent of traffic fatalities, occurred at roadway intersections (1). The high likelihood of crashes at intersections can be attributed to the opportunities for two or more vehicles (or a vehicle and a pedestrian) to come into conflict, termed “conflict points.” Depending on its physical characteristics, an intersection can have anywhere from four conflict points to 32 conflict points for a typical four-leg intersection (2). As the number of conflict points increases, the probability of crashes also increases. At intersections with many potential conflict points, drivers need to perform a complicated visual searching task to avoid a crash or lessen the probability of a crash. They must check for turning and cross-street traffic while maintaining their own vehicle speed and path. At night, drivers’ behavior patterns searching visual information is especially important because the information that drivers can acquire is extremely limited. This environmental limitation correlates to a higher crash rate. Some studies have shown a nighttime fatality rate that is three times the daytime rate, and the general nighttime crash rate is approximately 1.6 times the daytime rate (3, 4). Understanding the natural visual search patterns of drivers on approach to intersections can aid the development of safety countermeasures such as improvements to geometric design, traffic control device applications, and operational changes during daytime as well as nighttime. During recent years, the Texas Transportation Institute (TTI) has conducted on-road driving studies using eye-tracking equipment for analyzing drivers’ visual search patterns. Participants in the studies drive a specially instrumented vehicle at night while their eye movements ware recorded via a head-mounted eye-tracking device. Simultaneously, vehicle control data such as steering, braking, and throttling are recorded by the instrumented vehicle. Typically in these kinds of studies, only a fraction of the collected data is analyzed to answer the specific questions being asked in the sponsoring study. These data sets, however, are enormously rich because they contain an hour or more data of normal driving. This project mined one of these existing data sets to answer further safety questions.
TTI’s eye tracker was used to collect data from 24 drivers navigating a pre-set route at night as part of a Texas Department of Transportation (TxDOT) Research Management Committee (RMC) project which was completed in July 2008 (5). This route contains 19 signalized intersections, some of which the drivers drove straight through, some that required left turns, and some right turns. The drivers also passed 54 unsignalized intersections. For the current study, these eye movement data were re-analyzed to study drivers’ eye-scanning behavior at intersections at night. The intent of the research was to learn more about drivers’ eye-scanning behavior at intersections at night. Another purpose of this study was to develop effective and efficient techniques for analyzing the eye-tracker’s video data and to develop a better understanding of the challenges and limitations of this type of data.

2

3
Chapter 2. Literature Review Geometric Characteristics of Intersections An intersection is the geometric area where two or more roadways join or cross at grade, including the roadway and roadside facilities for traffic movements within the area (6). Intersections can be classified according to the number of “legs,” that is, the number of road segments intersecting. Most intersections are composed of three or four legs (Figure 1). A three-leg intersection, such as a T-type intersection, generally includes a major highway having two legs and a minor road having one leg. Four-leg intersections are the most common. Ideally and most commonly, each leg of an intersection is perpendicular to each adjacent leg. However, in some intersections legs may cross at different angles. Intersections are also classified by the type of traffic controls present. Uncontrolled intersections have no signs or signals to direct traffic movements. Controlled intersections provide direction to drivers via traffic signs or signals. The American Association of State Highway and Transportation Officials (AASHTO) Green Book (6) specifies various factors that should be taken into consideration regarding intersection design. They are 1) human factors relating to drivers or pedestrians; 2) traffic considerations relating to vehicle movements and crash experience; 3) physical elements including geometric and environmental characteristics; 4) economic factors relating to operating cost and limiting right of way; and 5) functional intersection boundary considering perception-reaction distance. Among these factors, human factors interact with other factors: traffic considerations, physical elements, economic factors, and functional intersection area (7). Intersections, like other aspects of traffic operation and highway design, are often designed using the concept of the 85th percentile “design driver,” taking into account the behaviors, capabilities, and limitations of most drivers. Examples of the 85th-percentile concept include the selection of speed limits and the consideration of driver reaction times in the placement of traffic controls and roadway elements (6, 7, and 8). Traffic safety research must also consider higher-risk drivers and driving behaviors. Excessive vehicle speed, driver inexperience, insufficient attention, and longer-than-typical reaction times are some of the many factors that can increase crash risks on roadways and at intersections. Drivers’ Eye Scanning at Intersections Drivers control vehicles through the processes of information recognition, determination (decision-making), and operation (9). Recognition is the process of gathering the information from the peripheral environment using the senses such as vision, hearing, and so on. Drivers then interpret and analyze the information, and decide/determine their actions from the analyzed information. These actions translate into vehicle deceleration or acceleration, turning, stopping, etc., in the process of operation. Sivak (10) states that drivers generally acquire 90 percent of their information visually.

4
During driving, drivers scan the road and the peripheral environment. Observing these drivers’ eye movements is a way to study drivers’ information gathering processes and the effects of different visual cues on driver decision-making and performance (7). For example, Zwahlen (11) examined the effect of the STOP AHEAD sign on drivers’ eye scanning behavior and performance when approaching intersections. Analysis of eye scanning behavior showed that drivers glanced more often at the STOP sign than at the STOP AHEAD sign, because the STOP sign provides more important information for drivers to make a decision at the intersection. However, drivers glanced more often and longer at the STOP sign when the STOP AHEAD sign was present. Drivers also approached the intersection with significantly lower speed when the sign was present than when it was not. The effects of the STOP AHEAD sign were stronger at
Major Highway
Minor H
ighway
T Skewed T
(a) Three-leg Intersections
Right angle Oblique
(b) Four-leg Intersections
FIGURE 1 Three and Four-Leg Intersections.

5
night than during the day. The STOP AHEAD sign provided a visual clue for the upcoming STOP sign to drivers at night; recognizing the STOP AHEAD sign, drivers assumed the existence of the upcoming intersection, and they reduced speed in advance. Farraher et al. (12) and Smith et al. (13) found results similar to those seen in Zwahlen’s research. When drivers encountered yellow signals at intersections with Advanced Warning Flashers (AWFs), they stopped more frequently and drove more slowly while approaching intersections, and had fewer red light violations. Another study by Sayed et al. (14) found AWF reduced crashes at locations with moderate to high minor approach traffic volumes. Eye scanning movement is usually analyzed using the following categories:
• scanning pattern – what drivers scan in sequence • number of glances – how many times drivers look at an object, and • duration of glances – how long drivers look at an object.
Knodler and Noyce (15) researched the eye scanning pattern at permissive left-turn intersections. When opposing traffic was present, drivers mainly focused on opposing traffic; however, when opposing traffic was not present, drivers tried to find visual cues by scanning from right to left. When approaching sign-controlled intersections with STOP AHEAD signs, drivers looked at the STOP AHEAD sign an average of 1.45 to 2.77 times, with an average duration of between 0.65 and 0.82 seconds (11). Also, geometric environment affected eye movement. According to Mortimer and Jorgeson (16), the average duration of glances on curved sections of road was longer at night than during the day, while average glance duration on straight sections of road was shorter at night. Serafin (17) analyzed drivers’ daytime eye movements and found that drivers looked straight ahead at the road 59 percent of the time, to the right side of the road 15 percent of the time, and to the left side of the road 25 percent of the time. In the sequence of movement at visual target, Diguer et al. (18) determined that eye movements were the first response to a visual cue, followed by head and finally body movements. In a study examining drivers’ behavior during different driving maneuvers (19), the results showed that there were significant increases in head movements during turning movements compared to thru movements. Head movement frequency per second was 0.255 for left turns and 0.253 for right turns, but 0.127 for straight driving. The greater workload for turning maneuvers made head movement increase for collecting the needed visual information. There are some individual factors affecting drivers’ eye scanning movement. According to research by Kosaka et al. (9) and Pradhan et al. (20), older/experienced drivers scanned a traffic scene more often and much longer and responded more quickly by stopping than younger/novice drivers. Also, Olsen et al. (21) found that the eye scanning behavior of novice teen drivers was significantly worse than that of experienced adults on baseline measurement. However, the scanning behaviors of teen drivers improved significantly when measured after six months later. The number of rearview glances and left mirror/window glances significantly increased. It appears that six months of driving experience improved scanning behaviors for teen drivers.

6
Safety at Intersections Kosaka et al. (9) demonstrated that experienced drivers scanned twice more before crossing or turning at intersection than inexperienced drivers and concluded that a crash was more likely to occur as a vehicle approaches faster and a driver looked right or left fewer times before entering an intersection. These less safe behaviors of drivers at intersections can increase the probability of crashes. As well as drivers’ risky behaviors, geometric characteristics and environmental factors can affect the safety at intersections. Several studies suggest strategies to reduce the probability of crashes at intersections. Street lighting can improve safety at intersections by reducing the probability of all nighttime crashes including both single and multiple vehicles, as well as by reducing the severity of nighttime crashes (22, 23, and 24). Hallmark et al. (22) found that intersections without street lighting had twice as many crashes as intersections with lighting. Other improvements found to decrease crashes at intersections include using two stop signs instead of one on each approach and using reflective posts (23) and installing more and larger “stop ahead” or “ cross-traffic does not stop” signs (25 and 26). Improving signal visibility also helps to reduce crashes at intersections. The Manual on Uniform Traffic Control Devices (MUTCD) requires a minimum of two signal heads for the major movement on an approach and requires that signals be located between 40 ft and 150 ft from the stop line (27). Some research analyzed the effect of the placement and number of signal heads on traffic safety. The safety impacts of replacing pole-mounted signals with mast-arm-mounted signals resulted in 32 percent and 25 percent reduction in total crashes in studies by Thomas and Smith (28) and Russi (29), respectively. Total crashes were also significantly reduced at intersections where an auxiliary signal head was installed (27). An intersection has several potential conflict points due to the traffic movements from all approaches. These conflict points can be reduced by providing drivers with sufficient sight distances (6). According to Mitchell (30), removing sight obstructions at intersections can reduce accidents by up to 67 percent. Improving sight distance may decrease head-on, right-angle, and left-turn crashes by 20 percent at intersections (31), and a large curve radius at curvilinear intersections helps drivers to more correctly detect moving objects (32). Access control within the functional boundary of intersections can improve the operational safety at intersections. In the research of Gluck et al. (33), crash rates increased as access density increased. The crash rates for access densities greater than 60 access points per mile were 2.5 times higher than the crash rates of access densities of fewer than 20 access points per mile. Driveways from businesses or residences close to intersections increase access densities and as such are a safety concern. The median treatments of roadways were also shown to have significant effects on roadway safety; divided roadways with non-traversable medians had 40 percent lower crash rates than roadways with traversable medians.

7
Chapter 3. Methodology This research used the eye-movement data collected as part of a TxDOT RMC Project that was completed in July 2008. The data collection procedure for the original project, as well as the procedures for re-analyzing that data, is summarized in this chapter. Original Data Collection Apparatus An instrumented Toyota Highland with an automatic transmission was used as the experimental vehicle. In this vehicle, many independent systems are fully integrated to provide test participants with a driving experience very similar with their normal driving. For measuring and recording a driving data and drivers’ behavior, the independent instruments are used: DEWE5000 for a data acquisition/synchronization, Advanced Global Positioning System for high accuracy driving speed, Video Cameras for the observation of drivers’ behavior, and Arrington Viewpoint Eye-Tracking System for measuring eye positions and eye movements (see Figure 2. The Arrington Viewpoint Eye-Tracking System is the head-mounted eye-tracking system equipped with a special high-resolution, low-light camera in order to collect accurate eye-glance information after dark.
FIGURE 2 Driver Wearing the Arrington Viewpoint Eye-Tracking System.
Participants Participants were volunteers recruited from the local population. The 30 participants ranged in age from 23 to 79 years, though most were over 45 years of age. All participants held valid driver’s licenses with no nighttime restrictions and completed visibility tests before beginning data collection.

8
Procedure for Data Collecting Data collection for each participant began with a calibration process for the eye-tracking system. The first step in calibration was to ensure that the eye-tracker apparatus fit comfortably and securely on the participant’s head while the participant was seated in the driver’s seat of the test vehicle. The data collector focused the eye-cameras directly on the eyes’ pupils and positioned the forward camera to capture the same view as the participant. The eye-tracking system was calibrated using a 16-point grid, which was visible to the data collector on the eye-tracker’s video screen, superimposed over the view from the forward camera. Using a laser pointer aimed at the side of building approximately 200 ft from the front of the vehicle, the data collector asked the participant to follow a dot of light reflected against the building while keeping his or her head as still as possible. The eye-tracker software recorded each target fixation to create a personalized eye-mapping grid. The eye-mapping grid was then used to calibrate the equipment. After a successful calibration, the participant began the driving portion of the study. The driving portion included a pre-set route through local rural and urban streets at night. The purpose of the RMC project was to measure legibility distances of roadway signs. However, on the test route, participants also passed 19 signalized intersections and 52 sign-controlled intersections. At these intersections, participants made a total of 4 left-turn movements, 5 right-turn movements, and 62 through movements (see the appendix). Data Re-Analysis: Eye Movements at Intersections In this research, drivers’ eye scanning patterns, glance durations, and numbers of glances were analyzed at selected sign-controlled and signalized intersections at night. Three sign-controlled and seven signalized intersections were selected for analysis, representing a mixture of right-turn, left-turn, and through movements by the approaching drivers. Table 1 lists the intersections used in the analysis and summarizes the characteristics of each intersection. The three sign-controlled intersections analyzed were all two-way stops. At two of these (SH 47 southbound and Leonard Road, SH 47 southbound and Silver Hill Road), the study participants had the right of way and proceeded through the intersection without stopping. At the third (Leonard Road westbound and SH 47), study participants stopped at a stop sign and then turned right. At this intersection, drivers saw a guide sign for SH 47 and a stop sign with an additional warning that “Cross Traffic Does Not Stop.” There were no sign-controlled intersections on the route at which study participants turned left. None of the sign-controlled intersections analyzed for this study had street lighting. The signalized intersections selected for analysis represented a mix of right-turn, left-turn, and through movements for the participating drivers. All of these signalized intersections are equipped with multiple signal heads for each intersection leg, guide signs showing the names of the streets, and street lighting. Drivers in the study made right turns from westbound George Bush Drive onto northbound FM 2818 and from southbound Wellborn Road onto eastbound George Bush Drive. The intersection of George Bush Drive and FM 2818 has an exclusive right-turn lane, while the intersection of Wellborn Road and George Bush Drive does not. Drivers proceeded straight through (no turns) at the intersections of southbound FM 2818 and

9
George Bush Drive, westbound George Bush Drive and Wellborn Road, and northbound FM 2818 and F&B Road. An Advanced Warning Flasher and a “Be Prepared to Stop When Flashing” sign are located on FM 2818 approximately 530 ft in advance from the intersection at George Bush Drive. Four driveways are located within 1350 ft of the intersection at George Bush Drive and Wellborn Road, and drivers cross railroad tracks approximately 75 ft prior to the intersection. The approach to the intersection at FM 2818 and F&B Road has the highest speed limit (60 mph) among these three intersections. The study’s drivers turned left at two of the selected intersections. The intersection of FM 2818 and Wellborn Road is not perpendicular, which alters drivers’ sight lines; drivers also cross a railroad track shortly before the intersection. The intersection of FM 2818 and Leonard Road is more visually complex, with some gas stations and other facilities near the intersection; the speed limit on the approach is slightly higher (55 mph) than that leading up to FM 2818 and Wellborn Road (50 mph). Both of these intersections have protected and permissive left turn signal phases and exclusive left turn lanes. Drivers’ eye scanning patterns, duration of glances, and number of glances were analyzed over the 1000 ft of roadway leading up to each of the selected intersections. This distance was selected because the speed limits at these intersections ranged from 45 to 65 mph, with the associated stopping sight distances ranging from 360 to 645 ft. This study hypothesized that drivers’ eye movement patterns during the 1000 ft prior to an intersection would be affected by differences in the intersection characteristics and by the action they would take at a particular intersection (turning right, turning left, or proceeding straight through). Analyzing Eye Movements The eye movements recorded by the eye-tracker system include fixations and transition movements. Eye fixations indicate that a driver is focused on something, such as a road sign, traffic signal, lane markings, a lead vehicle, or other focal point, and the driver’s eyes do not move during that time. A transition step is the movement of the eyes between one fixation and the following fixation. To calculate the durations of eye movements, three methods can be used: 1) tallying the duration of each fixation and each transition movement separately, 2) considering durations of fixations only, and 3) including the transition period as part of the total fixation time. The first method allows the exact duration of eye glances to be calculated; however, it requires a lot of time to measure the glance durations and separate transition durations. Using this method to measure and list the glance durations for 20 seconds of driving video took approximately two hours. The next method, considering only eye fixations and discarding the transition times, requires less analysis time than the first method. However, although each transition period is equal to or less than 0.1 seconds, discarding the transitions from the analysis results in a gap between the actual driving/video time and the summed fixation times. The last method, which includes the transition time as part of the fixation time, more completely accounts for the full driving time in the glance analysis. This analysis method was also more efficient than the previous two methods; 20 seconds of eye-tracking video could be analyzed in approximately 40 minutes using this method. This study analyzed the eye movements from 13 to 16 drivers out of the total 24 drivers for the 10 intersections. Eye-tracker video for some of the drivers could not be accurately analyzed because of problems with the calibration of the eye tracker. These problems seemed to result

10
from some drivers’ head movements during the hour of driving, which shifted the head-mounted eye tracker away from its original calibrated position and caused the focal point shown in the video to shift away from the drivers’ true glance locations. Since the drivers were looking for road signs in the original study, the road signs appearing in the video could be used to gauge whether or not the eye tracker remained accurately calibrated over the course of the video footage. The assumption is that drivers would look directly at road signs that they approached, and therefore the data coder could evaluate the validity of the eye movements recorded by comparing the positions of a road sign and the green dot on the screen showing a driver’s focal point as he or she glanced toward the sign. If there was a consistent difference between the road signs and the location of that focal point, the data coders adjusted the location of eye fixation with the amount of the difference. In some of the videos, this type of adjustment was not possible because the dot showing the eye focus location disappeared from the screen or became fixed at a single point on the screen.

11
TABLE 1 List of Intersections and Characteristics to Each Intersection Used in the Analysis.
Type Study
Vehicle Movement
Characteristics
Two-way Sign-
controlled Intersections
Right Turn • Leonard Rd. + SH 47 (Westbound)
- Stop sign with letters “Cross traffic does not stop” - Guide sign for SH 47
Through • SH 47 + Leonard Rd. (Southbound)
- Guide sign for Leonard Rd. • SH 47 + Silver Hill Rd. (Southbound)
Signalized Intersections
Right Turn
• George Bush Dr. + FM 2818 (Westbound) - 2 signal heads (1 for left turn + 1 for through) - Exclusive right turn and left turn lanes - Guide signs for FM 2818
• Wellborn Rd. + George Bush Dr. (Northbound) - 3 signal heads (1 for left turn + 2 for through) - Exclusive left turn lane - Guide signs and Pedestrian Signal - Facilities (Fast food restaurant, Railroad)
Through
• FM 2818 + George Bush Dr. (Southbound) - Advanced Warning Flasher (AWF) - Guide signs - 3 signal heads (1 for left turn+ 2 for through) - Exclusive left turn lane - Channelized Island for right turns
• George Bush Dr. + Wellborn Rd. (Westbound) - Exclusive left turn and right turn lanes - 3 signal heads (1 for left turn + 2 for through) - Yield and Guide Signs for right turns - Pedestrian Signal &Crossing Railroad
• FM 2818 + F&B Rd. (Northbound) - Exclusive left turn lane - 3 signal heads (1 for left turn + 2 for through)
Left Turn
• FM 2818 + Wellborn Rd. (Southbound) - Oblique intersection (Not Perpendicular) - Guide signs - 3 signal heads (1 for left turn + 2 for through) - Exclusive left turn lane - Channelized Island for right turns - Protected and permitted left turn signal phases - Railroad Crossing
• FM 2818 + Leonard Rd. (Southbound) - Exclusive left turn lane - 3 signal heads (1 for left + 2 for through) - Protected and permitted left turn signal phases - Facilities (Gas stations)

12
To analyze eye movements for this study, this research defined four zones of interest as shown in Figure 3. Trained data coders then manually reviewed each video and scored which zone the driver was looking at frame by frame. Zone C, or “center,” includes the lane in which the driver is traveling, as well as locations on and above the road that are directly forward in the driver’s view. Zone R (“right”) is the area to the right of the driver’s own lane, including the right-side road shoulder or edge, any lanes to the driver’s right, and other objects on or near the roadway on the right side. Zone L (“left”) similarly includes lanes, road edges, and other objects to the left of the driver’s own lane. Zone O (“off-screen”) is a code indicating that the driver’s gaze left the field of view of the forward scene camera; usually this occurs when the driver looks at something inside the car (e.g., instrument panel) or in another direction that is sufficiently outside his/her forward field of view that the eye tracker cannot record the gaze. These zones were intentionally large to allow for some variations in the calibration accuracy of the eye tracker.
FIGURE 3 Zone Map at the Intersections.

13
Chapter 4. Results This research analyzed drivers’ eye movements from 10 intersections. Eye movement patterns were analyzed as the average duration and accumulated distance for each zone within 1000 ft at each intersection, as well as the number and percentage of glances on each zone. Also, the effects of a lead vehicle, signal condition, and type of turning movements at the intersections on eye movement were analyzed. Finally, the probabilities of glances on each zone were analyzed using binary logistic regression modeling. Eye Movement Pattern at Each Intersection Intersection of SH 47 and Silver Hill Road The intersection of SH 47 and Silver Hill Road is controlled by two-way stop-signs on Silver Hill Road. Participants drove on SH 47 and went through the intersection. Therefore, the stop signs at this intersection did not affect drivers’ eye movement. When approaching the intersection on the through movement, drivers most frequently looked at the area to their vehicle’s right (zone R); glances to this zone accounted for 44 percent of total number of glances (Table 2). The lane directly ahead of the driver (zone C) was second in glance frequency; drivers looked at the area to the left of their vehicle (zone L) least, with only 7 percent of the total number of glances in this zone. Average durations of glances were 1.3 seconds on zone R and 0.6 seconds on zone C. The accumulated distance is defined as the number of feet out of the total 1000 traveled during which the driver glanced at each zone. Zone R glances accounted for 648 ft, while glances to zones C, O, and L accounted for 273 ft, 52 ft, and 27 ft, respectively. Intersection of SH 47 and Leonard Road The intersection of SH 47 and Leonard Road is controlled by a two-way stop-sign on Leonard Road. Similar to the intersection of SH 47 and Silver Hill Road, participants drove through the intersection without stopping. Table 2 shows that drivers made more glances to zone C than other zones, and it accounted for 42 percent of total glances on the approach to the intersection. Drivers made the least number of glances out of screen (zone O), accounting for 11 percent of total glances. The longest average glance duration was 1.1 seconds for zone R, with the average duration for other zones ranging from 0.5 to 0.7 sec. The distance accumulated for zone R accounted for the largest portion among zones, 450 ft out of 1000 ft. Drivers mostly allocated their glances to zone R while approaching the intersection from 1000 ft. Zone O accounted for the smallest accumulated distance: 81 ft out of 1000 ft.

14
TABLE 2 Results from Eye Movement Analyses on Zones at Intersections.
Intersection Category Zone
TotalL C R O
SH 47 & Silver Hill Rd.
Number of Glances (%) 12(7%) 72(40%) 80(44%) 17(9%) 181
Average duration (sec.) 0.3 0.6 1.3 0.5
Accumulated Distance(ft) 27 273 648 52 1000
SH 47 & Leonard Rd.
Number of Glances (%) 32(15%) 93(42%) 70(32%) 25(11%) 220
Average duration (sec.) 0.5 0.7 1.1 0.5 Accumulated Distance(ft) 92 378 450 81 1000
FM 2818 & George Bush
Dr.
Number of Glances (%) 36(14%) 91(36%) 101(40%) 27(11%) 255
Average duration (sec.) 0.5 0.8 1.1 0.6
Accumulated Distance(ft) 82 328 513 77 1000
FM 2818 & Wellborn Rd.
Number of Glances (%) 84(26%) 131(40%) 72(22%) 38(12%) 325
Average duration (sec.) 0.9 0.9 1.0 0.6
Accumulated Distance(ft) 245 420 253 83 1000
Wellborn Rd. & George Bush
Dr.
Number of Glances (%) 35(10%) 131(39%) 128(38%) 43(13%) 337
Average duration (sec.) 0.6 0.6 1.5 0.7
Accumulated Distance(ft) 48 254 621 77 1000
George Bush Dr. & Wellborn
Rd
Number of Glances (%) 36(12%) 119(40%) 115(38%) 29(10%) 299
Average duration (sec.) 0.5 0.8 1.0 0.5
Accumulated Distance(ft) 68 381 498 54 1000
George Bush Dr. & FM 2818
Number of Glances (%) 29(9%) 120(39%) 130(43%) 27(9%) 306
Average duration (sec.) 0.7 0.7 1.1 0.4
Accumulated Distance(ft) 41 303 608 49 1000
FM 2818 & F&B Rd.
Number of Glances (%) 22(9%) 91(35%) 91(35%) 53(21%) 257
Average duration (sec.) 0.3 0.7 1.1 0.4
Accumulated Distance(ft) 35 304 533 127 1000
FM 2818 and Leonard Rd.
Number of Glances (%) 54(19%) 116(40%) 79(28%) 37(13%) 286
Average duration (sec.) 0.6 0.9 0.8 0.4
Accumulated Distance(ft) 136 451 345 69 1000
Leonard Rd. & SH 47
Number of Glances (%) 22(10%) 75(33%) 100(44%) 30(13%) 227
Average duration (sec.) 0.9 0.6 1.6 0.5
Accumulated Distance(ft) 30 192 704 74 1000

15
Intersection of FM 2818 and George Bush Drive The intersection of FM 2818 and George Bush Drive is a signalized intersection, and each lane/movement at the intersection has its own signal head. Drivers made 101 glances to zone R, accounting for 40 percent of total glances on the 1000-ft through-movement approach on FM 2818. Drivers made 91 glances to zone C along the approach. The total number of glances (to all zones) was greater compared to the total number of glances made while approaching theprevious non-signalized intersections. The average duration of glances to zone R was longer (1.1 sec) than to other zones. In other words, drivers held their glances longer on zone R to search for visual cues than on other zones. Zone R also accounted for the largest accumulated distance, 513 ft out of 1000 ft. Zones L and O accounted for small portions of the total distance at 82 ft and 77 ft out of 1000 ft, respectively. Intersection of FM 2818 and Wellborn Road The intersection of FM 2818 and Wellborn is a four-leg intersection controlled by traffic signals. Drivers in the original study turned left at this intersection. During the last 1000 ft when approaching the intersection, drivers made a total 325 of glances to all zones (Table 2). Of these, zone C accounted for the largest number, 131 glances or 40 percent of the total. Zone L had the second highest frequency with 84 glances (26 percent); drivers made more glances to zone L than on the approaches to the previous intersections that they were proceeded straight through. Average glance duration was similar for zones L, C, and R, ranging from 0.9 to 1.0 sec. Similarly to the number of glances to each zone, the accumulated glance distance on zone C was the largest at 420 ft out of the 1000-ft approach. Zones L and R showed similar accumulated distances: 245 and 253 ft. Intersection of Wellborn Road and George Bush Drive The intersection of Wellborn Road and George Bush Drive is a four-leg signal-controlled intersection. Study participants turned right at this intersection. During the 1000-ft approach, drivers made total 337 glances to the four zones (Table 2). Drivers made 131 glances (39 percent) to zone C and 128 glances (38 percent) to zone R. The percentage of glances to zone L was as low, similar to the percentage when approaching the previous intersections where drivers were proceeding straight through. Average glance durations for zones L, C, and O were almost the same. However, the average duration for zone R was higher at 1.5 sec. The accumulated distance for zone R accounted for 621 ft out of the 1000 approach due to longer-duration glances to that zone. Intersection of George Bush Drive and Wellborn Road The intersection of George Bush Drive and Wellborn Road has four legs and is signalized. Drivers proceeded straight through this intersection. They made a total of 299 glances on the 1000-ft approach to the intersection. Zone C accounted for 40 percent of total glances, and zone R followed with 38 percent. The average duration of glances on zone R was 1.0 sec, and the duration for zone C was 0.8 sec. The accumulated distance traveled during glances to zone R was

16
498 ft out of 1000. The accumulated distances for zones C, L, and O were 381 ft, 68 ft, and 54 ft, respectively. Intersection of George Bush Drive and FM 2818 The intersection of George Bush Drive and FM 2818 is a four-leg intersection controlled by traffic signals. Participants turned right from George Bush Drive onto FM 2818 at the intersection and they reduced speed to almost a full stop prior to turning. While approaching the intersection, drivers made a total of 306 glances. Out of this total, drivers made 130 glances (43 percent) to zone R and 120 glances (39 percent) to zone C. Zone R had the longest average glance duration at 1.1 sec. Zone R also had the longest accumulated distance at 608 ft out of 1000; zone C followed with 303 ft. Intersection of FM 2818 and F&B Road The intersection of FM 2818 and F&B Road is controlled by traffic signals from four ways. Participants approached the intersection on FM 2818 and proceeded straight through the intersection. When approaching the intersection from a distance of 1000 ft, drivers made 91 glances to zones C and to zone R, each of these two zones accounting for 35 percent of the total glances made over the 1000-ft approach. Zone O received its highest percentage of glances (21 percent) among the 10 intersection approaches. The average glance duration to zone R was 1.1 sec; to zone C, it was 0.7 sec. Glance durations for zones L and O were considerably shorter, averaging 0.3 and 0.4 sec. Out of the 1000-ft approach, the accumulated distance was 533 ft for zone R and 304 ft for zone C. Intersection of FM 2818 and Leonard Road The intersection of FM 2818 and Leonard Road is a signalized four-leg intersection. Study participants turned left from northbound FM 2818 to southbound Leonard Road at this intersection, which has both permissive and protected left-turn phases in the signal sequence. Drivers made 116 glances to zone C during the 1000-ft approach to this intersection, accounting for 40 percent of total glances. Glances on zone R were the second in frequency with 79 glances (28 percent of total) as shown in Table 2. The number and percentage of glances to zone L were higher than at the other intersections. Drivers made 54 glances to zone L, accounting for 19 percent of the total number. The longest average glance duration was 0.9 sec for zone C; average glance duration for zone L was 0.6 sec. In accumulated distance, zone C accounted for 451 ft of 1000 ft, and zones R, L, and O accounted for 345 ft, 136 ft, and 69 ft, respectively. Intersection of Leonard Road and SH 47 The intersection of Leonard Road and SH 47 is controlled by two-way stop signs located on Leonard Road. Participants approached the intersection on Leonard Road and stopped before turning right onto northbound SH 47. Among the total 227 glances made during the 1000-ft approach to this intersection, zone R accounted for 100 glances (44 percent) and zone C for 75 glances (33 percent). The average glance duration for zone R was 1.6 sec, and it was the highest

17
average duration among zones from 10 analyzed intersections. For accumulated distance over the 1000 ft, zone R accounted for 704 ft, the highest distance, followed by zone C at 192 ft. Eye Movement Pattern by Turning Movements Table 3 shows the number and percentage of glances, average duration, and accumulated distance categorized by different turning movements: left turn (LT), through movement/no turn (Thru), and right turn (RT). Participants turned left at two intersections (FM 2818 and Wellborn Road; FM 2818 and Leonard Road); they turned right at three intersections (Wellborn Road and George Bush Drive; George Bush Drive and FM 2818; and Leonard Road and SH 47); and at the other five intersections, they drove through without turning.
TABLE 3 Number and Percentage of Glances, Average Duration, and Accumulated Distance according to Turning Movements from 10 Analyzed Intersections.
Category Zone
Total L C R O
LT
Number of Glances (%) 138
(23%) 247
(40%) 151
(25%) 75
(12%) 611
Average duration (sec) 0.8 0.9 0.9 0.5
Accumulated Distance(ft) 192 435 297 76 1000
Thru
Number of Glances (%) 138
(11%) 471
(39%) 458
(38%) 151
(12%) 1218
Average duration (sec) 0.4 0.7 1.1 0.5
Accumulated Distance(ft) 60 331 529 80 1000
RT
Number of Glances (%) 86
(10%) 326
(37%) 358
(41%) 100
(11%) 870
Average duration (sec) 0.7 0.7 1.4 0.5
Accumulated Distance(ft) 40 251 642 67 1000
When approaching the intersections where they would make an LT movement, drivers glanced more often to zone C than other zones. Zone C accounted for 40 percent of total glances, and the percentages for zones R and L were 25 percent and 23 percent, respectively. In average duration, there was no big difference among zones L, C, and R, ranged from 0.8 to 0.9 sec. The proportion of accumulated distance shows similar difference with the percentages of glances from each zone. At the intersections where drivers made Thru movements, they glanced more often at zones C and R than at other zones; the percentages of glances to zones C and R were 39 percent and 38 percent, respectively. The longest average glance duration was 1.1 seconds for zone R. There was more difference in average duration between zone R and other zones than for the intersections where drivers turned left (LT). Zone R also accounted for the longest distance at 529 ft of 1000 ft. Although drivers glanced more often to zone C than zone R, the accumulated distance for zone C was shorter than for zone R.

18
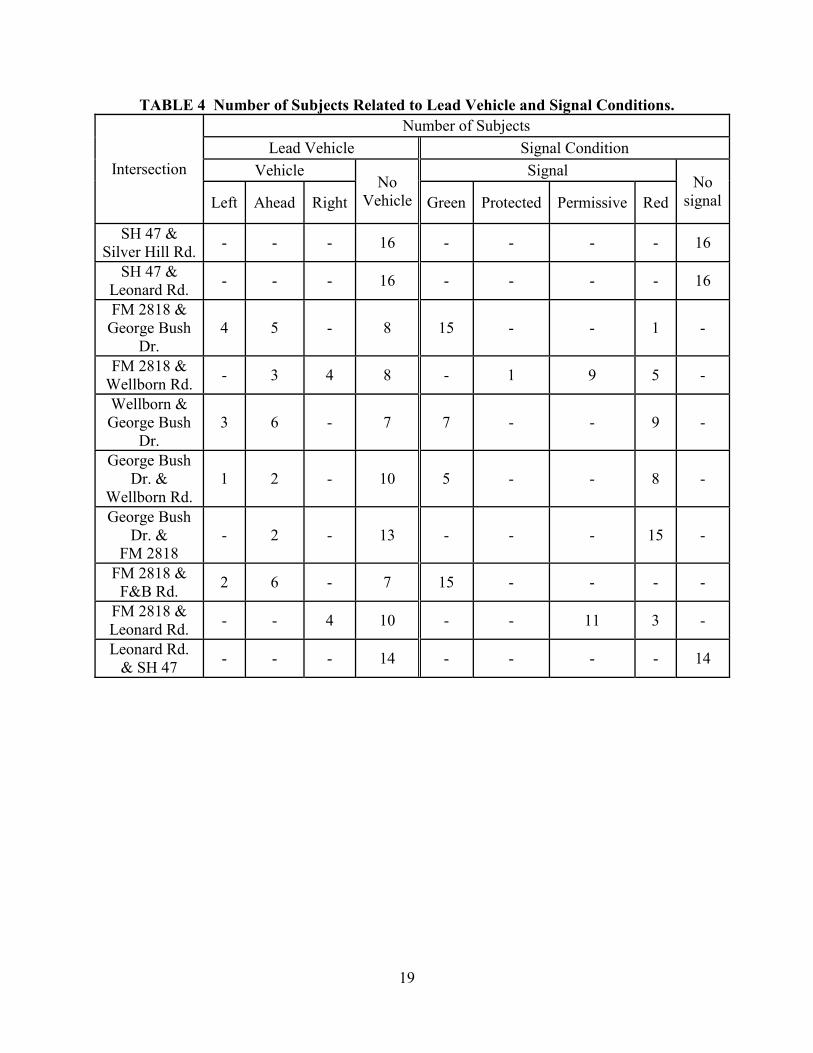
At the intersections where drivers made RT movements, participants glanced most often to zone R, which accounted for 41 percent of the total glances. Zone C followed and accounted for 37 percent. Average glance duration for zone R was the longest among the four zones at 1.4 sec. There was more difference in average glance duration between zone R and other zones than at the intersections where drivers made RT and Thru movements. Due to more glances and longer average glance duration, zone R accounted for 642 ft of 1000 ft in accumulated distance. Drivers’ eye movements on the approach to the intersections where they would make a left turn were different from eye movements approaching intersections were they would continue straight through. As drivers approached intersections where they would make through movements, 38 percent of their glances were to zone R and 11 percent to zone L. On the approaches to intersections where drivers would turn left, the frequency of drivers’ glances to zone R dropped to 25 percent, and glances to zone L increased to 23 percent. Effect of lead Vehicle and Signal Condition on Eye Movement Pattern Table 4 shows the numbers of drivers that encountered specific conditions (i.e., the presence of a lead vehicle and signal phase) at the intersections. To analyze the effect of a lead vehicle on drivers’ eye movements, five intersections (i.e., FM 2818 and George B. Drive; FM 2818 and Wellborn; Wellborn and George B. Drive; FM 2818 and F&B; and FM 2818 and Leonard) were chosen because they included at least three subjects in each category. For example, at the intersection of FM 2818 and George Bush Drive, there were five drivers who had a lead vehicle present in the lane to their left, five drivers who had a lead vehicle in their own lane, and eight drivers with a lead vehicle present in the lane to their right. To analyze the eye movement differences due to the signal phase, two intersections (i.e., Wellborn and George B. Drive; and George B. Drive and Wellborn) were chosen. These intersections have similar numbers of drivers approaching under several signal conditions (Table 4). Effect of Lead Vehicle on Eye Movement at Intersection of FM 2818 and George Bush Drive Figure 3 shows the number of glances to each zone as drivers approached the intersection of FM 2818 and George Bush Drive. Drivers glanced more frequently to the left side (zone L) when there was a lead vehicle on the left. Similarly, drivers glanced ahead (zone C) more often when there was a lead vehicle ahead than they did when there was no lead vehicle. Drivers also made fewer glances to zone O with a lead vehicle present than they did when there was no lead vehicle.
19
TABLE 4 Number of Subjects Related to Lead Vehicle and Signal Conditions.
Intersection
Number of Subjects
Lead Vehicle Signal Condition
Vehicle No
Vehicle
Signal No
signalLeft Ahead Right Green Protected Permissive Red
SH 47 & Silver Hill Rd.
- - - 16 - - - - 16
SH 47 & Leonard Rd.
- - - 16 - - - - 16
FM 2818 & George Bush
Dr. 4 5 - 8 15 - - 1 -
FM 2818 & Wellborn Rd.
- 3 4 8 - 1 9 5 -
Wellborn & George Bush
Dr. 3 6 - 7 7 - - 9 -
George Bush Dr. &
Wellborn Rd. 1 2 - 10 5 - - 8 -
George Bush Dr. &
FM 2818 - 2 - 13 - - - 15 -
FM 2818 & F&B Rd.
2 6 - 7 15 - - - -
FM 2818 & Leonard Rd.
- - 4 10 - - 11 3 -
Leonard Rd. & SH 47
- - - 14 - - - - 14

20
FIGURE 4 Comparison of Percentage of Glances on Zones according to Location of Lead
Vehicle at Intersection of FM 2818 and George Bush Drive. Effect of Lead Vehicle on Eye Movement at Intersection of FM 2818 and Wellborn Road The frequencies of glances to zones L and C were higher when there was a lead vehicle present than when there was no lead vehicle (Figure 5). However, glances to zones R and O were less frequent with a lead vehicle, regardless of the lead vehicle’s location. Drivers were preparing to turn left at this intersection. Thus, the presence of a lead vehicle on the right side might not have drawn the drivers’ attention enough to significantly affect their eye movements.
FIGURE 5 Comparison of Percentages of Glances on Zones according to Location of Lead
Vehicle at Intersection of FM 2818 and Wellborn Road.

21
Effect of Lead Vehicle on Eye Movement at Intersection of Wellborn Road and George Bush Drive The percentage of glances to zone L was higher when there was a lead vehicle to the left than it was with no lead vehicle (Figure 6). The percentage of glances to zone C was also higher when a lead vehicle was ahead. Commonly, the percentages of glances to zone O with a lead vehicle regardless of its location (left or center) were lower than with no lead vehicle. The presence of a lead vehicle on the left or straight ahead appeared to affect the drivers’ eye movements at this intersection.
FIGURE 6 Comparison of Percentages of Glances on Zones according to Location of Lead
Vehicle at Intersection of Wellborn and George Bush Drive. Effect of Lead Vehicle on Eye Movement at Intersection of FM 2818 and F&B Road The percentage of glances to zone C was the same, regardless of whether there was a lead vehicle or not (Figure 7). Furthermore, the percentage of glances to zone O was higher when there was a lead vehicle. These results are different than for the previous intersections.

22
FIGURE 7 Comparison of Percentages of Glances on Zones according to Location of Lead
Vehicle at Intersection of FM 2818 and F&B Road. Effect of Lead Vehicle on Eye Movement at Intersection of FM 2818 and Leonard Road Similarly to the intersection of FM 2818 and F&B Road, the percentage of glances to zone R was lower with a lead vehicle in the right lane than without a lead vehicle, and the percentage of glances to zone O was higher when there was a lead vehicle (Figure 8).
FIGURE 8 Comparison of Percentage of Glances on Zones according to Location of Lead
Vehicle at Intersection of FM 2818 and Leonard Road.

23
Effect of Signal Condition on Eye Movement Pattern at Intersection of Wellborn Road and George Bush Drive Drivers face a red or green traffic signal when approaching a signalized intersection, and their eye movements can be affected by the condition of traffic signals (i.e., red or green). During a green signal condition when approaching the intersection, the percentages of glances to zones C and R were higher than during the red signal condition (Figure 9). However, the percentages of glances to zones L and O were lower during the green signal condition.
FIGURE 9 Comparison of Percentages of Glances according to Signal Condition at
Intersection of Wellborn Road and George Bush Drive. Effect of Signal Condition on Eye Movement Pattern at Intersection of George Bush Drive and Wellborn Road The percentage of glances to zone L when approaching the intersection during a green signal was lower than the percentage during the red signal condition (Figure 10). However, the percentage of glances for zone R was higher when approaching during green signal than red signal.

24
FIGURE 10 Comparison of Percentages of Glances on Zones according to Signal
Condition at Intersection of George Bush Drive and Wellborn Road. Probabilities of Glances on Zones using Binary Logistic Regression Model This study analyzed the changes of probabilities of glances to each zone (L, C, R, and O) with the changes of distance to intersections using a binary logistic regression model. Table 5 shows the results from binary logistic regression analyses. At several intersections (i.e., intersections of SH 47 and Silver Hill Road; FM 2818 and Wellborn Road; George Bush Drive and Wellborn Road; George Bush Drive and FM 2818; FM 2818 and Leonard Road; and Leonard Road and SH 47), there were statistically significant changes on the probabilities of glances to some zones as drivers approached the intersections.

25
TABLE 5 Results from Binary Logistic Regression Analyses.
Intersection Zone Variables B S.E. df Sig. Exp(B)
Intersection of SH 47 and Silver Hill Road
L Distance -.001 .001 1 .411 .999 Constant -2.381 .497 1 .000 .092
C Distance .000 .000 1 .519 1.000 Constant -.302 .263 1 .251 .740
R Distance .000 .000 1 .827 1.000 Constant -.105 .259 1 .684 .900
O Distance .002 .001 1 .032* 1.002 Constant -3.374 .593 1 .000 .034
Intersection of SH 47 and Leonard Road
L Distance .001 .001 1 .200 1.001 Constant -2.225 .381 1 .000 .108
C Distance .000 .000 1 .565 1.000 Constant -.469 .246 1 .057 .626
R Distance .000 .000 1 .276 1.000 Constant -.480 .251 1 .056 .619
O Distance .000 .001 1 .501 1.000 Constant -1.805 .357 1 .000 .165
Intersection of FM 2818 and George Bush Drive
L Distance .000 .001 1 .472 1.000 Constant -1.666 .291 1 .000 .189
C Distance .000 .000 1 .570 1.000 Constant -.395 .212 1 .062 .673
R Distance .001 .000 1 .183 1.001 Constant -.712 .217 1 .001 .491
O Distance .000 .001 1 .678 1.000 Constant -2.071 .335 1 .000 .126
Intersection of FM 2818 and Wellborn Road
L Distance -.001 .000 1 .003* .999 Constant -.496 .203 1 .015 .609
C Distance .000 .000 1 .981 1.000 Constant -.402 .192 1 .037 .669
R Distance .001 .000 1 .035* 1.001 Constant -1.676 .245 1 .000 .187
O Distance .001 .001 1 .144 1.001 Constant -2.454 .327 1 .000 .086
Intersection of Wellborn Road and George Bush Drive
L Distance -.001 .001 1 .050 .999 Constant -1.708 .263 1 .000 .181
C Distance .000 .000 1 .928 1.000 Constant -.454 .180 1 .012 .635
R Distance .001 .000 1 .059 1.001 Constant -.744 .185 1 .000 .475
O Distance .000 .001 1 .414 1.000 Constant -1.779 .257 1 .000 .169
* p < 0.05 and ** p < 0.01

26
TABLE 5 Results from Binary Logistic Regression Analyses (continued).
Intersection Zone Variables B S.E. df Sig. Exp(B)
Intersection of George Bush Drive and Wellborn Road
L Distance .000 .001 1 .664 1.000 Constant -1.931 .298 1 .000 .145
C Distance -.001 .000 1 .072 .999 Constant -.047 .196 1 .810 .954
R Distance .001 .000 1 .046* 1.001 Constant -.848 .209 1 .000 .428
O Distance .000 .001 1 .837 1.000 Constant -2.335 .341 1 .000 .097
Intersection of George Bush Drive and FM 2818
L Distance -.001 .001 1 .028* .999 Constant -1.679 .273 1 .000 .187
C Distance -.001 .000 1 .062 .999 Constant -.135 .185 1 .466 .874
R Distance .000 .000 1 .387 1.000 Constant -.461 .187 1 .014 .631
O Distance .003 .001 1 .000** 1.003 Constant -3.899 .508 1 .000 .020
Intersection of FM 2818 and F&B Road
L Distance .000 .001 1 .551 1.000 Constant -2.156 .370 1 .000 .116
C Distance .000 .000 1 .987 1.000 Constant -.630 .230 1 .006 .532
R Distance .000 .000 1 .967 1.000 Constant -.546 .227 1 .016 .579
O Distance .000 .000 1 .694 1.000 Constant -1.496 .279 1 .000 .224
Intersection of FM 2818 and Leonard Road
L Distance -.002 .001 1 .001* .998 Constant -.658 .228 1 .004 .518
C Distance .000 .000 1 .766 1.000 Constant -.343 .201 1 .088 .710
R Distance .001 .000 1 .004* 1.001 Constant -1.569 .244 1 .000 .208
O Distance .000 .001 1 .388 1.000 Constant -2.177 .314 1 .000 .113
Intersection of Leonard Road and SH 47
L Distance -.003 .001 1 .000** .997 Constant -1.011 .287 1 .000 .364
C Distance .000 .000 1 .590 1.000 Constant -.672 .235 1 .004 .511
R Distance .000 .000 1 .345 1.000 Constant -.380 .224 1 .090 .684
O Distance .002 .001 1 .002* 1.002 Constant -3.104 .462 1 .000 .045
* p < 0.05 and ** p < 0.01

27
Intersection of SH 47 and Leonard Road The probabilities of glances on zones L and C decreased as a driver approached the intersection; however, the probabilities of glances on zones R and O increased during the approach (Figure 11). According to the results in Table 4, there was no statistical significance for the changes in probabilities of glances versus distance for any zone.
FIGURE 11 Probabilities of Glances on Each Zone by Distance to Intersection of SH 47
and Leonard Road. Intersection of FM 2818 and George Bush Drive The probabilities of glances to zones L, C, and O increased when a driver was approaching the intersection; however, the probability of glances to zone R decreased during the approach to the intersection (Figure 12). Although the probabilities of glances on zones changed with distance, the changes were not statistically significant for any zone (Table 6).
FIGURE 12 Probabilities of Glances on Each Zone by Distance to Intersection of FM 2818
and George Bush Drive.

28
Intersection of FM 2818 and Wellborn Road The probabilities of glances on zone L and C increased as distance to the intersection decreased, and the probabilities for zone R and O decreased over the distance (Figure 13). According to the results shown in Table 6, there were statistically significant relationships between the distance to the intersection and the glance probabilities for zones L and R. The probability of glances on zone L was approximately 15 percent when a driver was 1000 ft away from the intersection; however, the probability increased to almost 38 percent when arriving at the intersection. The probability of glances on zone R was 48 percent at 1000 ft away from the intersection, but the probability was 32 percent at the intersection. Drivers were more likely to glance to zone L and less likely to glance to zone R the closer they got to the intersection.
FIGURE 13 Probabilities of Glances on Each Zone by Distance to Intersection of FM 2818
and Wellborn Road. Intersection of Wellborn Road and George Bush Drive Figure 14 shows the changes of the probabilities of glances on each zone due to the change of distance to the intersection; the probabilities of glances on zones L and O increased with approaching the intersection, but the probabilities on zone R decreased and there was no change on the probability on zone C. Although the changes of the probabilities on zones, according to the results shown in Table 6, there were no statistical significant relationships between probability and distance in all zones.

29
FIGURE 14 Probabilities of Glances on Each Zone by Distance to Intersection of Wellborn
Road and George Bush Drive. Intersection of George Bush Drive and Wellborn Road Figure 15 shows the changes in probabilities of glances versus the distance to the intersection of George Bush Drive and Wellborn Road. The probabilities of glances to zones L and C increased as a driver approached the intersection and the probabilities of glances to zones R and O decreased. Based on the results shown in Table 6, only zone R’s change in probability relative to the distance to the intersection was statistically significant. The probability of glances to zone R was 47 percent when a driver was 1000 ft away from the intersection, and the probability decreased to 30 percent when arriving at the intersection. Drivers were less likely to glance at zone R as they got closer to the intersection.
FIGURE 15 Probabilities of Glances on Each Zone by Distance to Intersection of George
Bush Drive and Wellborn Road.

30
Intersection of George Bush Drive and FM 2818 Figure 16 shows the changes in probabilities of glances to each zone over the approach to this intersection. The probabilities of glances to zones L and C increased as drivers got closer to the intersection, and the probabilities of glances to zones R and O decreased. According to the regression analysis (Table 6), the changes in probabilities of glances to zones L and O were statistically significant. The probability of glances to zone L was less than 5 percent when the distance was 1000 ft away from the intersection, but the probability significantly increased to 15.73 percent when arriving at the intersection. The probability of glances to zone O was approximately 23 percent when the distance was 1000 ft away from the intersection, but the probability decreased to less than 2 percent when arriving at the intersection. Drivers were likely to glance more often at zone L and less often at zone O as they approached the intersection.
FIGURE 16 Probabilities of Glances on Each Zone by Distance to Intersection of George
Bush Drive and FM 2818. Intersection of FM 2818 and F&B Road At this intersection, the changes of probabilities of glances on each zone by distance were less than at other signalized intersections (Figure 17). The probability of glances to zone L slightly increased and the probability of glances to zone O slightly decreased when approaching the intersection. The probabilities of glances to zones C and R did not change by distance to the intersection. There was no statistical significance in the probabilities of glances to all zones (Table 6).

31
FIGURE 17 Probabilities of Glances on Each Zone by Distance to Intersection of FM 2818
and F&B Road. Intersection of FM 2818 and Leonard Road The slopes of the graphs of the probabilities of glances on zones L and R were steeper than ones of other zones as shown in Figure 18. The probability of glances on zone L increased when approaching the intersection; however, the probability of glances on zone R decreased. For other zones, C and O, the probabilities slightly changed with distance. According to the analysis shown in Table 6, there were statistically significant changes in the probabilities of glances on zones L and R as distance decreased. The probability of glances on zone L was less than 8 percent at the distance of 1000 ft, but the probability was about 35 percent when arriving at the intersection. For zone R, the probability decreased from 42 percent for 1000 ft away from the intersection to 17 percent at the intersection. Drivers were likely to glance more often at zone L and less often at zone R as their distance to the intersection decreased.
FIGURE 18 Probabilities of Glances on Each Zone by Distance to Intersection of FM 2818
and Leonard Road.

32
Intersection of Leonard Road and SH 47 As shown in Figure 19, the probabilities of glances on zones L, C, and R increased as drivers approached the intersection. Among those, the probabilities for zones C and R changed at identical rates over the distance. The probability of glances to zone O decreased as drivers approached the intersection. As shown in Table 6, there were statistically significant changes for the probabilities of glances on zones L and O. At the distance of 1000 ft, the probabilities of glances on zones L and O were less than 2 percent and approximately 26 percent, respectively; however, the probabilities were 27 percent for zone L and less than 5 percent for zone O when arriving at the intersection. Drivers were likely to glance more often at zone L and less often at zone O as they approached the intersection.
FIGURE 19 Probabilities of Glances on Each Zone by Distance to Intersection of Leonard
Road and SH 47. Probabilities of Glances on Zones according to Turning Movement The probabilities of glances on each zone for intersections with through movements were analyzed using eye movement data at five intersections: SH 47 and Silver Hill Road; SH 47 and Leonard Road; FM 2818 and George Bush Drive; George Bush Drive and Wellborn Road; and FM 2818 and F&B Road. For left-turn movements, two intersections, FM 2818 and Wellborn Road; and FM 2818 and Leonard Road, were analyzed. For right-turn movements, three intersections, Wellborn Road and George Bush Drive; George Bush Drive and FM 2818; and Leonard Road and SH 47, were analyzed. Table 6 shows the results from binary logistic regression analyses for through, left-turn, and right-turn movements, labeled Thru, LT, and RT.

33
TABLE 6 Results from Binary Logistic Regression Analyses according to Turning Movement.
Intersection Zone Variables B S.E. df Sig. Exp(B)
Thru
L Distance .000 .000 1 .610 1.000 Constant -2.022 .155 1 .000 .132
C Distance .000 .000 1 .239 1.000 Constant -.352 .101 1 .000 .703
R Distance .000 .000 1 .302 1.000 Constant -.576 .102 1 .000 .562
O Distance .000 .000 1 .475 1.000 Constant -2.081 .155 1 .000 .125
LT
L Distance -.001 .000 1 .000** .999 Constant -.586 .151 1 .000 .556
C Distance .000 .000 1 .825 1.000 Constant -.374 .139 1 .007 .688
R Distance .001 .000 1 .001** 1.001 Constant -1.617 .172 1 .000 .199
O Distance .001 .000 1 .102 1.001 Constant -2.314 .226 1 .000 .099
RT
L Distance -.002 .000 1 .000** .998 Constant -1.501 .158 1 .000 .223
C Distance .000 .000 1 .109 1.000 Constant -.381 .113 1 .001 .683
R Distance .000 .000 1 .025* 1.000 Constant -.554 .113 1 .000 .575
O Distance .001 .000 1 .000** 1.001 Constant -2.645 .202 1 .000 .071
* p < 0.05 and ** p < 0.01 Probabilities of Glances on Each Zone at the Intersections with Through Movements The probabilities of glances on zones C and L slightly increased as drivers approached these five intersections and the probabilities of glances on zones R and O decreased, as shown in Figure 20. According to the analysis shown in Table 5, these changes in probability were not statistically significant.

34
FIGURE 20 Probabilities of Glances on Each Zone by Distance at Intersections having
Thru Movement. Probabilities of Glances on Each Zone at the Intersections with Left Turn Movements The probabilities of glances on zones L and C increased as drivers approached these intersections and the probabilities for zones R and O decreased, as shown in Figure 21. The changes in probability for zones L and R were statistically significant. The probability of glances on zone L was almost 12 percent when the distance was 1000 ft away from the intersection, but the probability was up to 36 percent when arriving at the intersection. For zone R, the probability was about 36 percent at the distance of 1000 ft, and then decreased to 17 percent when arriving at the intersection. At the intersections where drivers made left turns, they were more likely to glance at zone L and less likely to glance at zone R as they got closer to the intersection.
FIGURE 21 Probabilities of Glances on Each Zone by Distance at Intersections having LT
Movement.

35
Probabilities of Glances on Each Zone at the Intersections with Right Turn Movements As shown in Figure 22, the probabilities of glances on zones L and C increased as drivers approached the intersections where they would make right turns, and the probabilities of glances on zones R and O decreased. According to the regression analysis (Table 6), the changes in probability for zones L, R, and O were statistically significant. The probability of glances on zone L was less than 4 percent at the distance of 1000 ft away from the intersection but increased to 18 percent when arriving at the intersection. The probabilities for zones R and O were 48 percent and 18 percent for the distance of 1000 ft away, respectively; however, the probabilities decreased to 46 percent and 7 percent when arriving at the intersection. Drivers were likely to glance more frequently to zone L and less frequently to zones R and O when approaching the intersections where they would turn right.
FIGURE 22 Probabilities of Glances on Each Zone by Distance at Intersections having RT
Movement.

36

37
Chapter 5. Conclusions and Recommendations This study analyzed drivers’ eye movements approaching 10 different intersections. The intersections were selected as several “sets” of two or three: the intersections in each set were similar in most respects but different from each other in particular characteristics, such as signalized versus stop-sign controlled intersections; right-, left-, and through-movement intersections, and lighted versus unlighted intersections. To compare eye movements at each intersection, this study defined four visual “zones” (left, right, center, and off-screen) and tallied the number of glances, average glance durations, and accumulated distance traveled (representing the total “glance time”) for each zone over the 1000-ft approach to the intersection. These numbers were used to calculate the probabilities that drivers would glance at each zone for each type of intersection selected. The analysis of the total number of glances over the 1000-ft approach to each intersection showed that drivers shifted their glance more frequently approaching the signalized intersections than they did at the unsignalized intersections. Drivers made an average of 209 glances (Standard Deviation: 24.7) over all zones when approaching the intersections controlled by stop-signs. However, drivers made an average of 294 glances (Standard Deviation: 45.3) at the signalized intersections. Overall, drivers glanced straight ahead and to the right more often than to the left or off-screen. These results, with glances to the right nearly as frequent as glances straight ahead, differed somewhat from an earlier study by Serafin (17), which indicated that drivers glanced straight ahead considerably more often than in any other direction. The reason for this difference in results can be explained by the objective of the original study for which the video was collected, in which the participating drivers were instructed to scan for specific road signs located on the right side of the road. Although it can be assumed that drivers’ eye movement patterns were affected by the objective of original study, drivers still glanced at the road straight ahead slightly more often than to the right at most intersections. The objective of the original study likely also affected average glance duration to the right side of the drivers. The longest glance durations tended to be on the right side among the four zones. In other words, drivers kept their focus toward the right side of the road for longer durations to scan for specific road signs. Similar to the results for average glance duration, the right-side zone also accounted for the longest accumulated distance driven. There was a difference in eye movement pattern correlating with left-turn, right-turn, and through movements at intersections. At the intersections where drivers proceeded straight through or turned right, they glanced much more frequently straight ahead and to the right, in approximately equal proportions, than they did to the left and off-screen. At these intersections, drivers kept their glances fixed on the right side with the longest average durations. However, approaching intersections where they would turn left, the drivers glanced most often straight ahead, while glances to the right side decreased in frequency and glances to the left increased in frequency compared to the right-turn and through-movement intersections. Furthermore, differently than for other movements, the average glance durations straight ahead, to the left, and to the right were similar for left-turn movements; drivers kept similar duration of glances on each of the zones. The left-turn intersections overall seemed to elicit different eye movement patterns than the right-turn or through-movement intersections.

38
In the few instances where there was a lead vehicle present, drivers glanced more often at the zone containing the lead vehicle (whether that was center, right, or left) at the intersections of FM 2818 and George Bush Drive; FM 2818 and Wellborn Road; and Wellborn Road and George Bush Drive. Also, drivers glanced off-screen less frequently when there was a lead vehicle at those three intersections. However, at the intersections of FM 2818 and F&B Road and FM 2818 and Leonard Road, drivers glanced less often at the zones containing lead vehicles. Although analysis of the effect of a lead vehicle was attempted, the relative lack of data (due to the rarity of other vehicles on the road during the original late-night data collection) led to inconclusive results. As well as the effect of turning movements and the presence of a lead vehicle on eye movement, this study analyzed the probabilities that a driver glanced at a specific zone as a function of distance to the intersection, using logistic regression modeling. At some intersections, the probabilities of glances at particular zones significantly changed with distance to the intersection. At intersections where drivers would turn left or right (rather than proceeding straight through), the changes in probabilities were more distinct. For the intersections where drivers turned left, the probabilities of glances at the left side significantly increased as drivers approached the intersections and the probabilities of glances to the right significantly decreased. For the intersections where drivers turned right, the probabilities of glances to the left significantly increased as they approached the intersections and the probabilities of glances to the right and off-screen both decreased. The results indicate that when drivers were preparing to turn (in either direction) they were more likely to scan the area to their left, possibly looking for oncoming traffic from the left. They were also less likely to shift their gaze away from the oncoming roadway to look off-screen; one possible reason is that they were focusing more on the driving environment (rather than, for instance, looking down at the speedometer) when they were preparing to make a turn. Challenges Associated with Re-Analyzing Existing Eye-Tracker Video The analysis of eye movements in this study provided evidence that differences in the driving environment correlate to differences in drivers’ eye movements. However, certain characteristics of the data presented some challenges and limitations for these analyses. First, eye movement data were originally recorded from 24 drivers, but data from only 16 drivers was used for this new analysis. The lost data was due to calibration problems with the head-mounted eye tracker that made the data from some drivers difficult or impossible to read accurately. Although the eye tracker was calibrated to each driver at the beginning of the original data collection, driver head movements during the hour-long test drive sometimes shifted the eye-tracker apparatus and degraded the calibration. Potential methods for minimizing these types of calibration difficulties should be considered when preparing for data acquisition in future research.
Another limitation resulted from the low frequencies of certain events/circumstances along the data collection route. The effect of lead vehicles on eye movements was one analysis that was attempted but was inconclusive due to the scarcity of situations available for comparison. This limitation was inherent in the conditions and the purpose of the original study—the driving

39
videos were collected late at night, when traffic volumes are relatively low, and the visual “targets” provided for drivers in the original study were road signs rather than vehicles.
Finally, since the drivers in the original study had been instructed to scan for signs on the right side of the road, it is likely that their overall glance pattern was different than it would have been for “natural” driving. The experience from this study suggests that future research involving “data-mining” and re-analysis of existing driving data (including eye-tracking data) has the potential to yield some useful results. However, the results gleaned from this type of re-analysis should be considered in light of the purpose, procedures, and conditions of the original study.

40

41
References 1. Federal Highway Administration (FHWA). Intersection Safety. Issue Briefs on April, 2004. 2. Roadway Design Manual. Texas Department of Transportation. Revised October, 2006. 3. Hasson, P. and P. Lutkevich. Roadway Lighting Revisited. Public Roads, May/June, 2002. 4. Opiela, K. S., C. K. Andersen, and G. Schertz. Driving after Dark. Public Roads, Vol. 66,
No. 4, 2003.
5. Carlson, P., J Miles, ES Park, S Young, S Chrysler, J Clark. Development of a model performance-based sign sheeting specification based on the evaluation of nighttime traffic signs using legibility and eye tracker data. FHWA/TX-10/0-5235-1, Texas Transportation Institute Report 0-5235-1, September 2009.
6. American Association of State Highway and Transportation Officials (AASHTO, 2004). A
policy on geometric design of highways and streets, Washington, D. C. 7. Dewar, R. and Olson, P. Human factors in traffic safety. Lawyers & Judges Publishing
Company, Tucson, AZ, 2007. 8. Whitten, M. How are speed limits set? An example from TxDOT, AASHTO Quarterly
Magazine, Vol. 75, No. 3, 1996.
9. Kosaka, H., N. Higashikawa, T. Morioka, M. Noda, H. Nishitani, M. Uechi, and K. Sasaki. Analysis of driver’s negotiation patterns at intersection, Proceedings of IEEE International Conference on October, 2007.
10. Sivak, M. The information that drivers use: is it indeed 90% visual? Perception, Vol. 25,
1996, pp. 1081-1089. 11. Zwahlem, H. Stop Ahead and stop signs and their effect on driver eye scanning and driving
performance. Transportation Research Record, Vol. 1168, 1988, pp. 16-24. 12. Farraher, B. A., R. Weinholzer, and M. P. Kowski. The effect of advanced warning flashers
on red light running: A study using motion imaging recording system technology at trunk highway 169 and Pioneer trail in Bloomington. Minnesota, ITE Annual Meeting, Minnesota Department of Transportation, 1999.
13. Smith, T. J., C. Hammond, and M. G. Wade. Investigating the effect on driver performance
of advanced warning flashers at signalized intersections. Technical Report No. Mn/RC- 2002-05, Minnesota Department of Transportation, 2002.
14. Sayed, T., H. Vahidi, and F. Rodriguez. Advanced Warning Flashers: Do they improve
safety? Transportation Research Record, No.1692, 1999, pp 30-38.

42
15. Knodler Jr, M. A. and D. A. Noyce. Tracking driver eye movements at permissive left-turns,
Proceedings of the third International Driving Symposium on Human Factors in Driver Assessment, Training and Vehicle Design, 2005.
16. Mortimer, R. G. and C. M. Jorgeson. Comparison of Eye Fixations of Operators of
Motorcycles and Automobiles. SAE Technical Report No. 750373, Warrendale, PA: Society of Automotive Engineers, 1975.
17. Serafin, C. Preliminary Examination of Driver Eye Fixations on Rural Roads: Insight into
Safe Driving Behavior. Publication UMTRI-93-29, Ann Arbor, Michigan: University of Michigan Transportation Research Institute, 1993.
18. Diguer, B., M. Jeannerod, and C. Prablanc. The Coordination of Eye, Head, and Arm
Movements during Reaching at a Signal Visual Target. Experimental Brain Research, Vol. 46, 1982, pp. 301-304.
19. Hancock, R. A., G. Wulf, D. Thom, and P. Fassnacht. Driver Workload during Differing
Driving Maneuvers. Accident Analysis and Prevention, Vol. 22, No. 3, 1990, pp. 281-290. 20. Pradhan, A. K., K. R. Hammel, R. DeRamus, A. Pollatsek, D. A. Noyce, and D. L. Fisher.
The Use of Eye Movements to Evaluate the Effects of Driver Age on Risk Perception in an Advanced Driving Simulator. Proceeding on 82nd Annual Meeting of the Transportation Research Board, Washington, D. C., 2005.
21. Olsen, E. B., S. E. Lee, B. G. Simons-Morton. Eye Movement Patterns for Novice Teen Drivers: Does 6 Months of Driving Experience Make a Difference? Transportation Research Record, No. 2009, 2007, pp. 9-14.
22. Hallmark, S., N. Hawkins, O. Smadi, C. Kinsenbaw, M. Orellana, Z. Hans, and H.
Isebrands. Strategies to Address Nighttime Crashes at Rural, Unsignalized Intersections. Publication CTRE Project 05-220. Center for Transportation Research and Education, Iowa State University, 2008.
23. Harder, K. A., J. Bloomfield, and B. J. Chihak. Reducing crashes at controlled rural
intersections. Technical Report No. MN/RC 2003-15. Minnesota Department of Transportation, 2003.
24. Preston, H. and T. Schoenecker. Safety Impacts of Street Lighting at Isolated Rural
Intersections. Publication 1999-17. Minnesota Department of Transportation, 1999. 25. Amparano, G. and D. A. Morena. Senior mobility series: Article 4 marking the way to
greater safety. Public Roads, Vol. 70, No. 1, 2006. 26. Ellison, J. W. Case study: Failure to stop at stop sign: A progressive approach, Pierce
County, WA, 2007.

43
27. Institute of Transportation Engineers (ITE). Making intersections safer: A toolbox of
engineering countermeasures to reduce red light running. Retrieved from http://safety.fhwa.dot.gov/intersections/docs/rlrbook.pdf. 2003.
28. Thomas, G. B. and D. J. Smith. Effective of roadway safety improvements, Iowa State
University, 2001. 29. Russi, B. P. Impact of mast-mounted signal heads on accident reduction. ITE Journal, Vol.
61, No. 10, 1991. 30. Michell, R. Identifying and Improving Highway Accident Locations. Public Works,
December, 1972. 31. Preston, H. and C. Albrecht. Traffic safety fundamentals handbook. Minnesota Department
of Transportation, St. Paul, 2001. 32. Berthelon, C. and D. Mestre. Curvilinear Approach to an Intersection and Visual Detection
of a Collision. Human Factors, Vol. 35, 1993. pp. 521–534. 33. Gluck, J., H. S. Levinson, and V. Stover. Impacts of Access Management Techniques.
NCHRP Report 420, Transportation Research Board, Washington, D. C., 1999.

44

45
45
Appendix: Intersection list
Cross street 1 Cross street 2 Distance1
(Miles)
Type of IS (legs)
Speed limit
(mph)
Number of lanes2
Movement3Traffic signal (T)
( or Stop sign (S)) Exclusive lane4
Channelized island Street
LightingA B C D A B C D A B C D AC BC BD AD
Fifth Street SH 47 - 4 - 2 2 4 4 R S S R L L SH 47 Goodson Bend Rd 0.25 4 65 4 4 2 2 TH S S L L SH 47 Silver Hill Rd 0.96 3 65 4 4 2 2 TH S L L SH 47 Silver Hill Rd 0.27 4 65 4 4 2 2 TH S S L L SH 47 SH 47 Crossover 0.51 3 65 4 4 2 TH S L L SH 47 Leonard Rd 0.7 4 65 4 4 2 2 TH S S L L SH 47 SH 47 Crossover 0.44 3 65 4 4 2 TH S L L SH 47 W Villa Maria Rd 0.73 4 65 4 4 2 2 TH S S L L SH 47 SH 47 Crossover 0.9 3 65 4 4 2 TH S L L SH 47 SH 47 Crossover 0.45 3 65 4 4 2 TH S L L
Harvey Mitchell pkwy George Bush Dr. W 0.73 4 60 4 4 4 2 TH T T T T L L L,R Y Y Y Harvey Mitchell pkwy Luther St. W 0.46 4 60 4 4 4 5 TH T T T T L Y Harvey Mitchell pkwy Canyon Creek Circle 0.36 3 60 4 4 2 TH S Harvey Mitchell pkwy Holleman Dr. W 0.31 3 60 4 4 2 TH T T L Y Harvey Mitchell pkwy Marion Pugh Dr. 0.31 3 60 4 4 2 TH S Harvey Mitchell pkwy N Dowing Rd. 0.19 3 50 4 4 2 TH S Harvey Mitchell pkwy Railroad 0.08 50 4 4 TH T T Harvey Mitchell pkwy Wellborn Rd. 0.15 4 50 4 4 4 4 L T T T T L,R L L L Y Y
Wellborn Rd Christline Ln. 0.19 3 45 4 4 2 TH S Wellborn Rd Southwest pkwy 0.2 3 45 4 4 4 TH T T T L L,R Y Wellborn Rd Southland St 0.15 3 45 4 4 2 TH S Wellborn Rd Holleman Dr. 0.22 4 45 4 4 3 4 TH T T T T L L L,R Wellborn Rd Luther St. 0.29 3 45 4 4 2 TH S Y Wellborn Rd Park Place 0.06 3 45 4 4 2 TH S Y Wellborn Rd Fidelity St 0.11 3 45 4 4 2 TH S Y Wellborn Rd Grove St 0.07 3 45 4 4 2 TH S Y Wellborn Rd George Bush Dr. 0.16 4 45 4 4 4 4 R T T T T L L,R L L,R Y Y
George Bush Dr. Highlands St 0.06 3 40 4 4 2 TH S L Y George Bush Dr. Montclair Ave 0.09 3 40 4 4 2 TH S L Y George Bush Dr. Fairview Ave 0.06 3 40 4 4 2 TH S L Y George Bush Dr. Houston St 0.11 3 40 4 4 3 TH T T T L R L,R Y George Bush Dr. Dexter Dr. 0.16 4 40 4 4 4 2 L T T T T L L,R L,R L Y Y Y
Dextor George Bush Dr. 4 40 4 2 4 4 R T T T T L L,R L,R L Y Y Y George Bush Dr. Houston St 0.11 3 40 4 4 3 TH T T T R L,R L,R Y George Bush Dr. Fairview Ave 0.06 3 40 4 4 2 TH S L Y

46
46
Cross street 1 Cross street 2 Distance1
(Miles)
Type of IS (legs)
Speed limit
(mph)
Number of lanes2
Movement3Traffic signal (T)
( or Stop sign (S)) Exclusive lane4
Channelized island Street
LightingA B C D A B C D A B C D AC BC BD AD
George Bush Dr. Montclair Ave 0.09 3 40 4 4 2 TH S L Y George Bush Dr. Highlands St 0.06 3 40 4 4 2 TH S L Y George Bush Dr. Wellborn Rd 0.16 4 40 4 4 4 4 TH T T T T L,R L L L,R Y Y George Bush Dr. Marion Pugh Dr. 0.08 3 45 4 4 2 TH S L L,R Y George Bush Dr. Olson Blvd 0.09 4 45 4 4 2 4 TH T T T T L L Y George Bush Dr. Penberthy Rd 0.32 3 45 4 4 2 TH S R Y George Bush Dr. Barbara Bush Rd 0.33 3 45 4 4 2 TH S L R L,R Y Y Y George Bush Dr. Harvey Mitchell pkwy 0.43 4 45 4 2 4 4 R T T T T R, L R, L R, L Y Y Y
Harvey Mitchell pkwy F&B Rd 1.65 4 60 4 4 2 2 TH T T T T L L Y Harvey Mitchell pkwy Turkey Creek Rd. 0.37 3 60 4 4 2 TH S Harvey Mitchell pkwy Gabbard Rd. 0.3 3 60 4 4 2 TH S Y Harvey Mitchell pkwy Finewood Dr 0.08 3 60 4 4 2 TH S Harvey Mitchell pkwy Rockwood 0.06 3 60 4 4 2 TH S Harvey Mitchell pkwy Streamside way 0.16 3 60 4 4 2 TH S Harvey Mitchell pkwy Labrisa Dr 0.12 3 60 4 4 2 TH S Y Harvey Mitchell pkwy W Villa Maria Rd 0.4 4 55 4 4 4 4 TH T T T T R, L R, L R, L L,R Y Harvey Mitchell pkwy Western Oake Ct 0.12 3 55 4 4 2 TH S Harvey Mitchell pkwy Verde Dr 0.13 4 55 4 4 2 2 TH S R, L Harvey Mitchell pkwy W Bronze ln 0.19 4 55 4 4 2 2 TH T T S S R, L L Y Harvey Mitchell pkwy Rock Hollow Lp 0.24 3 55 4 4 2 TH S Harvey Mitchell pkwy Creek Cr 0.19 3 55 4 4 2 TH S Harvey Mitchell pkwy Leonard Rd 0.31 4 55 4 4 2 2 L T T T T L L Y
Leonard Rd Chick Ln 0.97 3 55 2 2 2 TH S Leonard Rd Charlotte Ln 0.31 3 55 2 2 2 TH S Leonard Rd Linda Ln 0.7 3 55 2 2 2 TH S Leonard Rd Jones Rd 0.22 3 55 2 2 2 TH S Leonard Rd Higgs 0.33 3 55 2 2 2 TH S Leonard Rd Mallard Dr 0.08 3 55 2 2 2 TH S Leonard Rd Beth Ln 0.13 3 55 2 2 2 TH S Leonard Rd Meg Ln 0.04 3 55 2 2 2 TH S Leonard Rd SH 47 0.17 4 55 4 4 2 2 R S S
SH 47 SH 47 Crossover 0.7 3 65 4 4 2 TH S L L SH 47 Silver Hill Rd 0.52 3 65 4 4 2 TH S L L SH 47 Silver Hill Rd 0.28 3 65 4 4 2 TH S L L SH 47 Goodson Bend Rd 0.96 4 65 4 4 2 2 TH S S L L SH 47 Fifth Street 0.24 4 65 4 4 2 2 L S S L L R

47
47
Note 1. Distance with the previous intersection (mile) 2. Number of lanes for each direction (A, B, C, and D)
3. Movements: L (left-turn), R (right-turn), and TH (through) 4. Exclusive lanes for each direction - L (left-turn exclusive lane)
- R (right-turn exclusive lane)
D
B
C
A
Vehicle approaching direction