Technical Monograph: Transportation Planning for the ...
70
VOLUME II Appendixes Technical Monograph: Transportation Planning for the Philadelphia–Harrisburg “Keystone” Railroad Corridor Federal Railroad Administration United States Department of Transportation March 2004
Transcript of Technical Monograph: Transportation Planning for the ...

VOLUME II Appendixes
Technical Monograph: Transportation Planning for the Philadelphia–Harrisburg “Keystone” Railroad Corridor
Federal Railroad Administration United States Department of Transportation March 2004

Disclaimer: This document is disseminated under the sponsorship of the Department of Transportation solely in the interest of information exchange. The United States Government assumes no liability for the contents or use thereof, nor does it express any opinion whatsoever on the merit or desirability of the project(s) described herein. The United States Government does not endorse products or manufacturers. Any trade or manufacturers' names appear herein solely because they are considered essential to the object of this report.
Note: In an effort to better inform the public, this document contains references to a number of Internet web sites. Web site locations change rapidly and, while every effort has been made to verify the accuracy of these references, they may prove to be invalid in the future. Should an FRA document prove difficult to find, readers should access the FRA web site (www.fra.dot.gov) and search by the document’s title or subject.

1. Report No. FRA/RDV-04/05.II
2. Government Accession No. 3. Recipient's Catalog No.
4. Title and Subtitle 5. Report Date March 2004 Technical Monograph: Transportation Planning for the
Philadelphia–Harrisburg “Keystone” Railroad Corridor⎯Volume II: Appendixes
6. Performing Organization Code
7. Authors: For the engineering contractor: Michael C. Holowaty, Project Manager For the sponsoring agency: Richard U. Cogswell and Neil E. Moyer
8. Performing Organization Report No.
9. Performing Organization Name and Address 10. Work Unit No. (TRAIS)
11. Contract or Grant No.
Engineering Contractor: Parsons Transportation Group Sponsoring Agency (see below)
DTFR53-94-A-00060 (Task 204) 12. Sponsoring Agency Name and Address 13. Type of Report or Period Covered
Technical monograph on transportation planning
U.S. Department of Transportation Federal Railroad Administration Office of Railroad Development 1120 Vermont Avenue N.W., Mail Stop 20 Washington, DC 20590 14. Sponsoring Agency Code
See (1) Report No. 15. Supplemental Notes
16. Abstract Should the Commonwealth of Pennsylvania desire to upgrade the railroad corridor between Philadelphia and Harrisburg for improved passenger service that meets a specific travel time goal, a number of infrastructure improvements would be needed. This monograph enumerates, describes, and costs a set of improvements that could, in combination, support a trip time goal of 90 minutes between Philadelphia (Suburban Station) and Harrisburg. The operational implications of such a service are discussed. This monograph may be of technical assistance to other States that are contemplating similar rail passenger service projects.
17. Key Words 18. Distribution Statement Railroad corridors, transportation planning, rail passenger service, high-speed rail, Keystone Corridor
This document is freely available through the FRA’s web site, www.fra.dot.gov. A limited printing will be available from the Sponsoring Agency at the address shown.
19. Security Classification (of the report)
20. Security Classification (of this page)
21. No of Pages 22. Price
Unclassified Unclassified Vol. I: 106 Vol. II: 76
See (18) Distribution Statement

TABLE OF CONTENTS
Appendix A Ownership, Operating Rights, and Agreements
Appendix B Curve Analysis, Philadelphia to Harrisburg; Speed Analysis of Curves and Civil Impacts
Appendix C Operations Analysis to Support Project Goals
Appendix D Track Charts (Existing and Contemplated 2015 Track Configuration)
Appendix E Assumed Train Schedules⎯2015
NOTE: Volume I of this Technical Monograph contains the Executive Summary and Main Report.

APPENDIX AOWNERSHIP, OPERATING RIGHTS
AND AGREEMENTS
INTRODUCTION
The following summary of ownership and operating rights and agreements is forinformation purposes only. It covers the portion of the Amtrak system referred to as the“Main Line-Philadelphia to Harrisburg” from Philadelphia (Zoo Interlocking) to theDivision Post at Harrisburg (MP 105.2), where the line becomes the Main Line ofNorfolk Southern’s Harrisburg Division. It also includes the 36th St. Connectionbetween Penn Interlocking, at 30th St. Station and Zoo Interlocking. The summary isnot intended to establish the legal effects of the various agreements or the rights of theparties thereto. The summaries of the agreements do not necessarily include all of thepoints covered by the agreements.
SUMMARY OF OWNERSHIP AND OPERATING RIGHTS
Ownership
The portion of the NEC from Philadelphia to Harrisburg is wholly owned by Amtrak. Itwas conveyed to the Consolidated Rail Corporation (Conrail/CR) on April 1, 1976 by theU.S. Railway Administration (USRA) as part of the Final System Plan (FSP) resolutionof the disposition of the operating assets of the bankrupt railroads of the Northeast.One month later it was transferred to Amtrak along with the rest of NEC. One of theobjectives of the FSP was the preservation of intercity passenger service andcommuter rail service on the NEC.
Operating Rights
Commuter Service. The Southeastern Pennsylvania Transportation Authority(SEPTA) has operating rights for commuter service. Operating rights extend westerlyfrom Philadelphia to Cork Interlocking, but revenue service is prohibited west ofParkesburg, the last stop in Chester County, by agreement between SEPTA andPennDOT. With Philadelphia as its hub of operations, SEPTA has similar rights overthe main stem of Amtrak's NEC.
A-2
Freight Service. The railroad properties of the bankrupt Northeast railroads werecombined to form Conrail under the FSP on April 1, 1976. Conrail conveyed thoseportions of the NEC under its control to Amtrak pursuant to an Agreement of Purchasedated March 31, 1976, and retained the rights to operate over the NEC under the 1986amended agreement, which replaced the Freight Service Agreement of April 1, 1976. Norfolk Southern assumed these rights as of the effective date of its acquisition ofConrail, June 1, 1999.
Delaware & Hudson/CP Rail has operating rights over a segment of Amtrak'sHarrisburg Line from the Division Post (Property line), MP 105.2, at Harris Interlocking(MP 104.8), west of Harrisburg station, to Roy Interlocking (MP 94.3), the junction withthe NS Royalton Branch. This can be used, in connection with the Enola and PortRoad Branches, as an alternate route to Perryville.
Operating Control
Under the FSP, Amtrak was given full operational control of the Harrisburg Line, withresponsibility for all signaling, power distribution, dispatching, and maintenance. This iscurrently defined in the Second Amended and Restated NEC Freight OperatingAgreement, dated 10/01/86, which also provides for the operation of Norfolk Southernfreight service.
OPERATING AGREEMENTS
Southeastern Pennsylvania Transportation Authority (SEPTA) 12/23/82 Harrisburg Line Access And Services Agreement
Provides for SEPTA access and operation, with no termination date, overthree NEC segments as follows: C between Marcus Hook and Arsenal (including SEPTA Media Line
trains, which use Arsenal);C between Zoo and Trenton; and C between Zoo and Paoli (including SEPTA Manayunk Branch trains
operating between 30th St. Station and Overbrook).SEPTA pays monthly fees for use of NEC and traction power, includingpower from the NEC.
1/1/87 Lease Agreement
Provides for the lease of certain stations on lines owned by Amtrak toSEPTA, including 20 stations on the Harrisburg Line. The lease includesall stations from Overbrook to Downingtown, with the exception of Paoli. It

A-3
provides lease of the premises, including “... station buildings [and relatedequipment], platforms, passenger tunnels and overhead ... walkways,[designated] parking, and necessary access and appurtenances ... directlyutilized by SEPTA...”. SEPTA has the option to include Coatesville andParkesburg.
1/31/90 Letter agreement to “... permit SEPTA access as far west as CorkInterlocking (MP 68.1) on the Harrisburg Line except that the SEPTAtrains shall not be operated in revenue service west of Parkesburg.” Thisagreement is still in effect, however, SEPTA service has been cut back toDowningtown, and trains are turned at Thorn.
Norfolk Southern (NS)
10/01/86 Freight Operating Agreement (Second Amended and Restated)
Covers NS operating rights on the NEC. Key items:
C Freight Service Easement: Rights granted to CR under the FSP tooperate freight services on the NEC.
C Has been extended to apply to NS following the acquisition ofConrail rights in this territory.
C Operations: Amtrak has total operating control on NEC includingdispatching, transportation supervision, and maintenance of way.
C Added Facilities: NS has the right, at its expense, to require Amtrakto improve or add to NEC properties, provided there is no resultantinterference with commuter and intercity service.
C Compensation: NS is to pay Amtrak a specified per-car mile fee,which amount is to be adjusted annually. There is to be no qualityof performance payment for NS's NEC freight service.
The following sidebar agreements have been extended to apply to Norfolk Southern:
05/31/89 Amendment to 10/01/86 Agreement - clarifies definition of hazardoussubstances transported by CR on NEC and CR liabilities andresponsibilities.
04/25/80 Agreement for the Installation and Connection of Private Sidetracks forCR Service - defines the procedure and responsibilities of the parties withregard to installing sidetracks on NEC.

1The Norfolk Southern Harrisburg Line passes through Zoo, which is owned by Amtrak. A flat fee is paid
because only a short distance is traveled.
A-4
05/06/83 Amendment to 04/25/80 Sidetrack Agreement - provides Amtrak withoption to remove or cause to be removed any sidetrack which has been indisuse for a period of 12 months.
01/08/90 Letter Agreement for Switch Maintenance Fee - CR shall pay an annualswitch maintenance fee to Amtrak on any sidetrack which has handled sixor less loaded cars in a calendar year.
Delaware & Hudson (CP Rail)
2/1/91 Agreement Between National Railroad Passenger Corporation(Amtrak) and D & H Corporation for Freight Operations OverAmtrak Lines in the Vicinity of Harrisburg, Pennsylvania and ...[other locations not on the Harrisburg Line]
This agreement allows D&H to use an alternate route through theHarrisburg/Enola area en route from Allentown to Potomac Yard. Trainsgoing through Harrisburg instead of Enola can be routed over the Amtrakline instead of the CR Royalton Branch between Harris and RoyInterlockings.
Key items:
C Passenger trains have priority over freight.C Fees are based on per car or locomotive mile, except at Zoo,
where a flat rate per car of locomotive is charged.1 C Term - Twenty-five (25) years.

APPENDIX BCURVE ANALYSIS, PHILADELPHIA TO HARRISBURG;
SPEED ANALYSIS OF CURVES AND CIVIL IMPACTS
Recent simulations and analyses of future intercity, commuter, and freight operatingrequirements have concluded that significant track changes are required to achieve triptime goals, improve the reliability of intercity and commuter operations, increasecapacity, and provide improved operating flexibility. These needs would be satisfied byreconfiguring major terminals and interlockings, removing existing crossovers andturnouts, and installing new (mostly higher speed) turnouts and crossovers toimplement desired alignment and configuration changes. Revised interlocking layoutsalso will be required to optimize train operations entering and leaving the additionaltracks, and passing sidings that also have been recommended. The number ofinterlockings that will be modified and the new interlockings that are recommended aresignificant. Details of recommended programs are contained in the body of the report. The proposed track configurations are illustrated in Appendix E. The interlockingchanges that have been recommended are summarized in the body of the report.
Track curvature imposes the most severe constraint on trip time. Consequently,realigning or changing the physical characteristics of existing curves is a primary meansof reducing trip times included in this program. Several types of fixed-plantimprovements can minimize the constraints to speed associated with curves:
• increasing superelevation to the maximum allowable for a particular trackalignment;
• changing horizontal and vertical alignment, either within the existing right-of-way,or by acquiring land outside the existing right-of-way;
• increasing the amount of unbalanced superelevation used to calculate speedsthrough curves to minimize track shifts; and
• modifying spirals (the length of track that provides a smooth transition from level,tangent track to curved, superelevated track) by eliminating superelevation runoffonto the adjacent tangent sections.
The rationale for the realignments recommended in this program is summarized in thisappendix.
OBJECTIVE
The results of a speed analysis of curves, and the civil impacts associated with

B-2
realigning them for the Keystone Corridor segment of the Northeast Corridor (betweenPhiladelphia and Harrisburg) was performed by Parsons Transportation Group. Theresults of those analyses are summarized in the following subsection.
The goal of the Plan is to reduce the trip time between Philadelphia and Harrisburg toless than 90 minutes. There are several changes to the methods of operation, to thefacilities, and to the equipment that can contribute to the overall goal.
One of these changes is to increase the speed of the trains. Increasing the speed mayrequire one or all of the following:
! more powerful or additional locomotives;! coaches that can provide comfort at greater unbalanced speeds, tilt vehicles will
be needed for unbalanced superelevation greater than 5 inches;! tracks and track beds that can withstand the energies transferred at higher
speed (including greater imbalance); and! alignments that can accommodate the greater speeds without exceeding
acceptable limits for:- actual superelevation, - unbalanced superelevation, - lateral acceleration to the passenger- spiral lengths limited by:
. rate of change of change of actual superelevation or twist,
. rate of change of change of lateral acceleration to the passenger orjerk.
The objective of this analysis was to propose realignments to the existing curves so thatproposed speeds can be reached and to identify civil impacts caused by the proposedrealignments. The results of the analysis were used to develop a project estimate forrealigning curves. The methodology employed to perform the analysis and the resultsof the analysis are presented in this subsection.
CRITERIA AND SCOPE
Criteria
The criteria utilized in the performance of this analyses were as follows.
Maximum actual superelevation should not exceed 6 inches. Actual superelevationwas chosen in increments commensurate with the runoff rates specified by Amtrak andspeed.
Maximum unbalanced superelevation should not exceed 5 inches; this assumes theuse of conventional, non-tilt equipment.

B-3
Maximum lateral acceleration parallel to the floorboards should not exceed 0.15 g.
For conventional coach equipment at 6 inches of unbalanced superelevation the rollangle should be 2.87 degrees and lateral acceleration parallel to floorboards should be0.15 g.
All actual superelevation should be introduced and removed over the entire length ofthe spiral; actual superelevation should not be introduced and removed on the adjacenttangents.
Maximum jerk rate through the spiral should be 0.04 g per sec.
Maximum track twist rate (introduction and removal rate of actual superelevation)through existing spirals for speeds less than, and equal to 90 miles per hour, should be3/8-inch in 31 feet. For speeds greater than 90 miles the maximum twist rate throughexisting spirals should be 1/4" in 31 feet.
Track twist rates for alignments specified by Amtrak at proposed speed:
• speeds from 0 to 50 miles per hour, 1/2-inch per 31 feet; • speeds from 51 to 70 miles per hour, 3/8-inch per 31 feet; and• speeds from 71 to 125 miles per hour, 1/4-inch per 31 feet.
Scope
The curves to be considered in the analysis were those located between Philadelphia30th Street Station and Harrisburg Station. Studies recently performed for PaDOTproposed maximum speeds for individual curves. These were speeds were used asinitial speed goals, but were modified as necessary to reflect the iterative analysisprocess subsequently defined. Maximum speed sought was 110 mph.
Presently maximum speed for passenger trains in the corridor is 90 mph. Maximumauthorized speeds vary by location and are specified in the Amtrak EmployeesTimetable. The analysis was based for the most part on data for Track 1; where datawas unavailable Track 3 data was used.
One product of the analysis was the conclusion that, with a limited number ofexceptions, each curve on the corridor had to be modified to some degree - usuallyboth spiral length or superelevation changed. For each curve the highest speeds thatcan be reached without realignment or adjustment to the actual superelevation on eachof the existing curves, while satisfying safety and comfort criteria, were calculated. Aniterative process was then followed to identify the maximum speed attainable (in fivemph increments) on each curve. Changes to superelevation and spiral length weredetermined.

1Assuming maximum actual superelevation of six inches and maximum unbalancedsuperelevation of five inches.
B-4
The analysis indicates that the speed improvements can be attained in many instancesby merely surfacing and aligning the track as part of a normal maintenance cycle.
The study did not identify specific curves that should have their degree of curvaturedecreased to enable speeds to be increased. Curves whose degree of curvature is 1.1degree or more would not support speeds of 110 mph or more1, and therefore would becandidates for further detailed analysis in subsequent studies. Curves to be modifiedshould be selected on the basis of their cost effectiveness - the cost per minute savedas the result of the modification. The analysis will require that Train PerformanceCalculation (TPC) runs be made to determine the time savings as the result of eachcurve modification. The cost of each modification also will have to be estimated, and bydividing the cost by the time for all curve modifications a cost effective listing could bedeveloped, which would assist the planner in evaluating which improvements should befunded.
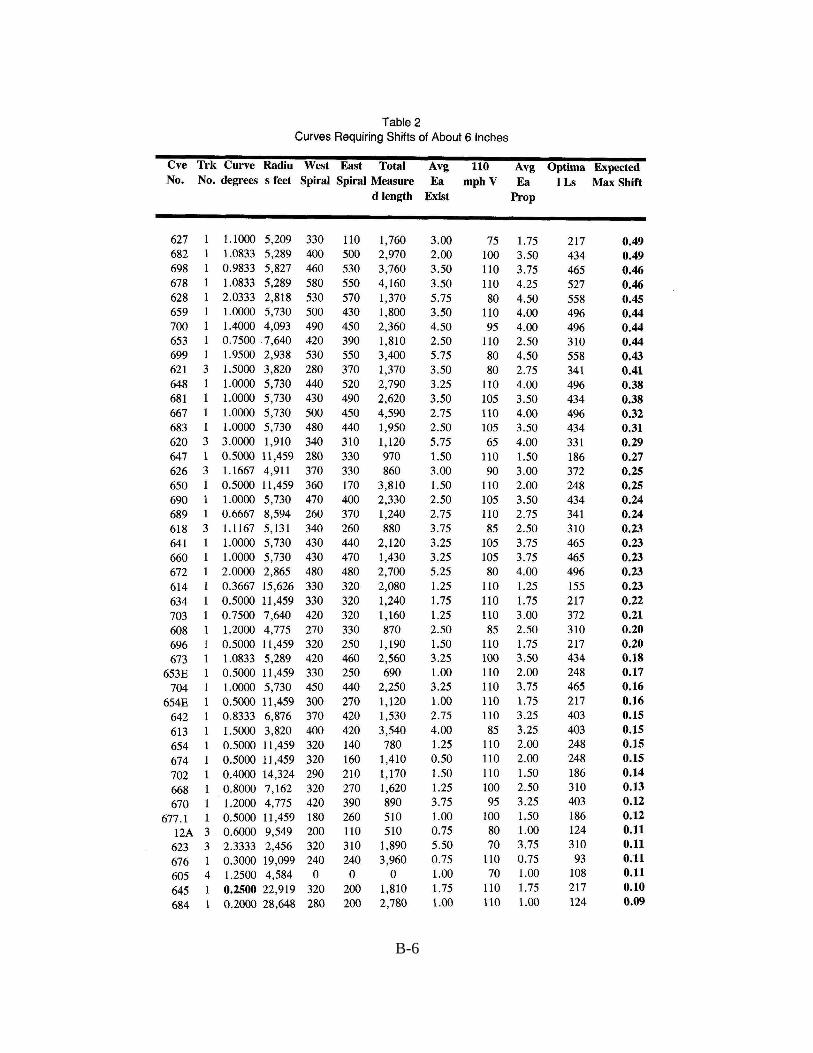
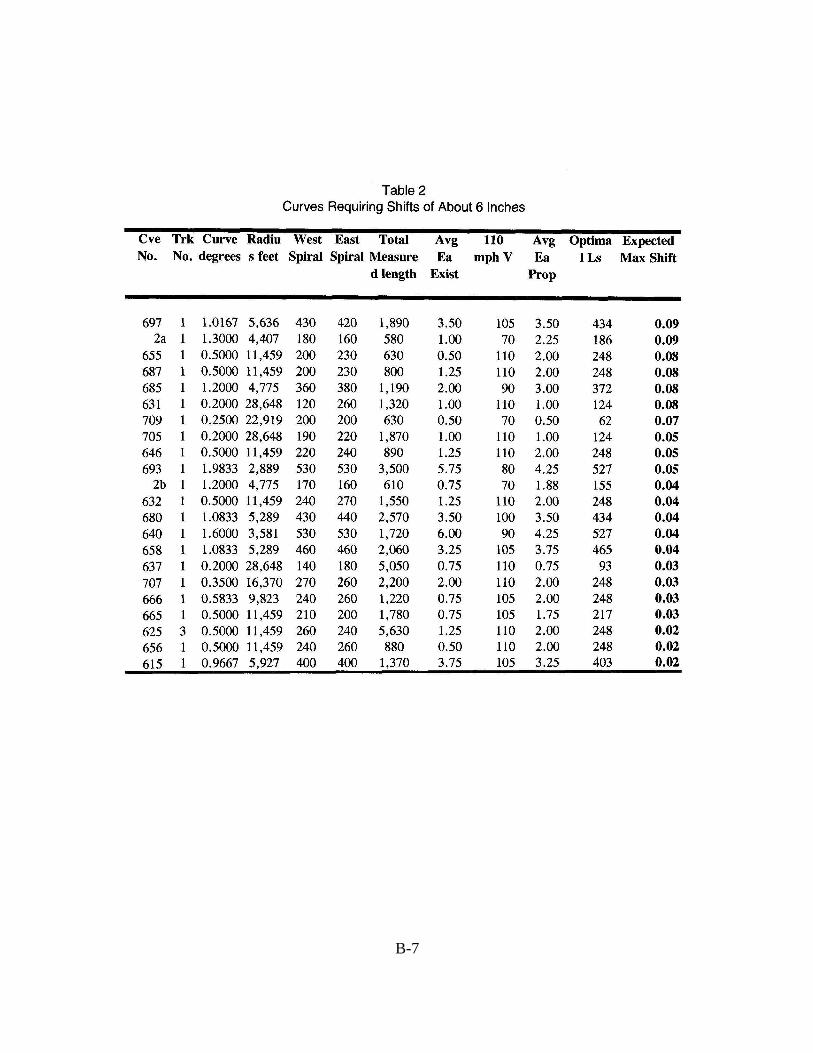
A second product was the calculation of the highest speeds that can be reached withrealignment to improve spiral lengths and with adjustment to the actual superelevation,while satisfying safety and comfort criteria. The result of the analysis was a list ofproposed realignments to reach the proposed speeds. In addition to safety and comfortcriteria the proposed realignments will comply with standard Amtrak field maintenancepractices. No required shifts in excess of three-feet. Curves requiring shifts between 6inches and 3 feet are shown in Table 1. Curves requiring shifts of about 6 inches areshown in Table 2.
Actual bridge impacts will need to be confirmed on a bridge-by-bridge basis. Wherethere are no undergrade bridges and the shifts are less than 6 inches, the realignmentscan be performed with regular maintenance procedures, and will not result in significantadditional civil costs. Curves that have turnouts to industrial spurs within their lengthhave not been identified, but need to be; since turnouts will limit the actualsuperelevation and the speed in the curve. In these cases the realignment will be moresignificant resulting in increased costs.
The analysis technique (a spreadsheet) made it easier to answer "what-if?" questions,such as, how much will the proposed speed be reduced if the realignment shift wasreduced so as not to impact bridge B? Or, how much additional shift would be requiredto increase the proposed speed on curve A?

B-5
B-6
B-7

2Cogo, short for coordinate geometry, is a technique used to verify the mathematicalfeasibility of a concept.
3The Northeast Corridor Transportation Plan, New York City to Boston, Volume 2,Appendix I, July 1995.
B-8
The analysis technique resulted in an estimate that is considered accurate to plus andminus 0.1-foot for simple spiraled curves, provided that the radius (degree of curvature)was not changed or the spirals were not changed by a significantly unequal amount. For compound curves the analysis technique is not reliable. For these morechallenging realignments dummy cogos should be run to determine the shifts. Adummy cogo2 is a cogo that properly uses all of the geometric elements (degree ofcurvature, spiral length, and intersection angle) of the alignment but the coordinates arenot associated to any specific location. A dummy cogo previously was performed on atwo centered compound curve on the New Haven Line between New Rochelle, NY andNew Haven, CT, which was judged to be an extreme case3. From this cogo analysis itwas judged that the maximum predicted shift will not be exceeded throughout the curve. However, the general characteristics of the shifting shown for compound curves shouldnot be relied upon. The eight compound curves in the Keystone Corridor would requiremuch more detailed investigation than was possible in this study, if the contemplatedimprovements are undertaken.
METHODOLOGY
Soft Realignments
There are two types of alignment changes: soft and hard. Soft alignment changes arechanges in unbalanced superelevation, lateral acceleration to the passenger, and jerkthat do not require physical changes. Therefore, there would be no cost associatedwith obtaining desired the speeds. These realignments would assume that the existingtrack twist (rate of introduction of superelevation) is acceptable. However, the presentanalysis did not identify any soft realignments between Philadelphia and Harrisburg.
Hard Realignments
Hard alignment changes are changes to actual superelevation, degree of curvature,and/or spiral lengths. Hard changes result in a physical change to the track, and whencertain thresholds are reached, hard changes will impact adjacent or supportingfacilities, such as, overhead bridges, undergrade bridges, signal towers, catenarytowers, station platforms, etc.

B-9
Actual Superelevation on Tangent, Maximum Twist, etc. To meet comfortstandards it was not considered acceptable to extend actual superelevation or tracktwist on to the tangents. Introduction and removal of actual superelevation should belinear, and should occur over the length of the spiral. As curve improvements areimplemented occurrences of superelevation on tangents should be eliminated.
Shifts and Impacts
Right of way is generally not considered a factor unless the shift is very large and inthose cases right of way would have been considered separately. The shifts identifiedin this study were not considered sufficient to require right-of-way acquisition. Ingeneral, the impacts of track shifts on overhead and undergrade bridges are of greatestconcern, as is a determination whether the change can be made as part of a routinetrack maintenance surfacing operation.
Although each bridge located on the body of a curve ultimately will have to beindividually evaluated to determine the impact of the assumed track shift, for theseanalyses it was generally assumed that if a specific shift exceeded the followings limits,the bridge would be impacted: ! open deck bridges with no additional improvement work proposed--any shift or
change in superelevation;! open deck bridges with through girders, or through deck girders scheduled for tie
replacement--6 inches;! open deck bridges with deck girders scheduled for tie replacement--1-foot;! open deck bridges scheduled for conversion to ballasted deck--2 feet;! ballasted bridges--2 feet; and! overhead bridges--3 feet.
Bridges requiring replacement should be designed to accommodate the proposedalignment changes.
It also has been assumed that realignments that require shifts of 6 inches, and less,would be accomplished through regular maintenance practices and procedures. If theshift exceeds 6 inches, the track shifting cannot be done as part of maintenance andwill require an independently scheduled effort.
Analysis Guidelines, Assumptions and Techniques
The analysis process utilized to analyze speeds and curves, and evaluate impacts onstructures is subsequently described. The following are the guidelines, assumptions,and techniques for doing the analysis.

B-10
Degree of Curvature, Radius
The radius and degree of curvature were not changed.
Actual Superelevation
For curves whose superelevation is proposed to be changed, superelevation has beenassumed to be implemented in increments in accordance with the way superelevation isintroduced in the spiral by railroad maintenance personnel.
Unbalanced Superelevation
Unbalanced superelevation was computed from the following equation.
Eu = 0.0007 * Dc * V2 - Ea
where Eu is unbalanced superelevation in inches Ea is actual superelevation in inches Dc is degree of curvature in decimal degreesV is speed in miles per hour.
In accordance with previous agreed assumptions, unbalanced superelevation waslimited to a maximum of 5 inches.
Lateral Acceleration Parallel to the Vehicle's Floor boards
When unbalanced superelevation occurs, passengers are subjected to a steady statelateral acceleration. This acceleration is the component of centripetal acceleration thatis parallel to the floor boards of the vehicle. The calculation for this component takesinto account the floor board rotation due to actual superelevation and the roll of the carbody as it's suspension responds to the centripetal lateral acceleration. The lateralacceleration is computed from the following equation.
AL = {[(Ea + Eu) / G * COS(THETA - PHI * Eu / 6)] - SIN(THETA - PHI * Eu / 6)} * g
where, AL is lateral acceleration parallel to floor boards in gTHETA is the angle due to the actual superelevation = ARCSIN(Ea /G)G = distance between rail head centers = 60 inchesPHI is the vehicle roll angle per 6 inches of unbalanced superelevation = 2.87degrees per 6 inches of Eu.
The PHI value of 2.87 was derived from conventional coach data provided on page 21of the report for the FRA entitled Railroad Passenger Ride Safety, revised April 1989.

B-11
Conventional non-tilting equipment has to be considered since either tilting or non-tiltingequipment ultimately may be used. The tests reported indicated that both the LRCCoach (non-banking, with tilt capability cut out) and the Amfleet Coach reached 0.15 gof steady state lateral acceleration at 6 inches of unbalanced superelevation. Bysubstituting these values into the above equation a PHI value of 2.87 is foundcalculated all values of actual superelevation up to 6 inches.
For prior projects, review of previous research and consultation with the FRA lead to therecommendation that 0.15 g should be the lateral acceleration limit. This analysesperformed assumed that 0.15 g to be the lateral acceleration limit. Vehicle test dataindicates that 0.15 g will be reached at 6 inches of unbalanced superelevation,therefore as long as unbalanced superelevation is limited to 5 inches, the lateralacceleration limit of 0.15 g will not be exceeded.
The PHI value is based upon available data for conventional non-tilting equipment. It isunlikely that new, non-tilting equipment will have a larger PHI coefficient, however, itmight have a smaller value. A smaller PHI value would result in smaller lateralaccelerations (good for passenger comfort) and in shorter comfort spiral lengths thatwould be based on a maximum jerk rate (jerk rate and comfort spiral are discussed inthe following subsection). Consequently, spirals established based on the PHI value of2.87 will be longer than necessary if the new non-tilting equipment has a smaller PHI. Therefore, the construction impacts resulting from shifts determined by the PHI valueestablished for this report will be conservative.
The Comfort Spiral, Jerk, and Jolt
The comfort spiral transitions the passenger through a change in lateral acceleration(unbalanced superelevation) at a comfortable rate. Assuming that a vehicle's speed isconstant, while traversing a spiral, unbalanced superelevation (lateral acceleration)changes linearly as the passenger travels along the spiral. This is because: degree ofcurvature changes linearly along a spiral; actual superelevation is introduced linearlyalong the spiral; and vehicle roll is linearly related to lateral acceleration. The change inlateral acceleration is referred to as jerk, with units of g per sec.
The jerk is computed by dividing the change in lateral acceleration (which is found byusing the above equation and the change in unbalanced superelevation) by the time ittakes for the passenger to travel over the spiral. The time is found by dividing the spirallength by the vehicle speed, with appropriate adjustments for units.
After a jerk rate has been established for a project, the minimum comfort spiral lengthcan be computed by dividing the change in lateral acceleration by the jerk rate, andmultiplying the quotient by the vehicle speed:

B-12
Ls = AL / J * V = AL / 0.04 * 88 / 60 * V = 36.67 * AL * Vwhere, Ls is minimum comfort spiral length in feet
J is maximum jerk rate in g per secAL is found from the earlier equation as a function of
unbalanced superelevation.
AREA recommends 0.03 g per sec as a maximum jerk rate, when conditions permit. But where the cost of the realignment of existing tracks will be excessive the AREArecommends that the jerk rate should not exceed 0.04 g per sec. For this analysis ajerk rate of 0.04 g per sec for non-tilt train equipment was assumed.
The Railroad Passenger Ride Safety report, cited above, lists the lateral accelerationand jerk limits for several railroads. Jerk limits range from 0.03 to 0.1 g per sec. It isgenerally true that when a railroad accepts a higher jerk rate, it accepts a lower lateralacceleration. This is consistent with the observation reported in the same report thatpeople are able to tolerate larger jolts when they are in a lower steady state lateralacceleration environment.
A jolt is also a rate of change of lateral acceleration per second, but it is considered asan occurrence that occurs in 1 second. A jolt is usually a response to a trackirregularity. When jolts exceed 0.25 g per sec it is usually a sign that, for that speed,the track needs adjustment. The jerk through a spiral usually occurs over severalseconds and, therefore, is not considered a jolt.
Usually back and forth car body rolling occurs when a track irregularity is encountered. The more violent the rolling the greater the jolt. When the jolt is measured as a lateralacceleration parallel to the floor boards, the position of the accelerometer affects themagnitude of the reading. In a double deck car, for the same track irregularity, apassenger on the lower level near the roll center of the car body will feel a smaller joltthan a passenger on the upper level.
The Railroad Passenger Ride Safety report also indicates that the researchers did notfind any evidence that jerk is a comfort concern. This suggests that the comfort spiralcould be shortened until the jerk is 0.25 g per sec. The problem with this approach isthat the track has to be maintained in perfect condition. Any track irregularity wouldresult in a total change in lateral acceleration that exceeds 0.25 g per sec.
The SNCF was found to have the highest limits, 0.15 g and 0.10 g per sec. Sincecomfort is a subjective feeling of the passenger, the SNCF may be recognizing that theFrench have a higher threshold to discomfort, or that they may be willing to tolerate ahigher percentage of the passengers to be uncomfortable. Or, and perhaps more likely,SNCF has made a commitment to high quality track with tight maintenance tolerancesfor their high speed lines. (The British and American comfort criteria were established

B-13
at comfort limits where 50 percent of the passengers will be satisfied. The Japanesedesire to have 90 percent of the passengers satisfied.)
Track Twist
If the track twist, the rate of introduction or removal of superelevation, is too large,safety is impaired. When computing the maximum allowable speed for the existingalignment, the analysis performed verified that the ratio of the existing spiral length toactual superelevation was equal to, or greater than, 62 for speeds below, and including,90 miles per hour. For speeds above 90 miles per hour, the ratio would be equal to, orgreater than, 83.
When the maximum allowable speed did not reach the proposed speed the spirals werelengthened and the actual superelevation adjusted, as necessary, to maximize thespeed. A third alternative, decreasing the degree of curvature and adjusting spirallengths and superelevation was not utilized in this study. Where these alignmentchanges were required the spiral lengths were changed to satisfy the appropriate actualsuperelevation runoff rate assumed for the Keystone Corridor. The new spirals alsowere checked for jerk. The actual superelevation was adjusted until the jerk criteriawas satisfied. The following are the runoff rate criteria specified for by Amtrak:
Speed Range, miles per hour Runoff per 31' 0 to 50 1/2"51 to 70 3/8"71 to 125 1/4"
Track Shifts
For this analysis, shifts between the existing and the proposed alignments werecomputed at 2 points: near each of the curve spiral points. A third possible point, nearthe mid-point of the curve was not calculated. The shifts near the curve spiral pointswere estimated as the difference between the spiral offsets, the "p" distance, for theproposed and existing spirals. At the curve's mid-point the difference in the externaldistances for the proposed and existing alignment would have been estimated to be theamount of shift required.
The estimated shifts were checked for an earlier NEC study by running several dummycogos using typical alignment curve data, and calculating offsets. A range ofintersection angles, radii, spiral lengths, and differential spiral lengths, when the existingspirals are unequal, were tested. For simple, spiral curves it was found that theestimated shifts were within 0.1 feet and that they were usually on the conservativeside, i.e., 0.1-foot larger than actual. If the proposed alignment has a differentintersection angle or a significantly different radius, the estimated shifts become lessaccurate.

B-14
Compound Curves
Compound curves (a combination of two or more curves connected by transitionspirals) added another level of complexity to the analysis. Except for the followingmodifications, the method used to estimate the amount of shift was basically the sameas for simple curves. The following labeling was used:
Existing Compound CurveA-spiral length between tangent and longer radius curveB-longer radius curveC-combining spiral lengthD-shorter radius curveE-spiral length between tangent and shorter radius curve
Proposed Compound CurvePA-spiral length between tangent and longer radius curvePB-longer radius curvePC-combining spiral lengthPD-shorter radius curvePE-spiral length between tangent and shorter radius curve.
Each curve in the compound curve was analyzed separately. For the first curve thefollowing curve elements were used:
ExistingA-spiral lengthB-curve radiusE-C-spiral length
ProposedPA-spiral lengthPB-curve radiusPE-PC-spiral length.
For the second curve the following curve elements were used:
ExistingA+C-spiral lengthD-curve radiusE-spiral length
ProposedPA+PC-spiral lengthPD-curve radiusPE-spiral length.

B-15
From initial checks it was found that the external distance is very dependent upon theintersection angle, but that the difference in external distances is not very sensitive tothe intersection angle. Therefore, using data from track geometry car graphs providedby Amtrak, it was assumed to be sufficient to divide the total intersection angle in thesame proportion as the curve lengths.
Dummy COGO checks indicated that the largest shift found using the estimatingmethod is similar to the largest found with the dummy COGO but the location of thepeak shift may not be correctly represented. To check for impacts at specific locationsdummy COGO should be used.
Basis for Existing Curve Data
As with any analysis, the results of the curve analyses performed were only as good asthe quality of the available existing data. The best source of data is good mapping orsurveyed data points of the existing tracks. Description of an alignment by degree ofcurvature is incomplete, it is similar to describing a line by its slope. The description ofa curve is not complete until the Y intercept is known. Stringline data and trackgeometry car data also are not ideal sources of data. The degree of curvature is neveruniform, always varying. The result is that data elements assumed to describe thealignment may vary greatly from the actual configuration. The variation cannot bedetermined without mapping or surveyed data points.
The existing data sources used to develop information for the analyses performed wereas follows:
• Amtrak track geometry car charts;• earlier work performed by various consultants for PaDOT; and• track charts.
The track charts were used for general orientation, but not to define spiral lengths,curvature, etc. The previous work efforts was used for background information only;data on proposed curve speeds and previous recommendations were obtained from thereports developed by those studies.
Data relative to the existing superelevation, spiral lengths, curve lengths, and degree ofcurvature were primarily developed from an analysis of recent Amtrak Track GeometryCar Charts, which were the result of a round-trip run of the corridor.
Although there were possible inconsistencies in the track geometry car data, it wasnecessary to use them in most instances. The data was valuable for providing thespiral lengths, which were measured directly from the charts of the individual simpleand compound curves.

B-16
The track geometry car chart data was reduced as follows. The track geometryproduces strip charts with fluttering lines. A visual average was made for the degree ofcurvature and actual superelevation. If the data was not uniform, the curve wassubdivided into a compound curve. The distance between uniform curvature datapoints was assumed to be spiral lengths. The distance between uniform actualsuperelevation data was not assumed to have any relationship to spiral length becauseactual superelevation may have been run off onto the tangents and into circular curves.
It was assumed that tracks 3 and 4 and sidings also will be shifted, as necessary, wheneither would be the inside track on a curve, and thus need to be shifted to maintainadequate clearance to the shifted inner tracks. The costs for this effort were included inthe project estimate, but it was assumed that the magnitude of shifts and, therefore,impacts on adjacent right-of-way structures would be driven by the changes required tothe high-speed tracks, tracks 2 and 3.
For each curve, the existing data from each source was tabulated. The source datawas compared, curve by curve, and data type by data type. Finally, one set of existingdata for each curve was selected and compiled. The compiled data is the mostconservative.
Speeds
The existing speeds were taken from the existing Amtrak Employees Timetables. Theproposed speeds were initially taken from the speeds proposed in earlier PaDOTstudies. Proposed speeds have been established in multiples of 5 miles per hour.
When determining the maximum allowable speed within the criteria the speed is shownto the nearest downward five miles per hour.
The Spreadsheet
To facilitate the analysis a spreadsheet was developed that allows for the existingspeed, degree of curvature, spiral and curve lengths, and superelevation to be input. The input was utilized to perform a variety of calculations. The spreadsheet determinedthe maximum speed obtainable given the existing alignment and actual superelevation,by only making soft changes, i.e., only changes to speed, unbalanced superelevation,and jerk. For this initial analysis no change to curvature, spiral lengths, and actualsuperelevation were made. In general it was assumed that the proposed curvature willremain unchanged.
For those instances when superelevation and spiral length changes were analyzed, thespreadsheet was used to determine the shifts associated with changes in actualsuperelevation and spiral lengths that would satisfy railroad and comfort criteria, andattain the proposed speeds. For the proposed alignment only the proposed speed andactual superelevation had to be input. Unbalanced superelevation, optimal spiral

4Whether superelevation ran onto either the tangent or circular curve was notdetermined.
B-17
lengths, and shifts were computed. "What if" questions about speeds were asked, andanswered, by using different proposed speeds and superelevation for input. Limitationsconcerning the shift calculations were discussed earlier.
ANALYSIS PROCESS
The following questions for each curve were answered and the analysis proceeded asindicated.
1 What is the existing?:a. Amtrak curve number b. speedc. degree of curvature or radiusd. actual superelevation4
e. spiral length(s)
The following were computed:f. maximum speed with existing superelevation, not taking spiral length into
consideration;g. unbalanced superelevation;h. steady state lateral acceleration to the passenger;i. minimum spiral length based on unbalanced superelevation;j. Minimum spiral length based on actual superelevation and railroad runoff
rate criteria;k. Optimal spiral length as the maximum of (i) and (j); andl. spiral offset(s) and external.
2. Since it was assumed that the superelevation does not run onto the tangent andcircular curve then the following were computed/developed:
a. steady state jerk(s) based on optimal spiral length (k).b. track twist(s), rate of change of change in actual superelevation, i.e., ratio of
existing spiral length to existing actual superelevation.c. list of bridges with no planned work.d. list of ballasted bridges.e. list of overhead bridges.f. list of bridges to be replaced.

B-18
3. Assuming that the superelevation does not run onto the tangent and circularcurve, then the following were computed/developed:
a. if 2.b. was greater than 83, the highest speed that does not exceed 5 inchesof unbalanced superelevation, nor exceed 0.15 g lateral acceleration, norexceed 0.04 g per sec jerk was determined. The existing radius,superelevation, and spiral length(s) were to remain unchanged. This speedwas considered as the highest speed attainable with no impacts, no shift,and not requiring an alignment change. Note: when the existing spiralswere of unequal length, the shorter spiral was used to compute jerk. Theanalysis proceeded to 4.
b. if 2.b. was greater than 62, the highest speed less than or equal to 90 milesper hour that does not exceed 5 inches of unbalanced superelevation, norexceed 0.15 g lateral acceleration, nor exceed 0.04 g per sec jerk wasdetermined. The existing radius, superelevation, and spiral length(s) wereassumed to remain unchanged. This speed was assumed to be the highestspeed with no impacts, no shift, and that did not require an alignmentchange. Note: when the existing spirals were of unequal length, the shorterspiral was used to compute jerk. The analysis proceeded to 4.
c. if 2.b was less than 62 a spiral length change was required. Thespreadsheet would report that an alignment change was required. Theanalysis would proceeded to 4.
4. Steps 1-3 were performed for all the curves, a curve list showing the highestspeed determined in 3.a. and 3.b was developed. The proposed speed for eachof these curves was listed. The curves whose highest speed met or exceededtheir proposed speed were highlighted. The list was entitled Highest Speeds forAll Curves without Alignment Changes. Proceed to 5.
5. For all curves that were not highlighted in 4 (i.e., those curves that will needalignment changes, and/or changes in superelevation, radius or spiral length-toachieve the proposed speed, without changing radius) increase actualsuperelevation in increments specified for the segment and speed, withoutexceeding 6 inches, until the proposed speed was reached without exceeding 5inches of unbalanced superelevation or exceeding 0.40 g/sec jerk rate. If theproposed speed could not be achieved without exceeding the above limitations,the speed was decreased in 5 mph increments until the limitations were notexceeded. Proceed to 6.
6. If 1.g (maximum speed with existing superelevation, not taking spiral length intoconsideration ) exceeded the speed calculated in step 5 by five or more mph thefollowing steps were followed -

B-19
1. maximum speed was increased in five mph increments;2. actual superelevation was increased in increments specified for the segment
and speed, without exceeding 6 inches, until neither 5 inches of unbalancedsuperelevation or exceeding 0.40 g/sec jerk rate were exceeded.
3. 6.1 and 6.2 were repeated until a further five mph increase would requiremore than 6 inches of superelevation or the 0.40 g/sec jerk rate would beexceeded.
4. Using the superelevation that was determined to be necessary to achieve themaximum feasible speed, the shortest spiral length that satisfied Amtrakcurve criteria and did not exceed the 0.04 g per sec jerk, was calculated. Spiral lengths were established as an integer multiple of either 31, 39, or 50feet, depending upon the speed. Shifts to achieve the proposed alignmentwere calculated.
5. The impact of the proposed shifts on each bridge were evaluated. If theshifts exceeded the followings limits the bridge was considered to beimpacted:
! open deck bridges with no planned work-any shift or change insuperelevation;
! open deck bridges with through girders or through deck girdersscheduled for tie replacement--6 inches;
! open deck bridges with deck girders scheduled for tie replacement--1-foot;
! open deck bridges scheduled for change to ballast--2 feet;! ballasted bridges--2 feet; and! overhead bridges--3 feet.
Bridges listed for replacement were assumed to not be impacted by alignmentchanges.
A list all of the curves that required alignment changes to achieve the proposed oroptimal speed was developed. It included: proposed speeds, curves requiring 6 inchesor less of shift, and curves requiring between 6 inches and 3 feet of shift.

Appendix COPERATIONS ANALYSIS TO SUPPORT PROJECT GOALS
INTRODUCTION
The results of the Train Performance Calculator simulations that were performed insupport of this supplement to the Transportation Plan are discussed in detail in thisAppendix. Results for intercity, commuter, and freight trains are presented. The abilityof the recommended improvements to support reliable, less than 90-minute intercity triptimes, also is evaluated.
ABILITY TO MEET PROJECT GOALS
As agreed upon at meetings involving all the railroads, FRA, and PennDOT, operationsanalyses to assess the impact of the proposed projects on rail operations, and to helpidentify other additional improvements that will benefit future operations wereperformed. The analyses performed were:
! The Train Performance Calculator model, which assesses the performance of asingle train over the route to measure trip time differences between the existingtrack configuration and the proposed configuration for a variety of train consists;and
! Manual analyses of existing and proposed 2015 schedules and operationalrequirements of high speed intercity and commuter trains to determine areas ofoperating conflicts and delays.
Train Performance Calculator Runs
A program of Train Performance Calculator (TPC) analyses was undertaken to evaluatethe efficacy of the recommended track configuration and alignment to satisfy therecommended goal of regularly scheduled, safe, and dependable rail passenger servicebetween Philadelphia and Harrisburg in less than 90 minutes. The results of theanalyses to date are summarized in this Appendix.
Conditions for Simulations of "Goal Trains"
Goal trains are those scheduled to meet the recommended, less than 90-minute, triptime between Philadelphia and Harrisburg. TPC simulations of goal trains on theexisting, and the upgraded, facility configurations were based upon the conditionsdescribed in the following subsections.

1A proposed station to provide rail access to the airport located east of Harrisburg, adjacent to the Keystone
Corridor.
C-2
"Baseline" TPC Runs. Baseline TPC runs were performed with a train consist of fourAmfleet cars powered by one F40PH diesel locomotive upon the existing facilityconfigurations, i.e., prior to any improvements being made. Trip times to 30th StreetStation were simulated. The Baseline conditions included:
! Existing Maximum Authorized Speeds (MASs); trains were limited to 90 miles perhour;
! Speed restrictions as shown on Amtrak’s employee timetables that were in effectin spring of 1997;
! Positive stops and Civil speed restrictions were not enforced by the signal systemin these simulations; and
! Six Intermediate stops - 1.0-minute dwell at Exton, Downingtown, Elizabethtown,and Harrisburg Airport1; and 2.0-minute dwell at Paoli and Lancaster.
! Several Train consists were evaluated:S four Amfleet cars powered by one F40PH diesel locomotive;S four Silverliner IV Electric Multiple Unit (EMU) vehicles;S two IC-3D Diesel Multiple Unit (DMU) vehicles ; andS four Amfleet cars powered by one AEM-7 locomotive.
TPC Runs - MAS Increased to 110 mph. Another set of TPC runs to determine theamount of time savings to be experienced after increasing MAS to 110 mph. Trip timesto 30th Street Station were simulated. The following conditions were used:
! MAS was increased to 110 mph; speeds on individual curves were calculatedusing a spreadsheet previously described in Appendix C.
! Speed restrictions due to track conditions were assumed to be removed as theresult of an intensive program to restore the line to a state of good repair. As inthe Baseline case, positive stops and curve speeds were not enforced.
! Improvements to spiral length and superelevation of selected curves, to optimizespeed for curves without changing curvature, were assumed.
! Six Intermediate stops - 1.0-minute dwell at Exton, Downingtown, Elizabethtown,and Harrisburg Airport; and 2.0-minute dwell at Paoli and Lancaster.
! Several Train consists were evaluated:S four Amfleet cars powered by one F40PH diesel locomotive;S four Silverliner IV Electric Multiple Unit (EMU) vehicles;S two IC-3D Diesel Multiple Unit (DMU) vehicles ;S four Amfleet cars powered by one AEM-7 locomotive; and

2A hypothetical train capable of operating at nine inches of unbalanced superelevation.
3At the time the TPC runs were made, data on Amtrak’ s proposed high-speed trainset was not available,
therefore the characteristics of a hypothetical trainset used in the 1995 analysis of New Haven to Boston
improvements was utilized.
4Only the generic tilt train was simulated at nine inches of unbalanced superelevation.
C-3
S one generic Amtrak tilt train.2,3
! Speeds were set assuming three levels of unbalanced superelevation - S 3 inches;S 5 inches; andS 9 inches4.
! Concrete ties were assumed to be installed in stretches of 110 mph operation andon curves where unbalanced superelevation would exceed 5 inches.
TPC Runs - Intermediate stops decreased to two. A third set of TPC runs todetermine the amount of time savings to be experienced from decreasing the number ofintermediate train stops to two after increasing MAS to 110 mph. Trip times to 30thStreet Station were simulated. The following conditions were used:
! MAS was increased to 110 mph; speeds on individual curves were calculatedusing a spreadsheet previously described in Appendix C.
! Speed restrictions due to track conditions were assumed to be removed as theresult of an intensive program to restore the line to a state of good repair. As inthe Baseline case, positive stops and curve speeds were not enforced.
! Improvements to spiral length and superelevation of selected curves, to optimizespeed for curves without changing curvature, were assumed.
! Two intermediate stops (2.0-minute dwell) at Paoli and Lancaster.! Several Train consists were evaluated:
S four Amfleet cars powered by one F40PH diesel locomotive;S four Silverliner IV Electric Multiple Unit (EMU) vehicles;S two IC-3D Diesel Multiple Unit (DMU) vehicles ;S four Amfleet cars powered by one AEM-7 locomotive; andS one generic Amtrak tilt train.
! Speeds were set assuming three levels of unbalanced superelevation - S 3 inches;S 5 inches; andS 9 inches.These all assume that selected curves would be upgraded to 6 inches of actualsuperelevation (identified as Ea on the tables).
! Concrete ties were assumed to be installed in stretches of 110 mph operation andon curves where unbalanced superelevation would exceed 5 inches.

C-4
TPC Simulations of increasing intermediate train stops to 14. A fourth set of TPCsimulations to evaluate the impact of increasing the number of intermediate train stopsto 14, after increasing MAS to 110 mph was performed. Trip times to 30th StreetStation were simulated. The following conditions were used:
! MAS was increased to 110 mph; speeds on individual curves were calculatedusing a spreadsheet previously described in Appendix C.
! Speed restrictions due to track conditions were assumed to be removed as theresult of an intensive program to restore the line to a state of good repair. As inthe baseline case, positive stops and curve speeds were not enforced.
! Improvements to spiral length and superelevation of selected curves, to optimizespeed for curves without changing curvature, were assumed.
! Fourteen intermediate stops - 1.0-minute dwell at Malvern, Exton, Whitford,Downingtown, Coatesville, Parkesburg, Leaman Place, Mount Joy, Elizabethtown,Middletown, and Harrisburg Airport; and 2.0-minute dwell at Ardmore, Paoli, andLancaster.
! Several Train consists were evaluated:S four Amfleet cars powered by one F40PH diesel locomotive;S four Silverliner IV Electric Multiple Unit (EMU) vehicles;S two IC-3D Diesel Multiple Unit (DMU) vehicles ;S four Amfleet cars powered by one AEM-7 locomotive; andS one generic Amtrak tilt train.
! Speeds were set assuming three levels of unbalanced superelevation - S 3 inches;S 5 inches; andS 9 inches.These all assume that selected curves would be upgraded to 6 inches of actualsuperelevation (identified as Ea on the tables).
! Concrete ties were assumed to be installed in stretches of 110 mph operation andon curves where unbalanced superelevation would exceed 5 inches.
! Although positive stops and curve speeds were not enforced, signal systemimprovements compatible with the recommended speeds were assumed.
The runs with one AEM-7 locomotive, the Diesel Multiple Unit consists beinginvestigated by PennDOT, and the generic Amtrak tilt train cars were made forcomparison purposes. The TPC runs illustrate the running times that could beexpected given the relevant performance and physical characteristics of these types ofrolling stock.
Conditions used in the TPC simulations, including MASs, speeds through curves, andunbalanced superelevation, are all a function of track structures, equipment structuralcapacity, and crashworthiness and represent the collective best judgment ofexperienced rail operators. Before high-speed operations are introduced, however,

C-5
many of these conditions will have to be analyzed in greater detail, and tested to ensurethe safety of the total system.
TPC Running Times and Schedule Times
TPC simulated running time is the best achievable time that may be expected of agiven train operated over a railroad line with given physical characteristics. The TPCtimes reported in Tables C-1 through C-10 are therefore the most optimistic runningtimes for each given train consist.
When train schedules are prepared using TPC simulated times as a basis for the trainrunning times, it is necessary to add an allowance for minor operating irregularities,which may be expected to occur on a daily basis. Several terms are used for thisallowance, the most common of which are "pad", "cushion time", or "slop". Adiscussion of the issue of the amount of pad that should be added to the TPC times isfound in a later subsection. The addition of this allowance to the TPC running time willenable trains to perform reliably on a day-to-day basis. The pad also will enable trainsto regain any lost time resulting from minor delays (i.e., temporary speed restrictions,diversions around maintenance work, etc.). Pad also provides for two additionalcomponents: the probability that not all of the configuration and alignmentimprovements incorporated into the model will prove physically feasible; and therealization that the model assumes that the train engineer operates the train in aconsistent and precise manner in response to speed changes.
Description of the Goal Train Output Tables
The results of the TPC simulations are contained in Tables C-1 through C-10. Thetables are organized to present the overall running times and time savings (comparedwith the Baseline TPC run) from Philadelphia to Harrisburg for the different trainconsists and facility configuration assumptions.
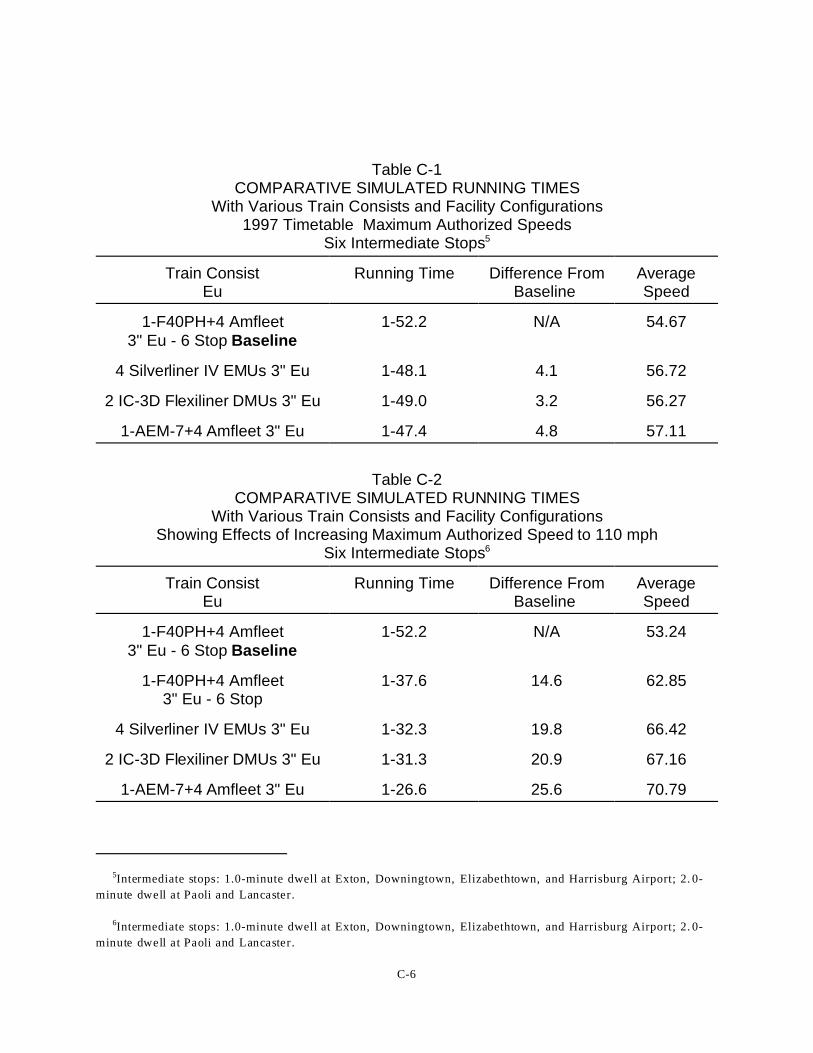
The running times and time savings to be achieved by various alternative train consistsoperating at 3 inches of unbalanced superelevation and present timetable speeds,before any facility improvements such as curve realignments are made are illustrated inTable C-1. The Baseline scenario is identified in the tables as the scenario with "1-F40PH + 4 Amfleet, 3" Eu, with 6 stops.
The running times and time savings to be achieved with 3 inches of unbalancedsuperelevation and an MAS of 110 are illustrated in Table C-2. The Baseline scenariois identified in the tables as the scenario with "1-F40PH + 4 Amfleet, 3" Eu, with 6stops.
5Intermediate stops: 1.0-minute dwell at Exton, Downingtown, Elizabethtown, and Harrisburg Airport; 2. 0-
minute dwell at Paoli and Lancaster.
6Intermediate stops: 1.0-minute dwell at Exton, Downingtown, Elizabethtown, and Harrisburg Airport; 2. 0-
minute dwell at Paoli and Lancaster.
C-6
Table C-1COMPARATIVE SIMULATED RUNNING TIMES
With Various Train Consists and Facility Configurations1997 Timetable Maximum Authorized Speeds
Six Intermediate Stops5
Train ConsistEu
Running Time Difference FromBaseline
AverageSpeed
1-F40PH+4 Amfleet3" Eu - 6 Stop Baseline
1-52.2 N/A 54.67
4 Silverliner IV EMUs 3" Eu 1-48.1 4.1 56.72
2 IC-3D Flexiliner DMUs 3" Eu 1-49.0 3.2 56.27
1-AEM-7+4 Amfleet 3" Eu 1-47.4 4.8 57.11
Table C-2COMPARATIVE SIMULATED RUNNING TIMES
With Various Train Consists and Facility ConfigurationsShowing Effects of Increasing Maximum Authorized Speed to 110 mph
Six Intermediate Stops6
Train ConsistEu
Running Time Difference FromBaseline
AverageSpeed
1-F40PH+4 Amfleet3" Eu - 6 Stop Baseline
1-52.2 N/A 53.24
1-F40PH+4 Amfleet3" Eu - 6 Stop
1-37.6 14.6 62.85
4 Silverliner IV EMUs 3" Eu 1-32.3 19.8 66.42
2 IC-3D Flexiliner DMUs 3" Eu 1-31.3 20.9 67.16
1-AEM-7+4 Amfleet 3" Eu 1-26.6 25.6 70.79

C-7
The six intermediate stop running times and time savings (also compared with theBaseline TPC run) resulting from improvements to curve geometry to permit operationat 110 mph and curve speeds computed for 5 inches of unbalanced superelevation areshown in Table C-3. In all cases, selected curves would have upgraded actualsuperelevation of 6 inches. These tables also illustrate the trip time savings incomparison with the Baseline scenario.
Table C-3COMPARATIVE SIMULATED RUNNING TIMES
With Various Train Consists and Facility ConfigurationsShowing Effects of Increasing Curve Unbalance (Eu) to 5 Inches
Maximum Authorized Speed of 110 mphSix Intermediate Stops (1.0-minute dwell at Exton, Downingtown, Elizabethtown, and
Harrisburg Airport; 2.0-minute dwell at Paoli and Lancaster)
Train ConsistEu
Running Time Difference FromBaseline
AverageSpeed
1-F40PH+4 Amfleet3" Eu - 6 Stop Baseline
1-52.2 N/A 53.24
1-F40PH+4 Amfleet 5" Eu 1-34.1 18.1 65.13
4 Silverliner IV EMUs 5" Eu 1-29.0 23.2 68.88
2 IC-3D Flexiliner DMUs 5" Eu 1-27.0 25.2 71.47
1-AEM-7+4 Amfleet 5" Eu 1-22.5 29.7 74.36
The impact of using the generic Amtrak tilt train at 9 inches of unbalancedsuperelevation, with six intermediate stops, is shown in Table C-4.
The running times and time savings to be achieved by decreasing the number of stopsto two, with 3 inches of unbalanced superelevation and an MAS of 110, are illustrated inTable C-5. The Baseline scenario is identified in the tables as the scenario with "1-F40PH + 4 Amfleet, 3" Eu, with 6 stops. The two intermediate stop running times andtime savings (also compared with the Baseline TPC run), resulting from improvementsto curve geometry to permit operation at 110 mph and curve speeds computed for 5inches of unbalanced superelevation are shown in Table C-6. In all cases, selectedcurves would have upgraded actual superelevation of 6 inches. These tables alsoillustrate the trip time savings in comparison with the Baseline scenario.

7Intermediate stops: 1.0-minute dwell at Exton, Downingtown, Elizabethtown, and Harrisburg Airport; 2. 0-
minute dwell at Paoli and Lancaster.
8Intermediate stops (2.0-minute dwell) at Paoli and Lancaster.
C-8
Table C-4COMPARATIVE SIMULATED RUNNING TIMES
With Various Train Consists and Facility ConfigurationsShowing Effects of Increasing Curve Unbalance (Eu) to 9 Inches
Maximum Authorized Speed of 110 mphSix Intermediate Stops7
Train ConsistEu
Running Time Difference FromBaseline
AverageSpeed
1-F40PH+4 Amfleet3" Eu - 6 Stop Baseline
1-52.2 N/A 53.24
Amtrak Generic Tilt Train 1-16.0 36.2 80.68
Table C-5COMPARATIVE SIMULATED RUNNING TIMES
With Various Train Consists and Facility ConfigurationsShowing Effects of Decreasing Number of Stops
Maximum Authorized Speed of 110 mphTwo Intermediate Stops8
Train ConsistEu
Running Time Difference FromBaseline
AverageSpeed
1-F40PH+4 Amfleet3" Eu - 6 Stop Baseline
1-52.2 N/A 53.24
1-F40PH+4 Amfleet 3" Eu 1-26.5 25.7 70.89
4 Silverliner IV EMUs 3" Eu 1-23.8 28.4 73.20
2 IC-3D Flexiliner DMUs 3" Eu 1-21.6 30.6 75.10
1-AEM-7+4 Amfleet 3" Eu 1-18.0 34.2 78.61

9Intermediate stops (2.0-minute dwell) at Paoli and Lancaster.
10Intermediate stops (2.0-minute dwell) at Paoli and Lancaster.
C-9
Table C-6COMPARATIVE SIMULATED RUNNING TIMES
With Various Train Consists and Facility ConfigurationsShowing Effects of Decreasing Number of Stops and Increasing Eu to 5"
Maximum Authorized Speed of 110 mphTwo Intermediate Stops9
Train ConsistEu
Running Time Difference FromBaseline
AverageSpeed
1-F40PH+4 Amfleet5" Eu - 6 Stop Baseline
1-52.2 N/A 53.24
1-F40PH+4 Amfleet 5" Eu 1-23.7 27.5 74.17
4 Silverliner IV EMUs 5" Eu 1-21.2 30.0 76.47
2 IC-3D Flexiliner DMUs 5" Eu 1-17.9 33.3 79.78
1-AEM-7+4 Amfleet 5" Eu 1-14.7 36.5 83.14
The impact of using the generic Amtrak tilt train at 9 inches of unbalancedsuperelevation, with two intermediate stops, is shown in Table C-7.
Table C-7COMPARATIVE SIMULATED RUNNING TIMES
With Various Train Consists and Facility ConfigurationsShowing Effects of Decreasing Number of Stops and Increasing Eu to 9 Inches
Maximum Authorized Speed of 110 mphTwo Intermediate Stops10
Train ConsistEu
Running Time Difference FromBaseline
AverageSpeed
1-F40PH+4 Amfleet3" Eu - 6 Stop Baseline
1-52.2 N/A 53.24
Amtrak Generic Tilt Train 1-07.0 43.2 91.51
The running times and time savings to be achieved by increasing the number of stopsto fourteen, with 3 inches of unbalanced superelevation and an MAS of 110, are

11Intermediate stops 1.0-minute dwell at Malvern, Exton, Whitford, Downingtown, C oatesville, Parkesburg,
Leaman Place, Mount Joy, E lizabethtown, Middletown, and Har risburg Airport; 2. 0-minute dwell at Ardm ore,
Paoli, and Lancaster.
C-10
illustrated in Table C-8. The Baseline scenario is identified in the tables as the scenariowith "1-F40PH + 4 Amfleet, 3" Eu, with 6 stops. The fourteen intermediate stop runningtimes and time savings (also compared with the Baseline TPC run), resulting fromimprovements to curve geometry to permit operation at 110 mph and curve speedscomputed for 5 inches of unbalanced superelevation are shown in Table C-9. In allcases, selected curves would have upgraded actual superelevation of 6 inches. Thesetables also illustrate the trip time savings in comparison with the Baseline scenario.
Table C-8COMPARATIVE SIMULATED RUNNING TIMES
With Various Train Consists and Facility ConfigurationsShowing Effects of Increasing Number of Stops
Maximum Authorized Speed of 110 mphFourteen Intermediate Stops11
Train ConsistEu
Running Time Difference FromBaseline
AverageSpeed
1-F40PH+4 Amfleet3" Eu - 6 Stop Baseline
1-52.2 N/A 53.24
1-F40PH+4 Amfleet 3" Eu 1-57.7 (2.0) 52.11
4 Silverliner IV EMUs 3" Eu 1-48.3 7.4 56.61
2 IC-3D Flexiliner DMUs 3" Eu 1-49.16.6
56.23
1-AEM-7+4 Amfleet 3" Eu 1-42.9 12.8 59.61
The impact of using the generic Amtrak tilt train at 9 inches of unbalancedsuperelevation, with fourteen intermediate stops, is shown in Table C-10.
TPC Results for the Goal Trains
The running times and time savings resulting from the facility configurationimprovements and train stop assumptions are discussed in the following paragraphs.

12Intermediate stops 1.0-minute dwell at Malvern, Exton, Whitford, Downingtown, C oatesville, Parkesburg,
Leaman Place, Mount Joy, E lizabethtown, Middletown, and Har risburg Airport; 2. 0-minute dwell at Ardm ore,
Paoli, and Lancaster.
13Intermediate stops 1.0-minute dwell at Malvern, Exton, Whitford, Downingtown, C oatesville, Parkesburg,
Leaman Place, Mount Joy, E lizabethtown, Middletown, and Har risburg Airport; 2. 0-minute dwell at Ardm ore,
Paoli, and Lancaster.
C-11
Table C-9COMPARATIVE SIMULATED RUNNING TIMES
With Various Train Consists and Facility ConfigurationsShowing Effects of Increasing Number of Stops and Increasing Eu to 5"
Maximum Authorized Speed of 110 mphFourteen Intermediate Stops12
Train ConsistEu
Running Time Difference FromBaseline
AverageSpeed
1-F40PH+4 Amfleet3" Eu - 6 Stop Baseline
1-52.2 N/A 53.24
1-F40PH+4 Amfleet5" Eu
1-55.0 0.7 53.33
4 Silverliner IV EMUs 5" Eu 1-45.5 10.2 58.12
2 IC-3D Flexiliner DMUs 5" Eu 1-45.7 9.9 58.00
1-AEM-7+4 Amfleet 5" Eu 1-39.1 16.6 61.87
Table C-10COMPARATIVE SIMULATED RUNNING TIMES
With Various Train Consists and Facility ConfigurationsShowing Effects of Decreasing Number of Stops and Increasing Eu to 9 Inches
Maximum Authorized Speed of 110 mphFourteen Intermediate Stops13
Train ConsistEu
Running Time Difference FromBaseline
AverageSpeed
1-F40PH+4 Amfleet3" Eu - 6 Stop Baseline
1-52.2 N/A 53.24
Amtrak Generic Tilt Train 1-32.2 22.8 66.00

C-12
Comparative simulated running times with various train consists showing effects ofvarious train consists operating at 3 inches of unbalanced superelevation (Eu), thepresent (spring 1997) maximum authorized speeds, and six intermediate stops areshown in Table C-1. No changes in track configuration or state of good repairimprovements were assumed for these runs. The impact of varying train consistsranges from 3 to 5 minutes. The utilization of diesel rather than electric locomotivesincreases trip times by 4.8 minutes. The use of DMUs rather than diesel locomotivesreduces the TPC time by three minutes.
Compared to the timetable scheduled performance of two hours and five minutes forseven-stop Keystone trains, the six-stop Baseline TPC run represents more than aneleven percent pad (discussed in subsequent subsections).
Estimates of the time savings that may be achieved by increasing MAS to 110 mph,implementing an intensive state of good repair program, selectively increasing actualcurve superelevation to 6 inches, selectively increasing spiral length on curves to satisfydesign and comfort criteria as discussed in Appendix C are provided in Table C-2. Alsoincluded are track capacity improvements to improve trip time reliability and trip timeimprovements at Lancaster, Harrisburg Station, and the east of Overbrook Interlocking. These improvements provide total savings ranging from about 14.6 minutes to 25.5minutes, compared with the Baseline. A diesel-hauled consist could potentially operateon a six-stop 1-hour 45-minute schedule. An AEM-7 (electric) hauled consist couldachieve a 95-minute schedule between 30th Street and Harrisburg. Silverliners orDMUs could support a 1-hour 40-minute operation.
Estimates of the time savings that may be achieved by increasing MAS to 110 mph,implementing an intensive state of good repair program, increasing Eu to 5 inches,selectively increasing actual curve superelevation to 6 inches, selectively increasingspiral length on curves to satisfy design and comfort criteria as discussed in Appendix Care provided in Table C-3. Also included are track capacity improvements to improvetrip time reliability, and trip time improvements at Lancaster, Harrisburg Station, and tothe east of Overbrook Interlocking. These improvements provide total savings rangingfrom about 18.0 minutes to 29.7 minutes, compared with the Baseline. A diesel-hauledconsist could potentially operate on a six-stop, 1-hour 40-minute schedule. An AEM-7(electric) hauled consist could achieve an 90-minute schedule between 30th Street andHarrisburg. Silverliners and DMUs both could satisfactorily support a 95-minuteoperation.
The incremental effect of operating a generic tilt train at nine inches of unbalancedsuperelevation is illustrated in Table C-4. The generic trainset produced savings of36.2 minutes and would should reliably operate a one-hour 25-minute schedulebetween Philadelphia and Harrisburg.

C-13
The incremental effect of decreasing the number of stops to two at three inches ofunbalanced superelevation is illustrated in Table C-5. The improvement produces totalsavings ranging from about 23.7 minutes to 32.2 minutes, compared with the Baseline. Incremental savings from the six intermediate stop 3" Eu option range from 6.7 minutes(for the AEM-7 Option) to 9.1 minutes (for the diesel option). Minimizing the number oftimes the diesel must accelerate from a station stop has a significant impact on itoperating performance.
The incremental effect of decreasing the number of stops to two at five inches ofunbalanced superelevation is illustrated in Table C-6. The improvement produces totalsavings ranging from about 27.5 minutes to 36.4 minutes, compared with the Baseline90 mph case. Incremental savings from the six intermediate stop 5" Eu option rangefrom 6.7 minutes (for the AEM-7 Option) to 9.5 minutes (for the diesel option). Minimizing the number of times the AEM-7 must accelerate from a station stop has aless significant impact on it’s operating performance than decreasing the number ofdiesel-hauled stops.
The incremental effect of decreasing the number of stops to two at nine inches ofunbalanced superelevation is illustrated in Table C-7. The improvement produces totalsavings of 43.2 minutes, compared with the Baseline. The incremental savings fromthe six intermediate stop option is 7.0 minutes. Minimizing the number of times thegeneric tilt train must accelerate from a station stop has about the same impact on it’soperating performance as decreasing the number of AEM-7-hauled stops.
The incremental effect of increasing the number of stops to 14 at 3 inches ofunbalanced superelevation is illustrated in Table C-8. The increase in stops producestotal savings ranging from about a loss of 2.0 minutes, for the diesel-hauled consist, toa savings of 12.8 minutes for the AEM-7 hauled consist, compared with the Baseline. Incremental time lost from the comparative six intermediate stop option range from 12.4minutes (for the Silverliner 3" Option) to 16.6 minutes (for the diesel 3" Option). Increasing the number of times the diesel-hauled consist must accelerate from a stationstop has a more significant impact on it’s operating performance than increasing thenumber of electric-hauled stops.
The incremental effect of increasing the number of stops to 14 at 5 inches ofunbalanced superelevation is illustrated in Table C-9. The increase in stops producestotal savings ranging from about 0.7 minutes for the diesel-hauled consist to 16.6minutes for the AEM-7 hauled consist, compared with the Baseline. Incremental timelost from the comparative six intermediate stop option range from 12.9 minutes (for theSilverliner 5" Option) to 17.3 minutes (for the diesel 5" Option).
The incremental effect of increasing the number of stops to 14, at nine inches ofunbalanced superelevation, is illustrated in Table C-10. The increase in stops producestotal savings of 22.8 minutes, compared with the Baseline. The incremental time loss

C-14
from the comparable 9-inch six intermediate stop option is 13.4 minutes. Minimizingthe number of times the generic tilt train must accelerate from a station stop has aboutthe same impact on it’s operating performance as decreasing the number of AEM-7-hauled stops.
Speed Profile Graphs
Speed profile graphs comparing the performance of various train consists, train speeds,number of stops, and MAS are provided as Figures C-1 and C-2. The 29.7 minutessaved by having an electrified train operation, in place of a diesel operation, betweenPhiladelphia and Harrisburg, restoring the track structure, signals, etc. to a state-of-good repair, and upgrading selected curves to six inches of actual superelevation isshown in Figure C-1. The effect of reducing the number of stops, with electrifiedoperation, from six to two is shown in Figure C-2.
The vertical scale on each figure has been modified from the normal display in whichspeed on the vertical scale is uniform to a proportional scale in which the area underthe curve created by the plot is equal to time. Since the scale between 0 and 25 mphwould dominate the display and the distance traveled at speeds in that range is minimalthat speed range is normally not plotted. When two TPC runs are plotted on the samechart, the revised scale enables the enhanced effect of trip improvements at lowerspeeds to be illustrated.
Performance of Commuter Trains
Budgetary limitations limited TPC runs to intercity trains.


C-17
2015 TRAFFIC LEVEL OPERATIONS
MONTE CARLOTM Simulations
When several services coexist on the same trackage, conflicts are likely. Delays fromthese conflicts can jeopardize the reliability of all services; therefore, a methodology isrequired that can measure the impact of these conflicts. With services as interrelatedas those on the NEC and the Richmond Line, simulation of the entire interrelatedsystem is the only valid methodology. That is not the case with the Keystone Corridor. The lack of intercity freight operations and the integrated nature of the intercity-commuter scheduling process lessens the need for a computerized analysis of trainoperations. Consequently, the MONTE CARLOTM simulation package was not appliedto the Harrisburg corridor.
Therefore, in addition to the TPC model, manual analysis techniques were used toevaluate the effectiveness of individual projects initially considered necessary toachieve the trip time and reliability goals.
The purpose of the manual analyses was to provide information for each locationanalyzed as to:
! where delays potentially could occur;! possible schedule changes to eliminate conflicts; and! facility changes that could potentially eliminate conflicts.
Operations Evaluation Methodology
The starting point for the analyses were the existing corridor-wide facilities and the Year2015 schedules, which were obtained from each entity (SEPTA, PennDOT, CR, andAmtrak).
The analyses attempted to determine for varying levels of service, at different times ofthe day whether commuter and intercity trains could be routed on regularly assignedtracks. If normal track assignments appeared infeasible, the potential for using othertracks to avoid delays was evaluated. If it appeared that, because of conflicting moves,no track was available, or if an interlocking was blocked, trains were assumed to waituntil a route was available. The severity of potential operating problems wasestablished based experience of the personnel performing the analyses.
Terminal operations in Philadelphia and Harrisburg were not simulated as part of thestudy. It was expected that the terminals could accommodate the projected trafficlevels. The capacity of the terminals cannot be ignored, and the interface of intercity

C-18
and commuter passenger operations at the station and in the vicinity of the station are apotential problem ultimately that should be addressed by rail planners.
2015 Operations Between Philadelphia and Harrisburg
Achieving the running time goals under theoretical circumstances does not ensuremeeting them in actual operations. The numerous interfaces with commuter trainsbetween Philadelphia and Atglen affect trip times.
At several locations, where there was potential for delays, the first step was todetermine if operating options could alleviate the perceived difficulties. When thisprocess did not identify viable solutions, it was concluded that the delays could beminimized through configuration modifications. The recommended changes aredocumented in the body of this supplemental report.
TRIP TIME FINDINGS
Scheduling Pad
Background. In planning train schedules or analyzing the results of TPC runs, pad isdefined as the difference between a published schedule time and the best achievabletime between two terminals. When planning schedules, the amount of pad allows trainsto incur small increments of delay en route and still maintain a high probability of on-time performance. When analyzing the results of TPC runs, two additional componentsof pad are considered: the expectation that not all of the configuration and alignmentimprovements incorporated into the model will prove physically feasible; and theexpectation that the model assumes that every train engineer operates the train in aconsistent and precise manner in response to required speed changes. Theseassumptions usually are too optimistic.
Traditionally, the most common way of adding pad to the schedule is to concentratemuch of it toward the end of the run. The reason for this technique is that pad, which isdistributed throughout a schedule and is consumed by waiting for scheduled departuretimes at intermediate stations, is unavailable to cover any delays that may occur towardthe end of a run. Since, traditionally, the on-time performance of a train is measured bythe time at the final terminal, many schedule makers and transportation supervisorsprefer to have the pad allocated toward the end of the run.
In scheduling high-performance trains on a route with heavy commuter traffic, it may bemore appropriate to distribute pad at the location(s) where delays are most likely tooccur.

C-19
Pad Considerations. The amount of pad to be provided depends upon the nature ofthe railroad being operated. Traditionally, a percentage of the TPC is allotted for pad. Realistic estimates of pad cannot be made until a facility and schedules have beendefined. Even then, determining the distribution of pad must be based on subjectiveevaluation and operating history.
Previous MONTE CARLOTM simulations for similar NEC studies have resulted in theconclusion that a pad in the range of 6 to 7 minutes, which represents 7-percent addedto the TPC time for intercity trains in this corridor would be justified.
Achievement of Planned Keystone Corridor Improvements and Impact upon Pad. The TPCs expected that the presently projected curve speeds will be achieved. Experience has indicated that not all of these planned improvements will provephysically feasible and not all of the anticipated savings will be achieved in the realworld. This is another reason why a pad of at least 7-percent is necessary during theplanning phase of a project.
Pad Recommendations. For planning purposes it is better to overestimate pad than tounderestimate it, unless doing so grossly distorts construction costs. Based on theFRA's previous analyses, a 6- to 7-minute (7-percent pad) is being used to determinewhether or not a reliable less than 90-minute time between Philadelphia and Harrisburgis achievable.
Trip Time Goal Status
The TPC simulations have clearly indicated that completion of an extensive state ofgood repair program, the performance characteristics of the intercity rolling stock, andthe amount of unbalanced superelevation, will be critical to achieving the trip time goalof less 90 minutes.
To determine whether a reliable intercity service of less 90 minutes can be operated,Table C-11 was prepared to summarize the overall running times for various alignmentand train consist options. The results are shown for speeds computed for the threedifferent unbalanced superelevation conditions and the 110 mph MAS option betweenPhiladelphia and Harrisburg that have been simulated. The table also shows theamount of pad available for each run.
Using the 6- to 7-minute (7-percent) pad recommendation mentioned in the previoussection, it is clear that only the six stop cases assuming electrified diesel-hauledoperation in which 5 and 9 inches of unbalanced superelevation were used resulted in arun time that provides the recommended pad.

C-20
Table C-11SIMULATED RUN TIMES
AND AVAILABLE PADCompared to 90-Minute Goal
Case SimulatedRun Time
Pad(minutes.)
Pad (% of TPCTime)
Baseline: 1-F40PH +4Amfleet,3" Eu - 6 stop
107.2 N/A N/A
110 mph/5" Eu/2 IC-3D/6 stops 87.0 3.0 3.4%
110 mph/3" Eu/1 AEM-7/6stops
86.6 3.4 3.9%
110 mph/3" Eu/1 F40PH/2stops
86.5 3.5 4.1%
110 mph/3" Eu/4 Silverliner IVEMUs/2 stop
83.8 6.2 7.5%
110 mph/5" Eu/1 F40PH/2stops
83.7 6.3 7.6%
110 mph/5" Eu/1 AEM-7/6stops
82.5 7.5 9.1%
110 mph/3" Eu/2 IC-3D/2 stops 81.6 7.4 10.2%
110 mph/3" Eu/AEM7/2 stops 78.0 12.0 15.4%
110 mph/5" Eu/2 IC-3D/2 stops 76.9 13.1 17.1%
110 mph/9" Eu/ Generic Tilttrain/6 stops
76.0 14.0 18.4%
110 mph/5" Eu/AEM7/2 stops 73.7 16.3 22.0%
110 mph/9" Eu/ Generic Tilttrain/2 stops
67.0 23.0 34.3%
Considering the above-mentioned uncertainties, and therefore applying the sevenpercent pad, only the electrified 110 mph six-stop options achieve the trip time goal ofless than 90 minutes. Use of a train with tilt capabilities operating at 9-inches ofunbalanced superelevation and a MAS of 110 mph, would enable a 6-stop 85-minute

C-21
schedule to be established, and might enable a limited number of 80-minute 6-stoptrains to be operated.
It does not appear that IC-3D consists would support a 6-stop, 90-minute service (at 5"Eu), however, 6-stop 95-minute would appear to be possible. A two-stop 85-minute IC-3D schedule would appear feasible. IC-3D diesel-powered trains would only beoperated between the lower level of 30th Street Station and Harrisburg. They would berestricted from operating into the underground Suburban Street Station.
It should be noted that a number of potential changes in the conditions upon which theTPC results are based might occur, which would further erode the amount of availablepad. For example:
! There may still be some question as to whether all of the curve modifications thatare assumed in the TPC runs are feasible, from an engineering standpoint;
! If a 110 mile-per-hour MAS cannot be achieved, there would be some increase inTPC running time;
! If an unbalanced superelevation lower than 5 inches must be used, the trip timewould suffer; and
! Adding station stops beyond six would increase running time.
It is believed that an on-time performance of at least 90 percent should be establishedas a goal for Keystone Corridor train services.
Track Capacity
Goal trains most likely could be integrated into today's corridor schedule throughschedule adjustments, with implementation of the state of good repair program, and theconstruction of the planned track and configuration improvements. However, given the2015 schedules provided by corridor users, there is insufficient capacity and operatingflexibility at certain station locations to accommodate all users during peak periods, ifthe recommended improvements at those locations are not implemented. TheOverbrook to Philadelphia segment improvements also must be implemented, if triptime and capacity goals are to be satisfied.
Insufficient capacity, resulting from lack of program implementation in these keylocations, can be handled in two ways: reducing train frequencies and lengtheningschedules to accommodate delay. Selection of either of these two options would bepolicy decisions, which would work against the project goals assumed for this study.

APPENDIX D TRACK CHARTS

D-2

D-3

D-4

D-5

APPENDIX E
ASSUMED TRAIN SCHEDULES⎯2015
Note: Sixteen pages of schedules follow. “DH” means “deadhead” or nonrevenue moves.

Assumed Train Schedules—2015
WESTBOUND
Train DH DH DH DH DHAmtk 601 Hbg Cmtr
Hbg Cmtr 7607 DH
Fra-Atg Fra-Th Fra-Th Fra-Th Fra-Atg 30h-500 HLan1 HLan3 Sub-Cyn Fra-Atg
MPNew York Penn Station30th Street Station LLSuburban Station 0.0 5:00 AM 5:40 AM30th Street Station UL 0.0 5:03 AMPowelton Yard 0.5Zoo-D1 1.4 5:08 AMZoo-JO 1.9 5:46 AMOverbrook 5.4Ardmore 8.5 ToBryn Mawr 10.1 CynwydPaoli 19.9 5:27 AMMalvern 21.6 5:30 AMFrazer Yard 23.9 4:57 AM 5:11 AM 5:28 AM 5:41 AM 5:43 AM 6:11 AMExton 27.5 5:36 AMWhitford 28.3 5:38 AMDowningtown 32.4 5:43 AMThorn 35.0 5:46 AM 6:03 AM 6:16 AMCoatesville 38.4 5:48 AMParksburg 44.2 5:53 AMAtglen 47.0 5:32 AM 6:18 AM 6:46 AMLeaman Place 55.6 6:03 AMLancaster 68.0 6:13 AM 6:15 AM 6:45 AMMt. Joy 80.1 6:22 AM 6:30 AM 7:00 AMElizabethtown 86.8 6:28 AM 6:38 AM 7:08 AMMiddletown 94.7 6:49 AM 7:19 AMH'burg Airport 97.0 6:38 AM 6:52 AM 7:22 AMHarrisburg 104.6 6:45 AM 7:00 AM 7:30 AM
EASTBOUND
Train 6612 514 516 Amtk 694 518 520 4206 9524 622
PowSub Th-Sub MalSub h30-500 CynSub Atg-Sub Bry-Sub MalSub Th-Sub CynSubMP
Harrisburg 104.6 5:00 AMH'burg Airport 97.0 5:08 AMMiddletown 94.7 Elizabethtown 86.8 5:17 AMMt. Joy 80.1 Lancaster 68.0 5:32 AMLeaman Place 55.6Atglen 47.0 5:45 AMParksburg 44.2 5:47 AMCoatesville 38.4 5:52 AMThorn 35.0 5:06 AM 5:55 AM 6:24 AMDowningtown 32.4 5:58 AM 6:00 AM 6:29 AMWhitford 28.3 6:05 AM 6:34 AMExton 27.5 6:04 AM 6:07 AM 6:36 AMFrazer Yard 23.9 5:40 AM 6:24 AMMalvern 21.6 5:24 AM 5:47 AM 6:13 AM 6:31 AM 6:42 AMPaoli 19.9 5:28 AM 5:51 AM 6:12 AM 6:17 AM 6:35 AM 6:46 AMBryn Mawr 10.1 From 5:48 AM 6:11 AM From 6:37 AM 6:45 AM 6:55 AM FromArdmore 8.5 Yard 5:52 AM 6:15 AM Cynwyd 6:49 AM CynwydOverbrook 5.4 6:00 AM 6:23 AM 6:57 AMZoo-JO 1.9 6:42 AM 7:19 AMZoo-D1 1.4 6:27 AMPowelton Yard 0.5 5:39 AM30th Street Station LL 0.030th Street Station UL 6:10 AM 6:33 AM 6:53 AM 7:07 AM 7:11 AM 7:20 AMSuburban Station 0.0 5:48 AM 6:15 AM 6:38 AM 6:35 AM 6:52 AM 6:58 AM 7:12 AM 7:16 AM 7:25 AM 7:29 AMNew York Penn Station
E-1
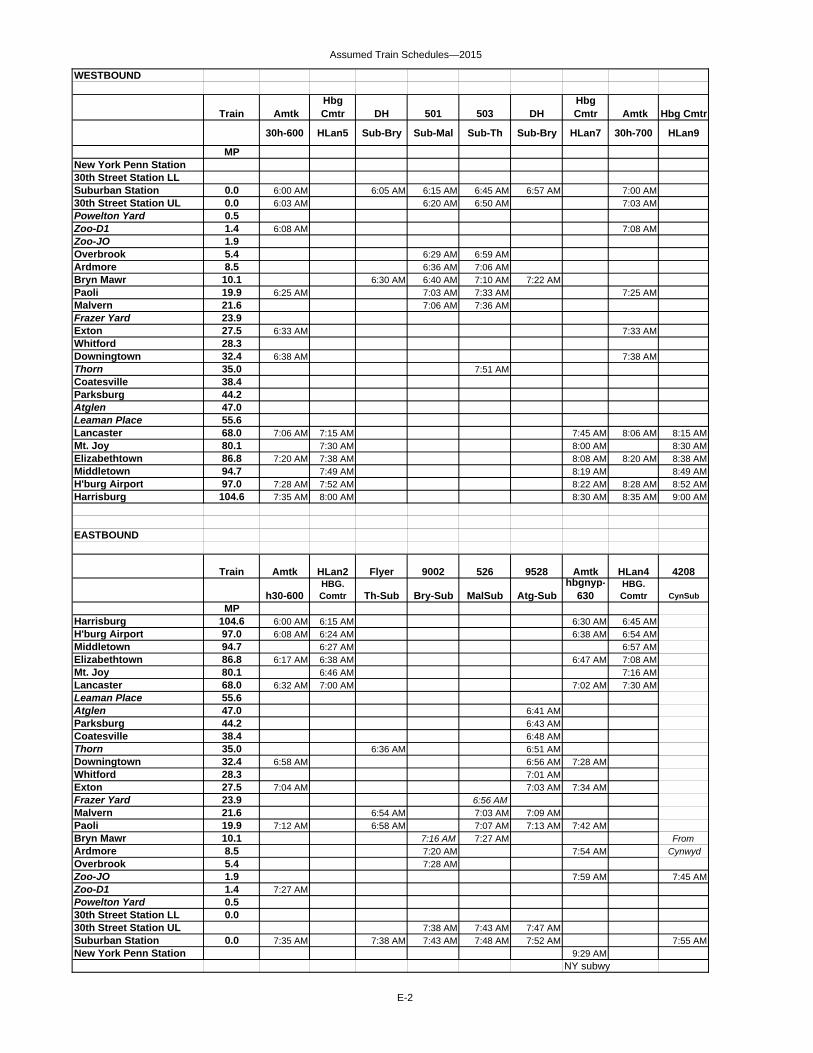
Assumed Train Schedules—2015
WESTBOUND
Train
MPNew York Penn Station30th Street Station LLSuburban Station 0.030th Street Station UL 0.0Powelton Yard 0.5Zoo-D1 1.4Zoo-JO 1.9Overbrook 5.4Ardmore 8.5Bryn Mawr 10.1Paoli 19.9Malvern 21.6Frazer Yard 23.9Exton 27.5Whitford 28.3Downingtown 32.4Thorn 35.0Coatesville 38.4Parksburg 44.2Atglen 47.0Leaman Place 55.6Lancaster 68.0Mt. Joy 80.1Elizabethtown 86.8Middletown 94.7H'burg Airport 97.0Harrisburg 104.6
EASTBOUND
Train
MPHarrisburg 104.6H'burg Airport 97.0Middletown 94.7Elizabethtown 86.8Mt. Joy 80.1Lancaster 68.0Leaman Place 55.6Atglen 47.0Parksburg 44.2Coatesville 38.4Thorn 35.0Downingtown 32.4Whitford 28.3Exton 27.5Frazer Yard 23.9Malvern 21.6Paoli 19.9Bryn Mawr 10.1Ardmore 8.5Overbrook 5.4Zoo-JO 1.9Zoo-D1 1.4Powelton Yard 0.530th Street Station LL 0.030th Street Station ULSuburban Station 0.0New York Penn Station
new new
AmtkHbg Cmtr DH 501 503 DH
Hbg Cmtr Amtk Hbg Cmtr
30h-600 HLan5 Sub-Bry Sub-Mal Sub-Th Sub-Bry HLan7 30h-700 HLan9
6:00 AM 6:05 AM 6:15 AM 6:45 AM 6:57 AM 7:00 AM6:03 AM 6:20 AM 6:50 AM 7:03 AM
6:08 AM 7:08 AM
6:29 AM 6:59 AM 6:36 AM 7:06 AM
6:30 AM 6:40 AM 7:10 AM 7:22 AM6:25 AM 7:03 AM 7:33 AM 7:25 AM
7:06 AM 7:36 AM
6:33 AM 7:33 AM
6:38 AM 7:38 AM7:51 AM
7:06 AM 7:15 AM 7:45 AM 8:06 AM 8:15 AM7:30 AM 8:00 AM 8:30 AM
7:20 AM 7:38 AM 8:08 AM 8:20 AM 8:38 AM 7:49 AM 8:19 AM 8:49 AM
7:28 AM 7:52 AM 8:22 AM 8:28 AM 8:52 AM7:35 AM 8:00 AM 8:30 AM 8:35 AM 9:00 AM
Amtk HLan2 Flyer 9002 526 9528 Amtk HLan4 4208
h30-600HBG. Comtr Th-Sub Bry-Sub MalSub Atg-Sub
hbgnyp-630
HBG. Comtr CynSub
6:00 AM 6:15 AM 6:30 AM 6:45 AM6:08 AM 6:24 AM 6:38 AM 6:54 AM
6:27 AM 6:57 AM6:17 AM 6:38 AM 6:47 AM 7:08 AM
6:46 AM 7:16 AM6:32 AM 7:00 AM 7:02 AM 7:30 AM
6:41 AM 6:43 AM 6:48 AM 6:36 AM 6:51 AM
6:58 AM 6:56 AM 7:28 AM7:01 AM
7:04 AM 7:03 AM 7:34 AM6:56 AM
6:54 AM 7:03 AM 7:09 AM7:12 AM 6:58 AM 7:07 AM 7:13 AM 7:42 AM
7:16 AM 7:27 AM From7:20 AM 7:54 AM Cynwyd7:28 AM
7:59 AM 7:45 AM7:27 AM
7:38 AM 7:43 AM 7:47 AM7:35 AM 7:38 AM 7:43 AM 7:48 AM 7:52 AM 7:55 AM
9:29 AMNY subwy
E-2

Assumed Train Schedules—2015
WESTBOUND
Train
MPNew York Penn Station30th Street Station LLSuburban Station 0.030th Street Station UL 0.0Powelton Yard 0.5Zoo-D1 1.4Zoo-JO 1.9Overbrook 5.4Ardmore 8.5Bryn Mawr 10.1Paoli 19.9Malvern 21.6Frazer Yard 23.9Exton 27.5Whitford 28.3Downingtown 32.4Thorn 35.0Coatesville 38.4Parksburg 44.2Atglen 47.0Leaman Place 55.6Lancaster 68.0Mt. Joy 80.1Elizabethtown 86.8Middletown 94.7H'burg Airport 97.0Harrisburg 104.6
EASTBOUND
Train
MPHarrisburg 104.6H'burg Airport 97.0Middletown 94.7Elizabethtown 86.8Mt. Joy 80.1Lancaster 68.0Leaman Place 55.6Atglen 47.0Parksburg 44.2Coatesville 38.4Thorn 35.0Downingtown 32.4Whitford 28.3Exton 27.5Frazer Yard 23.9Malvern 21.6Paoli 19.9Bryn Mawr 10.1Ardmore 8.5Overbrook 5.4Zoo-JO 1.9Zoo-D1 1.4Powelton Yard 0.530th Street Station LL 0.030th Street Station ULSuburban Station 0.0New York Penn Station
9691 DH4005 505 507 DH Hbg Cmtr 6613 509 615
Sub-Cyn Sub-Bry Sub-Th Sub-Th Sub-Bry HLan11 Sub-Pow Sub-Th Sub-Cyn
7:04 AM 7:12 AM 7:15 AM 7:28 AM 7:38 AM 7:41 AM 7:45 AM 7:50 AM7:20 AM 7:33 AM 7:50 AM
7:49 AM
7:10 AM To Yard 7:56 AM7:29 AM 7:42 AM 7:59 AM
To 7:36 AM 7:49 AM 8:06 AM To Cynwyd 7:37 AM 7:40 AM 7:53 AM 8:03 AM 8:10 AM Cynwyd
8:03 AM 8:16 AM 8:33 AM8:06 AM 8:19 AM 8:36 AM
8:24 AM
8:29 AM8:21 AM 8:34 AM 8:51 AM
8:45 AM9:00 AM9:08 AM9:19 AM9:22 AM9:30 AM
9004 9530 Flyer 7532 534 9626 9536 9538 9008
Bry-Sub MalSub Th-Sub Th-Sub Bry-Sub CynSub Mal-Sub Atg-Sub Bry-Sub
7:16 AM7:18 AM7:23 AM
7:06 AM 7:11 AM 7:26 AM7:16 AM 7:31 AM7:21 AM 7:36 AM7:23 AM 7:38 AM
7:13 AM7:20 AM 7:24 AM 7:29 AM 7:36 AM 7:44 AM7:24 AM 7:28 AM 7:33 AM 7:40 AM 7:48 AM
7:35 AM 7:44 AM 7:48 AM From 8:00 AM 8:10 AM7:39 AM 7:52 AM Cynwyd 8:14 AM7:47 AM 8:00 AM 8:22 AM
8:08 AM
7:57 AM 8:00 AM 8:07 AM 8:10 AM 8:16 AM 8:22 AM 8:32 AM8:02 AM 8:05 AM 8:08 AM 8:12 AM 8:15 AM 8:18 AM 8:21 AM 8:27 AM 8:37 AM
E-3

Assumed Train Schedules—2015
WESTBOUND
Train
MPNew York Penn Station30th Street Station LLSuburban Station 0.030th Street Station UL 0.0Powelton Yard 0.5Zoo-D1 1.4Zoo-JO 1.9Overbrook 5.4Ardmore 8.5Bryn Mawr 10.1Paoli 19.9Malvern 21.6Frazer Yard 23.9Exton 27.5Whitford 28.3Downingtown 32.4Thorn 35.0Coatesville 38.4Parksburg 44.2Atglen 47.0Leaman Place 55.6Lancaster 68.0Mt. Joy 80.1Elizabethtown 86.8Middletown 94.7H'burg Airport 97.0Harrisburg 104.6
EASTBOUND
Train
MPHarrisburg 104.6H'burg Airport 97.0Middletown 94.7Elizabethtown 86.8Mt. Joy 80.1Lancaster 68.0Leaman Place 55.6Atglen 47.0Parksburg 44.2Coatesville 38.4Thorn 35.0Downingtown 32.4Whitford 28.3Exton 27.5Frazer Yard 23.9Malvern 21.6Paoli 19.9Bryn Mawr 10.1Ardmore 8.5Overbrook 5.4Zoo-JO 1.9Zoo-D1 1.4Powelton Yard 0.530th Street Station LL 0.030th Street Station ULSuburban Station 0.0New York Penn Station
mod
DH Amtk FlyerHbg Cmtr 513 6617 515 6619 Hbg Cmtr
Sub-Bry 30h-800 Sub-Th HLan13 Sub-Pao Sub-Pow Sub-Pao Sub-
Pow HLan15
7:56 AM 8:00 AM 8:04 AM 8:18 AM 8:21 AM 8:45 AM 8:50 AM8:03 AM 8:23 AM 8:50 AM
8:29 AM 8:58 AM8:08 AM
To Yard To Yard8:32 AM 8:59 AM
8:39 AM 9:06 AM8:21 AM 8:43 AM 9:10 AM
8:27 AM 8:29 AM 9:06 AM 9:33 AM8:30 AM 8:32 AM 9:09 AM 9:36 AM
9:20 AM 9:47 AM8:36 AM8:38 AM8:43 AM
8:47 AM8:48 AM8:52 AM
9:03 AM9:13 AM 9:15 AM9:22 AM 9:30 AM9:28 AM 9:38 AM9:35 AM 9:49 AM9:38 AM 9:52 AM 10:22 AM9:45 AM 10:00 AM 10:32 AM
Flyer Amtk HLan6 HLan8 540 628 9010 542 6630
Th-Sub h30-700HBG. Comtr
HBG. Comtr Th-Sub CynSub Bry-Sub Mal-Sub PowSub
7:00 AM 7:15 AM 7:45 AM7:08 AM 7:24 AM 7:54 AM7:11 AM 7:27 AM 7:57 AM7:18 AM 7:38 AM 8:08 AM7:24 AM 7:46 AM 8:16 AM7:34 AM 8:00 AM 8:30 AM7:43 AM
7:54 AM7:58 AM
7:38 AM 7:42 AM8:04 AM8:08 AM8:10 AM
7:56 AM 8:16 AM 8:00 AM 8:29 AM8:00 AM 8:20 AM 8:04 AM 8:33 AM
8:24 AM From 8:35 AM 8:53 AM From Cynwyd 8:39 AM 8:57 AM Yard
8:47 AM 9:05 AM 8:42 AM
8:37 AM9:14 AM
8:40 AM 8:57 AM 9:15 AM8:40 AM 8:45 AM 8:45 AM 8:52 AM 9:02 AM 9:20 AM 9:23 AM
E-4

Assumed Train Schedules—2015
WESTBOUND
Train
MPNew York Penn Station30th Street Station LLSuburban Station 0.030th Street Station UL 0.0Powelton Yard 0.5Zoo-D1 1.4Zoo-JO 1.9Overbrook 5.4Ardmore 8.5Bryn Mawr 10.1Paoli 19.9Malvern 21.6Frazer Yard 23.9Exton 27.5Whitford 28.3Downingtown 32.4Thorn 35.0Coatesville 38.4Parksburg 44.2Atglen 47.0Leaman Place 55.6Lancaster 68.0Mt. Joy 80.1Elizabethtown 86.8Middletown 94.7H'burg Airport 97.0Harrisburg 104.6
EASTBOUND
Train
MPHarrisburg 104.6H'burg Airport 97.0Middletown 94.7Elizabethtown 86.8Mt. Joy 80.1Lancaster 68.0Leaman Place 55.6Atglen 47.0Parksburg 44.2Coatesville 38.4Thorn 35.0Downingtown 32.4Whitford 28.3Exton 27.5Frazer Yard 23.9Malvern 21.6Paoli 19.9Bryn Mawr 10.1Ardmore 8.5Overbrook 5.4Zoo-JO 1.9Zoo-D1 1.4Powelton Yard 0.530th Street Station LL 0.030th Street Station ULSuburban Station 0.0New York Penn Station
mod mod
Hbg Cmtr Amtk 43 Hbg Cmtr 517 6623 D6011 519 Amtk 6625
HLan17 nyppgh-0745 HLan19 Sub-Pao Sub-Pow Sub-Pow Sub-Th 30h-1000 Sub-Pow
7:45 AM9:15 AM
9:15 AM 9:25 AM 9:42 AM 9:45 AM 10:00 AM 10:03 AM9:20 AM 9:50 AM 10:03 AM
9:33 AM 9:50 AM 10:11 AM9:18 AM 10:08 AM
To Yard To Yard To Yard9:29 AM 9:59 AM
9:23 AM 9:36 AM 10:06 AM 9:40 AM 10:10 AM
9:35 AM 10:03 AM 10:33 AM 10:27 AM 10:06 AM 10:36 AM 10:30 AM
10:17 AM 10:47 AM 10:41 AM 10:36 AM 10:38 AM
9:51 AM 10:46 AM 10:43 AM10:51 AM
10:48 AM 10:52 AM
11:03 AM10:15 AM 10:21 AM 11:13 AM10:30 AM 11:22 AM10:38 AM 11:28 AM10:49 AM 11:35 AM10:52 AM 10:47 AM 11:22 AM 11:38 AM11:00 AM 10:55 AM 11:32 AM 11:45 AM
to PGH
Amtk HLan10 544 Amtk HLan12 HLan14 546 6632 548
h30-800 HBG. Comtr Pao-Subhbgnyp-
830HBG. Comtr
HBG. Comtr Th-Sub PowSub Pao-Sub
8:00 AM 8:15 AM 8:30 AM 8:45 AM 9:15 AM8:08 AM 8:24 AM 8:38 AM 8:54 AM 9:24 AM
8:27 AM 8:57 AM 9:27 AM8:17 AM 8:38 AM 8:47 AM 9:08 AM 9:38 AM
8:46 AM 9:16 AM 9:46 AM8:32 AM 9:00 AM 9:02 AM 9:30 AM 10:00 AM
9:11 AM
8:58 AM 9:28 AM 9:16 AM9:21 AM
9:04 AM 9:34 AM 9:23 AM8:49 AM 9:48 AM
9:29 AM9:12 AM 9:01 AM 9:42 AM 9:33 AM 10:00 AM
9:21 AM 9:53 AM From 10:20 AM9:25 AM 9:54 AM 9:57 AM Yard 10:24 AM9:33 AM 10:05 AM 10:32 AM
9:59 AM9:27 AM
10:14 AM
9:43 AM 10:15 AM 10:42 AM9:35 AM 9:48 AM 10:20 AM 10:23 AM 10:47 AM
11:29 AMNY subwy
E-5

Assumed Train Schedules—2015
WESTBOUND
Train
MPNew York Penn Station30th Street Station LLSuburban Station 0.030th Street Station UL 0.0Powelton Yard 0.5Zoo-D1 1.4Zoo-JO 1.9Overbrook 5.4Ardmore 8.5Bryn Mawr 10.1Paoli 19.9Malvern 21.6Frazer Yard 23.9Exton 27.5Whitford 28.3Downingtown 32.4Thorn 35.0Coatesville 38.4Parksburg 44.2Atglen 47.0Leaman Place 55.6Lancaster 68.0Mt. Joy 80.1Elizabethtown 86.8Middletown 94.7H'burg Airport 97.0Harrisburg 104.6
EASTBOUND
Train
MPHarrisburg 104.6H'burg Airport 97.0Middletown 94.7Elizabethtown 86.8Mt. Joy 80.1Lancaster 68.0Leaman Place 55.6Atglen 47.0Parksburg 44.2Coatesville 38.4Thorn 35.0Downingtown 32.4Whitford 28.3Exton 27.5Frazer Yard 23.9Malvern 21.6Paoli 19.9Bryn Mawr 10.1Ardmore 8.5Overbrook 5.4Zoo-JO 1.9Zoo-D1 1.4Powelton Yard 0.530th Street Station LL 0.030th Street Station ULSuburban Station 0.0New York Penn Station
Hbg Cmtr 521 523 6627 Hbg Cmtr 525 Hbg Cmtr 527 6629
HLan21 Sub-Pao Sub-Pao Sub-Pow HLan23 Sub-Pao HLan25 Sub-Th Sub-Pow
10:15 AM 10:45 AM 10:49 AM 11:15 AM 11:45 AM 11:49 AM10:20 AM 10:50 AM 11:20 AM 11:50 AM
10:57 AM 11:57 AM
To Yard To Yard10:29 AM 10:59 AM 11:29 AM 11:59 AM10:36 AM 11:06 AM 11:36 AM 12:06 PM10:40 AM 11:10 AM 11:40 AM 12:10 PM11:03 AM 11:33 AM 12:03 PM 12:33 PM11:06 AM 11:36 AM 12:06 PM 12:36 PM11:17 AM 11:47 AM 12:17 PM 12:47 PM
12:41 PM
12:46 PM12:51 PM
11:15 AM 12:15 PM11:30 AM 12:30 PM11:38 AM 12:38 PM11:49 AM 12:49 PM11:52 AM 12:22 PM 12:52 PM12:00 PM 12:32 PM 1:00 PM
550 6634 HLan16 Amtk 552 HLan18 HLan20 HLan22 554
Pao-Sub PowSubHBG. Comtr h30-1000 Pao-Sub
HBG. Comtr
HBG. Comtr
HBG. Comtr Th-Sub
9:45 AM 10:00 AM 10:15 AM 10:45 AM 11:15 AM9:55 AM 10:08 AM 10:24 AM 10:55 AM 11:24 AM
10:11 AM 10:27 AM 11:27 AM10:18 AM 10:38 AM 11:38 AM10:24 AM 10:46 AM 11:46 AM10:34 AM 11:00 AM 12:00 PM10:43 AM
10:54 AM10:58 AM
11:11 AM11:04 AM 11:16 AM11:08 AM 11:21 AM11:10 AM 11:23 AM
10:22 AM 10:52 AM11:16 AM 11:29 AM
10:34 AM 11:20 AM 11:04 AM 11:33 AM10:54 AM From 11:24 AM 11:53 AM10:58 AM Yard 11:28 AM 11:57 AM11:06 AM 11:36 AM 12:05 PM
11:37 AM
11:15 AM
11:16 AM 11:46 AM 12:15 PM11:21 AM 11:24 AM 11:45 AM 11:51 AM 12:20 PM
E-6

Assumed Train Schedules—2015
WESTBOUND
Train
MPNew York Penn Station30th Street Station LLSuburban Station 0.030th Street Station UL 0.0Powelton Yard 0.5Zoo-D1 1.4Zoo-JO 1.9Overbrook 5.4Ardmore 8.5Bryn Mawr 10.1Paoli 19.9Malvern 21.6Frazer Yard 23.9Exton 27.5Whitford 28.3Downingtown 32.4Thorn 35.0Coatesville 38.4Parksburg 44.2Atglen 47.0Leaman Place 55.6Lancaster 68.0Mt. Joy 80.1Elizabethtown 86.8Middletown 94.7H'burg Airport 97.0Harrisburg 104.6
EASTBOUND
Train
MPHarrisburg 104.6H'burg Airport 97.0Middletown 94.7Elizabethtown 86.8Mt. Joy 80.1Lancaster 68.0Leaman Place 55.6Atglen 47.0Parksburg 44.2Coatesville 38.4Thorn 35.0Downingtown 32.4Whitford 28.3Exton 27.5Frazer Yard 23.9Malvern 21.6Paoli 19.9Bryn Mawr 10.1Ardmore 8.5Overbrook 5.4Zoo-JO 1.9Zoo-D1 1.4Powelton Yard 0.530th Street Station LL 0.030th Street Station ULSuburban Station 0.0New York Penn Station
mod
Hbg Cmtr Amtk Hbg Cmtr 529 9693 531 6631 533 Hbg Cmtr
HLan27 30h-1200 HLan29 Sub-Bry Sub-Cyn Sub-Pao Sub-Pow Sub-Th HLan31
12:00 PM 12:15 PM 12:20 PM 12:45 PM 12:49 PM 1:15 PM12:03 PM 12:20 PM 12:50 PM 1:20 PM
12:57 PM12:08 PM
12:26 PM To Yard12:29 PM 12:59 PM 1:29 PM
12:36 PM To 1:06 PM 1:36 PM12:40 PM Cynwyd 1:10 PM 1:40 PM
12:27 PM 1:03 PM 1:33 PM 2:03 PM12:30 PM 1:06 PM 1:36 PM 2:06 PM
1:17 PM 1:47 PM 2:17 PM12:36 PM 2:11 PM12:38 PM12:43 PM 2:16 PM
2:21 PM12:48 PM12:52 PM
1:03 PM1:13 PM 1:15 PM1:22 PM 1:30 PM1:28 PM 1:38 PM1:35 PM 1:49 PM
1:22 PM 1:38 PM 1:52 PM 2:22 PM1:32 PM 1:45 PM 2:00 PM 2:32 PM
6636 556 Amtk HLan24 558 9694 6638 D9598 Amtk
PowSub Pao-Subhbgnyp-
1130HBG. Comtr Pao-Sub CynSub PowSub Pao-Sub h30-1200
11:30 AM 11:45 AM 12:00 PM11:38 AM 11:55 AM 12:08 PM
12:11 PM11:47 AM 12:18 PM
12:24 PM12:02 PM 12:34 PM
12:43 PM
12:54 PM 12:58 PM
12:28 PM 1:04 PM1:08 PM
12:34 PM 1:10 PM11:52 AM 12:22 PM 12:30 PM
1:16 PM12:04 PM 12:42 PM 12:34 PM 12:42 PM 1:20 PM
From 12:24 PM 12:54 PM From From 1:02 PMYard 12:28 PM 12:54 PM 12:58 PM Cynwyd Yard
12:36 PM 1:06 PM1:13 PM
12:59 PM 1:37 PM12:14 PM 1:14 PM
1:07 PM12:46 PM 1:16 PM
12:23 PM 12:51 PM 1:21 PM 1:23 PM 1:23 PM 1:27 PM 1:45 PM2:37 PM
E-7

Assumed Train Schedules—2015
WESTBOUND
Train
MPNew York Penn Station30th Street Station LLSuburban Station 0.030th Street Station UL 0.0Powelton Yard 0.5Zoo-D1 1.4Zoo-JO 1.9Overbrook 5.4Ardmore 8.5Bryn Mawr 10.1Paoli 19.9Malvern 21.6Frazer Yard 23.9Exton 27.5Whitford 28.3Downingtown 32.4Thorn 35.0Coatesville 38.4Parksburg 44.2Atglen 47.0Leaman Place 55.6Lancaster 68.0Mt. Joy 80.1Elizabethtown 86.8Middletown 94.7H'burg Airport 97.0Harrisburg 104.6
EASTBOUND
Train
MPHarrisburg 104.6H'burg Airport 97.0Middletown 94.7Elizabethtown 86.8Mt. Joy 80.1Lancaster 68.0Leaman Place 55.6Atglen 47.0Parksburg 44.2Coatesville 38.4Thorn 35.0Downingtown 32.4Whitford 28.3Exton 27.5Frazer Yard 23.9Malvern 21.6Paoli 19.9Bryn Mawr 10.1Ardmore 8.5Overbrook 5.4Zoo-JO 1.9Zoo-D1 1.4Powelton Yard 0.530th Street Station LL 0.030th Street Station ULSuburban Station 0.0New York Penn Station
mod mod
Hbg Cmtr Hbg Cmtr Amtk 535 6635 Amtk Hbg Cmtr Amtk
HLan33 HLan35 nyphbg-1220 Sub-Pao Sub-Pow 30h-1400 HLan37 NYPChi-
1255
12:25 PM 12:55 PM1:55 PM 2:25 PM
1:45 PM 1:49 PM 2:00 PM 1:50 PM 2:03 PM
1:57 PM1:58 PM 2:08 PM 2:28 PM
To Yard1:59 PM
2:03 PM 2:06 PM 2:33 PM2:10 PM
2:15 PM 2:33 PM 2:27 PM 2:45 PM 2:36 PM 2:30 PM
2:47 PM 2:36 PM 2:38 PM
2:31 PM 2:43 PM 3:01 PM
2:48 PM 2:52 PM
3:03 PM 2:15 PM 3:01 PM 3:13 PM 3:15 PM 3:31 PM2:30 PM 3:22 PM 3:30 PM 2:38 PM 3:28 PM 3:38 PM 2:49 PM 3:35 PM 3:49 PM 2:52 PM 3:22 PM 3:27 PM 3:38 PM 3:52 PM 3:57 PM3:00 PM 3:32 PM 3:35 PM 3:45 PM 4:00 PM 4:05 PM
to PGH to chi
HLan26 HLan28 560 6640 562 564 566 6642HBG. Comtr HBG. Comtr Pao-Sub PowSub Pao-Sub Pao-Sub Th-Sub PowSub
12:15 PM 12:45 PM12:24 PM 12:55 PM12:27 PM12:38 PM12:46 PM1:00 PM
2:11 PM2:16 PM2:21 PM2:23 PM
12:52 PM 1:52 PM2:29 PM
1:04 PM 1:54 PM 2:04 PM 2:33 PM1:24 PM From 2:14 PM 2:24 PM 2:53 PM From1:28 PM Yard 2:18 PM 2:28 PM 2:57 PM Yard1:36 PM 2:26 PM 2:36 PM 3:05 PM
2:14 PM 3:21 PM
1:46 PM 2:36 PM 2:46 PM 3:15 PM1:51 PM 2:23 PM 2:41 PM 2:51 PM 3:20 PM 3:30 PM
E-8

Assumed Train Schedules—2015
WESTBOUND
Train
MPNew York Penn Station30th Street Station LLSuburban Station 0.030th Street Station UL 0.0Powelton Yard 0.5Zoo-D1 1.4Zoo-JO 1.9Overbrook 5.4Ardmore 8.5Bryn Mawr 10.1Paoli 19.9Malvern 21.6Frazer Yard 23.9Exton 27.5Whitford 28.3Downingtown 32.4Thorn 35.0Coatesville 38.4Parksburg 44.2Atglen 47.0Leaman Place 55.6Lancaster 68.0Mt. Joy 80.1Elizabethtown 86.8Middletown 94.7H'burg Airport 97.0Harrisburg 104.6
EASTBOUND
Train
MPHarrisburg 104.6H'burg Airport 97.0Middletown 94.7Elizabethtown 86.8Mt. Joy 80.1Lancaster 68.0Leaman Place 55.6Atglen 47.0Parksburg 44.2Coatesville 38.4Thorn 35.0Downingtown 32.4Whitford 28.3Exton 27.5Frazer Yard 23.9Malvern 21.6Paoli 19.9Bryn Mawr 10.1Ardmore 8.5Overbrook 5.4Zoo-JO 1.9Zoo-D1 1.4Powelton Yard 0.530th Street Station LL 0.030th Street Station ULSuburban Station 0.0New York Penn Station
537 539 6637 541 Hbg Cmtr Hbg Cmtr Hbg Cmtr Amtk Hbg Cmtr
Sub-Pao Sub-Pao Sub-Pow Sub-Th HLan39 HLan41 HLan43 nyphbg-1435 HLan45
2:35 PM
2:15 PM 2:45 PM 2:49 PM 3:15 PM 2:20 PM 2:50 PM 3:20 PM
2:57 PM4:05 PM
To Yard2:29 PM 2:59 PM 3:29 PM2:36 PM 3:06 PM 3:36 PM 4:10 PM2:40 PM 3:10 PM 3:40 PM3:03 PM 3:33 PM 4:03 PM 4:22 PM3:06 PM 3:36 PM 4:06 PM 3:17 PM 3:47 PM 4:17 PM
4:11 PM
4:16 PM 4:38 PM4:21 PM
3:45 PM 4:15 PM 4:45 PM 5:08 PM 5:15 PM4:00 PM 4:30 PM 5:00 PM 5:30 PM4:08 PM 4:38 PM 5:08 PM 5:38 PM4:19 PM 4:49 PM 5:19 PM 5:49 PM4:22 PM 4:52 PM 5:22 PM 5:34 PM 5:52 PM4:30 PM 5:00 PM 5:30 PM 5:42 PM 6:00 PM
NY subwy
Amtk HLan30 HLan32 Amtk HLan34 568 HLan36 6644 6596Chinyp-
1250HBG. Comtr
HBG. Comtr h30-1400
HBG. Comtr Th-Sub
HBG. Comtr PowSub Pow-Sub
12:50 PM 1:15 PM 1:45 PM 2:00 PM 2:15 PM 2:45 PM12:58 PM 1:24 PM 1:55 PM 2:08 PM 2:24 PM 2:55 PM
1:27 PM 2:11 PM 2:27 PM1:38 PM 2:18 PM 2:38 PM
1:46 PM 2:24 PM 2:46 PM1:24 PM 2:00 PM 2:34 PM 3:00 PM
2:43 PM
2:54 PM 2:58 PM 2:41 PM
1:54 PM 3:04 PM 2:46 PM3:08 PM 2:51 PM3:10 PM 2:53 PM
3:16 PM 2:59 PM2:10 PM 3:20 PM 3:03 PM
3:23 PM From From2:22 PM 3:27 PM Yard Yard
3:35 PM
2:27 PM 3:37 PM3:53 PM 4:08 PM
2:30 PM3:45 PM
3:45 PM 3:50 PM 4:02 PM 4:19 PM4:00 PM
E-9

Assumed Train Schedules—2015
WESTBOUND
Train
MPNew York Penn Station30th Street Station LLSuburban Station 0.030th Street Station UL 0.0Powelton Yard 0.5Zoo-D1 1.4Zoo-JO 1.9Overbrook 5.4Ardmore 8.5Bryn Mawr 10.1Paoli 19.9Malvern 21.6Frazer Yard 23.9Exton 27.5Whitford 28.3Downingtown 32.4Thorn 35.0Coatesville 38.4Parksburg 44.2Atglen 47.0Leaman Place 55.6Lancaster 68.0Mt. Joy 80.1Elizabethtown 86.8Middletown 94.7H'burg Airport 97.0Harrisburg 104.6
EASTBOUND
Train
MPHarrisburg 104.6H'burg Airport 97.0Middletown 94.7Elizabethtown 86.8Mt. Joy 80.1Lancaster 68.0Leaman Place 55.6Atglen 47.0Parksburg 44.2Coatesville 38.4Thorn 35.0Downingtown 32.4Whitford 28.3Exton 27.5Frazer Yard 23.9Malvern 21.6Paoli 19.9Bryn Mawr 10.1Ardmore 8.5Overbrook 5.4Zoo-JO 1.9Zoo-D1 1.4Powelton Yard 0.530th Street Station LL 0.030th Street Station ULSuburban Station 0.0New York Penn Station
mod
543 6641 Amtk 9547 549 Flyer 9551 553 9647
Sub-Mal Sub-Pow 30h-1600 Sub-Atg Sub-Bry Sub-Th Sub-Th Sub-Bry Sub-Cyn
3:45 PM 3:49 PM 4:00 PM 4:08 PM 4:15 PM 4:30 PM 4:35 PM 4:40 PM 4:43 PM3:50 PM 4:03 PM 4:13 PM 4:20 PM 4:40 PM 4:45 PM
3:57 PM4:08 PM
To Yard 4:49 PM3:59 PM 4:29 PM 4:54 PM4:06 PM 4:36 PM 5:01 PM To4:10 PM 4:26 PM 4:40 PM 4:55 PM 5:05 PM Cynwyd4:33 PM 4:25 PM 4:48 PM 4:55 PM 5:19 PM4:36 PM 4:51 PM 4:58 PM 5:22 PM4:47 PM
4:33 PM 4:57 PM4:59 PM
4:38 PM 5:04 PM5:09 PM 5:13 PM5:13 PM5:18 PM5:23 PM
5:06 PM
5:20 PM
5:28 PM5:35 PM
HLan38 570 6572 HLan40 574 6648 578 6650 D6018HBG. Comtr Pao-Sub Pow-Sub
HBG. Comtr Pao-Sub PowSub Pao-Sub PowSub Bry-Sub
3:15 PM 3:45 PM3:24 PM 3:54 PM3:27 PM 3:57 PM3:38 PM 4:08 PM3:46 PM 4:16 PM4:00 PM 4:30 PM
3:19 PM 3:52 PM 4:13 PM
3:31 PM 4:04 PM 4:25 PM3:51 PM From 4:24 PM From 4:45 PM From 4:52 PM3:55 PM Yard 4:28 PM Yard 4:49 PM Yard4:03 PM 4:36 PM 4:57 PM
4:36 PM 4:53 PM 5:04 PM
4:13 PM 4:46 PM 5:07 PM4:18 PM 4:47 PM 4:51 PM 5:02 PM 5:12 PM 5:13 PM 5:17 PM
E-10

Assumed Train Schedules—2015
WESTBOUND
Train
MPNew York Penn Station30th Street Station LLSuburban Station 0.030th Street Station UL 0.0Powelton Yard 0.5Zoo-D1 1.4Zoo-JO 1.9Overbrook 5.4Ardmore 8.5Bryn Mawr 10.1Paoli 19.9Malvern 21.6Frazer Yard 23.9Exton 27.5Whitford 28.3Downingtown 32.4Thorn 35.0Coatesville 38.4Parksburg 44.2Atglen 47.0Leaman Place 55.6Lancaster 68.0Mt. Joy 80.1Elizabethtown 86.8Middletown 94.7H'burg Airport 97.0Harrisburg 104.6
EASTBOUND
Train
MPHarrisburg 104.6H'burg Airport 97.0Middletown 94.7Elizabethtown 86.8Mt. Joy 80.1Lancaster 68.0Leaman Place 55.6Atglen 47.0Parksburg 44.2Coatesville 38.4Thorn 35.0Downingtown 32.4Whitford 28.3Exton 27.5Frazer Yard 23.9Malvern 21.6Paoli 19.9Bryn Mawr 10.1Ardmore 8.5Overbrook 5.4Zoo-JO 1.9Zoo-D1 1.4Powelton Yard 0.530th Street Station LL 0.030th Street Station ULSuburban Station 0.0New York Penn Station
7555 9557 9019 Hbg Cmtr Amtk Flyer Hbg Cmtr 9559 561
Sub-Th Sub-Mal Sub-Bry HLan47 30h-1700 Sub-Th HLan49 Sub-Atg Sub-Mal
4:47 PM 4:53 PM 4:57 PM 5:00 PM 5:05 PM 5:08 PM 5:15 PM4:52 PM 4:58 PM 5:02 PM 5:03 PM 5:13 PM 5:20 PM
5:08 PM
5:11 PM5:18 PM
5:13 PM 5:22 PM 5:35 PM5:12 PM 5:37 PM 5:25 PM 5:30 PM 5:33 PM 5:59 PM5:15 PM 5:40 PM 5:33 PM 5:36 PM 6:02 PM
5:20 PM 5:33 PM
5:25 PM 5:38 PM5:30 PM 5:48 PM 5:51 PM
5:54 PM5:59 PM6:03 PM
5:45 PM 6:06 PM 6:15 PM6:00 PM 6:30 PM6:08 PM 6:20 PM 6:38 PM6:19 PM 6:49 PM6:22 PM 6:28 PM 6:52 PM6:30 PM 6:35 PM 7:00 PM
Amtk 4598 D8020 Amtk HLan42 580 HLan44 4656 DHPghnyp-
1550 CynSub Bry-Sub h30-1600HBG. Comtr ThSub
HBG. Comtr CynSub Bry-Sub
3:50 PM 4:00 PM 4:15 PM 4:45 PM3:58 PM 4:08 PM 4:24 PM 4:54 PM
4:11 PM 4:27 PM 4:57 PM4:18 PM 4:38 PM 5:08 PM
4:24 PM 4:46 PM 5:16 PM4:24 PM 4:34 PM 5:00 PM 5:30 PM
4:43 PM
4:54 PM 4:58 PM 4:41 PM
4:54 PM 5:04 PM 4:46 PM5:08 PM 4:51 PM5:10 PM 4:53 PM
5:16 PM 4:59 PM5:10 PM 5:20 PM 5:03 PM
From 5:17 PM 5:23 PM From 5:40 PM5:22 PM Cynwyd 5:27 PM Cynwyd
5:35 PM5:30 PM 5:50 PM
5:27 PM 5:37 PM
5:30 PM5:45 PM
5:40 PM 5:42 PM 5:45 PM 5:50 PM 6:00 PM 6:05 PM7:00 PM
E-11
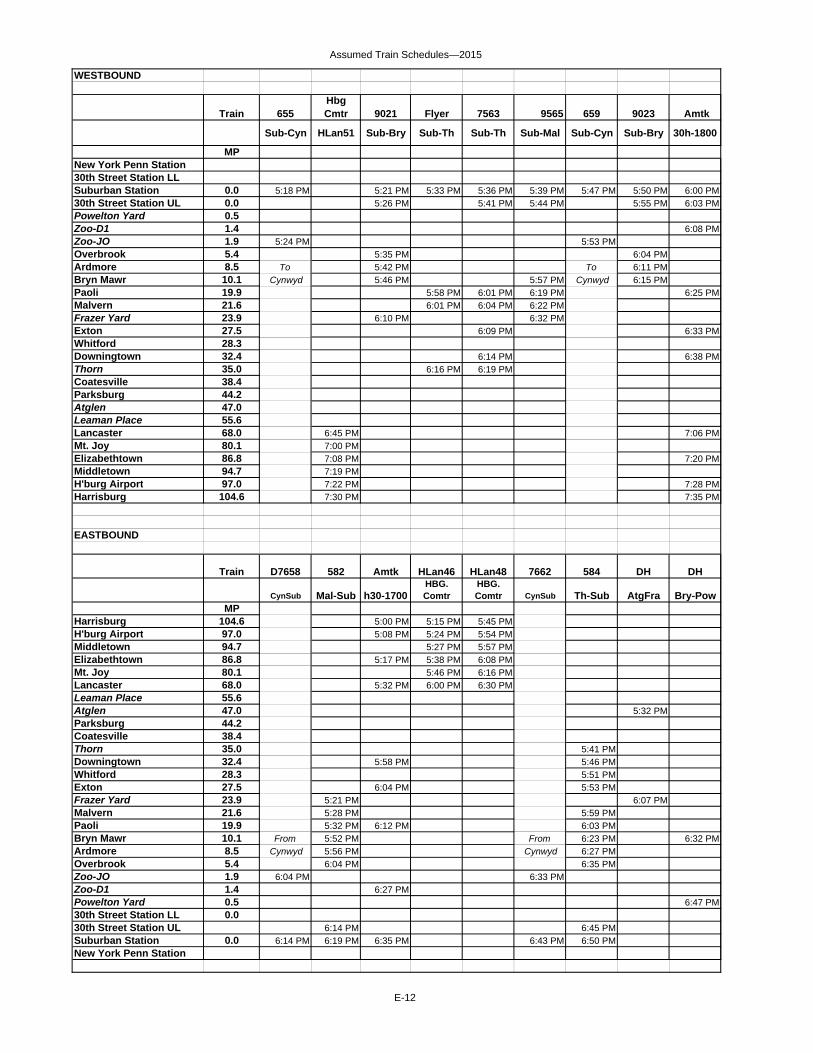
Assumed Train Schedules—2015
WESTBOUND
Train
MPNew York Penn Station30th Street Station LLSuburban Station 0.030th Street Station UL 0.0Powelton Yard 0.5Zoo-D1 1.4Zoo-JO 1.9Overbrook 5.4Ardmore 8.5Bryn Mawr 10.1Paoli 19.9Malvern 21.6Frazer Yard 23.9Exton 27.5Whitford 28.3Downingtown 32.4Thorn 35.0Coatesville 38.4Parksburg 44.2Atglen 47.0Leaman Place 55.6Lancaster 68.0Mt. Joy 80.1Elizabethtown 86.8Middletown 94.7H'burg Airport 97.0Harrisburg 104.6
EASTBOUND
Train
MPHarrisburg 104.6H'burg Airport 97.0Middletown 94.7Elizabethtown 86.8Mt. Joy 80.1Lancaster 68.0Leaman Place 55.6Atglen 47.0Parksburg 44.2Coatesville 38.4Thorn 35.0Downingtown 32.4Whitford 28.3Exton 27.5Frazer Yard 23.9Malvern 21.6Paoli 19.9Bryn Mawr 10.1Ardmore 8.5Overbrook 5.4Zoo-JO 1.9Zoo-D1 1.4Powelton Yard 0.530th Street Station LL 0.030th Street Station ULSuburban Station 0.0New York Penn Station
mod mod
655Hbg Cmtr 9021 Flyer 7563 9565 659 9023 Amtk
Sub-Cyn HLan51 Sub-Bry Sub-Th Sub-Th Sub-Mal Sub-Cyn Sub-Bry 30h-1800
5:18 PM 5:21 PM 5:33 PM 5:36 PM 5:39 PM 5:47 PM 5:50 PM 6:00 PM5:26 PM 5:41 PM 5:44 PM 5:55 PM 6:03 PM
6:08 PM5:24 PM 5:53 PM
5:35 PM 6:04 PMTo 5:42 PM To 6:11 PM
Cynwyd 5:46 PM 5:57 PM Cynwyd 6:15 PM5:58 PM 6:01 PM 6:19 PM 6:25 PM6:01 PM 6:04 PM 6:22 PM
6:10 PM 6:32 PM6:09 PM 6:33 PM
6:14 PM 6:38 PM6:16 PM 6:19 PM
6:45 PM 7:06 PM7:00 PM7:08 PM 7:20 PM7:19 PM 7:22 PM 7:28 PM7:30 PM 7:35 PM
D7658 582 Amtk HLan46 HLan48 7662 584 DH DH
CynSub Mal-Sub h30-1700HBG. Comtr
HBG. Comtr CynSub Th-Sub AtgFra Bry-Pow
5:00 PM 5:15 PM 5:45 PM5:08 PM 5:24 PM 5:54 PM
5:27 PM 5:57 PM5:17 PM 5:38 PM 6:08 PM
5:46 PM 6:16 PM5:32 PM 6:00 PM 6:30 PM
5:32 PM 5:41 PM
5:58 PM 5:46 PM5:51 PM
6:04 PM 5:53 PM5:21 PM 6:07 PM5:28 PM 5:59 PM5:32 PM 6:12 PM 6:03 PM
From 5:52 PM From 6:23 PM 6:32 PM Cynwyd 5:56 PM Cynwyd 6:27 PM
6:04 PM 6:35 PM6:04 PM 6:33 PM
6:27 PM6:47 PM
6:14 PM 6:45 PM6:14 PM 6:19 PM 6:35 PM 6:43 PM 6:50 PM
E-12

Assumed Train Schedules—2015
WESTBOUND
Train
MPNew York Penn Station30th Street Station LLSuburban Station 0.030th Street Station UL 0.0Powelton Yard 0.5Zoo-D1 1.4Zoo-JO 1.9Overbrook 5.4Ardmore 8.5Bryn Mawr 10.1Paoli 19.9Malvern 21.6Frazer Yard 23.9Exton 27.5Whitford 28.3Downingtown 32.4Thorn 35.0Coatesville 38.4Parksburg 44.2Atglen 47.0Leaman Place 55.6Lancaster 68.0Mt. Joy 80.1Elizabethtown 86.8Middletown 94.7H'burg Airport 97.0Harrisburg 104.6
EASTBOUND
Train
MPHarrisburg 104.6H'burg Airport 97.0Middletown 94.7Elizabethtown 86.8Mt. Joy 80.1Lancaster 68.0Leaman Place 55.6Atglen 47.0Parksburg 44.2Coatesville 38.4Thorn 35.0Downingtown 32.4Whitford 28.3Exton 27.5Frazer Yard 23.9Malvern 21.6Paoli 19.9Bryn Mawr 10.1Ardmore 8.5Overbrook 5.4Zoo-JO 1.9Zoo-D1 1.4Powelton Yard 0.530th Street Station LL 0.030th Street Station ULSuburban Station 0.0New York Penn Station
mod mod
Hbg Cmtr 573 663 Amtk 575 667 Amtk Hbg Cmtr
HLan53 Sub-Th Sub-Cyn nyphbg-1708 HLan55 Sub-Pao Sub-Cyn 30h-1900 HLan57
5:08 PM
6:14 PM 6:22 PM 6:45 PM 6:52 PM 7:00 PM6:19 PM 6:50 PM 7:03 PM
6:38 PM 7:08 PM6:28 PM 6:58 PM
6:28 PM 6:59 PM6:35 PM To 6:43 PM 7:06 PM To 6:39 PM Cynwyd 7:10 PM Cynwyd7:02 PM 6:55 PM 7:33 PM 7:27 PM7:05 PM 7:36 PM 7:30 PM
7:36 PM 7:38 PM
7:11 PM 7:43 PM7:20 PM
7:48 PM 7:52 PM
8:03 PM7:15 PM 7:41 PM 8:13 PM 8:15 PM7:30 PM 8:22 PM 8:30 PM7:38 PM 8:28 PM 8:38 PM7:49 PM 8:35 PM 8:49 PM7:52 PM 8:06 PM 8:22 PM 8:38 PM 8:52 PM8:00 PM 8:13 PM 8:32 PM 8:45 PM 9:00 PM
NY subwy
DH DH 7696 586 Amtk 588 Amtk HLan50 D7666
Th-Fra Th-Fra CynSub Th-Sub h30-1800 Th-Subpghnyp-
1810 HBG. Comtr CynSub
6:00 PM 6:10 PM 6:15 PM6:08 PM 6:18 PM 6:24 PM
6:27 PM6:17 PM 6:38 PM
6:46 PM6:32 PM 6:44 PM 7:00 PM
5:48 PM 6:07 PM 6:20 PM 6:42 PM 6:58 PM 7:14 PM
7:04 PM6:07 PM 6:26 PM
6:38 PM 7:00 PM6:42 PM 7:12 PM 7:04 PM 7:30 PM
From 7:02 PM 7:24 PM From Cynwyd 7:06 PM 7:28 PM 7:42 PM Cynwyd
7:14 PM 7:36 PM7:13 PM 7:43 PM
7:27 PM 7:47 PM
7:50 PM7:24 PM 7:46 PM
7:23 PM 7:29 PM 7:35 PM 7:51 PM 7:53 PM9:20 PM
E-13
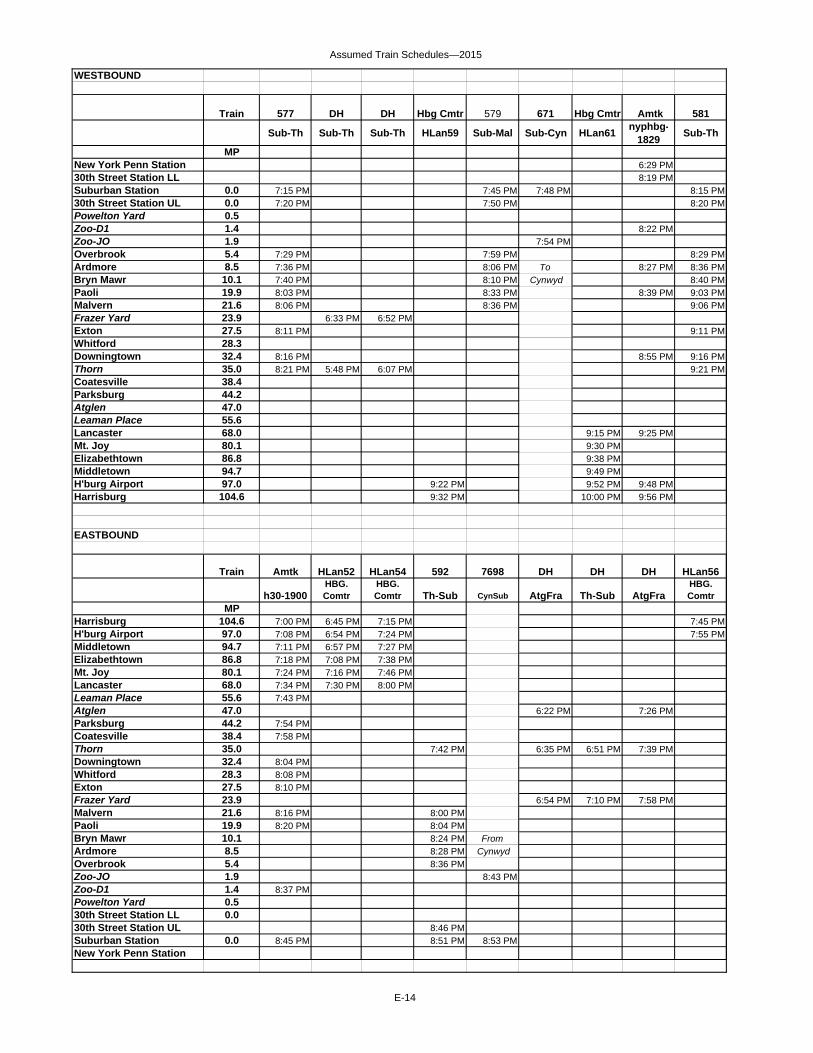
Assumed Train Schedules—2015
WESTBOUND
Train
MPNew York Penn Station30th Street Station LLSuburban Station 0.030th Street Station UL 0.0Powelton Yard 0.5Zoo-D1 1.4Zoo-JO 1.9Overbrook 5.4Ardmore 8.5Bryn Mawr 10.1Paoli 19.9Malvern 21.6Frazer Yard 23.9Exton 27.5Whitford 28.3Downingtown 32.4Thorn 35.0Coatesville 38.4Parksburg 44.2Atglen 47.0Leaman Place 55.6Lancaster 68.0Mt. Joy 80.1Elizabethtown 86.8Middletown 94.7H'burg Airport 97.0Harrisburg 104.6
EASTBOUND
Train
MPHarrisburg 104.6H'burg Airport 97.0Middletown 94.7Elizabethtown 86.8Mt. Joy 80.1Lancaster 68.0Leaman Place 55.6Atglen 47.0Parksburg 44.2Coatesville 38.4Thorn 35.0Downingtown 32.4Whitford 28.3Exton 27.5Frazer Yard 23.9Malvern 21.6Paoli 19.9Bryn Mawr 10.1Ardmore 8.5Overbrook 5.4Zoo-JO 1.9Zoo-D1 1.4Powelton Yard 0.530th Street Station LL 0.030th Street Station ULSuburban Station 0.0New York Penn Station
577 DH DH Hbg Cmtr 579 671 Hbg Cmtr Amtk 581
Sub-Th Sub-Th Sub-Th HLan59 Sub-Mal Sub-Cyn HLan61 nyphbg-1829 Sub-Th
6:29 PM8:19 PM
7:15 PM 7:45 PM 7:48 PM 8:15 PM7:20 PM 7:50 PM 8:20 PM
8:22 PM7:54 PM
7:29 PM 7:59 PM 8:29 PM7:36 PM 8:06 PM To 8:27 PM 8:36 PM7:40 PM 8:10 PM Cynwyd 8:40 PM8:03 PM 8:33 PM 8:39 PM 9:03 PM8:06 PM 8:36 PM 9:06 PM
6:33 PM 6:52 PM8:11 PM 9:11 PM
8:16 PM 8:55 PM 9:16 PM8:21 PM 5:48 PM 6:07 PM 9:21 PM
9:15 PM 9:25 PM9:30 PM 9:38 PM 9:49 PM
9:22 PM 9:52 PM 9:48 PM9:32 PM 10:00 PM 9:56 PM
Amtk HLan52 HLan54 592 7698 DH DH DH HLan56
h30-1900HBG. Comtr
HBG. Comtr Th-Sub CynSub AtgFra Th-Sub AtgFra
HBG. Comtr
7:00 PM 6:45 PM 7:15 PM 7:45 PM7:08 PM 6:54 PM 7:24 PM 7:55 PM7:11 PM 6:57 PM 7:27 PM7:18 PM 7:08 PM 7:38 PM7:24 PM 7:16 PM 7:46 PM7:34 PM 7:30 PM 8:00 PM7:43 PM
6:22 PM 7:26 PM7:54 PM7:58 PM
7:42 PM 6:35 PM 6:51 PM 7:39 PM8:04 PM8:08 PM8:10 PM
6:54 PM 7:10 PM 7:58 PM8:16 PM 8:00 PM8:20 PM 8:04 PM
8:24 PM From8:28 PM Cynwyd8:36 PM
8:43 PM8:37 PM
8:46 PM8:45 PM 8:51 PM 8:53 PM
E-14

Assumed Train Schedules—2015
WESTBOUND
Train
MPNew York Penn Station30th Street Station LLSuburban Station 0.030th Street Station UL 0.0Powelton Yard 0.5Zoo-D1 1.4Zoo-JO 1.9Overbrook 5.4Ardmore 8.5Bryn Mawr 10.1Paoli 19.9Malvern 21.6Frazer Yard 23.9Exton 27.5Whitford 28.3Downingtown 32.4Thorn 35.0Coatesville 38.4Parksburg 44.2Atglen 47.0Leaman Place 55.6Lancaster 68.0Mt. Joy 80.1Elizabethtown 86.8Middletown 94.7H'burg Airport 97.0Harrisburg 104.6
EASTBOUND
Train
MPHarrisburg 104.6H'burg Airport 97.0Middletown 94.7Elizabethtown 86.8Mt. Joy 80.1Lancaster 68.0Leaman Place 55.6Atglen 47.0Parksburg 44.2Coatesville 38.4Thorn 35.0Downingtown 32.4Whitford 28.3Exton 27.5Frazer Yard 23.9Malvern 21.6Paoli 19.9Bryn Mawr 10.1Ardmore 8.5Overbrook 5.4Zoo-JO 1.9Zoo-D1 1.4Powelton Yard 0.530th Street Station LL 0.030th Street Station ULSuburban Station 0.0New York Penn Station
mod
583 Amtk 585 Hbg Cmtr Hbg Cmtr 587 589 591 6681
Sub-Pao 30h-2100 Sub-Th HLan63 HLan65 Sub-Th Sub-Th Sub-Th Sub-Pow
8:45 PM 9:00 PM 9:15 PM 10:15 PM 11:15 PM 12:15 AM 12:20 AM8:50 PM 9:03 PM 9:20 PM 10:20 PM 11:20 PM 12:20 AM
12:28 AM9:08 PM
To Yard8:59 PM 9:29 PM 10:29 PM 11:29 PM 12:29 AM9:06 PM 9:36 PM 10:36 PM 11:36 PM 12:36 AM9:10 PM 9:40 PM 10:40 PM 11:40 PM 12:40 AM9:33 PM 9:27 PM 10:03 PM 11:03 PM 12:03 AM 1:03 AM9:36 PM 9:30 PM 10:06 PM 11:06 PM 12:06 AM 1:06 AM9:47 PM
9:36 PM 10:11 PM 11:11 PM9:38 PM9:43 PM 10:16 PM 11:16 PM
10:21 PM 11:21 PM 12:21 AM 1:22 AM9:48 PM9:52 PM
10:03 PM10:13 PM 10:15 PM10:22 PM 10:30 PM10:28 PM 10:38 PM10:35 PM 10:49 PM10:38 PM 10:22 PM 10:52 PM10:45 PM 10:32 PM 11:00 PM
HLan58 594 HLan60 Amtk HLan62 596 HLan64 HLan66 598HBG. Comtr Th-Sub
HBG. Comtr h30-2100
HBG. Comtr Th-Sub
HBG. Comtr
HBG. Comtr Th-Sub
8:15 PM 8:45 PM 9:00 PM 9:15 PM 9:45 PM 10:15 PM8:24 PM 8:55 PM 9:08 PM 9:24 PM 9:55 PM 10:24 PM8:27 PM 9:11 PM 9:27 PM 10:27 PM8:38 PM 9:18 PM 9:38 PM 10:38 PM8:46 PM 9:24 PM 9:46 PM 10:46 PM9:00 PM 9:34 PM 10:00 PM 11:00 PM
9:43 PM
9:54 PM9:58 PM
8:43 PM 9:41 PM 10:41 PM8:48 PM 10:04 PM 9:46 PM 10:46 PM8:53 PM 10:08 PM 9:51 PM 10:51 PM8:55 PM 10:10 PM 9:53 PM 10:53 PM
9:01 PM 10:16 PM 9:59 PM 10:59 PM9:05 PM 10:20 PM 10:03 PM 11:03 PM9:25 PM 10:23 PM 11:23 PM9:29 PM 10:27 PM 11:27 PM9:37 PM 10:35 PM 11:35 PM
10:37 PM
9:47 PM 10:45 PM 11:45 PM9:52 PM 10:45 PM 10:50 PM 11:50 PM
E-15

Assumed Train Schedules—2015
WESTBOUND
Train
MPNew York Penn Station30th Street Station LLSuburban Station 0.030th Street Station UL 0.0Powelton Yard 0.5Zoo-D1 1.4Zoo-JO 1.9Overbrook 5.4Ardmore 8.5Bryn Mawr 10.1Paoli 19.9Malvern 21.6Frazer Yard 23.9Exton 27.5Whitford 28.3Downingtown 32.4Thorn 35.0Coatesville 38.4Parksburg 44.2Atglen 47.0Leaman Place 55.6Lancaster 68.0Mt. Joy 80.1Elizabethtown 86.8Middletown 94.7H'burg Airport 97.0Harrisburg 104.6
EASTBOUND
Train
MPHarrisburg 104.6H'burg Airport 97.0Middletown 94.7Elizabethtown 86.8Mt. Joy 80.1Lancaster 68.0Leaman Place 55.6Atglen 47.0Parksburg 44.2Coatesville 38.4Thorn 35.0Downingtown 32.4Whitford 28.3Exton 27.5Frazer Yard 23.9Malvern 21.6Paoli 19.9Bryn Mawr 10.1Ardmore 8.5Overbrook 5.4Zoo-JO 1.9Zoo-D1 1.4Powelton Yard 0.530th Street Station LL 0.030th Street Station ULSuburban Station 0.0New York Penn Station
DH DH DH
Th-Sub Th-Sub Th-Sub
11:36 PM 12:36 AM 1:36 AM
11:55 PM 12:55 AM 1:55 AM
E-16