TECHNICAL MODELING GUIDELINES S A H , T
48
TECHNICAL MODELING GUIDELINES 2D D YNAMIC STORMWATER ANALYSIS CITY OF HOUSTON, TEXAS
Transcript of TECHNICAL MODELING GUIDELINES S A H , T

TECHNICAL MODELING GUIDELINES
2D DYNAMIC STORMWATER ANALYSIS
CITY OF HOUSTON, TEXAS
Moore, Andrew
Stamp

City of Houston, Texas
Houston Public Works
Technical Paper No. 102
(TP-102)
Technical Modeling Guidelines for 2D Dynamic Storm Water Analysis
March 20, 2020
Abstract
This document serves as a guideline for dynamic and two-dimensional storm water modeling. The
document includes a discussion of the hydrologic and hydraulic methods associated with dynamic modeling
that can be used in the analysis and design process for Capital Improvement Projects for the City of
Houston. The intent is to provide the consulting engineer and City project managers guidance to
developing, simulating, analyzing, and reviewing drainage models.
Authors: C. Andrew Moore, P.E., CFM (Halff Associates, Inc.)
Sam Hinojosa, P.E., CFM (Halff Associates, Inc.)
Terry Barr, P.E., CFM (Halff Associates, Inc.)
Reviewers: Kevin Hammond, P.E. (City of Houston, Houston Public Works)
Paresh Lad (City of Houston, Houston Public Works)
Adam Eaton, P.E. (City of Houston, Houston Public Works)
Dr. Kathlie S. Jeng-Bulloch, P.E., D.WRE, CFM
(City of Houston, Office of the City Engineer)
Sam Edwards, P.E., CFM (Halff Associates, Inc.)
Maria Martinez, P.E., CFM (Halff Associates, Inc.)
Pradeepa Venigalla, P.E. (Halff Associates, Inc.)
Ashley Lowrie, P.E. (Halff Associates, Inc.)
Acknowledgements: American Council of Engineering Companies
Harris County Flood Control District

Contents 1.0 Introduction ........................................................................................................................................ 1
1.1 Purpose ......................................................................................................................................... 1 1.2 Background ................................................................................................................................... 1 1.3 Disclaimer of Liability .................................................................................................................... 1
2.0 Terms and Definitions ....................................................................................................................... 2 3.0 Hydrology and Hydraulics Overview ................................................................................................. 3
3.1 Introduction to Storm Water Modeling .......................................................................................... 3 3.2 Appropriate Use of Dynamic Models ............................................................................................ 3 3.3 Model Scenarios ........................................................................................................................... 4 3.4 Model Stages ................................................................................................................................ 4
Planning-Stage Models ......................................................................................................... 4 Design-Stage Models ............................................................................................................ 4
3.5 1D Versus 2D Hydraulic Modeling ................................................................................................ 4 3.6 Model Approach Decision Matrix .................................................................................................. 6
4.0 Dynamic Modeling ............................................................................................................................. 8 4.1 Hydrology ...................................................................................................................................... 8 4.2 Hydraulics ...................................................................................................................................... 8
1D Components .................................................................................................................... 8 2D Components .................................................................................................................... 8
5.0 Hydrology Overview .......................................................................................................................... 9 5.1 Rainfall .......................................................................................................................................... 9 5.2 Drainage Area ............................................................................................................................. 10 5.3 Losses ......................................................................................................................................... 10 5.4 Hydrograph Method .................................................................................................................... 10 5.5 Time of Concentration ................................................................................................................. 10 5.6 Hydrograph Development ........................................................................................................... 10
6.0 1D Model Components ................................................................................................................... 11 6.1 Data Sources............................................................................................................................... 11 6.2 Model Datum ............................................................................................................................... 11 6.3 Nodes .......................................................................................................................................... 12
Spill Crest/Ground Elevation ............................................................................................... 12 Invert Elevation .................................................................................................................... 13 Ponding Type ...................................................................................................................... 13 Storage ................................................................................................................................ 14 Inlet Capacity ....................................................................................................................... 14 Inflow Locations................................................................................................................... 14 Outfalls ................................................................................................................................ 15
6.4 1D Hydraulic Links ...................................................................................................................... 15 Data Input ............................................................................................................................ 15 Storm Sewer ........................................................................................................................ 16 Roadside Ditches ................................................................................................................ 16 Channels ............................................................................................................................. 16
6.4.4.1 Case #1 – FEMA Studied Stream ....................................................................................... 16 6.4.4.1 Case #2 – Non-FEMA Studied Stream ............................................................................... 16
Surface Flow ....................................................................................................................... 16 6.5 1D Outfall Boundary Conditions (Tailwater) ................................................................................ 17
Outfalls into HCFCD Channels ........................................................................................... 19 Outfalls into City of Houston or Other Agency Storm Sewer .............................................. 19 Situations for Areas within the Existing Floodplain ............................................................. 19
6.6 1D Hydraulic Model Settings ....................................................................................................... 20

6.7 Configuration Parameters ........................................................................................................... 20 7.0 2D Model Components ................................................................................................................... 21
7.1 Terrain ......................................................................................................................................... 21 7.2 2D Surface .................................................................................................................................. 21
Types of Surfaces ............................................................................................................... 21 2D Surface Cell Size ........................................................................................................... 22 Multiple Surfaces ................................................................................................................. 23 Surface Adjustments ........................................................................................................... 23
7.3 Roughness Values ...................................................................................................................... 24 7.4 Inactive Areas/Voids ................................................................................................................... 24 7.5 2D Boundary Conditions ............................................................................................................. 25 7.6 Bank Lines ................................................................................................................................... 25 7.7 Direct Rainfall .............................................................................................................................. 27 7.8 2D Hydraulic Model Settings ....................................................................................................... 28
8.0 Model Results.................................................................................................................................. 29 8.1 1D Model Results ........................................................................................................................ 29 8.2 2D Model Results ........................................................................................................................ 30 8.3 Model Validation .......................................................................................................................... 30
9.0 Dynamic Modeling Deliverables ...................................................................................................... 32 9.1 Report .......................................................................................................................................... 32 9.2 Hydrology .................................................................................................................................... 33 9.3 Hydraulics .................................................................................................................................... 33 9.4 Submittal File Structure ............................................................................................................... 34 9.5 Design Deliverables .................................................................................................................... 34
10.0 References ...................................................................................................................................... 35
Appendix A – Model Submittal Checklist
Appendix B – Model Review Checklist

CITY OF HOUSTON Houston Public Works
Technical Modeling Guidelines for 2D Dynamic Storm Water Analysis 1 | P a g e March 2020
1.0 INTRODUCTION
1.1 Purpose The purpose of this document is to provide guidelines for developing and submitting two-dimensional (2D)
drainage models for City of Houston (City) storm water projects. These guidelines do not replace the City
of Houston Infrastructure Design Manual but aid in maintaining consistency in model development,
submittals, and reviews. Guideline specifics may not encompass terms and methodologies for all 2D
modeling software available; therefore, good engineering practices should be followed when applying the
guidelines for 2D model development.
1.2 Background The advent of increased computer processing capabilities and 2D modeling has allowed the City to enhance
the analysis and design of the storm sewer system throughout the City. 2D modeling allows the City to
produce more accurate ponding maps and better model the complex surface drainage patterns in the City.
The existing standards described in the City of Houston Infrastructure Design Manual (IDM), Technical
Papers 100 [1] and 101 [2], and the Harris County Flood Control District (HCFCD) Policy, Criteria, and
Procedure Manual (PCPM) [3], do not provide extensive guidance for 2D model development for storm
sewer applications. Therefore, the City project managers and consultants do not have a document that
provides consistent guidelines for 2D modeling as it pertains to City projects. This document provides a
description of dynamic 2D modeling and general guidelines for users. Terms used in the guidelines are
featured in Innovyze software InfoWorks ICM and XPSWMM; however, the concepts can be applied for
most 2D modeling software programs. The HCFCD Two-Dimensional Modeling Guidelines [4] may also
be a useful resource, though it pertains specifically to HEC-RAS 2D riverine modeling.
1.3 Disclaimer of Liability The following guidelines are intended for the sole purpose of the City and its contracting entities. The use
of these guidelines by any third party shall be at the sole and exclusive responsibility of such third party and
shall not create liability on the part of the City, Halff Associates, Inc., or any employee, agent, director or
officer of either of the two entities, for any claims, demands or causes of action that are related to or result
from third party’s use or reliance upon the information, guidance or administrative decision lawfully made
or resulting from, or included in the guidelines, or for any design issues, property damage, or personal injury
that may result from or which may be alleged to result from the use of the guidelines presented in the
Technical Modeling Guidelines for 2D Dynamic Storm Water Analysis or in any of its referenced materials.

CITY OF HOUSTON Houston Public Works
Technical Modeling Guidelines for 2D Dynamic Storm Water Analysis 2 | P a g e March 2020
2.0 TERMS AND DEFINITIONS 2D Model Mathematical model that allows hydraulic flows to be conveyed in two
directions
Boundary Conditions The water surface elevation or flow at the termination of the hydraulic model
Breakline Line used in 2D models to force alignment and/or shape of a 2D element
Drainage Area/Basin The surface area determined by topography that contributes rainfall runoff to a point of interception. The drainage area represents the drainage system service area and is not limited by the project boundary or street R.O.W. The possibility of overland flow contributions from adjacent drainage areas during certain extreme events shall be considered for accurate assurance of level of service.
Dynamic Model Hydraulic model than can account for channel storage, backwater, and pressurized flow as it routes the entire runoff hydrograph
Hydrograph Graph showing flow rates over time
LiDAR Light Detection and Ranging: Remote sensing method used to digitally examine the surface of the earth
Link Hydraulic connector between nodes in a drainage network. Any open or
closed device for conveying flowing water including culverts, ditches, and
storm sewers.
2D Mesh/Grid Area of cells used to calculate two-dimensional flow across a surface,
which can consist of square grids, irregular triangles, or irregular
polygons
Mitigation Measures taken to minimize flood risk and damage from storm water overflows
Node Calculation point of connectivity between links in the drainage network
Ponding Storm water runoff, usually considered as standing water, accumulating in low areas
RCP Reinforced Concrete Pipe: Circular shaped concrete link used to convey or store water
Runoff Storm water generated from rainfall not infiltrating the ground that flows over the ground surface
Static Model Hydraulic model using steady flow that assumes within each computation time step, flow is uniform and steady
Storm Sewer System Combination of features that convey storm water (e.g. storm sewer, box culvert, open channel, inlets, outfall, manholes, etc.)
Time of Concentration (Tc) The longest time required for a drop of water falling at the upper limit of a drainage area to travel to the point under consideration
Spill Crest Elevation Top of node elevation where the storm drainage system will become
pressurized and the excess volume will either leave the system, become
storage, or spill onto the 2D surface
Storm Water Model Mathematical model of a drainage system used to analyze the behavior
of the system during rainfall events
CITY OF HOUSTON Houston Public Works
Technical Modeling Guidelines for 2D Dynamic Storm Water Analysis 3 | P a g e March 2020
3.0 HYDROLOGY AND HYDRAULICS OVERVIEW
3.1 Introduction to Storm Water Modeling During rainfall events in highly urbanized areas, storm runoff typically drains to the streets and travels via
the street gutter to a curb inlet or roadside ditch. The curb inlet or roadside ditch then collects the runoff
and conveys it to an underground storm sewer system (pipe or box). The underground system conveys
the runoff to a series of larger underground storm sewer systems that ultimately discharges to a drainage
channel or a natural stream. The City’s storm water drainage system consists of underground storm sewer,
roadside ditches, swales, streams, bayous, streets, and detention facilities.
A storm water model is a hydrologic and hydraulic mathematical model of a storm water system used to
analyze the behavior of the system during rainfall events. Hydrologic and hydraulic models related to storm
drainage analysis consist of applying rainfall to a drainage system to determine the flow through the system
and the resultant above-ground ponding. A model can replicate how a storm event impacts the drainage
network as well as private and City infrastructure. Models are used to both analyze and design drainage
systems.
Engineers use two types of hydrologic and hydraulic models to study storm drainage: steady and dynamic.
Steady models have been traditionally used for analysis and design of storm sewer systems. Steady flow
routing assumes that within each computational time step, flow is uniform and steady [5]. In contrast, a
dynamic model can account for channel storage, backwater, and pressurized flow as it routes the entire
runoff hydrograph through the model [5]. Dynamic models give a more holistic picture of the impacts of a
storm event on the drainage network. These guidelines will focus on dynamic modeling.
2D models are dynamic models in which surface flow can travel in multiple directions. These models are
useful when the direction of overland flow can vary and is complex, such as in urban settings. The model
calculates flow, velocity, and water surface elevations for the entire overland area for each time step of the
simulation and provides depth and velocity information.
Data input into a hydrologic and hydraulic model includes rainfall amounts and timing, above-ground soil
and land use types, and the characteristics of the storm sewer network and overland flow paths. The results
of a model simulation can include ponding depth maps, time of inundation, and flows and velocities of storm
runoff throughout the network. Models help engineers and planners design a system to convey storm
events and determine the impact to downstream infrastructure. 2D models also provide graphical and
visual results that assist in communicating the impacts of projects to other agencies and the public.
3.2 Appropriate Use of Dynamic Models Dynamic modeling may require additional engineering effort compared to traditional modeling methods and
may not always be needed when designing a storm sewer system. However, dynamic models can better
assess the existing storm drainage issues and potentially deliver more effective solutions.
Modeling provides the City and the engineer with additional resources and information regarding the
drainage network. Dynamic modeling is appropriate and beneficial when:
• Drainage networks are complex with interconnecting storm sewers and overflows
• Overland flow paths are complex, such as sheet flow in flat terrain areas
• There has been a history of drainage concerns for the area
• Detention is required to mitigate downstream flow rates
• The downstream boundary condition can control the water surface elevation
• A traditional design does not provide adequate drainage
• Visual aids for conveying information to the public are needed

CITY OF HOUSTON Houston Public Works
Technical Modeling Guidelines for 2D Dynamic Storm Water Analysis 4 | P a g e March 2020
3.3 Model Scenarios To demonstrate the benefits of hydraulic improvements, a drainage analysis requires two modeling
scenarios: existing and proposed conditions. Existing conditions simulations evaluate the capacity of the
system prior to any improvements. Proposed conditions simulations evaluate the capacity of the proposed
improvements and the impacts to the receiving systems. The effectiveness of improvements and impacts
to receiving systems can only be evaluated when both existing and proposed conditions are modeled. The
existing and proposed conditions models have identical components and features except for the proposed
improvements.
3.4 Model Stages There are typically two stages of models used in the City: planning and design. The appropriate level of
detail is determined by the stage of the project.
Planning-Stage Models Planning-stage models provide the City with an accurate depiction of the existing conditions within a
drainage system and are used to develop drainage improvement projects. By utilizing up to date as-built
infrastructure information and topographic data, planning-stage models can accurately determine existing
inadequacies in the storm drainage infrastructure network and predict overland sheet flow patterns,
including potential overland impacts from offsite areas, to identify areas at risk to excessive ponding. The
drainage system can then be modeled to propose the most appropriate improvements required to address
inadequacies and alleviate excessive ponding risk. The proposed conditions model can quantify mitigation
volumes and identify potential locations for detention, considering any potential utility conflicts or other
issues that may impact constructability. The planning-stage model can then be used to develop design-
stage models. It is anticipated that planning-stage models will be incorporate 2D dynamic analysis.
Design-Stage Models Design-stage models provide the engineer with the detail required to develop design plans for the network.
A design-stage model may include the entire drainage network including inlets, laterals, and main trunk
storm sewer. Parameters for the drainage network may be obtained using field survey. The model is used
to determine the storm sewer elevations and resulting hydraulic grade lines for the plan set design drawings.
A design-stage model should include both the existing and proposed conditions to ensure there is no
adverse impact to downstream infrastructure and receiving channels. If 2D modeling is used for the design,
traditional calculations (i.e., HouStorm) per the City IDM may be requested by the City to validate that the
proposed hydraulic grade lines from the 2D model meet appropriate City criteria.
3.5 1D Versus 2D Hydraulic Modeling Dynamic models can be one-dimensional (1D) or two-dimensional (2D). For both methods, the input
requires a set of calculation points to determine where the modeling software will calculate results including
water surface elevations, flows, and velocities.
1D models calculate changes in velocity, depth, and flow in one defined direction. The direction of flow is
specified by the model setup. An example of 1D modeling software for open channel systems is the United
States Army Corps of Engineers’ (USACE) program, HEC-RAS. Cross sections drawn by the user
represent the river flow area and path. Calculations for the velocity, depth, and flow are only tabulated at
each calculation point, or in the case of the HEC-RAS model, the cross section.
For a storm sewer system, calculation points are called nodes and represent manholes, inlets, and changes
in storm sewer characteristics. At these locations, the model calculates the water surface elevation. 1D
models assume conveyance, velocities, and other forces are only significant in the stream direction, and
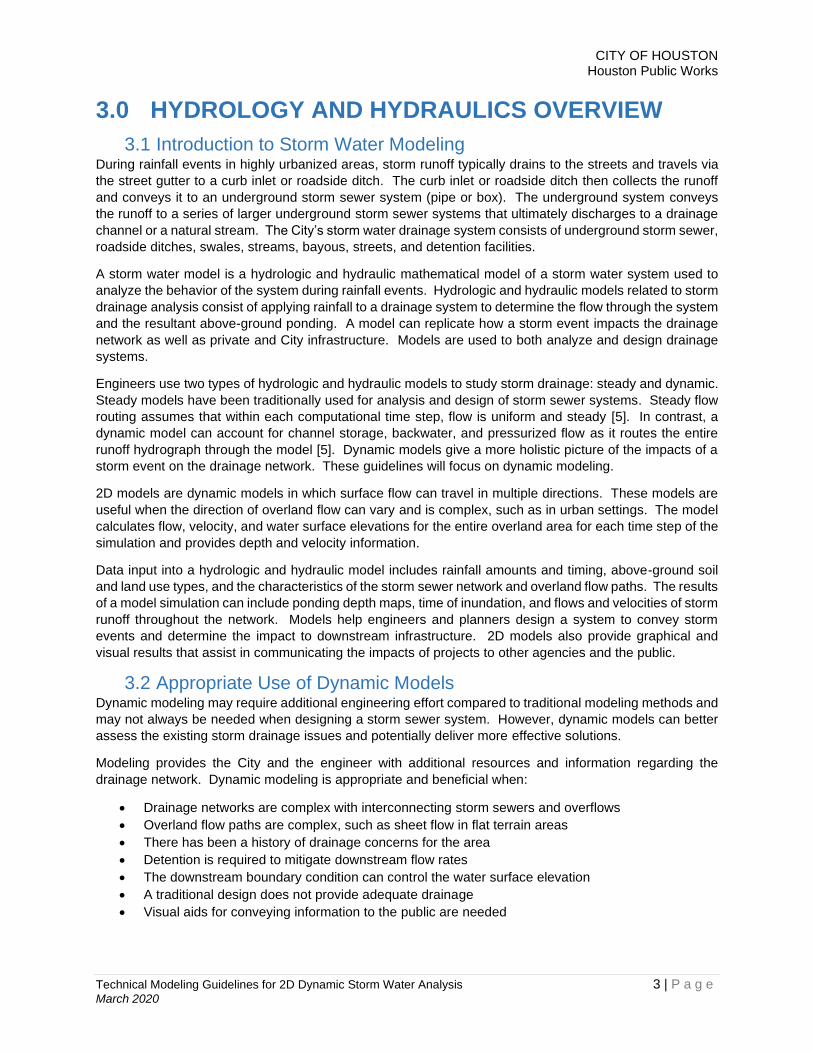
the hydraulic parameters can be modeled using cross sections perpendicular to the flow direction. 1D
models are applicable when the direction of flow is constant, as in well-defined open channels and closed
storm sewer. An example of a 1D model layout is shown in Figure 1. Hydraulic parameters are represented
CITY OF HOUSTON Houston Public Works
Technical Modeling Guidelines for 2D Dynamic Storm Water Analysis 5 | P a g e March 2020
using cross sections perpendicular to the flow direction. The red dots represent the calculation points.
Results are interpolated between the calculation points.
Figure 1: 1D Model Example
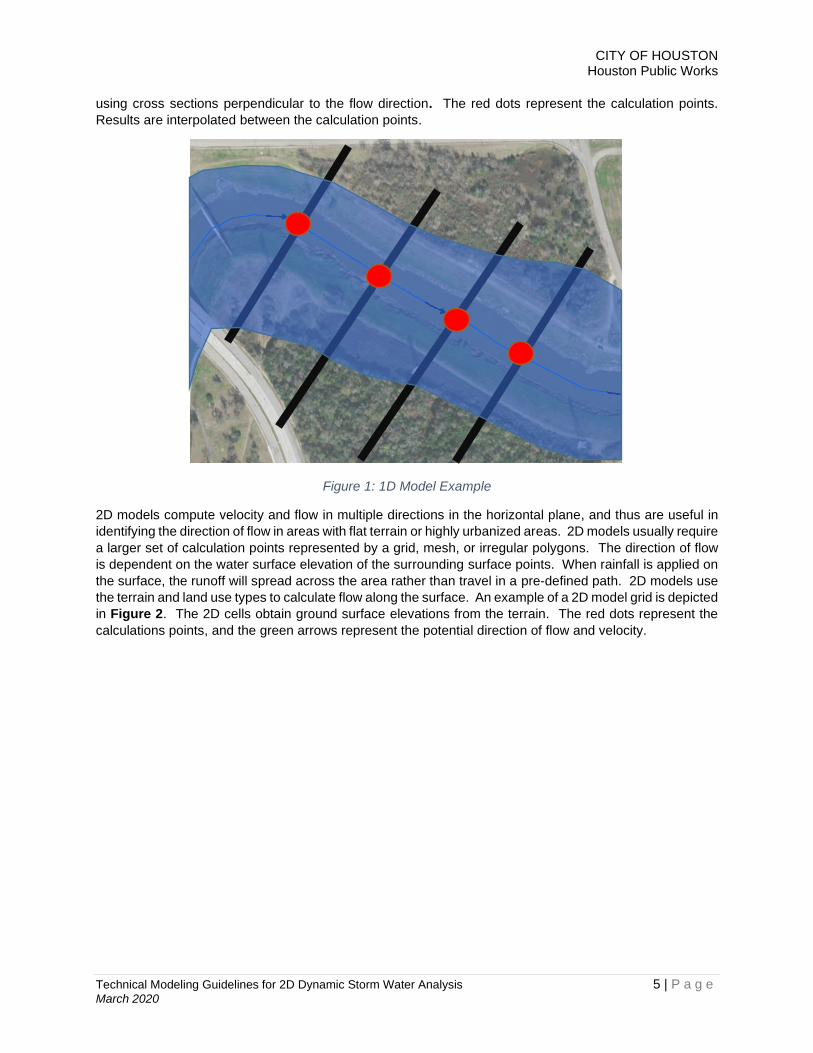
2D models compute velocity and flow in multiple directions in the horizontal plane, and thus are useful in
identifying the direction of flow in areas with flat terrain or highly urbanized areas. 2D models usually require
a larger set of calculation points represented by a grid, mesh, or irregular polygons. The direction of flow
is dependent on the water surface elevation of the surrounding surface points. When rainfall is applied on
the surface, the runoff will spread across the area rather than travel in a pre-defined path. 2D models use
the terrain and land use types to calculate flow along the surface. An example of a 2D model grid is depicted
in Figure 2. The 2D cells obtain ground surface elevations from the terrain. The red dots represent the
calculations points, and the green arrows represent the potential direction of flow and velocity.

CITY OF HOUSTON Houston Public Works
Technical Modeling Guidelines for 2D Dynamic Storm Water Analysis 6 | P a g e March 2020
Figure 2: 2D Model
3.6 Model Approach Decision Matrix Figure 3 is a simplistic decision matrix for determining which type of model may be appropriate for the
project area. The model approach will vary highly depending on the level of the study, the drainage features
of the area, and the overland drainage patterns. While the matrix provides guidance, engineering
judgement and input from the City may be used to determine which model approach to use for the project.

CITY OF HOUSTON Houston Public Works
Technical Modeling Guidelines for 2D Dynamic Storm Water Analysis 7 | P a g e March 2020
Figure 3: Modeling Decision Matrix

CITY OF HOUSTON Houston Public Works
Technical Modeling Guidelines for 2D Dynamic Storm Water Analysis 8 | P a g e March 2020
4.0 DYNAMIC MODELING Dynamic modeling represents the behavior of the storm sewer system over a time interval such as a storm
event. Dynamic modeling involves routing an entire storm event through the drainage network and
tabulating results. A dynamic model can include hydrology, 1D hydraulics, and 2D hydraulics.
Conventional 2D dynamic models apply flow hydrographs at node locations and allow surcharge (the flow
unable to enter the storm sewer due to capacity) to leave the underground system and spill onto the 2D
surface or the 1D surface links. The excess storm water will bypass the inlets and continue down the street,
often collecting to significant depths in low areas. Resultant ponding maps show the runoff that was unable
to enter the system. New approaches such as direct rainfall analysis (Section 7.7) model runoff towards
the storm sewer. Direct rainfall ponding maps identify depths upstream of the storm sewer system.
4.1 Hydrology Hydrology for dynamic studies requires creating hydrographs for each drainage basin rather than computing
only the peak flow. The hydrograph is determined based on the timing of the rainfall and the characteristics
of the watershed or drainage basin.
Hydrographs may be developed for each delineated drainage basin using HEC-HMS or within the hydraulic
modeling software if available. All parameters and methodology specified in the IDM should be used in the
programs. The hydrographs will need to be applied into the hydraulic software at the corresponding inflow
node locations.
4.2 Hydraulics Hydraulics is the study of how the rainfall runoff flows through the drainage network of underground
systems, surface flow, and other storm water features. The results of a hydraulic analysis include water
surface elevations and flows for each drainage feature. Most hydraulic models consist of a network of
nodes and links representing the existing and proposed drainage conditions.
1D Components The hydraulic computations for dynamic models can include both 1D and 2D features. 1D features only
allow flow to travel in an assumed direction. Manholes, inlets, storm sewer, channels, weirs, and ditches
are typically modeled using 1D components. These features are represented by nodes and links. The flow
hydrographs are applied to these systems to determine how runoff will behave during a storm event.
Hydrographs are applied at nodes throughout the network.
2D Components 2D components of a model allow flow to travel in multiple directions. The 2D portion of a model is typically
represented by the terrain. Flow in 2D models is passed from cell to cell using St. Venant or Diffusion Wave
equations based on the momentum and elevation of water in each cell. 2D components include terrain,
elevation polygons, roughness zones, grids and/or meshes, breaklines, inactive areas and bank lines.

CITY OF HOUSTON Houston Public Works
Technical Modeling Guidelines for 2D Dynamic Storm Water Analysis 9 | P a g e March 2020
5.0 HYDROLOGY OVERVIEW Hydrology is the study of occurrence, distribution, movement, and properties of the waters of the earth [6].
It consists of analyzing rainfall patterns, determining the infiltration into the ground, studying evaporation
and transpiration rates, and determining the timing of runoff. The results of a hydrologic study include
hydrographs showing the flow rates over time based on a rainfall event. A hydrograph is a graph or table
showing the flow rate as a function of time at a given location in the drainage network [3]. An example of a
hydrograph is included in Figure 4.
Figure 4: Hydrograph Example
5.1 Rainfall Hydrologic methods used for analysis and design for the City range from Rational Method equations to
synthetic hyetographs to gauged rainfall. Rainfall used for developing hydrographs can be obtained from
the City IDM. The IDM specifies drainage design criteria for the 2-year (50% annual exceedance) and
100-year (1% annual exceedance) storm events.
Other storm events may be required or used to assess the existing and proposed design. Typical frequency
events such as the 5-year, 10-year, 25-year or 50-year can be used to assess the level of service of an
existing or proposed system. Historical storms or gauged data can validate the results of a hydraulic model.
The rainfall information for these storms can be obtained from the National Weather Service, private rainfall
entities, or gauge information from the Harris County Flood Warning System. The rainfall information can
be applied to the hydrologic model to obtain resultant hydrographs for the hydraulic model. Validation of
storm events is further discussed in Section 8.3.
0
10
20
30
40
50
60
5/26/2016 5/27/2016 5/28/2016 5/29/2016 5/30/2016
Flo
w (
CFS
)
Date
Hydrograph

CITY OF HOUSTON Houston Public Works
Technical Modeling Guidelines for 2D Dynamic Storm Water Analysis 10 | P a g e March 2020
5.2 Drainage Area Drainage areas are the surface area determined by topography that contributes rainfall runoff to a point of
interception [7]. Drainage areas are delineated from available topographic information, field investigation,
and/or as-built plans. For planning-level studies, drainage areas can be delineated at either the trunk line
or inlet level. For the trunk line level analysis, consideration can be given to delineate the drainage areas
down to the level where flow changes occur. Typical flow location changes are groups of inlets along the
main trunk line and locations of lateral storm sewers. For design-level models, drainage areas are typically
delineated at the inlet level so that each inlet is included in the model.
Delineated drainage areas include areas outside the project study area that may contribute to runoff to the
drainage network. This may include upstream or adjacent areas that overflow into the project area during
extreme storm events.
5.3 Losses As precipitation falls from the atmosphere, a portion of the rainfall is absorbed into the ground and
vegetation and does not contribute to runoff. This portion of rainfall is referred to as hydrologic loss. Losses
include interception, depression storage, infiltration, and evapotranspiration [6]. Losses for the City are
accounted for by the Rational Method runoff coefficient for static models and the Green and Ampt
parameters in dynamic models. Values for these parameters can be found in the City IDM. If outside
agency coordination requires a submittal, then parameters may need to follow other standards.
5.4 Hydrograph Method Hydrologic routing is a process used to determine the variations in flow rate for a flood wave as it moves
through a watercourse [6]. It is used to determine the shape of the flow hydrograph for the drainage basin.
Routing determines how the rainfall runoff volume is distributed over time. The Clark Unit Hydrograph is
the most commonly used transform in Harris County. The Clark Method requires the calculation of the peak
flow, time of concentration (Section 5.5), and the Clark storage coefficient (Section 5.6).
5.5 Time of Concentration The time of concentration is defined as the travel time from the hydraulically furthest point in a watershed
to the outlet [8]. The time of concentration represents how quickly the watershed responds to rainfall runoff.
The City IDM provides an equation that can be used to calculate the time of concentration based on the
area of the basin. Refer to the City IDM for other acceptable methods.
5.6 Hydrograph Development The City IDM specifies that for drainage basins less than 200 acres, the peak flows can be determined from
the Rational Method. The Rational Method only provides a peak flow rate for a drainage area. Dynamic
models simulate an entire hydrograph rather than just the peak flow; therefore, a flow hydrograph is required
for each drainage area in the model. The City IDM specifies using the Clark Unit Hydrograph and calibrating
the Clark storage coefficient (R) so that the peak flow from the hydrograph for each basin matches the peak
flow calculated using the Rational Method. The process is detailed the City IDM (2019).
CITY OF HOUSTON Houston Public Works
Technical Modeling Guidelines for 2D Dynamic Storm Water Analysis 11 | P a g e March 2020
6.0 1D MODEL COMPONENTS
6.1 Data Sources The model input data should match the available information from data sources. Recommended sources
include:
• City of Houston Public Works GIS Website (GIMS)– The website includes storm sewer information
for much of the City including the location, size, invert, material, and length. This data can be
downloaded into GIS format and incorporated into the hydraulic model. The data should be verified
with plans and/or field survey. The datum for the invert elevations may need to be adjusted to
match with the latest terrain data (Section 6.2).
• Terrain data – Terrain data is typically produced by LiDAR and can be obtained through regional
entities. The latest terrain data is recommended to ensure accuracy for the analysis.
• As-built or Plan Drawings – Record drawings are available from the City. Any elevations from the
plans may need to be adjusted to match the latest terrain data (Section 6.2).
• Survey or Field Measurements – Survey and field measurements can be used to develop or modify
a model. The survey can be based on the same datum as the terrain information or adjusted as
needed.
• Prior Studies – Prior studies and models can be used to develop the hydraulic model. If prior
information is used, it can be verified with other available sources.
In some cases, the preferred sources are not available for every section of the drainage network. For these
instances, engineering assumptions may be made to complete a model. Assumptions may include size,
location, and invert of storm sewer elements. Any assumptions would need to be documented in the model
and report.
6.2 Model Datum 2D dynamic models rely on a terrain surface to simulate overland flow. The surface is typically created
from the latest available LiDAR information. The 1D information for the nodes and links may be obtained
from GIS, as-built record drawings, or survey, and these may differ in datums. The datum for the hydraulic
model should be consistent with all the varying data sources (link data and surface data). To determine if
the datums are the same, the survey data sheet provided with the as-built record drawings can be compared
to the datum for the LiDAR data used. Another method is to compare the ground elevations of the road
shown on the as-built record drawings and the ground elevation of the LiDAR.
The datum for all available data should be consistent. The preferred horizontal datum is the North American
Datum 1983 (2011 adjustment) and the preferred vertical datum is the North American Vertical Datum 1988.
One method is to shift the 1D sources to the same datum as the LiDAR. This will allow ponding depths and
water surface elevations to correlate to the latest terrain data. Another method is to shift the terrain data to
the datum of the 1D information. Whichever method is used, the datum should be consistent with all the
data and should be documented in the hydraulic report.
CITY OF HOUSTON Houston Public Works
Technical Modeling Guidelines for 2D Dynamic Storm Water Analysis 12 | P a g e March 2020
6.3 Nodes Model nodes represent the point of connectivity between links in the drainage network [9]. Links between
each node are uniform, so nodes are used for each change in shape, size, slope, or at a junction of links.
Nodes are also used at system outfalls to assign a boundary condition. The node location generally
represents the geographical location of the drainage feature. Nodes also connect the 1D link network to
the 2D surface.
In most modeling software, the node has four essential inputs for the simulation: 1) spill crest/ground
elevation, 2) invert elevation, 3) node type, and 4) storage. Terminology can vary depending on the
software but the concepts are consistent.
Spill Crest/Ground Elevation The node spill crest elevation refers to the physical top of the junction. This may be either a real or
conceptual upper limit to the junction [9]. The spill crest elevation will be set differently for 1D and 2D
models. The spill crest elevation is the elevation at which the storm sewer will become pressurized and
flow will begin to interact with the surface.
For 1D models, the spill crest for a closed system (underground storm sewer) is set at the top of ground for
the location of the node. For open channel links (channels and weirs), the spill crest elevation can be set
above the highest anticipated water surface elevation if the top of bank is exceeded. This will ensure that
the open channel will not be pressurized during the simulation.
For dynamic models, the spill crest elevation will vary depending on the model component. For 2D inlet
nodes, the spill crest elevation is generally the throat elevation of the inlet. This is the elevation at which
the inlet will begin to interact with the roadway gutter. For manholes, junctions, and locations of storm
sewer changes, the spill crest elevation is typically the ground elevation at that location. For riverine or
open channel nodes, the spill crest is set above the highest anticipated water surface elevation to ensure
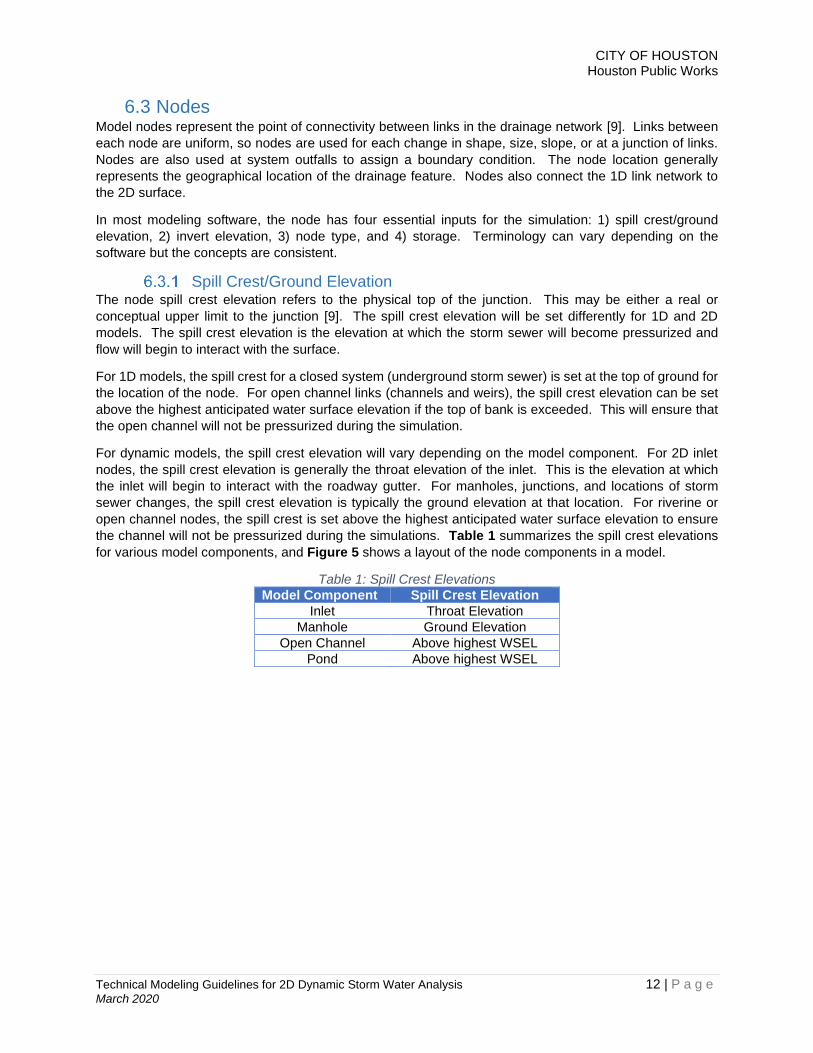
the channel will not be pressurized during the simulations. Table 1 summarizes the spill crest elevations
for various model components, and Figure 5 shows a layout of the node components in a model.
Table 1: Spill Crest Elevations
Model Component Spill Crest Elevation
Inlet Throat Elevation
Manhole Ground Elevation
Open Channel Above highest WSEL
Pond Above highest WSEL

CITY OF HOUSTON Houston Public Works
Technical Modeling Guidelines for 2D Dynamic Storm Water Analysis 13 | P a g e March 2020
Figure 5: Node Components in a Model
Invert Elevation The invert elevation of a node refers to the bottom of the node [9]. The node invert is typically set to be the
bottom of the lowest connected link invert to ensure the program will run properly. Most software packages
have the capability to set the invert default to the lowest connected link. Inverts for storage nodes or ponds
are set to the elevation of the bottom of the pond.
Ponding Type The ponding type for a node specifies how the model calculates surcharge when the hydraulic grade line
reaches the specified spill crest elevation [9]. Most software packages have at least four ponding types for
nodes. The ones included here are the most common types, and the terminology is specific for XPSWMM.
However, the discussion is relevant for all software.
• Ponding Type None – For the “none” ponding option, when the hydraulic grade line exceeds the
spill crest elevation, the flow above the spill crest is lost from the analysis. This option is rarely
used because flow and volume may be lost from the model.
• Ponding Type Allowed – For the “allowed” ponding option, when the hydraulic grade line exceeds
the spill crest elevation, the volume above the spill crest elevation will be stored. The amount of
storage above the spill crest can be set as a default curve or specified with a depth-area
relationship. The default curves can be used to approximate a solution in the beginning stages of
model-building; however, it should generally be avoided for a detailed analysis, as the storage may
not represent actual conditions. The “allowed” option is common in 1D models to represent the
above-ground surface storage when the depth-area relationship is specified. The option is rarely
used in 2D models as the surface is represented by the 2D grid.
• Ponding Type Sealed – For the “sealed” option, when the hydraulic grade line exceeds the spill
crest, the system becomes pressurized. This option is typically used for manholes and junctions
that do not interact with the 2D surface. The spill crest elevation should be reviewed to ensure that
the actual system can be pressurized.
• Ponding Type 2D – For the “2D” option, when the hydraulic grade line exceeds the spill crest
elevation, the water above the spill crest can flow onto the 2D surface. Excess flow from the surface
is also allowed to interact with the 1D node at this location. For “2D” nodes, the water is transferred
directly to the grid or mesh element where the node is located. “2D” nodes typically represent
inlets, outfalls, headwalls, and riverine nodes in a drainage network.

CITY OF HOUSTON Houston Public Works
Technical Modeling Guidelines for 2D Dynamic Storm Water Analysis 14 | P a g e March 2020
Storage Node storage is the volume of water that can be retained in the node during the simulation. Storage is used
to model features such as detention facilities, underground chambers, and the above-ground surface, etc.
The storage included in the model represents the actual storage available in the drainage network. For
both 1D and 2D models, it is often best to represent a detention facility with a storage node. For the facility,
a depth-area curve can be developed from available as-builts, plan drawings, LiDAR, or survey. The depth-
area curve should begin at the invert of the outlet structure and end at the top of bank.
• Subsurface Detention – Underground chambers include large junction boxes, manholes, and
underground detention. While the volume of the infrastructure may be minor compared to the total
volume of the system, these nodes can be modeled with storage to represent the volume of the
chamber. Depending on the node type, the volume can be represented with a depth-area curve or
with a constant area. For the constant area option, the area remains the same for all water surface
elevations.
• Surface Detention – The ground surface in much of the City consists of flat terrain which does not
provide significant conveyance during storm events. The system performs more like a storage
facility than a link. With a 1D dynamic model, the above-ground surface can be modeled with a
storage node. The storage can be defined as a depth-area curve with the depth and area obtained
from available LiDAR or survey. The City has documentation discussing the process of obtaining
a depth-area curve using LiDAR and ArcGIS. It is important that volumes using this method are
not double counted with surface flow links (Section 6.4.5).
Inlet Capacity Inlets in a storm sewer network allow surface runoff to enter the underground drainage system. Inlets are
modeled in dynamic models with flow restrictions to control the interaction between the 1D and 2D systems.
Restrictions can include rating curves, maximum capacities, and exponential functions. Inlets can also be
modeled as weir/orifice combinations with appropriate discharge coefficients. The results of the dynamic
model inlet should be reviewed for engineering soundness. Coefficients can be adjusted to match real
world conditions and may vary depending on the inlet type.
Inflow Locations Nodes will also represent inflow locations into the model. Inflow locations may include inlets, offsite storm
sewer (storm sewer draining to the network but not modeled hydraulically), and overland drainage (storm
water runoff from other watersheds). Hydrographs developed from the hydrology model can be applied to
the nodes to represent the inflow location. One inflow location is generally included for each drainage
basin.

CITY OF HOUSTON Houston Public Works
Technical Modeling Guidelines for 2D Dynamic Storm Water Analysis 15 | P a g e March 2020
Outfalls Outfall nodes are locations where the storm sewer system empties into a channel or other drainage system
and are considered the endpoints of the model. A model can have multiple outfalls depending on the
drainage network and model extents. Outfalls are located at the bounds of the study typically at
channels/ditches or junctions with storm sewer. A boundary condition can be set for the outfall to determine
the impact of the downstream tailwater on the system. The boundary condition is further discussed in
Section 6.5.
6.4 1D Hydraulic Links Hydraulic model links represent the connection between the nodes of a system [10]. Links provide a method
of conveyance between the calculation points. Hydraulic links can represent storm sewer, open ditches,
channels, roadways, weirs, pumps, backflow prevention devices, orifices, restrictors, and overland sheet
flow. Link locations in the model should generally represent the geographical location of the 1D drainage
feature.
Data Input Typical link data includes the shape, size, invert elevation, material, length, slope, and headloss. This data
is used to represent the 1D link in the model.
• Shape – The cross-sectional shape of the hydraulic link. Shapes include circular, rectangular,
trapezoidal, natural channel, oval, or user-specified. The shape should represent the actual shape
of the drainage feature.
• Size – The size of the link references the cross-sectional dimensions. The input will vary depending
on the shape selected. Typical input includes the diameter, height, width, or station/elevation data.
• Elevations – The invert elevations of the link including the upstream and downstream inverts.
• Material – The material is input using the friction roughness value (typically Manning’s value).
Acceptable Manning’s values can be obtained from the City IDM or, if missing, the HCFCD PCPM.
• Length – The length of the link between the two node locations. The length represents the actual
field length from the record drawings, not the model length between the nodes as these may be
spatially different. Some software packages have performance issues with link lengths smaller
than 33 feet. It is recommended to avoid small lengths when possible.
• Slope – The slope of the link between the nodes. The slope can be calculated from the input length
and invert elevations in most software packages.
• Headloss – The headloss refers to the minor losses within the system occurring at changes in the
links and junctions. Headloss coefficients may be adjusted to simulate the minor losses in the
system. Losses should be verified with typical headloss equations.
• Station/Elevation – Irregular channel links require station/elevation information to represent the
channel cross section. Stations and elevations can be obtained from field survey, LiDAR, and/or
previous models such as the HCFCD FEMA effective models.
• Flow Direction – The hydraulic link calculation can be adjusted to prevent backflow in the link. This
option can be selected if the system includes backflow prevention devices to prevent flow from the
receiving system.
• Weir Length – Length of the weir
• Weir Crest Elevation – Elevation of the crest of the weir. The elevation in which spill begins.
• Weir Crown Elevation – Top of the weir where the weir begins using the orifice flow calculations
• Orifice Area – Area of the weir
• Discharge Coefficient – Discharge coefficient for orifice calculations

CITY OF HOUSTON Houston Public Works
Technical Modeling Guidelines for 2D Dynamic Storm Water Analysis 16 | P a g e March 2020
Storm Sewer Storm sewer is the most common 1D dynamic model component. Storm sewer is modeled as a 1D link
with nodes located at manholes, junctions, storm sewer characteristic changes, outfalls, headwalls, and
inlets. The parameters of the storm sewer represent the actual conditions provided from survey, field
investigation, as-built record drawings, and/or GIS shapefiles.
Roadside Ditches Roadside ditches are modeled as either natural or channel sections in the 1D network depending on the
shape. If the shape is triangular or trapezoidal, then a channel section can be used. If the shape is irregular,
then the natural section can be used with user-specified stations and elevations. The model should also
include the headloss of the driveway and cross culverts in the roadside ditch system. Driveway culvert
input data are the same as the input for the storm sewers. For 1D models only, driveway culverts can be
grouped for reaches of the ditch.
For 2D models, the roadside ditches can be modeled either by defining the 2D mesh within the ditch or by
1D/2D river sections. The 2D surface cell size may need to be reduced to define in detail the roadside ditch
invert and flow area. The roadside ditches can be linked to the 2D via bank lines to allow overflow to travel
onto the 2D mesh. Bank lines are discussed in Section 7.6.
Channels Much of the City’s drainage network discharges into HCFCD channels. These channels can be included
in dynamic models to properly assess the tailwater condition of the City drainage network. Two types of
cases for including HCFCD channels within the dynamic model are outlined below. For both cases, HCFCD
guidance can be referenced for modeling the channel.
6.4.4.1 Case #1 – FEMA Studied Stream If the HCFCD channel is a FEMA modeled stream, then the hydraulic model for the channel can be imported
into the dynamic model and included in the analysis. FEMA stream models are available through the
HCFCD Model and Map Management website (www.m3models.org). The model provided will include cross
section geometry and crossing structure information for the length of stream. The model can be truncated
as needed, provided that the truncation does not alter the downstream results. Since the existing hydraulic
models are steady state, inflow hydrographs may need to be developed or obtained from the existing
hydrologic models.
6.4.4.1 Case #2 – Non-FEMA Studied Stream If the HCFCD channel is a non-FEMA modeled stream, then likely a hydraulic model does not exist. For
this condition, channel components will need to be included in the dynamic model. While the model may
not need the detail for a FEMA submittal, the major components of the channel should be included to
achieve an accurate downstream boundary condition including cross sections and major crossing
structures. The HCFCD PCPM and HCFCD Hydrology & Hydraulics Manual have guidance regarding
cross section spacing, roughness values, and bridge/culvert data.
Surface Flow Surface flow can be modeled in 1D or 2D and represents the runoff accumulating and flowing through
streets and overland sections. For 1D systems, surface flow is accounted for in 1D links, typically natural
or channel sections. The shape selected should generally represent the cross section of the overland flow,
such as the typical street section. The elevations can be obtained from survey or available LiDAR data.
For 1D-only models, surface flow should also account for overland flow areas outside of the right of way.
These are areas where runoff may flow between streets such as behind houses and buildings. The cross
sections should represent the typical overland section.
Recommendations for 2D modeling of surface flow are discussed in Section 7.0.

CITY OF HOUSTON Houston Public Works
Technical Modeling Guidelines for 2D Dynamic Storm Water Analysis 17 | P a g e March 2020
6.5 1D Outfall Boundary Conditions (Tailwater) Establishing tailwater condition is a critical step in hydraulic modeling. The City IDM (Section 9.2.01(5))
address the steps necessary to determine the appropriate outfall boundary condition for the project. As
with any analysis, consideration should be made to offsite flow and how it may impact the downstream
storm sewer system. This section discusses how to apply the boundary conditions to the dynamic model.
The engineer should document the approach followed for selecting the model boundary conditions. 2D
dynamic models have boundary conditions for both the 1D and 2D portions of the model. The 2D boundary
conditions are discussed in Section 7.5.
1D outfalls consist of nodes at the boundary of the study extent. Outfalls may include discharge points into
channels or storm sewer. Depending on the receiving drainage feature and storm event, different outfall
conditions can be used.
• Free Outfall – Free Outfall allows the flow to leave the system under specified conditions. The
tailwater elevation will be set to either normal or critical depth. The water surface at the outfall is
calculated based on the flow leaving the system. This option may only be applicable for frequent
storm events such as the 2-year storm. Figure 6 shows typical results of a free outfall storm sewer
system.
Figure 6: Free Outfall Boundary Condition Storm Sewer Profile
• Fixed/Static Backwater – Fixed Backwater is a constant and fixed elevation for the tailwater
elevation. Flow will leave the system when the upstream water surface elevation is higher than the
set backwater elevation. Flow will also back into the system if the tailwater elevation is higher than
the elevation of the drainage network. Using a static tailwater for the dynamic model can introduce
volume into the system that does not physically occur. A fixed backwater can introduce instability
in a dynamic model. Using a static tailwater could also result in an oversized drainage system.
Figure 7 shows typical results of a fixed backwater outfall storm sewer system.
Hydraulic
Grade Line
Ground
Elevation
Storm Sewer

CITY OF HOUSTON Houston Public Works
Technical Modeling Guidelines for 2D Dynamic Storm Water Analysis 18 | P a g e March 2020
Figure 7: Fixed Backwater Boundary Condition Storm Sewer Profile
• Stage Hydrograph – A stage hydrograph is a varied elevation over time at the tailwater location.
The stage hydrograph can be based on actual gauge data, developed from a channel rating curve,
or developed from another model approved by the City. The stage hydrograph timing should be
equivalent to the timing of the local rainfall applied to the model assuming that rainfall is occurring
simultaneously in the stage hydrograph basin and the local basin. An example of a stage
hydrograph is shown on Figure 8.
Figure 8: Stage Hydrograph Boundary Condition
• Rating Curve – A rating curve can be applied to the outfall node that relates the elevation at the
outfall to the flow through the last outfall link. A rating curve is generally only applicable if the outfall
is at the upstream end of a studied channel as the curve requires all flow contributing to the location
to be included in the model. An example of a rating curve is shown on Figure 9.
20
22
24
26
28
30
32
0 5 10 15 20 25
Stag
e (f
t)
Time (hr)
Stage Hydrograph
Hydraulic
Grade Line
Ground
Elevation
Storm Sewer

CITY OF HOUSTON Houston Public Works
Technical Modeling Guidelines for 2D Dynamic Storm Water Analysis 19 | P a g e March 2020
Figure 9: Rating Curve Boundary Condition
Outfalls into HCFCD Channels Much of the City’s drainage network discharges into HCFCD channels. As discussed in Section 6.4.4,
these models can be included in the dynamic model to provide a comprehensive analysis of the drainage
system. In all cases where the system outfalls into a HCFCD channel, establishing a tailwater in the outfall
is an important part of the project.
The stage hydrograph option provides a varying tailwater needed for a dynamic model. The hydrograph
can be developed from the effective hydrologic and hydraulic models for the HCFCD channel. The timing
of the rainfall for both the stage hydrograph and the local dynamic model should be equivalent.
The fixed backwater option can be used if a stage hydrograph is not available. The fixed backwater can
be set to the maximum elevation of the downstream channel for the frequency storm event. However, a
fixed backwater tailwater can be a source of instabilities.
For unstudied streams, the capacity of the receiving channel may need to be evaluated to determine the
tailwater on the storm sewer system. Including the system in the modeling may be required. Section
6.4.4.1 discusses methodologies for these streams.
Outfalls into City of Houston or Other Agency Storm Sewer If the drainage system outfalls into another City or governmental agency storm sewer, the capacity of the
downstream system may need to be evaluated. Based on the downstream capacity, an appropriate
boundary condition can be applied. The assumptions can include the capacity of the downstream system
and any backwater impacts from downstream floodplains.
Situations for Areas within the Existing Floodplain In many cases, project areas are in existing 100-year or 500-year floodplains. For these areas, the
backwater elevation may inundate the project area even without local runoff. Design and analysis of the
existing or proposed drainage infrastructure will be highly dependent on the backwater elevation and may
make design goals potentially unachievable. TxDOT frequency analysis curves can be used to determine
if a lower tailwater can be used for the project. These curves relate the drainage area of the project to the
drainage area of the receiving system. In some cases, a lower frequency boundary condition can be
applied. The methods discussed will apply to the stage hydrograph and fixed backwater options. Boundary
conditions for these areas should be discussed with City staff.
20
22
24
26
28
30
32
0 100 200 300 400 500 600
Elev
atio
n (
ft)
Flow (cfs)
Rating Curve

CITY OF HOUSTON Houston Public Works
Technical Modeling Guidelines for 2D Dynamic Storm Water Analysis 20 | P a g e March 2020
6.6 1D Hydraulic Model Settings Simulation settings determine how the model will run and provide results. Settings include the computation
time step, reporting time step, hydrology method, time control, and global settings.
• Computation Time Step - The time at which calculations will occur in the simulation. The time step
should typically be small enough that the model is able to capture the peak discharges in the
system. For 1D dynamic models, the time step can vary to achieve accurate and stable results.
User manuals provide an estimate for determining an appropriate time step. For 2D dynamic
models, it is recommended to have a time step of 1 second so that the interaction between the 1D
and 2D is captured.
• Reporting Time Step – The time step at which results will be saved. Dynamic models have the
capability of showing results at every computation time step, but this can produce large results file
sizes. The results time step should typically be short enough to capture the peak of each
hydrograph in the model and large enough as to minimize the file size. A reasonable reporting
range is between 1 and 10 minutes.
• Hydrology Method - Calculations for a hydraulic model can be simulated within software programs
and run simultaneously with the hydrologic calculations. If the hydrology component is used within
the program, the hydrology time settings should generally be equivalent to the hydraulics to ensure
continuity between the two calculations. The hydrologic method used in the hydraulic model should
be consistent with the methods outlined in the City IDM Section 9.05B.
• Time Control – The time control determines the length of time for the hydraulic calculations. The
simulation time is generally set to capture the rise and fall of the full inflow hydrographs used in the
model. If the design event is for a 24-hour duration storm, then the simulation time is typically set
for at least 24 hours. For large systems, the simulation may need to be run further to include the
entire storm event.
• Global Settings – Global settings can be used to assign storage, tolerances, and modifications to
the simulation. Global settings can be used with a simulation, and any changes should be
documented within the hydraulic report.
6.7 Configuration Parameters Some software packages include parameters that can be used to adjust the default model settings and
alter the performance of the model. Configuration parameters are listed in the software program’s user
manual and can be used to improve model stability. If parameters are used, documentation should be
included to justify the need for the parameter and ensure the use does not impact results.
CITY OF HOUSTON Houston Public Works
Technical Modeling Guidelines for 2D Dynamic Storm Water Analysis 21 | P a g e March 2020
7.0 2D MODEL COMPONENTS
7.1 Terrain 2D modeling software requires a surface to simulate the 2D overland flow. The surface can be generated
from available topography information such as the latest LiDAR from the Houston-Galveston Area Council
(HGAC). The terrain used for the project should be approved by the City before any modeling begins.
Terrain may be different between existing and proposed conditions to reflect proposed changes in the
topography.
7.2 2D Surface Overland flow is analyzed using 2D methods. The terrain data is converted into a 2D surface within each
software program. The surface represents the actual terrain and is used by the model for the 2D
computations. The 2D surface can consist of elements such as square grids, irregular triangles, or irregular
polygons. The elements have elevation and roughness components based on the land use (Section 7.3)
to determine how runoff will flow across the element.
Types of Surfaces The type of 2D surface will depend on the software package used. The three most commonly used surfaces
include rigid grid, triangular mesh, and irregular polygon.
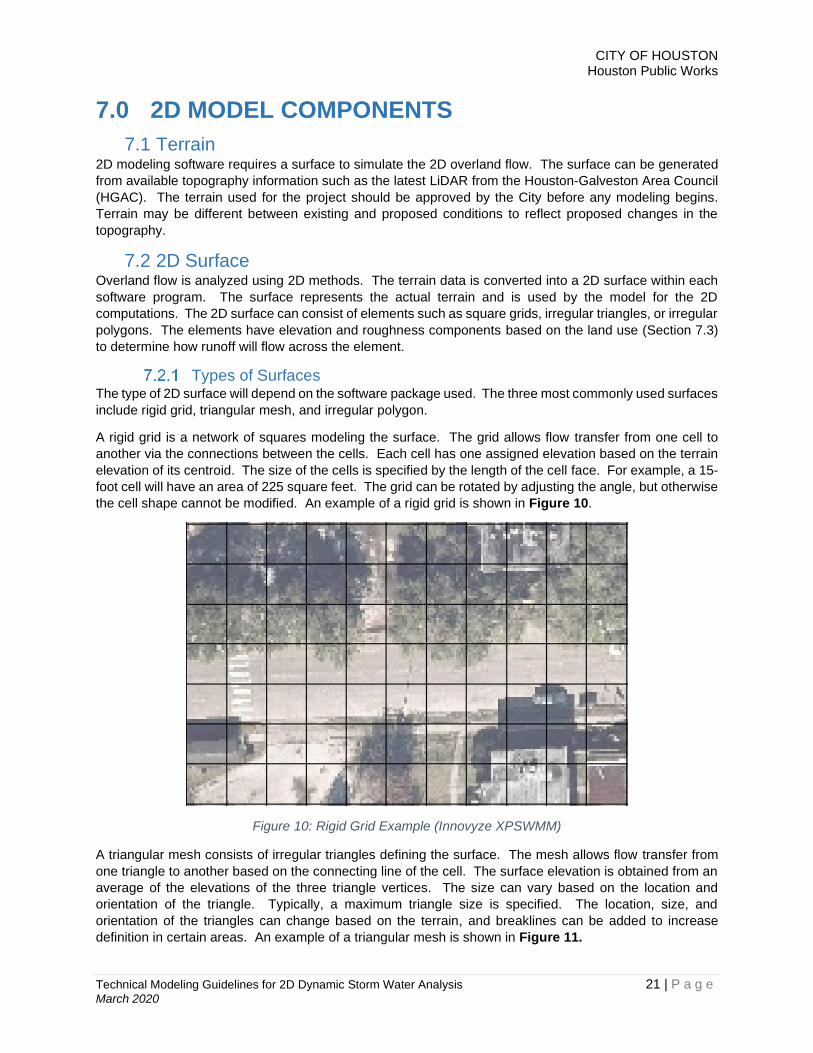
A rigid grid is a network of squares modeling the surface. The grid allows flow transfer from one cell to
another via the connections between the cells. Each cell has one assigned elevation based on the terrain
elevation of its centroid. The size of the cells is specified by the length of the cell face. For example, a 15-
foot cell will have an area of 225 square feet. The grid can be rotated by adjusting the angle, but otherwise
the cell shape cannot be modified. An example of a rigid grid is shown in Figure 10.
Figure 10: Rigid Grid Example (Innovyze XPSWMM)
A triangular mesh consists of irregular triangles defining the surface. The mesh allows flow transfer from
one triangle to another based on the connecting line of the cell. The surface elevation is obtained from an
average of the elevations of the three triangle vertices. The size can vary based on the location and
orientation of the triangle. Typically, a maximum triangle size is specified. The location, size, and
orientation of the triangles can change based on the terrain, and breaklines can be added to increase
definition in certain areas. An example of a triangular mesh is shown in Figure 11.

CITY OF HOUSTON Houston Public Works
Technical Modeling Guidelines for 2D Dynamic Storm Water Analysis 22 | P a g e March 2020
Figure 11: Triangular Mesh Example (Innovyze InfoWorks)
An irregular polygon surface consists of a network of squares, rectangles, and/or polygons. The surface
will allow flow transfer from one polygon to the next based on the connection between the cells. The surface
elevation is a rating curve of the actual terrain volume rather than a specified elevation. The location, size,
and orientation of the polygons can change based on the terrain, and breaklines can be added to better
define certain areas. An example of an irregular polygon surface is shown in Figure 12.
Figure 12: Irregular Polygon Example (HEC-RAS 2D)
2D Surface Cell Size The detail of the 2D surface is defined by the size and number of the elements. The more elements in the
surface, the better the terrain elevations are represented. A large element size will have less detail than a
small element size. A small size will allow for higher definition of the 2D surface as more points are used.
However, the smaller size will increase the computation time and size of the output files. A large size allows

CITY OF HOUSTON Houston Public Works
Technical Modeling Guidelines for 2D Dynamic Storm Water Analysis 23 | P a g e March 2020
for decreased computation time and size of the output files. However, the larger size could decrease the
overall accuracy of the model results. A comparison of the grid size details is shown in Figure 13. The
desired grid size will achieve a high level of accuracy with a reasonable computation time. A rule of thumb
is to have at least one cell representing a typical roadway section. It is important to understand the
computational method of the 2D surface to determine the surface detail that is necessary. When the 2D
surface uses a rating curve of the actual terrain volume within a 2D element, a larger size may be more
appropriate than in a 2D surface using a specified elevation for a 2D element.
Figure 13: Small Grid versus Large Grid Comparison (Innovyze XPSWMM)
Multiple Surfaces Multiple surfaces can be used to vary the size, detail, elevation, and direction of the surfaces. Multiple
surfaces are used to adjust the orientation and vary the grid size within one model. They should generally
be oriented to allow perpendicular flow, as is the case when roads and channels change direction. If
multiple surfaces are used, connections need to be in place to ensure runoff from one surface will interact
with the adjoining surfaces.
Figure 14: Multiple Surfaces with Varied Grid Size (Innovyze InfoWorks)
Surface Adjustments The surface generated in the 2D model can be adjusted to enhance the analysis. In some modeling
software, breaklines can be included to adjust the surface at the location of irregular elements. Breaklines

CITY OF HOUSTON Houston Public Works
Technical Modeling Guidelines for 2D Dynamic Storm Water Analysis 24 | P a g e March 2020
create a hard line that element boundaries are not allowed to cross. Breaklines assist in defining curb lines,
bank lines, ridges, and drastic changes in the terrain.
The surface can also be adjusted to represent changes in the terrain for proposed conditions or changes
not reflected in the latest terrain. Adjustments can include vertical walls, detention ponds, berms, and
excavation or raising of roadways. Polygons or polylines with elevations can be added to the model to
represent these changes. An example of adjustments to the surface is shown in Figure 15. In the figure,
the elevation of the terrain is lowered to model a detention facility.
Figure 15: 2D Surface Adjustments for a Detention Facility
7.3 Roughness Values Flow and velocity across the 2D surface is dependent on the friction roughness of the area. Roughness is
usually defined by the Manning’s N-value. N-values are typically determined for each type of land cover in
the project area shown on aerial photography. Typical ranges for Manning’s N-values used in 2D surfaces
are provided in Table 2. For other land use roughness values, refer to the HCFCD Two-Dimensional
Modeling Guidelines [4].
Table 2: 2D Manning's N Values
Land Cover Manning’s N-Value
Open Water 0.02
Concrete/Asphalt Pavement 0.01-0.03
Developed Grass Areas 0.04-0.10
Dense Trees/Vegetation 0.05-0.2
Residential Lots 0.02-0.2
Structures 10* *Structures can also be modeled as Inactive Areas/Voids (Section 7.4)
Structures (buildings, houses, walls, etc.) can be modeled using high roughness values, surface adjustment
polygons, or voids in the 2D surface depending on the software capabilities. High roughness values allow
runoff to flow through the structure at a low velocity. Surface adjustments can be used to increase the
elevation of the structure to represent the finished floor elevation. Voids remove the structure from the 2D
surface which creates a depth of ponding surrounding the structure.
7.4 Inactive Areas/Voids Inactive areas or “voids” are sections within the 2D surface limits where calculations are not conducted.
Surface flow is impeded at these locations and will pond along the edge of the area. Inactive areas can be
used to represent buildings and large structures within the 2D surface. Inactive areas can also be used to
BEFORE AFTER

CITY OF HOUSTON Houston Public Works
Technical Modeling Guidelines for 2D Dynamic Storm Water Analysis 25 | P a g e March 2020
block out open channels and detention basins if these hydraulic features are modeled within the 1D flow
regime. Figure 16 shows an example of inactive areas used to block the volume of the detention pond and
roadside ditches that were modeled in 1D.
Figure 16: Inactive Areas/Voids
7.5 2D Boundary Conditions Depending on the slope and extent of the terrain, runoff that accumulates on the 2D surface may not stay
within the bounds of the model or study limits. 2D boundary conditions are used to determine what occurs
with the runoff that accumulates at the limits of the model. Several options are available dependent on the
software program. 2D boundary conditions may also include any potential overflow into the study area.
Extreme storm events may cause excess runoff from adjacent watersheds to overflow into the project area,
and often these flows are considered for planning and design analyses.
• Wall – The wall option assumes that the model limits are infinite walls and flow is unable to leave
the 2D surface. This option is the default and is shown when there is excess storm runoff at the
bounds of the model grid. The vertical wall will ensure that no volume actually leaves the system;
however, it may show excessive ponding along the limits when the flow would leave the system.
• Normal Depth – Normal depth can be used to allow flow to leave the 2D surface along the model
limits. At the boundary limit, normal depth is assumed for the ponding depth.
• Stage Hydrograph – A time-varying stage hydrograph will vary the water surface elevation along
the limits of the model surface based on user input. A stage hydrograph may be applicable if the
limits are a stream with known elevations. This option will introduce flow and runoff in the model if
the water surface elevations are higher than the terrain.
• Flow Hydrograph – A time-varying flow hydrograph can be applied at the boundary of a surface to
represent above-ground flow from adjacent watersheds.
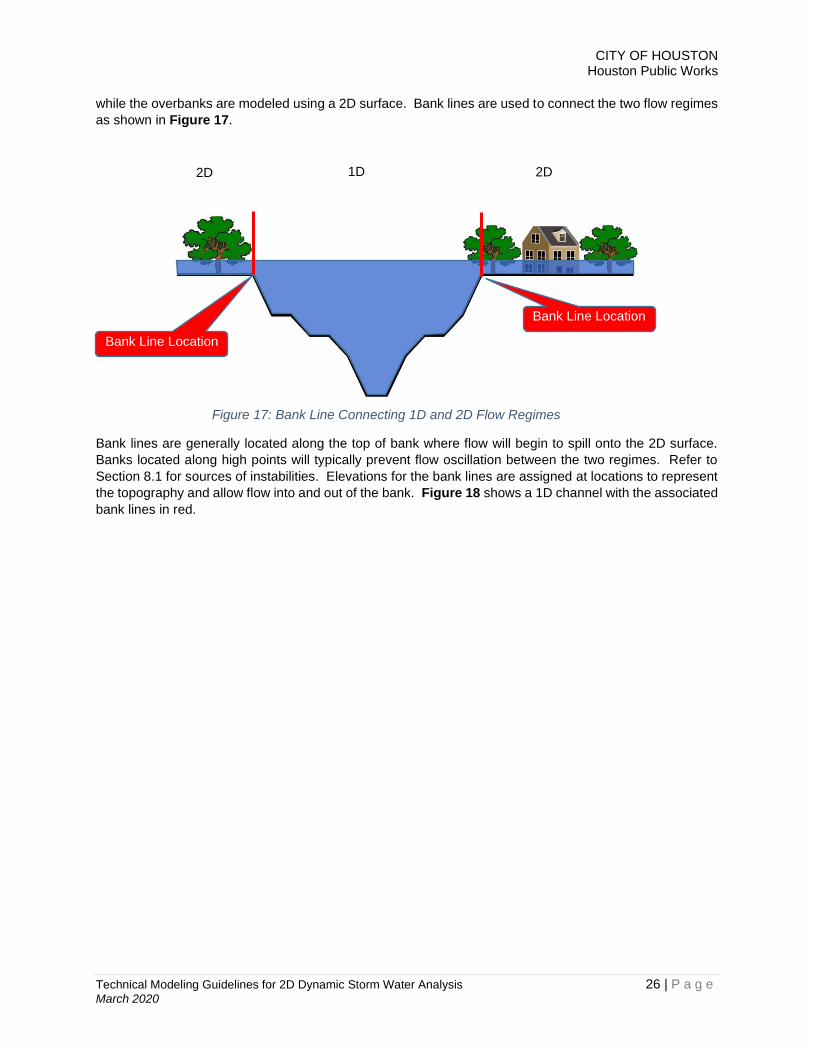
7.6 Bank Lines Channels and rivers can be modeled with coupled 1D/2D methodology to simulate flow through the channel.
Channel overbanks, especially in flat areas, can be more complex than traditional 1D model assumptions
allow for. In these cases, the channel within the banks can be modeled using traditional 1D cross sections
CITY OF HOUSTON Houston Public Works
Technical Modeling Guidelines for 2D Dynamic Storm Water Analysis 26 | P a g e March 2020
while the overbanks are modeled using a 2D surface. Bank lines are used to connect the two flow regimes
as shown in Figure 17.
Bank lines are generally located along the top of bank where flow will begin to spill onto the 2D surface.
Banks located along high points will typically prevent flow oscillation between the two regimes. Refer to
Section 8.1 for sources of instabilities. Elevations for the bank lines are assigned at locations to represent
the topography and allow flow into and out of the bank. Figure 18 shows a 1D channel with the associated
bank lines in red.
Bank Line Location
Bank Line Location
Figure 17: Bank Line Connecting 1D and 2D Flow Regimes
1D
Flow
2D
Flow
2D
Flow

CITY OF HOUSTON Houston Public Works
Technical Modeling Guidelines for 2D Dynamic Storm Water Analysis 27 | P a g e March 2020
Figure 18: Riverine Bank Lines (XPSWMM)
7.7 Direct Rainfall Direct rainfall or rainfall on the mesh is the application of rainfall directly on the surface, rather than routed
through a hydrograph. Rainfall will flow on the surface based on the assigned roughness values and the
details of the terrain as shown in Figure 19. Direct rainfall can be used to replace hydrologic routing;
however, it is not recommended at this time. Factors such as infiltration and other losses should be
considered. When rainfall is applied directly to the 2D surface, the detail of the surface will impact how
runoff reaches the drainage system. If the purpose is to design a drainage network, using direct rainfall
can result in an undersized system if not applied correctly. Use of direct rainfall should generally be limited
to identifying overland drainage patterns, locating areas of potential drainage issues, and determining
drainage basin boundaries.

CITY OF HOUSTON Houston Public Works
Technical Modeling Guidelines for 2D Dynamic Storm Water Analysis 28 | P a g e March 2020
Figure 19: Direct Rainfall (Innovyze InfoWorks)
7.8 2D Hydraulic Model Settings 2D models require additional settings to run the simulation. Settings include the 2D time step, output
variables, and output intervals.
The 2D time step should match the 1D hydraulic time step. Most software packages will adjust the 2D time
step to achieve model stability, but the time step should typically match the 1D to ensure the 2D calculations
are occurring at the same time. It is recommended to use a one-second time step for the 2D model.
The output time step refers to the time step at which results will be saved. Dynamic models have the
capability of showing results at every computation time step, but this can produce large results file sizes.
The output time step should be short enough to capture the peak of each hydrograph in the model and
large enough as to minimize the file size. A reasonable reporting range is between 1 and 10 minutes.
Dynamic 2D models also have the capability to report several output options for the 2D results. The results
may include velocity, depth, and elevation. These three variables can be included with a model run to
report and validate the output.

CITY OF HOUSTON Houston Public Works
Technical Modeling Guidelines for 2D Dynamic Storm Water Analysis 29 | P a g e March 2020
8.0 MODEL RESULTS The simulated hydraulic model provides results for each node, link, and 2D surface element for each
reporting time step. The results should be reviewed to ensure they are accurate and demonstrate sound
engineering practice.
8.1 1D Model Results 1D results include tables, hydrographs, and charts for each 1D element. The 1D output will have results
for each reporting time step chosen. The 1D results should be reviewed to ensure an accurate model is
being presented.
Dynamic models can have calculation errors due to the complexity of the models. Errors in the 1D results
pertain to the inflow and outflow volume of the model. A small and acceptable amount of error indicates
equivalent inflow and outflow volumes. A large percentage of error indicates a notable difference in the
inflow and outflow volumes. Typical 1D error should be less than or equal to 2% to be considered an
accurate model. However, having an error less than 2% does not by itself ensure that the model results
are acceptable and reasonable. A typical model error report in XPSWMM is shown in Figure 20.
Figure 20: Model Error Report
Instabilities in 1D models are common and can affect results. Instabilities are defined as flow and stage
hydrographs oscillating during the storm event. Though instabilities can come from numerous sources,
they are typically related to improper model development. The model should be modified to reduce and
eliminate instabilities. Issues commonly arise from the following:
1D Hydraulics
• Short link lengths
• Locations of bank lines
• Downstream boundary conditions
• Inconsistent cross section spacing
2D Hydraulics
• Connection of 2D nodes to the 2D surface
• 2D calculations
• Size of grid cells
• Inappropriate computational time step
Practical engineering assumptions and checks can be validated with the 1D model results. Dynamic
models simulate how a drainage system would react to a specific storm event, so the model results should
generally match typical engineering judgement. Examples of checks include 1D velocities, flows, stage
hydrographs, volume, and outflow.

CITY OF HOUSTON Houston Public Works
Technical Modeling Guidelines for 2D Dynamic Storm Water Analysis 30 | P a g e March 2020
8.2 2D Model Results 2D models provide various results for the surface for each reporting time step. The results will include
ponding depth, water surface elevation, flow, velocity, and other time step information. Each result file
should be reviewed for engineering soundness.
The resultant water surface elevations should generally correspond to the water surface elevations
presented in the nodes. Water surface elevations that are lower in the nodes than in the 2D surface imply
that storm water is being prevented from entering the 1D network. This is an indication that either the inlet
capacity is too small for the inflow or that the node configuration and placement is preventing inflow, which
can be a source of model error. Water surface elevations that are higher in the nodes than in the 2D surface
imply that storm water is prevented from leaving the 1D network. This is an indication that there may not
be enough nodes in the network connected to the 2D surface or that the inlet capacity is too restrictive.
The resultant ponding depth should be representative of the water surface elevation grid and the terrain in
the project area. Ponding depths should be reasonable and reflect the depths of actual conditions. Depths
that are too high or too low can be a source of error or inaccuracies.
Velocities of the 2D surface should generally reflect actual representative velocities. Typical overland flow
velocities in the City are between one (1) and four (4) feet per second (ft/s) due to the flat terrain. While
velocities can be higher, excessive velocities can be a result of inaccuracies in a model and should be
reviewed prior to submittal.
Flow hydrographs can be viewed of the flow across the 2D surface. Similar to the hydrographs in the 1D
model, the 2D flow should result in a smooth hydrograph. Instabilities in the 2D surface can be a result of
model errors and should be corrected before finalizing the model.
8.3 Model Validation Models provide a tool for evaluating the existing capacity and proposed improvements to a storm sewer
system. Validation is important for providing a defensible product to the project stakeholders. Validation
involves replicating actual drainage patterns to confirm the model results and recommendations. Hydraulic
model validation can involve recreating historical storm events and comparing results to flood data received
by the City.
Historical rainfall for the City can usually be obtained from the Harris County Flood Warning System website
(www.harriscountyfws.org). Harris County has approximately 35 rainfall and stream gauges that have data
dating back to 1994. The rainfall information can be collected and input into the hydrologic or hydraulic
model. The model can then be simulated and compared to flood data to confirm and validate the model
results.

CITY OF HOUSTON Houston Public Works
Technical Modeling Guidelines for 2D Dynamic Storm Water Analysis 31 | P a g e March 2020
Historical flood data is key to model validation. The historical data can be reviewed with the historical
rainfall hydraulic model results to confirm the model results. and referencedata may include:
• High water mark survey
• Flood photos taken by City officials or residents
• FEMA Repetitive loss data
• Structural and other flooding complaints
• COH GIMS overland ponding map
• Local news coverage
• Historical stream stage and flow hydrographs
• Resident testaments to overflow patterns and ponding depths
A successful validation will show similar results to the data provided. Ponding depths, durations, and flow
patterns should generally match those recorded in the field. An unsuccessful validation may require altering
the model’s 1D and 2D components, adding detail to alter drainage patterns, or reviewing the hydrologic
parameters.
It is important to define the difference between model validation and model calibration. Validation may
show similar but not exact results with those observed in the field. Validation ensures proper results are
presented and used for design, though may be slightly different than actual field conditions. On the other
hand, calibration involves altering the model to exactly match field conditions such as stage gauges and
field survey. Calibrating 2D dynamic models can require significant effort and requires actual field data. In
most cases, validating with observed conditions is usually sufficient.

CITY OF HOUSTON Houston Public Works
Technical Modeling Guidelines for 2D Dynamic Storm Water Analysis 32 | P a g e March 2020
9.0 DYNAMIC MODELING DELIVERABLES Upon completion of a hydrologic and hydraulic analysis, a detailed report should be prepared that includes
the project description, model process, assumptions, parameters, results, and recommendations. This
chapter includes the information that should generally be provided with the report submittal.
9.1 Report The following are recommended report topics for 2D modeling report submittals to provide reviewers
information regarding the model development process. Information can vary depending on the project type,
location, and purpose.
• Executive Summary and Introduction – Summarizes the project purpose and report conclusions.
Also discusses the project criteria and requirements.
• Data Collection – The data collection section includes information regarding the data used in the
analysis including the terrain, as-built record drawings, GIMS data, survey, prior studies, and
assumptions. This section should also include the datum used for the project and any adjustments
made to the data.
• Existing Conditions Hydrology – The hydrology section includes information regarding the
methodology used to develop hydrographs, the software and version used, general parameters,
the peak discharges and hydrographs, and any modeling assumptions used for the analysis.
• Existing Conditions Hydraulics – The hydraulics section includes information regarding the
hydraulic methodology, software and version used, parameters, data adjustments, assumptions,
and the boundary condition. This section should provide enough detail so that reviewers of the
model and report can understand the modeling process without additional explanation. This section
can also include a description of the existing drainage network.
• Existing Conditions Results – The results section includes the hydraulic model results such as
ponding depths at critical locations in the area, durations of ponding, critical areas where ponding
exceeds criteria, the outflows into the downstream drainage systems, and potential issues with the
existing drainage system. The section should also include results of the model validation.
• Proposed Conditions – The proposed conditions section includes discussion of the potential
improvements to address the ponding concerns for the project area. This discussion may include
any alternatives discussed or attempted as well as the recommended alternative for further
consideration or design. The section should also discuss any modeling assumptions or techniques
used to model the alternatives for both the hydrologic and hydraulic analyses. Cost estimates,
potential design constraints, and property acquisition can be included with this discussion.
• Proposed Conditions Results – The proposed conditions results section includes the hydraulic
model results such as ponding depths at critical locations in the area, durations of ponding, critical
areas where ponding exceeds criteria, hydraulic grade line profiles, and the outflows into the
downstream drainage systems. The results should be compared to existing conditions using tables
and ponding maps to show reduction at the critical locations and no impact to the existing or
downstream systems.
• Conclusions and/or Recommendations – This section should include any conclusions or
recommendations to be made by the engineer.

CITY OF HOUSTON Houston Public Works
Technical Modeling Guidelines for 2D Dynamic Storm Water Analysis 33 | P a g e March 2020
9.2 Hydrology The hydrologic technical submittal should include the following items:
• HEC-HMS or equivalent software models
• Hydrologic parameter spreadsheets
o Rational Method Calculations
o Clark Method Calculations
• Hydrologic shapefiles
o Drainage Basins
o Rational Method Parameters
o Clark Method Parameters
9.3 Hydraulics Hydraulic models should include results so that the City is not required to rerun the models. The models
should also include all background files used for model development and the terrain data. Both the existing
and proposed conditions models and information should be provided for review. The hydraulic technical
submittal should include the following items.
• Hydraulic Model Data and Results
o XPSWMM, EPASWMM, InfoWorks ICM, ICPR, etc.
o Terrain files
• Shapefiles
o Existing Drainage Network
▪ Nodes (manholes and inlets)
▪ Links (storm sewer, channels, etc.)
o Proposed drainage network
▪ Nodes (manholes and inlets)
▪ Links (storm sewer, channels, etc.)
• Naming Convention
Naming convention of nodes and links should be concise and consistent. An example
naming convention is as follows:
▪ DAXXXX – Drainage area inflow node (inlets)
▪ MHXXXX – Manhole
▪ RXXXX – Regular or break node not associated with a manhole
▪ OXXXX – Outfall or boundary condition
▪ SDXXXX – Storm sewer
▪ CHXXXX – Channel
▪ WXXXX – Weir
▪ PXXXX - Pump

CITY OF HOUSTON Houston Public Works
Technical Modeling Guidelines for 2D Dynamic Storm Water Analysis 34 | P a g e March 2020
9.4 Submittal File Structure The following file structure should be used to submit packages to the City. Items included may differ based
on the level of submittal. The submittal should include the Model Submittal Checklist and the Model Review
Checklist as provided in Appendix A and Appendix B, respectively. The Model Submittal Checklist
includes the basic information that can be used to review the project. This information includes the project
description, modeling software and versions, as well as the model file names. The Model Review Checklist
is the review form used by City reviewers that will be populated with comments during the review process.
The basin information should be filled out by the engineer prior to submission. An example file structure
for model and report submittals is shown in Figure 21 and may vary depending on the phase and scope of
the project.
Figure 21: Example Model Submittal File Structure
9.5 Design Deliverables Deliverables for a design-level analysis should include any information needed for the hydraulic design
sheet. Note that if the project requires HCFCD review, the analysis may need to be performed for additional
storm events. Information provided may include:
• Drainage Areas
• Flow rates for the 2-year and 100-year storm events
• Nodes
• Hydraulic grade elevation for 2-year and 100-year storm events
• Ground elevation
• Maximum ponding elevation as described in the City IDM
• Links
• Data input
• Maximum flow rate for 2-year and 100-year storm events
• Maximum velocity for 2-year and 100-year storm events
• Upstream and downstream maximum HGL at each node

CITY OF HOUSTON Houston Public Works
Technical Modeling Guidelines for 2D Dynamic Storm Water Analysis 35 | P a g e March 2020
10.0 REFERENCES
[1] City of Houston Department of Public Works and Engineering, "Storm Sewer Design Applications for
the City of Houston, Texas, Capital Improvement Plan Projects," 2005. (TP100)
[2] City of Houston Department of Public Works and Engineering, "Guidelines for Consideration of
Overland Flow for the Extreme Event for Improvement Projects in the City of Houston, Harris County,
Texas Region," 2005. (TP 101)
[3] Harris County Flood Control District, "Policy, Criteria, and Procedure Manual," 2018.
[4] Harris County Flood Control District, "Two-Dimensional Modeling Guidelines," 2018.
[5] U.S. Environmental Protection Agency, Storm Water Management Model User's Manual Vrsion 5.1,
2015.
[6] R. A. Wurbs and W. P. James, Water Resources Engineering, 2002.
[7] City of Houston Department of Public Works and Engineering, "Infrastructure and Design Manual,"
2016.
[8] U.S. Army Corps of Engineers Hydrologic Engineering Center, "Hydrologic Modeling System HEC-
HMS Technical Reference Manual," 2000.
[9] Innovyze, "Node Data," 10 March 2015. [Online]. Available:
https://help.innovyze.com/display/xps/Links. [Accessed 30 March 2018].
[10] Innovyze, "Links," 10 March 2015. [Online]. Available: https://help.innovyze.com/display/xps/Links.
[Accessed 30 March 2018].
[11] U.S. Army Corps of Engineers Hydrologic Engineering Center, "HEC-RAS River Analysis System,"
2016.
[12] V. T. Chow, D. R. Maidment and L. W. May, Applied Hydrology, 1998.

APPENDIX A – MODEL SUBMITTAL
CHECKLIST

STORM WATER MODEL REVIEW SUBMITTAL
Technical Modeling Guidelines for 2D Dynamic Stormwater Analysis – DRAFT
March 2019
Engineer:
Firm:
Telephone:
Email:
Project:
WBS No:
Date:
Purpose of Model:
HCFCD Watershed: (Name and ID)
Outfall Location: COH TXDOT Other _______________________ HCFCD Harris County
Hydrologic Model Software & Version:
HEC-HMS v._____________ EPA-SWMM v. ________________ XP-SWMMv._____________ Other _______________________
Hydraulic Model Software & Version:
HEC-RASv.______________ EPA-SWMM v. ________________ XP-SWMMv._____________ Other _______________________
Hydraulic Model Configuration:
1D Storm/Channel and 1D Surface 1D Storm/Channel only 1D Storm/Channel and 2D Surface Other
Model File Names:
File Name: Description: Event(s):
Source of Terrain: Include Datum Adjustments
LiDAR Survey Other _________________________ Datum Adjustments:
Items Submitted: Georeferenced Drainage Areas (GIS or CADD) Georeferenced Links, Nodes, Cross Sections (GIS or CADD) Report or Memorandum Detailing Model Methodology Hydraulic Models Drainage Area Map Node and Link Schematic Existing vs Proposed Results (Graphical and Tabular Formats)

APPENDIX B – MODEL REVIEW
CHECKLIST
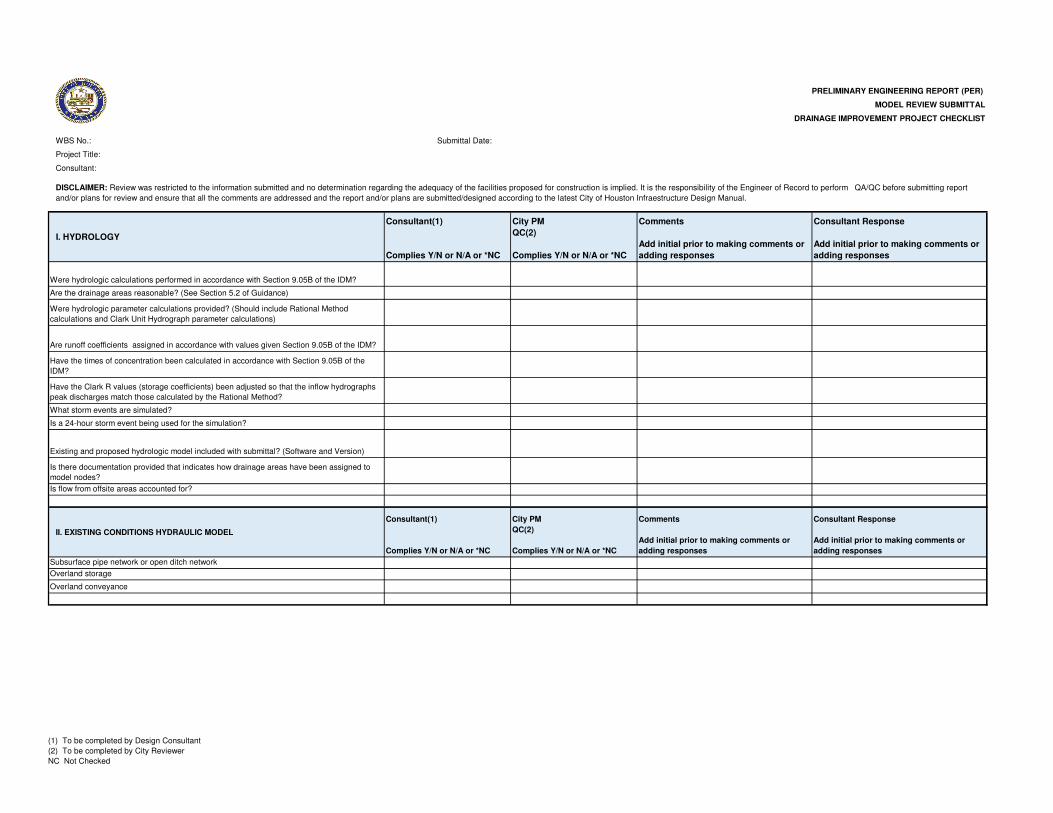
PRELIMINARY ENGINEERING REPORT (PER)
MODEL REVIEW SUBMITTAL
DRAINAGE IMPROVEMENT PROJECT CHECKLIST
WBS No.: Submittal Date:
Project Title:
Consultant:
I. HYDROLOGY
Consultant(1)
Complies Y/N or N/A or *NC
City PM
QC(2)
Complies Y/N or N/A or *NC
Comments
Add initial prior to making comments or
adding responses
Consultant Response
Add initial prior to making comments or
adding responses
Were hydrologic calculations performed in accordance with Section 9.05B of the IDM?
Are the drainage areas reasonable? (See Section 5.2 of Guidance)
Were hydrologic parameter calculations provided? (Should include Rational Method
calculations and Clark Unit Hydrograph parameter calculations)
Are runoff coefficients assigned in accordance with values given Section 9.05B of the IDM?
Have the times of concentration been calculated in accordance with Section 9.05B of the
IDM?
Have the Clark R values (storage coefficients) been adjusted so that the inflow hydrographs
peak discharges match those calculated by the Rational Method?
What storm events are simulated?
Is a 24-hour storm event being used for the simulation?
Existing and proposed hydrologic model included with submittal? (Software and Version)
Is there documentation provided that indicates how drainage areas have been assigned to
model nodes?
Is flow from offsite areas accounted for?
II. EXISTING CONDITIONS HYDRAULIC MODEL
Consultant(1)
Complies Y/N or N/A or *NC
City PM
QC(2)
Complies Y/N or N/A or *NC
Comments
Add initial prior to making comments or
adding responses
Consultant Response
Add initial prior to making comments or
adding responses
Subsurface pipe network or open ditch network
Overland storage
Overland conveyance
DISCLAIMER: Review was restricted to the information submitted and no determination regarding the adequacy of the facilities proposed for construction is implied. It is the responsibility of the Engineer of Record to perform QA/QC before submitting report
and/or plans for review and ensure that all the comments are addressed and the report and/or plans are submitted/designed according to the latest City of Houston Infraestructure Design Manual.
(1) To be completed by Design Consultant
(2) To be completed by City Reviewer
NC Not Checked

PRELIMINARY ENGINEERING REPORT (PER)
MODEL REVIEW SUBMITTAL
DRAINAGE IMPROVEMENT PROJECT CHECKLIST
WBS No.: Submittal Date:
Project Title:
Consultant:
DISCLAIMER: Review was restricted to the information submitted and no determination regarding the adequacy of the facilities proposed for construction is implied. It is the responsibility of the Engineer of Record to perform QA/QC before submitting report
and/or plans for review and ensure that all the comments are addressed and the report and/or plans are submitted/designed according to the latest City of Houston Infraestructure Design Manual.
III. EXISTING CONDITIONS NODES
Consultant(1)
Complies Y/N or N/A or *NC
City PM
QC(2)
Complies Y/N or N/A or *NC
Comments
Add initial prior to making comments or
adding responses
Consultant Response
Add initial prior to making comments or
adding responses
Are nodes placed at appropriate locations? (See Section 6.3 of Guidance)
What are the Ponding Types used? (Allowed, Sealed, 2D, None, Other)
Have spill crest elevations been assigned properly? (See Section 6.3.1 of Guidance)
Are inflows applied applied appropriately?
Is offsite overland flow included?
Are there storage nodes in the model?
If there are storage nodes, has documentation been provided on development of depth-
area curves?
Do the depth-area curves seem reasonable?
Are 2D Nodes used?
Have the 2D nodes been linked to the 2D grid appropriately?
Are 2D node spill crest elevations reasonable compared to the adjacent terrain?
Is the 2D ponding type set appropriately? (Spill Crest or Invert)
Are the storm sewer inlet capacities modeled if required?
Do inlet capacities appropriately represent the size of the inlets into the storm system?
(1) To be completed by Design Consultant
(2) To be completed by City Reviewer
NC Not Checked

PRELIMINARY ENGINEERING REPORT (PER)
MODEL REVIEW SUBMITTAL
DRAINAGE IMPROVEMENT PROJECT CHECKLIST
WBS No.: Submittal Date:
Project Title:
Consultant:
DISCLAIMER: Review was restricted to the information submitted and no determination regarding the adequacy of the facilities proposed for construction is implied. It is the responsibility of the Engineer of Record to perform QA/QC before submitting report
and/or plans for review and ensure that all the comments are addressed and the report and/or plans are submitted/designed according to the latest City of Houston Infraestructure Design Manual.
IV. EXISTING CONDITIONS CONDUITS
Consultant(1)
Complies Y/N or N/A or *NC
City PM
QC(2)
Complies Y/N or N/A or *NC
Comments
Add initial prior to making comments or
adding responses
Consultant Response
Add initial prior to making comments or
adding responses
Do pipe sizes match available information? (GIMS, record drawings or survey)
Do pipe profiles look reasonable?
Are there adverse slopes?
Are size transitions appropriate for proposed conditions?
Does the model contain conduits that are shorter than 33 feet? Are settings appropriate if
shorter links are used?
Does the pipe network contain restrictor pipes?
Are there any conduits designated as downhill (or uphill) only flow? (flapgates)
Are streets modeled?
Are multi-links used?
Are conduit factors used? (Types)
Are minor headlosses accounted for?
Are open channel conduits used?
Are roughness values reasonable?
Are ditches/channels modeled?
Are open channel cross sections represented appropriately?
Are special conduits used? (pumps, weirs, orifices)
Are discharge coefficients for special conduitsreasonable?
(1) To be completed by Design Consultant
(2) To be completed by City Reviewer
NC Not Checked

PRELIMINARY ENGINEERING REPORT (PER)
MODEL REVIEW SUBMITTAL
DRAINAGE IMPROVEMENT PROJECT CHECKLIST
WBS No.: Submittal Date:
Project Title:
Consultant:
DISCLAIMER: Review was restricted to the information submitted and no determination regarding the adequacy of the facilities proposed for construction is implied. It is the responsibility of the Engineer of Record to perform QA/QC before submitting report
and/or plans for review and ensure that all the comments are addressed and the report and/or plans are submitted/designed according to the latest City of Houston Infraestructure Design Manual.
V. OUTFALL BOUNDARY CONDITIONS
Consultant(1)
Complies Y/N or N/A or *NC
City PM
QC(2)
Complies Y/N or N/A or *NC
Comments
Add initial prior to making comments or
adding responses
Consultant Response
Add initial prior to making comments or
adding responses
Are different boundary conditions used for different storm events?
What 2-year boundary conditions are used? (Stage hydrograph, fixed, free outfall)
What 100-year boundary conditions are used? (Stage hydrograph, fixed, free outfall)
Are assumptions documented?
Are boundary conditions reasonable? (See Section 6.5 of Guidance)
VI. PROJECT CONTROL
Consultant(1)
Complies Y/N or N/A or *NC
City PM
QC(2)
Complies Y/N or N/A or *NC
Comments
Add initial prior to making comments or
adding responses
Consultant Response
Add initial prior to making comments or
adding responses
Is full dynamic wave solution used for the simulation?
Is the computational time step appropriate? (time step of one second is recommended in
Section 6.6 of Guidance)
Is the reporting time step appropriate? (time step between 1 and 10 minutes is suggested in
Section 6.6 of Guidance)
Does the simulation time cover the full event?
What configuration parameters are used?
VII. EXISTING RESULTS
Consultant(1)
Complies Y/N or N/A or *NC
City PM
QC(2)
Complies Y/N or N/A or *NC
Comments
Add initial prior to making comments or
adding responses
Consultant Response
Add initial prior to making comments or
adding responses
Is the resultant model stable for all storm events?
Are there unstable link hydrographs?
Are there unstable node hydrographs?
What are some areas of instability?
Do the instabilities affect the overall results of the analysis?
Is the continuity error appropriate? (continuity error of less than or equal to +/- 2% is
recommended in Section 8.1 of Guidance)
Is volume lost from the calculations?
Do open channel/ditch conduits contain the flow, or are they pressurized?
Do maximum velocities meet City requirements?
Does the system have capacity for the design storm events?
Are water surface elevation profiles reasonable and have consistent rise and falls along the
system?
(1) To be completed by Design Consultant
(2) To be completed by City Reviewer
NC Not Checked
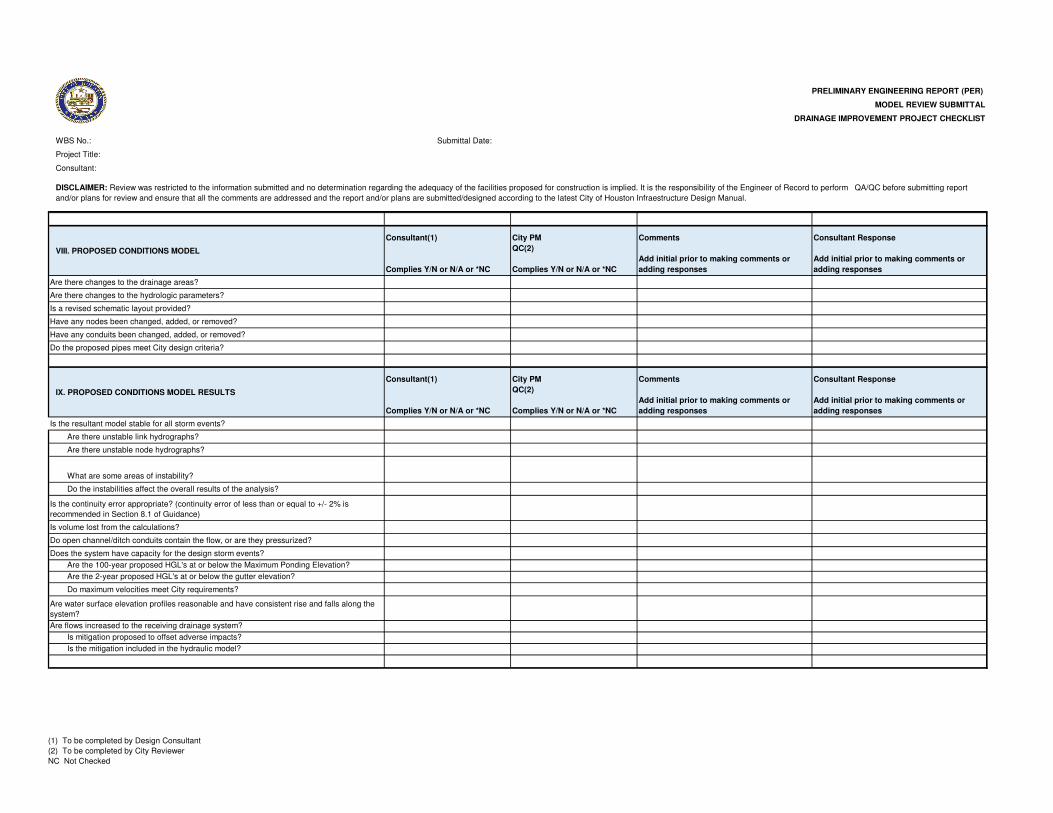
PRELIMINARY ENGINEERING REPORT (PER)
MODEL REVIEW SUBMITTAL
DRAINAGE IMPROVEMENT PROJECT CHECKLIST
WBS No.: Submittal Date:
Project Title:
Consultant:
DISCLAIMER: Review was restricted to the information submitted and no determination regarding the adequacy of the facilities proposed for construction is implied. It is the responsibility of the Engineer of Record to perform QA/QC before submitting report
and/or plans for review and ensure that all the comments are addressed and the report and/or plans are submitted/designed according to the latest City of Houston Infraestructure Design Manual.
VIII. PROPOSED CONDITIONS MODEL
Consultant(1)
Complies Y/N or N/A or *NC
City PM
QC(2)
Complies Y/N or N/A or *NC
Comments
Add initial prior to making comments or
adding responses
Consultant Response
Add initial prior to making comments or
adding responses
Are there changes to the drainage areas?
Are there changes to the hydrologic parameters?
Is a revised schematic layout provided?
Have any nodes been changed, added, or removed?
Have any conduits been changed, added, or removed?
Do the proposed pipes meet City design criteria?
IX. PROPOSED CONDITIONS MODEL RESULTS
Consultant(1)
Complies Y/N or N/A or *NC
City PM
QC(2)
Complies Y/N or N/A or *NC
Comments
Add initial prior to making comments or
adding responses
Consultant Response
Add initial prior to making comments or
adding responses
Is the resultant model stable for all storm events?
Are there unstable link hydrographs?
Are there unstable node hydrographs?
What are some areas of instability?
Do the instabilities affect the overall results of the analysis?
Is the continuity error appropriate? (continuity error of less than or equal to +/- 2% is
recommended in Section 8.1 of Guidance)
Is volume lost from the calculations?
Do open channel/ditch conduits contain the flow, or are they pressurized?
Does the system have capacity for the design storm events?
Are the 100-year proposed HGL's at or below the Maximum Ponding Elevation?
Are the 2-year proposed HGL's at or below the gutter elevation?
Do maximum velocities meet City requirements?
Are water surface elevation profiles reasonable and have consistent rise and falls along the
system?
Are flows increased to the receiving drainage system?
Is mitigation proposed to offset adverse impacts?
Is the mitigation included in the hydraulic model?
(1) To be completed by Design Consultant
(2) To be completed by City Reviewer
NC Not Checked

PRELIMINARY ENGINEERING REPORT (PER)
MODEL REVIEW SUBMITTAL
DRAINAGE IMPROVEMENT PROJECT CHECKLIST
WBS No.: Submittal Date:
Project Title:
Consultant:
DISCLAIMER: Review was restricted to the information submitted and no determination regarding the adequacy of the facilities proposed for construction is implied. It is the responsibility of the Engineer of Record to perform QA/QC before submitting report
and/or plans for review and ensure that all the comments are addressed and the report and/or plans are submitted/designed according to the latest City of Houston Infraestructure Design Manual.
X. 2D Model
Consultant(1)
Complies Y/N or N/A or *NC
City PM
QC(2)
Complies Y/N or N/A or *NC
Comments
Add initial prior to making comments or
adding responses
Consultant Response
Add initial prior to making comments or
adding responses
Is the 1D/2D linkage appropriate? (See Section 6.3 of Guidance)
Is the 2D surface size appropriate? (See Section 7.2.2 of Guidance)
What is the source of the 2D grid development?
Does the 2D mesh roughness vary or is it uniform?
Are the 2D mesh roughness values appropriate? (See Section 7.3 of Guidance)
Are 2D boundary types appropriate? (See Section 7.5 of Guidance)
Are there 2D inactive areas/voids and are they reasonable?
Are 2D breaklines used and are they reasonable?
Are mutiple meshes used and are they reasonable?
Are bank lines assigned to the 2D mesh appropriately?
XI. 2D MODEL RESULTS
Consultant(1)
Complies Y/N or N/A or *NC
City PM
QC(2)
Complies Y/N or N/A or *NC
Comments
Add initial prior to making comments or
adding responses
Consultant Response
Add initial prior to making comments or
adding responses
Do the node HGL's match the 2D water surface elevations?
Does the model 2D volume balance seem appropriate?
Is volume lost from the calculations?
Are 2D velocities reasonable?
Y - Yes
N - No
N/A - Not Applicable
NC - Not Checked
(1) To be completed by Design Consultant
(2) To be completed by City Reviewer
NC Not Checked