TECHNICAL FEASILIBITY OF DATA CENTRE HEAT RECOVERY IN …
13
AIRAH and IBPSA’s Australasian Building Simulation 2017 Conference, Melbourne, November 15- 16. 1 TECHNICAL FEASILIBITY OF DATA CENTRE HEAT RECOVERY IN A COMMUNITY ENERGY NETWORK ADREON R. MURPHY MASc Student, Mechanical & Industrial Engineering Ryerson University 350 Victoria St, Toronto, Ontario, Canada M5B 2K3 [email protected] ALAN S. FUNG, PHD, PENG, FCSME Associate Professor, Mechanical & Industrial Engineering Ryerson University 350 Victoria St, Toronto, Ontario, Canada M5B 2K3 [email protected] ABOUT THE AUTHOR Adreon Murphy is a Masters of Applied Science Student at Ryerson University in Toronto, Canada, supervised by Dr Alan Fung. Adreon is working in tandem with Enwave Energy Corporation, a district energy company to study data centre heat revocery in a community energy network as his thesis project. Adreon has experience in community energy planning, especially in integrating ground source heat pumps as well as good knowledge of residential high-rise HVAC design. ABSTRACT Due to their significant internal heat gain as a result of computer server banks, data centres require cooling year-round creating an opportunity to transport the waste heat to neighbouring buildings which are heat deficient. This paper evaluates the energy sharing potential of two data centres and 10 residential buildings; analysing the potential to heat and cool these buildings with geo-exchange. The analysis indicated that 14,593MWh of energy should be shared, equating to 79% of the total energy sharing potential. The coefficient of performance (COP) of a heat pump facilitating energy sharing was found to be 4.2. Utilising the industry recognised Ground Loop Design (GLD) 2016 software; simulations indicated geo-exchange bore field requires 500 vertical boreholes drilled to 244 meters with 6.1 metre spacing. The seasonal coefficients of performance of for heating and cooling were observed to be 3.1 and 7.1, respectively. Additionally, the bore field required a 2800kW dry cooler capacity to prevent it from overheating due to an annual imbalance in the ground’s thermal loading. Furthermore, the data centre waste heat recovery system suggests a reduction potential of 4930 tonnes of CO2e annually equating to 71% of the existing emissions in the community. 1. INTRODUCTION Data centres are becoming large contributors to GHG emissions globally. In 2010 data centres accounted for 1.1% to 1.5% of global energy consumption, and 1.7% to 2.2% of energy consumption in the U.S. (Koomey, 2011). Data centre power demand is expected to increase by 15-20% annually (Brunschwiler, Smith, Ruetsche, & Michel, 2009). In addition to electricity, data centres consume large volumes of water through their evaporative cooling towers. If this growth is to be sustainable, data centre operations must be reimagined as thermal energy resources, thereby offsetting their negative environmental impact and increasing their importance in society (Velkova, 2016).
Transcript of TECHNICAL FEASILIBITY OF DATA CENTRE HEAT RECOVERY IN …
AIRAH and IBPSA’s Australasian Building Simulation 2017 Conference, Melbourne, November 15-
16. 1
TECHNICAL FEASILIBITY OF DATA CENTRE HEAT RECOVERY IN A
COMMUNITY ENERGY NETWORK
ADREON R. MURPHY MASc Student, Mechanical & Industrial Engineering Ryerson University
350 Victoria St, Toronto, Ontario, Canada M5B 2K3
ALAN S. FUNG, PHD, PENG, FCSME Associate Professor, Mechanical & Industrial Engineering Ryerson University
350 Victoria St, Toronto, Ontario, Canada M5B 2K3
ABOUT THE AUTHOR
Adreon Murphy is a Masters of Applied Science Student at Ryerson University in Toronto, Canada,
supervised by Dr Alan Fung. Adreon is working in tandem with Enwave Energy Corporation, a
district energy company to study data centre heat revocery in a community energy network as his
thesis project. Adreon has experience in community energy planning, especially in integrating ground
source heat pumps as well as good knowledge of residential high-rise HVAC design.
ABSTRACT
Due to their significant internal heat gain as a result of computer server banks, data centres require
cooling year-round creating an opportunity to transport the waste heat to neighbouring buildings
which are heat deficient. This paper evaluates the energy sharing potential of two data centres and 10
residential buildings; analysing the potential to heat and cool these buildings with geo-exchange. The
analysis indicated that 14,593MWh of energy should be shared, equating to 79% of the total energy
sharing potential. The coefficient of performance (COP) of a heat pump facilitating energy sharing
was found to be 4.2. Utilising the industry recognised Ground Loop Design (GLD) 2016 software;
simulations indicated geo-exchange bore field requires 500 vertical boreholes drilled to 244 meters
with 6.1 metre spacing. The seasonal coefficients of performance of for heating and cooling were
observed to be 3.1 and 7.1, respectively. Additionally, the bore field required a 2800kW dry cooler
capacity to prevent it from overheating due to an annual imbalance in the ground’s thermal loading.
Furthermore, the data centre waste heat recovery system suggests a reduction potential of 4930 tonnes
of CO2e annually equating to 71% of the existing emissions in the community.
1. INTRODUCTION
Data centres are becoming large contributors to GHG emissions globally. In 2010 data centres
accounted for 1.1% to 1.5% of global energy consumption, and 1.7% to 2.2% of energy consumption
in the U.S. (Koomey, 2011). Data centre power demand is expected to increase by 15-20% annually
(Brunschwiler, Smith, Ruetsche, & Michel, 2009). In addition to electricity, data centres consume
large volumes of water through their evaporative cooling towers. If this growth is to be sustainable,
data centre operations must be reimagined as thermal energy resources, thereby offsetting their
negative environmental impact and increasing their importance in society (Velkova, 2016).
AIRAH and IBPSA’s Australasian Building Simulation 2017 Conference, Melbourne, November 15-
16. 2
Data centres normally produce more heat than offices within the building housing the data centre can
consume. Typically, this excess heat is released to the atmosphere via cooling towers. District energy
or community energy systems are the best way—and in most cases, the only way—to effectively use
this waste heat. These systems use a network of pipes (below grade) to supply buildings with heating
and cooling from a variety of energy sources. Data centres can be an economically viable energy
source for these systems.
A data centre heat recovery to district energy system has been successfully completed in the past.
Fortum, a Swedish district energy company has completed four projects in which they have integrated
a data centre into their district heating network and in one of the cases their district cooling network
as well (Open District Heating , 2017) (Open District Heating , 2012). Enwave Energy Corporation,
a North American district energy provider, has started construction on a system to recover heat from
an 11 MW IT load data centre in Seattle, for use in their district heating network (IDEA Industry
News, 2016). Yandex, a Russian search engine connected a 6 MW IT load data centre to a Finnish
district heating network, in which it sells 3.6 MW of waste heat (Data Center Dynamics, 2015).
Davies et. al studied the potential for data centre waste heat recovery in London, England and
concluded that the best sources of heat are in the chilled water return or the computer room air
handling (CRAH) unit return air (Davies, Maidment, & Tozer, 2016). This was confirmed by
Ebrahimi et al. (Ebrahimi, Jones, & Fleischer, 2014). Among all of the aforementioned projects and
studies, data centre heat recovery for district energy systems has never been done with geo-exchange,
for thermal energy storage.
1.1 Scope
This paper aims to determine how much energy can be shared by supplying data centres with chilled
water from the process of heating residential buildings with a heat pump. This paper aims
simultaneously to provide additional cooling to data centres as well as heating and cooling to
residential buildings with geo-exchange, when energy sharing is incapable of providing the full loads.
The paper seeks to fill gaps in data centre waste heat recovery literature by evaluating the capability
of geo-exchange to provide efficient heating and cooling for this application.
2. METHODOLOGY
2.1 Methodology
The methodology for this analysis consisted of a three-step process. Hourly heating and cooling data
was collected for a data centre and residential building in, Toronto, Canada. This data was scaled to
represent a real community in Toronto, Canada, containing two data centres and 10 surrounding
multi-unit residential buildings. The exact location is kept confidential to protect the identity of the
data centres. The heating and cooling data was then analysed in MATLAB (MathWorks Inc, 2013),
to determine the portion of energy that is either shared directly, or sources from geo-exchange.
Finally, the load profiles were imported into Ground Loop Design (GLD) 2016; simulations were
performed to determine the bore field specifications and the seasonal coefficient of performance
(COP) of the ground source heat pump in heating and cooling mode (Thermal Dynamics, 2016).
AIRAH and IBPSA’s Australasian Building Simulation 2017 Conference, Melbourne, November 15-
16. 3
2.2 Preliminary concept
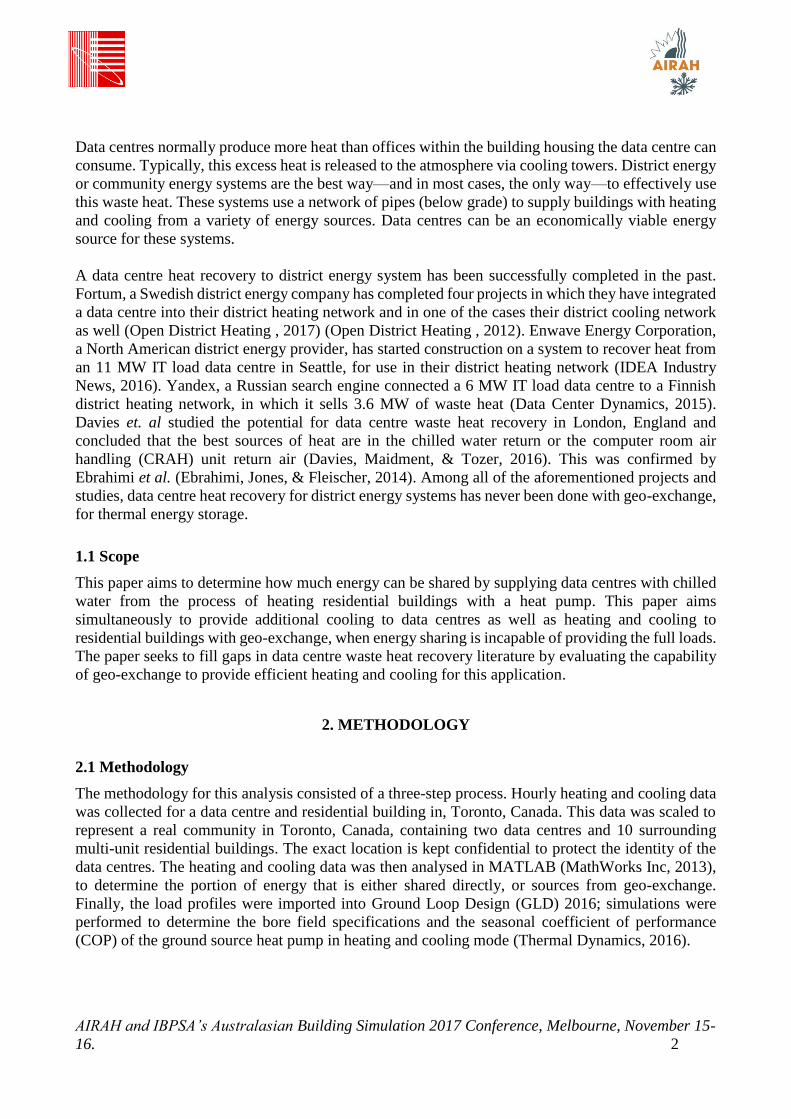
The following, Figure 1, shows the base case connection configuration. Rejected heat from the data
centres will be provided to heat pumps in multi-unit residential buildings (MURBs), based on heat
demand. The two data centres combined would meet a portion of the peak heating requirement in
multiple buildings. However, when the MURBs are demanding less heat than their contracted
amount, or have no demand for heat, the data centres will need to run their existing chillers and
cooling towers.
Figure 1. Scenario with no storage, only interacts during winter season (Scenario 1).
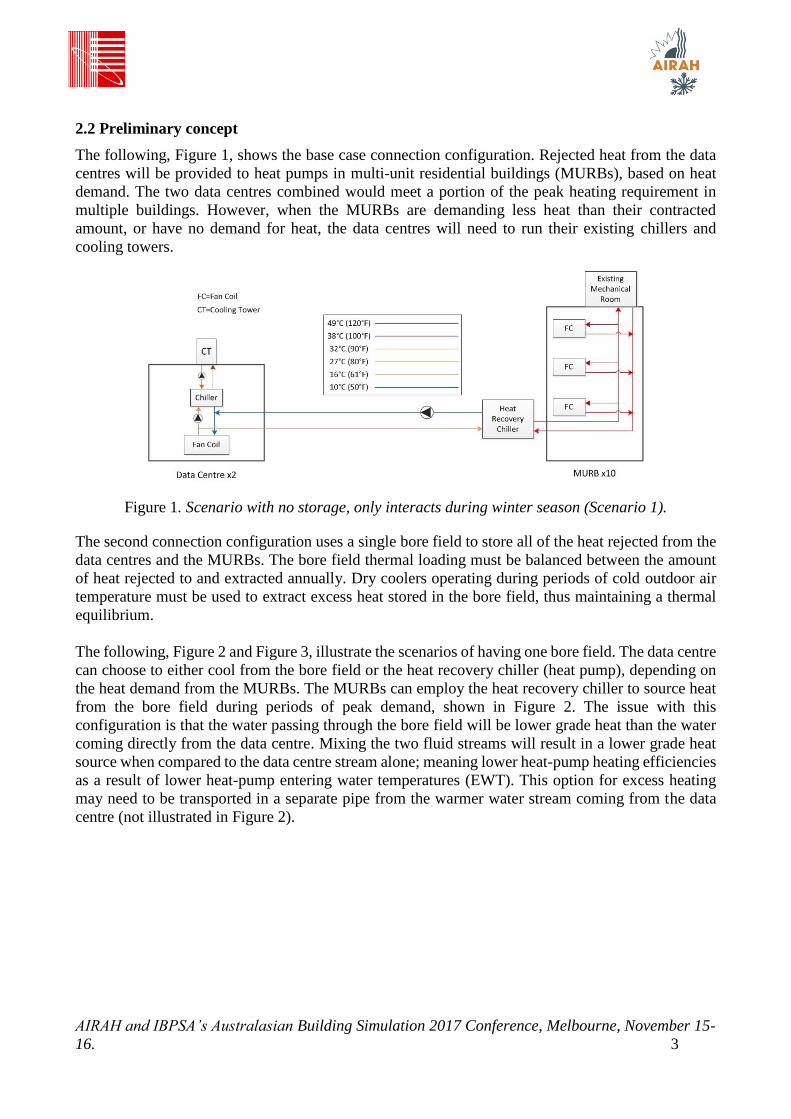
The second connection configuration uses a single bore field to store all of the heat rejected from the
data centres and the MURBs. The bore field thermal loading must be balanced between the amount
of heat rejected to and extracted annually. Dry coolers operating during periods of cold outdoor air
temperature must be used to extract excess heat stored in the bore field, thus maintaining a thermal
equilibrium.
The following, Figure 2 and Figure 3, illustrate the scenarios of having one bore field. The data centre
can choose to either cool from the bore field or the heat recovery chiller (heat pump), depending on
the heat demand from the MURBs. The MURBs can employ the heat recovery chiller to source heat
from the bore field during periods of peak demand, shown in Figure 2. The issue with this
configuration is that the water passing through the bore field will be lower grade heat than the water
coming directly from the data centre. Mixing the two fluid streams will result in a lower grade heat
source when compared to the data centre stream alone; meaning lower heat-pump heating efficiencies
as a result of lower heat-pump entering water temperatures (EWT). This option for excess heating
may need to be transported in a separate pipe from the warmer water stream coming from the data
centre (not illustrated in Figure 2).
AIRAH and IBPSA’s Australasian Building Simulation 2017 Conference, Melbourne, November 15-
16. 4
Figure 2. Single bore field scenario, showing winter season (Scenario 2).
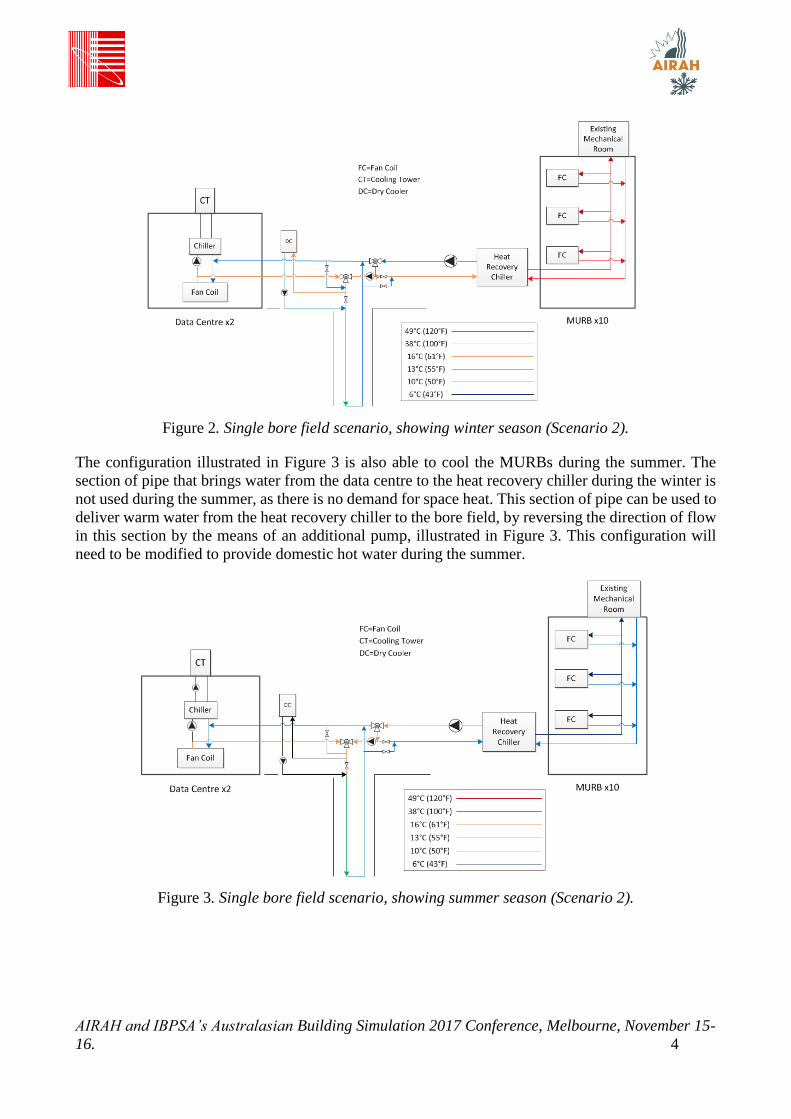
The configuration illustrated in Figure 3 is also able to cool the MURBs during the summer. The
section of pipe that brings water from the data centre to the heat recovery chiller during the winter is
not used during the summer, as there is no demand for space heat. This section of pipe can be used to
deliver warm water from the heat recovery chiller to the bore field, by reversing the direction of flow
in this section by the means of an additional pump, illustrated in Figure 3. This configuration will
need to be modified to provide domestic hot water during the summer.
Figure 3. Single bore field scenario, showing summer season (Scenario 2).
AIRAH and IBPSA’s Australasian Building Simulation 2017 Conference, Melbourne, November 15-
16. 5
3. RESULTS AND DISCUSSION
3.1 Results
Data on residential building heating for the community is derived from an hourly simulation on a
high-rise residential building in Toronto, Canada. The data is scaled to represent the particular
community of combined 185,874 m2 by building area. In order to provide a better return on
investment (ROI) existing boilers in the residential buildings were assumed to provide 70% of the
heating capacity, leaving 30% of the capacity to be provided by the community energy network as a
baseload. The 30% baseload still left 77% of the heating energy to be provided by the community
energy network.
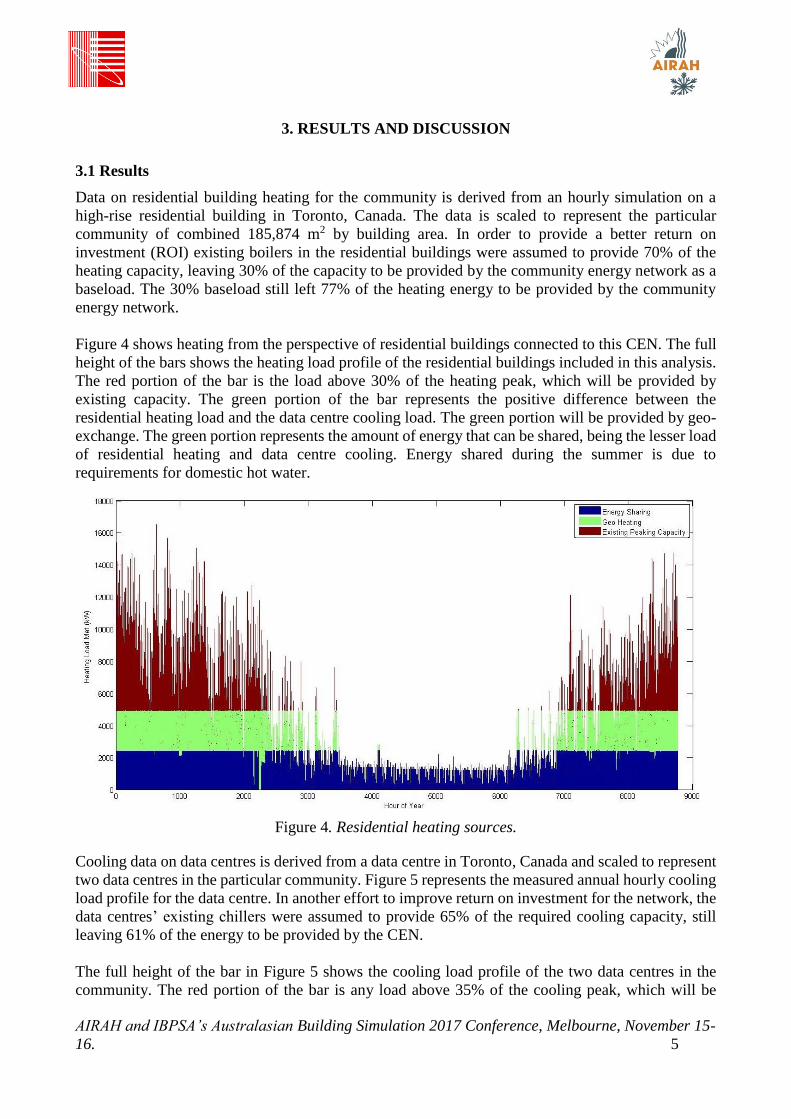
Figure 4 shows heating from the perspective of residential buildings connected to this CEN. The full
height of the bars shows the heating load profile of the residential buildings included in this analysis.
The red portion of the bar is the load above 30% of the heating peak, which will be provided by
existing capacity. The green portion of the bar represents the positive difference between the
residential heating load and the data centre cooling load. The green portion will be provided by geo-
exchange. The green portion represents the amount of energy that can be shared, being the lesser load
of residential heating and data centre cooling. Energy shared during the summer is due to
requirements for domestic hot water.
Figure 4. Residential heating sources.
Cooling data on data centres is derived from a data centre in Toronto, Canada and scaled to represent
two data centres in the particular community. Figure 5 represents the measured annual hourly cooling
load profile for the data centre. In another effort to improve return on investment for the network, the
data centres’ existing chillers were assumed to provide 65% of the required cooling capacity, still
leaving 61% of the energy to be provided by the CEN.
The full height of the bar in Figure 5 shows the cooling load profile of the two data centres in the
community. The red portion of the bar is any load above 35% of the cooling peak, which will be
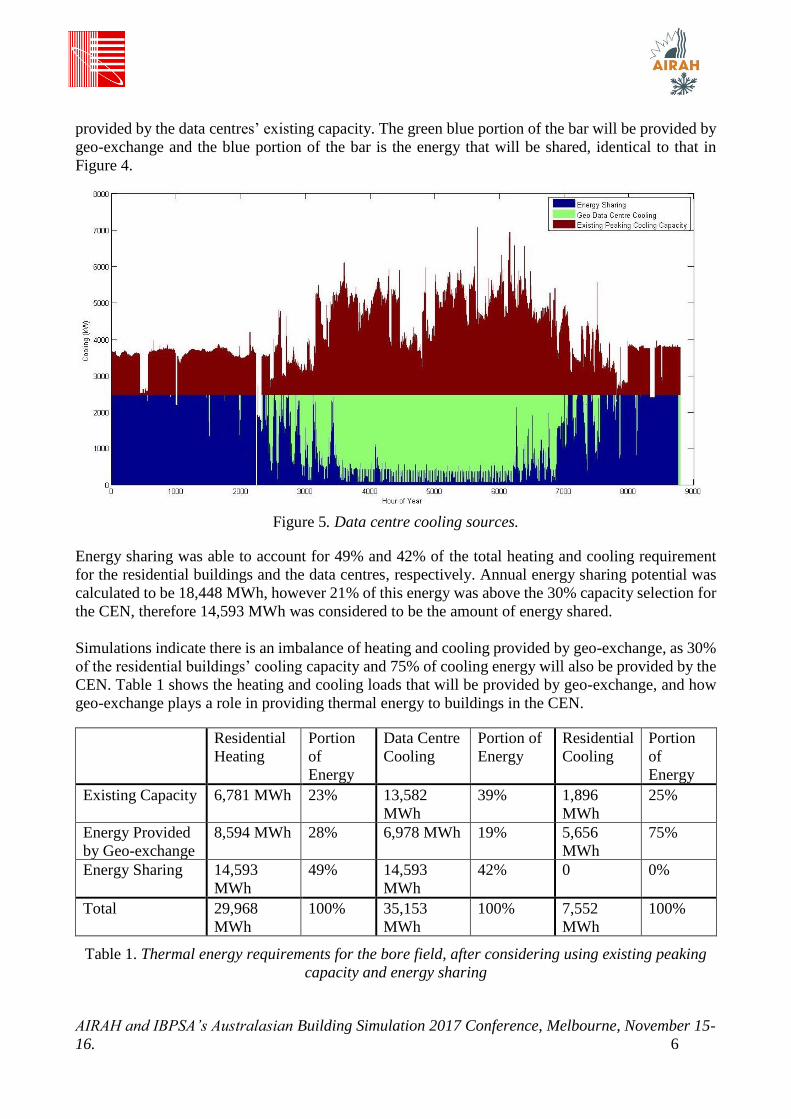
AIRAH and IBPSA’s Australasian Building Simulation 2017 Conference, Melbourne, November 15-
16. 6
provided by the data centres’ existing capacity. The green blue portion of the bar will be provided by
geo-exchange and the blue portion of the bar is the energy that will be shared, identical to that in
Figure 4.
Figure 5. Data centre cooling sources.
Energy sharing was able to account for 49% and 42% of the total heating and cooling requirement
for the residential buildings and the data centres, respectively. Annual energy sharing potential was
calculated to be 18,448 MWh, however 21% of this energy was above the 30% capacity selection for
the CEN, therefore 14,593 MWh was considered to be the amount of energy shared.
Simulations indicate there is an imbalance of heating and cooling provided by geo-exchange, as 30%
of the residential buildings’ cooling capacity and 75% of cooling energy will also be provided by the
CEN. Table 1 shows the heating and cooling loads that will be provided by geo-exchange, and how
geo-exchange plays a role in providing thermal energy to buildings in the CEN.
Residential
Heating
Portion
of
Energy
Data Centre
Cooling
Portion of
Energy
Residential
Cooling
Portion
of
Energy
Existing Capacity 6,781 MWh 23% 13,582
MWh
39% 1,896
MWh
25%
Energy Provided
by Geo-exchange
8,594 MWh 28% 6,978 MWh 19% 5,656
MWh
75%
Energy Sharing 14,593
MWh
49% 14,593
MWh
42% 0 0%
Total 29,968
MWh
100% 35,153
MWh
100% 7,552
MWh
100%
Table 1. Thermal energy requirements for the bore field, after considering using existing peaking
capacity and energy sharing
AIRAH and IBPSA’s Australasian Building Simulation 2017 Conference, Melbourne, November 15-
16. 7
Table 2 shows the parameters used to balance the bore field. In order to balance the bore field, while
maintaining a high COP, a 2800kW dry cooler was considered to run at full load during the coldest
4000 hours per year. This simulates 11,200MWh being extracted from the ground. After estimating
the seasonal COPs of the ground source heat pumps (GSHPs) the annual energy extracted and rejected
to the ground is balanced within 8%.
Annual Heating/Extraction Annual Cooling/Rejection
Energy Requirement 8,594 MWh 12,634 MWh
Energy After Dry Cooler
Balancing
19,797 MWh 12,634 MWh
Seasonal COP of GSHP from
GLD
3.1 7.1
Energy Extracted/Rejected to
Ground
13,410 MWh 14,413 MWh
Table 2. Parameters used to balance the bore field
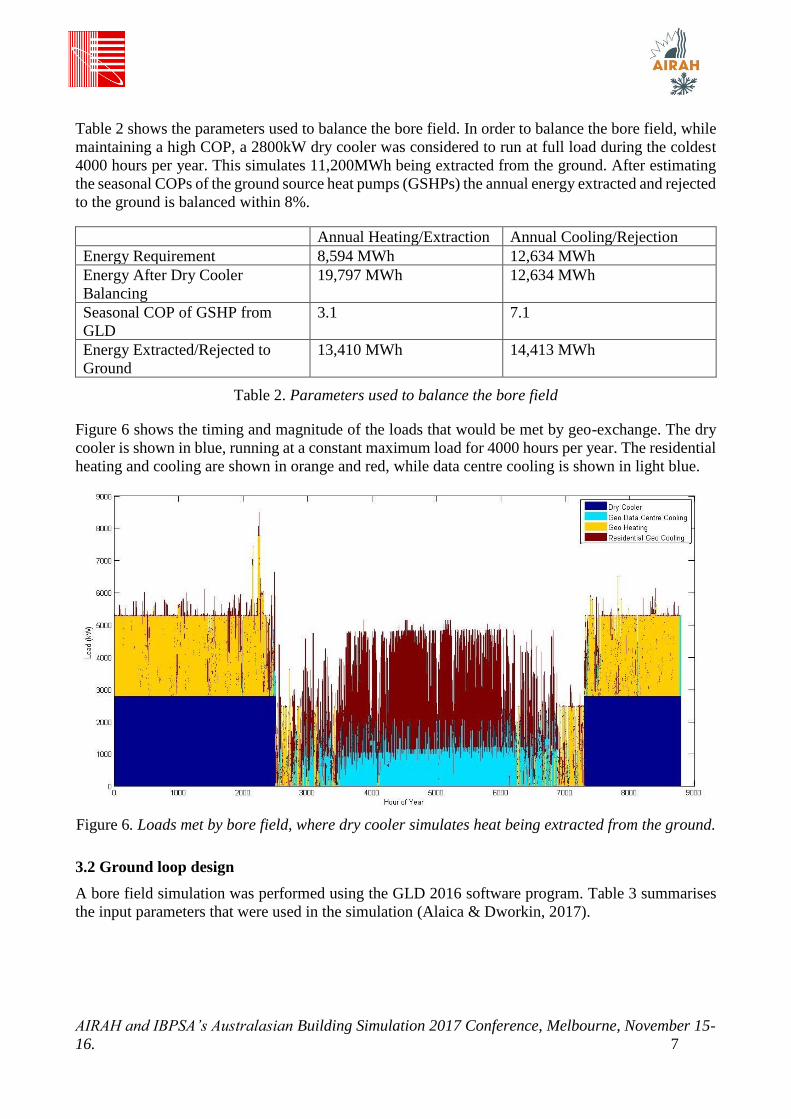
Figure 6 shows the timing and magnitude of the loads that would be met by geo-exchange. The dry
cooler is shown in blue, running at a constant maximum load for 4000 hours per year. The residential
heating and cooling are shown in orange and red, while data centre cooling is shown in light blue.
Figure 6. Loads met by bore field, where dry cooler simulates heat being extracted from the ground.
3.2 Ground loop design
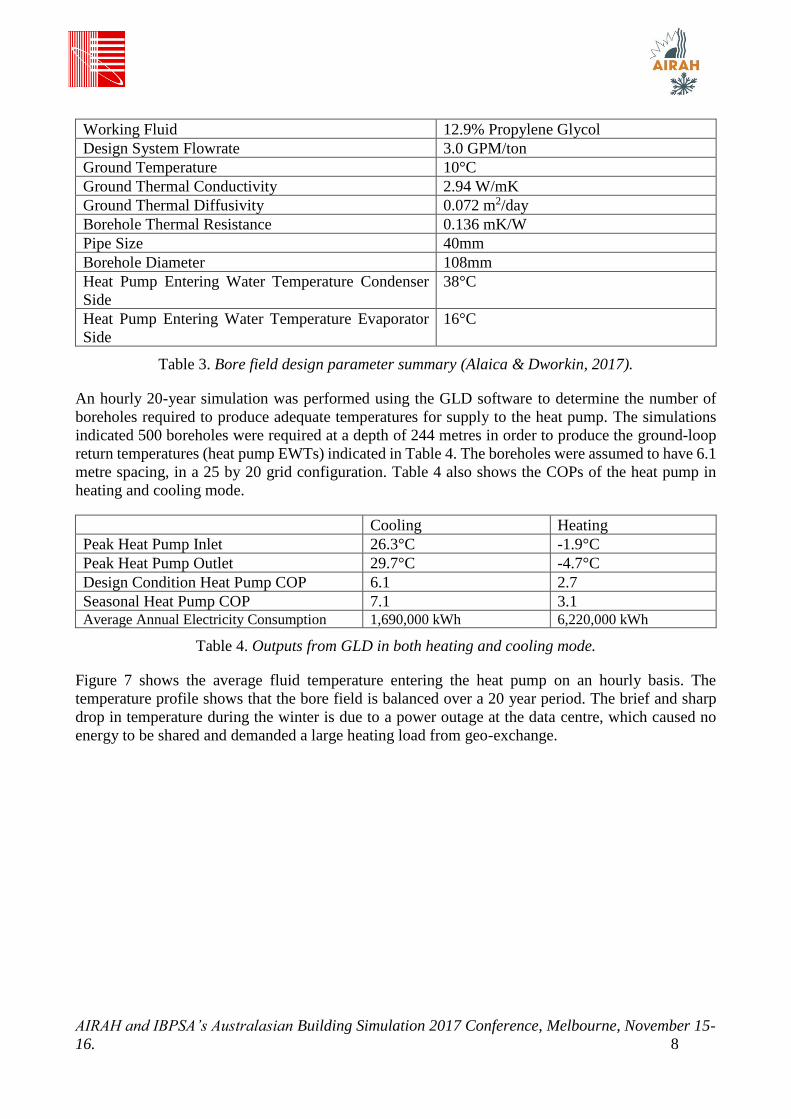
A bore field simulation was performed using the GLD 2016 software program. Table 3 summarises
the input parameters that were used in the simulation (Alaica & Dworkin, 2017).
AIRAH and IBPSA’s Australasian Building Simulation 2017 Conference, Melbourne, November 15-
16. 8
Working Fluid 12.9% Propylene Glycol
Design System Flowrate 3.0 GPM/ton
Ground Temperature 10°C
Ground Thermal Conductivity 2.94 W/mK
Ground Thermal Diffusivity 0.072 m2/day
Borehole Thermal Resistance 0.136 mK/W
Pipe Size 40mm
Borehole Diameter 108mm
Heat Pump Entering Water Temperature Condenser
Side
38°C
Heat Pump Entering Water Temperature Evaporator
Side
16°C
Table 3. Bore field design parameter summary (Alaica & Dworkin, 2017).
An hourly 20-year simulation was performed using the GLD software to determine the number of
boreholes required to produce adequate temperatures for supply to the heat pump. The simulations
indicated 500 boreholes were required at a depth of 244 metres in order to produce the ground-loop
return temperatures (heat pump EWTs) indicated in Table 4. The boreholes were assumed to have 6.1
metre spacing, in a 25 by 20 grid configuration. Table 4 also shows the COPs of the heat pump in
heating and cooling mode.
Cooling Heating
Peak Heat Pump Inlet 26.3°C -1.9°C
Peak Heat Pump Outlet 29.7°C -4.7°C
Design Condition Heat Pump COP 6.1 2.7
Seasonal Heat Pump COP 7.1 3.1 Average Annual Electricity Consumption 1,690,000 kWh 6,220,000 kWh
Table 4. Outputs from GLD in both heating and cooling mode.
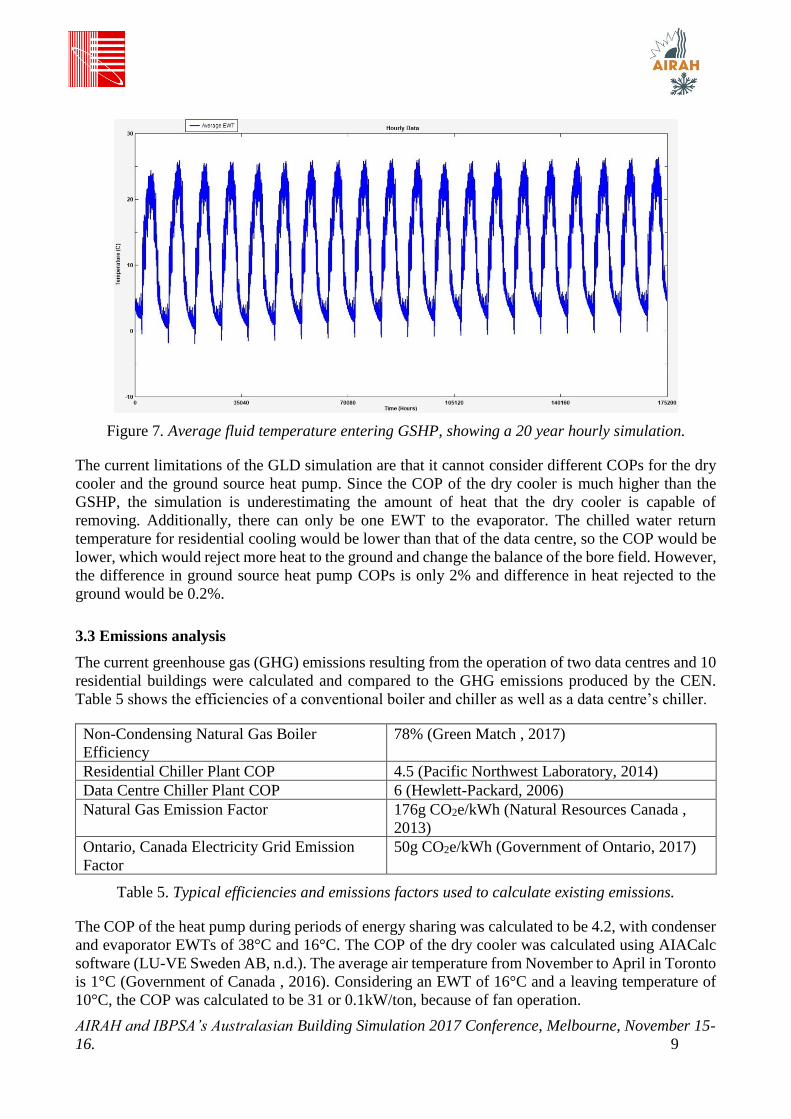
Figure 7 shows the average fluid temperature entering the heat pump on an hourly basis. The
temperature profile shows that the bore field is balanced over a 20 year period. The brief and sharp
drop in temperature during the winter is due to a power outage at the data centre, which caused no
energy to be shared and demanded a large heating load from geo-exchange.
AIRAH and IBPSA’s Australasian Building Simulation 2017 Conference, Melbourne, November 15-
16. 9
Figure 7. Average fluid temperature entering GSHP, showing a 20 year hourly simulation.
The current limitations of the GLD simulation are that it cannot consider different COPs for the dry
cooler and the ground source heat pump. Since the COP of the dry cooler is much higher than the
GSHP, the simulation is underestimating the amount of heat that the dry cooler is capable of
removing. Additionally, there can only be one EWT to the evaporator. The chilled water return
temperature for residential cooling would be lower than that of the data centre, so the COP would be
lower, which would reject more heat to the ground and change the balance of the bore field. However,
the difference in ground source heat pump COPs is only 2% and difference in heat rejected to the
ground would be 0.2%.
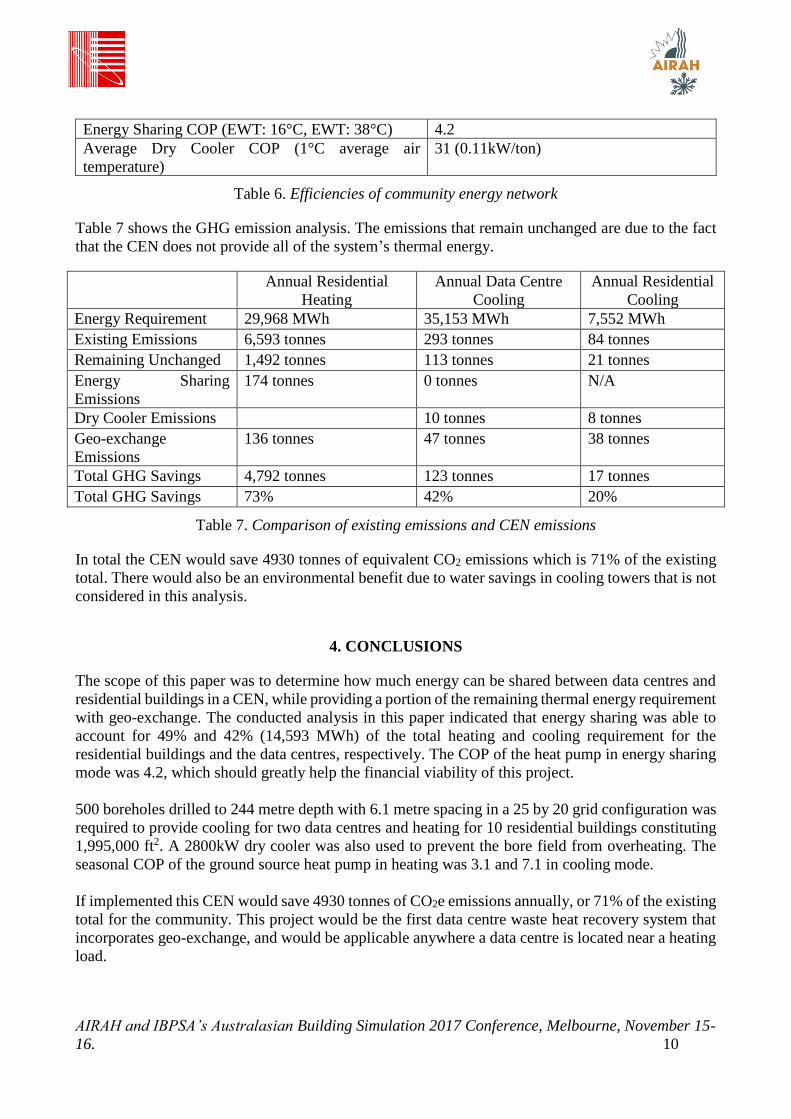
3.3 Emissions analysis
The current greenhouse gas (GHG) emissions resulting from the operation of two data centres and 10
residential buildings were calculated and compared to the GHG emissions produced by the CEN.
Table 5 shows the efficiencies of a conventional boiler and chiller as well as a data centre’s chiller.
Non-Condensing Natural Gas Boiler
Efficiency
78% (Green Match , 2017)
Residential Chiller Plant COP 4.5 (Pacific Northwest Laboratory, 2014)
Data Centre Chiller Plant COP 6 (Hewlett-Packard, 2006)
Natural Gas Emission Factor 176g CO2e/kWh (Natural Resources Canada ,
2013)
Ontario, Canada Electricity Grid Emission
Factor
50g CO2e/kWh (Government of Ontario, 2017)
Table 5. Typical efficiencies and emissions factors used to calculate existing emissions.
The COP of the heat pump during periods of energy sharing was calculated to be 4.2, with condenser
and evaporator EWTs of 38°C and 16°C. The COP of the dry cooler was calculated using AIACalc
software (LU-VE Sweden AB, n.d.). The average air temperature from November to April in Toronto
is 1°C (Government of Canada , 2016). Considering an EWT of 16°C and a leaving temperature of
10°C, the COP was calculated to be 31 or 0.1kW/ton, because of fan operation.
AIRAH and IBPSA’s Australasian Building Simulation 2017 Conference, Melbourne, November 15-
16. 10
Energy Sharing COP (EWT: 16°C, EWT: 38°C) 4.2
Average Dry Cooler COP (1°C average air
temperature)
31 (0.11kW/ton)
Table 6. Efficiencies of community energy network
Table 7 shows the GHG emission analysis. The emissions that remain unchanged are due to the fact
that the CEN does not provide all of the system’s thermal energy.
Annual Residential
Heating
Annual Data Centre
Cooling
Annual Residential
Cooling
Energy Requirement 29,968 MWh 35,153 MWh 7,552 MWh
Existing Emissions 6,593 tonnes 293 tonnes 84 tonnes
Remaining Unchanged 1,492 tonnes 113 tonnes 21 tonnes
Energy Sharing
Emissions
174 tonnes 0 tonnes N/A
Dry Cooler Emissions
10 tonnes 8 tonnes
Geo-exchange
Emissions
136 tonnes 47 tonnes 38 tonnes
Total GHG Savings 4,792 tonnes 123 tonnes 17 tonnes
Total GHG Savings 73% 42% 20%
Table 7. Comparison of existing emissions and CEN emissions
In total the CEN would save 4930 tonnes of equivalent CO2 emissions which is 71% of the existing
total. There would also be an environmental benefit due to water savings in cooling towers that is not
considered in this analysis.
4. CONCLUSIONS
The scope of this paper was to determine how much energy can be shared between data centres and
residential buildings in a CEN, while providing a portion of the remaining thermal energy requirement
with geo-exchange. The conducted analysis in this paper indicated that energy sharing was able to
account for 49% and 42% (14,593 MWh) of the total heating and cooling requirement for the
residential buildings and the data centres, respectively. The COP of the heat pump in energy sharing
mode was 4.2, which should greatly help the financial viability of this project.
500 boreholes drilled to 244 metre depth with 6.1 metre spacing in a 25 by 20 grid configuration was
required to provide cooling for two data centres and heating for 10 residential buildings constituting
1,995,000 ft2. A 2800kW dry cooler was also used to prevent the bore field from overheating. The
seasonal COP of the ground source heat pump in heating was 3.1 and 7.1 in cooling mode.
If implemented this CEN would save 4930 tonnes of CO2e emissions annually, or 71% of the existing
total for the community. This project would be the first data centre waste heat recovery system that
incorporates geo-exchange, and would be applicable anywhere a data centre is located near a heating
load.

AIRAH and IBPSA’s Australasian Building Simulation 2017 Conference, Melbourne, November 15-
16. 11
4.1 Future work
In future considerations of this research, the amount of buildings included in the CEN should be
optimised to maximise the amount of energy that is shared while reducing the peak requirement of
the bore field; reducing the ground loop length requirement, meaning avoided capital costs. The
amount of capacity allotted to the CEN should also be optimised to produce the maximum ROI.
A third scenario of having two separate bore fields for heating and cooling will also be considered.
This is theorised to create higher heating and cooling efficiencies, introducing controlled bore field
saturation to produce a temperature similar to that required for building side heating and cooling
supply temperatures.
Finally, a financial analysis will be conducted to determine the economic feasibility of the project,
and to determine which configuration poses the strongest business case.
ACKNOWLEDGEMENTS
I would like to thank Enwave Energy Corporation, Mitacs, Ontario Centre of Excellence, Ryerson
Faculty of Engineering, Dr Alan S. Fung and Adam A. Alaica for their support and funding.
AIRAH and IBPSA’s Australasian Building Simulation 2017 Conference, Melbourne, November 15-
16. 12
REFERENCES
1. Alaica, A. A., & Dworkin, S. B. (2017). Characterizing the effect of an off-peak ground pre-cool
control strategy on hybrid ground source heat pump systems. Energy and Buildings, 46-59.
2. Brunschwiler, T., Smith, B., Ruetsche, E., & Michel, B. (2009). Toward zero-emission data
centers through direct reuse of thermal energy. IBM Journal of Research and Development, 53(3),
11:1 - 11:13.
3. Data Center Dynamics. (2015, March 18). DCD at CeBIT: Heat reuse worth more than PUE -
Yandex. (Data Center Dynamics) Retrieved April 27, 2017, from
http://www.datacenterdynamics.com/content-tracks/design-build/dcd-at-cebit-heat-reuse-worth-
more-than-pue-yandex/93586.fullarticle
4. Davies, G., Maidment, G., & Tozer, R. (2016). Using data centres for combined heating and
cooling: An investigation for London. Applied Thermal Engineering, 94, 269-304.
5. Ebrahimi, K., Jones, G. F., & Fleischer, A. S. (2014). A review of data center cooling technology,
operating conditions and the corresponding low-grade waste heat recovery opportunities.
Renewable and Sustainable Energy Reviews, 31, 622-638.
6. Government of Canada . (2016, April 19). Candadian Climate Normals 1981-2010 Station Data.
Retrieved Novemeber 9, 2016, from
http://climate.weather.gc.ca/climate_normals/results_1981_2010_e.html?searchType=stnName&txt
StationName=Toronto&searchMethod=contains&txtCentralLatMin=0&txtCentralLatSec=0&txtCe
ntralLongMin=0&txtCentralLongSec=0&stnID=5051&dispBack=0
7. Government of Ontario. (2017). Ontario Building Code 2017.
8. Green Match . (2017, March 28). Condensing vs Non-Condensing Boilers. Retrieved April 27,
2017, from Green Match: http://www.greenmatch.co.uk/blog/2015/10/condensing-vs-non-
condensing-boilers
9. Hewlett-Packard. (2006, April 14). Model-Based Approach for Optimizing a Data Center
Centralized Cooling System. Retrieved October 29, 2016, from HP:
http://www.hpl.hp.com/techreports/2006/HPL-2006-67.pdf
10. IDEA Industry News. (2016, June 30). Update: In Seattle waste heat is being recovered to heat
buildings. (DistrictEnergy.org) Retrieved April 27, 2017, from
http://www.districtenergy.org/blog/2016/06/30/update-in-seattle-recovered-waste-heat-is-being-
used-to-heat-buildings/
11. Koomey, J. (2011). Growth in data center electricity use 2005 to 2010. New York Times.
12. LU-VE Sweden AB. (n.d.). AIACalc. Retrieved from
http://www.aia.se/_en/Default.aspx?PagId=96
13. MathWorks Inc. (2013). MATLAB 2013. Retrieved from http://www.mathworks.com/
14. Natural Resources Canada . (2013, May 15). CO2 Emission Factors. Retrieved June 10, 2017,
from http://www.nrcan.gc.ca/energy/efficiency/industry/technical-info/benchmarking/canadian-
steel-industry/5193
15. Open District Heating . (2012). Bahnhof data centre Thule. Retrieved October 30, 2016, from
https://oppenfjarrvarme.fortum.se/?case=bahnhof_thule&lang=en
16. Open District Heating . (2017). Pilots . Retrieved from Open District Heating :
https://www.opendistrictheating.com/

AIRAH and IBPSA’s Australasian Building Simulation 2017 Conference, Melbourne, November 15-
16. 13
17. Pacific Northwest Laboratory. (2014). ANSI/ASHRAE/IES Standard 90.1-2013 Determination
of Energy Savings: Quantitative Analysis. U.S. Department of Energy.
18. Thermal Dynamics. (2016). Ground Loop Design 2016. Retrieved from
http://www.groundloopdesign.com/
19. Velkova, J. (2016). Data that warms: Waste heat, infrastructural convergence and the
computation traffic commodity. Big Data and Society , 1-10.