TECHNICAL EVALUATION OF THE GREENHOUSE … · technical evaluation of the . greenhouse gas...
104
TECHNICAL EVALUATION OF THE GREENHOUSE GAS EMISSIONS REDUCTION QUANTIFICATION FOR THE MADERA COUNTY TRANSPORTATION COMMISSION’S SB 375 SUSTAINABLE COMMUNITIES STRATEGY FEBRUARY 2018 Electronic copies of this document can be found on CARB’s website at http://www.arb.ca.gov/cc/sb375/sb375.htm
Transcript of TECHNICAL EVALUATION OF THE GREENHOUSE … · technical evaluation of the . greenhouse gas...

TECHNICAL EVALUATION OF THE
GREENHOUSE GAS EMISSIONS REDUCTION QUANTIFICATION FOR THE
MADERA COUNTY TRANSPORTATION COMMISSION’S
SB 375 SUSTAINABLE COMMUNITIES STRATEGY
FEBRUARY 2018
Electronic copies of this document can be found on CARB’s website at http://www.arb.ca.gov/cc/sb375/sb375.htm

This document has been reviewed by the staff of the California Air Resources Board and approved for publication. Approval does not signify that the contents necessarily reflect the views and policies of the California Air Resources Board, nor does the mention of trade names or commercial products constitute endorsement or recommendation for use.
Electronic copies of this document are available for download from the California Air Resources Board’s Internet site at: http://www.arb.ca.gov/cc/sb375/sb375.htm. In addition, written copies may be obtained from the Public Information Office, California Air Resources Board, 1001 I Street, 1st Floor, Visitors and Environmental Services Center, Sacramento, California 95814, (916) 322-2990.
For individuals with sensory disabilities, this document is available in Braille, large print, audiocassette, or computer disk. Please contact CARB’s Disability Coordinator at (916) 323-4916 by voice or through the California Relay Services at 711, to place your request for disability services. If you are a person with limited English and would like to request interpreter services, please contact the CARB’s Bilingual Manager at (916) 323-7053.

Contents
I. EXECUTIVE SUMMARY .......................................................................................... i
II. MADERA COUNTY TRANSPORTATION COMMISSION ....................................... 3
A. Background .......................................................................................................... 3 B. Transportation Planning in the Region ................................................................. 6
III. 2014 SCS DEVELOPMENT ................................................................................... 13
A. Development and Selection of the SCS Scenario .............................................. 13 B. Amended SCS .................................................................................................... 14
IV. CARB STAFF EVALUATION ................................................................................. 17
A. Methodology ....................................................................................................... 17 B. Data Inputs and Assumptions ............................................................................. 18 C. Modeling Tools ................................................................................................... 18 D. Off-Model Calculations ....................................................................................... 19 E. SCS Performance Indicators .............................................................................. 19
V. CONCLUSION ....................................................................................................... 25
A. Findings .............................................................................................................. 25 B. Recommendations .............................................................................................. 26
VI. REFERENCES....................................................................................................... 28
APPENDIX A: CARB Technical Review ........................................................................ 31
I. Data Inputs and Assumptions ................................................................................ 31
A. Land Use Assumptions and Growth Forecast .................................................... 31 B. Transportation Network Inputs and Assumptions ............................................... 34 C. Cost Inputs and Assumptions ............................................................................. 36
II. Modeling Tools ....................................................................................................... 38
A. Land Use Planning Tool ..................................................................................... 38 B. Travel Demand Model ........................................................................................ 38 C. EMFAC Model .................................................................................................... 47 D. Off-Model Strategies ........................................................................................... 47
III. Model Sensitivity Analysis ...................................................................................... 49
A. Auto Operating Cost Sensitivity Test .................................................................. 50 B. Household Income Distribution ........................................................................... 51 C. Transit Frequency ............................................................................................... 52

D. Overall Assessment of Sensitivity Testing Results ............................................. 53
APPENDIX B: MCTC Modeling Data Table .................................................................. 54
APPENDIX C: MCTC Description of Amendment Modeling Changes and Off-Model Strategies, January 2017 .............................................................................................. 64
APPENDIX D: MCTC Supplement on Changes in Transportation Funding Allocations, Assumed Higher Density Housing Shifts, & Infill Development, December 2017 .......... 86
APPENDIX E: Residential Density Supplemental Data ................................................. 98

LIST OF TABLES
Table 1. Change in Residential Density by Sub-area (2010-2040) ............................... 21 Table 2: Demographic Forecast (2010-2035) ................................................................ 32 Table 3: Lane Miles in 2010 by Facility Type ................................................................ 34 Table 4: Default Link Capacity and Speed Assumptions by Terrain Type ..................... 35 Table 5: Auto Operating Cost (cents/mile, in 2000 Dollars) ........................................... 37 Table 6. Cost of Time Assumptions .............................................................................. 37 Table 7. Data Sources and Modeling Variables for Trip Generation ............................. 41 Table 8. Trip Rates by Housing Type (per dwelling unit) ............................................... 42 Table 9. Trip Rates by Employment Type (per employee) ............................................ 42 Table 10. Trip Rate by School Type (per student) ......................................................... 42 Table 11. Assumptions of Travel Time and Cost by Travel Mode ................................. 43 Table 12: Average Travel Time by Travel Mode (Minutes) ............................................ 44 Table 13: Person-trips by Mode in 2010 ........................................................................ 45 Table 14: Estimated and Observed Traffic Counts for MCTC Region ........................... 47 Table 15: Model Validation – Total VMT in 2005 for MCTC Region .............................. 47 Table 16. Household Income Distribution – Mode Share .............................................. 52
LIST OF FIGURES
Figure 1: MCTC Context Map ......................................................................................... 4 Figure 2: MCTC Map of Roadways ................................................................................. 7 Figure 3: Summary of Expenditures by Mode 2014-2040 ............................................. 11 Figure 4. Residential Density of New Development (2010-2040) .................................. 21 Figure 5. Shift towards Smaller Lot Sizes in New Developments (2010-2040) ............. 22 Figure 6. Shift towards Multi-Family Housing ................................................................ 23 Figure 7. Percent Change in Transportation Investment by Mode ................................ 24 Figure 8: MCTC's Modeling Tools ................................................................................. 38 Figure 9: Madera County Travel Demand Model .......................................................... 40 Figure 10: Change of Mode Share and Auto Operating Cost ........................................ 50 Figure 11: VMT Changes for Household Income Distribution Scenarios ...................... 52 Figure 12: Impact of Transit Frequency on Mode Share ............................................... 53

i
I. EXECUTIVE SUMMARY
The Sustainable Communities and Climate Protection Act of 2008 (SB 375) calls for the California Air Resources Board (CARB) to accept or reject the determination of each metropolitan planning organization (MPO), that their Sustainable Communities Strategy (SCS) would, if implemented, achieve the passenger vehicle greenhouse gas (GHG) emissions reduction targets (targets) for 2020 and 2035, set by CARB.
For Madera County Transportation Commission (MCTC), the MPO for the County of Madera, CARB set per capita GHG emissions reduction targets for the region of 5 percent in 2020 and 10 percent in 2035 from a 2005 base year. The MCTC Board adopted a final Regional Transportation Plan/Sustainable Communities Strategy (RTP/SCS) on July 23, 2014. The 2014 SCS projected that the region would not, if implemented, achieve either the 2020 or 2035 GHG emissions reduction targets. Because the 2014 RTP/SCS would not achieve the 2020 or 2035 targets, the plan would not qualify as an SCS under SB 375. For this reason, MCTC initiated a reevaluation of the 2014 SCS, which resulted in an amendment to their SCS (Amended SCS), adopted on June 21, 2017. MCTC transmitted a complete submittal of their Amended SCS and GHG emissions quantification documentation to CARB for review on December 29, 2017.
Madera County (County) is in the San Joaquin Valley (Valley), a significant agricultural region of the State, with a population of about 151,000 people. The County is the second smallest of the Valley counties by population size. The transportation system is primarily auto-dependent, however there are various public transportation services provided by the City of Madera, City of Chowchilla, and County. Development in the region is primarily low density, single-family residential located within the two incorporated cities.
The Amended SCS builds off the Madera County Blueprint Report which prioritizes preservation of environmental and agricultural land and development in urban centers with connections to transportation corridors. The land use strategy of the SCS focuses on efforts within local jurisdictions to increase connectivity and the mix of land uses that will help provide more housing choices for residents and decrease travel distances to destinations. The Amended SCS also includes increased investments in public transportation projects, as well as non-motorized transportation options that aim to meet the needs of residents. Additionally, continued investment in vanpools and rideshare will continue to be an effective alternative to single occupant vehicle travel for some residents.
This report represents CARB staff’s evaluation of MCTC’s Amended SCS and GHG emissions reduction determination, and describes methods used to evaluate the GHG emissions quantification. CARB staff has concluded that MCTC’s Amended SCS, if implemented, would achieve the region’s GHG emissions reduction targets of 5 and 10 percent reduction in 2020 and 2035, respectively.

ii
This conclusion is based on CARB staff’s independent assessment of multiple factors, including the sensitivity of the MPO’s travel demand model, and the types of projects and strategies in the SCS that support compact development, and qualitative evidence from SCS performance indicators that indicate the region’s ability to reduce per capita emissions. While MCTC’s travel model structure is similar to that of the other San Joaquin Valley MPOs, and the model inputs and assumptions were consistent with those used to forecast VMT for the other SCSs in the San Joaquin Valley, MCTC’s travel model did not perform as expected, and some model parameters were not sensitive to changes in response to MCTC’s key SCS strategies. The travel model results indicated an inexplicably large reduction in per capita GHG emissions, despite the model’s reported lack of directional sensitivity to MCTC’s described strategy. Given that CARB staff could not make a clear determination on the reasonableness of MCTC’s travel modeling as a means for verifying estimated GHG emissions reductions from their SCS, for this assessment, CARB staff utilized an alternative approach, for purposes of this evaluation only, using the weight of evidence expressed in the performance indicators section of this evaluation, combined with expected effects on emissions in published literature from specific strategies.

3
II. MADERA COUNTY TRANSPORTATION COMMISSION
In California, Metropolitan Planning Organizations (MPO) are responsible for preparing and updating Regional Transportation Plans (RTP)1 that include a Sustainable Communities Strategy (SCS),2 demonstrating a reduction in regional greenhouse gas (GHG) emissions from automobiles and light-duty trucks to meet regional targets set by the California Air Resources Board (CARB).
Madera County Transportation Commission (MCTC) is the federally designated MPO and State designated Regional Transportation Planning Agency (RTPA) for Madera County (County). MCTC member agencies include the County and the two incorporated cities of Madera and Chowchilla. MCTC’s Policy Board is composed of three members from the County Board of Supervisors, two members from the Madera City Council and one member from the Chowchilla City Council. Additionally, the MCTC Transportation Policy Committee includes the same membership as the Policy Board with the addition of one representative from Caltrans District 6. The RTP/SCS Roundtable (Roundtable), the RTP Technical Working Group, and the Social Services Transportation Advisory Council, along with input collected during public workshops, informed the development of the 2014 RTP/SCS and subsequent 2017 RTP/SCS Amendment (Amended SCS).
A. Background
The MCTC region encompasses approximately 2,147 square miles in the central San Joaquin Valley (Figure 1). The region is primarily rural or agricultural lands with 55 percent of the land area dedicated to farmland. About two thirds of the County is largely undeveloped due to agricultural and open space preservation with dedicated public lands including the Devils Postpile National Monument and portions of the Sierra National Forest, Inyo National Forest, and Yosemite National Park. Residential development throughout the County is mostly suburban or rural in nature consisting of low density, single-family residential, which constitutes approximately 94 percent of the existing housing supply.
1 An RTP is a federally required plan to finance and program regional transportation infrastructure projects, and associated operation and maintenance for the next 20 years. 2 The SCS sets forth a forecasted development pattern for the region which, when integrated with the transportation network and other transportation measures and policies, will reduce the GHG emissions from automobiles and light trucks. It shall include identification of the location of uses, residential densities and building densities, information regarding resource areas and farmland.

4
Figure 1: MCTC Context Map
Source: CARB

5
The MCTC region is the second smallest of the San Joaquin Valley MPOs in terms of population size. The largest city, and only urbanized area3 within the County, is the City of Madera with almost 77,000 residents, or about 50 percent of the County’s total population. The only other city within the County is the City of Chowchilla, which consists of 14,000 residents. About 40 percent of the population lives in unincorporated communities divided among the mountain and rural areas especially along State Route (SR) 99. There are several unincorporated population centers adjacent to the City of Madera including Madera Acres, Parkwood, and Parksdale. Bonadelle Ranchos-Madera is located off SR 145 between the City of Madera and SR 41, north of Fresno. The communities located along SB 41 on the way to Yosemite National Park include: Yosemite Lakes, Coarsegold, and Oakhurst. Ahwahnee is located in the foothills off of SR 49 on the edge of the Sierra National Forest. Additionally, the Bass Lake community is located within the Sierra National Forest, close to Bass Lake and north of Shaver Lake, both recreational destinations.
SR 99 is a major transportation corridor for the movement of agricultural products and other commercial goods throughout the State, and also serves as a major link for recreation-bound traffic.4 The SR 99 corridor runs north-south through the center of the County and the City of Madera and is a source of heavy truck travel. Other primary transportation facilities in the region include SR 41, 49, 145, 152, and 233, with most traffic served by SR 41 and 99 (Figure 2). The eastern half of the region consists of the Sierra National Forest and is home to the 80-acre North Fork Rancheria of Mono Indians, which is the largest restored Tribe in California with nearly 1,800 tribal citizens,5 and the 2,000 acre reservation for the Picayune Rancheria of Chukchansi Indians.6
Between 2010 and 2015, the unemployment rate in the County has dropped from 12 percent7 to 7.5 percent8. The top five industries by employment are: (1) agriculture, forestry, fishing and hunting, (2) educational services, health care, and social assistance, (3) retail trade, (4) manufacturing, and (5) arts, entertainment, recreation, accommodation and food services. Major employers within the County include: Valley Children’s Hospital, Valley State Prison for Women, and Chukchansi Gold Resort.9 All three of these major employers are served by transit.
3 The US Census Bureau defines the term urbanized area as any area with a population of 50,000 or greater. 4 Caltrans. State Route 99 Corridor System Management Plan San Joaquin County Area. (2008). http://www.dot.ca.gov/d10/tcr-csmp/sr99/FinalSJ-99CSMP103108.pdf 5 North Fork Rancheria of Mono Indians of California. (2018). Our People – History. Accessed January 19, 2018. Retrieved from: http://northforkrancheria-nsn.gov/our-people/history 6 The Official Website of the Chukchansi Indians. (2013). Culture (History & Language. Accessed January 19, 2018. Retrieved from: http://chukchansitribe.net/culture-history-language/ 7 U.S. Census Bureau, 2006-2010 American Community Survey 5-Year Estimates 8 U.S. Census Bureau, 2011-2015 American Community Survey 5-Year Estimates 9 Employment Development Department. Major Employers in Madera County. (2018). http://www.labormarketinfo.edd.ca.gov/majorer/countymajorer.asp?CountyCode=000039
6
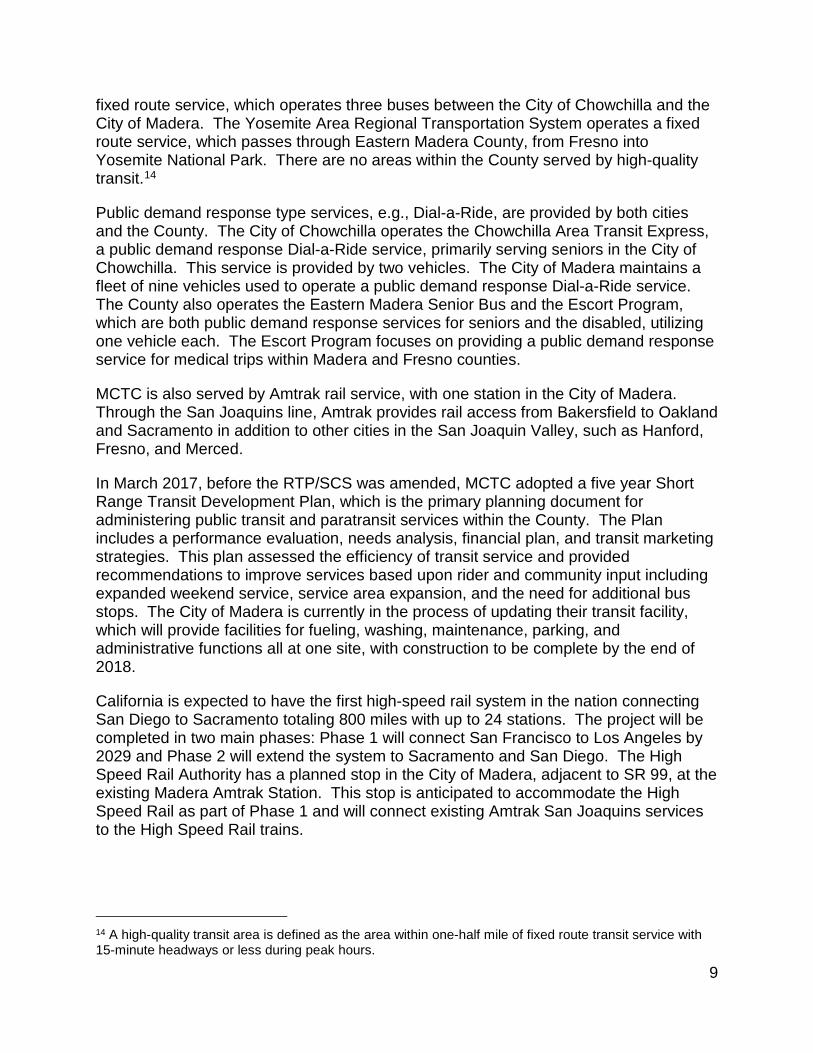
In 2015 the County’s agricultural activities resulted in overall gross crop production of over $2 billion with the top three commodities being almonds, grapes, and milk.10 Additionally in 2015, Madera County ranked first in the State for fig production, fourth for raisin grape production, and fourth for pistachio production.11 Within the eastern part of the County, Madera has a history of supporting a lumber-based economy, however this economic base has been curtailed by recent environmental actions.
B. Transportation Planning in the Region
MCTC develops an RTP/SCS, a long range planning document, to integrate the growth policies of local governments in the region and the transportation system needed to support that growth. For the 2014 RTP/SCS, MCTC developed the plan in coordination with its member cities and County, transportation providers, facility operators, appropriate federal, State, and local agencies, Native American Tribal Governments, environmental resource agencies, air district, pedestrian and bicycle representatives, and adjoining MPO/RTPAs.
1. Transportation Systems
Madera County’s transportation system is primarily concentrated within the cities of Madera and Chowchilla, however it is also served regionally by SR 99 and Amtrak. The transportation network consists of freeways, highways, local roadways, transit, rail, and bicycle/pedestrian facilities. MCTC is focused on enhancing the operational efficiency of its transportation network and encouraging active transportation (non-motorized transportation). The following section describes the existing transportation network in the MCTC region.
Roadways
MCTC has approximately 133 miles of freeway and general purpose lanes and an estimated 2,157 lane miles of streets and highways. Total lane miles within the regionally significant road network are projected to increase from 1,600 to almost 2,000 miles by 2040. There are six state highways in the County, with most traffic served by SR 41, which is the main route to Yosemite National Park, and SR 99, which bisects the County through the City of Madera (Figure 2).
10 Madera County Farm Bureau. Welcome to Madera County. Accessed January 19, 2018. Retrieved from: https://www.maderafb.com/about/county-ag-stats/ 11 Madera County Farm Bureau. Welcome to Madera County. Accessed January 19, 2018. Retrieved from: https://www.maderafb.com/about/county-ag-stats/

7
Figure 2: MCTC Map of Roadways
Source: CARB
The MCTC region is reliant on the roadway system for both residents and goods movement, as well as the social and economic well-being of the region. The roadway system supports a rural land use development pattern outside Chowchilla and Madera. Both freight and trucking services provide goods movement in the County to support an agricultural economy. Trucking facilities include the public highway system, truck terminal facilities, truck stops, and maintenance facilities, which are primarily located along SR 99.

8
Transportation Demand Management
MCTC provides guidance and resources to regional employers required to comply with the San Joaquin Valley Air Pollution Control District’s Employer Trip Reduction Implementation Plan (eTRIP) Rule 9410. This program requires employers of over 100 employees to encourage employees to reduce single-occupancy vehicle trips through strategies like providing preferential parking for vanpools and rideshare, and bicycle parking.
Vanpooling is a viable transportation option for many residents in the MCTC region. MCTC is a member of the California Vanpool Authority (CalVans) which promotes vanpooling in the region and currently operates 25 vanpools that originate in Madera County. Almost all of these vanpools, 24 of 25, support commuters in the agricultural industry.12 For trips originating in Madera County, CalVans has increased ridership since 2010, with 1.1 million more passenger lane miles and 3,400 new passenger trips.13
The Madera region is also served by Central Valley Rideshare, called ValleyRides, a voluntary rideshare program provided by the Fresno Council of Governments (Fresno COG), which services Fresno, Kings, Madera, and a portion of Tulare counties. This program provides computerized ride matching services, employer outreach, and marketing.
Additionally, Caltrans manages three park-and-ride lots along the SR 41 corridor at the following intersections: Road 200, SR 145, and Avenue 10.
Transit and Rail
Madera County public transportation services are provided by the cities of Chowchilla and Madera and the County. Fixed-route bus services are provided by the City of Madera, which operates the Madera Area Express, a six bus fixed-route system primarily within the city limits. The County of Madera operates the Madera County Connection, a six vehicle fixed-route system with inter-city weekday service. Additionally, the City of Chowchilla operates CatLinx, an inter-city 12 Calvans. (2017). Calvans August Newsletter. http://www.calvans.org/sites/default/files/downloadable-pdfs/events/Low%20Res_August%202017_Newsletter.pdf 13 FY 16-17 Vanpool Ridership by County of Origination were provided by CalVans staff via email correspondence on November 27, 2017.
Source: http://sanjoaquinrtd.com/wptest/vanpool/
Source: http://mcctransit.com/contact-us/
9
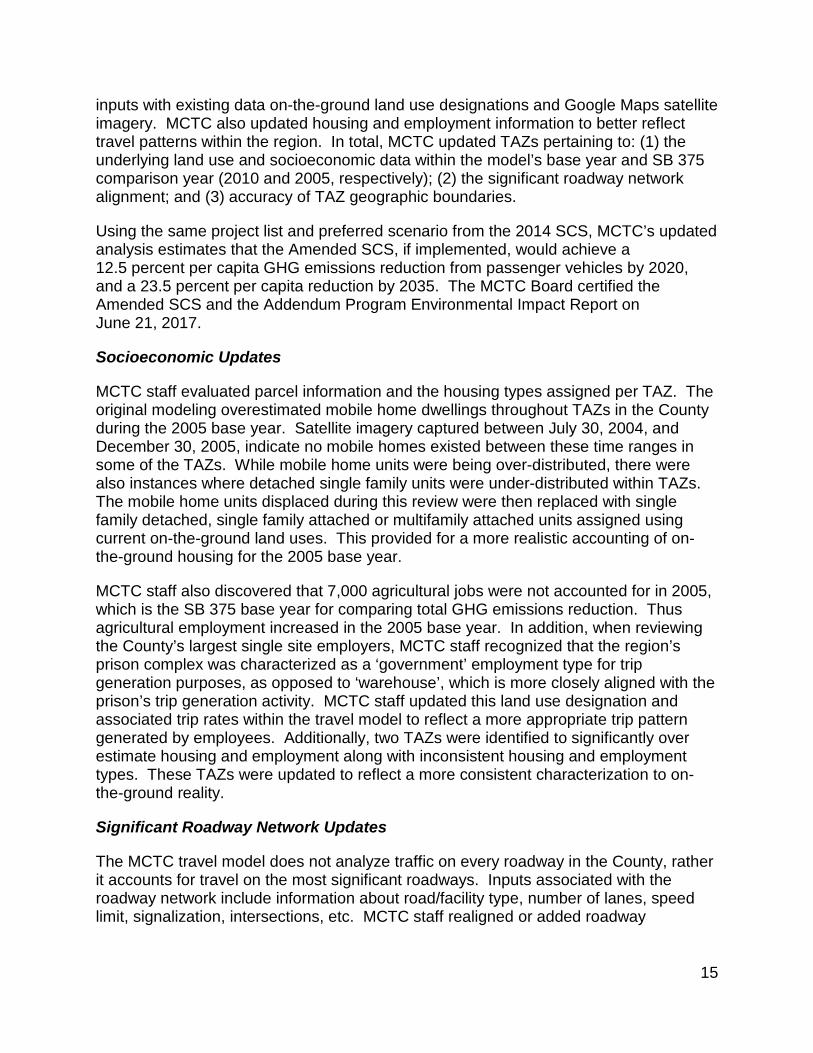
fixed route service, which operates three buses between the City of Chowchilla and the City of Madera. The Yosemite Area Regional Transportation System operates a fixed route service, which passes through Eastern Madera County, from Fresno into Yosemite National Park. There are no areas within the County served by high-quality transit.14
Public demand response type services, e.g., Dial-a-Ride, are provided by both cities and the County. The City of Chowchilla operates the Chowchilla Area Transit Express, a public demand response Dial-a-Ride service, primarily serving seniors in the City of Chowchilla. This service is provided by two vehicles. The City of Madera maintains a fleet of nine vehicles used to operate a public demand response Dial-a-Ride service. The County also operates the Eastern Madera Senior Bus and the Escort Program, which are both public demand response services for seniors and the disabled, utilizing one vehicle each. The Escort Program focuses on providing a public demand response service for medical trips within Madera and Fresno counties.
MCTC is also served by Amtrak rail service, with one station in the City of Madera. Through the San Joaquins line, Amtrak provides rail access from Bakersfield to Oakland and Sacramento in addition to other cities in the San Joaquin Valley, such as Hanford, Fresno, and Merced.
In March 2017, before the RTP/SCS was amended, MCTC adopted a five year Short Range Transit Development Plan, which is the primary planning document for administering public transit and paratransit services within the County. The Plan includes a performance evaluation, needs analysis, financial plan, and transit marketing strategies. This plan assessed the efficiency of transit service and provided recommendations to improve services based upon rider and community input including expanded weekend service, service area expansion, and the need for additional bus stops. The City of Madera is currently in the process of updating their transit facility, which will provide facilities for fueling, washing, maintenance, parking, and administrative functions all at one site, with construction to be complete by the end of 2018.
California is expected to have the first high-speed rail system in the nation connecting San Diego to Sacramento totaling 800 miles with up to 24 stations. The project will be completed in two main phases: Phase 1 will connect San Francisco to Los Angeles by 2029 and Phase 2 will extend the system to Sacramento and San Diego. The High Speed Rail Authority has a planned stop in the City of Madera, adjacent to SR 99, at the existing Madera Amtrak Station. This stop is anticipated to accommodate the High Speed Rail as part of Phase 1 and will connect existing Amtrak San Joaquins services to the High Speed Rail trains.
14 A high-quality transit area is defined as the area within one-half mile of fixed route transit service with 15-minute headways or less during peak hours.

10
Active Transportation
MCTC is currently preparing the Madera County Regional Active Transportation Plan which presents a long-range vision for the bicycle and pedestrian network across the county. This plan provides guidance on the development of bicycle and pedestrian infrastructure including route identification and implementation sources. Active transportation needs are identified in the 2014 RTP/SCS and include supporting education and enforcement programs for safe bike lane use, lack of adequate shoulder space on highways for bicycle travel, bike route services in rural areas, and bike parking and storage facilities in urban areas.
MCTC is in the process of developing a regional Complete Streets policy to promote and formalize the accommodation of all users and modes in the transportation system. In August 2017, MCTC published the Complete Streets Development White Paper which includes an overview of best practices and key topics that can be included in a context sensitive Complete Streets policy. Feedback from local agencies and stakeholders will be used to develop the regional policy.
2. Transportation Funding
RTPs must be financially constrained, meaning that funding for planned transportation projects must be reasonably foreseeable. Funding for transportation projects comes from federal, State, and local sources, including federal transportation funding legislation, fuel taxes, license fees, and developer-paid impact fees.
MCTC includes a constrained transportation list with total available funding of $1.4 billion for the planning period 2014-2040. The revenue assumptions did not change between the 2014 RTP/SCS and Amended RTP/SCS. Funding for the projects listed in the RTP/SCS comes from a combination of federal (26 percent) and State (13 percent), and local (61 percent) sources. The region has implemented a self-help taxation measure, Measure T, to help raise additional transportation revenue. Measure T, passed in 2006, is a local ½ cent sales tax estimated to generate $213 million in funding over a 20-year period.
The Amended RTP/ SCS allocates almost $1.4 billion to transportation investments dedicating 76 percent of the total budget to streets and roads ($1.1 billion), 17 percent to public transit ($238 million), and 3 percent to non-motorized active transportation ($36 million). The remaining 4 percent ($57 million) is for “other” projects, which includes low and zero-emission vehicle projects, electric charging stations, traffic signals, and various transportation control measures/transportation systems management projects. Figure 3 summarizes the funding allocation by mode.

11
Figure 3: Summary of Expenditures by Mode 2014-2040
Source: MCTC 2014 RTP/SCS
Supplemental Funding
In addition to federal, State, and local funding sources, MCTC has also received grant funding for projects related to technology and mobility improvements. In 2016, MCTC was awarded approximately $140,000 and the City of Madera was awarded $50,000 in grant funding through the Low Carbon Transportation Program.15 MCTC plans to purchase and install Wi-Fi equipment for all Madera County Connection Buses. Funds will also be used to install bike lockers, benches, signage, shelters, and trash receptacles at various bus stops throughout the region. This funding is anticipated to help attract new transit riders by improving comfort and safety at bus stops.
During fiscal year 2015-2016, Caltrans awarded a Transportation Planning Grant to the eight Valley MPOs and the University of California at Davis, Institute of Transportation Studies for a shared access pilot program to help address transit needs in rural areas.16 This program will identify car, bike, and ridesharing options as well as other alternatives that may meet the transit needs of smaller communities in the Valley.
In addition, the San Joaquin Valley Regional Policy Council, made up of the eight Valley counties, received approximately $980,000 in grant funding from the Strategic Growth
15 Low Carbon Transportation Program is one of 21 programs funded through California Climate Investments. 16 Caltrans. (2016). Fiscal year 2015-2016 Sustainable Transportation Planning Grant Awards. http://www.dot.ca.gov/hq/tpp/documents/AwardList.pdf

12
Council to implement the Sustainable Energy Roadmap. Implementation of the Sustainable Energy Roadmap, a project being led by MCTC, will leverage a proven process and set of tools to support municipal agencies in the Valley to adopt and pursue clean energy and sustainable development goals that optimize outcomes for their most disadvantaged communities delivering a triple bottom line (environment, economy, and equity) benefit.17 The objective of the roadmap is to reduce GHG emissions, protect open space and agricultural lands, increase water and energy conservation and efficiency, and promote a prosperous economy and safe, healthy, and walkable communities.
17 California Natural Resources Agency. (2015). Bond Accountability – Project: Implementing a Sustainable Energy Roadmap for the San Joaquin Valley. http://bondaccountability.resources.ca.gov/Project.aspx?ProjectPK=12608&PropositionPK=4

13
III. 2014 SCS DEVELOPMENT
This section describes the planning context within which the SCS was developed and the process through which the plan was subsequently amended and adopted. MCTC began its public process in 2012 by consulting with various public and local agency representatives to gather input for alternative investment scenarios and to hold public workshops to explain the scenarios and provide opportunities to comment. These scenarios illustrated different options for the region’s future through 2040.
A. Development and Selection of the SCS Scenario
In 2006, MCTC along with the seven other Councils of Governments (COGs) in the Valley initiated a long-range blueprint planning effort intended to establish a more sustainable vision for the region. MCTC used the Blueprint scenarios as the basis for their SCS scenario development process.
MCTC began the 2014 SCS planning process by updating its demographic and socioeconomic growth forecasts using the 2010 Census and the California Department of Finance “Interim Projections for California: State and Counties, July 1, 2015, to 2050 (in 5-year increments)” released May 7, 2012. Demographic and socioeconomic growth forecasts are fundamental to understanding the needs of people who live, work and travel in the region (see APPENDIX A: CARB Technical Review for more information on the growth forecast).
MCTC then created the Roundtable composed of local agencies and stakeholders to serve as the main planning committee for the 2014 SCS. The Roundtable reviewed the transportation and land use modeling process, prioritization process, development of the SCS alternative scenarios and modeling results, as well as performance measures and selected the preferred scenario.
Between 2012 and 2014, MCTC and their consultant, VRPA Technologies, Inc., conducted over 15 public meetings, to gain input from the community and provide information on the SCS planning process. In addition, MCTC developed a web-based tool to collect community input and conducted outreach to local agencies to obtain feedback on the consistency of the SCS scenarios with existing General Plans and how they would affect future land use decisions. Based on the public and local jurisdiction input, regional priorities for growth and development were identified in three distinct scenarios. The Roundtable selected a preferred scenario which was then adopted by the Policy Board to be used in the SCS.
Land Use Characteristics of the SCS
The preferred scenario assumes an increase of residential density of 20 percent across the region compared to the region’s existing average density by 2035, with increased densities across all growth areas and a focus in the City of Madera and the Southeast Madera County. MCTC projects that by 2035, the share of multi-family housing units in the region will increase by 38 percent compared with 2005. MCTC cites examples of

14
several major projects that have recently been entitled or are currently undergoing permit processing in the region that already collectively comprise over 10,000 units proposed at densities well above their existing average density of 2.9 dwelling units per acre. See APPENDIX D: MCTC Supplement on Changes in Transportation Funding Allocations, Assumed Higher Density Housing Shifts, & Infill Development, December 2017 for further detail.
Transportation Characteristics of the SCS
The preferred scenario promotes an expanded transportation system through dedication of increased investments in public transit, non-motorized transportation, and increasing the number of transportation linkages throughout the system. MCTC more than doubles the funding for public transit compared to its previous RTP for public transit, with planned improvements including fleet expansion and operational assistance such as upgrades to on-board technology and bus stop amenities. MCTC also dedicates 10 percent more funding than in the previous RTP to non-motorized transportation improvement projects, which include pedestrian and bicycle facilities, no and low-emission vehicle projects, electric charging stations, traffic signals, and other transportation system management and transportation control measures, like rideshare programs (CalVans and ValleyRide) and the park-and-ride facilities program.
Before the scheduled adoption of the SCS, MCTC realized that the modeled results of their preferred scenario would not meet the assigned SB 375 targets. However, the MCTC Policy Board decided to continue with adoption of the 2014 SCS and the Program Environmental Impact Report, Federal Transportation Improvement Program, and Conformity Finding on July 23, 2014. After the adoption of the 2014 SCS, MCTC identified issues within their travel demand model (travel model)18 inputs and assumptions that required further attention and prepared an Amended SCS with refinement to the modeling inputs.
B. Amended SCS
After the adoption of the 2014 SCS, MCTC staff conducted a detailed analysis of their modeling inputs to better understand why the modeled results of their identified SCS strategies were not achieving the GHG emissions reduction targets set by CARB. MCTC staff concluded the inputs used in the MCTC travel model, which is the planning tool used to calculate GHG emissions reduction from land use and transportation inputs, could be refined to improve accuracy of emissions results.
As part of this process, MCTC staff individually examined each modeled transportation analysis zone (TAZ)19 within their region and compared the associated travel model 18 MCTC uses traffic model and transportation model interchangeably, for consistency travel model is used throughout this evaluation. 19 To apply model inputs to a region specific calculation, travel models use Transportation or Traffic Analysis Zones (TAZ). These are geospatial areas which divide up the entire county by distinguishing individual geographic areas. Each TAZ has an assigned traffic distribution associated with the significant roadway network.
15
inputs with existing data on-the-ground land use designations and Google Maps satellite imagery. MCTC also updated housing and employment information to better reflect travel patterns within the region. In total, MCTC updated TAZs pertaining to: (1) the underlying land use and socioeconomic data within the model’s base year and SB 375 comparison year (2010 and 2005, respectively); (2) the significant roadway network alignment; and (3) accuracy of TAZ geographic boundaries.
Using the same project list and preferred scenario from the 2014 SCS, MCTC’s updated analysis estimates that the Amended SCS, if implemented, would achieve a 12.5 percent per capita GHG emissions reduction from passenger vehicles by 2020, and a 23.5 percent per capita reduction by 2035. The MCTC Board certified the Amended SCS and the Addendum Program Environmental Impact Report on June 21, 2017.
Socioeconomic Updates
MCTC staff evaluated parcel information and the housing types assigned per TAZ. The original modeling overestimated mobile home dwellings throughout TAZs in the County during the 2005 base year. Satellite imagery captured between July 30, 2004, and December 30, 2005, indicate no mobile homes existed between these time ranges in some of the TAZs. While mobile home units were being over-distributed, there were also instances where detached single family units were under-distributed within TAZs. The mobile home units displaced during this review were then replaced with single family detached, single family attached or multifamily attached units assigned using current on-the-ground land uses. This provided for a more realistic accounting of on-the-ground housing for the 2005 base year.
MCTC staff also discovered that 7,000 agricultural jobs were not accounted for in 2005, which is the SB 375 base year for comparing total GHG emissions reduction. Thus agricultural employment increased in the 2005 base year. In addition, when reviewing the County’s largest single site employers, MCTC staff recognized that the region’s prison complex was characterized as a ‘government’ employment type for trip generation purposes, as opposed to ‘warehouse’, which is more closely aligned with the prison’s trip generation activity. MCTC staff updated this land use designation and associated trip rates within the travel model to reflect a more appropriate trip pattern generated by employees. Additionally, two TAZs were identified to significantly over estimate housing and employment along with inconsistent housing and employment types. These TAZs were updated to reflect a more consistent characterization to on-the-ground reality.
Significant Roadway Network Updates
The MCTC travel model does not analyze traffic on every roadway in the County, rather it accounts for travel on the most significant roadways. Inputs associated with the roadway network include information about road/facility type, number of lanes, speed limit, signalization, intersections, etc. MCTC staff realigned or added roadway

16
segments to the travel model using observed data to make the network more closely align with the real world system and planned capital improvement projects.
Traffic Analysis Zone Updates
A standard practice for TAZs in a travel model is that they should not be intersected by any roadways from the significant roadway network the model uses, nor should they be intersected by geographic features such as rivers. Within the region, several TAZs were bisected by the roadway network and realigned to adhere to this practice.
Additionally, several new TAZs were created to better align to the significant roadway network, and refine the distribution of traffic. For example, MCTC staff also created a new TAZ in rural eastern Madera County to capture traffic behavior related to the Chukchansi Gold Resort and Casino, one of Madera County’s largest employers. With this change, MCTC was able to assign a trip rate to the TAZ that more accurately reflects travel activity in that part of their region.
Other
In addition MCTC corrected technical errors in the previous model runs pertaining to interregional trips, time of day factors, and traffic counts and volumes. This is discussed in detail in APPENDIX A: CARB Technical Review.

17
IV. CARB STAFF EVALUATION
MCTC’s quantification of the GHG emissions reduction in the SCS is central to its determination that the SCS would meet the targets established by CARB. Those targets for MCTC are 5 percent per capita reduction in 2020 and 10 percent per capita reduction in 2035 from 2005 levels. CARB staff’s evaluation of MCTC’s Amended SCS and technical documentation indicates that if implemented, the Amended SCS would meet the GHG emissions reduction targets set by the Board. This section describes the method CARB staff used to review MCTC’s determination that its Amended SCS would meet its targets, and reports the results of CARB staff’s evaluation of MCTC’s quantification of the passenger vehicle GHG emissions reduction.
A. Methodology
CARB staff’s evaluation of MCTC’s Amended SCS included assessments of both the technical aspects of MCTC’s modeling, as well as the expected effects of policy changes included in the SCS.
Government Code section 65080(b)(2)(J)(i) requires the MPO to submit a description to CARB of the technical methodology it intends to use to estimate GHG emissions from its SCS. MCTC’s March 2014 technical methodology identifies the regional travel demand model, model inputs and assumptions, land use projections, growth forecast, performance indicators, and sensitivity analyses, as the technical foundation for its quantification.
To assess the technical soundness and general acceptability of MCTC’s GHG emissions quantification, four central components were evaluated: 1) data inputs and assumptions, 2) modeling tools, 3) model sensitivity, and 4) performance indicators. The general method of review is outlined in CARB’s July 2011 document entitled “Description of Methodology for ARB Staff Review of Greenhouse Gas Reductions from Sustainable Communities Strategies Pursuant to SB 375.” To address the unique characteristics of each MPO region and modeling system, CARB’s methodology is tailored for the evaluation of each MPO.
For MCTC, CARB staff’s evaluation examined how MCTC’s travel model operates and performs when estimating travel demand, land use impacts, and future growth, and how well it is able to quantify GHG emissions reduction associated with the SCS. In evaluating whether the modeling was reasonably sensitive for these purposes, CARB staff examined how well MCTC’s travel demand model responded to specific changes in input values, as well as how accurately it replicated observed results. Given that CARB staff could not make a clear determination of the reasonableness of MCTC’s travel modeling results as a means for estimating GHG emission reductions from MCTC’s SCS, CARB staff could not rely purely on MCTC’s travel modeling results to make a determination that its SCS would meet the Board adopted targets.
Thus, for purposes of this evaluation only, CARB staff conducted an alternative weight of evidence approach. Under this approach, CARB staff compared changes in land use

18
and transportation policy assumptions from MCTC’s status quo scenario to its preferred scenario and the expected effects on GHG emissions using evidence expressed in the performance indicators section of CARB staff’s evaluation, combined with published literature on VMT and GHG emissions reductions from specific strategies.
CARB staff used publicly available information in MCTC's Amended SCS and accompanying documentation, including the technical appendices, model documentation, technical memo with amendment changes, and data table (see APPENDIX D: MCTC Supplement on Changes in Transportation Funding Allocations, Assumed Higher Density Housing Shifts, & Infill Development, December 2017).
B. Data Inputs and Assumptions
CARB staff reviewed MCTC’s key modeling inputs and assumptions for land use, forecasted regional growth, the region’s transportation network, as well as travel cost, including the corrections MCTC made as part of their Amended SCS to their 2005 base year employment, housing types, and transportation network. CARB found the sources and processing of the input data and assumptions were reasonable. More detail on the individual data input and assumptions reviewed by CARB staff can be found in APPENDIX A: CARB Technical Review.
C. Modeling Tools
Similar to other California MPOs, MCTC utilized a land use scenario planning tool, a regional travel demand model, and CARB’s EMFAC model to quantify base and future year VMT and GHG regional passenger vehicle emissions with their SCS. Specifically, MCTC used the UPlan land use tool to develop the base and future year land use scenarios, allocating regional growth according to the desired criteria and priorities of each scenario (e.g., residential density, transit service). MCTC then input the zonal land use and demographic data to the regional travel model to quantify VMT for each planning scenario. In the last step of the GHG emissions quantification process, MCTC input the VMT estimates from the travel model in to the EMFAC 2014 emissions model to estimate GHG emissions of its 2014 Amended SCS. CARB found MCTC’s GHG emissions modeling process to be consistent with common practice. CARB staff also reviewed the sensitivity, or responsiveness of MCTC’s regional travel model to changes in key SCS strategy variables, including: auto operating cost, household income distribution, and transit frequency. For all sensitivity tests, MCTC provided CARB the model outputs of VMT and mode share and CARB staff assessed the modeled change of direction and magnitude based on the empirical literature. Overall, CARB found MCTC’s regional travel model was not reasonably sensitive to changes in land use and transit service for SCS quantification purposes. Results from two of the three tests were inconsistent with the literature in both direction and magnitude, which was the primary reason CARB staff’s evaluation used an alternative approach. More detailed discussion on the modeling tools, MCTC’s application of the tools, associated sensitivity testing scenarios and results, and CARB staff’s

19
recommendations for model improvement can be found in APPENDIX A: CARB Technical Review. D. Off-Model Calculations
MCTC incorporated potential GHG emissions reductions from off-model strategies as part of their SCS. Three strategies were included based on the 2015 Climate Action Plan of the City of Madera, and two strategies focused on the rest of the County. CARB staff reviewed MCTC’s calculations for these strategies and identified errors (e.g., double counting benefits, inaccurate references to the literature), as well as a lack of information to support claimed reductions (e.g., funding support). Overall, CARB found the resulting per capita GHG emissions reductions from off-model strategies to be less than MCTC’s claimed values. More detail on the off-model calculations reviewed by CARB staff can be found in APPENDIX A: CARB Technical Review.
E. SCS Performance Indicators
Given that CARB staff could not make a clear determination of the reasonableness of MCTC’s travel modeling results as a means for estimating GHG emission reductions from MCTC’s SCS, CARB staff relied more heavily on its review of evidence expressed in changes to land use and transportation policy assumptions from MCTC’s status quo scenario to its preferred scenario to make a determination that its SCS would meet the Board adopted targets.
CARB staff’s evaluation identified changes in important land use and transportation-related indicators that describe SCS performance. These indicators are examined to determine if they can provide qualitative evidence that the SCS, if implemented, could meet its GHG targets. The evaluation looked at directional consistency of the indicators with MCTC’s modeled GHG emissions reductions, as well as the general relationships between those indicators and GHG emissions reductions based on the empirical literature as discussed in the CARB-funded policy briefs and corresponding technical background documents.20
The SCS performance indicators evaluated include residential density, mix of housing types, and investment by mode. These indicators are based on information provided by MCTC in Appendix B: MCTC Data Table and Appendix E: Residential Density Supplemental Data. CARB staff’s evaluation relies on key empirical studies for each indicator that illustrate qualitatively how changes in these indicators can increase or decrease VMT and/or GHG emissions.
20 These policy briefs and technical background documents, which seek to identify the impacts of key transportation and land use policies on vehicle use and GHG emissions, based on the scientific literature, can be found at http://arb.ca.gov/cc/sb375/policies/policies.htm
20
1. Land Use Indicators
To determine the benefits of changes in future development pattern in the SCS on GHG emissions to passenger vehicles, the evaluation focused on two performance indicators related to land use: changes in residential density, and mix of housing types.
Change in Residential Density
Residential density is a measure of the average number of dwelling units per acre of developed land. When residential density increases, it is expected to change travel behavior including reductions in average trip length, and eventually a decrease in regional VMT, which is supported by relevant empirical literature. Brownstone and Golob (2009) analyzed National Household Travel Survey (NHTS) data and observed the denser housing development significantly reduces annual VMT and fuel consumption, which directly results in the reduction in GHG emissions. Boarnet and Handy (2014) reported that doubling residential density reduces VMT an average of 5 to 12 percent.
Based on the reported Amended SCS land use allocation travel model parameters, residential density of new development in the MCTC region will increase from 2.9 to 3.521 dwelling units per acre, which is a 20 percent increase in residential density region-wide (Figure 4). Based on findings from relevant empirical literature, this proposed increase in residential density in the MCTC region is expected to reduce region VMT, specifically, from the new development areas identified in the Amended SCS.
21 The MCTC’s Amended SCS states 3.3 dwelling units/acre for new growth, which need to be updated to reflect MCTC staff’s latest estimate of 3.5 dwelling units/acre.

21
Figure 4. Residential Density of New Development (2010-2040)
Source: MCTC SCS Data Table, Appendix B
Table 1 summarizes the proposed increase in residential density for new development from 2010 to 2040 by sub-area in the MCTC region. Overall, City of Madera will experience the highest change in residential density for new development, and countywide residential density will increase by 20 percent from 2010 to 2040.
Table 1. Change in Residential Density by Sub-area (2010-2040)
Sub-area Without SCS With SCS % Change in Density
City of Madera 6.2 10.0 61%
City of Chowchilla 3.9 4.7 20%
Southeast Madera County New Growth Area 5.2 8.0 54%
Remaining Madera County Unincorporated Area 0.8 0.8 2%
Source: MCTC SCS Data Table, Appendix B
Mix of Housing Types
Housing type mix influences the land use patterns that can be achieved in a region. The greater the proportion of housing growth that is small-lot and attached housing types, the more opportunity a region has to accommodate future growth through a more compact land use pattern. As the housing market shifts towards smaller lot sizes or lots with higher residential densities, the travel characteristics in the MCTC region are expected to change.
2.9 3.5
0.0
0.5
1.0
1.5
2.0
2.5
3.0
3.5
4.0
Without SCS With SCS
Cou
ntyw
ide
Res
iden
tial D
ensi
ty
(Gro
wth
Onl
y, d
wel
ling
units
/acr
e)

22
The Amended SCS categorizes five types of residential development (in terms of density of units per acre): very low,22 low,23 medium,24 medium – high25 and high26
density. Compared to without SCS, the Amended SCS shows a significant increase in housing units share in medium high and high density lot size categories countywide (Figure 5).
Figure 5. Shift towards Smaller Lot Sizes in New Developments (2010-2040)
Source: MCTC SCS Data Table, Appendix B
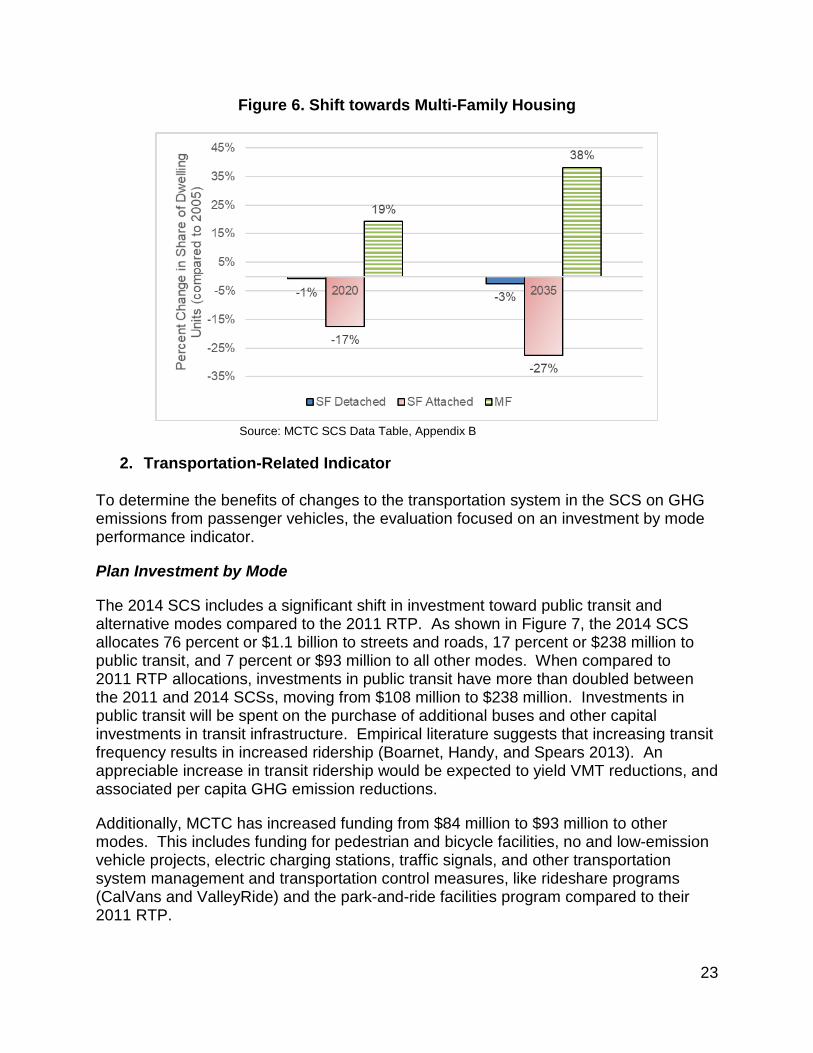
The Amended SCS also indicates a shift towards a greater percentage of multi-family housing units. Figure 6 shows the percentage of the change in share of housing by housing type from 2005. By 2035, the share of multi-family housing units will increase by 38 percent from 2005, whereas single-family share of total housing will decrease consistently from 2005 to 2035.
22 Lot size of 20 acres. 23 Lot size of 1 acre. 24 Lot size of 0.11 acres. 25 Lot size of 0.06 acres. 26 Lot size of 0.04 acres.
0.5%
11.0%
75.6%
10.9%
2.0%0.5%
10.2%
64.6%
17.5%
7.1%
0%
10%
20%
30%
40%
50%
60%
70%
80%
Very Low Low Medium Medium High High
Perc
ent H
ouse
hold
of T
otal
(Gro
wth
O
nly)
Lot Sizes by Density
Without SCS
With SCS
23
Figure 6. Shift towards Multi-Family Housing
Source: MCTC SCS Data Table, Appendix B
2. Transportation-Related Indicator
To determine the benefits of changes to the transportation system in the SCS on GHG emissions from passenger vehicles, the evaluation focused on an investment by mode performance indicator.
Plan Investment by Mode
The 2014 SCS includes a significant shift in investment toward public transit and alternative modes compared to the 2011 RTP. As shown in Figure 7, the 2014 SCS allocates 76 percent or $1.1 billion to streets and roads, 17 percent or $238 million to public transit, and 7 percent or $93 million to all other modes. When compared to 2011 RTP allocations, investments in public transit have more than doubled between the 2011 and 2014 SCSs, moving from $108 million to $238 million. Investments in public transit will be spent on the purchase of additional buses and other capital investments in transit infrastructure. Empirical literature suggests that increasing transit frequency results in increased ridership (Boarnet, Handy, and Spears 2013). An appreciable increase in transit ridership would be expected to yield VMT reductions, and associated per capita GHG emission reductions.
Additionally, MCTC has increased funding from $84 million to $93 million to other modes. This includes funding for pedestrian and bicycle facilities, no and low-emission vehicle projects, electric charging stations, traffic signals, and other transportation system management and transportation control measures, like rideshare programs (CalVans and ValleyRide) and the park-and-ride facilities program compared to their 2011 RTP.

24
Figure 7. Percent Change in Transportation Investment by Mode
Source: Residential Density Supplemental Data, Appendix E

25
V. CONCLUSION
A. Findings
MCTC’s travel model structure is similar to that of the other San Joaquin Valley MPOs, and the model inputs and assumptions were consistent with those used to forecast VMT for the other SCSs in the San Joaquin Valley. However, as discussed in previous sections of this staff report, MCTC’s travel model did not perform as expected, and some model parameters were not sensitive to changes in response to MCTC’s key SCS strategies. The travel model results indicated an inexplicably large reduction in per capita GHG emissions, despite the model’s reported lack of directional sensitivity to MCTC’s described strategy. CARB staff could not make a clear determination on the reasonableness of MCTC’s travel modeling as a means for estimating GHG emission reductions from MCTC’s SCS.
MPOs make incremental improvements to their travel models over time, and CARB staff acknowledges that there are shortcomings of travel models. CARB staff has provided recommendations in the following section on how MCTC can improve its travel modeling capabilities in the future.
Given the uncertainties with the modeling, CARB staff could not rely purely on MCTC’s travel modeling results to make a determination that its SCS would meet the Board adopted per capita GHG emissions reduction targets of five percent reduction in 2020 and 10 percent reduction in 2035 compared with 2005 levels. Thus, CARB staff examined an alternative approach, for purposes of this evaluation only, using the weight of evidence expressed in the performance indicators section of this staff evaluation, combined with published literature on VMT and GHG reductions from specific strategies.
Specifically, MCTC’s SCS, if implemented, would involve increasing residential density by 20 percent across the region. By 2035, MCTC projects that the share of multi-family housing units would increase by 38 percent compared with 2005. In addition, MCTC cited several major projects that have recently been entitled or are currently undergoing permit processing in the region (see complete list in APPENDIX D: MCTC Supplement on Changes in Transportation Funding Allocations, Assumed Higher Density Housing Shifts, & Infill Development, December 2017). These examples of land use development projects collectively comprise over 10,000 units proposed at densities well-above the existing average residential density of 2.9 dwelling units per acre. Thus, there is evidence in the record that the current trend of development in the MCTC region supports the claim that increased multi-family, attached, and/or small lot units could be implemented over the planning horizon. Empirical literature suggests that increasing residential density reduces VMT (Boarnet and Handy 2014). Thus, VMT reductions and associated per capita GHG emissions reductions would be expected from MCTC’s land use strategy.
MCTC’s other key strategy is dedicating significantly more funding (i.e., more than double) to public transit than in previous RTPs. MCTC’s financially constrained project

26
list reflects purchase of additional buses and other capital investments in transit infrastructure that support claimed increases in transit frequency. Empirical literature suggests that increasing transit frequency results in increased ridership (Boarnet, Handy, and Spears 2013). An appreciable increase in transit ridership would be expected to yield VMT reductions, and associated per capita GHG emission reductions.
MCTC is also increasing its plan’s share of funding to non-motorized transportation improvement projects, including pedestrian and bicycle facilities, no and low-emission vehicle projects, electric charging stations, traffic signals, and other transportation system management and transportation control measures, like rideshare programs (CalVans and ValleyRide) and the park-and-ride facilities program. Several local jurisdictions in the region have also adopted general plan policies that support implementation of the increased density and multi-modal SCS strategies.
Based on CARB staff’s independent assessment, MCTC’s SCS, if implemented, combined with actions by local jurisdictions within Madera County described in further detail in APPENDIX A: CARB Technical Review of this report under “Off-Model Strategies” would yield a minimum per capita GHG emission reduction of 5 percent in 2020 and 10 percent in 2035 compared with 2005 levels.
B. Recommendations
Improvements are realized with each iteration of a region’s SCS. CARB staff have included a summary of the following recommendations for MCTC to improve on in their second round SCS development.
Modeling
• Use the latest available independent data sources such as the National Household Travel Survey (NHTS), Census Transportation Planning Package (CTPP), traffic counts, and the American Community Survey (ACS) to validate the travel model.
• Improve overall model sensitivity to land use and transit accessibility in modeling auto ownership and trip generation rates by incorporating variables (e.g., lot size, land-use mix, accessibility to transit and activities).
• Examine modeling variables and formulation and relate income to level of travel. • Ensure exclusion of group quarter population in calculation of per capita CO2
emissions upon common understanding that group quarter population has limited travel and activities.
• CARB staff found that for a complete assessment for the next SCS, MCTC needs to provide: 1) VMT and mode share associate with all the base case scenarios (given base case can be different for different test strategy); 2) justification of the irresponsiveness of the model to select land use and/or transportation-related variables.
• Provide goodness-of-fit statistics, the frequency distribution of trip lengths, and coincident ratios for different trip types in future model documentation.

27
• Include costs such as tire and maintenance costs in estimating auto operating cost in the future travel model update.
• Document the development process and application of the vehicle ownership component of the travel model in the next model update.
• Document the unbalanced trip production and trip attraction and the adjusted or balanced trip production and trip attraction in the model documentation in the next model update.
• Refine inputs, assumptions, and methodology of off-model strategy quantification in consultation with CARB staff.
• Develop a transit network in the future travel model update to better represent and forecast transit activities in the region.
• Adjust the transit travel time to 1.9 factor of auto travel time in the next model update (assuming MCTC will continue to represent transit service as zonal attribute), which was found during model development of the MCTC travel model.
• Consider including more details on the model estimation process, estimated parameters, and statistical significance of the estimates in the model documentation for all model components.
• Consider developing a destination choice model or other method, which can improve the sensitivity of changes to land use and socioeconomic factors on trip distribution by better reflecting the attributes that influence a person’s decision to travel.
• Consider developing a mode choice model that can model transit trips based on socioeconomic data. MCTC should also consider auto occupancy rates by trip purpose in the mode choice step, and use the latest household travel survey data. In addition, model choice model should include speed and frequency, days, and hours of operation of service as model inputs.
SCS Strategy Tracking and Reporting
• For development of MCTC’s second SCS, CARB staff recommends continuing to build on the supplemental information provided (Appendix D: MCTC Supplement on Changes in Transportation Funding Allocations, Assumed Higher Density Housing Shifts, & Infill Development, December 2017) by continuing to track and report on: 1) the types and timing of local and regional planning and development activity and its relationship to implementation of the region’s SCS strategies; and 2) the types and timing of local and regional transportation project investments and their relationship to implementation of the region’s SCS strategies.
• Strategies quantified off-model for SB 375 target purposes, should include available region-specific data on program or project performance to date, planned or adopted local investment commitments, as well as information on how strategies go above and beyond State measures or investments, to substantiate assumptions for estimating emissions reductions.

28
VI. REFERENCES
Boarnet, Marlon G., and Susan Handy. (30 September 2014). “Policy Brief on the Impacts of Residential Density on Passenger Vehicle Use and Greenhouse Gas Emissions.” https://www.arb.ca.gov/cc/sb375/policies/density/residential_density_brief.pdf
Boarnet, Marlon G., Susan Handy, and Steve Spears. (8 October 2013). “Policy Brief on the Impacts of Transit Service Strategies on Passenger Vehicle Use and Greenhouse Gas Emissions.” https://www.arb.ca.gov/cc/sb375/policies/transitservice/transit_brief.pdf
Brownstone, David and Thomas Golob. 2009. The Impact of Residential Density on Vehicle Usage and Energy Consumption. Journal of Urban Economics 65: 91-98.
California Air Resources Board. Senate Bill 375 Policy Briefs on Impacts of Transportation and Land Use-Related Policies. https://arb.ca.gov/cc/sb375/policies/policies.htm
California Natural Resources Agency. (2015). Bond Accountability – Project: Implementing a Sustainable Energy Roadmap for the San Joaquin Valley. http://bondaccountability.resources.ca.gov/Project.aspx?ProjectPK=12608&PropositionPK=4
California State Department of Housing and Community Development. (2014). Madera County RHNA Plan 2014-2023. http://www.maderactc.org/wp-content/uploads/2014/08/Madera-County_5th-RHNA-Plan1.pdf
Caltrans. (2016). Fiscal year 2015-2016 Sustainable Transportation Planning Grant Awards. http://www.dot.ca.gov/hq/tpp/documents/AwardList.pdf
Caltrans. (2008).State Route 99 Corridor System Management Plan San Joaquin County Area. http://www.dot.ca.gov/d10/tcr-csmp/sr99/FinalSJ-99CSMP103108.pdf
Calvans. (2017). Calvans August Newsletter. http://www.calvans.org/sites/default/files/downloadable-pdfs/events/Low%20Res_August%202017_Newsletter.pdf
Calvans. FY 16-17 Vanpool Ridership by County of Origination. Provided by CalVans staff via email correspondence on November 27, 2017.
City of Madera. (2009). City of Madera General Plan. https://www.cityofmadera.ca.gov/wp-content/uploads/2016/05/COM-General-Plan.pdf

29
City of Madera. (2015). 2016-2024 Housing Element Update. https://www.cityofmadera.ca.gov/wp-content/uploads/2015/11/MadHE_Adopted_12-02-15_Highlighted.pdf
City of Madera. (2015). City of Madera Climate Action Plan. https://www.cityofmadera.ca.gov/wp-content/uploads/2017/08/Final-Madera-CAP_September-2015.pdf
County of Madera. (1995). Madera County General Plan: Background Report. http://www.madera-county.com/index.php/county-forms/category/46-general-plan-document-materials
County of Madera. (2015). Madera County 2014-2024 Housing Element Update. http://www.madera-county.com/index.php/county-forms/category/46-general-plan-document-materials
Employment Development Department. (2018). Major Employers in Madera County. http://www.labormarketinfo.edd.ca.gov/majorer/countymajorer.asp?CountyCode=000039
Kittelson & Associates (2014) Madera County Travel Demand Model Report.
Madera County Farm Bureau. Welcome to Madera County. Accessed January 19, 2018. Retrieved from: https://www.maderafb.com/about/county-ag-stats/
Madera County Transportation Commission. (2004). Madera County 2004 Regional Bicycle Transportation Plan. http://www.maderactc.org/wp-content/uploads/2015/07/2004BikePlanFinal.pdf
Madera County Transportation Commission. (2008). San Joaquin Valley Blueprint: Madera County Blueprint Report. http://www.ca-ilg.org/sites/main/files/file-attachments/madera_county_bp_document_0.pdf
Madera County Transportation Commission. (2014). Final 2014 Regional Transportation Plan and Sustainable Communities Strategy. http://www.maderactc.org/wp-content/uploads/2014/07/MCTC-2014-Final-RTP-SCS.pdf
Madera County Transportation Commission. (2016). 2017 Measure “T” Strategic Plan. http://www.maderactc.org/wp-content/uploads/2016/07/Strategic-Plan-20171.pdf
Madera County Transportation Commission. (2017). 2014 Regional Transportation Plan and Sustainable Communities Strategy (RTP & SCS) Amendment #1. http://www.maderactc.org/wp-content/uploads/2017/08/RTPSCS-Amend-1-Final.pdf
Madera County Transportation Commission. (2017). Final Short Range Transit Development Plan FY 2017/18 – 2021/22. http://www.maderactc.org/wp-content/uploads/2017/03/FINAL-SRTDP-MARCH-2017.pdf

30
Martin, William A. and Nancy A. McGuckin. “NCHRP Report 365: Travel Estimation Techniques for Urban Planning.” Washington D.C.: Transportation Research Board, 1998.
North Fork Rancheria of Mono Indians of California. (2018). Our People – History. Accessed January 19, 2018. Retrieved from: http://northforkrancheria-nsn.gov/our-people/history
The Official Website of the Chukchansi Indians. (2013). Culture (History & Language. Accessed January 19, 2018. Retrieved from: http://chukchansitribe.net/culture-history-language/
The Planning Center. (2012). San Joaquin Valley: Demographic Forecasts 2010 to 2050. http://www.valleyblueprint.org/files/San%20Joaquin%20Valley%20Demographic%20Forecasts%20-%20Final%2027%20Mar%202012_0.pdf
Transportation Research Board. Highway Capacity Manual. Washington D.C.: 2010.National Research Council.
United States Census Bureau, 2006-2010 American Community Survey 5-Year Estimates.
United States Census Bureau, 2011-2015 American Community Survey 5-Year Estimates.

31
APPENDIX A: CARB Technical Review
CARB’s technical review of MCTC’s tools and GHG emissions quantification for base year and SB 375 analysis years focused on the model inputs and assumptions, application of modeling tools, and modeling results. CARB staff also reviewed the reported data and information associated with MCTC’s off-model strategies, and the results of model sensitivity tests of auto operating cost, household income distribution and transit frequency. MCTC used a regional travel demand model to quantify amount of travel in the region, which was consistent with the structure and operation as other Valley MPOs’ travel models. However, CARB staff found some of the results of model sensitivity tests demonstrate an inconsistent directional and magnitude change in modeled VMT and mode share with respect to change in household income distribution and transit frequency. Due to this reason, as mentioned in the main report, CARB staff developed an alternative approach in the evaluation of MCTC’s Amended SCS. Following are details of CARB’s findings of each aspect of the technical review of MCTC’s quantification. I. Data Inputs and Assumptions
MCTC’s key travel model inputs and assumptions were evaluated to confirm that model inputs represent current and reliable data, and were used appropriately. Specifically, a subset of the most relevant model inputs were reviewed, including: 1) regional socioeconomic characteristics, 2) the region’s transportation network inputs and assumptions, and 3) cost assumptions. In evaluating these three input types, CARB staff reviewed the assumptions MCTC used to forecast growth and VMT, and compared model inputs with underlying data sources. This involved using publicly available, authoritative sources of information, such as national and statewide survey data on socioeconomic and travel factors, as well as region-specific forecasting documentation.
A. Land Use Assumptions and Growth Forecast
Demographic data and forecasts describe a number of key characteristics used in travel models. The regional growth forecast describes how many people will live in the region, how many jobs the region will have, and the anticipated number of households.
Similar to the other Valley MPOs, demographic forecasts for population, employment, and households were prepared by The Planning Center. The Planning Center’s March 2012 report, “San Joaquin Valley: Demographic Forecasts 2010 to 2050,” cites data sources including the U.S. Census Bureau, the California Department of Finance (DOF), and the California Employment Development Department (EDD). MCTC used the Planning Center forecast as the Countywide control values and then disaggregated the information to the local level with input from local agencies. MCTC’s growth forecast is summarized in Table 2. The population of the MCTC region is forecast to grow from about 151,000 in 2010 to 243,000 in 2035. Number of households in the MCTC region grows almost 28,000 between 2020 and 2035. Additionally, employment grows at a similar rate by about 28,000 between 2010 and 2035.

32
Table 2: Demographic Forecast (2010-2035)
Population Households Employment
2010 150,865 43,304 43,547
2020 183,176 54,470 57,740
2035 242,530 71,200 71,557
2040 265,161 76,746 76,746
Source: MCTC SCS Data Table, Appendix B
1. Housing Units and Households
Housing units were estimated based on the general plans of the cities and the County. Local jurisdictions provided potential housing growth by TAZ. MCTC then corroborated potential housing growth by TAZ with expected growth totals. The number of households is projected to increase by almost 28,000 between 2010 and 2035, yielding an annual growth rate in households of about 2 percent Average household sizes are projected to remain relatively constant at 3.4 from 2010-2040.
2. Consistency with the Regional Housing Needs Assessment
SB 375 requires the coordination of housing planning with regional transportation planning through the SCS. In 2014, the State of California, through the Department of Housing and Community Development (HCD), issued an eight-year Regional Housing Needs Determination to MCTC. HCD calculates the amount of housing needed within four income distribution categories based on demographic projection information from DOF. HCD then works with MCTC to discuss and develop a final assessment. The Amended SCS includes enough residential housing capacity by jurisdiction to meet the housing need within the region as determined by HCD.
3. Employment
Employment projections in the SCS were developed as part of the socioeconomic profile in the MCTC travel model. Employment in Madera County is forecast to increase by about 28,000 jobs between 2010 and 2035, yielding an annual employment growth rate of about 2 percent.
4. Land Use Assumptions
There are three local jurisdictions in the MCTC region (two cities and the County) that adopt unique comprehensive land use plans commonly known as general plans. Current land use was simulated through GIS, but future land use was not mapped.
33
Future land use assumptions used by MCTC were provided by the local jurisdictions through the housing growth by TAZ mentioned above.
Madera County, and the cities of Chowchilla and Madera have adopted general plan land use, housing, and transportation goals, objectives, and policies consistent with and intended to implement the Amended SCS. Through these plans local jurisdictions encourage increased densities and self-contained communities designed to reduce vehicle trip and encourage a multi-modal transportation system. Specific projects that have recently been entitled or are currently undergoing permit processing in the region and support increased densities and self-contained communities were provided by MCTC (see complete list in APPENDIX D: MCTC Supplement on Changes in Transportation Funding Allocations, Assumed Higher Density Housing Shifts, & Infill Development, December 2017).

34
B. Transportation Network Inputs and Assumptions
The transportation network is a map-based representation of the transportation system serving the MCTC region. MCTC’s transportation network mainly consists of the roadway network, while transit service is represented in zonal attributes (i.e., peak and off-peak average transit frequency). The travel model includes roadway network and transit network for the travel model base year of 2010 and for future years (i.e. 2020, 2035). CARB staff reviewed the MCTC regional roadway network, and network assumptions such as link capacity and free-flow speeds. The methodologies MCTC used to develop the transportation network and travel model input assumptions is consistent with guidelines provided in the National Cooperative Highway Research Program (NCHRP) Report 365. However, CARB staff recommends MCTC develop a transit network in the next travel model update to better represent and forecast transit activities in the region.
1. Roadway Network
MCTC’s roadway network is a representation of the automobile roadway system, which includes freeways, highways, expressways, arterials, collectors, and freeway ramps in the region. Roadways in the travel model were also grouped by adjacent development (i.e., urban, suburban, rural) and terrain type (i.e., flat, rolling, mountain). The roadway network provides the basis for estimating zone-to-zone travel times and costs (in terms of travel distance and travel time) for the trip distribution and mode choice steps of the modeling process, and for trip routing in vehicle assignments.
Table 3 summarizes the reported roadway lane miles in the MCTC region in 2010 by facility type. These facility type classifications are consistent with the Federal Function Highway Classification system. Link attributes (e.g., route/street name, distance, capacity, speed) are coded for each roadway segment, which are consistent with common practice.
Table 3: Lane Miles in 2010 by Facility Type
Facility Type Lane miles in 2010
Freeway 133 Highway 179
Expressway 62 Arterial 787
Collector 324 Freeway Ramp 2.39
Source: MCTC SCS Data Table, Appendix B
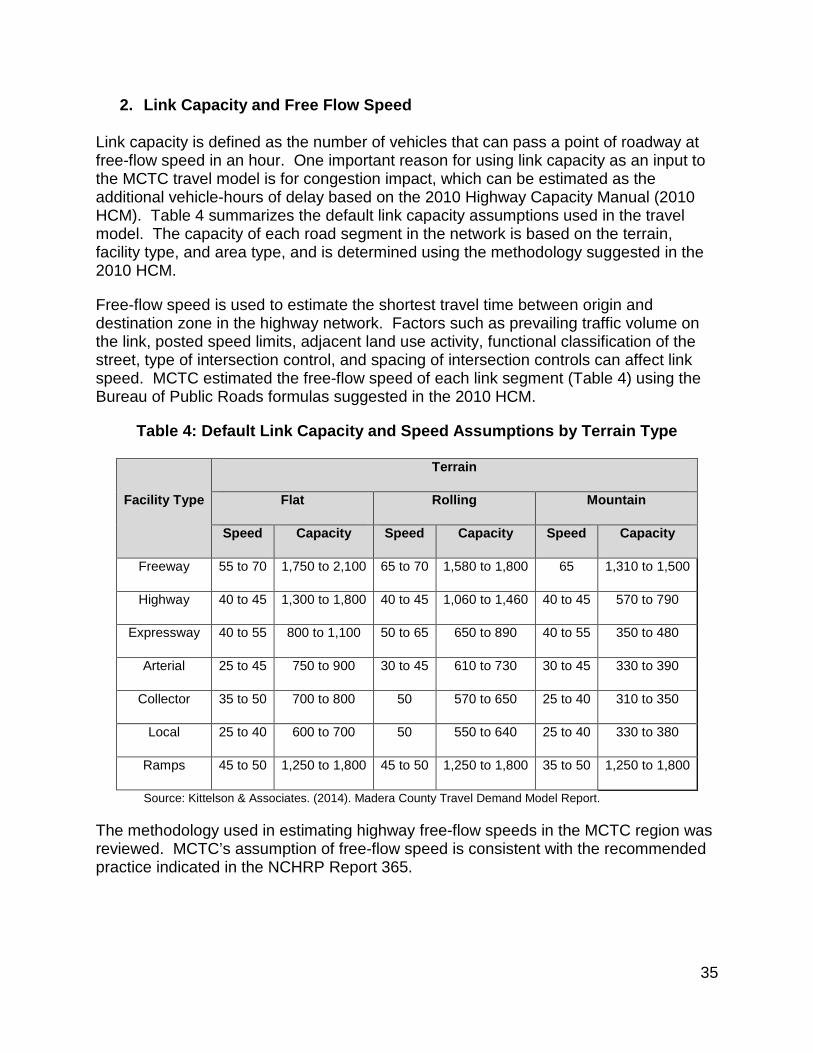
35
2. Link Capacity and Free Flow Speed
Link capacity is defined as the number of vehicles that can pass a point of roadway at free-flow speed in an hour. One important reason for using link capacity as an input to the MCTC travel model is for congestion impact, which can be estimated as the additional vehicle-hours of delay based on the 2010 Highway Capacity Manual (2010 HCM). Table 4 summarizes the default link capacity assumptions used in the travel model. The capacity of each road segment in the network is based on the terrain, facility type, and area type, and is determined using the methodology suggested in the 2010 HCM.
Free-flow speed is used to estimate the shortest travel time between origin and destination zone in the highway network. Factors such as prevailing traffic volume on the link, posted speed limits, adjacent land use activity, functional classification of the street, type of intersection control, and spacing of intersection controls can affect link speed. MCTC estimated the free-flow speed of each link segment (Table 4) using the Bureau of Public Roads formulas suggested in the 2010 HCM.
Table 4: Default Link Capacity and Speed Assumptions by Terrain Type
Facility Type
Terrain
Flat Rolling Mountain
Speed Capacity Speed Capacity Speed Capacity
Freeway 55 to 70 1,750 to 2,100 65 to 70 1,580 to 1,800 65 1,310 to 1,500
Highway 40 to 45 1,300 to 1,800 40 to 45 1,060 to 1,460 40 to 45 570 to 790
Expressway 40 to 55 800 to 1,100 50 to 65 650 to 890 40 to 55 350 to 480
Arterial 25 to 45 750 to 900 30 to 45 610 to 730 30 to 45 330 to 390
Collector 35 to 50 700 to 800 50 570 to 650 25 to 40 310 to 350
Local 25 to 40 600 to 700 50 550 to 640 25 to 40 330 to 380
Ramps 45 to 50 1,250 to 1,800 45 to 50 1,250 to 1,800 35 to 50 1,250 to 1,800
Source: Kittelson & Associates. (2014). Madera County Travel Demand Model Report.
The methodology used in estimating highway free-flow speeds in the MCTC region was reviewed. MCTC’s assumption of free-flow speed is consistent with the recommended practice indicated in the NCHRP Report 365.

36
3. Transit Service
MCTC’s travel model does not contain a transit network to represent existing and forecasted transit service in the region. This contribute to the lack of responsiveness of the travel model to transit strategy and transit frequency changes (see more details in section III of this Appendix). However, the transit service availability is reflected as a zonal attribute as peak and off-peak transit frequency for each TAZ in the roadway network. Bus travel times were assumed to be 200 percent of the auto travel times, which is generally consistent with the bus service operating schedule. Average wait times for bus service were assumed to be 50 percent of the maximum of the transit frequency at the origin and destination of each trip.
For future travel model improvement, MCTC should consider developing a GIS-based transit network that include geocoded transit lines, stops, headway, and fare information to better estimate transit travel time and reflect transit strategy.
C. Cost Inputs and Assumptions
Travel cost is one of the major factors determining the mode of transportation for any given trip. CARB staff reviewed basic travel cost components, such as auto operating cost and value of time, that were used as inputs in the MCTC’s travel model. To examine the responsiveness of the travel model to changes in the cost variable or other model inputs, model sensitivity tests performed by MCTC, such as auto operating cost and transit frequency were evaluated. The results of the sensitivity tests are presented in section III of this Appendix.
1. Auto Operating Cost
Auto operating cost is a key parameter used in the mode choice step of the MCTC travel model. Similar to other Valley MPOs, MCTC defined auto operating costs as the cost of fuel alone. The price of fuel is the amount consumers pay at the pump for regular grade gasoline (in dollars/gallon). When gasoline prices go up, drivers are expected to decrease their frequency of driving, reduce their travel distance, increase their use of public transit, and/or switch to more fuel efficient cars. Lower gas prices would be expected to have the opposite effect on VMT.
MCTC followed a similar method as other Valley MPOs to estimate auto operating cost as documented in the 2009 Regional Transportation Plan Analysis performed by the Metropolitan Transportation Commission (MTC) to forecast fuel price in the region. The fuel price in 2020 and in 2035 was forecasted using the historical trend from 1998 to 2008 in the MCTC region. The corresponding auto operating costs were then derived by dividing the fuel price of the year by the fuel efficiency assumptions. Table 5 summarizes the reported year 2010 and future years’ auto operating cost in the MCTC region.

37
Table 5: Auto Operating Cost (cents/mile, in 2000 Dollars)
2010 2020 2035
Auto Operating Cost 18.0 17.8 18.9 Source: MCTC SCS Data Table, Appendix B
Although fuel cost is the major component of travel cost for auto mode, other costs such as the cost of vehicle maintenance and tire replacement are considered in some California MPO regional travel demand models. CARB staff recommends MCTC include these costs such as tire and maintenance costs in estimating auto operating cost in its future travel model update.
2. Cost of Time
A value-of-time assumption is used, in the trip distribution step, to estimate the travel cost of alternative routes. MCTC staff converted travel cost to cost-of-time using a value of time. The average perceived value of time that MCTC used is similar to that used by other MPOs in the Valley (Table 6).
Table 6. Cost of Time Assumptions
Household (HH) by Auto Ownership
Value of Time (dollar/hour)
0 Auto HHs 6
1 Auto HHs 12
2+ Auto HHs 18 Source: Kittelson & Associates. (2014). Madera County Travel Demand Model Report.

38
II. Modeling Tools
MCTC used the UPlan land use allocation tool, MCTC travel model, the CARB vehicle emission model (EMFAC 2014) to quantify the GHG emissions for the Amended SCS. The analysis years for the GHG emissions were 2005, 2020, and 2035. Figure 8 shows the flow chart of the modeling process. MCTC collected demographic data (e.g., population, housing units) and future socioeconomic demands from local jurisdictions, and used UPlan to prepare data at TAZ level as inputs for the travel model to estimate the amount of travel in the MCTC region. Results from the travel model, such as VMT by time of day and vehicle hours of travel (VHT), were input to EMFAC2014 to estimate GHG emissions associated with the Amended SCS.
Figure 8: MCTC's Modeling Tools
Source: CARB
A. Land Use Planning Tool
MCTC used the UPlan, a land use allocation tool to prepare population, household, employment, and land use datasets for each planning scenario for base and future years. MCTC estimated the control totals of number of households, population and employment for future analysis years, and used UPlan to allocate growth and demographics into geographic areas within the region according specific requirements of each planning scenario. The outputs from UPlan were then used as zonal inputs to the travel model to estimate the amount of travel in the MCTC region.
B. Travel Demand Model
In 2010, the eight MPOs in the Valley began a collaborative process to improve their TDM capabilities. This process, known as the San Joaquin Valley Model Improvement Plan (MIP), was funded by the Strategic Growth Council (SGC) and was completed in 2012. The MIP effort substantially upgraded and standardized travel demand models of the Valley MPOs and improved their ability to evaluate land use and transportation strategies central to meeting SB 375 requirements.
Additionally, MCTC had a consultant, Kittelson & Associates and Fehr & Peers, complete the validation for various components of the MIP model for Madera County. The resulting model is known as the MCTC travel model. The Amended SCS is the first SCS to be developed by MCTC using the new model. Similar to most regional travel demand models, the MCTC travel model is a four-step model that includes trip
UPlan Allocate
demographics & regional growth data in planning scenarios
Travel Demand Model Estimate VMT, VHT,
delay, etc.
EMFAC2014 Estimate CO2
emissions

39
generation, trip distribution, mode choice, and trip assignment Figure 9. The travel model uses land use, socioeconomic, and roadway network data to estimate travel patterns, roadway traffic volumes and transit volumes. The travel model contains approximately 570 TAZs representing origins and destinations of travel in the model area. Travel to/from and through the model area is represented by 16 gateway zones at major road crossings of the county line in order to estimate interregional travel.
After the adoption of the 2014 RTP/SCS, MCTC staff found that the emission analysis showed a gap between the GHG emissions target and the modeled GHG emissions reduction. MCTC staff and its consultant went through a model enhancement process to correct coding errors in the modeling tool’s base year data. The following highlights general errors MCTC staff corrected:
• Distribution of agricultural jobs in 2005, • Replacement of over-distributed mobile homes with single-family detached, • Trip rates associated with largest single site employers, • Realignment of roadway network, • Creation of new TAZs, and • Review of socioeconomic data.
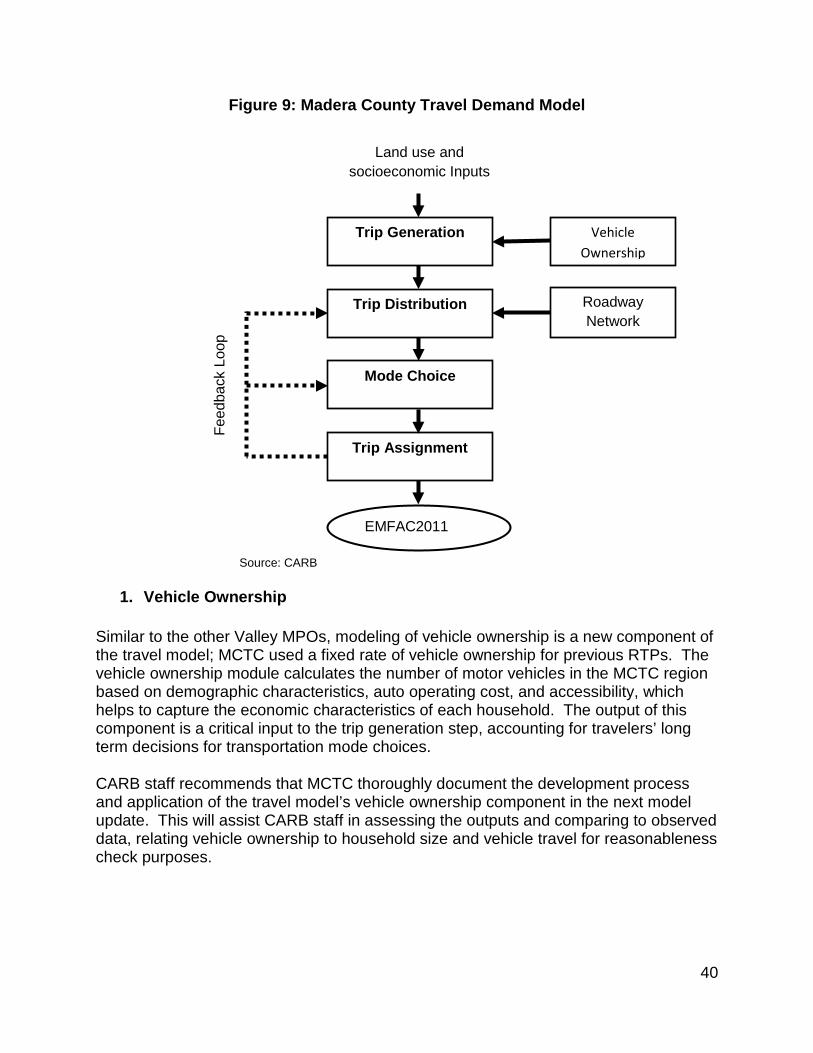
40
Figure 9: Madera County Travel Demand Model
Source: CARB
1. Vehicle Ownership
Similar to the other Valley MPOs, modeling of vehicle ownership is a new component of the travel model; MCTC used a fixed rate of vehicle ownership for previous RTPs. The vehicle ownership module calculates the number of motor vehicles in the MCTC region based on demographic characteristics, auto operating cost, and accessibility, which helps to capture the economic characteristics of each household. The output of this component is a critical input to the trip generation step, accounting for travelers’ long term decisions for transportation mode choices.
CARB staff recommends that MCTC thoroughly document the development process and application of the travel model’s vehicle ownership component in the next model update. This will assist CARB staff in assessing the outputs and comparing to observed data, relating vehicle ownership to household size and vehicle travel for reasonableness check purposes.
Land use and socioeconomic Inputs
Trip Generation
Trip Distribution
Mode Choice
Trip Assignment
Roadway Network
EMFAC2011
Vehicle Ownership
Feed
back
Loo
p

41
2. Trip Generation
Trip generation, the first module of travel demand modeling, quantifies the amount of travel in terms of person-trips at TAZ level in a model area base upon land uses within the TAZ. MCTC estimates person-trips by trip purpose using cross-classification, of residential data, employment information, and school enrollment based on the 2000/2001 California Household Travel Survey (CHTS). There are 11 trip purposes modeled in the MCTC travel model: home-based work (HBW), home-based shopping (HBShop), home-based K12 (HBK12), home-based college (HBCollege), home-based other (HBO), work-based other (WBO), other-based other (OBO), and highway commercial, small trucks, medium trucks, and heavy trucks.
Consistent with any conventional trip-based travel demand model, the MCTC model has two trip ends, trip production27 and trip attraction.28 The trip generation rates were derived based on the 2000/2001 California Household Travel Survey (CHTS), ITE Trip Generation Manual (8th edition), and the NCHRP Report 365. Table 7 summarizes the data sources and modeling variables used in the trip generation module of the MCTC travel model.
Table 7. Data Sources and Modeling Variables for Trip Generation
Trip Production
Trip Attraction
Gateway Trips
Special Generators
Home-Based Work-Other Home-Work Other IX/XI and XX Various
Data Source(s)
2000/2001 CHTS
2000/2001 CHTS
2000/2001 CHTS
NCHRP 365
2008 CSTDM
ITE Trip Generation Manual (8th edition)
Modeling Variable(s)
- Housing Type - Housing Size - Income Level
- Type of Employment
- Type of Employment
-- -- --
Source: CARB
Table 8 to Table 10 summarize the modeled trip rates by housing type, employment type and type of school facility.
27 Trip production is defined as the home end of any home-based trip, regardless of whether the trip is directed to or from home. If neither end of the trip is a home, it is defined as the origin end. 28 Trip attraction is defined as the non-home end of a home-based trip. If neither end of the trip is a home, the trip attraction is defined as the destination end.

42
Table 8. Trip Rates by Housing Type (per dwelling unit)
Housing Type Daily Person Trip Rate
Estimated Daily Vehicle Trip Rate
Single Family 8.03 5.53 Multi-Family 5.45 3.88 Mobile Home 4.28 2.98
Source: Kittelson & Associates. (2014). Madera County Travel Demand Model Report.
Table 9. Trip Rates by Employment Type (per employee)
Employment Type Daily Person Trip Rate
Estimated Daily Vehicle Trip Rate
Agriculture 2.07 1.77 Mining 2.05 1.74 Utilities 2.21 1.93 Construction 2.09 1.78 Manufacture 2.17 1.8 Wholesale 8.11 5.85 Retail 27.65 17.64 Warehouse 4.2 3.19 Information 4.36 3.07 Finance 4.37 3.12 Real Estate 4.34 3.09 Service* 4.28 to 27.58 2.99 to 17.7 Health 5.96 4.17 Entertainment 39.84 24.85 Accommodations 14.49 9.42 Food 71.37 44.62 Public 33.05 20.71 *Service includes professional, management, administration, recreation, and all other.
Source: Kittelson & Associates. (2014). Madera County Travel Demand Model Report.
Table 10. Trip Rate by School Type (per student)
School Type Daily Person
Trip Rate Estimated Daily
Vehicle Trip Rate Elementary and Middle School 1.78 0.49 High School 2.36 0.64 College 2.71 2.22
Source: Kittelson & Associates. (2014). Madera County Travel Demand Model Report.

43
CARB staff recommend MCTC to document the unbalanced trip production and trip attraction and the adjusted or balanced trip production and trip attraction in the model documentation in the next model update. CARB staff could not assess the quality and the reasonableness of the outputs from the trip generation component of the MCTC travel model because no unbalanced and adjusted production and attraction trips were presented in the current model documentation. Also, CARB staff recommends increasing the trip generation module’s sensitivity to land use by incorporating land use and accessibility variables (e.g., lot size, land-use mix, accessibility to transit and activities).
3. Trip Distribution
The trip distribution module is the second component of the MCTC travel model, which utilizes a gravity model29 to estimate how many trips travel from one zone to any other zone in the region. The inputs to the gravity model include the person-trip productions and attractions for each zone, zone-to-zone impedances (e.g., travel time, travel costs), and friction factors30 that define the effect of travel time. Zonal distributions were estimated by trip purpose.
Table 11 summarizes the travel impedance assumptions in the trip distribution module of the MCTC travel model. MCTC’s assumptions are generally consistent with other Valley MPO travel models and common practice. However, CARB staff recommends MCTC to adjust the transit travel time to 1.9 factor of auto travel time in the next model update (assuming MCTC will continue to represent transit service as zonal attribute), which was found during model development of the MCTC travel model.31
Table 11. Assumptions of Travel Time and Cost by Travel Mode
Travel Mode Zone-to-Zone Impedances Auto Travel - Shortest path by vehicle occupancy
Auto Intrazonal Travel - 100% of the travel time to the nearest adjacent TAZ
Auto Terminal - 1 minute at each trip end
Transit Travel - 1.0 factor of auto travel times - Transit frequency assigned at TAZ Level
Non-Motorized Travel - average of 10 miles/hour for biking - average 3 miles/hour for walking
Source: CARB
29 A gravity model assumes that urban places will attract travel in direct proportion to their size in terms of population and employment, and in inverse proportion to travel distance. 30 Friction factors represent the effect that travel time exerts on the propensity for making a trip to a given zone. 31 Kittelson & Associates. (2014). Madera County Travel Demand Model Report.
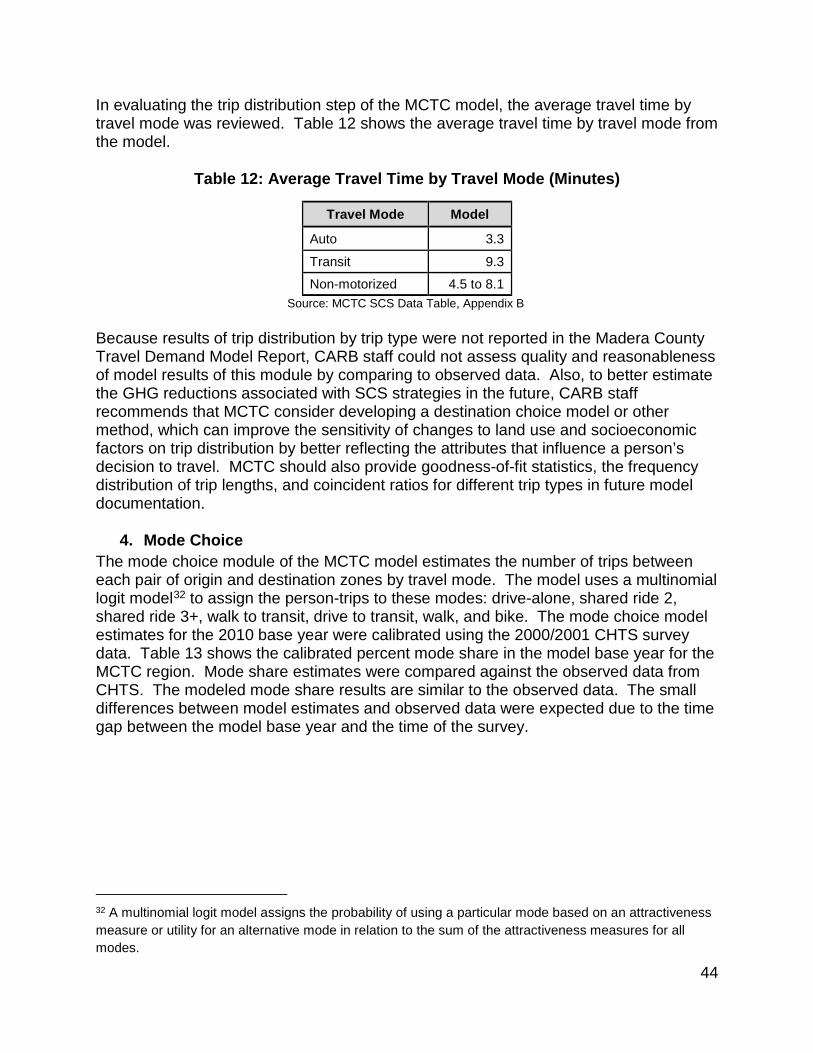
44
In evaluating the trip distribution step of the MCTC model, the average travel time by travel mode was reviewed. Table 12 shows the average travel time by travel mode from the model.
Table 12: Average Travel Time by Travel Mode (Minutes)
Travel Mode Model
Auto 3.3
Transit 9.3 Non-motorized 4.5 to 8.1
Source: MCTC SCS Data Table, Appendix B
Because results of trip distribution by trip type were not reported in the Madera County Travel Demand Model Report, CARB staff could not assess quality and reasonableness of model results of this module by comparing to observed data. Also, to better estimate the GHG reductions associated with SCS strategies in the future, CARB staff recommends that MCTC consider developing a destination choice model or other method, which can improve the sensitivity of changes to land use and socioeconomic factors on trip distribution by better reflecting the attributes that influence a person’s decision to travel. MCTC should also provide goodness-of-fit statistics, the frequency distribution of trip lengths, and coincident ratios for different trip types in future model documentation.
4. Mode Choice The mode choice module of the MCTC model estimates the number of trips between each pair of origin and destination zones by travel mode. The model uses a multinomial logit model32 to assign the person-trips to these modes: drive-alone, shared ride 2, shared ride 3+, walk to transit, drive to transit, walk, and bike. The mode choice model estimates for the 2010 base year were calibrated using the 2000/2001 CHTS survey data. Table 13 shows the calibrated percent mode share in the model base year for the MCTC region. Mode share estimates were compared against the observed data from CHTS. The modeled mode share results are similar to the observed data. The small differences between model estimates and observed data were expected due to the time gap between the model base year and the time of the survey.
32 A multinomial logit model assigns the probability of using a particular mode based on an attractiveness measure or utility for an alternative mode in relation to the sum of the attractiveness measures for all modes.

45
Table 13: Person-trips by Mode in 2010
Mode Model
Drive alone 40%
Shared ride 58% Transit 0% Non-motorized 1% Total 100%
Mode Model
Drive alone 40%
Shared ride 58% Transit 0%
Source: MCTC SCS Data Table, Appendix B
The method MCTC used to develop their mode choice module is consistent with the approaches used nationwide as cited in NCHRP Report 365. However, the current model choice component does not model transit trips, but estimates transit trips based on the 2000-2001 CHTS survey data. In future model updates, MCTC should consider developing a mode choice model that can model transit trips based on socioeconomic data. Model documentation should consider including more details on the model estimation process, estimated parameters, and statistical significance of the estimates. MCTC should also consider auto occupancy rates by trip purpose in the mode choice step, and use the latest household travel survey data. In addition, the mode choice model should include speed and frequency, days, and hours of operation of service as model inputs.
5. Trip Assignment
In the trip assignment module, vehicle trips from one zone to another are assigned to specific travel routes between the zones in the transportation network. Congested travel information serves as feedback to the beginning of the process until convergence is reached. This process utilizes a user equilibrium assignment concept to assign vehicles to roadways in the network. The iteration runs until no driver can shift to an alternative route with a faster travel time. The MCTC model is set for a maximum internal iteration of 50 iterations for each peak hour and peak period (i.e., AM Peak, PM Peak) traffic assignment, and 20 iterations for each off-peak hour and off-peak period (i.e., midday, night) traffic assignment.
In evaluating the trip assignment module, CARB staff reviewed the validation volume counts by facility type (Table 14). Table 14 summarizes statistics based on the model validation documented in 2014, which does not reflect the correction to the model MCTC made during the Amended SCS process. The results are outside the recommended range of 2010 Federal Highway Administration (FHWA) Travel Model

46
Validation and Reasonableness Checking Manual guidelines, except for the volume of arterial and ramps.

47
Table 14: Estimated and Observed Traffic Counts for MCTC Region
Facility Type Model FHWA Guidelines Freeway 16% ±7% Highway 11% ±10% Arterial -3% ±15%
Collector/Local -29% ±25% Freeway Ramps -16% ±25%
Source: Kittelson & Associates. (2014). Madera County Travel Demand Model Report. Since the updated model validation on total VMT was not available at the time of this SCS evaluation, CARB staff compared the total VMT in 2005 from the EMFAC output file to the observed VMT from HPMS (Table 15).
Table 15: Model Validation – Total VMT in 2005 for MCTC Region
Model HPMS Percent Difference
VMT 3,207,341 4,078,640 -21.4% Source: HPMS (2005). EMFAC output file submitted to CARB.
C. EMFAC Model
MCTC used EMFAC 2011 to estimate the GHG emissions associated with its 2014 RTP/SCS and EMFAC 2014 for the GHG emissions associated with the Amended SCS.33 CARB staff reviewed MCTC’s GHG emission estimation procedures and model results. CARB staff suggest MCTC to ensure to exclude group quarter population in calculation of per capita CO2 emissions upon common understanding that group quarter population has limited travel and activities.
D. Off-Model Strategies
MCTC incorporated into its 2014 Amended SCS potential GHG emissions reductions from strategies that could not be reflected in the travel demand model. These strategies include bicycle and pedestrian improvements, transit, commute trip reduction programs, vanpooling, and ridesharing. Table 16 below further breaks down these strategies by the geographic area they are located.
33 The modeled GHG emission results of the 2014 RTP/SCS are denoted as the “without project” scenario in the Data Table in Appendix B; and the GHG emission results of the Amended SCS are denoted as the “with project” scenario in the Data Table.

48
Table 16: Off-Model Strategies
Area Strategy MCTC’s Estimate of Daily VMT Reduction
in 2020
MCTC’s Estimate of Daily VMT Reduction
in 2035 Bicycle & Pedestrian
Environment Improvements
8,422 39,535
Transit Travel 19,232 52,713 Commute Trip Reduction 13,239 20,468
Vanpooling 8,358 68,007 Ridesharing 41,400 55,719
MCTC 90,652 236,442 Relative to 2005
Baseline -2.1% -8.4%
Source: 2014 MCTC RTP/SCS – Achievement of SB 375 GHG Targets
The first three strategies are modified from the City of Madera’s Climate Action Plan (CAP) by extending the project assumptions in the CAP from 2030 to 2035. Since MCTC did not provide any funding and/or policy information to support this project extension, the appropriateness of their projection method remains unknown. Instead, CARB staff assumed that projected benefits in 2030 from the plan would stay constant through 2035. This results in smaller VMT reductions and corresponding lower GHG reductions than what MCTC assumed
MCTC’s vanpooling and ridesharing strategies will be implemented by CalVans and Fresno County respectively. The greenhouse gas reductions estimated by MCTC however were overestimated for the reasons highlighted below.
• Citing data from the first years of the vanpool program’s implementation MCTC assumes an annual ridership increase of 20 percent to 2020, and then 15 percent from 2020 to 2035. Since the vanpool program is new to the region, its high increase rate in the first three years is not an appropriate rate to assume going forward. For this evaluation, CARB staff instead utilized a 5 percent annual increase in ridership based on CalVan’s projection and those utilized by other Valley MPOs. By lowering this increase rate, CARB staff estimated a lower GHG emissions reduction than MCTC’s estimate.
• The Valley Rides ridesharing program supported by Fresno County is an inter-county program to reduce VMT in the San Joaquin Valley region. As an inter-county program, it provides ridesharing options to and from Fresno and Tulare Counties. CARB staff determined that the current VMT and trip reduction estimation method used by MCTC is not suitable for inter-county program, because the method attributes all reductions from this program to Madera County. For the purpose of this analysis, CARB staff assumed only a fraction of the VMT are within the County. In the future MCTC should develop an approach that accounts only for travel only in Madera. CARB staff also discovered a
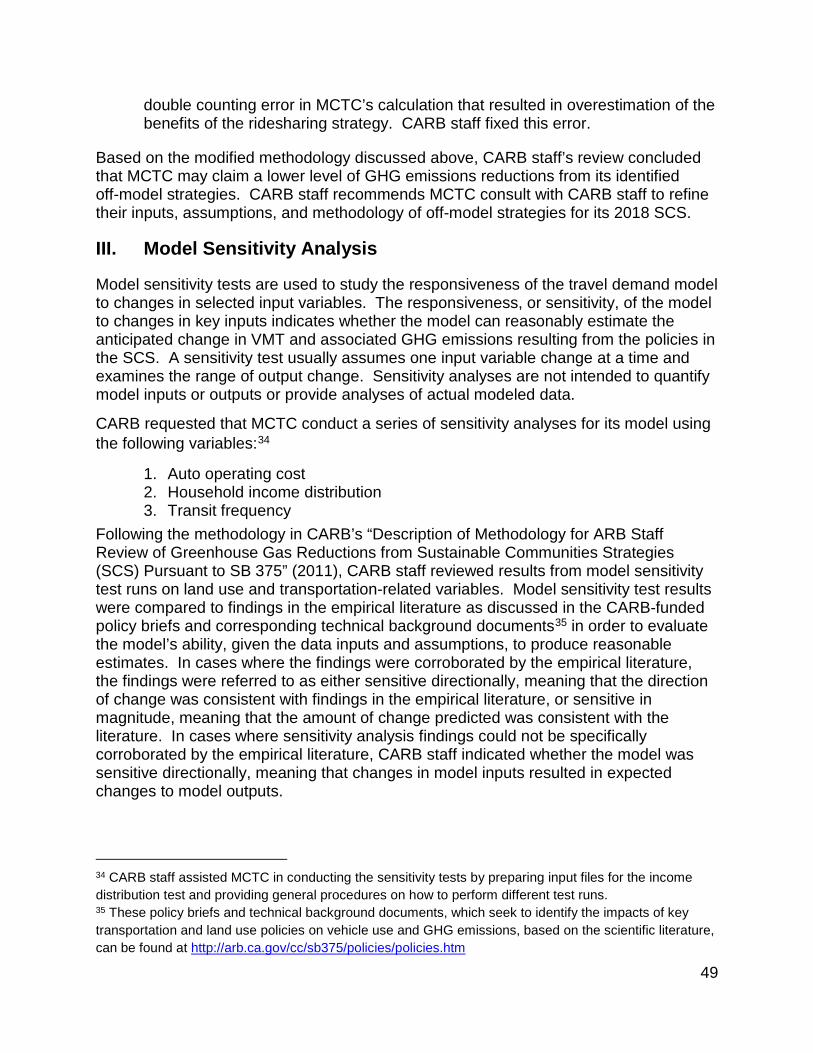
49
double counting error in MCTC’s calculation that resulted in overestimation of the benefits of the ridesharing strategy. CARB staff fixed this error.
Based on the modified methodology discussed above, CARB staff’s review concluded that MCTC may claim a lower level of GHG emissions reductions from its identified off-model strategies. CARB staff recommends MCTC consult with CARB staff to refine their inputs, assumptions, and methodology of off-model strategies for its 2018 SCS.
III. Model Sensitivity Analysis
Model sensitivity tests are used to study the responsiveness of the travel demand model to changes in selected input variables. The responsiveness, or sensitivity, of the model to changes in key inputs indicates whether the model can reasonably estimate the anticipated change in VMT and associated GHG emissions resulting from the policies in the SCS. A sensitivity test usually assumes one input variable change at a time and examines the range of output change. Sensitivity analyses are not intended to quantify model inputs or outputs or provide analyses of actual modeled data.
CARB requested that MCTC conduct a series of sensitivity analyses for its model using the following variables:34
1. Auto operating cost 2. Household income distribution 3. Transit frequency
Following the methodology in CARB’s “Description of Methodology for ARB Staff Review of Greenhouse Gas Reductions from Sustainable Communities Strategies (SCS) Pursuant to SB 375” (2011), CARB staff reviewed results from model sensitivity test runs on land use and transportation-related variables. Model sensitivity test results were compared to findings in the empirical literature as discussed in the CARB-funded policy briefs and corresponding technical background documents35 in order to evaluate the model’s ability, given the data inputs and assumptions, to produce reasonable estimates. In cases where the findings were corroborated by the empirical literature, the findings were referred to as either sensitive directionally, meaning that the direction of change was consistent with findings in the empirical literature, or sensitive in magnitude, meaning that the amount of change predicted was consistent with the literature. In cases where sensitivity analysis findings could not be specifically corroborated by the empirical literature, CARB staff indicated whether the model was sensitive directionally, meaning that changes in model inputs resulted in expected changes to model outputs.
34 CARB staff assisted MCTC in conducting the sensitivity tests by preparing input files for the income distribution test and providing general procedures on how to perform different test runs. 35 These policy briefs and technical background documents, which seek to identify the impacts of key transportation and land use policies on vehicle use and GHG emissions, based on the scientific literature, can be found at http://arb.ca.gov/cc/sb375/policies/policies.htm

50
A. Auto Operating Cost Sensitivity Test
MCTC used four scenarios to examine the responsiveness of the model to changes in auto operating cost. Auto operating cost is an important factor influencing travelers’ auto use. MCTC’s definition of auto operating cost for the region includes fuel price only. When the auto operating cost increases, travelers are expected to drive less. Conversely, when auto operating cost decreases, travelers are expected to drive more. In relation to mode share, it is expected that as auto operating cost increases, the number of drive-alone trips would shift to shared-ride, transit, bicycling, and/or walking.
Figure 10 summarizes the change in mode share with a 50 percent decrease, 25 percent decrease, base case, 25 percent increase, and 50 percent increase from base case in auto operating cost. As expected, as auto operating cost increases, the percentage of drive alone trips decreases while percentages of shared-ride trips increase. However, the mode shares of transit and non-motorized trips seem not be affected by the change of auto operating cost.
Figure 10: Change of Mode Share and Auto Operating Cost
MCTC also provided outputs of VMT associated each test scenario, however, CARB staff could not assess its reasonableness without base case (2035) VMT36 specifically to this test.
36 The base case (2035) VMT needs to be by trip type (i.e., II, IX/XI), consistent with VMT outputs from the -50%, -25%, 25% and 50% test scenarios, to be evaluated its responsiveness to the change of AOC.

51
B. Household Income Distribution
Household income distribution plays an important role in the trip generation step of the travel demand model. Household income is linked to the available number of vehicles which then impacts the total number of trips. The expectation of the income distribution sensitivity testing is that as household income increases, so will the proportion of households with a greater number of vehicles. Given the predetermined trip generation rates in the model, if a household has more vehicles, it generates more trips and more VMT. If the income distribution shifts downward, it is expected that the vehicle ownership model will predict more households with fewer available vehicles and similarly, fewer trips and less VMT.
To test the responsiveness of the model to changes in household income distribution, three testing scenarios were designed and tested using the average household income as an indicator, while controlling the total number of households at approximately the same as in the base case. The 2010 average household income of $53,607 from the model was used as the base case. CARB staff designed three testing scenarios with average household incomes of Low ($42,101), Medium ($53,567) and High ($66,117).
There is relatively little in the empirical literature that cites the direct effect of household income on household VMT. Murakami and Young (1997) report that low income households make 20 percent fewer trips than other households. Since this number counts all trips (including walking and transit), the effect on VMT is even more significant: VMT per household in low income households is about half of that in other households. Figure 11 lists the modeled VMT for each test scenario of household income distribution. The modeled VMT does not align with the general expectation of more VMT with higher income. For example, in median income of household in the low scenario produced same level of VMT as the base case (2010). Again, the VMT associates with the high income scenario produces a lower level of VMT. Due to these inconsistencies, CARB staff could not evaluate MCTC’s travel model’s responsiveness to household income distribution. CARB staff suggest MCTC staff to ensure to resolve this issue to improve model sensitivity for the next model update.

52
Figure 11: VMT Changes for Household Income Distribution Scenarios
The impact of household income on daily mode share was also examined. It is expected that as household income increases, travelers will be more likely to drive autos or use the auto mode in general. As shown in Table 16 the mode share is irresponsive to the change of household income distribution. For example, transit mode share stays at 0.2 percent in all scenarios except the high income scenario. Noticing this irresponsiveness of the model to household income distribution, CARB staff suggests MCTC to examine modeling variables and formulation relates income to level of travel.
Table 16. Household Income Distribution – Mode Share
Test Scenario DA SR Transit Non-Motorized Total High ($66,117) 40.5% 58.5% 0.1% 0.9% 100.0% Base Case ($53,607) 40.2% 58.5% 0.2% 1.2% 100.0% Medium ($53,567) 40.2% 58.4% 0.2% 1.2% 100.0% Low ($42,101) 40.2% 58.5% 0.2% 1.2% 100.0%
C. Transit Frequency
Transit service frequency is a key to the effectiveness of regional transit service. To determine the responsiveness of MCTC’s travel model to transit frequency, four alternative frequencies were tested: 1) 25 percent increase; 2) 50 percent increase; 3) 25 percent decrease; and 4) 50 percent decrease from the base case (2035). As transit service becomes more frequent, transit ridership is expected to increase, and conversely, transit ridership is expected to decline with decreasing frequency. Figure 12 shows modeling results of mode share as transit frequency changes. The test results do not show a significant difference from one test scenario to another. It is the understanding that transit mode share in the MCTC region is overall very low due to

53
limited transit coverage. To assess the impact of transit investment strategy in its 2014 RTP/SCS, MCTC sought through off-model quantification on transit strategies focusing on the City of Madera (see Section II of this Appendix).
Figure 12: Impact of Transit Frequency on Mode Share
D. Overall Assessment of Sensitivity Testing Results
CARB reviewed model share and VMT outputs of all the test strategies and scenarios associated with each strategy. CARB staff found that for a complete assessment for the next SCS, MCTC needs to provide: 1) VMT and mode share associate with all the base case scenarios (given base case can be different for different test strategies); and 2) justification of the irresponsiveness of the model to select land use and/or transportation-related variables.

54
APPENDIX B: MCTC Modeling Data Table
Modeling Parameters
2005 (if
available)
2010 (base year)
2020 2035 2040 Data Source(s) With
Project* Without Project
With Project
Without Project
With Project
Without Project
DEMOGRAPHICS Total population 140313 150865 183176 183176 242530 242530 265161 265161
Interim DOF - July 2012
Group quarters population 8930 10161 10161 12333 12333 13156 13156
Planning Center 2012
Total employment (employees) 41295 43547 57740 55188 71557 73071 76914 79886 Model Input Average unemployment rate (%) 7.9 16.6
California DOF
Total number of households 39244 43304 54470 55766 71200 73836 76746 80723 Model Input Persons per household 3.58 3.48 3.36 3.28 3.41 3.28 3.46 3.28 Pop/HH Auto ownership per household 2.13 2.15 2.13 1.96 2.12 2.09 2.12 2.07 Pop/HH Median household income 48268 LAND USE [4] Total acres within MPO 1374080 1374080 1374080 1374080 1374080 1374080 1374080 1374080 EIR Total resource area acres(CA GC Section 65080.01)
Not Available
Total farmland acres(CA GC Section 759446
2012 total, EIR

55
Modeling Parameters
2005 (if
available)
2010 (base year)
2020 2035 2040 Data Source(s) With
Project* Without Project
With Project
Without Project
With Project
Without Project
65080.01) (2010 Base Year) Developed acres (Growth Only) 12652 14503 EIR Commercial developed acres (Growth Only)
Not Available
Residential developed acres (Growth Only)
Not Available
Total housing units 39244 43303 54469 52578 71202 74477 76746 80712 Model Input
Housing vacancy rate 12.2% 11.8% 10.9% 10.9% 9.5% 9.5% 9.0% 9.0%
DOF E-5, Growth Forecast
Total single-family detached housing units 32108 35876 44178 40716 56766 59067 63952 64354 Model Input Total small-lot single family detached housing units(x,xxx sq. ft. lots and smaller)
Not Available
Total conventional-lot single family detached
Not Available

56
Modeling Parameters
2005 (if
available)
2010 (base year)
2020 2035 2040 Data Source(s) With
Project* Without Project
With Project
Without Project
With Project
Without Project
units(between x,xxx and x,xxx sq. ft. lots) Total large-lot single family detached units (x,xxx sq ft. lots and larger)
Not Available
Total single-family attached housing units 899 922 1030 1072 1183 1656 1700 1802 Model Input Total multi-family housing units 4678 4945 7741 5991 11719 8954 9621 9756 Model Input Total mobile home units & other 1559 1560 1520 4800 1534 4800 1473 4800 Model Input Total infill housing units (Growth Only)
Not Available
Total mixed use buildings Not Available
Total households within 1/4 mile of transit stations and stops 4311 4608 5295 6243
Model Output Calculated
Total households within 1/2 mile of transit 13352 14104 16847 20500
Model Output Calculated

57
Modeling Parameters
2005 (if
available)
2010 (base year)
2020 2035 2040 Data Source(s) With
Project* Without Project
With Project
Without Project
With Project
Without Project
stations and stops Total employment within 1/4 mile of transit stations and stops 12530 13381 15631 18500
Model Output Calculated
Total employment within 1/2 mile of transit stations and stops 18098 19550 23496 28421
Model Output Calculated
TRANSPORTATION SYSTEM Freeway general purpose lanes – mixed flow lane miles 125 133 133 166 205 207 212 212 Model Output Highway (lane miles) 179 179 179 242 175 237 175 175 Model Output Expressway (lane miles) 62 62 62 2.41 79 16.6 92 92 Model Output HOV (lane miles) 0 0 0 0 0 0 0 0 Model Output Arterial (lane miles) 783 787 787 827 952 956 952 951 Model Output Collector (lane miles) 324 324 324 344 430 436 432 432 Model Output Local (lane miles) 87 87 87 79 59 59 60 60 Model Output Freeway-Freeway (lane miles) 2.39 2.39 2.39 2.39 2.39 2.39 2.39 2.39 Model Output

58
Modeling Parameters
2005 (if
available)
2010 (base year)
2020 2035 2040 Data Source(s) With
Project* Without Project
With Project
Without Project
With Project
Without Project
Local, express bus, and neighborhood shuttle operation miles Not Available Bus rapid transit bus operation miles
Not Applicable
Passenger rail operation miles 26.5 26.5 26.5 26.5 26.5 26.5 26.5 26.5 Amtrak Transit total daily vehicle service hours Not Available Bicycle and pedestrian trail/lane miles Not Available Vanpool (total riders per weekday) 492 4005 8005 Calvans TRIP DATA Number of trips by trip purpose 469760 569266 668701 723056 980595 799951 1068215 Model Output
Home-based work 81206 96505 117443 119487 161408 130978 175725 Model Output
Home-based other 206877 252068 314060 319857 437234 353752 473893 Model Output
Non-home-based work 27187 34472 37569 45472 64904 50972 72017 Model Output Non-home-based other 154489 186220 199629 238239 317040 264249 347580 Model Output

59
Modeling Parameters
2005 (if
available)
2010 (base year)
2020 2035 2040 Data Source(s) With
Project* Without Project
With Project
Without Project
With Project
Without Project
MODE SHARE Vehicle Mode Share (Peak Period) Not Available SOV (% of trips) Not Available HOV (% of trips) Not Available Transit (% of trips) Not Available Non-motorized (% of trips) Not Available Vehicle Mode Share (Whole Day) 847649.00 989519.80
1138531.62
1337402.12
1445651.66
1961190.54
1548025.01
2172857.20 Model Output
SOV (% of trips) 41.50% 40.16% 40.56% 40.16% 40.68% 39.95% 40.71% 39.91% Model Output HOV (% of trips) 57.20% 58.49% 57.94% 57.22% 57.60% 57.01% 57.52% 56.97% Model Output Transit (% of trips) 0.18% 0.18% 0.18% 0.30% 0.18% 0.31% 0.18% 0.33% Model Output Non-motorized (% of trips) 1.12% 1.17% 1.32% 2.32% 1.54% 2.73% 1.60% 2.80% Model Output Average weekday trip length (miles) 8.9 8.5 8.35 7.4 6.8 6.1 6.6 6.1 Model Output SOV 10.5 10.1 9.9 8.8 8 7.4 7.8 7.4 Model Output HOV 7.3 7 6.8 5.9 5.5 4.8 5.3 4.8 Model Output Transit Not Available Walk Not Available Bike Not Available

60
Modeling Parameters
2005 (if
available)
2010 (base year)
2020 2035 2040 Data Source(s) With
Project* Without Project
With Project
Without Project
With Project
Without Project
Average weekday travel time (minutes) 5:48 5:48 5:53 5:43 5:47 5:47 5:54 6:01 Model Output SOV 3:26 3:26 3:20 3:19 3:18 3:18 3:13 3:14 Model Output HOV 3:20 3:16 3:11 3:10 3:09 3:09 3:06 3:09 Model Output Transit 9:17 9:25 9:38 9:14 9:18 9:18 9:59 9:55 Model Output Walk 8:05 8:07 8:24 8:07 8:19 8:19 8:24 8:43 Model Output Bike 4:55 4:50 4:53 4:47 4:55 4:55 4:48 5:06 Model Output TRAVEL MEASURES Total VMT per weekday for passenger vehicles (ARB vehicle classes of LDA, LDT1, LDT2 and MDV) (miles) 2626348 2631287 3043148 3093525 3723361 4221237 4531938 4558922 Model Output Total II (Internal) VMT per weekday for passenger vehicles (miles) 1077781 1131453 1442601 1466482 1974726 2238780 2102819 2115340 Model Output Total IX/XI VMTper weekday for passenger vehicles (miles) 781422 744654 758458 771014 786439 891600 1223623 1230909 Model Output Total XX VMT per weekday 767519 754127 842090 856030 970938 1100768 1205495 1212673 Model Output

61
Modeling Parameters
2005 (if
available)
2010 (base year)
2020 2035 2040 Data Source(s) With
Project* Without Project
With Project
Without Project
With Project
Without Project
for passenger vehicles (miles) Congested Peak Hour VMT on freeways (Lane Miles, V/C ratios >0.75) Not Available Congested Peak VMT on all other roadways (Lane Miles, V/C ratios >0.75) Not Available CO2 EMISSIONS Total CO2 emissions per weekday for passenger vehicles (ARB vehicle classes LDA, LDT1, LDT2, and MDV) (tons) 1193 1364 1585 1579 2014
EMFAC11/14 Output
Total II (Internal) CO2 emissions per weekday for passenger vehicles (tons) 663 858 906 1085 1252

62
Modeling Parameters
2005 (if
available)
2010 (base year)
2020 2035 2040 Data Source(s) With
Project* Without Project
With Project
Without Project
With Project
Without Project
Total IX / XI trip CO2 emissions per weekday for passenger vehicles (tons) 499 474 607 461 735 Total XX trip CO2 emissions per weekday for passenger vehicles (tons) 31 32 72 33 27 INVESTMENTS Total RTP Expenditure (Year XXXX $) 359855007 359855007 619642082 619642082 492335534 492335534 2014 RTP Highway capacity expansion (S)
200143000 200143000 332617168 332617168 207950518 207950518 2014 RTP
Other road capacity expansion ($)
Not Available
Roadway maintenance ($)
17488216 17488216 100695046 100695046 174768786 174768786 2014 RTP
BRT projects ($) Not Available Transit capacity expansion ($)
15845249 15845249 29065097 29065097 11381635 11381635 2014 RTP
Transit operations ($) 111483354 111483354 135954989 135954989 62029625 62029625 2014 RTP

63
Modeling Parameters
2005 (if
available)
2010 (base year)
2020 2035 2040 Data Source(s) With
Project* Without Project
With Project
Without Project
With Project
Without Project
Bike and pedestrian projects ($)
14895188 14895188 21309782 21309782 36204970 36204970 2014 RTP
TRANSPORTATION USER COSTS Vehicle operating costs (Year XXXX $ per mile) 11.37 18.00 17.78 17.78 18.85 18.85 19.20 19.20 Model Input Gasoline price (Year XXXX $ per gallon) 2.24 3.65 4.46 4.46 6.06 6.06 Model Input Average transit fare (Year XXXX $) Varies Parking cost (Year XXXX $) Not Available
Source: MCTC Data Table, December 2017
*The “Without Project” equates to the Preferred Scenario before model improvements and the “With Project” equates to the Preferred Scenario after model improvements; i.e., the Amended SCS. CARB did not compare the “With Project” to a traditional baseline scenario as Madera CTC did not conduct baseline scenario model runs using the same modeling inputs as the Preferred Scenario associated with the Amended SCS. In addition, the baseline scenario included lower densities and did not use transit facilities to attract growth, indicating it would perform worse than the “Without Project” and “With Project” shown in the table above.

64
APPENDIX C: MCTC Description of Amendment Modeling Changes and Off-Model Strategies, January 2017

1
January 26, 2017
Lezlie Kimura Szeto California Air Resources Board 1001 “I” Street Sacramento, CA 95814
RE: 2014 Madera County Regional Transportation Plan/Sustainable Communities Strategy – Achievement of SB 375 GHG Targets
Dear Ms. Szeto,
The Madera County Transportation Commission (MCTC) has been working diligently to finalize the 2014 Madera County Regional Transportation Plan/Sustainable Communities Strategy (RTP/SCS) and has identified methods to meet the greenhouse gas (GHG) emission reduction targets consistent with the Sustainable Communities and Climate Protection Act of 2008 (SB 375). This letter provides a comprehensive update regarding the status of work relating to MCTC’s 2014 RTP/SCS and includes a summary of both model updates and off-model analysis, which taken together constitute achievement of the goals of the RTP/SCS. MCTC is confident that we now have a plan, which fully complies with SB 375 to reduce GHG emissions through coordinated transportation and land use planning with the goal of more sustainable communities.
Overview of RTP/SCS History and Process
Development of the 2014 Madera County RTP/SCS was a collective effort, which required meaningful collaboration with each of the three local governments (cities of Chowchilla and Madera and Madera County), State and federal agencies, local tribal governments, community interest groups, and public stakeholders to identify land-use and transportation opportunities within the region that will address the needs of the growing population and ensure compliance with State and federal requirements. As a result of this effort, MCTC developed varying planning scenarios built-up from a status quo planning assumption. Each scenario introduced new planning principles and parameters meant to address the intent of SB 375 and reduce GHG generated in Madera County. At all levels of outreach, the most aggressive planning scenario developed was received amiably and recommended to be forwarded in the process. This aggressive planning scenario would be selected as the preferred planning scenario of the 2014 RTP/SCS. The preferred scenario calls for a variety of shifts in planning parameters including, but not limited to, a demographic shift in housing share, changes to lot sizes, shift in employment share, enhancements to public transit systems, and enhancement of the non-motorized transportation network. These principles are most heavily emphasized in Madera County’s established or planned urban cores and less emphasized in rural areas, which lack adequate population densities.
65

2
The parameters of the preferred RTP/SCS Scenario were utilized in the then newly developed Madera County Transportation Model. Unfortunately, the technical results of the modeling effort yielded GHG reduction results opposite of their anticipated outcome. The 2014 Madera County RTP/SCS was adopted with emission results that did not meet the GHG budgets established by the California Air Resources Board (ARB).
2014 Madera County RTP/SCS GHG Targets
In 2011, the CARB issued a 5% reduction target to each of the eight (8) Metropolitan Planning Organizations (MPOs) in the San Joaquin Valley including MCTC. CARB agreed that the targets would be applicable to each MPO independently of other Valley MPOs. The targets included a percentage reduction of per capita greenhouse gas emissions from 2005 of 5 percent by the year 2020 and a reduction in GHG emissions of 10 percent by the year 2035. Developing the SCS requires meaningful collaboration with each of the local agencies, as well as stakeholders to identify land use and transportation planning opportunities around the region that will address the needs of the growing population and ensure compliance with State and federal requirements.
2014 Madera County RTP/SCS GHG Reductions - Comparison to Year 2005 GHG Emissions
Table 6-5 in the 2014 RTP/SCS provides the results of the SCS Scenario GHG reductions from the 2005 Base Year for year 2020 from the 2005 Base Year of 5 percent by 2020 and 10 percent by the year 2035. Results show that the 2014 RTP and SCS will NOT meet the established emission reduction targets. As a result, it was appropriate for MCTC to review the transportation VMT reductions in its effort to meet the targets.
Analysis Tools Applied
Following the adoption of the 2014 RTP/SCS, MCTC staff immediately began analyzing what led to the greenhouse gas (GHG) emission results achieved in the development of the RTP/SCS. Given the wide gap between emissions results and emissions targets, despite pursuing the most feasibly aggressive SCS strategy proposed, MCTC staff began to analyze the planning tools utilized in the RTP/SCS emissions reporting process, in particular, the newly developed Madera County Transportation Model.
This analysis concluded the tools used by MCTC for the RTP/SCS to account for GHG emissions could be enhanced to greatly improve accuracy in the reporting of emission results, particularly the newly developed forecasting model. An extensive effort was undertaken to review the input data used in the transportation model. The bulk of the MCTC staff review focused on how land use and socioeconomic data (SED) was allocated in the model’s base year and SB 375 comparison year (2010 and 2005 respectively), the significant roadway network utilized in the model, and the boundaries of traffic analysis zones (TAZs) used to distinguish individual geographic areas in Madera County.
Socioeconomic Detail
The socioeconomic detail input file for the transportation model contains housing type and employment type data for TAZs covering the entirety of Madera County. Review of SED inputs utilized in the transportation model revealed a distribution of population and employment in Madera County capable of refinement to be more consistent with the true, on ground reality for 2005 and 2010 model years.
66

3
Housing
Review of SED inputs relating to housing indicated inaccuracies with the types of housing distributed throughout the County. Of particular note was the over population of mobile home dwelling types. Mobile home dwelling types were distributed throughout TAZs in the County despite evidence concluding that no such dwellings existed in the analysis years reviewed. Figure 1 displays a TAZ in the City of Chowchilla. Input data assigned 33 mobile home dwellings to this TAZ for the 2005 analysis year. Satellite imagery of this geographic area captured between July 30, 2004 and December 30, 2005 indicate no mobile homes existed between these time ranges. Similar instances of this dwelling type distribution occur in all jurisdictions and unincorporated communities throughout the County and varying degrees accounting for an estimated 2,500 over counting of mobile home type dwelling units.
MCTC staff examined all TAZs with mobile home dwelling types assigned and made corrections where data existed to warrant them. This exercise revealed some instances of mobile home dwelling types being over-distributed while detached single family units were under-distributed in TAZs. Mobile units displaced in this exercise were replaced with single family detached; single family attached or multifamily attached dwelling units indicative of the actual on-ground land use existing in these TAZs in the examined analysis year.
FIGURE 1 City of Chowchilla TAZs
Employment
Review of SED inputs relating to employment indicated inaccurate employment levels and distribution at several locations. Most significant was the employment distribution of Agriculture jobs in 2005. Historical data indicates agriculture jobs, though varied in season, are static in quantity. This means
67

4
throughout the planning window utilized for the 2014 RTP/SCS process, numbers of agricultural jobs should not fluctuate significantly. It was determined over 7,000 agriculture jobs were not counted in 2005. This input was edited to reflect a more realistic count of agriculture jobs in Madera County.
MCTC staff examined Madera County’s largest single site employers. Changes were made to the manner employment was calculated for the prison complex in central Madera County. The employees were recognized to generate trip patterns more like ‘warehouse’ employment types as opposed to ‘government’ employment types. The land use was therefore reclassified to more accurately capture travel behavior as it exists in the context of a prison facility.
Outliers
MCTC staff was able to identify two TAZs during the overall review process containing SED data significantly inconsistent with reality on the ground. Both of these TAZs were consistent with each other in the level of error contained within. Both TAZs were located in unincorporated areas of Madera County not within the immediate vicinity of any Madera County population centers, in areas zoned for agricultural uses, where the primary makeup of jobs and housing would be agricultural employment with a very small quantity of single family detached residential housing (See Figure 2). Both TAZs had significantly higher than expected quantities of housing and employment, as well as a large variety of different employment and housing types inconsistent with what actually existed within them.
68

5
FIGURE 2 County TAZs
Significant Roadway Network The traffic model does not analyze traffic on every roadway in the County, rather it accounts for travel on the most significant roadways. The roadway network is a line and point map of the significant streets, roads, and highways in Madera County. The lines and points contain specific data related to what facet of the roadway network they depict (facility type, number of lanes, speed limit, signalization at an intersection, etc.). Upon examination of the significant roadway network, MCTC staff realigned roadway segments in several areas to make the network more closely align the real world geometries currently existing or to add new segments where warranted. Planned capital improvement projects were checked to ensure the future year significant roadway network was consistent with planned roadway improvements.
69

6
Traffic Analysis Zones
TAZs are spatial geographic areas designated to encompass a specific area in the traffic model. The size of a TAZ can range from a single densely packed city block, to a broad area encompassing an unincorporated rural community. Boundaries for TAZs primarily are created from the significant roadway network, and/or geopolitical borders and/or physical environmental features. Each TAZ has a centroid; extending from each TAZ centroid are centroid connectors responsible for distributing traffic onto the significant roadway network. MCTC staff reviewed the boundaries of the TAZs used for the model. Several new TAZs were created during this process.
A standard practice for TAZs in a traffic model is that they should not be intersected by any roadways from the significant roadway network the model uses nor should they be intersected by geographic features such as rivers. Several TAZs were bisected and realigned to adhere to this practice (See Figure 3).
MCTC staff created a new TAZ in rural eastern Madera County to capture traffic behavior related to the Chukchansi Tribe casino and hotel, Chukchansi Gold Resort and Casino. The casino and hotel were previously within a TAZ also containing a rural housing development, though neither entity shared any local roads; both are accessed off of a state highway at different locations. The new TAZ encompasses only the casino and hotel facility; one of Madera County’s largest employers (See Figure 4).
FIGURE 3 Realigned TAZs
70

7
FIGURE 4 Chukchansi Casino TAZs
Transportation Model Review
Upon conclusion of SED data review and correction by MCTC staff, a SED data land use input file was reviewed by traffic modeling consultants against the latest Census, California Employment Development Department (CA EDD), Longitudinal Employer-Household Dynamics (LEHD), and American Community Survey (ACS) data at the County and city (Madera and Chowchilla) levels where available. The latest updates to the land use data accurately reflect the demographic, household, and employment data from the different sources.
Inaccuracies related to under-developed housing and employment totals in 2005 were deemed problematic given that 2005 is the year 2020 and 2035 must be measured against for GHG reductions as stipulated by SB 375. Measured reductions of future GHG emissions as the result of the planning parameters of the selected preferred Madera County 2014 RTP/SCS scenario were not able to be accurately accounted for when juxtaposed against a 2005 model year less developed than what actually did exist in 2005. Improvement to the 2005 comparison year is paramount to accurately convey GHG emission reductions as a result of the 2014 RTP/SCS planning effort for Madera County.
In addition to checking the new inputs, consultants found a few technical errors in the previous model runs. The model gateways (interregional trips) were updated to reflect the revised 2005 and 2010 scenario. The time of day (diurnal) factors were adjusted to add up to 100%. Some traffic counts were excluded from the validation because they were below the threshold for reasonableness for the model to estimate (500 for the daily scenario and 50 for the peak hour), and updated the calculation compared
71

8
to the model for only roadways that had both counts and model volumes. With these improvements to the model, the MCTC model validates better across the wide range of validation metrics that it is required to meet per the California RTP Guidelines. A great amount of effort has gone into making sure MCTC possesses the most adequate and accurate planning tools possible for utilization in the RTP/SCS development process. The results of this effort have proven beneficial. All changes made to the model have been scrutinized to make sure that nothing implemented is inconsistent with the established and adopted measures prescribed in the preferred SCS scenario. 2016 Transportation Model Enhancement Results Based upon the set of transportation model enhancements and revisions discussed above, GHG reductions for the year 2020 and 2035 have been met (reference Table 1).
TABLE 1
2016 Madera County Transportation Model 2020 and 2035 Target Results
2005 CO2 emissions/capita 17.0
Target 5 % per capita from 2005 0.85
2020 Target 16.16
2020 CO2 emissions/capita 14.9
2020 CO2 reduction needed (#/capita) -1.27
2020 VMT reduction needed (4 vehicle types) -265816
Target 10% per capita from 2005 1.70
2035 Target 15.31
2035 CO2 emissions/capita 13.0
2035 CO2 reduction (#/capita) -2.29
2035 VMT reduction needed (4 vehicle types) -654544
change in CO2 per capita from 05 to 20 -12.5%
change in CO2 per capita from 05 to 35 -23.5%
72

9
Off-Model Transportation Strategies MCTC believes it has improved the technical capability of the transportation model to convey meaningful emission results based on adopted planning principles of the preferred 2014 RTP/SCS scenario; however new or previously unutilized tools also exist and are being implemented by MCTC staff for the RTP/SCS development process. As a result of legislation such as The Global Warming Solutions Act of 2006 and SB 375, great emphasis has been placed on establishing a variety of means to meet broad GHG emission reduction goals. As they pertain to transportation, not all of these measures are able to be accounted for in the Madera County Transportation Model. These strategies, as they relate to the RTP/SCS development process, are referred to as Off-Model strategies. MCTC believes it is very important to account for transportation investments capable of reducing GHG emissions that are not able to be accounted for in the Madera County Transportation Model. Off-Model VMT Reductions - Strategies in the City of Madera 2015 CAP The City of Madera Climate Action Plan (CAP), dated August 2015, was adopted by the City Council in September, 2015. It estimates GHG reductions from dozens of strategies and measures, including several transportation measures, four of which reduce vehicle miles traveled (VMT). As discussed below, three of these strategies represent VMT reductions that are not captured by the MCTC model because they represent local incentives for use of alternatives to driving. The CAP projects to the year 2030. MCTC staff further projected the CAP results out to the year 2035. The CAP first forecasts a “business as usual” (BAU) scenario for GHG emissions in two horizon years, 2020 and 2030. Section 2.2.1 of the City of Madera CAP describes the 2020 and 2030 Emissions Forecast Methodology: The GHG emissions forecast provides a “business-as-usual estimate,” or scenario, of how emissions will change in the years 2020 and 2030 if consumption trends and efficiency continue as they did in 2007, absent any new regulations or actions that would reduce emissions. The year 2020 was selected for the forecast in order to maintain consistency with the AB 32 target year. The year 2030 was selected to maintain consistency with the City of Madera General Plan horizon year and to support California’s larger effort to reduce statewide emissions under Executive Orders S-3-05 and B-30-15. The forecast is based on projected growth trends in population, jobs, and VMT. The forecast relies on population and job projections provided by the City and VMT projections provided by Fehr & Peers using the MCTC travel model. The forecast is based on the assumption that the number of drivers, electricity and natural gas consumption, solid waste tonnage, water usage, and wastewater generation will increase over time in proportion to the growth in population, jobs, and VMT. As a business-as-usual projection, the forecast does not take into account legislation or regulations implemented after 2007, which are accounted for in the adjusted forecast (Section 2.2.3 of the CAP provides more details). As noted, among other GHG reductions strategies, the CAP describes four transportation mode shift strategies to reduce per capita VMT, and identifies associated VMT reductions in the City by 2020 (CAP App. C, p. C-4). All of these reductions represent reductions in VMT for trips that begin or end in the City of Madera from a baseline estimate from MCTC 2020 and 2035 model runs. The next section describes the transportation reduction strategies and the associated VMT reduction factors applied in the 2020 and 2035 analysis.
73
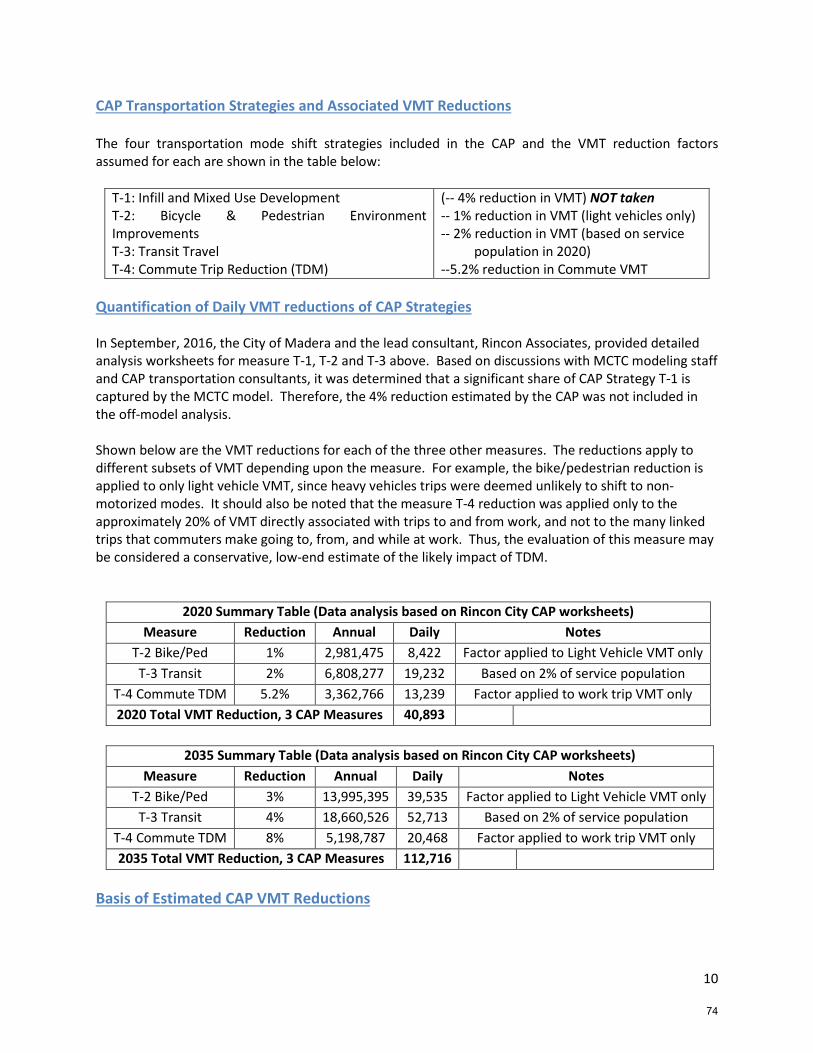
10
CAP Transportation Strategies and Associated VMT Reductions The four transportation mode shift strategies included in the CAP and the VMT reduction factors assumed for each are shown in the table below:
T-1: Infill and Mixed Use Development T-2: Bicycle & Pedestrian Environment Improvements T-3: Transit Travel T-4: Commute Trip Reduction (TDM)
(-- 4% reduction in VMT) NOT taken -- 1% reduction in VMT (light vehicles only) -- 2% reduction in VMT (based on service population in 2020) --5.2% reduction in Commute VMT
Quantification of Daily VMT reductions of CAP Strategies In September, 2016, the City of Madera and the lead consultant, Rincon Associates, provided detailed analysis worksheets for measure T-1, T-2 and T-3 above. Based on discussions with MCTC modeling staff and CAP transportation consultants, it was determined that a significant share of CAP Strategy T-1 is captured by the MCTC model. Therefore, the 4% reduction estimated by the CAP was not included in the off-model analysis. Shown below are the VMT reductions for each of the three other measures. The reductions apply to different subsets of VMT depending upon the measure. For example, the bike/pedestrian reduction is applied to only light vehicle VMT, since heavy vehicles trips were deemed unlikely to shift to non-motorized modes. It should also be noted that the measure T-4 reduction was applied only to the approximately 20% of VMT directly associated with trips to and from work, and not to the many linked trips that commuters make going to, from, and while at work. Thus, the evaluation of this measure may be considered a conservative, low-end estimate of the likely impact of TDM.
2020 Summary Table (Data analysis based on Rincon City CAP worksheets) Measure Reduction Annual Daily Notes
T-2 Bike/Ped 1% 2,981,475 8,422 Factor applied to Light Vehicle VMT only T-3 Transit 2% 6,808,277 19,232 Based on 2% of service population
T-4 Commute TDM 5.2% 3,362,766 13,239 Factor applied to work trip VMT only 2020 Total VMT Reduction, 3 CAP Measures 40,893
2035 Summary Table (Data analysis based on Rincon City CAP worksheets)
Measure Reduction Annual Daily Notes T-2 Bike/Ped 3% 13,995,395 39,535 Factor applied to Light Vehicle VMT only T-3 Transit 4% 18,660,526 52,713 Based on 2% of service population
T-4 Commute TDM 8% 5,198,787 20,468 Factor applied to work trip VMT only 2035 Total VMT Reduction, 3 CAP Measures 112,716
Basis of Estimated CAP VMT Reductions
74

11
Chapter 5 of the CAP contains numerous references. Key sources used in the VMT reduction estimates include: California Air Pollution Control Officers Association (CAPCOA). (August 2010). Quantifying
Greenhouse Gas Mitigation Measures. Available at: www.capcoa.org/wp.../CAPCOA-Quantification-Report-9-14-Final.pdf
Federal Highway Administration FHWA. (2011). Transportation and Global Climate Change: A Review and Analysis of the Literature. Strategies to Reduce Greenhouse Gas Emissions from Transportation Sources. Available at: http://www.fhwa.dot.gov/environment/glob_c5.pdf
Fehr & Peers. (June 2014). City of Madera CAP – Vehicle Miles of Travel (VMT) Inventory Memorandum.
For more detail on the City of Madera transportation measures and their efficacy in reducing VMT, see the excerpt from the City of Madera’s CAP Technical Appendix C (Excerpt appended to this letter). VMT Reductions from Transportation Strategies Outside the City of Madera
Projected off-model transportation strategies to be implemented in Madera County outside of the City of Madera were identified for the period 2014 to 2020. Based on the “2010 CAPCOA Quantifying Greenhouse Gas Mitigation Measures (August 2010),” and projected trip reduction actions identified in Madera County, several key measures were identified that will result in VMT reductions. They include:
Bicycle and Pedestrian
Transit Travel
Commute Trip Reduction/TDM
Vanpooling
Ridesharing
VMT reductions from Bicycle and Pedestrian, Transit Travel, and Commute Trip Reduction/TDM measures based on the City of Madera’s CAP have been discussed above; Vanpooling VMT reductions were derived using localized CalVans historical data and projections for the remainder of Madera County. The 2010 CAPCOA study methodology was used to calculate projected ridesharing VMT reductions.
Vanpooling
Vanpooling is projected to experience robust growth through cooperative efforts between Madera County governmental agencies, employers and the CalVans Program. CalVans is sponsored by the California Vanpool Authority, a joint cooperative comprised of twelve California counties, and includes nearly 400 vanpools tailored to commuters/farm workers. Increased use of vouchers or subsidized trips is highly promoted by CalVans and is anticipated to incentivize County riders.
75

12
A reduction of 8,358 daily VMT from vanpooling is projected by 2020 based on recent historical growth trends. This projection assumes a total of 45 vans carrying 492 passengers per day. A reduction of 68,007 daily VMT from vanpooling is projected by 2035 based on recent historical growth trends. This projection assumes a total of 364 vans carrying 4005 passengers per day. Vanpools operate six days per week traveling approximately 20 miles per round trip. Net VMT reduction calculations for vanpooling considered single-occupancy vehicle trips that would be made without vanpooling and vanpool-generated VMT including the number of miles participants drive to their vanpool pickup point. Eighty percent of CalVans participants are picked up directly at their homes while 20 percent drive less than three miles to a pick-up point.
The 2010 CAPCOA study cites a VMT reduction range of 2% to 20% from vanpooling (“TRT-11 Provide Employer-Sponsored Vanpool/Shuttle”). For comparative purposes, the CAPCOA study methodology for vanpooling results in a daily VMT reduction of 12,883 to 64,416 at a 2% and 10% employer participation rate, respectively. The projected 8,358 daily VMT reduction attributable to vanpooling in Madera County in the year 2020 is conservative and well below the 2% to 20% CAPCOA range of effectiveness. Implementation of successful voucher programs under consideration in Madera County would be expected to result in even higher VMT reductions. Ridesharing Ridesharing is projected to grow through coordinated efforts with Valleyrides, a program sponsored by the Fresno Council of Governments. The 2010 CAPCOA study cites a ridesharing range of effectiveness of 1% to 15% commute VMT reduction and like reductions in GHG emissions (“TRT-3 Provide Ride-Sharing Programs”). A 5% reduction in VMT is projected in Madera County utilizing the CAPCOA ridesharing methodology. This results in a total ridesharing VMT reduction of 41,129 and 55,719 in the years 2020 and 2035 respectively. Total Transportation-Related VMT Reduction As shown on Table 2, a total daily VMT reduction of 90,562 and 236,442 from transportation-related measures is projected in 2020 and 2035 respectively.
76

13
TABLE 2 Off-Model Transportation Strategies
VMT Reductions
Measure
2020 Projected VMT Reduction (Daily)
2035 Projected VMT Reduction (Daily)
Source
City of Madera Bicycle & Pedestrian
8,422
39,535
City of Madera 2015 Climate Action Plan (CAP)
City of Madera Transit Travel
19,232
52,713
City of Madera 2015 Climate Action Plan (CAP)
City of Madera Commute Trip Reduction/TDM
13,239
20,468
City of Madera 2015 Climate Action Plan (CAP)
Rest of Madera County Vanpooling
8,358
68,007
2010 CAPCOA Quantifying Greenhouse Gas Mitigation Measures (August 2010)
Rest of Madera County Ridesharing
41,400
55,719
2010 CAPCOA Quantifying Greenhouse Gas Mitigation Measures (August 2010)
TOTAL 90,652 VMT 236,442 VMT
Summary Expanded Amtrak service, installation of additional electric vehicle charging stations, traffic improvements, and the implementation of transit rider incentives with vouchers are expected to result in further decreases in single-occupancy vehicle usage and GHG and VMT reductions. MCTC continues to explore all available methods to depict the GHG reduction benefits of these new projects and measures for inclusion in future regional plans of significance. Proposed transit improvements, including bus stop shelters, benches, and amenities; and installation of park-and-ride lots also will provide synergistic or complementary effects to transit service expansions. The CAPCOA study indicates there is no readily available method to quantify VMT reductions for these types of measures; and they therefore are not reflected. It is worth noting that there are also numerous programs in the Madera region that will serve to reduce per capita GHG emissions without affecting VMT. These include City of Madera CAP strategies to improve traffic flow (reducing idling emissions) and to increase use of low-carbon fuels. As noted, there are also numerous projects incentivizing the use of emission-free electric vehicles, e.g. through provision of public charging stations. Referencing Table 2, with model and off-model VMT reductions, the 2014 RTP/SCS meets the GHG emission reduction target for Year 2020. The 2035 target was met using transportation model reductions as discussed above. Following transportation model reductions estimates, 88,889 VMT
77

14
needed to meet the Year 2020 target. Off-model transportation strategy VMT reductions referenced in Table 2 total 90,380 VMT, or approximately 1,491 VMT more than needed to meet the Year 2020 target. Applying the off-model transportation strategy VMT reductions to the GHG emissions reductions results table shows Madera County is able to meet the reductions targets in compliance with SB 375 (reference Table 3). Appended to this letter is a complete GHG Emissions Reductions Table displaying demographic data, CO2 and VMT data, and the CO2 emissions output results (reference Appendix III).
TABLE 3 2016 Madera County Transportation Model
2020 and 2035 Target Results with Off Model Reductions
2005 CO2 emissions/capita 17.0
Target 5 % per capita from 2005 0.85
2020 Target 16.16
2020 CO2 emissions/capita 14.5
2020 CO2 reduction needed (#/capita) -1.63
2020 VMT reduction needed (4 vehicle types) -340605
Target 10% per capita from 2005 1.70
2035 Target 15.31
2035 CO2 emissions/capita 11.6
2035 CO2 reduction (#/capita) -3.72
2035 VMT reduction needed (4 vehicle types) -1063563
change in CO2 per capita from 05 to 20 -14.6%
change in CO2 per capita from 05 to 35 -31.9%
78
15
Next Steps Now that both the Year 2020 and 2035 targets have been achieved, the next step will be for MCTC to amend the 2014 RTP/SCS. It is anticipated that the amendment process will be complete within the next 4 months. The update will also include appropriate changes to the associated Program Environmental Impact Report for the RTP/SCS. MCTC looks forward to your review of this document and is ready to discuss its contents and answer any questions that you and your staff may have. Sincerely, Patricia Taylor, Executive Director Madera County Transportation Commission
79

16
APPENDIX I Appendix C, City of Madera CAP (Excerpt) Technical Assumptions for Transportation Measures This appendix outlines the assumptions, data sources, and performance criteria used to estimate the GHG emissions reduction potential for each measure related to transportation. The quantification of GHG reductions was based primarily on calculation methods detailed in the California Air Pollution Control Officers Association’s (CAPCOA) report, Quantifying Greenhouse Gas Mitigation Measures (August 2010). The calculations utilize emissions factors and results from the City of Madera Community-wide GHG Emissions Inventory (2014) and City of Madera Government Operations GHG Emissions Inventory (2012), and assumptions made about the degree of implementation in the years 2020 and 2030. TABLE C-1: TECHNICAL ASSUMPTIONS: GHG REDUCTIONS FROM TRANSPORT MEASURES
Measure
2020 GHG Reduction (MT CO2e)
2030 GHG Reduction (MT CO2e)
Assumptions
T-1: Infill and Mixed Use Development
5,613
21,292
Assumes a 4% reduction in VMT by 2020 as a result of a 30% increase in density within the City. Also assumes a combined 12% reduction in VMT by 2030 as a result of smart growth development (increased service population density to 50%, diversity of land uses, and destination accessibility) within the City. Conservative VMT reduction estimates were used based on the following ranges presented in CAPCOA: increase density (0.8-30%), diversity of land use (9-30%), destination accessibility (6.7%-20%), combined total reduction not to exceed: compact infill = 30%; suburban center = 10%; suburban = 5%. (City of Madera, 2014; Community-wide GHG Emissions Inventory, 2014; CAPCOA, 2010)
T-2: Bicycle and Pedestrian Environment
1,053
3,454
As a rule of thumb, the Center for Clean Air Policy (CCAP) Guidebook attributes a 1% to 5% reduction associated with comprehensive bicycle programs. Assume low-middle range of CCAP reduction estimates: 1% reduction by 2020 and 3% reduction by 2030 (to account for both bicycle and pedestrian trips). (CCAP Guidebook, 2005; Community-wide GHG Emissions Inventory, 2014; CAPCOA, 2010)
80

17
Measure
2020 GHG Reduction (MT CO2e)
2030 GHG Reduction (MT CO2e)
Assumptions
T-3: Transit Travel
2,404
4,757
Assumes an increase in transit ridership to 2% of the city’s service population by 2020 and 4% of the service population by 2030. Average round-trip transit trip: 14 miles in 2020, 12 miles in 2020. This equates to a 2% reduction in light-duty VMT by 2020 and a 4% reduction in light-duty VMT by 2030. (Fehr & Peers, 2014; CAPCOA, 2010)
T-4: Commute Trip Reduction
1,188
1,977
VMT reductions from TDM programs range from 5.2% to 19% depending on the level of support provided and the density of the area in which the TDM is implemented. Conservatively assumes low range estimates for voluntary TDM (5.2% reduction in commute VMT in 2020 and 8% reduction in 2030). Also assumes 19.41% of 2020 VMT from commute trips and 19.17% 2030 VMT from commute trips. (Fehr & Peers, 2014; CAPCOA, 2010)
T-5: Traffic Flow and Vehicle Idling
265
401
Traffic Signalization: According to the Federal Highway Administration, there is evidence of a 4-13% reduction in fuel consumption for signal coordination projects. This calculation assumes 10% reduction from reduced idling in 2020 and 13% reduction in 2030. (FHWA, 2011; CAPCOA, 2010)
T-6: Low Carbon Fuel Vehicles and Infrastructure
4,255
11,061
Assumes 2.5% increase in purchase of electric vehicles above Advanced Clean Cars in 2020 and 6% increase in 2030. Assumes 6% of heavy-duty vehicles switch to a CARB-approved low carbon fuel (CNG was used for the purposes of this calculation) by 2020 and 15% switch by 2030. (CARB, 2010)
SOURCE: Pages C-1 and C-4 | City of Madera Climate Action Plan, August, 2015
81

18
APPENDIX II – DETAIL ON CAP TRANSPORTATION STRATEGIES (Source: Madera City CAP Chapter 4 | Implementation & Monitoring)
Measure
Actions
Responsible Parties(s)
Potential Cost (Aggregated)
Potential Savings (Annual)
GHG Reduction Potential (MT CO2e)
Performance Indicator
Implementation Timeframe
Transportation and Land Use
T-1 Infill and Mixed-Use Development: Facilitate mixed use, higher density, and infill development near transit stops, in existing community centers/ downtown, and in other designated areas.
T-1.1: Expand the promotion of incentives for new development and renovation of existing uses in identified infill areas. T-1.2: Continue to work with MCTC in updates to the Madera County Blueprint to direct future growth to existing urbanized areas through implementation of smart growth principles and use of toolkit resources identified in the Blueprint. T-1.3: Showcase infill and mixed-use projects on the City’s website, in newsletters, or via other mechanisms.
Administrative Services, Community Development – Planning & Building
$45,000 - $90,000
None 2020: 5,613 MT CO2e
2030: 21,292 MT CO2e
Increase service population density within the city 30% by 2020 and 50% by 2030; 25% of new development located within 2 miles of shopping/transit/ job centers by 2030; and 15% of new development with 2 or more land use types (e.g., residential and commercial) by 2030.
Mid-Term
82

19
Measure
Actions
Responsible Parties(s)
Potential Cost (Aggregated)
Potential Savings (Annual)
GHG Reduction Potential (MT CO2e)
Performance Indicator
Implementation Timeframe
T-2 Bicycle and Pedestrian Environment: Continue to expand and improve the City’s bicycle and pedestrian network.
T-2.1: Continue to pursue public and private funding to expand and link the City's bicycle and pedestrian network in accordance with the General Plan and Bicycle Master Plan. T-2.2: Develop policies and minimum design criteria for bicycle and pedestrian circulation in new residential development and implement through the development review process. Require the installation of adequate and secure bicycle parking at all new multi- family residential, commercial, governmental, and recreational locations throughout the City. T-2.3: Collaborate with law enforcement, school officials, and private organizations to encourage public bicycle safety programs.
Administrative Services, Community Development – Planning & Public Works, Parks & Community Services
$30,000- $60,000
None 2020: 1,053 MT CO2e
2030: 3,454 MT CO2e
Achieve a 1% reduction in light-duty VMT by 2020 and a 3% reduction in light-duty VMT by 2030 as a result of mode shift to bicycling and walking.
Near-Term
83

20
Measure
Actions
Responsible Parties(s)
Potential Cost (Aggregated)
Potential Savings (Annual)
GHG Reduction Potential (MT CO2e)
Performance Indicator
Implementation Timeframe
T-3 Transit Travel: Continue to expand and improve the transit network and its accessibility within the City of Madera.
T-3.1: Through the development review process, require new development to provide safe routes to adjacent transit stops, where applicable, and to finance and/or construct bus turnouts and shelters adjacent to new projects where transit demand warrants such improvements. T-3.2: Promote and encourage businesses to provide public transit vouchers as a benefit of employment.
Administrative Services, Community Development – Planning
$22,500 - $45,000
None 2020: 2,404 MT CO2e
2030: 4,757 MT CO2e
Achieve a 2% increase in service population transit ridership by 2020 and a 4% increase by 2030. This equates to an approximately 2% reduction in passenger vehicle VMT in 2020 and 4% reduction in 2030.
Near-Term
T-4 Commute Trip Reduction: Facilitate programs that give commuters and employers resources and incentives to reduce their single- occupancy vehicle trips.
T-4.1: Provide targeted marketing and promotion of commute trip reduction programs to employers such as the SJVAPCD Vanpool Voucher Incentive. T-4.2: Provide information on, and links to, vanpool programs and employer services available to local residents/ on the City’s website. T-4.3: Provide information on and promote existing employer based TDM programs as part of the business licensing and renewal process.
Administrative Services, Community Development – Planning
$45,000 - $90,000
None 2020: 1,188 MT CO2e 2030: 1,977 MT CO2e
Achieve a 5% decrease in commute trip VMT by 2020 and an 8% decrease in commute trip VMT by 2030.
Mid-Term
84
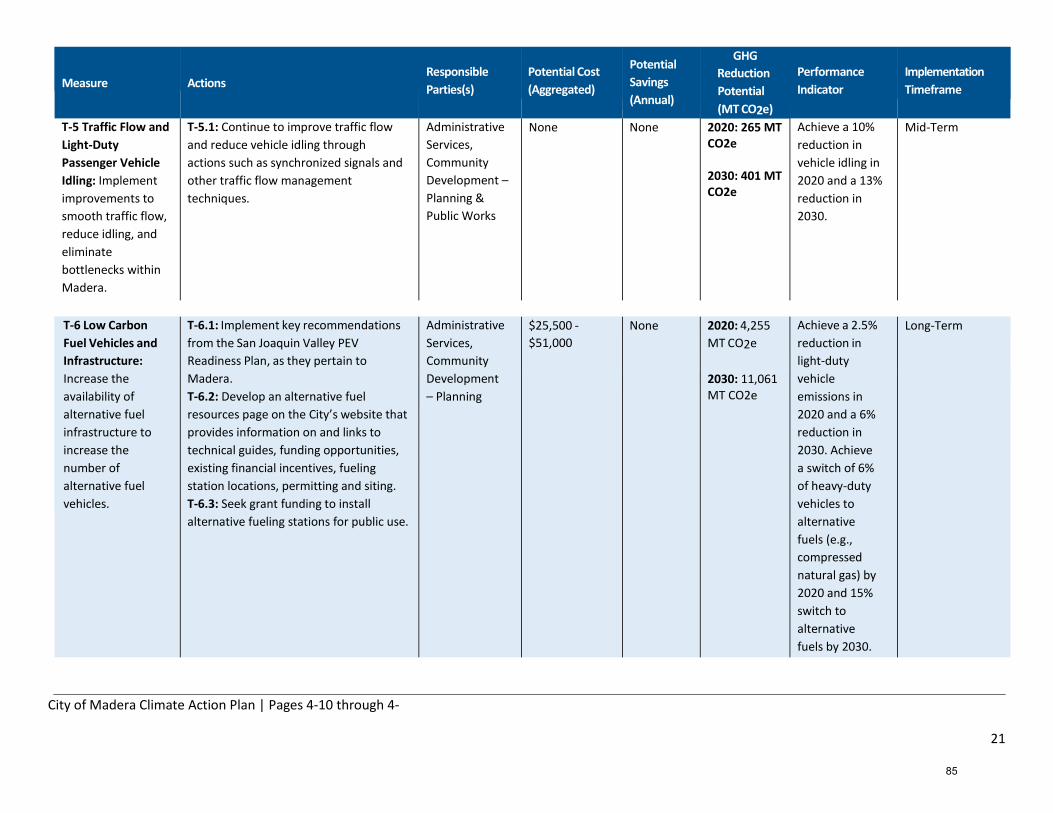
21
Measure
Actions
Responsible Parties(s)
Potential Cost (Aggregated)
Potential Savings (Annual)
GHG Reduction Potential (MT CO2e)
Performance Indicator
Implementation Timeframe
T-5 Traffic Flow and Light-Duty Passenger Vehicle Idling: Implement improvements to smooth traffic flow, reduce idling, and eliminate bottlenecks within Madera.
T-5.1: Continue to improve traffic flow and reduce vehicle idling through actions such as synchronized signals and other traffic flow management techniques.
Administrative Services, Community Development – Planning & Public Works
None None 2020: 265 MT CO2e 2030: 401 MT CO2e
Achieve a 10% reduction in vehicle idling in 2020 and a 13% reduction in 2030.
Mid-Term
T-6 Low Carbon Fuel Vehicles and Infrastructure:
T-6.1: Implement key recommendations from the San Joaquin Valley PEV Readiness Plan, as they pertain to
Administrative Services, Community
$25,500 - $51,000
None 2020: 4,255 MT CO2e
Achieve a 2.5% reduction in light-duty
Long-Term
Increase the availability of alternative fuel infrastructure to increase the number of alternative fuel vehicles.
Madera. T-6.2: Develop an alternative fuel resources page on the City’s website that provides information on and links to technical guides, funding opportunities, existing financial incentives, fueling station locations, permitting and siting. T-6.3: Seek grant funding to install alternative fueling stations for public use.
Development – Planning
2030: 11,061 MT CO2e
vehicle emissions in 2020 and a 6% reduction in 2030. Achieve a switch of 6% of heavy-duty vehicles to alternative fuels (e.g., compressed natural gas) by 2020 and 15% switch to alternative fuels by 2030.
City of Madera Climate Action Plan | Pages 4-10 through 4-
85

86
APPENDIX D: MCTC Supplement on Changes in Transportation Funding Allocations, Assumed Higher Density Housing Shifts, & Infill Development, December 2017

1
2014 MCTC RTP/SCS
Changes in Transportation Funding Allocations, Assumed Higher
Density Housing Shifts,
& Infill Development
2014 MCTC RTP/SCS Objectives
The MCTC 2014 Regional Transportation Plan/Sustainable Communities Strategy (RTP/SCS) details how the Region will reduce greenhouse gas (GHG) emissions to state mandated levels over time. The inclusion of the SCS is required by Senate Bill 375, and stresses the importance of meeting GHG per capita emission reduction targets set by the California Air Resources Board (CARB). MCTC has approached development of the SCS as an “opportunity” to enhance the integration of transportation, land use and the environment in the Madera Region.
The RTP/SCS Roundtable and Technical Working Group developed the set of goals and objectives based on an extensive review and consideration of their vision of the regional transportation system over the next 26 years, along with meaningful input from the public.
The RTP/SCS is intended to show how integrated land use and transportation planning can
lead to lower GHG emissions from autos and light trucks.
A detailed land use growth strategy related to housing and employment was developed in
conjunction with local agency staff, stakeholder and public input in the creation of SCS Scenarios for
the RTP.
These growth strategies needed to break away from the status quo and be more aggressive in order
make progress towards achieving vehicle emission reduction goals and the subsequent benefits
from such progress. This aggressive approach still needed to be balanced with what was deemed
feasibly achievable within Madera communities.
The input into land use strategies was correlated with San Joaquin Valley Blueprint data and
parameters specific to Madera County with outlined changes towards the following polices:
Demographic shift in housing share specific to each individual community area with an emphasis
towards higher densities in urban areas.
Shift in housing lot size ratios specific to each individual community area with emphasis towards
more units per acre, especially in urban areas.
Demographic shifts in employment share specifically tailored to accurately reflect an individual
community’s existing and projected employment profile.
Shifts to employment type intensities specific to a community’s planned employment growth.
Spatial shift in new jobs and household allocation to areas with the highest potential for infill,
redevelopment in urban areas.
87
2
The preferred SCS scenario, as well as all analyzed scenarios, was consistent with locally approved
general plans from each of the Madera County jurisdictions.
The preferred SCS scenario chosen for the RTP/SCS was the most aggressive proposed and yielded
the most favorable GHG reductions when traffic activity from cars and trucks was measured using
available technical analysis tools.
Current local general plans direct growth to more sustainable and smart growth provisions outlined
by the SCS. Examples of these directives are detailed further in this correspondence.
The RTP/SCS will promote increased transit use and mode share, all of which will led to both
mobility and air quality improvements.
Maintaining existing roadways and addressing new issues related to growing car and truck trips is an
important factor towards realizing a healthy and efficient transportation system, however additional
emphasis on public transit, non-motorized travel, multi-modal choice and availability and alternative
modes and fuels plays a significant role in the change projected in the Madera Region’s future.
Providing more efficient and broader reaching access to important destinations with an array of
modal choices will yield co-benefits for many aspects of daily life in the Madera Region.
The 2014 RTP/SCS outlines a meaningful shift in long range modal investment with significant
increased funding to non-streets and roads projects. Table 1 indicates the projected shift in
investment towards public transit and alternative modes from the 2011 RTP to the current 2014
RTP/SCS.
This shift and subsequent investments are already identifiable in the Madera Region today via the
following service expansions and system enhancements:
Rural bus stop shelter program has installed numerous bus shelters and platforms in rural
Madera County areas in 2016 for the Madera County Connection (MCC) fixed route bus service.
Implementing route headway reductions for the MCC in 2016 for high frequency routes in rural
Madera County. Enhances access for connecting residents to high frequency destinations
(Madera Center Community College, Valley Children’s Hospital and Fresno Area Express transit
transfer to the City of Fresno).
The City of Madera between 2015 to 2018 will have completed installing 80 new bus stop
shelters throughout the City of Madera city limits for the Madera Area Express fixed route bus
service.
In Winter of 2018 the City of Madera will launch a new hourly fixed route service between the
City of Madera and the Madera Center Community College.
88

3
TABLE 1 – 2011 vs 2014 RTP Investment by Mode
In the Summer of 2015, Yosemite Area Regional Transit System (YARTS) launched a regional,
multi-county fixed route system connecting Fresno Yosemite International Airport to Yosemite
National Park via State Route 41 through Madera County’s rural Eastern foothill and mountain
communities. Planning is currently underway to expand this system to connect the rural
communities of Oakhurst in Madera County and Mariposa in Mariposa County along State Route
49.
The CalVans rideshare program is expanding yearly and effective outreach is connecting new
users to this system yearly.
Many of these new or improved systems were conceived in the development of the 2014 RTP/SCS.
Outreach with the Madera Center Community College administration staff and the Madera Unified
School District Superintendent’s office brought new collaboration with City of Madera and Madera
County agency staff and transit service providers to help bridge accessibility gaps and address public
dialog and comments MCTC received in the 2014 RTP/SCS development process.
Mode Total Percent
Streets and Roads Total $1,560,700,000 89%
Public Transit Total $107,900,000 6%
All Other Modes* $84,200,000 5%
TOTAL $1,752,800,000 100%
Mode Total Percent
Streets and Roads Total $1,052,800,000 76%
Public Transit Total $238,400,000 17%
All Other Modes* $93,000,000 7%
TOTAL $1,384,200,000 100%
Mode Total Difference Percent Change
Streets and Roads Total -$507,900,000 -33%
Public Transit Total $130,500,000 121%
All Other Modes* $8,800,000 10%
2014 Madera County RTP - Expenditure by Mode
2011 Madera County RTP - Expenditure by Mode
2011 vs 2014 Madera County RTP - Expenditure by Mode
*“All Other Modes” includes non-motorized (bicycle and pedestrian),
aviation, no and low-emission vehicle projects; electric charging
stations; traffic signals; and various transportation control
measures/transportation systems management projects, etc.
89
4
Regional collaboration with the MCTC, the City of Fresno, Madera County and Yosemite National
Park staff to launch the YARTS system in the rural area helped to alleviate seasonal congestion from
those visiting the National Park, while also benefiting rural Madera County residents by providing
higher quality and more frequent transit options to connect them to other areas.
Beyond what improvements are visible today, additional planning for improved connections
between growing urban population centers along State Route 99 and State Route 41 will come on
line as warranted.
Additionally, enhancements to commuter rail are also planned in the Madera Region. The California
High Speed Rail Authority has indicated that Madera County will be in the unique position of having
the future high speed commuter train connect to the existing Amtrak system. This connection will
open the door for important Transit Orientated Development (TOD) in the Madera Region for years
to come and will be depicted in future RTP/SCS documents as more meaningful planning data
materializes. Additionally, the San Joaquin Joint Powers Authority is planning to implement
improved frequency to the San Joaquins Amtrak system (seven daily trips to nine) as well as a mid-
route start location to help better serve Valley peak hour commuters. The improved service will
assist in getting more riders on commuter rail and fewer drivers on our state highway systems
thereby improving congestion and air quality. This will be a benefit to SCS implementation in the
San Joaquin Valley.
Encourages changes to the urban form that improve accessibility to transit, and create more
compact development, thereby yielding a number of transportation benefits to the region.
MCTC is in the process of finalizing a comprehensive Active Transpiration Plan (ATP) for all
communities in the Madera Region. The goal is to identify specific objectives, policies and projects
able to provide accessible travel options in Madera communities, reduce reliance on emission
producing vehicles, promote better health, enhance community aesthetics and improve public
safety. A listing of ATP goals is provided in the section below. Developed concurrently to the
Madera ATP is the Complete Streets Policy Development White Paper. Additional information
regarding the Madera Complete Streets Policy Development White Paper is provided later in this
correspondence.
General Plan Goals, Objectives and Policies Related to Increasing Housing Density and the
Integration of Alternative Transportation Modes and New Development
The following general plan land use, housing and transportation goals, objectives and policies adopted by the three local jurisdictions (Madera County, and the cities of Chowchilla and Madera) are consistent with, and are intended to implement the 2014 MCTC RTP/SCS. As can be seen, the local jurisdictions encourage increased densities and self-contained communities designed to reduce vehicle trip and encourage other modes such as walking, biking and the use of transit.
Madera County General Plan (Web Link: http://www.madera-county.com/index.php/county-forms/category/46-general-plan-document-materials)
Adopted October, 1995
90
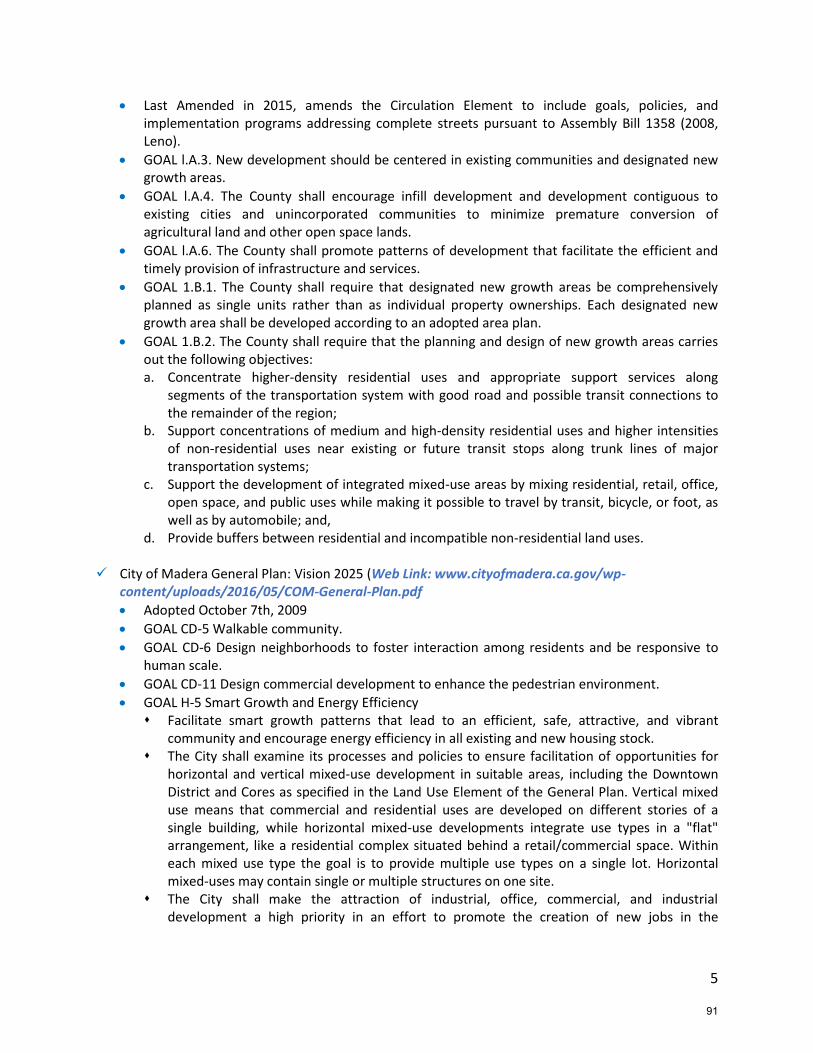
5
Last Amended in 2015, amends the Circulation Element to include goals, policies, and implementation programs addressing complete streets pursuant to Assembly Bill 1358 (2008, Leno).
GOAL l.A.3. New development should be centered in existing communities and designated new growth areas.
GOAL l.A.4. The County shall encourage infill development and development contiguous to existing cities and unincorporated communities to minimize premature conversion of agricultural land and other open space lands.
GOAL l.A.6. The County shall promote patterns of development that facilitate the efficient and timely provision of infrastructure and services.
GOAL 1.B.1. The County shall require that designated new growth areas be comprehensively planned as single units rather than as individual property ownerships. Each designated new growth area shall be developed according to an adopted area plan.
GOAL 1.B.2. The County shall require that the planning and design of new growth areas carries out the following objectives: a. Concentrate higher-density residential uses and appropriate support services along
segments of the transportation system with good road and possible transit connections to the remainder of the region;
b. Support concentrations of medium and high-density residential uses and higher intensities of non-residential uses near existing or future transit stops along trunk lines of major transportation systems;
c. Support the development of integrated mixed-use areas by mixing residential, retail, office, open space, and public uses while making it possible to travel by transit, bicycle, or foot, as well as by automobile; and,
d. Provide buffers between residential and incompatible non-residential land uses. City of Madera General Plan: Vision 2025 (Web Link: www.cityofmadera.ca.gov/wp-
content/uploads/2016/05/COM-General-Plan.pdf
Adopted October 7th, 2009
GOAL CD-5 Walkable community.
GOAL CD-6 Design neighborhoods to foster interaction among residents and be responsive to human scale.
GOAL CD-11 Design commercial development to enhance the pedestrian environment.
GOAL H-5 Smart Growth and Energy Efficiency Facilitate smart growth patterns that lead to an efficient, safe, attractive, and vibrant
community and encourage energy efficiency in all existing and new housing stock. The City shall examine its processes and policies to ensure facilitation of opportunities for
horizontal and vertical mixed-use development in suitable areas, including the Downtown District and Cores as specified in the Land Use Element of the General Plan. Vertical mixed use means that commercial and residential uses are developed on different stories of a single building, while horizontal mixed-use developments integrate use types in a "flat" arrangement, like a residential complex situated behind a retail/commercial space. Within each mixed use type the goal is to provide multiple use types on a single lot. Horizontal mixed-uses may contain single or multiple structures on one site.
The City shall make the attraction of industrial, office, commercial, and industrial development a high priority in an effort to promote the creation of new jobs in the
91

6
community, improve the financial resources of residents, and create a balanced community that is more resistant to economic downturns.
The City shall promote residential development patterns that protect and improve air quality through alternative modes of transportation.
GOAL LU-2 In a change from the city’s previous practice of rapid outward expansion, Madera is amore sustainable, compact city that uses more compact land use patterns to encourage walking,bicycling, and transit use; preserve agricultural and other open space uses; and reduceinfrastructure costs.
Policy LU-1 City of Chowchilla 2040 General Plan (http://www.ci.chowchilla.ca.us/154/Chowchilla-2040-
General-Plan)
Adopted May 9th, 2011
Housing Element GOAL 2 Ensure adequate provision of housing for all household income groups Policy 2.1. Designate adequate medium and medium-high density areas on the General Plan
to provide for the development of apartments and other forms of high-density housing. Policy 2.2. Pursue funding under federal and state programs for affordable housing
construction and rehabilitation. Policy 2.3. Provide density bonuses to homebuilders proposing to include a minimum
specified percentage of very low- and/or low-income housing within residential zoningdistricts to increase supply of affordable housing.
Land Use Element Objective LU 2 Develop and maintain a pattern of residential land uses that provides for a
variety and balance of densities, and a mixture of different dwelling and household types. o Policy LU 2.1 Residential development shall be consistent with the density ranges
included in Table LU 3. Minimum densities shall not be less than those listed in Table LU3.
o Policy LU 2.2 Encourage large residential developments to include a specific plan thatincorporates a variety of types and densities of housing.
o Policy LU 2.3 High and medium density residential development is encouraged withinreasonable walking distance of the downtown of the City and commercial land uses.
o Policy LU 2.4 Encourage Mixed Use development to integrate housing with commercialand office land uses in newly developing areas and in the Downtown.
o Policy LU 3.2 Residential development proposals over 20 acres in size shall include amixture of densities and dwelling types, consistent with the land use designation anddensity range.
o Policy LU 5.2 Create and preserve distinct, identifiable neighborhoods that:1. Connect in as many locations as possible to adjacent development, arterial streets,
and thoroughfares;2. Provide a balanced mix of housing, workplaces, shopping, recreational
opportunities, and institutional uses, including mixed-use structures (combinedresidential and non-residential uses), that help to reduce vehicular trips;
3. Provide second stories on commercial buildings to provide for other uses andencourage residential use;
8. Allow small ancillary dwelling units in the rear yard for residential areas;o Policy LU 9.2 Mixed uses, which support the overall intent of the Downtown Commercial
District should be encouraged by the adoption of a flexible zoning district applicableonly in the Downtown Commercial District.
-2►
92

7
Other Major Plans and Programs Related to Increasing Densities and Integrating Land Use and Transportation Systems Other plans and programs that promote increased densities and the use of alternative modes in Madera County are noted below.
City of Madera Climate Action Plan 2030 (Web Link: www.cityofmadera.ca.gov/wp-
content/uploads/2017/08/Final-Madera-CAP_September-2015.pdf) Adopted September 2, 2015, the City of Madera Climate Action Plan is designed to:
Benchmark Madera’s 2007 GHG emissions and 2020 and 2030 projected emissions.
Establish GHG emissions targets for the years 2020 and 2030 to support California’s larger effort to reduce statewide emissions under AB 32 and Executive Orders S-3-05 and B-30-15.
Provide a roadmap for achieving the city’s GHG emissions reduction targets.
Fulfill City of Madera General Plan (2009) Action Item CON-36.2, which directs the City to prepare this CAP.
Support the streamlining of the environmental review process for future projects within Madera in accordance with State California Environmental Quality Act (CEQA) Guidelines Sections 15152 and 15183.5It estimates GHG reductions from dozens of strategies and measures, including several transportation measures, four of which reduce vehicle miles traveled (VMT).
The CAP first forecasts a “business as usual” (BAU) scenario for GHG emissions in two horizon years, 2020 and 2030. Section 2.2.1 of the City of Madera CAP describes the 2020 and 2030 Emissions Forecast Methodology: The GHG emissions forecast provides a “business-as-usual estimate,” or scenario, of how emissions will change in the years 2020 and 2030 if consumption trends and efficiency continue as they did in 2007, absent any new regulations or actions that would reduce emissions. The year 2020 was selected for the forecast in order to maintain consistency with the AB 32 target year. The year 2030 was selected to maintain consistency with the City of Madera General Plan horizon year and to support California’s larger effort to reduce statewide emissions under Executive Orders S-3-05 and B-30-15.
MCTC Draft Madera County Regional Active Transportation Plan (ATP) (Web Link:
http://www.maderactc.org/planning/active-transportation/) According to the Draft ATP, the Plan will support the RTP/SCS by providing a long-range vision for the bicycle and pedestrian network across the County. There are no other ATPs prepared or adopted by the three (3) local jurisdictions. As a result, the ATP supports local planning processes by providing a vision and guide for the creation of active transportation facilities. The Plan simultaneously considers countywide connections as well as local networks for the cities of Madera and Chowchilla, and selected unincorporated communities. Most importantly, the Draft ATP, once adopted by MCTC, will provide local agencies with the ability to apply for State and federal funding to implement facilities contained in the Plan. Goals and policies contained in the Plan include:
GOAL 1. Expand pedestrian and bicycle access throughout Madera County for both visitors and residents 1.1. Build a connected pedestrian and bicycle network over the next two decades through
connections within and between cities, towns, and other destinations in Madera County 1.2. Improve safety and access to schools across Madera County
93

8
1.3. Increase the miles of pedestrian and bicycle facilities across Madera County 1.4. Connect active transportation to other modes of transportation to encourage first/last
mile connections
GOAL 2. Improve and maintain existing bicycle and pedestrian facilities across Madera County2.1. Improve the quality of facilities whenever possible, particularly when these facilities
provide critical links between important destinations 2.2. Regularly inventory condition of active transportation facilities in Madera County 2.3. Maintain good quality of active transportation facilities in Madera County through
repairs and maintenance
GOAL 3. Increase walking and bicycling in Madera County3.1. Increase the number of commute trips made by walking or bicycle across Madera
County 3.2. Increase recreational use of bicycle and pedestrian facilities across Madera County
GOAL 4. Improve safety and accessibility across Madera County through active transportationfacilities4.1. Improve safety at high injury intersections across the county4.2. Adopt new design guidelines that facilitate safe travel for pedestrians and bicyclists4.3. Promote accessible design across the county through the adoption of design guidelines
that consider all users, including the elderly and individuals with disabilities 4.4. Promote Safe Routes to School programming across Madera County
GOAL 5. Increase awareness and appreciation of active transportation through publicengagement5.1. Create context - sensitive programming to promote active transportation across Madera
County 5.2. Support programming at schools across Madera County to increase awareness of
benefits and safe practices related to active transportation
Complete Streets Policy Development White Paper (web Ling: http://www.maderactc.org/wp-content/uploads/2017/08/MaderaCTC_Complete-Streets-White-Paper_Public-Review-Draft.pdf)
MCTC is starting the process to create a regional Complete Streets policy to promote andformalize the accommodation of all users and modes in the transportation system. This whitepaper is intended to provide an overview of best practices and key topics that can be included ina context sensitive Complete Streets policy. MCTC will use feedback provided by local agenciesand stakeholders to guide the language to be included in the regional Complete Streets policy.
94
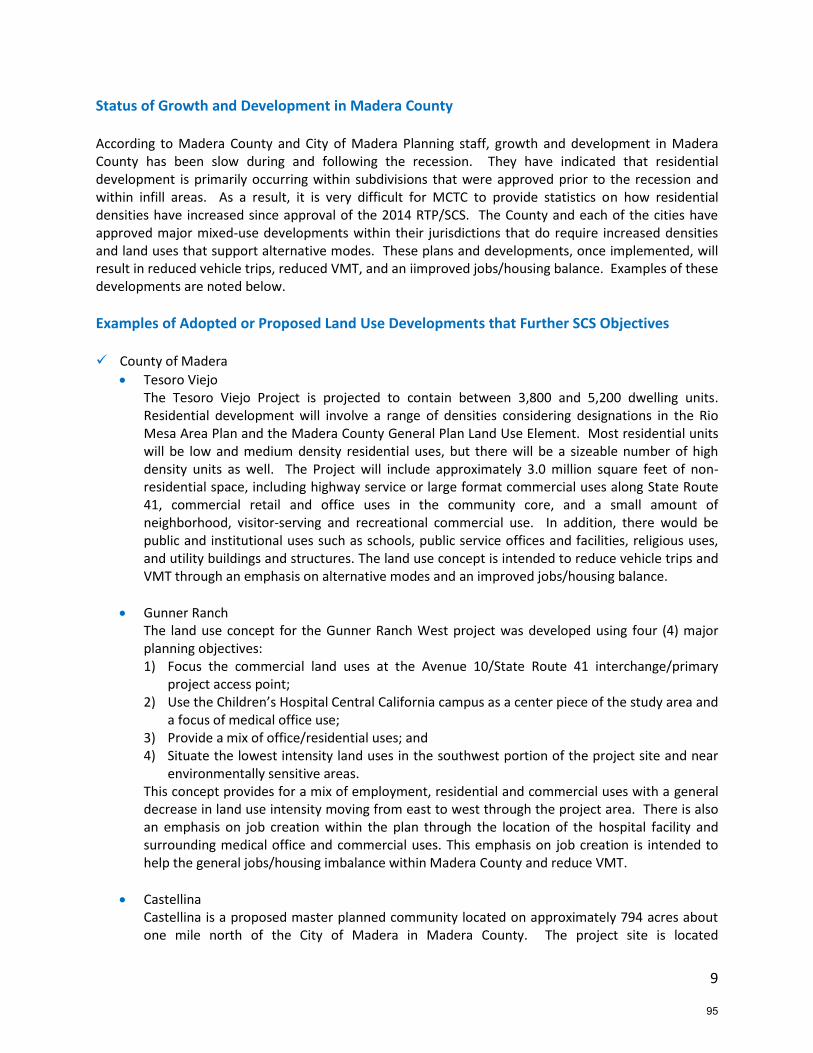
9
Status of Growth and Development in Madera County According to Madera County and City of Madera Planning staff, growth and development in Madera County has been slow during and following the recession. They have indicated that residential development is primarily occurring within subdivisions that were approved prior to the recession and within infill areas. As a result, it is very difficult for MCTC to provide statistics on how residential densities have increased since approval of the 2014 RTP/SCS. The County and each of the cities have approved major mixed-use developments within their jurisdictions that do require increased densities and land uses that support alternative modes. These plans and developments, once implemented, will result in reduced vehicle trips, reduced VMT, and an iimproved jobs/housing balance. Examples of these developments are noted below.
Examples of Adopted or Proposed Land Use Developments that Further SCS Objectives County of Madera
Tesoro Viejo The Tesoro Viejo Project is projected to contain between 3,800 and 5,200 dwelling units. Residential development will involve a range of densities considering designations in the Rio Mesa Area Plan and the Madera County General Plan Land Use Element. Most residential units will be low and medium density residential uses, but there will be a sizeable number of high density units as well. The Project will include approximately 3.0 million square feet of non-residential space, including highway service or large format commercial uses along State Route 41, commercial retail and office uses in the community core, and a small amount of neighborhood, visitor-serving and recreational commercial use. In addition, there would be public and institutional uses such as schools, public service offices and facilities, religious uses, and utility buildings and structures. The land use concept is intended to reduce vehicle trips and VMT through an emphasis on alternative modes and an improved jobs/housing balance.
Gunner Ranch The land use concept for the Gunner Ranch West project was developed using four (4) major planning objectives: 1) Focus the commercial land uses at the Avenue 10/State Route 41 interchange/primary
project access point; 2) Use the Children’s Hospital Central California campus as a center piece of the study area and
a focus of medical office use; 3) Provide a mix of office/residential uses; and 4) Situate the lowest intensity land uses in the southwest portion of the project site and near
environmentally sensitive areas. This concept provides for a mix of employment, residential and commercial uses with a general decrease in land use intensity moving from east to west through the project area. There is also an emphasis on job creation within the plan through the location of the hospital facility and surrounding medical office and commercial uses. This emphasis on job creation is intended to help the general jobs/housing imbalance within Madera County and reduce VMT.
Castellina Castellina is a proposed master planned community located on approximately 794 acres about one mile north of the City of Madera in Madera County. The project site is located
95

10
approximately three miles east of State Route 99. Other cities along the State Route 99 corridor include the cities of Merced (34 miles) and Chowchilla (16 miles) to the north, and the City of Fresno (25 miles) to the south. Yosemite is located 60 miles to the northeast via State Routes 145 and 41. The vision for Castellina is to be a residential community that reinforces traditional community qualities - cohesive neighborhoods connected via sustainable design features that support strong social, cultural and civic amenities and activities. Thoughtful and imaginative design will result in memorable places and opportunities for engagement and interaction. Castellina will be a community of diverse and integrated residential neighborhoods that surround a large central park and a mixed-use village center, a possible active adult community, and an employment park that supports job opportunities in proximity to housing. This conceptual land plan calls for the development of up to 2,984 market rate and active adult single-family, multi-family and mixed-use residential units, approximately 21 acres of commercial mixed-use, an approximately 20-acre employment park, and approximately 137 acres of parks, play fields, trails, plazas, community gardens, and other open space.
City of Madera
The Madera General Plan directs growth in the City to be denser than prior plans in order to provide a more walkable, livable and sustainable Madera into the future. Density ranges for all residential land use designations were increased, and target densities are specified for new, larger developments. Although there has not been meaningful expansive growth in Madera since its adoption, the vision of the General Plan and its imprint upon the community has still been seen in characteristics of the City’s post-2009 growth patterns. Below are several examples of residential developments that have been approved in the City of Madera since 2010.
2011 - Madera Family Apartments - A 72-unit apartment complex on 3.2 acres, this project satisfies the General Plan target density for high density residential development with 22.5 units per acre.
2013 - Gateway Village - A 65-unit apartment complex on 4.3 acres, this project satisfies the General Plan minimum density for high density residential development with 15 units per acre.
2014 - Emily Way Apartments - A 54-unit apartment complex on 2.3 acres this project satisfies the General Plan target density for high density residential development with 22.5 units per acre.
2014 - Capistrano XVI SFR subdivision - A 103 lot single family residential neighborhood, this project exceeds the General Plan target density for low density residential development with 5.5 units per acre where 5.25 units are required. Of note, prior to the 2009 General Plan, this 18.69-acre property had been proposed for a residential subdivision of only 86 lots.
2017 - Adell SFR subdivision - A 14 lot single family residential subdivision on 1.61 acres, this project satisfies the General Plan density for medium density residential development with 8.7 units per acre where 7.1 units are required.
96

11
2017 - Linden Street Apartments - A 22-unit apartment complex on 1.4 acres, this projectsatisfies the General Plan minimum density for high density development with 15.7 units peracre where 15.1 units are required.
Thus, since adoption, these examples of approved residential development equate to 330 units on approximately 31.5 acres for an average density of 10.5 units per acre, far in excess of the overall target densities for the General Plan’s "building block” village concept which envision six to eight units per acre for all residential development combined.
The City’s General Plan also includes several goals and policies intended to support multi-modal choices in non-residential development. While relatively little large scale new commercial development has been approved since the adoption of the General Plan, the City has incorporated pedestrian and transit features into appropriately scaled projects where feasible. A key example is the project noted above:
2013 – Foxglove Shopping Center. A 191,500 square feet shopping center with internalpedestrian connections, pedestrian amenities, and a new internal transit stop.
City of Chowchilla
Rancho Calera Specific PlanThe master planned community is planned on 576 acres with 2,042 single-family homes, 35acres of commercial property, two elementary schools, a one-acre safety facility, and 77 acres ofpark/open space. The Plan features an elaborate system of parks and walking trials withconnections to many parts of the community. Other elements include a number of waterfeatures, lakes, sports and neighborhood parks as well as an elementary school, middle school,and community center. Key features include: Mixed housing types for a diversity of home buyers Multi-modal street design includes pedestrian sidewalks and bike lanes
Findings
Based upon the information provided above, MCTC and local jurisdictions in Madera County are committed to increasing housing densities and an improved jobs/housing balance to reduce vehicle trips and VMT and to support alternative modes of transportation. Each of the jurisdictions were involved with development of the 2014 SCS and continue to provide input into the 2018 RTP/SCS process. While growth and development has been very slow since the recession began in 2008, the plans and policies adopted and being implemented by the local jurisdictions will continue to ensure that the objectives of the 2014 and future versions of the SCS will be achieved.
97

98
APPENDIX E: Residential Density Supplemental Data
Residential Density – Status Quo or Without SCS Scenario Madera City Chowchilla SE Madera County
PARAMETERS Status Quo (“Baseline”
Status Quo (“Baseline”
Status Quo (“Baseline”
Status Quo (“Baseline”
1 Demographic Shift in Housing Share 15,233 2,784 13,581 5,821 Very Low 0.0% 0.25% 0.1% 3.0% Low 1.8% 6.50% 4.2% 53.0% Medium 82.0% 80.00% 82.0% 42.0% Medium High 13.0% 12.50% 12.0% 2.0% High 3.2% 0.75% 1.8% 0.0% 100.0% 100.00% 100.00% 100.00% 2 Change in Lot Sizes Very Low 20 20 20 20 Low 1 1 1 1 Medium 0.16 0.16 0.16 0.16 Medium High 0.08 0.08 0.08 0.08 High 0.05 0.05 0.05 0.05
Very Low 0.0 139.2 135.8 3492.6
Low 274.2 181.0 570.4 3085.1
Medium 1998.6 356.4 1781.8 391.2
Medium High 158.4 27.8 130.4 9.3
High 24.4 1.0 11.9 0.0
Total HH 15,233 2,784 13,581 5,821 Total Acres 2,456 705 2,630 6,978 Density 6.2 3.9 5.2 0.8
County Wide Total HH 37,419 Total Acres 12,769 Density 2.9
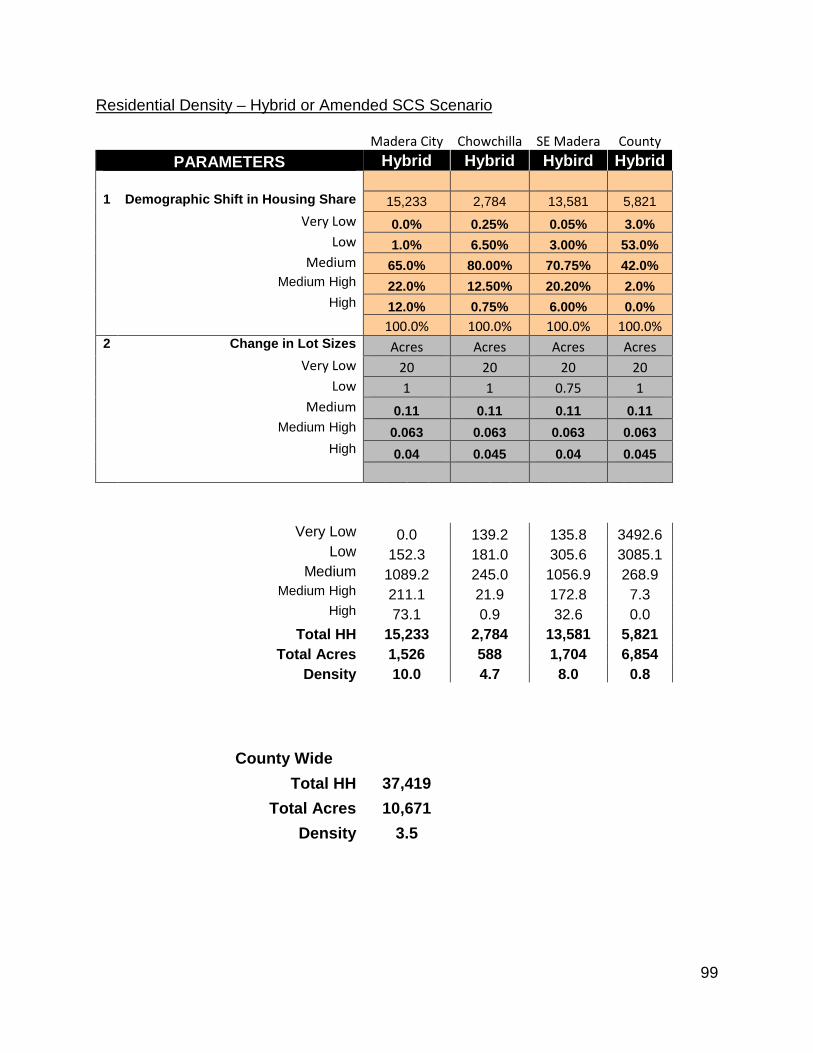
99
Residential Density – Hybrid or Amended SCS Scenario
Madera City Chowchilla SE Madera County PARAMETERS Hybrid Hybrid Hybird Hybrid
1 Demographic Shift in Housing Share 15,233 2,784 13,581 5,821 Very Low 0.0% 0.25% 0.05% 3.0% Low 1.0% 6.50% 3.00% 53.0% Medium 65.0% 80.00% 70.75% 42.0% Medium High 22.0% 12.50% 20.20% 2.0% High 12.0% 0.75% 6.00% 0.0% 100.0% 100.0% 100.0% 100.0% 2 Change in Lot Sizes Acres Acres Acres Acres Very Low 20 20 20 20 Low 1 1 0.75 1 Medium 0.11 0.11 0.11 0.11 Medium High 0.063 0.063 0.063 0.063 High 0.04 0.045 0.04 0.045
Very Low 0.0 139.2 135.8 3492.6 Low 152.3 181.0 305.6 3085.1 Medium 1089.2 245.0 1056.9 268.9 Medium High 211.1 21.9 172.8 7.3 High 73.1 0.9 32.6 0.0 Total HH 15,233 2,784 13,581 5,821 Total Acres 1,526 588 1,704 6,854 Density 10.0 4.7 8.0 0.8
County Wide
Total HH 37,419
Total Acres 10,671
Density 3.5