Technical-economical System Comparison of High Speed ... Michael Witt.pdf · Technical-economical...
20
86 Technical-economical System Comparison of High Speed Railway Systems (*) Michael Witt, (**) Stefan Herzberg (*) Dornier Consulting GmbH, Platz vor dem Neuen Tor 2, 10115 Berlin Germany Phone.: +49 30 253991-43, Fax: +49 30 253991-99 [email protected] (**) Dornier Consulting GmbH, Platz vor dem Neuen Tor 2, 10115 Berlin Germany Phone: +49 30 253991-14, Fax: +49 30 253991-99 [email protected] Keywords System comparison, LCC, system-cost comparison, wheel-on-rail system, ICE 3, Transrapid, Maglev- system. Abstract In the context of the Further Development Program for the German Maglev technology, please refer to the lecture of Mr. Dörries. The Ministry of Transport, Building and Housing assigned the creation of an exemplary comparison of high-speed systems in Railway- and Maglev-technology on the basis of a concrete line. This lecture describes the structure and the general methodology of a cost-of-ownership comparison based on an LCC-analysis. The aim of this system-cost comparison was the realisation of a method to calculate the costs in the different life-cycle phases, e.g. planning, construction, implementation, operation, maintenance and modernisation. In addition to that, other aspects like environmental effects and transport capacity were examined. A comparison with other transport systems was also accomplished. Building on these facts the base parameter of a cost-of-ownership comparison will be explained and the characteristics of a wheel-on-rail system will be shown on the example of the ICE 3, furthermore the Transrapid will illustrate the characteristics of a Maglev-system. On the basis of a common route planning for both systems a track-layout was executed with regard to operational data, system requirements and track equipment. This layout was examined with the help of a simulation model. On the basis of these data the quantity and cost structure were derived and the operational and maintenance costs calculated. An LCC-analysis for both systems is performed in a static and a dynamic form. The results are discussed with regard on cost drivers and the cost optimisation potentials.
Transcript of Technical-economical System Comparison of High Speed ... Michael Witt.pdf · Technical-economical...

86
Technical-economical System Comparison of High Speed Railway Systems
(*) Michael Witt, (**) Stefan Herzberg
(*) Dornier Consulting GmbH, Platz vor dem Neuen Tor 2, 10115 Berlin Germany
Phone.: +49 30 253991-43, Fax: +49 30 253991-99 [email protected]
(**) Dornier Consulting GmbH, Platz vor dem Neuen Tor 2, 10115 Berlin
Germany Phone: +49 30 253991-14, Fax: +49 30 253991-99
Keywords System comparison, LCC, system-cost comparison, wheel-on-rail system, ICE 3, Transrapid, Maglev-system. Abstract In the context of the Further Development Program for the German Maglev technology, please refer to the lecture of Mr. Dörries. The Ministry of Transport, Building and Housing assigned the creation of an exemplary comparison of high-speed systems in Railway- and Maglev-technology on the basis of a concrete line. This lecture describes the structure and the general methodology of a cost-of-ownership comparison based on an LCC-analysis. The aim of this system-cost comparison was the realisation of a method to calculate the costs in the different life-cycle phases, e.g. planning, construction, implementation, operation, maintenance and modernisation. In addition to that, other aspects like environmental effects and transport capacity were examined. A comparison with other transport systems was also accomplished. Building on these facts the base parameter of a cost-of-ownership comparison will be explained and the characteristics of a wheel-on-rail system will be shown on the example of the ICE 3, furthermore the Transrapid will illustrate the characteristics of a Maglev-system. On the basis of a common route planning for both systems a track-layout was executed with regard to operational data, system requirements and track equipment. This layout was examined with the help of a simulation model. On the basis of these data the quantity and cost structure were derived and the operational and maintenance costs calculated. An LCC-analysis for both systems is performed in a static and a dynamic form. The results are discussed with regard on cost drivers and the cost optimisation potentials.
87
0 Introduction After the system decision in the year 1977 the German Transrapid technology was planned for the high-speed passenger transport. The chosen technology with:
• Long stator linear propulsion • Levitation/guidance system ready from 0 km/h as well as • A safety concept according to the principle “Safe Levitation”
is tailored to the application with high speed and large station distances. Therefore, the specific, technical and operational solutions are essential for the existing case of operation to provide an economic transport system. To develop the existing technology and economic potential of the Maglev System Transrapid, a Program for Further Development of the Maglev takes place in Germany between 2002 and 2005. It is in the responsibility of the German Federal Ministry of Transport, Building and Housing and the project assistance is being executed by Dornier Consulting. The Program for Further Development is being fully funded by the Ministry and has the following goals:
• Further development of the previous high speed inter city transport technology for future regional application
• Cost optimisation/cost reduction • Further improvement of reliability and availability of the entire system
With the economical evaluation of complex transport systems, it is necessary to bear in mind their entire costs and life cycle processes. For example, with provisioning measures where both alternatives have the same technical performance it is then common to only compare the initial investment levels. With increasing measures, one must bear in mind the associated monetary effect in the areas of operation and maintenance to find the optimal technical and economical solution. The decided advantage of the Life-Cycle-Cost Engineering lies on the one hand on the excess of net investment and the extension of follow up costs (e.g. maintenance, availability, life cycle). These are calculated so that the technical characteristics of an object are transparent and can be monetarily evaluated. On the other hand, the life cycle examination make it possible to analyse all costs from preparation of contract documents, development of construction and operation to waste disposal. The following lecture gives an overview of the life cycle costs from a neutral point of view as well as of the development potential of the High Speed Maglev System Transrapid.
1 Basis of the LCC Analysis In the area of vehicle purchasing the LCC Analysis is commonly used. In contrast, there is still a considerable demand for research in the area of infrastructure. As a result, there are existing UIC and DB activities still in processing. The LCC Model must closely match the systems conditions. It can then be determined which costs to take into consideration in which life cycle phases, which incoming information to acquire and which relations between the elements of the technical system structure exist. An integral part of such a LCC Model is the Cost Matrix, which is illustrated in Figure 1.

88
Kostenelement :Ausfallkosten des Antriebsin der Lebensphase Betrieb
Bauteil :Antrieb
KostenklassenKostenklasse :Ausfallkosten
Lebensphase : Betrieb
Tech
nisc
heS
trukt
ur
LebenszyklusphasenKostenelement :Ausfallkosten des Antriebsin der Lebensphase Betrieb
Kostenelement :Ausfallkosten des Antriebsin der Lebensphase Betrieb
Bauteil :AntriebBauteil :Antrieb
KostenklassenKostenklassenKostenklassenKostenklasse :AusfallkostenKostenklasse :Ausfallkosten
Lebensphase : BetriebLebensphase : Betrieb
Tech
nisc
heS
trukt
urTe
chni
sche
Stru
ktur
LebenszyklusphasenLebenszyklusphasen
Figure 1: Cost Matrix Model The Cost Matrix divides the entire costs into three dimensions:
Life cycle phases (planning, conception, manufacture, operation, decline etc) Technical system structure (hierarchical structure) Cost Types (e.g. energy costs, personnel costs, material costs, fault induced costs etc)
Through the implementation of this systematic, single costs can be defined and the entire costs are divided into a transparent form (e.g. the failure costs of the propulsion system in the operation phase of the life cycle). The used system structure is illustrated here from an operational point of view and doesn’t cover expenditure for development. It is assumed that these development expenses are already included in the sale price. Also the decline is due to an open life expectancy, which is not quantitatively considered. The main parts of the LCC cover:
Investment and re-investment Maintenance Operational costs Administration costs
The maintenance costs include the expenditure for preventive and corrective measures. In figure 2, a global illustration of the structure of the LCC costs is given in separate block diagrams. For example, it is shown how repair is divided into single cost factors.
Life-cycle phases
Cost Types Cost Type: Failure Costs
Life-cycle: Operation
Cost Element: Failure costs of the propulsion system in the operation phase of the life cycle.
Components:Propulsion System
Tech
nica
l stru
ctur
e

89
Figure 2: Simplified LCC Model for Railway Systems Through the addition of all single cost figures the total costs of the system can be calculated.
2 Comparison of the Technology between the Wheel on Rail and the Maglev using the ICE3 and the Transrapid 08 as Examples
The technology of the ICE3 and the High Speed Maglev are quite different. The differences are included in the LCC model. In the following information, the primary differences of the main sub systems are explained. Alignment Parameters: The following tables show the advantages of the Maglev system in the tilt criteria, horizontal and lateral radii:
Parameter ICE 3 Maglev Transrapid
Lateral Tilt 6,5° od. 160 mm 12°
Extremal Value 7,2° od. 180 mm 16°
Dissassembly Disposal
Special tools
Scrapping
Vehicles
Initial equipment
Training Trial Operations
Initial Operation
Investment Operation
Putting out of operation
Waste Disposal / Re-selling
Operations
Operational disturbance
Spares Inventory
Maintenance
Repair
Preparation
Work
Consumption parts
Spares
Special work tools
Energy
Induced costs
Disposal
Financial costs
Personel

90
Table 1: Maximum Lateral Tilt Minimum Horizontal Radius Design Speed ICE 3 Transrapid
Max. Side Acceleration 1,0 m/s² Passenger Transport 1,5 m/s²
Minimum Technical Radius 300 m 350 m 200 km/h 1.400 m 705 m 250 km/h 2.250 m 1.100 m 300 km/h 3.200 m 1.590 m 350 km/h - 2.160 m 400 km/h - 2.825 m 450 km/h - 3.580 m
Table 2: Horizontal Minimum Radii Wheel/Rail System ICE3 Maglev Transrapid
Design Speed Crest Sag Crest Sag
Max. Vertical Acceleration 0,5 m/s² 0,6 m/s² 0,6 m/s² 1,2 m/s²
200 km/h 6.400 m 5.200 m 5.150 m 2.600 m
300 km/h 14.400 m 11.700 m 11.600 m 5.790 m
330 km/h 17.400 m 14.200 m 14.000 m 7.000 m
400 km/h - - 20.600 m 10.300 m
450 km/h - - 26.000 m 13.000 m Table 3: Crest and Sag of the High Speed Systems
Guideway
In figure 3, the cross section of an ICE3 balastless track is illustrated and the typical track values are given.
Figure 3: Cross Section of High-Speed Railway System

91
With the Transrapid there are three guideway types that can be either elevated or at-grade using either steel, concrete or hybrid construction concepts for application. The different Transrapid guideway types are shown in cross section and longitudinal section with the relevant data in Figure 4 a-c.
At grade guideway Typ III
2,75 m
0,4 m6,19 m
24,76 m
1 m
12 m
Elevated guideway Typ II
Elevated guideway Typ I
49,536 m
2 m
25 m
2,5
– 10
m
< 3,
5 m
Figure 4 a – c: Transrapid Guideway Types Vehicle An ICE3 unit is composed of eight coaches with 415 seats plus 24 in the dining coach. The length of the Transrapid vehicle is variable between two sections with a total of 150 places to ten sections for 1060 passengers. The transport capacity of both rail systems is somewhat similar. In the LCC system cost comparison, one motor coach train with eight carriages of the existing ICE3 of the model series 403 and one motor coach train with five sections of the Transrapid 08 were examined.
92
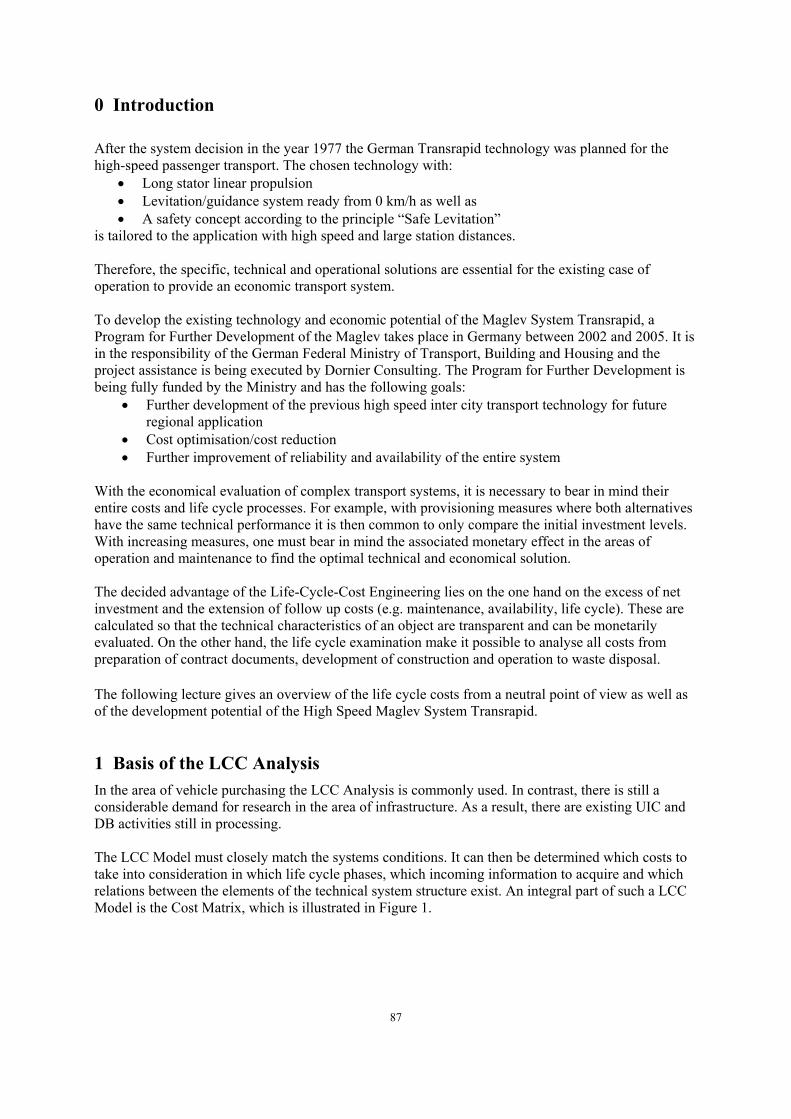
Table 4 shows the specific train parameters for the both high-speed systems Parameter Wheel/Rail High Speed Maglev System Carriages/Sections per Train 8 5 Seats (average) 415 (+ 24 in the dining car) 446 Operational speed 300 km/h 450 km/h Max. engine power 8000 KW Approx. 25000 KW Net weight of the train 409 t 247 t Weight / Seat Approx. 930 kg Approx. 550 kg Total length of train 200m 128,3 m Width 2,95 m 3,70 m Heigth 3,89 m 4,16 m Axel load 17 t (2,1 t/m) 2,2 t/m Table 4: Specific Train Parameters
Propulsion
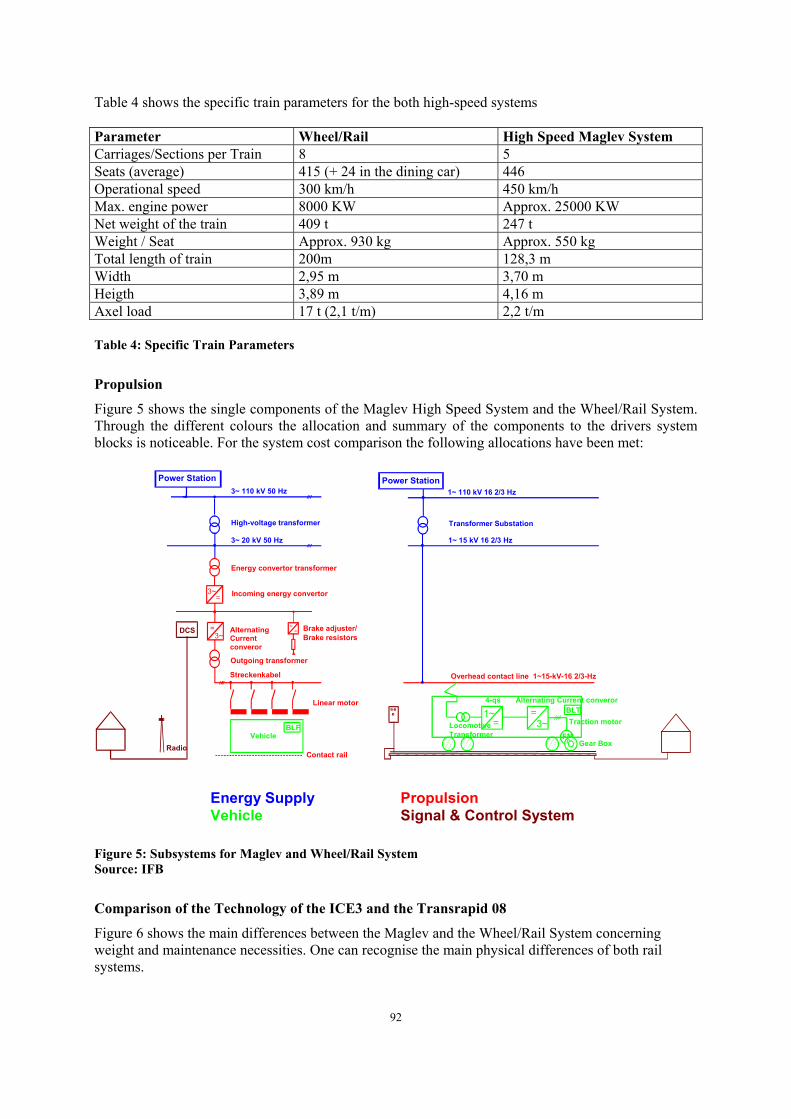
Figure 5 shows the single components of the Maglev High Speed System and the Wheel/Rail System. Through the different colours the allocation and summary of the components to the drivers system blocks is noticeable. For the system cost comparison the following allocations have been met:
Energy Supply Propulsion Vehicle Signal & Control System
= =
=3~
Vehicle
Streckenkabel
Brake adjuster/Brake resistors
Power Station 3~ 110 kV 50 Hz
3~ 20 kV 50 Hz
1~ 110 kV 16 2/3 Hz
1~ 15 kV 16 2/3 Hz
Overhead contact line 1~15-kV-16 2/3-Hz
3~ =
3~ =
Linear motor
Alternating Current converor
Incoming energy convertor
Transformer SubstationHigh-voltage transformer
Energy convertor transformer
Outgoing transformer
FM Locomotive Transformer
Alternating Current converor
Traction motor Gear Box
1~=
4-qs
Power Station
DCS
BLF BLT
Contact railRadio
Figure 5: Subsystems for Maglev and Wheel/Rail System Source: IFB
Comparison of the Technology of the ICE3 and the Transrapid 08
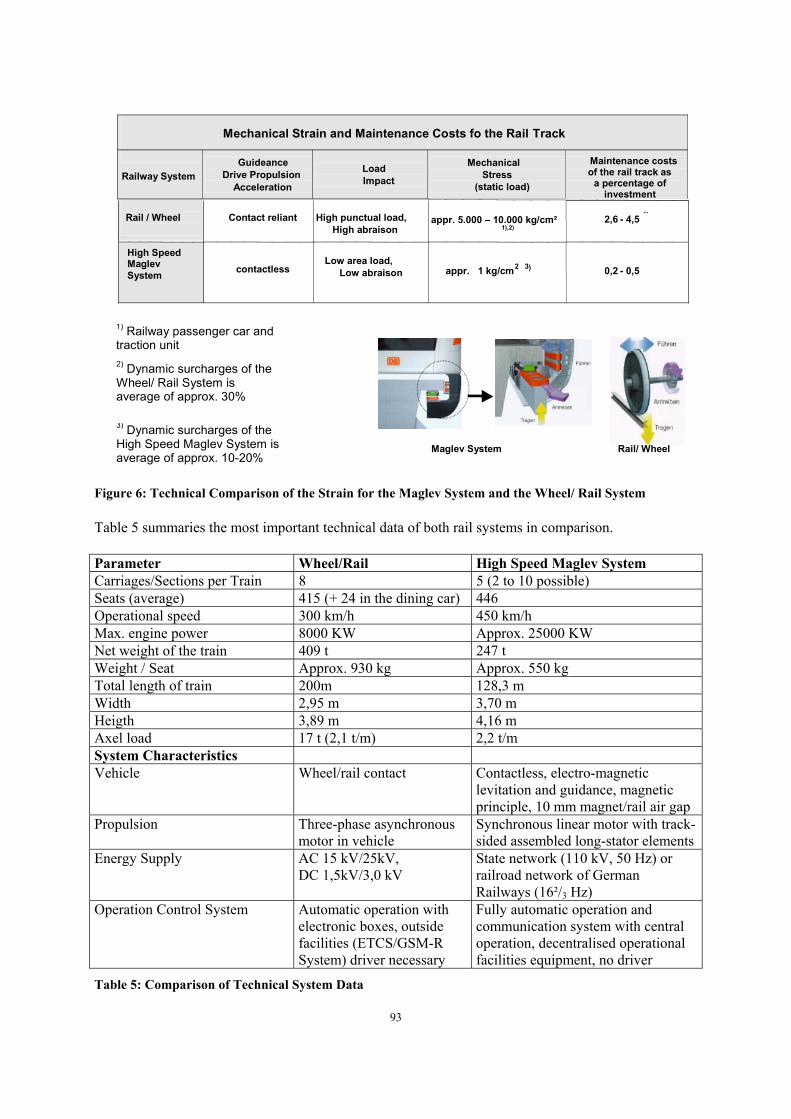
Figure 6 shows the main differences between the Maglev and the Wheel/Rail System concerning weight and maintenance necessities. One can recognise the main physical differences of both rail systems.
93
Maglev System Rail/ Wheel
Mechanical Strain and Maintenance Costs fo the Rail Track Railway System
Guideance Drive Propulsion
LoadImpact
MechanicalStress
(static load)
Maintenance costsof the rail track as
Rail / Wheel
Contact reliant High punctual load,High abraison
2,6 - 4,5 4)
contactless
Low area load,Low abraison appr. 1 kg/cm2 3)
0,2 - 0,5 5)
High Speed Maglev System
Acceleration a percentage of investment
appr. 5.000 – 10.000 kg/cm²1),2)
1) Railway passenger car and traction unit 2) Dynamic surcharges of the Wheel/ Rail System is average of approx. 30%
3) Dynamic surcharges of the High Speed Maglev System is average of approx. 10-20%
Figure 6: Technical Comparison of the Strain for the Maglev System and the Wheel/ Rail System Table 5 summaries the most important technical data of both rail systems in comparison. Parameter Wheel/Rail High Speed Maglev System Carriages/Sections per Train 8 5 (2 to 10 possible) Seats (average) 415 (+ 24 in the dining car) 446 Operational speed 300 km/h 450 km/h Max. engine power 8000 KW Approx. 25000 KW Net weight of the train 409 t 247 t Weight / Seat Approx. 930 kg Approx. 550 kg Total length of train 200m 128,3 m Width 2,95 m 3,70 m Heigth 3,89 m 4,16 m Axel load 17 t (2,1 t/m) 2,2 t/m System Characteristics Vehicle Wheel/rail contact Contactless, electro-magnetic
levitation and guidance, magnetic principle, 10 mm magnet/rail air gap
Propulsion Three-phase asynchronous motor in vehicle
Synchronous linear motor with track-sided assembled long-stator elements
Energy Supply AC 15 kV/25kV, DC 1,5kV/3,0 kV
State network (110 kV, 50 Hz) or railroad network of German Railways (16²/3 Hz)
Operation Control System Automatic operation with electronic boxes, outside facilities (ETCS/GSM-R System) driver necessary
Fully automatic operation and communication system with central operation, decentralised operational facilities equipment, no driver
Table 5: Comparison of Technical System Data

94
3 System Comparison The German Federal Ministry of Transport, Building and Housing has executed a LCC orientated cost comparison through Dornier Consulting together with the engineering companies IFB and DI between Wheel/Rail and Maglev with the help of the newest data material. The goal of the system cost comparison was the preparation of intercity transport. The aim of this method was to identify the costs in the life cycle phases of construction, initial operation, operation as well as maintenance and modernisation for the two new high speed systems in Germany, ICE3 and Transrapid 08. Additionally, further relevant evaluative aspects were examined such as environmental impact, transport capacity and other quality factors as well as the comparison between other means of transport. The system comparison on an LCC basis was to be implemented between two German cities by means of a 110 km long model line in uphill areas. To reach the best possible comparison the following operational assumptions were made:
Intercity transport without intermediate stops The trains turn at both end points The cycle during the main traffic times (from 5 till 20:00) takes 30 minutes and during other
times (from 20:00 till 1:00) 60 minutes. The boundary conditions of the track are as follows:
End points are the existing main stations The max. speed is not restricted on the free line The alignments are slightly different. The speed of the two systems is restricted on entering
city areas to 200 km/h (ICE3) and 300km/h (Transrapid) (because of noise emissions) For the entire alignment, a balastless track system Type Rheda was chosen for the ICE3. The Transrapid track consists of concrete guideway chosen because of lower maintenance costs. The travel dynamic running standards such as the operational system requirements of both systems, that arose from the alignments and operational concept are illustrated in the below table:
Wheel/Rail System ICE3 Maglev High Speed System Transrapid
Track Length 110,1 km 111,3 km Number of passovers 4 3 Number of switches 19 7 Max. Speed 300km/h 450 km/h Max. gradient 40°/oo 90°/oo
Max. acceleration 0,6 m/s² 0,8 m/s² Max. deceleration -0,5 m/s² -0,8 m/s² Number of trains 5
4
Seating capacity per train 415 (+ 24 in the dining carriage) 446 Journey time including time table reserves
32 mins. 21mins.
Time of circulation 120 mins. 90 mins. Trips per day (both directions) 70 70 Table 6: Technically Operational Characteristics Figure 7 shows the speed of the track course of the two systems in comparison with each other. One can notice the lower speed in city areas and the following acceleration and also the respective deceleration. The reductions in speed in the track course result from slopes, where the residual acceleration abilities don’t maintain a high speed.

95
The High Speed Maglev System reaches 300 km/h after 5 km. The ICE3 reaches this speed after 23 km.
0
50
100
150
200
250
300
350
400
450
500
0 20 40 60 80 100 120
Weg
Fahrprofil Transrapid
Fahrprofil ICE 3
km/h
kmLeipzig Dresden
Figure 7: Distance-Speed Curve On the basis of the above-illustrated running dynamic data, the secondary energy consumption were calculated. This arose from the energy demand for the supply of the systems and also the energy demand for the traction of the vehicle. The energy is calculated on the basis of the requirement of the vehicle and also the number of trips. All phases of a run are considered; acceleration, run with maximum speed and deceleration of given track profiles. Table 7 shows the results: ICE3 Transrapid Transrapid Journey time including timetable reserves
32 mins. 32 mins. 21 mins.
Design Speed
300 km/h 246 km/h 450 km/h
Interface Substation 15 kV Substation 20 kV Substation 20 kVTraction energy demand 62,2 GWh/a 44,1 GWh/a 89,6 GWh/a Other energy demand
6,2 GWh/a 13,2 GWh/a 13, 2 GWh/a
Table 7: Energy consumption of the rail systems The middle column was taken from a direct comparison of both train systems with the same running time. On the basis of faster acceleration, the operation speed of the Transrapid can be smaller than that of the ICE3 in order to achieve the same running time. The primary energy demand that is relevant for the comparison between different means of transport averages under the examination of the current power mix as 2.5 times the secondary needs.
running Profile Transrapid running profile ICE 3
Track length between main stations
Spee
d
96
4 Identification of the Quantity and Cost Frameworks The cost structure is used to identify and record all expenses of the transport system. They are fundamentally based on:
The technical system structure in the area of investment The functional structure in the areas of operational and maintenance costs.
The entire costs of a system can be identified by the quantity structure for investment (infrastructure, vehicles) and by the operational costs (maintenance, energy, personnel). The main costs blocks are summarised as: Investment costs
Purchasing of site Guideway Power supply Propulsion/feeder Operations control system Sound protection
Vehicle Costs Other Costs
Facilities. Indirect costs Planning costs
Considerably large influences of the quantity and cost determination are the line topography, the distance between stops, the operational programme and the design of the sub-systems. Therefore, the transferability of the results of the system comparison for a concrete line to another line is not possible. A track specific investigation is essential. The Transrapid stands at the beginning of its commercial use. The standards of quality and quantity of the transport offer are high because of the long-standing experience of the wheel/rail systems in manufacture and operation. This includes economical as well as technological aspects. Although the comprehensive experience of the wheel/rail is incorporated in the development of the Maglev System, it stands that the Maglev System is only at the beginning concerning it’s technological and economical development potential. For this purpose, the outstanding practical operational experience serves as a driving force behind further development. The Maglev System already possesses many advantages in the operation phase especially through the expected lower costs expenses for personnel and maintenance along with higher attractiveness of the transport offer. The same goes for the manufacturing and start-up phases. Starting points for this are the ongoing improvements of components and structures as well as the optimisation of manufacturing and initial operation processes. Furthermore, one of the cases of operation of the tailored design of the technical sub-system opened up further development potential. As the long-standing experience of the wheel/rail technology shows, this considerable development potential results from the realisation of further application projects. Therefore, it is especially important to organise permanent information feedback from operator to manufacturer. Guideway Therefore, the following cost reduction potentials can be seen with regard to manufacturing of the guideway:
• Guideway automatic production of the guideway elements and equipment parts

97
• Improved technology for the foundation and beam assembly • Application of the concrete slab at grade guideway
The goal of the development is the reduction of the investments in the Maglev guideway to a minimum of 20% of the existing level. Vehicle Compared with the vehicles of the high-speed wheel/rail technology, the investment for the Maglev vehicle remains clearly higher. On one hand, this is caused by the low number of vehicles that have up until now no economies of scale. On the other hand, the levitation/guidance system of the Maglev are still have yet higher investments costs due to numerous electronic components. In connection with these numerous effects, reduction of the potential investment of the Maglev vehicle should reach between 25% and 30%. Propulsion and Energy Supply As well as the vehicle, the propulsion and energy supply forms the main part of the investment of the operation system of the Maglev. Above all, the propulsion possesses a vast infrastructure with a large quantity of components due to its spacious allocation along the track. Potential exists here through structure and component optimisation (switch gear and converter, feeder procedure, long-stator partition, switch procedure). Independent from the case of operation, these are estimated in the medium term to be up to 25% of the current investment. The system of the external power supply over the contact rail causes higher investment and operational costs. A new contactless solution that reduces equipment costs is being worked on. Operation Control System The control technique of the Maglev is up to now an independently developed line from the railway technology. Potential is identified in the Application of hard and software components from the conventional railway technology in the magnitude of 25%. As a consequence the calculation of the investment costs was based on two cost frameworks
a) Existing specific unit-cost calculations based on the results of the regional application studies in Germany
b) Realization of the assumed costs reduction potentials specified for the various subsystems and their unit costs

98
In table 8 the total costs for both systems are illustrated: Cost Group Wheel/Rail High Speed Maglev System Space requirement 6% 4% Guideway/track 26% 50-59% Tunnel 8% 1% Bridge construction 13% 2% Guideway/track total 47% 53-62% Propulsion/feeder 2% 13-18% Power supply 3% 3.5-4% Operation control system 7% 4-6% Semi-total of infrastructure 65% 75-94% Stations, facilities 1% 1% Indirect costs 12% 7% Sound protection 7% 4% Planning costs 5% 5% Other costs 28% 20% Total sum of infrastructure costs 94% 95-114% Vehicle 6% 8-11% Total investment 100% 103-125% Table 8: Comparison of the Investment Costs of the Transport Systems The values for Maglev define interval within of that the highest likelihood for cost estimations is given. You can recognize that the Maglev system has a lower proportion of tunnels and bridges due to the more potential alignment parameters, but the guideway (at grade and elevated) and the propulsion system plus power supply with the motor mounted in the guideway are generally more expensive than for the railway system. Operational Costs The operational costs are broken down as follows:
Personnel costs (operation and facilities) The personnel costs include all the expenses for the operational and service personnel that are essential for the operation. Additionally to the personnel costs, there is a flat proposal rate for consumable materials (e.g. office supplies), which is 20% of the personnel costs. Five different personnel groups were considered depending on qualification specified cost ratios. These are specified and standardised after the areas of operations for both transport systems is decided.
Energy costs Maintenance costs Initial operation costs during implementation

99
Distribution costs, insurance and marketing are not included here as they are independent from this system comparison
Figure 8 shows the personnel demands of both systems in comparison for the specific line.
28 21
41
2
29
133
21
2
39
178
12 12
5252
0
20
40
60
80
100
120
140
160
180
200
Operation Management Train Personnel Station Personnel Cleaning
StationaryCleaningMobile
Administration Total
P A S S E G
ICE 3Transrapid
Figure 8: Comparison of Personnel Demands Depending on the assumptions that there is no driver necessary for the Maglev train and the number of train crew is equal to that of the wheel on rail system and taking into account that the vehicle fleet is less than that for the ICE rolling stock, the train personnel is only 55% of that for wheel on rail. In total the personnel sum is approx. 1/3 higher for the wheel on rail system. Energy Costs
The energy cost is determined from the own consumption of the equipment and facilities of the transport system (substation, power supply facilities, operation equipment, stations, centralised and decentralised operation control equipment) as well as from the traction requirement.
The traction demand is determined for each transport system by means of journey simulation per run and is projected through the operation programme. The associated energy consumption cost of the operation arise from the traction energy demands per train run and the specific energy price per kilowatt hour (see table 7)
The energy costs of the Maglev lie on the basis of higher design speed, although the specific value per seat kolometer is lower than for the ICE3 in a higher magnitude than for the railway system. With the same speed the energy cost of the Maglev is lower.

100
Maintenance Costs
Maintenance performance serves to restore operational status to defective components or conserve operational components and also includes servicing, inspection and re-conditioning. Maintenance costs arise from costs for preventative maintenance and for re-conditioning (corrective maintenance) with the inclusion of the necessary personnel and material costs.
The maintenance costs for infrastructure, equipment and vehicles includes the annual personnel and material expenses to the warranty of the operation.
Reliability, availability, maintainability and safety of the system components influences the maintenance directly and also the associated costs. All four areas influence each other.
The maintenance costs for infrastructure, equipment and vehicles are included in the yearly personnel and material expenses to the warranty of the operation. The costs are directly attached to the components in the quantity structure.
Figure 9 shows the comparison of the maintenance costs of both transport systems.
0 1 2 3 4 5 6 7
Propulsion Energy Supply
Feeder
Energy Supply
Operation Control System
Stations
Guideway
Vehicle
Total
M €/a
0 1 2 3 4 5 6 7 8 9 10 11 12 13 14
R/w Maintenance Costs
Maglev Maintenance Costs
Figure 9: Comparison of the Maintenance Costs
The maintenance expenses for the Transrapid vehicle and the guideway are visibly lower than the expenses of the ICE3 as no rail/wheel wear and tear occurs.
101
0
5
10
15
20
25
30
I n s
MSB
RS
Mai
nten
ance
Cos
ts
Ener
gy C
osts
Ope
ratio
nal M
ater
ial
Ope
ratio
nal P
erso
nnel
Tota
l
Mio
€
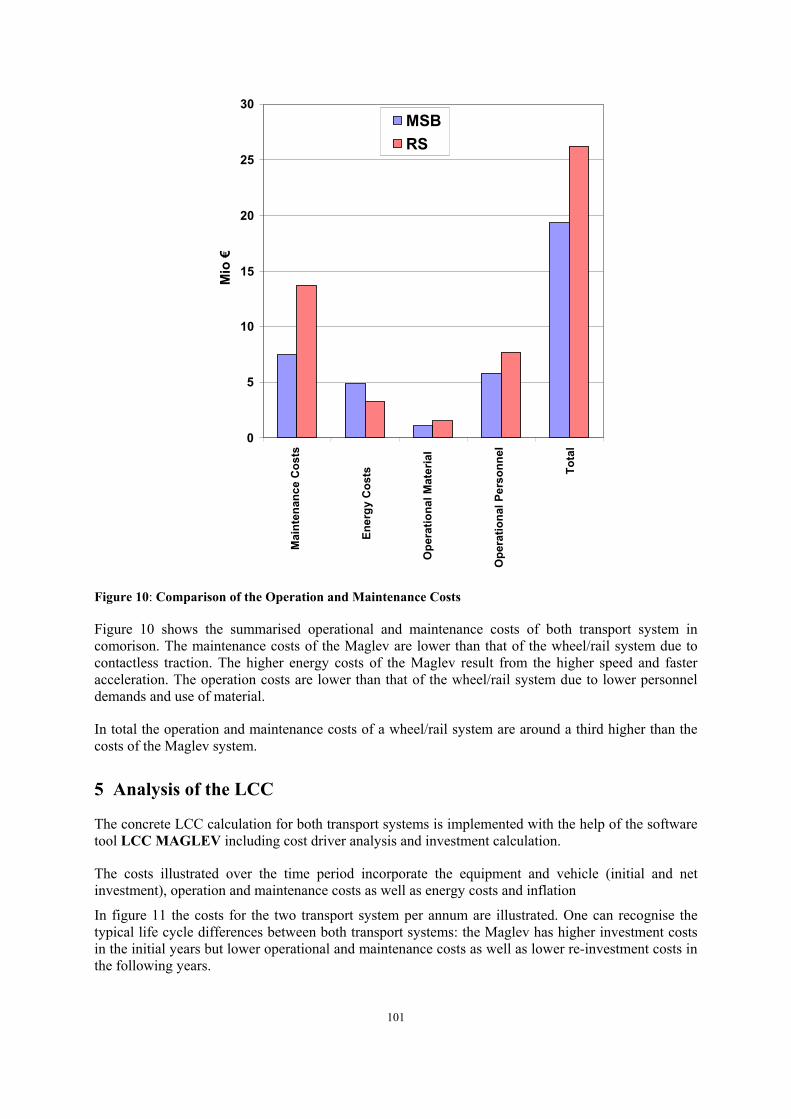
Figure 10: Comparison of the Operation and Maintenance Costs
Figure 10 shows the summarised operational and maintenance costs of both transport system in comorison. The maintenance costs of the Maglev are lower than that of the wheel/rail system due to contactless traction. The higher energy costs of the Maglev result from the higher speed and faster acceleration. The operation costs are lower than that of the wheel/rail system due to lower personnel demands and use of material.
In total the operation and maintenance costs of a wheel/rail system are around a third higher than the costs of the Maglev system.
5 Analysis of the LCC
The concrete LCC calculation for both transport systems is implemented with the help of the software tool LCC MAGLEV including cost driver analysis and investment calculation.
The costs illustrated over the time period incorporate the equipment and vehicle (initial and net investment), operation and maintenance costs as well as energy costs and inflation
In figure 11 the costs for the two transport system per annum are illustrated. One can recognise the typical life cycle differences between both transport systems: the Maglev has higher investment costs in the initial years but lower operational and maintenance costs as well as lower re-investment costs in the following years.

102
Maglev R/ W
Year
Figure 11: Time Pattern for Cost Trends
Figure 12 shows the cumulative totals of the entire system costs for the two transport systems as sum curves. The Maglev cost curve lies over the wheel on rail curve due to higher investments but the costs curves draw nearer to each other in time. This is especially due to the lower maintenance and operation costs of the Maglev system.
The break-even time point lies with this application after 30 years. This means that after this cut-off time the total cost of the Maglev are lower than for the wheel on rail system in spite of higher initial investment. The lower maintenance and operation costs of the Maglev balance out the higher investment costs over this period. Taking into account the expected results for potential cost reduction realised by the ongoing development programme, the LCC Model shows that the break-even point of the Maglev system can be achieved after 15 years.

103
-4 -2 0 2 4 6 8 10 12 14 16 18 20 22 24 26 28 30
Year
R/WMaglevMaglev_optimised
Figure 12: Total Cost Curve of the Maglev and Wheel on the Rail System
6 Summarised Evaluation The following statements summarise the before mentioned insights:
Potential Cost Savings of the High Speed Maglev System As a rule, the track related investment costs of the High Speed Maglev System are, on the basis of a first application, still in the magnitute of 20% of a comparable Wheel/Rail System. The cost saving potential of the Maglev is expected to draw nearer to that of a Wheel/Rail System in the course of further development because of economies of scale and advances in technology. A relatively large and fast saving potential is expected of the High Speed Maglev System due to little operational and series production experience of the Transrapid System in comparison with the railway system and also due to the arising expectations of technical advances along with the cost drivers of the sub systems. These available development opportunities and constructive improvements through experience in series operation seem to leave the gap of intensive savings with comparable transport systems relatively small.
High Speed Maglev System has Lower Costs than the Wheel/Rail System
The costs for the operation are on the basis of low personnel demands because of automatic operation, a quarter lower than that of the Wheel/Rail System. Due to higher operational speed, shorter turn around time and automatic operation, the High Speed Maglev System has higher energy costs. However, both have the same overall

104
transport performance with the Maglev System possessing definite lower operational costs and a smaller vehicle fleet.
High Speed Maglev System has Lower Maintenance expenses than the Wheel/Rail System On the basis of little wear and tear and related low maintenance, the maintenance costs of the High Speed Maglev System are less than half that of the Wheel/Rail System.
High Speed Maglev System has Lower Life Cycle Costs than the Wheel/Rail System
The life cycle examination shows the obvious lower costs for maintenance and operation, results in the expectations that the Maglev can be cheaper than a comparable Wheel/Rail System after several years, in spite of high initial investment costs.
Higher Income Achievable
On observation of the current specific revenue situation, where the traffic income is expected to be higher due to a shorter travelling time and high travel comfort, the application of the Maglev from an operational point of view is described as being minimumally comparable with the Wheel/Rail System.
Financial Advantages
From a financially evaluated point of view, the Maglev System has advantages despite higher initial investment cost. On the basis of lower operational and re-investment costs of the Maglev System along with moderate Return on Investment, Venture Capital from long term active investors can be obtained. Relative to the initial investment, the Maglev requires less than the Wheel/Rail System needs for financing.
Environmentally Compatible Operation
The Maglev System harms the environment to a lesser extent than other comparable transport systems. The Maglev has a smaller space requirements and lower energy consumption and causes lower CO2 emissions as well as lower noise emissions.
Existing Field of Operation
Up to a distance of 600 km the Maglev can achieve a shorter journey time than an aeroplane. Furthermore, capacitive advantages against air traffic also exist. Today, there are many areas in aviation that have arrived at their capacitive limits and cannot accommodate anymore which is possible with the High Speed Maglev System. For the large traffic streams a High Speed Maglev System incorporates the advantages from railway systems with regard to lower operational costs and total cost advantages with the shorter journey time of air traffic.
Marco-economical Advantages
The implementation of a Maglev System is affected by a model split of transport demand services, highly costly and lower environmentally compatible transport systems and for this reason is economical beneficial. From an industrial point of view, the transport technology of the Maglev secures more employment in high industrially technological areas. The effects on income, employment and technological spin-off of the first Maglev line in Bavaria are assumed to be around 100 thousand men years resulting in a benefit-cost ratio of about 3, which means that each Euro invested in the Maglev creates a macro-economical benefit of 3 Euros.

105
Reference List
1. Witt, Michael; Herzberg, Stefan: TRANSRAPID – Transport Technology for the Mobility of the future. Stech ‘03
2. Witt, Michael; Herzberg, Stefan:
Study on the Feasibility of Maglev Systems in Regional Transport in Bavaria and North Rhine-Westphalia. Maglev 2002
3. Dornier Consulting GmbH: LCC System Comparison under contract of the Federal Ministry of Transport, Buiding and Housing,
2003.