
Technical Assessment of the Operation of Coal & Gas Fired ... · Table 4 - Typical “Hot” start...
44
December 2014 Technical Assessment of the Operation of Coal & Gas Fired Plants DECC 286861A
-
Upload
vuonghuong -
Category
Documents
-
view
214 -
download
1
Transcript of Technical Assessment of the Operation of Coal & Gas Fired ... · Table 4 - Typical “Hot” start...

December 2014
Technical Assessment of the Operation of
Coal & Gas Fired Plants
DECC
286861A

Technical Assessment of theOperation of Coal & Gas Fired
Plants
286861A
Prepared forDECC
Prepared byParsons Brinckerhoff
Units 4 & 5Ferrybridge Business Park
FerrybridgeWest Yorkshire
WF11 8NA
01977 677664 www.pbworld.com

AUTHORISATION SHEET
Client: Department of Energy and Climate ChangeProject: 286861AAddress: 3 Whitehall Place, London, SW1A 2AW
PREPARED BYName: David LunnPosition: ConsultantDate: 20/6/14
AGREED BYName: David RobertsPosition: Group ManagerDate: 20/6/14
AUTHORISED FOR ISSUEName: Dave RobertsPosition: Group ManagerDate: 20/6/14
DISTRIBUTION
ACCEPTED BYName: John SpurgeonPosition: Assistant Head, Market Development, DECCDate: 25/11/2014
ACCEPTED BYName: Ben MarriottPosition: Senior Economist, Energy Economics and Analysis, DECCDate: 25/11/2014

Technical Assessment of the Operation of Coal &Gas Fired Plants
286861A Prepared by Parsons BrinckerhoffDecember 2014 for DECC
- 9 -
CONTENTSPage
List of Abbreviations 11
Executive Summary 13
1 INTRODUCTION 151.1 Structure of the Report 151.2 Scope of work 15
2 POWER MARKET ARRANGEMENTS AND PARAMETERS 162.1 Balancing Market 162.2 Synchronisation 162.3 Ramp Rates 162.4 Operating Regimes 17
3 PHYSICAL LIMITATIONS OF START TIMES 193.1 Thermal Fatigue/Rate of Temperature Rise 193.2 Coal Fired Plant 193.3 Combined Cycle Gas Turbine (CCGT) 193.4 Open Cycle Gas Turbine (OCGT) 20
4 GUIDE TO COAL PLANT FLEXIBILITY 214.1 Types of Coal Plant 214.2 Start-up - Process 224.3 Start-up - Types, Timings and Cost 25
5 GUIDE TO GAS PLANT FLEXIBILITY 275.1 Types of Gas Plant 275.2 CCGT Start-up - Process 31
6 MOTHBALLING/PRESERVATION 356.1 Short Term Preservation 366.2 Long Term Preservation 366.3 Miscellaneous Preservation Costs 366.4 Timescales 37
REPORT APPENDICES 39

Technical Assessment of the Operation of Coal & Gas FiredPlants
286861A_FINAL Prepared by Parsons BrinckerhoffDecember 2014 for DECC
- 10 -
CONTENTS OF TABLES
Table 1 – Indicative start up times .................................................................................................... 13Table 2 – Indicative mothball / reinstatement times .......................................................................... 14Table 3 – UK Coal fired power stations post 2016 ............................................................................ 22Table 4 - Typical “Hot” start Process for Coal Fired Unit ................................................................... 23Table 5 - Typical Shut-down Process for Coal Fired Unit .................................................................. 24Table 6 - Coal Plant Start Types ...................................................................................................... 25Table 7 - Coal Indicative Start up Times........................................................................................... 26Table 8 - CCGT Start Types ............................................................................................................ 27Table 9 - Existing CCGT Indicative Start up Times ........................................................................... 28Table 10 - Modern CGGT Indicative Start up Times ......................................................................... 29Table 11 - Future Large Frame OCGT Indicative Start up Times ...................................................... 30Table 12 - Small Frame OCGT Indicative Start up Times ................................................................. 30Table 13 - Aero Derivative Indicative Start up Times ........................................................................ 31Table 14 - Typical “Hot” start Process for CCGT Unit ....................................................................... 32Table 15 - Coal Plant Preservation Timescales ................................................................................ 37Table 16 - CCGT Preservation Timescales ...................................................................................... 38Table 17 - OCGT Preservation Timescales ...................................................................................... 38

Technical Assessment of the Operation of Coal &Gas Fired Plants
286861A Prepared by Parsons BrinckerhoffDecember 2014 for DECC
- 11 -
LIST OF ABBREVIATIONS
CCGT Combined Cycle Gas Turbine
CEM Continuous Emissions Monitoring
CO Carbon Monoxide
DECC Department of Energy & Climate Change
IED Industrial Emissions Directive
FGD Flue Gas Desulphurisation
FSNL Full speed no load
HRSG Heat Recovery Steam Generator
GW Giga Watt
GWh Giga Watt Hour
LCPD Large Combustion Plant Directive
MEL Maximum Export Limit
MSG Minimum Stable Generation
MW Megawatt
NGT National Grid Transco
NOx Oxides of Nitrogen
OCGT Open Cycle Gas Turbine
OEM Original Equipment Manufacturer
PSSR Pressure Systems Safety Regulations
SEL Stable Export Limit
SOP Stable Operating Point
STOR Short Term Operational Reserve
TEC Technical Export Capability
UK United Kingdom
VIGV Variable Inlet Guide Vane
Technical Assessment of the Operation of Coal &Gas Fired Plants
286861A_FINAL Prepared by Parsons BrinckerhoffDecember 2014 for DECC
- 13 -
EXECUTIVE SUMMARY
Introduction
This report describes the capability of four types of generating technologies to provide reservegeneration which can be delivered at short notice to balance any shortfalls in grid capacity:-
· Coal fired (500MW and 660MW)· Combined cycle gas turbine (160MW – 300MW)· Open cycle gas turbine – large scale industrial (125MW – 180MW)· Open cycle gas turbine – aero derivative (60MW – 100MW)
The ability to provide reserve generation capacity is a function of the start times for each type of planttechnology
Start Up Times
The indicative time for start-up is made up of two phases namely:-
· notice to deviate from zero and
· synchronisation to full load.
The Notice to Deviate from Zero (NDZ) time is a term used by the grid operator which covers the priornotice that a power plant requires, to be able to start up the plant to the point of synchronisation. Thiscomprises preparation of the unit for starting by adjusting the boiler drum water level, purging thefurnace of any explosive gases, lighting up the burners to commence raising pressure, pressureraising, temperature matching, blowdown of wet steam to drains and running the turbine to speed.This activity is the same for both coal and gas fired power plant
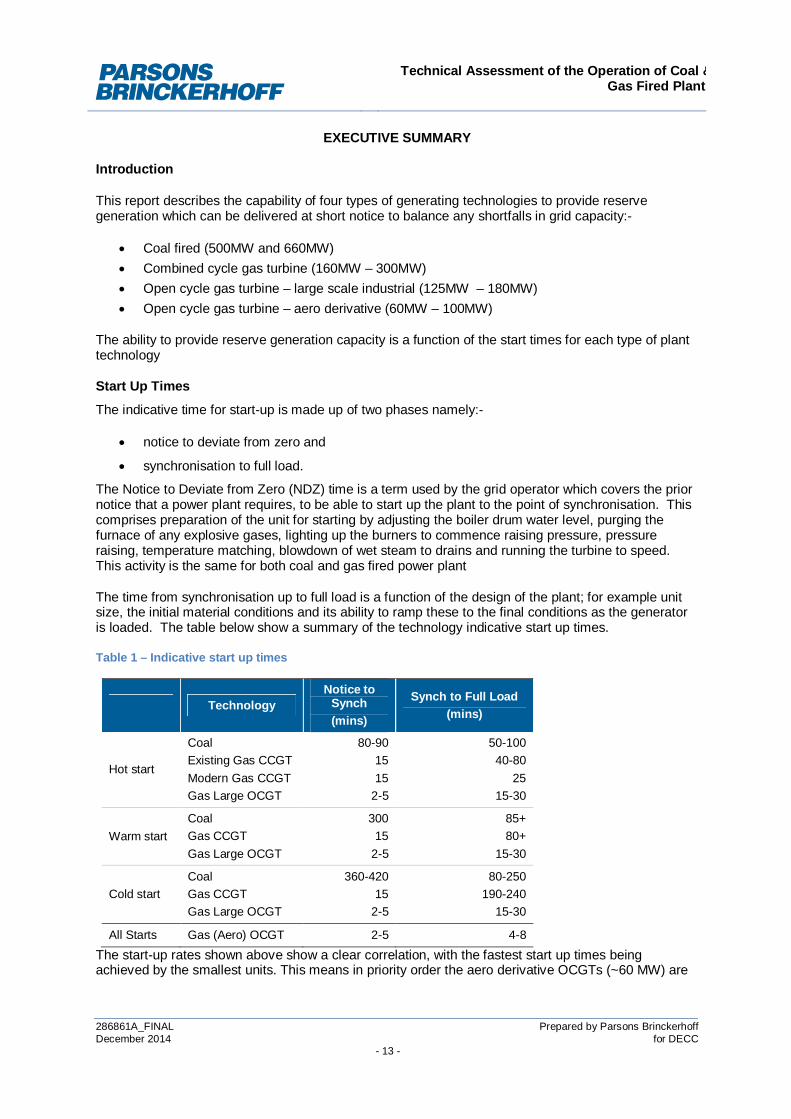
The time from synchronisation up to full load is a function of the design of the plant; for example unitsize, the initial material conditions and its ability to ramp these to the final conditions as the generatoris loaded. The table below show a summary of the technology indicative start up times.
Table 1 – Indicative start up times
TechnologyNotice to
Synch(mins)
Synch to Full Load(mins)
Hot start
CoalExisting Gas CCGTModern Gas CCGTGas Large OCGT
80-901515
2-5
50-10040-80
2515-30
Warm startCoalGas CCGTGas Large OCGT
30015
2-5
85+80+
15-30
Cold startCoalGas CCGTGas Large OCGT
360-42015
2-5
80-250190-240
15-30
All Starts Gas (Aero) OCGT 2-5 4-8
The start-up rates shown above show a clear correlation, with the fastest start up times beingachieved by the smallest units. This means in priority order the aero derivative OCGTs (~60 MW) are

Technical Assessment of the Operation of Coal &Gas Fired Plants
286861A_FINAL Prepared by Parsons BrinckerhoffDecember 2014 for DECC
- 14 -
capable of the fastest start up times followed by the CCGTs (300 MW) and the coal fired units(500 MW). The times have been derived from our knowledge of the plant technologies and evidenceseen in the UK power trading market. To that extent, the indicative duration shown reflects both thetechnical parameters and the commercial offer of the plant and these can differ as the plant optimisesits market position from day to day. However in a competitive market it is likely that the durations willalign.
Mothballing/Preservation
In the context of a power station the words mothballing or preservation applies to those techniqueswhich could be applied to the plant in order to prevent or reduce deterioration when out of service.
There are two options for preservation, namely short term and long term preservation. The techniquesused for each option differ significantly, together with the timescales required to successfully mothballand reinstate the plant back to an operational condition. These returns to service timescales can alsovary considerably between technologies (Coal, CCGT or OCGT).
No allowance has been included in Long Term for re-recruitment of staff and training or for majoroverhaul (if required) prior to return to service. These additional durations have been included inSection 6.4 of this report and should be added (where applicable) to the plant reinstatement duration.
The table below shows a summary of the durations to mothball/reinstate for a technology type.
Table 2 – Indicative mothball / reinstatement times
Activity Duration (days)
Short Term CoalGas CCGTGas OCGT
Mothball/ReinstateMothball/ReinstateMothball/Reinstate
421
Long term CoalGas CCGTGas OCGT
Mothball/ReinstateMothball/ReinstateMothball/Reinstate
42*30*5
* The durations specified above include time required to mothball and reinstate the plant back into service only.
Within this report no indicative costs have been included for two shift operation or plantmothballing/reinstatement. These costs are outside the scope of work for this report but will need tobe considered at a future time in order to establish the optimum technical/commercial fit whendeciding on which strategy should be adopted to provide reserve generation which can be deliveredat short notice to balance any shortfalls in grid capacity.
Technical Assessment of the Operation of Coal &Gas Fired Plants
286861A_FINAL Prepared by Parsons BrinckerhoffDecember 2014 for DECC
- 15 -
1 INTRODUCTION
Parsons Brinckerhoff has been asked by the Department of Energy and ClimateChange (DECC) to undertake work in relation to gas and coal power plant technologyand the associated modelling assumptions. This report considers specifically theachievable start up times which could be applied to existing coal and gas fired powerplants and expected new CCGT and OCGT designs in order to provide reservegeneration which can be delivered at short notice to balance any shortfalls in gridcapacity.
1.1 Structure of the Report
Section 2 describes the power market arrangements and parameters applicable togenerators providing reserve generation capability.
Section 3 of this report describes the physical limitations in starting up a power plantto provide a repeatable and reliable return to service without causing any long termdamage and premature ageing.
Section 4 describes the start-up times and factors that affect the flexibility of a coalfired power station.
Section 5 describes the start-up times and factors that affect the flexibility of a CCGTand Open Cycle Gas Turbine (OCGT).
Section 6 describes the mothballing process and gives indicative times to place theplant into a state of preservation and to return the plant back into service.
1.2 Scope of work
The aim of this report is to describe the capability of the three types of generatingtechnologies to provide reserve generation which can be delivered at short notice tobalance any shortfalls in grid capacity.
The indicative time for start-up is made up of two phases namely:-
· notice to deviate from zero and
· synchronisation to full load.
This report does not include consideration of the costs associated with:
· Retaining the generating unit to be made available as requested (to include therange of fixed costs e.g. staffing, maintenance, insurance, use of system chargesand rates).
· Holding the generating units in a state of readiness to be able to respond (toinclude the range of fixed costs above and fuel required to keep the plant in astate where it could move to synchronisation quickly.
· Operating the synchronised unit at low load in order that it can increase outputimmediately (to include the range of fixed costs above and fuel required to keepthe unit generating above Minimum Stable Generation).
Technical Assessment of the Operation of Coal &Gas Fired Plants
286861A_FINAL Prepared by Parsons BrinckerhoffDecember 2014 for DECC
- 16 -
2 POWER MARKET ARRANGEMENTS AND PARAMETERS
2.1 Balancing Market
The UK has moved away from the pooling and central despatch arrangement thatwas set up on privatisation and implemented a system based on bi-lateral tradingbetween generators, suppliers, traders and customers. The parties contract witheach other for power based on a rolling half hour basis with generators thendespatching their plant themselves. Any imbalance between the parties’ contractualpositions and the actual physical flows are determined and the volume settled at thesystem buy or system sell prices.
National Grid is responsible for balancing the system in real time, maintainingfrequency by matching supply and demand. The Balancing Mechanism has beenestablished by which parties can submit:
· Offers - to increase generation / decrease demand.
· Bids - to decrease generation / increase demand.
Generators are required to submit their availability and plant parameters and arerewarded for their activities in the balancing market by the prevailing system prices.
2.2 Synchronisation
The UK electricity grid system’s target frequency is set at 50 Hz with small variationsaround that level depending on the balance of supply and demand. All machinesconnected to the grid are held at the system frequency and National Grid balancesthe system frequency by calling for generators to increase or decrease the powersupplied in response to fluctuating demand.
Synchronisation is taken to be the point at which the individual generating unit isconnected to the national grid system. At the time the switch is closed andconnection made, the frequency of the generator has to be synchronous to that of thegrid.
2.3 Ramp Rates
The ramp rates define the rate (in MW per minute) at which units can be brought upand down the load range once they are synchronised to the system. The individualgenerating units can have varying characteristics which require different operatingtechniques and therefore different plant parameters. Each generator discloses itsramp rates to assist the system operator in determining which generating units can becalled to respond to an impending imbalance on the system.
In addition generators can use the plant parameters to manage their plant’s exposureto the market and submit attractive or prohibitive rates accordingly. This allows themto protect plant which they would not wish to run in the short market unless it wasamply rewarded for the risk.
Technical Assessment of the Operation of Coal &Gas Fired Plants
286861A_FINAL Prepared by Parsons BrinckerhoffDecember 2014 for DECC
- 17 -
2.3.1 Ramp Up
The Run-Up Rate Export shows the rate(s) of increase in active power production fora particular unit which is exporting power within a particular range. There can be upto three rates for any unit allowing the generator to give a profile of production overthe run up period including two “elbow” points where the rate can be changed. This isto enable a unit that is starting up to match its technical requirements with that of thegrid operator.
2.3.2 Ramp Down
The Run-Down Rate Export expresses the rate(s) of decrease in active powerproduction for a particular unit which is exporting power within a particular range.There can be up to three rates for any unit allowing the generator to give a profile ofproduction over the run down period including two “elbow” points where the rate canbe changed. This is to enable a unit that is shutting down, to match its technicalrequirements with that of the grid operator.
2.4 Operating Regimes
2.4.1 Base load
All the 500 MW Coal plant currently operating was designed and built in the 1960sand 70s to provide base and near full load, operation 24 hours a day across the year.
Combined Cycle Gas Turbine plants constructed since the 1990s were similarlydesigned and built to provide a base load regime, e.g. 7,980 operating hours with asmall number of annual starts, typically <15 (5 hot starts, 4 warm starts, 3 cold starts,and 2 trips).
Plant adopting this base load regime not only provides the highest generated output,but is also able to run at the higher levels of efficiency and to manage the plantdamage caused by variations in temperature and pressures associated with startsand changes in loading.
2.4.2 Two Shifting
Plants which come off load overnight on a regular basis as demand falls are said to“two-shift”. They are required to come on load around 05:00hours for the morningpeak, stay synchronised on the system (often at part load) during the day and areready to respond to the higher evening peak before coming off load around 22:00hrs.
For CCGT plant two shift operation is around 3,875 operating hours with a highnumber of annual starts, typically, 200-250 (200 hot starts, 0 warm starts, 50 coldstarts, and 4 trips.
Technical Assessment of the Operation of Coal &Gas Fired Plants
286861A_FINAL Prepared by Parsons BrinckerhoffDecember 2014 for DECC
- 18 -
2.4.3 Coal Fired
Until recently and since the world price of coal has fallen relative to gas, most coalplants had been operating flexibly and with some incurring circa 200 starts per annumas they came off load overnight and across the weekends in response to the demandprofile.
In the past the smaller generators below 500 MW had offered themselves to themarket with double two-shift capability, looking to take advantage of higher pricesacross the peaks, coming off load during the day. This regime has been undertakenby some 500 MW units in the past but operators generally have looked to avoid thepotential plant damage associated with frequent variations in metal temperatures.
2.4.4 Gas Fired - CCGT
As gas turbine technology has developed in the last 25 years, efficiency has improvedmarkedly from circa 49 per cent in 1990 (e.g. Killingholme A) to circa 57 per cent ofmore recent projects (e.g. Carrington). Consequently those plants with lowerefficiencies have been less able to compete and moved away from base load, throughtwo shifting and, in the face of recent low coal prices, had to consider runningintermittently to cover peaks only. Certain plants subsequently have been positionedto work in the Short Term Operating Reserve (STOR) capacity market or have beentaken into mothballing for short or longer periods until their market position improves(e.g. Keadby in 12 month storage).
2.4.5 Gas Fired - OCGT
With much lower efficiency and burning light fuel oil or natural gas these plants wouldnot compete in the power market for long duration runs. However theirresponsiveness gives them an advantage over other technologies and they can bebrought on and off load very quickly for short, infrequent periods in the year toaddress system imbalances at a national or local level (e.g. Indian Queens).

Technical Assessment of the Operation of Coal &Gas Fired Plants
286861A_FINAL Prepared by Parsons BrinckerhoffDecember 2014 for DECC
- 19 -
3 PHYSICAL LIMITATIONS OF START TIMES
3.1 Thermal Fatigue/Rate of Temperature Rise
Whilst the time taken to start a unit on a conventional power station is made up ofmultiple operational activities and plant limitations, the most time critical activity is theplant limitation caused by thermal fatigue.
In the context of a power station, thermal fatigue is defined as the gradualdeterioration of a material by alternate heating and cooling. This type of thermalfatigue may also be classified as low cycle fatigue due to the low frequency of cycles,typically one or two per day. Thermal fatigue cracks can usually start to initiate in lessthan 200,000 cycles.
At the design stage of a power station, detailed attention is given to the selection ofmaterial properties and wall thickness of high temperature components, to optimisetemperature ramp rates during start up. Typical thick walled components such asboiler/Heat Recovery Steam Generator (HRSG) drums and headers, main steampipework and steam turbine, valves, steam chests and cylinders are limited by thematerial yield point. Prior to the yield point the material will deform elastically and willreturn to its original shape when the applied stress is removed. Once the yield pointis passed (which can be achieved by overheating the component using excessiverapid ramp rates), some fraction of the deformation will be permanent and non-reversible. It is therefore essential not to exceed the design rate of temperature rise,in order to prevent the premature onset of thermal fatigue cracking and to achieve therequired component design life.
Modern control systems are designed to prevent critical “thick walled” componentsfrom being heated too quickly by setting limits on rates of temperature rise andmaximum temperature allowed. There are also limits on the rate of loading on theelectrical generators, since excessive electrical loading can generate high thermaltemperatures in the copper core of the rotor and stator.
3.2 Coal Fired Plant
Designed in the 1960’s and 70’s, the materials used in large coal fired power plantscan be classed as “basic” by today’s standards. The methods used to increase thepower output from the earlier 120 MW units to the existing 500 MW units was to“scale up” the design. This involved increasing the thickness of some critical boilerand steam turbine components, thus increasing the start-up time.
3.3 Combined Cycle Gas Turbine (CCGT)
The majority of the first generation CCGT plants were designed in the late 1990s orearly 2000’s. Based on aero derivative turbines (similar to aircraft engines) thematerials used in the gas turbines of CCGTs are highly developed alloys withsignificantly thinner cross-sections than used in a steam turbine. The average size ofa class F gas turbine is typically 300 MW; this discharges hot gas through a HRSG,producing steam for a nominal 150 MW steam turbine. The component size of theHRSG and steam turbine is therefore smaller having been based on 150 MWcapacity. An improvement in materials over the last 30 years has allowed some boilerand steam turbine components to be designed with reduced wall thickness.

Technical Assessment of the Operation of Coal &Gas Fired Plants
286861A_FINAL Prepared by Parsons BrinckerhoffDecember 2014 for DECC
- 20 -
3.4 Open Cycle Gas Turbine (OCGT)
Traditionally OCGTs have been used to provide a black start capability (with somegrid/frequency response) and were typically sized <40 MW. Based on aeroderivatives the gas turbine components are highly developed alloys of thin section,being capable of rapid start up. Since there is no HRSG or steam turbine installed inan OCGT, the total start up time is dependent only upon the gas turbine.
Technical Assessment of the Operation of Coal &Gas Fired Plants
286861A_FINAL Prepared by Parsons BrinckerhoffDecember 2014 for DECC
- 21 -
4 GUIDE TO COAL PLANT FLEXIBILITY
4.1 Types of Coal Plant
Coal fired power plant in the UK now comprises a range of 500 MW and 660MW unitsdesigned and built predominantly in the 1960s and 1970’s for a nominal 25 yearsdesign life, equivalent to 250,000 operating hours. The original specification for theselarge generating sets anticipated predominantly base load operation with few starts orrequirements for flexible loading while in service. As the power market hasdeveloped, there has been an increasing need for coal fired generating units tooperate more flexibly in response to competitive pressures from alternative fuels andrenewables and in order to target periods of higher prices.
The flexible generation profile has placed more demands on the operators andstresses on the plant itself. The original operating life assumed to be 25-30 years hasbeen extended by a programme of continuing engineering assessments andsubstantial repair and replacement of life expired components.
A number of coal plant units have “opted out” of the Large Combustion Plant Directive(LCPD) which required improved emissions controls. These units have either closedalready, converted to other fuels such as biomass or are scheduled to close before31 December 2015. In addition, the implementation of the Industrial EmissionsDirective (IED) in January 2016 will require the remaining plants to meet new morestringent emission limits with respect to
· oxides of nitrogen (<200mg/m3),
· sulphur dioxide (<200mg/m3)
· particulates (<20mg/m3)
In order to meet the new IED limits, owners must consider major plant upgradeinvestments or conversion to biomass or contemplate opting out of the new regime.This latter option will allow them to generate only for a further 17,500 hours across allunits (based on usage of the plant stack(s)) before closing by the end of 2023 at thelatest.
It is not known at this stage how many coal fired plants will ultimately elect to complywith the emissions requirements and therefore how many will be in existence in themid-2020s. The following table shows the plants that are understood to remain inoperation using coal after January 2016 and therefore will possibly be available post2023:

Technical Assessment of the Operation of Coal &Gas Fired Plants
286861A_FINAL Prepared by Parsons BrinckerhoffDecember 2014 for DECC
- 22 -
Table 3 – UK Coal fired power stations post 2016
PlantUnitsNo.
CapacityMW
Aberthaw 3 1 665
Cottam 4 2 000
Drax 4 2 580
Eggborough 4 1 960
Ferrybridge 2 1 000
Fiddlers Ferry 4 1 987
Longannet 4 2 304
Ratcliffe 4 2 000
Rugeley 2 1 026
West Burton 4 2 000
TOTAL 35 18 522
Note Drax comprises 660 MW and Longannet 600 MW units
4.2 Start-up - Process
4.2.1 Operating a 500 MW generating unit is a large scale industrial process. The unitcomprises a boiler circa 50 metres tall producing high pressure steam delivered torotate a 30 metre long turbine train of some 200 tonnes at 3000 revolutions perminute. In addition there is a wide range of auxiliary equipment required to deliverpulverised coal to the boiler for combustion, to supply water for use in the boiler or thecooling systems and to transport electrical power to and from the unit.
Therefore the 500 MW generating sets use an established and relatively generic startup sequence which must be followed. This is designed to protect plant integrity butprimarily to ensure safety from the inherent risks associated with a process whichentails combustion of significant volumes of explosive substances and plant operatingat high pressures and temperatures.
4.2.2 The duration of a start-up is dependent on the physical state of the unit and inparticular the existing energy stored in the plant in terms of the temperature andpressures. Plant which has more recently been in operation will contain more energyand can be returned to service more quickly. Starts are therefore categorised as“hot”, “warm” and “cold” and defined in Section 4.3.
4.2.3 Start-up times comprise two phases namely:
· Pre-synchronisation
The pre-synchronisation phase duration varies depending on whether the unit is beingbrought into service from a “hot” or “cold” start (see definition in Section 4.3) but in allcases the unit start-up consumes large quantities of energy (gas and electricity)before the plant is able to generate power and export from the site.

Technical Assessment of the Operation of Coal &Gas Fired Plants
286861A_FINAL Prepared by Parsons BrinckerhoffDecember 2014 for DECC
- 23 -
· Post synchronisation
Generating sets are brought on (synchronised) to the national grid system at 50 Hzand at the point where the steam turbine rotor is spinning at 3000 revolutions perminute. At this point the turbine is at the Fast Speed No Load (FSNL) point and whilstenergy is being applied to rotate the turbine (no load heat requirement), there is nogeneration of electrical power.
Once synchronised, additional energy in the form of steam is applied to the turbineand the plant begins its ramp from zero MWh to full load.
4.2.4 A typical “hot” start up process for a 500 MW generating set requires the followingsteps:
Table 4 - Typical “Hot” start Process for Coal Fired Unit
Task
Adjust drum water level, bring Induced Draft (ID) and Forced Draft (FD) fans into service inorder to purge the furnace of any potentially flammable gas which could otherwise result inexplosion on ignition.
Ignite oil burners to start warming through the furnace, establish circulation and providestability since coal will not ignite on its own.
Start the first coal mill and deliver pulverised fuel to the boiler for ignition and to begin theprocess of raising steam.
Blow down steam to drains, until desired degree of superheat is reached to match the steampipework and turbine inlet conditions. Open boiler stop bypass valves to commence warmingsteam pipework, with pipework drains open. When steam pipework is up to temperaturecommence opening the turbine valves to raise temperature with drains open. Finally steam isadmitted into the turbine for running the machine. This then progressively increasestemperature and pressure and thereby avoids potentially damaging differentials.
The first mill is used to provide the steam required to move the turbine rotors to 3000revolutions per minute prior to synchronising on to the Grid system. This point before anyelectrical load is produced is known as FSNL.
The second and third coal mills are brought into service as the output from the turbine isincreased to over 200 MW.
As the mills are established the oil burners become less necessary to support combustion andcan be progressively shutdown. In addition, the steam feed pumps and direct contact heatersare brought fully into service. The steam feed pumps are powered from the boiler and takeover from electric pumps (fed from the station supply) used at start up.
When the furnace is considered stable enough, then the last oil burner is taken out, allowingcoal to support combustion. This requires a minimum number of mills in service beforestabilising oil can be shut off (generally 3 for a 5 mill station and 4 for a 6 mill station).
Minimum Stable Generation (MSG) is typically around 280 MW and will be reached when theboiler combustion is stabilised, the main boiler feed pump is established and the oil can beshut off.
Once the oil burners are no longer required, combustion will remain steady as long as loadremains above MSG. The boiler output can then be increased and decreased within anallowable range by varying the quantity of fuel delivered by the full range of up to six mills.
Once the boiler is fully heated after approximately one hour of further operation, theminimum “stable operating point” (SOP) may at some sites be lower than the originalMSG from the start-up sequence (see discussion of shut-down below).
Technical Assessment of the Operation of Coal &Gas Fired Plants
286861A_FINAL Prepared by Parsons BrinckerhoffDecember 2014 for DECC
- 24 -
4.2.5 FGD Plant
For boilers with flue gas desulphurisation (FGD) in place, the FGD equipment isinitially kept offline during start-up, to avoid damage to the absorber linings and oilcontamination of the gypsum by-product. At a point at or close to MSG the FGDdampers operate to route the flue gases through the FGD. This point is specified inoperational guidance, as it is important that time is allowed for the FGD process tostabilise at a lower load before progressing to full load. The exact point of damperoperation may vary from start to start, depending on operational factors.
4.2.6 “Cold” starts after the unit has been out of service for a longer period require aprolonged start up process with steps of the “hot and warm start” processes extendedto safeguard the integrity of the plant and mitigate potential plant damage frommechanical processes such as creep and fatigue (see later).
Whereas a hot start may require oil burners in service for only 1-2 hours, a completelycold start, e.g. after returning from an outage, may require the boiler to be running onoil burners alone for pressure raising for several hours.
4.2.7 Shut down process for the unit is based on the following steps:
Table 5 - Typical Shut-down Process for Coal Fired Unit
Task
Individual mills are shut down and the turbine output allowed to reduce as the boilerpressure falls. In conjunction some oil burners may be commissioned to maintain safe andstable combustion.
Fuel input from the last 3-4 mills is reduced and the unit output falls below SOP.
Mill coal feeders are tripped and mills allowed to mill off the coal they contain. As the millsrun short of coal, combustion becomes erratic and the oil burners are essential to keep thefurnace alight.
Once the coal has milled off the oil burners are left in for a few minutes to ensure that noexplosive coal mixtures are present and then the oil burners are shut down.
Reduce load on steam turbine to zero and desynchronise for the grid.
Check rundown of steam turbine to slow speed machine barring to allow for cooling.
Open all steam turbine and non-boiler main steam pipework drains.
Finally the FD and then the ID fans are shut down and the boiler boxed in by closingdampers to prevent the chimney suction drawing air through the boiler and cooling it.
The above actions particularly below the SOP are carried out quickly to ensure thelarge section components are not unnecessarily cooled so as to retain energy.
When the unit output falls below SOP the boiler is usually committed to shut-down.SOP is generally equivalent to the value of minimum “Stable Export Limit” (SEL)which is declared to the grid operator from time to time. However SEL may be variedrelatively frequently, due to commercial considerations; it is more appropriate tospecify SOP separately, although the values will usually be close or identical.
Technical Assessment of the Operation of Coal &Gas Fired Plants
286861A_FINAL Prepared by Parsons BrinckerhoffDecember 2014 for DECC
- 25 -
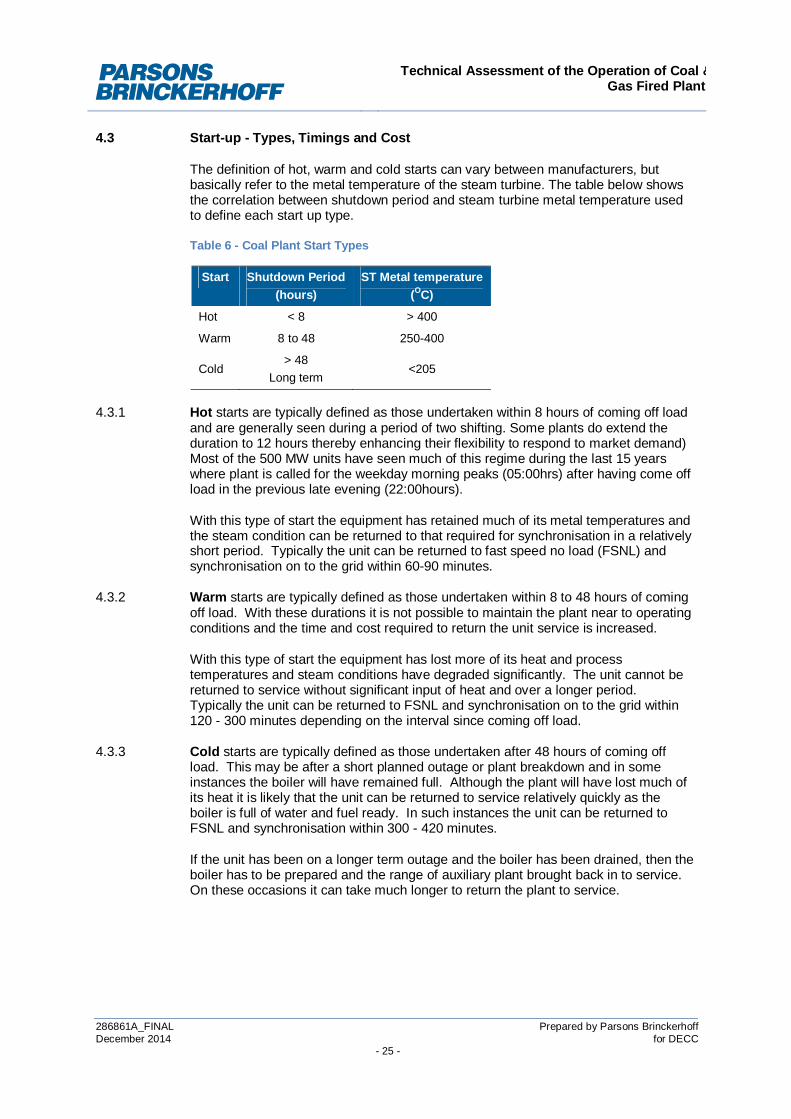
4.3 Start-up - Types, Timings and Cost
The definition of hot, warm and cold starts can vary between manufacturers, butbasically refer to the metal temperature of the steam turbine. The table below showsthe correlation between shutdown period and steam turbine metal temperature usedto define each start up type.
Table 6 - Coal Plant Start Types
Start Shutdown Period(hours)
ST Metal temperature(OC)
Hot < 8 > 400
Warm 8 to 48 250-400
Cold> 48
Long term<205
4.3.1 Hot starts are typically defined as those undertaken within 8 hours of coming off loadand are generally seen during a period of two shifting. Some plants do extend theduration to 12 hours thereby enhancing their flexibility to respond to market demand)Most of the 500 MW units have seen much of this regime during the last 15 yearswhere plant is called for the weekday morning peaks (05:00hrs) after having come offload in the previous late evening (22:00hours).
With this type of start the equipment has retained much of its metal temperatures andthe steam condition can be returned to that required for synchronisation in a relativelyshort period. Typically the unit can be returned to fast speed no load (FSNL) andsynchronisation on to the grid within 60-90 minutes.
4.3.2 Warm starts are typically defined as those undertaken within 8 to 48 hours of comingoff load. With these durations it is not possible to maintain the plant near to operatingconditions and the time and cost required to return the unit service is increased.
With this type of start the equipment has lost more of its heat and processtemperatures and steam conditions have degraded significantly. The unit cannot bereturned to service without significant input of heat and over a longer period.Typically the unit can be returned to FSNL and synchronisation on to the grid within120 - 300 minutes depending on the interval since coming off load.
4.3.3 Cold starts are typically defined as those undertaken after 48 hours of coming offload. This may be after a short planned outage or plant breakdown and in someinstances the boiler will have remained full. Although the plant will have lost much ofits heat it is likely that the unit can be returned to service relatively quickly as theboiler is full of water and fuel ready. In such instances the unit can be returned toFSNL and synchronisation within 300 - 420 minutes.
If the unit has been on a longer term outage and the boiler has been drained, then theboiler has to be prepared and the range of auxiliary plant brought back in to service.On these occasions it can take much longer to return the plant to service.

Technical Assessment of the Operation of Coal &Gas Fired Plants
286861A_FINAL Prepared by Parsons BrinckerhoffDecember 2014 for DECC
- 26 -
4.3.4 Typically once a hot coal unit is synchronised, a block load of an immediate ~50 MWis applied to the machine and, on hot starts, followed by a loading rate of around10 MW per minute thereafter. In the case of warm and cold starts a moreconservative ramp rate is applied with no block load depending on turbine metaltemperatures. This would entail ramping at circa 1-1.5 MW per minute up to around130 MW with a subsequent increase to circa 5 MW per minute up to full load.
The following table summarises starts by type and shows indicative durations tosynchronisation and then to full load:
Table 7 - Coal Indicative Start up Times
4.3.5 Start Cost
UK plants undertook a number of exercises to identify and evaluate the componentcosts of starts and synchronisation in their efforts to remain flexible and viable in theface of an increasingly competitive market. Costs include:
· Fuel for oil burners.
· Coal burnt to attain boiler stable operating point.
· Electricity used to drive auxiliary plant.
In addition operators assessed the associated non-energy costs including plantdegradation/damage resulting from each additional start.
Appendix 1 shows the ramp rates submitted on a weekday in late January 2014 anddemonstrates that once synchronised coal plant on a hot start can move from zero tofull load 500 MW and above within one hour. It is also noted that certain units arerestrained in their offer, providing slower ramp rates and deferred full load times. Thismay be to cater for specific plant conditions, reflecting the duration that the unit hasbeen off-load or simply owners positioning their plant in the market in order tooptimise their returns.
Shutdown of the coal fired units is typically much faster than starts. This is due to theabsence of the technical limitations present during the start. The downturn rate isgenerally given by the ability of the operator to reduce the load to the system.Appendix 4 shows the ramp down rates for some coal fired units in the UK.
StartShutdown Period
(hours)Notice to Synch
(minutes)
Synch to FullLoad
(minutes)
Hot < 8 60-90 50
Warm 8 to 48 120-300 85
Cold > 48Long term
360-420420+
90200

Technical Assessment of the Operation of Coal &Gas Fired Plants
286861A_FINAL Prepared by Parsons BrinckerhoffDecember 2014 for DECC
- 27 -
5 GUIDE TO GAS PLANT FLEXIBILITY
5.1 Types of Gas Plant
5.1.1 Pre-Existing CCGT
CCGT technology was introduced into the UK market in the early 1990s and some ofthe plant is therefore nearing the end, or in a few cases is already beyond, its originaldesign life. At the time these power stations, such as Deeside and LittleBarford,provided the latest technology for operators and there were closerelationships with the original equipment manufacturers (OEM) which brought furtherenhancements. There has been subsequent investment in new gas plants in the UKsince privatisation and more are nearing completion or cleared through planningready for start on site when owners commit. The plant is significantly smaller in scaleper MW capacity than a coal plant and the staffing levels required to operate andmaintain the plant are much lower.
The “combined” technology utilises a HRSG which raises steam using the heat of theexhaust gases of the gas turbine. The steam is then used to drive a conventionalsteam turbine and generate electricity. This approach increases the efficiency of theprocess from below 40 per cent in a simple gas turbine to nearer 60 per cent inmodern CCGTs.
The gas turbine rotor is rotating at a very early stage in the start-up process and ableto synchronise to the Grid within 15 minutes of ignition. However the steam turbinetakes longer as time is required to develop the right steam conditions in the HRSGand to “heat soak” the steam turbine before it is brought through to full load. Ingeneral, the unit is synchronised, generating and exporting power to the grid muchsooner after ignition than a coal fired plant, taking shorter than a coal unit to reach fullload from the point of synchronisation.
5.1.2 The definition of hot, warm and cold starts can vary between manufacturers, butbasically refers to the metal temperature of the steam turbine. The table below showsthe correlation between shutdown period and steam turbine metal temperature usedto define each start up type.
Table 8 - CCGT Start Types
Start Shutdown Period(hours)
ST Metaltemperature
(OC)
Hot < 8 >371
Warm 8 to 36/48 204 to 371
Cold> 36/48
Long term<205
-
Technical Assessment of the Operation of Coal &Gas Fired Plants
286861A_FINAL Prepared by Parsons BrinckerhoffDecember 2014 for DECC
- 28 -
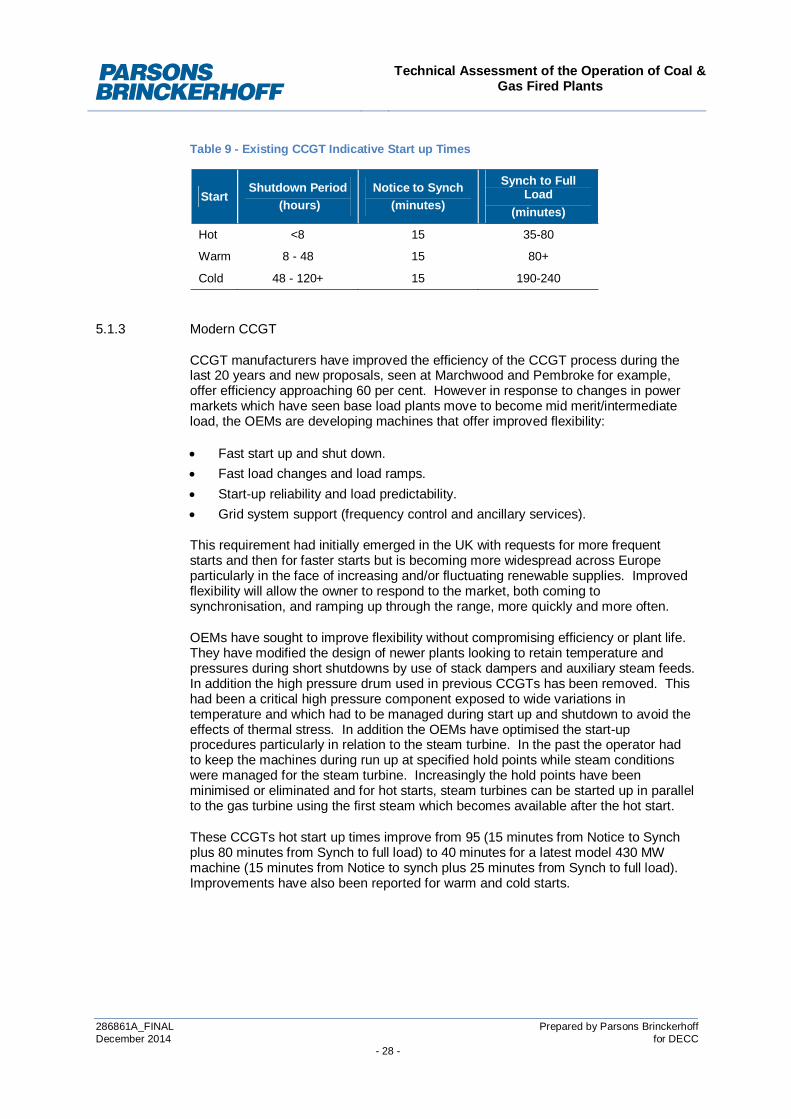
Table 9 - Existing CCGT Indicative Start up Times
StartShutdown Period
(hours)Notice to Synch
(minutes)
Synch to FullLoad
(minutes)
Hot <8 15 35-80
Warm 8 - 48 15 80+
Cold 48 - 120+ 15 190-240
5.1.3 Modern CCGT
CCGT manufacturers have improved the efficiency of the CCGT process during thelast 20 years and new proposals, seen at Marchwood and Pembroke for example,offer efficiency approaching 60 per cent. However in response to changes in powermarkets which have seen base load plants move to become mid merit/intermediateload, the OEMs are developing machines that offer improved flexibility:
· Fast start up and shut down.· Fast load changes and load ramps.· Start-up reliability and load predictability.· Grid system support (frequency control and ancillary services).
This requirement had initially emerged in the UK with requests for more frequentstarts and then for faster starts but is becoming more widespread across Europeparticularly in the face of increasing and/or fluctuating renewable supplies. Improvedflexibility will allow the owner to respond to the market, both coming tosynchronisation, and ramping up through the range, more quickly and more often.
OEMs have sought to improve flexibility without compromising efficiency or plant life.They have modified the design of newer plants looking to retain temperature andpressures during short shutdowns by use of stack dampers and auxiliary steam feeds.In addition the high pressure drum used in previous CCGTs has been removed. Thishad been a critical high pressure component exposed to wide variations intemperature and which had to be managed during start up and shutdown to avoid theeffects of thermal stress. In addition the OEMs have optimised the start-upprocedures particularly in relation to the steam turbine. In the past the operator hadto keep the machines during run up at specified hold points while steam conditionswere managed for the steam turbine. Increasingly the hold points have beenminimised or eliminated and for hot starts, steam turbines can be started up in parallelto the gas turbine using the first steam which becomes available after the hot start.
These CCGTs hot start up times improve from 95 (15 minutes from Notice to Synchplus 80 minutes from Synch to full load) to 40 minutes for a latest model 430 MWmachine (15 minutes from Notice to synch plus 25 minutes from Synch to full load).Improvements have also been reported for warm and cold starts.
Technical Assessment of the Operation of Coal &Gas Fired Plants
286861A_FINAL Prepared by Parsons BrinckerhoffDecember 2014 for DECC
- 29 -
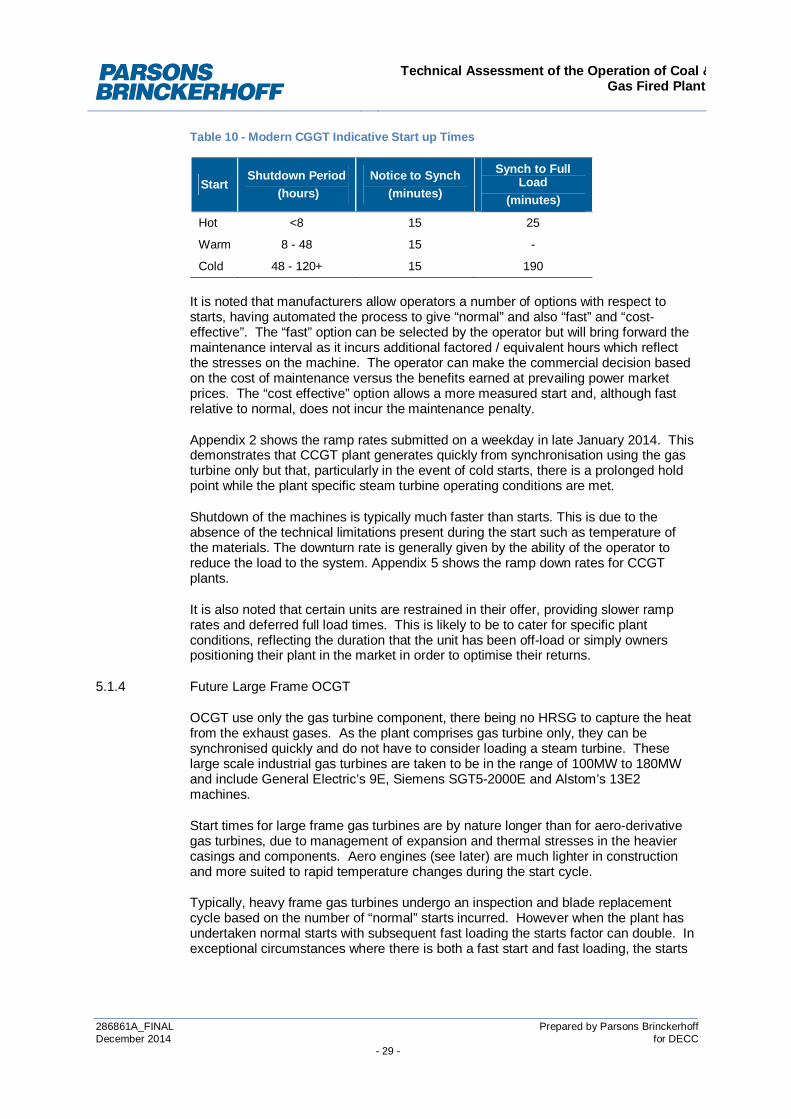
Table 10 - Modern CGGT Indicative Start up Times
StartShutdown Period
(hours)Notice to Synch
(minutes)
Synch to FullLoad
(minutes)
Hot <8 15 25
Warm 8 - 48 15 -
Cold 48 - 120+ 15 190
It is noted that manufacturers allow operators a number of options with respect tostarts, having automated the process to give “normal” and also “fast” and “cost-effective”. The “fast” option can be selected by the operator but will bring forward themaintenance interval as it incurs additional factored / equivalent hours which reflectthe stresses on the machine. The operator can make the commercial decision basedon the cost of maintenance versus the benefits earned at prevailing power marketprices. The “cost effective” option allows a more measured start and, although fastrelative to normal, does not incur the maintenance penalty.
Appendix 2 shows the ramp rates submitted on a weekday in late January 2014. Thisdemonstrates that CCGT plant generates quickly from synchronisation using the gasturbine only but that, particularly in the event of cold starts, there is a prolonged holdpoint while the plant specific steam turbine operating conditions are met.
Shutdown of the machines is typically much faster than starts. This is due to theabsence of the technical limitations present during the start such as temperature ofthe materials. The downturn rate is generally given by the ability of the operator toreduce the load to the system. Appendix 5 shows the ramp down rates for CCGTplants.
It is also noted that certain units are restrained in their offer, providing slower ramprates and deferred full load times. This is likely to be to cater for specific plantconditions, reflecting the duration that the unit has been off-load or simply ownerspositioning their plant in the market in order to optimise their returns.
5.1.4 Future Large Frame OCGT
OCGT use only the gas turbine component, there being no HRSG to capture the heatfrom the exhaust gases. As the plant comprises gas turbine only, they can besynchronised quickly and do not have to consider loading a steam turbine. Theselarge scale industrial gas turbines are taken to be in the range of 100MW to 180MWand include General Electric’s 9E, Siemens SGT5-2000E and Alstom’s 13E2machines.
Start times for large frame gas turbines are by nature longer than for aero-derivativegas turbines, due to management of expansion and thermal stresses in the heaviercasings and components. Aero engines (see later) are much lighter in constructionand more suited to rapid temperature changes during the start cycle.
Typically, heavy frame gas turbines undergo an inspection and blade replacementcycle based on the number of “normal” starts incurred. However when the plant hasundertaken normal starts with subsequent fast loading the starts factor can double. Inexceptional circumstances where there is both a fast start and fast loading, the starts
Technical Assessment of the Operation of Coal &Gas Fired Plants
286861A_FINAL Prepared by Parsons BrinckerhoffDecember 2014 for DECC
- 30 -
factor can be increased by 10 – 20 thereby bringing forward the manufacturer’srecommended inspection outage and associated costs.
This category of plant is taken to cover those units above 100 MW and have beenutilised in the UK on a limited scale such as Indian Queens in Cornwall. Given thesize of the plant and its poor efficiency relative to the combined cycle plant, it is likelythat “new build” would be contemplated only where there is a requirement for systemsupport or where a capacity agreement can be put in place.
One approach being considered is to operate existing CCGT plants in open cyclemode. Most CCGT plants in the UK are not capable since they cannot remove theexhaust gases from the gas turbine without passing them through the HRSG. Onlythose CCGT plants with a by-pass stack can divert the exhaust gases out of theprocess cycle by use of a damper plate.
It is understood that operators of older and less efficient CCGTs are considering theinstallation of a by-pass stack in order to offer short term capability. This modificationcan only be undertaken where there is sufficient space between the gas turbine andthe HRSG and is not practicable on many of the more compact sites.
Table 11 - Future Large Frame OCGT Indicative Start up Times
Start Notice to Synch(minutes)
Synch to Full Load(minutes)
Start 2.5 15-30
5.1.5 Future Small Frame OCGT
This type of plant, generally between 25 MW and 100 MW, has been in operation inthe UK and modern engines can provide around 38 per cent efficiency in open cyclemode.
Table 12 - Small Frame OCGT Indicative Start up Times
StartNotice to Synch
(minutes)Synch to Full Load
(minutes)
Start 2.5 10-15
5.1.6 Aero-derivative OCGT
These machines, similar to aircraft turbines have been used for many years in the UKand often deployed on existing thermal and nuclear sites, primarily to provide blackstart capability. The units are typically in the range 60MW to 100MW and includeRolls Royce’s Trent 60 and General Electric’s LMS 100. Stand-alone sites also existand new installations are being considered and developed to provide a short termflexible response for both grid support and power output. Owners are seekingcapacity contracts in order to support the funding required and also looking to operateon a variety of fuels including gas, diesel and liquid biomass.

Technical Assessment of the Operation of Coal &Gas Fired Plants
286861A_FINAL Prepared by Parsons BrinckerhoffDecember 2014 for DECC
- 31 -
Table 13 - Aero Derivative Indicative Start up Times
StartNotice to Synch
(minutes)Synch to Full Load
(minutes)
Start 2-5 4-8
This is the time to go from a Grid call (if selected) by National Grid Transco (NGT) tolow frequency then the start commences immediately.
Since OCGTs comprise a gas turbine only; there is only one type of start and doesnot require the hot, warm and cold start classifications used on coal and combinedcycle units. In general since these machines are suited to more able to cope withrapid temperature changes there is no starts related maintenance penalty andoutages are predicated largely on accumulated running hours.
In appendix 3 it is shown the start-up time for different OCGTs in the UK. Theshutdown time for these units is given in Appendix 6.
5.2 CCGT Start-up - Process
A typical start sequence for the first gas turbine in a combined cycle plant is detailedbelow with hot, warm and cold all progressing through the same steps but of differingdurations. A combined-cycle start-up procedure is separated into three primaryphases:
· Purging of the HRSG.
· Gas turbine (GT) speed-up, synchronisation, and loading.
· Steam turbine (ST) speed-up, synchronisation, and loading.

Technical Assessment of the Operation of Coal &Gas Fired Plants
286861A_FINAL Prepared by Parsons BrinckerhoffDecember 2014 for DECC
- 32 -
Table 14 - Typical “Hot” start Process for CCGT Unit
Task
Establish cooling water systems and auxiliary boiler in service where applicable.
Ensure GT and ST’s auxiliary systems are operational and release criteria are satisfied.
Confirm the HRSG is ready for start and gas path is clear.
GT is accelerated using the generator in motor mode with a static frequency converter (SFC)or with a separate starter cranking motor and the combustion system is purged by maintaininga low GT speed for a fixed period.
GT load held at, typically 25% load until HRSG pressure rises to the minimum operatingpressure and drum levels are stabilised. The ST condenser vacuum raising sequence startsif there is no auxiliary boiler.
GT target load is raised to circa 50% after the minimum operating pressure has beenreached. GT NOx steam or water injection system (where fitted) is warmed and put intoservice.
Once required steam parameters are met the ST run up sequence commences.
With the GT load held at circa 50% the ST reaches full speed and is synchronised.
For cold starts the ST can only be loaded at a low rate (discussed in next section) and willrequire several hours before all available steam is routed through the steam turbine and theST bypasses are closed. For NOx steam or water injected GT units, this defines the StableExport Limit.
Dry low NOx GTs has loaded to this point using diffusion burners for combustion stability. At(typically) 50-60% GTs load these units gradually change to premix operation. Oncecompleted and stable operation (including the steam turbine) is achieved, this is the StableExport Limit. This mode changeover point is firing temperature initiated with a “dead band”set between rising and falling temperature (load). This, together with the time lag betweenchanging load and resultant changing temperatures, can result in significantly different loadsfor changeover to occur for start-up and shut down (dependant on the rate of loading ordeloading). Also the firing temperature that is used to initiate the change is affected byambient conditions.
SEL is achieved when a unit is operating within its design range, with stable combustion andoperational NOx control measures. Stable readings are obtained from the continuousemissions monitoring (CEM) exhaust measurements, which confirm the low NOx operation.
The duration of the start-up sequence for gas turbines operating in open cycle modecan be shortened as the sequence of steps associated with the HRSG and steamturbine operations may not be applicable.
Technical Assessment of the Operation of Coal &Gas Fired Plants
286861A_FINAL Prepared by Parsons BrinckerhoffDecember 2014 for DECC
- 33 -
Stable Export Limit and Gas Turbine load control
The Stable Export Limit (SEL) is achieved when a unit is operating within its designrange, with stable combustion and operational NOx control measures. Stablereadings are obtained from the CEM exhaust measurements, which confirm the lowNOx operation.
As Gas Turbines are available in a number of designs (both aero engine derivativesand industrial turbines) and can be operated in open cycle or as part of a combinedcycle, there are a number of factors that can influence the durations of the abovesequence steps. For example, the loading and control of the Gas Turbine will varywith combustor design and burner configuration.
Common types of combustor include annular, can-annular and silo style combustionchambers. For some designs, all of the burners fire continuously with the gas supplybeing modulated, for others the burners fire in groups that are turned on and off tocontrol the load; some designs combine the two firing patterns. Sequentialcombustion is also available in which two combustion chambers are separated by aturbine section.
The burners may also have different modes of operation. In diffusion mode the gas toair ratio is high which produces a fuel rich flame which is more stable and iscommonly used for start-up and low loads. In premix mode the gas to air ration islower which results in a weaker flame but with lower emissions. Due to the weakerflame, operating in premix mode can only be used for higher loads. Steam or waterinjection can also be used to control NOx.
For more recent combustor configurations, the flame and acoustic pulsations willneed to be continually monitored. Lean premix combustion relies on firing at a lowflame temperature in order to achieve low NOx. In certain Dry Low NOx systems thisincreases the likelihood of combustion instability - resulting in an increased level ofcombustion dynamics (acoustic pulsations) with a significant risk of serious damageto the combustor. In addition to maintaining low emissions, the control system needsto navigate through operating windows that are prone to high dynamics.
Turbine exit temperature and spread are carefully monitored during run up and, athigher loads, the calculated firing temperature is usually the controlling factor.Turbine exit temperature may be used to trigger changes in burner modes or groups.
The number of Variable Inlet Guide Vane (VIGV) stages and their control varies withdesign. On some machines VIGVs are gradually opened as the load increases tomatch the increase in fuel. For other machines the VIGV only have two positions andopen at a set firing temperature.
The Stable Export Limit is only reached once the Gas Turbine is loaded, has minimalexhaust temperature spread, using the optimal burner mode (i.e. premix, steaminjection) and required steam properties and full Steam Turbine operation with nosteam bypasses operating.
The limiting factor during turn-down is often elevated concentrations of carbonmonoxide (CO) rather than increasing NOx. The combustion air flow is initiallythrottled back, in line with the reducing fuel flow, using variable inlet guide vanes atthe compressor inlet or by bleeding off Compressor Discharge Air. However, belowabout 70 per cent load, the air-fuel ratio increases and the flame temperature falls.When combined with the higher design air-fuel ratio of lean-premix systems, these

Technical Assessment of the Operation of Coal &Gas Fired Plants
286861A_FINAL Prepared by Parsons BrinckerhoffDecember 2014 for DECC
- 34 -
factors cause a rapid increase in CO that marks the end of normal operation. This ismore severe for twin-spool aero-derivate designs.
Shut Down
The shutdown sequence will vary from site to site. An example for a Combined CycleGas Turbine is as follows:
· Reduce load to Stable Export Limit.
· Both Gas Turbine and Steam Turbine unit shut down sequences are initiated atthe same time. As the output drops below the Stable Export Limit, this isconsidered to be the commencement of the shutdown period.
· The Steam Turbine rapidly de-loads and follows a controlled shut-downsequence.
· During the Gas Turbine de-load sequence the combustion system reverts tostart-up mode with an associated short term increase in NOx and CO emissions.

Technical Assessment of the Operation of Coal &Gas Fired Plants
286861A_FINAL Prepared by Parsons BrinckerhoffDecember 2014 for DECC
- 35 -
6 MOTHBALLING/PRESERVATION
In the context of a power station the words mothballing or preservation apply to thosetechniques which could be applied to the plant in order to prevent or reducedeterioration when out of service.
When market economics are not favourable, the option to mothball the plant can beapplied, but at this time it may not be known for how long the plant may be required toremain in the preserved state. Basically there are two categories or options forpreservation, namely short term preservation and long term preservation. Thetechniques used for each option can vary significantly, together with the timescalesrequired to successfully mothball the plant and reinstate the plant back to operationalcondition. These returns to service timescales can also vary significantly betweentechnologies (Coal, CCGT or OCGT).
Basically the protection of plant from condensation, corrosion and seizure due to lackof intended use, is primarily a matter of good engineering practice and goodhousekeeping.
The most frequently used methods of preservation and plant protection are:
· The establishment of clean dry conditions - This is the most satisfactory practicesince it allows the plant to be recommissioned with the minimum of delay.Normally the plant will be drained and fully dried out with the installation ofdehumidifiers
· Cleaning, flushing and drying – This method can be applied when storage underdry air is not possible. Generally the system will require opening up, to enablethe necessary work to be carried out correctly. This is the least satisfactorymethod to be applied to plant that requires long-term storage. It is however theonly practical option available when shutting down plant for major maintenanceactivities.
· Plant can be stored wet when filled with suitably dosed demineralised water.
· The use of a protective gas – When it is not possible to achieve dry conditions,protection can be achieved by filling the system with nitrogen gas. Nitrogenblanketing is an effective method of plant storage. However unless the plant isabsolutely gas tight, it is very difficult to achieve in reality.
· The use of inhibitors – For systems that cannot be drained, cleaned or blanketedetc, dosing the waterside of plant systems with corrosion inhibitors may be usedas an alternative.
· Intermittent running of the plant – Auxiliary systems which contain nonaggressive fluids such as lubricating oils can be run on a regular but intermittentbasis to prevent corrosion and ensure filtration.
· Protection of essential live systems – For systems which need to remainavailable, but may be subject to damage through freezing, i.e. fire systems,applying insulation or trace heating may be an option.
· Removal of plant items – small high-risk items can be removed for storage inclean dry conditions.
Technical Assessment of the Operation of Coal &Gas Fired Plants
286861A_FINAL Prepared by Parsons BrinckerhoffDecember 2014 for DECC
- 36 -
6.1 Short Term Preservation
Short term preservation can be classed as a period of 3 -12 months and typically theboilers/HRSGs are retained full of de-oxygenated water. The access doors on thesteam turbine and condensers are removed to allow dehumidifiers to be installedwhich circulate dry air through the airspaces to prevent corrosion.
Station staff are normally retained and are given alternative duties principally relatingto plant preservation. The plant being out of service also provides the opportunity tocarry out more routine or planned maintenance that would otherwise requires anindividual unit or station outage.
Due to the short term nature of the plant preservation, emphasis is required at alltimes on the ability for a rapid return to service of the plant, in order to capitalise onchanges in market economics.
The ability to achieve a successful and rapid return to service relies on the stationhaving a detailed recommissioning plan which includes the cancellation of safetydocumentation, proof testing of safety systems and running of essential lubricationsystems to allow hand turning or machine barring.
6.2 Long Term Preservation
Long term preservation techniques (>12 months) are far more detailed than shortterm preservation techniques and require the boilers/HRSGs to be fully drained anddried out. Main generators are to be stored under dehumidified air and largeelectrical motors are to be kept dry using in built heaters where installed. Small highrisk components should be removed and stored under clean dry conditions. Livewater systems will require protecting against freezing by applying insulation or traceheating. External surfaces normally covered by insulation where rainwater,condensation or leakage could lead to concealed corrosion occurring.
Where advanced information on the long term preservation (>1year) is available, it iscommon to reduce the number of site staff down to a minimum level. These staff arethen given preservation inspection and maintenance duties. One major disadvantageof this approach is the timescales required to recruit and train new operations staff,when the plant is required to return to service.
6.3 Miscellaneous Preservation Costs
Even when the plant is fully mothballed, there are a number of costs which will stillcontinue, in order for the unit to be capable of return to service. These can besummarised as:
· Minimum staffing cost.
· Maintenance costs of: Fire systems, Heating Ventilation and Air Conditioning(HVAC), building structures etc.
· Pressure Systems Safety Regulations (PSSR) Inspections.
· Transmission Entry Capacity payment (TEC).
· Insurance.
· Water Fees.

Technical Assessment of the Operation of Coal &Gas Fired Plants
286861A_FINAL Prepared by Parsons BrinckerhoffDecember 2014 for DECC
- 37 -
The decision to mothball the plant may have been taken to avoid or defer the expenseof a major overhaul. In this case a major overhaul would be required before the plantis returned to service.
6.4 Timescales
The timescales to mothball the plant in the first instance and then for return to servicewill depend upon a number of factors, the main two being the method of preservation(short or long term) and technology type (Coal, CCGT and OCGT). Typical periodsthat a plant would need to be taken out of the market to justify the costs of long-termmothballing and reinstatement would be > 12 months. While the option for long termmothballing is available to both coal and gas fired plant, the cost of mothballing issignificantly higher for coal fired plant, due to the physical size and additionalequipment. Coal Plant
With the typical UK coal fired unit being sized at 500 MW, the time taken to fullymothball a unit of this size would be longer than for a significantly smaller gas firedunit. Typical durations for the mothballing activities are as follows:
Table 15 - Coal Plant Preservation Timescales
Period Activity Duration (days)
Short Term Mothball 4
Reinstate 4
Long Term Mothball 30-42
Reinstate 30-42
Staff Recruitment & Training 90
Major outage Duration (if required) 84
Based on the common “F” Class gas turbine technology of nominal 300 MW size, thetime taken to fully mothball a unit of this size would be significantly shorter than a coalfired unit, but longer than for an OCGT Unit. Typical durations for the mothballingactivities are as follows:

Technical Assessment of the Operation of Coal &Gas Fired Plants
286861A_FINAL Prepared by Parsons BrinckerhoffDecember 2014 for DECC
- 38 -
Table 16 - CCGT Preservation Timescales
Period Activity Duration (days)
Short Term Mothball 2
Reinstate 2
Long Term Mothball 15-30
Reinstate 15-30
Staff Recruitment & Training 90
Major outage Duration (if required) 42-56
With the majority of existing UK OCGT units being of a smaller size than the coal andCCGT units, typically <40 MWe, typical durations for the mothballing activities are asfollows:
Table 17 - OCGT Preservation Timescales
Period Activity Duration (days)
Short Term Mothball 1
Reinstate 1
Long Term Mothball 5
Reinstate 5
Staff Recruitment & Training* -
Major Outage Duration (if required)** 10
* Due to the minimal staff employed on OCGT sites it is unlikely that there would be any significantmanpower reductions.
** Duration based on 5 days to install and remove an exchange engine.

Technical Assessment of the Operation of Coal &Gas Fired Plants
286861A_FINAL Prepared by Parsons BrinckerhoffDecember 2014 for DECC
- 39 -
APPENDIX
REPORT APPENDICES
Technical Assessment of the Operation of Coal &Gas Fired Plants
286861A_FINAL Prepared by Parsons BrinckerhoffDecember 2014 for DECC
- 41 -
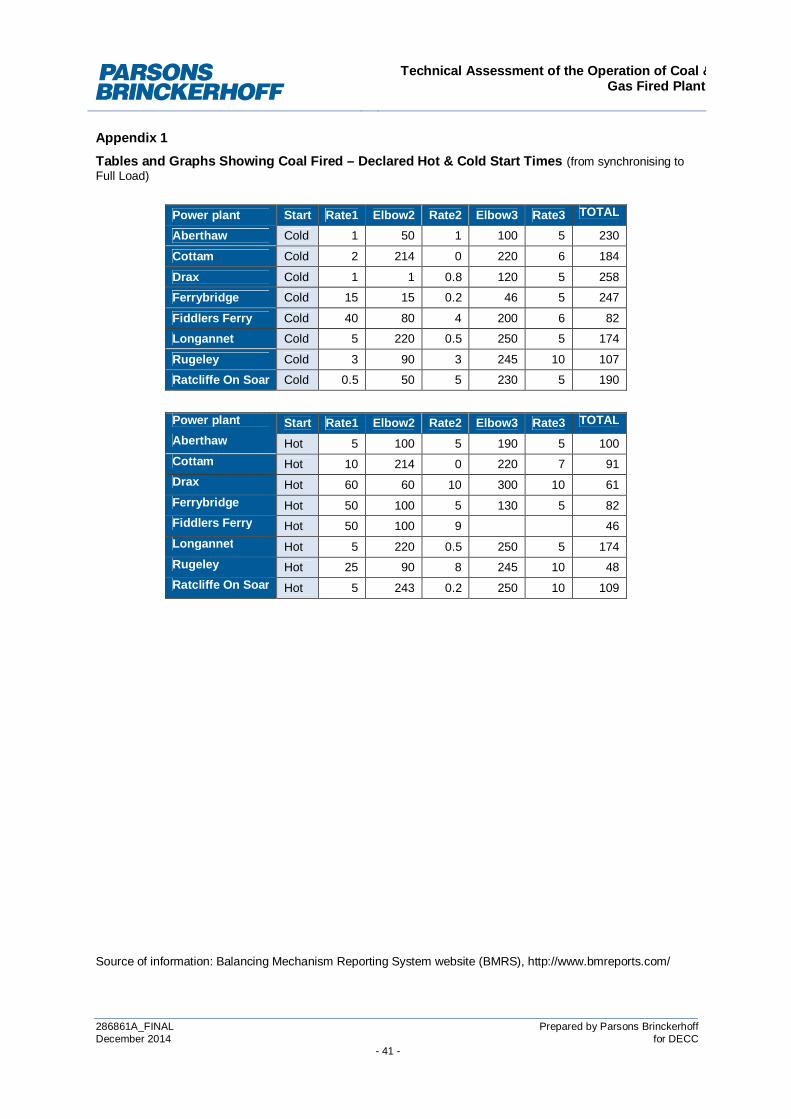
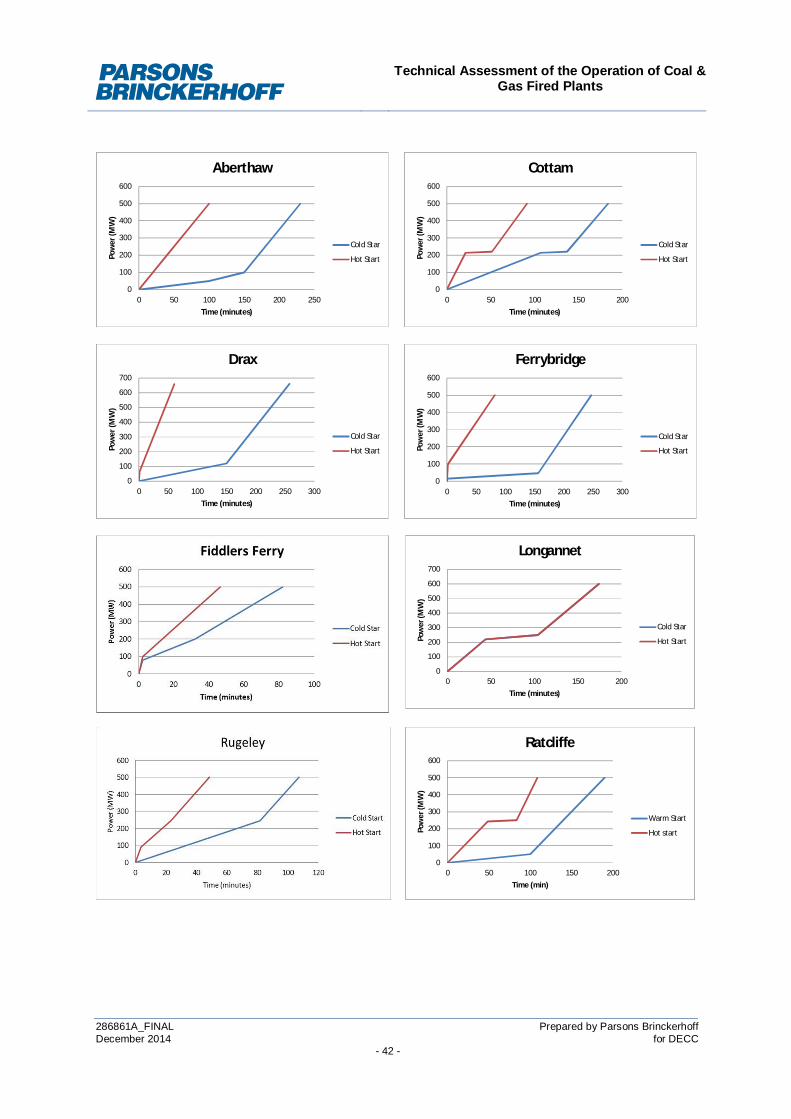
Appendix 1Tables and Graphs Showing Coal Fired – Declared Hot & Cold Start Times (from synchronising toFull Load)
Power plant Start Rate1 Elbow2 Rate2 Elbow3 Rate3 TOTAL
Aberthaw Cold 1 50 1 100 5 230
Cottam Cold 2 214 0 220 6 184
Drax Cold 1 1 0.8 120 5 258
Ferrybridge Cold 15 15 0.2 46 5 247
Fiddlers Ferry Cold 40 80 4 200 6 82
Longannet Cold 5 220 0.5 250 5 174
Rugeley Cold 3 90 3 245 10 107
Ratcliffe On Soar Cold 0.5 50 5 230 5 190
Power plant Start Rate1 Elbow2 Rate2 Elbow3 Rate3 TOTALAberthaw Hot 5 100 5 190 5 100Cottam Hot 10 214 0 220 7 91Drax Hot 60 60 10 300 10 61Ferrybridge Hot 50 100 5 130 5 82Fiddlers Ferry Hot 50 100 9 46Longannet Hot 5 220 0.5 250 5 174Rugeley Hot 25 90 8 245 10 48Ratcliffe On Soar Hot 5 243 0.2 250 10 109
Source of information: Balancing Mechanism Reporting System website (BMRS), http://www.bmreports.com/
Technical Assessment of the Operation of Coal &Gas Fired Plants
286861A_FINAL Prepared by Parsons BrinckerhoffDecember 2014 for DECC
- 42 -
0
100
200
300
400
500
600
0 50 100 150 200 250
Pow
er(M
W)
Time (minutes)
Aberthaw
Cold Star
Hot Start
0
100
200
300
400
500
600
0 50 100 150 200
Pow
er(M
W)
Time (minutes)
Cottam
Cold Star
Hot Start
0
100
200
300
400
500
600
700
0 50 100 150 200 250 300
Pow
er(M
W)
Time (minutes)
Drax
Cold Star
Hot Start
0
100
200
300
400
500
600
0 50 100 150 200 250 300
Pow
er(M
W)
Time (minutes)
Ferrybridge
Cold Star
Hot Start
0
100
200
300
400
500
600
700
0 50 100 150 200
Pow
er(M
W)
Time (minutes)
Longannet
Cold Star
Hot Start
0
100
200
300
400
500
600
0 50 100 150 200
Pow
er(M
W)
Time (min)
Ratcliffe
Warm Start
Hot start

Technical Assessment of the Operation of Coal &Gas Fired Plants
286861A_FINAL Prepared by Parsons BrinckerhoffDecember 2014 for DECC
- 43 -
Appendix 2Tables and Graphs Showing CCGT - Declared Hot & Cold Start Times (from synchronising to FullLoad)
Power plant Start Rate1 Elbow2 Rate2 Elbow3 Rate3 TOTAL
Connahs Quay Cold 10 35 0.7 110 4.5 160
Didcot B Cold 1.3 210 4.5 420 20 221Killingholme Cold 7 40 0.2 68 10 205Staythorpe Cold 0.3 0.3 0.3 0.3 0.3 233
Pembroke Cold 0.3 43 4 191 17.5 192
Deeside Cold 8 49 0.2 58 2.6 240
Marchwood Cold 5.5 5.5 5.5 5.5 5.5 327
Little Barford Cold 5 110 0.3 140 20 149
Power plant Start Rate1 Elbow2 Rate2 Elbow3 Rate3 TOTALConnahs Quay Hot 10 25 1.8 115 12 70Didcot B Hot 3.8 305 30 710 5 88Killingholme Hot 7 60 0.2 62 10 79Staythorpe Hot 2.1 2.1 2.1 2.1 2.1 80Pembroke Hot 11 178 0.3 191 17.5 71Deeside Hot 24 360 30 475 5 34Marchwood Hot 10 10 10 10 10 70Little Barford Hot 10 60 20 240 20 37
Source of information: Balancing Mechanism Reporting System website (BMRS), http://www.bmreports.com/
0
50
100
150
200
250
300
350
0 50 100 150 200
Pow
er(M
W)
Time (minutes)
Connahs Quay
Cold start
Hot start
0
100
200
300
400
500
600
700
800
0 50 100 150 200 250
Pow
er(M
W)
Time (minutes)
Didcot B
Cold start
Hot start

Technical Assessment of the Operation of Coal &Gas Fired Plants
286861A_FINAL Prepared by Parsons BrinckerhoffDecember 2014 for DECC
- 44 -
0
100
200
300
400
500
600
700
0 50 100 150 200 250
Pow
er(M
W)
Time (minutes)
Killingholme
Cold Start
Hot Start
050
100150200250300350400450
0 50 100 150 200 250
Pow
er(M
W)
Time (minutes)
Staythorpe
Cold start
Hot start
050
100150200250300350400450
0 50 100 150 200 250
Pow
er(M
W)
Time (minutes)
Pembroke
Cold start
Hot start
0
100
200
300
400
500
600
0 50 100 150
Pow
er(M
W)
Time (minutes)
Deeside
Cold start
Hot start
0100200300400500600700800900
1000
0 100 200 300 400
Pow
er(M
W)
Time (minutes)
Marchwood
Cold Start
Hot start
0
100200
300400
500
600700
800
0 50 100 150 200
Pow
er(M
W)
Time (minutes)
Little Barford
Cold start
Hot start
Technical Assessment of the Operation of Coal &Gas Fired Plants
286861A_FINAL Prepared by Parsons BrinckerhoffDecember 2014 for DECC
- 45 -
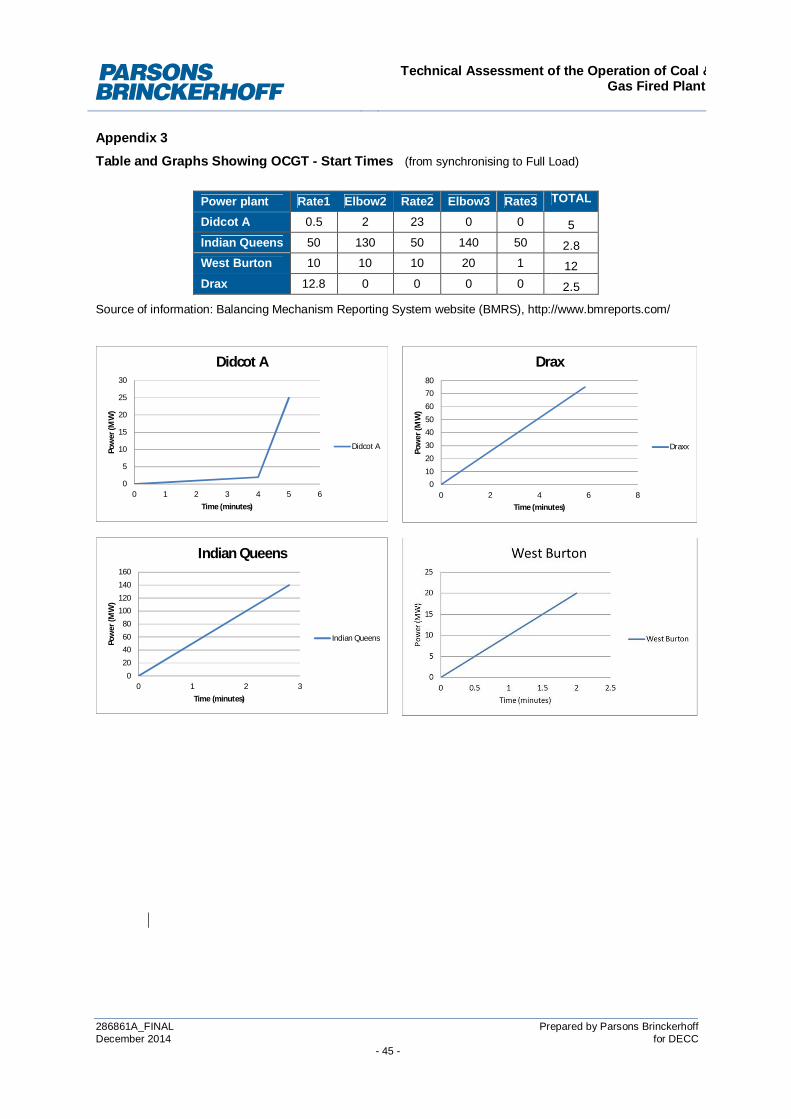
Appendix 3Table and Graphs Showing OCGT - Start Times (from synchronising to Full Load)
Power plant Rate1 Elbow2 Rate2 Elbow3 Rate3 TOTAL
Didcot A 0.5 2 23 0 0 5Indian Queens 50 130 50 140 50 2.8West Burton 10 10 10 20 1 12Drax 12.8 0 0 0 0 2.5
Source of information: Balancing Mechanism Reporting System website (BMRS), http://www.bmreports.com/
0
5
10
15
20
25
30
0 1 2 3 4 5 6
Pow
er(M
W)
Time (minutes)
Didcot A
Didcot A
010
20
30
4050
60
7080
0 2 4 6 8
Pow
er(M
W)
Time (minutes)
Drax
Draxx
0
20
4060
80
100120
140
160
0 1 2 3
Pow
er(M
W)
Time (minutes)
Indian Queens
Indian Queens

Technical Assessment of the Operation of Coal &Gas Fired Plants
286861A_FINAL Prepared by Parsons BrinckerhoffDecember 2014 for DECC
- 46 -
Appendix 4Table and Graphs Showing Coal Fired – Declared Run-Down Rate Export
Power plant Rate1 Elbow2 Rate2 Elbow3 Rate3 TOTAL
Aberthaw 5 240 4 180 45 71
Cottam 10 250 5 200 10 55
Drax 10 300 10 200 99 48
Ferrybridge 15 490 15 280 15 33
Fiddlers Ferry 6 240 20 55
Longannet 7 86
Rugeley 10 245 10 200 25 38
Ratcliffe On Soar 10 230 10 80 40 44
Source of information: Balancing Mechanism Reporting System website (BMRS), http://www.bmreports.com/

Technical Assessment of the Operation of Coal &Gas Fired Plants
286861A_FINAL Prepared by Parsons BrinckerhoffDecember 2014 for DECC
- 47 -
Technical Assessment of the Operation of Coal &Gas Fired Plants
286861A_FINAL Prepared by Parsons BrinckerhoffDecember 2014 for DECC
- 48 -
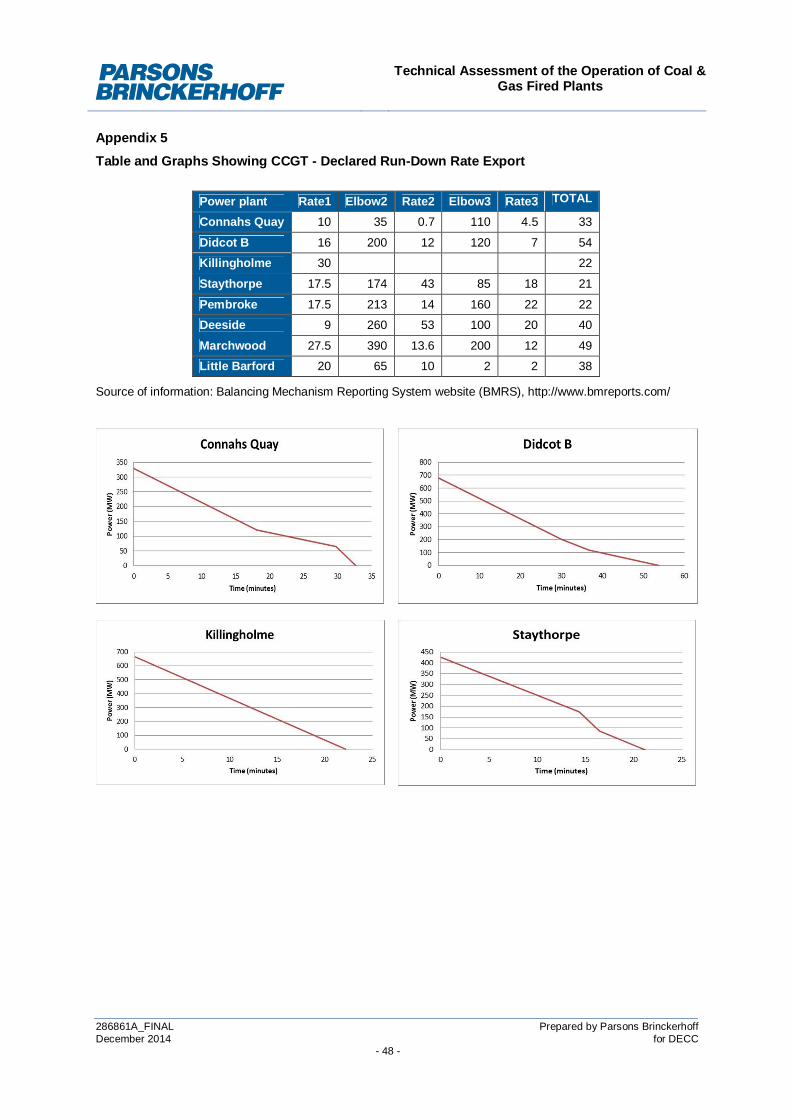
Appendix 5Table and Graphs Showing CCGT - Declared Run-Down Rate Export
Power plant Rate1 Elbow2 Rate2 Elbow3 Rate3 TOTAL
Connahs Quay 10 35 0.7 110 4.5 33
Didcot B 16 200 12 120 7 54
Killingholme 30 22
Staythorpe 17.5 174 43 85 18 21
Pembroke 17.5 213 14 160 22 22
Deeside 9 260 53 100 20 40
Marchwood 27.5 390 13.6 200 12 49
Little Barford 20 65 10 2 2 38
Source of information: Balancing Mechanism Reporting System website (BMRS), http://www.bmreports.com/

Technical Assessment of the Operation of Coal &Gas Fired Plants
286861A_FINAL Prepared by Parsons BrinckerhoffDecember 2014 for DECC
- 49 -
Technical Assessment of the Operation of Coal &Gas Fired Plants
286861A_FINAL Prepared by Parsons BrinckerhoffDecember 2014 for DECC
- 50 -
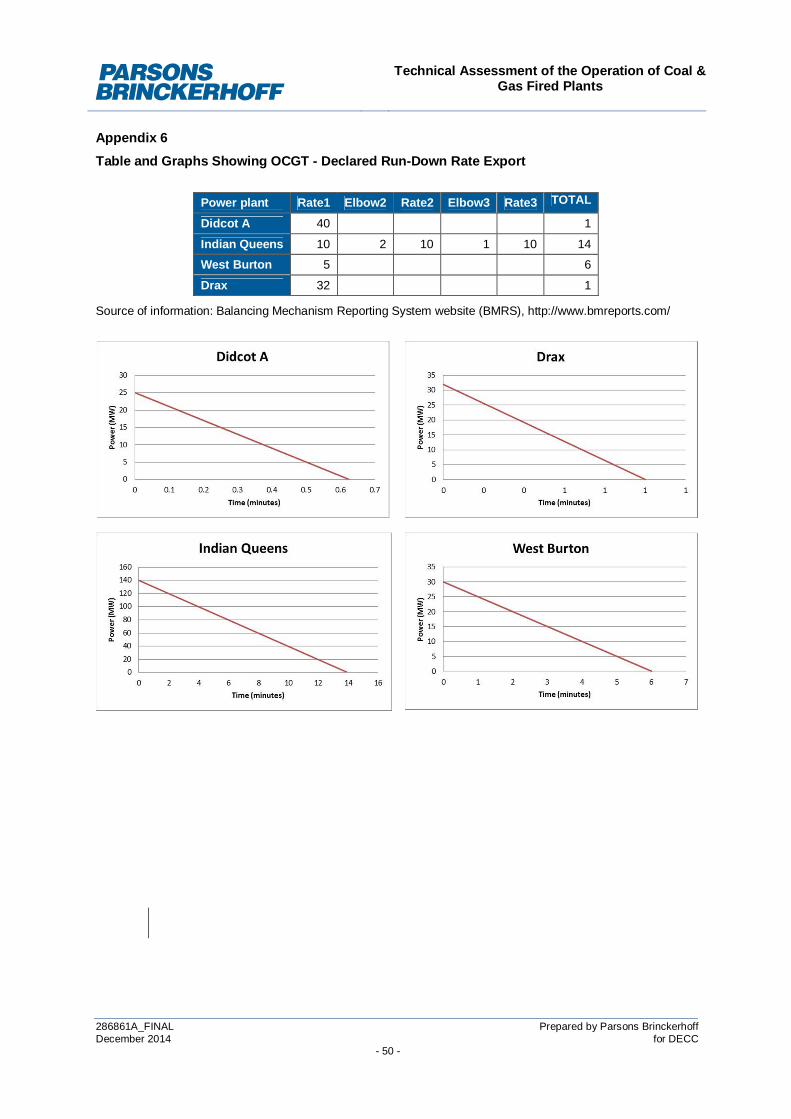
Appendix 6Table and Graphs Showing OCGT - Declared Run-Down Rate Export
Power plant Rate1 Elbow2 Rate2 Elbow3 Rate3 TOTAL
Didcot A 40 1
Indian Queens 10 2 10 1 10 14
West Burton 5 6
Drax 32 1
Source of information: Balancing Mechanism Reporting System website (BMRS), http://www.bmreports.com/


![EXERGY DIAGNOSIS OF COAL FIRED COMBINED … · Exergy Diagnosis of Coal Fired Combined Heat and Power ... in coal fired combined heat and power plant have ... Thermoeconomic [2] analysis](https://static.fdocuments.in/doc/165x107/5b4f746a7f8b9a1b6e8c4949/exergy-diagnosis-of-coal-fired-combined-exergy-diagnosis-of-coal-fired-combined.jpg)
