Tech Memo 3 – Financial Assessment and Strategies Selection
31
TECHNICAL MEMO Tetra Tech Canada Inc. Suite 1000 – 10th Floor, 885 Dunsmuir Street Vancouver, BC V6C 1N5 CANADA Tel 604.685.0275 Fax 604.684.6241 ISSUED FOR REVIEW To: Tauseef Waraich Harmony Huffman Date: June 28, 2018 c: Memo No.: 3 From: Melissa Nielsen Tamara Shulman Wilbert Yang File: 704-SWM.PLAN03006-01 Subject: Tech Memo 3 – Financial Assessment and Strategies Selection (Preliminary for Review) This ‘Issued for Review’ document is provided solely for the purpose of client review and presents our interim findings and recommendations to date. Our usable findings and recommendations are provided only through an ‘Issued for Use’ document, which will be issued subsequent to this review. Final design should not be undertaken based on the interim recommendations made herein. Once our report is issued for use, the ‘Issued for Review’ document should be either returned to Tetra Tech Canada Inc. (Tetra Tech) or destroyed. 1.0 INTRODUCTION The Cowichan Valley Regional District (CVRD) retained Tetra Tech Canada Inc. (Tetra Tech) to support the review and update of the CVRD’s Solid Waste Management Plan (SWMP). The 2018 Draft SWMP Update will review existing solid waste management policies and programs; identify and evaluate strategies for reduction and diversion, residual management, and financing; and set the regional district’s waste management principles, targets and strategies for the next ten years. A summary of the project phases that encompasses solid waste management planning process is included in Table 1-1. Table 1-1: Project Deliverables Phase Deliverable 1 Initiate the Planning Process Technical Memorandum (Tech Memo) 1 - Current Solid Waste Management System Overview 2 Set the Plan Direction Consultation Plan Tech Memo 2 - Options: 3 R’s and Residual Management 3 Evaluate Strategies Tech Memo 3 – Financial Assessment and Strategies Selection 4 Prepare and Adopt the Plan Draft Solid Waste Management Plan Consultation Summary Report 5 Plan to Implement, Monitor, and Report 2018 Solid Waste Management Plan This document represents Phase 3 (Tech Memo 3) and provides a financial analysis of the strategies selected for the 2018 Draft SWMP Update. Tech Memo 1 included an overview of the Current Solid Waste Management System that was presented at the Plan Advisory Committee (PAC) meeting on March 29, 2018. Tech Memo 2 was presented to the PAC on May 10, 2018 and identified options for consideration for the SWMP Update and discussed the Guiding Principles that would ultimately be used as the foundation for the SWMP Update.
Transcript of Tech Memo 3 – Financial Assessment and Strategies Selection
TECHNICAL MEMO
Tetra Tech Canada Inc. Suite 1000 – 10th Floor, 885 Dunsmuir Street
Vancouver, BC V6C 1N5 CANADA Tel 604.685.0275 Fax 604.684.6241
ISSUED FOR REVIEW
To: Tauseef Waraich Harmony Huffman
Date: June 28, 2018
c: Memo No.: 3
From: Melissa Nielsen Tamara Shulman Wilbert Yang
File: 704-SWM.PLAN03006-01
Subject: Tech Memo 3 – Financial Assessment and Strategies Selection (Preliminary for Review)
This ‘Issued for Review’ document is provided solely for the purpose of client review and presents our interim findings and recommendations to date. Our usable findings and recommendations are provided only through an ‘Issued for Use’ document, which will be issued subsequent to this review. Final design should not be undertaken based on the interim recommendations made herein. Once our report is issued for use, the ‘Issued for Review’ document should be either returned to Tetra Tech Canada Inc. (Tetra Tech) or destroyed.
1.0 INTRODUCTION
The Cowichan Valley Regional District (CVRD) retained Tetra Tech Canada Inc. (Tetra Tech) to support the review and update of the CVRD’s Solid Waste Management Plan (SWMP). The 2018 Draft SWMP Update will review existing solid waste management policies and programs; identify and evaluate strategies for reduction and diversion, residual management, and financing; and set the regional district’s waste management principles, targets and strategies for the next ten years. A summary of the project phases that encompasses solid waste management planning process is included in Table 1-1.
Table 1-1: Project Deliverables
Phase Deliverable 1 Initiate the Planning Process Technical Memorandum (Tech Memo) 1 - Current Solid Waste
Management System Overview 2 Set the Plan Direction Consultation Plan
Tech Memo 2 - Options: 3 R’s and Residual Management 3 Evaluate Strategies Tech Memo 3 – Financial Assessment and Strategies Selection 4 Prepare and Adopt the Plan Draft Solid Waste Management Plan
Consultation Summary Report 5 Plan to Implement, Monitor, and Report 2018 Solid Waste Management Plan
This document represents Phase 3 (Tech Memo 3) and provides a financial analysis of the strategies selected for the 2018 Draft SWMP Update. Tech Memo 1 included an overview of the Current Solid Waste Management System that was presented at the Plan Advisory Committee (PAC) meeting on March 29, 2018. Tech Memo 2 was presented to the PAC on May 10, 2018 and identified options for consideration for the SWMP Update and discussed the Guiding Principles that would ultimately be used as the foundation for the SWMP Update.

TECH MEMO 3 – FINANCIAL ASSESSMENT AND STRATEGIES SELECTION FILE: 704-SWM.PLAN03006-01 | JUNE 28, 2018 | ISSUED FOR REVIEW
2 180619_TM3_Financial and Technical Analysis
1.1 Purpose
The purpose of this tech memo is to elaborate on the strategies selected, assess their implications on the solid waste management system, and develop an understanding of the resource requirements. In addition, this tech memo will include refinements to the Guiding Principles for the updated Plan.
Once the strategies have been analyzed and selected, an initial draft SWMP will be developed and presented for more public consultation. Important considerations include adequate engagement with CVRD stakeholders which range from the public, the private sectors and through to First Nations. An updated 2018 SWMP will be crafted based on the outcomes of the previous deliverables, including a consultation summary.
1.2 Guiding Principles
SWMPs should have Guiding Principles to provide an overarching direction for the plan. The PAC reviewed the Ministry’s Guiding Principles that were included in the planning guide entitled, “A Guide to Solid Waste Management Planning” (Guide) and recommended modifications that better suits the regional district’s priorities and situation. The PAC recommends the following Guiding Principles.
Figure 1-1: Cowichan Valley Regional District Guiding Principles for the 2018 SWMP Update
Promote zero waste approaches and support a circular economy
Promote the first 3 Rs (Reduce, Reuse and Recycle) and consider Recovery before Residuals Management
Maximize beneficial use of discarded materials and manage residuals appropriately
Support structural and systemic changes (e.g. polluter and user-pay approaches) and corresponding behaviour change programs to optimize system changes and promote principles one and two.
Prevent organics and recyclables from going into the garbage wherever practical
Collaborate with other regional districts wherever practical
Develop collaborative partnerships with interested parties to achieve regional targets set in plans
Support practical and effective delivery of waste management services from public and private service providers, and level the playing field within the region for private and public solid waste management facilities.

TECH MEMO 3 – FINANCIAL ASSESSMENT AND STRATEGIES SELECTION FILE: 704-SWM.PLAN03006-01 | JUNE 28, 2018 | ISSUED FOR REVIEW
3 180619_TM3_Financial and Technical Analysis
2.0 SOLID WASTE SYSTEM RECAP AND REFRAME
In terms of disposal and diversion rate, the CVRD is one of the highest performing regional districts in the Province. In 2016, an estimated 30,100 tonnes of waste were disposed from within the region, which amounts to an annual disposal rate of 358 kg per capita. The total amount of recycling (including organic materials) was approximately 44,000 tonnes, which amounts to an annual recycling rate of 525 kg per capita.
2.1 Facilities and Services
The major solid waste management facilities that support the CVRD are summarized in Table 2-1. These facilities are a combination of public and private sector facilities, and offer a variety of services from processing organic materials to drop-off of recyclable, organics and garbage.
Table 2-1: Overview of Major CVRD Facilities
Facility Name Facility Type Location(s) Ownership Model
Bings Creek Recycling Centre & Garbage Drop-Off Depot Transfer Station and Drop-off Depot Duncan Public
Meade Creek Recycling Centre & Garbage Drop-Off Depot Drop-off Depot Lake Cowichan Public
Peerless Road Recycling Centre & Garbage Drop-Off Depot Drop-off Depot Ladysmith Public
Coast Environmental Transfer Station, Drop-off Depot, Organics Processor
Duncan and Chemainus Private
Fisher Road Recycling Transfer Station and Drop-off Depot, Organics Processor Cobble Hill Private
Three types of residential waste collection exist in the CVRD: (1) public or publicly-contracted collection at curbside; (2) private collection; and (3) self-haul by residents or small businesses to drop-off depots. Most single-family residents receive a three-stream curbside collection service (garbage, recycling and organics). Many businesses in the commercial sector and most multi-family residents do not receive organics collection service, and many do not receive recycling service.
There is a combination of public and private sector depots throughout the CVRD. The southern Electoral Areas (A, B, and C) are served exclusively by private facilities. The CVRD tried to site a public sector depot in Area B in 2011 but was unsuccessful. In lieu of public service, the CVRD partners with private sector depots to offer free drop-off for packaging and printed paper materials and yard waste for south end residents.
Recyclables are collected in the CVRD and transferred to material recovery facilities (MRFs) in the Capital Regional District (CRD) or the Regional District of Nanaimo (RDN). Bings Creek is the transfer station for residential recyclables collected under the RecycleBC program. A transfer station for industrial, commercial, and institutional (ICI) sector recyclables is lacking in the CVRD.
There are no disposal facilities in the CVRD. Garbage from the CVRD is transported and disposed in a private sector landfill in Roosevelt, Washington in the United States of America.
TECH MEMO 3 – FINANCIAL ASSESSMENT AND STRATEGIES SELECTION FILE: 704-SWM.PLAN03006-01 | JUNE 28, 2018 | ISSUED FOR REVIEW
4 180619_TM3_Financial and Technical Analysis
2.2 Disposal by Sector
In 2016, an estimated 30,100 tonnes of waste were disposed from the regional district. Most materials disposed (~70%) were taken to CVRD facilities. The remainder was taken to private sector facilities. Table 2-2 summarizes the estimated distribution by sector.
Table 2-2: Disposed Material by Sector
Sector Percent of Total Disposed Materials1
Quantity of Disposed Materials (tonnes)
Single-Family 22% 6,700 Multi-Family 6% 1,700
Industrial, Commercial, and Institutional 42% 12,800 Drop-off 12% 3,600
Construction and Demolition 18% 5,300 Total Disposal Rate 100% 30,100
2.3 Waste Composition
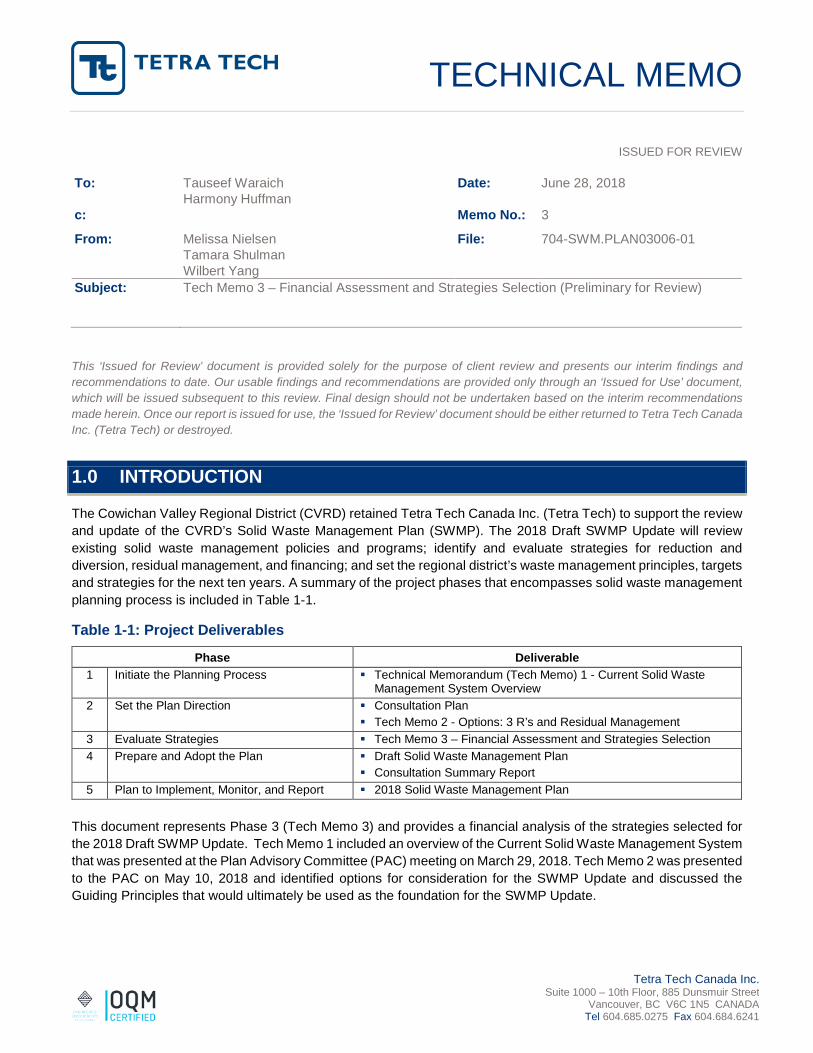
The 2017 waste composition study (Figure 2-1) revealed that the largest component of the waste disposed was compostable organics (24.4%), followed by plastics (17.2%), and paper (11.1%).
Figure 2-1: Overall Waste Composition – All Sectors
The study also examined the primary waste composition categories by sector (Residential (Single Family [SF] & Multi-Family [MF]), Industrial, Commercial and Institutional [ICI], Drop Off [DO] and Construction & Demolition [C&D]). As shown in Figure 2-2, most of the discarded materials consist of paper, plastic, metal, and organic materials, and much of these materials are recoverable from the waste stream.
Paper, 11.1%
Plastics, 17.2%
Compostable Organics, 24.4%Non-Compostable
Organics, 13.2%
Textiles, 4.8%
Metals, 2.5%Glass, 1.5%
Building Material, 7.7%
Electronics, 1.2%
Household Hazardous, 1.0%
Household Hygiene, 7.2%Bulky Objects, 3.1% Fines, 5.3%

TECH MEMO 3 – FINANCIAL ASSESSMENT AND STRATEGIES SELECTION FILE: 704-SWM.PLAN03006-01 | JUNE 28, 2018 | ISSUED FOR REVIEW
5 180619_TM3_Financial and Technical Analysis
Figure 2-2: Waste Composition and Disposal by Sector
2.4 Diversion Potential
The Ministry established waste disposal reporting as an annual requirement for regional districts and set a provincial target of 350 kilograms (kg) per capita per year or lower to be achieved by 2020. While the CVRD is one of the highest performing regional districts in the Province and is on track to achieve the provincial target by 2020, there are opportunities in certain sectors to increase waste diversion in the region even further. It is also important to take into consideration that the provincial target is for 2020 and the CVRD’s Plan Update spans beyond 2028.
This section uses waste composition data to present the amount of potentially divertible material still in the garbage. This section considers two factors when discussing diversion potential:
Material Grouping. Table 2-3 presents how material types were grouped for the diversion potential analysis. These groupings reflect groups of materials that are managed in a particular way – for example, material that is collected via curbside recycling is grouped together, since these materials could be targeted through improved residential recycling programs, and wasted food is separated from inedible organic materials, since wasted food may be targeted through waste reduction programs, while inedible organic materials may be targeted through organics diversion programs.
Sector. Waste from each sector typically has a distinct composition profile and would be targeted by different programs.
0.0
20.0
40.0
60.0
80.0
100.0
120.0
SF MF ICI DO C&D
Was
te G
ener
atio
n in
201
6 (k
g/ca
pita
)
Paper Plastic Comp. Organics Non-Comp. OrganicsTextiles Metal Glass Building MaterialElectronic Household Hazardous Household Hygiene Bulky ObjectsFines

TECH MEMO 3 – FINANCIAL ASSESSMENT AND STRATEGIES SELECTION FILE: 704-SWM.PLAN03006-01 | JUNE 28, 2018 | ISSUED FOR REVIEW
6 180619_TM3_Financial and Technical Analysis
Table 2-4 presents the material groupings according to the following sectors:
Single Family (Municipalities); Single Family (Electoral Areas); Multi-Family;
Industrial, Commercial, and Institutional; Self-hauled Waste; and Construction and Demolition Materials.
Table 2-3: Material Groupings
Category Included Items (e.g.) Curbside Recyclable Material (EPR)1 Packaging and Printed Paper Materials that are collected from the residential
sector (Managed by Recyclable BC) Containers and Paper Recyclable Materials1
Packaging and Printed Paper Materials from the commercial sector
Depot Recyclable Material (EPR) Deposit Containers, Electronics, Batteries, Used Oil, and Containers, etc.
Wasted Food Edible or donatable food
Inedible Organic Materials Inedible food scraps, yard waste, and compostable paper
Recyclable C&D Materials Cardboard, Drywall, Masonry (concrete/asphalt), Clean Wood, and Metals
Textiles All textiles
Bulky Objects Furniture and Mattresses
1Curbside Recyclable Material and ICI Paper and Printed Packaging are the same materials. In the residential sector, these materials are managed by Recycle BC. In the ICI sector, materials are not managed by a product stewardship program.
Table 2-4 presents the potential waste diversion according to material categories and sector. The purpose of this table is to assist in understanding:
Areas with room for improvement which could be targeted by programs outlined in the SWMP; and
The effect that waste reduction and diversion programs could have on the overall waste stream, including the effect that they could have on diversion and disposal rates.

TECH MEMO 3 – FINANCIAL ASSESSMENT AND STRATEGIES SELECTION FILE: 704-SWM.PLAN03006-01 | JUNE 28, 2018 | ISSUED FOR REVIEW
7 180619_TM3_Financial and Technical Analysis
Table 2-4: Potential Waste Diversion
Current CVRD Disposal = 358 kg/capita
Provincial Goal = 350 kg/capita CVRD Goal = 250 kg/capita by 2025 (to be confirmed)
Sector
Contribution to Landfill by
Sector (percent and
tonnes)
Material Type
Material
Contribution to Landfill (tonnes)1
Target Disposal Rate (kg/capita)
325 300 250 150
16% of divertable
materials is removed from
the current waste stream
28% of divertable
materials is removed from
the current waste stream
50% of divertable
materials is removed from
the current waste stream
97% of divertable
materials is removed from
the current waste stream
Single-Family (Municipalities)
9% (2,600)
Curbside Recyclable Material 269 54 75 134 261
Depot Recyclable Material (EPR) 204 41 57 102 198
Wasted Food 322 64 90 161 313
Inedible Organic Materials 463 93 130 232 449
Recyclable Building Materials 71 14 20 35 69
Textiles 204 41 57 102 198
Bulky Objects 4 1 1 2 4
Single-Family (Electoral Areas)
14% (4,100)
Curbside Recyclable Material 326 65 91 163 316
Depot Recyclable Material (EPR) 274 55 77 137 266
Wasted Food 797 159 223 399 773
Inedible Organic Materials 975 195 273 487 945
Recyclable Building Materials 173 35 48 86 168
Textiles 279 56 78 139 270
Bulky Objects 0 0 0 0 0
Multi-Family 6% (1,700)
Curbside Recyclable Material 253 51 71 126 245
Depot Recyclable Material (EPR) 165 33 46 83 160
Wasted Food 292 58 82 146 284
Inedible Organic Materials 376 75 105 188 365
Recyclable Building Materials 27 5 8 14 26
Textiles 89 18 25 44 86
Bulky Objects 0 0 0 0 0
Industrial, Commercial, Institutional
42% (12,800)
ICI Paper and Printed Packaging 1,627 325 456 814 1,578
Depot Recyclable Material (EPR) 709 142 198 354 688
Wasted Food 4,400 880 1,232 2,200 4,268
Inedible Organic Materials 2,302 460 644 1,151 2,233
Recyclable Building Materials 326 65 91 163 316
Textiles 569 114 159 284 552
Bulky Objects 52 10 15 26 50
Self-hauled Waste
12% (3,600)
Curbside Recyclable Material 184 37 51 92 178
ICI Paper and Printed Packaging 0 0 0 0 0
Depot Recyclable Material (EPR) 282 56 79 141 273
Wasted Food 74 15 21 37 72
Inedible Organic Materials 105 21 29 53 102
Recyclable Building Materials 691 138 193 345 670
Textiles 275 55 77 138 267
Bulky Objects 465 93 130 233 451
Construction and Demolition Materials
18% (5,300)
Curbside Recyclable Material 46 9 13 23 44
ICI Paper and Printed Packaging 0 0 0 0 0
Depot Recyclable Material (EPR) 120 24 34 60 116
Wasted Food 0 0 0 0 0
Inedible Organic Materials 61 12 17 30 59
Recyclable Building Materials 46 9 13 23 45
Textiles 61 12 17 30 59
Bulky Objects 175 35 49 87 169
Disposal Reduction (tonnes) from 30,100 3,626 5,077 9,066 17,588
Resulting Per Capita Disposal Rate (kg/capita) from 358 kg/capita 325 300 250 150 1Red cells indicate a large diversion potential (greater than 500 tonnes); orange cells indicate a medium diversion potential (200 to 500 tonnes) The sectors with the greatest opportunity for additional diversion include the ICI sector, multi-family households and single family homes who do not have organic diversion programs.

TECH MEMO 3 – FINANCIAL ASSESSMENT AND STRATEGIES SELECTION FILE: 704-SWM.PLAN03006-01 | JUNE 28, 2018 | ISSUED FOR REVIEW
8 180619_TM3_Financial and Technical Analysis
2.5 Financials and Staffing
This sub-section summarizes the financial and staffing resources for the CVRD.
2.5.1 Financials The CVRD Recycling and Waste Management Division operates on an annual budget of approximately $9.6 million. This is divided between two functions which deal with solid waste management planning and operation of regional Recycling Centres, and curbside collection of garbage and recyclable materials for residents living in Electoral Areas. Table 2-5 summarizes the budgets for the two sections and the funding source.
Table 2-5: 2018 Budget Summary
Budget Budget Amount Funding Source 520 Solid Waste Management Complex ~$8.0M Requisition
Tipping fees 515 Curbside Collection ~$1.6M Annual User fees
RecycleBC The annual budget does not include capital expenditures, or curbside collection programs that are implemented by member municipalities. Capital expenditures budgeted in 2018 were $3.9M which included costs for construction of the Meade Creek Recycling Centre.
The overall expenditures for the CVRD for 2018 is summarized in the following Table 2-6 and Figure 2-3.
Table 2-6: Summary of 2018 Expenditures
Expense Categories Total Garbage Disposal $2,706,200 Operations - Disposal $1,482,232 Curbside Collection - Garbage $197,963 Curbside Collection - Recycling $418,563 Operations - Recycling $1,947,945
Reduction and Recycling Programs $395,145
Planning, Operations Support, and Execution $768,345 Debt $731,043 CVRD Internal Allocations $585,417 Legal & Administrative $331,245
Total $9,564,100

TECH MEMO 3 – FINANCIAL ASSESSMENT AND STRATEGIES SELECTION FILE: 704-SWM.PLAN03006-01 | JUNE 28, 2018 | ISSUED FOR REVIEW
9 180619_TM3_Financial and Technical Analysis
Figure 2-3: CVRD Expenditures
2.5.2 Staffing The Recycling and Waste Management Division is led by a manager, who oversees three Environmental Technologists and a Superintendent. Based at the Ingram Street office, the Environmental Technologists are mainly responsible for planning, budgeting and program administration. Their work is supported by administrative support staff who also provide Recycling Hotline services. The Superintendent is responsible for operations staff which include site attendants and truck drivers, and are based at the Bings Creek Recycling Centre. Operations staff are responsible for program operation including curbside collection, roll-off container hauling, and operation of the Bings Creek Transfer Station and Recycling Centre and two satellite Recycling Centres at Peerless Road (Ladysmith) and Meade Creek (Lake Cowichan). An organization of the division is illustrated below.
Garbage Disposal28%
Operations -Disposal
16%
Curbside Collection -Garbage
2%
Curbside Collection - Recycling4%
Operations -Recycling
20%
Reduction and Recycling Programs
4%
Planning, Operations
Support, and Execution
8%
Debt8%
CVRD Internal Allocations
6%
Legal & Administrative
4%

TECH MEMO 3 – FINANCIAL ASSESSMENT AND STRATEGIES SELECTION FILE: 704-SWM.PLAN03006-01 | JUNE 28, 2018 | ISSUED FOR REVIEW
10 180619_TM3_Financial and Technical Analysis
2.6 Additional Planning Inputs
The following section outlines the roles of the various players in the waste management system, and explains how policy tools can be applied. These will help to inform the SWMP Update.
2.6.1 Waste Management Plan System Participants Table 2-7 provides a list of the various organizations that contribute to municipal solid waste management in the CVRD.
Table 2-9: Municipal Solid Waste Management Participants
Who Roles in Solid Waste Management
Federal Government Regulates waste management facilities under federal jurisdiction
Provincial Government Approves Solid Waste Management Plans as regulated through the Environment Management Act
Regulates Extended Producer Responsibility (EPR) programs through the Recycling Regulation
Authorizes discharges to the environment through permits and operational certificates
Responsible for enforcement of Provincial regulations and the conditions set out in discharge permits and operational certificates
Various Ministries have several other regulatory authorities related to waste management
Figure 2-4: Organization Chart for CVRD Recycling and Waste Management Division

TECH MEMO 3 – FINANCIAL ASSESSMENT AND STRATEGIES SELECTION FILE: 704-SWM.PLAN03006-01 | JUNE 28, 2018 | ISSUED FOR REVIEW
11 180619_TM3_Financial and Technical Analysis
Who Roles in Solid Waste Management
Cowichan Valley Regional District Develops plans to provide big picture oversight of waste management in the region Owns and operates public waste management facilities Through regional plans and plan implementation (including bylaws), works to meet
regional waste disposal goals and targets and ensures that the communities have access to facilities and services
Collaborates and cooperates with local organizations, businesses and agencies to implement plans and new programs
Ensures that legislative and policy requirements are followed, including monitoring and reporting
Supports the provision of EPR programs in the CVRD Provides waste management related education and promotion of programs
CVRD Member Municipalities Collaborate with CVRD to support SWMP Update implementation, provide collection services, and consult with CVRD on operational activities under regional jurisdiction.
Extended Producer Responsibility (EPR) Producers and Agencies
Ensures reasonable and free consumer access to collection facilities Collects and processes stewarded products Coordinates local government delivery as a service provider where applicable Provides and/or funds education and marketing Provides deposit refunds to consumers (where applicable) Monitors and reports on key performance indicators such as recovery rates to the
Province on a regional district basis (when possible)
First Nations Communities Provides waste management services to residents and businesses
Non-Profit Sector Applies for waste reduction funding through the available grant programs Engages in and promotes reuse and upcycling
Residents and Businesses Responsible for carrying out proper waste reduction, recycling and disposal activities
Collaborates and cooperates with local government initiatives Provides collection, processing, and infrastructure needs for solid waste
management
Neighbouring Jurisdictions Identifies and engages in opportunities for collaboration and cooperation
2.7 Policy Tools
Policies and bylaws have an important role in defining how solid waste should be managed in the CVRD. They can be applied to further overcome obstacles related to promoting diversion. The following sub-sections describe current CVRD solid waste bylaw components as well as provide an overview of how effective implementation of disposal ban bylaws can inform strategy implementation.
2.7.1 CVRD Bylaw Overview The CVRD has adopted bylaws that promote sound environmental management for regional waste systems, and which support the CVRD’s waste reduction and diversion goals. There are five solid waste bylaws that inform the CVRD’s solid waste management system. The disposal bans regulated under the Solid Waste Management Charges & Regulations Bylaw could be adjusted as noted below.
Bylaw No. 3716 – Smoke Control Regulation Bylaw, 2013

TECH MEMO 3 – FINANCIAL ASSESSMENT AND STRATEGIES SELECTION FILE: 704-SWM.PLAN03006-01 | JUNE 28, 2018 | ISSUED FOR REVIEW
12 180619_TM3_Financial and Technical Analysis
− Description – the Smoke Control Regulation Bylaw aims to reduce air pollution from smoke by restricting backyard burning of yard waste to two, one-month periods during the spring and fall. Other restrictions, including minimum set-backs and limits to the types of material that can be burned, also apply.
Bylaw No. 2020 – Landclearing Management Regulation Bylaw, 2006
− Description – the Landclearing Management Regulation Bylaw also aims to reduce air pollution from burning. Targeted at developers, this bylaw bans the open burning of large or machine-stacked quantities of landclearing debris, and requires that debris be burned in an air curtain burner, or chipped, ground or transported off-site. Forestry and agricultural burns are exempt.
Bylaw No. 2570 – Waste Stream Management Licencing Bylaw, 2004
− Description - This bylaw authorizes the CVRD to licence any private waste management facility. Facilities are issued operating licences by the CVRD and are monitored to ensure they meet stated management, volume and performance targets.
Bylaw No. 1958 – Garbage and/or Recyclable Materials Collection Bylaw, 1999
− Description - Garbage and/or Recyclable Materials Collection Bylaw – regulates the curbside collection program including bin sizes and annual fees. Currently the CVRD runs a user pay system where residents that use larger garbage totes pay more per year. Available tote sizes are: 140L (standard offer), 240 and 360L. Recycling totes come in the same sizes (standard offer is 360L) but the fee is the same regardless of size.
Bylaw No. 2108 – Solid Waste Management Charges & Regulations Bylaw, 2000
− Description - This bylaw regulates all activities at Recycling Centres and transfer stations including accepted materials and rates. The bylaw also sets out a free tipping policy for clean up of illegally dumped waste. Recyclable materials are banned for disposal (and subject to fines of double the tip fee i.e. $280/tonne). Recyclable materials not currently banned from disposal include:
• Glass containers
• Non-commercial organic waste (i.e. compostable organic material from residential generators)
− Commercial organic waste (i.e. organic waste from ICI generators) is currently banned but has not been enforced or widely promoted for several years. Introduction of a full organics disposal ban or any other material ban would require amendment of the bylaw. See Section 1.4.2.2 Disposal Bans for more information about how bans can be effectively implemented.
2.7.2 Disposal Bans Many regional districts and municipalities implement disposal bans on recyclable and compostable materials to encourage and/or mandate source-separation and diversion without relying solely on variable tipping fees. This is a low-cost policy tool used to signal to waste generators and waste collection companies that there is an expectation to separate and recycle/compost specific materials that have available alternatives (e.g. cardboard, metal, yard waste).
Disposal bans are enforced at the point of disposal (i.e. at transfer stations and landfills) through the application of significant surcharges on garbage found to contain banned materials. To ensure sustained success, disposal bans require the local government to work closely with waste generators (residential and ICI sectors) and waste haulers to design, start up and maintain this policy. Several regional districts have followed these steps when implementing disposal bans:
TECH MEMO 3 – FINANCIAL ASSESSMENT AND STRATEGIES SELECTION FILE: 704-SWM.PLAN03006-01 | JUNE 28, 2018 | ISSUED FOR REVIEW
13 180619_TM3_Financial and Technical Analysis
1. Regulate (decide to ban a waste stream with a readily available alternative to landfilling)
2. Collaborate (work with affected stakeholders to determine the timing of implementation and the ramp up of behaviour change-oriented technical assistance support and programming and enforcement measures)
3. Educate (make sure all haulers and waste generators are aware of the upcoming new disposal ban, and plan to communicate regularly)
4. Enforce (enforce the disposal ban at the point of disposal).
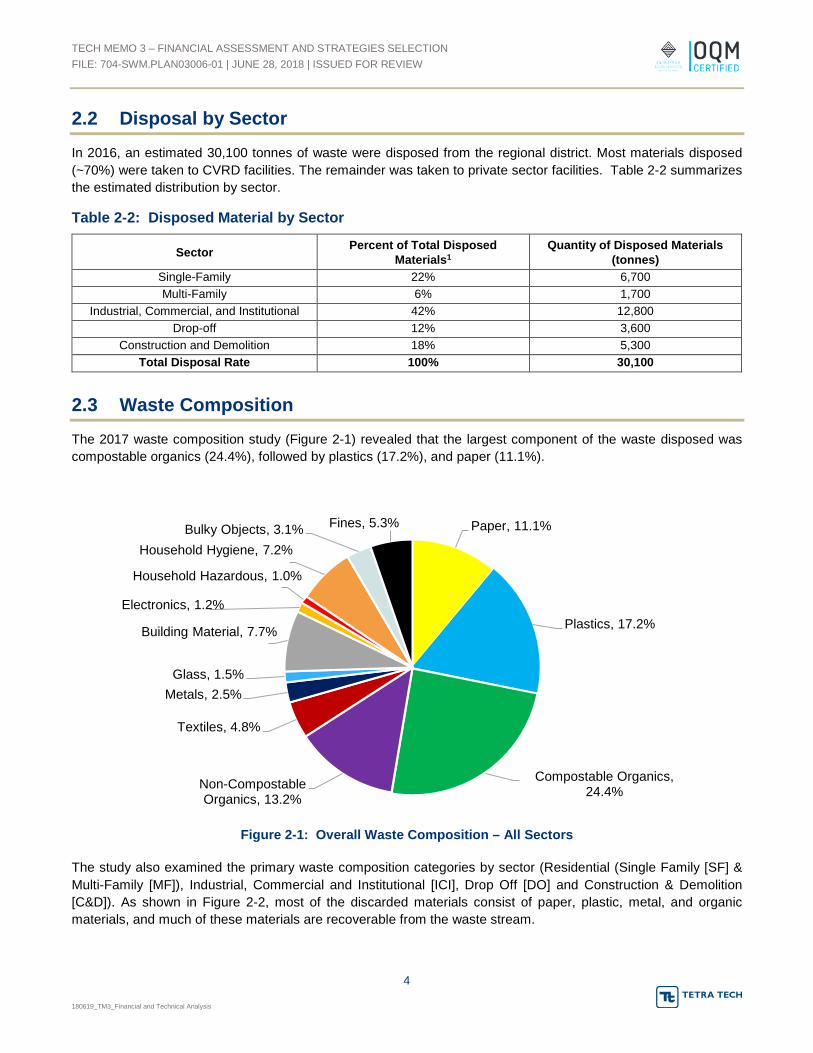
Approaches to Disposal Ban Enforcement
The approach to enforcing disposal bans has evolved over the last decade as regional districts have gained more experience with this policy tool. Enforcement is only one component of an integrated approach to implementing a disposal ban. As indicated in Figure 2-5, collaboration with waste haulers and generators is essential not only during the design of a disposal ban but also during implementation.
Many regional districts have discovered that the need to enforce a disposal ban is short-term and minimal if adequate up-front collaboration with waste haulers, supported by effective education of waste generators, results in diversion becoming “business-as-usual”. In effect, waste haulers become the enforcers since the implementation of a disposal ban provides them with an opportunity to increase their market share if they can provide more cost-effective collection options to their customers.
Figure 2-5: Integrated Disposal Ban Design and Implementation
Local governments need to provide resources to support enforcement efforts. There are a number of approaches with respect to disposal bans on cardboard, mixed waste paper and scrap metal. In the Capital Regional District, dedicated bylaw enforcement officers work on the landfill inspecting loads at the working face and issuing fines if required. In the RDN, bans are enforced at the landfill by RDN equipment operators who notify a supervisor to
DiversionOpportunities
Collaborate
Regulate
Educate
Enforce

TECH MEMO 3 – FINANCIAL ASSESSMENT AND STRATEGIES SELECTION FILE: 704-SWM.PLAN03006-01 | JUNE 28, 2018 | ISSUED FOR REVIEW
14 180619_TM3_Financial and Technical Analysis
inspect the load, take pictures and then advise the scale clerk to apply a surcharge to the load. This information is then passed on to a Zero Waste Compliance Officer who follows up with the hauler and generator to educate then on compliance options. In Metro Vancouver, contactors are hired to inspect load entering their facilities and issue fines (i.e. 50% load surcharge) when material ban limits are exceeded.
It is important to note that the goal of the surcharge is not to make money for the regional district but to provide an opportunity to educate and maintain enforcement efforts. In most cases the first infraction results in a warning while the second infraction results in a surcharge. Most infractions occur within the first six to twelve months of ban implementation after which fines become minimal as waste diversion becomes business as usual.
Metro Vancouver refined this approach with the introduction of their food scraps disposal ban in January 2015. From 2012-2013, Metro Vancouver planned their organics diversion strategy in collaboration with stakeholders and then released their implementation strategy in 2014. The strategy was based on a phased implementation approach as illustrated in Figure 2-6 below. Although the ban was effective January 2015, the first six months was considered as an education period with no surcharge on tipping fees. However, from July to December 2015, if a hauler arrived with a load at a transfer station or disposal facility containing more than 25% food scraps, a 50% surcharge was applied to their tipping fee. This 20% threshold was reduced to 10% in 2016 and then down to 5% in 2017.
Figure 2-6: Metro Vancouver Organics Disposal Ban Phased Implementation
Although Metro Vancouver hired contracted enforcement staff at their facilities to inspect incoming loads for food waste, most regional districts have used their own staff to enforce disposal bans on a wide range of materials. This is because, as discussed above, enforcement activity is usually short-term while waste generators and haulers adjust to new waste management behaviours.
Metro Vancouver’s phased approach was extremely successful and has been adopted by other regional districts as they introduce their own disposal bans. Most recently, in 2017 the Regional Districts of Fraser-Fort George and Bulkley Nechako approved a commercial cardboard diversion program that will apply phased surcharges and thresholds to loads containing cardboard. This program will be implemented by regional staff.

TECH MEMO 3 – FINANCIAL ASSESSMENT AND STRATEGIES SELECTION FILE: 704-SWM.PLAN03006-01 | JUNE 28, 2018 | ISSUED FOR REVIEW
15 180619_TM3_Financial and Technical Analysis
3.0 AREAS FOR IMPROVEMENT
While the CVRD is a leader in recycling and waste diversion, there are several areas where improvements can occur. The following potential areas of improvement are listed below.
3.1 Reduce and Reuse
Opportunities exist to improve waste management at the top of the waste prevention hierarchy. These include the following:
Reducing wasted food at the residential and commercial level
Enhancing and improving reuse opportunities
3.2 Recycling
More than half of the garbage generated in the region comes from ICI and Multi-Family generators. Waste composition results that were completed in 2017 indicate there are recyclable or compostable materials that can be diverted from disposal. Developing and enforcing material disposal bans can potentially enhance waste diversion rates from the largest waste sectors and this would promote a more consistent message for waste management practices in the regional district.
Removing barriers and providing convenient access to recycling opportunities is an important strategy for improving recycling rates within residential, MF and ICI sectors. In the CVRD, the majority of residents are within a fifteen-minute drive of a public recycling drop-off depot. The lack of a public drop-off depot in the south end means that the more than 18,000 residents in Electoral Areas A, B and C must drive further to access the same level of service, or that alternative service models are required to provide equitable access to service. Many households in the region also do not have access to garbage or organics collection services at curbside. Options to enhance services are required to enable more recycling and diversion to occur.
Organics management is a big reason why the CVRD has one of the lowest disposal rates in the Province. Although organics diversion is well established in the regional district, over 33,000 residents in Electoral Areas do not have organics collection. Furthermore, the organic processing facilities are accepting more and more materials, much of which is coming from outside of the region. The success of these facilities is resulting in processing challenges that are creating unacceptable odours and impacting residents and businesses in their respective areas. Improving standards in a fair and equitable manner is required to ensure the success of the organics processing industry in the CVRD.
Recycling processing capacity is limited for commingled ICI recyclable materials and for C&D materials. Options to expand processing capabilities for these materials could be improved.
3.3 Residual Management
Approximately 30,000 tonnes of waste is disposed from the CVRD annually. There are also several historic disposal facilities that require ongoing maintenance and monitoring to ensure the environment is not compromised. Several strategies to improve residue management should be considered. Shipping and disposing refuse to landfills in the United States has additional financial, political, and environmental risks to manage. Options to improve residual

TECH MEMO 3 – FINANCIAL ASSESSMENT AND STRATEGIES SELECTION FILE: 704-SWM.PLAN03006-01 | JUNE 28, 2018 | ISSUED FOR REVIEW
16 180619_TM3_Financial and Technical Analysis
management should be investigated and evaluated. In addition to residual management options, plans should be developed for the management of disaster debris, difficult to dispose items and illegal dumping.
4.0 STRATEGIES FOR CONSIDERATION
Options presented below take into consideration the existing solid waste management system and are presented in order of the waste prevention hierarchy.
4.1 Strategy 1: Reduce and Reuse Opportunities
This SWMP review process has identified issues and associated program and policy options available to reduce the current disposal rate of 358 kilogram per capita. The issues and options are summarized below.
4.1.1 Strategy 1A: Reduce Wasted Food from Residential and Industrial, Commercial, and Institutional (ICI) Sectors
Issues:
Approximately 1,400 tonnes of edible and donatable food is being wasted by the residential sectors (single family and multi-family).
Approximately 3,100 tonnes of edible food and 1,300 tonnes of donatable food is being wasted by the ICI sector.
These numbers reflect the food currently being disposed. Since municipalities in the CVRD have mature, well-established food scraps collection programs, it is likely that edible or donatable food is being recycled in municipal curbside organics programs as well. The amount of edible and donatable food wasted overall is estimated to be 6,700 tonnes. Preventing food from being wasted will reduce the amount of organics requiring processing and greenhouse gas emissions. The production of wasted food is estimated to release 1,600 kg of CO2 per tonne of wasted food.
4.1.1.1 Promote Residential Food Waste Reduction Food waste reduction and rescue has become paramount in recent years. The United Nations Food and Agriculture Organization (FAO) estimates that a third of food produced for human consumption is lost or wasted globally, amounting to 1.3 billion tonnes of food per year. In British Columbia, the Ministry developed food waste reduction tools1 for residential and commercial sectors including a Food Waste Reduction Toolkit tailored to municipalities.
The CVRD could consider adopting a well-established residential food waste prevention campaigns such as “Love Food Hate Waste”. This program was designed by Waste and Resources Action Programme (WRAP – an UK organization) and is being utilized by several Canadian municipalities. The National Zero Waste Council adapted the “Love Food Hate Waste” program for Canadian municipalities and has resources available to share with participating jurisdictions2. The national launch of “Love Food Hate Waste” is planned for May 2018. It is designed to raise awareness to reduce the amount of wasted food by partnering with business and government to design and implement campaigns and tools to actively promote behaviour change. CVRD could consider participating in “Love Food Hate Waste” as a local implementing partner.
1 BC Ministry of Environment and Climate Change Strategy, 2017. Food Waste Reduction Tools & Resources.
http://www2.gov.bc.ca/gov/content/environment/waste-management/recycling/organics/tools-resources 2 Metro Vancouver, 2017. Love Food Hate Waste Canada. http://www.lovefoodhatewaste.ca
TECH MEMO 3 – FINANCIAL ASSESSMENT AND STRATEGIES SELECTION FILE: 704-SWM.PLAN03006-01 | JUNE 28, 2018 | ISSUED FOR REVIEW
17 180619_TM3_Financial and Technical Analysis
4.1.1.2 Build Local Food Rescue Capacity for the ICI Sector The CVRD could move towards improved food rescue capacity through the following actions:
Convening with stakeholders who may have a surplus or shortage of food (e.g. large food producers and food banks);
Creating a database of stakeholders who may have a surplus or shortage of food;
Advocating to provincial and federal governments for a tax incentive to encourage businesses to donate surplus food;
Creating toolkits and platforms that allow businesses and residents to learn how surplus food can be donated and utilized;
Collaborating with Island Health (Health Authority) to define safe food donation practices; and
Collaborating with local non-profit organizations dedicated to food rescue.
4.1.2 Strategy 1B: Explore Reduction and Reuse Opportunities Issues:
There are opportunities to enhance the CVRD’s programs at the top of the waste prevention hierarchy (reduction and reuse) to reduce waste, associated environmental impacts and financial implications.
Free stores are located at all CVRD Recycling Centres, where residents pay standard tipping fees to drop off items but may take items for free. These initiatives – plus potentially partnering with charities – could be built upon to more actively capture textiles. There are also local reuse opportunities through online platforms such as UsedCowichan and Kijiji.
Other platforms for reuse could also be explored, such as repair cafes, tool libraries, or building supply reclamation. The CVRD could support these programs through:
Collaborating with municipalities on zoning for these types of spaces and/or businesses to reduce barriers for entrepreneurs and residents to set up these types of organizations;
Providing grants for organizations to implement these initiatives; and
Convening with stakeholders working in this space to identify opportunities for expansion.
4.1.3 Strategy 1C: Support Bans On Single-Use Plastic Bags and/or Other Single-Use Items
In January 2018, the City of Victoria adopted a new Checkout Bag Regulation Bylaw, wherein businesses are not allowed to sell or provide customers with single-use plastic bags. Similarly, the City of Vancouver is developing a Single-Use Item Reduction Strategy that explores waste reduction approaches for disposable cups, bags, and takeout containers.
While there are jurisdictional limitations to directly implementing product bans, the CVRD could explore similar programs and mechanisms used in other jurisdictions, such as advocating for senior government policy change and supporting municipal bans on specific items. The CVRD can also adopt policies or develop mandates to support bans or the reduction of Single-Use items within in the regional district.

TECH MEMO 3 – FINANCIAL ASSESSMENT AND STRATEGIES SELECTION FILE: 704-SWM.PLAN03006-01 | JUNE 28, 2018 | ISSUED FOR REVIEW
18 180619_TM3_Financial and Technical Analysis
4.1.4 Strategy 1D: Advocate for Expansion of EPR Programs Issues:
The CVRD currently accepts mattresses and bulky furniture at Bings Creek for recycling, however, recycling of these items is currently funded through tipping fees because there are no EPR programs for these items.
579 tonnes of textiles are disposed by the residential sector and 569 tonnes are disposed by the ICI sector. These materials are recyclable but are not managed by an EPR Program.
The Canadian Council for Ministers of the Environment (CCME) continues to provide guideline updates for Canada-wide implementation of EPR programs. Products not yet in the BC Recycling Regulation that are recommended for Canada-wide EPR include carpet, textiles, and furniture. CVRD can continue to stay abreast of industry trends through conferences and annual updates as provided by the CCME and the BC Product Stewardship Council (BCPSC). There is also an opportunity to advocate for new programs through direct correspondence with the Ministry or through associations of which CVRD is a member (e.g. British Columbia Product Stewardship Council).
The CVRD currently accepts mattresses and bulky objects at Bings Creek and has a contract with a private sector entity to process these materials. More than 12,000 mattresses have been collected since the program’s implementation in 2012. The CVRD funds this recycling initiative by charging high tipping fees for these materials. The CVRD’s management of materials such as mattresses and bulky furniture presents an opportunity to justify the expansion of EPR to these materials. Several regional districts in the Province have also implemented similar programs.
4.2 Strategy 2: Reduce Disposal from Multi-Family Residential and ICI
Issues:
Residential comingled recyclables such as paper and plastic containers (often referred to as “Blue box” materials), make up 13% of the ICI disposal stream and 15% of the multi-family disposal stream (compared to 9% in the single-family sector);
Compostable organic materials make up 52% of the ICI disposal stream and 39% of the multi-family stream (compared to 23% from the single-family sector that have garbage, recycling, and organics collection);
The multi-family sector annually disposes approximately 250 tonnes of “blue box” material and 670 tonnes of organic materials;
The ICI sector annually disposed of 1,630 tonnes of “blue box” material and 6,700 tonnes of organic materials; and
Nearly one-third (9,250 tonnes) of the waste disposed is recyclable or compostable material from the multifamily and ICI sectors.
4.2.1 Strategy 2A: Mandate Source Separation for Multi-Family and ICI Sector Adopt policies and update existing bylaws to require waste haulers who service multi-family buildings and the ICI sector to provide recycling and organics receptacles. These types of source separation requirements exist in almost all municipalities in Metro Vancouver. As a part of this strategy, behaviour change and enforcement measures should be considered, such as technical assistance support, waste audits of generators, bin checks, cameras on collection vehicles, and surcharges for not having all collection services in place.

TECH MEMO 3 – FINANCIAL ASSESSMENT AND STRATEGIES SELECTION FILE: 704-SWM.PLAN03006-01 | JUNE 28, 2018 | ISSUED FOR REVIEW
19 180619_TM3_Financial and Technical Analysis
Further to the proposed mandates, resources will be required to develop education materials, prepare proper signage, engage with stakeholders and monitor progress on a regular basis.
4.2.2 Strategy 2B: Collection Services Review for Multi-Family and ICI Sector A collection services review should be undertaken for the multi-family and ICI sector to determine whether the service should be provided by either the public or private sector. Having the garbage and divertible materials be managed by separate sectors is not ideal because of competing interests. Stakeholder consultation should be conducted to determine the most efficient and effective approach to maximizing the diversion of recyclable and compostable materials from disposal.
4.2.3 Strategy 2C: Organics and Material Disposal Bans The CVRD has some material disposal bans in place for recyclable and commercial organic materials. Adoption of a full organics disposal ban across sectors has been shown to have a considerable impact on increasing organics capture and reducing garbage. Robust promotion of the disposal bans along with behaviour change programs and stricter enforcement of these bans can improve adherence to bylaws. In communities that enforce material disposal bans and apply surcharges for non-compliance, haulers would be fined for loads containing a certain amount of the banned materials. These enforcement actions can reinforce collaboration opportunities between the CVRD and other key stakeholders such as collection service providers. Disposal bans can also motivate haulers to work with their customers to provide adequate service levels and behaviour change programs. Customers who resist adopting the new services would be charged a higher rate that would account for financial penalties.
4.3 Strategy 3: Reduce Disposal from Residential Sector
Issues:
Most residents in the regional district are within a fifteen-minute drive of a publicly funded Recycling Centre; however, the lack of a public Recycling Centre in the south end means that the more than 18,000 residents in Electoral Areas A, B, and C do not share the same level of access
Residents in Electoral Areas A, B, C and H are also not provided with a public curbside garbage collection service; service is available privately but not all residents are required, or able, to access it
Over 33,000 residents in the CVRD (mostly living in Electoral Areas) do not have public sector organics collection. Residents in areas with no organics collection, either public or private, have 13% more organics in the garbage than in areas with organics collection.
4.3.1 Strategy 3A: Provide Equal Access to Publicly Funded Recycling Programs The 2006 SWMP included a plan to develop a public drop off depot in the south end of the CVRD, to service Electoral Areas A, B, and C. Facility siting efforts were unsuccessful in 2011. In the interim, the CVRD has developed agreements with private facilities in Cobble Hill that allow south end area residents to drop off recyclables such as packaging and printed paper, and yard waste, for free. Other materials, including garbage, are accepted for a fee and are not covered under current agreements with the CVRD.
An assessment could be completed to determine whether a public south-end facility could be built or purchased. The key difference between public and private drop-off facilities is access to funding from taxes, which can allow public facilities to better support diversion programs over the long-term, and to reduce up-front drop off costs. In the CVRD, the majority of recyclable materials are accepted for free, while private facilities must charge a minimum

TECH MEMO 3 – FINANCIAL ASSESSMENT AND STRATEGIES SELECTION FILE: 704-SWM.PLAN03006-01 | JUNE 28, 2018 | ISSUED FOR REVIEW
20 180619_TM3_Financial and Technical Analysis
drop-off fee to ensure operating costs are covered. This analysis should include community consultations to determine:
The desire for a public drop-off facility;
Understanding of community’s preference for a public south-end depot versus expanded curbside collection; and
The willingness to fund a public drop-off facility where nearly all recyclable materials are accepted for free and garbage disposal is a user pay system.
Alternatively, the CVRD should also consider whether expanding or extending an agreement with private facilities to service the south end of the regional district is more effective and efficient. The existing agreement allows residents to drop off yard waste and recyclable materials that are managed by Recycle BC (Packaging and Printed Paper) for free. At this time, there is a $5 minimum drop off fee for other materials. The CVRD could explore expanding this agreement so that residents in the south end have access to the same service levels as residents who use CVRD Recycling Centres and do not pay a minimum drop off fee for recyclables.
4.3.2 Strategy 3B: Expand Universal Curbside Collection Services to be Consistent Across the Region
Universal curbside collection programs as compared to opt in programs (public or private) keeping consistent with the CVRD’s current user pay approach have been shown to significantly increase diversion. Universal garbage collection can also reduce frequency of illegal dumping. As part of this strategy, a review to determine the most efficient and cost effective collection methods should take place along with an assessment of what materials are to be collected (e.g. yard trimmings plus food scraps vs. food scraps only, monthly glass collection). These can be implemented in house or through the provision of a contract.
As more BC jurisdictions adopt curbside collection of source separated materials, the capture rate for diverted items increased and garbage decreases by up to 40% by weight source separation.
The 2017 waste composition study showed that households with curbside organics collection have less organics in the garbage than household with optional organics collection or without organics collection, as presented in Table 4-2. The differences in composition is primarily due to increased food waste (and not due to yard waste from larger rural properties).
Service levels and cart sizing will need to be reviewed to determine the most effective and efficient approach for the regional district.
Table 4-2: Correlation of Organics in Garbage to Varying Service Levels
Service Level Description Areas Proportion of Organics in Garbage Mandatory organics collection All municipalities 23% Optional organics collection Electoral Areas A-C 30%
No organics collection Electoral Areas D-I 36%
4.4 Strategy 4: Improve Organics Processing
Issues:
Organics processing and diversion is one of the main reasons for high diversion rates in the CVRD.

TECH MEMO 3 – FINANCIAL ASSESSMENT AND STRATEGIES SELECTION FILE: 704-SWM.PLAN03006-01 | JUNE 28, 2018 | ISSUED FOR REVIEW
21 180619_TM3_Financial and Technical Analysis
There are several organic processing facilities in the CVRD and many are generating unacceptable odour that are impacting residents and businesses.
The amount of organics being processed continues to grow as more organics from outside the region are being imported to facilities in the CVRD.
Facilities that process more organics than what they were designed to receive are susceptible to odour incidents. Odour complaints have been an issue in recent years in several nearby regional districts such as Metro Vancouver, Capital Regional District, and Regional District of Nanaimo. Unacceptable odour incidents have led to closure of several organic processing facilities in other regions in the last five years using various instruments.
Organics processing facilities are regulated under the Provincial Organic Matter Recycling Regulation (OMRR) and the CVRD licences solid waste management facilities such as composting facilities.
4.4.1 Strategy 4A: Best Management Practices for Odour Management The CVRD and neighbouring regional districts are very successful in diverting organics from disposal. This success is putting pressure on processing facilities to manage odours and prevent impacts to neighbouring properties. Often processors are accepting more material than originally intended and best available control technology (BACT) are not being upgraded to account for the additional material. Third party verification of capital and operational works should be conducted to assess and explore opportunities to incorporate advanced processes or technologies for organics processing that may reduce odour impacts to the environment and receptors. Fair and equitable standards should be developed to ensure sustainable operation of organic processing facilities in the CVRD.
4.4.2 Strategy 4B: Ensure Priority for Locally-Generated Organics Processing An increase to organics diversion within the region may put pressure on local processing capacity. The CVRD may need to consider mechanisms to secure local processing capacity to allow for the sustainable long-term operation of local diversion programs. There are currently no regulations that prevent organic materials from crossing regional district borders anywhere in British Columbia, and nearby regional districts have been unsuccessful in implementing this type of material flow regulations, so this would be a difficult undertaking.
4.4.3 Strategy 4C: Standardize Design Criteria to Protect Environment and Public Develop design criteria and emission/odour limits to ensure odours are less likely to impact the environment and public in the CVRD. The BC Ministry of Environment has standards that apply across the province. The CVRD with its licensing capabilities can impose stricter requirements if there are reasonable grounds for doing so. These standards would be over and above the provincial requirements and may be challenged by existing organic processing facilities.
4.5 Strategy 5: Processing and Transfer Capacity for Recyclables
Issues:
In 2006, most recyclable materials in the region were previously hauled to the Vancouver Island Recycling Centre which was located in the CVRD. This facility has since closed, and materials are hauled to out of region to material recovery facilities (MRFs) in either the Capital Regional District (Victoria) or the Regional District of Nanaimo (Nanaimo).
TECH MEMO 3 – FINANCIAL ASSESSMENT AND STRATEGIES SELECTION FILE: 704-SWM.PLAN03006-01 | JUNE 28, 2018 | ISSUED FOR REVIEW
22 180619_TM3_Financial and Technical Analysis
There are no facilities in the CVRD that accept comingled ICI recyclable materials and this material is typically hauled out-of-region or may not be collected at all because there is no local drop off location.
4.5.1 Strategy 5A: Feasibility Assessment for a Material Recycling Facility (MRF) Determine whether it is feasible and necessary to build or support development of a MRF in the CVRD. This should take into consideration RecycleBC requirements, any MRFs that are nearby and recommendations to identify the most feasible options.
4.5.2 Strategy 5B: Feasibility Assessment for Transfer Capacity for ICI Recyclables Recyclables from the residential sector are taken to the Bings Creek Transfer Station as per the RecycleBC arrangements. The CVRD could investigate options for the most feasible or cost-effective approach for managing ICI recyclables. This may include a feasibility study to assess the logistics and costs to accept comingled ICI recyclable materials at Bings Creek Transfer Station or at a private sector facility.
4.6 Strategy 6: Improve Management of Construction and Demolition (C&D) Materials
Issues:
Despite related disposal bans, there is still a significant portion of C&D materials in the garbage.
There is limited disposal capacity for hazardous C&D materials (asbestos, gypsum wallboard) and the material is costly to manage and properly dispose.
4.6.1 Strategy 6A: Monitor C&D Disposal and Recycling Activities in the Region C&D waste typically represents 25% to 35% of the waste stream, and recyclability of this material is typically in the order of 70% to 80%. The CVRD should conduct a C&D waste system analysis to determine how residents and businesses are managing C&D waste, where it is taken to and available capacity for managing this waste stream. This study can also assess the current recycling/waste diversion activities in the region and whether there is a need to develop mechanisms to further divert C&D materials from disposal.
4.6.2 Strategy 6B: Develop a C&D Waste Management Strategy As part of the SMWP update implementation process, the CVRD could undertake a planning process to develop a C&D waste management strategy for the region. This would take into consideration the results from the C&D waste system analysis, consult with key stakeholders (i.e. construction industry, C&D waste processor, waste haulers, municipalities, etc.) and develop a strategy that follows the goals and principles of the SWMP. The strategy would set capture targets and specify that materials are to be taken to permitted facilities.
4.6.3 Strategy 6C: Reduce Barriers to Disposing Hazardous Materials (asbestos, gypsum wallboard)
Asbestos and gypsum wallboard may currently be disposed at Coast Environmental (Duncan and Chemainus locations). However, it is expensive for residents to dispose of these materials. The CVRD may consider reducing barriers to legally disposing of these materials by providing a disposal subsidy.

TECH MEMO 3 – FINANCIAL ASSESSMENT AND STRATEGIES SELECTION FILE: 704-SWM.PLAN03006-01 | JUNE 28, 2018 | ISSUED FOR REVIEW
23 180619_TM3_Financial and Technical Analysis
4.7 Strategy 7: Residuals Management
4.7.1 Strategy 7: Feasibility Study of Alternative Disposal Options Issues:
The CVRD has one of the highest tipping fees in British Columbia.
Solid waste is exported to the Roosevelt Regional Landfill in Washington State, and the CVRD is responsible for transportation costs and the USD exchange rates.
Shipping waste across the Canada-USA border has many risks including fluctuation of the exchange rate, high transportation costs, challenges with marine traffic and potential border restrictions. The CVRD maintains a contingency disposal agreement with the Regional District of Nanaimo in the event exporting waste to the designated disposal facility is disrupted. It is recommended that the options for alternative and local disposal presented in Table 4-3 are explored. These options are not an exhaustive list. To ensure the efficiency of the disposal system, the CVRD should continue to explore the feasibility of alternative disposal mechanisms as opportunities arise.
Table 4-3: Options for Disposal
Option Description Continue Waste Export
Currently, waste is placed in shipping containers, barged to the mainland, transported by rail to Southeastern Washington State, and taken to the Roosevelt Regional Landfill for disposal. The empty shipping containers are brought back to the CVRD to be filled with waste again. This disposal program costs approximately $130/tonne. Alternative disposal locations closer to home will continue to be investigated, for opportunities to reduce transport costs and/or exposure to exchange rate fluctuations.
Disposal at Comox Valley Regional Landfill
A new landfill was recently opened in Comox Valley. Preliminary conversations have indicated that the Comox Valley Regional District may be open to receiving waste from the Cowichan Valley Regional District. The feasibility of disposal at the Comox Valley Landfill should be explored.
Waste to Energy (Public Facility)
Two recent studies reviewed the feasibility of a Waste to Energy (WTE) facility for southern Vancouver Island. Both studies determined that viable technology exists but is not economically feasible. However, the 2018 SWMP could revisit the creation of WTE infrastructure in the CVRD if it is desired by the PAC and public.
Waste to Energy (Private Facility)
It is possible that a new private WTE facility may be built within the Cowichan Valley. The feasibility of disposal at this potential WTE facility should be explored.
New CVRD Landfill Development
The CVRD tried to site a landfill in the mid-1990s. An appropriate site was not found; thus, waste has since been exported out of region. If it is desired by the PAC and the public, an initiative for the 2018 SWMP could be to site and build a new landfill.
4.8 Strategy 8: Augment Illegal Dumping Prevention Strategies
Issue:
Illegal dumping of materials occurs throughout the CVRD.
A campaign was conducted in 2016 to reduce illegal dumping in the Hillcrest Road area. Additionally, a “Free Tipping” policy was implemented in the early 2000s which provides financial incentives to non-profit organizations for cleaning up public lands or for appropriately disposing of waste dumped on their property.
However, illegal dumping continues to be a problem. The CVRD may wish to analyze the costs and ubiquity of illegal dumping to determine what other changes and programming may need to be made to existing strategies.

TECH MEMO 3 – FINANCIAL ASSESSMENT AND STRATEGIES SELECTION FILE: 704-SWM.PLAN03006-01 | JUNE 28, 2018 | ISSUED FOR REVIEW
24 180619_TM3_Financial and Technical Analysis
4.9 Strategy 9: Collection/Drop-off for HHW, Bulky Items and Organic Debris
Issues:
The CVRD has no options for residents to safely dispose of household hazardous materials which are not managed by an EPR program.
The CVRD has subsidized drop off but not have subsidized curbside collection for bulky items, such as furniture and mattresses, which may contribute to illegal dumping.
4.9.1 Strategy 9A: Round up event for HHW The CVRD could begin to accept household hazardous materials (which are not managed by an EPR program) at CVRD Recycling Facilities. This could be implemented on a periodic (annual or seasonal) or year-round basis. The CVRD may also wish to create agreements (or expand existing agreements) with private facilities to subsidize them to accept these materials.
The CVRD could begin to accept household hazardous materials (which are not managed by an EPR program) at CVRD Recycling Facilities. This could be implemented on a periodic (annual or seasonal) or year-round basis. The CVRD may also wish to create agreements (or expand existing agreements) with private facilities to subsidize them to accept these materials.
4.9.2 Strategy 9B: Collection for bulky items The CVRD could implement on-call or curbside collection system to have bulky items collected by area. If this strategy is chosen for further review, it would need to be determined whether this would be in place throughout the CVRD or in Electoral Areas only. If this service was to be offered in municipalities, it would need to be determined whether this service would be offered by municipalities or by the CVRD.
4.9.3 Strategy 9C: Effective ways to reduce open burning of wood waste In some rural areas in the CVRD, residents burn yard waste, which has led to air quality issues. In addition, the accumulation of woody debris on larger, forested properties has been identified as a fuel-loading hazard for fire. Strategies to address these issues include reviewing the feasibility of offering yard waste collection at curbside, either regularly as part of a food waste collection program, or seasonally as a stand-alone program, and/or implementation of a seasonal wood chipping service, which could be operated at a fixed location within communities or at the curbside, and run by public sector staff or private contracted operators.
4.10 Strategy 10: Monitor Historic Disposal Sites
Issue:
The CVRD has a number of closed disposal sites that require ongoing monitoring and attention: Koksilah Sanitary Landfill, Koksilah Road Incinerator Ash Landfill, Peerless Road Incinerator Ash Landfill, and Meade Creek Incinerator Ash Landfill (ash landfill closure is in progress at the time of writing).
The CVRD needs to continue monitoring and assessing the state of these historic disposal sites and implementing measures that minimize potential impacts to the environment. These sites should have annual resources to monitor

TECH MEMO 3 – FINANCIAL ASSESSMENT AND STRATEGIES SELECTION FILE: 704-SWM.PLAN03006-01 | JUNE 28, 2018 | ISSUED FOR REVIEW
25 180619_TM3_Financial and Technical Analysis
and address potential concerns. Monitoring requirements should continue unless it can be demonstrated that these sites are no longer an environmental concern.
4.11 Strategy 11: Operational Improvement
4.11.1 Strategy 11A: Create an Asset Management Plan Issues:
The CVRD Recycling and Waste Management Division owns a number of mobile (trucks/equipment) and stationary (buildings) assets. Mobile assets have varied life spans; stationary structures typically last longer than mobile assets.
It is prudent to understand the assets that the Division holds and the operational and financial considerations to manage the solid waste system in a sustainable manner.
In 2016, the CVRD adopted an Asset Management Policy and is committed to applying recognized holistic Asset Management practices in its strategic planning, operations and financial management systems to deliver sustainable services to its communities and direct customers. An asset management strategy is current under development for the organization. Eventually, the strategy should include all assets for the solid waste management system including fleet, and will set out how those assets are operated and managed, lifespan of those assets, cost of assets and financial plan to pay for the assets (replacement or repair) and where the revenues would come from.
4.11.2 Strategy 11B: Bings Creek Transfer Station 10-Year Plan Issues:
Bings Creek receives most of the waste in the regional district. This facility accepts many waste streams and the future function and capacity of this facility needs to be determined.
Bings Creek does not receive ICI sector recyclables. Although residential recyclables are received at the transfer station, there is very little room to receive any more material. The transfer station building received both residential recycling and waste destined for disposal from residential and commercial sources.
Bings Creek is not equipped with compactors or balers. Purchasing this equipment may lead to operational efficiencies.
The future role of the Bings Creek Transfer Station needs to be determined. This should take into consideration the type and amount of material it would be receiving, any processing that could occur on site and a condition assessment of the structures as part of an organization-wide asset management program.
4.12 Strategy 12: Disaster Debris Management Plan
Issues:
The CVRD currently does not have an emergency management plan for solid waste in the event of a natural disaster.
Several Canadian municipalities, such as Fort McMurray, interior BC, and Calgary, were affected by fires or floods. These types of disasters create a chaotic situation and require a management plan to deal with the large amounts or different types of waste that will require disposal or staging. Consideration should be given to developing an

TECH MEMO 3 – FINANCIAL ASSESSMENT AND STRATEGIES SELECTION FILE: 704-SWM.PLAN03006-01 | JUNE 28, 2018 | ISSUED FOR REVIEW
26 180619_TM3_Financial and Technical Analysis
Emergency Management Plan for public waste management facilities. The CVRD is susceptible to fires, floods and earthquakes.
4.13 Strategy 13: Education and Behaviour Change Considerations
Increased education is not presented as a separate strategy in this document. Many of the strategies outlined herein would require CVRD residents to change their behaviour. To be successful, these strategies would require education programs to be expanded.
In addition to continuing to promote waste reduction and diversion programs through vivid print and electronic communications tools, social media (e.g., Facebook, Twitter, YouTube), and hands on technical assistance, other behaviour change tools can be integrated into education efforts. The behaviour change tactics outlined within community-based social marketing (CBSM) can provide a framework for how to most effectively target a specific behaviour. Derived from social marketing by Doug McKenzie-Mohr, an environmental psychologist, CBSM offers several behaviour change tools that can be incorporated into existing and future education initiatives. Examples of CBSM behaviour based tools include:
Commitment – By agreeing to a small request, people have subsequently been found to be far more likely to agree to a larger request.
Prompts – Prompts can also be used to encourage people to engage in positive behaviour. By providing visual or auditory aids, people are reminded to perform a particular action. Prompts often take the form of a sticker or tag posted in close proximity to the action.
Norms – Norms guide how we behave and are largely influenced by the behaviour of those around us. If members of our community, especially our immediate networks, are living sustainably, we are more likely to do the same.
Social Diffusion – New behaviours are frequently adopted because friends, colleagues, or competitors have changed certain behaviours. To encourage social diffusion, make commitments to new behaviours public and visible (such as adding a sticker for another environmental behaviour to the side of a collection container) and/or recruit well known and respected opinion leaders in the community to promote a specific behaviour.
Communication – The more relevant messages are to a group, the more likely it is to captivate someone’s attention.
Incentives/Disincentives – Closely pairing an incentive, or reward, to specific positive behaviour can have a substantial impact on encouraging sustainable activities. This strategy is particularly useful when motivation to engage in action is low or people are not doing the activity as effectively as they could.
Convenience – Consider the external barriers related to a project, how they can be overcome, and what resources are needed to successfully address them.
5.0 TARGET SETTING
A SWMP should clearly outline goals for the duration of the plan. Although the plan outlines strategies for the next ten years, it is important to take into considerations overarching initiatives that may span over twenty or thirty years. The Ministry has defined the following goals for British Columbia to achieve by 2020:
75% of BC’s Population covered by Organic Waste Disposal Restrictions;

TECH MEMO 3 – FINANCIAL ASSESSMENT AND STRATEGIES SELECTION FILE: 704-SWM.PLAN03006-01 | JUNE 28, 2018 | ISSUED FOR REVIEW
27 180619_TM3_Financial and Technical Analysis
75% Recovery of Materials Covered by Extended Producer Responsibility Programs (EPR); and
Provincial Disposal Rate of 350 kg per capita per year (or lower).
With a disposal rate of 358 kg per capita, the CVRD is at the forefront of meeting the Ministry’s Provincial goals. EPR programs are active in the CVRD and it needs to be determined whether 75% of EPR materials are being recovered. Businesses and institutions in the CVRD are covered by an organic waste disposal restriction and most residents in the CVRD are serviced with curbside collection programs for organic materials, however, there is no residential organic waste disposal restriction. Thus, this Plan will need to consider whether more ambitious goals should be pursued. Suggested goals for this plan update include:
Target a Regional Disposal Rate of 180 to 300 kg per capita per year by 2030; and
Adopt “Zero Waste” as a goal for the plan.
5.1.1 Target a Regional Disposal Rate Based on the analysis in Section 1.3.4, the CVRD has the potential to reduce kg per capita garbage to approximately 280 based on how current and new strategies are implemented. Table 4-4 below lists how some of the sectors would be potentially affected by the proposed strategies above.

TECH MEMO 3 – FINANCIAL ASSESSMENT AND STRATEGIES SELECTION FILE: 704-SWM.PLAN03006-01 | JUNE 28, 2018 | ISSUED FOR REVIEW
28 180619_TM3_Financial and Technical Analysis
Table 4-4: Diversion Potential with Programs Implemented
Sector (Contribution to
Landfill %) Material Type Diversion Potential out of Landfill (%) Diversion Potential out of Landfill1
(kg/capita)
Single-Family (Municipalities) 9%
Curbside Recyclables 10% 0.3
Depot Recyclables 20% 0.5
Wasted Food 30% 1.2
Inedible Organic Materials 10% 0.6
Building Materials 20% 0.2
Textiles 30% 0.7
Bulky Objects 10% 0.0
Single Family (Municipalities) Diversion Potential 3.4
Single-Family (Electoral Areas) 14%
Curbside Recyclables 30% 1.2 Depot Recyclables
50% 1.6 Wasted Food
60% 5.7
Inedible Organic Materials 50% 5.8
Building Materials 30% 0.6
Textiles 10% 0.3
Bulky Objects 20% 0.0
Single Family (Electoral Areas) Diversion Potential 15.3
Multi-Family
Containers and Mixed Paper Recyclables 30% 0.9
Depot Recyclables 10% 0.2
Wasted Food 30% 1.0
Inedible Organic Materials 30% 1.3
Building Materials 10% 0.0
Textiles 20% 0.2
Bulky Objects 30% 0.0 Multi-Family Diversion Potential 3.7
Industrial, Commercial & Institutional
Containers and Mixed Paper Recyclables 40% 7.8
Depot Recyclables 20% 1.7 Wasted Food 50% 26.3
Inedible Organic Materials 40% 11.0 Building Materials 20% 0.8
Textiles 30% 2.0 Bulky Objects 20% 0.1
ICI Diversion Potential 49.7
Drop Off
Containers and Mixed Paper Recyclables 20% 0.4
Depot Recyclables 30% 0.0 Wasted Food 10% 0.3
Inedible Organic Materials 10% 0.1 Building Materials 20% 0.3
Textiles 10% 0.8 Bulky Objects 20% 0.7
Drop Off Diversion Potential 4.3
Construction & Demolition
Containers and Mixed Paper Recyclables 10% 0.1
Depot Recyclables 20% 0.0 Wasted Food 30% 0.4
Inedible Organic Materials 10% 0.0 Building Materials 20% 0.0
Textiles 30% 0.0 Bulky Objects 10% 0.0
C&D Diversion Potential 1.0
Potential Additional Diversion from Landfill 77.7
Estimated Annual Disposal (assuming 358 kg/capita) 280.3 1. Note some materials with 0 estimated – based on the waste composition study – may still show up in these material categories by sector.

TECH MEMO 3 – FINANCIAL ASSESSMENT AND STRATEGIES SELECTION FILE: 704-SWM.PLAN03006-01 | JUNE 28, 2018 | ISSUED FOR REVIEW
29 180619_TM3_Financial and Technical Analysis
5.1.2 Zero Waste “Zero Waste” is a goal that several BC regional districts have adopted, including the Regional District of Nanaimo (RDN), Metro Vancouver, and the Regional District of Kootenay Boundary. The CVRD has also adopted this goal in previous Solid Waste Management Plans, including the 2006 Plan.
Zero Waste is a visionary goal intended to guide people in changing their lifestyles and practices to emulate sustainable natural cycles, where all discarded materials are designed to become resources for others to use. Zero Waste means moving towards a circular economy, wherein ‘waste’ is viewed as a resource, and maximum value is extracted from all resources before they are eventually recovered or regenerated3.
A Zero Waste goal suggests a move towards the systematic redesign and management of products and processes to avoid and eliminate the volume and toxicity of waste and materials, conserve and recover all resources, and not burn or bury them. The ultimate realization of Zero Waste will eliminate all discharges to land, water or air that are a threat to planetary, human, animal or plant health.4
6.0 LIMITATIONS OF REPORT
This report and its contents are intended for the sole use of Cowichan Valley Regional District and their agents. Tetra Tech Canada Inc. (Tetra Tech) does not accept any responsibility for the accuracy of any of the data, the analysis, or the recommendations contained or referenced in the report when the report is used or relied upon by any Party other than Cowichan Valley Regional District, or for any Project other than the proposed development at the subject site. Any such unauthorized use of this report is at the sole risk of the user. Use of this document is subject to the Limitations on the Use of this Document attached in the Appendix or Contractual Terms and Conditions executed by both parties.
3WRAP UK, http://www.wrap.org.uk/about-us/about/wrap-and-circular-economy 4 Zero Waste International Alliance, http://zwia.org/standards/zw-definition/

TECH MEMO 3 – FINANCIAL ASSESSMENT AND STRATEGIES SELECTION FILE: 704-SWM.PLAN03006-01 | JUNE 28, 2018 | ISSUED FOR REVIEW
30 180619_TM3_Financial and Technical Analysis
7.0 CLOSURE
We trust this technical memo meets your present requirements. If you have any questions or comments, please contact the undersigned.
Respectfully submitted, Tetra Tech Canada Inc. ISSUED FOR REVIEW ISSUED FOR REVIEW Prepared by: Reviewed by: Tamara Shulman, BA, M.Sc. Wilbert Yang, P.Eng. Team Lead – Planning and Consultation Specialist Business Development Director Solid Waste Management Practice Solid Waste Management Practice Direct Line: 604.608.8636 Direct Line: 604.608.8648 [email protected] [email protected] /tv Attachments: Tetra Tech’s Limitations on the Use of this Document

LIMITATIONS ON USE OF THIS DOCUMENT
1
1.1 USE OF DOCUMENT AND OWNERSHIP
This document pertains to a specific site, a specific development, and a specific scope of work. The document may include plans, drawings, profiles and other supporting documents that collectively constitute the document (the “Professional Document”). The Professional Document is intended for the sole use of TETRA TECH’s Client (the “Client”) as specifically identified in the TETRA TECH Services Agreement or other Contractual Agreement entered into with the Client (either of which is termed the “Contract” herein). TETRA TECH does not accept any responsibility for the accuracy of any of the data, analyses, recommendations or other contents of the Professional Document when it is used or relied upon by any party other than the Client, unless authorized in writing by TETRA TECH. Any unauthorized use of the Professional Document is at the sole risk of the user. TETRA TECH accepts no responsibility whatsoever for any loss or damage where such loss or damage is alleged to be or, is in fact, caused by the unauthorized use of the Professional Document. Where TETRA TECH has expressly authorized the use of the Professional Document by a third party (an “Authorized Party”), consideration for such authorization is the Authorized Party’s acceptance of these Limitations on Use of this Document as well as any limitations on liability contained in the Contract with the Client (all of which is collectively termed the “Limitations on Liability”). The Authorized Party should carefully review both these Limitations on Use of this Document and the Contract prior to making any use of the Professional Document. Any use made of the Professional Document by an Authorized Party constitutes the Authorized Party’s express acceptance of, and agreement to, the Limitations on Liability. The Professional Document and any other form or type of data or documents generated by TETRA TECH during the performance of the work are TETRA TECH’s professional work product and shall remain the copyright property of TETRA TECH. The Professional Document is subject to copyright and shall not be reproduced either wholly or in part without the prior, written permission of TETRA TECH. Additional copies of the Document, if required, may be obtained upon request. 1.2 ALTERNATIVE DOCUMENT FORMAT
Where TETRA TECH submits electronic file and/or hard copy versions of the Professional Document or any drawings or other project-related documents and deliverables (collectively termed TETRA TECH’s “Instruments of Professional Service”), only the signed and/or sealed versions shall be considered final. The original signed and/or sealed electronic file and/or hard copy version archived by TETRA TECH shall be deemed to be the original. TETRA TECH will archive a protected digital copy of the original signed and/or sealed version for a period of 10 years. Both electronic file and/or hard copy versions of TETRA TECH’s Instruments of Professional Service shall not, under any circumstances, be altered by any party except TETRA TECH. TETRA TECH’s Instruments of Professional Service will be used only and exactly as submitted by TETRA TECH. Electronic files submitted by TETRA TECH have been prepared and submitted using specific software and hardware systems. TETRA TECH makes no representation about the compatibility of these files with the Client’s current or future software and hardware systems.
1.3 STANDARD OF CARE
Services performed by TETRA TECH for the Professional Document have been conducted in accordance with the Contract, in a manner consistent with the level of skill ordinarily exercised by members of the profession currently practicing under similar conditions in the jurisdiction in which the services are provided. Professional judgment has been applied in developing the conclusions and/or recommendations provided in this Professional Document. No warranty or guarantee, express or implied, is made concerning the test results, comments, recommendations, or any other portion of the Professional Document. If any error or omission is detected by the Client or an Authorized Party, the error or omission must be immediately brought to the attention of TETRA TECH. 1.4 DISCLOSURE OF INFORMATION BY CLIENT
The Client acknowledges that it has fully cooperated with TETRA TECH with respect to the provision of all available information on the past, present, and proposed conditions on the site, including historical information respecting the use of the site. The Client further acknowledges that in order for TETRA TECH to properly provide the services contracted for in the Contract, TETRA TECH has relied upon the Client with respect to both the full disclosure and accuracy of any such information. 1.5 INFORMATION PROVIDED TO TETRA TECH BY OTHERS
During the performance of the work and the preparation of this Professional Document, TETRA TECH may have relied on information provided by third parties other than the Client. While TETRA TECH endeavours to verify the accuracy of such information, TETRA TECH accepts no responsibility for the accuracy or the reliability of such information even where inaccurate or unreliable information impacts any recommendations, design or other deliverables and causes the Client or an Authorized Party loss or damage. 1.6 GENERAL LIMITATIONS OF DOCUMENT
This Professional Document is based solely on the conditions presented and the data available to TETRA TECH at the time the data were collected in the field or gathered from available databases. The Client, and any Authorized Party, acknowledges that the Professional Document is based on limited data and that the conclusions, opinions, and recommendations contained in the Professional Document are the result of the application of professional judgment to such limited data. The Professional Document is not applicable to any other sites, nor should it be relied upon for types of development other than those to which it refers. Any variation from the site conditions present, or variation in assumed conditions which might form the basis of design or recommendations as outlined in this report, at or on the development proposed as of the date of the Professional Document requires a supplementary exploration, investigation, and assessment. TETRA TECH is neither qualified to, nor is it making, any recommendations with respect to the purchase, sale, investment or development of the property, the decisions on which are the sole responsibility of the Client.