Teaching Statistics to Social Science Students Alan … Statistics to Social Science Students Alan...
31
Teaching Statistics to Social Science Students Alan Agresti Distinguished Professor Emeritus Department of Statistics University of Florida, USA QM Workshop, Oxford, June 29, 2012 Oxford workshop, June 29, 2012 – p. 1/31
Transcript of Teaching Statistics to Social Science Students Alan … Statistics to Social Science Students Alan...

Teaching Statistics to Social Science Students
Alan Agresti
Distinguished Professor Emeritus
Department of Statistics
University of Florida, USA
QM Workshop, Oxford, June 29, 2012
Oxford workshop, June 29, 2012 – p. 1/31

Outline
• My background and perspective
• Guidelines for what the introductory course shouldaccomplish
• Course should focus on concepts rather than watered-downmathematical statistics
• Of traditional topics, what could be eliminated or receiveless attention?
• What should receive more attention?
• What should be different for the introductory statisticscourse for graduate students?
Oxford workshop, June 29, 2012 – p. 2/31

My Background
• Trained as a statistician, not a social scientist• Teaching in Statistics Department both “service courses” to
social scientists and other non-statisticians, and alsocourses for Statistics majors at BS, MS, PhD levels
• UF Stat Department, in a large state university, has
– General introductory course (including social sciencestudents, business students) on main ideas of statistics
– Follow-up second courses specialized to particular areas(e.g., social sciences, business require second coursewith main focus on multiple regression, ANOVA)
– Graduate-level sequence of two courses for socialscience students
– Advanced courses for students quite comfortable withmultiple regression (e.g., multivariate statistics,categorical data analysis, longitudinal data analysis).
Oxford workshop, June 29, 2012 – p. 3/31

Qualifiers
• Social science majors are required to take separateresearch methods course from their home department. Iwon’t discuss that course.
• Most of my teaching in past 10 years was for thegraduate-level courses (∼ 60 students per term, with little orno TA help); the undergraduate introductory course (>2000students a term) is now handled by MS-level instructors,assisted by many graduate-student TAs.
• My comments apply to general introductory statisticscourses at undergraduate level, not just those for socialscientists. This partly reflects less specialization at U.S.undergraduate curriculum than in Britain.
• My opinions partly reflect how I feel about the way Statisticsis presented in introductory textbooks.
Oxford workshop, June 29, 2012 – p. 4/31

The General Introductory Course: GAISE Reports
Guidelines for Assessment and Instruction in StatisticsEducation (GAISE) project supported by American StatisticalAssociation created recommendations for introductory statisticscourses.
See www.amstat.org/education/gaise
Recommendations include:
1. Emphasize statistical thinking and conceptualunderstanding, rather than mere learning of recipes fordifferent methods. Statistics is a process to answerquestions (and unlike math, perhaps no unique answer!),not a toolkit of formulas.
2. Foster active learning (e.g., activities, projects).
3. Use technology (applets, simple software) to aid conceptualunderstanding and reduce computational drudgery.
Oxford workshop, June 29, 2012 – p. 5/31

Emphasize statistical thinking and concepts
• Conclusions from a well designed study beat anecdotes.• Variability, and how it is quantifiable with an appropriate
study:
– Random assignment in a controlled experiment allowscause and effect conclusions.
– Random sampling in a survey allows us to makeinferences about the population of interest.
• Limitations of studies with observational data, commonsources of bias in surveys
• How associations are affected by “lurking variables”(e.g., in U.S. murder trials, proportion of defendants who getthe death penalty is higher for whites than blacks, but muchhigher for blacks when adjust for race of victim.)
• Association does not imply causation.
Oxford workshop, June 29, 2012 – p. 6/31

Emphasize statistical thinking and concepts (2)
• Concept of a sampling distribution, and how it relates tomaking inferences from samples
• Significance testing and its limitations
– Statistical significance does not imply practicalsignificance.
– A lack of statistical significance does not mean H0 is true.
• Confidence intervals, and how we learn more from themthan from a significance test
• Experience how to critique reports in newspapers and onInternet and journal articles that have statistical information
• Understand the processes statisticians/methodologists usewhen formulating and conducting research
Oxford workshop, June 29, 2012 – p. 7/31
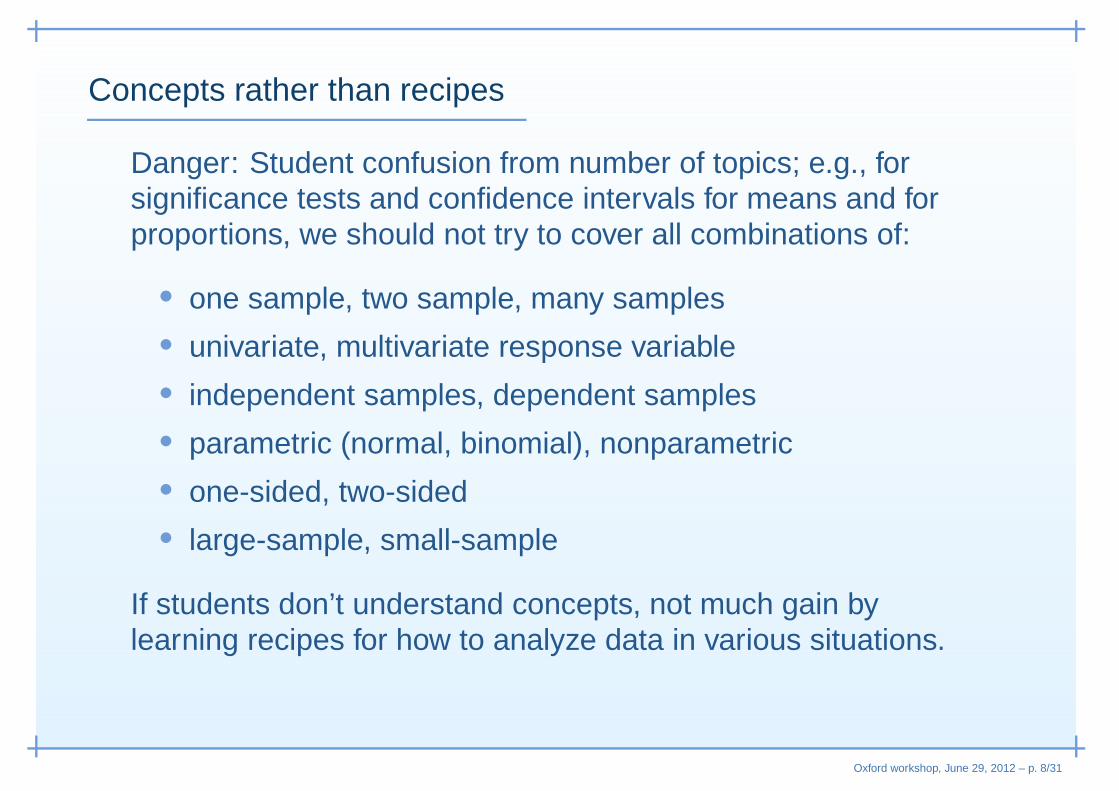
Concepts rather than recipes
Danger: Student confusion from number of topics; e.g., forsignificance tests and confidence intervals for means and forproportions, we should not try to cover all combinations of:
•• one sample, two sample, many samples• univariate, multivariate response variable• independent samples, dependent samples• parametric (normal, binomial), nonparametric• one-sided, two-sided• large-sample, small-sample
If students don’t understand concepts, not much gain bylearning recipes for how to analyze data in various situations.
Oxford workshop, June 29, 2012 – p. 8/31

Concepts rather than recipes (2)
As put more emphasis on concepts and interpretations, can putless on formulas (except for helping to explain the concepts) thatare a roadblock for students with poor algebra skills; this helpsalso with the “mixed ability” issue typical in such courses.
Tell students at beginning of course that if they think they’re poorat math, algebra, they can still do well in the course.
In UK, many courses are brief (e.g., 10 lectures plus 10 labsessions), so it seems especially crucial to focus on the “bigideas” rather than math theory and formulas.
On exams, can use multiple-choice questions and writteninterpretations (including using software output) to focus onconcepts and appropriate interpretations rather than thetechnical details of how to plug numbers into formulas to getcertain answers.
Oxford workshop, June 29, 2012 – p. 9/31

Active learning
• Perhaps get data for examples from class survey, ideallywith students having input in formulating questions ofinterest and developing measuring instrument.
• During second half of course, have teams of 2-3 studentsconduct projects, perhaps presenting results to the class ona poster accompanied by 15-minute talk.
• Perhaps analyze different aspects of an interesting data setat various points in the course. (They should look at dataright from the start, rather than spending much of thecourse on “prerequisites” such as probability before gettingto data analysis.)
• Introduce classroom activities in context of real problems.• Good resource for classroom activities: Activity-Based
Statistics by Scheaffer et al., Springer-Verlag (1996)
Oxford workshop, June 29, 2012 – p. 10/31

Examples of activities
• Create contingency tables using variables of interest atGeneral Social Survey (sda.berkeley.edu/GSS), or findvariable strongly associated with response variableidentified by instructor
• Using applet to generate sampling distribution of aproportion for various n
• Why 0.05 is a common significance level (placebo betterthan treatment for observation 1, 2, 3, 4, 5, ...)
• Do literature search and critique article on topic of interest:Study design? Observational study or experiment?Response and explanatory variables? Statistics used?Conclusions? Limitations of study (e.g., confoundingvariables)? What could have been done better?
Oxford workshop, June 29, 2012 – p. 11/31

An activity I used on first day of course:
Ex. How does randomness look?
(Apparent trends, such as “hot hand” in sports, stock marketup/down, may reflect mere random variability)
For n flips of coin (outcomes “head” and “tail” might represent“favor” and “oppose” in survey or “Labour” and “Conservative” ineven election)
E(longest run of heads) ≈ linear in log(n)
4 for n = 25 flips, 5 for n = 50, 6 for n = 100, 7 for n = 200
Can use to explain that randomness has unpredictable aspectsbut also predictable aspects that a sampling distributiondescribes (degree of variability in sample proportions, law oflarge numbers)
Oxford workshop, June 29, 2012 – p. 12/31

Technology for aiding conceptual understanding
• Use software for computations (something simple that doesnot take much time to teach, such as SPSS or Minitab).
• Using software (and interpreting output in examples) helpsthe course to focus on concepts rather than computationaldetails of formulas.
• Use only needed formulas, and in form that enhanceunderstanding (e.g., ignore “short-cut” formulas forvariance, correlation, regression coefficients).
• Explore “what happens if ...” questions, such as showingeffects of outlier on results
• Get students in habit of exploring data with graphics andbasic descriptive summaries before using more complexmethods, and to help check assumptions (e.g., aboutregression model), search for unusual observations.
Oxford workshop, June 29, 2012 – p. 13/31

Ex. Florida vote by county (Bush/Gore election):
Buchanan in 2000, Perot in 1996 (Reform party)
0 10000 20000 30000 40000
050
010
0015
0020
0025
0030
0035
00
Perot 1996 Votes
Buc
hana
n 20
00 V
otes
PalmBeach
Oxford workshop, June 29, 2012 – p. 14/31

Technology for aiding conceptual understanding (2)
Use applets (preceded by physical explorations) to help explaindifficult concepts such as sampling distributions (and effect of non its spread), inferential error rates.
See www.stat.tamu.edu/~west/ph/ for some good ones byWebster West that I’ve used in textbooks and my teaching.
– Sampling distributions:www.stat.tamu.edu/~west/ph/sampledist.html
– Significance tests:www.stat.tamu.edu/~west/ph/propht.html
– Confidence intervals:www.stat.tamu.edu/~west/ph/propci.html
– Regression by eye (and seeing effect of moving a point)www.stat.tamu.edu/~west/ph/regeye.html
Oxford workshop, June 29, 2012 – p. 15/31

Technology for aiding conceptual understanding (3)
There are now many on-line resources where statisticsinstructors share ideas and research about statistics education.
• Free on-line Journal of Statistics Education,www.amstat.org/publications/jse
Website resources include a data archive.
• Free on-line Technology Innovations in Statistics Education,escholarship.org/uc/uclastat_cts_tise
e.g., current issue: “Using applets and video instruction tofoster students’ understanding of sampling variability”
• The International Association for Statistical Education,www.stat.auckland.ac.nz/~iaseand its Statistics Education Research Journal.
Oxford workshop, June 29, 2012 – p. 16/31

Some things to de-emphasize (in my opinion)
• Inference with population std. dev. σ assumed known(can first use z instead of t in inference by doing proportionbefore mean)
• Less emphasis on significance tests and more onconfidence intervals(natural to see concept of “margin of error” after learningabout standard error of a sampling distribution)
• Less emphasis on one-sided tests(agreement with practice, confidence intervals)
• Less classical probability (e.g., counting rules, Bayes ruleand complex probability calculations, continuity correction inapproximating binomial with normal) and probabilitydistributions (cover normal, skip Poisson, gamma, possiblybinomial)
Oxford workshop, June 29, 2012 – p. 17/31

Some things to de-emphasize (2)
• De-emphasize strict frequentist interpretations(vs. Bayesian)
• Drop nonparametric and small-sample methods (focus onrobust parametric methods, such as two-sided inferences)
• Dependent samples (e.g., longitudinal studies) can wait untila later course
• Some assumptions/conditions
• Some important ideas (e.g., probabilistic concepts) can beintroduced at a lower technical level using a simplifiedapproach
Oxford workshop, June 29, 2012 – p. 18/31

Simplify in presenting difficult concepts:
Ex. Conditional probability is important but difficult, can beexplained in intuitive terms with contingency tables, treediagrams.
In a criminal justice setting, suppose legal trials result in
P(conviction | guilt) = 0.9
P(acquit | innocent) = 0.9
Then, if P(guilt) = 0.1, what is P(guilt | conviction)?
Oxford workshop, June 29, 2012 – p. 19/31

Ex. Contingency table for conditional probability
Reality Trial result
Convict Acquit Total
Guilty 9 1 10
Innocent 9 81 90
Total 18 82 100
Again, conditional on conviction, probability of guilt is about9/(9 +9) = 0.50.
Illuminating to show students how this changes dramaticallyaccording to value of P(guilt).
Oxford workshop, June 29, 2012 – p. 20/31

Ex. Tree diagram for conditional probability
Typical results for 100 trials
Guilty Trial result----------------
Yes (10) | Convict (9)----------------| | Acquit (1)| ----------------
100 trials ---|| ----------------| No (90) | Convict (9)----------------
| Acquit (81)----------------
So, conditional on conviction, prob. of guilt about 9/(9 +9) = 0.50.
Oxford workshop, June 29, 2012 – p. 21/31

What deserves more attention?: Statistics uses models
All inferential methods have assumptions, which form a model(simple approximation for reality that is never exactly true)
ex. Comparing means:
Model for pooled two-sample t test assumesobservations from group 1 at random from N(µ1, σ) dist.observations from group 2 at random from N(µ2, σ) dist.
• All models are wrong (our sample was not truly random,some missing data or measurement error, distributions notexactly normal, standard deviations not identical)
• But some models are useful, summarizing lots of data by afew statistics that estimate parameters of that model
• Some assumptions, conditions much more important thanothers
Oxford workshop, June 29, 2012 – p. 22/31

Statistics uses models (2)
ex. Model comparing means, regression:
For two-sided inference, normal population assumption not asimportant as other assumptions(unless so highly skewed that mean is inappropriate summary).
Shape of population distribution has little relevance, especiallyas n increases.
Data gathering assumptions important for any n.
At some point of course, we should show faulty conclusions in apublished study that indicated an effect that can merely beexplained by regression toward the mean.
Oxford workshop, June 29, 2012 – p. 23/31
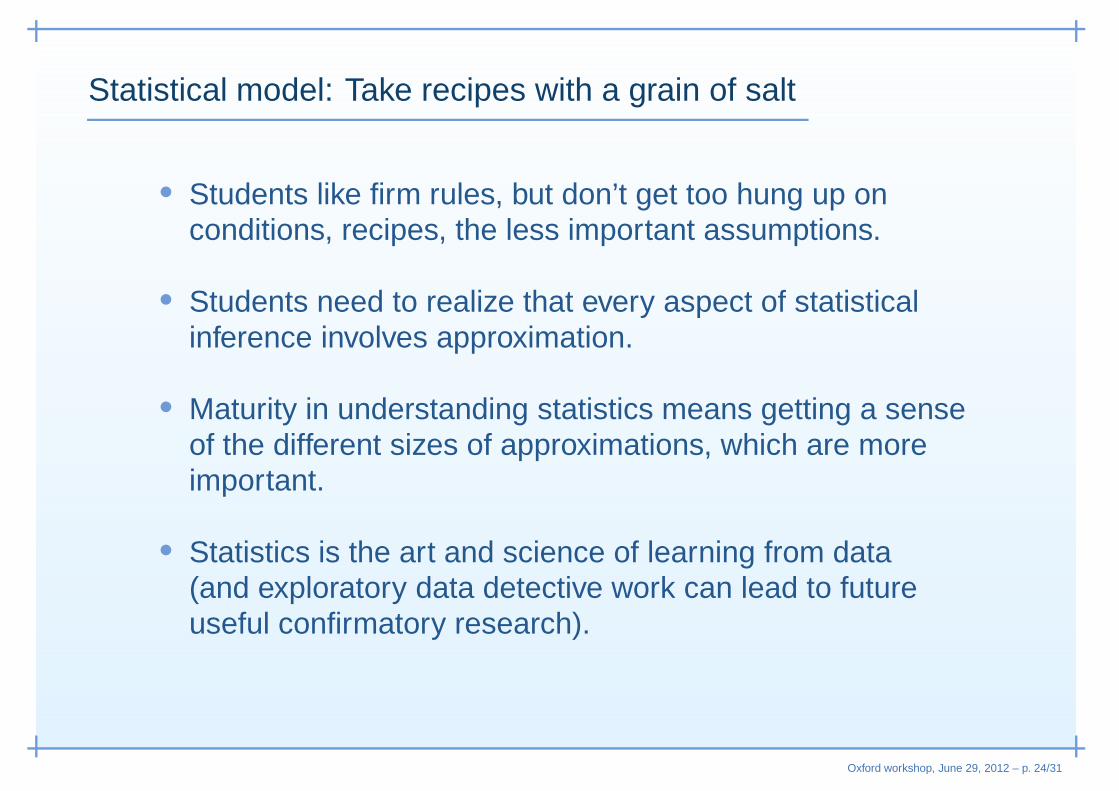
Statistical model: Take recipes with a grain of salt
• Students like firm rules, but don’t get too hung up onconditions, recipes, the less important assumptions.
• Students need to realize that every aspect of statisticalinference involves approximation.
• Maturity in understanding statistics means getting a senseof the different sizes of approximations, which are moreimportant.
• Statistics is the art and science of learning from data(and exploratory data detective work can lead to futureuseful confirmatory research).
Oxford workshop, June 29, 2012 – p. 24/31

What deserves more attention (2)?: Categorical data
• They’ll hear about proportions the rest of their lives forresults of surveys, medical research.
(Most students will never see a std. dev., t test after thiscourse but will see lots of proportions, margins of error andneed to know when study design suggests skepticism.)
• For bivariate description, show contingency tables as wellas scatterplots.
• Easier to construct sampling distributions for proportions.
• Inference for contingency tables should cover not onlychi-squared; follow up by studying residuals, effectmeasures such as p1 − p2 and p1/p2.
Oxford workshop, June 29, 2012 – p. 25/31

Example: standardized residuals for contingency table
Party Identification
Race Democrat Independent Republican Total
White 640 783 775 2198(−14.2) (2.7) (11.9)
Black 250 106 17 373(14.2) (−2.7) (−11.9)
Follow up chi-squared: X2 = 234.7 (df = 2, P -value < 0.0001)
e.g., (17− 114.9)/SE = −11.9. Difference between no. of blackRepublicans and no. expected under H0: independence is−11.9 SE’s.
Proportion of whites who are Republican is (775/2198)/
(17/373)= 7.7 times proportion of blacks who are Republicans.
Oxford workshop, June 29, 2012 – p. 26/31

Deserves attention (3): New applications/methods
Students should learn (especially in graduate-level courses) thatstatistics is an evolving field, not an old toolkit of recipes or asubset of mathematics
Continually new applications and methods because of moderncomputing power (e.g., bootstrap) and new types of data(survival analysis in medical research, data mining with hugedatabases such as in financial industry, bioinformatics)
Oxford workshop, June 29, 2012 – p. 27/31

What’s different in introductory grad-level course?
• Most students had undergrad courses that varied greatly inquality and scope; most students remember little.
• More rapid pace• Strong emphasis on regression (in generalized linear model
terms, including logistic regression for categorical response)• Examples and motivation more social-science research
oriented (e.g., focus on journal articles rather than dailynewspaper and Internet for examples)
• We’re training them to be researchers, whereas we’retraining undergraduates to be better consumers ofquantitative information.
• But it’s important for student to recognize their limitationsand the increasing breadth of the field, that they won’t be astatistician after taking a course or two, and need to adaptan active learning strategy for their entire careers.
Oxford workshop, June 29, 2012 – p. 28/31

Textbooks focusing on a conceptual approach
Introductory statistics textbooks that changed focus fromwatered-down mathematical statistics to concepts first written byDavid Moore (Purdue), Freedman/Pisani/Purves (Berkeley)
My attempts to “do as I preach” –
Statistics: The Art and Science of Learning from Databy A. Agresti and C. Franklin, 3rd ed. 2012
Designed for undergraduate-level general course
Statistical Methods for the Social Sciencesby A. Agresti and B. Finlay, 4th ed. 2008
1st ed. 1979 intended as student-friendly alternative to Blalock’sSocial Statistics. Power-point notes from teaching a course fromthis book to psychology majors at Harvard two years ago atwww.stat.ufl.edu/~aa/social/powerpoints
Oxford workshop, June 29, 2012 – p. 29/31

Outline for intro. stats course, from Art and Science ...
Exploring data with graphs and numerical summaries
Association: contingency, correlation, and regression
Gathering data
Probability distributions (normal)
Sampling distributions
Statistical inference: confidence intervals
Statistical inference: significance tests
Comparing two groups
Analyzing association between categorical variables
Analyzing association between quantitative variables(regression analysis)
Oxford workshop, June 29, 2012 – p. 30/31

Thanks
THANKS for your time today and for listening to the perspectiveof a statistician, one who is now somewhat removed from thereal difficulties you must all face!
I look forward to the discussion.
Oxford workshop, June 29, 2012 – p. 31/31