Agresti/Franklin Statistics, 1 of 33 Enrollment Fall 2005 (all students) ClassificationMenWomenTotal...
79
Agresti/Franklin Statistics, 1 of 33 Enrollment Fall 2005 (all students) Classificatio n Men Women Total Undergraduate 1,533 (52%) 1,416 (48%) 2,949 Professional* 17 22 39 Graduate 1,285 698 1,983 Master 505 276 781 Doctoral 780 422 1,202 Total 2 2,835 2,136 4,971
-
Upload
sharon-carter -
Category
Documents
-
view
216 -
download
1
Transcript of Agresti/Franklin Statistics, 1 of 33 Enrollment Fall 2005 (all students) ClassificationMenWomenTotal...
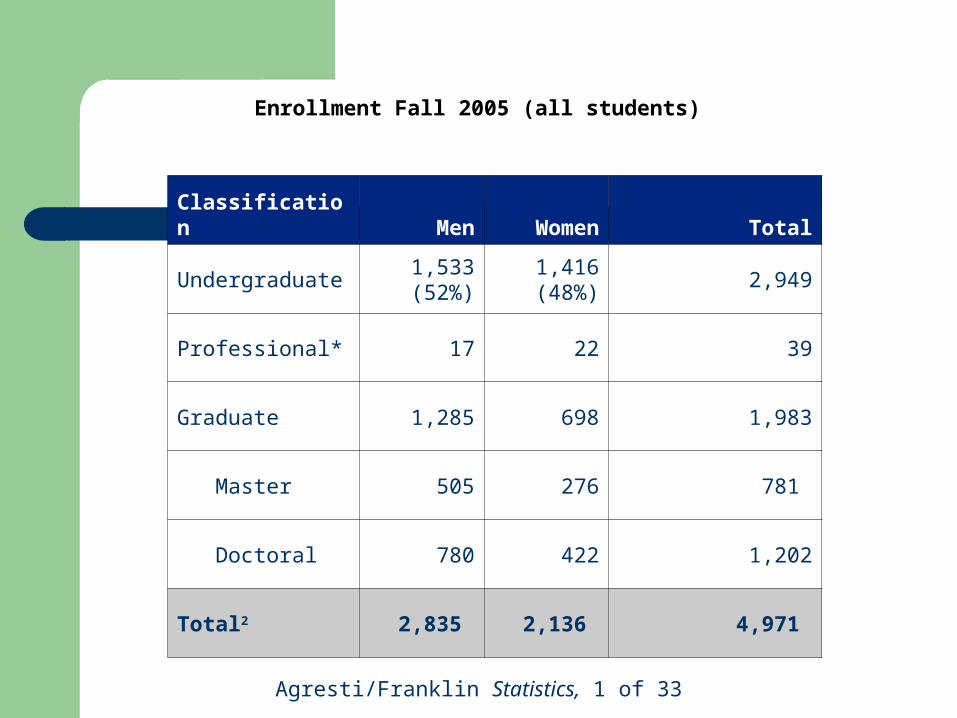
Agresti/Franklin Statistics, 1 of 33
Enrollment Fall 2005 (all students)
Classification Men Women Total
Undergraduate1,533(52%)
1,416(48%)
2,949
Professional* 17 22 39
Graduate 1,285 698 1,983
Master 505 276 781
Doctoral 780 422 1,202
Total2 2,835 2,136 4,971

Agresti/Franklin Statistics, 2 of 33
Geographic Origin3 (Fall 2005)
Undergraduates* Graduates Total
Master Doctoral
Texas1,532
(51.3%)474 482 2,488
Other U.S.1,320
(44.2%)157 178 1,655
International96
(3.2%)123 521 740
Not Designated40
(1.3%)27 21 88
Total 2,988 781 1,202 4,971

Agresti/Franklin Statistics, 3 of 33
Student Demographics (Fall 2005)
Undergrad Grad
# % Master % Doctoral %
Architecture 126 4% 74 9% 1 1%
Engineering 751 25% 36 5% 464 39%
Humanities 559 19% 16 2% 175 14%
Management -- 0% 471 60% -- 0%
Music 128 4% 123 16% 39 3%
Natural Sciences 704 23% 29 4% 346 29%
Social Sciences 693 23% -- 0% 135 11%
Interdisciplinary 21 1% -- 0% 42 3%
Continuing Studies -- 0% 32 4% -- 0%
Unclassified 6 1% -- 0% -- 0%
Total 2,988 781 1,202 100%

Agresti/Franklin Statistics, 4 of 33
Chapter 1Statistics: The Art and Science of
Learning from Data
Learn ….
What Statistics Is
Why Statistics Is Important

Agresti/Franklin Statistics, 5 of 33
Chapter 1
Learn…
How Data is Collected
How Data is Used to Make
Predictions

Agresti/Franklin Statistics, 6 of 33
Section 1.1
How Can You Investigate using Data?

Agresti/Franklin Statistics, 7 of 33
Health Study
Does a low-carbohydrate diet result in significant weight loss?

Agresti/Franklin Statistics, 8 of 33
Market Analysis
Are people more likely to stop at a Starbucks if they’ve seen a recent TV advertisement for their coffee?

Agresti/Franklin Statistics, 9 of 33
Heart Health
Does regular aspirin intake reduce deaths from heart attacks?

Agresti/Franklin Statistics, 10 of 33
Cancer Research
Are smokers more likely than non-smokers to develop lung cancer?

Agresti/Franklin Statistics, 11 of 33
To search for answers to these questions, we…
Design experiments
Conduct surveys
Gather data

Agresti/Franklin Statistics, 12 of 33
Statistics is the art and science of:
Designing studies Analyzing data Translating data into knowledge and
understanding of the world
Agresti/Franklin Statistics, 13 of 33
Example from the National Opinion Center at the University of Chicago:
General Social Survey (GSS) provides data about the American public
Survey of about 2000 adult Americans

Agresti/Franklin Statistics, 14 of 33
Example from GSS: Do you believe in life after death?

Agresti/Franklin Statistics, 15 of 33
Three Main Aspects of Statistics
Design
Description
Inference

Agresti/Franklin Statistics, 16 of 33
Design
How to conduct the experiment
How to select the people for the survey
Agresti/Franklin Statistics, 17 of 33
Description
Summarize the raw data
Present the data in a useful format

Agresti/Franklin Statistics, 18 of 33
Inference
Make decisions or predictions based on the data.

Agresti/Franklin Statistics, 19 of 33
Example: Harvard Medical School study of Aspirin and Heart attacks
Study participants were divided into two groups• Group 1: assigned to take aspirin
• Group 2: assigned to take a placebo

Agresti/Franklin Statistics, 20 of 33
Example: Harvard Medical School study of Aspirin and Heart attacks
Results: the percentage of each group that had heart attacks during the study:
0.9% for those taking aspirin 1.7% for those taking placebo

Agresti/Franklin Statistics, 21 of 33
Example: Harvard Medical School study of Aspirin and Heart attacks
Can you conclude that it is beneficial for people to take aspiring regularly?
Example: Harvard Medical School study of Aspirin and Heart attacks

Agresti/Franklin Statistics, 22 of 33
Section 1.2
We Learn About Populations Using Samples

Agresti/Franklin Statistics, 23 of 33
Subjects
The entities that we measure in a study
Subjects could be individuals, schools, countries, days,…

Agresti/Franklin Statistics, 24 of 33
Population and Sample
Population: All subjects of interest
Sample: Subset of the population for whom we have data

Agresti/Franklin Statistics, 25 of 33
Geographic Origin (Fall 2005)
Undergraduates* Graduates Total
Master Doctoral
Texas1,532
(51.3%)474 482 2,488
Other U.S.1,320
(44.2%)157 178 1,655
International96
(3.2%)123 521 740
Not Designated40
(1.3%)27 21 88
Total 2,988 781 1,202 4,971

Agresti/Franklin Statistics, 26 of 33
Enrollment Fall 2005
Classification Men Women Total
Undergraduate1,533(52%)
1,416(48%)
2,949
Professional* 17 22 39
Graduate 1,285 698 1,983
Master 505 276 781
Doctoral 780 422 1,202
Total2 2,835 2,136 4,971

Agresti/Franklin Statistics, 27 of 33
Majors (Fall 2005)Undergrad Grad
# % Master % Doctoral %
Architecture 126 4% 74 9% 1 1%
Engineering 751 25% 36 5% 464 39%
Humanities 559 19% 16 2% 175 14%
Management -- 0% 471 60% -- 0%
Music 128 4% 123 16% 39 3%
Natural Sciences 704 23% 29 4% 346 29%
Social Sciences 693 23% -- 0% 135 11%
Interdisciplinary 21 1% -- 0% 42 3%
Continuing Studies
-- 0% 32 4% -- 0%
Unclassified 6 1% -- 0% -- 0%
Total 2,988 781 1,202 100%

Agresti/Franklin Statistics, 28 of 33
Example Format
• Picture the Scenario
• Question to Explore
• Think it Through
• Insight
• Practice the concept

Agresti/Franklin Statistics, 29 of 33
Example: The Sample and the Population for an Exit Poll
In California in 2003, a special election was held to consider whether Governor Gray Davis should be recalled from office.
An exit poll sampled 3160 of the 8 million people who voted.

Agresti/Franklin Statistics, 30 of 33
What’s the sample and the
population for this exit poll?
The population was the 8 million people who voted in the election.
The sample was the 3160 voters who were interviewed in the exit poll.
Example: The Sample and the Population for an Exit PollExample: The Sample and the Population for an Exit Poll

Agresti/Franklin Statistics, 31 of 33
Descriptive Statistics
Methods for summarizing data
Summaries usually consist of graphs and numerical summaries of the data

Agresti/Franklin Statistics, 32 of 33
Types of U.S. Households

Agresti/Franklin Statistics, 33 of 33
Inference
Methods of making decisions or predictions about a populations based on sample information.

Agresti/Franklin Statistics, 34 of 33
Parameter and Statistic
A parameter is a numerical summary of the population
A statistic is a numerical summary of a sample taken from the population
Agresti/Franklin Statistics, 35 of 33
Randomness
Simple Random Sampling: each subject in the population has the same chance of being included in that sample
Randomness is crucial to experimentation

Agresti/Franklin Statistics, 36 of 33
Variability
Measurements vary from person to person
Measurements vary from sample to sample

Agresti/Franklin Statistics, 37 of 33
a. To describe whether a sample has more females or males.
b. To reduce a data file to easily understood summaries.
c. To make predictions about populations using sample data.
d. To predict the sample data we will get when we know the population.
Inferential Statistics are used:

Agresti/Franklin Statistics, 38 of 33
Chapter 2Exploring Data with Graphs and
Numerical Summaries
Learn ….The Different Types of Data
The Use of Graphs to Describe Data
The Numerical Methods of Summarizing Data

Agresti/Franklin Statistics, 39 of 33
Section 2.1
What are the Types of Data?
Agresti/Franklin Statistics, 40 of 33
In Every Statistical Study:
Questions are posed
Characteristics are observed
Agresti/Franklin Statistics, 41 of 33
Characteristics are Variables
A Variable is any characteristic that is recorded for subjects in the study

Agresti/Franklin Statistics, 42 of 33
Variation in Data
The terminology variable highlights the fact that data values vary.

Agresti/Franklin Statistics, 43 of 33
Example: Students in a Statistics Class
Variables:• Age
• GPA
• Major
• Smoking Status
• …

Agresti/Franklin Statistics, 44 of 33
Data values are called observations
Each observation can be:
• Quantitative
• Categorical
Agresti/Franklin Statistics, 45 of 33
Categorical Variable
Each observation belongs to one of a set of categories
Examples:• Gender (Male or Female)
• Religious Affiliation (Catholic, Jewish, …)
• Place of residence (Apt, Condo, …)
• Belief in Life After Death (Yes or No)

Agresti/Franklin Statistics, 46 of 33
Quantitative Variable
Observations take numerical values
Examples:• Age
• Number of siblings
• Annual Income
• Number of years of education completed
Agresti/Franklin Statistics, 47 of 33
Graphs and Numerical Summaries
Describe the main features of a variable
For Quantitative variables: key features are center and spread
For Categorical variables: key feature is the percentage in each of the categories

Agresti/Franklin Statistics, 48 of 33
Quantitative Variables
Discrete Quantitative Variables
and
Continuous Quantitative Variables

Agresti/Franklin Statistics, 49 of 33
Discrete
A quantitative variable is discrete if its possible values form a set of separate numbers such as 0, 1, 2, 3, …

Agresti/Franklin Statistics, 50 of 33
Examples of discrete variables
Number of pets in a household Number of children in a family Number of foreign languages spoken

Agresti/Franklin Statistics, 51 of 33
Continuous
A quantitative variable is continuous if its possible values form an interval

Agresti/Franklin Statistics, 52 of 33
Examples of Continuous Variables
Height Weight Age Amount of time it takes to complete
an assignment

Agresti/Franklin Statistics, 53 of 33
Frequency Table
A method of organizing data
Lists all possible values for a variable along with the number of observations for each value

Agresti/Franklin Statistics, 54 of 33
Example: Shark Attacks

Agresti/Franklin Statistics, 55 of 33
Example: Shark Attacks
What is the variable?
Is it categorical or quantitative?
How is the proportion for Florida calculated?
How is the % for Florida calculated?
Example: Shark Attacks
Agresti/Franklin Statistics, 56 of 33
Insights – what the data tells us about shark attacks
Example: Shark Attacks
Agresti/Franklin Statistics, 57 of 33
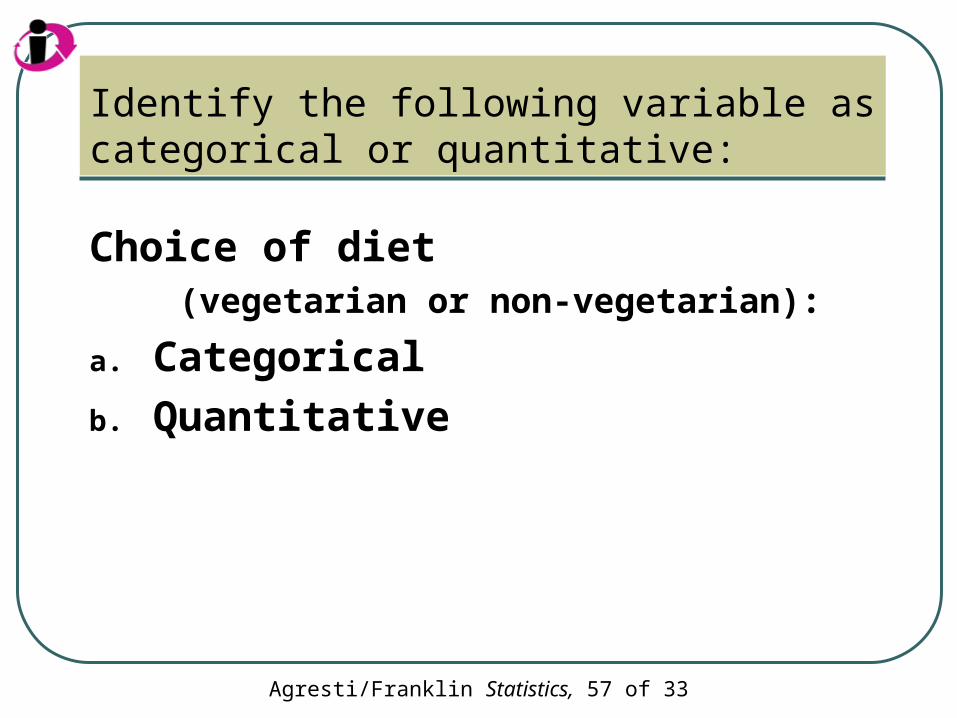
Identify the following variable as categorical or quantitative:
Choice of diet (vegetarian or non-vegetarian):
a. Categorical
b. Quantitative

Agresti/Franklin Statistics, 58 of 33
Number of people you have known who have been elected to political office:
a. Categorical
b. Quantitative
Identify the following variable as categorical or quantitative:

Agresti/Franklin Statistics, 59 of 33
Identify the following variable as discrete or continuous:
The number of people in line at a box office to purchase theater tickets:
a. Continuous
b. Discrete

Agresti/Franklin Statistics, 60 of 33
The weight of a dog:
a. Continuous
b. Discrete
Identify the following variable as discrete or continuous:

Agresti/Franklin Statistics, 61 of 33
Section 2.2
How Can We Describe Data Using Graphical Summaries?

Agresti/Franklin Statistics, 62 of 33
Graphs for Categorical Data
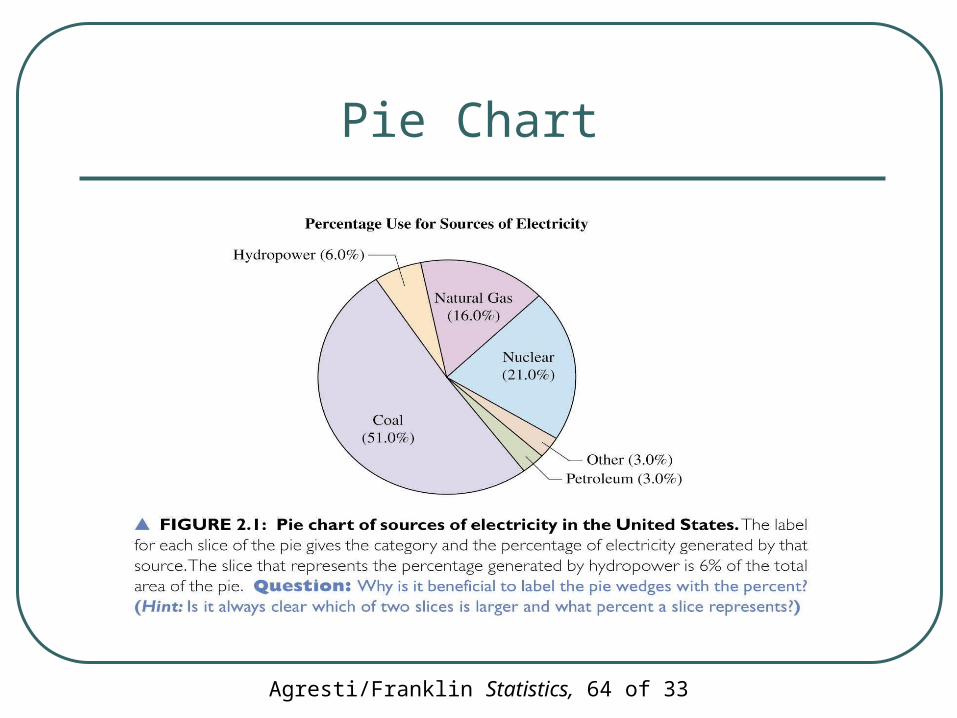
Pie Chart: A circle having a “slice of pie” for each category
Bar Graph: A graph that displays a vertical bar for each category
Agresti/Franklin Statistics, 63 of 33
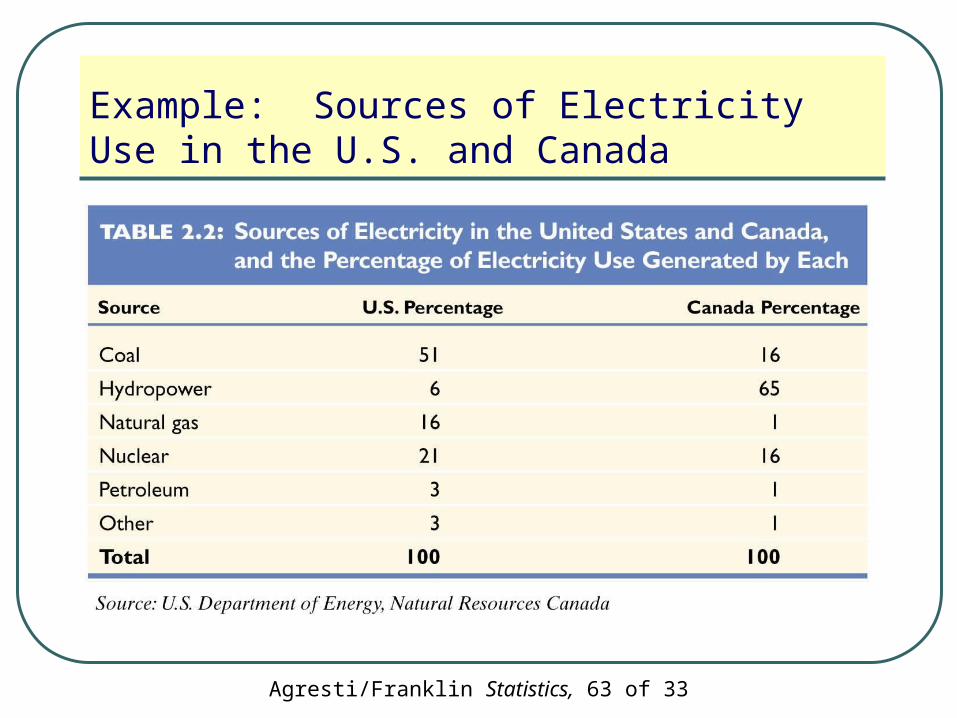
Example: Sources of Electricity Use in the U.S. and Canada
Agresti/Franklin Statistics, 64 of 33
Pie Chart

Agresti/Franklin Statistics, 65 of 33
Bar Chart

Agresti/Franklin Statistics, 66 of 33
Pie Chart vs. Bar Chart
Which graph do you prefer? Why?

Agresti/Franklin Statistics, 67 of 33
Graphs for Quantitative Data
Dot Plot: shows a dot for each observation
Stem-and-Leaf Plot: portrays the individual observations
Histogram: uses bars to portray the data
Agresti/Franklin Statistics, 68 of 33
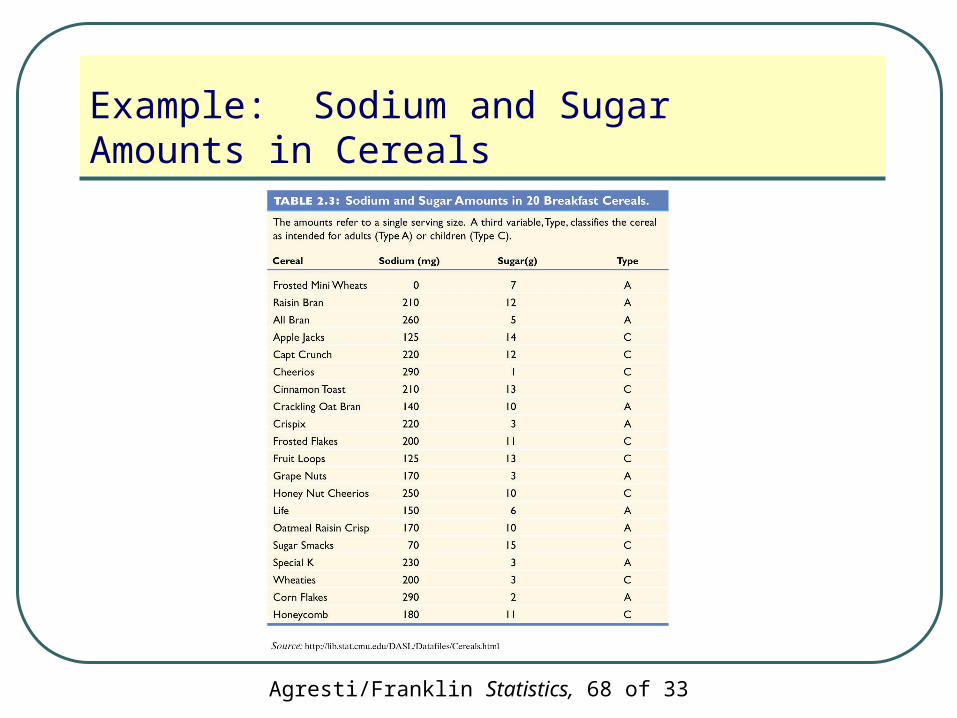
Example: Sodium and Sugar Amounts in Cereals

Agresti/Franklin Statistics, 69 of 33
Dotplot for Sodium in Cereals
Sodium Data:
0 210 260 125 220 290 210 140 220 200 125 170 250 150 170 70 230 200 290 180
Agresti/Franklin Statistics, 70 of 33
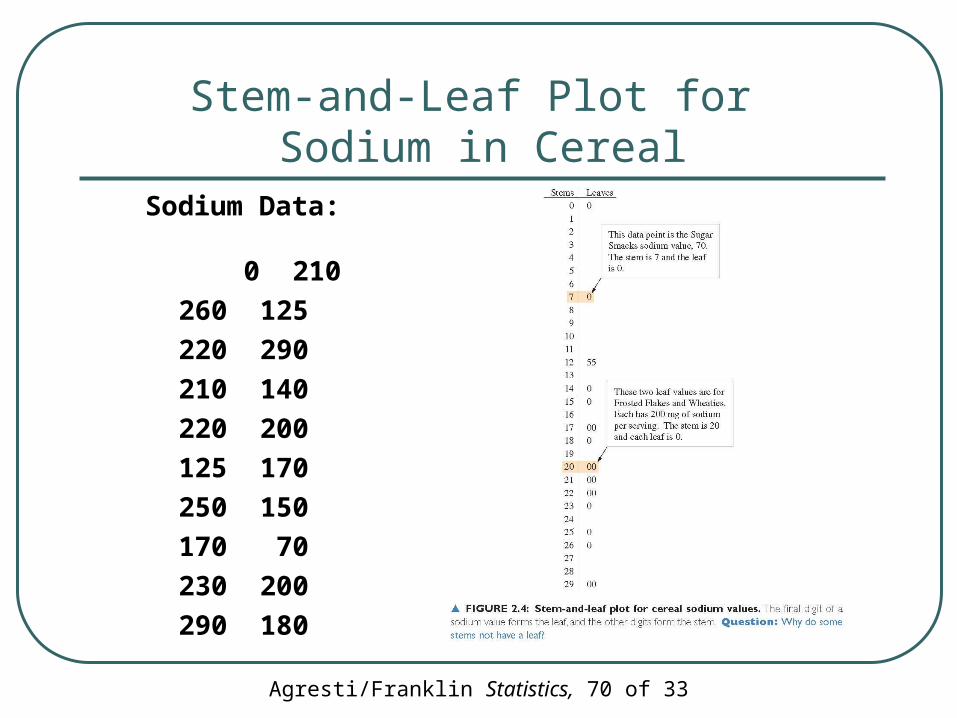
Stem-and-Leaf Plot for Sodium in Cereal
Sodium Data:
0 210
260 125
220 290
210 140
220 200
125 170
250 150
170 70
230 200
290 180

Agresti/Franklin Statistics, 71 of 33
Frequency Table
Sodium Data: 0 210
260 125220 290210 140220 200125 170250 150170 70230 200290 180

Agresti/Franklin Statistics, 72 of 33
Histogram for Sodium in Cereals

Agresti/Franklin Statistics, 73 of 33
Which Graph?
Dot-plot and stem-and-leaf plot:• More useful for small data sets
• Data values are retained
Histogram• More useful for large data sets
• Most compact display
• More flexibility in defining intervals

Agresti/Franklin Statistics, 74 of 33
Shape of a Distribution
Overall pattern• Clusters?
• Outliers?
• Symmetric?
• Skewed?
• Unimodal?
• Bimodal?
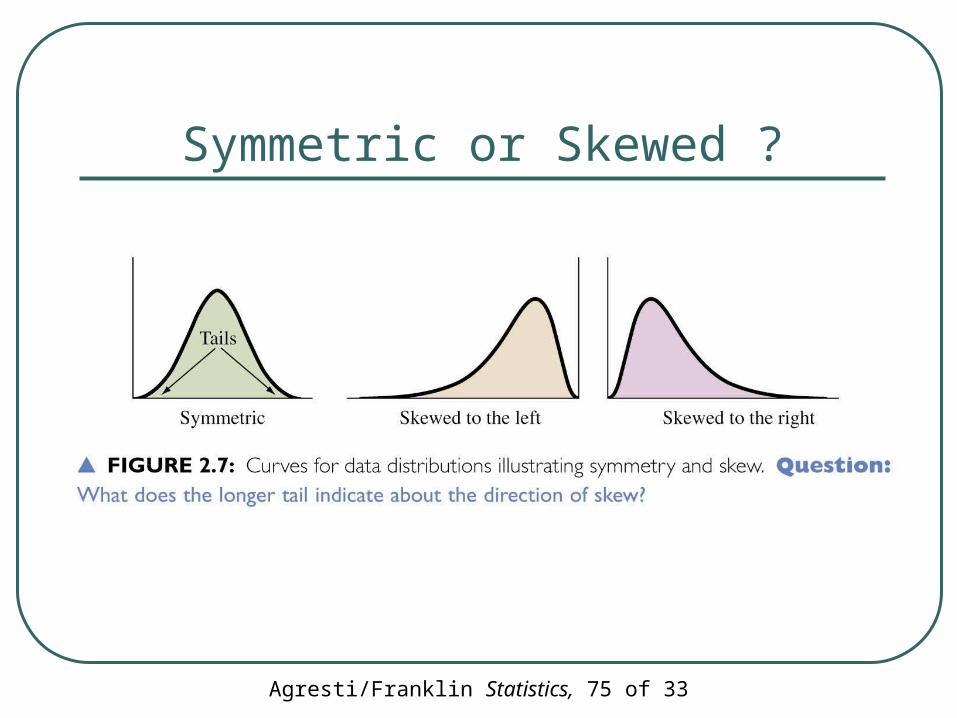
Agresti/Franklin Statistics, 75 of 33
Symmetric or Skewed ?

Agresti/Franklin Statistics, 76 of 33
Example: Hours of TV Watching
Agresti/Franklin Statistics, 77 of 33
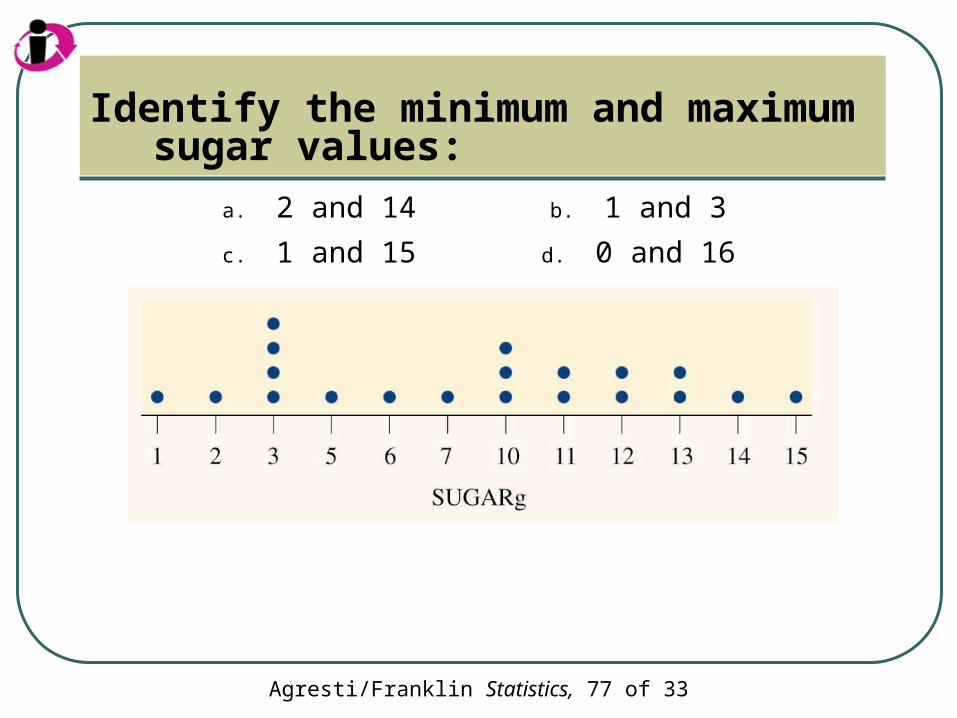
Identify the minimum and maximum sugar values:
a. 2 and 14 b. 1 and 3
c. 1 and 15 d. 0 and 16

Agresti/Franklin Statistics, 78 of 33
Consider a data set containing IQ scores for the general public:
What shape would you expect a histogram of this data set to have?
a. Symmetric
b. Skewed to the left
c. Skewed to the right
d. Bimodal

Agresti/Franklin Statistics, 79 of 33
Consider a data set of the scores of students on a very easy exam in which most score very well but a few score very poorly:
What shape would you expect a histogram of this data set to have?
a. Symmetric
b. Skewed to the left
c. Skewed to the right
d. Bimodal