
TD Bank Group Quarterly Results Presentation Q2 2015 · PDF fileQuarterly Results Presentation...
30
TD Bank Group Quarterly Results Presentation Q2 2015 Thursday May 28 th , 2015
Transcript of TD Bank Group Quarterly Results Presentation Q2 2015 · PDF fileQuarterly Results Presentation...

TD Bank Group Quarterly Results Presentation
Q2 2015
Thursday May 28th, 2015
2
Caution Regarding Forward-Looking Statements
From time to time, the Bank makes written and/or oral forward-looking statements, including in this document, in other filings with Canadian regulators or the United States (U.S.) Securities and Exchange Commission (SEC), and in other communications. In addition, representatives of the Bank may make forward-looking statements orally to analysts, investors, the media and others. All such statements are made pursuant to the “safe harbour” provisions of, and are intended to be forward-looking statements under, applicable Canadian and U.S. securities legislation, including the U.S. Private Securities Litigation Reform Act of 1995. Forward-looking statements include, but are not limited to, statements made in this document, the Management's Discussion and Analysis (“MD&A”) in the Bank's 2014 Annual Report under the heading “Economic Summary and Outlook”, for each business segment under headings “Business Outlook and Focus for 2015”, and in other statements regarding the Bank’s objectives and priorities for 2015 and beyond and strategies to achieve them, and the Bank’s anticipated financial performance. Forward-looking statements are typically identified by words such as “will”, “should”, “believe”, “expect”, “anticipate”, “intend”, “estimate”, “plan”, “may”, and “could”.
By their very nature, these forward-looking statements require the Bank to make assumptions and are subject to inherent risks and uncertainties, general and specific. Especially in light of the uncertainty related to the physical, financial, economic, political, and regulatory environments, such risks and uncertainties – many of which are beyond the Bank’s control and the effects of which can be difficult to predict – may cause actual results to differ materially from the expectations expressed in the forward-looking statements. Risk factors that could cause, individually or in the aggregate, such differences include: credit, market (including equity, commodity, foreign exchange, and interest rate), liquidity, operational (including technology), reputational, insurance, strategic, regulatory, legal, environmental, capital adequacy, and other risks. Examples of such risk factors include the general business and economic conditions in the regions in which the Bank operates; the ability of the Bank to execute on key priorities, including to successfully complete acquisitions and strategic plans and to attract, develop and retain key executives; disruptions in or attacks (including cyber attacks) on the Bank’s information technology, internet, network access or other voice or data communications systems or services; the evolution of various types of fraud or other criminal behaviour to which the Bank is exposed; the failure of third parties to comply with their obligations to the Bank or its affiliates, including relating to the care and control of information; the impact of new and changes to current laws and regulations; the overall difficult litigation environment, including in the U.S.; increased competition, including through internet and mobile banking; changes to the Bank’s credit ratings; changes in currency and interest rates; increased funding costs for credit due to market illiquidity and competition for funding; changes to accounting policies and methods used by the Bank; and the occurrence of natural and unnatural catastrophic events and claims resulting from such events. The Bank cautions that the preceding list is not exhaustive of all possible risk factors and other factors could also adversely affect the Bank’s results. For more detailed information, please see the “Risk Factors and Management” section of the 2014 MD&A, as may be updated in subsequently filed quarterly reports to shareholders and news releases (as applicable) related to any transactions or events discussed under the heading “Significant Events” in the relevant MD&A, which applicable releases may be found on www.td.com. All such factors should be considered carefully, as well as other uncertainties and potential events, and the inherent uncertainty of forward-looking statements, when making decisions with respect to the Bank and the Bank cautions readers not to place undue reliance on the Bank’s forward-looking statements.
Material economic assumptions underlying the forward-looking statements contained in this document are set out in the 2014 MD&A under the headings “Economic Summary and Outlook”, and for each business segment, “Business Outlook and Focus for 2015”, each as updated in subsequently filed quarterly reports to shareholders.
Any forward-looking statements contained in this document represent the views of management only as of the date hereof and are presented for the purpose of assisting the Bank’s shareholders and analysts in understanding the Bank’s financial position, objectives and priorities and anticipated financial performance as at and for the periods ended on the dates presented, and may not be appropriate for other purposes. The Bank does not undertake to update any forward-looking statements, whether written or oral, that may be made from time to time by or on its behalf, except as required under applicable securities legislation.
3
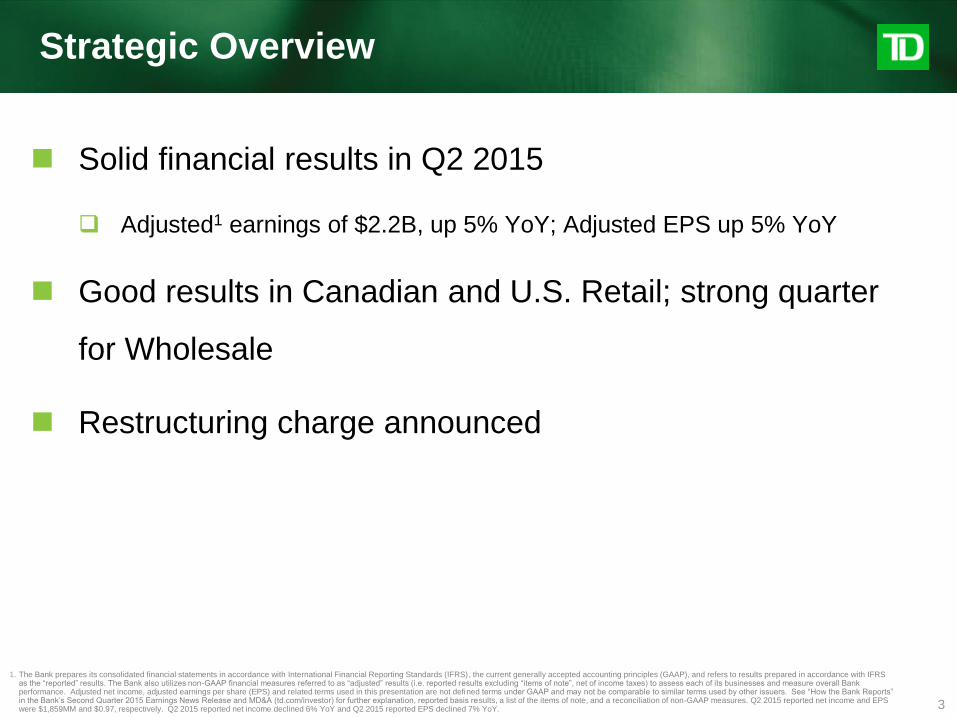
Strategic Overview
Solid financial results in Q2 2015
Adjusted1 earnings of $2.2B, up 5% YoY; Adjusted EPS up 5% YoY
Good results in Canadian and U.S. Retail; strong quarter
for Wholesale
Restructuring charge announced
1. The Bank prepares its consolidated financial statements in accordance with International Financial Reporting Standards (IFRS), the current generally accepted accounting principles (GAAP), and refers to results prepared in accordance with IFRS as the “reported” results. The Bank also utilizes non-GAAP financial measures referred to as “adjusted” results (i.e. reported results excluding “items of note”, net of income taxes) to assess each of its businesses and measure overall Bank performance. Adjusted net income, adjusted earnings per share (EPS) and related terms used in this presentation are not defined terms under GAAP and may not be comparable to similar terms used by other issuers. See “How the Bank Reports” in the Bank’s Second Quarter 2015 Earnings News Release and MD&A (td.com/investor) for further explanation, reported basis results, a list of the items of note, and a reconciliation of non-GAAP measures. Q2 2015 reported net income and EPS were $1,859MM and $0.97, respectively. Q2 2015 reported net income declined 6% YoY and Q2 2015 reported EPS declined 7% YoY.
4
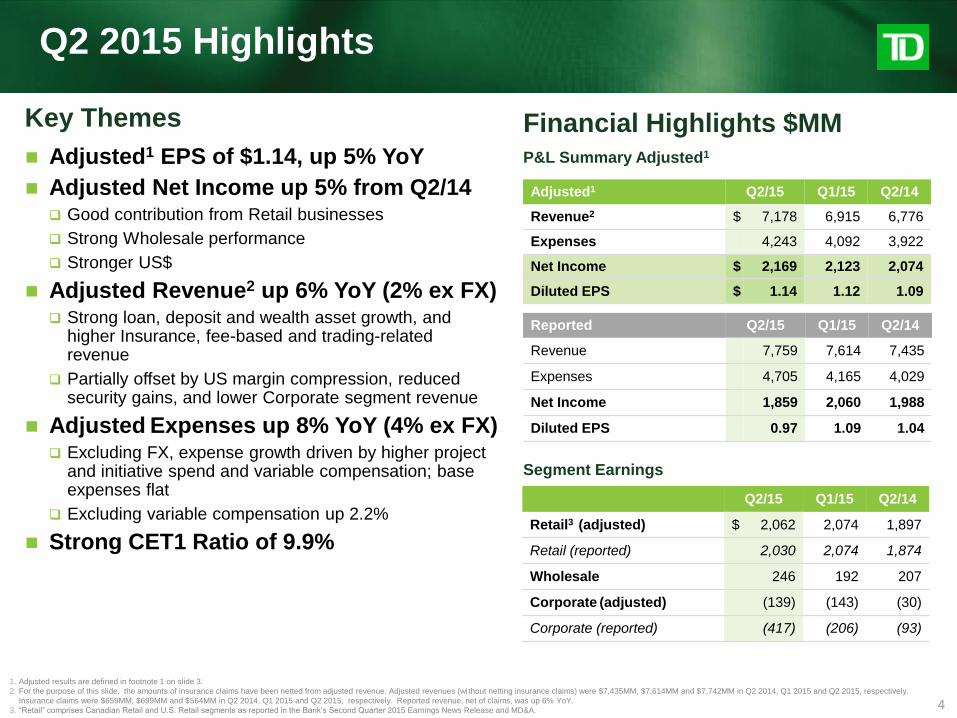
Q2 2015 Highlights
Adjusted1 Q2/15 Q1/15 Q2/14
Revenue2 $ 7,178 6,915 6,776
Expenses 4,243 4,092 3,922
Net Income $ 2,169 2,123 2,074
Diluted EPS $ 1.14 1.12 1.09
1. Adjusted results are defined in footnote 1 on slide 3.
2. For the purpose of this slide, the amounts of insurance claims have been netted from adjusted revenue. Adjusted revenues (wi thout netting insurance claims) were $7,435MM, $7,614MM and $7,742MM in Q2 2014, Q1 2015 and Q2 2015, respectively.
Insurance claims were $659MM, $699MM and $564MM in Q2 2014, Q1 2015 and Q2 2015, respectively. Reported revenue, net of claims, was up 6% YoY.
3. “Retail” comprises Canadian Retail and U.S. Retail segments as reported in the Bank’s Second Quarter 2015 Earnings News Release and MD&A.
Reported Q2/15 Q1/15 Q2/14
Revenue 7,759 7,614 7,435
Expenses 4,705 4,165 4,029
Net Income 1,859 2,060 1,988
Diluted EPS 0.97 1.09 1.04
Financial Highlights $MM
Q2/15 Q1/15 Q2/14
Retail3 (adjusted) $ 2,062 2,074 1,897
Retail (reported) 2,030 2,074 1,874
Wholesale 246 192 207
Corporate (adjusted) (139) (143) (30)
Corporate (reported) (417) (206) (93)
P&L Summary Adjusted1
Segment Earnings
Key Themes
Adjusted1 EPS of $1.14, up 5% YoY
Adjusted Net Income up 5% from Q2/14 Good contribution from Retail businesses
Strong Wholesale performance
Stronger US$
Adjusted Revenue2 up 6% YoY (2% ex FX) Strong loan, deposit and wealth asset growth, and
higher Insurance, fee-based and trading-related revenue
Partially offset by US margin compression, reduced security gains, and lower Corporate segment revenue
Adjusted Expenses up 8% YoY (4% ex FX) Excluding FX, expense growth driven by higher project
and initiative spend and variable compensation; base expenses flat
Excluding variable compensation up 2.2%
Strong CET1 Ratio of 9.9%
5
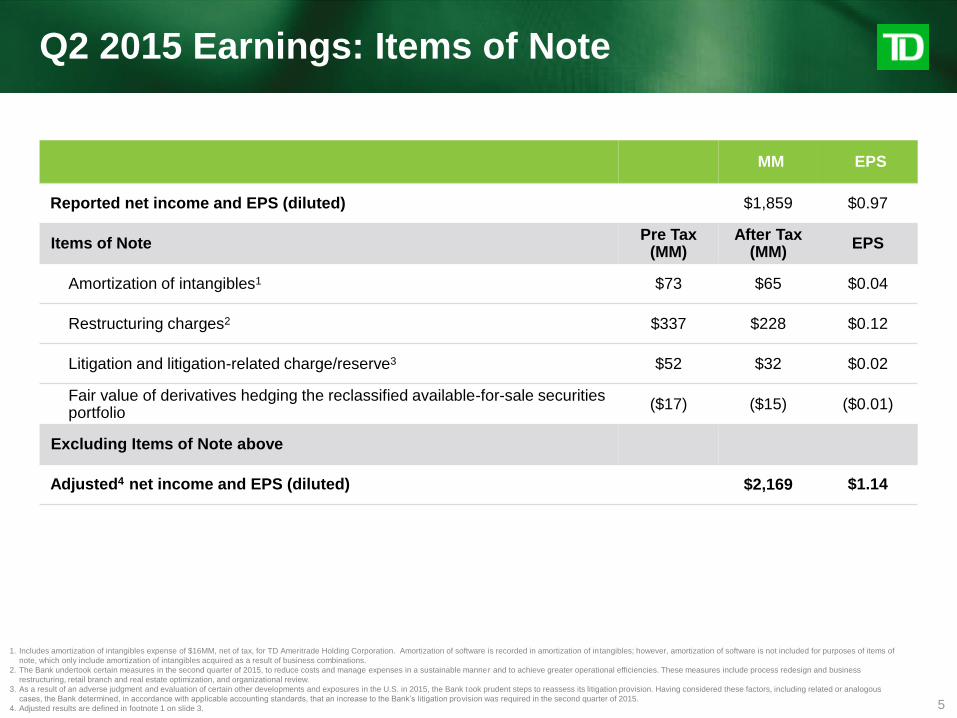
Q2 2015 Earnings: Items of Note
MM EPS
Reported net income and EPS (diluted) $1,859 $0.97
Items of Note Pre Tax
(MM) After Tax
(MM) EPS
Amortization of intangibles1 $73
$65
$0.04
Restructuring charges2 $337
$228
$0.12
Litigation and litigation-related charge/reserve3 $52
$32
$0.02
Fair value of derivatives hedging the reclassified available-for-sale securities portfolio ($17)
($15)
($0.01)
Excluding Items of Note above
Adjusted4 net income and EPS (diluted) $2,169 $1.14
1. Includes amortization of intangibles expense of $16MM, net of tax, for TD Ameritrade Holding Corporation. Amortization of software is recorded in amortization of intangibles; however, amortization of software is not included for purposes of items of
note, which only include amortization of intangibles acquired as a result of business combinations.
2. The Bank undertook certain measures in the second quarter of 2015, to reduce costs and manage expenses in a sustainable manner and to achieve greater operational efficiencies. These measures include process redesign and business
restructuring, retail branch and real estate optimization, and organizational review.
3. As a result of an adverse judgment and evaluation of certain other developments and exposures in the U.S. in 2015, the Bank took prudent steps to reassess its litigation provision. Having considered these factors, including related or analogous
cases, the Bank determined, in accordance with applicable accounting standards, that an increase to the Bank’s litigation provision was required in the second quarter of 2015.
4. Adjusted results are defined in footnote 1 on slide 3.
6
Canadian Retail
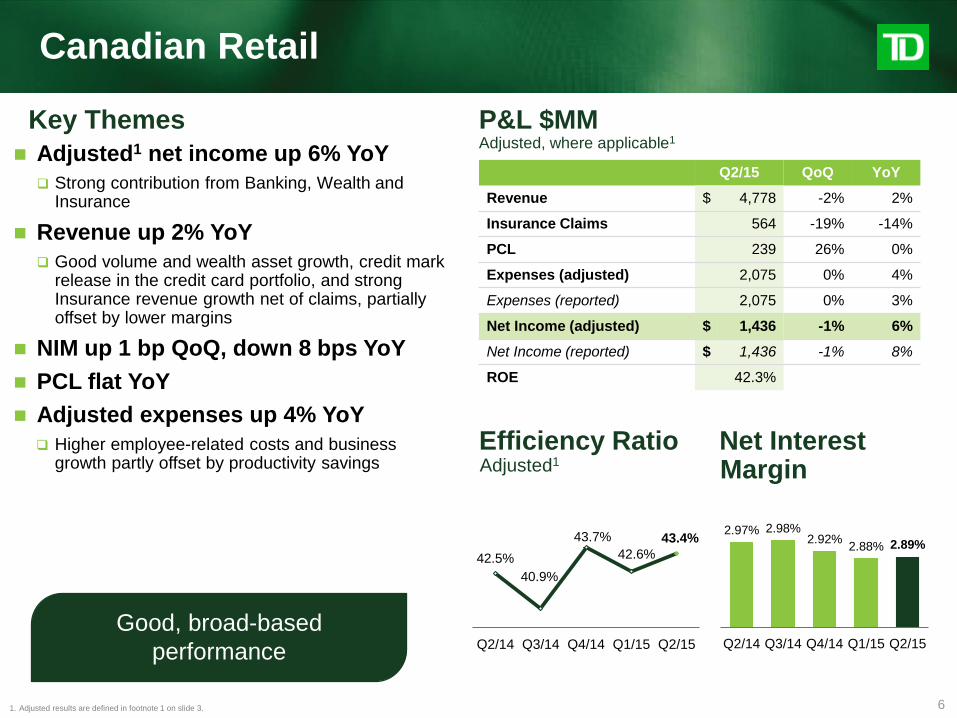
42.5%
40.9%
43.7%
42.6%
43.4%
Q2/14 Q3/14 Q4/14 Q1/15 Q2/15
Efficiency Ratio Adjusted1
Net Interest Margin
1. Adjusted results are defined in footnote 1 on slide 3.
Key Themes P&L $MM
Adjusted, where applicable1
Q2/15 QoQ YoY
Revenue $ 4,778 -2% 2%
Insurance Claims 564 -19% -14%
PCL 239 26% 0%
Expenses (adjusted) 2,075 0% 4%
Expenses (reported) 2,075 0% 3%
Net Income (adjusted) $ 1,436 -1% 6%
Net Income (reported) $ 1,436 -1% 8%
ROE 42.3%
Good, broad-based
performance
Adjusted1 net income up 6% YoY
Strong contribution from Banking, Wealth and Insurance
Revenue up 2% YoY
Good volume and wealth asset growth, credit mark release in the credit card portfolio, and strong Insurance revenue growth net of claims, partially offset by lower margins
NIM up 1 bp QoQ, down 8 bps YoY
PCL flat YoY
Adjusted expenses up 4% YoY
Higher employee-related costs and business growth partly offset by productivity savings
2.97% 2.98% 2.92%
2.88% 2.89%
Q2/14 Q3/14 Q4/14 Q1/15 Q2/15
7
U.S. Retail
1. Adjusted results are defined in footnote 1 on slide 3. Q2 2015 reported efficiency ratio and return on equity were 68.2% and 7.9%, respectively.
2. Security gains includes both gains on sales of securities and debt securities classified as loans.
3. Deposits includes average personal deposits, average business deposits, and average TD Ameritrade insured deposit account (IDA) balances. Loans includes average personal loans and average business loans and acceptances.
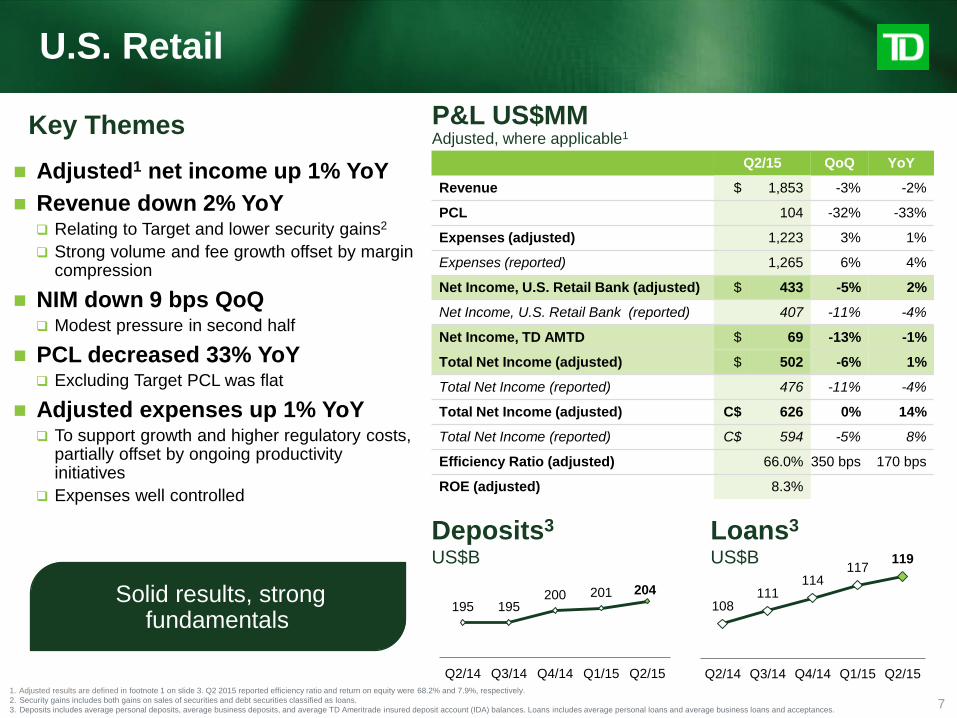
Q2/15 QoQ YoY
Revenue $ 1,853 -3% -2%
PCL 104 -32% -33%
Expenses (adjusted) 1,223 3% 1%
Expenses (reported) 1,265 6% 4%
Net Income, U.S. Retail Bank (adjusted) $ 433 -5% 2%
Net Income, U.S. Retail Bank (reported) 407 -11% -4%
Net Income, TD AMTD $ 69 -13% -1%
Total Net Income (adjusted) $ 502 -6% 1%
Total Net Income (reported) 476 -11% -4%
Total Net Income (adjusted) C$ 626 0% 14%
Total Net Income (reported) C$ 594 -5% 8%
Efficiency Ratio (adjusted) 66.0% 350 bps 170 bps
ROE (adjusted) 8.3%
Key Themes P&L US$MM
Adjusted, where applicable1
Deposits3 US$B
Loans3 US$B
195 195 200 201 204
Q2/14 Q3/14 Q4/14 Q1/15 Q2/15
108 111
114 117
119
Q2/14 Q3/14 Q4/14 Q1/15 Q2/15
Great quarter on strong Retail and good
Wholesale results
Solid results, strong fundamentals
Adjusted1 net income up 1% YoY
Revenue down 2% YoY Relating to Target and lower security gains2
Strong volume and fee growth offset by margin compression
NIM down 9 bps QoQ Modest pressure in second half
PCL decreased 33% YoY Excluding Target PCL was flat
Adjusted expenses up 1% YoY To support growth and higher regulatory costs,
partially offset by ongoing productivity initiatives
Expenses well controlled

8
Wholesale Banking
Revenue $MM
Key Themes P&L $MM
Q2/15 QoQ YoY
Revenue $ 784 10% 16%
PCL 0 NA NA
Expenses 447 3% 10%
Net Income $ 246 28% 19%
ROE 17.7%
Net income up 19% YoY
Revenue up 16% YoY Broad-based contribution from trading,
equity and debt underwriting and strong corporate lending growth
Expenses up 10% YoY Higher variable compensation and the
impact of FX
Great quarter on strong Retail and good
Wholesale results
Client-driven franchise model delivering strong results
365 325 296 380 424
313 355 308
331 360
678 680
604
711 784
Q2/14 Q3/14 Q4/14 Q1/15 Q2/15
Trading Related Non-Trading

9
Corporate Segment
Key Themes
Q2/15 Q1/15 Q2/14
Net Corporate Expenses $ (177) $ (172) $ (159)
Other 10 2 103
Non-Controlling Interests 28 27 26
Net Income (adjusted) $ (139) $ (143) $ (30)
Net Income (reported) (417) (206) (93)
Background
Corporate segment includes: Net treasury and capital management
related activities
Corporate expenses and other items not fully allocated to operating segments
Adjusted1 net income down $109MM YoY
Reflects the prior year gain on sale of TD Ameritrade shares and lower favourable tax items
1. Adjusted results are defined in footnote 1 on slide 3 .
P&L $MM
Adjusted, where applicable1
10
Capital & Liquidity
1. Effective Q1 2013, amounts are calculated in accordance with the Basel III regulatory framework, excluding Credit Valuation Adjustment (CVA) capital in accordance with OSFI guidance and are presented based on the “all-in” methodology.
Effective January 1, 2014, the CVA capital charge is phased in over a five year period based on a scalar approach whereby a CVA capital charge of 57% applies in 2014, 64% in 2015 and 2016, 72% in 2017, 80% in 2018 and 100% in 2019.
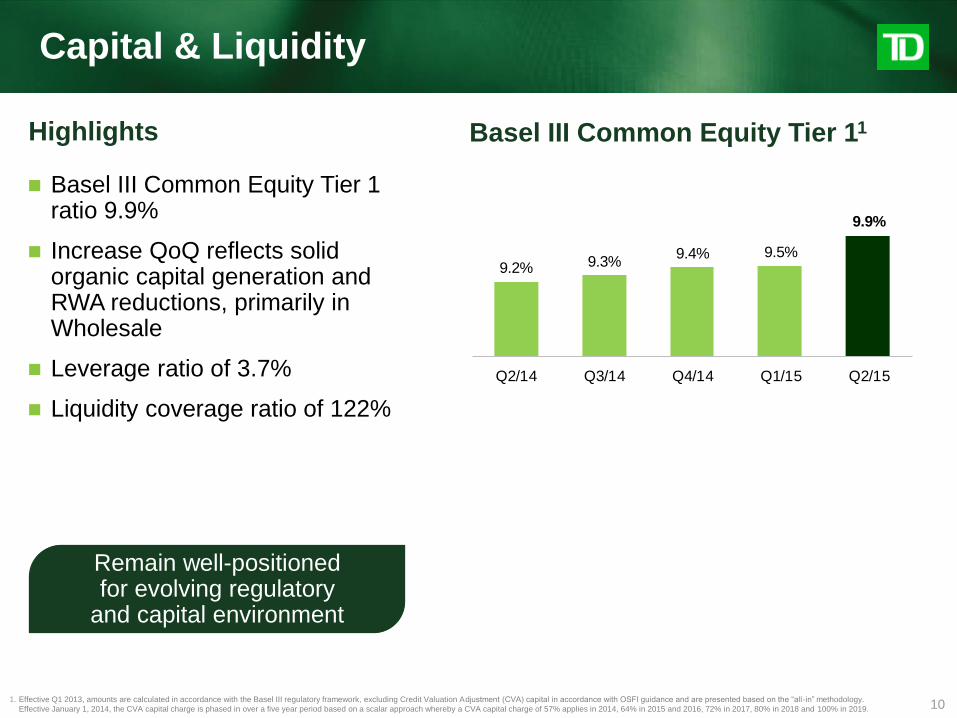
Basel III Common Equity Tier 11 Highlights
Basel III Common Equity Tier 1 ratio 9.9%
Increase QoQ reflects solid organic capital generation and RWA reductions, primarily in Wholesale
Leverage ratio of 3.7%
Liquidity coverage ratio of 122%
Great quarter on strong Retail and good
Wholesale results
Remain well-positioned for evolving regulatory
and capital environment
9.2% 9.3%9.4% 9.5%
9.9%
Q2/14 Q3/14 Q4/14 Q1/15 Q2/15
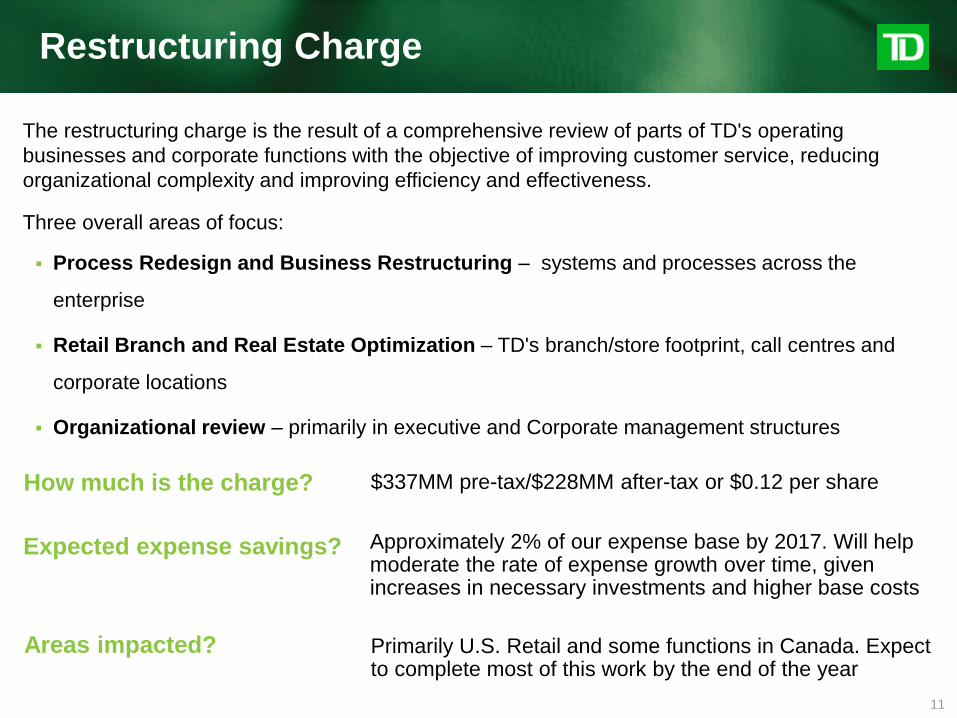
$337MM pre-tax/$228MM after-tax or $0.12 per share
Restructuring Charge
How much is the charge?
The restructuring charge is the result of a comprehensive review of parts of TD's operating
businesses and corporate functions with the objective of improving customer service, reducing
organizational complexity and improving efficiency and effectiveness.
Three overall areas of focus:
Process Redesign and Business Restructuring – systems and processes across the
enterprise
Retail Branch and Real Estate Optimization – TD's branch/store footprint, call centres and
corporate locations
Organizational review – primarily in executive and Corporate management structures
Approximately 2% of our expense base by 2017. Will help moderate the rate of expense growth over time, given increases in necessary investments and higher base costs
Expected expense savings?
Primarily U.S. Retail and some functions in Canada. Expect to complete most of this work by the end of the year
Areas impacted?
11
12
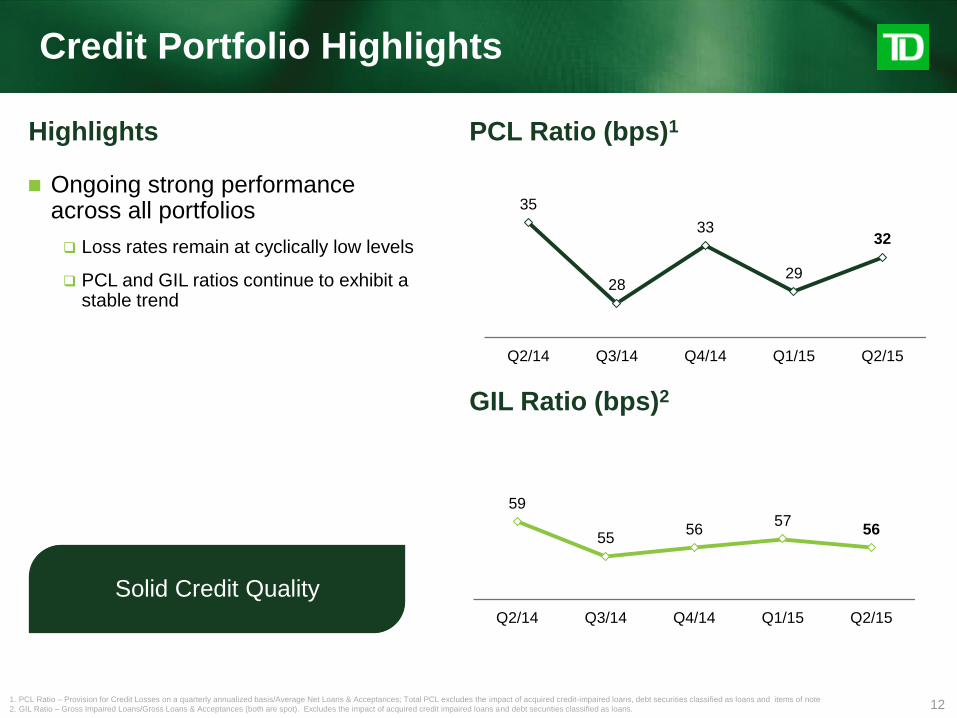
35
28
33
29
32
Q2/14 Q3/14 Q4/14 Q1/15 Q2/15
Credit Portfolio Highlights
1. PCL Ratio – Provision for Credit Losses on a quarterly annualized basis/Average Net Loans & Acceptances; Total PCL excludes the impact of acquired credit-impaired loans, debt securities classified as loans and items of note
2. GIL Ratio – Gross Impaired Loans/Gross Loans & Acceptances (both are spot). Excludes the impact of acquired credit impaired loans and debt securities classified as loans.
Highlights
GIL Ratio (bps)2
PCL Ratio (bps)1
59
55 56
57 56
Q2/14 Q3/14 Q4/14 Q1/15 Q2/15
Great quarter on strong Retail and good
Wholesale results Solid Credit Quality
Ongoing strong performance across all portfolios
Loss rates remain at cyclically low levels
PCL and GIL ratios continue to exhibit a stable trend

Appendix

14
Q2 2015 Earnings: Items of Note
MM EPS
Reported net income and EPS (diluted) $1,859 $0.97
Items of note Pre Tax
(MM) After Tax
(MM) EPS Segment
Revenue/ Expense
Line Item5
Amortization of intangibles1 $73 $65 $0.04 Corporate pg 9, line 10
Restructuring charges2 $337 $228 $0.12 Corporate pg 9, line 10
Litigation and litigation-related charge/reserve3 $52 $32 $0.02 U.S. Retail pg 6, line 12
Fair value of derivatives hedging the reclassified available-for-sale securities portfolio ($17) ($15) ($0.01) Corporate pg 9, line 10
Excluding Items of Note above
Adjusted4 net income and EPS (diluted) $2,169 $1.14
1. Includes amortization of intangibles expense of $16MM, net of tax, for TD Ameritrade Holding Corporation. Amortization of software is recorded in amortization of intangibles; however, amortization of software is not included for purposes of items of
note, which only include amortization of intangibles acquired as a result of business combinations.
2. The Bank undertook certain measures in the second quarter of 2015, to reduce costs and manage expenses in a sustainable manner and to achieve greater operational efficiencies. These measures include process redesign and business
restructuring, retail branch and real estate optimization, and organizational review.
3. As a result of an adverse judgment and evaluation of certain other developments and exposures in the U.S. in 2015, the Bank took prudent steps to reassess its litigation provision. Having considered these factors, including related or analogous
cases, the Bank determined, in accordance with applicable accounting standards, that an increase to the Bank’s litigation provision was required in the second quarter of 2015.
4. Adjusted results are defined in footnote 1 on slide 3.
5. This column refers to specific pages of our Q2 2015 Supplementary Financial Information package, which is available on our website at td.com/investor.
15
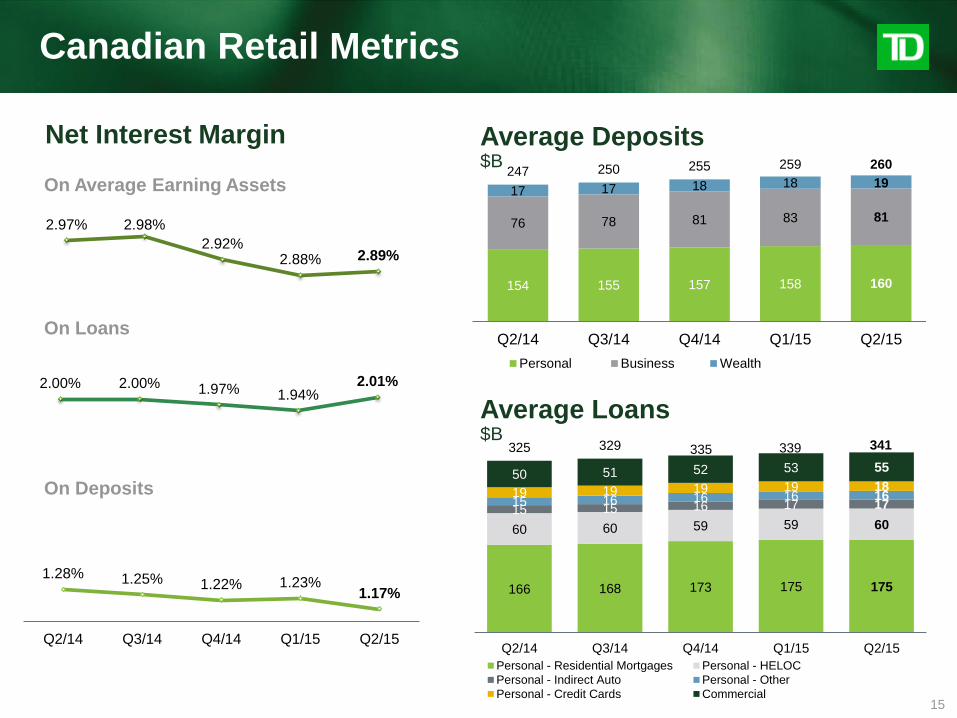
Canadian Retail Metrics
1.28% 1.25% 1.22% 1.23% 1.17%
Q2/14 Q3/14 Q4/14 Q1/15 Q2/15
On Average Earning Assets
On Loans
On Deposits
Net Interest Margin
2.00% 2.00% 1.97% 1.94% 2.01%
2.97% 2.98%
2.92% 2.88% 2.89%
154 155 157 158 160
76 78 81 83 81
17 17 18 18 19 247 250 255 259 260
Q2/14 Q3/14 Q4/14 Q1/15 Q2/15
Personal Business Wealth
Average Deposits $B
166 168 173 175 175
60 60 59 59 60 15 15 16 17 17 15 16 16 16 16 19 19 19 19 18 50 51 52 53 55
325 329 335 339 341
Q2/14 Q3/14 Q4/14 Q1/15 Q2/15
Personal - Residential Mortgages Personal - HELOC
Personal - Indirect Auto Personal - Other
Personal - Credit Cards Commercial
Average Loans $B

16 1. Certain comparative amounts for Wealth Fee & Other and revenue have been restated to conform with the presentation adopted in the current period.
2. Assets under management .
529 571 592 599 613
145 139 129 124 131
112 115 116 118 112
786 825 837 841 856
Q2/14 Q3/14 Q4/14 Q1/15 Q2/15
Wealth Fee & Other Wealth Transaction Wealth NII
Wealth Revenue1 $MM
Canadian Wealth
108
113
115
121
127
111
114 112
121
117
Q2/14 Q3/14 Q4/14 Q1/15 Q2/15
Retail Institutional
Wealth Retail vs. Institutional AUM2 $B

17
Average Deposits US$B
67 68 68 69 72
55 55 57 57 57
73 72 75 75 75
195 195 200 201 204
Q2/14 Q3/14 Q4/14 Q1/15 Q2/15
Personal Business TD Ameritrade IDAs
Average Loans US$B
54 55 56 56 56
54 56 58 61 63
108 111 114 117 119
Q2/14 Q3/14 Q4/14 Q1/15 Q2/15
Personal Commercial
US Retail Loans and Deposit Growth
1. Insured deposit accounts.
1
18
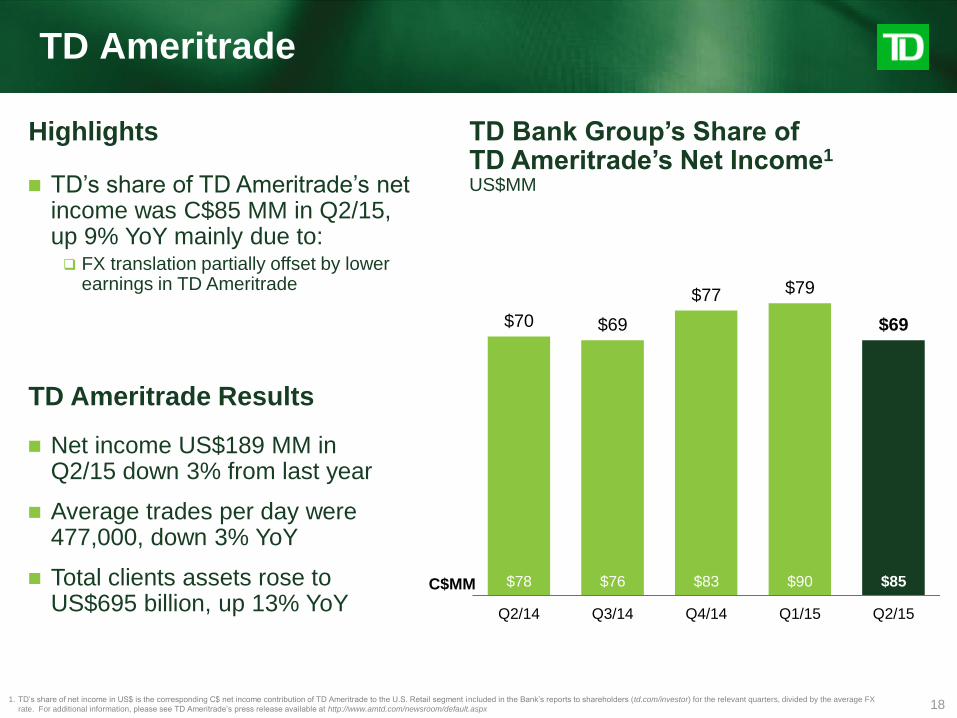
TD Ameritrade
1. TD’s share of net income in US$ is the corresponding C$ net income contribution of TD Ameritrade to the U.S. Retail segment included in the Bank’s reports to shareholders (td.com/investor) for the relevant quarters, divided by the average FX
rate. For additional information, please see TD Ameritrade’s press release available at http://www.amtd.com/newsroom/default.aspx
Highlights TD Bank Group’s Share of TD Ameritrade’s Net Income1 US$MM TD’s share of TD Ameritrade’s net
income was C$85 MM in Q2/15, up 9% YoY mainly due to: FX translation partially offset by lower
earnings in TD Ameritrade
$70 $69
$77 $79
$69
$78 $76 $83 $90 $85
Q2/14 Q3/14 Q4/14 Q1/15 Q2/15
TD Ameritrade Results
Net income US$189 MM in Q2/15 down 3% from last year
Average trades per day were 477,000, down 3% YoY
Total clients assets rose to US$695 billion, up 13% YoY
C$MM

Liquidity Coverage Ratio (LCR) New Q2 2015 Disclosure
How is it disclosed?
Q2 Average
(A) HQLA Primarily high quality sovereign or sovereign-issued with guarantee investments
$167 billion
(B) Projected net 30-Day stressed cash outflows
Primarily deposit run-off, secured and unsecured wholesale funding maturities, additional collateral required in stressed market conditions
$137 billion
(A) / (B) = Month End LCR Ratio Quarterly average is calculated based on the 3 monthly LCR ratios 122%
LCR measures a bank’s ability to withstand a liquidity crisis under a severe stress
scenario. In other words, does a Bank have sufficient high quality liquid assets (HQLA) to
cover projected stressed cash outflows in a thirty day period?
The LCR ratio is calculated at each month end and disclosed quarterly as an average.
TDBG's LCR ratio is reported based on the OSFI Liquidity Adequacy Requirement (LAR)
Guideline. It prescribes types of investments that qualify as HQLA and stressed cash
outflow weighting factors such as deposit run-off rates.
Minimum OSFI LAR LCR required = 100%.
What is it?
19
20
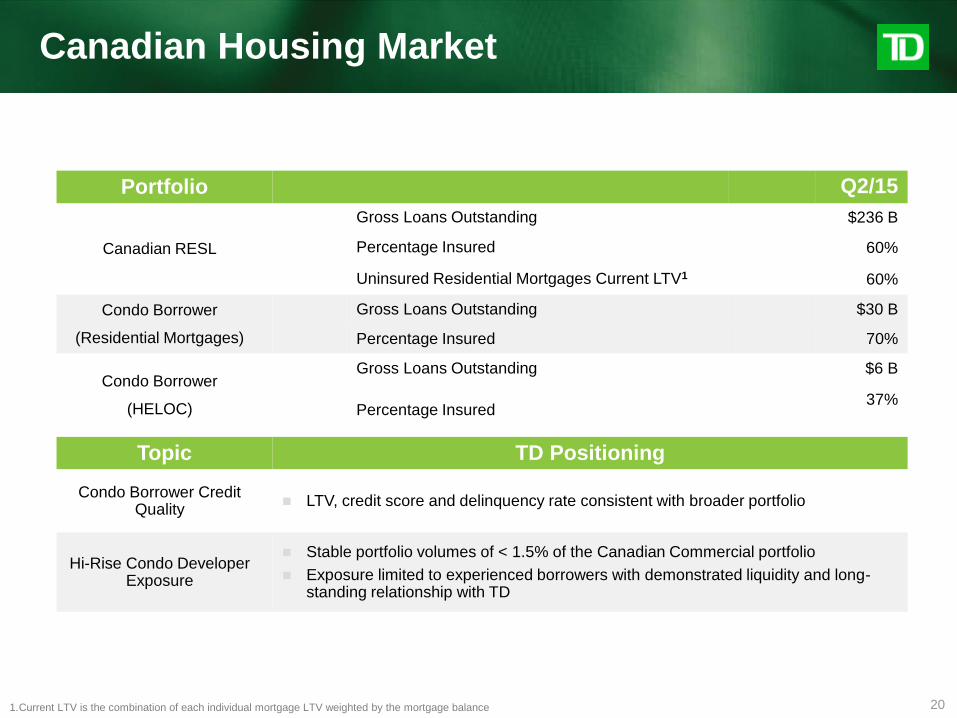
Canadian Housing Market
Portfolio Q2/15
Canadian RESL
Gross Loans Outstanding $236 B
Percentage Insured 60%
Uninsured Residential Mortgages Current LTV1 60%
Condo Borrower
(Residential Mortgages)
Gross Loans Outstanding $30 B
Percentage Insured 70%
Condo Borrower
(HELOC)
Gross Loans Outstanding $6 B
Percentage Insured 37%
Topic TD Positioning
Condo Borrower Credit Quality
LTV, credit score and delinquency rate consistent with broader portfolio
Hi-Rise Condo Developer Exposure
Stable portfolio volumes of < 1.5% of the Canadian Commercial portfolio
Exposure limited to experienced borrowers with demonstrated liquidity and long-standing relationship with TD
1.Current LTV is the combination of each individual mortgage LTV weighted by the mortgage balance

21
1. U.S. HELOC includes Home Equity Lines of Credit and Home Equity Loans
2. Wholesale portfolio includes corporate lending and other Wholesale gross loans and acceptances
3. Other includes Acquired Credit-Impaired Loans and Corporate Segment Loans.
Note: Some amounts may not total due to rounding
Excludes Debt securities classified as loans
Balances (C$B unless otherwise noted)
Q1/15 Q2/15
Canadian Retail Portfolio $ 339.6 $ 342.4
Personal $ 285.6 $ 287.2
Residential Mortgages 175.3 175.5
Home Equity Lines of Credit (HELOC) 59.7 60.3
Indirect Auto 16.9 17.5
Unsecured Lines of Credit 9.2 9.3
Credit Cards 17.4 17.5
Other Personal 7.1 7.1
Commercial Banking (including Small Business Banking) $ 54.0 $ 55.2
U.S. Retail Portfolio (all amounts in US$) US$ 117.0 US$ 120.0
Personal US$ 56.0 US$ 56.1
Residential Mortgages 20.8 20.8
Home Equity Lines of Credit (HELOC)1 10.3 10.3
Indirect Auto 17.2 17.5
Credit Cards 7.1 6.9
Other Personal 0.6 0.6
Commercial Banking US$ 61.0 US$ 63.9
Non-residential Real Estate 12.9 13.2
Residential Real Estate 3.6 3.8
Commercial & Industrial (C&I) 44.5 46.9
FX on U.S. Personal & Commercial Portfolio $ 31.7 $ 24.7
U.S. Retail Portfolio (C$) $ 148.7 $ 144.7
Wholesale Portfolio2 $ 30.1 $ 30.6
Other3 $ 3.4 $ 3.4
Total $ 521.8 $ 521.1
Gross Lending Portfolio Includes B/As
22
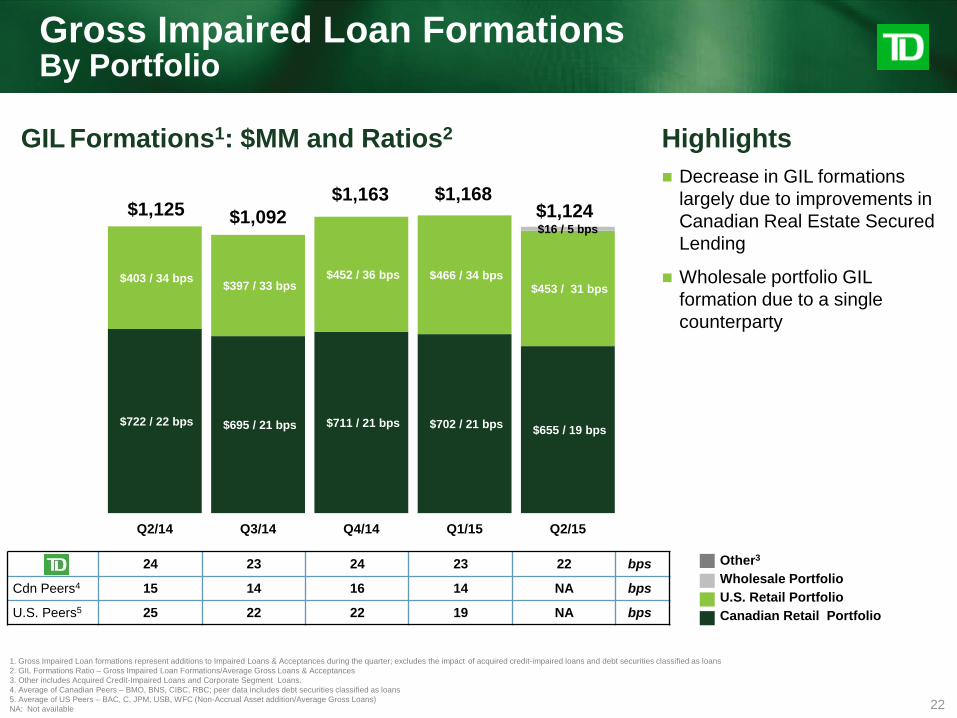
Gross Impaired Loan Formations By Portfolio
GIL Formations1: $MM and Ratios2
1. Gross Impaired Loan formations represent additions to Impaired Loans & Acceptances during the quarter; excludes the impact of acquired credit-impaired loans and debt securities classified as loans
2. GIL Formations Ratio – Gross Impaired Loan Formations/Average Gross Loans & Acceptances
3. Other includes Acquired Credit-Impaired Loans and Corporate Segment Loans.
4. Average of Canadian Peers – BMO, BNS, CIBC, RBC; peer data includes debt securities classified as loans
5. Average of US Peers – BAC, C, JPM, USB, WFC (Non-Accrual Asset addition/Average Gross Loans)
NA: Not available
$722 / 22 bps $695 / 21 bps $711 / 21 bps $702 / 21 bps $655 / 19 bps
$403 / 34 bps $397 / 33 bps
$452 / 36 bps $466 / 34 bps $453 / 31 bps
$16 / 5 bps
Q2/14 Q3/14 Q4/14 Q1/15 Q2/15
Canadian Retail Portfolio
U.S. Retail Portfolio
Wholesale Portfolio
Other3 24 23 24 23 22 bps
Cdn Peers4 15 14 16 14 NA bps
U.S. Peers5 25 22 22 19 NA bps
$1,125 $1,092
$1,163 $1,124
Highlights
Decrease in GIL formations
largely due to improvements in
Canadian Real Estate Secured
Lending
Wholesale portfolio GIL
formation due to a single
counterparty
$1,168
23
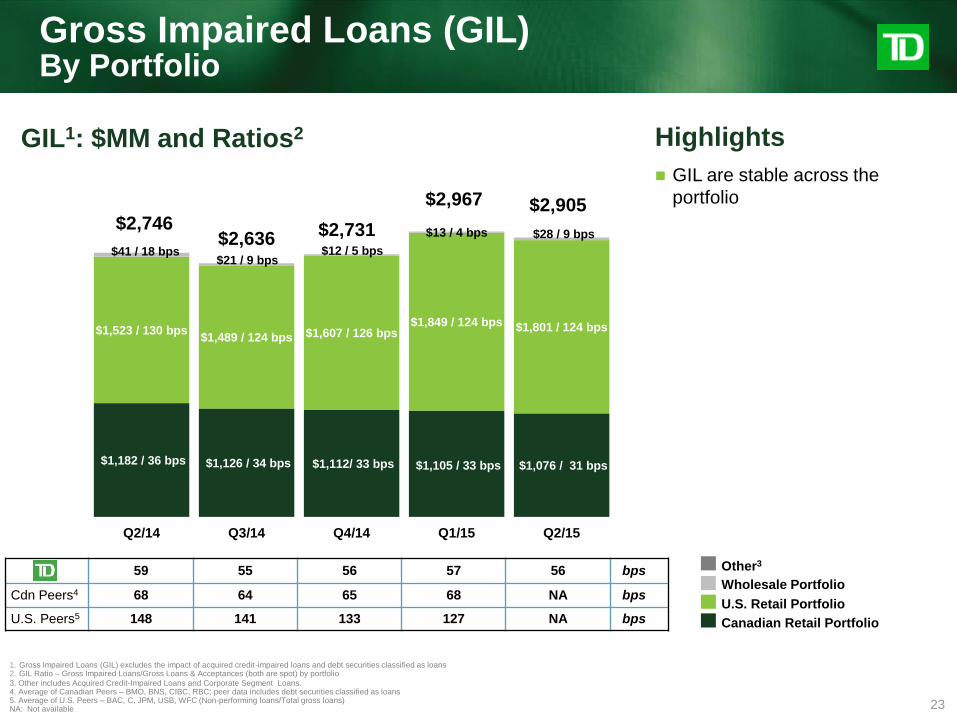
1. Gross Impaired Loans (GIL) excludes the impact of acquired credit-impaired loans and debt securities classified as loans 2. GIL Ratio – Gross Impaired Loans/Gross Loans & Acceptances (both are spot) by portfolio
3. Other includes Acquired Credit-Impaired Loans and Corporate Segment Loans. 4. Average of Canadian Peers – BMO, BNS, CIBC, RBC; peer data includes debt securities classified as loans 5. Average of U.S. Peers – BAC, C, JPM, USB, WFC (Non-performing loans/Total gross loans) NA: Not available
GIL1: $MM and Ratios2
$1,182 / 36 bps $1,126 / 34 bps $1,112/ 33 bps $1,105 / 33 bps $1,076 / 31 bps
$1,523 / 130 bps $1,489 / 124 bps $1,607 / 126 bps
$1,849 / 124 bps $1,801 / 124 bps
$41 / 18 bps $21 / 9 bps
$12 / 5 bps
$13 / 4 bps $28 / 9 bps
Q2/14 Q3/14 Q4/14 Q1/15 Q2/15
59 55 56 57 56 bps
Cdn Peers4 68 64 65 68 NA bps
U.S. Peers5 148 141 133 127 NA bps Canadian Retail Portfolio
U.S. Retail Portfolio
Wholesale Portfolio
Other3
$2,746 $2,636
$2,731
$2,905
Highlights
GIL are stable across the
portfolio
Gross Impaired Loans (GIL) By Portfolio
$2,967

24
$238 / 30 bps $227 / 27 bps $250 / 30 bps
$190 / 22 bps $239 / 29 bps
$174 / 62 bps
$119 / 40 bps
$164 / 53 bps
$183 / 53 bps
$152 / 43 bps
$ (20) / NM $ (20) / NM $(15) / NM $(5)/ NM
$6 / NM $3 / NM
$ 3 / NM
$(2) / NM $(1) NM
Q2/14 Q3/14 Q4/14 Q1/15 Q2/15
PCL1: $MM and Ratios2
1. PCL excludes the impact of acquired credit-impaired loans, debt securities classified as loans and items of note. 2. PCL Ratio – Provision for Credit Losses on a quarterly annualized basis/Average Net Loans & Acceptances
3. Other includes Acquired Credit-Impaired Loans and Corporate Segment Loans. 4. Wholesale PCL excludes premiums on credit default swaps (CDS): Q2/15 $(3)MM / Q1/15 $(3)MM. 5. Average of Canadian Peers – BMO, BNS, CIBC, RBC; peer PCLs exclude increases in incurred but not identified allowance; peer data includes debt securities classified as loans 6. Average of U.S. Peers – BAC, C, JPM, USB, WFC NM: Not meaningful; NA: Not available
1 35 28 33 29 32 bps
Cdn Peers5 28 27 32 28 NA bps
U.S. Peers6 44 47 49 54 NA bps Canadian Retail Portfolio
U.S. Retail Portfolio
Wholesale Portfolio4
Other3
$395
$329
$397 $396
Highlights
PCL remains at low levels
Canadian PCL increase is a
return to typical run rate after the
Q1 debt sale
Provision for Credit Losses (PCL) By Portfolio
$368

5 (66%)
23 (55%)
67 (58%)
32 (66%)
15 (65%) 2 (34%)
20 (45%)
48 (42%)
17 (34%)
7 (35%)
ATLANTICPROVINCES
BRITISHCOLUMBIA
ONTARIO PRAIRIES QUEBEC
Uninsured
Insured
25
Real Estate Secured Lending Portfolio ($B) Geographic and Insured/Uninsured Distribution3
Q2/154 68 54 58 66 65
Q1/154 69 55 59 64 65
$7
$43
$115
$49
$22
Highlights
Credit quality remains strong in
the Canadian Personal portfolio
Canadian Personal Banking
Uninsured Mortgage Loan to Value (%)3
PCL2
($MM)
GIL
($MM)
39 44 0.25% 17 Indirect Auto
Q2/15
Canadian Personal Banking1 Gross Loans
($B)
GIL/ Loans
Residential Mortgages 176 0.25% 437 10
Home Equity Lines of Credit (HELOC) 60 0.40% 242 2
Unsecured Lines of Credit 9 0.47% 44 30
Credit Cards 18 0.92% 162 130
Other Personal 7 0.29% 21 14
Total Canadian Personal Banking $287 0.33% $950 $225
Change vs. Q1/15 $2 (0.02%) $(37) $43
1. Excludes acquired credit impaired loans
2. Individually insignificant PCL excludes any change in Incurred But Not Identified Allowance
3. The territories are included as follows: Yukon is included in British Columbia; Nunavut is included in Ontario; and Northwest Territories is included in the Prairies region.
4. Loan To Value based on Seasonally Adjusted Average Price by Major City (Canadian Real Estate Association) and is the combination of each individual mortgage LTV weighted by the mortgage balance consistent with peer reporting
26
1. Individually Insignificant and Counterparty Specific PCL and Allowance excludes any change in Incurred But Not Identified Allowance
2. Includes Small Business Banking
3. Resources includes: Forestry, Metals and Mining; Pipelines, Oil and Gas
4. Consumer includes: Food, Beverage and Tobacco; Retail Sector
5. Industrial/Manufacturing includes: Industrial Construction and Trade Contractors; Sundry Manufacturing and Wholesale
6. Other includes: Power and Utilities; Telecommunications, Cable and Media; Transportation; Professional and Other Services; Other
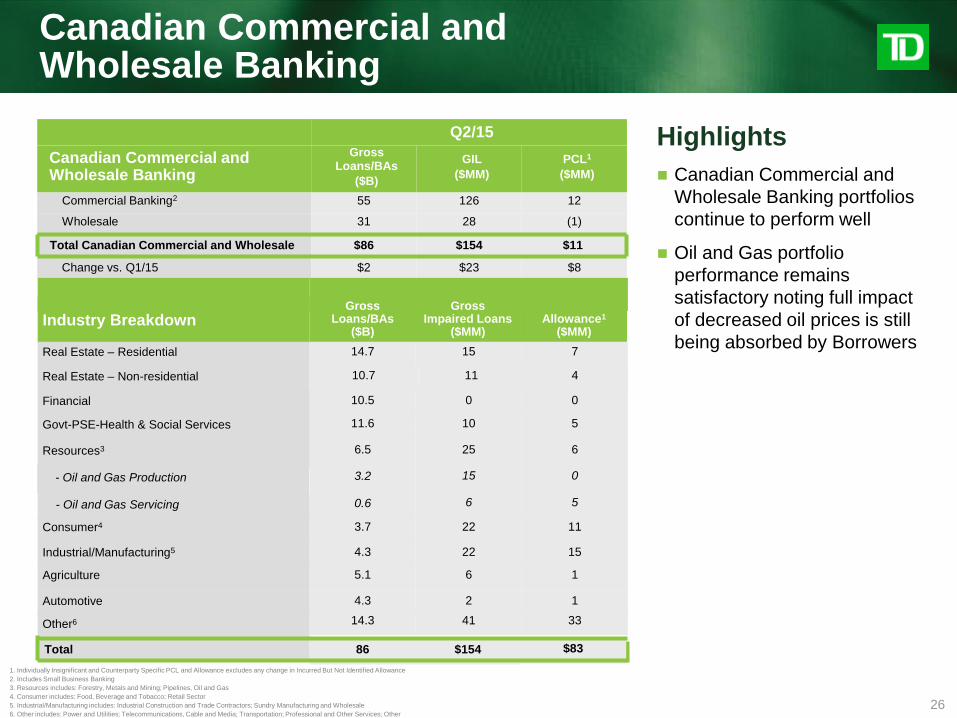
$11
Q2/15
Canadian Commercial and Wholesale Banking
Gross Loans/BAs
($B)
GIL
($MM)
PCL1
($MM)
Commercial Banking2 55 126 12
Wholesale 31 28 (1)
Total Canadian Commercial and Wholesale $86 $154
Change vs. Q1/15 $2 $23 $8
Industry Breakdown Gross
Loans/BAs ($B)
Gross Impaired Loans
($MM) Allowance1
($MM)
Real Estate – Residential 14.7 15 7
Real Estate – Non-residential
10.5 0 0 Financial
11.6 10 5 Govt-PSE-Health & Social Services
6.5 25 6 Resources3
3.2 15 0
Consumer4 3.7 22 11
Industrial/Manufacturing5 4.3 22 15
Agriculture 5.1 6 1
Automotive 4.3 2 1
Other6 14.3 41 33
Total 86 $154 $83
Canadian Commercial and Wholesale Banking
- Oil and Gas Servicing
- Oil and Gas Production
10.7 11 4
0.6 6 5
Highlights
Canadian Commercial and
Wholesale Banking portfolios
continue to perform well
Oil and Gas portfolio
performance remains
satisfactory noting full impact
of decreased oil prices is still
being absorbed by Borrowers

27
U.S. Real Estate Secured Lending Portfolio1
Indexed Loan to Value (LTV) Distribution and Refreshed FICO Scores4
Current Estimated LTV
Residential Mortgages
1st Lien
HELOC
2nd Lien
HELOC Total
>80% 8% 14% 34% 13%
61-80% 45% 32% 38% 42%
<=60% 47% 55% 28% 45%
Current FICO Score >700
87% 88% 83% 86%
Highlights
Continued good asset quality
in U.S. Personal
Increased GIL mainly due to
Troubled Debt Restructurings
(TDRs) for HELOCs and Home
Equity loans
U.S. Personal Banking- U.S. Dollars
Q2/15
U.S. Personal Banking1 Gross Loans
($B)
GIL/ Loans
GIL
($MM)
PCL2
($MM)
Residential Mortgages 21 1.37% 285 12
Home Equity Lines of Credit (HELOC)3 10 3.88% 400 0
Indirect Auto 17 0.67% 118 16
Credit Cards 7 1.47% 101 61
Other Personal 0.5 0.88% 5 12
Total U.S. Personal Banking (USD) $56 1.62% $909 $102
Change vs. Q1/15 (USD) $0 0.07% $39 $(58)
1. Excludes acquired credit-impaired loans
2. Individually insignificant PCL excludes any change in Incurred But Not Identified Allowance
3. HELOC includes Home Equity Lines of Credit and Home Equity Loans
4 Loan To Value based on authorized credit limit and Loan Performance Home Price Index as of February 2015. FICO Scores updated March 2015
Foreign Exchange $12 - $187 $25
Total U.S. Personal Banking (CAD) $68 1.62% $1,096 $127

28
1. Excludes acquired credit-impaired loans and debt securities classified as loans
2. Individually Insignificant and Counterparty Specific PCL and Allowance excludes any change in Incurred But Not Identified Allowance
3. Consumer includes: Food, beverage and tobacco; Retail sector
4. Industrial/Manufacturing includes: Industrial construction and trade contractors; Sundry manufacturing and wholesale
5. Other includes: Agriculture; Power and utilities; Telecommunications, cable and media; Transportation; Resources; Other
Total CRE $17 $230
Commercial Real
Estate Gross
Loans/BAs (US $B)
GIL (US $MM)
Office 4.5 36
Retail 3.9 49
Apartments 3.1 39
Residential for Sale 0.2 21
Industrial 1.2 31
Hotel 0.8 21
Commercial Land 0.1 8
Other 3.1 25
Total C&I $47 $355
Commercial &
Industrial Gross
Loans/BAs (US $B)
GIL (US $MM)
Health & Social Services 6.9 46
Professional &Other Services
5.9 68
Consumer3 4.6 80
Industrial/Mfg4 5.7 73
Government/PSE 6.5 10
Financial 2.2 24
Automotive 2.2 9
Other5 13 45
Highlights
Sustained strong portfolio
quality in U.S. Commercial
Banking
Commercial & Industrial
segment growth spread
broadly across industries and
largely due to government-
guaranteed and near
investment grade or better
corporate exposures
U.S. Commercial Banking - U.S. Dollars
$15
$(11)
15 355 47 Commercial & Industrial (C&I)
Q2/15
U.S. Commercial Banking1 Gross
Loans/BAs
($B)
GIL
($MM)
PCL2
($MM)
Commercial Real Estate (CRE) 17 230 0
Non-residential Real Estate 13 160 4
Residential Real Estate 4 70 (4)
Total U.S. Commercial Banking (USD) $64 $585
Change vs. Q1/15 (USD) $3 $0
$4 Foreign Exchange $13 $120
$19 Total U.S. Commercial Banking (CAD) $77 $705

29
Investor Relations Contacts
Phone: 416-308-9030
or 1-866-486-4826
Email: [email protected]
Website:
www.td.com/investor
Grand Prix for Best Overall Investor Relations: Large Cap
Best Investor Relations by
Sector: Financial Services
Best Investor Relations by a CFO: Large Cap
Best Investor Relations
Officer: Large Cap
Best Financial Reporting
Best Use of Technology
TD Bank Group Quarterly Results Presentation
Q2 2015
Thursday May 28th, 2015


![Announces Q2 results [Result]](https://static.fdocuments.in/doc/165x107/577ca7391a28abea748c4b21/announces-q2-results-result.jpg)


