TCI 2014 Visualisation of Linkages in Networked Clusters: Analysis of the ICT Cluster Ecosystem in...
31
Visualisation of Linkages in Networked Clusters: Analysis of the ICT Cluster Ecosystem in Cork John Hobbs Academic 2: Industrial Trends, Innovation and the Cluster Ecosystems 11 November 2014
-
Upload
tci-network -
Category
Economy & Finance
-
view
127 -
download
0
Transcript of TCI 2014 Visualisation of Linkages in Networked Clusters: Analysis of the ICT Cluster Ecosystem in...

Visualisation of Linkages in Networked Clusters: Analysis of the ICT Cluster Ecosystem in Cork John Hobbs
Academic 2: Industrial Trends, Innovation and the Cluster Ecosystems
11 November 2014

VISUALISATION OF LINKAGES IN NETWORKED CLUSTERS: ANALYSIS OF THE ICT CLUSTER ECOSYSTEM IN CORK
DR JOHN HOBBS & EOIN BYRNE
EUROPEAN PROJECTS RESEARCH UNIT
DEPARTMENT OF MANAGEMENT & ENTERPRISE
CORK INSTITUTE OF TECHNOLOGY, IRELAND.
DATE: 11/11/2014
This research was supported by Be Wiser (www.be-wiser.eu). Be Wiser is a Coordination Project funded by the research DG of the European Commission within the Regions of Knowledge programme of FP7.

Traditional Cluster Analysis
Traditional Porterian cluster analysis focused on the INTERNAL workings and competencies of a cluster and its local boundaries
Informs and Develops Policies Based on Regional Strengths
Economic Analysis: • Location Quotients• Input / Output• Regional Employment• Patents• Case Studies

Visualisation of Linkages in Networked Clusters
V-LINC supplements traditional Porterian cluster analysis by adding an EXTERNAL analysis:
Informs & Supports Local/National Policy Development with an International Perspective
European International
Informed policy development within the
context of regional strengths + dynamics
National
Traditional Porterian Analysis + V-LINC Analysis = Contextual Policy
=

Measuring input and output linkages has provided the backbone to traditional Porterianresearch studies on concentrations of industry.
Derived from Marshall’s (1890); Porter’s (1998) and Leydesdorff (2012) each of which recognisethe role of knowledge, innovation, collaboration, administrative supports and specialised inputs.
What Types of Linkages does V-LINC Measure?

• V-LINC data collected through structured interviews.
• Measure the business value of linkages as perceived by company personnel.
• Using likert scale questions derived from Porter’s (1998) industry cluster theory.
How V-LINC measures the Business Value of Linkages
= 36/40
= 31/40
= 27/40
= 24/40
Perceived Significance Value No.High >30 to 40 2
Medium >20 to 30 2Low >10 to 20 0
Tenuous >1 to 10 0
Employees Provide Expert Views on Firm
Linkages
Head of Research & Development
Confidentiality kept - Perceived Significance Bands

1) IndividualFirm Analysis
2) MultipleFirm Analysis
Triple Helix Cluster
3) ReportingData Visualisation
Tabular Data
4) Policy & StrategyDevelopment
The Overall V-LINC Methodology
Firm Level
Cluster Level
National Level
European Level
Employees Provide Expert Views on Firm
Linkages SMEs MNCs

Why Apply V-LINC to ICT in Cork?• Nationally, ICT is one of 14 sectors
selected by Government to be a driver ofgrowth in the Irish Economy, in the Reportof the Research Prioritisation SteeringGroup (Forfás, 2012).
• ICT also features in Ireland’s RIS3 strategy(Forfás, 2014).
• Key Statistics:– 97,000 employed
– 27,000 in ICT hardware segments and 70,000 insoftware and ICT services (DJEI, 2012)
– Over €70 billion of exports from Ireland perannum (ICT, Ireland 2013).
– 2nd largest exporter of computer and IT servicesin the world (Irish Exporters Association, 2013).
– Indigenous sector alone employs over 30,000people with total sales of over €2 billion perannum (ICT Ireland, 2013).
• ICT is a major industrial sector in Irelandwith a notable specialisation in Cork.

Why Apply V-LINC to ICT in Cork?

Applying V-LINC to Cork ICT
• Area: 7,500 km²• Population: 519,000• ICT Enterprises: 865• ICT employees: > 11,000• Policy : State Government – National• Research: 2 Universities and 49
research Institutes / laboratories,• Location Quotient = 1.5
47 interviews
572 Linkages
10 SMEs
6 Large Firms/MNEs

• Maps linkages between firms constituent in a cluster, with organisations they engage with.
• Reports linkages across 8 categories at 4 levels Local, National, European & International
The Cork ICT Cluster Ecosystem
Local National
European International

Applying V-LINC to Cork ICTDistribution of Linkages by Category and by Firm
Note to Table: The eight linkage categories are: Government agencies (GA); Industry association (IA); Industry peers (IP); Inputs (IN); Output (OU); Research & development (RD) Specialist service linkages (SS) and Training (TN).
Company GA IA IP IN OU RD SS TN Total (n)
DeCare Systems 14.3% 19.0% 0.0% 19.0% 23.8% 14.3% 9.5% 0.0% 21
EMC 5.3% 4.3% 0.0% 26.6% 27.7% 12.8% 10.6% 12.8% 94
ePubDirect 9.1% 22.7% 0.0% 18.2% 36.4% 4.5% 0.0% 9.1% 22
Flextronics 6.7% 6.7% 11.1% 15.6% 24.4% 15.6% 17.8% 2.2% 45
InHand Guides 4.3% 13.0% 8.7% 13.0% 30.4% 8.7% 17.4% 4.3% 23
McAfee 2.0% 8.0% 12.0% 0.0% 26.0% 8.0% 32.0% 12.0% 50
Moog 13.5% 17.3% 11.5% 15.4% 3.8% 1.9% 28.8% 7.7% 52
Newsweaver 5.9% 35.3% 0.0% 11.8% 41.2% 0.0% 5.9% 0.0% 17
QUMAS 3.9% 11.8% 3.9% 9.8% 25.5% 5.9% 29.4% 9.8% 51
Smarttech 9.5% 14.3% 0.0% 19.0% 19.0% 0.0% 28.6% 9.5% 21
SolarWinds 2.4% 4.9% 14.6% 0.0% 19.5% 2.4% 46.3% 9.8% 41
Strencom 2.6% 13.2% 7.9% 23.7% 26.3% 7.9% 5.3% 13.2% 38
Supply.ie 4.8% 14.3% 14.3% 14.3% 38.1% 4.8% 4.8% 4.8% 21
Trend Micro 12.1% 6.1% 30.3% 0.0% 21.2% 3.0% 18.2% 9.1% 33
Voxpro 4.5% 18.2% 0.0% 13.6% 27.3% 0.0% 31.8% 4.5% 22
Zartis 23.8% 9.5% 0.0% 19.0% 33.3% 9.5% 4.8% 0.0% 21
RFG Average 7.0% 11.4% 7.5% 14.2% 24.8% 7.2% 19.8% 8.2% 36
Total (n) 40 65 43 81 142 41 113 47 572
Most Populous
(Rank 1-8)8 4 6 3 1 7 2 5
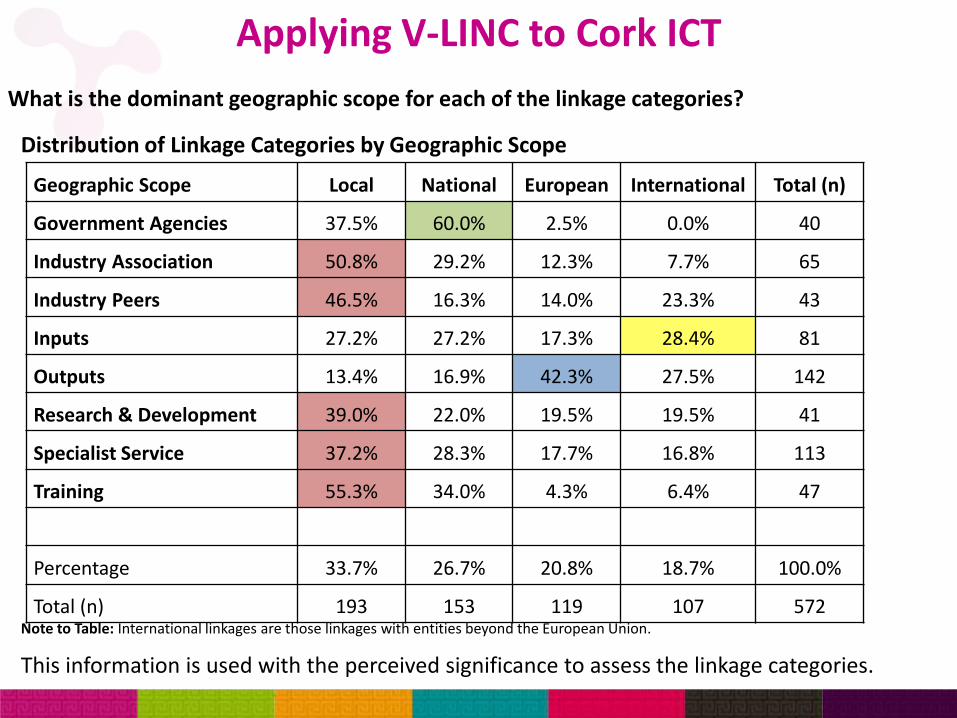
Applying V-LINC to Cork ICT
Distribution of Linkage Categories by Geographic Scope
Note to Table: International linkages are those linkages with entities beyond the European Union.
This information is used with the perceived significance to assess the linkage categories.
What is the dominant geographic scope for each of the linkage categories?
Geographic Scope Local National European International Total (n)
Government Agencies 37.5% 60.0% 2.5% 0.0% 40
Industry Association 50.8% 29.2% 12.3% 7.7% 65
Industry Peers 46.5% 16.3% 14.0% 23.3% 43
Inputs 27.2% 27.2% 17.3% 28.4% 81
Outputs 13.4% 16.9% 42.3% 27.5% 142
Research & Development 39.0% 22.0% 19.5% 19.5% 41
Specialist Service 37.2% 28.3% 17.7% 16.8% 113
Training 55.3% 34.0% 4.3% 6.4% 47
Percentage 33.7% 26.7% 20.8% 18.7% 100.0%
Total (n) 193 153 119 107 572

Is there an ICT Cluster in Cork?
Porter’s Diamond Model of national competitiveness
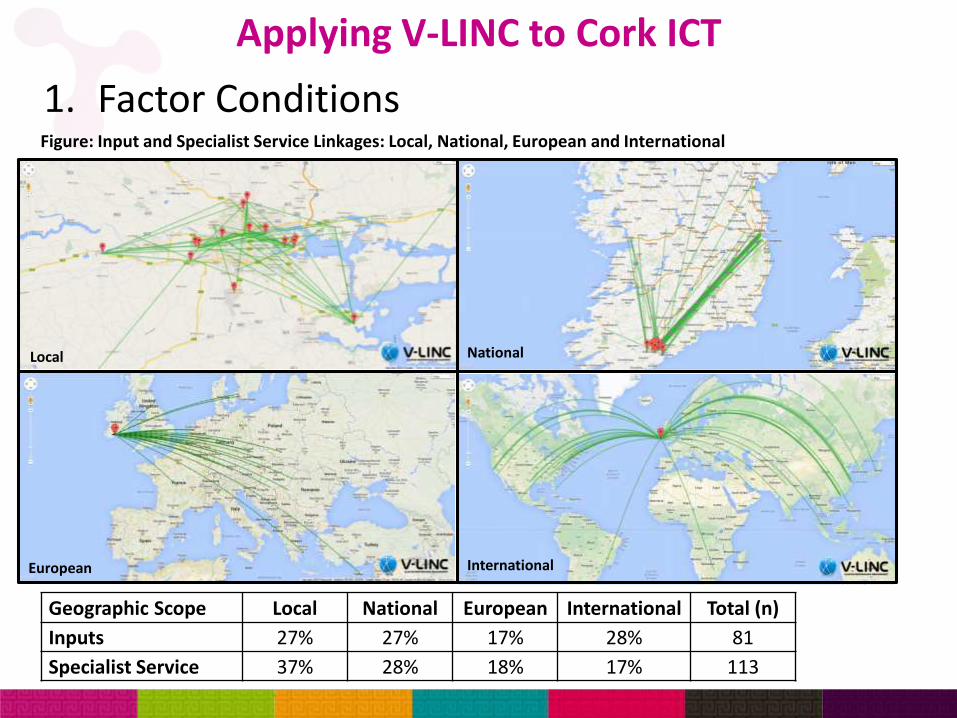
1. Factor ConditionsFigure: Input and Specialist Service Linkages: Local, National, European and International
Geographic Scope Local National European International Total (n)
Inputs 27% 27% 17% 28% 81
Specialist Service 37% 28% 18% 17% 113
Applying V-LINC to Cork ICT
Local
European International
National

2. Demand Conditions
Applying V-LINC to Cork ICT
• 70% of output linkages in this study are external to Ireland • Importance - 92% of European and International linkages in the High and Medium band
Geographic Scope Local National European International Total (n)
Outputs 13% 17% 42% 28% 142
Figure: European and International Output Linkages
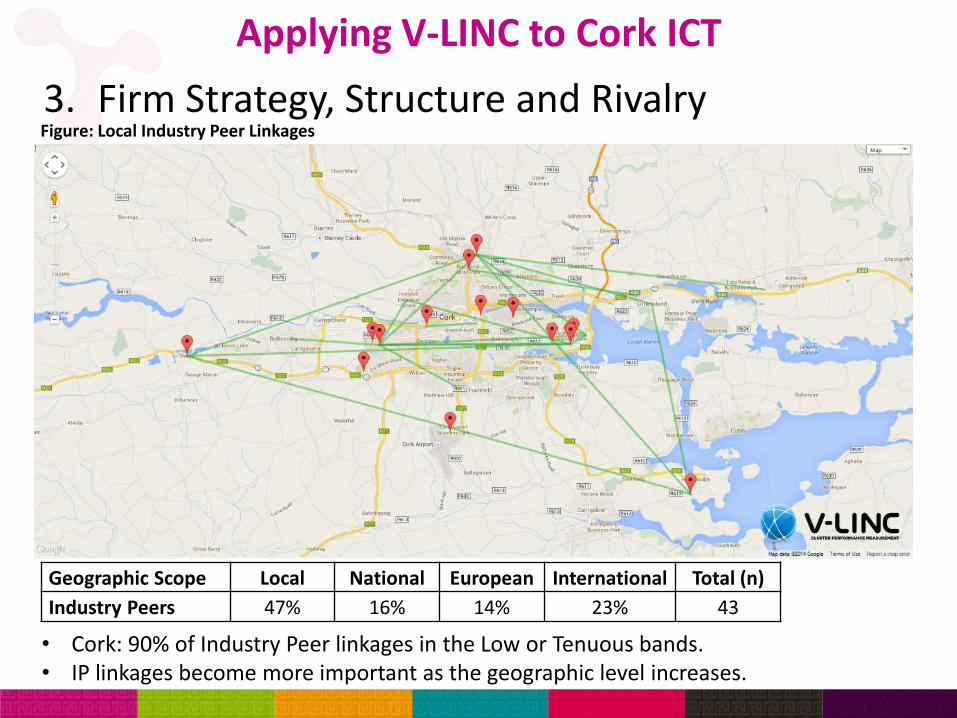
3. Firm Strategy, Structure and Rivalry
Applying V-LINC to Cork ICT
Geographic Scope Local National European International Total (n)
Industry Peers 47% 16% 14% 23% 43
• Cork: 90% of Industry Peer linkages in the Low or Tenuous bands.• IP linkages become more important as the geographic level increases.
Figure: Local Industry Peer Linkages
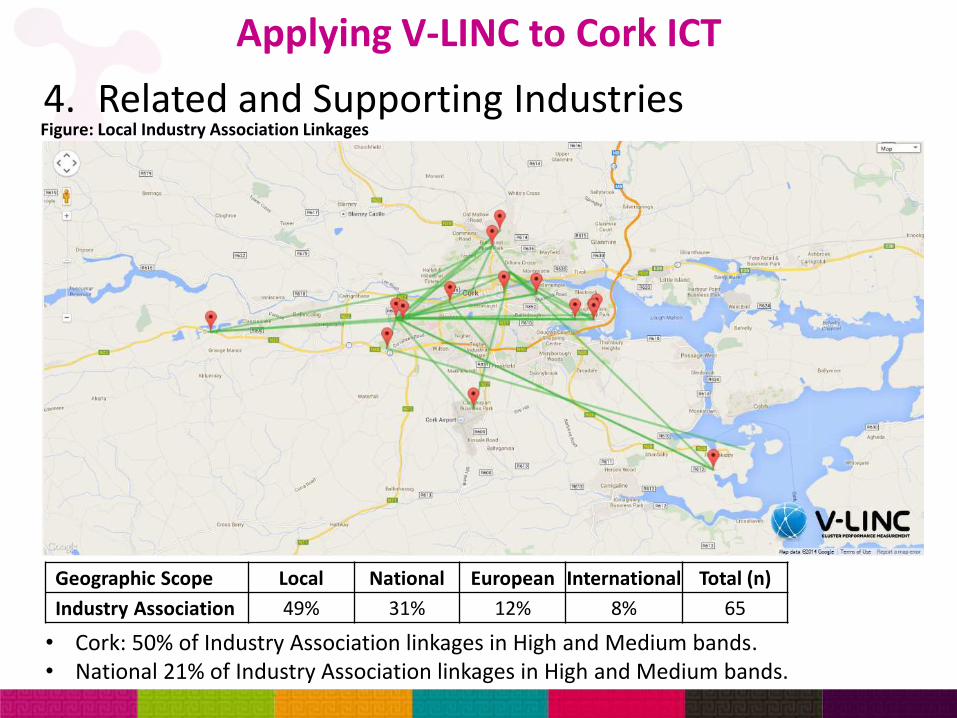
4. Related and Supporting Industries
Applying V-LINC to Cork ICT
Figure: Local Industry Association Linkages
Geographic Scope Local National European International Total (n)
Industry Association 49% 31% 12% 8% 65
• Cork: 50% of Industry Association linkages in High and Medium bands.• National 21% of Industry Association linkages in High and Medium bands.

4. Related and Supporting Industries
Applying V-LINC to Cork ICT
Figure: Local Research & Development Linkages
Geographic Scope Local National European International Total (n)
Research & Development 36% 24% 20% 20% 41
• Cork: 91% of R&D linkages in High and Medium bands.• National: 75% of R&D linkages in High and Medium bands.
Few B2B Research Links in Cork / Ireland

5. Government
Applying V-LINC to Cork ICT
Geographic Scope Local National European International Total (n)
Government Agencies 38% 60% 2% 0% 40
• Cork: 60% of Government Agency Linkages are in the High and Medium bands.• National: 67% of Government Agency Linkages are in the High and Medium bands
Figure: Local Government Agency Linkages

Applying V-LINC to Cork ICT
Perceived Significance by Geographic Scope of Linkages
• Firms are more likely to engage in linkages which are geographically proximate (within thecountry), as these linkages are easier to form and maintain they may not be as important.
• Firms are less likely to engage in linkages at further distances (European and international)unless they are beneficial as they are harder to form and maintain.
The table compares the overall perceived significance of linkages at each geographic scope.
CorkGeographic Scope L N EU INT Total
Perceived Significance
High 30 to 40 16.6% 17.0% 45.4% 49.5% 165Medium 20 to 30 40.9% 39.9% 40.3% 34.6% 225
Low 10 to 20 38.9% 41.2% 13.4% 15.0% 170Tenuous 0 to 10 3.6% 2.0% 0.8% 0.9% 12
Percentage 33.7% 26.7% 20.8% 18.7% 100%Total (n) 193 153 119 107 572

Key Connectors in Cork ICT Sector
Key Connector it@cork EI C. Chamber UCC CIT IDA
High 30 to 40 6% 12% 0% 10% 22% 44%
Medium 20 to 30 44% 65% 44% 40% 44% 44%
Low 10 to 20 44% 24% 50% 50% 22% 11%
Tenuous 0 to 10 6% 0% 6% 0% 11% 0%
Total (n) 18 17 16 10 9 9
Linkage Category15 IA, 3 TN
14 GA, 3 TN
11 IA, 5 TN
5 RD, 4 TN, 1 SS
6 RD, 3 TN
9 GA

Evidence for an ICT Cluster in Cork?
• Not primarily local demand conditions
• 70% EU and INT.
• Cork ICT firms do not compete locally, but compete internationally.
• Compete locally for talent.
• Not a heavy reliance on local input factors:
• IN – 27% local• SS – 37% local
• A connected local industry – 34% of linkages are local. Largest proportion of local linkages are : IA 51%, IP 47%, RD 39%, SS 37%, TN 55%.
• Supportive / facilitative government: 60% local and 67% of national GA linkages are in top two significance bands.

Policy Recommendations (1)
Develop a cluster organisation responsible for the ICT sector in the South West Region.
Provide financial supports at a national level to develop a cluster organisation in the region to facilitate cluster initiatives and increased collaborative linkages.
ICN (2014) suggest that a clusterorganisation can have a significantinfluence on strengthening collaborationwithin the cluster and facilitating e.g.information exchange, training andseminars, joint corporation projects,marketing and public relations, as wellas internationalisation.
Cluster programmes are an integral partof an effective innovation policy atregional & national level, clusterorganisations are essential for theexecution of cluster policies.
Figure: Local Industry Association Linkages , Cork ICT

Policy Recommendations (2)Support the development of degree, conversion and training degree courses to include a focus on ICT, wireless and internet security.
Adapt third level degree courses / curricula according to the needs of industry with regards to Internet and wireless security content
Figure: Local Training Linkages , Cork ICT
• Majority of training linkages occurwithin the country, 55% locally and34% nationally.
• 51% of linkages occur in the Lowand Tenuous bands.
• >30% of local Training linkages withUniversity College Cork and CorkInstitute of Technology.
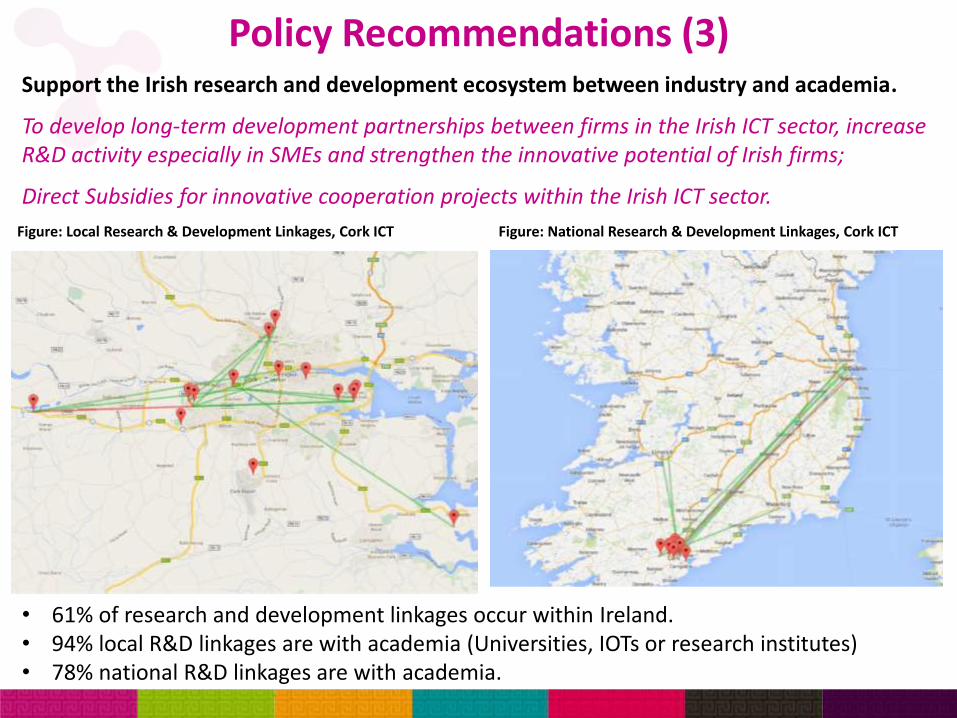
Policy Recommendations (3)Support the Irish research and development ecosystem between industry and academia.
To develop long-term development partnerships between firms in the Irish ICT sector, increase R&D activity especially in SMEs and strengthen the innovative potential of Irish firms;
Direct Subsidies for innovative cooperation projects within the Irish ICT sector.
Figure: Local Research & Development Linkages, Cork ICT Figure: National Research & Development Linkages, Cork ICT
• 61% of research and development linkages occur within Ireland.• 94% local R&D linkages are with academia (Universities, IOTs or research institutes)• 78% national R&D linkages are with academia.

Policy Recommendations (3)Support the Irish research and development ecosystem between industry and academia.
Direct Subsidies for innovative cooperation projects within the Irish ICT sector.
Co-operation Projects - The region of Upper Austria: • Innovative strategic programmes (‘Upper Austria 2000 +’, ‘Innovative
Upper Austria 2010’ and ‘Innovative Upper Austria 2010plus’).• A minimum of three companies should participate in the project and at
least one of them should be a SME.• Managed by Clusterland: >400 cooperation projects, involving 1,737
participating partners with €22.15 million in funding from thegovernment (Clusterland, 2014).
Output:• SMEs achieve sustainable differentiation through
innovation.• 77% continue to co-operate after project completion.• Experience to apply for National and EU projects.• Over come barriers; limited funding , lack of
management, resources and technologicalcompetencies.

Other Sectoral Applications of V-LINCThe V-LINC software is being used to analyse 5 local clusters in the Cork region.
Further engagement with 7 clusters across Europe through FP7 projects.
• Biopharma• It@cork – European Tech Cluster• IMERC - Maritime• Kinsale - Tourism • WCDP – Agri-Food.
• Be Wiser Project - Paris, Karlsruhe, Barcelona,Cyprus, Slovenia, Northern Ireland and SouthWest Region. www.be-wiser.eu
• REMCAP – MSE, Southampton; IMERC, Cork.www.remcap.eu
Local Cluster Analysis: International Cluster Analysis:

Potential Future Work DirectionsFuture developments of V-LINC could support work in the following areas:
• Dr Bernie Fingleton (University of Cambridge)• Dr Justin Doran (UCC)
Network AnalysisSmart Specialisation
Longitudinal Analysis: Global Value Chain Analysis:
• Dominique Foray (École Polytechnique de Lausanne)• Declan Hughes (Dept. Jobs, Enterprise and Innovation)
• Measure and analyse cluster ecosystem changes.• Impact of specific policies on linkage development.
• Dr Tim Sturgeon (MIT) & Dr Andrew Reamer (GWU)• Louis Brennan (Dublin University)
2014 2016

• DETE (2008), Knowledge and enterprise clusters in Ireland, Technical report, Department of Enterprise Trade and Employment: Available online @ http://www.entemp.ie.
• DES (2014), ‘ICT Skills Action Plan’, Department of Education and Skills, Available online @ http://www.hea.ie• DES (2011), ‘ICT Action Plan: Meeting the high-level skills needs of enterprise in Ireland’, Department of Education and
Skills, Available online @ http://www.education.ie• DJEI (2014), ‘Policy Statement on Foreign Direct Investment in Ireland,’ published by Department of Jobs, Enterprise
and Innovation, 30th July Available online @ http://www.enterprise.gov.ie• DJEI (2012), Action Plan for Jobs 2012, Department of Jobs, Enterprise and Innovation, Available Online @
http://www.djei.ie• EC (2002), ‘Final report of the expert group on enterprise clusters and networks’, Technical report, European
Commission: Enterprise Directorate General, Brussels.• EGFSN (2013), ‘Addressing Future Demand for High-Level ICT Skills’, Expert Group on Future Skills Needs, Available
online @ www.egfsn.ie• Forfás (2014), Ireland’s RIS3 strategy, presented at National Peer Review Workshop Smart Specialisation: Moving
Forward and Looking Outward, Dublin, 3-4 July 2014.• Forfás (2012), Report of the Research Prioritisation Steering Group, Available online @ http://www.forfas.ie. • Hobbs, J. (2010), A Framework for the Analysis of Spatial Specialisations of Industry, PhD thesis, Cork Institute of
Technology, Cork.• ICN (2014), ‘Why Clusters,’ International Cleantech Network, Accessed on 10th August, Available online @
http://internationalcleantechnetwork.com. • ICT Ireland (2013), ‘The Global Technology Hub’, Accessed on 17th August, Available online
@ http://www.ictireland.ie/• Irish Exporters Association (2013), ‘Top 250 Exporters in Ireland and Northern Ireland 2013’, Accessed on 17th
August, Available online @ http://www.irishexporters.ie• OECD (2002), Measuring the Information Economy, Paris: OECD.
Bibliography

Dr John Hobbs,
European Projects Research Unit, Department of Management and Enterprise,Cork Institute of Technology. Rossa Avenue, Bishopstown, Cork.Mobile: 00353 86 8091294 Office: 00353 21 4335149Email: [email protected] Skype: jhobbs.cit
Mr Eoin Byrne,
European Projects Research Unit, Department of Management and Enterprise,Cork Institute of Technology. Rossa Avenue, Bishopstown, Cork.Mobile: 00353 86 0719451 Office: 00353 21 4335056Email: [email protected] Skype: eoin.byrne881
This research was supported by Be Wiser (www.be-wiser.eu). Be Wiser is a Coordination Project funded by the research DG of the European Commission within the Regions of Knowledge programme of FP7.