TCEQ Regulatory Guidance · TCEQ Regulatory Guidance Remediation Division RG-366/TRRP-13 December...
44
TCEQ Regulatory Guidance Remediation Division RG-366/TRRP-13 December 2002 Texas Commission on Environmental Quality • PO Box 13087 • Austin, Texas • 78711-3087 The TCEQ is an equal opportunity/affirmative action employer. The agency does not allow discrimination on the basis of race, color, religion, national origin, sex, disability, age, sexual orientation or veteran status. In compliance with the Americans with Disabilities Act, this document may be requested in alternate formats by contacting the TCEQ at 512/239-0028, Fax 239-4488, or 1-800-RELAY-TX (TDD), or by writing PO Box 13087, Austin, Texas 78711-3087. Authorization for use or reproduction of any original material contained in this publication, i.e., not obtained from other sources, is freely granted. The Commission would appreciate acknowledgment. RG-366/TRRP-13 December 2002 1 SUBJECT: REVIEW AND REPORTING OF COC CONCENTRATION DATA Objectives: This document provides the procedures for review and reporting of chemical of concern (COC) concentration data by the person under the Texas Risk Reduction Program (TRRP) rule as it relates to: • documentation of the quality of COC concentration data used to demonstrate compliance with the TRRP rule; • data to include in rule-required reports; • technical review of the data performed by the laboratory; • usability review of data performed by the person; and • contents of the Data Usability Summary. Audience: Regulated Community, Environmental Professionals, and Environmental Laboratories References: The regulatory citation for TRRP rule data acquisition and reporting requirements is included in 30 Texas Administrative Code (TAC) §350.54. The TRRP Rule and Preamble are on-line at http://www.tnrcc.state.tx.us/oprd/rules/indxpdf5.html . The TRRP Rule, together with conforming changes to related rules, is contained in 30 TAC Chapter 350, and was published in the September 17, 1999, Texas Register (24 TexReg 7413-7944). The Tier 1 PCL Tables, toxicity factors and other TRRP information can be downloaded at http://www.tnrcc.state.tx.us/permitting/trrp.htm . Contact: Technical Support Team, Toxicology and Risk Assessment Section at 512/239-0310; Corrective Action Section 512/239-2343; Site Assessment & Management Section 512/239-2509; Superfund Cleanup Section 512/239-2425; Voluntary Cleanup Program Section 512/239-5891 For mailing addresses, see TCEQ’s web page at http://www.tceq.state.tx.us/ . Key issues in this guidance associated with the TRRP rule • Guidance Implementation Date – This guidance is applicable to TRRP data generated on or after February 1, 2003. • Dry Weight Reporting – Unless otherwise specified by the project objectives, soil and sediment results generated on or after February 1, 2003, must be reported on a dry weight basis. • Definitions of terms used in the guidance are defined in the TRRP rule, the text of this guidance document, or in readily available national guidance.
Transcript of TCEQ Regulatory Guidance · TCEQ Regulatory Guidance Remediation Division RG-366/TRRP-13 December...

TCEQ Regulatory Guidance Remediation Division
RG-366/TRRP-13 December 2002
Texas Commission on Environmental Quality • PO Box 13087 • Austin, Texas • 78711-3087 The TCEQ is an equal opportunity/affirmative action employer. The agency does not allow discrimination on the basis of race, color, religion, national origin, sex, disability, age, sexual orientation or veteran status. In compliance with the Americans with Disabilities Act, this document may be requested in alternate formats by contacting the TCEQ at 512/239-0028, Fax 239-4488, or 1-800-RELAY-TX (TDD), or by writing PO Box 13087, Austin, Texas 78711-3087. Authorization for use or reproduction of any original material contained in this publication, i.e., not obtained from other sources, is freely granted. The Commission would appreciate acknowledgment. RG-366/TRRP-13 December 2002 1
SUBJECT: REVIEW AND REPORTING OF COC CONCENTRATION DATA
Objectives: This document provides the procedures for review and reporting of chemical of concern (COC) concentration data by the person under the Texas Risk Reduction Program (TRRP) rule as it relates to: • documentation of the quality of COC concentration data used to demonstrate
compliance with the TRRP rule; • data to include in rule-required reports; • technical review of the data performed by the laboratory; • usability review of data performed by the person; and • contents of the Data Usability Summary.
Audience: Regulated Community, Environmental Professionals, and Environmental Laboratories
References: The regulatory citation for TRRP rule data acquisition and reporting requirements is included in 30 Texas Administrative Code (TAC) §350.54.
The TRRP Rule and Preamble are on-line at http://www.tnrcc.state.tx.us/oprd/rules/indxpdf5.html.
The TRRP Rule, together with conforming changes to related rules, is contained in 30 TAC Chapter 350, and was published in the September 17, 1999, Texas Register (24 TexReg 7413-7944). The Tier 1 PCL Tables, toxicity factors and other TRRP information can be downloaded at http://www.tnrcc.state.tx.us/permitting/trrp.htm.
Contact: Technical Support Team, Toxicology and Risk Assessment Section at 512/239-0310; Corrective Action Section 512/239-2343; Site Assessment & Management Section 512/239-2509; Superfund Cleanup Section 512/239-2425; Voluntary Cleanup Program Section 512/239-5891 FFoorr mailing addresses, see TCEQ’s web page at http://www.tceq.state.tx.us/.
Key issues in this guidance associated with the TRRP rule
• Guidance Implementation Date – This guidance is applicable to TRRP data generated on or after February 1, 2003.
• Dry Weight Reporting – Unless otherwise specified by the project objectives, soil and sediment results generated on or after February 1, 2003, must be reported on a dry weight basis.
• Definitions of terms used in the guidance are defined in the TRRP rule, the text of this guidance document, or in readily available national guidance.
RG-366/TRRP-13 December 2002 2
Key issues in this guidance associated with the TRRP rule
•
Key changes to data reporting include 1) the requirement to spike the laboratory control sample with all of the COCs, except as noted; 2) submitting a laboratory review checklist with every data package; 3) reporting detected and non-detected results based on the laboratory’s documented analytical limits; and 4) preparing a data usability summary for TRRP-required reports.
1.0 Introduction This document is intended to provide guidance to the person responding to the rule (the person) for reporting and reviewing project COC concentration data being used to demonstrate compliance with the Texas Risk Reduction Program (TRRP) rule in accordance with 30 TAC 350. This guidance is applicable to TRRP project data generated on or after February 1, 2003. Therefore, the specifications in this guidance are not retroactive. However, the data quality must be adequate to meet the project objectives based on the data's own merit regardless of the implementation date of TRRP-13. Project data being used to demonstrate compliance with the TRRP rule must be of known and documented quality. As specified in §350.54(a), the person is responsible for the quality of the data even though contractors may be used to handle various phases of the project, such as sample collection, sample analysis, and data review. Samples used to demonstrate compliance are considered critical samples. Critical samples include:
i) samples used under §350.71(k) to determine if a protective concentration level (PCL) needs to be established for a COC;
ii) samples used to define the lateral and/or vertical extent of affected environmental media; iii) samples used to demonstrate response action completion; iv) samples used to demonstrate no further action is required; and v) samples used to determine if notification is required under §350.55.
Critical samples may be a subset of samples from the sample population that are key to supporting a specific decision. For example, even though 50 samples may have been collected, only 20 might be critical to compliance. This guidance describes the procedures for reviewing and reporting data. Alternate approaches for reviewing the data may be acceptable. However, other presentations will be evaluated by comparison with this guidance. This guidance recognizes that different levels of quality control, documentation, and/or data review may be appropriate to meet the program and project objectives. However, provisions of this document will be considered the default when objectives are not established prior to sample collection. The TCEQ document, Assessment Planning (RG-336/TRRP-6), provides guidance on developing appropriate project objectives for the TCEQ program area under which the data are to be used. Refer to that guidance document for developing the objectives for each phase of the project to ensure the data meet the requirements of §350.54(b) of the TRRP rule. The EPA's Guidance for the Data Quality Objective Process for Hazardous Waste Sites (EPA QA/G-4HW) also contains helpful tips for identifying the project data needs when developing the project objectives. This guidance outlines the steps for reviewing and reporting the data. Unless requested by the TCEQ, the person is responsible for determining if a more extensive review of the data is warranted to meet potential legal demands on the data. The TRRP-required reports must include:
• The laboratory data package(s), as described in Section 2 of this guidance (§350.54(b), (d) & (e)), and
• The Data Usability Summary (DUS) as described in Section 3 of this guidance (§350.54(f)).

RG-366/TRRP-13 December 2002 3
The steps of data review are bulleted below. Table 1 outlines the TCEQ’s expectations and references the pertinent corresponding tools and sections within this guidance that may be helpful.
• Step 1: A laboratory data review is conducted by the laboratory generating the data to ensure the technical defensibility of the data and to ensure method and laboratory requirements were met. This review is documented in the Laboratory Review Checklist(s) (LRCs) and associated Exception Reports (ERs) that accompany the reportable data. An example format for an LRC with an ER page is in Appendix A.
• Step 2: A data usability review is conducted by the person or, on the person’s behalf, by a data usability reviewer to ensure that the data are usable for regulatory compliance decisions. The results of this review are documented in the Data Usability Summary (DUS). An example DUS is included as Appendix B.
• Step 3: A regulatory review is conducted by the TCEQ to ensure that the requirements under the TRRP rule have been met.
Table 1. Responsibility Matrix Who Purpose Documentation Tool Reference
Laboratory
Review of laboratory data to ensure method and laboratory requirements are met and reporting performed as required
Laboratory Review Checklist Associated Exception Report(s) Required reportable data
(Example LRC format in Appendix A)
Section 2.0
Person
Data usability review to ensure that data are usable for intended purpose specified in project objectives
Data Usability Summary
(Example in Appendix B and helpful tools in Appendix 1)
Section 3.0
TCEQ
Verification that report is complete and data quality is documented and usability justified.
Not Applicable _ NA
The review performed on the COC concentration data at every level should be documented by: • the laboratory field personnel generating field analytical data to be used in compliance decisions, and • the data usability reviewer. This guidance provides documentation procedures to capture the results of review effort of each party thereby ensuring that critical elements of the review process are not overlooked. This guidance also sets in place a system that can be audited or inspected. Figure 1 illustrates an overview of this process.
1.1 Acronyms CCB – continuing calibration blank C-O-C - chain of custody COC - chemical of concern DCS – detectability check sample DL – detection limit DQO – data quality objective DUS – data usability summary ER – exception report

RG-366/TRRP-13 December 2002 4
GC/MS – gas chromatography/mass spectrometry ISO/IEC – International Organization for Standardization/International Electrotechnical Commission LCS – laboratory control sample LCSD – laboratory control sample duplicate LORP – level of required performance LRC – laboratory review checklist MB – method blank MDL – method detection limit MQL – method quantitation limit MS – matrix spike MSA – method of standard addition MSD – matrix spike duplicate NELAC – National Environmental Laboratory Accreditation Conference NIST – National Institute of Standards and Technology NR – not reviewed PBMS – performance-based measurement system PCL – protective concentration level QA – quality assurance QAP – quality assurance plan QC – quality control R# - reportable data item number %R – percent recovery RPD – relative percent difference RSD – relative standard deviation S# - supporting data item number SOP – standard operating procedure SQL – sample quantitation limit TIC - tentatively identified compound TCEQ – Texas Commission on Environmental Quality TRRP – Texas Risk Reduction Program UQL - upper quantitation limit Note on terminology: This guidance document refers to the process of adding known quantities of certain analytes, surrogates, or internal standards as "spiking." However, some published methods or laboratory standard operating procedures (SOPs) refer to this process as "fortification." For the purpose of this guidance, the terms “spiking” and “fortification” are considered equivalent.
1.2 Related Information Sources Below are other sources of information that may be helpful. It is recommended the most current version be used. EPA Guidance for Quality Assurance Project Plans, EPA QA/G-5, EPA/600/R-98/018, February 1998 (or
most current version) (http://www.epa.gov/quality/qa_docs.html) Guidance for the Data Quality Objectives Process for Hazardous Waste Sites, EPA QA/G-4HW,
EPA/600/R-00/007, January 2000 (or most current version) (http://www.epa.gov/quality/qa_docs.html)
International Organization for Standardization/International Electrotechnical Commission 17025 (http://www.iso.ch/)
RG-366/TRRP-13 December 2002 5
National Environmental Laboratory Accreditation Conference (most current standards) (http://www.epa.gov/ttn/nelac/)
USEPA Contract Laboratory Program National Functional Guidelines for Inorganic Data Review, EPA 540/R-94/013, February 1994 (or most current version) (http://www.epa.gov/superfund/programs/clp/guidance.htm)
USEPA Contract Laboratory Program National Functional Guidelines for Organic Data Review, EPA 540/R-99/008, October1999 (or most current version) (http://www.epa.gov/superfund/programs/clp/guidance.htm)

RG-366/TRRP-13 December 2002 6
Laboratory input
TCEQ assistance in defining project objectives
DEFINING PROJECT OBJECTIVES
(see Assessment Planning RG - 366/TRRP-6)
Field Sample Collection
Laboratory analysis of sample
REVIEW OF DATA BY LABORATORY Review reportable data and supporting data Prepare LRC and data package
LABORATORY REPORTING • Laboratory Review Checklist • Exception Reports • Reportable data
REVIEW OF DATA BY THE PERSON • Review the reportable data and the supporting QC review results on the LRC
• Assess whether project objectives met • Prepare the Data Usability Summary
Are decisions valid and supported by the
data?
INCLUDE IN REQUIRED TRRP REPORTS • Project data • Laboratory data
Reportable data LRC and Exception Reports
• Data Usability Summary
LABORATORY REVIEW AND REPORTING
REVIEW BY THE PERSON
USING THE DATA
REPORTING BY THE PERSON
No
Yes
Figure 1. Review and report process for COC concentration data.

RG-366/TRRP-13 December 2002 7
2.0 Laboratory Data Review The laboratory must review the data it has generated. This section discusses procedures laboratories should use to document the data have been sufficiently reviewed.
2.1 The Laboratory Data Package Each laboratory data package submitted by the person must contain a Laboratory Review Checklist (LRC), any associated Exception Reports (ERs), and the reportable data. The LRC is described below in Section 2.1.1, the ER is described in Section 2.1.2, and the reportable data are described in Section 2.1.3 below. An example format for the LRC and associated ERs is in Appendix A.
2.1.1 Laboratory Review Checklists The LRCs are completed by the laboratory performing the analyses and are used to document the level of the laboratory’s review (as discussed in Section 2.3) and the results of that review. The laboratory may complete LRCs in any format provided the laboratory substantively addresses the questions in the example LRC presented in Appendix A of this guidance. The intent of the example LRC is not to add additional requirements beyond the requirements and recommended procedures in the analytical methods used and in the laboratory’s QAP. However, the laboratory must ensure the quality control steps are taken in the laboratory to demonstrate the laboratory's procedures and practices are generally consistent with the NELAC standards and/or the ISO/IEC standards (§350.54(d)), and include routine internal laboratory audits, documented SOPs, and participation in proficiency tests or performance evaluation studies. The format of the LRC must allow a reviewer to quickly discern where method or laboratory quality control (QC) limits are not met and what samples were affected. If the format used by the laboratory does not lend itself to rapid review by the TCEQ, the person will be contacted for clarification. The laboratory can elect to complete the LRC(s) on a batch basis, project basis, or laboratory-defined basis provided each LRC clearly and unambiguously lists the project samples associated with that LRC. Each LRC must be complete and must provide a data usability reviewer with enough information to be able to independently assess 1) the magnitude of any potential inaccuracy or imprecision, if possible; 2) the direction of potential bias; and 3) other potential effects on the quality of the reported data. Usability qualifiers as defined in Section 3 should be applied by the data usability reviewer. In order to document the quality of the data to satisfy §350.54(b), include a signed release statement in each LRC, and when applicable, a statement declaring the laboratory is an in-house laboratory. The release statement must include the printed name, official title and signature of the laboratory representative signing the statement, and the date of the signature. The representative signing the release statement must be the laboratory manager or an appropriate designee except when an in-house laboratory is used, that is, except when a laboratory controlled by the person responding to the TRRP rule is used. When the laboratory is an in-house laboratory controlled by the person responding to the TRRP rule and the laboratory data package will be submitted to the TCEQ within a TRRP-required report (for example, within an APAR), the person has two options:
1. the in-house laboratory manager or an appropriate designee can sign the release statement, or 2. the official signing the cover page of the TRRP-required report (in which the laboratory data are
used) is responsible for the release of the data from the laboratory and, by signature on the cover page of the TRRP-required report, is affirming the release statement is true. If the data package is submitted in response to TRRP, but is not submitted to TCEQ within a TRRP-required report, the LRC release statement must be signed by the laboratory manager or appropriate designee.

RG-366/TRRP-13 December 2002 8
The release statement, and if applicable the in-house laboratory statement, must read: Release Statement:
I am responsible for the release of this laboratory data package. This data package has been reviewed by the laboratory and is complete and technically compliant with the requirements of the methods used, except where noted by the laboratory in the attached exception reports. I affirm to the best of my knowledge, all problems/anomalies, observed by the laboratory as having the potential to affect the quality of the data, have been identified by the laboratory in the Laboratory Review Checklist, and no information or data have been knowingly withheld that would affect the quality of the data.
Check, if applicable: [ ] This laboratory is an in-house laboratory controlled by the person
responding to rule. The official signing the cover page of the rule-required report (for example, the APAR) in which these data are used is responsible for releasing this data package and is by that signature affirming the above release statement is true.
2.1.2 Exception Reports ERs must be prepared by the laboratory to identify and document any problems or anomalies observed during the receipt, handling, preparation, and/or analysis of a sample. An ER for each “No” or “NR” (that is, "not reviewed") entry on the LRC must be attached to the LRC included in the data package. Each ER should be clearly and unambiguously tied to specific samples. The ERs must briefly, but concisely, identify and describe all deviations from the:
• analytical method, • the laboratory Quality Assurance Plan (QAP), and/or • the laboratory Standard Operating Procedures (SOPs), if applicable.
To expedite the data review process, the ERs must identify instances of QC failures, the QC parameter(s) involved, and the samples affected by the problem(s)/anomalies.
2.1.3 Reportable Data The data package must contain, at a minimum, the reportable data listed on the laboratory data package cover page of the example LRC in Appendix A of this guidance. Descriptions of the reportable data to include in the data package are outlined below. The “(R#)” notations are provided to match those used in the example LRC. (R1) Completed Chain-of-Custody Documentation Field chain-of-custody (C-O-C) forms are used to document custody of the samples during collection and transportation. Separate C-O-C forms may also be used by the laboratory to document the movement and analysis of samples within the laboratory. Completed field C-O-C forms and documentation submitted in the data package must include the following:
• Field sample identification, • Date and time of sample collection, • Method of preservation, • Analytical methods requested and/or analytes requested,

RG-366/TRRP-13 December 2002 9
• Signatures of all personnel having custody of the samples prior to delivery to the laboratory, • Signature of laboratory personnel taking custody samples, and • Date and time of custody transfers.
The laboratory must have in place a documented sample acceptance policy and documented sample handling and sample receipt protocols generally consistent with NELAC 5.11 or ISO/IEC 17025 Section 5.8. The laboratory must document in the LRC and associated ERs when samples are received outside of the standard conditions described in the laboratory’s sample acceptance policy, including when samples are received in inappropriate sampling containers, when the samples are not properly preserved, that is, thermally or chemically as required for the sample, or when custody transfers are not properly documented. (R2) Sample Identification Cross-Reference Sample identification cross-reference information correlates field and laboratory sample designations to facilitate the association of field samples with a particular laboratory batch. The data package must include a listing of C-O-C field identifications cross-referenced to the associated laboratory sample identification numbers. If not already included on individual test reports, provide an easy and unambiguous means of associating a specific QC sample (for example, a laboratory control sample) with specific field samples in the data package. (R3) Test Reports for Samples Sample test reports, that is, analytical data sheets, provide specific information for each sample regarding analytical results and methods. Include the test reports for all reported data in the data package. Include items consistent with NELAC Section 5.13 or ISO/IEC 17025 Section 5.10 in each test report, and also include the identification of the instrument used and preparation, cleanup, and test method(s) used. The test reports must include the information needed to interpret the test results and the information required by the method used. Adjust analytical results, that is both detected results and non-detected results, for sample characteristics, laboratory preparations/cleanups, and/or laboratory adjustments, such as percent moisture, gel cleanup procedure used, or dilution, respectively. Unless otherwise specified by the project objectives, all analytical results reported for soil and sediment samples collected on or after February 1, 2003, must be reported on a dry weight basis with the percent solids (or percent moisture) also reported on the test reports to allow back calculation of the result to a wet weight basis. Soil and sediment data generated prior to February 1, 2003, will be accepted as generated with respect to the dry weight issue. As outlined in Table 2 below, measured or estimated concentrations that exceed the method detection limit (MDL), and that meet the qualitative identification criteria of the method used, must be reported as detected results by the laboratory for the COC in the sample analyzed. As defined in §350.4(a)(53), the MDL is “the minimum concentration of a COC the laboratory would measure and report with 99% confidence that the analyte concentration is greater than zero and is determined for each COC in a reagent matrix.” The MDL can be determined using the procedures specified in 40 CFR Part 136, Appendix B (as amended), using reagent matrices, that is both laboratory grade aqueous and solid materials. Other methods for determining the MDL are acceptable, provided the MDL as defined in the rule is met. The rationale used by the laboratory to calculate or approximate the MDL must be technically sound and documented. The documentation for the MDL determination must be available for inspection by the person and/or TCEQ. As required by §350.54(e)(4), the laboratory must routinely check the MDL for reasonableness to verify the laboratory's ability to reliably detect the COC at the MDL used for reporting detected results and for calculating non-detected results. For those COCs with levels of required performance (LORPs) at or
RG-366/TRRP-13 December 2002 10
below the method quantitation limit (MQL) of the appropriate method, this check can be demonstrated by analyzing a detectability check sample (DCS). A DCS is a reagent matrix spiked by the laboratory with the COC near, or within two to three times, the calculated MDL and carried through the sample preparation procedures for the analysis. A DCS analyzed after instrument maintenance can also serve as this check. To meet the specifications under §350.54(e)(4), the DCS must be analyzed on a quarterly basis during the period of time TRRP samples are being analyzed. The laboratory might consider analyzing the DCS on a monthly basis if other programs outside the TRRP will allow the DCS values to be used in the laboratory's annual MDL study (if an annual MDL study is required). If the laboratory does not analyze a set of TRRP samples for a quarter of a year or more, no DCS analysis is required for that period with respect to this guidance. Also, if the laboratory’s routine DCS results support the MDL, no additional MDL study is necessary with respect to the TRRP and this guidance. When evaluating the results of the DCS, the analytical response must meet the qualitative identification criteria specified in the method and the laboratory’s QAP. If no qualitative identification criteria are specified in the method or the laboratory QAP, a detection would be considered a response for which the laboratory has a high degree of confidence that the response is different from a blank. If the COC is not detected in the DCS, the DCS should be reanalyzed. If the COC is still not detected, the MDL is considered not valid for calculating non-detected results under TRRP because it is not supported by successful DCS results. Therefore, analyze the DCS at increasing concentrations until the COC is detected. The concentration at which the COC is detected should be used in lieu of the MDL for reporting detected results and calculating non-detected results. The DCS documentation maintained by the laboratory must be sufficient to allow a person with reasonable and applicable experience to concur with the laboratory's conclusion that the COC was detected in the DCS. Under §350.54(h), non-detected results must be reported as less than the value of the SQL. In §350.4(a)(78), the SQL is defined as "the [MDL] adjusted to reflect sample-specific actions, such as dilution or use of smaller aliquot sizes than prescribed in the analytical method, and takes into account sample characteristics, sample preparation, and analytical adjustments. The term, as used in this rule, is analogous to the sample-specific detection limit." As implied in the definition, the term “SQL” is a misnomer, as the value generated by the rule definition is a function of detection, not quantitation. From the perspective of the laboratory, the SQL is that value below which the COC cannot be reliably detected and is equal to the sample detection limit (SDL). From the perspective of the data user, the SQL is the maximum concentration at which the COC can be expected if the COC were in the sample. In discussing reporting requirements with the laboratory, using the term "SDL" in lieu of "SQL" may be helpful. When reporting non-detected results where the MDL cannot be verified or is not supported by the initial DCS, the concentration at which the COC was detected in the DCS should be used in lieu of the MDL to determine if a response is detected and to calculate the SQLs. That is, if the estimated concentration represented by a response is less than the concentration in the successful DCS, the result is reported as not detected and the SQL is calculated using the concentration in the DCS in lieu of the MDL concentration.
RG-366/TRRP-13 December 2002 11
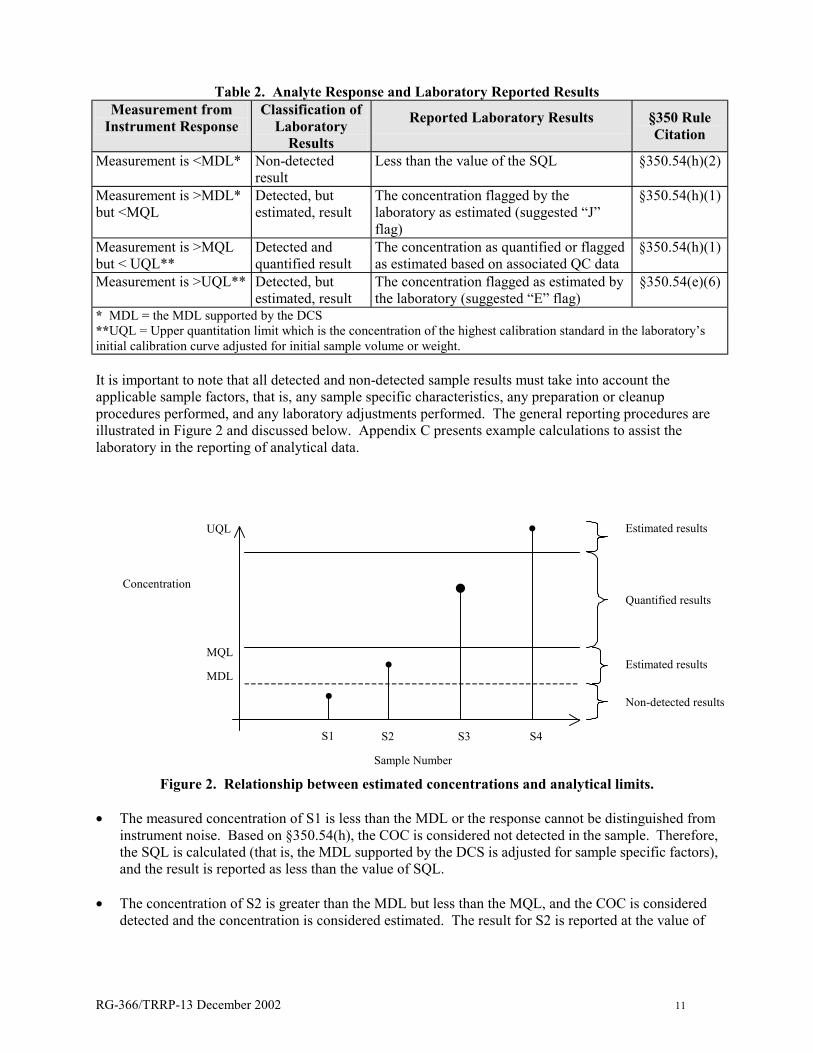
Table 2. Analyte Response and Laboratory Reported Results Measurement from
Instrument Response Classification of
Laboratory Results
Reported Laboratory Results §350 Rule Citation
Measurement is <MDL* Non-detected result
Less than the value of the SQL §350.54(h)(2)
Measurement is >MDL* but <MQL
Detected, but estimated, result
The concentration flagged by the laboratory as estimated (suggested “J” flag)
§350.54(h)(1)
Measurement is >MQL but < UQL**
Detected and quantified result
The concentration as quantified or flagged as estimated based on associated QC data
§350.54(h)(1)
Measurement is >UQL** Detected, but estimated, result
The concentration flagged as estimated by the laboratory (suggested “E” flag)
§350.54(e)(6)
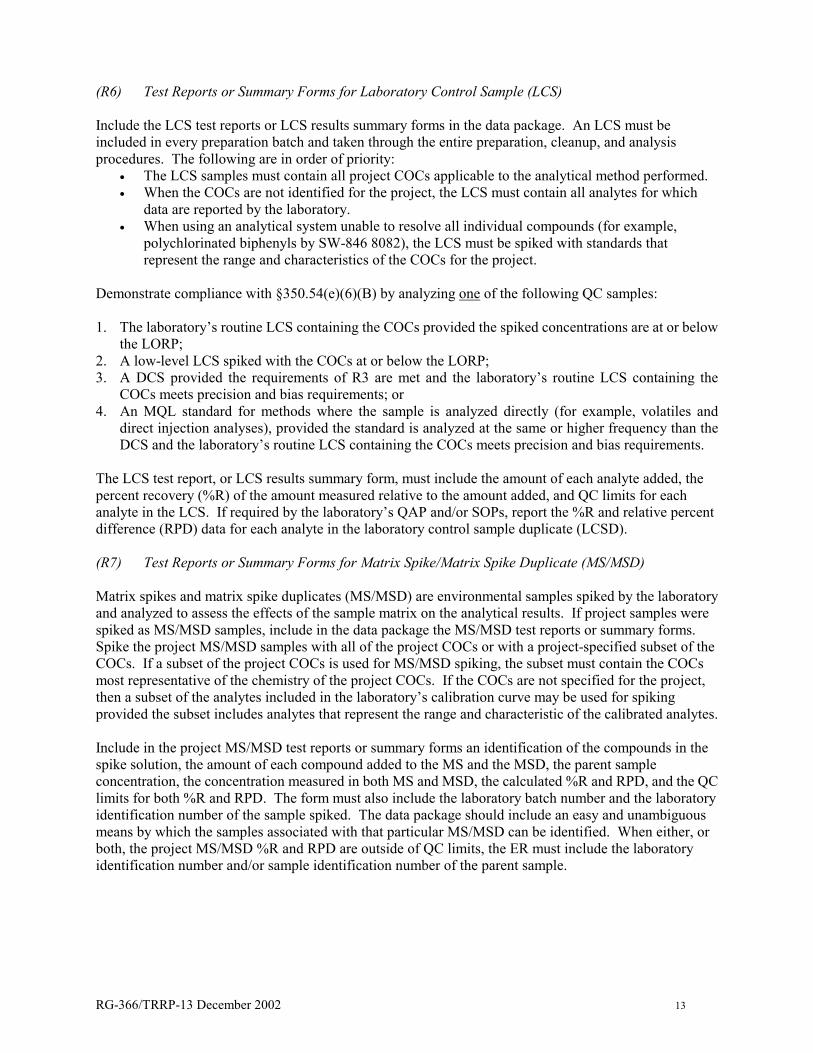
* MDL = the MDL supported by the DCS **UQL = Upper quantitation limit which is the concentration of the highest calibration standard in the laboratory’s initial calibration curve adjusted for initial sample volume or weight. It is important to note that all detected and non-detected sample results must take into account the applicable sample factors, that is, any sample specific characteristics, any preparation or cleanup procedures performed, and any laboratory adjustments performed. The general reporting procedures are illustrated in Figure 2 and discussed below. Appendix C presents example calculations to assist the laboratory in the reporting of analytical data.
Figure 2. Relationship between estimated concentrations and analytical limits. • The measured concentration of S1 is less than the MDL or the response cannot be distinguished from
instrument noise. Based on §350.54(h), the COC is considered not detected in the sample. Therefore, the SQL is calculated (that is, the MDL supported by the DCS is adjusted for sample specific factors), and the result is reported as less than the value of SQL.
• The concentration of S2 is greater than the MDL but less than the MQL, and the COC is considered
detected and the concentration is considered estimated. The result for S2 is reported at the value of
S1 S2 S3 S4
MDL
MQL
UQL
Concentration
Sample Number
Estimated results
Quantified results
Estimated results
Non-detected results

RG-366/TRRP-13 December 2002 12
the estimated concentration adjusted for sample specific factors and flagged, for example, “J,” to indicate the result is estimated.
• The measured concentration of S3 is greater than the MQL and less than the UQL, that is, the
analytical response is within the calibration range. Therefore, the COC is detected and the measured concentration is quantified because it is bracketed by calibration standards (§350.54(e)(6)(A)). The result is reported as the value of the measured concentration adjusted for sample specific factors. The result is flagged, if necessary, based on associated QC data.
• The measured concentration of S4 is not bracketed by calibration standards; the COC is considered
detected, and the concentration is considered estimated. The sample should be diluted and reanalyzed. However, if the laboratory is not able to dilute and reanalyze the sample, the result should be reported at the value of the estimated concentration adjusted for sample specific factors and flagged “E” to indicate the result exceeds the UQL and is estimated.
Reporting of tentatively identified compound (TIC) data: If TIC searches for volatile or semi-volatile organic compounds using gas chromatography/mass spectrometry (GC/MS) technologies are warranted, the sample test report or the TIC identification summary report should include the following for each TIC: 1) the Chemical Abstract Service (CAS) number, where applicable; 2) the compound name, if known, otherwise the chemical class or group; 3) the retention time; and 4) the estimated concentration. Unless otherwise specified in a later amendment to this guidance, the method recommendations and the laboratory’s standard operating procedures for performing TIC searches should be followed. Currently, TIC data are reported when specifically requested by TCEQ. See TCEQ guidance document Target COCs (RG-366/TRRP-10) for a description of circumstances or conditions which warrant TIC searches. (R4) Surrogate Recovery Data Surrogate recovery data are used to evaluate potential bias on the analytical result in the sample that could have been introduced by the preparatory procedures and/or the analysis. The data package must include the surrogate data as applicable to the analytical method performed. The surrogate data can be included on the test report for each sample, or can be included on a summary form, provided that the surrogate results are clearly and unambiguously linked to the sample in which the surrogate results were measured. Include the associated percent recovery and the laboratory’s QC limits in the surrogate data. (R5) Test Reports or Summary Forms for Laboratory Blank Sample Analytical results for laboratory blanks provide a means to assess the potential for laboratory contamination of project samples. The data package must include test reports or summary forms for all blank samples (for example, method blanks and preparation blanks) pertinent to sample analyses of interest. Detected and non-detected results in blank samples should be reported as described previously in Section 2.1.3 (R3). If an analyte is reported above the MQL in any of the laboratory blanks associated with samples from the project, then describe in an ER: the type of blank, the analyte detected in the blank, the concentration of the analyte in the blank, and the project samples potentially affected. Blank sample test reports must contain the surrogate results, if applicable to the method used, and the information specified for environmental sample test reports/summary forms (R3 above). Do not blank correct the sample data.
RG-366/TRRP-13 December 2002 13
(R6) Test Reports or Summary Forms for Laboratory Control Sample (LCS) Include the LCS test reports or LCS results summary forms in the data package. An LCS must be included in every preparation batch and taken through the entire preparation, cleanup, and analysis procedures. The following are in order of priority:
• The LCS samples must contain all project COCs applicable to the analytical method performed. • When the COCs are not identified for the project, the LCS must contain all analytes for which
data are reported by the laboratory. • When using an analytical system unable to resolve all individual compounds (for example,
polychlorinated biphenyls by SW-846 8082), the LCS must be spiked with standards that represent the range and characteristics of the COCs for the project.
Demonstrate compliance with §350.54(e)(6)(B) by analyzing one of the following QC samples: 1. The laboratory’s routine LCS containing the COCs provided the spiked concentrations are at or below
the LORP; 2. A low-level LCS spiked with the COCs at or below the LORP; 3. A DCS provided the requirements of R3 are met and the laboratory’s routine LCS containing the
COCs meets precision and bias requirements; or 4. An MQL standard for methods where the sample is analyzed directly (for example, volatiles and
direct injection analyses), provided the standard is analyzed at the same or higher frequency than the DCS and the laboratory’s routine LCS containing the COCs meets precision and bias requirements.
The LCS test report, or LCS results summary form, must include the amount of each analyte added, the percent recovery (%R) of the amount measured relative to the amount added, and QC limits for each analyte in the LCS. If required by the laboratory’s QAP and/or SOPs, report the %R and relative percent difference (RPD) data for each analyte in the laboratory control sample duplicate (LCSD). (R7) Test Reports or Summary Forms for Matrix Spike/Matrix Spike Duplicate (MS/MSD) Matrix spikes and matrix spike duplicates (MS/MSD) are environmental samples spiked by the laboratory and analyzed to assess the effects of the sample matrix on the analytical results. If project samples were spiked as MS/MSD samples, include in the data package the MS/MSD test reports or summary forms. Spike the project MS/MSD samples with all of the project COCs or with a project-specified subset of the COCs. If a subset of the project COCs is used for MS/MSD spiking, the subset must contain the COCs most representative of the chemistry of the project COCs. If the COCs are not specified for the project, then a subset of the analytes included in the laboratory’s calibration curve may be used for spiking provided the subset includes analytes that represent the range and characteristic of the calibrated analytes. Include in the project MS/MSD test reports or summary forms an identification of the compounds in the spike solution, the amount of each compound added to the MS and the MSD, the parent sample concentration, the concentration measured in both MS and MSD, the calculated %R and RPD, and the QC limits for both %R and RPD. The form must also include the laboratory batch number and the laboratory identification number of the sample spiked. The data package should include an easy and unambiguous means by which the samples associated with that particular MS/MSD can be identified. When either, or both, the project MS/MSD %R and RPD are outside of QC limits, the ER must include the laboratory identification number and/or sample identification number of the parent sample.

RG-366/TRRP-13 December 2002 14
(R8) Test Reports for Laboratory Duplicate Laboratory duplicate samples are project samples split in the laboratory and analyzed to assess method/laboratory precision in the matrix of concern. If a project sample was analyzed as a laboratory duplicate was analyzed, the data package must include the duplicate sample test report summary form. Include in the duplicate sample test report the calculated RPD between the sample and the sample duplicate results and the QC limits for the RPD. Also include the laboratory batch number and the identification number of the parent sample in the test report. The data package must include an easy and unambiguous means by which the samples associated with that particular duplicate analysis can be identified. (R9) Method Quantitation Limits The MQL is defined in §350.4(54) as “The lowest non-zero concentration standard in the laboratory’s initial calibration curve and is based on the final volume of extract (or sample) used by the laboratory.” To assist the data user in verifying an appropriate method was used for the analysis, the laboratory data package must include a copy of the laboratory’s unadjusted MQLs for the analytes included in the laboratory’s calibration curve in each matrix, that is, solid, aqueous, tissue, and air, for which data are reported. See TCEQ guidance document Target COCs (RG-366/TRRP-10) for determining the minimum analytes which should be included in the laboratory’s calibration curve when the project COCs have not been identified. An example of how the laboratory would calculate and report the MQL based on the initial calibration curve using Method SW846-8270 for the analysis of Compound C in soil is as follows: An analytical standard of Compound C obtained from a commercial source is diluted in methylene chloride (MeCl2) solvent to calibrate a range from 5 to 80 ug/mL. Using the laboratory's standard solid mass, for example, 30 grams, and standard final volume of the MeCl2, for example, 1 mL MeCl2, the concentration of the lowest calibration standard, that is, the MQL, is
( )MQL
ug Compound CmL MeCl
mL MeCl
kg sampleug Compound Ckg sample
= =
51
0 0301672
2
.
(R10) Other Problems and Anomalies The laboratory is to document and report problems and/or anomalies observed by the laboratory that might have an impact on the quality of the data. If the SQL is used by the person for vertical delineation of COCs in soil under §350.51(d) or for the demonstration of attainment of the critical PCL under §350.79, the person must satisfactorily demonstrate that all reasonably available technology has been used to demonstrate the COC cannot be measured to the MQL or PCL, respectively, due to sample specific interferences. Interference is defined as the presence of a compound, chemical species, or collection of compounds when having properties that impair/inhibit the laboratory’s ability to detect and/or quantify the COC at or below the level of required performance. The laboratory must document any evidence of matrix interference along with the measures taken to eliminate or reduce the effect on the sample results by the interferent, if appropriate. Evidence of a matrix interference may include, but is not limited to:

RG-366/TRRP-13 December 2002 15
• Chromatograms, or other raw data from the instrument, which show the presence of an
interferent. • Substances present that are recognized to cause interference with the analysis of the COC. • Unusual physical appearance or odor of the sample and/or sample extract/digestate (for example,
highly colored, viscous, turbid, etc.). • Moisture content*
* It is recognized that soil moisture content can elevate the SQLs. The moisture content reported as described in R3 is adequate demonstration of this effect and no further action relative to soil moisture is required.
Measures taken to eliminate or reduce the interference may include, but are not limited to:
• Re-extraction/re-digestion and/or re-analysis • Modifications to the preparation and/or analytical procedures • Using alternate preparation procedures • Using sample cleanup methods • Using alternate analytical methods
If the sample is diluted, the dilution factor used by the laboratory must keep the most concentrated target COC’s response in the upper half of the initial calibration range of the instrument.
2.2 Supporting Data Supporting data are the reports, information, and results generated and maintained by the laboratory to document the level of quality control the laboratory maintains during sample analysis and during routine operations. Supporting data document the laboratory’s performance on a sample and sample batch basis (for example, internal standard recoveries and initial and continuing calibration verifications), the laboratory’s standard practices on an on-going basis, SOPs, audit findings, and proficiency tests or performance evaluation studies. The supporting data must be kept on file either by the laboratory or the person. Supporting data (noted as “S#” items on the example LRC in Appendix A) outside of QC limits must be identified in the LRC included in the data package submitted to the TCEQ.
A review of the supporting data by the TCEQ may be warranted, but is not limited to, when:
1) the reportable data submitted to the TCEQ indicate problems may exist with the data, and the
problems were not identified by the person in the ER and were not resolved either by the laboratory or the person;
2) the data come under scrutiny for evidentiary reasons, or 3) the laboratory comes under scrutiny because of questions regarding the laboratory’s quality
systems or lack thereof.
Maintain supporting data on file and make it available upon request. The person should establish appropriate data retention periods with the laboratory. At a minimum, the data must be available within and up to three years after the person submits the completed report in which the data are used. However, if after the three years the data come into question, it is the person’s responsibility to make available sufficient supporting data to back up the decisions made with the questionable data or to replace the data by recollecting and analyzing samples used in the decisions.

RG-366/TRRP-13 December 2002 16
If the laboratory is implementing performance-based measurement system (PBMS) methods, the laboratory must meet the required and recommended quality assurance/quality control (QA/QC) criteria in U. S. EPA Test Methods for Evaluation of Solid Waste, Update III (as amended) (SW-846) unless, based on the potential use of the sample results, the project and/or samples require less stringent quality control criteria than those recommended. Chapter One (Quality Control) of SW-846 describes the QA/QC specifications for analytical procedures. These specifications include proficiency (precision, bias and method detection limit), control procedures and control limits (laboratory control samples, method blank, and matrix spikes), corrective action, data handling and documentation.
2.3 Review by the Laboratory The laboratory must review both the reportable data and the supporting data, with respect to project objectives (if known), the method requirements and recommendations, applicable SOPs, and the laboratory’s overall performance. The results of the laboratory’s review of both the reportable data and supporting data must be documented in the associated LRC and ERs described in Section 2.1. Review of raw data should encompass both sample preparation and analysis and must verify the following have been conducted in accordance with applicable standards: i) data reductions; ii) transcriptions and calculations from raw data; and iii) maintenance of laboratory logbooks and calculation sheets. Also, maintain documentation to facilitate an audit of any or all stages of data generation. Maintain a laboratory QA program that identifies and corrects problems associated with the generation of analytical data. Document the laboratory’s technical procedures, as well as, procedures for data reduction, reporting, and review in the laboratory’s QAP and/or SOPs to ensure: (1) complete documentation is maintained; (2) transcription and data reduction errors are minimized; (3) the data are reviewed and the review documented; and (4) the reported results are flagged to reflect potential limitations of the data, when necessary. 3.0 Data Usability Review The data usability review is conducted by, or on behalf of, the person to assess the usability of the field and laboratory data and to document all decisions are supported by data of appropriate quality. The data usability review recognizes that even though a laboratory completes all analyses in accordance with appropriate methods, the resulting data may still require qualification with respect to the intended use, given matrix interferences, method limitations, or other considerations. The recommended procedures to follow when performing the data usability review and in preparing a Data Usability Summary (DUS) are described in Sections 3.1 and 3.2, respectively. In order to identify data quality concerns (such as ongoing problems with the matrix or difficulty meeting the LORP) in a timely manner, it is recommended that the data usability review be conducted as soon as possible after the laboratory reports are received. A supplemental data usability review, as described in Section 3.3 below, may be needed based on the outcome of the initial data usability data review.
3.1 Data Usability Review To identify any potential impacts on the quality of the data, the data usability review includes an examination of
1) the project objectives, 2) the LRC and associated ERs for the reportable and supporting data (See Section 2.1 and Appendix
A), 3) the reportable data, and

RG-366/TRRP-13 December 2002 17
4) the field notes and data associated with the sampling event(s). An evaluation of the reportable data includes a review of the following QC parameters, as applicable to the analytical method and project requirements:
• Holding times • Preservation • Sample containers • Blank data • LCS recoveries • LCSD recoveries (if applicable) • LCS/LCSD precision (if applicable) • MS recoveries (if applicable) • MSD recoveries (if applicable) • MS/MSD precision • Duplicate precision (inorganic analyses only) • Surrogate recoveries (organic analyses only) • Field duplicate precision • MQLs compared to the LORP • Appropriateness of the demonstration that all available analytical technology was used by the
laboratory to lower the SQL if the person is attempting to use the SQL as the attainment level (or LORP) as allowed under §350.51(d) and §350.79.
An evaluation of the supporting data includes reviewing the results of the laboratory's review of the supporting data documented in the LRC and associated ERs. The criteria and/or QC limits used to evaluate each QC parameter must be defined for each project. These criteria may differ from the laboratory QC criteria and/or QC limits because the usability review is based on project objectives, not necessarily the laboratory or method criteria. A review of some of the reportable data listed above will involve comparison to numerical criteria. For all new data collection activities, project data objectives should be developed prior to sampling activities in accordance with TRRP guidance document Assessment Planning (RG-366/TRRP-6) and should be available to the data usability reviewer. Therefore, a hierarchy has been developed to determine the applicable criteria at the time of data review. From highest to lowest preference, the data reviewer should compare the reportable data to one of the following sets of criteria:
1. the project specific criteria; which should be equal to or be more stringent than the program requirements;
2. the program specific criteria; and 3. in the absence of 1 and 2, the data usability reviewer should provide the review criteria and the
rationale for qualifying the data.
The data usability reviewer should consult the Assessment Planning guidance (RG-366/TRRP-6) on how to set the review criteria. Typically,
• for organic analytes, percent recoveries between 60% and 140%, but not less than 10%, and relative percent differences within 40% are acceptable, and

RG-366/TRRP-13 December 2002 18
• for inorganic analytes, percent recoveries between 70% and 130%, but not less than 30%, and relative percent differences within 30% are acceptable.
However, the data reviewer must carefully consider the intended use of the data before using these ranges as review criteria for a project. For example, if the reported data are near to, but below, the LORP, (that is, within 75 to 100% of the LORP), a 60% recovery may not be acceptable. On the other hand, if the reported result is greater than the LORP or far below the LORP (<50% of the LORP), then a 60% recovery would be acceptable. The data usability reviewer must assign usability qualifiers to the data based on the usability review. Recommended data usability qualifiers are listed on Table 3. The data usability reviewer must annotate qualified data on the analytical test reports with appropriate usability qualifiers and bias codes listed in Table 3. The usability qualifier should be followed by the applicable bias code. The bias code provides an indication of the potential direction of bias, if known. To ensure that all data users are aware of any data quality problems, present the usability qualifier/bias codes in the data summary tables in rule-required reports submitted to the agency.
Table 3. Data Usability Qualifier Definitions Qualifier Definition
U Not detected: Analysis for the analyte was performed, but the analyte was not detected above the level of the associated value. The associated value is the SQL.
J Estimated: The analyte was detected and identified. The associated numerical value is the approximate concentration of the analyte in the sample.
UJ Not detected, SQL is estimated: The analyte was not detected above the reported SQL. The numerical value of the SQL is estimated and may be inaccurate.
NJ
Tentatively identified, reported concentration is estimated: The analysis indicates the presence of an analyte for which there is presumptive evidence to make a tentative identification and the associated numerical value represents its approximate concentration. For example, analyte not included in the calibration or second column confirmation not performed.
R Rejected: The data are unusable. Bias Codes Definition
H Bias in sample result likely to be high. L Bias in sample result likely to be low.
In addition to the project analytical data, the data usability reviewer must evaluate the field data to identify problems or anomalies that may affect the quality of the data and document the results of that review in the DUS. Examples of field data to review are as follows:
• Records of field measurements such as pH, specific conductivity, and temperature, (for example, were instruments calibrated properly and were project specified conditions documented?).
• Maintenance of temperature preservation prior to shipping the samples to the laboratory. • Filtering procedures used, (for example, were samples filtered? If so, what were the turbidity
measurements and what size filter was used?). • Results from field, trip, and equipment blanks, as applicable. • Sampling sequence (for example, lower COC concentration areas to higher COC concentration
areas). • Records of ambient conditions during sampling regarding possible sources of COCs not attributable
to the affected property.

RG-366/TRRP-13 December 2002 19
3.2 Data Usability Summary (DUS) The data usability reviewer must prepare a DUS that summarizes and documents the results of the data usability review described in Section 3.1. The data reviewer should log the results during the review conducted on each data package. These review results can be stored as tables or text to provide the data reviewer with a record of the rationale used for qualifying the data. The rationale should also be sufficiently detailed so as to allow for a change in project personnel with minimal loss of information, effort, and expertise. When preparing the DUS for a TRRP-required report, the data reviewer can summarize the usability issues and uncertainties in the data by reviewing the text and/or tables stored at the time each review was completed. The tables and text can then be edited and inserted in the DUS text or in an appendix or attachment to the DUS or the information can be summarized in text. The DUS must provide the following information:
• The intended use of the data • Samples and analytical parameters reviewed • Field data reviewed • QC parameters reviewed • Review criteria for each QC parameter • Specific samples and constituents that did not meet review criteria and the resulting qualifiers
applied • Usability of the data, and the associated uncertainty, when applicable • Appropriateness of the laboratory’s demonstration that available technology was used to minimize
the SQL as discussed in §§350.51(d) and 350.79, and Section 2.1.3 of this document. If appropriate, the DUS may reference information presented elsewhere in an accompanying document or in nationally available documents or applicable TCEQ guidance. An example DUS is provided in Appendix B. Specify in the DUS the samples reviewed either by listing or by reference to any accompanying document and provide a description of the types of samples (for example, groundwater, soil, field QC), a listing of analytical methods and a reference to the source of the analytical methods (for example, Standard Methods for the Examination of Water and Wastewater, U.S. EPA SW-846, or laboratory defined methods). The DUS must identify the laboratory data packages reviewed by laboratory job number, sample data group number, batch, or other appropriate reference. In the case where QC criteria are outside applicable limits, the summary must indicate the affected samples, the QC parameter reviewed, the qualifiers and bias code(s) applied to the data point, and the determination made concerning the usability of data. If non-project samples were used for the MS/MSD samples, no qualifiers or bias codes are applied to the project data based on MS/MSD results. Appendix 1 provides evaluation tools that the reviewer may find helpful for documenting the rationale used to determine the usability of the data. Note, Appendix 1 is provided for reference only and is not a required submittal. Tables D-1 and D-2 in Appendix 1 provide guidance for the application of qualifiers and bias codes for each QC parameter reviewed. Any additional qualifiers or bias codes used by the reviewer must be defined specifically in the DUS. All data qualifications based on professional judgment must be documented and explained. Relevant qualifiers and bias codes also must be applied to each data point in the data summary tables included in the rule-required reports.
RG-366/TRRP-13 December 2002 20
State in the DUS whether the reviewed data can be used to support the regulatory compliance decision(s) being made for the project and quantify, if possible, and describe the effects of uncertainty associated with qualified results. Discuss whether any of the qualified results are considered critical to meeting project objectives and any potential consequences related to the project if the qualified results are used for decision making. For example, if the result is needed to make a project decision and the result is qualified with a low bias, quantify, if possible, and discuss in the DUS the uncertainty in the qualified result and include an explanation of the potential for error and how the associated uncertainty will be managed.
3.3 Supplemental Data Usability Review If it appears warranted based on the initial data usability review, the data reviewer must perform a supplemental data usability review on relevant supporting data. For example, a review may be warranted when there are inconsistencies between the reportable data and the LRC or when significant QC problems indicate the laboratory may be operating outside control conditions (for example, continued failure of the LCS or continuous and/or significant blank contamination). Review of the laboratory’s MDL and DCS results and the steps taken by the laboratory to lower the SQL may be warranted when the SQL is above the critical PCL. Prior to selecting the data for supplemental data usability review, the project data objectives should be reviewed to ensure that any samples critical to the decision process are identified and given priority, if necessary. The supplemental data usability review should include, but not necessarily be limited to, obtaining and reviewing the following supporting data:
• Initial calibrations (S1) • Initial calibration verifications and continuing calibration verifications (S2) • Tuning for GC/MS analyses (S3) • Internal standard areas (S4) • Sample preparation/analytical raw data, such as run logs and chromatographic and spectral data
(S5) • Dual column confirmation for GC analyses (S6) • Chromatograms, spectra, and reference spectra of TICs from GC/MS analyses, if TIC data are
requested (S7) • Interference check samples for metals (S8) • Serial dilutions, post-digestion spikes and MSA for metals (S9) • Method detection limit determinations (S10)
The project data objectives, laboratory or method QC limits/criteria should be used to evaluate the supporting QC parameters, and the results of the supplemental data review, if performed, must be documented in the DUS. Define the usability qualifiers and bias codes used to identify the exceptions if the usability qualifiers used differ from the qualifiers and codes presented in Table 3-1. To ensure the data user is aware of any quality problems associated with the data, present the data usability qualifier/bias codes in the data summary tables in the rule-required reports submitted to the TCEQ.

RG-366/TRRP-13 December 2002
A1
Appendix A Laboratory Data Package Cover Page
This data package consists of: � This signature page, the laboratory review checklist, and the following reportable data: � R1 Field chain-of-custody documentation; � R2 Sample identification cross-reference; � R3 Test reports (analytical data sheets) for each environmental sample that includes:
a) Items consistent with NELAC 5.13 or ISO/IEC 17025 Section 5.10 b) dilution factors, c) preparation methods, d) cleanup methods, and e) if required for the project, tentatively identified compounds (TICs).
� R4 Surrogate recovery data including: a) Calculated recovery (%R), and
b) The laboratory’s surrogate QC limits. � R5 Test reports/summary forms for blank samples; � R6 Test reports/summary forms for laboratory control samples (LCSs) including:
a) LCS spiking amounts, b) Calculated %R for each analyte, and c) The laboratory’s LCS QC limits.
� R7 Test reports for project matrix spike/matrix spike duplicates (MS/MSDs) including: a) Samples associated with the MS/MSD clearly identified, b) MS/MSD spiking amounts, c) Concentration of each MS/MSD analyte measured in the parent and spiked samples, d) Calculated %Rs and relative percent differences (RPDs), and e) The laboratory’s MS/MSD QC limits
� R8 Laboratory analytical duplicate (if applicable) recovery and precision: a) the amount of analyte measured in the duplicate, b) the calculated RPD, and c) the laboratory’s QC limits for analytical duplicates.
� R9 List of method quantitation limits (MQLs) for each analyte for each method and matrix; � R10 Other problems or anomalies. � The Exception Report for every “No” or “Not Reviewed (NR)” item in laboratory review checklist. Release Statement: I am responsible for the release of this laboratory data package. This data package
has been reviewed by the laboratory and is complete and technically compliant with the requirements of the methods used, except where noted by the laboratory in the attached exception reports. By me signature below, I affirm to the best of my knowledge, all problems/anomalies, observed by the laboratory as having the potential to affect the quality of the data, have been identified by the laboratory in the Laboratory Review Checklist, and no information or data have been knowingly withheld that would affect the quality of the data.
Check, if applicable: [ ] This laboratory is an in-house laboratory controlled by the person
responding to rule. The official signing the cover page of the rule-required report (for example, the APAR) in which these data are used is responsible for releasing this data package and is by signature affirming the above release statement is true.
_____________________ __________________________ ____________________ ____________ Name (Printed) Signature Official Title (printed) Date

RG-366/TRRP-13 December 2002 A2
1. Items identified by the letter “R” must be included in the laboratory data package submitted in the TRRP-required report(s). Items identified by the letter “S” should be retained and made available upon request for the appropriate retention period.
2. = organic analyses; I = inorganic analyses (and general chemistry, when applicable); 3. NA = Not applicable; 4. NR = Not reviewed; 5. ER# = Exception Report identification number (an Exception Report should be completed for an item if “NR” or “No” is checked).
Appendix A (cont’d): Laboratory Review Checklist: Reportable Data Laboratory Name: LRC Date:
Project Name: Laboratory Job Number: Reviewer Name: Prep Batch Number(s): #1 A2 Description Yes No NA3 NR4 ER#5
Chain-of-custody (C-O-C) Did samples meet the laboratory’s standard conditions of sample acceptability upon receipt? R1 OI Were all departures from standard conditions described in an exception report?
R2 OI Sample and quality control (QC) identification Are all field sample ID numbers cross-referenced to the laboratory ID numbers? Are all laboratory ID numbers cross-referenced to the corresponding QC data? R3 OI Test reports Were all samples prepared and analyzed within holding times? Other than those results < MQL, were all other raw values bracketed by calibration standards? Were calculations checked by a peer or supervisor? Were all analyte identifications checked by a peer or supervisor? Were sample quantitation limits reported for all analytes not detected? Were all results for soil and sediment samples reported on a dry weight basis? Were % moisture (or solids) reported for all soil and sediment samples? If required for the project, TICs reported? R4 O Surrogate recovery data Were surrogates added prior to extraction? Were surrogate percent recoveries in all samples within the laboratory QC limits? R5 OI Test reports/summary forms for blank samples Were appropriate type(s) of blanks analyzed? Were blanks analyzed at the appropriate frequency? Were method blanks taken through the entire analytical process, including preparation and, if
applicable, cleanup procedures?
Were blank concentrations < MQL? R6 OI Laboratory control samples (LCS): Were all COCs included in the LCS? Was each LCS taken through the entire analytical procedure, including prep and cleanup steps? Were LCSs analyzed at the required frequency? Were LCS (and LCSD, if applicable) %Rs within the laboratory QC limits? Does the detectability data document the laboratory’s capability to detect the COCs at the MDL used
to calculate the SQLs?
Was the LCSD RPD within QC limits? R7 OI Matrix spike (MS) and matrix spike duplicate (MSD) data Were the project/method specified analytes included in the MS and MSD? Were MS/MSD analyzed at the appropriate frequency? Were MS (and MSD, if applicable) %Rs within the laboratory QC limits? Were MS/MSD RPDs within laboratory QC limits? R8 OI Analytical duplicate data Were appropriate analytical duplicates analyzed for each matrix? Were analytical duplicates analyzed at the appropriate frequency? Were RPDs or relative standard deviations within the laboratory QC limits? R9 OI Method quantitation limits (MQLs): Are the MQLs for each method analyte included in the laboratory data package? Do the MQLs correspond to the concentration of the lowest non-zero calibration standard? Are unadjusted MQLs included in the laboratory data package? R10 OI Other problems/anomalies Are all known problems/anomalies/special conditions noted in this LRC and ER? Were all necessary corrective actions performed for the reported data? Was applicable and available technology used to lower the SQL minimize the matrix interference
affects on the sample results?

RG-366/TRRP-13 December 2002 A3
1 Items identified by the letter “R” should be included in the laboratory data package submitted to the TCEQ in the TRRP-required report(s). Items
identified by the letter “S” should be retained and made available upon request for the appropriate retention period. 2 O = organic analyses; I = inorganic analyses (and general chemistry, when applicable). 3 NA = Not applicable. 4 NR = Not Reviewed. 5 ER# = Exception Report identification number (an Exception Report should be completed for an item if “NR” or “No” is checked).
Appendix A (cont’d): Laboratory Review Checklist: Reportable Data Laboratory Name: LRC Date:
Project Name: Laboratory Job Number:
Reviewer Name: Prep Batch Number(s): #1 A2 Description Yes No NA3 NR4 ER#5
S1 OI Initial calibration (ICAL) Were response factors and/or relative response factors for each analyte within QC limits? Were percent RSDs or correlation coefficient criteria met? Was the number of standards recommended in the method used for all analytes? Were all points generated between the lowest and highest standard used to calculate the curve? Are ICAL data available for all instruments used?
Has the initial calibration curve been verified using an appropriate second source standard? S2 OI Initial and continuing calibration verification (ICCV and CCV) and continuing calibration
Was the CCV analyzed at the method-required frequency? Were percent differences for each analyte within the method-required QC limits? Was the ICAL curve verified for each analyte?
Was the absolute value of the analyte concentration in the inorganic CCB < MDL? S3 O Mass spectral tuning:
Was the appropriate compound for the method used for tuning? Were ion abundance data within the method-required QC limits?
S4 O Internal standards (IS): Were IS area counts and retention times within the method-required QC limits? S5 OI Raw data (NELAC section 1 appendix A glossary, and section 5.12 or ISO/IEC 17025 section
Were the raw data (for example, chromatograms, spectral data) reviewed by an analyst? Were data associated with manual integrations flagged on the raw data?
S6 O Dual column confirmation Did dual column confirmation results meet the method-required QC? S7 O Tentatively identified compounds (TICs): If TICs were requested, were the mass spectra and TIC data subject to appropriate checks? S8 I Interference Check Sample (ICS) results: Were percent recoveries within method QC limits? S9 I Serial dilutions, post digestion spikes, and method of standard additions Were percent differences, recoveries, and the linearity within the QC limits specified in the method? S10 OI Method detection limit (MDL) studies Was a MDL study performed for each reported analyte? Is the MDL either adjusted or supported by the analysis of DCSs? S11 OI Proficiency test reports: Was the laboratory's performance acceptable on the applicable proficiency tests or evaluation studies? S12 OI Standards documentation Are all standards used in the analyses NIST-traceable or obtained from other appropriate sources? S13 OI Compound/analyte identification procedures Are the procedures for compound/analyte identification documented? S14 OI Demonstration of analyst competency (DOC)
Was DOC conducted consistent with NELAC Chapter 5C or ISO/IEC 4? Is documentation of the analyst’s competency up-to-date and on file?
S15 OI Verification/validation documentation for methods (NELAC Chap 5 or ISO/IEC 17025 Section 5) Are all the methods used to generate the data documented, verified, and validated, where applicable? S16 OI Laboratory standard operating procedures (SOPs): Are laboratory SOPs current and on file for each method performed?

RG-366/TRRP-13 December 2002 A4
Appendix A (cont’d): Laboratory Review Checklist: Exception Reports
Laboratory Name: LRC Date:
Project Name: Laboratory Job Number:
Reviewer Name: Prep Batch Number(s): ER #1 DESCRIPTION
1 ER# = Exception Report identification number (an Exception Report should be completed for an item if “NR” or “No” is
checked on the LRC)

RG-366/TRRP-13 December 2002 B1
Appendix B: Example Data Usability Summary Data Usability Summary [Person] reviewed two data packages from [Laboratory] for the analysis of soil and groundwater samples collected May 4 through May 10, 2001 at the [Name of Affected Property]. Data were reviewed for conformance to the requirements of the guidance document, Review and Reporting of COC Concentration Data (RG-366/TRRP-13) and adherence to project objectives. Intended Use of Data: To provide current data on concentrations of chemicals of concern (COCs) in the groundwater at the affected property and to characterize the soil present beneath the liner or suitability for off-site disposal or other remedies. Analyses requested included: • SW-846 6020 - Inductively Coupled Plasma-Mass Spectrometry • SW-846 8260B - Volatile Organic Compounds by Gas Chromatography-Mass Spectrometry
(GC/MS) • SW-846 8270C - Semivolatile Organic Compounds by Gas Chromatography-Mass Spectrometry
(GC/MS) Data were reviewed and validated as described in Review and Reporting of COC Concentration Data, (RG-366/TRRP-13) and the results of the review/validation are discussed in this Data Usability Summary (DUS). The following laboratory submittals and field data were examined: • the reportable data, • the laboratory review checklists and associated exception reports, and • the field notes with respect to field instrument calibrations, filtering procedures, sampling procedures,
and preservation procedures prior to shipping the samples to the laboratory. The results of supporting quality control (QC) analyses were summarized on the Laboratory Review Checklists (LRCs), Exception Reports (ERs) and in the case narratives, all of which were included in this review. The LRCs, associated ERs, and reportable data included in this review are attached to this DUS.
Introduction Nine (9) groundwater samples were analyzed for volatile organic compounds (VOCs), semivolatile organic compounds (SVOCs), and total RCRA metals (arsenic, barium, cadmium, chromium, lead, mercury, selenium and silver). Twelve (12) soil samples were analyzed for VOCs and SVOCs. Table B-1 lists the sample identifications cross-referenced to laboratory identifications. Project Objectives Metals Recovery 75-125% RPD Organic Compounds Recovery 60-140% RPD 40%
RG-366/TRRP-13 December 2002 B2
Data Review / Validation Results
Analytical Results Soil analytical results are reported corrected for moisture content. Qualified sample data are listed in Table B-2. Non-detected results are reported as less than the value of the sample quantitation limit (SQL) as defined by the TRRP rule.
Preservation and Holding Times
Samples were evaluated for agreement with the chain-of-custody (C-O-C). All samples were received in the appropriate containers and in good condition with the paperwork filled out properly. Sample receipt temperatures were within the acceptance criteria of 4 ± 2 °C. Samples were preserved in the field as specified in SW-846 Table 2-36. Samples were prepared and analyzed within holding times specified in SW-846 Table 2-36.
Calibrations According to the LRCs, initial calibration and continuing calibration data met SW-846 method requirements for metals, VOC and SVOC analyses. The LRCs also document satisfactory instrument performance calibrations (GC/MS tunes) for VOC and SVOC analyses.
Blanks Barium was detected in the groundwater field blank at a concentration of 0.140 mg/L. Lead was detected in the groundwater equipment blank at a concentration of 0.031 mg/L. All groundwater barium and lead concentrations less than 0.7 mg/L (5 times the blank concentration) and 0.15 mg/L (5 times the blank concentration), respectively, are qualified as nondetect (U). Target analytes were not detected in trip, field or equipment blanks associated with soil samples. Methylene chloride concentrations ranged from 6.13 to 6.45 µg/L in the laboratory blanks associated with the groundwater samples. Methylene chloride concentrations less than 64 µg/L (10 times the blank concentrations) are qualified as nondetect (U) in the associated groundwater samples. Methylene chloride and toluene were detected in the volatile laboratory blanks associated with soil samples. Sample data for these compounds are qualified as nondetect (U) if concentrations in the associated field samples are less than ten times the blank concentration for methylene chloride and less than five times the blank concentration for toluene. Methylene chloride concentrations ranged from 2.5 to 15.5 µg/Kg and toluene concentrations ranged from 0.5 to 1.3 µg/Kg. Methylene chloride concentrations less than 155 µg/Kg and toluene concentrations less than 6.5 µg/Kg are qualified as nondetect (U) in the associated field samples (Table B-2). Laboratory method blank data for reported analytes were not submitted for the SVOC analyses. Since none of the compounds detected in the environmental samples are common laboratory contaminants and SVOCs were not detected in the field blanks reviewed and laboratory blanks, as noted in the LRC, data are not qualified.
Internal Standard and Surrogate Recoveries (VOCs and SVOCs Only)
Surrogate recoveries for groundwater VOC and SVOC analyses were within the project objectives. Surrogate recoveries exceeded the project objectives for the volatile soil analyses of GP1-2’, GP3-2’ and GP3-6’. Detected volatiles in these three samples are qualified as estimated with a high bias (JH). According to the LRCs, internal standard areas were within SW-846 method acceptance criteria. Soil SVOC surrogate recoveries for samples analyzed at a 10x dilution were acceptable. Surrogate recoveries

RG-366/TRRP-13 December 2002 B3
were 0% for the soil samples analyzed at a 100x dilution. Data are not qualified since surrogate analytes were diluted out of the sample.
Laboratory Control Samples
Metals laboratory control sample (LCS) recoveries met the project objectives of 75-125% recovery. LCS recoveries for SVOC analyses met the project objectives of 60-140% recovery. For the groundwater VOC analyses, chloromethane and bromomethane recoveries were less than 60% in all of the LCSs and vinyl chloride LCS recoveries were less than 60% for the analysis on May 21, 2001, As shown on Table 2, vinyl chloride chloromethane and bromomethane data are qualified as estimated with a low bias (JL or UJL) in the associated field samples.
Matrix Spike/Matrix Spike Duplicates
MS/MSD precision and accuracy results were within laboratory QC acceptance criteria for metals, VOC and SVOC analyses.
Field Precision SVOCs and VOCs were not detected in groundwater field duplicate samples M-3D and Dup-1. Detected barium and lead were qualified as nondetect (see discussion on Blanks above). Field duplicate precision was not calculated for groundwater since data for target analytes are reported as nondetect (U). Table B-3 summarizes soil field duplicate precision calculations. Field duplicate precision met project objectives.
Field Procedures
Samples were collected using documented SOPs. Groundwater samples for metal analysis, M-2S and M-3S, had turbidity measurements >10 NTU and were filtered using filters with a pore size of 10 microns.
Summary Groundwater analytical data are usable for the purpose of determining current COC concentrations in groundwater at the affected property with the exception of vinyl chloride, chloromethane, and bromomethane. The data user is advised that the vinyl chloride, chloromethane, and bromomethane results in groundwater are biased low (JL or UJL) due to low LCS recoveries, i.e., <60%. These data can be used for determining the presence of these compounds and as an indication that the concentrations of these compounds exceed the respective PCLs. However, the concentration reported or the SQLs may be low and may be an underestimate of the concentrations of these compounds in the groundwater. The SQLs for vinyl chloride and chloromethane may be biased low and should be used with caution with consideration of trends in recent historical data. Soil data are usable for the purpose of characterizing the soil beneath the liner at the affected property for suitability for off-site disposal or other remedies. The barium and lead results in groundwater samples and toluene results in soil samples are qualified as not detected (U) due to the presence of these compounds in one or more associated blank. All methylene chloride results are qualified as not detected (U) due to methylene chloride being present at low levels in all the laboratory blanks.

RG-366/TRRP-13 December 2002 B4
Table B-1. Cross-Reference Field Sample Identifications and Laboratory Identifications
Field Identification Laboratory Identification
M-1 12345-001
M-2S 12345-002
M-2D 12345-003
M-2TD 12345-004
M-3S 12345-005
M-3D 12345-006
M-4S 12345-007
M-4D 12345-008
EB-1 12345-009
M-5 12345-010
FB-1 12345-011
Dup-1 12345-012
Trip Blank 1 12345-013
Trip Blank 2 12346-001
EB-2 12346-002
GP1-2' 12346-003
GP1-6' 12346-004
GP1-6' Dup 12346-005
GP2-2' 12346-006
GP2-6' 12346-007
GP3-2' 12346-008
GP3-6' 12346-009
GP4-2' 12346-010
GP4-6' 12346-011
GP5-2' 12346-012
GP5-2' Dup 12346-013
GP5-6' 12346-014
GP6-2' 12346-015
GP6-6' 12346-016
FB-2 12346-017

RG-366/TRRP-13 December 2002 B5
Table B-2. Qualified Analytical Data
Field Identification
Analyte Qualification Reason for Qualification
All Chloromethane UJL LCS recovery less than 60%
All Methylene chloride U Analyte detected in laboratory blank
All Bromomethane JL LCS recovery less than 60%
Dup-1 Barium U Analyte detected in field blank
M-1 Barium U Analyte detected in field blank
M-2S Barium U Analyte detected in field blank
M-2TD Barium U Analyte detected in field blank
M-3S Barium U Analyte detected in field blank
M-4S Barium U Analyte detected in field blank
M-5 Barium U Analyte detected in field blank
Dup-1 Lead U Analyte detected in equipment blank
M-1 Lead U Analyte detected in equipment blank
M-3S Lead U Analyte detected in equipment blank
M-4S Lead U Analyte detected in equipment blank
GP1-6’ Toluene U Analyte detected in laboratory blank
GP1-6’ Dup Toluene U Analyte detected in laboratory blank
GP5-6’ Toluene U Analyte detected in laboratory blank
GP6-2’ Toluene U Analyte detected in laboratory blank
M-2D Vinyl chloride UJL LCS recovery less than 60%
M-2S Vinyl chloride UJL LCS recovery less than 60%
M-3S Vinyl chloride UJL LCS recovery less than 60%
M-4S Vinyl chloride UJL LCS recovery less than 60%
M-5 Vinyl chloride UJL LCS recovery less than 60%
GP1-2’ m,p-Xylenes JH Surrogate recoveries exceeded control limits
GP3-2' Benzene JH Surrogate recoveries exceeded control limits
GP3-6' Toluene JH Surrogate recoveries exceeded control limits UJ – The analyte was analyzed for but was not detected above the reported sample quantitation limit. The associated value is an estimate and may be inaccurate or imprecise. J – Estimated data; the reported quantitation limit or sample concentration is approximated due to exceedance of one or more QC requirements. H – Bias in sample result likely to be high. L – Bias in sample result likely to be low.

RG-366/TRRP-13 December 2002 B6
Table B-3 - Field Precision
Field Identification Analyte Sample
Result Duplicate
Result RPDa Qualified
Acenaphthene 68.6 81.4 17 A Anthracene 111 87.5 24 A
Benzo(a)anthracene 19.1 19.1 0 A Benzo(a)pyrene 7.95 8.56 7.4 A
Benzo(b)fluoranthene 11.7 12.6 7.4 A Benzo(g,h,i)perylene 2.61 3.01 14 A Benzo(k)fluoranthene 6.95 6.81 2.0 A
Chrysene 18.5 18.2 1.6 A Dibenzofuran 44.5 49.4 10 A Fluoranthene 106 107 0.9 A
Fluorene 68.6 73.4 6.8 A Indeno(1,2,3-cd)pyrene 2.97 3.32 11 A 2-Methylnaphthalene 28.7 39.9 33 A
Naphthalene 58.8 94.9 47 A Phenanthrene 198 201 1.5 A
GP1 – 6’/GP1 – 6’ Dup
Pyrene 87 88.5 1.7 A Acenaphthene 110 131 17 A
Anthracene 120 104 14 A Benzo(a)anthracene 25.4 23.7 6.9 A
Benzo(a)pyrene 11.7 11 6.2 A Benzo(b)fluoranthene 19.3 19 1.6 A Benzo(g,h,i)perylene 3.36 3.02 11 A Benzo(k)fluoranthene 8.88 7.44 18 A
Chrysene 24.9 22.7 9.2 A Dibenzofuran 57 55.4 2.8 A Fluoranthene 15.8 15.3 3.2 A
Fluorene 94 93.2 0.9 A Indeno(1,2,3-cd)pyrene 3.94 3.69 6.6 A 2-Methylnaphthalene 61.5 62.5 1.6 A
Naphthalene 20.4 20.6 1.0 A Phenanthrene 23 22.7 1.3 A
GP5 - 2'/GP5 - 2' Dup
Pyrene 108 101 6.7 A a RPD = ((SR - DR)*200)/(SR + DR) A - Acceptable Data ND - Not detected at quantitation limits stated in analytical report NA - Not Applicable J - Estimated data due to inability to meet QC criteria

RG-366/TRRP-13 December 2002 C1
Appendix C: Sample Calculations MDL and SQL Formulas
MDL = t(n-1,1-α=0.99) (S) MDL = 3.14 (S) for 7 replicates SQL = MDL * SF when the MDL is verified or supported by DCS SQL = DCS * SF when MDL is not considered valid
where S = standard deviation; and
SF = sample factors which incorporate any change in initial volume or mass and/or final volume or mass from standard conditions, as well as sample characteristics, such as moisture content in soils, or other laboratory adjustments, such as dilutions or concentrations.
Examples of Calculations for Purgeable Compounds in Aqueous Matrix
Analyte MDL DCS MQL (A) Raw Data Report (B) Report (C)
Sample Factors: 1 10
Benzene 0.47 0.5 5 0.3 0.47 U* 4.7 U*
Toluene 0.49 0.5 5 2.5 2.5 J 25 J
Ethylbenzene 0.40 0.5 5 25 25 250
o-Xylene 0.67 1 5 500 500 E 5000 E
All results are in µg/L. (A) Lowest calibration standard is 5 µg/L. Calibration range is 5 µg/L to 200 µg/L. (B) Sample factor 1: standard laboratory condition is 5 mL of water purged.(C) Sample factor 10: 1 mL of sample diluted into 10 mL of water and 5 mL purged. * Not detected at the MDL. The reported value is the MDL adjusted for sample-specific factors.

RG-366/TRRP-13 December 2002 C2
Example Calculations for Extractable Compounds in Aqueous Matrix
Analyte MDL DCS MQL Raw Data (A)
Report (A)(B) Report (A)(C)
Sample Factors: 1 5
Aldrin 0.004 0.02 0.05 0.01 0.02 U* 0.10 U*
Alpha-BHC
0.010 0.01 0.05 0.025 0.025 J 0.12 J
Endrin Ketone
0.024 0.02 0.1 0.022 0.024 U* 0.12 U*
All results are in units of µg/L (A) After converting ng on-column to µg/L with formula: µg/L = ng * Extract volume(µL) / (Sample volume (L) * injection volume (µL) * 1000) (B) Sample factor 1: standard laboratory condition is 1000 mL of water extracted and final volume is 10 mL. C) Sample factor 5: 200 mL of sample extracted and final volume is 10 mL.
* Not detected at the MDL. The reported value is the MDL adjusted for sample-specific factors.

RG-366/TRRP-13 December 2002 C3
Example Calculations for Purgeable Compounds in Solid Matrix
Analyte MDL DCS MQL Raw Data Report (A)(B)
Report (A)(C)
Sample Factors 2 250
Benzene 0.50 0.5 5 25 50 6200
Toluene 0.47 0.5 5 2.5 5 J 620 J
Ethylbenzene 1.91 2 5 1.5 3.8 U* 480 U*
All results are in units of µg/Kg. (A) Sample has 50% moisture (50% solids) (B) Sample factor 2: standard laboratory condition is 5 g of soil purged, adjusted for sample moisture. (C) Sample factor 250: 4 g of soil extracted with 10 mL methanol, analyzing 100 µL of extract, adjusted for sample moisture.
* Not detected at the MDL. The reported value is the MDL adjusted for sample-specific factors.
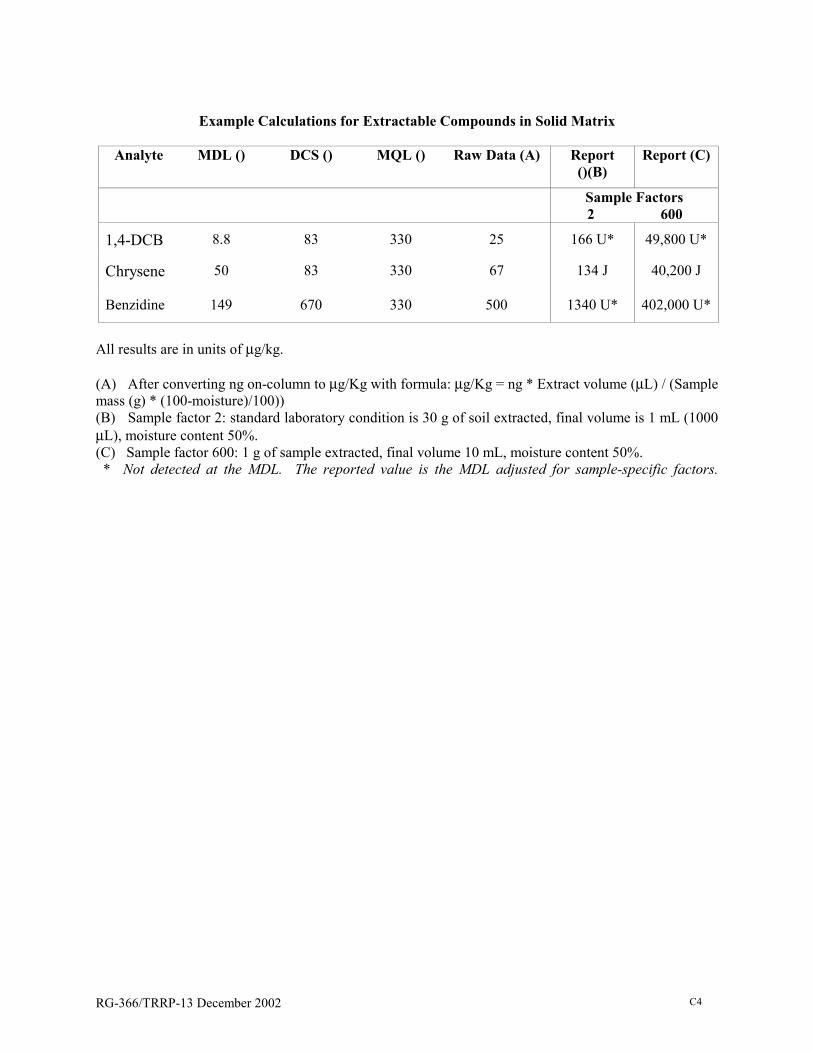
RG-366/TRRP-13 December 2002 C4
Example Calculations for Extractable Compounds in Solid Matrix
Analyte MDL () DCS () MQL () Raw Data (A) Report ()(B)
Report (C)
Sample Factors 2 600
1,4-DCB 8.8 83 330 25 166 U* 49,800 U*
Chrysene 50 83 330 67 134 J 40,200 J
Benzidine 149 670 330 500 1340 U* 402,000 U*
All results are in units of µg/kg. (A) After converting ng on-column to µg/Kg with formula: µg/Kg = ng * Extract volume (µL) / (Sample mass (g) * (100-moisture)/100)) (B) Sample factor 2: standard laboratory condition is 30 g of soil extracted, final volume is 1 mL (1000 µL), moisture content 50%. (C) Sample factor 600: 1 g of sample extracted, final volume 10 mL, moisture content 50%. * Not detected at the MDL. The reported value is the MDL adjusted for sample-specific factors.

RG-366/TRRP-13 December 2002 D1
Appendix D Example Data Usability Review Evaluation Tool
All of the QC criteria in the following evaluation tools are for examples only. The QC criteria in these evaluation tools should be replaced with project specific criteria developed during the planning process (See the TCEQ document, Assessment Planning (See RG-366/TRRP-6)). Also, if the item addresses supporting data beyond what is included in the LRC, and a supplementary data usability review was not necessary, an entry in the “NA” column is recommended.
Data Usability Review Evaluation Tool: Data Package
Client Name: Project Number:
Affected Property Location: Project Manager: Laboratory: Laboratory Job No:
Reviewer: Date Checked: ITEM YES NO N/A COMMENTS R1 Date of sample collection included? R1 Sample receipt temperature 2-6ºC? R1 Signed C-O-Cs included? R2 Field I.D. included? R2 Laboratory I.D. included? R3 Date of analysis included? R3 Date of sample prep. included? R3 Detection levels included? R3 Holding time to analysis expired? R3 Holding time to prep expired? R3 Met method quantitation limits? R3 Method reference included? R3 Sample matrix included? R3 Sample results included? R9 Evaluate unadjusted MQLs? R10 Exception reports included, where
required?
R10 Are justifications for elevated SQLs provided?
Definitions: AA – Atomic Absorption; %D – Percent Difference; ICP – Inductively Coupled Plasma; IDL – Instrument Detection Limit; MDL – Method Detection Limit; %R – Percent Recovery; RF – Response Factor; RPD – Relative Percent Difference; RRT – Relative Retention Times; RSD – Relative Standard Deviation COMMENTS Note: Submittal of Appendix D tables to the TCEQ is not required. Appendix D is intended as an example checklist tool the data reviewer may find helpful for documenting the rationale used to determine data usability.

RG-366/TRRP-13 December 2002 D2
All of the QC criteria in the following evaluation tool are for examples only. The QC criteria in these evaluation tools should be replaced with project specific criteria developed during the planning process (See the TCEQ document, Assessment Planning (See RG-366/TRRP-6)). Also, if the item addresses supporting data beyond what is included in the LRC, and a supplementary data usability review was not necessary, an entry in the “NA” column is recommended.
Data Usability Review Evaluation Tool: Metals QC
Client Name: Project Number:
Affected Property Location: Project Manager: Laboratory: Laboratory Job No:
Reviewer: Date Checked: ITEM YES NO N/A COMMENTS R5 Method Blank Data Included in Lab
Package?
Criteria met? (ICP < 3x IDL; Hg/AA < MDL)
R6 QC Check Samples/LCS Data Included in Lab Package?
%R criteria met? (90 - 110%) R7 Matrix Spike Data Included in Lab
Package?
%R criteria met? (AA/ICP 75 - 125%; Hg 85-115%)
R8 Sample Duplicate Data Included in Lab Package?
RPD criteria met? (RPD < 20%) S1 Initial Calibration Documentation
Included in Lab Package?
Blank/1 std (ICP) or blank/3 stds (AA) or blank/5 stds (Hg)
S2 Calibration Verification Data Included in Lab Package?
%R criteria met? (Initial 90 - 110%) %R criteria met (Continuing 80-120%) S8 Interference Check Sample Data
included (ICP only)?
%R criteria met? (80 - 120%) S9 Dilution Test Data included? Results within 10% original? S9 Post Digestion Spike %R criteria met? (75 - 125% - ICP) (85-
115% - AA)
Notes: 1. Circle applicable QC criteria used in the evaluation of the data. 2 Repeat form as needed. Note: Submittal of Appendix D tables to the TCEQ is not required. Appendix D is intended as an example checklist tool the data reviewer may find helpful for documenting the rationale used to determine data usability.
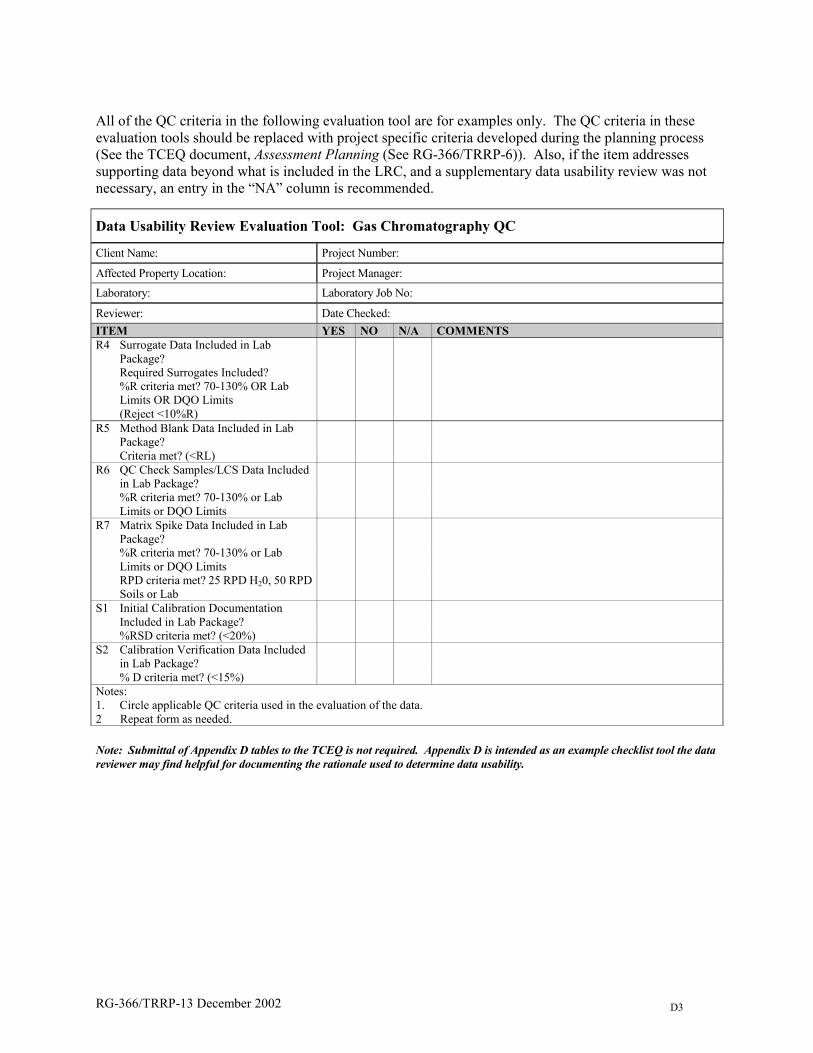
RG-366/TRRP-13 December 2002 D3
All of the QC criteria in the following evaluation tool are for examples only. The QC criteria in these evaluation tools should be replaced with project specific criteria developed during the planning process (See the TCEQ document, Assessment Planning (See RG-366/TRRP-6)). Also, if the item addresses supporting data beyond what is included in the LRC, and a supplementary data usability review was not necessary, an entry in the “NA” column is recommended.
Data Usability Review Evaluation Tool: Gas Chromatography QC
Client Name: Project Number:
Affected Property Location: Project Manager: Laboratory: Laboratory Job No:
Reviewer: Date Checked: ITEM YES NO N/A COMMENTS R4 Surrogate Data Included in Lab
Package? Required Surrogates Included?
%R criteria met? 70-130% OR Lab Limits OR DQO Limits
(Reject <10%R)
R5 Method Blank Data Included in Lab Package?
Criteria met? (<RL) R6 QC Check Samples/LCS Data Included
in Lab Package?
%R criteria met? 70-130% or Lab Limits or DQO Limits
R7 Matrix Spike Data Included in Lab Package?
%R criteria met? 70-130% or Lab Limits or DQO Limits
RPD criteria met? 25 RPD H20, 50 RPD Soils or Lab
S1 Initial Calibration Documentation Included in Lab Package?
%RSD criteria met? (<20%) S2 Calibration Verification Data Included
in Lab Package?
% D criteria met? (<15%) Notes: 1. Circle applicable QC criteria used in the evaluation of the data. 2 Repeat form as needed. Note: Submittal of Appendix D tables to the TCEQ is not required. Appendix D is intended as an example checklist tool the data reviewer may find helpful for documenting the rationale used to determine data usability.

RG-366/TRRP-13 December 2002 D4
All of the QC criteria in the following evaluation tool are for examples only. The QC criteria in these evaluation tools should be replaced with project specific criteria developed during the planning process (See the TCEQ document, Assessment Planning (See RG-366/TRRP-6)). Also, if the item addresses supporting data beyond what is included in the LRC, and a supplementary data usability review was not necessary, an entry in the “NA” column is recommended. Data Usability Review Evaluation Tool: GC/MS QC Client Name: Project Number:
Affected Property Location: Project Manager: Laboratory: Laboratory Job No:
Reviewer: Date Checked: ITEM YES NO N/A COMMENTS R4 Surrogate Data Included in Lab Package? Required surrogates included? Recoveries within limits (see below OR Lab Limits or
DQO Limits)? (Reject <10%R)
Areas within limits? (within -50% to+100% of last calibration check)
RRT within limits? (< 30 sec. difference from last calibration check)
R5 Method Blank Data Included in Lab Package? Criteria met? (<5X RL for lab contamination; <RL for
others))
R6 QC Check Samples/LCS Data Included in Lab Package?
% Recovery criteria met? 70-130%R OR Lab Limits or DQO Limits
R7 Matrix Spike Data Included in Lab Package? %R criteria met? 70-130% OR Lab Limits or DQO
Limits
RPD criteria met? 25 RPD H20, 50 RPD Soils or Lab S1 Initial Calibration Data Included in Lab Package? RF criteria met for SPCC?*;
RRF < 0.05 must be rejected
%RSD criteria met for CCC?**; (<30%RSD for CCC; >15% RSD must have fit)
S2 Continuing Calibration Data Included in Lab Package?
RF criteria met for SPCC?*; RRF < 0.05 must be rejected
% Difference (%D) criteria met for CCC?** 20% D Max; Qualify if >25%D
S3 Instrument Tune for GC-MS Included In Lab Package?
S4 Internal Standard Data Included in Lab Package? Note: Submittal of Appendix D tables to the TCEQ is not required. Appendix D is intended as an example checklist tool the data reviewer may find helpful for documenting the rationale used to determine data usability.

RG-366/TRRP-13 December 2002 D5
Data Usability Review Evaluation Tool: GC/MS QC (continued)
Client Name: Project Number:
Affected Property Location: Project Manager:
Laboratory: Laboratory Job No:
Reviewer: Date Checked: SURROGATE H2O (%R) SOIL (%R) NOTES: 1,2-Dichloroethane-d4 80-120 80-120 Dibromofluoromethane 86-118 80-120 Toluene-d8 88-110 81-117 Bromofluorobenzene 86-115 74-121 Nitrobenzene-d5 35-114 23-120 2-Fluorobiphenyl 43-116 30-115 Terphenyl-d14 33-141 18-137 Phenol-d5 10-94 24-113 2-Fluorophenol 21-100 25-121 2,4,6-Tribromophenol 10-123 19-122 2-Chlorophenol-d4 33-110 20-130 1,2-Dichlorobenzene-d4 16-110 20-130 Notes: 1. Circle applicable QC criteria. 2. Repeat form as needed. * SPCC (System Performance Check Compounds): chloromethane (0.1), 1,1-dichloroethane (0.1), bromoform (0.1), 1,1,2,2-
tetrachloroethane (0.3) and chlorobenzene (0.3) (volatiles); nitroso-di-n-propylamine, hexachlorocyclopentadiene, 2-4-dinitrophenol and 4-nitrophenol (semi-volatiles.)
** CCC (Calibration Check Compounds) are 1,1-dichloroethene, chloroform, 1,2-dichloropropane, toluene, ethylbenzene, and vinyl chloride (volatiles); acenaphthene, 1,4-dichlorobenzene, hexachlorobutadiene, nitroso-di-n-phenylamine, di-n-octylphthalate, fluoranthene, benzo(a)pyrene, 4-chloro-3-methylphenol, 2,4-dichlorophenol, 2-nitrophenol, phenol, pentachlorophenol, and 2,4,6-trichlorophenol.
Note: Submittal of Appendix D tables to the TCEQ is not required. Appendix D is intended as an example checklist tool the data reviewer may find helpful for documenting the rationale used to determine data usability.

RG-366/TRRP-13 December 2002 D6
All of the QC criteria in the following evaluation tool are for examples only. The QC criteria in these evaluation tools should be replaced with project specific criteria developed during the planning process (See the TCEQ document, Assessment Planning (See RG-366/TRRP-6)). Also, if the item addresses supporting data beyond what is included in the LRC, and a supplementary data usability review was not necessary, an entry in the “NA” column is recommended.
Data Usability Review Evaluation Tool: General Chemistry QC
Client Name: Project Number:
Affected Property Location: Project Manager:
Laboratory: Laboratory Job No:
Reviewer: Date Checked:
Parameter: Method: ITEM YES NO N/A COMMENTS R5 Method Blank Data Included in Lab
Package?
Criteria met? (< RL) R6 QC Check Samples/LCS Data Included
in Lab Package?
%R criteria met? (Method or Lab or DQO)
R7 Matrix Spike Data Included in Lab Package?
%R criteria met? (Method or Lab or DQO)
R7 Matrix Spike Duplicate Data Included in Lab Package?
%R criteria met? (Method or Lab or DQO)
RPD criteria met? (Method or Lab or DQO)
Note: Submittal of Appendix D tables to the TCEQ is not required. Appendix D is intended as an example checklist tool the data
reviewer may find helpful for documenting the rationale used to determine data usability.
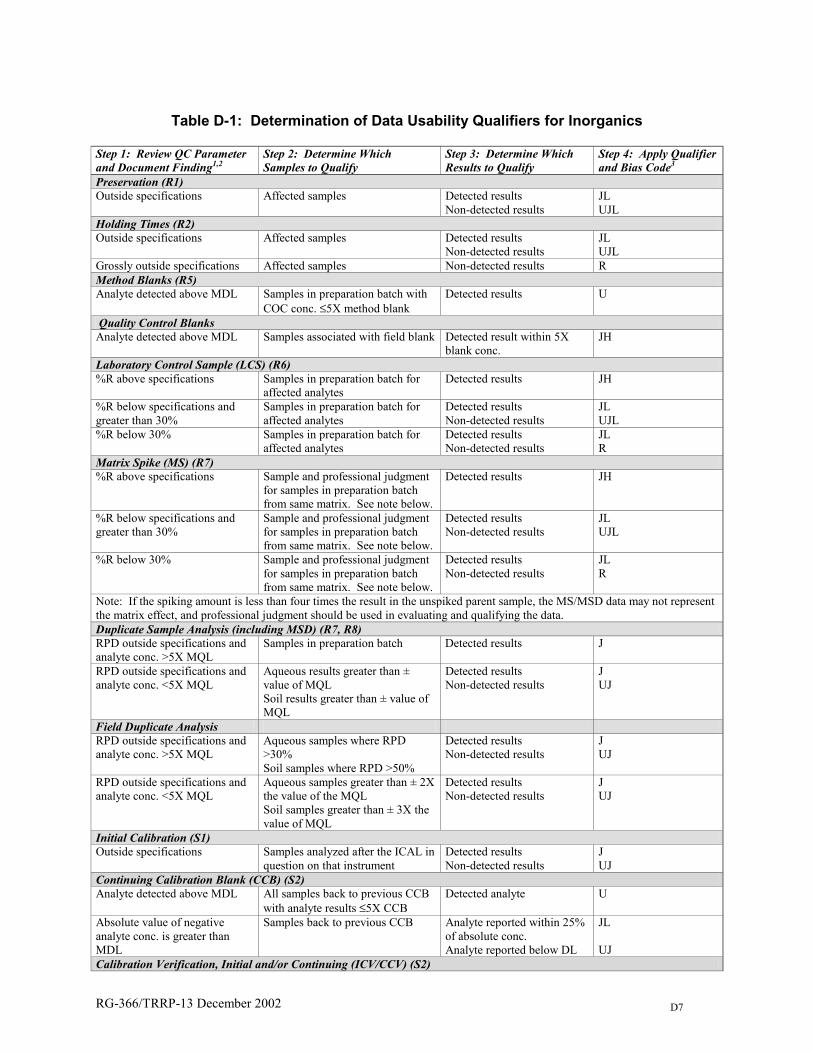
RG-366/TRRP-13 December 2002 D7
Table D-1: Determination of Data Usability Qualifiers for Inorganics Step 1: Review QC Parameter and Document Finding1,2
Step 2: Determine Which Samples to Qualify
Step 3: Determine Which Results to Qualify
Step 4: Apply Qualifier and Bias Code3
Preservation (R1) Outside specifications Affected samples Detected results
Non-detected results JL UJL
Holding Times (R2) Outside specifications Affected samples Detected results
Non-detected results JL UJL
Grossly outside specifications Affected samples Non-detected results R Method Blanks (R5) Analyte detected above MDL Samples in preparation batch with
COC conc. ≤5X method blank Detected results U
Quality Control Blanks Analyte detected above MDL Samples associated with field blank Detected result within 5X
blank conc. JH
Laboratory Control Sample (LCS) (R6) %R above specifications Samples in preparation batch for
affected analytes Detected results JH
%R below specifications and greater than 30%
Samples in preparation batch for affected analytes
Detected results Non-detected results
JL UJL
%R below 30% Samples in preparation batch for affected analytes
Detected results Non-detected results
JL R
Matrix Spike (MS) (R7) %R above specifications Sample and professional judgment
for samples in preparation batch from same matrix. See note below.
Detected results JH
%R below specifications and greater than 30%
Sample and professional judgment for samples in preparation batch from same matrix. See note below.
Detected results Non-detected results
JL UJL
%R below 30% Sample and professional judgment for samples in preparation batch from same matrix. See note below.
Detected results Non-detected results
JL R
Note: If the spiking amount is less than four times the result in the unspiked parent sample, the MS/MSD data may not represent the matrix effect, and professional judgment should be used in evaluating and qualifying the data. Duplicate Sample Analysis (including MSD) (R7, R8) RPD outside specifications and analyte conc. >5X MQL
Samples in preparation batch Detected results J
RPD outside specifications and analyte conc. <5X MQL
Aqueous results greater than ± value of MQL Soil results greater than ± value of MQL
Detected results Non-detected results
J UJ
Field Duplicate Analysis RPD outside specifications and analyte conc. >5X MQL
Aqueous samples where RPD >30% Soil samples where RPD >50%
Detected results Non-detected results
J UJ
RPD outside specifications and analyte conc. <5X MQL
Aqueous samples greater than ± 2X the value of the MQL Soil samples greater than ± 3X the value of MQL
Detected results Non-detected results
J UJ
Initial Calibration (S1) Outside specifications Samples analyzed after the ICAL in
question on that instrument Detected results Non-detected results
J UJ
Continuing Calibration Blank (CCB) (S2) Analyte detected above MDL All samples back to previous CCB
with analyte results ≤5X CCB Detected analyte U
Absolute value of negative analyte conc. is greater than MDL
Samples back to previous CCB Analyte reported within 25% of absolute conc. Analyte reported below DL
JL UJ
Calibration Verification, Initial and/or Continuing (ICV/CCV) (S2)

RG-366/TRRP-13 December 2002 D8
Step 1: Review QC Parameter and Document Finding1,2
Step 2: Determine Which Samples to Qualify
Step 3: Determine Which Results to Qualify
Step 4: Apply Qualifier and Bias Code3
Outside specifications All samples back to last acceptable ICV/CCV
Detected results Non-detected results
J UJ
Internal Standards (S4) Above specifications Affected samples Detected results J Below specifications Affected samples Detected results
Non-detected results J UJ
Interference Check Standard (ICS) (S8) %R is above specifications Samples in analytical batch Detected results JH %R is below specifications Samples in analytical batch Detected results
Non-detected results JL ULJ
Serial Dilution Analysis (S9) Outside specifications (generally %D ±30%)
Samples in analytical batch with results > 50X the DL
Detected results J
Post Digestion Spike Analysis (S9) Outside QC criteria (generally 70 – 130%)
Samples and professional judgment in preparation batch from same matrix
Detected results Non-detected results
J UJ
If MSA is performed and r>0.995
Samples in analytical batch No qualification necessary
%R greater than specifications Samples in analytical batch Detected results JH %R less than specifications but greater than 30%
Samples in analytical batch Detected results Non-detected results
JL UJL
%R less than specifications but less than 30%
Samples in analytical batch Detected results Non-detected results
JL R
Method of Standard Additions (MSA) (S9) r<0.995 Samples in analytical batch Detected results
Non-detected results J UJ
Anion / Cation Balance Outside specifications No qualification required; however, data should be reviewed thoroughly and problem
documented. Total/Dissolved Metals Total < dissolved conc. Qualification may or may not be needed. Data should be reviewed thoroughly, qualified as
necessary, and problem documented. General Analytical Relationships Total conc of analyte < conc of a subset of the analyte (e.g., [Total Cr ]< [Cr+6])
Qualification of results may or may not be needed; Data should be reviewed thoroughly, qualified as necessary, and problem documented.
1 From highest to lowest preference, the data reviewer should compare the reportable data to one of the following sets of criteria: a. the project specific criteria, which should meet or be more stringent than the program criteria; b. the program specific criteria; and c. in the absence of 1. and 2, the data usability reviewer should provide the review criteria and the rationale for qualifying
the data. The data usability reviewer should consult the Assessment Planning guidance (RG-366/TRRP-6) on how to set the review criteria. Typically, for inorganic analytes, percent recoveries between 70% and 130%, but not less than 30%, and relative percent differences within 30% are acceptable. However, the intended use of the data must be carefully considered before using these default ranges as data objectives for a project. 2 "R#s" and "S#s" refer to Laboratory Review Checklist elements defined in Appendix A. 3 Definitions: U = Not Detected R = Rejected J = Estimated Value H = Biased High 4 Abbreviations: L = Biased Low conc. = concentration

RG-366/TRRP-13 December 2002 D9
Table D-2: Determination of Data Usability Qualifiers for Organics Step 1: Review QC Parameter and Document Finding1,2
Step 2: Determine Which Samples to Qualify
Step 3: Determine Which Results to Qualify
Step 4: Apply Qualifier and Bias Code3
Preservation (R1) Outside specifications Affected samples Detected results
Non-detected results JL UJL
Holding Times (R2) Outside specifications Affected samples Detected results
Non-detected results JL UJL
Grossly outside specifications Affected samples Non-detected results R Surrogate Spikes (R5) %R above specifications for i) more than 1 compound in method with multiple spike compounds or ii) 2 or more acid or 2 or more base compounds.
Each sample Detected results JH
%R below specifications but >10% for i) more than 1 compound in method with multiple spike compounds or ii) 2 or more acid or 2 or more base compounds.
Each sample Detected results Non-detected results
JL UJL
%R <10% for i) more than 1 compound in method with multiple spike compounds or ii) 2 or more acid or 2 or more base compounds.
Each sample Detected results Non-detected results
JL R
%R outside specifications for two or more surrogates in more than one direction
Each sample Detected results Non-detected results
J UJ
Laboratory Blanks (R5) Analyte present above MDL Samples in preparation batch with
analyte conc. ≤5X MB conc. except methylene chloride, acetone, 2-butanone, cyclohexane, and phthalates which may be <10x MB conc.
Detected results U
Field QC Blanks (FB) Analyte present above MDL Samples associated with field blank
with analyte conc. ≤5X MB conc. except methylene chloride, acetone, 2-butanone, cyclohexane, and phthalates which may be <10x MB conc.
Detected results U
Laboratory Control Sample (LCS) (R6) %R above specifications Samples in preparation batch Detected results JH %R below specifications and greater than 10%
Samples in preparation batch Detected results Non-detected results
JL UJL
%R below 10% Samples in preparation batch Detected results Non-detected results
JL R

RG-366/TRRP-13 December 2002 D10
Table D-2: Determination of Data Usability Qualifiers for Organics (continued) Step 1: Review QC Parameter and Document Finding1,2
Step 2: Determine Which Samples to Qualify
Step 3: Determine Which Results to Qualify
Step 4: Apply Qualifier and Bias Code3
Matrix Spike (MS) (R7) %R above specifications Sample and professional judgment
for samples in preparation batch from same matrix, See note below.
Detected results JH
%R below specifications and greater than 10%
Sample and professional judgment for samples in preparation batch from same matrix, See note below.
Detected results Non-detected results
JL UJ
%R below10% Sample and professional judgment for samples in preparation batch from same matrix, See note below.
Detected results Non-detected results
JL R
Note: If the spiking amount is less than four times the result in the unspiked parent sample, the MS/MSD data may not represent the matrix effect, and professional judgment should be used in evaluating and qualifying the data. Duplicate Sample Analysis (including MSD) (R7, R8) RPD outside specifications and result >5X MQL
Samples in preparation batch Detected results J
RPD outside specifications and results < 5X MQL
Aqueous results greater than ± value of MQL Soil results greater than ± value of MQL
Detected results Non-detected results
J UJ
Field Duplicate Analysis RPD outside specifications and analyte conc. >5X MQL
Aqueous samples where RPD >30% Soil samples where RPD >50%
Detected results Non-detected results
J UJ
RPD outside specifications and analyte conc. <5X MQL
Aqueous results greater than ±2X the value of MQL Soil results greater than ±3X value of MQL
Detected results Non-detected results
J UJ
Initial Calibration (S1) Outside specifications Samples analyzed after the ICAL in
question on that instrument Detected results Non-detected results
J UJ
Initial and/or Continuing Calibration Verification (ICV/CCV) (S2) Outside specifications Samples associated with ICV/CCV Detected results
Non-detected results J UJ
Internal Standard Area Counts (S4) Above specifications Affected samples Detected results JL Below specifications Affected samples Detected results
Non-detected results JH UJ
Dual Column Confirmation (S6) Results agree > 40% and co-elution suspected
Each sample Select lower result. J
Not performed Each sample Detected results NJ Note: Where historical data, such as groundwater monitoring data, have documented the presence of analyte, second column confirmation may not be warranted during routine monitoring analyses. Tentatively Identified Compounds (S7) (if requested) TIC analysis performed. All reported TICs Detected results NJ 1 From highest to lowest preference, the data reviewer should compare the reportable data to one of the following sets of criteria: 1. the project specific criteria which should be equal to or more stringent than the program criteria; 2. the program specific criteria; and 3. in the absence of 1 and 2, the data usability reviewer should provide the review criteria and the rationale for qualifying the
data. The data usability reviewer should consult the Assessment Planning guidance (RG-366/TRRP-6) on how to set the review criteria. Typically, for organic analytes, percent recoveries between 60% and 140%, but not less than 10%, and relative percent differences within 40% are acceptable. However, the intended use of the data must be carefully considered before using these default ranges as data objectives for a project.
2 "R#s" and "S#s" refer to Laboratory Review Checklist elements defined in Appendix A. 3 Definitions: U = Not Detected R = Rejected N = Presumed present J = Estimated Value H = Biased High L = Biased Low 4 Abbreviations: conc. = concentration