Tcchnical Senctary -KATARZYNA SZTYLIŃSKA Proof-rcadcr ...
255
The journal is partially supported by the Ministry of Scientific Research and Jnformation Technology Tcchnical Senctary Proof-rcadcr Editorial Officc Publishcr -KATARZYNA -HALINA MARCINIAK -lnstitute ofPhysics, Wroclaw University ofTechnology, Wyspial'lskiego 27, 50-370 Wroclaw, Poland University ofTechnology, Wyspial'lskiego 27, 50-370 Poland [email protected] www.if.pwr .wroc.plroptappl te l. 48 7 I-320-23-93 fax 48 7 I-328-36-96 Optica App/icata has been pub lished s ince I 971 in a non-periodical form. Starting from 1973 it is published quarterly. Thc Editorial 13oard invitcs the rcadcr s to send over any rcmarks or obscrvations rcf"crring to thc publicalians which w ill a ppc ar in th e Oplica App /ica/a. Th e correspondcncc of esscntial importancc will be publishcd in a se paratc co lumn dcaling with Lellers lo !h e Editor. Rcview o f matter Diffraction thcory and it s application , quantum optics, in radialian cohcrcncc, li ght so urces, holo grap hy and its application, scicntific photography, mcthods of im age reconstruction , oplical application of Fotu·ier transfor m, thcory of oplical systcms, critcria of oplical image cvaluation, oplical material s, tcchnology of manufacturing oplical elemcnts, asphcric optic s, oplical propcrtics o f so lid s and thin films, la sc rs and thcir application, photo- and radiometry, probletns in s pcctroscopy, nonlincar optics, oplical data processing, oplical mcasurcmcnts , fibre optics, oplical instrumentation , interferometry, micros copy, non-visible op tics, automalian of oplical computing, optoclcctronics, colorimctry, oplical dctectors , ellipsametry and photoe lasticity, oplical modulation , optics of elcetron bcams, biooptic s, opto metry. A11icl e and iss uc pho tocopics o f this journal arc availablc through Univcrsity Microfilms International, 300 Nort h Zccb Road, Ann Arbor, Michi gan 48106 -1 346, USA. © Copyright by Oficyna Wydawnicza rolitechniki 20 l O Drubmia Ofi cyny Wydawniczej rolitechniki Wroclawskiej. Zam. nr 664/20 1 O.
Transcript of Tcchnical Senctary -KATARZYNA SZTYLIŃSKA Proof-rcadcr ...

The journal is partially supported by the Ministry of Scientific Research and Jnformation Technology
Tcchnical Senctary Proof-rcadcr Editorial Officc
Publishcr
-KATARZYNA SZTYLIŃSKA -HALINA MARCINIAK -lnstitute ofPhysics, Wroclaw University ofTechnology, Wybrzeże Wyspial'lskiego 27, 50-370 Wroclaw, Poland
-Wrocław University ofTechnology, Wybrzeże Wyspial'lskiego 27, 50-370 Wrocław, Poland Optica.Applicata@ pwr.wroc.pl www.if.pwr.wroc.plroptappl te l. 48 7 I -320-23-93 fax 48 7 I -328-36-96
Optica App/icata h as been pub l ished s ince I 971 in a non-periodical form. Starting from 1973 it is published quarterly.
Thc Edit orial 13oard inv itcs the rcadcrs to send over any rcmarks or obscrvations rcf"crring to thc publicalians which w ill appcar in the Oplica App/ica/a. The correspondcncc of esscntial importancc will be publishcd in a separatc co lumn dcaling with Lellers lo !he Editor.
Rcview o f matter
Diffraction thcory and its application, quantum optics, probłetns in radialian cohcrcncc, li ght sources, holography and its application, scicntific photography, mcthods of image reconstruction, oplical application of Fotu·ier transform, thcory of oplical systcms, critcria of oplical image cvaluation, oplical material s, tcchn ology of manufacturing oplical elemcnts, asphcric optics, oplical propcrtics o f so lid s and thin film s, lascrs and thcir application, photo- and radiometry, probletns in spcctroscopy, nonlincar optics, oplical data processing, oplical mcasurcmcnts, fibre optics, oplical instrumentation, interferometry, microscopy, non-v isible optics, automalian of oplical computing, optoclcctronics, co lo rimctry, oplical dctectors, ellipsametry and photoelasticity, oplical modulation, optics of elcetron bcams, biooptics, optometry.
A11icle and issuc photocopics o f this journal arc avai lablc throu gh Univcrsity Microfilms Internati ona l, 300 Nort h Zccb Road, An n A rbor, Michigan 48106-1 346, USA.
© Copyright by Oficyna Wydawnicza rolitechniki Wrocławskiej , Wrocław 20 l O
Drubmia Ofi cyny Wydawniczej rolitechniki Wroclawskiej . Zam. nr 664/20 1 O.

OPTICA APPLICATA
HONORARY Eon·on IN CHIEF
Eon·on IN CHIEf'
VtcE-Eorron
EDITING COUNSELLOn
TOPICAL EDITORS
KRZYSZTOF ABRAMSKI, Wrocław University ojTechnology, Pafand
TADEUSZ PUSTELNY, Silesian University ojTechnology, Gliwice, Poland
TOMASZ SZOPLIK, Warsaw University, Poland
H EN RYK KASPRZAK, Wrocław University ojTechnology, Poland
EwA WEINERT-RĄCZKA, Szczecin University ojTechnology, Poland
INTERNATIONAL ADVISORY BOARD
Thc quartcrly o f thc lnstitutc o f Physics Wrocław Univcrsity ofTcchnology, Poland
PL ISSN 0078 -5466 lndcx 367729
MIRON GAJ
W ACLA w URBAŃCZYK AGNI ESZKA POPIOŁEK-MASAJADA
IR ENEUSZ WILK
Fiber optics and optical communication, spectroscopy, lasers and their applications
Integrated optics, acoustooptics, microoptics, oplical inslrumenlation, optical measurements, oplical sensing
Nanooplics, plasmonics, oplical imaging, optical computing, optical data storage and processing
Holography, diffraction and gratings, biooptics, merlical optics, optometry, optical imaging, Fourier optics
Nonlinear optics, oplical waveguides, photonic crystals
0LEG V. ANGELSKY, Chernivlsy University, Ukraine Y ASUHIKO A RAKA W A, The University oj Tokyo, Japa n IvAN GLESK, University ojStrathclyde, UK CHRISTOPH E GORECKI, FEMTO-ST, Besam;:on, France ROMAN S. ING ARDEN, Nicolaus Copernicus University, Torw1, Poland EUGENIUSZ JAGOSZEWSKI (Chairman), Wrocław University ojTechnology, Poland ROMUALD JÓŹWICKI, Warsaw University ojTechnology, Poland FRANCISZEK KACZMAREK, Adam Mickiewicz University, Poznań, Poland BoLESLA w KĘDZIA, Poznań University oj Medical Sciences, Poland MAŁGORZATA KUJA WIŃSKA, Warsaw University ojTechnology, Poland NoRB ERT LINDLEIN, University oj Erlangen - Niirnberg, Germany MIROSLAV MILER, lnslitute oj Photonics and Electronics of t he ASCR, v. v.i., Prague, Czech Republic JAN MISIEWICZ, Wrocław University ofTechnology, Poland WLODZIMIERZ NAKWASKI, Technical University o f Łódź, Poland WoLFGANG OSTEN, Universitiit Stuttgart, Germany JAN PER IN A, Palackj University, 0/omouc, Czech Republic BARBARA PIERŚCIONEK, University of Ulster, UK Co u N SHEPP ARD, National University oj Singapore CoNCITA SIBILlA, Universita di Roma "La Sapienza", Italy TADEUSZ ST ACEWICZ, University oj Warsaw, Poland TOMASZ WOLIŃSKI, Warsaw University ofTechnology, Pafand JAN WÓJCIK, Maria Curie-Skłodowska University in Lublin, Poland PAVEL ZEMANEK, lnslitute oj Scientific lnstruments oj the ASCR, v.v. i., Brno, Czech Republic

This issue o f Optica Applicata has been in partfi.nancially supported by t he Offi.ce o f Naval Research GZobal
(grant N62909-09-1-1095)

OPTICA APPLICATA
Contents
Porous glasses
High porosity materia/s as volumetric receivers for sol ar energetics
Vol. XL (2010) No. 2
T . F END . . . . . . . . . . . . . . . . . . . . . . . . . . . . . . . . . . . . . . . . . . . . . . . . . . . . . . . . . . . . . . . . . 271
The influence o f thermal treatment o f t he porous g las s piat es on t he character o f their scattering in visible spectra/ region T.V. ANTROPOYA, l.N. ANFIMOVA . . . . . . . . . . . . . . . . . . . . . . . . . . . . . . . . . . . . . . . . . . . . . 285
App/ication o f high resolution microscopy and oplical spectrascapy for study ofphase separation in phosphorus- andjluorine-containing sodium borosilicale g lasses T .V . ANTROPOVA, l. DROZDOVA, J. K UKHTEVICH, A. EVSTRAPOV, N. ESIKOVA . . . . . . . . . . . . 293
Effect ofrestricted geometry on struciurai phase trans itians in KH2P04 and NH4H 2P04 ctystals V. TARNAVICH, L. KoROTKov, O. KARAEVA, A . NAB EREZHNOv, E. RYSIAKJEWI CZ-PASEK . . . . 305
Aggregation o f dyes in porous g lass O.V. TYURIN, Y.M. BERCOV, S .O. ZHUKOV, T.F. LEVITSKAYA, S.A. G EVELY UK, I.K. DOYCHO,
E. RYSIAKJ EWI CZ-PASEK . . . . . . . . . . . . . . . . . . . . . . . . . . . . . . . . . . . . . . . . . . . . . . . . . . . . . 311
Photoluminescencefeatures of AgBr nanoparticlesformed in porous glass matrices l. K. DOYCHO, S.A. G EVELY UK, 0 .0. PTASHCHEN KO, E. RYSIAKI EW JCZ-PASEK, T.M. TOLMACHOVA,
O.V. TYURIN, S.O. ZHUKOV . . . . . . . . . . . . . . . . . . . . . . . . . . . . . . . . . . . . . . . . . . . . . . . . . . 323
Porous glasses as a substratefor sensor elements A. EvsTRAPOV, N. ESIKOVA, G. R uDN ITSKA Y A, T.V. ANTROPOVA . . . . . . . . . . . . . . . . . . . . . . 333
Determination of electrokinetic potential of porous g lasses by methods of streaming potential, electroosmosis and electrophoresis A. V OLKOVA , L. ERMAKOVA , M. VOLKOVA, T.V. ANTROPOYA . . . . . . . . . . . . . . . . . . . . . . . . 341
Special glasses
Influence o f PbX2 (X = F, CI, 81) eontent and thermaltreatment on structure and oplical properties o f lead borale g lasses doped wit h rare earth ions J . PISARSKA, R . LISIECKI, G. D OMI NJAK-DZ IK, W. RYBA-ROMANOWSKI, T. GORYCZKA,
Ł. GROBELN Y, W.A. PISARSKI . . . . . . . . . . . . . . . . . . . . . . . . . . . . . . . . . . . . . . . . . . . . . • . . . 351
The effect of woj - group in xerogels doped with Ln2 - xPrJW04JJ where Ln = La, Cd B . GROB ELNA, P. BOJARSKI . . . . . . . . . . . . . . . . . . . . . . . . . . . . . . . . . . . . . . . . . . . . . . . . . . . 359
Borale g lasses with PbO and PbC/2 containing Dy 3+ ions J. PISARSKA . . . . . . . . . . . . . . . . . . . . . . . . . . . . . . . . . . . . . . . . . . . . . . . . . . . . . . . . . . . . . . 367
Thermaltreatment e.ffect on dynamics o.f luminescent states in ox.yfluoride g lass-ceramics doped with Pr3+ and Tb3+
G . DOMJ NIAK-DZIK , B. KLIM ESZ, w. R YBA-ROMANOWSK I . . . . . . . • . . . . . • . . . . . . . . . . . . . . 375

268
Hybrid materia/s doped with lithium ions E . ŻELAZOWSKA, E. RYSIAKIEWICZ-P ASEK 383
Oplical properties oj smal/ silver partie/es embedded in soda-lime silica g lasses M. SuszvŃSKA, T. MORAWSKA-KowAL, L. KRAJCZYK . . . . . . . . . . . . . . . . . . . . . . . . . . . . . . . 397
Biocompatible g lass compasile system - some physical-mechanical properties oj the g lass compasile matrix system B . STANIEWI CZ-BRUDNIK, M. LEKKA, L. JAWORSKA, W. WILK . . . . . . . . . . . . . . . . . . . . . . . . . 403
Synthe.sis and optical .spectroscopy ofthe E u- and Pr-doped glasses wit h Sr0- 2B 20 3 compos ition B. PADLYAK, M. GRJNB ERG, B . KuKLIŃSKI, Y. OsELEDCHIK, O. SMYRNov, D. K uDRYAVTCEV,
A . PROSVIR NIN . . . . . . . . . . . . . . . . . . . . . . . . . . . . . . . . . . . . . . . . . . . . . . . . . . . . . . . . . . . . . 413
Oplical spectra and luminescence kinetics ojthe Sm 3+ and Yb 3+ centres in the lithium tetraborale g lasses B. P ADLYAK, W. RYBA-R OMANOWSKI, R . LISI ECKI, V. ADAMIV, Y. BURAK, l. T ESLYUK,
A. BANASZAK-PI ECHOWSKA . . . . . . . . . . . . . . . . . . . . . . . . . . . . . . . . . . . . . . . . . . . . . . . . . . . 427
The influence o.f nanoc1ystallization process on !herma/ and oplical parameter in oxy.fluoride g lasses J. JAGLARZ, M. REB EN . . . . . . . . . . . . . . . . • . . . . . . . . . • . . . . . . . . . • . . . . . . . . . . . . . . . . . . 439
Interferometry
Stabilized detection scheme oj surface acoustic waves by Miche/san interjerometer 0. MOKRYY, V . KOSHOVYY, J. R OMANYSHYN, R. SilARAMAGA . . . . . . . . . . . . . . . . . . . . . . . . . 449
Oplical correlation techniquejor cement particie s ize measurements M.P. GORSKY, P .P . MAKSIMY AK, A .P. M AKS IMY AK . . . . . . . . . . . . . . • . . . . . . . . . • . . . . . . . . 459
Photodetectors
Jnvestigation and analysis oj time response in Geiger mode avalanche photodiode M. DEHGHAN, V. AHMADI, E. DARABI . . . . . . . . . . . . . . . . . . . . . . . . . . . . . . . . . . . . . . . . . . . 471
Nonlinear optics
Higher-order s pace charge field effects on t he self-dąflection oj bright screening spatial solitons in two-photon photorefractive crystals Q. JIANG, Y. S u, X. J1 . . . . . . . . . . . . . . . . . . . . . • . . . . . . . . . • . . . . . . . . . . . . . . • . . . . . . . . 481
Light difraction
Extraordinmy oplical transmission by interference oj diffracted wavelets R . K UMAR . . . . . . . . . . . . . . . . . . . . . . . . . . . . . . . . . . . . . . . . . . . . . . . . . . • . . . . • . . . . . . . . 491
Ellipsometry
A polynomial approach for re.flection, lransmission, and el/ipsometric parameters by isotropie stratifled media T. EL-AGEZ, S. TAYA , A . EL TAYYAN . . . . • . . . . . . . . • . . . . . . . . . . . . . . . . . . . . . . . . . . . . . 501

269
Optical communication
Optimization o.f a FBG-basedjiltering module .for a 40Gb/s OSSB transmission system M .V . DRUMMOND, A. f ERREIRA, T. SILYEIRA, D. FONSECA, R.N . N OGUEIRA , P. M ONTEIRO 5 11
Electron spectroscopy
Theoretical analysis o.f electro-optical characteristics o.f the modified three cylindrical mit-ror analyzer S. KLEIN, S. KA szczvszvN, A. GRzEszczA K, P. Kości ELN IAK . . . . . . . • . . . . . . • . . . . . . . . . . 521

Optica Applicata, Vol. XL, No. 2, 2010
High porosity materials as volumetric receivers for solar energetics
THOMAS FEND
German Aerospace Center, Institute of Technical Thermodynamics, Solar Technology Department, Linder Hoehe, 51143 Köln, Germany; e-mail: [email protected]
This paper gives a brief overview on the research activities of the Solar Technology Departmentof the German Aerospace Center on porous materials for solar tower technology. Firstly, a briefintroduction to solar tower technology is given. Then, the function of the central component oftower technology, the volumetric air receiver, is described in detail and examples as well asexperimental results of receiver tests are given. Results of numerical studies are presented, whichhave been carried out to characterize air flow stability in receiver systems. Approaches presentlyused to model the interior temperatures of the receiver are described. Next spin-off applicationssuch as particle filters or cooling systems are presented, which are dominated by similar physicalphenomena and which can be treated with the same experimental and numerical methods. Finally,information is given about the Jülich Solar Tower, which is the first test power station that makesuse of the solar air receiver technology.
Keywords: solar tower technology, porous materials, volumetric air receiver, concentrating solar power.
1. Introduction
Solar tower technology is a promising way to generate large amounts of electricityfrom concentrated solar power in countries with high solar resources such as NorthAfrica and the Middle East, India, Australia or parts of North and South America,countries known to belong to the so-called “sun-belt” of the Earth.
The concentrated radiation is generated by a large number of controlled mirrors(heliostats), each of which redirects the solar radiation onto the receiver as a commontarget on the top of a tower. Here, at the focal point the so-called “solar air receiver”is located, which absorbs the radiation and converts it into high temperature heat.Cellular high temperature resistant materials are used as receivers. As a heat transfermedium air is used, which is heated up by flowing through the open cells of the hotreceiver material and which then feeds a conventional boiler of a steam turbine.
As an example, a 3 MW solar tower test plant in Almería, Spain, as well as a sketchof the working principle are shown in Fig. 1. A typical flow chart is shown inFig. 2. This idea of the “solar air receiver” was first presented in 1985 [1]. Since then,

272 T. FEND
Fig. 1. Solar tower technology: photograph of the CESA 1 test plant in Almería, Spain (a) and workingprinciple (b).
Fig. 2. Flow chart of a steam turbine driven by solar tower technology.
a
b

High porosity materials as volumetric receivers for solar energetics 273
the technology has been successfully proven in a number of projects during the last25 years [2–4]. A ceramic receiver with a thermal power of 3 MW was successfullytested by a European consortium in 2002 and 2003 within the SOLAIR-project [5].Recently, a 1.5 MWE
1 test plant was erected in Jülich, Germany, which is the firstplant connected to the grid equipped with a solar air receiver [6]. A detailed descriptionof the solar air technology is provided in [7].
2. The solar air receiver
The solar air receiver is often also called volumetric air receiver, because due tothe porosity of the material the concentrated solar radiation is absorbed in part ofthe volume of the material. Its principle is illustrated in Fig. 3. A simple tubularabsorber is shown for comparison. Because cold ambient air enters the material atthe front of the volumetric absorber, where it is facing the radiation, the material canbe kept relatively cool. In an ideal operation, the temperature distribution should beas shown on the lower right-hand side of Fig. 3. The low temperature level at the frontminimizes thermal radiation losses.
Reaching the inner absorber volume the temperature increases and the temperaturedifference between fluid and solid vanishes. Usually, this is already the case aftera couple of cell diameters, for example, in the case of an 80 ppi2 ceramic foam after1–2 millimetres. In contrast to this increasing temperature distribution from the inletto the outlet of the absorber module in the case of an ideal volumetric absorberthe temperature distribution of a simple tubular absorber is disadvantageous. This isshown in the graph on the lower left-hand side of Fig. 3.
1Megawatt electrical power.2The unit ppi (pores per inch) is a measure of the pore density of a foam.
Fig. 3. The volumetric receiver principlecompared to a tube receiver.
274 T. FEND
Here, the fluid which has to be heated flows inside a tube. The solar radiation heatsthe tube which in turn heats the fluid. The temperature at the outer tube surface issignificantly higher, leading to higher radiation losses. The temperature at the outertube surface is limited by the temperature resistance of the material employed. Toavoid destruction of the tube material, the intensity of the concentrated radiation mustbe kept low compared to volumetric absorbers. This makes it necessary to install largerabsorber apertures to achieve similar amounts of total power.
The material requirements of volumetric absorbers are resistance to temperaturesof 1000 °C and more and a high porosity needed to allow the concentrated solarradiation to penetrate into the volume of the cellular material. Further requirementsare a high cell density to achieve large surface areas necessary to transfer heat fromthe material to the gaseous fluid flowing through the channels and a high thermalconductivity. Even though the extinction volume, that is, the volume of the receiver,in which the solar radiation is absorbed, decreases with smaller cell size, the increasedsurface area and the increase of heat transfer by smaller hydraulic diameters leads tothe desire for structures with cells as small as possible.
3. Results of solar air receiver experiments
Within several recent projects the performance of solar air receivers has been testedexperimentally. The most interesting quantity of solar air receivers is their solar-to--thermal efficiency
It may be calculated by dividing the useful thermal power inside the air circuit afterthe receiver by the power of the concentrated solar radiation penetrating intothe aperture area of the absorber POA (power-on-aperture). is usually determinedwith the temperature difference, the air mass flow and the heat capacity:
The experiments were carried out in a 20 kW solar installation capable to generateconcentrated radiation of up to 5 MW/m2 peak flux. Figure 4 shows the principle ofthe set-up used for efficiency measurements. Figure 5 shows examples of materialstested: a fiber mesh material, which is commercially available from SCHOTT underthe name Ceramat (fiber ∅ = 25 μm), the HITREC-material, a siliconized siliconcarbide (SiSiC) catalyst carrier with parallel channels of approximately 2 mm in widthmade by Saint-Gobain, a 20 ppi SiC foam and an 80 ppi/20 ppi SiC sandwich-likefoam with the 80 ppi layer at the front being responsible for absorption and heattransfer, both made by the Fraunhofer Institute for Ceramic Technologies (IKTS).
η Q· air
POA-----------------=
Q· airQ· air
Q· air m· CPL Tout T0–( )=

High porosity materials as volumetric receivers for solar energetics 275
The results are shown in Figs. 6 and 7. The best performance was achieved bythe fiber mesh absorber and by the 80 ppi foam. This indicates that at a given level offlux density the efficiency increases with increasing cell density. However, the HITREC--material was the material of choice for the modular receiver in the SOLAIR-project(Fig. 8) to be tested in a 3 MWth
3 scale although it has shown limited efficiency results(Fig. 6) compared to the fiber mesh or the 80 ppi foam. The reason for that was a higherreliability as far as corrosion resistance and durability are concerned.
Some other materials did not withstand the high temperature exposure duringthe tests. This happened although the mean air outlet temperature was significantlylower than the allowed temperature for the material. As an example, a cordierite
3Megawatt thermal power.
Fig. 4. Set-up used for efficiency measurements.
Fig. 5. Examples of porous materials tested as solar air receivers.
Foam 80/20 ppi
Foam 20 ppiHitrec
Advancedfiber material

276 T. FEND
Fig. 6. Results of efficiency test of a receiver made out of silicon carbide (SiC) catalyst carrier material(HITREC) and a combined receiver additionally covered with an SiC fiber mesh material.
Fig. 7. Results of efficiency test of an SiC 20 ppi foam receiver and a combined receiver additionallycovered with an 80 ppi SiC foam.
Fig. 8. Solar air receiver test within the European project SOLAIR. Each of the 150 mm HITREC modulesabsorbs 15–20 kW of solar power (left); photographs show a cordierite material before (middle) and afterbeing tested as a solar air receiver in concentrated radiation (I0 ≈ 2 MW/m2).

High porosity materials as volumetric receivers for solar energetics 277
receiver melted, when the air outlet temperature was 900 °C, although the meltingtemperature of cordierite is 1450 °C (Fig. 8, right).
This effect is mainly due to flow instabilities, which have to do with the temperaturedependent viscosity of air, which increases with increasing temperature. If there aretemperature inhomogeneities at the front side of the receiver hot parts of the receiverhave a lower permeability due to the more viscous air in these channels. Consequently,this kind of self-reinforcing effect may lead to hot spots and a material failure insevere cases. The occurrence of flow instabilities has been investigated in moredetail in a recent study [8]. It turned out that a number of measures are efficient toprevent the occurrence of hot spots. These are a good thermal conductivity inthe direction perpendicular to the main direction of flow, a high inertial coefficientin the Darcy–Forchheimer equation describing the pressure loss inside the porousmaterial and the capability of the materials to allow fluid flow perpendicular tothe main direction of flow (mixing). This last property is especially fulfilled forceramic foams.
4. Numerical prediction of gas flow and temperature distributionsA sophisticated way to describe the problem in Fig. 9 is a numerical approach, whichhas been carried out by a research group at the University of Erlangen withinthe common project SOLPOR [14]. This approach provides a numerical solution ofthe basic conservation equations of mass, momentum and energy in a number ofdistinct control volumes. The heat transport in the porous material, which is composedout of heat conduction in the solid, grid, heat conduction in the fluid and heatconduction by mixing effects, is described by an effective heat conductivity, whichhas to be determined experimentally. The experimental method as well as data ofvarious porous materials have been published by DECKER et al. [10]. The numericalmethod is described in more detail in an earlier publication by BECKER et al. [8]. Asthe method is a two phase calculation, solid-to-fluid heat transfer has to be treatedas a separate physical quantity. A transient technique has been employed todetermine this quantity for porous materials. It is described in more detail in [11].An overview on experimental data of a number of various porous materials is given
Fig. 9. Flow problem through a heated porous medium with Pout < P0.

278 T. FEND
in [12]. As an example, heat transfer data of a series of silicon carbide foams is shownin Fig. 10.
Performing a detailed numerical study as roughly described in the last paragraphenables us not only to show a rough tendency how certain properties influencethe probability of hot spots but also to generate two dimensional distributions ofthe front temperature of the porous sample. Such an investigation has been carried outwithin the German SOLPOR-project by researchers from the University of Erlangen.It is described in more detail in [8]. They considered the situation shown in Fig. 9and assumed a cylindrical geometry. The external radiant heat source of 1 MW/m2,a typical value for a solar tower installation, was assumed to be absorbed in somethin layers of the porous body corresponding to the extinction coefficient ofthe material employed. It was further assumed that the heat flux is homogeneouslydistributed on the circular front of the sample. The resulting flow and temperaturedistribution were calculated. To study possible flow instabilities a “static hot spot”was created by using a small area of higher flux as starting conditions. After a whilethe flux was switched to homogenous flux but the temperature calculation continued.Depending on the material properties, the hot spot maintained or it vanished. In thisway, a parameter study was performed and it could be observed at which levels ofthermal conductivity and inertial coefficient flow instabilities occurred. An exampleis shown in Fig. 11. On the horizontal axis the inertial coefficient was varied, onthe vertical axis, the thermal conductivity. For K2 < 1×10⁻⁴ no hot spots could beobserved. Also for materials with a flow, which is completely dominated by viscousflow (K2 = ∞) the probability for hot spots vanishes, if the effective thermalconductivity is high enough (>10 Wm–1K–1). By varying three parameters and lookingfor permanent hot spots, a detailed parameter field could be determined, in which nohot spots can occur.
The results confirm the experimental results, which were obtained from a test withthe cordierite catalyst carrier material already mentioned in Section 3. Here the sample
Fig. 10. Volumetric heat transfer data determined for a set of ceramic foam materials. (Various porediameters were investigated.)

High porosity materials as volumetric receivers for solar energetics 279
melted although the average air outlet temperature was 800 °C and the melting pointof cordierite is 1450 °C. The thermal conductivity (λ ≈ 1 Wm–1K–1) and the inertialcoefficient (K2 = 0.05 m) of the cordierite sample were in a range where hot spots areallowed.
5. The Solar Tower Jülich
In Section 2, the technology of the solar air receiver was described in detail.The most recent application of the HITREC Technology (Fig. 8) is the Solar TowerJülich, a power plant of 1.5 MW electrical power erected in Jülich in West Germany.It was launched in June 2009 and since then it has been delivering electrical powerinto the German electricity grid. It was erected by the company Kraftanlagen Münchenwith financial and scientific support of DLR. It is currently operated by StadtwerkeJülich, the local utility.
Fig. 11. Temperature distributions at the front side of various homogenously heated porous materialsamples obtained from numerical calculations.

280 T. FEND
It works according to the principle shown in Fig. 2. The total number of heliostatsneeded is more than 2000 and they comprise a mirror surface area of more than20000 m2. The receiver consists of 1080 HITREC receiver elements and covers a totalarea of 20 m2.
6. Spin of applications 6.1. Cross-flow particle filterParticle filters for Diesel engines (DPF), which are going to be obligatory in the futurefor passenger cars and large vehicles, are object of an intensive research activity allover the world. Most of the DPFs consist of inlet channels, a porous ceramic or metalwall, which enables flow of the exhaust gas through it and outlet channels. Particlesare filtered and remain outside the walls in the inlet channels. In regular time intervalsthe DPF has to be regenerated to remove the particles. In this process, which is carriedout during regular use of the engine, soot particles in the inlet channels of the filter areburned, partly with catalyst support. After burning, ashes remain in the channels. Inmany existing filters this leads to a slow blocking of the inlet channels (Fig. 13, left).
Fig. 12. The Solar Tower Jülich in operation (a), HITREC receiver element (b), view from the testplatform of the tower (c).
a b
c
Fig. 13. Cross-flow particle filter principle.

High porosity materials as volumetric receivers for solar energetics 281
During the regeneration heat is generated inside the channels. In so far, the physicalprocesses are comparable to the processes inside the solar air receiver. In the commonproject INNOTRAP, which is carried out by the company DEUTZ AG, the Universityof Erlangen, the Fraunhofer IKTS, the Solar Institute Jülich, the DLR and somesmaller industrial partners, these processes are investigated in more detail.Additionally, a cross-flow filter is proposed, which enables the ashes being removedfrom the inlet channels and entering into an ash container. This principle is shownin Fig. 12.
The cross-flow filter may be realized with ceramic foil technology, which has beenapproved for water filtering before, or with an advanced ceramic printing technology,which has been developed by the German company Bauer Technologies. Also thistechnology has been approved in a hot gas application as a solar receiver before [13].An example of a possible filter design is shown in Fig. 14 (right).
Besides testing new filter designs experimentally the objective of the project is todevelop tools for a numerical simulation of the air and particle flow inside the filter.
6.2. Gas turbine coolingTo achieve higher temperatures in the combustion chamber of combined cycle powerstations, the Collaborative German Research Project SFB 561 has been founded in1998. One of the main objectives of the project is to investigate an active cooling ofthe combustion chamber walls by effusion of air into the chamber (effusion cooling).The principle is shown in Fig. 15. The wall is covered with metal foam and a thermalbarrier coating (TBC). Cooling air is pressed through the foam and through thin
Fig. 14. State-of-the-art particle filter principle (left) and advanced cross-flow principle.
Fig. 15. Combustion chamber cooling with μm-scale porous metal foams.

282 T. FEND
holes in the TBC. In 2004, DLR joined the project and took over the responsibility forthe characterization of the flow through the foam. Until now, a number of foammaterials have been characterized concerning heat transfer and thermal conductionproperties. Results are presented in more detail in [15] and [16]. Also this applicationdeals with an external heat source, which is transferred into the porous material byconvection and by radiation.
6.3. Cross-flow/counter flow heat exchangerA new approach manufacturing a compact high temperature heat exchanger is shownin Fig. 16. A modified honeycomb structure was used to lead two separate gas flowsthrough the open pores of the material. Every second row of channels was closed atthe inlet and outlet with a high temperature cement. These closed rows were thenopened from the side in the green state of the ceramics, as can be seen on the rightphotograph of Fig. 16. By using an appropriate canning a second flow could be ledthrough the lateral openings. First experimental results as well as results of numericalcalculations show excellent performance of prototypes of this technology.
Cold gas I out
Hot gas I in
Cold gas II in
Hot gas II out
Fig. 16. Extruded SiC honeycomb-structure used as a cross-flow/counterflow heat exchanger.

High porosity materials as volumetric receivers for solar energetics 283
7. Conclusions
Flow through hot porous materials has been investigated for a number of differentapplications. In the case of the solar air receiver physical phenomena likethe occurrence of hot spots, which have been observed experimentally, could beexplained theoretically and it could be shown how material properties such as thermalconductivity and permeability influence this phenomenon. From the design point ofview the desired properties of an ideal solar air receiver are known, however, futureactivities have to focus on durability, corrosion resistance and simplicity ofmanufacturing to achieve low costs for the whole receiver system, which at last lowersthe generation costs of solar electricity. In the case of the particle filter, the ceramicmixer and the effusion cooling of the gas turbine numerical approaches are subject ofcurrent research activities and first results should be expected within the next months.
Acknowledgments – The support of the Deutsche Forschungsgemeinschaft (DFG) for the projectsPORENKÖRPER and SFB 561, the German Ministry of Education and Science for the projects SOLPORand 3DKeSt as well as the German Ministry of Economy for the project INNOTRAP is gratefullyacknowledged. Additionally we thank the European Commission for having funded the collaborativeproject SOLAIR.
References[1] FRICKER H., Studie über die Möglichkeiten eines Alpenkraftwerkes, Bulletin SEV/VSE 76, 1985,
pp. 10–16 (in German).[2] WINTER C.J., SIZMANN R.L., VANT-HULL L.L. [Eds.], Solar Power Plants, Springer-Verlag, Berlin,
1991.[3] MEINECKE W., BOHN M., BECKER M., GUPTA B. [Eds.], Solar Energy Concentrating Systems,
C.F. Miller Verlag, Heidelberg, 1994, pp. 18–19, 68.[4] CHAVEZ J.M., KOLB G.J., MEINECKE W., Second Generation Central Receiver Technologies –
A Status Report, [Eds.] Becker M., Klimas P.C., Verlag C.F. Müller, Karlsruhe, Germany.[5] HOFFSCHMIDT B., DIBOWSKI G., BEUTER M., FERNANDEZ V., TÉLLEZ F., STOBBE P., Test results of
a 3 MW solar open volumetric receiver, Proceedings of the ISES Solar World Congress 2003“Solar Energy for a Sustainable Future”, June 14–19, 2003, Göteborg, Sweden.
[6] KOLL G., SCHWARZBÖZL P., HENNECKE K., HARTZ TH., SCHMITZ M., HOFFSCHMIDT B., The Solar TowerJülich, a Research and Demonstration Plant for Central Receiver Systems, Proceedings of the 2009SolarPaces Conference, Berlin, September 15–19, 2009.
[7] FEND T.D., PITZ-PAAL R., HOFFSCHMIDT B., REUTTER O., Solar radiation conversion, [In] CellularCeramics: Structure, Manufacturing, Properties and Applications, [Eds.] Scheffler M.,Colombo P., Wiley-VCH Verlag GmbH & Co. KgaA, Weinheim, 2005.
[8] BECKER M., FEND T., HOFFSCHMIDT B., PITZ-PAAL R., REUTTER O., STAMATOV V., STEVEN M.,TRIMIS D., Theoretical and numerical investigation of flow stability in porous materials applied asvolumetric solar receivers, Solar Energy 80(10), 2006, pp. 1241–1248.
[9] KRIBUS A., RIES H., SPIRKL W., Inherent limitations of volumetric solar receivers, Journal of SolarEnergy Engineering 118(3), 1996, pp. 151–155.
[10] DECKER S., MÖßBAUER S., NEMODA S., TRIMIS D. ZAPF T., Detailed experimental characterizationand numerical modelling of heat and mass transport properties of highly porous media for solarreceivers and porous burners, Sixth International Conference on Technologies and Combustion fora Clean Environment (Clean Air VI), Vol. 2, Porto, Portugal, 9–12 July 2001, paper 22.2.

284 T. FEND
[11] FEND T., REUTTER O., PITZ-PAAL R., Convective heat transfer investigations in porous materials,International Conference Porous Ceramic Materials, Brügge, October 20–21, 2005.
[12] FEND T., HOFFSCHMIDT B., PITZ-PAAL R., REUTTER O., RIETBROCK P., Porous materials as openvolumetric solar receivers: Experimental determination of thermophysical and heat transferproperties, Energy 29 (5–6), 2004, pp. 823–833.
[13] FEND T., REUTTER O., PITZ-PAAL R., HOFFSCHMIDT B., BAUER J., Two novel high-porositymaterials as volumetric receivers for concentrated solar radiation, Solar Energy Materials andSolar Cells 84(1–4), 2004, pp. 291–304.
[14] REUTTER O., BUCK R., FEND T., et al., SOLPOR Charakterisierung von Strömungsinstabilitäten involumetrischen Solarreceivern, Statusseminar Vernetzungsfond “Erneuerbare Energien”, Stuttgart,February 17–18, 2004, Projektträger Jülich, 2004.
[15] SAUERHERING J., REUTTER O., FEND T., ANGEL S., PITZ-PAAL R., Temperature dependency ofthe effective thermal conductivity of nickel based metal foams, Proceedings of ASMEICNMM2006, 4th International Conference on Nanochannels, Microchannels and Minichannels,June 19–21, 2006, Limerick, Ireland, paper no. ICNMM2006-96136.
[16] REUTTER O., SAUERHERING J., SMIRNOVA E., FEND T., ANGEL S., PITZ-PAAL R., Experimentalinvestigation of heat transfer and pressure drop in porous metal foams, Proceedings of ASMEICNMM2006, 4th International Conference on Nanochannels, Microchannels and Minichannels,June 19–21, 2006, Limerick, Ireland, paper no. ICNMM2006-96135.
Received November 12, 2009in revised form January 13, 2010

Optica Applicata, Vol. XL, No. 2, 2010
The influence of thermal treatment of the porous glass plates on the character of their scattering in visible spectral region
TATYANA V. ANTROPOVA*, IRINA N. ANFIMOVA
Grebenshchikov Institute of Silicate Chemistry, Russian Academy of Sciences, Nab. Makarova, 2, Saint Petersburg, Russia
*Corresponding author: [email protected]
The pore structure and light transmission of the high-silica porous glasses in visible spectralregion are investigated depending on a temperature of their thermal treatment and composition ofthe initial two-phase alkali borosilicate glasses. The character of light transmission in porousglasses is analyzed considering the features of their pore space structure and processes occurringin porous glass upon heating. It is shown that with an increase in temperature of thermaltreatment of the porous glasses of different composition the pore size increases, and theirspecific surface decreases (at practically constant common porosity), which is due to the processesof pore overcondensation, that occur owing to the regrouping and change of packing density ofthe secondary silica particles. It is shown that introducting phosphate and fluoride ions in the basicalkali borosilicate glass results in an increase in the light attenuation factors of the porous glassesowing to an increase in the sizes of liquation areas of heterogeneity in initial two-phase glasses,formation of larger pores and presence of the nanostructured microcrystalline phases in the porousglasses.
Keywords: phase-separated alkali borosilicate glasses, porous glass, light transmission.
1. IntroductionPorous glasses (PGs) based on the phase-separated alkali borosilicate (ABS)glass-forming systems represent the chemically, biologically and thermally steadynanostructured porous materials with controllable parameters of the structure andproperties [1]. PGs are the matrices for creation of the high silica materials withadjustable properties, such as the spectral-optical sensors of sorption type foroptoelectronic analyzers of structure of the gas environment; the microoptical elementsfor creation of integrated microcircuits working in an optical range and used fortransfer, storage and processing of information; the functional nanoporous elementsfor microfluidic devices, etc. [2, 3]. In connection with the availability of PG’sapplication in optical technologies information on their optical properties, namely,light transmission τ in visible spectral area and τ change depending on various factors,is necessary.

286 T.V. ANTROPOVA, I.N. ANFIMOVA
Generally, a light transmission of the PG plates is defined by absorption anddispersion on inhomogeneities in PGs [4].
Spectral dependences of the light transmission allow us to obtain data onthe scattering of a light flux from the boundary of the media, as well as fromthe structure inhomogeneities and surface. Depending on the size, form anddistributions of the inhomogeneities the various variants of light scattering arepossible. When the inhomogeneity sizes are smaller than the wavelengths λ,the Rayleigh scattering is observed [5, 6]. In this case, the light extinction factorKλ = A /λ–β (A = const, β is a parameter, which is determined as a tangent of angle ofinclination of dependence –log(–logτ ) = f (logλ ) [7]) is proportional to the quantityλβ = 4 [8, 9]. The presence of large inhomogeneities results in diffraction scattering.The absence of a strict connection between PG’s τ values (in a wavelengths rangeλ = 350–800 nm) and the pore sizes (at pore radius r < λ ) testifies to the complexmechanism of light scattering in PG [10]. Besides the pores the sizes of which are lessthan a wavelength and the inhomogeneities of liquation type which are inherent totwo-phase ABS glasses there are larger heterogeneities, namely silica gelprecipitations and microcrystalline inclusions [4, 11]. These heterogeneities poorlyabsorb light, but bring about the essential contribution to the weakening of a lightstream because of light scattering [6] and can influence the light transmissioncharacter [4, 5, 7, 10, 12, 13]. The observed dependences of τ values on the variousfactors which influence the glass leaching process and the structure of the PGs obtainedare connected to these facts (see the review in [14]).
Earlier we investigated the τ values of the porous glasses depending on the ABSglass composition and its leaching conditions (i.e., the concentration and temperatureof an acid solution) [10], thickness of samples [10], an angle of the light streamfalling on a glass plate surface [12], PG’s thermal background [4]. In the present work,the light transmittance of the PG plates (thickness L = 3 mm) at λ = 400–800 nm isinvestigated depending on the composition of the initial two-phase ABS glasses andthe values of temperature of subsequent thermal treatment (Ttt ) of the PG samplesobtained.
2. TechniqueThe composition and pore parameters of the PGs, obtained as a result of through acidleaching of two-phase ABS glasses that are a base glass (PG-1) and the glasses ofmodified composition (PG-2a, PG-2b, PG-3), and the following PG’s thermaltreatment at Ttt = 120–750 °C, are presented in Tabs. 1 and 2. Values of porosity Ware determined by a weight method; sizes of a specific surface pore S (m2/g) – byporosimetry BET method using a SORBTOMETER-M (Russia) analyzer. The valuesof average pore diameter D were calculated with the formula [15]:
D 4S
-------- 1ρseeming
----------------------- 1ρSi
------------–⎝ ⎠⎜ ⎟⎛ ⎞
=

The influence of thermal treatment of the porous glass plates ... 287
where ρSi = 2.18 g/sm3 is the density of silica skeleton; ρseeming = P/V is a seemingdensity of PG, g/sm3; P [g] – weight of the sample, g; V [sm3] – volume of the sample.
Spectral dependences of the values τ have been measured on a SF-26spectrophotometer relative to air (PG/air) or a sample of corresponding two-phase
T a b l e 1. Composition of the porous glasses under study.
T a b l e 2. The pore structure parameters of the porous glasses under study.
GlassComposition as-analyzed [wt%]
Na2O B2O3 SiO2 R x(Oy)*
PG-1 0.22 4.25 95.53 –
PG-2a 0.17 5.96 93.75 0.07 P2O50.05 |F|
PG-2b 0.30 5.48 94.08 0.08 P2O50.06 |F|
PG-3 0.09 6.29 93.49 0.13 K2O
Glass
Thermal treatment temperature Ttt [°C]
Parameter of pore structure [15]Porosity W [sm3/sm3]
Diameter D [nm]
Specific surface area S [m2/g]
PG-1 120 0.28 3.9 160400 0.28 4.9 135600 0.29 5.0 137650 0.29 5.9 117700 0.31 7.3 95750 0.27 8.4 83
PG-2a 120 0.27 9.9 65400 0.27 17.6 35600 0.28 17.9 37650 0.27 20.0 31700 0.28 24.9 27
PG-2b 120 0.28 14.3 45400 0.28 18.7 36600 0.27 18.2 38650 0.29 25.3 28700 0.27 27.4 26750 0.27 27.5 25
PG-3 120 0.43 9.3 149400 0.43 10.4 136600 0.44 12.4 115650 0.45 14.3 102700 0.44 17.3 83750 0.44 26.6 54

288 T.V. ANTROPOVA, I.N. ANFIMOVA
glass (PG/two-phase glass). Transmittance spectra of the PG samples, which werethermally treated at Ttt ≥ 400 °C (PGT), have been measured relative to PG sampleswith Ttt = 120 °C (PG120).
The obtained spectra have been used to reveal the scattering type by parameter β.
3. Experimental results and discussionThe pore parameters of the PGs investigated depend on the initial two-phase glasscomposition and their thermal background (Tab. 2). Upon heating of PG samplesin interval Ttt ≤ 750 °C the pore size increases, and their specific surface decreases(at practically constant common porosity) as a result of processes of the poreover-condensation, caused by the regrouping and change of packing density ofthe secondary silica particles [16].
Some results of the measurement of the spectral dependences of porous glassesunder study are given in Fig. 1. The PG plates having larger pores are characterizedby smaller τ values (Fig. 1, Tab. 2). This result is adjusted with data [10] aboutan increase of turbidity of the PGs at increase in the sizes of scatterers, which iscaused by the pore over-condensation processes at Ttt increase. At the same time, forsimilar D values the various values τ of the PG plates from modified glasses are
Fig. 1. Spectral dependences of light transmission of the porous glasses after drying at 120 °C (a–c) andafter thermal treatment at 600 °C (d).
a b
c d

The influence of thermal treatment of the porous glass plates ... 289
observed. The PG-2 samples made from two-phase ABS glass with P2O5 and fluorideion additives possess a practically zero light transmission in the wavelength areaλ ≤ 550 nm (Fig. 1b).
The low light transmission of PGs from the two-phase glasses with additives ismost likely caused (besides both an increase in the sizes of the liquation areas ofheterogeneity in initial two-phase glasses [5, 7] and a presence of larger pores) bythe presence of the nanostructured microcrystalline phases [13]. In certain λ intervalsfor PGs from two-phase glasses with additives the value τ (PGT/PG120) is greaterthan τ (PGT/air) and τ (PGT/ two-phase glass) values (Fig. 1d). This fact can also serveas a proof of the presence of such phases in PG and gives grounds for judging theirsizes and temperatures of their fusion (decomposition).
According to Fig. 1, light transmittance of the PG samples, measured relative toair is a little bit less than that measured relative to two-phase glass, and to PG120 inlong-wave region (λ > 600 nm). It was shown that the presence of fluoride-ions ininitial two-phase glass results in an increase in Kλ (at the same Ttt) [15]. For thesePGs an increase of Ttt up to 600 °C is accompanied by reduction of Kλ , contrary toPGs from the glass without fluoride-ions. At Ttt > 600 °C the light attenuation of PGsdecreases. In the long-wave spectral region (λ ≈ 700–800 nm) the character of Tttinfluence on Kλ is maintained, but absolute sizes of Kλ values decrease by 1.5–2.5times (at the same λ). Under such conditions, for PGs from the glasses withthe additives of fluoride-ions a Rayleigh scattering is inherent (β ≈ 4) (Tab. 3). In othercases, a more complicated character of scattering (β ≈ 0.3–1.9), which is caused bythe features of PG’s porous space structure [17] is observed. An increase of Ttt valuefrom 120 °C up to 600 °C–750 °C is accompanied by a small increase in β values(Tab. 4).
T a b l e 3. The values of factor β of the porous glasses (Ttt = 120 °C) in different spectral regions.
T a b l e 4. The values of factor β of the porous glasses treated thermally at different temperatures.
GlassFactor β
λ = 400–550 nm λ = 550–750 nmPG-1 1.4 0.4PG-2a 3.7 4.0PG-2b 0.3 3.7PG-3 3.3 1.3
Glass λ [nm]Factor β
Ttt = 120 °C Ttt = 600 °C Ttt = 750 °CPG-1 400–550 1.4 1.9 1.7
550–750 0.4 0.6 0.9PG-2b 400–550 0.3 0.4 0.8
550–750 3.7 3.8 4.1

290 T.V. ANTROPOVA, I.N. ANFIMOVA
4. Conclusions
A study of an influence of the composition and temperature of thermal treatment ofthe porous glass plates on their light transmission in visible spectral area has beencarried out.
Temperature ranges have been determined of the thermal treatment of the porousglass plates in which a change of light attenuation, a character of which is defined bythe pore over-condensation processes and depend on an initial glass composition, isobserved. A complex character of the light scattering caused by the structural featuresof a pore space has been shown.
The results obtained can be used for optimization of the technological modes ofcreating the high-silica porous functional elements of the devices with opticaldetection.
Acknowledgements – This work was supported by the Russian Foundation for Basic Research (projectNo. 08-08-00733a) and by the Department of Chemistry and Material Science of the Russian Academyof Science (project PFI OXNM-02).
References[1] ANTROPOVA T.V., Nanostructurized porous glasses, Proceedings of Nanotechnology International
Forum “Rusnanotech’08”, December 2–6, 2008, Moskow, Russia, Abstracts: 4.5. Chemistry andChemical Technology of Nanomaterials 1, 2008, pp. 485–486.
[2] MESHKOVSKIJ I.K., Composite Optical Materials on the Basis of Porous Matrixes, Saint-PetersburgState University of Information Technologies, Mechanics and Optics, 1998, p. 332.
[3] EVSTRAPOV A.A., ESIKOVA N.A., RUDNITSKAJA G.E., ANTROPOVA T.V., Application of porous glassesin microfluidic devices, Optica Applicata 38(1), 2008, pp. 31–38.
[4] ANTROPOVA T.V., DROZDOVA I.A., YASTREBOV S.G., EVSTRAPOV A.A., Porous glass: inhomogeneitiesand light transmission, Optica Applicata 30(4), 2000, pp. 553–567.
[5] EVSTRAPOV A.A., MURAVIEV D.O., ANTROPOVA T.V., YASTREBOV S.G., Study of optical propertiesof the two-phase and microporous glasses, Optical Journal 75 (4), 2008, pp. 71–77 (in Russian).
[6] EVSTRAPOV A.A., ANTROPOVA T.V., DROZDOVA I.A., YASRTEBOV S.G., Optical properties andstructure of porous glasses, Optica Applicata 33 (1), 2003, pp. 45–54.
[7] ROSKOVA G.P., MOROZOVA E.V., BAKHANOV V.A., Light transmittance of the porous plates receivedfrom two-phase sodium borosilicate glasses with different structures, Fizika i Khimiya Stekla 17 (4),1991, pp. 623–630 (in Russian).
[8] ANDREEV N.S., Small-angle X-ray scattering and visible light scattering in inorganic glasses uponmetastable phase separation, Abstract of Doctoral Dissertation, Leningrad, 1981.
[9] BOHREN C.F., HUFFMAN D.R., Adsorption and Scattering of Light by Small Particles, Wiley, NewYork, 1983.
[10] SMIRNOVA I.S., ANTROPOVA T.V., SIDOROVA M.P., ERMAKOVA L.E., ROSKOVA G.P., The effect ofsynthesis conditions on the transmittance and coefficient of structural electrical resistance ofmicroporous glasses, Glass Physics and Chemistry 22(4), 1996, pp. 388–392.
[11] ANTROPOVA T.V., DROZDOVA I.A., Influence of the conditions of manufacturing of the porous glasseson their structure, Fizika i Khimiya Stekla 21(2), 1995, pp. 199–209 (in Russian).
[12] ANTROPOVA T.V., KRYLOVA N.L., BAKHANOV V.A., Physic-and-chemical interpretation ofthe anomalous light transmittance of porous glasses, Fizika i Khimiya Stekla 18 (1), 1992,pp. 113–122 (in Russian).

The influence of thermal treatment of the porous glass plates ... 291
[13] ANTROPOVA T.V., DROZDOVA I.A., Physic-and-chemical features of a porous glass and theirinfluence on its light scattering, J. Applied Chemistry 69 (3), 1996, pp. 393–396 (in Russian).
[14] ANTROPOVA T.V., Physic-and-chemical processes of creation of the porous glasses and high-silicamaterials on a base of the two-phase alkali borosilicate glasses, D.Sc. Thesis, Saint Petersburg,2005, p. 588 (in Russian).
[15] ANTROPOVA T.V., ANFIMOVA I.N., GOLOVINA G.F., Influence of the composition and temperature ofheat treatment of porous glasses on their structure and light transmission in the visible spectralrange, Glass Physics and Chemistry 35(6), 2009, pp. 572–579.
[16] ANTROPOVA T.V., DROZDOVA I.A., VASILEVSKAYA T.N., VOLKOVA A.V., ERMAKOVA L.E.,SIDOROVA M.P., Structural transformations in thermally modified porous glasses, Glass Physicsand Chemistry 33 (2), 2007, pp. 109–121.
[17] DROZDOVA I., ANTROPOVA T., Features of the structure of the phase-separated and porousborosilicate glasses with/without an impurity of fluorid-ions according to electron microscopy,Optica Applicata 38 (1), 2008, pp. 17–24.
Received November 12, 2009in revised form January 5, 2010

Optica Applicata, Vol. XL, No. 2, 2010
Application of high resolution microscopy and optical spectroscopy for study of phase separation in phosphorus- and fluorine-containing sodium borosilicate glasses
TATYANA V. ANTROPOVA1*, IRINA DROZDOVA1, IGOR KUKHTEVICH1, ANATOLY EVSTRAPOV2, NADYA ESIKOVA2
1Grebenshchikov Institute of Silicate Chemistry, Russian Academy of Sciences, Nab. Makarova, 2, Saint Petersburg, Russia
2Institute for Analytical Instrumentation of Russian Academy of Sciences, Rizhski Pr., 26, 198103 Saint Petersburg, Russia
*Corresponding author: [email protected]
The kinetics of phase separation in glass-forming Na2O–B2O3–SiO2–P2O5– |F| system andstructure parameters of the two-phase glasses have been investigated by transmission electronmicroscopy (TEM) and optical spectroscopy methods. The TEM images were analyzed withthe help of specially designed software for the purpose of determination of the relative volumeand size of the phases. An influence of duration of a glass heat treatment on the parameters oftheir structure was investigated at a temperature of 550 °C which is necessary for promptinga two-network structure and is most frequently used for manufacturing porous glasses. The timeof glass heat treatment necessary for achieving phase equilibrium was established. A deviation ofthe phase inhomogeneity growth rate from theoretical one was determined. It was revealed thata certain third phase, the composition of which can include α -quartz, is formed in glass duringthe heat treatment. Fluorescence of the two-phase glass which has been subjected to heat treatmentfor a long time can be caused by the presence of this phase.
Keywords: alkali borosilicate glasses, phase separation, transmission electron microscopy, opticalspectroscopy.
1. IntroductionPhosphorus- and fluorine-containing (PF) glasses are of interest for varioustechnological applications due to a combination of the useful qualities inherent influorine and metaphosphate glasses [1–9]. In particular, the PF-glasses arecharacterized by unique optical and laser properties, that, alongside with high chemicalstability and big opportunities on introduction of the alkaline-earth and rare-earth

294 T.V. ANTROPOVA et al.
elements into a glass matrix, makes theirs by perspective material for the decision ofthe applied tasks of optoelectronics. Successful application of PF-glasses is promotedby their technological properties (a good glass-forming ability, the high thermalexpansion coefficients, a low viscosity) which have a positive effect in industrialproduction of the glass, shown in the lowering of a liquidus temperature andtemperature of glass melting.
The important direction is practical use of PF-glasses for creation of the porousglasses (PGs). Even small additives of fluorine and phosphorus in the glasses ofsodium borosilicate (SBS) system significantly influence the process of phaseseparation during their heat treatment [5, 6], which ultimately determines the courseof acid leaching of two-phase glasses and structural parameters of PGs [10]. Usingthe two-phase fluorine- and phosphorus-containing SBS glasses in some cases helpsto reduce cracking of the leached samples [6]. This accelerates the process of alkalineetching of the microporous [11] glasses during manufacture of the macroporous [11]glasses, and facilitates the process of obtaining PGs with bigger pore radiuses [7, 8].The last circumstance is extremely important because the functional elements frommacroporous glasses are promising for use as electroosmotic pumps in microfluidicanalytical systems [12–14]. With proper conduct of alkaline etching of the micro-porous glass a silica skeleton structure of the macroporous glass obtained correspondsto the phase structure of the initial two-phase glass.
To optimize the structural parameters of PGs the directional choice of the initialglass composition and its heat treatment regime are necessary to regulate the structureof the coexisting phases in two-phase glass. The most important condition for solvingthis problem is the availability of information about the structure of two-phase glassand PGs.
A comparative study of the structure of the phase-separated SBS glasses with andwithout additives of fluorides and phosphorus oxide has been initiated by us throughthe use of electronic microscopy and X-ray phase analysis methods [15]. There werefound out the distinctions of phase morphology of the two-phase glasses which eithercontain or not a fluorine and phosphorus additives. Since the purpose of the researchwas to identify the influence of the initial glass composition on the morphology oftwo-phase glasses, the experiments were conducted under condition of only one regimeof the thermal treatment of glass. At the same time, the processes of phase separationin the Na2O–B2O3–SiO2–P2O5–|F| (NaBSiPF) system have been little studied,making it difficult to directionally select the regimes of heat treatment of the initialglasses for future manufacture of the macroporous glasses with the predicted structureof a pore space.
This governs the statement of this work, which is aimed at studying the effect oftemperature and duration of heat treatment of the NaBSiPF-glasses (in comparisonwith the base SBS-glass [10, 15, 16]) on structure of coexisting phases in the phase--separated glasses with high resolution microscopy and optical spectroscopy methods.

Application of high resolution microscopy and optical spectroscopy ... 295
2. Technique
The objects of investigation were the samples of NaBSiPF-glass (see the Table).The initial glasses were clarified at temperature T = 810 °C for 15 min, were roughlyannealed to room temperature at a rate of 100 °C/min, and then heat treated attemperature Tht = 550 °C during a time tht = 0.5–500 hrs, or at 700 °C during 1–6 hrs.The choice of such Tht values is caused by the fact of using them in practice forproduction of the two-phase glasses suitable for manufacture of PGs.
The transmission electron microscopy (TEM) study of the two-phase glasses wasperformed via electronic microscope EM-125 at an accelerating voltage 75 kV withthe resolution at 5 Å. A well-known method of platinum–carbon replica [15] preparedfrom freshly cleaved surface etched in 5% solution HF at room temperature during5–7 seconds has been used.
An analysis of TEM images including calculation of relative volume and the sizesof co-existing phases in a glass was carried out with the help of special software[20, 21], which had been developed in MatLab system. In these programsthe histograms of analyzed grey images are used [5]. To estimate a relative volume ofboron-rich phase (V) the cross-section of areas selected on the appropriate image ofglass structure is made. An approach for the choice of rules for a section (in the centerspan of the histogram, the peak of the histogram, the half-width at half-height, etc.)depends on the morphology of the phases. To smooth the origin image the filteringoperation was carried out.
X-ray analysis of all glasses was previously executed on DRON-3 device withmonochromatic CuKα-radiation.
The transmission spectra of the two-phase glass samples were measured on HitachiU-3410 spectrophotometer in the wavelength range of 250–850 nm with a step of
T a b l e. The compositions, density and glass transition temperature Tg values of the glassesunder investigation.
*Dilatometer measurements in a mode of heating a sample at a speed of 3 °C/min [17, 18], or 7 °C/min [19].
GlassInitial glass composition as-analyzed [mol%]
[g/sm3]tht at 550 °C [hrs]
Tg [°C]*Na2O B2O3 SiO2 Al2O3 P2O5 |F |
NaBSi 7.6 20.4 71.9 0.1 – – 2.262 [17] 140 495 [17]NaBSiPF 6.8 22.1 70.4 – 0.2 0.5 2.200 [17] 40 468 [19]
454 [18]140 458 [19]
449 [18]500 450 [18]
ρH2O20
ρH2O20
296 T.V. ANTROPOVA et al.
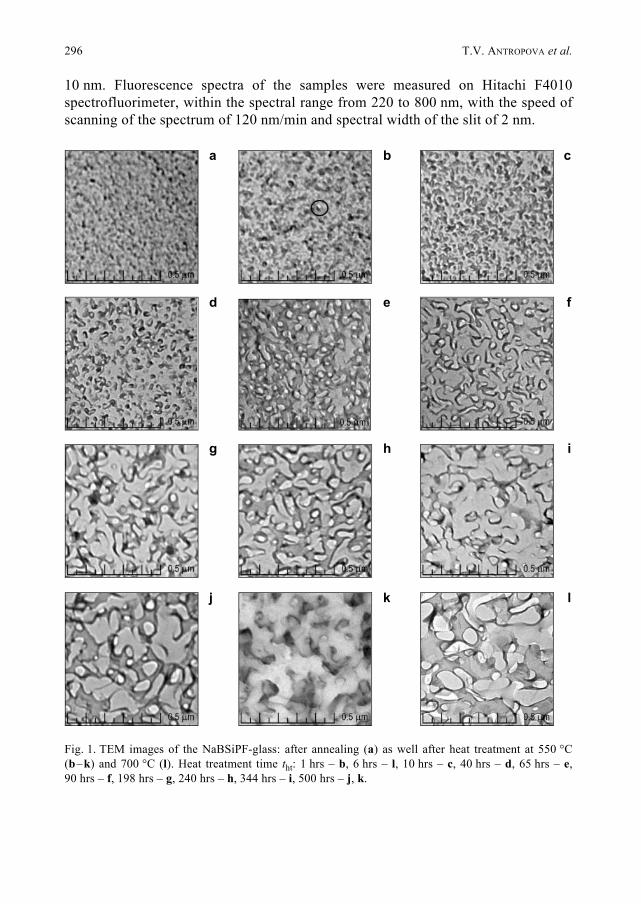
10 nm. Fluorescence spectra of the samples were measured on Hitachi F4010spectrofluorimeter, within the spectral range from 220 to 800 nm, with the speed ofscanning of the spectrum of 120 nm/min and spectral width of the slit of 2 nm.
Fig. 1. TEM images of the NaBSiPF-glass: after annealing (a) as well after heat treatment at 550 °C(b–k) and 700 °C (l). Heat treatment time tht: 1 hrs – b, 6 hrs – l, 10 hrs – c, 40 hrs – d, 65 hrs – e,90 hrs – f, 198 hrs – g, 240 hrs – h, 344 hrs – i, 500 hrs – j, k.
a b c
d e f
g h i
j k l

Application of high resolution microscopy and optical spectroscopy ... 297
3. Experimental results and discussion
It is possible to obtain some notions about the course of the glass phase separationprocess on TEM images on which there are precise phase borders between the sites ofthe various structures [22, chapter 5]. This can be readily done under the circumstanceswhere a nucleation mechanism takes place and there is a distribution of one phasedrops inside a matrix of another phase. In the case of a drop-matrix structure it ispossible to estimate the relative volume V values and the size (average radius R) ofco-existing phases on TEM images. The TEM data can be used for the descriptionof glass phase separation kinetics [22, pp. 29–34]. According to the Lifshitz–Slyozovtheory (see review in [22], Chapter 2), the growth of the radius of the germs formedof the second phase is proportional to a root square of time of heat treatment, and toa root cubic of time for the over-condensation stage. The parameter α , determinedon a tangent of an angle of inclination of dependences R = f (tht) in logarithmicalcoordinates, is accordingly equal to 1/2 and 1/3. In the first case the size α ischaracteristic of diffusion on an inter-phase surface, in the second case, it ischaracteristic of the growth controllable by volumetric diffusion; for diffusion throughan interface α = 1/4 [23]. However, in our case, as is apparent from Fig. 1, on whichTEM images of the glasses investigated are submitted, the structure variantdescribed is not characteristic even at small values tht. At the same time, it is knownthat the laws described according to the Lifshitz–Slyozov theory are carried out forqualitatively similar structures in base SBS system [24, 25]. Results of our estimationof the phase parameters in the two-phase glasses on their TEM images are presentedin Figs. 2–4.
According to the results obtained, formation of a micro-heterogeneous structure inthe glass-forming NaBSiPF system occurs already during the cooling of glass melt(Fig. 1a). It is probable that at this stage a heterogeneity of glass structure is causedmainly by the occurrence of composition fluctuations, namely by formation ofthe high-polymerized silica-oxygen anionic groupings constructed from structural unitsQ3 and Q4 [26], the depolymerizated ortho-phosphate structural groupings [9]and oxyfluoride polar [BO3/2F]– ones [27, 28], and also the germs of a new phase (forexample, [BO4/2Me] structural complexes, compatible with SiO4/2 [22, pp. 24–28]).These fluctuations result in formation of the areas strongly distinguished on compo-sition from an initial melt at the following heat treatment of glass [22, pp. 28–45].
It is visible from Fig. 1 that at early stages of phase separation up to tht < 10 hrsthe areas of heterogeneity have a drop-channel form with the least average diameterof the liquation channels Dchannel ~ 15 nm (Fig. 2a, dependence 1). Already at tht == 1–2 hrs an origin of the third phase* (Fig. 1b) is observed. At tht = 10–40 hrs there*The formations which have the expressed boundaries with the neighboring areas and an occurrenceof which is not connected with three-phase immiscibility in glass forming systems [20, pp. 20–24,158–161] are had in mind.
PO43–

298 T.V. ANTROPOVA et al.
is a formation of a structure with interpenetrating silica and alkali-borate phases,the channel diameters of which are Dchannel = 15–20 nm (Figs. 1c and 1d; Fig. 2a,dependence 1). At the beginning of the tht interval mentioned the sizes of the thirdphase particles Dparticle are commensurable with the sizes of the liquation channels(Fig. 2a, dependence 2).
As the tht value increases it is possible to observe some increase of the Dchannelvalues as well as structure condensation due to the increase of the third phaseamount. The occurrence of the third phase particles the sizes of which surpass the sizesof the channels occupied with a boron-rich phase is marked.
At tht = 65 hrs the sharp changes of a two-phase glass structure are observed(Fig. 1e) which undergo further development with an increase of tht (Figs. 1f–1j).The sizes of the silica phase areas are essentially increased. Along with occurrenceof new fine particles of the third phase its larger part is presented by particles, forwhich Dparticle > Dchannel.
The fact of so-called “crushing” of the silica phase (an occurrence of the “cracks”in the areas contacting the particles of the third phase which considerably increases insize) at tht ≥ 198 hrs has engaged our attention. In the long heat treatment of a glass(tht = 500 hrs) a faceting of the third phase particles (Fig. 1j) and their substantialgrowth (Fig. 2a, dependence 2) are observed.
The TEM image of glass structure, generated at elevated temperature Tht = 700 °C,at which the phase separation processes occur much faster [24, 25], demonstratesthe growth in the size of areas of silica phase and the faceted crystalline particles ofthe third phase (Fig. 1l). It should be noted that at longer etching of the cleaved surfaceof glass in 5% HF solution before a replica manufacturing these particles are dissolvedas evidenced by the image of a spongy structure with a rounded through pores,corresponding to the size of liquation channels (Fig. 1k).
An example of construction of the histograms accordingly to [20] is shown inFig. 3a. The histograms, constructed for TEM images of the two-phase glasses withdifferent time of heat treatment which are combined so that all maxima are at zero, are
Fig. 2. Dependences of the phase inhomogeneity diameters D (a) or radius R (b) versus heat treatmenttime tht in the common coordinates (a) or in logarithmical coordinates (b).
a b

Application of high resolution microscopy and optical spectroscopy ... 299
Fig. 3. An illustration of histogram designed by software (a). Overlapping of the histograms of the two--phase NaBSiPF-glass samples after heat treatment at 550 °C during different times tht (b). Dependenceof a relative volume of boron-rich phase in the two-phase NaBSiPF-glasses versus the time tht of glassheat treatment at 550 °C (c).
a
b
c

300 T.V. ANTROPOVA et al.
presented in Fig. 3b. It is seen that the form of histograms depends on the time of glassheat treatment: the tendency towards reduction of a maximum height at essentialincrease of tht value is marked.
For small tht values the histograms look like an asymmetrical parabola. Withincreasing tht, the narrowing of the peak with maximum and the appearance of strongskewness (a two-peak distribution) are observed. For tht ≥ 198 hrs there appearreflexes (the small peaks) at the end of distributions. These reflexes correspond tothe lightest gradations that are adequate to the lightest areas on TEM images, whichcan be correlated to areas of the third phase.
Figure 3c shows a dependence V = f (tht), obtained under the condition of choosingthe histogram section as a half-width on half-height after filtering. It is seen that whentht ≥ 25–40 hrs an equilibrium value V ~ 55% is achieved. The fluctuations of V aroundthis value are caused by a process of formation and reorganization of the particles ofthird phase, which is denser in comparison with a boron-rich phase, which ismanifested in the analysis of grey images.
It is worthwhile to note that, that judging by glass transition temperature Tg, a glassheat treatment during tht = 40 hrs is enough to achieve equilibrium composition ofboron-rich phase in the NaBSiPF-glass investigated (the Table), whereas in the caseof base NaBSi-glass not less than 100 hrs are required for this purpose [24]. Fromthe Table, it is seen that the density and Tg value (for the same tht value) of the modifiedglass is much less than for base glass [17–19]. Most probably, this reflectsthe influence of fluoride ions, which are mainly in the boron-rich phase and reducethe degree of connectivity of a skeleton of the second glass-former B2O3 due tothe formation of the oxyfluoride polar structural groupings [BO3/2F] – [10, 27, 28].
On the curves representing the dependences of the sizes of phase inhomogeneitiesin two-phase glass versus tht value (taking into account the error caused bya sufficiently high degree of coherence of heterogeneity regions) in log–logcoordinates there are points of inflection separating the initial and later stages ofgrowth (Fig. 2b). The results of determining the α values indicate that the growthof the sizes of the heterogeneity areas in SBS glass with phosphorus and fluorideadditives (under conditions of phase equilibrium) cannot be unambiguously explainedwithin the framework of the mechanisms mentioned previously, because the α valuesdo not correspond to any of the above.
Qualitatively similar results were obtained in research of phase separation kineticsin SBS glasses with ZrO2, CaO and Sb2O5 additives [23, 29]. According to the authorof [23, 29] we can assume that in this case, it is not the over-condensation which isthe late stage of phase separation, but the transitive stage of formation of the dispersesystem state called a metastable colloidal equilibrium [30] that takes place. At thisstage, the growth of particles can be either slowed down or stopped for some time, asexemplified by our results (Fig. 2a). The occurrence of such a state in the phasedecomposition of the metastable systems may be due to the simultaneous processesof nucleation, dissolution and growth of the particles that complicates the kinetics ofa process [23].
Application of high resolution microscopy and optical spectroscopy ... 301
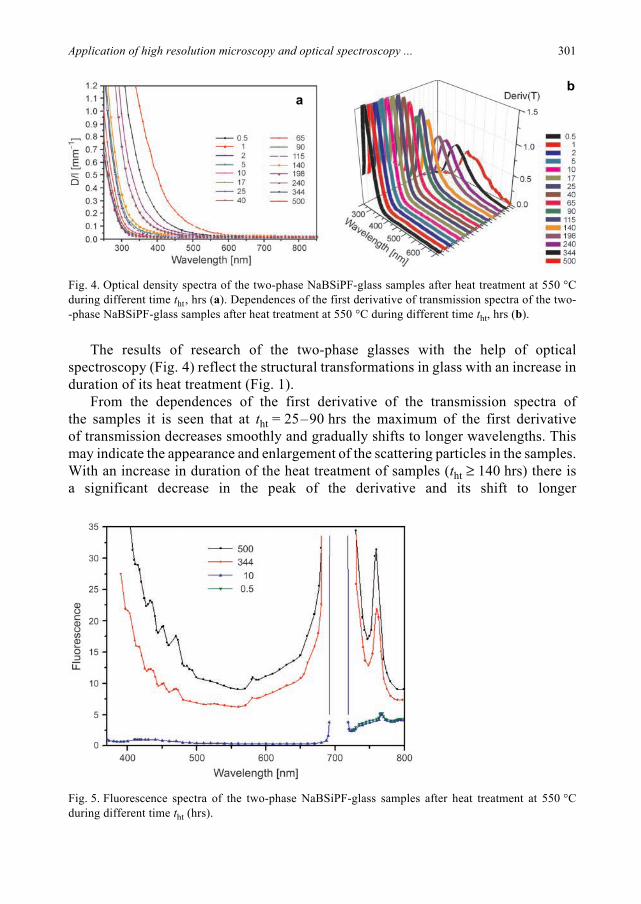
The results of research of the two-phase glasses with the help of opticalspectroscopy (Fig. 4) reflect the structural transformations in glass with an increase induration of its heat treatment (Fig. 1).
From the dependences of the first derivative of the transmission spectra ofthe samples it is seen that at tht = 25–90 hrs the maximum of the first derivativeof transmission decreases smoothly and gradually shifts to longer wavelengths. Thismay indicate the appearance and enlargement of the scattering particles in the samples.With an increase in duration of the heat treatment of samples (tht ≥ 140 hrs) there isa significant decrease in the peak of the derivative and its shift to longer
ab
Fig. 4. Optical density spectra of the two-phase NaBSiPF-glass samples after heat treatment at 550 °Cduring different time tht, hrs (a). Dependences of the first derivative of transmission spectra of the two--phase NaBSiPF-glass samples after heat treatment at 550 °C during different time tht, hrs (b).
Fig. 5. Fluorescence spectra of the two-phase NaBSiPF-glass samples after heat treatment at 550 °Cduring different time tht (hrs).

302 T.V. ANTROPOVA et al.
wavelengths, which may be due to a significant enlargement of the structure. Thusobserved broadening of a peak, in all probability, is caused by transition from a systemwith prevalence of disseminating and absorbing particles of equal size in a system withdiffusers of different sizes.
The important question is identification of the third phase. Such compounds as, forexample, sodium fluoride and Na2SiF6 [15], can be present at the microcrystallinephase revealed. Allocation of the fluorides in a separate phase can be caused bythe known fact of their small solubility in silicate glass and propensity to crystalli-zation [2, 3]. In the case of the introduction of P2O5 in SBS glass, formation ofphosphates in the form of the teardrop-shaped particles the crystallization of which isimprobable because of propensity to glass formation [3] is quite possible. Apparently,this explains the fact that accordingly to X-ray analysis data there is only a crystallinemodification of silica, namely α -quartz (ICPDS, no. 33-116) in the samples ofthe two-phase glasses under investigation.
The intensity of crystallization increases at great tht values. This fact can beevidenced by the spectra of fluorescence which can be caused by presence ofα -quartz in the two-phase glass: the expressed peaks of fluorescence are observedat tht = 344–500 hrs (Fig. 5).
4. Conclusions
The structure of the phase-separated glasses of Na2O–B2O3–SiO2–P2O5–|F | systemsubjected to heat treatment at 550 °C during 0.5–500 hrs is investigated usingelectronic microscopy and optical spectroscopy techniques. The programs developedin MatLab environment in which the histograms of analyzed grey images are usedhave been applied for the processing of TEM images, which enabled us to analyzethe kinetics of phase separation in system under study. The deviation of growth rateof the liquation heterogeneity areas from theoretical dependence is established.
Propensity to formation of micro-heterogeneous structure in the glass-formingsystem during the cooling of glass melt is revealed.
There was found the generation of the particles of a third phase in the glasses witha two-frame structure which is formed by coexisting silica and alkali borate phases.The growth of the third phase particles with an increase in duration of the heat treatmentof a glass is shown. The presence of crystal modification of silica (α -quartz; ICPDS,no. 33-116) in this phase is established.
It is shown that the light transmission spectra and fluorescence spectra of the two--phase glasses under study are influenced by the structural transformations in glasswith an increase in duration of its heat treatment.
Acknowledgements – This work was supported by the Russian Foundation for Basic Research (projectno. 08-08-00733a) and by the Department of Chemistry and Material Science of Russian Academy ofSciences (project PFI OXNM-02 PAN, 2009). The authors thank Irina Anfimova for carrying out the heattreatments of the glasses.

Application of high resolution microscopy and optical spectroscopy ... 303
References
[1] VIDEAU J.-J., PORTIER J., PIRIOU B., Raman specrtoscopic studies of fluorophosphate glasses, Journalof Non-Crystalline Solids 48 (2–3), 1982, pp. 385–392.
[2] BROW R.K., TALLANT D.R., OSBORNE Z.A., YANG Y., DAY D.E., Effect of fluorine on the structureof phosphate glass, Physics and Chemistry of Glasses 32 (5), 1991, pp. 188–195.
[3] MÖNCKE D., EHRT D., VELLI L.L., VARSAMIS C.P.E., KAMITSOS E.I., Structure and properties of mixedphosphate and fluoride glasses, Physics and Chemistry of Glasses – European Journal of GlassScience and Technology Part B 46 (2), 2005, pp. 67–71.
[4] VELLI L.L., VARSAMIS C.P.E., KAMITSOS E.I., MÖNCKE D., EHRT D., Structural investigation ofmetaphosphate glasses, Physics and Chemistry of Glasses – European Journal of Glass Science andTechnology Part B 46 (2), 2005, pp. 178–181.
[5] YONG WAN PARK, Method of leaching high silica glass having 0.5–2.0% P2O5, Patent USAno. 3.785.793 (15.01.1974).
[6] TAKUSAGAWA N., YAMAMOTO K., KITAJIMA K., Structure of porous glass prepared from fluorine--containing sodium borosilicate glasses, Journal of Non-Crystalline Solids 95–96 (Part 2), 1987,pp. 1055–1062.
[7] EXNAR P., Macroporous glass with P2O5 and fruorides content, Proceedings of 5th ESG Conference,June 21–24, 1999, Prague, Czech Republic, p. 184.
[8] EXNAR P., Makroporézní skla, Informativní přehled, Hradec Kralove 32 (1), 1989, pp. 1–55.[9] MULEVANOV S.V., MINYIN’KO N.I., KEMENOV S.A., OSIPOV A.A., BJKOV V.N., Investigation of
the complex phosphorus-containing silicate glass by oscillation spectroscopy methods, Glass andCeramics (4), 2009, pp. 3–5 (in Russian).
[10] ANTROPOVA T.V., LURIE S.V., KOSTYREVA T.G., SIRENEK V.A., DORONINA L.A., DIKAIA L.F., Featuresof making process and a structure of the porous membranes on the basis of two-phase fluorine- andphosphorus-containing alkali borosilicate glasses, Glass Physics and Chemistry – to be published.
[11] ZHDANOV S.P., The porous glasses and their structure, WissZtschr. Friedrich-Schiller-Univ., Jena,Math.-Naturwiss. Reihe 36 (5/6), 1987, pp. 817–830.
[12] YAO S., SANTIAGO J.G., Porous glass electroosmotic pumps: Theory, Journal of Colloid and InterfaceScience 268(1), 2003, pp. 133–142.
[13] YAO S., HERTZOG D.E., ZENG S., MIKKELSEN JR. J.C., SANTIAGO J.G., Porous glass electroosmoticpumps: Design and experiments, Journal of Colloid and Interface Science 268 (1), 2003,pp. 143–153.
[14] EVSTRAPOV A.A., ESIKOVA N.A., RUDNITSKAJA G.E., ANTROPOVA T.V., Application of porous glassesin microfluidic devices, Optica Applicata 38 (1), 2008, pp. 31–38.
[15] DROZDOVA I.A., ANTROPOVA T.V., Features of the structure of phase-separated and porousborosilicate glasses with/without an impurity of fluorid-ions according to electron microscopy,Optica Applicata 38 (1), 2008, pp. 17–24.
[16] ANTROPOVA T.V., DROZDOVA I.A., The influence of synthesis conditions of porous glasses on theirstructure, Glass Physics and Chemistry 21 (2), 1995, pp. 131–140.
[17] ANTROPOVA T.V., DROZDOVA I.A., VASILEVSKAYA T.N., VOLKOVA A.V., ERMAKOVA L.E., SIDOROVA
M.P., Structural transformations in thermally modified porous glasses, Glass Physics and Chemistry33 (2), 2007, pp. 154–170.
[18] STOLYAR S.V., private communication.[19] STOLYAR S.V., ANTROPOVA T.V., PETROV D.V., ANFIMOVA I.N., Viscosity and shrinkage of the porous
and quartz-like glasses received on the basis of Na2O–B2O3–SiO2 system, Journal of AppliedChemistry 81(6), 2008, pp. 935–938 (in Russian).
[20] KUKHTEVICH I.V., ANTROPOVA T.V., EVSTRAPOV A.A., DROZDOVA I.A., Investigation ofthe nanoporous glass structure on the images received by high resolution microscopy methods,Proc. III Russ. Conf. on Nanomaterials “NANO-2009” (in Russian), Ural Pbl., Ekaterinburg, 2009,pp. 850–853.

304 T.V. ANTROPOVA et al.
[21] EVSTRAPOV A.A., ESIKOVA N.A., KLOKOV M.V., KUKHTEVICH I.V., ANTROPOVA T.V., Research ofthe porous glasses by methods of confocal laser scanning microscopy and optical microscopy ofa near field, Nauchnoe priborostroenie (Scientific instrument making) 19, 2009 (in Russian)(in press).
[22] MAZURIN O.V., ROSKOVA G.P., AVER’ANOV V.I., ANTROPOVA T.V., Two-phase glasses: Structure,Properties, Application, Nauka, Leningrad 1991, p. 276 (in Russian).
[23] MOROZOVA E.V., Phase separation in sodium borosilicate glass with additions of ZrO2 and CaO,Fizika i Khimiya Stekla (Physics and Chemistry of Glass) 17(5), 1991, pp. 726–739 (in Russian).
[24] ROSKOVA G.P., ANTROPOVA T.V., TSEKHOMSKAYA T.S., ANFIMOVA I.N., Influence of the volumes andradiuses of channels of alkali borate phases of the liquation sodium borosilicate glasses for rate oftheir interaction with an acid, Fizika i Khimiya Stekla (Physics and Chemistry of Glass) 11 (5), 1991,pp. 578–586 (in Russian).
[25] VENZEL’ B.I., ZHDANOV S.P., Kinetics of growth of the sizes of boron-phase areas in the sodiumborosilicate glasses, Fizika i Khimiya Stekla (Physics and Chemistry of Glass) 1 (2), 1975,pp. 122–127 (in Russian).
[26] MCMILLAN P., Structural studies of silicate glasses and melts – Applications and limitations ofRaman spectroscopy, American Mineralogist 69(6–8),1984, pp. 622–644.
[27] PRONKIN A.A., NARAEV V.N., TSOI TONG BEEN, ELISEEV S.U., Electroconductivity of the sodiumborate glasses containing fluorine and chlorine, Fizika i Khimiya Stekla (Physics and Chemistry ofGlass) 18 (4), 1992, pp. 52–63 (in Russian).
[28] KIPRIANOV A.A., KARPUKHINA N.G., Influence of fluorine additives on electric characteristics ofthe alkali-silicate electrode glasses, Fizika i Khimiya Stekla (Physics and Chemistry of Glass) 27 (1),2001, pp. 108–115 (in Russian).
[29] MOROZOVA E.V., Influence of stibium oxide on phase separation in alkali borosilicate glass, Fizikai Khimiya Stekla (Physics and Chemistry of Glass) 17 (5), 1991, pp. 717–725 (in Russian).
[30] KATSNEL’SON A.A., OLEMSKOI A.I., The microscopic theory of non-uniform structures, Moskow1987, p. 328.
Received November 12, 2009in revised form January 4, 2010

Optica Applicata, Vol. XL, No. 2, 2010
Effect of restricted geometry on structural phase transitions in KH2PO4 and NH4H2PO4 crystals
VLADISLAV TARNAVICH1*, LEONID KOROTKOV1, OLJA KARAEVA1, ALEXANDER NABEREZHNOV2, EWA RYSIAKIEWICZ-PASEK3
1Voronezh State Technical University, 394026, Voronezh, Russia
2Ioffe Physical Technical Institute, 194021, St Petersburg, Russia
3Institute of Physics, Wrocław University of Technology, 50-370 Wrocław, Poland
*Corresponding author: [email protected]
The dielectric response of crystalline NH4H2PO4 and KH2PO4–SiO2 and NH4H2PO4–SiO2composites prepared by embedding salts into porous glasses with the average pore diameter of320 nm has been studied at the temperature range of 85–300 K. An increase of the structure phasetransition temperatures in embedded salts has been observed, which is supposedly due to tensiledeformations of embedded crystalline particles. The antiferroelectric phase transition in confinedADP particles becomes diffuse in the temperature region around 10 K.
Keywords: ferroelectrics, antiferroelectrics, composite material, porous glass, phase transition, dielectricpermittivity.
1. Introduction
The porous structures filled with various substances are suitable material for opticaldevices [1]. The use of optically active ferroelectric fillers allows us to create opticaldevices operated by electrical voltage. However, it is known that the physicalproperties of ferroelectric materials in confinement are essentially different fromthe properties of the bulk. For example, the temperature of ferroelectric phase transitionTC in NaNO2 embedded into porous glasses decreases [2] upon reduction of averagepore diameters. On the contrary, for potassium dihydrogen phosphate (KH2PO4 –KDP) TC increases [3] with a decrease of pore diameters. These experimental factscould be explained by both the size effect and interaction between the intrinsic surfaceof pores and the material embedded.
It was suggested [3] that the observed increase of TC for embedded KDPparticles with a decrease of pore diameters (and sizes of particles) is caused bytensile deformations, which appear owing to different temperature coefficients of

306 V. TARNAVICH et al.
linear expansion of embedded material and matrix. Cooling the sample leads tothe appearance of elastic stresses in embedded nanoparticles, and it is possibleto interpret this process as an influence of “negative” hydrostatic pressure P. Due tothe strong dependence TC (P) [4] it could be a reason of growth of TC for KDPnanoparticles.
To check this assumption [3] it is expedient to study the effect of “restrictedgeometry” on phase transition (PT) temperature for other crystals of KDP family.
For comparative studies we have used the potassium dihydrogen phosphate andammonium dihydrogen phosphate (NH4H2PO4 – ADP) embedded into the identicalporous glasses. This selection has been determined by the following reasons:
1. Both compositions are crystallized in a tetragonal phase.2. The values of dTC /dP for these substances differ essentially (dTC /dP ≈
≈ –4.5 K/kbar for KDP and dTC /dP ≈ –3.4 K/kbar for ADP [4]).3. Not only dTC /dP but the linear expansion coefficients for ADP (α1 ≈
≈ 34.0–39.3×10⁻⁶ K–1 and α3 ≈ 1.9–5.3×10 –6 K–1 within temperature range203–407 K) are smaller than for KDP (α1 ≈ 20–26.6×10⁻⁶ K–1 and α3 ≈≈ 34.3–44.6×10⁻⁶ K–1 for KDP within temperature range T ≈ 123–363 K) [5]. Thislightens the interpretation of experimental results.
4. Both materials are used as active elements of optical convertors.5. The effect of restricted geometry on antiferroelectric phase transition in
KDP-family crystals has not been studied up-to-now.
2. Experiment
The experiments were performed with the samples of composites KDP–SiO2 andADP–SiO2 and polycrystalline ADP. The composites were prepared by embedding at363–368 K during 4–5 hours a KDP (ADP) saturated water solution into previouslyannealed porous glass with average pore diameter of 320 nm. The volume fraction ofthe salts embedded into the porous glass was about 12–17%. The samples werein the form of rectangular plates ≅ 10×5×1 mm3. Every time before measurementsthe samples were annealed at ~ 373 K during 4 hours for removing remnant water.Then the samples were clamped between two aluminum electrodes and placed ina cryostat, where the temperature varied from 85 to 300 K and was measured withan error not more than ±0.2 K. The measurements of dielectric permittivity ε werecarried out in the cooling and heating regimes (1–2 K/min) in nitrogen atmosphere,using LCR-meter at the frequency of 1 kHz.
3. Results and discussion
The temperature dependence of dielectric permittivity for KDP–SiO2 compositesample is presented in Fig.1. The well defined maximum of ε (T ) dependence near125 K indicates the ferroelectric phase transition. One can see that the transitiontemperature for embedded material is ≈ 125 K, i.e., 3 K higher than for KDP single

Effect of restricted geometry on structural phase transitions ... 307
crystal (TC ≈ 122 K [4]). The increase of TC in confined KDP in comparison withthe bulk material is in a good agreement with data obtained in reference [3].
It should be noted that the shape of the ε (T ) maximum for composite material hasqualitative similarity to the shape of ε33(T ) dependence observed for KDP singlecrystal [4] and for polycrystalline KDP [6] in the vicinity of TC.
Below TC the so-called plateau region is observed. Usually, the plateau regionin ε (T ) dependence is explained by high domain structure mobility which isa characteristic feature of KDP type ferroelectrics [4]. Thus, one can assumethe existence of high domain structure mobility in embedded KDP particles withina broad temperature region below the Curie temperature.
The analysis of ε (T ) dependences for polycrystalline ADP sample and compositeADP–SiO2 (Figs. 2 and 3, respectively) has shown their qualitative similarity.
One can see the step-like ε (T ) dependence and a wide temperature hysteresis ofdielectric permittivity for polycrystalline ADP in the vicinity phase transitiontemperature. Such behavior of ε unambiguously shows that the crystal under study
Fig. 1. Dielectric permittivity vs. temperature for KDP–SiO2 composite obtained at heating regime.
Fig. 2. Dielectric permittivity vs. temperature for polycrystalline ADP (1 – cooling, and 2 – heating).

308 V. TARNAVICH et al.
undergoes the first order phase transition near TC ≈ 150 K that is in agreement withreference data [4, 5].
A similar ε (T ) dependence is observed for ADP–SiO2 composite. However,the temperature hysteresis of dielectric permittivity for composite material isessentially smaller and the anomaly of ε (T ) near TC broadens evidently. So, PT inconfined ADP becomes diffuse, and we have observed the “rounding” of phasetransition as is typical of nanostructured materials. It is possible to suggest that witha decrease of sizes of ADP particles the crossover of PT from the first to the secondorder will take place. We are going to check this supposition in the future usingthe porous glasses with smaller average pore diameters.
The broadening of ε anomaly in the phase transition region makes determinationof the precise point of TC complicated. Taking into account the fact that the appearanceof a nonzero order parameter leads to a decrease of dielectric permittivity inantiferroelectric crystals [4], we find the TC ≈ 151 K to be the temperature at whichthe dependence ε (T ) decreases rapidly.
4. Conclusions
Having analyzed the experimental results we can conclude what follows:– An increase of the structure phase transition temperatures in KDP and ADP
salts embedded into the porous glass matrices (d ~ 320 nm) in comparison withthe bulk materials has been found. More pronounced effect of “restricted geometry”on transition temperature is observed for KDP particles. This speaks in favor ofthe assumption [3] that an increase of phase temperature in embedded crystals of KDPfamily is caused by tensile deformations effect.
– The antiferroelectric PT in confined ADP particles becomes diffuse inthe temperature region of about 10 K.
Fig. 3. Dielectric permittivity vs. temperature for ADP–SiO2 composite (1 – cooling, and 2 – heating);insert: ε (T ) dependences for polycrystalline and ADP–SiO2 composite, obtained during heating.

Effect of restricted geometry on structural phase transitions ... 309
– The presence of the so-called plateau region in ε (T ) dependence below TCobserved for KDP–SiO2 composite speaks in favor of the existence of a high mobiledomain structure in embedded KDP salt below TC .
Acknowledgements – This work was supported by the Russian Foundation for Basic Research (GrantsN 08-02-01089-a and N 09-02-97503-p_a) and by the Wrocław University of Technology (Poland).
References[1] KUMZEROV YU., VAKHRUSHEV S., Nanostructures within porous materials, [In] Encyclopedia of
Nanoscience and Nanotechnology, [Ed.] H.S. Nalwa, American Scientific Publishers, Vol. 10, 2003,pp. 1–39.
[2] NABEREZHNOV A., FOKIN A., KUMZEROV YU., SOTNIKOV A., VAKHRUSHEV S., DORNER B., Structure andproperties of confined sodium nitrite, The European Physical Journal E: Soft Matter 12(Supplement 1),2003, pp. 21–24.
[3] COLLA E.V., FOKIN A.V., KUMZEROV YU.A., Ferroelectric properties of nanosize KDP particles, SolidState Communications 103(2), 1997, pp. 127–130.
[4] LINES M.E., GLASS A.M., Principles and Applications of Ferroelectrics and Related Materials,Claredon, Oxford, 1977.
[5] SHASKOLSKAJA M.P., Acoustic Crystals, M. Nauka, 1982, pp. 402–425 (in Russian).[6] ZOLOTUKHIN I.V., SPITSINA S.V., YANCHENKO L.I., KOROTKOV L.N., Preparation, structure and
dielectric properties of fractale aggregates of KH2PO4, Fizika Tverdogo Tela 41(11), 1999,pp. 2059–2061 (in Russian).
Received November 12, 2009in revised form December 6, 2009

Optica Applicata, Vol. XL, No. 2, 2010
Aggregation of dyes in porous glass
OLEXANDR V. TYURIN1*, YURY M. BERCOV1, SERGIY O. ZHUKOV1, TETIANA F. LEVITSKAYA1, SERGIY A. GEVELYUK2, IGOR K. DOYCHO2*, EWA RYSIAKIEWICZ-PASEK3
1Institute of Physics, I.I.Mechnikov Odessa National University, Pasteur St. 27, 65-082 Odessa, Ukraine
2Non-Crystalline Media Department (NDL-11) of I.I. Mechnikov Odessa National University, Dvorianska St. 2, 65-082 Odessa, Ukraine
3Institute of Physics, Wrocław University of Technology, Wybrzeże Wyśpiańskiego 27, 50-370 Wrocław, Poland
*Corresponding authors: [email protected], [email protected]
The research examines the interaction of dye molecules with their dimers (H aggregates) andthe more complex formations (J aggregates) developing in porous glass. The use of porousglass when dealing with dye aggregation has resulted in obtaining photoluminescence dimers ofthe J aggregating dye, the formation of which is difficult under normal conditions. In addition,the porous glass matrix contributes to a substantial reduction in the interaction of photoexcitedstates of both a molecular and an aggregated dye, thus helping maximize the luminescenceefficiency of porous glass-distributed dyes.
Keywords: dye, porous glass, luminescence, aggregates.
1. IntroductionDyes absorb light selectively and efficiently, as they have a high quantum efficiencyof irradiation. This property of dyes is used in spectral sensibilisation of halogen-silveremulsions [1], in photoelectric transducers based on nanoparticles and nanotubes(organic dye-sensitized solar cell, DSSC) [2], and in laser equipment [3–5].
The efficiency using dyes in laser equipment, during the emission of radiation fromthe first singlet level of dye molecules is significantly complicated by the interactionbetween particular dye molecules at high concentrations. This leads to the emergenceof ordered dye dimers of the so-called H aggregates and polymolecular structure,the so-called J aggregates which absorb light in spectral ranges shifted relative tothe absorption spectrum of the molecular dye [6], promoting a decrease in the transferof photoelectrons to singlet levels of the dye molecules.
The emergence of associate dye molecules implies an opportunity for theirinteraction, which also has a significant impact on the efficiency using dye for laserequipment.

312 O.V. TYURIN et al.
The research related to the possibility of controlling the process of aggregation ofthe dye is quite significant.
It is especially important that predominant emergence of H or J aggregates in a dyeis not only related to the special structure and concentration of dye molecules inthe solution, but also the dimension and state of the sorption surface, the speciallimitation and change of state of which may change the type of dye moleculesaggregation, thus enabling one to control this process.
The latter point has served as the subject of this study dealing with peculiarities ofthe H and J aggregation of dyes, and photoexcitation of these aggregates interactionwith dye molecules in case of spatial limitation and different states of the porous glassmatrix which is a sorption surface.
2. Experiment
One of the techniques of studying the internal conversion of dye photoexcitation isthe luminescent method with a temporal resolution of spectra [7]. The experimentalfacility that was used to perform low-temperature (T = 77 K) luminescent studies isable to measure spectral values not only in continuous exciting light irradiation, butalso in case of discontinuous (modulated) excitation, when the time of excitation ofthe specimen is equal to the time of registration of its luminescence, which is0.1×10–4 s, while the interval between the end of irradiation and luminescenceregistration was 1.1×10⁻³ s.
This choice of the measuring technique was made because in continuous excitation,luminescence includes all major glows of luminescence centres: fluorescence,anomalously retarded fluorescence and phosphorescence. In modulated excitation,the glow is only caused by anomalously retarded fluorescence and phosphorescenceof luminescence centres.
The luminescence studies were performed for two J aggregating dyes of cation andanion type, whose structural formulas are presented in Fig. 1.
A porous glass matrix was chosen to be the absorption surface with twopredominant pore dimensions in the range of nanometres: matrix type A – mid-sizepore diameters d1 = 10 nm and d2 = 20 nm (conditionally “small”) and matrixtype C – mid-size pore diameters D1 = 20 nm and D2 = 50 nm (conditionally “large”),which appeared ideal in view of the limitation of the dimension of the sorption surfacethat displayed the aggregation and interaction of dyes. The procedure of measuringthe medial sizes in the nanometre range of pores is given in [8].
The implantation of the dye into the porous glass was performed by dipping it inthe dye solution and holding it there for 3 minutes, excessive dye being removed fromthe specimen surface by filter paper.
The dye solutions were made in isopropyl and polyvinyl alcohol (PVA) witha percentage of three weight percent and 5×10⁻⁴ gmol/liter of dye concentration.
The choice of these solvents was made because in transition from isopropyl alcoholto polymeric solvent, PVA, apart from doing its primary job as a solvent, can contribute

Aggregation of dyes in porous glass 313
to a change to the state of the internal surface of pores of microporous glass, aswas mentioned in the paper, thus changing the nature of dye aggregation in porousglass [9].
Pursuant to our studies and known experimental data [10–12] for the two selecteddyes, we have designed a table presenting maxima of absorption and glow of molecules(M) of dimers (H) and aggregate dyes (J), in a solution of isopropyl (Tab. 1) andpolyvinyl (Tab. 2) alcohol excited by light in the range of 400–700 nm.
Fig. 1. The 1,1'-diethyl-2,2'-cyanineiodine, hereinafter referred to as Dye-I (a); pyridine salt 3,3'-di--(γ-sulphopropyl)-4,5,4',5'-dibenzo-9-ethyltiacarbocyaninebetaine, hereinafter referred to as Dye-II (b).
a
b
T a b l e 1. Position of band maxima (nm). Solution dyes in isopropyl alcohol. (A dash means no dataavailable.)
Luminescence
Absorption Fluorescence Anomalously retarded fluorescence Phosphorescence
H M J H M J H M J H M JDye-I 440 510 540 620 570 550 – – – – 700 –Dye-II 490 600 640 570 610 650 – – 650 – 760
T a b l e 2. Position of band maxima (nm). Solution dyes in PVA. (A dash means no data available.)
LuminescenceAbsorption Fluorescence Anomalously retarded
fluorescencePhosphorescence
H M J H M J H M J H M JDye-I 470 510 540 650 570 550 – – – – 700 –Dye-II 490 600 640 570 620 650 570 – 650 – 780 –

314 O.V. TYURIN et al.
3. ResultsIn excitation with either continuous (Fig. 2a, curves 1, 2) or modulated (Fig. 2c,curve 3) light at λ = 450 nm, the luminescence spectra for the specimens of porousglass having Dye-I in isopropyl alcohol, regardless of the size of pores of the glassmatrix, are only characterised by one glow maximum, the position of which fitsthe same wavelength, and which are only different from each other by the glowmaximum intensity.
The luminescence maximum of the given band fits a wavelength of λmax ≈≈ 610–620 nm and, consequently, the glow can be referred to as fluorescence, alsoincluding anomalously retarded fluorescence of the H aggregates of Dye-I in the caseof continuous excitation, otherwise to anomalously retarded fluorescence H aggregateof Dye-I in the case of modulated excitation (see Tab. 1).
Compared to the luminescence of the solution not distributed in porous glass,the following should be mentioned: in the glow of Dye-I in porous glass, there is nophosphorescence of Dye-I molecules (λmax ≈ 700 nm), with only anomalously retardedfluorescence of the H-aggregates of Dye-I (λmax ≈ 610–620 nm).
Fig. 2. Spectra of low-temperature (T =77 K) luminescence (a, c), excitation of luminescence (b, d),in continuous (a, b) and modulated (c, d) excitation of isopropyl alcohol solution with Dye-I in porousglass matrix type A (solid line) and matrix type C (dashed line). Spectra of luminescence recorded in lightexcitation at λ = 450 nm (curves 1, 2) (a). Spectra of excitation recorded for luminescence at λ = 610 nm– curves 1', 2' (b). Spectra of luminescence recorded in light excitation at λ = 450 nm – curve 3 andλ = 550 nm – curves 4 and 5 (c). Spectra of excitation recorded for luminescence at λ = 650 nm – curves3' , 5' and at λ = 750 nm – curve 4' (d).
ab
dc

Aggregation of dyes in porous glass 315
While the solution had phosphorescence of Dye-I molecules only, there is noanomalously retarded fluorescence of H-aggregates of Dye-I.
In the spectrum of continuous excitation of the fluorescence of H-aggregates ofDye-I at λmax ≈ 610 nm, only three overlapped bands are observed with maxima atλmax ≈ 440 nm, λmax ≈ 510 nm, and λmax ≈ 540 nm which are most distinct for porousglass matrix type A (Fig. 2b, curve 1' ). These bands are related to the area of absorptionof H dimers, molecular M and J-aggregated Dye-I, respectively (see Tab. 1).
In the spectrum of modulated excitation of anomalously retarded fluorescence ofH aggregates of Dye-I (λmax ≈ 610 nm), four overlapped bands are observed atλmax ≈ 440 nm, λmax ≈ 470 nm, a low-intensity band at λmax ≈ 510 nm, and the mostintensive amongst excitation bands at λmax ≈ 540 nm (Fig. 2d, curve 3' ).
These bands may be classified as follows: the bands at λmax ≈ 510 nm andλmax ≈ 540 nm, as in the case of continuous excitation, fit the absorption of molecularand J-aggregated Dye-I. Concerning the two bands at λmax ≈ 440 nm andλmax ≈ 470 nm which fit the Dye-I dimers’ absorption region, it is for the first timethat we have seen them in the excitation spectrum of anomalously retardedfluorescence of H-aggregates of Dye-I; their nature being ambiguous, we suggestdealing with this issue during a later discussion.
When looking at the spectrum of low-temperature (T = 77 K) luminescence ofa specimen of porous glass matrix type A having a solution of isopropyl alcohol atDye-II in continuous excitation at λ = 500 nm, an intensive glow band atλmax ≈ 610 nm (Fig. 3a, curve 2) is visible and typical of the fluorescence of Dye-IImolecules. For the spectrum of continuous excitation of this glow band, a maximumis visible at λmax = 600 nm (Fig. 3b, curve 2' ), which coincides with the absorptionmaximum of molecular Dye-II (see Tab. 1).
On exposure to modulated light excitation at λmax = 600 nm from the absorptionregion of molecular Dye-II, the above specimen’s luminescence spectrum displaysa vivid band at λmax = 760 nm (Fig. 3c, curve 5) which relates to the phosphorescenceof molecular Dye-II (see Tab. 1).
The spectrum of modulated excitation of the phosphorescence of molecularDye-II (λmax = 760 nm) does not form a vivid maximum unlike in the case ofcontinuous excitation. Apart from the maximum related to the absorption of molecularDye-II (λmax ≈ 600 nm), it also displays maxima in the absorption regions of Dye-IIdimers (Fig. 3d, curve 4' ) (see Tab. 1).
On exposure to modulated light excitation from the absorption region of Dye-IIdimers (λmax ≈ 450 nm), the luminescence displays a glow band at λmax ≈ 610 nm(Fig. 3c, curve 4) which coincides with that in continuous excitation (Fig. 3a, curve 2)and, consequently, in the case of modulated excitation, it pertains to anomalouslyretarded fluorescence of molecular Dye-II (see Tab. 1).
When taking a matrix of porous glass matrix type C having a solution of isopropylalcohol with Dye-II, the luminescence spectrum in continuous light excitation atλ = 500 nm displays an overlap of three bands of luminescence at λmax = 570 nm,λmax = 610 nm and λmax = 670 nm (Fig. 3a, curve 1), which may be naturally related

316 O.V. TYURIN et al.
to the luminescence of dimers, molecules and J aggregates of Dye-II, respectively. Inthe spectrum of continuous excitation for the long-wave glow band J aggregates ofDye-II (λ = 670 nm), there are three bands at λmax ≈ 490 nm, λmax ≈ 600 nm andλmax ≈ 650 nm (Fig. 3b, curve 1' ) which fit the absorption of dimers, molecules and Jaggregates of Dye-II, respectively (see Tab. 1). This indicates that the photoexcitationof dimers and molecules of Dye-II is transferred to the J aggregates of Dye-II.
In modulated light excitation at λ = 490 nm, the luminescence spectrum has twobands at λmax ≈ 670 nm and λmax ≈ 760 nm (Fig. 3c, curve 3) which pertain to theanomalously retarded fluorescence of J aggregates and phosphorescence of molecularDye-II, respectively. In the spectrum of modulated excitation of these glow bands atλmax ≈ 760 nm, bands are found at λmax ≈ 440 nm, λmax ≈ 490 nm, λmax ≈ 600 nm andλmax ≈ 650 nm (Fig. 3d, curve 3' ).
The nature of three bands with maxima λmax ≈ 490 nm, λmax ≈ 600 nm andλmax ≈ 650 nm is clear and based on the absorption of dimers, molecules and Jaggregates of Dye-II, respectively (see Tab. 1). As to the maximum at λmax ≈ 440 nmfrom the absorption region of Dye-II dimers, we have seen this maximum for the first
Fig. 3. Spectra of low-temperature (T = 77 K) luminescence (a, c) and excitation of luminescence (b, d)in continuous (a, b) and modulated (c, d) excitation of a porous glass matrix type A (solid line) and matrixtype C (dashed line), impregnated with a solution of isopropyl alcohol with Dye-II. Spectra ofluminescence recorded in light excitation at λ = 500 nm curves 1 and 2 (a). Spectra of excitation recordedfor luminescence at λ = 700 nm – curve 2' and at λ = 670 nm – curve 1' (b). Spectra of lumines-cencerecorded in light excitation at λ = 450 nm – curves 4 and at λ = 600 nm – curves 3 and 5 (c). Spectra ofexcitation recorded for luminescence at λ = 750 nm – curves 3' and 4' (d).
ab
d c

Aggregation of dyes in porous glass 317
time displayed in the excitation spectrum of the phosphorescence of molecularDye-II, so its origin requires classifications.
The luminescence spectrum of porous glass matrix type A holding a PVA solutionwith Dye-I in continuous light excitation at λ = 450 nm is characterised by one glowband at λmax ≈ 570 nm (Fig. 4a, curve 2), which is typical of the fluorescence ofmolecular Dye-I (see Tab. 2). In the spectrum of continuous excitation of the aboveluminescence band, one band of glow excitation is seen with a maximum atλmax ≈ 510 nm which fits the absorption region of molecular Dye-I (see Tab. 2).
The specimen under study in modulated light excitation from the range of400–700 nm does not glow and, consequently, there is no phosphorescence andanomalously retarded fluorescence of H aggregates of Dye-I.
The spectra of luminescence of porous glass matrix type C having Dye-I in PVAin continuous light excitation at λ = 450 nm are based on two glow bands atλmax ≈ 570 nm and λmax ≈ 650 nm (Fig. 4a, curve 1) pertaining to the luminescence ofmolecular and H aggregated Dye-I, respectively (see Tab. 2).
In the spectrum of continuous excitation of a long-wave luminescence band atλmax ≈ 650 nm, there are three bands at λmax ≈ 470 nm, λmax ≈ 510 nm andλmax ≈ 540 nm, which in their spectral absorption coincide with the absorption rage ofdimers, molecular and J-aggregated Dye-I, respectively (see Tab. 2).
Fig. 4. Spectra of low-temperature (T = 77 K) luminescence (a, c) and excitation of luminescence (b, d)in continuous (a, b) and modulated (c, d) light excitation of a porous glass matrix type A (solid line) andmatrix type C (dashed line) impregnated with a PVA solution having Dye-I. Spectra of luminescencerecorded in light excitation at λ = 450 nm – curve 1, 2 (a). Spectra of continuous excitation recordedfor luminescence at λ = 700 nm – curves 1' , 2' (b). Spectrum of luminescence recorded in excitationby the modulated light at λ = 550 nm – curve 3 (c). Spectra of modulated excitation recorded forluminescence at λ = 750 nm – curve 3' (d).
ab
dc

318 O.V. TYURIN et al.
In modulated light excitation from the range of 400–700 nm, unlike the porousglass matrix type A having a solution of Dye-I in PVA which does not glow,the specimen with matrix type C displays a glow at λmax ≈ 650 nm (Fig. 4c, curve 3)which in its spectral position coincides with the fluorescence of Dye-I H aggregatesin continuous excitation and, consequently, can be referred to as anomalously retardedfluorescence of Dye-I H aggregates. The spectrum of modulated excitation of the aboveglow (λmax ≈ 650 nm) displays two bands at λmax =470 nm and λmax = 540 nm(Fig. 4d, curve 3' ) which fit into the absorption region of H and J aggregates ofDye-I, respectively (see Tab. 2).
Eventually, on treating the porous glass matrixes of both types with a PVA solutionhaving Dye-II, specimens were only luminescent in continuous excitation.
In the case of the specimen matrix type A in continuous light excitation atλ = 450 nm, the luminescence spectrum displays a glow band at λmax ≈ 610 nm(Fig. 5a, curve 1) which can be referred to as the fluorescence of molecularDye-II (see Tab. 2). The spectrum of continuous excitation of the above luminescenceband also comprises one band at λmax ≈ 600 nm (Fig. 5b, curve 1' ) which fitsthe absorption of molecular Dye-II (see Tab. 2).
For the specimen matrix type C in continuous light excitation at λ = 450 nm,the luminescence spectrum also displays one glow band at λmax ≈ 570 nm (Fig. 5a,curve 2) which in its spectral position fits the fluorescence of Dye-II dimers (seeTab. 2). In the spectrum of continuous light excitation, this band displays one bandexcitation at λmax ≈ 490 nm (Fig. 5b, curve 2' ) which in its spectral position fitsthe absorption of Dye-II dimers (see Tab. 2).
It is important that far more intensive glow is seen in the porous glass matrix ofthe PVA solution with Dye-II compared to the isopropyl alcohol solution with Dye-II(versus the intensity of luminescence in continuous excitation – Fig. 5a, curves 1, 2,and Fig. 3a, curves 1, 2).
Fig. 5. Spectra of low-temperature (T = 77 K) luminescence (a) and excitation of luminescence (b) withcontinuous light in porous glass matrix type A (solid line) and matrix type C (dashed line) impregnatedwith a PVA solution with Dye-II. Spectra of luminescence recorded in light excitation at λ = 450 nm –curves 1 and 2 (a). Spectra of excitation recorded for luminescence at λ = 750 nm – curve 1' and 2' (b).
ab

Aggregation of dyes in porous glass 319
4. Discussion
The luminescence spectrum of Dye-I in isopropyl alcohol and PVA, excited withmodulated light from the range of 400–600 nm, displays a glow band caused bythe phosphorescence of molecular Dye-I (λmax ≈ 700 nm, see Tab. 2). It is known [13]that such phosphorescence is only visible when dye molecules are adsorbed on H or Jaggregates of the dye.
In the case of distribution of a Dye-I solution in isopropyl alcohol, the porous glassmatrixes of both types does not display a phosphorescence of the Dye-I regardless ofdimensions of pores – neither in the case of continuous nor modulated light excitationfrom the range of 400–600 nm, while displaying a fluorescence of H aggregatedDye-I, including that anomalously retarded (λmax ≈ 640 nm).
Besides, the point should be made that modulated excitation of luminescence ofH aggregates from the absorption regions of molecular Dye-I (λmax ≈ 510 nm) hasa minor efficiency and is accompanied by a low glow intensity.
Conversely, modulated excitation of luminescence of Dye-I H aggregates fromthe absorption regions of Dye-I dimers (λ = 450 nm) is not only accompanied bya more intensive glow of H aggregates, compared to the excitation from the absorptionbands of molecular Dye-I, but also – for the porous glass matrix type A (withpredominantly “small” mid-size pores) – by the appearance of an extra maximum ofexcitation at λmax ≈ 470 nm. It is for the first time that we have recorded the appearanceof a new maximum of luminescence excitation of Dye-I H aggregates, which perhapsimplies the existence of two types of H aggregates in the glass matrix depending onthe dimensions of pores, since, in transition to porous glass matrix type C (withpredominantly “large” pores), the spectrum of modulated excitation of anomalouslyretarded fluorescence of Dye-I H aggregates does not display an extra maximum inthe absorption regions of dimers.
These results indicate that porous glass matrix type A has a predominant formationof Dye-I H aggregates, while in the solution this dye mostly forms J aggregates. Inaddition, the interaction of molecular Dye-I and its H and J aggregates formingin porous glass is minimised.
In the case of distributing the Dye-I solution in PVA in a porous glass matrixtype A, it displays a fluorescence of molecular Dye-I, whilst no fluorescence of dimers.Consequently, PVA has an impact on the character of Dye-I adsorption, which resultsin the fact that the formation of Dye-I dimers in a PVA solution in a porous glass matrixtype A is hindered. For the glass matrix type C the formation of Dye-I dimers in PVAoccurs, while not being predominant, unlike in the case of Dye-I solution in isopropylalcohol in porous glass matrices of both types.
The spectrum of luminescence of Dye-II dissolved in isopropyl alcohol out ofa porous glass excited with continuous and modulated light from the range400–700 nm displays two fluorescent glow bands, including the fluorescence ofanomalously retarded J aggregates and Dye-II molecules. It is important that

320 O.V. TYURIN et al.
the spectrum of excitation of phosphorescence of Dye-II molecules displaysa maximum in the absorption region of dimers, molecules and J aggregates.
When distributing Dye-II dissolved in isopropyl alcohol in porous glass matrixtype A no fluorescence of Dye-II J aggregates is found, while only phosphorescenceoccurs, including anomalously retarded fluorescence of Dye-II. Thus, porous glassmatrix type A hinders the formation of Dye-II J aggregates, while they are only formedin porous glass matrix type C.
The glass matrix has a greater impact on the aggregation of Dye-II in a PVAsolution. In this case, porous glass matrix type A does not form any aggregates,the luminescence spectrum only having a fluorescence of molecular Dye-II. In porousglass matrix type C only the dimerisation of Dye-II takes place, with no formation ofJ aggregates.
5. Conclusions
Based on our analysis, the following may be concluded:1. Porous glass has a substantial impact on the aggregation of a dye and, depending
on the size of pores, may lead to complete disappearance of aggregation, even at a highdye concentration in the solution, which greatly widens the possible category ofthe dye used in laser.
2. The use of the matrix of the porous glass contributes to a change of the featuresof predominant dye aggregation. An example is the 1,1' -diethyl-2,2'-cyanineiodinewhich mostly forms J aggregates in isopropyl alcohol solution and PVA. It is forthe first time that we have seen predominant formation of dye dimers in porous glass,while the formation of J aggregates was difficult.
3. If a dye solution displays an interaction between aggregates and molecules ofdye which reduces the intensity of luminescence of the dye solution, the use of porousglass will minimise this interaction, thus to a large extent enhancing the intensity ofluminescence of the dye. This is substantial in the use of the dye in lasers.
References[1] SHAPIRO B.I., Basis Theory of the Photographic Process, Editorial URSS, Moscow, 2000, p. 646.[2] O’REGAN B., GRÄTZEL M., Photochemical method for the conversation of light into chemical energy,
Nature 353, 1991, pp. 737–747.[3] BEZRODNY V.I., DEREVIANKO N.A., ISHENKO A.A., KARABANOVA L.V., Laser of dye on basis of
polyurethane matrix, Zhurnal Tekhnicheskoi Fiziki 71(7), 2001, pp. 72–78 (in Russian).[4] ALDEG G.R., DOLOTOV S.M., KOLDUNOV M.F., KRAVCHENKO YA.V., MANENKOV A.A., PACHIKO D.P.,
PONOMARENKO E.V., REZNICHENKO A.V., ROSKOVA G.P., TSEKHOMSKAYA T.S., Composite a micro-porous glass – a polymeric compound: a new material for solid-state dye laser, KvantovayaElektronika 30(11), 2000, pp. 954–958 (in Russian).
[5] KUZNECOV K.A., LAPTINSKAYA T.V., MAMAEV YU.B. et al., Gereration third harmonic in J-aggregateimmobilization in polymer matrix, Kvantovaya Elektronika 34(10), 2004, pp. 927–929 (in Russian).

Aggregation of dyes in porous glass 321
[6] DIETZ F.J., Zum Stand der Theorie der spektralen Sensibilisierung, J. Signal AM 6(4–5), 1978,pp. 245–266, 341–361.
[7] SADIKOVA A.A., KOZAKOV B.I., MEYKLIAR P.V., LOGINOVA I.S., Application method of the temporaryof luminescence spectra resolution for examination of microcrystal emulsion, ZNiPFiK 30(6), 1985,pp. 457–459.
[8] RYSIAKIEWICZ-PASEK E., GEVELYUK S.A., DOYCHO I.K., VOROBJOVA V.O., Application of porousglasses in ophthalmic prosthetic repair, Journal of Porous Materials 11(1), 2004, pp. 21–29.
[9] ROSSI U.D., DAEHNE S., REISFELD R., Photophisical properties of cyanine dyes in sol–gel matrices,Chemical Physics Letters 251 (5–6), 1996, pp. 259–267.
[10] GILMAN P.B., The luminescent properties of 1,1'-diethyl-2,2'-cyanine alone and absorbed to silverhalides, Photographic Science and Engineering 11(4), 1967, pp. 222–232.
[11] GILMAN P.B., Effects of aggregation, temperature and supersensitization on the luminescence of1,1'-diethyl-2,2'-ceanine adsorbed to silver chloride, Photographic Science and Engineering 12(5),1968, pp. 230–273.
[12] COOPER W., Electronic adsorption, luminescence and related properties of resolved J-aggregatesof 1,1'-diethyl-2,2'-cyanine adsorbed to silver halide, Photographic Science and Engineering 17(2),1973, pp. 217–225.
[13] TYURIN A.V., CHURASHOV V.P., ZHUKOV S.A., MANCHENKO L.I., LEVITSKAYA T.F., SVIRIDOVA O.I.,Interaction dye molecular and polymolecular formation, Optika i Spektroskopia 104(1), 2008,pp. 97–103 (in Russian).
Received November 12, 2009in revised form December 25, 2009

Optica Applicata, Vol. XL, No. 2, 2010
Photoluminescence features of AgBr nanoparticles formed in porous glass matrices
IGOR K. DOYCHO1*, SERGIY A. GEVELYUK1, OLEXANDR O. PTASHCHENKO1, EWA RYSIAKIEWICZ-PASEK2, TETIANA M. TOLMACHOVA1, OLEXANDR V. TYURIN3, SERGIY O. ZHUKOV3
1Non-Crystalline Media Department (NDL-11) of I.I. Mechnikov Odessa National University, Dvorianska St. 2, 65-082 Odessa, Ukraine
2Institute of Physics, Wrocław University of Technology, Wybrzeże Wyśpiańskiego 27, 50-370 Wrocław, Poland
3Institute of Physics, I.I. Mechnikov Odessa National University, Pasteur St. 27, 65-082 Odessa, Ukraine
*Corresponding author: [email protected]
The photoluminescence of AgBr nanoparticles formed by a two stage liquid-gas microsynthesistechnology in two types of porous glass with different sizes of pores was investigated. Polyvinylalcohol (Polinol) was used as a binder. It has been found that AgBr nanoparticles in the glasseswith smaller pores luminesce more intensively, and we attribute this phenomenon to the differ-ences in pore size distributions. The luminescence spectra were shown to have two maximacorresponding to AgBr nanoparticles formed within the nanopores of two different sizescharacteristic of each of the matrices. In both cases, the spectra excited by xenon lamp irradiationare more intensive than those stimulated by a 337-nm nitrogen laser. Comparing the maxima shiftsin the phosphorescence excitation spectra with ones in phosphorescence spectra we can concludethat the luminescence and phosphorescence centers in AgBr nanoparticles are of identical naturein the matrices of both types. The investigation results fit neatly into the inherently consistentquantum confinement model and are well correlated with the poroscopic spectra of both types ofglass.
Keywords: porous glasses, silver bromide, nanoparticles, luminescence properties, quantum confinement.
1. IntroductionIt is well known [1] that AgBr crystallizes into a face-centered cubic crystal latticewith NaCl structure (space group ) or into a simple cubic crystal lattice with CsClstructure (space group ) depending on the acidity of the medium. The most probableshape of nanocrystallites are cubes characteristic for these space groups. AgBr is oneof the basic photographic materials and its photographic properties are the result of
Oh5
Oh1

324 I.K. DOYCHO et al.
deviations from an ideal crystal structure. Since there is no immediate correlationbetween concentration of the ingredients of the reaction and the concentration ofthe nanoparticles obtained the latter can be evaluated only qualitatively. The metalsilver phase in this case was not formed as its appearance would be accompaniedby sample blackening, which was not observed. The majority of defects in AgBr arethe Frenkel defects concentrated near the surface of its particles [2].
To provide the high-resolution photographic material with good radiationsensitivity the task of vital concern is to create AgBr particles within the mediumpreventing formation of large conglomerations. The presence of nanodimensionalpores makes porous silicate glasses a good medium for the purpose [3–6]. They areof interest not only as a model medium for investigating various quantum confinementeffects, etc., but they are also promising as a matrix for creating radiation sensitive,photoresponsive and photochromic materials with extended range of sensitivity,resolution and, possibly, optical density. These perspectives come about throughthe possibility of introducing into the matrix a considerable amount of sensitivematerial avoiding at the same time the danger of large conglomerations developing,which reduce the material resolution and deteriorate its radiation sensitivity. The poresize distribution restricts nanoparticle size growth within the pores, whereasspecial features of the formation technique ensure nanoparticle fineness. The size ofthe nanoparticles being formed is determined by the microsynthesis technique. SmallAgBr particles will tend to form the energetically advantageous crystallites of spacegroup . Energetically unfavorable coral-like “sprouting” of AgBr into the adjacentpores could occur at the excess concentration of the reaction components within pores,but we deliberately created a deficient concentration. If, along with the nanoparticles,large microcrystallites of irregular shape were formed inside the pores, the position ofthe photoluminescence spectra peak would correspond to single-crystal AgBr inpolyvinyl alcohol (~800 nm). Therefore, the nanoparticle contribution would becomeapparent through additional spikes shifted into the short-wave region. However, wehave observed the system shift of all maxima towards higher energies. Such a shift ischaracteristic of the system of nanoparticles without any single-crystal formations.
In the present paper, a technique of silver-halide nanoparticle formation issuggested, which does not result in the development of such conglomerations.The photoluminescence centers in AgBr particles are known to be concentrated neartheir surface interacting directly with binder molecules, thus the selection of a binderis crucial. It has been shown earlier [7–9] that gelatin is not a suitable binder becauseits molecules are too big to transport AgBr nanoparticles into the nanopores. For thispurpose, we employed polyvinyl alcohol (Polinol), a substance not commonly usedfor creation of photosensitive media. Since Polinol molecules are essentially smallerthan gelatin ones, the Polinol being a binder serves also as a delivery vehicletransporting silver particles into the finest pores. For AgBr particles formed withPolinol assistance within porous matrices of two types [10] we succeeded in observingthe quantum confinement effect. The results of investigating the phosphorescenceexcitation spectra and phosphorescence and luminescence ones can be consistently
Oh5

Photoluminescence features of AgBr nanoparticles ... 325
explained in terms of the quantum confinement model. The effects induced byformation of AgBr nanoparticles within the pores of two predominant sizes,characteristic of each of the two matrices, fit neatly within the frame of the model. Atthe same time, all observations demonstrate a good correlation with the poroscopicspectra for both types of glasses [11].
2. ExperimentThe special features of the liquid-gas microsynthesis procedure are such that, in spiteof the wide range of pore sizes in the matrix (from several to hundreds of nanometers),only small particles (of the order of several nanometers) can develop within the pores.This should be expected from the minimum total energy principle, and this is confirmedby the photoluminescence spectra where the position of spectrum peaks, beingsubstantially different from that typical of a single crystal, shifts into the higher energyregion, which is a manifestation of the quantum confinement effect characteristic ofnanoparticles. Thus, in our investigation, we can consider only small pores since ourtechnique [12] ensures no contribution of large ones to photoluminescence. Thusan A-type porous silicate glass was selected as a matrix with pores of minimal sizesprevailing in the range of pore size distribution under consideration. To trace a possiblesystem shift we used for comparison a C-type glass as a reference material withsomewhat larger prevalent pore sizes. Both types of glass were produced without silicagel leaching out [13].
The pore size distributions in both types of glass were obtained earlier [11]; ascan be seen in Fig. 1 they are relatively narrow. We were trying to createthe nanoparticles of AgBr, so our interest is only with the fine pores which should limitthe growth of AgBr particles within a nanometric range of sizes where quantumconfinement effects can be observed. Defining role in our studies was played by twosmallest fractions in pore size distributions, since it is just in such pores that the silverhalide nanoparticles can form. These two fractions in A- and C-type glasses aredistinguishable, as can be seen in Fig. 1, and due to this difference the matrix typeinfluences the nanoparticle forming conditions and, therefore, their luminescent
Fig. 1. Pore-size distribution spectra forA- and C-type porous silicate glass.
326 I.K. DOYCHO et al.
spectra. We did not take into account a possible presence of large pores in the matricesof both types since we extended to AgBr the microsynthesis technique developed forCdS [12, 14]. Owing to such a technique, on the inner surfaces of large pores onlythe islets of binder monolayer can appear containing the same AgBr nanoparticles,which do not lead to development of additional maxima in photoluminescence spectra.
To create AgBr nanoformations within the matrix we saturated the appropriateporous glass with one-molar AgNO3 aqueous solution with a 3% Polinol addition.After an hour’s holding in the solution necessary for silver ions to penetrate intothe finest pores, the specimen was exsiccated for 30 minutes at approximately 40 °C,and after that for twenty-four hours it was held in bromine vapors.
In the case of silver haloids, the photoluminescence centers at low temperaturesare the same centers that provide photosensitivity at room temperature. These twoproperties of silver haloids are complementary, which means that if there is a photo-luminescence at liquid-nitrogen temperature, at room temperature the photosensitivityshould be expected. However, an increase in the intensity of photoluminescence is notconnected directly with photosensitivity growth, but is only indicative of an increasein the quantity of silver halide nanoparticles with the suitable relationship betweentheir volume and their surface area.
Being actually one and the same recombination process the fluorescence andphosphorescence are distinguished only by the excited-state lifetimes of the lumines-cence centers. However, as fluorescence correlates with the size of particles containingthese centers, and phosphorescence characterizes the centers themselves and makes itpossible with sufficiently good resolution to distinguish the traps indistinguishablewithin the lifetime range of up to 10–5 s, both phenomena are conveniently studiedseparately in the different sample excitation modes. The luminescence and phospho-rescence spectra excited by a 337-nm nitrogen laser or 1 kW xenon lamp were recordedat 77 K with standard equipment [15]. The laser and xenon lamp sample excitationregimes do not require any special calibration for comparison of results. Both sourcesof excitation are parts of one and the same installation, use the same register systemand the excitation mode is changed by a simple switch in the exciting unit. We did notinvestigate the efficiency of quantum luminescence in this case, since this exceedsthe scope of the problem formulated.
To record the phosphorescence spectra excited by the xenon lamp twomonochromators are used. The first performs a spectral decomposition of the lamplight, and through the second one a luminescence beam goes from the samplebefore hitting a photodetector. A possible internal photoelectric effect as a result ofxenon lamp irradiation could have a significant influence on single-crystal AgBr, butfor the carriers inside nanoparticles the forbidden band is considerably wider andthe photoelectric threshold shifts towards higher energies.
At the beginning, knowing from the photoluminescence spectrum in what spectralrange it is necessary to look for the phosphorescence peak, the sample is excited bya sufficiently broadband within this range. Having the peak located, the secondmonochromator in front of the photodetector is adjusted to the corresponding

Photoluminescence features of AgBr nanoparticles ... 327
wavelength. After that the first monochromator scans the broad spectral band ofthe excitation source providing as a result the excitation spectrum of this particularmaximum of the phosphorescence spectrum. Such a procedure makes it possible tosegregate maxima of the phosphorescence spectrum, which can overlap inphotoluminescence investigation. Each separate maximum corresponds to a specifictype of traps, and therefore the spectrum of phosphorescence excitation showsthe excitation energy of this particular trap.
Optical polarization inside such essentially isotropic system as porous glass ispossible only for sufficiently long molecules, for example, organic dyes or liquidcrystals sensitive to the conditions on the surface inside the pores. But in our case, forsufficiently symmetrical nanoparticles the optical polarization is hardly probable andwas not investigated.
3. Results
For A- and C-glasses with AgBr nanoparticles created with Polinol assistancethe luminescence spectra excited by a 337-nm nitrogen laser are presented in Fig. 2;and in Fig. 3 are the ones excited by 430-nm xenon lamp. Comparing the spectra inFigs. 2 and 3 shows that for both types of glass the intensity of luminescence excitedby xenon lamp is almost 10 times higher. The spectra of AgBr nanoparticles inA-type matrix for both methods of excitation have two characteristic maximawith approximately 130-nm system shift. The laser-excited spectrum shows a moreintensive short-wave maximum against the background of relatively insignificantoverall luminous intensity. With a xenon lamp excitation the intensity redistributionbetween the maxima occurs, they become comparably-intensive and the luminosity ofboth sharply increases. The same effect is observed for C-type matrix, but here
Fig. 2. Photoluminescence spectra of AgBr nanoparticles excited by 337-nm nitrogen laser in two typesof porous glass.
Fig. 3. Photoluminescence spectra of AgBr nanoparticles excited by 430-nm xenon lamp in two types ofporous glass.

328 I.K. DOYCHO et al.
the system shift between maxima is less almost by half (about 70 nm), the lumines-cence intensity is substantially lower and there is no intensity redistribution. With bothexcitation methods in the luminescence spectra of AgBr nanoparticles in C-typematrix only the short-wave maximum is strongly pronounced, while the second oneat 430 nm excitation is diffuse and spread-out, and at 337-nm excitation it is barelyperceptible.
In the photoluminescence spectra we observe the shift of the peak into the short--wave region in comparison with the spectra of AgBr microcrystallites, known fromthe literature, obtained with the same binding agent. It is precisely a manifestation ofthe quantum confinement effect. The phosphorescence spectra and the phosphores-cence excitation spectra do not refer to the quantum confinement effect, and theircomparison just helps to separate the contributions into the luminosity fromenergetically close long- and short-lived centers.
The system shift of the spectra can also be traced through comparison of maximaposition in phosphorescence excitation spectra and those in the phosphorescence
a b
Fig. 4. Phosphorescence excitation spectra (a) and phosphorescence ones (b) of AgBr nanoparticles inA-glass.
a b
Fig. 5. Phosphorescence excitation spectra (a) and phosphorescence ones (b) of AgBr nanoparticles inC-glass.

Photoluminescence features of AgBr nanoparticles ... 329
spectra of AgBr nanoparticles Polinol-implanted into both types of matrices. ForA-type matrix these spectra are shown in Fig. 4, and for C-type glass in Fig. 5. A single--humpedness of all maxima indicates that the corresponding traps are elementary oneswithout any fine structure. In the phosphorescence spectra of AgBr nanoparticles inA-glass two maxima can be seen at a wavelength λmax of approximately 580 and720 nanometers, for which there are also two corresponding peaks in the spectraof their phosphorescence excitation with λmax ≈ 420 nm and 550 nm, respectively. Inthe phosphorescence spectra of C-glass with AgBr nanoparticles also two maxima ofluminosity are observed (approximately at 570 nm and 660 nm) for which there arealso two corresponding peaks in the spectra of their phosphorescence excitation withλmax ≈ 440 nm and 465 nm, respectively. Thus, the maxima in the spectra ofphosphorescence excitation, just as the maxima of phosphorescence spectra for bothmatrices, are shifted into the long-wave region with an increase in the excitingwavelength.
4. Discussion
It is known [16] that at 77 K the photoluminescence spectrum of AgBr microcrystalsin a Polinol binder solution demonstrates one strongly pronounced maximum at680 nm. Both maxima that we observed in the luminescent spectra were shifted from680-nm into the short-wave region, which is explained by the quantum confinementeffect and confirms that we succeeded in creating AgBr nanoparticles. The presenceof two peaks in the photoluminescence spectra corresponds to the nanoparticles formedin pores of two basic fractions (see Fig. 1). The absence of any traces of a 680-nm peakin the spectra confirms that our two stage liquid-gas technique of microsynthesisprevents the reagents from filling the large pores where the microcrystals could form.
As can be seen in Fig. 1, the luminosity of nanoparticles created in C-type matrixis considerably weaker, for there are fewer pores of appropriate sizes than in A-typematrix. The long-wave excitation power of xenon lamp is higher than that of a pulsedlaser, so the intensity of laser-stimulated luminosity for both glasses is 10 times lower.Because the xenon lamp is more powerful and can activate some radiativerecombination centers in bigger particles, the lamp-excited A-glass photoluminescencedemonstrates the intensity redistribution from the maxima of the AgBr nanoparticlesin favor of those radiative recombination centers. At the same time, since the pulsedlaser UV radiation fades being scattered strongly by the fine pores, the majority ofthe carriers in bigger particles recombine nonradiatively. For C-glass nanoparticlesthe effect is practically nonexistent because of the weak luminous intensity.
As the wavelength of the exciting radiation shortens the maxima ofphosphorescence the excitation spectra are shifted into the short-wave regionsimultaneously with the respective peaks in phosphorescent spectra, for two sizes ofAgBr nanoparticles in the matrices of both types. This is the evidence thatquantum confinement effect takes place for AgBr nanoparticles in pores of appropriatesizes.

330 I.K. DOYCHO et al.
Presented in Figs. 4 and 5 the phosphorescence spectra and the correspondingphosphorescence excitation spectra, as well as their system shift with the change inthe excitation wavelength, confirm that luminescence and phosphorescence centersin AgBr nanoparticles are of identical nature for matrices of both types.
The investigation of light emission by AgBr crystallites [17, 18] has shownthat lattice defects can play the role of luminescence centers. As is known [2],the luminescence centers in AgBr without binder are the atom-molecule dispersioncenters formed by the elementary combinations of interstitial atoms with silver ions.They can be distinguished by the presence of cation vacancies in these centers [17].The only one peak in the phosphorescence spectra (Figs. 4, 5) suggests that there isonly one type of luminescence centers, namely, the inherent in AgBr Frenkeldefects [1], that is, the complexes of interstitial silver ions and silver vacancies
[2]. In this case, the Polinol binder molecules stabilize the surface interstitialluminescence centers in AgBr through their agglomeration. When light falls onthe surface of AgBr nanoparticle a photoelectron is generated in the conduction bandat the expense of the halogen electron [18]:
X– + hν → X + e–
After being generated, the electron tends to be bonded with an interstitial silverion to form a neutral atom :
e– + →
Simultaneously with a nonequilibrium electron a nonequilibrium hole h+ is formed,which also tends to be neutralized. The lifetime of a nonequilibrium hole, however,does not correlate with the electron lifetime. This is a consequence of differenttrapping mechanisms: it was shown [18] that traps for the holes are the mobile,negatively charged lattice defects, namely, the silver vacancies , with which theyform the hole complexes:
h+ + ↔ h·Agv
Formation of the hole complexes h·Agv reduces energy of the componentssufficiently for their stabilization and reduction in the probability of the hole ejectionback into the valence band. As a result of the concentration gradient creation the holesdiffuse to a nanoparticle surface where their lifetime is much longer than withinthe bulk of crystallite, and where they are in equilibrium with the adsorbed bromine.The final result of this equilibrium is the stimulation of an increase in the number ofholes at the surface, which makes up for the phosphorescence.
The fundamental absorption edge in AgBr can reach 500 nm [3, 19], hencethe subsequent recombination of nonequilibrium carriers is a band-to-band one. Thus
Agi+
Agv–
Agi+ Agi
0
Agi+ Agi
0
Agv–
Agv–

Photoluminescence features of AgBr nanoparticles ... 331
the shift of phosphorescence excitation maximum into short-wave region witha decrease in the sizes of AgBr nanoparticles makes it possible to speak about sucha manifestation of the quantum confinement effect as the band-gap broadening.
5. Conclusions
For porous glasses a liquid-gas microsynthesis technique is developed for the Polinolassisted formation of AgBr nanoparticles within the pores.
The technique ensures the uniformity of bulk distribution of AgBr nanoparticleswithin the matrix and makes it possible to increase silver halide concentration ingelatin- or Polinol-type binding solutions. In that way, it opens up prospects bothfor creating more responsive radiation sensors and for further development ofphotochromic media.
Two maxima in the luminescence spectra of AgBr nanoparticles correspond tothe two fractions of predominant pore sizes. This is confirmed by the system shift ofmaxima in the photoluminescence spectra, in phosphorescence excitation spectra, andin the phosphorescence ones, depending on the prevalent pore sizes in each glass.
Upon transition from AgBr nanoparticles in A-type glass to the ones created inC-glass a tendency towards weakening the quantum confinement effect takes place,which manifests itself in the reduced system shift of the luminescence spectra peaksinto the long-wave region with a simultaneous sharp decrease in their intensity.
A single-humpedness of all maxima in phosphorescence spectra and inthe corresponding phosphorescence excitation spectra indicates that the relatedtraps are elementary ones without any fine structure. And the maxima simultaneoussystem shift with the change in the exciting wavelength confirms that luminescenceand phosphorescence centers in AgBr nanoparticles are of identical nature for matricesof both types.
References
[1] GLAUS S., CALZAFERRI G., The band structures of the silver halides AgF, AgCl, and AgBr:A comparative study, Photochemical and Photobiological Sciences 2 (4), 2003, pp. 398–401.
[2] SLIFKIN L.M., The physics of lattice defects in silver halides, Crystal Lattice Defects and AmorphousMaterials 18, 1989, pp. 81–96.
[3] GLAUS S., CALZAFERRI G., The band sructures of the silver halides AgF, AgCl, and AgBr:A comparative study, Photochemical and Photobiological Sciences 2 (4), 2003, pp. 398–401.
[4] HAILSTONE R.K., DE KEYZER R., Latent-image formation in tabular AgBr grains: experimental studies,The Imaging Science Journal 52(3), 2004, pp. 151–163.
[5] OVECHKO V., SCHUR O., Size spectroscopy of porous glasses and porous glasses with metalnanoparticles using UV-VIS and X-ray radiation, Optica Applicata 35(4), 2005, pp. 735–743.
[6] MIKHAYLOV V.N., STASEL’KO D.I., Ipulse defectolyse in the emulsion nanocrystals AgBr:Recombination processes in the early stadia of defectolyse, Optics and Spectroscopy 102, 2007,pp. 962–966 (in Russian).
332 I.K. DOYCHO et al.
[7] MESHKOVSKY I.K., Composition of Optical Materials on Base of Porous Matrixes, SPb, 1998,pp. 148–176 (in Russian).
[8] SUKHANOV V.I., KHAZOVA M.B., SHELEKHOV N.S., ANDREYEVA O.V., KURSAKOVA A.M.,TSEKHOMSKA T.C., RASKOVA G.P., SOLOMATIN Y.V., Volumetric Phase Diagrams in the Light--Sensitive Systems Having a Capillary Structure, Optical Holography with Three-DimensionalRecording, Nauka, L. 1989, pp. 86–105 (in Russian).
[9] SHORE J.D., Molecular Dynamics Simulation of Nucleation of AgBr from Solution, AmericanInstitute of Chemical Engineering, 1999.
[10] RYSIAKIEWICZ-PASEK E., VOROBYOVA V.A., GEVELYUK S.A., DOYCHO I.K., MAK V.T., Effect ofpotassium nitrate treatment on the adsorption properties of silica porous glasses, Journal ofNon-Crystalline Solids 345–346, 2004, pp. 260–264.
[11] RYSIAKIEWICZ-PASEK E., GEVELYUK S., DOYCHO I., VOROBJOVA V.A., Application of porous glassesin ophthalmic prosthetic repair, Journal of Porous Materials 11 (1), 2004, pp. 21–29.
[12] GEVELYUK S.A., DOYCHO I.K., MAK V.T., ZHUKOV S.A., Photoluminescence and structuralproperties of nano-size CdS inclusions in porous glasses, Photoelectronics 16, 2007, pp. 75–79.
[13] JANOWSKI E., HEYER W., Porose Glasser, VEB Deutscher Verlag für Grundstoffindustrie, Leipzig,1982.
[14] RYSIAKIEWICZ-PASEK E., ZALEWSKA M., POLAŃSKA J., Optical properties of CdS-doped porousglasses, Optical Materials 30 (5), 2008, pp. 777–779.
[15] DOYCHO I.K., GEVELYUK S.A., KOVALENKO M.P., PROKOPOVICH L.P., RYSIAKIEWICZ-PASEK E., Smalldoses γ-irradiation effect on the photoluminescence properties of porous glasses, OpticaApplicata 33(1), 2003, pp. 55–60.
[16] YEFIMOV S.P., ZAKHAROV V.I., KARTUZHANSKY O.L., MARTYSH G.G., SHUR L.I., Luminescence andlight-sensitivity of primitive AgBr photographical emulsions with absolute and partial substitutiongelatin with polinol, Journal of Scientific and Applied Photography and Cinematography 23(5),1978, pp. 351–358 (in Russian).
[17] MALINOWSKI J., The role of holes in the photographic process, The Journal of PhotographicScience 16 (2), 1968, pp. 57–62.
[18] MAKLAR P.V., Physical Processes by Forming of the Latent Photographic Image, Nauka, M. 1972,p. 339 (in Russian).
[19] JAMES T., Theory of Photographical Process, Chemistry, L. 1980, p. 646 (in Russian).
Received November 12, 2009in revised form April 14, 2010

Optica Applicata, Vol. XL, No. 2, 2010
Porous glasses as a substrate for sensor elements
ANATOLY EVSTRAPOV1, NADYA ESIKOVA1*, GALINA RUDNITSKAYA1, TATYANA V. ANTROPOVA2
1Institute for Analytical Instrumentation, Russian Academy of Sciences, Rizhsky Pr., 26, 198103 Saint-Petersburg, Russia
2Grebenschikov Institute of Silicate Chemistry, Russian Academy of Science, Nab. Makarova, 2, Saint-Petersburg, Russia
*Corresponding author: [email protected]
The properties of porous glasses are determined by optical spectroscopy and high-resolutionmicroscopy at different stages of immunoglobulin immobilization and after immune reaction.The influence of duration and temperature of drying between surface activation and silanizationis studied. The quantity of protein immobilized on the porous glass surface is estimated bythe Coomassie method. Various ways of surface silanization with the use of toluene and acetoneare compared. The possibility of fabricating a microsensor element based on the porous glass formicrochip is presented.
Keywords: porous glass, sensor element, laser scanning confocal microscopy, scanning near field opticalmicroscopy, optical spectrometry.
1. IntroductionDesigning microfluidic chip (MFC) devices is one of the perspective directions inthe development of microanalytical systems. The chips make it possible to manipulatewith picoliter volumes of samples and reagents, including dosing, mixing, carryingout chemical reactions, etc., [1, 2]. Microanalytical systems with the new propertiesand high technical characteristics can be developed by means of integrating the newelements into an MFC. These may be fabricated on the basis of porous glasses (PG)(for example, sensors elements, micropumps, columns, reactors, etc.)
Modern technologies made it possible to produce PG with pores of nanometer sizes(from 2 to 500 nm) and known structural characteristics [3, 4]. PG’s optical propertiesallow using high-sensitivity methods for detection and registration of samplecomponents.
In order to design an element of a sensor on the basis of PG it is necessary to chooseoptimal methods of PG surface activation, modification and sensitive substanceimmobilization. This requires studying optical and structural characteristics of glassesat different stages of preparation of the sensor element. So, characterization of glassesat different stages by methods of high resolution microscopy and optical spectroscopyis a topical issue.

334 A. EVSTRAPOV et al.
2. Experiment 2.1. MotivationIn order to study the features of biological substance immobilization on a PG surface,the PG made of biphasic glass 8 V was used. It has a developed surface and high opticaltransmittance in visual and infrared spectral ranges (80–93% at a wavelength of340–850 nm for a 0.2 mm sample thickness). The average pore radius of the samplesis 85.5 nm, the specific pore surface is 88.8 m2/g (Institute of Silicate Chemistry RAS).These parameters are suitable for designing sensor elements with good permeabilityfor liquid probes. The PG size is 8×8×0.2 mm.
Fabrication of the sensor element required: activation of the hydroxyl groups onthe PG surface, with the purpose to silanize the surface, to treat it with bifunctionalreagent (glutaric dialdehyde) and to immobilize the sensitive substance (for example,biological substances like proteins, antibodies and antigenes).
In this technology, the covalent binding of the silan on the glass substrate is chosenbecause this immobilization type allows more firm protein fixation. But this methodhas a disadvantage: it makes probe diffusion difficult, so the sensor response time getslonger. Nevertheless, the PG allows using transportation of the probe to sensitivesubstance due to electroosmotic flow produced by the external electric field. It givesan opportunity to reduce the response time of the sensor.
2.2. Surface modification and sensor working principleA reaction scheme for protein immobilization is outlined in Fig. 1. It was realized instatic regime in four stages: surface activation (I), silanization (II), treatment withglutaric dialdehyde (III) and protein immobilization (IV) [5, 6].
For surface activation, samples were placed into 0.5 M NaOH for 0.5 hour.Silanization was carried out in two ways: i ) immersion in a 10% solution ofaminopropyltriethoxysilane (APS) in toluene at 90 °C for 2 hours; or ii) 4% solutionof APS in acetone at 24 °C for 2 hours. Then, sample surfaces were treated withglutaraldehyde for 2 hours. Protein immobilization is based on Schiff ’s baseformation between the amino groups on the protein surface and the aldehyde groupson a chemically modified surface of PG.
The principle of the sensor element action based on the immune reaction:IgG + (Insulin-FITC) ↔ IgG – (Insulin-FITC). Anti-insulin immunoglobulin IgG isimmobilized on PG surface. Afterwards the immune reaction with insulin-FITCfollowed.
2.3. Measurement and instrumentationDuring preparation of glasses the influence of drying conditions (time and temperature)between glass surface activation and silanization on protein immobilization wasstudied. At first, toluene was used for silanization, later – acetone.
At every stage of the protein immobilization and after immune reactionthe characteristics of the samples were detected by transmittance spectroscopy,
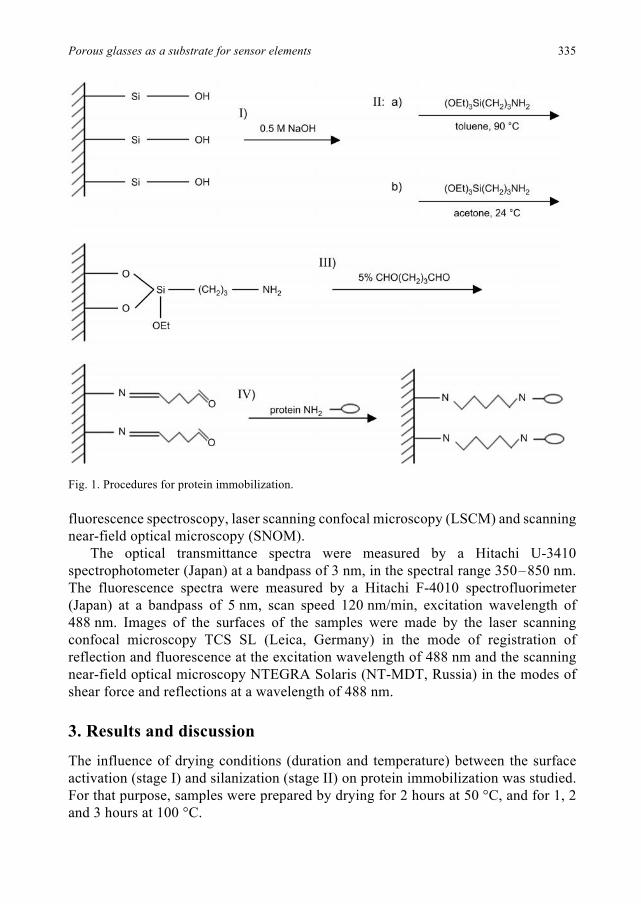
Porous glasses as a substrate for sensor elements 335
fluorescence spectroscopy, laser scanning confocal microscopy (LSCM) and scanningnear-field optical microscopy (SNOM).
The optical transmittance spectra were measured by a Hitachi U-3410spectrophotometer (Japan) at a bandpass of 3 nm, in the spectral range 350–850 nm.The fluorescence spectra were measured by a Hitachi F-4010 spectrofluorimeter(Japan) at a bandpass of 5 nm, scan speed 120 nm/min, excitation wavelength of488 nm. Images of the surfaces of the samples were made by the laser scanningconfocal microscopy TCS SL (Leica, Germany) in the mode of registration ofreflection and fluorescence at the excitation wavelength of 488 nm and the scanningnear-field optical microscopy NTEGRA Solaris (NT-MDT, Russia) in the modes ofshear force and reflections at a wavelength of 488 nm.
3. Results and discussion
The influence of drying conditions (duration and temperature) between the surfaceactivation (stage I) and silanization (stage II) on protein immobilization was studied.For that purpose, samples were prepared by drying for 2 hours at 50 °C, and for 1, 2and 3 hours at 100 °C.
Fig. 1. Procedures for protein immobilization.

336 A. EVSTRAPOV et al.
The images of the sample surfaces were made by laser scanning confocalmicroscopy. For the samples dried at 100 °C it visualized relatively large particles(with a diameter of nearly 10 mkm). After silanization (stage II) and glutaricdialdehyde surface treatment (stage III) the transmittance of the samples alters ina wide spectral range. A small “burnt out” site of the surface with lower fluorescencecompared to the background on all the surfaces is observed in the images. The changesof the sample surface properties are due to laser radiation (for LSCM) at 488 nm(energy density ~500 W/cm2).
When the sample is dried at 50 °C there are no big particles observed and “burntsite” is more degraded. Spectrophotometric measurements show that the sample driedat 60 °C has lower transmittance (~10%) in the spectral range 550–850 nm thanfor other samples; the sample dried for 5 hours has higher transmittance in the range350–600 nm than for other samples. The above observations proved that drying regimeexerts a significant influence on protein immobilization at PG (i.e., on the volumequantity of the immobilized protein).
Protein immobilization was performed by immersing the pretreated glass samplesin protein solution. The quantity of the immobilized protein was estimated byspectrophotometric detection of protein in solution before and after immobilization atPG (Coomassie method) [7]. The method was based on the dye colour change (fromred-brown to blue) corresponding to absorbance peak shift from 465 to 595 nmafter reaction with protein. These measurements show that only 0.202 mg(~16 mkg/mm3) of the protein was immobilized on the sample, when toluene was usedat the silanization stage (stage II, version a), while 0.302 mg (~24 mkg/mm3) wasimmobilized when acetone was used (stage II, version b).
The absorbance peak at ~525 nm was observed at the spectrum of PG treated withglutaric dialdehyde. There is no such absorbance peak for the spectrum of the glutaricdialdehyde solution.
From the spectral transmittance dependences for the samples after immune reaction(Fig. 2) the fluorescence absorbance peak is observed at 495 nm. It confirms thatsuccessful immune reaction has been performed.
The treatment with glutaric dialdehyde results in reduction of sampletransmittance. The immunoglobulin immobilization leads to additional transmittancereduction. The transmittance of the samples considerably increases (~15% for sampleswith the use of toluene for silanization (Fig. 2a) and ~45% with the use of acetone forsilanization (Fig. 2b)) after the immune reaction has been carried out. This effect maybe used for the future detection system design.
Figure 3 presents the normalized transmittance spectra of PG after the immunereaction and treatment with Coomassie solution. The measurements demonstratethat silanization with acetone results in immobilization of more protein compared tosilanization with toluene.
Note that no fluorescence was observed in the case of initial (native) porous glassupon excitation at a wavelength of 488 nm.

Porous glasses as a substrate for sensor elements 337
a b
Fig. 2. Transmittance spectra of PG 8V-MAP: after silanization with toluene (a), after silanization withacetone (b); solid line – PG, dashed line – after immunoglobulin immobilization, dotted line – afterimmune reaction.
Fig. 3. Normalized transmittance spectra ofPG after immune reaction and treatment withCoomassie solution.
Fig. 4. Fluorescence spectra of PG: after immunoglobulin immobilization (a), after immune reaction (b);dashed line – silanization with the use of toluene, solid line – with the use of acetone.
a b
Silanization with toluene
Silanization with acetone

338 A. EVSTRAPOV et al.
Glutaric dialdehyde solution (which was used for protein immobilization) hasa fluorescence peak at 550 nm at excitation wavelength 488 nm (Fig. 4a). This hasmade it more difficult to interpret the results obtained by laser scanning confocalmicroscopy because of the presence of a few fluorescence substances and not just one.
The fluorescence of insulin-FITS at 523 nm is significantly higher thanthe fluorescence of glutaric dialdehyde. Using acetone for silanization leads tothe higher fluorescence peak of insulin-FITS for the samples after immune reactionthan in the case of toluene (Fig. 4b). This proves that using acetone for silanizationresults in immobilization of more protein than in the case of using toluene.
Figure 5 presents images of the sample surfaces taken by scanning near-fieldoptical microscopy in shear force and reflection modes. For the initial glass in bothmodes a near-to-smooth surface is obtained at image size 25×25 mkm. But at biggermagnification (image size 5×5 mkm) a porous structure appears. It corresponds to BETmeasurement (Institute of Silicate Chemistry RAS).
Groups of particles with average radius ~0.6 mkm are visualized by shear forcemode after insulin immobilization at the sample surface. After immune reaction theremay also be observed particles at the sample surface, but more uniform.
In the sample surface images after immune reaction (in reflection mode) one cansee not only the particles formed, but the surface structure, too. Probably, this effectoccurs because of the formation of a homogeneous surface film with structuralelements greater than the sizes of the pores in the glass.
Fig. 5. Surface images of PG 8 V by SNOM. Shear force mode: 1 – initial glass, 2 – after insulinimmobilization, 3 – after immune reaction; reflection mode: 4 – initial glass, 5 – after immune reaction.Images size 25×25 mkm.

Porous glasses as a substrate for sensor elements 339
The measurement by laser scanning confocal microscopy (Fig. 6) shows thatfluorescent substances (glutaric dialdehyde/insulin-FITC) are adsorbed not only onthe surface but diffused through the pores into the deep glass layers.
After immunoglobulin immobilization an PG surface some particles withsignificant absorption at excitation wavelength of 488 nm were visualized by laserscanning confocal microscopy. After immune reaction a homogeneous surface wasobserved. Obviously, this is due to the formation of a thin enough and more opticallyuniform layer of the immune complex on the surface. This is confirmed bymeasurement with the use of scanning near-field optical microscopy (Fig. 5).
4. ConclusionsPorous glass is a suitable material used in designing optical sensor elements forimmune reaction detection.
Sensor element formation consists of four basic stages: surface activation,silanization, treatment by glutaric dialdehyde and protein immobilization.
Duration and temperature of drying between activation and silanization stages havea significant influence on immobilization.
According to spectrophotometric (Coomassie method) and fluorometric measure-ments using acetone for silanization results in immobilization of more proteins on PGin comparison with the case of using toluene.
Immune reaction leads to the formation of an optically homogeneous thin layer onthe surface of glass and to an increase of transmittance, which may be used forthe immune reaction detection.
Measurements by scanning near-field optical and laser scanning confocalmicroscopy confirmed the complex formation at the sample surfaces and the opticaluniformity increase as a result of the immune reaction.
So, we can draw a conclusion about the possibility of monitoring the immunereaction with the use of sensors based on the porous glass.
Acknowledgements – This work was supported by the RFBR Grant No. 08-08-00733-a: The processes ofcreation, a structure, the colloid-chemical and optical properties of the nano-dimensional membranes
Fig. 6. Surface images of PG 8 V by LSCM: 1 – initial glass, 2 – after immunoglobulin immobilization(silanization with toluene), 3 – after immunoglobulin immobilization (silanization with acetone), 4 – afterimmune reaction. Image sizes 50×50 mkm.
340 A. EVSTRAPOV et al.
from the high silica porous glasses and their application for creation of the microfluid analytical systems ;SPbRC RAS project: Microfluidic analytical systems with integrated nanostructures (porous glasses)and by the Saint-Petersburg Government grant for undergraduate and postgraduate students of universitiesand academic institutes located in Saint-Petersburg.
References[1] HAEBERLE S., ZENGERLE R., Microfluidic platforms for lab-on-a-chip applications, Lab on a Chip 7(9),
2007, pp. 1094–1110.[2] HEROLD K. E., RASOOLY A., Lab-on-a-Chip Technology (Vol. 1): Fabrication and Microfluidics,
Caister Academic Press, 2009, p. 410.[3] KREISBERG V.A., RAKCHEEV V.P., ANTROPOVA T.V., Influence of the acid concentration on
the morphology of micropores and mesopores in porous glasses, Glass Physics and Chemistry 32 (6),2006, pp. 615–622.
[4] ANTROPOVA T.V., DROZDOVA I.A., Influence of the porous glass receiving on it’s structure, GlassPhysics and Chemistry 21 (2), 1995, pp. 199–209.
[5] LI XIONG, REGNIER F.E., Channel-specific coatings on microfabricated chips, Journal ofChromatography A 924(1–2), 2001, pp. 165–176.
[6] PIJANOWSKA D.G., REMISZEWSKA E., PEDERZOLLI C., LUNELLI L., VENDANO M., CANTERI R.,DUDZIŃSKI K., KRUK J., TORBICZ W., Surface modification for microreactor fabrication, Sensors 6 (4),2006, pp. 370–379.
[7] REIGOSA R.M.J., Handbook of Plant Ecophysiology Techniques, Springer Netherlands,The Netherlands, 2001, pp. 283–295.
Received November 12, 2009in revised form February 1, 2010

Optica Applicata, Vol. XL, No. 2, 2010
Determination of electrokinetic potential of porous glasses by methods of streaming potential, electroosmosis and electrophoresis
ANNA VOLKOVA1*, LUDMILA ERMAKOVA1, MARIA VOLKOVA1, 2, TATYANA V. ANTROPOVA2
1Saint-Petersburg State University, Chemical Faculty, Universitetskii pr., 26, St. Petersburg, 198504, Russia
2Institute of Silicate Chemistry, RAS, emb. Makarova, 2, St. Petersburg, 199034, Russia
*Corresponding author: [email protected]
Complex research of structural and electrokinetic characteristics of nano- and the ultraporousglasses prepared from sodium borosilicate (SBG) glass DV1-Sh in KCl background solutions ofvarious concentrations in a wide pH range has been performed. It is shown that for ultraporousmembranes with the sizes of porous channels r in the range 10–70 nm appreciable electroosmoticflows and a good agreement of electrokinetic potential values determined by three differentmethods are observed. It is established that for nanoporous (r < 10 nm) glass membraneschange of electroosmotic flow velocity with time is due to the development of concentrationpolarization.
Keywords: electrokinetic potential, electroosmotic flow.
1. Introduction
It is known that nanostructured porous glasses (PG) with controllable nanometricrange parameters of structure and adjustable adsorptive and optical properties finda variety of applications [1–3]. In particular, suitability of PGs for their applicationas functional membrane elements in microfluidic chip (MFC) systems for the biochem-ical analysis [4] is revealed. Depending on the pore size and the secondary silicacontents PGs can be used as electroosmotic pumps or as sensory elements withindicated complexes being introduced. In this connection definition of electroosmoticflows and electrokinetic potential values depending on pore space structure ofmembranes from PGs, which is defined by composition, thermal treatment of initialalkali borosilicate (ABS) glasses and conditions of obtaining of PG [5], are actual.
342 A. VOLKOVA et al.
2. Objects and techniques
Porous high-silica glasses were prepared from industrial sodium borosilicate (SBG)glass DV1-Sh with bithermal treatment (650 °C, 530 °C) and two-frame structure byleaching in 3 M solution of hydrochloric acid (DV1-Sh (3 M HCl)). Afterwards,some of the samples were treated by a 0.5 M KOH solution for 10 hours (DV1-Sh(3 M HCl + 10-KOH)).
For the samples obtained the following electrokinetic characteristics weredetermined:
– Specific membrane conductivity κM by difference method [6]; κM valueswere used for calculating the efficiency coefficient α (α = κMβ /κV , where κV isthe specific conductivity of bulk solution, β is the structural resistance coefficient,which characterize the contribution of the non-conducting skeleton to the membraneconductivity).
– Counterion transport numbers n+ by method of membrane potential in a flowingcell [7].
– Electrokinetic potential ζ by methods of electroosmosis, streaming potentialand ultramicroelectrophoresis; ζ – potential values of membranes were calculatedfrom experimental data using Helmholtz–Smoluchowski’s equations:
– method of streaming potential (1)
– method of electroosmosis (2)
(where ES is the streaming potential, P is the applied pressure, η is the fluid viscosity,Q = V /t is the volume velocity of a liquid, I is the current strength) and taking intoaccount both electrical double layers overlapping [8], and real specific conductivityof pore solution [9]:
(3)
where β * is the parameter, including electrolyte properties, k is Debay’s parameter.After measurements of electroosmotic flow and streaming potential some of
the membranes were washed with HCl, then watered, dried up and powdered.The ζ-potential value was also determinated for powders by method of ultramicro-electrophoresis.
ζ 0 ηκV ES
ε ε0 P-----------------------=
ζ 0 ηκV Qε ε0 I
---------------------=
ζα* ηκVα ES Q[ ]( ) ε ε0 P I[ ]( )⁄
f krβ ζα* β *, ,( )
--------------------------------------------------------------------------=

Determination of electrokinetic potential of porous glasses ... 343
The values of ζ-potential were calculated from electrophoretic data usingSmoluchowski’s equation:
(4)
(where Uef is the electrophoretic mobility) and also taking into account conductivityof PG particles (Henry’s equation) [10]:
(5)
For porous glasses under investigation structural parameters were also determined:BET surface area S0 (by thermal desorption of nitrogen with chromatographicregistration), volume porosity W, structural resistance coefficient β, liquid filtrationcoefficient G. Measurements of G values were carried out in the range of pressure0.3–0.5 atm in a 0.1 M electrolyte solution to avoid the influence of electroviscouseffect. Values of the mean pore radius were calculated by the equations
(6)
(7)
where ρ is the glass density, dM is the membrane thickness.Measurements of colloidal-chemical characteristics of porous glasses were carried
out in KCl background solutions with concentration of 10–4–10–1 M in the pHrange 2–7. All solutions were prepared on bidistilled water with specific conductivity~2×10⁻⁶ Ω–1cm–1.
3. Experimental results and discussions
3.1. Structural parameters of porous glassesInvestigation of the porous glasses obtained began with studying their structuralcharacteristics in 0.1 M KCl solutions. It is worth noting that the obtained membranesDV1-Sh (3 M HCl) and DV1-Sh (3 M HCl + 10-KOH) after a sufficiently long-termstorage in air were put to contact with a 0.1 M KCl solution at once, and PG DV1-Sh*(3 M HCl) and DV1-Sh* (3 M HCl + 10-KOH) (parallel samples) were previouslyplaced for 2 days in a 0.1 M HCl solution.
ζ S ηεε0
-------------- Uef=
ζ ηεε0
-------------- Uef 1κM
2κV---------------+
⎝ ⎠⎜ ⎟⎛ ⎞
ζ S 1 α2β
------------+⎝ ⎠⎜ ⎟⎛ ⎞
= =
rS0
2W1 W–( )ρ S0
-----------------------------------=
rβ 8Gη dM β=

344 A. VOLKOVA et al.
It can be seen from the data of Tab. 1 that for PGs, leached in HCl, the porosityvalue increases and β value decreases during the contact of the membranes withelectrolyte solutions, owing to dissolution and removal of secondary silica from porespace.
The additional alkaline treatment of PGs for 10 hours leads to an increase inthe size of pore channels and also to a volume porosity growth, which causes a decreasein the specific surface area and in the structural resistance coefficients.
Note that the structural parameters of ultraporous membranes remain practicallyconstant during experimental time.
3.2. Specific conductivity of porous glasses
The measurements of efficiency coefficients show (Fig. 1a) that for all the porousglasses investigated α values decrease with increasing KCl solution concentration inaccordance with decreasing contribution of the EDL ions into specific conductivityof pore solution. A comparison of values α at C = const (C < 0.1 M) shows thatefficiency coefficients increase with the mean pore radius diminishing (in accordancewith the theoretical conceptions), therefore the additional alkaline treatment of PGsresults in essential (especially in the diluted solutions) α values decreasing.
It is necessary to pay attention to that fact that for membranes DV1-Sh (3 M HCl)and DV1-Sh (3 M HCl + 10-KOH) (not exposed before measurements to 0.1 M HCltreatment) a decrease of efficiency coefficient values after electroosmoticmeasurements (Fig. 1a, curves 1, 2 and 4, 5) is observed, whereas for PG DV1-Sh*(3 M HCl) and DV1-Sh* (3 M HCl + 10-KOH) no appreciable change of α values hasoccurred. It should be noticed that α–logC dependence for PG DV1-Sh (3 M HCl +10-KOH) coincides with that for membrane DV1-Sh* (3 M HCl + 10-KOH) (Fig. 1a,curve 5) and earlier obtained data for PG DV1-Sh (3 M HCl + 3.5-KOH) [11].
The analysis of changes of α values for membrane DV1-Sh (3 M HCl) shows thatboth before and after electroosmotic measurements α values (at C = const) are greaterthan that for the parallel sample. We should notice that initial α values for glassDV1-Sh (3 M HCl) (Fig. 1a, curve 1) are incredibly high. Such electrokinetic behaviorof nanoporous membranes is apparently connected with changes in the internal
T a b l e 1. Structural parameters of porous glasses under investigation. Rinit – initial parameter values,Rfin – final parameter values (parameter values at the end of experiment).
Membrane Winit Wfin βinit βfinGinit×1012
[cm2s/g]rβ init[nm]
Gfin×1012
[cm2s/g]rβ fin[nm]
S0 fin[m2/g]
rS0 fin[nm]
DV1-Sh* (3 M HCl)
0.25 0.31 7.27 6.03– – 7.71* 9.2* 37 11
0.24* 0.29* 8.20* 6.89*
DV1-Sh (3 M HCl + 10-KOH) – 0.44 3.53 3.47 909 71.6 935 71.6 10 70.9
DV1-Sh* (3 M HCl + 10-KOH) 0.42 0.42 4.06 3.64 638 61.4 669 61.7 – –

Determination of electrokinetic potential of porous glasses ... 345
structure of liquate channels, and first of all with the changing of globule packing ofsecondary silica. And this difference is most likely connected with the fact that in HClsolution secondary silica swells and is structured practically at a zero charge ofa surface, and in a salt solution at considerable negative surface charge. Let us noticethat the difference between measured parameters of membranes DV1-Sh (3 M HCl)and DV1-Sh* (3 M HCl) during contact with KCl solutions considerably decreases,but does not disappear.
3.3. Counterion transport numbers in membranes
The results of counterion (K+) transport numbers measurement show (Fig. 1b) thatan increase in salt level and in pore size leads to a monotonic decrease in the n+ values.These tendencies are in accordance with decreasing contribution of the EDL ions tothe membrane transport. In the most diluted solution membranes, leached in HClsolution, possess practically ideal selectivity (n+ = 0.94–0.98).
Let us notice that for PG DV1-Sh (3 M HCl) n+ value after electroosmoticmeasurements decreases (at C < 10–3 M) and becomes equal to n+ for PG DV1-Sh*(3 M HCl). This is in accordance with the results of membrane specific conductivitymeasurements. In the case of membranes DV1-Sh* (3 M HCl + 10-KOH) andDV1-Sh (3 M HCl + 10-KOH) no essential differences in counterion transport numbervalues were observed.
Fig. 1. Transport characteristics of the membranes investigated: efficiency coefficient (a) and counteriontransport numbers (b) vs. concentration of KCl solutions.
a
b

346 A. VOLKOVA et al.
3.4. Electrokinetic potential3.4.1. Method of streaming potential
The analysis of concentration dependences for membranes DV1-Sh (3 M HCl)and DV1-Sh (3 M HCl + 10-KOH) (Fig. 2a) has shown that the absolute valuesof electrokinetic potentials were greater before than after electroosmotic measure-ments. It should be noticed that the angular coefficient of dependences –logCdiffers, too.
It is seen (Fig. 2b) that for membrane DV1-Sh (3 M HCl + 10-KOH) after treatmentof 0.1 M HCl, | | values coincide with those for membranes DV1-Sh* (3 M HCl +10-KOH) and DV1-Sh (3 M HCl + 3.5-KOH) [11] (line 1 and points 2). For PGDV1-Sh (3 M HCl) (after electroosmotic measurements) | | values remainhigher than for membranes DV1-Sh* (3 M HCl) and DV1-Sh (3 M HCl) [11](curves 3 and 4), whereas values of electrokinetic potentials for those PGs are similar.It is worthwhile to notice that the laws obtained in the case of electrokineticpotential, completely agree with the results of measurement of specific conductivityof the membranes investigated (see Section 3.2). From Fig. 2 it is also seen that forthe membranes investigated absolute ζ-potential values increase with pore sizes, whichcan be connected with a decrease of an ion-permeable layer thickness on the surfaceof pore channels.
3.4.2. Method of ultramicroelectrophoresis
The dependences of electrophoretic mobility of particles of PGs being investigated onpH on the background of 10–2 M and 10–3 M KCl are presented in Fig. 3a. A growthof particle mobility with an increase in the mean pore radius and with a decreasein concentration of background electrolyte is observed. The analysis of Uef–pH
ζα*
ζα*
Fig. 2. Electrokinetic potential of the membranes investigated vs. concentration of KCl solutions.ζα*
a b
ζα*
ζα*

Determination of electrokinetic potential of porous glasses ... 347
dependences allows us to conclude that the isoelectric point (IET) lies close topHIET = 0.5 that is similar to IET position in HCl solutions [9].
The comparison of ζ-potential values, calculated taking into account ownconductivity of particles, has shown (Fig. 3b) that values of electrokinetic potentialson the background of 10–3 M KCl are similar. On the background of 10–2 M KCl usualratio of ζ values is observed – the transition from nanoporous to ultraporous glassesleads to an increase in |ζ | value. However, it should be noticed that this differencedoes not exceed 5 mV in neutral pH range.
3.4.3. Method of electroosmosis – Comparison of the results obtained with the data of other methods
The determination of ζ values by a method of electroosmosis on nanoporousglasses was very difficult because of the electroosmotic flow velocity changing withtime. This was due to the presence of secondary silica in the PG pore space, andwas also connected with the concentration polarization increasing with time, owing tothe essential difference in counterion transport numbers between bulk and poresolutions.
The results of electroosmotic flow measurements and calculated electrokineticpotentials for the ultraporous membranes are presented in Fig. 4 and Tab. 2. It is seenthat for ultraporous glasses the ζ values measured by the three methods are in a goodagreement. Note that in the diluted solution for glasses with pore radius close to 10 nmis not enough to take into account only own conductivity of particles (method of
Fig. 3. Electrophoretic mobility (a) and electrokinetic potential (b) of PG particles vs. pH onthe background of KCl solutions.
a b

348 A. VOLKOVA et al.
ultramicroelectrophoresis) for calculation of correct ζ-potential values, but it is alsorequired that polarization phenomena in a electric double layer should be considered.
4. Conclusions
It is established that for ultraporous membranes with the pore sizes ranging from10 to 70 nm appreciable electroosmotic flows are observed. The constancy ofstructural parameters and velocity of electroosmosis in time for those membranestestifies to the possibility of using them for creation of electroosmotic pumps.
It is shown that for ultraporous membranes, a good agreement of the electrokineticpotentials found by means of three independent methods is observed. This enables usto calculate the electroosmotic flow values from the electrokinetic potential valuesdetermined by the method of streaming potential, which is one of the most exactmethods of experimental definition of the ζ-potential value since application of
Fig. 4. Electrokinetic potential ζ i determined by various methods vs. concentration of KCl solutions.
T a b l e 2. Results of volume velocity measurements and calculations of electrokinetic potential values.
C [M] κV [Ω–1cm–1] α I [mA] V/It [cm3/As] –ζ 0 [mV] – [mV]V1-Sh* (3 M HCl + 10-KOH)0.98×10⁻² 1.246×10⁻³ 1.10 8.8 0.151 27.0 32.71.15×10-3 1.518×10⁻⁴ 1.84 1.2 0.965 20.0 52.11.29×10-3 1.705×10⁻⁴ 1.85 1.25 0.772 18.4 47.9DV1-Sh (3 M HCl + 10-KOH)1.05×10⁻¹ 1.760×10⁻² 1.00 30 0.017 27.7 28.51.08×10-2 1.326×10⁻³ 1.00 10.4 0.247 45.9 49.81.54×10-3 1.635×10⁻⁴ 2.55 1.25 0.899 20.6 65.51.55×10-4 2.075×10⁻⁵ 7.11 0.2 2.042 5.91 81.9
ζα*

Determination of electrokinetic potential of porous glasses ... 349
the external electromoving force calling by-effects (heating, polarization) is notrequired. For nanoporous glass membranes a change of electroosmotic flow velocitywith time owing to the development of concentration polarizations is observed.
Acknowledgments – This work was supported by the grant of RFBR No. 08-08-00733, SPbSC RAS(Section 2 Scientific Program 2009) and Russian President Program Leading Scientific Schools, projectNo. SSh-3020.2008.3.
References[1] ENKE D., JANOWSKI F., SCHWIEGER W., Porous glasses in the 21st century – a short review,
Microporous and Mesoporous Materials 60(1–3), 2003, pp. 19–30.[2] KHANDURINA J., JACOBSON S.C., WATERS L.C., FOOTE R.S., RAMSEY J.M., Microfabricated porous
membrane structure for sample concentration and electrophoretic analysis, AnalyticalChemistry 71(9), 1999, pp. 1815–1819.
[3] SHUHUAI YAO, SANTIAGO J.G., Porous glass electroosmotic pumps: theory, Journal of Colloid andInterface Science 268 (1), 2003, pp. 133–142.
[4] EVSTRAPOV A.A., ESIKOVA N.A., RUDNITSKAJA G.E., ANTROPOVA T.V., Application of porous glassesin microfluidic devices, Optica Applicata 38 (1), 2008, pp. 31–38.
[5] ANTROPOVA T., Abstract of a doctoral thesis, St. Petersburg, 2005, p. 45.[6] MEDVEDEVA S., Abstract of a Ph.D. thesis, St. Petersburg, 2004, p. 16.[7] BOGDANOVA N., SEMENOVA O., ERMAKOVA L., SIDOROVA M., Electrokinetic characteristics of
ultraporous membrane in NaCl solutions, Vestnik SPbSU 3(4), 2006, pp. 89–94.[8] LEVINE S., MARRIOTT J.R., NEALE G., EPSTEIN N., Theory of electrokinetic flow in fine cylindrical
capillaries at high zeta-potentials, Journal of Colloid and Interface Science 52(1), 1975,pp. 136–149.
[9] ERMAKOVA L., Abstract of a doctoral thesis, St. Petersburg, 2002, p. 33.[10] DUKHIN S., Non-equilibrium electric surface phenomena, Advances in Colloid and Interface
Science 44, 1993, pp. 1–134.[11] ERMAKOVA L., VOLKOVA A., ANTROPOVA T., SIDOROVA M., Preparation of nano- and ultraporous
glasses and study of their structural and electrokinetic characteristics in 1:1 electrolyte solutions,Colloid Journal 69 (5), 2007, pp. 563–570.
Received November 12, 2009

Optica Applicata, Vol. XL, No. 2, 2010
Influence of PbX2 (X = F, Cl, Br) content and thermal treatment on structure and optical properties of lead borate glasses doped with rare earth ions
JOANNA PISARSKA1, RADOSŁAW LISIECKI2, GRAŻYNA DOMINIAK-DZIK2, WITOLD RYBA-ROMANOWSKI2, TOMASZ GORYCZKA3, ŁUKASZ GROBELNY1, WOJCIECH A. PISARSKI1*
1University of Silesia, Institute of Chemistry, Szkolna 9, 40-007 Katowice, Poland
2Institute of Low Temperature and Structure Research, Polish Academy of Sciences, Okólna 2, 50-422 Wrocław, Poland
3University of Silesia, Institute of Materials Science, Bankowa 12, 40-007 Katowice, Poland
*Corresponding author: [email protected]
Oxyhalide lead borate glasses doped with rare earth ions have been studied before and after thermaltreatment. The rare earths as optically active ions were limited to the Er3+ ions. Near-infraredluminescence due to the main 4I13/2–4I15/2 laser transition of Er3+ was registered. The introductionof PbX2 to the borate glass results in a reduction of spectral linewidth and an increase ofluminescence lifetime of 4I13/2 state of Er3+ ions. The unusual large spectral linewidth for4I13/2–4I15/2 transition of Er3+ in the oxide glass host was obtained, whereas the luminescencedecay from 4I13/2 state is longer for a sample with PbF2 than PbCl2 and PbBr2. Heat treatmentintroduces transformation from a glass to transparent glass-ceramic (TGC). The coordinationsphere around Er3+ ions is changed, giving important contribution to the luminescencecharacteristics. The spectroscopic consequence of this transformation is the increase ofluminescence lifetime and the narrowing of spectral lines of Er3+.
Keywords: lead borate glasses, rare earth ions, thermal treatment, luminescence, up-conversion.
1. IntroductionB2O3 is one of the most important forming oxides from the point view of physics andchemistry of glasses. It was incorporated into the various kinds of glass systems.Glasses containing B2O3 usually exhibit very good broadband properties, but theirluminescence characteristics are rather not satisfied in comparison to low-phononheavy metal oxide and fluoride based glasses. Incorporation of PbO and/or PbF2 tothe conventional borate glasses leads to an increase of radiative parameters for Ln3+

352 J. PISARSKA et al.
ions. From this point of view, Ln-doped borate glasses with relatively high PbO/PbF2and low B2O3 concentration are of particular interest for optical investigation. Theybelong to glass systems, which are promising luminescent materials in relation topractical applications as solid-state laser active media, near-infrared tunable lasers,NIR-to-visible up-converters and broadband optical amplifiers.
Several oxide and oxyfluoride lead borate glasses were prepared and extensivelystudied by GRESSLER and SHELBY [1, 2] and TAWANSI et al. [3, 4] twenty years ago.The Ln-doped mixed oxyhalide glasses with B2O3 and PbX2 (where X = Cl, Br) haveyet not been examined, to the best of our knowledge. From the literature data it can begathered that oxyhalide systems such as the undoped alkali haloborate B2O3–BaF2––LiX glasses [5] or erbium-doped heavy metal lead halotellurite PbX2–TeO2glasses [6], where X denotes F, Cl or Br, were successfully prepared and presentinteresting optical properties.
The present paper is divided into two parts. The first part contains results forerbium-doped borate glasses with PbX2 content (X = F, Cl, Br). The luminescencespectra at 1.5 μm due to the main 4I13/2–4I15/2 laser transition of Er3+ ions andluminescence decay curves from the 4I13/2 state have been examined.
The second part is concerned with erbium-doped transparent glass-ceramics.Thermal treatment introduces transformation from a glass to transparent glass-ceramic(TGC). The coordination sphere around Er3+ ions is changed, giving importantcontribution to the luminescence characteristics. The spectroscopic consequence ofthis transformation is the increase of luminescence lifetime and the narrowingof spectral lines of Er3+. These aspects are presented and discussed in relation tothe previously published results [7].
2. Experiment
Multicomponent mixed oxyhalide glasses with the following composition givenin wt%: 9PbX2–63PbO–18B2O3–6Al2O3–3WO3–1Er2O3 (X = F, Cl, Br) wereprepared by mixing and melting appropriate amounts of metal oxides and lead halideof high purity (99.99%, Aldrich Chemical Co.). A homogeneous mixture was heatedin a protective atmosphere of dried argon. Mixed reagents were melted at 900 °C.Then, they were quenched and annealed below Tg in order to eliminate internalmechanical stresses. NIR luminescence spectra were measured with a ContinuumModel Surelite I optical parametric oscillator pumped by a third harmonic ofa Nd:YAG laser. Luminescence was dispersed by a 1-meter double gratingmonochromator and detected with a photomultiplier with S-20 spectral response.Up-conversion luminescence spectra were recorded under excitation by diode laser at980 nm. Both luminescence and up-conversion spectra were recorded using a StanfordSRS 250 boxcar integrator controlled by a computer. Luminescence decay curveswere recorded and stored by a Tektronix TDS 3052 oscilloscope. All measurementswere carried out at room temperature. The spectral resolution was equal to 0.1 nm.Luminescence decay curves were detected with accuracy of ±1 μs.

Influence of PbX2 (X = F, Cl, Br) content and thermal treatment ... 353
3. Results and discussionIt is interesting to see that glass modification strongly influenced the surroundingsof Ln3+ ions, bringing about an important contribution to their luminescencecharacteristics. Substitution of PbO by PbX2 (X denotes F, Cl or Br) and/or thermaltreatment of precursor glasses results in the structural changes of the local environmentof Ln3+ ions. These phenomena are correlated with the optical changes.
3.1. Influence of PbX2 content (X = F, Cl, Br)Our preliminary investigations indicate that erbium-doped oxide and oxyhalide leadborate glasses are promising materials for NIR solid-state laser and broadbandoptical amplifiers [8]. An introduction of lead halide PbX2 (where X = F, Cl or Br) tothe borate glass changes coordination sphere around Er3+. The anion electronegativities(Br – 2.8, Cl – 3.0, F – 4.0) and ionic-type bond character increase in Br → Cl → Fdirection, which results in reduction of spectral linewidth and the increase ofluminescence lifetime for Ln3+ ions. Figure 1 presents NIR luminescence spectra at1.5 μm due to the main 4I13/2–4I15/2 laser transition of Er3+ ions in oxide and oxyhalidelead borate glasses. Figure 2 shows luminescence decay curves from the 4I13/2 state ofEr3+ ions. Spectroscopic parameters for Er3+ ions strongly depend on PbX2 content.The unusual large spectral linewidth (Δλ = 100.5 nm) for the 4I13/2–4I15/2 transition ofEr3+ in the glass sample without PbX2 is useful for potential broadband opticalapplications. The linewidths for glass samples with PbX2 are close to 52.5 nm (X = F),60 nm (X = Cl) and 80 nm (X = Br). Their values are reduced in Br → Cl → Fdirection. They are considerably smaller than that obtained for glass sample without
Fig. 1. NIR luminescence spectra for Er3+ ions in lead borate glasses without and with PbX2 (X = F,Cl, Br).
Fig. 2. Luminescence decay curves for Er3+ ions in lead borate glasses without and with PbX2 (X = F,Cl, Br).
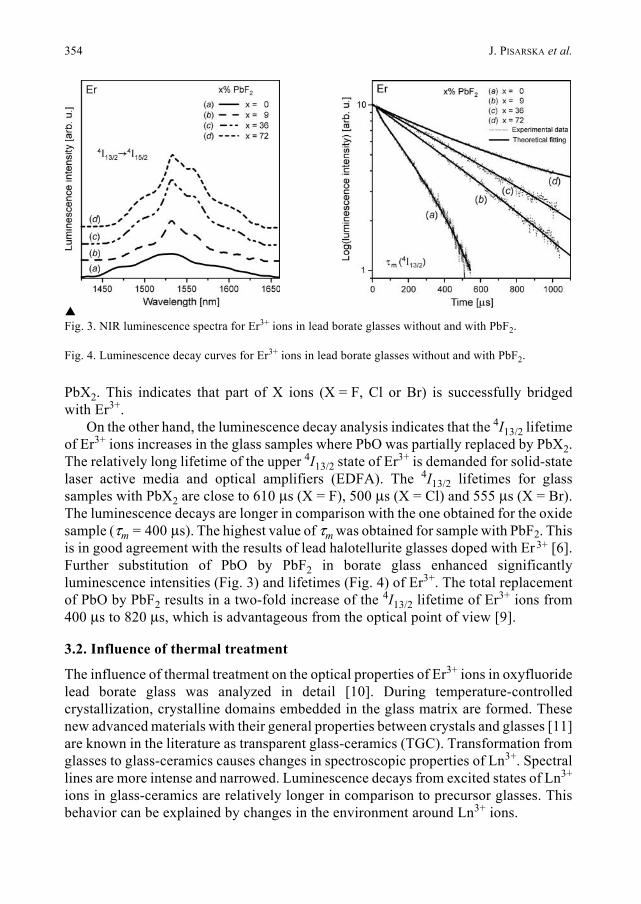
354 J. PISARSKA et al.
PbX2. This indicates that part of X ions (X = F, Cl or Br) is successfully bridgedwith Er3+.
On the other hand, the luminescence decay analysis indicates that the 4I13/2 lifetimeof Er3+ ions increases in the glass samples where PbO was partially replaced by PbX2.The relatively long lifetime of the upper 4I13/2 state of Er3+ is demanded for solid-statelaser active media and optical amplifiers (EDFA). The 4I13/2 lifetimes for glasssamples with PbX2 are close to 610 μs (X = F), 500 μs (X = Cl) and 555 μs (X = Br).The luminescence decays are longer in comparison with the one obtained for the oxidesample (τm = 400 μs). The highest value of τm was obtained for sample with PbF2. Thisis in good agreement with the results of lead halotellurite glasses doped with Er 3+ [6].Further substitution of PbO by PbF2 in borate glass enhanced significantlyluminescence intensities (Fig. 3) and lifetimes (Fig. 4) of Er3+. The total replacementof PbO by PbF2 results in a two-fold increase of the 4I13/2 lifetime of Er3+ ions from400 μs to 820 μs, which is advantageous from the optical point of view [9].
3.2. Influence of thermal treatment
The influence of thermal treatment on the optical properties of Er3+ ions in oxyfluoridelead borate glass was analyzed in detail [10]. During temperature-controlledcrystallization, crystalline domains embedded in the glass matrix are formed. Thesenew advanced materials with their general properties between crystals and glasses [11]are known in the literature as transparent glass-ceramics (TGC). Transformation fromglasses to glass-ceramics causes changes in spectroscopic properties of Ln3+. Spectrallines are more intense and narrowed. Luminescence decays from excited states of Ln3+
ions in glass-ceramics are relatively longer in comparison to precursor glasses. Thisbehavior can be explained by changes in the environment around Ln3+ ions.
Fig. 3. NIR luminescence spectra for Er3+ ions in lead borate glasses without and with PbF2.
Fig. 4. Luminescence decay curves for Er3+ ions in lead borate glasses without and with PbF2.

Influence of PbX2 (X = F, Cl, Br) content and thermal treatment ... 355
The structural changes for borate glasses with PbX2 (X = F or Cl) induced bythermal treatment and evidenced using X-ray diffraction are well illustrated in Fig. 5.It is interesting to see that the Ln3+-doped oxide lead borate glasses in the PbO–B2O3––Al2O3–WO3 system, referred to as PBAW, are fully amorphous, except for Er3+.Lead borate glasses singly doped with Er3+ or doubly doped with Er3+ and Yb3+ aresemi-crystalline systems with the presence of ErBO3 phase. The fully amorphous leadborate glasses doped with Er3+ are possible to obtain in the case of replacement PbOby PbX2 (X = F, Cl). Thermal treatment introduces the transformation from glass toglass-ceramic material. The X-ray diffraction analysis indicates that the orthorhombicPbF2 crystals are formed during controlled crystallization of precursor lead borateglass (Fig. 5, part a), in contrast to the other oxyfluoride systems (Fig. 5, part b)containing cubic β -PbF2 phase [12, 13]. Quite a different situation is observed forglasses with PbCl2 after annealing. The preliminary results suggest larger tendency tocrystallize lead tungstate than lead chloride in the lead borate glasses, which arepromising in the formation of PbXO4 (X = W, Mo) crystalline phases such as PbMoO4crystals in the B2O3–PbO–MoO2 system [14].
Near-infrared luminescence and up-conversion spectra for Er3+ ions in glasses withPbX2 (X = F, Cl) before and after annealing were examined. Figure 6 presents NIRluminescence spectra at 1.5 μm measured for oxyfluoride and oxychloride glasses andglass-ceramics, which correspond to the main 4I13/2–4I15/2 laser transition of Er3+.The luminescence bands are more intense and narrowed for glass-ceramics thanprecursor glasses, which suggests that local structure around optically active ions was
Fig. 5. Thermal treatment of precursor glasses.

356 J. PISARSKA et al.
changed and part of Er3+ ions are incorporated into crystalline phase. The luminescencedecay analysis for oxyfluoride samples indicates that the 4I13/2 lifetime of Er3+ ionsis slightly changed from 610 μs (glass) to 670 μs (glass-ceramic). This suggeststhat small amount of Er3+ ions is incorporated into the orthorhombic PbF2 crystals.The similar phenomena were observed for Er3+ ions in borate glass with PbCl2 beforeand after annealing.
The green up-conversion luminescence of Er3+ ions in oxyfluoride lead borateglasses and transparent glass-ceramics was registered under excitation with laser diodeat 980 nm (Fig. 7). There were no up-conversion spectra observed for samples withPbCl2. The luminescence band at about 545 nm corresponds to 4S3/2–4I15/2 transitionof Er 3+ ions. In comparison with the precursor glass the luminescence intensityis considerably higher, whereas the luminescence linewidth slightly decreases in
Fig. 6. NIR luminescence spectra for Er3+
ions in oxyhalide lead borate glasses beforeand after thermal treatment.
Fig. 7. Green up-conversion spectra for Er3+ ionsin oxyfluoride lead borate glasses before and afterthermal treatment.

Influence of PbX2 (X = F, Cl, Br) content and thermal treatment ... 357
the oxyfluoride TGC systems under study. This indicates that part of the trivalenterbium is incorporated into PbF2 crystalline phase.
Two dominant 2-photon mechanisms are involved in the up-conversion process [15],namely the excited state absorption (ESA) and energy transfer up-conversion (ETU).The 4I11/2 level is directly excited by 980 nm line. In the ESA process, the Er3+ ions(4I11/2 state) absorb photons and then are excited to 4F7/2 state. In the ETU process,two excited Er3+ ions (4I11/2 state) interact with each other. One of them is de-excitedto 4I15/2 ground state, whereas the other is promoted to 4F7/2 state. Both ESA and ETUprocesses populate the 4F7/2 state, which transfers energy nonradiatively very fast to4S3/2 state of Er3+. Finally, the green up-conversion luminescence due to 4S3/2–4I15/2transition of Er3+ ions has been observed.
In our case, the conversion of near-infrared radiation into visible (green) light isobserved only in the high limit of laser power. The relatively high power of excitationsource was used to register the luminescence spectrum, due to low efficiency ofup-conversion process. In the low power limit of diode laser, the up-conversion processwas not observed for Er-doped lead borate glasses, in contrast to glass samples doublydoped with Yb3+ and Er3+ ions [16, 17].
4. Conclusions
An introduction of PbX2 (X = F, Cl or Br) to the borate glass changes coordinationsphere around Er3+ ions. It results in the reduction of spectral linewidth forthe 4I13/2–4I15/2 transition in Br → Cl → F direction and the increase of luminescencelifetime for the 4I13/2 state of Er3+. The 4I13/2 lifetime is longer for glass sample withPbF2 than PbCl2 and PbBr2, which suggests that the F ions might have a special effecton luminescence lifetime among the halides.
Thermal treatment introduces transformation from glasses to transparent glass--ceramics. The spectroscopic consequence of this transformation is the narrowing ofspectral lines and the elongation of luminescence lifetimes of Er3+.
Acknowledgment – The Ministry of Science and Higher Education supported this work under the researchproject N N507 3617 33.
References[1] GRESSLER C.A., SHELBY J.E., Lead fluoroborate glasses, Journal of Applied Physics 64 (9), 1988,
pp. 4450–4453.[2] GRESSLER C.A., SHELBY J.E., Properties and structure of PbO-PbF2-B2O3 glasses, Journal of Applied
Physics 66 (3), 1989, pp. 1127–1131.[3] TAWANSI A., GOHAR I.A., HOLLAND D., EL-SHISHTAWI N.A., Some physical properties of lead borate
glasses. I. Influences of heat treatment and PbO content, Journal of Physics D: Applied Physics 21 (4),1988, pp. 607–613.
[4] TAWANSI A., AHMED E., EL-SHISHTAWI N.A., Some physical properties of lead borate glasses.II. A compensation model for the transition region, Journal of Physics D: Applied Physics 21 (4),1988, pp. 614–617.

358 J. PISARSKA et al.
[5] HAGER I.Z., Optical properties of lithium barium haloborate glasses, Journal of Physics andChemistry of Solids 70(1), 2009, pp. 210–217.
[6] YONG DING, SHIBIN JIANG, BOR-CHYUAN HWANG, TAO LUO, NASSER PEYGHAMBARIAN, YUSUKE HIMEI,TOMOKO ITO, YOSHINARI MIURA, Spectral properties of erbium-doped lead halotellurite glasses for1.5 μm broadband amplification, Optical Materials 15(2), 2000, pp. 123–130.
[7] PISARSKA J., RYBA-ROMANOWSKI W., DOMINIAK-DZIK G., GORYCZKA T., PISARSKI W.A., Near--infrared luminescence of rare earth ions in oxyfluoride lead borate glasses and transparentglass-ceramic materials, Optica Applicata 38 (1), 2008, pp. 211–216.
[8] PISARSKI W.A., PISARSKA J., LISIECKI R., GROBELNY Ł., DOMINIAK-DZIK G., RYBA-ROMANOWSKI W.,Erbium-doped oxide and oxyhalide lead borate glasses for near-infrared broadband opticalamplifiers, Chemical Physics Letters 472 (4–6), 2009, pp. 217–219.
[9] PISARSKI W.A., DOMINIAK-DZIK G., RYBA-ROMANOWSKI W., PISARSKA J., Role of PbO substitutionby PbF2 on structural behavior and luminescence of rare earth-doped lead borate glass, Journal ofAlloys and Compounds 451(1–2), 2008, pp. 220–222.
[10] PISARSKI W.A., GORYCZKA T., PISARSKA J., DOMINIAK-DZIK G., RYBA-ROMANOWSKI W., Effect of heattreatment on Er3+ containing multicomponent oxyfluoride lead borate glass system, Journal ofNon-Crystalline Solids 354 (2–9), 2008, pp. 492–496.
[11] MORTIER M., Between glass and crystal: glass-ceramics, a new way for optical materials,Philosophical Magazine B 82(6), 2002, pp. 745–753.
[12] RYBA-ROMANOWSKI W., DOMINIAK-DZIK G., SOLARZ P., KLIMESZ B., ŻELECHOWER M., Effect ofthermal treatment on luminescence and VUV-to-visible conversion in oxyfluoride glass singly dopedwith praseodymium and thulium, Journal of Non-Crystalline Solids 345–346, 2004, pp. 391–395.
[13] KLIMESZ B., DOMINIAK-DZIK G., SOLARZ P., ŻELECHOWER M., RYBA-ROMANOWSKI W., Pr3+ and Tm3+
containing transparent glass ceramics in the GeO2–PbO–PbF2–LnF3 system, Journal of Alloysand Compounds 382 (1–2), 2004, pp. 292–299.
[14] KASHCHIEVA E.P., IVANOVA V.D., JIVOV B.T., DIMITRIEV Y.B., Nanostructured borate glass ceramicscontaining PbMoO4 , Physics and Chemistry of Glasses 41 (6), 2000, pp. 355–357.
[15] AUZEL F., Upconversion and anti-Stokes processes with f and d ions in solids, ChemicalReviews 104 (1), 2004, pp. 139–174.
[16] ZHENGANG SHANG, GUOZHONG REN, QIBIN YANG, CHANGFU XU, YUNXIN LIU, YONG ZHANG, QUN WU,Spectroscopic properties of Er3+-doped and Er3+/Yb3+-codoped PbF2–MOx (M = Te, Ge, B)oxyfluoride glasses, Journal of Alloys and Compounds 460 (1–2), 2008, pp. 539–543.
[17] PISARSKA J., RYBA-ROMANOWSKI W., DOMINIAK-DZIK G., GORYCZKA T., PISARSKI W.A., Energytransfer from Yb to X (X = Tm, Er) in lead borate glasses, Optica Applicata 35 (4), 2005, pp. 837–842.
Received November 12, 2009in revised form March 23, 2010

Optica Applicata, Vol. XL, No. 2, 2010
The effect of WO42– group in xerogels
doped with Ln2–xPrx(WO4)3 where Ln = La, Gd
BEATA GROBELNA1*, PIOTR BOJARSKI2
1Faculty of Chemistry, University of Gdańsk, Sobieskiego 18/19, 80-952 Gdańsk, Poland
2Institute of Experimental Physics, University of Gdańsk, Wita Stwosza 57, 80-952 Gdańsk, Poland
*Corresponding author: [email protected]
We present a synthesis of highly efficient xerogels doped with Ln2–xPrx(WO4)3, where Ln = Laor Gd as novel phosphors. For comparison, the synthesis of xerogels doped only with Pr(III) andLa(III) ions was made. The photoluminescence properties of Pr(III) ions in xerogels were studiedby means of luminescence spectroscopy. In particular, an efficient energy transfer from toPr(III) ions was observed and demonstrated by their enhanced luminescence intensity. Especiallyinteresting seems to be strong red acceptor emission observed upon excitation at 240 nm (donorexcitation). Therefore, 4 f–4 f emission makes the system usable for red phosphor applications.Additionally, the emission intensity of the materials was improved by reducing concentration ofsuch quenchers as water molecules and OH groups by the thermal treatment.
Keywords: photoluminescence, praseodymium(III) ions, sol–gel method, energy transfer process.
1. Introduction
Rare earth doped xerogels are being studied for use as lasers, materials for amplifierdevices, phosphors for color television, fluorescent tubes and medical imaging [1]. Inthe luminescent materials field, phosphors based on lanthanide ions play an importantrole because of the sharp absorption and emissions lines. Nowadays, the three emissioncolors: blue, green and red are usually obtained with rare earth ions. Among redphosphors, materials with Eu(III) and Sm(III) ions are the most extensively studied ofthe various luminescent materials [2, 3].
On the other hand, it is known that trivalent praseodymium ion exhibits veryinteresting luminescence as an activator ion. The energy levels of Pr(III) ion containseveral metastable multiplets 3P0, 1, 2; 1D2 and 1G4 that offer the possibility of efficientemissions, such as red (1D2 → 3H4), green (3P0 → 3H4), and blue (1S0 → 3H4) inthe spectral region [4, 5]. Additionally, the emission of Pr(III) ions depends onthe kind of host matrix. Oxides with perovskite structure such as CaTiO3:Pr3+ or
WO42–

360 B. GROBELNA, P. BOJARSKI
SrTiO3:Pr3+ exhibit usually red emission with maximum placed at about 613 nm [6].However, to the best of our knowledge, there are no samples doped with Pr(III) ionsthat have been emitted at 647 nm. Therefore, we focused our attention on the synthesisand luminescence properties of materials consisting of Gd(III) or La(III) tungstate inthe presence of Pr3+ ions incorporated into silica xerogels. Pr(III) ions for applicationsin solid-state lasers and electroluminescent devices have to be assembled in transparentcomposite materials [7]. These xerogels have a wide transmission region, good thermalstability and high nonlinear refractive index. During the last years numerous xerogelmatrices were obtained by the sol–gel process [8, 9].
The sol–gel process for production of inorganic or hybrid organic-inorganicamorphous materials occurs at ambient temperature and is an excellent methodfor obtaining phosphors for luminescent materials [10]. Moreover, this method hasthe advantage of providing negligible diffusion loss, high quality and purity.
In this study, xerogels doped with Ln2–xPrx(WO4)3 showed three major redemission peaks from 605 to 648 nm. Among them the most intense is the peak placedat about 648 nm. In order to enhance the Pr(III) emission the energy transfer processcan be achieved by using xerogels doped with Ln2–xPrx(WO4)3. For comparisonpurposes the photoluminescence properties of xerogels without groups werestudied.
2. Experiment2.1. Sample preparationThe starting compounds used in these studies were of at least analytical grade. Sodiumtungstate was purchased from POCh (Poland); lanthanide(III) nitrates:Pr(NO3)3·5H2O, Gd(NO3)3·6H2O and La(NO3)·6H2O from Aldrich Co.; disodiumethylenediamine-tetraacetate, EDTA from POCh (Poland); polyethylene glycol 400,PEG and tetramethoxysilane Si(OCH3)4, TMOS from Aldrich Co.
Sodium tungstate was dissolved in warm water (60 °C). The aqueous solutions oflanthanide(III) nitrates were mixed together. The doping concentration x of the Pr(III)ions was 0.002–2 molar ratio of praseodymium in the Ln2(WO4)3 (where Ln = Gd,La) host. Then, the solutions of lanthanide(III) nitrates and sodium tungstate inappropriate amounts were mixed. After a while, insoluble white precipitate ofLn2–xPrx(WO4)3 was obtained. Next, EDTA was added to this mixture to form a stablecomplex with Ln(III) ions, while groups remained dissolved in the solution.Polyethylene glycol (PEG) and TMOS were added to homogeneous solution uponcontinuous stirring and heating; after several hours transparent gel was formed asa result of the sol–gel process. In the last step, the product was calcined overthe temperature range 600–900 °C for 3 h in the air atmosphere. Finally, we obtainedLn2–xPrx(WO4)3 entrapped in a silica xerogel as a white powder material.
However, xerogels without groups were synthesized in a similar manner,as above. The aqueous solutions of La(III) and Pr(III) nitrates were mixed together.The doping concentration x of Pr(III) ions was similar to the above one. Next, PEG
WO42–
WO42–
WO42–
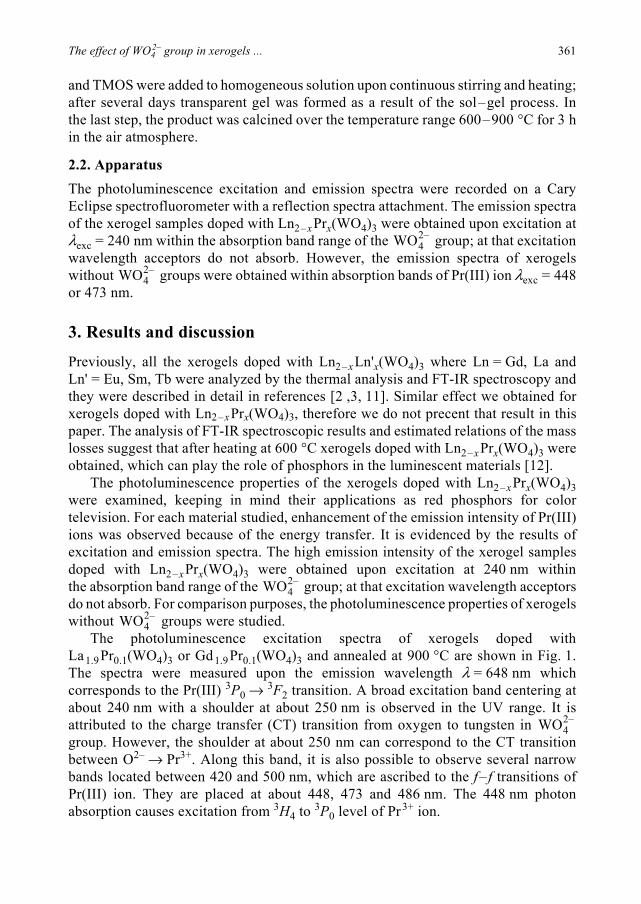
The effect of WO42– group in xerogels ... 361
and TMOS were added to homogeneous solution upon continuous stirring and heating;after several days transparent gel was formed as a result of the sol–gel process. Inthe last step, the product was calcined over the temperature range 600–900 °C for 3 hin the air atmosphere.
2.2. ApparatusThe photoluminescence excitation and emission spectra were recorded on a CaryEclipse spectrofluorometer with a reflection spectra attachment. The emission spectraof the xerogel samples doped with Ln2–xPrx(WO4)3 were obtained upon excitation atλexc = 240 nm within the absorption band range of the group; at that excitationwavelength acceptors do not absorb. However, the emission spectra of xerogelswithout groups were obtained within absorption bands of Pr(III) ion λexc = 448or 473 nm.
3. Results and discussion
Previously, all the xerogels doped with Ln2–xLn'x(WO4)3 where Ln = Gd, La andLn' = Eu, Sm, Tb were analyzed by the thermal analysis and FT-IR spectroscopy andthey were described in detail in references [2 ,3, 11]. Similar effect we obtained forxerogels doped with Ln2–xPrx(WO4)3, therefore we do not precent that result in thispaper. The analysis of FT-IR spectroscopic results and estimated relations of the masslosses suggest that after heating at 600 °C xerogels doped with Ln2–xPrx(WO4)3 wereobtained, which can play the role of phosphors in the luminescent materials [12].
The photoluminescence properties of the xerogels doped with Ln2–xPrx(WO4)3were examined, keeping in mind their applications as red phosphors for colortelevision. For each material studied, enhancement of the emission intensity of Pr(III)ions was observed because of the energy transfer. It is evidenced by the results ofexcitation and emission spectra. The high emission intensity of the xerogel samplesdoped with Ln2–xPrx(WO4)3 were obtained upon excitation at 240 nm withinthe absorption band range of the group; at that excitation wavelength acceptorsdo not absorb. For comparison purposes, the photoluminescence properties of xerogelswithout groups were studied.
The photoluminescence excitation spectra of xerogels doped withLa1.9Pr0.1(WO4)3 or Gd1.9Pr0.1(WO4)3 and annealed at 900 °C are shown in Fig. 1.The spectra were measured upon the emission wavelength λ = 648 nm whichcorresponds to the Pr(III) 3P0 →
3F2 transition. A broad excitation band centering atabout 240 nm with a shoulder at about 250 nm is observed in the UV range. It isattributed to the charge transfer (CT) transition from oxygen to tungsten in group. However, the shoulder at about 250 nm can correspond to the CT transitionbetween O2– → Pr3+. Along this band, it is also possible to observe several narrowbands located between 420 and 500 nm, which are ascribed to the f– f transitions ofPr(III) ion. They are placed at about 448, 473 and 486 nm. The 448 nm photonabsorption causes excitation from 3H4 to 3P0 level of Pr3+ ion.
WO42–
WO42–
WO42–
WO42–
WO42–
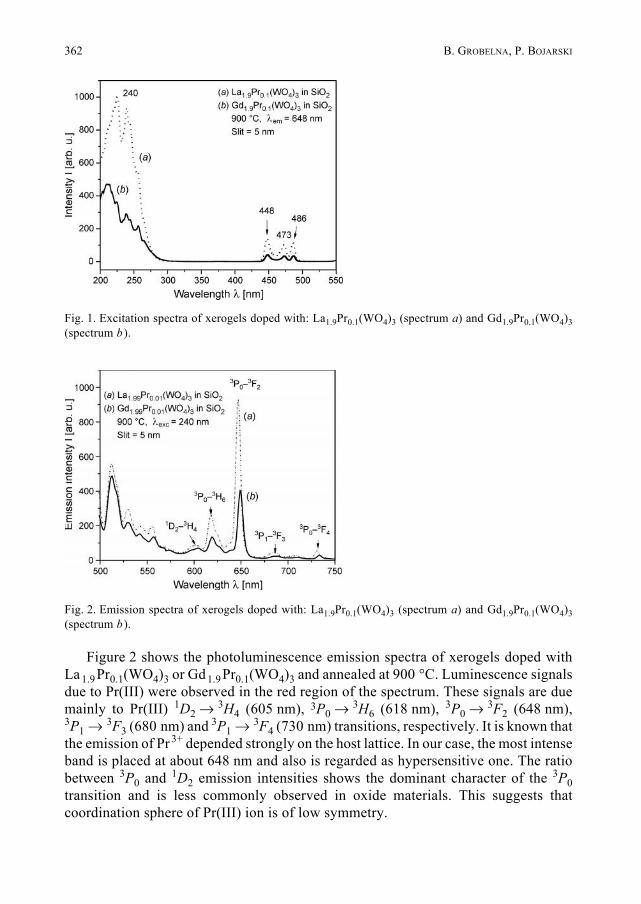
362 B. GROBELNA, P. BOJARSKI
Figure 2 shows the photoluminescence emission spectra of xerogels doped withLa 1.9Pr0.1(WO4)3 or Gd1.9Pr0.1(WO4)3 and annealed at 900 °C. Luminescence signalsdue to Pr(III) were observed in the red region of the spectrum. These signals are duemainly to Pr(III) 1D2 → 3H4 (605 nm), 3P0 → 3H6 (618 nm), 3P0 → 3F2 (648 nm),3P1 → 3F3 (680 nm) and 3P1 → 3F4 (730 nm) transitions, respectively. It is known thatthe emission of Pr 3+ depended strongly on the host lattice. In our case, the most intenseband is placed at about 648 nm and also is regarded as hypersensitive one. The ratiobetween 3P0 and 1D2 emission intensities shows the dominant character of the 3P0transition and is less commonly observed in oxide materials. This suggests thatcoordination sphere of Pr(III) ion is of low symmetry.
Fig. 1. Excitation spectra of xerogels doped with: La1.9Pr0.1(WO4)3 (spectrum a) and Gd1.9Pr0.1(WO4)3(spectrum b ).
Fig. 2. Emission spectra of xerogels doped with: La1.9Pr0.1(WO4)3 (spectrum a) and Gd1.9Pr0.1(WO4)3(spectrum b ).

The effect of WO42– group in xerogels ... 363
The influence of tungstate groups on Pr(III) luminescence in silica xerogels wasstudied. Figure 3, spectrum a shows excitation spectrum of xerogel doped with Pr(III)and La(III) ions. The spectrum was measured upon the emission wavelengthλ = 648 nm. The small band observed at 473 nm corresponds to f– f transition of Pr(III)ion. However, the band placed at around 250 nm is attributed to the charge transferbetween O2– → Pr3+. The emission spectra of low intensity (Fig. 3, spectra c and d )correspond to a situation where the material is excited by radiation of λexc = 448 or473 nm. In the case where λexc = 240 nm no red emissions at 605, 618 and 648 nmwere observed in Fig. 3, spectrum b.
In order to avoid emission quenching of O–H oscillators the emission intensity ofPr(III) ion has been studied as a function of annealing temperature in xerogels dopedwith mixed tungstate. Figure 4 shows that the emission intensity of Pr(III) ion in
Fig. 3. Excitation and emission spectra of xerogels doped with La1.9Pr0.1.
Fig. 4. The dependence of Pr3+ emission intensity I of the 3P0 →3F2 band at 648 nm with annealing
temperature T for xerogels doped with: La1.9Pr0.1(WO4)3 (curve a ) and Gd1.9Pr0.1(WO4)3 (curve b).The lines are drawn as guide to the eyes.

364 B. GROBELNA, P. BOJARSKI
the materials studied increases with an increase of temperature up to 900 °C. Watermolecules come from both silica matrix and coordination sphere of Pr(III) ion. Thus,removal of O–H groups leads to an increase of the emission intensity. In our previouspaper [3], we reported that heating at least up to 1000 °C causes the emission intensityto decrease. This is possible since the formation of mixed lanthanide silicate andtungstate salt could occur. Additionally, xerogels doped with Ln2–xPrx(WO4)3 heatedup to the temperature around 1000 °C could transform into glassy material.
The second parameter which affects the enhancement of the emission intensity isthe concentration of Pr(III) ion. As we can see from Fig. 5, the highest emission occurs
Fig. 5. The dependence of Pr3+ emission intensity I of the 3P0 → 3F2 band at 648 nm with Pr(III)content x for xerogels doped with: La1.9Pr0.1(WO4)3 (curve a ) and Gd1.9Pr0.1(WO4)3 (curve b). The linesare drawn as guide to the eyes.
Fig. 6. The dependence of Pr3+ emission intensity I of the 3P0 →3F2 band at 648 nm with time t for
xerogels doped with La1.9Pr0.1(WO4)3. The lines are drawn as guide to the eyes.

The effect of WO42– group in xerogels ... 365
for x = 0.1 for xerogels doped with Ln2–xPrx(WO4)3 or Gd2–xPrx(WO4)3. The decreaseabove the maximum (x) is due to the concentration quenching.
A good luminescent material should be resistant to UV-Vis radiation and waterabsorption from the air atmosphere for a long time. Therefore, it has not shown changesof emission intensity during illumination by the sun radiation. As can be seen in Fig. 6,the emission intensity of silica xerogel doped with La1.9Pr0.1(WO4)3 is constant withinthe experimental error for eight months.
4. Conclusions
The materials under study show UV-Vis reflectance spectra with a band placed at about240 nm, related to O → W charge transfer transition. The Pr(III) ion presents itsenhanced emissions (3P0 → 3F2) in the materials studied owing to the efficientenergy transfer from the excited W(VI) states in tungstate group via O to Pr(III) ions.The energy transfer from groups to Pr(III) ions is particularly effective forxerogels doped with mixed systems of the compositions: La1.9Pr0.1(WO4)3 andGd1.9Pr0.1(WO4)3. The Pr(III) emission intensity in the materials studied increaseswith temperature increasing up to 900 °C. This is due to the removal of O–H quenchersfrom the coordination sphere of Pr(III) ions. The Pr(III) emission intensity has beenconstant for eight months.
Acknowledgments – The financial support of this study by the Ministry of Science and Higher Education(Poland Grant 3162/B/T02/2009/36) is gratefully acknowledged.
References[1] RONDA C.R., JÜSTEL T., NIKOL H., Rare earth phosphors: fundamentals and applications, Journal of
Alloys and Compounds 275–277, 1998, pp. 669–676.[2] GROBELNA B., Luminescence based on energy transfer in xerogels doped with Tb2–xEux(WO4)3,
Optica Applicata 38 (1), 2008, pp. 39–47.[3] GROBELNA B., SZABELSKI M., KLEDZIK K., KŁONKOWSKI A.M., Luminescent properties of Sm(III) ions
in Ln2–x (WO4)3 entrapped in silica xerogel, Journal of Non-Crystalline Solids 353 (30–31), 2007,pp. 2861–2866.
[4] LIANHUA TIAN, SUN-IL MHO, ZHE JIN, Luminescence properties of red-emitting praseodymium--activated BaTi4O9 phosphor, Journal of Luminescence 129(8), 2009, pp. 797–800.
[5] VOLOSHIN A.I., SHAVALEEV N.M., KAZAKOV V.P., Luminescence of praseodymium (III) chelates fromexcited states (3P0 and 1D2) and its dependence on ligand triplet state energy, Journal ofLuminescence 93 (3), 2001, pp. 199–204.
[6] LIANHUA TIAN, SUN-IL MHO, Enhanced luminescence of SrTiO3:Pr3+ by incorporation of Li+ ion,Solid State Communications 125(11–12), 2003, pp. 647–651.
[7] BOILOT J.-P., GACOIN T., PERRUCHAS S., Synthesis and sol–gel assembly of nanophosphors, ComptesRendus Chimie 13 (1–2), 2010, pp. 186–198.
[8] BREDOL M., GUTZOV S., JÜSTEL T., Highly efficient energy transfer from Ge-related defects to Tb3+
ions in sol–gel derived glasses, Journal of Non-Crystalline Solids 321(3), 2003, pp. 225–230.[9] GARCIA-MURILLO A., LE LUYER C., GARAPON C., DUJARDIN C., BERNSTEIN E., PEDRINI C., MUGNIER J.,
Optical properties of europium-doped Gd2O3 waveguiding thin films prepared by the sol–gel method,Optical Materials 19 (1), 2002, pp. 161–168.
WO42–

366 B. GROBELNA, P. BOJARSKI
[10] BRINKER C.J., SCHERER G.W., Sol–Gel Science. The Physics and Chemistry of Sol–Gel Processing,Chapter 13, Acadmic Press, Boston, 1990.
[11] GROBELNA B., Luminescence based on energy transfer in xerogels doped with Ln2–x Tbx(WO4)3,Journal of Alloys and Compounds 440 (1–2), 2007, pp. 265–269.
[12] GROBELNA B., BOJARSKI P., Red emission of Eu(III) ions doped gadolinium or lanthanum tungstateentrapped in silica xerogel, Journal of Non-Crystalline Solids 355 (45–47), 2009, pp. 2309–2313.
Received November 12, 2009in revised form December 2, 2009

Optica Applicata, Vol. XL, No. 2, 2010
Borate glasses with PbO and PbCl2 containing Dy3+ ions
JOANNA PISARSKA
University of Silesia, Institute of Chemistry, Szkolna 9, 40-007 Katowice, Poland; e-mail: [email protected]
Oxychloroborate glasses containing Dy3+ ions in the B2O3–PbCl2–PbO–Al2O3–WO3 systemwere studied using X-ray diffraction, Raman, FT-IR, absorption, excitation and luminescencespectroscopy. The results concerning glass preparation, short-range order structure and opticalproperties are reported. X-ray diffraction analysis evidently indicates that the fully amorphoussystem was prepared. Coexistence of trigonal BO3 and tetrahedral BO4 units was evidenced byRaman and FT-IR spectroscopy. The electronic states belonging to the 4 f 9 configuration oftrivalent Dy3+ were determined from the absorption and excitation spectra. The luminescencebands at 480, 573 and 662 nm were registered in oxychloride glasses, which correspond totransitions originating from the 4F9/2 state to the 6HJ /2 (J = 11, 13, 15) states of Dy3+.
Keywords: glasses, dysprosium ions, optical properties.
1. Introduction
The systematic studies of rare earth ions in different environments indicate that Dy3+
doped systems are known as a two primary color (yellow/blue) luminescent materials.Yellow/blue luminescence is related to 4F9/2–6H13/2 and 4F9/2–6H15/2 transitions ofDy3+. Several oxide, oxyfluoride and fluoride glass systems containing Dy3+ ions werestudied for yellow/blue luminescence [1–15], but dysprosium-doped oxychlorideglasses have not been examined yet. The preparation of oxychloride glasses and theirpotential applications are often limited due to low glass forming region and largetendency towards crystallization. Previously published results for oxychloridesystems singly doped with Ln3+ are concerned mainly with Er3+ ions in tellurite [16],germanate [17], and phosphate [18] glasses containing PbCl2.
Recently, the NIR luminescence of Nd3+ ions in B2O3–PbCl2–PbO–Al2O3–WO3glass system was examined [19]. The present work deals with synthesis, short-rangeorder structure and optical properties of the oxychloroborate glasses containing Dy3+
ions. The glass structure was investigated using X-ray diffraction, Raman and FT-IRspectroscopy. Visible emission due to 4F9/2–6HJ/2 (J = 11, 13, 15) transitions and itsdecay from 4F9/2 state of Dy3+ was analyzed in detail. Several spectroscopic parameters

368 J. PISARSKA
for Dy3+ ions in oxychloroborate glasses were evaluated based on the absorption,excitation and emission measurements.
2. Experimental techniquesThe X-ray diffraction was carried out using INEL diffractometer with Cu Kαradiation. The Raman and FT-IR spectra were performed by Bruker spectrometer usingstandard KBr disc techniques. Absorption spectra were recorded using a Varian 2300UV-VIS-NIR spectrophotometer. Luminescence spectra and decay curves wereobtained using Jobin Yvon Fluoromax4 spectrophotometer. The spectral resolutionwas equal to 0.1 nm. Luminescence decay curves were detected with accuracy of±1 μs. All spectral measurements were carried out at room temperature.
3. Results and discussion3.1. Glass preparation and structural studiesOxychloroborate glass samples singly doped with Dy3+ ions were prepared usingthe following composition (in wt%): 18B2O3–9PbCl2–63PbO–6Al2O3–3WO3–– 1Dy2O3.
Anhydrous oxides (B2O3, PbO, Al2O3, WO3, Nd2O3) and lead halide PbCl2(99.99% purity, Aldrich) were used as the starting materials. Due to the hygroscopicityof the halide components and, in order to minimize the adsorbed water content,the batches of 4 g were weighted and stored in a vacuum furnace at 100 °C.Homogeneous mixture was heated in a protective atmosphere of dried argon. Glasseswere melted at 900 °C in Pt crucibles, then poured into preheated copper moulds andannealed below the glass transition temperature. After this procedure, the samples wereslowly cooled to room temperature. Transparent glassy plates of about 2 mm inthickness were obtained.
In order to obtain information on the crystallizing phases, the X-ray diffractionwas performed. Figure 1 presents X-ray diffraction pattern of the oxychloroborateglass singly doped with Dy3+ ions. The XRD pattern displays two characteristic broadbands corresponding to the fully amorphous phases and does not show any strongdiffraction lines due to the precipitation of PbCl2 or other crystalline phases. In orderto obtain some information on the short-range order structure of oxychloroborateglasses, Raman and FT-IR spectra were performed. Figure 2 presents the Ramanspectrum, which was registered in 600–1700 cm–1 region for oxychloride lead borateglass and then compared to the one obtained for glass sample without PbCl2. In thisfrequency region, the Raman bands are related to the vibrations of borate groups.Similarly to the previous results [20], several vibration bands at around 620, 720, 870,925, 1050 and 1280 cm–1 are located, which correspond to the chain- and ring-typemetaborate groups as well as diborate and pentaborate units, respectively.
Two important effects can be observed. Firstly, the intensities of the bands locatedat about 870 and 925 cm–1 (assigned to pentaborate groups [20]) due to the stretching
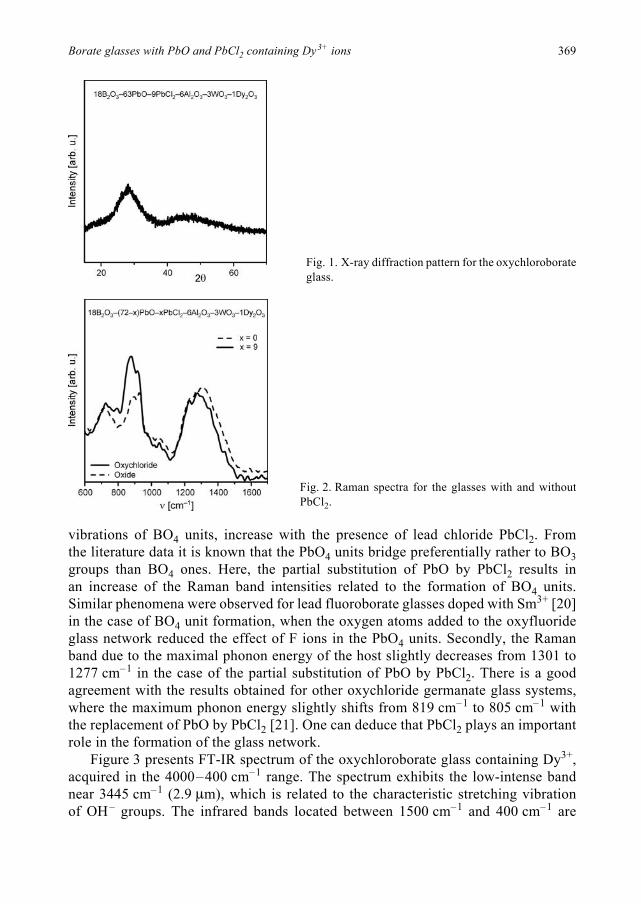
Borate glasses with PbO and PbCl2 containing Dy3+ ions 369
vibrations of BO4 units, increase with the presence of lead chloride PbCl2. Fromthe literature data it is known that the PbO4 units bridge preferentially rather to BO3groups than BO4 ones. Here, the partial substitution of PbO by PbCl2 results inan increase of the Raman band intensities related to the formation of BO4 units.Similar phenomena were observed for lead fluoroborate glasses doped with Sm3+ [20]in the case of BO4 unit formation, when the oxygen atoms added to the oxyfluorideglass network reduced the effect of F ions in the PbO4 units. Secondly, the Ramanband due to the maximal phonon energy of the host slightly decreases from 1301 to1277 cm–1 in the case of the partial substitution of PbO by PbCl2. There is a goodagreement with the results obtained for other oxychloride germanate glass systems,where the maximum phonon energy slightly shifts from 819 cm–1 to 805 cm–1 withthe replacement of PbO by PbCl2 [21]. One can deduce that PbCl2 plays an importantrole in the formation of the glass network.
Figure 3 presents FT-IR spectrum of the oxychloroborate glass containing Dy3+,acquired in the 4000–400 cm–1 range. The spectrum exhibits the low-intense bandnear 3445 cm–1 (2.9 μm), which is related to the characteristic stretching vibrationof OH– groups. The infrared bands located between 1500 cm–1 and 400 cm–1 are
Fig. 1. X-ray diffraction pattern for the oxychloroborateglass.
Fig. 2. Raman spectra for the glasses with and withoutPbCl2.

370 J. PISARSKA
correlated with the vibrations of borate network. The first group of bands was identifiedas the BO3 bending modes (650–700 cm–1).
The second group of bands is associated with the B–O stretching vibrations oftetrahedral BO4 groups (800–1050 cm–1). The antisymmetric stretching mode causesthat bands are centered at 1050 cm–1, whereas the symmetric stretching frequency islocated in the 800–900 cm–1 infrared region. The third group of the most intensebands, centered at 1300–1400 cm–1, is due to the antisymmetric B–O stretchingvibrations of trigonal BO3 groups. It can be clearly drawn from Fig. 3 that both trigonalBO3 and tetrahedral BO4 units coexist in multicomponent oxychloroborate glasses.
3.2. Optical studies
The absorption spectra of Dy3+ ions in the glasses without and with PbCl2 arepresented in Fig. 4. The spectra consist of several inhomogeneously broadenedtransitions from the 6H15/2 ground state to the 6H11/2, 6F11/2, 6F9/2, 6F7/2, 6F5/2 and 6F3/2excited states belonging to the 4 f 9 electronic configuration of trivalent dysprosium.
Fig. 3. FT-IR spectrum for the oxychloroborate glass.
Fig. 4. Absorption spectrum for Dy3+ in the glasses withand without PbCl2.

Borate glasses with PbO and PbCl2 containing Dy3+ ions 371
From the absorption spectra of Dy3+ ions in the glasses without and with PbCl2,bonding parameters (β and δ ) were calculated using the relation [22]:
where β = ΣNβ */N and β * = νc /νa, β is the shift of energy level position (nephelauxeticeffect), νc and νa are energies of the corresponding transitions in the investigatedcomplex and aquo-ion [23], respectively, and N denotes the number of levels used forthe calculation of β values. Positive or negative sign for the δ value indicates covalentor ionic bonding between the rare earth ions and surrounding ligands. The observedabsorption band positions and bonding parameters for Dy+3 in the glasses andaquo-ion are given in the Table. The bonding parameter δ was found to be –0.77,which indicates that the B2O3–PbO based glass exhibits ionic character between Dy3+
and surrounding ligands. This behavior is connected with the occurrence of [PbO4/2]2–
as well as [B3O9]9– anions having BO3 and BO4 units in the host matrix, which wasevidenced by Raman and FT-IR spectroscopy (see Section 3.1). The partialsubstitution of PbO by PbCl2 results in the change of δ value from –0.77 to –0.94,which indicates more ionic environment around Dy3+.
From the spectra it is also clearly seen that the absorption bands related to6H15/2–4F9/2 and 6H15/2–6F3/2 transitions of Dy3+ in the visible spectral region are moreintense and resolved for oxychloride glass than oxide one. Moreover, the matrixabsorption in the visible region is higher for oxychloride glass as compared to oxideglass. The 4F9/2 state lies on the UV-VIS absorption edge, whereas higher-lying statesof Dy3+ in the glass under study are not visible. For that reason, the excitation spectrummonitored at λem = 573 nm (4F9/2–6H13/2 transition) was recorded in 300–500 nmspectral region (Fig. 5). Several narrowed bands belong to the well known higher-lyingf– f electronic transitions of Dy3+. Any broad excitation charge-transfer bands due toDy3+–O2–/Cl– interactions were not obtained in the short wavelength spectral region.
δ 1 β–β
------------------ 100×=
T a b l e. Observed absorption band positions (in cm–1) and bonding parameters (β and δ ) for Dy3+ ionsin the glass samples without and with PbCl2.
Energy level PbO–B2O3 PbCl2–PbO–B2O3 Aquo-ion [16]6H15/2–4F9/2 22090 22170 221006H15/2–6F3/2 13290 13328 132506H15/2–6F5/2 12452 12500 124006H15/2–6F7/2 11101 11101 110006H15/2–6F9/2 9150 9151 91006H15/2–6F11/2 7847 7853 77006H15/2–6H11/2 5933 5937 5850β 1.0078 1.0095δ –0.77 –0.94

372 J. PISARSKA
This confirms the absence of the energy transfer process from the O2–/Cl– ligands tothe metal atoms. It also indicates that the interactions between Dy3+ ions and hostlattice are rather weak. The observed bands are assigned to transitions originating fromthe 6H15/2 ground state to the 4F9/2, 4I15/2, 4G11/2, 4K17/2, 6P5/2 and 6P7/2 states ofDy3+. Two of them, 6H15/2–4K17/2 (386 nm) and 6H15/2–4I15/2 (450 nm) transitions arethe most intense.
Figure 6 shows luminescence spectrum for Dy3+ in oxychloroborate glass.Luminescence spectra were recorded under excitation by 386 nm (4K17/2 state) or450 nm (4I15/2 state) lines. Independently of the excitation wavelengths, two relativeintense bands at 480 nm and 573 nm, and considerably less intense band at 662 nmhave been observed. The luminescence bands correspond to 4F9/2–6H15/2 (blue),4F9/2–6H13/2 (yellow) and 4F9/2–6H11/2 (red) transitions of Dy3+ ions, respectively. Alltransitions are shown in the energy level scheme, which was constructed for Dy3+ ions
Fig. 5. Excitation spectrum for Dy3+ in the oxychloroborateglass.
Fig. 6. Luminescence spectrum for Dy3+ in the oxychloroborate glass. Inset shows luminescence decayfrom the 4F9/2 state of Dy3+.

Borate glasses with PbO and PbCl2 containing Dy3+ ions 373
in oxychloroborate glass. Owing to small energy gaps between all states lying above21000 cm–1, the 4F9/2 state is well populated by non-radiative relaxation. Then,quite strong yellow/blue luminescence due to 4F9/2–6HJ/2 (J = 13, 15) transitionsis observed. This phenomenon is related to large separation (~6000 cm–1) between4F9/2 state and the next lower lying 6F1/2 state, and the relative high phonon energy ofthe host (~1300 cm–1).
The inset shows luminescence decay from the 4F9/2 state of Dy3+ inoxychloroborate glass. The luminescence decay curve is nearly single exponential.The measured 4F9/2 lifetime was determined to be 0.42 ms. It is consistent with valuesobtained for similar Dy-doped glasses based on ZnO–PbO–B2O3 [24].
4. ConclusionsOxychloroborate glasses containing Dy3+ ions were studied using X-ray diffractionand various spectroscopic techniques (Raman, FT-IR, absorption, excitation andluminescence). The results concerning glass preparation, short-range order structureand optical studies are presented. X-ray diffraction analysis evidently indicates thatthe fully amorphous system was prepared. Coexistence of trigonal BO3 and tetrahedralBO4 units was evidenced by Raman and FT-IR spectroscopy. The electronic states ofDy3+ ions in oxychloroborate glass were determined from the absorption and excitationspectra. Luminescence spectra registered in the visible spectral region correspond to4F9/2–6HJ/2 (J = 11, 13, 15) transitions of Dy3+. Decay curve for 4F9/2 state of Dy3+ isnearly single exponential and luminescence lifetime is close to 0.42 ms. The systematicstudies indicate that multicomponent oxychloroborate glasses containing Dy3+ arepromising solid-state materials for yellow/blue luminescence.
Acknowledgements – The author would like to thank Prof. W. Ryba-Romanowski for helpful discussion,Dr. G. Dominiak-Dzik for absorption measurements, Dr. M. Mączka for Raman and FT-IR measurementsand Dr. T. Goryczka for X-ray diffraction measurements. The Ministry of Science and Higher Educationsupported this work under the grant No. N N507 3617 33.
References[1] JAYASANKAR C.K., RUKMINI E., Spectroscopic investigations of Dy 3+ ions in borosulphate glasses,
Physica B: Condensed Matter 240(3), 1997, pp. 273–288.[2] TANABE S., KANG J., HANADA T., SOGA N., Yellow/blue luminescences of Dy3+-doped borate glasses
and their anomalous temperature variations, Journal of Non-Crystalline Solids 239 (1–3), 1998,pp. 170–175.
[3] BABU P., JAYASANKAR C.K., Spectroscopic properties of Dy3+ ions in lithium borate and lithiumfluoroborate glasses, Optical Materials 15(1), 2000, pp. 65–79.
[4] SRIVASTAVA P., RAI S.B., RAI D.K., Optical properties of Dy3+ doped calibo glass on addition oflead oxide, Spectrochimica Acta Part A: Molecular and Biomolecular Spectroscopy 59(14), 2003,pp. 3303–33111.
[5] JAYASANKAR C.K., VENKATRAMU V., SURENDRA BABU S., BABU P., Luminescence properties of Dy3+
ions in a variety of borate and fluoroborate glasses containing lithium, zinc, and lead, Journal ofAlloys and Compounds 374 (1–2), 2004, pp. 22–26.

374 J. PISARSKA
[6] MAHATO K.K., RAI A., RAI S.B., Optical properties of Dy3+ doped in oxyfluoroborate glass,Spectrochimica Acta Part A: Molecular and Biomolecular Spectroscopy 61 (3), 2005, pp. 431–436.
[7] JAYASIMHADRI M., MOORTHY L.R., KOJIMA K., YAMAMOTO K., WADA N., WADA N., Optical propertiesof Dy3+ ions in alkali tellurofluorophosphate glasses for laser materials, Journal of Physics D:Applied Physics 39 (4), 2006, p. 635.
[8] ZHONGCHAO DUAN, JUNJIE ZHANG, LILI HU, Spectroscopic properties and Judd–Ofelt theory analysisof Dy3+ doped oxyfluoride silicate glass, Journal of Applied Physics 101(4), 2007, p. 043110.
[9] LAKSHMINARAYANA G., VIDYA SAGAR R., BUDDHUDU S., Emission analysis of Dy 3+ and Pr3+:Bi2O3––ZnF2–B2O3–Li2O–Na2O glasses, Physica B: Condensed Matter 403 (1), 2008, pp. 81–86.
[10] PRAVEENA R., VIJAYA R., JAYASANKAR C.K., Photoluminescence and energy transfer studies ofDy3+-doped fluorophosphate glasses, Spectrochimica Acta Part A: Molecular and BiomolecularSpectroscopy 70(3), 2008, pp. 577–586.
[11] PIRAMIDOWICZ R., KLIMCZAK M., MALINOWSKI M., Short-wavelength emission analysis in Dy:ZBLANglasses, Optical Materials 30 (5), 2008, pp. 707–710.
[12] DWIVEDI Y., RAI S.B., Spectroscopic study of Dy 3+ and Dy3+/Yb3+ ions co-doped in bariumfluoroborate glass, Optical Materials 31 (10), 2009, pp. 1472–1477.
[13] SURENDRA BABU S., BABU P., JAYASANKAR C.K., TRÖSTER TH., SIEVERS W., WORTMANN G., Opticalproperties of Dy3+-doped phosphate and fluorophosphate glasses, Optical Materials 31(4), 2009,pp. 624–631.
[14] BABU P., KYOUNG HYUK JANG, EUN SIK KIM, LIANG SHI, HYO JIN SEO, RIVERA-LÓPEZ F.,RODRÍGUEZ-MENDOZA U.R., LAVÍN V., VIJAYA R., JAYASANKAR C.K., RAMA MOORTHY L., Spectralinvestigations on Dy3+-doped transparent oxyfluoride glasses and nanocrystalline glass ceramics,Journal of Applied Physics 105(1), 2009, p. 013516.
[15] BASAVAPOORNIMA CH., JAYASANKAR C.K., CHANDRACHOODAN P.P., Luminescence and lasertransition studies of Dy3+:K–Mg–Al fluorophosphate glasses, Physica B: Condensed Matter 404 (2),2009, pp. 235–242.
[16] SHIQING XU, DAWEI FANG, ZAIXUAN ZHANG, ZHONGHONG JIANG, Effect of OH – on upconversionluminescence of Er3+-doped oxyhalide tellurite glasses, Journal of Solid State Chemistry 178 (6),2005, pp. 2159–2162.
[17] SUN H., ZHANG L., WEN L., LIAO M., ZHANG J., HU L., DAI S., JIANG Z., Effect of PbCl2 addition onstructure, OH – content, and upconversion luminescence in Yb3+/Er3+-codoped germanate glasses,Applied Physics B: Lasers and Optics 80 (7), 2005, pp. 881–888.
[18] PRADEESH K., OTON C.J., AGOTIYA V.K., RAGHAVENDRA M., VIJAYA PRAKASH G., Optical propertiesof Er3+ doped alkali chlorophosphate glasses for optical amplifiers, Optical Materials 31 (2), 2008,pp. 155–160.
[19] PISARSKA J., Novel oxychloroborate glasses containing neodymium ions: Synthesis, structure andluminescent properties, Journal of Molecular Structure 887 (1–3), 2008, pp. 201–204.
[20] SOUZA FILHO A.G., MENDES FILHO J., MELO F.E.A., CUSTODIO M.C.C., LEBULLENGER R.,HERNANDES A.C., Optical properties of Sm3+ doped lead fluoroborate glasses, Journal of Physicsand Chemistry of Solids 61 (9), 2000, pp. 1535–1542.
[21] HONGTAO SUN, JUNJIE YANG, LIYAN ZHANG, JUNJIE ZHANG, LILI HU, ZHONGHONG JIANG, Compositiondependent frequency upconversion luminescence in Er3+-doped oxychloride germanate glasses,Solid State Communications 133(12), 2005, pp. 753–757.
[22] SINHA S.P., Complexes of the Rare Earth, Pergamon Press, Oxford, 1966.[23] CARNALL W.T., FIELDS P.R., RAJNAK K., Electronic energy levels of the trivalent lanthanide aquo
ions. IV. Eu3+, Journal of Chemical Physics 49 (10), 1968, pp. 4450–4455.[24] LAKSHMINARAYANA G., BUDDHUDU S., Spectral analysis of Sm3+ and Dy 3+: B2O3–ZnO–PbO
glasses, Physica B: Condensed Matter 373(1), 2006, pp. 100–106.
Received November 12, 2009in revised form March 23, 2010

Optica Applicata, Vol. XL, No. 2, 2010
Thermal treatment effect on dynamics of luminescent states in oxyfluoride glass-ceramics doped with Pr3+ and Tb3+
GRAŻYNA DOMINIAK-DZIK1, BARBARA KLIMESZ2*, WITOLD RYBA-ROMANOWSKI1
1Institute of Low Temperature and Structure Research, Polish Academy of Sciences, ul. Okólna 2, 50-395 Wrocław, Poland
2Department of Physics, Opole University of Technology, ul. Mikołajczyka 5, 45-271 Opole, Poland
*Corresponding author: [email protected]
The 50GeO2–(50–x–y)PbO–yPbF2–xLnF3 glass single doped with Pr3+ and Tb3+ ions wasstudied. The composition of the material was modified by varying the content of both PbF2 ( y = 5,10, 15 mol%) and LnF3 (x = 0.2 and 2 mol%). The differential thermal analysis (DTA) ofas-melted samples was used to determine thermal characteristics. Optical techniques and kineticsmeasurements were used to monitor the effect of thermal treatment on spectroscopic propertiesand dynamics of luminescent states of optically-active ions in amorphous and two-phase systems.It was found that non-exponential decays of praseodymium luminescence in as-melted materialbecome exponential or nearly exponential with corresponding longer lifetimes in thermally-treatedsamples. This effect was not so strong in the Tb3+-doped glass. The influence of the PbF2 contenton luminescence dynamics was studied for samples doped with 2 mol% of Pr3+. It was observedthat the increase of PbF2 content leads to lengthening of luminescence lifetime, e.g., the 1D2 lifetimeincreases from 4.1 to 45 μs in 5 and 15 mol% of PbF2 as-melted samples, respectively.
Keywords: oxyfluoride glasses, differential thermal analysis (DTA), thermal treatment, opticalproperties, luminescence dynamics, lifetimes.
1. Introduction
Rare earth doped oxyfluoride glass-ceramics combines physicochemical properties ofoxide host with profitable optical properties of fluoride crystals. Compared withprecursor material the glass-ceramics offers fluoride environment of rare earth siteswith low phonon energy. It has been found that part of rare earth ions is incorporatedinto crystalline phase after ceramming process. In glass-ceramics containing PbF2or PbF2–CdF2 the crystalline precipitates were identified as Ln:PbF2 [1–3] and

376 G. DOMINIAK-DZIK, B. KLIMESZ, W. RYBA-ROMANOWSKI
Ln:PbxCd2–xF2 [4, 5] cubic phase, respectively. It is common knowledge that oxidehosts have high energy of phonons. Their frequencies vary from host to host and insilicate and germanate amount to 1000–1100 and 800–970 cm–1, respectively.Fluoride matrices are characterised by maximal phonon energy of 500–600 cm–1. Inthis context, polycrystalline fluoride phase in glass-ceramics offers lowernon-radiative transition probabilities and longer lifetimes of luminescent levels.The ease and low cost of fabrication are additional advantages of oxyfluoride glassceramics.
The majority of glass ceramics with PbF2 reports deal with Er 3+ [2, 3, 6] or Tm3+
[1, 7, 8] due to practical importance of the near infrared laser transitions fortelecommunication and fiber amplifiers. Luminescence properties of the Pr3+
crystalline precipitates in silicate [4, 5, 9] or germanate [7, 8] glasses have beenreported too, however, the knowledge of Tb3+ luminescence properties in glass andglass-ceramics is rather poor.
The trivalent praseodymium is an attractive optical activator owing to the presenceof several metastable states (e.g., 3P0, 1D2 and 1G4) offering the possibility of the visibleemission for laser action. Terbium-activated hosts are known as good emitters of greenlight.
In our investigations, a special attempt was made at using kinetics technique tofind changes of the ligand environmental around Pr 3+ and Tb3+ in lead germanate glassafter heat-treatment process.
2. Experimental procedure
Precursor glasses with the molar composition of 50GeO2–(50–y–x)PbO–yPbF2––xPr(Tb)F3 ( y = 5, 10, 15 mol% and x = 0.2, 2 mol%) were fabricated. Startingbatches were thoroughly mixed in dry box, put in a covered platinum crucible andmelted at 1000 °C for 20 minutes in normal atmosphere. The liquefied material waspoured into preheated cooper form and pressed with preheated plate.
The differential thermal analysis (DTA) measurements were performed usinga NETZSCH differential scanning calorimeter DSC 404/3/F with Pt/PtRh DSCmeasuring head and platinum sample pans. The measurements were carried out ata heating rate of 10 °C per minute. Powder diffractograms were recorded in the 2Θrange of 10–60° by a Siemens D-5000 diffractometer (Ni-filtered Cu Kα radiation,0.02 deg/s scanning rate). Emission spectra were carried out in the visible and infraredspectral range. Samples were excited by a 458 or 488 nm line of an argon laser.Luminescence decay curves were recorded following a short pulse excitation providedby a Continuum Model Surelite optical parametric oscillator (OPO) pumped by a thirdharmonic of a Nd:YAG laser. Resulting luminescence signal was filtered using a Zeissmodel GDM-1000 monochromator, detected by a Hamamatsu R928 photomultiplierand recorded with a Tektronix TDS 3052 oscilloscope. All measurements were carriedout at room temperature. Heat-treatment processes were performed during five hoursat two extreme temperatures; 360 °C (slightly above the glass transition temperature

Thermal treatment effect on dynamics of luminescent states ... 377
of 5%PbF2–2%Pr(Tb)F3) and 395 °C (close to the beginning of the β -PbF2crystallisation band). Refractive indexes of the glass matrix were measured by usat several wavelengths in the visible using a prism method [7]. Its value is 1.65 atλ = 643.8 nm.
3. Results and discussion
The DTA curves of the 50GeO2–(45–x)PbO–5PbF2–xPr(Tb)F3 (x = 0.2 and 2 mol%)are presented in Fig. 1. The glass transition temperature Tg of as-melted samples withlow concentration of Pr3+ or Tb3+ is 340 ± 2 °C. The increase of dopant contents shiftsTg to 350 ± 1 °C. The crystallisation temperatures of the oxide glassy hosts Tc are givenin Fig. 1. The DTA curve of 50GeO2–43PbO–5PbF2–2PrF3 exhibits an additionalexothermic peak located between the Tg and Tc (Tβ = 415 °C in maximum)corresponding to the β -PbF2 crystallisation. However, this exothermic effect is notobserved in low concentrated systems.
The hello patterns, characteristic of the amorphous states were observed inthe X-ray powder diffractograms acquired from precursor samples. Contrary toGeO2–PbO–PbF2 doped with Er3+ [2, 3] or Tm3+ [7], no crystalline peaks appearedin the XRD spectrum of the samples studied after heat treatment at 360 °C and 395 °Cfor 5 hours. However, a large number of crystalline peaks, attributed to PbF2, PbGe3O7and GeO2 were recorded in 5%PbF2–2%PrF3 heated at 395 °C for 15 hours [8].
Emission of the 5%PbF2–2%PrF3 as-melted glass, presented in Fig. 2a,corresponds to transitions only from the 3P0 level. However, luminescence originatingalso from 1D2 was observed in spectrum with 0.2%PrF3. A contribution of the 1D2
Fig. 1. DTA curves of GeO2–PbO–5PbF2–xPr(Tb)F3 recorded for as-melted (solid lines) and heatedat 360 °C (dash lines) samples; x = 0.2 and 2 mol%.

378 G. DOMINIAK-DZIK, B. KLIMESZ, W. RYBA-ROMANOWSKI
luminescence appeared as a wing at the shorter wavelength side of the band at 615 nm(see the inset). Such a result indicates that concentration quenching plays the role inthe depopulation of the 1D2 state.
Emission of GeO2–PbO–5PbF2 doped with 2%TbF3 (Fig. 2b) exhibits a stronggreen luminescence at 543 nm and a significantly weaker yellow emission around587 and 622 nm. A green luminescence corresponding to the 5D4 →
7F5 transitiondominates emission spectrum. The distribution of the 5D4 → 7FJ (5, 4, 3) luminescenceintensity is in good agreement with emission of 30PbO–70PbF2–xTb3+ glasses(x = 0.5 and 2 wt%), reported in [10]. A very weak luminescence related to 5D3 is notpresented here.
Decay curves of the 3P0 and 1D2 luminescence of Pr 3+, acquired from heat-treatedsamples with 2 mol% of PrF3 and different PbF2 content are presented in Fig. 3. Theyare compared with luminescence decays of as-melted glasses. The thermal treatmentdoes not change exponential time dependences of the 3P0 luminescence but affectslifetimes. The 3P0 lifetime increases from 5.2 μs in 5%PbF2–2%PrF3 as-melted to8.1 μs in the sample heated at 395 °C/5 hours. A similar effect is observed inthe 10%PbF2–2%PrF3 sample. However, the increase of PbF2 to 15 mol% does notinfluence the lifetime significantly.
A more spectacular lifetime rise is observed for the 1D2 luminescence level; from4 μs (as-melted) to 109 μs (heated) in 5%PbF2–2%PrF3 and from 7 μs (as-melted) to100 μs (heated) in 10%PbF2–2%PrF3. Moreover, the controlled heat-treatmentprofitably affects the character of the 1D2 decays; non-exponential decays in precursorsamples become exponential or near exponential in cerammed material. The increaseof PbF2 content in as-melted sample lengthens the lifetime to 45 μs, which mayindicate that part of Pr3+ is in fluoride environment. Thus, the increase of lifetime inheated sample is relatively smaller.
Fig. 2. Emission spectra of Pr3+ and Tb ions acquired at room temperature from as-melted samplesunder 458 and 488 nm excitation, respectively. In the inset: part of luminescence observed for samplewith 0.2PrF3.
a b

Thermal treatment effect on dynamics of luminescent states ... 379
The luminescence dynamics of the 5D3 and 5D4 levels of terbium was investigatedas a function of dopant concentration for both as-melted and heat-treated samples.Luminescence decay curves of the 5D3 level are presented in Fig. 4.
Decay curves are strongly non-exponential even for low concentrated glassindicating the contribution of non-radiative energy transfer. Thus, the mean lifetimeτmean, defined as [11]:
where I0 is the initial intensity, was determined. The 5D3 lifetimes of as-melted samplesare 168 and 70 μs for 5PbF2–0.2TbF3 and 5PbF2–2TbF3, respectively andinsignificantly rise under heat-treatment process. In contrast to the 5D3 luminescence,the 5D4 decay curves of as-melted and heat-treated samples follow a single exponentialdependence with τ ~ 1.7 ms. This value is close to those observed in other Tb-dopedsystems [12, 13].
Decay curves of the 1D2 state of Pr3+ and 5D3 state of Tb3+ in as-melted glassesfollow a strong non-exponential dependence characteristic of disordered glassysystems. Generally, the excited state relaxation is governed by the sum of radiative
Fig. 3. Effect of the PbF2 content on the 3P0 (a, b, c) and 1D2 (d, e, f ) luminescence decay curves inthe xPbF2–2%PrF3 (x = 5, 10, 15 mol%) samples heated at 395 °C for over 5 hours. Circles in (a, d)represent decay curve acquired from the 5%PbF2–2%PrF3 glass cerammed at 360 °C.
a
b
c
d
e
f
τmean
I t( )dt∫I0
------------------------=
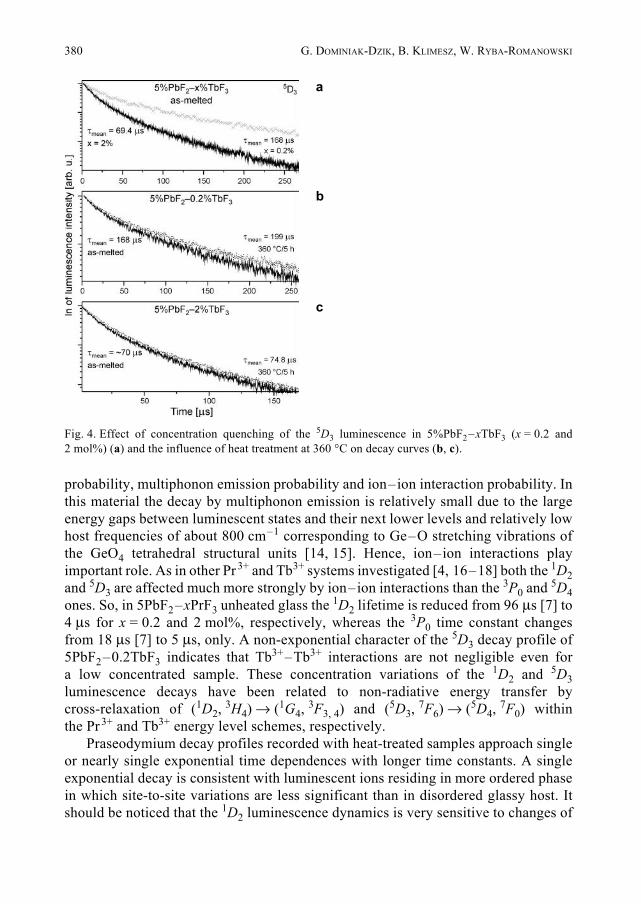
380 G. DOMINIAK-DZIK, B. KLIMESZ, W. RYBA-ROMANOWSKI
probability, multiphonon emission probability and ion–ion interaction probability. Inthis material the decay by multiphonon emission is relatively small due to the largeenergy gaps between luminescent states and their next lower levels and relatively lowhost frequencies of about 800 cm–1 corresponding to Ge–O stretching vibrations ofthe GeO4 tetrahedral structural units [14, 15]. Hence, ion–ion interactions playimportant role. As in other Pr 3+ and Tb3+ systems investigated [4, 16–18] both the 1D2and 5D3 are affected much more strongly by ion–ion interactions than the 3P0 and 5D4ones. So, in 5PbF2–xPrF3 unheated glass the 1D2 lifetime is reduced from 96 μs [7] to4 μs for x = 0.2 and 2 mol%, respectively, whereas the 3P0 time constant changesfrom 18 μs [7] to 5 μs, only. A non-exponential character of the 5D3 decay profile of5PbF2–0.2TbF3 indicates that Tb3+–Tb3+ interactions are not negligible even fora low concentrated sample. These concentration variations of the 1D2 and 5D3luminescence decays have been related to non-radiative energy transfer bycross-relaxation of (1D2, 3H4) → (1G4, 3F3, 4) and (5D3, 7F6) → (5D4, 7F0) withinthe Pr 3+ and Tb3+ energy level schemes, respectively.
Praseodymium decay profiles recorded with heat-treated samples approach singleor nearly single exponential time dependences with longer time constants. A singleexponential decay is consistent with luminescent ions residing in more ordered phasein which site-to-site variations are less significant than in disordered glassy host. Itshould be noticed that the 1D2 luminescence dynamics is very sensitive to changes of
Fig. 4. Effect of concentration quenching of the 5D3 luminescence in 5%PbF2–xTbF3 (x = 0.2 and2 mol%) (a) and the influence of heat treatment at 360 °C on decay curves (b, c).
a
b
c

Thermal treatment effect on dynamics of luminescent states ... 381
praseodymium environment. Kinetics results imply that observed luminescence isemitted by Pr3+ ions incorporated into crystalline fluoride precipitates embedded intointo oxide glass matrix. Thus, dopant ions reside fluoride sites with lower phononenergy, which results in excited state dynamics. The concentration of Pr3+ incrystalline precipitates is drastically higher than in as-melted sample due to preferentialsegregation of ions in nanocrystals [19]. In highly doped systems, the ion–ioninteraction brings about an excitation energy migration and/or concentrationquenching by cross-relaxation. If the cross-relaxation rate is higher than migrationenergy rate the luminescence decay curve is no longer exponential (Figs. 3d, 3e, 3f ).A more exponential character of the 3P0 decays (Figs. 3a, 3b, 3c) indicates thatluminescence is quenched mainly by migration of excitation energy. Time constantsof luminescence decays increased after heat treatment but the degree of these changesis different for different emitting levels and glass composition. An explanation for thisis that each lifetime recorded is a result of trade-off between the effect of structuralchanges that lengthens the lifetime and the effect of the increase of the Pr3+
concentration in crystalline species, which makes the lifetime shorter. Suchluminescence decay behaviours of other Ln3+-doped glass-ceramics are reported inliterature [2, 4, 8, 19–21].
4. ConclusionsBased on the results presented in the paper we can conclude that heat-treatmentprocess influences the kinetics of luminescent levels. It was found that thermaltreatment leads to an increase of luminescence lifetimes. This effect was clearly seenfor the 1D2 level which is highly sensitive to ligand environment around dopant ionand to non-radiative energy transfer by cross-relaxation (like the 5D3 terbium level).Strongly non-exponential luminescence decay curves of 1D2 in as-melted glassesbecame near-exponential in heated samples and lifetimes increased from a few to about100 μs. Such a result indicates the presence of the crystalline fluoride phase in beingin oxide host. It follows from the 5D3 kinetics of Tb3+ in heat-treated samples thatterbium ions are less efficient nucleating agents than Pr3+ in this material. The reasonis not obvious and further investigation is necessary to explain this phenomenon.
References[1] HIRAO K., TANAKA K., MAKITA M., SOGA N., Preparation and optical properties of transparent
glass-ceramics containing β-PbF2:Tm3+, Journal of Applied Physics 78 (5), 1995, pp. 3445–3450.[2] MORTIER M., AUZEL F., Rare-earth doped transparent glass-ceramics with high cross-sections,
Journal of Non-Crystalline Solids 256–257, 1999, pp. 361–365.[3] MORTIER M., PATRIARCHE G., Structural characterisation of transparent oxyfluoride glass-ceramics,
Journal of Materials Science 35 (19), 2000, pp. 4849–4856.[4] TICK P.A., BORRELLI N.F., CORNELIUS L.K., NEWHOUSE M.A., Transparent glass ceramics for 1300 nm
amplifier applications, Journal of Applied Physics 78(11),1995, pp. 6367–6374.[5] QUIMBY R.S., TICK P.A., BORRELLI N.F., CORNELIUS L.K., Quantum efficiency of Pr3+ doped
transparent glass ceramics, Journal of Applied Physics 83(3), 1998, pp. 1649–1653.

382 G. DOMINIAK-DZIK, B. KLIMESZ, W. RYBA-ROMANOWSKI
[6] KUKKONEN L.L., REANEY I.M., FURNISS D., PELLATT M.G., SEDDON A.B., Nucleation andcrystallisation of transparent, erbium III-doped, oxyfluoride glass-ceramics, Journal ofNon-Crystalline Solids 290 (1), 2001, pp. 25–31.
[7] KLIMESZ B., DOMINIAK-DZIK G., SOLARZ P., ŻELECHOWER M., RYBA-ROMANOWSKI W., Optical studyof GeO2–PbO–PbF2 oxyfluoride glass singly doped with Pr3+, Nd3+, Sm3+ and Eu3+, Journal ofAlloys and Compounds 403(1–2), 2005, pp. 76–85.
[8] RYBA-ROMANOWSKI W., DOMINIAK-DZIK G., SOLARZ P., KLIMESZ B., ŻELECHOWER M., Effect ofthermal treatment on luminescence and VUV-to-visible conversion in oxyfluoride glass singly dopedwith praseodymium and thulium, Journal of Non-Crystalline Solids 345–346, 2004, pp. 391–395.
[9] GOUTALAND F., JANDER P., BROCKLESBY W.S., GUOJUN DAI, Crystallisation effects on rare earthdopants in oxyfluoride glass ceramics, Optical Materials 22(4), 2003, pp. 383–390.
[10] NACHIMUTHU P., JAGANNTHAN R., Tb3+ fluorescence as a probe of cluster formation in leadoxyfluoride glasses, Journal of Non-Crystalline Solids 183 (1–2), 1995, pp. 208–211.
[11] RYBA-ROMANOWSKI W., BERKOWSKI M., VIANA B., ASCHEHOUG P., Relaxation dynamics of excitedstates of Tm3+ in SrGdGa3O7 crystals activated with Tm3+ and Tb3+, Applied Physics B 64 (5),1997, pp. 525–529.
[12] SAISUDHA M.B., RAMAKRISHNA J., Effect of host glass on the optical absorption properties of Nd 3+,Sm3+, and Dy3+ in lead borate glasses, Physical Review B 53(10), 1999, pp. 6186–6196.
[13] AMARANATH G., BUDDHUDU S., BRYANT F.J., Spectroscopic properties of Tb3+-doped fluorideglasses, Journal of Non-Crystalline Solids 122(1), 1990, pp. 66–73.
[14] CANALE J.E., CONDRATE SR. R.A., NASSAU K., CORNILSEN B.C., Characterization of various glassesin the binary PbO–GeO2 and Bi2O3–GeO2 systems, Journal of the Canadian Ceramic Society 55,1986, pp. 50–56.
[15] WACHTLER M., SPEGHINI A., PIGORINI S., ROLLI R., BETTINELLI M., Phonon sidebands and vibrationalproperties of Eu3+ doped lead germanate glasses, Journal of Non-Crystalline Solids 217(1), 1997,pp. 111–114.
[16] BALDA R., FERNÁNDEZ J., DE PABLOS A., FDEZ-NAVARRO J.M., Spectroscopic properties of Pr3+ ionsin lead germanate glass, Journal of Physics: Condensed Matter 11(38), 1999, pp. 7411–7421.
[17] PISARSKI W.A., PISARSKA J., DOMINIAK-DZIK G., RYBA-ROMANOWSKI W., Visible and infraredspectroscopy of Pr3+ and Tm3+ ions in lead borate glasses, Journal of Physics: Condensed Matter16(34), 2004, pp. 6171–6184.
[18] TONOOKA K., KAMATA N., YAMADA K., MATSUMOTO K., MARUYAMA F., A non-linear analysis ofenergy transfer in highly Tb3+-doped glasses, Journal of Luminescence 50 (3), 1991, pp. 139–151.
[19] MORTIER M., GOLDNER P., CHATEAU C., GENOTELLE M., Erbium doped glass-ceramics: concentrationeffect on crystal structure and energy transfer between active ions, Journal of Alloys andCompounds 323–324, 2001, pp. 245–249.
[20] MELTZER R.S., YEN W.M., ZHENG H., FEOFILOV S.P., DEJNEKA M.J., TISSUE B., YUAN H.B., Effect ofthe matrix on the radiative lifetimes of rare earth doped nanoparticles embedded in matrices,Journal of Luminescence 94–95, 2001, 217–220.
[21] HAYASHI H., TANABE S., HANADA T., 1.4 μm band emission properties of Tm3+ ions in transparentglass ceramics containing PbF2 nanocrystals for S-band amplifier, Journal of Applied Physics 89 (2),2001, pp. 1041–1045.
Received November 12, 2009

Optica Applicata, Vol. XL, No. 2, 2010
Hybrid materials doped with lithium ionsELŻBIETA ŻELAZOWSKA1*, EWA RYSIAKIEWICZ-PASEK2
1Institute of Glass, Ceramics, Refractory and Construction Materials – The Glass Branch in Cracow, ul. Lipowa 3, 30-702 Kraków, Poland
2Institute of Physics, Wrocław University of Technology, Wybrzeże Wyspiańskiego 27, 50-370 Wrocław, Poland
*Corresponding author: [email protected]
Sol–gel derived lithium-ion conducting organic–inorganic hybrid materials have been synthesizedfrom tetraethyl orthosilicate (TEOS), propylene glycol, ethylene glycol dimethacrylate, poly(vinylalcohol), vinyl acetate, ethyl acetoacetate, poly(methyl methacrylate), propylene carbonateand some other precursors and solvents. The mass fraction of the organic additions in the gels andthe level of the lithium salt doping (LiClO4) were ~40 mass% and 0.01%, respectively.The morphological and structural properties of the gels were investigated by a scanning electronmicroscope equipped with energy dispersive X-ray spectroscopy (SEM/EDX), X-ray diffraction(XRD), and Fourier-transform infrared spectroscopy (FTIR) and 29Si MAS Nuclear MagneticResonance (29Si MAS NMR). The hybrid gels obtained were amorphous and colourless transparentor slightly opalescent, with the room temperature ionic conductivities of the order of 10–3 Scm–1.The results of FTIR spectroscopy and 29Si MAS NMR investigations have revealed stronginfluence of the organic modification, resulting in the direct chemical bonding between organicand inorganic components of the gels. The WO3-based electrochromic cells with the hybridsobtained being applied as the electrolytes were able to be reversibly coloured and bleached inthe optical transmittance range of ~58% to 5% at around 550 nm.
Keywords: organic–inorganic hybrids, sol–gel, lithium electrolyte, ionic conductivity.
1. IntroductionSolid materials with relatively high ionic conductivities at ambient temperatures havepotentially a wide range of practical applications in the solid-state rechargeablebatteries [1] and advanced electrochemical devices, such as electrochromic displays,variable reflectance mirrors or smart windows [2, 3]. In the last years, intensivedevelopment has been observed in the use of sol–gel process for preparingthe organically modified silanes (ormosils) [4, 5]. Amorphous organic–inorganichybrid materials, which are synthesized through relatively easy and low cost sol–gelroute and have the potential of being used in integrated optics and solid electrolyte(ormolyte) applications have recently attracted a great deal of research attention [6, 7].
Many organic compounds have been proposed as components of the sol–gelderived hybrid electrolytes, including polyacrylonitrile (PAN), poly(ethylene oxide)

384 E. ŻELAZOWSKA, E. RYSIAKIEWICZ-PASEK
(PEO), poly(tetramethylene oxide) (PTMO), poly(methyl methacrylate) (PMMA),polyethylene glycol (PEG), polypropylene glycol (PPG), poly(vinylidene fluoride)(PVDF), some network polymers prepared by cross-linking reactions, and mixtures ofpolymers from these two groups [8–11].
Among the possible organic additions, polyether polymers have been studiedextensively due to their favourable feature of being miscible with many kinds of liquidelectrolytes for lithium batteries, [9] and [12]. CHAKER et al. [7] have reported onsiloxane-poly-(propylene oxide) (PPO, with 2000 and 4000 g/mol molecular weight)based hybrid electrolytes doped with sodium perchlorate (NaClO4), obtained bythe sol–gel method and exhibiting the ionic conductivity of 8.9×10⁻⁴ Scm–1 at roomtemperature. DAHMOUCHE et al. [13] and DE SOUZA et al. [14] have investigated lithiumion-conducting ormolytes with ionic conductivities higher than 10–4 Sm–1 at roomtemperature. They have found that in the hybrids prepared by sol–gel process fromthe mixture of tetraethyl orthosilicate (TEOS), polyethylene glycol (PEG), and lithiumsalt (LiClO4), the organic and inorganic parts were not chemically bonded, whilethe chemical bonding has been revealed in the hybrid electrolytes obtained froma mixture of 3-isocyanatopropyltriethoxysilane, O,O'-bis-(2-aminopropyl)-polyethyleneglycol or O,O'-bis-(2-aminopropyl)-polypropylene glycol, and lithium salt.
Due to appropriate doping and controlling of a molecular structure by organicmodification to enable fast proton and/or lithium ion conduction, organic–inorganichybrid materials have proved to be a remarkable family of amorphous solid stateelectrolytes for promising practical applications. On the other hand, the ionicconductivity of the hybrid electrolytes has been found to be strongly dependent onthe morphology and microstructure [9, 15, 16].
2. Experiment
2.1. Materials for hybrid synthesis
The hybrid materials for electrolytes have been synthesized from the tetraethylorthosilicate (TEOS, [Si(OC2H5)4]), propylene glycol (propane-1,2-diol; PG),ethylene glycol dimethacrylate (C10H14O4, EGDMA), poly(vinyl alcohol) (ethenol,
T a b l e 1. Components of the starting solutions.
Sample Components Lithium salt/solvent/fraction
Appearance, remarks
A TEOS, PG, VAM, PMMA, PC, CH2Cl2, ethanol LiClO4/ethanol/0.01 colourless,
transparent
BTEOS, PG, EGDMA, PVA, PMMA VAM, EAA, CH2Cl2, methanol, ethanol
LiClO4/ethanol//0.01 colourless, slightly opalescent
C TEOS, PG, PVA, VAM, EGDMA, PC, methanol, ethanol LiClO4/PC/0.01 colourless,
transparent

Hybrid materials doped with lithium ions 385
PVA, Mw ≈ 72000), vinyl acetate (ethenyl acetate; VAM), ethyl acetoacetate (ethyl3-oxobutanoate; EAA), poly(methyl methacrylate) (poly(methyl 2-methylpropenoate),PMMA, Mw ≈ 120000), propylene carbonate (4-methyl-1,3-dioxolan-2-one, C4H6O3,PC), dichloromethane (CH2Cl2), ethanol and methanol, precursors and solvents.Components (at least of reagent grade, Merck and Aldrich) of the starting solutionsfor hybrids under investigation are listed in Tab. 1.
Mass fractions of the organic compounds were calculated on ~40 mass% inthe gels. The level of the lithium salt doping (LiClO4 in solution with PC or ethanol)was ~0.01 for all the gels synthesized.
2.2. Experimental procedure2.2.1. Sol–gel procedure
Silica components of the gels under investigation were prepared by mixing TEOS[Si(OC2H5)4] (0.09 mol for each hybrid gel) and distilled water with the stoichiometricmolar ratio of TEOS:H2O = 1:4. As a catalyst, 36.6% HCl was added drop by drop,up to pH = 2. Solutions of PMMA or PVA (1.5 g and/or 1 g, respectively) in organicsolvents (dichloromethane, methanol and ethanol) were prepared under stirring for atleast 3 h at a temperature of 45±5 °C. Solutions of TEOS, after stirring for 1 h, weremixed with solutions of the PMMA or PVA. Then, under the continuous stirring, PGand VAM (6 ml and 15 ml, respectively) per each gel and the other organic compounds(0.08 mol of EGDMA, and/or PC and EAA in the weigh amounts equal to that of VAMaddition) were added one by one. The resulting mixtures after being stirred for ~1 hwere poured into the plastic dishes. The gelation process occurred within several hoursto 1 day. The hybrid gels were aged at ambient temperature for 2 weeks and then heatedin an electric oven for 3 h at a temperature of 105 °C.
2.2.2. Spray pyrolysis coating procedure for thin metal oxide electrochromic electrodes
The spectral and current–voltage characteristics have been obtained for a WO3–V2O5thin film electrochromic system. The layers of the sol–gel derived lithium ion dopedorganic–inorganic hybrid materials under investigation were applied as the solidelectrolytes with the aim to determine their potential to be useful for room-temperatureelectrochemical applications. Electrochromic devices consisted of: a transparentconducting layer (SnO2:F) /a cathodic, active electrochromic layer (WO3)/an ionconducting layer (hybrid electrolyte) /an anodic counter electrode layer (NiO)/a transparent conducting layer (SnO2:F), which were prepared for this study asthe symmetric multilayer structures of a smart window arrangement.
Thin electrochromic films of tungsten oxide and vanadium oxide for an activeand a counter electrode, respectively, were obtained by a spray pyrolysis method, atthe substrate temperature of about 680 °C and 670 °C, respectively. The transparentelectrode substrates were soda-lime glass plates (25×50×4 mm3) coated with fluorinedoped tin oxide (SnO2:F, K-Glass, Pilkington). The substrates to be coated werecarefully washed with a detergent solution, etched in a 4% aqueous solution ofhydrofluoric acid for 5 min, and then rinsed with distilled water and ethanol.

386 E. ŻELAZOWSKA, E. RYSIAKIEWICZ-PASEK
Tungsten (VI) oxide acetylacetonate WO(VI)(C5H7O2)4 and vanadylacetylacetonate (VO(IV)(C5H7O2)2, bis(2,4-pentanedionato)vanadium(IV) oxide) insolution with dichloromethane, were used as precursors of the metal oxideelectrochromic films. Detailed procedures were used for thin metal oxide films andpreparation of electrochromic cells followed that described in [17]. The thickness ofthe films obtained when measured with a “Talystep” microprofilometer (Rank TaylorHobson Ltd., Great Britain), was about 120 nm and 150 nm for WO3 and V2O5,respectively.
2.3. Instruments and measurements
The obtained hybrid materials and metal oxide films were characterized formorphology by scanning electron microscopy equipped with energy dispersiveX-ray spectroscopy (SEM/EDX, JEOL JSM 5400 with LINK An 10/5, NOVANANOSEM-FEI). Fourier transform infrared spectroscopy (Bio-Rad FTS-60VMFTIR spectrometer, KBr technique), nuclear magnetic resonance 29Si MAS NMR(NMR spectrometer at the magnetic field 7.05 T) and X-ray diffraction (XRD 7, Seifertdiffractometer) were used for examination of microstructure of the hybrids obtainedin this work. Spectral characteristics of the WO3-based thin film electrochromic cellsunder investigation in the coloured and bleached states have been obtained byapplying a DC voltage of ±(1.4–1.8) V between a WO3/SnO2:F active electrode anda V2O5/SnO2:F counter electrode, being registered with a Jasco V-570 spectro-photometer. The spectral and current–voltage characteristics of the electrochromiccells with hybrid electrolytes were observed at ± polarized DC potential of±(1.4–3.5) V applied through a laboratory-made potentiostat/galvanostat. The ACconductivity measurements were performed by using an Alpha N dielectric analyser(Novocontrol) in the frequency range of 7.32×10⁻² Hz–3×10⁶ Hz at roomtemperature. The measurements were carried out in the specially constructed samplecells with the platinum plate electrodes pressed against the sample surface. The areaof the contact was about 0.5 cm2.
3. Results and discussion
3.1. Structural characterization
3.1.1. XRD and SEM/EDX results
The appearance of the gels after heat treatment is described in Tab. 1. All the gelsobtained have revealed an amorphous structure under XRD examination. The XRDpattern, typical of hybrids under investigation, is shown in Fig. 1.
Typical SEM images (surface view and fractured surface, at a magnification of50000×) of the WO3, V2O5 thin films obtained in this work for the electrochromicelectrodes and of the hybrids A, B and C applied as electrolytes in the electrochromiccells of the WO3–V2O5 system are shown in Figs. 2a–2c and 2d–2f, respectively.

Hybrid materials doped with lithium ions 387
The EDX results typical of the organic–inorganic hybrid gels under investigation(for gel C, synthesized from: TEOS, PG, PVA, VAM, EGDMA, PC, LiClO4, methanol,ethanol) are presented in Fig. 3.
The scanning electron microscopy coupled with X-ray energy dispersivespectroscopy (SEM/EDX) in agreement with the XRD investigation results haverevealed the obtained metal oxide films to be porous and polycrystalline withuniformly distributed nano-sized crystallites. The amorphous and significantly porousmorphology has been observed for the sol–gel derived hybrid electrolytes A, B and
Fig. 1. XRD pattern of the hybrid A, typical of the hybrids under investigation.
Fig. 2. SEM images of thin films of WO3 (a), V2O5 (b – surface view, c – fractured surface) and hybridgels: A (d), B (e), C (f), at a magnification of 50000×.
a b c
d e f

388 E. ŻELAZOWSKA, E. RYSIAKIEWICZ-PASEK
especially C (Figs. 2d–2f , respectively) and such a thin microstructure can be seen asadvantageously available for a diffusion of alkali ions.
3.1.2. 29Si MAS NMR and FTIR spectroscopy results
29Si MAS NMR spectra and calculated results of the hybrid gels after heat treatmentat 105 °C are shown in Fig. 4 and Tab. 2, respectively.
29Si MAS NMR spectra of the hybrid electrolytes exhibit peak profiles withdifferent amounts of the Q4, Q3 and Q2 structural units corresponding to the silicon Siin coordination of 4, 3 or 2 in respect to the bridging oxygen atoms. The analysis ofthese spectra was based on the numerical values of the parameter A1 equal to the ratioof Q4/Q3 and parameter A2 equal to the ratio of Q4/Q2 calculated from the relativefractions of the peak area, corresponding to the appropriate Q species, where Q4 value
Fig. 3. EDX spectrum of a micro-area surface registered at a magnification of 5000× for hybrid gel Csynthesized from TEOS, PG, EGDMA, PVA (Mw ≈ 72000), VAM, PC, LiClO4 and organic solvents.
Fig. 4. 29Si MAS NMR spectra for organic–inorganic hybrid electrolytes under investigation A, Band C (the Q4, Q3 and Q2 peaks are corresponding to the structural units corresponding to the silicon Siin coordination 4, 3 or 2).
Q1
Q2 Q3

Hybrid materials doped with lithium ions 389
at approximately –109 ppm corresponds to [SiO4] tetrahedrons. The higher the A1 andA2 values, the higher the poly-condensation degree of the silicon-oxygen network.The observed chemical shifts were referenced to the signal of tetramethyl silane(TMS).
The NMR measurements (Tab. 2), with a good agreement with results ofSEM/EDX, indicated the poly-condensation of the inorganic network to be relativelyless developed for hybrids B and C, with the (PG, EGDMA, PVA, PMMA, VAM,EAA) or (PG, PVA, VAM, EGDMA, PC) organic additives, respectively, than that ofhybrid A, prepared with organic part containing PG, VAM, PMMA and PC.Additionally, the time of gelation as short as about 5–6 h and an enormous increasein the viscosity of the gels, especially just before the end of gelation process wereobserved for all the hybrids under investigation. A similar effect was reported byBOONSTRA et al. [18], among others, and it can be ascribed to the poly-condensationof inorganic structural units overlapped with cross-linking process. The course ofcondensation, as observed for all the hybrid gels under investigation, seems to beassociated with cross-linking polymerization of the organic and inorganic groupsconnected with formation of the cross-linked chains of particles, especially due tothe presence of the carboxylic groups originated from acrylic acid derivatives.The cross-linking effect of the carboxylic groups on a surface polymerization andgrown of the primary created particles has already been reported [19, 20].
FTIR spectra of the sol–gel derived hybrids obtained in this work are shown inFig. 5.
In the FTIR spectra of the sol–gel derived hybrid gels synthesized in this workand investigated after the heat treatment at a temperature of 105 °C, the observedbroad absorption bands at around 3456–3435 cm–1 are assigned to stretchingvibrations of OH– groups originated from residual water and those from the organiccomponents (PVA, VAM) [23, 24]. The situation of these bands corresponds todiffering organic additions in the hybrids. Additionally, in the IR spectra of the gelsbefore the heat treatment, residual absorption signals from asymmetric stretchingvibrations νas of the CH2 groups and C–Hx bonds of aliphatic organic groups, wereobserved in a range of about 2980–2880 cm–1 [5, 23].
The disappearance of signals from these groups as well as those at around1460–1390 cm–1 corresponding to vibrations of the bonds in organic parts
T a b l e 2. Isotropic chemical shifts (δ, ppm), line widths (half width at half maximum (hwhm), ppm)and relative fraction (%) of Qn units in the hybrid materials.
Sample
Q2–δ, hwhm [ppm]; relative share [%]
Q3–δ, hwhm [ppm]; relative share [%]
Q4–δ, hwhm [ppm]; relative share [%]
A1 = A2 =
A –92.4 (5.7) 7 –101.6 (7.1) 40 –110.8 (8.5) 50 1.25 7.14B –93.0 (9.0) 12 –101.7 (7.0) 41 –110.8 (8.6) 47 1.15 3.92C –91.7 (5.5) 8 –101.5 (6.2) 48 –110.3 (7.9) 44 0.92 5.50
Q4Q3---------
Q4Q2---------

390 E. ŻELAZOWSKA, E. RYSIAKIEWICZ-PASEK
(COH- deformation, νs(–COO–), δas(CH3) groups) after heating at 105 °C, can beascribed to the incorporation of the organics, resulting in organic–inorganic bondingand formation of a hybrid structure of the gels.
The bands located at around 1640 cm–1 are characteristic of adsorbed water(H–O–H), while those at around 1784 cm–1 correspond to the stretching vibrations ofthe C=O bonds and can be assigned to the etheric oxygen groups –C(=)–O– originatedfrom the carboxylic acid derivative (PMMA) and/or from acetic acid esters (VAM,EAA) [11, 23]. In the case of hybrids under investigation, the absorption bands relatedto C=O double bond vibrations are relatively weak. It can be supposed that in allthe hybrids obtained, and especially, gels A and B, there have occurred boththe organic–inorganic polymerization and a cross-linking process [19].
Three fundamental bands of the origin of Si–O vibrations, at about 1090 cm–1
(1087 cm–1 for gel C and 1086 cm–1 for gels A and B), 800 cm–1 and 460 cm–1 werefound in the FTIR spectra of all the gels under investigation. The first two correspondto asymmetric and symmetric Si–O stretching vibrations, respectively, and the lastone to the O–Si–O bending vibrations. The presence of these bands, and especiallythe bands at about 800 cm–1, is the evidence of a considerable degree of polymerizationof the silica fragments into network due to the formation of oxygen bridges betweenSiO4 tetrahedrons. The large absorption band in a range of 1250 cm–1–1000 cm–1 withthe dominating vibration mode at about 1087 cm–1 (νas Si–O) seems to be overlappingother vibration modes. A shoulder on the dominating vibration mode at around
Fig. 5. FTIR spectra of hybrid gels A, B and C,heated at a temperature of 105 °C.

Hybrid materials doped with lithium ions 391
1200 cm–1 can be assigned to the C–O stretching vibration and there in a region ataround 1110–1000 cm–1 the vibrations from Si–O–C can be overlapped [21, 24].
The absorption band for C–O bonds overlapped with Si–O vibrations bandwithout splitting the main absorption band at around 1087 cm–1 can be ascribed tothe conversion of the C–OH bonds in PVA and VAM to C–O–Si bonds, responsiblefor the cross-linking of the organic parts to silica and due to a hybrid structure ofthe gels [4].
Besides these bands, in the spectra of the gels under investigation, the absorptionpeaks located at around 950 cm–1 correspond to νas Si–OH stretching vibrations[21, 22]. Additionally, in the region at around 960 cm–1 the absorption correspondingto the vibrations of the hydrogen bonding (δ (COH)) can overlap that of the stretchingvibrations of the non-bridging oxygen atoms, e.g., Si–OH [23].
The relatively weak bands at around 556–558 cm–1 corresponding to absorptionof lithium in LiClO4 and bonded to organics, are observed in the FTIR spectra ofall the hybrid electrolytes obtained [23]. Additionally, in the spectrum of hybridelectrolyte C, besides the lithium bonded to organics, the peak from at628 cm–1 can be observed, indicating the presence of the free lithium ions [25].
The FTIR data are in a good agreement with SEM/EDX and 29Si MAS NMR data,and from this it was concluded that the degree of the inorganic poly-condensation inthe gel A is higher than that of the gel B, and especially, gel C.
3.2. Electrochemical evaluation
3.2.1. AC conductivity and cycling voltammetry
Figure 6 shows room temperature conductivities of hybrids A and C as a function offrequency ranging from about 7.32×10⁻² Hz to 3×10⁶ Hz.
AC conductivities of the order of 10–3 Scm–1, when measured at room temperaturehave been typical values of the hybrid electrolytes investigated.
The conductivities of hybrids A and B proved to have almost the same dependenceof conductivity on the frequency. The best value of ionic conductivity of about6.8×10–3 Scm–1 was noticed for the hybrid electrolyte C, with ethylene glycol
ClO4–
Fig. 6. Conductivities of hybrids A and C asa function of frequency at room temperature.

392 E. ŻELAZOWSKA, E. RYSIAKIEWICZ-PASEK
dimethacrylate (EGDMA), polyvinyl alcohol (PVA), vinyl acetate (VAM), andpropylene carbonate (PC) organic additives used as the gel precursors. The conduc-tivities of hybrids A and B, which were prepared with addition of PMMA, propyleneglycol (PG) and VAM, have proved to be a little lower than that of hybrid C and almostequal to each other, although these gels differ in the content of such organic additivesas PG, EGDMA, PVA or EAA. The main difference in composition of the hybridsunder investigation is the content of PMMA in gels A and B, when the acrylic acidderivatives are known for their cross-linking ability [20, 26]. On the other hand, it iswell known that the cross-linking density affects the flexibility of the polymer matrix:the lower the cross-linking density, the more flexible the polymer matrix becomes [27].The decrease in ionic conductivity with an increase of the content of polymer additivesin the gel matrix is related to the increase in the cross-linking density, resulteing ina decrease of the flexibility of the hybrid matrix, and consequently, the mobility ofionic charge carriers decreases.
Apart from the high conductivity, electrochemical stability is an importantcharacteristic of electrolytes for recent advanced applications. All the organic–inorganichybrid materials obtained in this work were examined as electrolytes for the symmetricelectrochemical cells of WO3–V2O5 thin film system with an electrochromic windowarrangement.
The cyclic voltammetry (CV) results obtained for an electrochromic cell ofthe WO3–V2O5 thin film system with hybrid electrolyte B under a potential signalof a rectangular shape applied by means of a potentiostat-galvanostat, typical ofthe materials under investigation, are shown in Fig. 7.
The cyclic voltammogram presented in Fig. 7b was recorded at a sweep rate of50 mV/s and with potentials ranging from –3.0 to 3.0 V after about 103 colouring––bleaching cycles.
Fig. 7. Typical current response (a) and cyclic voltammogram (b) for thin film tungsten oxide–vanadiumoxide electrochromic cell with organic–inorganic hybrid electrolyte B, cycled at a voltage of ±3.0 V(cycled area: 4 cm2; scan rate 50 mV/s).
a b

Hybrid materials doped with lithium ions 393
The CV course has been observed to stay established after a few initial cycles.The electrochromic films exhibit two distinct reduction-oxidation peaks at the lowvoltage values, which may be associated with redox couple in the V2O5 film and twoweakly distinguishable peaks which can be attributed to lithium ions intercalation/deintercalation in the WO3 film. The shape of the CV curve is typical of the diffusioncontrolled and a highly reversible lithium intercalation/deintercalation process andwell corresponds to the symmetric current response of the cell (Fig. 7a), indicatinghybrid materials under investigation to be a sufficient host for reversible intercalation/deintercalation of lithium ions. On the other hand, the colouring–bleaching cycles ofthe WO3 film have been performed very fast and associated with sharp colour changes.Such a behaviour of the WO3 film seems to be attributed to the nano-sizedpolycrystalline morphology to be favourable to the colouring efficiency enhancementdue to the probable participation of the surface and pore bonded protons.
3.2.2. Transmission characteristics
Figure 8 shows typical UV/VIS/NIR spectral transmittance characteristics ofa WO3–V2O5 symmetric thin film electrochromic system of an electrochromicwindow arrangement with a WO3 layer for the active electrode and a V2O5 layer forthe complementary counter electrode. Electrochromic layers were coated onto glasswith the electro-conductive films of fluorine (F) doped SnO2, and laminated withhybrid C employed as an electrolyte.
The spectral measurements conducted after up to 30 colouring–bleaching cycleswere performed at potential values ranging from ±1.4 to ±1.8 V. The presented data
Fig. 8. Typical spectral transmittance characteristics for a WO3–V2O5 thin film system of an electro-chromic window arrangement, coloured and bleached under ±1.8 V polarized DC voltage, with a layerof hybrid gel as electrolyte (C: synthesized from TEOS, PG, PVA, PC, VAM, EGDMA, LiClO4,dichloromethane and ethanol, precursors and solvents). The electrochromic layers are coated ontothe sheets of glass with electro-conductive transparent electrodes (SnO2:F); the labels W, V, W–V,correspond to the electrodes of WO3, V2O5 and WO3–V2O5 cell in a bleached (b) and coloured state (c),respectively.

394 E. ŻELAZOWSKA, E. RYSIAKIEWICZ-PASEK
were obtained both in the coloured and bleached states under a ±1.8 V polarized DCvoltage.
The thin film coating structure of the electrochemical cell used for CV and spectraltransmittance examination corresponds to a system in which lithium ions areintercalated and deintercalated in tungsten oxide and vanadium oxide layers accordingto the electrochemical reactions (1) and (2), respectively:
WO3 + xe– + xLi+ ↔ LixWO3 (1)
LixV2O5 ↔ V2O5 + ye– + yLi+ (2)
The vanadium pentoxide displays both cathodic and anodic colouration, but it isapplied mainly for ion storage counter electrodes because of a change in opticalspectrum not as large as that of the WO3 [28]. In a bleached state the amorphous V2O5layer is yellow and after lithium insertion it becomes blue-green due to the absorptionband at around 450 nm, typical of intervalence transfers between V 4+ and V5+ [29].In crystalline V2O5 the insertion of Li+ follows the reaction (2) and results in a colourchange from yellow to blue (Fig. 8, V/c) [30].
In the electrochromic systems under investigation, the insertion of lithium ionschanges the transmission in the visible range (at a wavelength of 550 nm) from about58% to about 5% or 40% when the WO3 and V2O5 electrochromic electrodes are ina coloured state, respectively (Fig. 8). All the hybrid gels obtained in this work, whenapplied as the electrolytes in a WO3–V2O5 electrochromic system have proved to beable to be reversibly coloured and bleached in a short time of less than 2 s andwith significant changes in the optical transmittance, with modulation from about 60%to 5%.
The transmittance characteristics in the VIS/NIR spectral range presented in Fig. 8,in a good agreement with the SEM observations have proved to be characteristic ofpolycrystalline non-stoichiometric thin films of tungsten oxide and vanadiumpentoxide with spectral reflective properties connected with Drude’s free-electronmodulation in NIR in a bleached and coloured state, respectively [31, 32].
4. Conclusions
Sol–gel derived, amorphous Li-ion conductive organic–inorganic hybrid materialswith the ionic conductivities of about (6.2–6.8)×10–3 Scm–1 at room temperature andcontaining ~40% of the organic additives were obtained using tetraethyl orthosilicateTEOS, propylene glycol, ethylene glycol dimethacrylate, poly(vinyl alcohol), vinylacetate, ethyl acetoacetate, poly(methyl methacrylate), propylene carbonate, lithiumperchlorate and organic solvents. Direct chemical bonding between the inorganic andorganic parts have been revealed from FTIR and 29Si MAS NMR spectra. The poly-condensation process overlapped with cross-linking polymerization has beenobserved, especially in the hybrids containing PMMA. The room temperature

Hybrid materials doped with lithium ions 395
conductivity of all the hybrids under investigation is almost linear in the frequencyrange of about 50 Hz to 3.5×10⁵ Hz. The symmetric situation and shape of cathodicand anodic peaks for active- and counter-electrode due to ion intercalation anddeintercalation, respectively, indicate materials under investigation to be kineticallyfavoured insertion hosts. On the other hand, relatively sharp peaks at the highest valuesof the voltage applied makes the association of lithium and proton conductancepossible, due to protons bonded with surface pores of the nano-sized polycrystallinestructure of the hybrids. All the hybrid materials obtained in this work have proved tobe electrochemically effective in reversible electrochromic reactions depending onreversible intercalation–deintercalation of the lithium ions, which makes themprospective as electrolytes for ambient temperature electrochemical and optoelectronicapplications.
References
[1] KONO M., HAYASHI E., NISHIURA M., WATANABE M., Chemical and electrochemical characterizationof polymer gel electrolytes based on poly(alkylene oxide) macromonomer for application to lithiumbatteries, Journal of The Electrochemical Society 147 (7), 2000, pp. 2517–2524.
[2] GLÄSER H.J., Large Area Glass Coating, Von Ardenne Anlagentechnik GMBH, Dresden 2000,pp. 377–393.
[3] GRANQVIST C.G., AVENDAÑO E., AZENS A., Electrochromic coatings and devices: survey of somerecent advances, Thin Solid Films 442 (1–2), 2003, pp. 201–211.
[4] PEREIRA A.P.V., VASCONCELOS W.L., ORÉFICE R.L., Novel multicomponent silicate–poly(vinylalcohol) hybrids with controlled reactivity, Journal of Non-Crystalline Solids 273 (1–3), 2000,pp. 180–185.
[5] JITIANU A., BRITCHI A., DELEANU C., BADESCU V., ZAHARESCU M., Comparative study of the sol–gelprocesses starting with different substituted Si-alkoxides, Journal of Non-Crystalline Solids 319 (3),2003, pp. 263–279.
[6] ATKINS G.R., KROLIKOWSKA R.M., SAMOC A., Optical properties of an ormosil system comprisingmethyl- and phenyl- substituted silica, Journal of Non-Crystalline Solids 265 (3), 2000,pp. 210–220.
[7] CHAKER J.A., DAHMOUCHE K., SANTILLI C.V., PULCINELLI S.H., BRIOIS V., FLANK A.-M.,JUDENSTEIN P., Siloxane-polypropyleneoxide hybrid ormolytes: structure-ionic conductivityrelationships, Journal of Non-Crystalline Solids 304(1–3), 2002, pp. 109–115.
[8] KONO M., HAYASHI E., WATANABE M., Preparation, mechanical properties, and electrochemicalcharacterization of polymer gel electrolytes prepared from poly(alkylene oxide) macromonomers,Journal of The Electrochemical Society 146 (5), 1999, pp.1626–1632.
[9] NAKAJIMA H., NOMURA S., SUGIMOTOT., NISHIKAWA S., HONMA I., High temperature protonconducting organic/inorganic nanohybrids for polymer electrolyte membrane, Journal ofThe Electrochemical Society 149 (8), 2002, pp. A953–A959.
[10] SONG J.Y., WANG Y.Y., WAN C.C., Conductivity study of porous plasticized polymer electrolytesbased on poly(vinylidene fluoride) – A comparison with polypropylene separators, Journal ofThe Electrochemical Society 147 (9), 2000, pp. 3219–3225.
[11] SAMAR KUMAR MEDDA, DEBTOSH KUNDU, GOUTAM DE, Inorganic–organic hybrid coatings onpolycarbonate: Spectroscopic studies on the simultaneous polimerizations of methacrylate and silicanetworks, Journal of Non-Crystalline Solids 318(1–2), 2003, pp. 149–156.
[12] POINSIGNON C., Polymer electrolytes, Materials Science and Engineering: B 3(1–2), 1989, pp. 31–37.

396 E. ŻELAZOWSKA, E. RYSIAKIEWICZ-PASEK
[13] DAHMOUCHE K., SANTILLI C.V., DA SILVA M., RIBEIRO C.A., PULCINELLI S.H., CRAIEVICH A.F.,Silica-PEG hybrid electrolytes: structure and properties, Journal of Non-Crystalline Solids247 (1–3), 1999, pp. 108–113.
[14] DE SOUZA P.H., BIANCHI R.F., DAHMOUCHE K., JUDEINSTEIN P., ROBERTO M. FARIA R.M.,BONAGAMBA T.J., Solid-state NMR, ionic conductivity, and thermal studies of lithium--doped siloxane–poly(propylene glycol) organic–inorganic nanocomposites, Chemistry ofMaterials 13 (10), 2001, pp. 3685–3692.
[15] YONG-IL PARK, MASAYUKI NAGAI, Proton-conducting properties of inorganic-organic nanocomposites,proton-exchange nanocomposite membranes based on 3-glycidoxypropyltrimethoxysilane andtetraethylorthosilicate, Journal of The Electrochemical Society 148 (6), 2001, pp. A616–A623.
[16] HUNT A., Statistical and percolation effects on ionic conduction in amorphous systems, Journal ofNon-Crystalline Solids 175 (1), 1994, pp. 59–70.
[17] ŻELAZOWSKA E., ZIEMBA B., LACHMAN W., Counter electrodes for WO3-based electrochromiccoatings, Optica Applicata 30 (4), 2000, pp. 663–670.
[18] BOONSTRA A.H., MEEUWSEN T.P.M., BAKEN J.M.E., ABEN G.V.A., A two-step silica sol–gel processinvestigated with static and dynamic light-scattering measurements, Journal of Non-CrystallineSolids 109 (2–3), 1989, pp. 153–163.
[19] DOO-HYUN LEE, JIN-WOONG KIM, KYUNG-DO SUH, Monodisperse micron-sized polymethyl-methacrylate particles having a crosslinked network structure, Journal of Materials Science 35(24),2000, pp. 6181–6188.
[20] SHUXUE ZHOU, LIMIN WU, WEIDIAN SHEN, GUANGXIN GU, Study on the morphology and tribologicalproperties of acrylic based polyurethane/fumed silica composite coatings, Journal of MaterialsScience 39 (5), 2004, pp. 1593–1600.
[21] PRIMEAU N., VAUTEY C., LANGLET M., The effect of thermal annealing on aerosol-gel deposited SiO2films: a FTIR deconvolution study, Thin Solid Films 310 (1–2), 1997, pp. 47–56.
[22] YING J.Y., BENZIGER J.B., NAVROTSKY A., Structural evolution of alkoxide silica gels to glass: effectof catalyst pH, Journal of the American Ceramic Society 76 (10), 1993, pp. 2571–2582.
[23] GÜNZLER H., GREMLICH H.-U., IR Spectroscopy: An Introduction, Wiley-VCH Verlag GmbH,Weinheim, 2002, pp. 189–246.
[24] PARASHAR V.K., RAMAN V., BAHL O.P., Sol–gel preparation of silica gel monoliths, Journal ofNon-Crystalline Solids 201 (1–2), 1996, pp. 150–152.
[25] MUNRO B., Ion-conducting properties of SiO2 gels containing lithium salt, Glass Science andTechnology – Glastechnische Berichte 68(4), 1995, pp. 123–132.
[26] KYOUNG-HEE LEE, KI-HO KIM, HONG S. LIM, Studies on a new series of cross-linked polymerelectrolytes for a lithium secondary battery, Journal of The Electrochemical Society 148 (10),2001, pp. A1148–A1152.
[27] EISENBERG A., Physical Properties of Polymers, 2nd Ed., American Chemical Society, WashingtonDC, 1993, p. 88.
[28] DONNADIEU A., Electrochromic materials, Materials Science and Engineering: B 3 (1–2), 1989,pp. 185–195.
[29] ÖZER N., Electrochemical properties of sol–gel deposited vanadium pentoxide films, Thin SolidFilms 305 (1–2), 1997, pp. 80–87.
[30] COGAN S.F., NGUYEN N.M., PERROTTI S.J., RAUH R.D., Optical properties of electrochromicvanadium pentoxide, Journal of Applied Physics 66(3), 1989, pp. 1333–1337.
[31] ASHRIT P.V., BADER G., TRUONG V.V., Electrochromic properties of nanocrystalline tungsten oxidethin films, Thin Solid Films 320 (2), 1998, pp. 324–328.
[32] COGAN S.F., PLANTE T.D., PARKER M.A., RAUH R.D., Electrochromic solar attenuation in crystallineand amorphous LixWO3, Solar Energy Materials 14 (3–5), 1985, pp. 185–193.
Received November 12, 2009in revised form January 4, 2010

Optica Applicata, Vol. XL, No. 2, 2010
Optical properties of small silver particles embedded in soda-lime silica glasses
MARIA SUSZYŃSKA*, TERESA MORAWSKA-KOWAL, LUDWINA KRAJCZYK
Institute of Low Temperature and Structure Research, Polish Academy of Sciences, ul. Okólna 2, 50-950 Wrocław, Poland
*Corresponding author: Maria [email protected]
The optical characteristics of silver nanoparticles embedded in a surface layer of commercial sodalime silica glass have been analysed. Additional results were obtained by the transmission electronmicroscopy observations and the selective area electron diffraction patterns. In this report, wehave shown the effect of deviation from the spherical shape and non-homogeneous distribution onthe optical characteristics of the Ag nanocrystals embedded in the dielectric matrix under study.
Keywords: soda-lime silica glass, ion exchange, silver nanoparticles, optical absorption, transmissionelectron microscopy.
1. Introduction
Embedding silver-clusters of nanometer dimensions in a dielectric matrix, e.g.,the oxide glasses, provides a simple way to study the linear and nonlinear opticalproperties of the systems thus composed [1]. The main feature of the linear opticalresponse of these new materials is the collective excitation of the free conduction bandelectrons, known as the surface plasmon resonance (SPR), and observed in the visibleregion of the optical spectra [1]. In addition to the basic interest, the presence ofa quantum-size behaviour has attracted much attention in view of the potential photonicapplications of the systems mentioned [2, 3].
In the present communication, we report on the optical response of Ag-clustersembedded in a soda-lime silica (SLS) glass. This study extends our previousworks reporting on the optical, mechanical and dielectric characteristics of the samesystem [4–6]. Because of the results obtained recently for the copper-doped SLSglass [7], special attention was paid to changes of the shape of matrix droplets as wellas to the shape and size of the metal nanoparticles during the thermal treatment whichfollows the Ag/Na ion exchange process.

398 M. SUSZYŃSKA, T. MORAWSKA-KOWAL, L. KRAJCZYK
2. Experimental part
The main constituents of the SLS glass were (mole percent): SiO2 (73.5), Na2O (13.8),CaO (6.5), MgO (4.5), and Fe2O3 (0.15) that contains about 50% of divalent iron; thiscomposition corresponds to the miscibility gap in the SiO2–Na2O system [8].
For ion exchange, the sample (about two millimetres thick) was kept ata temperature Tex for a time tex in a molten mixture of NaNO3 and AgNO3. Afterexchange, the samples were annealed at 873 K either for 0.5 or 4 h in the ambientair. The Table gives the concentration c of AgNO3, the parameters Tex and tex as wellas values of the penetration depths (pd) of metallic silver obtained after the thermaltreatment. Values of pd0.5 and pd4 were determined by microspectrophotometricmeasurements, cf. [5, 9].
The optical absorption (OA) spectra were recorded in the range between 250 and600 nm using a Varian (Cary 5) spectrophotometer; all measurements were performedat 294 K.
Microstructural data were obtained by means of a transmission electron microscope(TEM; PHILIPS-CM20) operating at 200 kV and providing a 24 nm point-to-pointresolution. Two types of replica (extraction and carbon-shadowed) were prepared fromsurfaces normal to the exchanged one. The selected area electron diffraction pattern(SAEDP) evidenced the presence of crystalline species.
3. Results and discussion
3.1. TEM observations and SAED performances
A typical TEM image of the doped SLS glass is shown in Fig. 1 for the sample FAg2.The crystalline nature of nanoparticles is revealed by the SAED, cf. the inset ofFigs. 1a and 1b (left-hand side). The detected diffraction rings with reflectionsfrom the {111} and {200} type planes correspond to the fcc structure of metallicsilver. Figures 1a and 1b (right-hand side) shows the matrix morphology for the samespecimens.
It is evident that after a short annealing time, the silver nanoparticles are mostlyspherical in shape, their size ranging between 2 and 10 nm. With increasingannealing time, coalescence of adjacent nanocrystals is facilitated and a marked
T a b l e. Parameters of the ion exchange process and the silver penetration depths for specimensannealed at 873 K for 0.5 and 4 h.
Sample c [%] Tex [K] tex [h] pd0.5 [μm] pd4 [μm]FAg1 0.5 673 2 130 250FAg2 2 673 2 180 380FAg3 0.5 603 310 250 490FAg4 2 603 310 330 595

Optical properties of small silver particles embedded in soda-lime silica glasses 399
deviation from the spherical shape of the Ag-particles is observed. The phase separateddroplets, present yet in the glass-matrix, behave qualitatively in the same way, i.e.,they change their size and shape along with the thermal treatment.
It should be stressed that the variation of the shape of metal nanocrystallites withsize is often overlooked and a simplistic description of the optical behaviour based onspherical particles is assumed [10–13]. On the other hand, the altered matrixmorphology, not considered up to now, has been tentatively related with the formationof mixed sodium-silver silicates, similar to the case of copper-doped SLS glass [7].
3.2. Optical absorption dataFigures 2a–2c shows the OA-characteristics of spectra obtained for annealedspecimens, and the last picture gives values of the Ag-particle diameters versus theirpenetration depth.
It was detected that the spectra exhibited a shift of the absorption-edge in the near--UV-region (not shown here) towards lower energies, and the spectral features ofthe UV-Ag-absorption were affected by the UV-absorption of the glass-matrix.
The occurence of the SPR absorbance is attributed to the interband transitionswhich dominate UV-vis region. The blue and red shift (for different depths of eachsample) of the band position λ is accompanied by changes of the absorbance A and ofthe full-width half-maximum of the absorption peak δ1/2. These changes are stronglydependent upon the annealing time, cf. Figs. 2a–2c.
The behaviour of the SPR absorption peak corresponds well with the size ofthe Ag-particles which are changing not only with the exchange parameters but alsowith the penetration depth characteristic of the thermal treatment.
Fig. 1. TEM-micrographs of the ion exchange sample FAg2 after annealing at 873 K for 0.5 h (a) and4 h (b).
a
b

400 M. SUSZYŃSKA, T. MORAWSKA-KOWAL, L. KRAJCZYK
The formation of mixed silver-alkali ion silicates at a given stage of the productionis probably responsible for the complex character of the depth-dependences of 2R,A, λ and δ1/2 shown in the present communication.
Several attempts have been made to model the OA spectra of dielectrics dopedwith metal nanoparticles by taking into account the effect of their size [1]. The effectof shape, which also modifies the optical properties and the effective dielectricconstant, has drawn lesser attention; for instance, the effective medium theoryintroduced by MAXWELL-GARNETT [12] and BRUGGEMAN [13] considered the sphericaland ellipsoidal shapes only. Unfortunately, the complex character of our results cannotat present be explained on the basis of the aforementioned models. It seems that moreexperimental work is necessary, especially with respect to the nucleation and growthof the matrix occlusions and the metal nanoparticles, as well.
4. Conclusions
We have reported changes of the half-width, intensity, and shift of the position ofthe plasmon resonance absorption peak with increasing size of the Ag-particlesembedded in the SLS glass matrix.
Fig. 2. OA-characteristics of the FAg2 specimen annealed for 4 h at 873 K (a–c), and the size ofthe created silver particles (d). All data are shown as a function of the silver penetration depth.
a b
c
d

Optical properties of small silver particles embedded in soda-lime silica glasses 401
The following conclusions have been drawn:1. The substitution of Na by Ag-ions cannot be described by a simple replacement
reaction; one has to take into account some structural rearrangements during the ionexchange well below the glass-transformation temperature;
2. The effect of size, shape and distribution of the silver nanoparticles uponthe optical absorption of a composite material is more complicated than anticipatedtheoretically on the basis of the free metal nanoparticles;
3. A combination of the ion exchange process with thermal treatments is a propertechnique for obtaining waveguiding structures with Ag-metallic-aggregates.
Acknowledgements – The authors wish to thank Dr. K.-J. Berg from the MLU in Halle/Saale (Germany)for making the microspectrophotometric measurements possible.
References[1] KREIBIG U., VOLLMER M., Optical Properties of Metal Clusters, Springer, Berlin, 1995.[2] HACHE F., RICARD D., FLYTZANIS C., KREIBIG U., The optical Kerr effect in small metal particles and
metal colloids: The case of gold, Applied Physics A 47(4), 1988, pp. 347–357.[3] RAMASWAMY R.V., SRIVASTAVA R., Ion-exchanged glass waveguides: A review, Journal of Lightwave
Technology 6 (6), 1988, pp. 984–1000.[4] CAPELLETTI R., COISSON R.,VAN HOI P., MORA C., SUSZYNSKA M., VEDDA A., Thermally stimulated
depolarisation currents of quartz and mixed alkali silicate glasses, 8th International Symposium onElectrets (ISE 8), 1994, pp. 511–516.
[5] BERG K., CAPELLETTI R., KRAJCZYK L., SUSZYNSKA M., Optical and electrical characterization ofsilver nanoparticles in soda lime silicate glasses, 9th International Symposium on Electrets (ISE 9),1996, pp. 378–383.
[6] SUSZYNSKA M., SZMIDA M., GRAU P., Mechanical characteristics of mixed soda-lime silicate glasses,Materials Science and Engineering A 319–321, 2001, pp. 702–705.
[7] SUSZYNSKA M., SZMIDA M., CIZMAN A., Structure and hardness of the copper-doped soda-lime silicaglass, 2009, accepted for publication in J. Phys. (c).
[8] PORAI-KOSHITS E.A., AVERJANOV V.I., Primary and secondary phase separation of sodium silicateglasses, Journal of Non-Crystalline Solids 1 (1), 1968, pp. 29–38.
[9] BERG K.-J., BERGER A., HOFMEISTER H., Small silver particles in glass surface layers produced bysodium-silver ion exchange – their concentration and size depth profile, Zeitschrift für Physik D:Atoms, Molecules and Clusters 20 (1–4), 1991, pp. 309–311.
[10] STEUBING W., Über die optischen Eigenschaften kolloidaler Goldlösungen, Annalen derPhysik 331(7), 1908, pp. 329–371.
[11] KREIBIG U., Electronic properties of small silver particles: the optical constants and theirtemperature dependence, Journal of Physics F: Metal Physics 4 (7), 1974, pp. 999–1014.
[12] MAXWELL-GARNETT J.C., Colours in metal glasses and in metallic films, Philosophical Transactionsof the Royal Society A 203, 1904, pp. 385–420.
[13] BRUGGEMAN D.A.G., Berechnung verschiedener physikalischer Konstanten von heterogenenSubstanzen. I. Dielektrizitätskonstanten und Leitfähigkeiten der Mischkörper aus isotropenSubstanzen, Annalen der Physik, Leipzig 416(7), 1935, pp. 636–664.
Received November 12, 2009in revised form January 6, 2010

Optica Applicata, Vol. XL, No. 2, 2010
Biocompatible glass composite system – some physical-mechanical properties of the glass composite matrix system
BARBARA STANIEWICZ-BRUDNIK1*, MAŁGORZATA LEKKA2, LUCYNA JAWORSKA1, WŁODZIMIERZ WILK1
1Institute of Advanced Manufacturing Technology, Wrocławska 37a, 30-011Kraków, Poland
2Institute of Nuclear Physics PAN, Radzikowskiego 152, 31-342 Kraków, Poland
*Corresponding author: [email protected]
In this work there are discussed the physical-mechanical properties of the glass CaO–SiO2–P2O5––Na2O system (FB3) assigned for the glass composite matrix system using the following researchmethods: spectral chemical analysis (XRF), SBET specific surface area analysis, XRD investigation,observation with a scanning electron microscope (SEM), wettability of the submicrocrystallinesintered corundum (ssc) by the glass system, microhardness test and DTA measurement. It wasfound that theoretical oxide chemical composition was close to that obtained from the spectralchemical analysis (XRF), the prolongated high energetic milling of the glass system did not haveany significant influence on the specific surface area of grains (from 0.9159 m2/g after 5-hourmilling to 1.9241 m2/g after 20-hour milling process only), in comparison to the specific surfacearea of the ssc, wettability investigation of the submicrocrystalline sintered corundum by the glassFB3 system showed the value of contact angle (θ < 45°), and the microhardness value ofabout 6 GPa. On the basis of DTA results the sintering temperature of bioglass composite withthe strengthening phase from the submicrocrystalline sintered corundum was determined and,using the previous experience, the way of producing composite was proposed. The calculation ofthe thermodynamic stability of the glass system-strengthening phase by VCS algorithm showedthe presence of 4–5 solid compounds. The results of the fibroblast (cell line CCL 110,Promochem LG) preliminary culture investigation on the bioglass composite substrate werepositive. The best results were obtained in the case of the biocomposite with the smallest amountof strengthening phase.
Keywords: glass of CaO–SiO2–P2O5–Na2O system, submicrocrystalline sintered corundum, bioglasscomposite, XRF, XRD, DTA, contact angle, VCS algorithm, fibroblast culture.
1. IntroductionGlassy biocompatible composites form a new generation of ceramic materials for usein tissue engineering [1–5]. Inorganic, polymer and hybrid biomaterial substratescan form two- or three-dimensional scaffolds on which cells (e.g., fibroblasts) are

404 B. STANIEWICZ-BRUDNIK et al.
planted and bred in vitro and subsequently this material-cell product is implanted.The fundamental criteria for suitability of the substrates have been thus formulated[4, 6–8]:
– The substrate should contain interconnected pores of such sizes that would favorintegration of the cells, and subsequently tissues and their vascularity.
– They should have appropriate chemical properties of bioactivity and non-toxicitywhich favor the attachment of cells to the substrate, their differentiation andmultiplication. Also, mechanical properties similar to the natural ones are required,specifically, resistance to stretching and twisting, hardness and Young’s modulus.
– They must not produce unwanted reactions such as inflammation.– They should be easily produced in various shapes and sizes.Taking account of all these requirements, substrate materials were synthesized,
including biocompatible glassy composites. Glassy composites, comprising propertiesof their constituent materials, allow the attainment of unique properties, such as:high mechanical strength, resistance to fracture, high biocompatibility and bioactivity.The biological activity of glasses and glass-ceramics depends on their chemicalcomposition and results from the specific nature of the glassy substance contained[8–11].
The ability of bioactive glasses and glass-ceramic implants to bond to bone tissueforms the subject of numerous investigations involving in vitro observations ofchanges on the material surface caused by solutions simulating human blood plasma(SBF). It was shown that for materials such as Bioglass, Ceravital, and glass-ceramics,hydroxylapatite Cerabone, bonding with the living bone material starts bythe formation of a surface layer enriched in calcium and phosphorus, which formsa hydroxyapatite containing a carbonate molecule with a deformed structure, similarto that of bone apatite [3, 7, 12, 13].
2. Subject and research methodology
The research aims at a glass matrix composite from the glass of CaO–SiO2–P2O5––Na2O system and the bioglass composite with the strengthening phase ofsubmicrocrystalline sintered corundum added with the amounts of 10, 20, and 30 vol%designed for the substrate of human skin fibroblast culture.
The glass of CaO–SiO2–P2O5–Na2O system (FB3) was obtained by traditionalmethod (heat treatment and fritting process) from previously precisly mixed rawmaterials.
Further, the glass system powder was subjected to the high energetic milling for5, 10, 15, 20 hours in the Fritsch type milling grinder in the weight proportion of ballsto grains 10:1 and the addition of water as a sliding substance. The glass samples afterspecific time (5, 10, 15, 20 hours) were removed from the chamber and subjected tofurther research procedures.
The measurement of the specific surface area SBET was done using the specialmultifunctional apparatus of ASAP2010 of Micrometrix. The specific surface area
Biocompatible glass composite system ... 405
SBET was determined by the physical adsorption of nitrogen at nitrogen’s liquefactiontemperature (77 K) with the Brunauer–Emmett–Teller equation.
The specific density measurements of the glass FB3 system were done in the heliumpicometer of Accu Pyc 330.The average grain size based on the specific density andspecific surface area data was calculated using the following equation:
where: 2r – diameter of the grains, SBET – specific surface area of grains, ρ – specificdensity of the glass FB3 system.
The obtained glass powder was subjected to spectral analysis by XRF method.The X-ray investigation was carried out on the X’Pert diffractometer of PanalyticalCompany using the Cu lamp in the 2θ angle range of 10–90°.
Microscopic observation of the glass system and bioglass composite was carriedout on the scanning electron microscope of the Joel Company of JSM6460 LV at lowvacuum and accelerating voltage of 20 kV at magnifications of 10, 100, 1000.
DTA investigation of the glass FB3 system was carried out using the Derivatograph1500 D apparatus by heating the sample in the platinum crucible with 10 °C/min speedto 1000 °C in the air atmosphere.
The wettability investigation of the submicrocrystalline sintered corundumsubstrate by the glass FB3 system was carried out under the high temperaturemicroscope of MHO2 Leitz–Watzler type by the sessile-drop method in the airatmosphere.
Microhardness test was performed using the FM7 detector under a 100 g loading.On the basis of DTA of the glass FB3 system investigation the sintering temperatureof glass matrix composite system with strengthening phase was carried out and usingthe previous experience the way of obtaining the bioglass composite was proposed.Thermodynamic stability of the glass FB3 system-strengthening phase (10, 20,30 vol% of submicrocrystalline sintered corundum) was calculated using VCSalgorithm.
On the samples of the bioglass composite (φ 10×4 mm), after proper preparationof surface area (quasi-polished section) and sterilization (12 hours in a 70% alcoholsolution and 2 hours of exposure of each side of the sample to UV lamp), fibroblastsfrom human skin (cell line No CCL 110, Promochem LG) were cultured in DMEMmedium (Dulbecco’s Modified Eagle Medium, Sigma) containing 5% of fetal bovineserum and a 1% mixture solution of antibiotics (streptomycin, neomycin andpenicillin). The results of investigation are discussed below.
3. Results and discussionThe glass of the CaO–SiO2–P2O5–Na2O system (FB3) obtained by fritting processat a temperature of 1350 °C was characterized by low viscosity, absence of gas bubbleand milk-amber color (Fig. 1).
2r 6SBET ρ
----------------------=

406 B. STANIEWICZ-BRUDNIK et al.
The glass powder was milled for 5, 10, 15, 20 hours (Fig. 2) in the Fritsch planetarball grinder. It was found that prolongated high energetic milling of glass FB3 systemdid not have a significant influence on the increase of specific surface area of the glassFB3 system (SBET 0.9159 m2/g after 5-hour milling, 1.9241 m2/g after 20-hour milling)in comparison to the specific surface area changes of the submicrocrystalline sinteredcorundum (0.1 m2/g for unmilled sample and 16.4 m2/g after 30-hour milling). Thiscan be explained by the specific structure of the glass FB3 system and big cohesiveinteractions.
Because of this fact the granulometric analysis of grains was difficult to perform.The calculations of average grains size from the equation showed that the grain sizeof the glass FB3 system was decreased 2.5 times only (Tab. l).
The density of the glass FB3 system was determined by the helium method atthe AccuPyc 330 picometer and had the value of 2.6554 g/cm3.
Microhardness test was done using the FM7 detector under a 100 g loading. InTab. 2 and Fig. 3, the results of microhardness of the glass FB3 system (about 6 GPa)are presented.
Fig. 1. The scanning electron microscope images of the glass CaO–SiO2–P2O5–Na2O (FB3) systemafter fritting process; magnified 15× (a), magnified 200× (b).
Fig. 2. The scanning electron microscope images of the glass CaO–SiO2–P2O5–Na2O (FB3). FB3 glasssystem after 5-hour milling (a), FB3 glass system after 20-hour milling (b).
a b
a b

Biocompatible glass composite system ... 407
To fulfill the requirements of the XRF apparatus assigned for spectral chemicalanalysis, the glass powder milled for 10 hours was used. The method, which is simpleand cheap, allowed the chemical oxide composition to be precisely determined(Tab. 3). The obtained values of spectral chemical oxide composition were close tothose of the theoretical calculations.
The X-ray investigation showed absolutely amorphic structure with increasingthe background in the low angle range.
T a b l e 1. The results of specific surface area and average grain size after prolongated high energeticmilling of the glass FB3 system.
T a b l e 2. The microhardness measurement of glass FB3 system.
Milling time [h] Specific surface area [m2/g] Average grain size [μm]5 0.9159 2.47
10 0.9553 2.3615 1.1964 1.8920 1.9241 1.17
Sample HV HVav Standard deviation of single measurement
Average standard deviation
Uncertainty of HVav for t (α = 0.005, n–1 = 4)
[–] [–] [–] [–] +/– %FB3 560 568 8.4 3.7 10.4 1.8
Fig. 3. The microhardness indents of the glass FB3system.
T a b l e 3. Chemical oxide compositions of glass system, spectral chemical analysis [wt%].
Oxide composition of glass system
Calculated composition
Spectral chemical analysis
CaO 19.200 19.0SiO2 54.145 52.9P2O5 5.912 5.23Na2O 20.706 20.0Additives < 0.37 < 2.67

408 B. STANIEWICZ-BRUDNIK et al.
The wettability investigation of submicrocrystalline sintered corundum substrateby the glass FB3 system showed that contact angle was proper and low at elevatedtemperature (θ < 45°, Fig. 4).
The DTA research (Fig. 5) allowed determination of the vitrification temperature(Tg = 525.2 °C) and dilatometric point temperature (Td = 711.9 °C). On the basis ofthe above investigation the sinter temperature of bioglass composite with the strength-ening phase was initially estimated.
A production technology comprising cold pressing and traditional heat treatmentor cold pressing, isostatic densification and traditional heat treatment wasdeveloped.
The theoretical calculation of the thermodynamic stability of the glass FB3 system-strengthening phase with the submicrocrystalline sintered corundum (ssc-amount of10, 20, 30 vol%) was carried out by the VCS algorithm (Tab. 4).
Using the VCS algorithm, theoretical calculations were made of the thermody-namic stability of the system FB3 glass – 10, 20 and 30 vol% submicrocrystallinesintered corundum strengthening phase. It was found that amongst some 100possible compounds, probably stable are 4–5 compounds in the solid phase (Tab. 4).From both hypotheses it follows that, for all of the three types of composite present,
Fig. 4. The wettability of submicrocrystalline sintered corundum by glass FB3 system: 101 °C (a),958 °C (b), 1010 °C (c), θ < 45°.
a b c
Fig. 5. DTA of the glass CaO–SiO2–P2O5–Na2O (FB3) system.

Biocompatible glass composite system ... 409
T a b l e 4. The thermodynamic stability of bioglass composites with additives of ssc – VCS algorithmcalculation.
Glass FB3 system (90 vol%) + ssc (10 vol%)Temperature 570 570 590 590Assumption I II I IINa2SiO3 2.868 2.868 2.868 2.868CaSiO3 4.104 4.104 4.104 4.104Ca3(PO4)2 0.786 0.786 0.786 0.786NaAlSiO4 6.59 6.59 6.59 6.59NaAlSi3O8 1.148 1.148 1.148 1.148Glass FB3 system (80 vol%) + ssc (20 vol%)Temperature 570 570 590 590Assumption I II I IICa3(PO4)2 0.698 0.698 0.698 0.698NaAlSiO4 11.975 11.975 11.975 11.975Ca2Al2SiO7 0.241 0.241 0.241 0.241Ca3Al2Si3O12 0.965 0.965 0.965 0.965Glass FB3 system (70 vol%) + ssc (30 vol%)Temperature 570 570 590 590Assumption I II I IIAl2O3 4.554 4.554 4.554 4.554Ca3(PO4)2 0.611 0.611 0.611 0.611CaAl4O7 0.448 0.448 0.448 0.448NaAlSiO4 10.478 10.478 10.478 10.478Ca3Al2Si3O12 0.914 0.914 0.914 0.914
Fig. 6. The microscopic image of haematoxylinstained fibroblast (violet) cultured for 14 days ona surface of bioglass composite with: 10 vol% (a),20 vol% (b), 30 vol% (c) of the submicrocrystallinesintered corundum additives, magnified 6×.
a b
c

410 B. STANIEWICZ-BRUDNIK et al.
there are the following compounds: NaAlSiO4 solid state and Ca3(PO4)2 in the liquidstate.
Practical verification of the presence of these compounds in the biocomposites willbe made by X-ray methods in the next stage of the work.
The fibroblasts from human skin (cell line No CCL 110, Promochem LG) werecultured, after the appropriate surface preparation, on the three variants of bioglasssamples (φ 10×4 mm). After 14 days of growth, the cells were fixed using coldacetone (4 °C) for 10 minutes and stained with haematoxylin to visualize cellnucleolus. The optical microscope images showed the largest number of fibroblastcells to be present on the surface of the sintered composite containing 10 vol% ofsubmicrocrystalline corundum. A felt-like layer of fibroblasts was established, which,during the cleaning process, was not separated from the surface. With increasingamount of the strengthening phase, submicrocrystalline sintered corundum (20%,30%), the number of the cultured fibroblast cells decreased (Fig. 6). This observationwill be possible to explain after examination of the surface topography (roughness,open and closed porosity) of the sintered glassy biocomposites.
4. Resume
The glass of CaO–SiO2–P2O5–Na2O system (FB3) has proper physical-mechanicalproperties (microhardness – 6 GPa, contact angle to submicrocrystalline sinteredcorundum substrate θ < 45°) and biocompatibility (the fibroblast culture results)which fulfill the application criteria for biocomposites.
The theoretical oxide chemical composition of the glass system was the same asthat resulting from the spectral chemical analysis (XRD) taking into considerationvolatility of phosphates at a 10% level.
It was found that prolongated high energetic milling of glass system, did not haveany significant influence on the specific surface area of grains (from 0.9159 m2/gafter 5-hour milling, to 1.9241 m2/g after 20-hour milling process) and decrease ofthe average value of grains (from 2.47 μm to 1.17 μm).
The wettability (wetting) investigation of the submicrocrystalline sinteredcorundum by the glass system showed the value of contact angle (θ < 45°).
On the basis of DTA results the sintering temperature of biocomposite wasdetermined and using the previous experience the way of producing biocompositewas proposed.
The calculation of the thermodynamic stability of the glass system strengtheningphase from submicrocrystalline sintered corundum by VCS algorithm showedthe presence of 4–5 solid compounds, whose verification by XRD method will beperformed in the next stage of the work. The results of the preliminary fibroblastgrowth on the surface of bioglass composite substrates were positive showingthe biocompatibility of these surfaces. The best results were obtained in the case ofthe biocomposite substrate with the smallest amount of the strengthening phase.

Biocompatible glass composite system ... 411
5. Conclusions
On the basis of the research work performed it can be concluded that:– The proposed glass of the CaO–SiO2–P2O5–Na2O system (FB3) fulfills
the application criteria for glass matrix composite because of the proper physical--mechanical properties (microhardness, wettability of submicrocrystalline sinteredcorundum, temperature stability) and biocompatibility (the fibroblast culture results).
– Verification of the thermodynamic stability of compounds calculated by VCSalgorithm based on XRD and DTA investigation is necessary.
– Investigation of the influence of the way of producing bioglass composite (coldsintering and traditional heat treatment or cold sintering with isostatic densificationand traditional heat treatment) on the topography of the surface area (roughness,porosity) is necessary.
Acknowledgement – This work was supported by the Polish Ministry of Science and Higher Educationunder the statutory grant DS 3683.
References[1] JAEGERMANN Z., ŚLÓSARCZYK A., Gęsta i porowata bioceramika korundowa w zastosowaniach
medycznych, Uczelniane Wydawnictwo Naukowo-Dydaktyczne AGH, Kraków, 2007 (in Polish).[2] JAEGERMANN Z., Porowata bioceramika korundowa, PhD Thesis, AGH, Kraków, 2005 (in Polish).[3] BŁAŻEWICZ S., STOCH L., Biomateriały, [In] Biocybernetyka i Inżynieria Biomedyczna, Vol. 4,
Akademicka Oficyna Wydawnicza, Exit, Warszawa, 2003 (in Polish).[4] SACHLOS E., CZERNUSZKA J.T., Making tissue engineering scaffolds work. Review: The application
of solid freeform fabrication technology to the production of tissue engineering scaffolds, EuropeanCells and Materials, No. 5, 2003, pp. 29–40.
[5] HENCH L.L., Biomaterials: a forecast for the future, Biomaterials 19 (16), 1998, pp. 1419–1423.[6] ŚLÓSARCZYK A., RAPACZ-KMITA A., Bioaktywne ceramiczne materiały kompozytowe, Materiały
Ceramiczne 56 (4), 2004, pp. 144–149 (in Polish).[7] CHEN Q.Z., EFTHYMIOU A., SALIH V., BOCCACINI A.R., Bioglass-derived glass-ceramic scaffolds:
Study of cell proliferation and scaffold degradation in vitro, Journal of Biomedical MaterialsResearch Part A 84(4), 2008, pp. 1049–1060.
[8] KRAJEWSKI A., RAVAGLIOLI A., Bioceramics and biological glasses, [In] Integrated BiomaterialsScience, Springer US, 2002.
[9] NIŻANKOWSKI CZ., Manufacturing sintered corundum abradants, Archives of Civil and MechanicalEngineering 2 (2), 2002, pp. 53–64.
[10] SZARSKA S., STANIEWICZ-BRUDNIK B., LEKKA M., The effect of the size of the substrate grain madeof submicrocrystalline sintered corundum on the bioglass composite structure and certain physico--mechanical properties of the bioglass, Optica Applicata 38 (1), 2008, pp. 251–258.
[11] PUTTINI S., LEKKA M., DORCHIES O.M., SAUGY D., INCITTI T., RUEGG U.T., BOZZONI I., KULIK A.J.,MERMOD N., Gene-mediated restoration of normal myofiber elasticity in dystrophic muscles,Molecular Therapy 17(1), 2009, pp. 19–25.
[12] JAEGERMANN Z., MICHAŁOWSKI S., KARAŚ J., CHROŚCICKA A., LEWANDOWSKA-SZUMIEŁ M.,Porowate nośniki korundowe do zastosowania w inżynierii tkankowej, Szkło i Ceramika 57 (4), 2006,pp. 16–20 (in Polish).

412 B. STANIEWICZ-BRUDNIK et al.
[13] LEKKA M., LEIDLER P., Applicability of AFM in cancer detection, Nature Nanotechnology 4 (2), 2009,p. 72.
[14] VITALE BROVARONE C., VERNÉ E., APPENDINO P., Macroporous bioactive glasse-ceramic scaffoldsfor tissue engineering, Journal of Materials Science: Materials in Medicine 17(11), 2006,pp. 1069–1078.
Received November 12, 2009in revised form March 26, 2010

Optica Applicata, Vol. XL, No. 2, 2010
Synthesis and optical spectroscopy of the Eu- and Pr-doped glasses with SrO–2B2O3 composition
BOHDAN PADLYAK1, 2*, MAREK GRINBERG3, BENEDYKT KUKLIŃSKI3, YURIY OSELEDCHIK4, OLEKSANDR SMYRNOV2, DMITRIY KUDRYAVTCEV4, ANDREW PROSVIRNIN4
1Institute of Physical Optics, Sector of Spectroscopy, 23 Dragomanov St., 79-005 Lviv, Ukraine
2University of Zielona Góra, Institute of Physics, Division of Spectroscopy of Functional Materials, 4a Szafrana St., 65-516 Zielona Góra, Poland
3University of Gdańsk, Institute of Experimental Physics, Condensed Matter Spectroscopy Division, 57 Wita Stwosza St., 80-952 Gdańsk, Poland
4Zaporizhya State Engineering Academy, Department of Physics, 226 Lenin Ave., 69-006 Zaporizhya, Ukraine
*Corresponding author: [email protected]; [email protected]
A series of Eu- and Pr-doped glasses with SrO–2B2O3 (or SrB4O7) composition were obtainedand their spectroscopic properties were investigated. The SrB4O7 polycrystalline compounds weresynthesised at T = 1300 K using high purity strontium carbonate (SrCO3) and boric acid (H3BO3).The Eu and Pr impurities were added to SrB4O7 compounds as Eu2O3 (amount: 0.167 at.%) andPr2O3 (amounts: 0.05 and 0.25 at.%) oxides. The glass samples of high chemical purity and opticalquality were obtained from corresponding polycrystalline compounds in the air atmosphere inplatinum crucibles according to standard glass technology. Optical absorption, luminescenceexcitation and emission spectra of the Eu- and Pr-doped glasses with SrO–2B2O3 compositionwere investigated in the spectral range 300–800 nm at temperatures of 293 and 85 K. On the basisof optical spectra obtained and electron paramagnetic resonance (EPR) data analysis it is shownthat Eu and Pr impurities are incorporated into the SrO–2B2O3 glass network as Eu3+ (4 f 6, 7F0)and Pr3+ (4f 2, 3H4) ions, exclusively. All the observed transitions of the Eu3+ and Pr3+ centres inabsorption and luminescence spectra were identified. The luminescence kinetics of Eu3+ and Pr3+
centres were investigated and analysed. The decay constants for main emission transitions in allsamples investigated were obtained at room temperature. Peculiarities of incorporating the Eu3+
and Pr3+ activator ions in the glass with SrO–2B2O3 composition and their optical spectra arediscussed in comparison with rare-earth doped polycrystalline compounds and single crystals withthe same (SrB4O7) composition and other borate glasses.
Keywords: borate glasses and crystals, Eu3+ centre, Pr3+ centre, optical absorption, luminescence, decaykinetics, local structure.

414 B. PADLYAK et al.
1. Introduction
The strontium tetraborate crystalline compounds (SrB4O7) are perspective nonlinearoptical and luminescent materials due to their excellent mechanical and opticalproperties, such as high hardness, non-hygroscopy, high SHG (second harmonicgeneration) coefficient, high transparency in a wide spectral range (135–3200 nm)and high optical damage threshold [1–3]. The polycrystalline SrB4O7 compounds canbe obtained by solid state reaction synthesis and corresponding single crystals of highoptical quality can be obtained using Kyropoulos and Czochralski methods [1, 2].Practically, all borate compounds, including tetraborates, can be obtained in bothcrystalline and glassy forms. From technological point of view the glassy (or vitreous)compounds are more perspective in comparison with corresponding single crystals,because glass synthesis technology is relatively cheap. But spectroscopic studies ofthe electron and local structure of luminescence centres in oxide glasses are morecomplicated and require adequate spectroscopic and structural data for their crystallineanalogies [4, 5].
During the last decade intensive luminescence investigations of the rare-earthdoped crystalline strontium tetraborates, obtained by solid-state synthesis,Czochralski, and Kyropoulos methods have been carried out [6–18]. The results provethe materials under study to be perspective for use as commercial phosphors. Inparticular, optical and luminescence properties of the Eu- and Pr-doped SrB4O7crystalline compounds were investigated in [6–14] and [15], respectively. Nonlinearoptical properties of the SrB4O7 single crystals were investigated in [14, 19, 20].The SrB4O7 crystalline and glassy compounds also exhibit thermoluminescence (TL)and were investigated by different authors [21–24] as perspective materials for solidstate dosimetry.
For the first time the crystal structure of SrB4O7 was reported in [25] and describedin detail in [26]. The SrB4O7 crystals belong to the rhombic system (space groupPnm21) and their lattice is formed by fourfold-coordinated boron–oxygen complexes(tetrahedrons) [25, 26]. The Sr atoms are stabilising in the SrB4O7 crystal lattice insites with coordination number to oxygen N = 9. The presence of BO4 tetrahedronsonly in the SrB4O7 lattice (while in other borate compounds, for example, inthe Li2B4O7 crystal, the polyanions are formed by both boron–oxygen tetrahedronsand boron–oxygen triangles [27]) provides the stabilisation of rare-earth ions, e.g.,Eu, Sm, Yb, Pr, etc., in divalent state even if the compound is synthesised in the air[6, 7, 9–14]. This allows obtaining broad emission and luminescence excitation bandsof divalent ions caused by interconfiguration f–d transitions in the UV–VIS spectralregion. It is generally acknowledged that rare-earth ions are incorporated in divalentstate into the lattice of oxide compounds synthesised in the vacuum or in the inertatmosphere. From the analysis of reference data [6–18] we can conclude thatthe rare-earth doping of SrB4O7 crystals obtained in the air leads to incorporation ofrare-earth ions into their lattice, generally, in a divalent state. Only several papers[8–12] report luminescence properties of the Eu3+ ions in SrB4O7:Eu crystalline

Synthesis and optical spectroscopy of the Eu- and Pr-doped glasses ... 415
compounds, obtained in the air. The mechanism of incorporation of divalent rare-earthions into the strontium borate polycrystalline compounds (SrB4O7, SrB6O10, etc.),obtained by solid-state synthesis in the air was discussed in [28–30]. Luminescenceproperties of the Pr-doped SrB4O7 crystalline compounds were investigated in [15].In this paper, it is shown that the Pr impurities are incorporated into the SrB4O7 latticeas Pr2+ ions. Emission lines at 216, 237, 225, 253, 271, 340, 396, and 400 nm in [15]were assigned to the Pr2+ transitions from 1S0 state to 3H4, 3H6, 3F2, 3F4, 1G4, 1D2, 1I6,and 3P2,1,0 states, respectively.
For the first time the results of optical and EPR investigations of Eu- and Pr-dopedglasses with SrO–2B2O3 (or SrB4O7) composition were reported by us in [31]. But upto now, optical spectra and peculiarities of incorporation of Eu and Pr impurities inthe glass with SrO–2B2O3 composition have not been systematically investigated norpublished. This work presents synthesis peculiarities and systematic investigations ofoptical and luminescence properties of the SrO–2B2O3 glasses doped with Eu and Pr.Local symmetry and structure of the luminescence centres are discussed. The resultsare compared to the ones obtained for corresponding crystalline compounds.
2. Experimental details2.1. Synthesis and characterisation of the SrB4O7 polycrystalline compounds and glassesThe SrB4O7 polycrystalline compounds were obtained by solid state reaction synthesisat T = 700–900 °C in the air, using a resistance furnace. The high purity strontiumcarbonate (SrCO3) and boric acid (H3BO3) in the proportion corresponding to SrB4O7composition were used as starting materials. For the purpose of compensatingevaporation during the solid state reaction an extra charge of H3BO3 in amount of2 mol% was added. The Eu and Pr impurities were added to the starting compositionas Eu2O3 (amount: 0.167 at.%) and Pr2O3 (amounts: 0.05 and 0.25 at.%) compounds.All chemicals used for sample synthesis are characterised by special purity (99.5 wt%)and were purchased in Krasnyj khimik (Saint-Petersburg, Russia). The synthesisprocess of SrB4O7 polycrystalline compounds included the following technologicaloperations: mixing of the starting materials, slow heating (2–3 h) to 200–250 °C,heating (3–4 h) up to 850–900 °C, keeping at this temperature for 2–3 h and coolingtogether with the furnace. Chemical composition of the compounds obtained wascontrolled by the X-ray phase analysis.
The Eu- and Pr-doped glasses with SrO–2B2O3 composition of high chemicalpurity and optical quality were obtained in the air atmosphere by meltingthe pre-synthesised SrB4O7:Eu and SrB4O7:Pr compounds in platinum cruciblesaccording to technology developed by the authors. Synthesised polycrystallinecompounds were heated up to melting temperature 1030–1050 °C, mixed by platinumstirrer and held (2 h) at melting temperature to achieve the complete homogenisationand remove any gas bubbles and other centres of crystallisation, then poured intoa corundum cylindrical form (20 mm in diameter, 20 mm in length) and fast cooled.

416 B. PADLYAK et al.
Finally, glasses were annealed at 400 °C during 3–4 h. The obtained glasses werealmost uncoloured and characterised by high optical quality and chemical purity.Samples for optical measurements were cut and polished to obtain an approximate sizeof 5×4×2 mm3.
2.2. Experimental methods and equipmentThe optical absorption spectra of the Eu- and Pr-doped glasses were registered at roomtemperature on a Specord M-40 (Carl Zeiss Jena) spectrophotometer.
The EPR spectra of non-controlled and rare-earth paramagnetic impurities inthe glasses obtained were registered at room and liquid helium temperatures usingmodernised commercial X-band spectrometer of SE/X-2544 type (RADIOPAN,Poznań, Poland), operating in the high-frequency (100 kHz) modulation mode ofmagnetic field.
Photoluminescence (excitation and emission) spectra were obtained attemperatures of 300 and 85 K upon frontal excitation and observation of the sampleemission using equipment built in the Condensed Matter Spectroscopy Division(Institute of Experimental Physics, Gdańsk University, Poland). The emission spectrawere corrected for spectral sensitivity of the equipment. A Hanovia xenon lamp(power: 1000 W) was used as excitation source. The wavelengths required forexcitation and observation were selected using an SPM-2 prismatic monochromator(Carl Zeiss Jena) with stepping motors driven by a computer and photomultipliers usedin the detection circuit and working in analog or photon counter regime. In the lattercase, they sent data to computer via a digital boxcar system. A Hamamatsu R 928photomultiplier was used as a detector.
The luminescence decays were measured using equipment described in detailin [32]. As excitation source the EKSPLA (Vilnius, Lithuania) laser system was used,which consisted of Nd:YAG pulsed laser (model PL 2143A/SS) and parametric opticalgenerator (model PG 401/SH). The detection part consisted of the 2501S spectrograph(Bruker Optics, USA) and the C4334-01 streak camera (Hamamatsu, Japan).
3. Results and discussion3.1. The Eu3+ centres in glasses with SrO–2B2O3 compositionThe Eu impurity in the oxide compounds can be revealed as Eu3+ (4f 6, 7F0) and Eu2+
(4f 7, 8S7/2) ions with characteristic optical absorption and luminescence spectra.The Eu2+ paramagnetic ions can also be registered by EPR technique. In the Eu-dopedglasses with SrO–2B2O3 composition the Eu2+ EPR spectrum was not observedeither at room or liquid nitrogen temperatures. Thus, the Eu impurity is incorporatedinto the SrO–2B2O3 glass network as Eu3+ ions.
In all SrO–2B2O3 glass samples doped with Eu there were observed opticalabsorption and luminescence spectra, characteristic of Eu3+ ions, caused by f– ftransitions. The optical absorption spectrum of the Eu-doped SrO–2B2O3 glassregistered in the spectral range 230–800 nm at room temperature consists of several

Synthesis and optical spectroscopy of the Eu- and Pr-doped glasses ... 417
characteristic weak absorption bands (Fig. 1, spectrum a). In accordance with the Eu3+
energy level diagram all observed absorption bands were assigned to the followingtransitions and groups of transitions: 7F0, 1 → 5I5, 7F0 → 3H4, 6, 7F0 → 5D4, 5L8,7F0 → 5G4–6, 7F0, 1 → 5L6, 7, 5G2, 3, 7F0 → 5D3, 7F0 → 5D2, 7F0, 1 → 5D1,7F0, 1 →
5D0 (Fig. 1, spectrum a). The intense broad absorption band with pronouncedmaximum near 300 nm was assigned to the O2– → Eu3+ charge transfer band (Fig. 1,spectrum a). One can notice that some absorption bands are only weakly revealedin the absorption spectrum (Fig. 1, spectrum a), but are easily observed inthe luminescence excitation spectrum (Fig. 1, spectrum b). The luminescenceexcitation bands show good correlation with corresponding absorption bands (Fig. 1,spectra a and b). In the optical absorption spectrum of Eu-doped SrO–2B2O3 glasses,no bands related to Eu2+ ions were observed, which confirms incorporation of Euimpurity into the glass as Eu3+ ions, exclusively.
The luminescence spectra of Eu3+ centres (Fig. 2) were registered at temperaturesof 293 and 85 K under excitation with λexc = 395 nm that corresponds to the 7F0, 1 →→ 5L6, 7, 5G2, 3 band in absorption and luminescence excitation spectra (Fig. 1,spectra a and b). In the luminescence spectrum at T = 293 K five emission bands,characteristic of Eu3+ ions, in the spectral range 570–730 nm are observed. Thesebands belong to the 5D0 → 7FJ (J = 0–4) transitions and are identified in Fig. 2.The absence of emission from higher 5DJ levels can be related to multiphonon orcross-relaxation processes, caused by a relatively high concentration of Eu3+ centresin the glass network.
The linewidth and resolution of the Eu3+ absorption and luminescence bands(Figs. 1 and 2) remained practically unchanged as the temperature decreased to 85 K.This is an evidence of the inhomogeneous broadening of spectral lines, caused bydisorder of the local environment around Eu3+ centres. The luminescence excitationand emission spectra of Eu3+ ions in the SrB4O7 powdered polycrystals (Figs. 3a
Fig. 1. Optical absorption (a) and luminescence excitation (b) spectra of the Eu-doped (Eu2O3 content:0.167 at.%) glass with SrO–2B2O3 composition, registered at room temperature.

418 B. PADLYAK et al.
Fig. 2. Luminescence spectra of Eu3+ centres in the Eu-doped (Eu2O3 content: 0.167 at.%) glass withSrO–2B2O3 composition, registered under excitation with λexc = 395 nm at temperatures of 293 and 85 K.
Fig. 3. The luminescence excitation (T = 293 K, λobs = 692 nm) (a) and emission (T = 293 K andT = 85 K, λexc = 280 nm) (b) spectra of the Eu3+ centres in the SrB4O7:Eu (Eu2O3 content: 0.167 at.%)polycrystalline powder.
a
b

Synthesis and optical spectroscopy of the Eu- and Pr-doped glasses ... 419
and 3b, respectively) are characterised by narrower and better resolved bands incomparison with the corresponding spectra in the glasses with SrO–2B2O3composition, registered under the same experimental conditions (Figs. 1 and 2).The number and relative intensities of the Eu3+ emission lines (5D0 → 7FJ transitions)are defined by the number of crystallographically non-equivalent centres and theirlocal symmetry in the crystal lattice or glass network [33]. Because of the fact thatthe most intense emission band of the Eu3+ luminescence spectra in the SrO–2B2O3glass corresponds to the 5D0 → 7F2 structurally-sensitive electric dipole transition(Fig. 2), one can suppose that the Eu3+ centres occupy structural sites without inversionsymmetry (non-centrosymmetric sites) [33]. In the luminescence spectra ofSrB4O7:Eu3+ polycrystalline compounds the Eu3+ centres are localised in the sites withinversion symmetry (centrosymmetric sites), because the most intense bandscorrespond to the 5D0 → 7F4 electric and 5D0 → 7F1 magnetic dipole transitions(Fig. 3b). Based on the results obtained and the SrB4O7 crystal structure analysis wecan suppose that the Eu3+ ions occupy Sr2+ sites in the crystal and glass with the samecomposition. In the real glass network the coordination number to oxygen (N ) issmaller than that in the corresponding real crystal one (for ideal SrB4O7 crystalN = 9) [26, 27], because it is characteristic of the glass structure in which the numberof oxygen vacancies is larger. Based on this result, we can explain the localisationof Eu3+ ions in the centrosymmetric Sr-sites of the SrB4O7 crystal lattice andnon-centrosymmetric Sr-sites in the corresponding glass network.
The luminescence decay curves of Eu3+ centres for the 5D0 → 7F2 emissiontransition registered under excitation at λexc = 280 nm and T = 300 K in the narrowand wide (whole) emission band ranges are presented in Figs. 4a and 4b, respectively.Decay curves for glass in the Δλ = 607–627 nm (Fig. 4a) and whole band (Fig. 4b)ranges were described in the framework of a single exponential model with closelifetime values: τ1 = 1.82 ms and τ1 = 1.97 ms, respectively. At the same time, decaycurves for the polycrystalline compound in the Δλ = 586–596 nm (Fig. 4a) and wholeband (Fig. 4b) ranges were satisfactorily fitted with double exponential decay withlifetimes τ1 = 1.76 ms, τ2 = 0.48 ms and τ1 = 2.02 ms, τ2 = 0.56 ms, respectively.The τ1 values for glasses and polycrystalline samples are very similar and can beassigned to the same centres, whereas the τ2 values are considerably (approximately4 times) lower than those of τ1. The longer (τ1) values are characteristic of Eu3+
luminescence centres in other oxide glasses and crystals including borate compoundsand belong to isolated Eu3+ centres in glassy and polycrystalline samples. Becausethe observed optical spectra show only one type of Eu3+ centres in the SrB4O7:Eu glassnetwork, according to [34, 35] we can suppose that the centres with shorter lifetimevalues belong to the Eu3+–Eu3+ exchange-coupled pairs or small exchange-coupledEu3+ clusters.
The results presented above correlate with spectroscopic data for SrB4O7crystalline compounds [8–12] and other Eu-doped borates obtained in the air, inparticular for glasses with 4SrO–7B2O3 (or Sr4B14O25) composition [36]. On the otherhand, in [6, 7, 13–18] it was shown that the europium impurity can be stabilised in

420 B. PADLYAK et al.
the SrB4O7 crystalline compounds in divalent (Eu2+) state during synthesis in the airatmosphere. In [13], authors reported on the preparation of a system containing (RE)2+
ions (RE = Sm, Eu) in the SrB4O7 crystalline matrix by ceramic, Pechini, andcombustion methods using reduction of (RE)3+ to (RE)2+ ions in the air. The emissionspectra of the SrB4O7:Eu2+ system prepared by combustion and Pechini methods arecharacterised by a broadband assigned to the 4f 65d–4f 7 interconfiguration transition.The SrB4O7:RE compounds prepared by combustion method present emission bandsfrom (RE)3+ ions as intense as that arising from (RE)2+, suggesting that the preparationroute is not efficient for (RE)3+ → (RE)2+ reduction [13].
3.2. The Pr3+ centres in glasses with SrO–2B2O3 compositionThe Pr impurity in the oxide compounds can be revealed as Pr3+ (4 f 2, 3H4) andPr 2+ (4 f 3, 4I9/2) ions with characteristic optical absorption and luminescence spectra.The paramagnetic Pr2+ ions can be registered also by EPR technique. In the Pr-doped
Fig. 4. Luminescence decay curves of the Eu3+ centres for 5D0 → 7F2 emission transition in the narrow (a)and whole (b) bands, registered in the SrB4O7:Eu glass (curves a) and corresponding polycrystallinepowder (curves b) under excitation with λexc = 280 nm at T = 300 K. Solid lines – results of fitting.
a
b

Synthesis and optical spectroscopy of the Eu- and Pr-doped glasses ... 421
glass with SrO–2B2O3 composition the Pr2+ EPR spectrum was not observed evenat liquid helium temperatures. Thus, the praseodymium impurity is incorporated intothe SrO–2B2O3 glass network as Pr3+ ions, exclusively.
The optical absorption spectrum of the Pr-doped glass with SrO–2B2O3composition in the spectral range 250–800 nm at room temperature consists offour characteristic absorption bands. According to rare-earth energy level diagramthe observed bands were assigned to appropriate f– f electronic transitions of the Pr3+
ions from the 3H4 ground state to the 1D2, 3P0, 3P1, 3P2 excited states (Fig. 5,spectrum a).
In the luminescence excitation spectrum of the SrO–2B2O3 glass doped with Pr(Pr2O3 content: 0.25 at.%) one can observe three resolved bands in the spectral range550–280 nm, which correspond to the 3H4 → 3P0, 3H4 → 3P1, 3H4 → 3P2 transitions(Fig. 5, spectrum b). The Pr3+ luminescence excitation bands show good correlationwith corresponding absorption bands (Fig. 5, spectra a and b). It should be noted thatthe resolution of Pr3+ optical absorption and luminescence excitation bands in the glasscontaining 0.25 at.% of Pr2O3 is lower than that in the glass containing 0.05 at.% ofPr2O3. This is related to homogeneous broadening of spectral lines, which depends oncentres concentration and temperature.
The luminescence spectrum of Pr3+ centres (Fig. 6) was registered at temperaturesof 293 and 85 K under excitation with λexc = 450 nm that corresponds to the 3H4 → 3P1transition in the absorption and luminescence excitation spectra (Fig. 5, spectra aand b). In the Pr3+ luminescence spectrum at temperatures of 293 and 85 K there wereobserved an intense broad complex emission band, peaking near 600 nm, whichcorresponds to the 3P0 → 3F2, 3H6 and 3P0 → 3H4 transitions, and weak emission bands,peaking near 450, 690, and 800 nm, which corresponds to the 3P0 → 3H4, 3P0 → 3F3,3P0 → 3F4 transitions (Fig. 6). The luminescence spectra of the SrO–2B2O3 glasseswhich contained 0.05 and 0.25 at.% of Pr2O3 are similar and characterised by
Fig. 5. Optical absorption (curve a) and luminescence excitation (curve b) spectra of the Pr-doped (Pr2O3content: 0.25 at.%) glass with SrO–2B2O3 composition, registered at room temperature.

422 B. PADLYAK et al.
practically the same resolution at temperatures of 293 and 85 K. The linewidth andresolution of the Pr3+ absorption, luminescence excitation and emission bands inthe glass samples with the same Pr3+ content practically did not change withtemperature decreasing to 85 K, which is an evidence of the inhomogeneousbroadening of spectral lines, caused by disorder of the local structure of Pr3+ centres.
The results of investigation of luminescence kinetics for Pr3+ centres inthe SrO–2B2O3 glass containing 0.05 and 0.25 at.% of Pr2O3 are presented in Fig. 7.Luminescence kinetics of the Pr3+ centres for the whole emission band correspondingto the 1D2 →
3H4 transition is satisfactorily described by a two-exponential modelwith decay constants τ1 = 32.92 μs and τ2 = 16.2 μs for glass containing 0.05 at.% of
Fig. 6. The luminescence spectrum of the Pr3+ centres in the Pr-doped (Pr2O3 content: 0.25 at.%) glasswith SrO–2B2O3 composition, registered under excitation with λexc = 450 nm at temperatures of 293and 85 K.
Fig. 7. Luminescence decay curves of the Pr3+ centres for 1D2 →3H4 transition (λmax = 599 nm),
registered under excitation with λexc = 450 nm at T = 300 K in the SrB4O7 glasses containing 0.05 at.%(curve a) and 0.25 at.% (curve b) of Pr2O3. Solid lines – results of fitting.

Synthesis and optical spectroscopy of the Eu- and Pr-doped glasses ... 423
Pr2O3 and τ1 = 27.49 μs and τ2 = 11.3 μs for glass containing 0.25 at.% of Pr2O3.According to [34, 35] and the data analysis we can suppose that longer lifetimescorrespond to isolated Pr3+ centres and shorter lifetimes correspond to the Pr3+–Pr3+
pair centres in the SrB4O7 glass network.The results obtained do not correlate with the results published in [15], where
the incorporation of Pr impurity ions in divalent state into the SrB4O7 crystal lattice isdescribed. On the other hand, the results of optical spectroscopy of SrO–2B2O3glasses doped with Pr show good correlation with the optical spectroscopy ofthe Pr-doped glass and crystal with 4SrO–7B2O3 (or Sr4B14O25) composition thatshows the presence of Pr3+ luminescence centres exclusively in the glass network [36]and crystal lattice [37, 38].
Based on structural [25–27] and optical spectroscopy data for Eu3+ in the SrB4O7crystal [8–12] and SrO–2B2O3 glass (see Section 3.1) as well as for Pr3+ inthe Sr4B14O25 crystal [37, 38] and 4SrO–7B2O3 glass [36] we confirm incorporationof trivalent rare-earth ions (Eu3+, Pr3+, etc.) into the Sr-sites (Fig. 8) with coordinationnumber to oxygen N = 8 for real crystalline and N = 7 for real glassy compounds.
4. Conclusions
The Eu- and Pr-doped borate glasses of high optical quality and chemical purity withthe SrO–2B2O3 basic composition were synthesised in the air according to technologyconditions, developed by the authors. On the basis of optical absorption andluminescence spectra analysis it was shown that the Eu and Pr impurities areincorporated into the SrO–2B2O3 glass network in trivalent state, exclusively and form
Fig. 8. A fragment of SrB4O7 single crystal ideal structure. A unit cell is shown by lines. The B1 and B2atoms have coordination numbers to oxygen N = 3 and N = 4, respectively. The Sr atoms stabilising inthe framework have coordination number to oxygen N = 9.

424 B. PADLYAK et al.
the Eu3+ (4f 6, 7F0) and Pr3+ (4f 2, 3H4) luminescence centres. All transitions ofthe Eu3+ and Pr3+ centres, observed in the UV–VIS optical spectra are identified.Peculiarities of absorption and luminescence spectra as well as luminescence kineticsof the Eu3+ and Pr3+ centres in the glass with SrO–2B2O3 composition were analysedin comparison with their crystalline analogs and other borate glasses. In particular, itwas shown that the Eu3+ and Pr3+ optical absorption and luminescence spectra in theSrB4O7 and Sr4B14O25 crystalline and glassy compounds are very similar, which is anevidence of the same local structure for rare-earth luminescence centres in strontiumborate glasses with different compositions and their crystalline analogs. Luminescencekinetics of the SrB4O7:Eu compounds shows only isolated Eu3+ centres in the glassnetwork, whereas it is the Eu3+ isolated and Eu3+–Eu3+ pair centres that arecharacteristic of SrB4O7 crystal lattice. Luminescence kinetics of the SrB4O7:Pr glasswith 0.05 and 0.25 at.% Pr2O3 content shows the presence of the Pr3+ isolated andPr3+–Pr3+ pair centres in the glass network.
On the basis of reference data and analysis of the results it was confirmed thatthe Eu3+, Pr3+ and other trivalent rare-earth ions in the structure of SrB4O7 compoundsare localised in one type of structural positions according to RE3+ → Sr2+ heterovalentsubstitution with coordination number to oxygen N = 8 for SrB4O7 real crystal andN = 7 for real glass with the same composition. The multisite character of the Eu3+ andPr3+ luminescence in the strontium borate glasses can be explained by compositional(or substitutional) disorder and continual disturbance of short-range order that leadsto statistical distribution of local crystal field parameters for luminescence centres andis revealed in the inhomogeneous broadening of spectral lines.
Acknowledgements – This work was supported by the Ministry of Education and Science of Ukraine(scientific research project No. 0109U001063) and University of Zielona Góra (Poland).
References [1] OSELEDCHIK YU.S., PROSVIRNIN A.L., STARSHENKO V.V., OSADCHUK V.V., PISAREVSKY A.I.,
BELOKRYS S.P., KOROL A.S., SVITANKO N.V., SELEVICH A.F., KRIKUNOV S.A., Crystal growth andproperties of strontium tetraborate, Journal of Crystal Growth 135(1–2), 1994, pp. 373–376.
[2] FENG PAN, GUANGQIU SHEN, RUJI WANG, XIAOQING WANG, DEZHONG SHEN, Growth, characterizationand nonlinear optical properties of SrB4O7 crystals, Journal of Crystal Growth 241(1–2), 2002,pp. 108–114.
[3] MICHAIL P., HULLIGER J., SCHNIEPER M., BILL H., SrB4O7:Sm2+: crystal chemistry, Czochralski growthand optical hole burning, Journal of Materials Chemistry 10 (4), 2000, pp. 987–991.
[4] PADLYAK B.V., KUKLIŃSKI B., GRINBERG M., Synthesis, structure and spectroscopic properties ofCaO–Ga2O3–GeO2 glasses, Physics and Chemistry of Glasses 43C, 2002, pp. 392–397.
[5] PADLYAK B.V., RYBA-ROMANOWSKI W., LISIECKI R., Optical spectroscopy and local structure of Er3+
luminescence centres in CaO–Ga2O3–GeO2 glasses, Journal of Non-Crystalline Solids 354(35–39),2008, pp. 4249–4255.
[6] MACHIDA K., ADACHI G., SHIOKAWA J., Luminescence properties of Eu(II )-borates and Eu2+-activatedSr-borates, Journal of Luminescence 21 (1), 1979, pp. 101–109.
[7] MEIJERINK A., NUYTEN J., BLASSE G., Luminescence and energy migration in (Sr, Eu)B4O7, a systemwith a 4f 7–4f 65d crossover in the excited state, Journal of Luminescence 44 (1–2), 1989, pp. 19–31.

Synthesis and optical spectroscopy of the Eu- and Pr-doped glasses ... 425
[8] ZHIWU PEI, QIANG SU, SHANHUA LI, Investigation on the luminescence properties of Dy3+ and Eu3+
in alkaline-earth borates, Journal of Luminescence 50 (2), 1991, pp. 123–126.[9] ZHIWU PEI, QIANG SU, JIYU ZHANG, The valence change from RE3+ to RE2+ (RE ≡ Eu, Sm, Yb)
in SrB4O7:RE prepared in air and the spectral properties of RE2+, Journal of Alloys andCompounds 198(1–2), 1993, pp. 51–53.
[10] YONG GAO, CHUNSHAN SHI, YING WU, Luminescence properties of SrB4O7:Eu,Tb phosphors,Materials Research Bulletin 31(5), 1996, pp. 439–444.
[11] HYO JIN SEO, BYUNG KEE MOON, BEANG JU KIM, JEONG BAE KIM, TAIJU TSUBOI, Opticalproperties of europium ions in SrB2O4 crystal, Journal of Physics: Condensed Matter 11 (39), 1999,pp. 7635–7643.
[12] MACHIDA K., UEDA D., INOUE S., ADACHI G., Reversible valence change of the europium ion dopedin alkaline-earth tetraborates, Chemistry Letters 28 (8), 1999, pp.785–786.
[13] STEFANI R., MAIA A.D., TEOTONIO E.E.S., MONTEIRO M.A.F., FELINTO M.C.F.C., BRITO H.F.,Photoluminescent behavior of SrB4O7:RE2+ (RE = Sm and Eu) prepared by Pechini, combustionand ceramic methods, Journal of Solid State Chemistry 179(4), 2006, pp. 1086–1092.
[14] ALEKSANDROVSKY A.S., MALAKHOVSKII A.V., ZABLUDA V.N., ZAITSEV A.I., ZAMKOV A.V., Opticaland magneto-optical spectra of europium-doped strontium tetraborate single crystals, Journal ofPhysics and Chemistry of Solids 67(8), 2006 pp. 1908–1912.
[15] VAN DER KOLK E., DARENBOS P., VAN EIJK C.W.E., Vacuum ultraviolet excitation of 1S0 and3P0 emission of Pr2+ in Sr0.7La0.3Al1.7Mg0.3O19 and SrB4O7, Journal of Physics: CondensedMatter 13 (23), 2001, pp. 5471–5486.
[16] SCHIPPER W.J., MEIJERINK A., BLASSE G., The luminescence of Tm2+ in strontium tetraborate, Journalof Luminescence 62(2), 1994, pp. 55–59.
[17] QINGHUA ZENG, ZHIWU PEI, SHUBING WANG, QIANG SU, SHAOZHE LU, The luminescent properties ofSm2+ in strontium tetraborates (SrB4O7:Sm2+), Journal of Physics and Chemistry of Solids 60 (4),1999, pp. 515–520.
[18] JING GOU, YUHUA WANG, FENG LI, The luminescence properties of Dy3+-activated SrB4O7 underVUV excitation, Journal of Luminescence 128 (5–6), 2008, pp. 728–731.
[19] OSELEDCHIK YU.S., PROSVIRNIN A.L., PISAREVSKIY A.I., STARSHENKO V.V., OSADCHUK V.V.,BELOKRYS S.P., SVITANKO N.V., KOROL A.S., KRIKUNOV S.A., SELEVICH A.F., New nonlinear opticalcrystals: strontium and lead tetraborates, Optical Materials 4 (6), 1995, pp. 669–674.
[20] PETROV V., NOACK F., SHEN D., PAN’ F., SHEN G., WANG X., KOMATSU R., ALEX V., Applicationof the nonlinear crystal SrB4O7 for ultrafast diagnostics converting to wavelengths as short as125 nm, Optics Letters 29(4), 2004, pp. 373–375.
[21] SANTIAGO M., LAVAT A., CASELLI E., LESTER M., PERISINOTTI L.J., DE FIGUEREIDO A. K., SPANO F.,ORTEGA F., Thermoluminescence of strontium tetraborate, Physica Status Solidi (a) 167(1), 1998,pp. 233–236.
[22] SANTIAGO M., GRASSELI C., CASELLI E., LESTER M., LAVAT A., SPANO F., Thermoluminescence ofSrB4O7:Dy, Physica Status Solidi (a) 185 (2), 2001, pp. 285–289.
[23] DUBOVIK M.F., KORSHIKOVA T.I., OSELEDCHIK YU.S., PARKHOMENKO S.V., PROSVIRNIN A.L.,SVITANKO N.V., TOLMACHEV A.V., YAVETSKY R.P., Thermostimulated luminescence of SrB4O7 singlecrystals and glasses, Functional Materials 12 (4), 2005, pp. 685–688.
[24] LAVAT A., GRASELLI C., SANTIAGO M., POMARICO J., CASELLI E., Influence of the preparation routeon the optical properties of dosimetric phosphors based on rare-earth doped polycrystallinestrontium borates, Crystal Research and Technology 39(10), 2004, pp. 840–848.
[25] KROGH-MOE J., On the structure of boron oxide and alkali borate glasses, Physics and Chemistryof Glasses 1 (1), 1960, pp. 26–31.
[26] PERLOFF A., BLOCK S., The crystal structure of the strontium and lead tetraborates, SrO.2B2O3 andPbO.2B2O3, Acta Crystallographica 20(2), 1966, pp. 274–279.
[27] KROGH-MOE J., Refinement of the crystal structure of lithium diborate, Li2O.2B2O3, ActaCrystallographica Section B 24(2), 1968, pp. 179–181.
426 B. PADLYAK et al.
[28] ZHIWU PEI, QINGHUA ZENG, QIANG SU, The application and a substitution defect model forEu3+ → Eu2+ reduction in non-reducing atmospheres in borates containing BO4 anion groups,Journal of Physics and Chemistry of Solids 61(1), 2000, pp. 9–12.
[29] YAVETSKIY R.P., DOLZHENKOVA E.F., TOLMACHEV A.V., PARKHOMENKO S.V., BAUMER V.N.,PROSVIRNIN A.L., Radiation defects in SrB4O7:Eu2+ crystals, Journal of Alloys andCompounds 441(1–2), 2007, pp. 202–205.
[30] QINGHUA ZENG, ZHIWU PEI, SHUBING WANG, QIANG SU, The reduction of Eu3+ in SrB6O10 preparedin air and the luminescence of SrB6O10:Eu, Journal of Alloys and Compounds 275–277, 1998,pp. 238–241.
[31] PADLYAK B., GRINBERG M., KUKLIŃSKI B., OSELEDCHIK YU., SMIRNOV A., KUDRYAVTCEV D.,PROSVIRNIN A., Synthesis and optical spectra of the Eu- and Pr-doped glasses with SrO–2B2O3composition, [In] The Second International Workshop on Advanced Spectroscopy and OpticalMaterials, 13–17 July 2008, Gdańsk (Poland): Institute of Experimental Physics, University ofGdańsk, 2008, p. 8-O-1.
[32] KUBICKI A.A., BOJARSKI P., GRINBERG M., SADOWNIK M., KUKLIŃSKI B., Time-resolved streak camerasystem with solid state laser and optical parametric generator in different spectroscopicapplications, Optics Communications 263 (2), 2006, pp. 275–280.
[33] SVIRIDOV D.T., SVIRIDOVA R.K., SMIRNOV YU.F., Optical spectra of transition metal ions in crystals(Opticheskie spektry ionov perekhodnych metallov v kristallakh), Moskwa, Nauka, 1976, p. 267(in Russian).
[34] RONDA C.R., AMREIN T., Evidence for exchange-induced luminescence in Zn2SiO4:Mn, Journal ofLuminescence 69(5–6), 1996, pp. 245–248.
[35] VINK A.P., DE BRUIN M.A., ROKE S., PEIJZEL P.S., MEIJERINK A., Luminescence of exchange coupledpairs of transition metal ions, Journal of the Electrochemical Society 148(7), 2001, pp. E313–E320.
[36] KUDRJAVTCEV D.P., OSELEDCHIK YU.S., PROSVIRNIN A.L., SVITANKO N.V., The spectroscopy of4SrO ·7B2O3:RE3+ (RE = Eu3+, Pr3+, Nd3+) glasses, Ukrainian Journal of Physical Optics 4 (2),2003, pp. 83–89.
[37] KUDRJAVTCEV D.P., OSELEDCHIK YU.S., PROSVIRNIN A.L., SVITANKO N.V., PETROV V.V.,The luminescence of the praseodymium-doped strontium borate Sr4B14O25:Pr3+, Ukrainian Journalof Physical Optics 3 (2), 2002, pp. 155–160.
[38] KUDRJAVTCEV D.P., OSELEDCHIK YU.S., PROSVIRNIN A.L., SVITANKO N.V., The spectral-generationproperties of Sr4B14O25 :Pr3+ crystal, Ukrainian Journal of Physics 48(1), 2003, pp. 11–16.
Received November 12, 2009in revised form December 30, 2009

Optica Applicata, Vol. XL, No. 2, 2010
Optical spectra and luminescence kinetics of the Sm3+ and Yb3+ centres in the lithium tetraborate glasses
BOHDAN PADLYAK1, 2*, WITOLD RYBA-ROMANOWSKI3, RADOSŁAW LISIECKI3, VOLODYMYR ADAMIV1, YAROSLAV BURAK1, IHOR TESLYUK1, AGNIESZKA BANASZAK-PIECHOWSKA4
1Institute of Physical Optics, 23 Dragomanov St., 79-005 Lviv, Ukraine
2University of Zielona Góra, Institute of Physics, Division of Spectroscopy of Functional Materials, 4a Szafrana St., 65-516 Zielona Góra, Poland
3Institute of Low Temperatures and Structure Research, Polish Academy of Sciences, 2 Okólna St., 50-422 Wrocław, Poland
4Kazimierz Wielki University in Bydgoszcz, Institute of Physics, 11 Weyssenhoff Sq., 85-072 Bydgoszcz, Poland
*Corresponding author: [email protected]; [email protected]
Optical absorption, luminescence excitation, and emission spectra as well as luminescencekinetics of the Sm- and Yb-doped glasses with lithium tetraborate (Li2B4O7) composition wereinvestigated and analysed. The Sm- and Yb-doped lithium tetraborate glasses of high opticalquality were obtained in air from corresponding polycrystalline compounds according to standardglass synthesis technology. The Sm and Yb impurities were added to the Li2B4O7 compound inthe form of Sm2O3 and Yb2O3 oxides in amount of 0.4 mol%. Using optical and electronparamagnetic resonance spectroscopy it was shown that the Sm and Yb impurities are incorporatedinto the lithium tetraborate glass network as Sm3+ (4f 5, 6H5/2) and Yb3+ (4f 13, 2F7/2) ions,exclusively. All of the observed transitions in the absorption and luminescence spectra ofSm3+ and Yb3+ centres were identified. The luminescence kinetics of the Sm3+ and Yb3+ centresin the Li2B4O7 glass are characterised by a single exponential decay. Decay constants for the mainemission transitions of the Sm3+ and Yb3+ centres in the lithium tetraborate glass were obtainedat T = 300 K. Incorporation peculiarities and optical spectra of Sm3+ and Yb3+ ions in the lithiumtetraborate glass have been discussed in comparison with other borate glasses and crystals.
Keywords: borate glasses, Sm3+ centre, Yb3+ centre, optical absorption, luminescence, decay kinetics,local structure.
1. IntroductionThe borate, in particular tetraborate crystals, are characterised by extremely highradiation stability [1, 2] and high transparency in the wide spectral range from vacuum

428 B. PADLYAK et al.
ultraviolet (VUV) to far infrared (IR). The rare-earth ions, such as Eu3+, Er3+, Tm3+,Sm3+, Yb3+, etc., show high luminescence efficiency in a variety of host materials withemission in a wide spectral range, in particular the Sm3+ and Yb3+ ions give a red andIR characteristic emission bands [3, 4], respectively. Therefore, the rare-earth activatorions are widely used in different luminescent materials [3, 4], including borate crystalsand glasses [5, 6].
In connection with their attractive spectroscopic and luminescence properties,the undoped and doped borate crystals and glasses are promising materials for differenttechnical applications: scintillators and tissue-equivalent materials for thermolumi-nescence (TL) dosimeters [7, 8], γ and neutron detectors [9, 10], lasers [11] and secondharmonic generation media [12]. Obtaining tetraborate single crystals is technolog-ically difficult, time-consuming and, consequently, very expensive. Besides, very lowcrystal growth rate and high viscosity of the melt lead to problems with doping,particularly with the rare-earth doping of tetraborate crystals. Therefore, fromthe technological point of view the glassy (or vitreous) tetraborate compounds are mostperspective in comparison with their crystalline analogies. On the other hand, the studyof electron and local structure of the luminescence centres in complex oxide glassesis an interesting problem of quantum electronics and solid state physics. Thus,synthesis and spectroscopic investigations of rare-earth doped tetraborate crystals andglasses are fundamental as far as real-life applications are concerned.
Methods of optical and electron paramagnetic resonance (EPR) spectroscopy allowinvestigating the electron and local structure of the impurity luminescence andparamagnetic centres in crystals and glasses. For interpretation of optical and EPRspectra in complex glasses need corresponding spectroscopic and structural data fortheir crystalline analogies [13, 14]. Practically all borate compounds, includingtetraborates, can be obtained in both crystalline and glassy states. Therefore, boratesare good candidates for studying the electron and local structure of luminescence andparamagnetic centres in them.
In [10, 15–17], optical and spectroscopic properties of doped lithium tetraboratecrystals and glasses, obtained in air, were investigated and perspectives of theirapplications for scintillators in neutron detectors, TL dosimeters and laser media wereconsidered. In [10, 15, 16] it was shown by means of optical spectroscopy thatthe rare-earth impurities, particularly Sm and Yb, are incorporated into the Li2B4O7glass and crystal structure, in general, as trivalent ions, which are characterised by highefficient luminescence at room temperature. In [16], by EPR spectroscopy it wasshown that the Yb impurity is incorporated into the Li2B4O7 glass and crystal asYb3+ ions, located in the Li+ and, probably B3+ or interstitial sites of the structure.Optical spectroscopy shows the presence of Yb2+ centres in the γ -irradiated Li2B4O7crystal [16]. According to [17], no Yb3+ bands were observed in optical absorptionspectra of the “as-grown” in air Li2B4O7:Yb crystals and absorption bands, peakednear 198, 234, and 280 nm in these crystals were assigned to Yb2+ centres. In lithium

Optical spectra and luminescence kinetics of the Sm3+ and Yb 3+ centres ... 429
borate glasses, there were also observed the Yb2+ centres with characteristic broadabsorption band near UV region and emission in the 520–540 nm spectral range [10].
As we can see from the above referenced data, optical and luminescenceproperties of the Sm- and Yb-doped glasses with Li2B4O7 composition have not beensystematically investigated up to now and electron and local structure of Sm and Ybluminescence centres in them have not been finally established. The present paperreports the synthesis and optical spectroscopy of the Li2B4O7 glasses, doped bySm and Yb. The electron and local structure of Sm and Yb luminescence centres inthe lithium tetraborate glass and crystal have been discussed based on referencedstructural and spectroscopic data and the results obtained.
2. Glass synthesis, characterisation, and experimental equipment
The Sm- and Yb-doped glasses with lithium tetraborate (Li2B4O7) compositions wereobtained in air from corresponding polycrystalline compounds according to standardglass technology. For solid state synthesis of the Li2B4O7 polycrystalline compoundsthere were used the Li2CO3 carbonate and boric acid (H3BO3) of high chemical purity(99.999%). The Sm and Yb impurities were added into the Li2B4O7 composition inthe form of Sm2O3 and Yb2O3 oxide compounds in the amount of 0.4 mol%.The Sm- and Yb-doped lithium tetraborate glasses were obtained by fast cooling ofthe corresponding melt, heated more than 100 K above the melting temperature(Tmelt = 1190 K) for exceeding the glass transition point.
Our undoped lithium tetraborate glasses are characterised by high transparency inthe 330–2500 nm spectral range (Fig. 1a). According to [10], undoped lithium borateglasses are transparent in the 281–2760 nm region, whereas nominally-pure Li2B4O7single crystals reveal high transparency in a very wide (167–3200 nm) spectralrange [17]. The Sm- and Yb-doped glass samples obtained are almost uncoloured andcharacterised by high optical quality. In Sm- and Yb-doped glasses with Li2B4O7composition, characteristic optical spectra were observed, which are presented inFigs. 1–7 and discussed in Section 3.
The non-controlled and rare-earth paramagnetic impurities in the glasses obtainedwere registered by EPR technique with the use of modernised commercial X-bandspectrometers of the SE/X-2013 and SE/X-2544 types (RADIOPAN, Poznań, Poland),operating in the high-frequency (100 kHz) modulation mode of magnetic field at roomand liquid helium temperatures. The microwave frequency was measured with the helpof the Hewlett–Packard microwave frequency counter of the 5350 B type and DPPHg-marker (g = 2.0036±0.0001). Practically, in all undoped and rare-earth dopedglasses with Li2B4O7 composition, two characteristic EPR signals were observed,with geff = 4.29±0.01 and geff = 2.00±0.01. The integral intensity of the signal withg ≅ 4.29 is more than 100 times greater than that of g ≅ 2.00. According to [18, 19]both observed EPR signals were assigned to the Fe3+ (3d5, 6S5/2) non-controlled

430 B. PADLYAK et al.
impurity ions in octahedral and/or tetrahedral sites of the glass network. WeakEPR signals of the non-controlled Mn2+ (3d5, 6S5/2) ions, characteristic of glassystate [18, 19] were also observed in Sm- and Yb-doped samples.
Optical absorption spectra were recorded with a Varian spectrophotometer(model 5E UV-VIS-NIR). Luminescence and excitation spectra were acquired witha Dongwoo (model DM711) scanning system consisting of an excitation monochro-mator with 150 mm focal length and emission monochromator having a 750 mm focallength equipped with a photomultiplier and an InGaAs detector. Spectral response ofthe whole emission system was calibrated in the 400–800 nm spectral region againstreference source. The Yb3+ emission spectra were measured using a 1m GDM 1000double grating monochromator with a spectral bandwidth of 2 cm–1 and detected bya photomultiplier with S-20 or S-1 spectral response. The resulting signal was analysedby a Stanford (model SRS 250) boxcar integrator and stored in a personal computer.Decay curves were recorded with a Tektronix (model TDS 3052) digital oscilloscope.Excitation was provided by a Continuum Surelite I Optical Parametric Oscillator
b
a
Fig. 1. Optical absorption spectra of the undoped (a) and Sm-doped (Sm2O3 content – 0.4 mol%) (b)glasses with Li2B4O7 composition, recorded at T = 300 K.

Optical spectra and luminescence kinetics of the Sm3+ and Yb 3+ centres ... 431
(OPO) pumped by a third harmonic of an Nd:YAG laser and the emitted light wasfiltered using a GDM grating monochromator (focal length – 1000 mm). All opticalmeasurements were performed at room temperature.
3. Results and discussion3.1. The Sm3+ centres in the Li2B4O7 glass The Sm impurity in oxide crystals and glasses reveals Sm3+ (4f 5, 6H5/2) and Sm2+
(4f 6, 7F0) ions with characteristic optical absorption, luminescence and EPR spectra.In the obtained Li2B4O7:Sm glasses only Sm3+ optical and EPR spectra were observed.This result correlates with the previous referenced data for Li2B4O7:Sm glass andcorresponding crystal [10, 15].
Optical absorption spectra of the Li2B4O7:Sm glasses in the visible spectral range,registered at room temperature consist of several very weak absorption bands (Fig. 1b).In the luminescence excitation spectrum of the Li2B4O7:Sm glass (Fig. 2) at roomtemperature there were also observed several weakly-resolved bands that correspondto Sm3+ optical absorption transitions (Fig. 1b). In accordance with energy levelsdiagram and referenced data [20, 21], the observed weak absorption and luminescenceexcitation bands centred about 345, 362, 377, 405, 421, 463, 476, 490 nm wereassigned to appropriate electronic f– f transitions within Sm3+ ion from 6H5/2ground state to the following terms of excited states: 3H7/2, 4F9/2, 4D3/2, 4G7/2, 6P5/2,4F5/2, 4I11/2, and 4I9/2, respectively (Fig. 1b and Fig. 2). One can notice that bandscorresponding to the 6H5/2 → 3H7/2 and 6H5/2 → 4F9/2 transitions of the Sm3+ centreswere not well revealed in the optical absorption (Fig. 1b), but clearly observed inthe luminescence excitation spectrum (Fig. 2). The intense absorption below 350 nm(Fig. 1b) may result from the O2– → Sm3+ charge transfer band [22] and fundamental
Fig. 2. The luminescence excitation spectrum of Sm3+ centres in the Li2B4O7:Sm glass, monitored atλmon = 599 nm and T = 300 K.
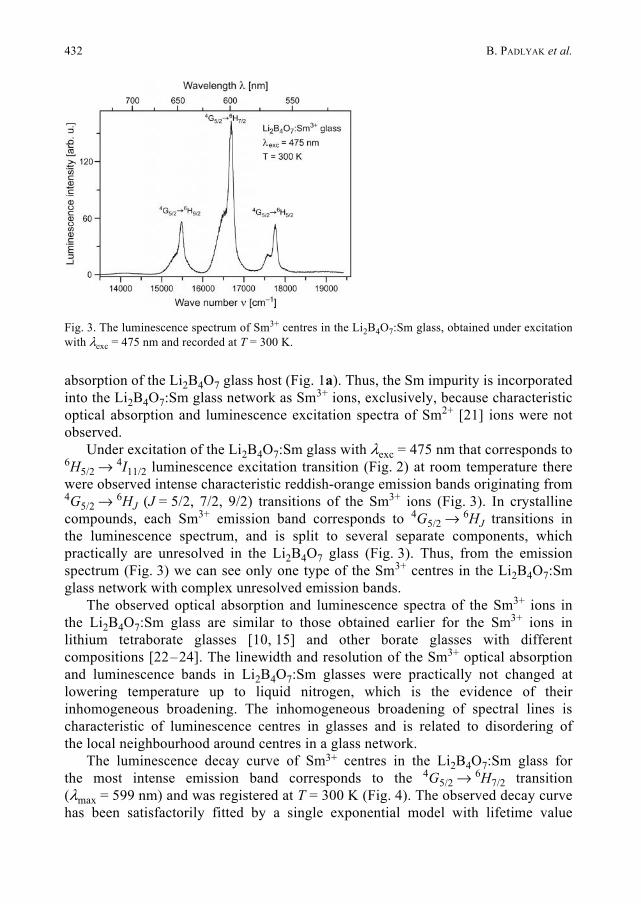
432 B. PADLYAK et al.
absorption of the Li2B4O7 glass host (Fig. 1a). Thus, the Sm impurity is incorporatedinto the Li2B4O7:Sm glass network as Sm3+ ions, exclusively, because characteristicoptical absorption and luminescence excitation spectra of Sm2+ [21] ions were notobserved.
Under excitation of the Li2B4O7:Sm glass with λexc = 475 nm that corresponds to6H5/2 →
4I11/2 luminescence excitation transition (Fig. 2) at room temperature therewere observed intense characteristic reddish-orange emission bands originating from4G5/2 → 6HJ (J = 5/2, 7/2, 9/2) transitions of the Sm3+ ions (Fig. 3). In crystallinecompounds, each Sm3+ emission band corresponds to 4G5/2 →
6HJ transitions inthe luminescence spectrum, and is split to several separate components, whichpractically are unresolved in the Li2B4O7 glass (Fig. 3). Thus, from the emissionspectrum (Fig. 3) we can see only one type of the Sm3+ centres in the Li2B4O7:Smglass network with complex unresolved emission bands.
The observed optical absorption and luminescence spectra of the Sm3+ ions inthe Li2B4O7:Sm glass are similar to those obtained earlier for the Sm3+ ions inlithium tetraborate glasses [10, 15] and other borate glasses with differentcompositions [22–24]. The linewidth and resolution of the Sm3+ optical absorptionand luminescence bands in Li2B4O7:Sm glasses were practically not changed atlowering temperature up to liquid nitrogen, which is the evidence of theirinhomogeneous broadening. The inhomogeneous broadening of spectral lines ischaracteristic of luminescence centres in glasses and is related to disordering ofthe local neighbourhood around centres in a glass network.
The luminescence decay curve of Sm3+ centres in the Li2B4O7:Sm glass forthe most intense emission band corresponds to the 4G5/2 → 6H7/2 transition(λmax = 599 nm) and was registered at T = 300 K (Fig. 4). The observed decay curvehas been satisfactorily fitted by a single exponential model with lifetime value
Fig. 3. The luminescence spectrum of Sm3+ centres in the Li2B4O7:Sm glass, obtained under excitationwith λexc = 475 nm and recorded at T = 300 K.

Optical spectra and luminescence kinetics of the Sm3+ and Yb 3+ centres ... 433
τ = 2.6 ms in the 4G5/2 emitting level (Fig. 4) that corresponds to one type of Sm3+
centres in the Li2B4O7:Sm glass network. One can notice that the obtained lifetimevalue is characteristic of 4G5/2 level of the Sm3+ luminescence centres and close toSm3+ lifetimes in other complex oxide glasses [25], particularly in borate glasses withdifferent compositions [22–24]. The local structure of Sm3+ luminescence centres inthe Li2B4O7:Sm crystal and glass is considered and discussed in Section 3.3.
3.2. The Yb3+ centres in the Li2B4O7 glass The Yb impurity can be incorporated in oxide crystals and glasses as Yb3+ (4f 13, 2F7/2)and Yb2+ (4f 14, 1S1) ions with characteristic optical absorption, luminescence and EPRspectra. In the investigated glasses with Li2B4O7:Yb composition only Yb3+ opticaland EPR spectra were observed. This result shows good agreement with previousreferenced data for Yb-doped lithium tetraborate (Li2B4O7:Yb) glass [15, 16], but doesnot correlate with results obtained for Yb-doped lithium borate glasses [10] andLi2B4O7:Yb crystals [17], which show the presence of Yb2+ centres, exclusively.
Room temperature optical absorption and luminescence spectra of the Li2B4O7:Ybglass show spectra typical of Yb3+ (Figs. 5 and 6). The absorption spectrumconsists of a strong peak centred at 970 nm and an unstructured broadband restrictedfrom 875 to 1100 nm associated with the 2F7/2 → 2F5/2 transition within the Yb3+ ionselectronic f– f levels (Fig. 5). The 2F5/2 excited level is separated from the 2F7/2ground level by about 10000 cm–1. Therefore, under resonant photoexcitation ofthe Li2B4O7:Yb glass with λexc = 970 nm (10700 cm–1) that corresponds to2F7/2 → 2F5/2 absorption transition (Fig. 5) there was observed a characteristicemission spectrum of Yb3+ centres, which consists of unresolved zero-line peak at970 nm and broadband in the 950–1020 nm spectral range (2F5/2 → 2F7/2 transition)(Fig. 6). The observed absorption and emission spectra show one type of Yb3+ centresin the Li2B4O7:Yb glass network.
The observed optical absorption and emission spectra of Yb3+ ions inthe Li2B4O7:Yb glass (Figs. 5 and 6) are very similar to corresponding Yb3+ optical
Fig. 4. The luminescence decay curve of Sm3+ centres for 4G5/2 →6H7/2 transition (λmax = 599 nm),
registered at T = 300 K. Solid line – result of a single exponential fit.
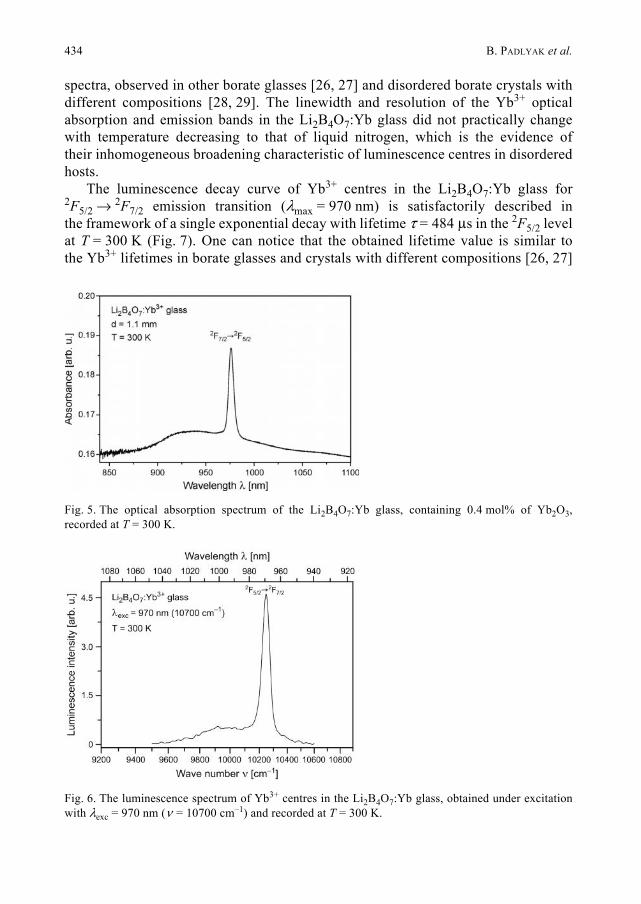
434 B. PADLYAK et al.
spectra, observed in other borate glasses [26, 27] and disordered borate crystals withdifferent compositions [28, 29]. The linewidth and resolution of the Yb3+ opticalabsorption and emission bands in the Li2B4O7:Yb glass did not practically changewith temperature decreasing to that of liquid nitrogen, which is the evidence oftheir inhomogeneous broadening characteristic of luminescence centres in disorderedhosts.
The luminescence decay curve of Yb3+ centres in the Li2B4O7:Yb glass for2F5/2 → 2F7/2 emission transition (λmax = 970 nm) is satisfactorily described inthe framework of a single exponential decay with lifetime τ = 484 μs in the 2F5/2 levelat T = 300 K (Fig. 7). One can notice that the obtained lifetime value is similar tothe Yb3+ lifetimes in borate glasses and crystals with different compositions [26, 27]
Fig. 5. The optical absorption spectrum of the Li2B4O7:Yb glass, containing 0.4 mol% of Yb2O3,recorded at T = 300 K.
Fig. 6. The luminescence spectrum of Yb3+ centres in the Li2B4O7:Yb glass, obtained under excitationwith λexc = 970 nm (ν = 10700 cm–1) and recorded at T = 300 K.

Optical spectra and luminescence kinetics of the Sm3+ and Yb 3+ centres ... 435
and other oxide glasses [30, 31]. Particularly, in [30] it was shown that the Yb3+ decaytime strongly depends on Yb concentration and luminescence kinetics can be describedby a double exponential model with slow (190–1250 μs) and fast (6–300 μs) decaytimes, which was assigned to the Yb3+ isolated and Yb3+–Yb3+ pair centres,respectively. Thus, the luminescence kinetics of Li2B4O7:Yb3+ glasses shows one typeof isolated Yb3+ centres in the glass network. The local structure of Yb3+ luminescencecentres in the Li2B4O7:Yb crystal and glass is considered in Section 3.3.
3.3. The local structure of Sm3+ and Yb3+ centres in the Li2B4O7 crystal and glass Let us consider the incorporation peculiarities and local structure of the Sm3+ and Yb3+
luminescence centres in the Li2B4O7 crystal and corresponding glass with the same(Li2O–2B2O3) composition. The Li2B4O7 crystal belongs to a 4mm point group andI41cd (C4v) space group of tetragonal symmetry (a = b = 9.479 Å, c = 10.286 Å).The B3+ ions occupy threefold- and fourfold-coordinated sites with average B3+–O2–
bonds equal to 1.373 and 1.477 Å, respectively [32]. According to [32], the Li+ ionsare located in the fourfold-coordinated distorted tetrahedra with Li+–O2– distances inthe range 1.97–2.14 Å. The numbers of nearest oxygen anions (coordination numberto oxygen N ) with the Li+–O2– distances equal to 2.63, 2.85, and 2.88 Å are 5, 6, and7, respectively [32]. The statistical distribution of Li+–O2– distances for differentcoordination numbers (N = 4–7) leads to so-called “positional disorder” inthe Li2B4O7 crystal lattice. Based on the crystal structure data we can suppose thattrivalent rare-earth impurity ions, RE3+, in the Li2B4O7 crystal occupy Li+ sites ofthe lattice due to extremely small ionic radius of the B3+ ions (0.23 Å). So, the Sm3+
and Yb3+ ions are expected to incorporate in Li+ sites of the Li2B4O7 crystal lattice,because the Li+, Sm3+, and Yb3+ ionic radii are close and approximately equal to 0.76,0.958, and 0.868 Å, respectively. Owing to positional disorder, the RE3+ luminescencecentres in Li+ sites of the Li2B4O7 lattice are characterised by slightly differentspectroscopic parameters and the weak inhomogeneous broadening of spectral lines.
Fig. 7. The luminescence decay curve of Yb3+ centres for 2F5/2 →2F7/2 transition (λmax = 970 nm),
registered at T = 300 K. Solid line – result of a single exponential fit.

436 B. PADLYAK et al.
The local environment of Sm3+ and Yb3+ centres in the Li2B4O7 glass network alsoconsists of O2– anions with statistically-distributed structural parameters (RE3+–O2–
interatomic distances and coordination numbers) in the first coordination shell(positional disorder) that is revealed in the inhomogeneous broadening of the opticalabsorption and luminescence bands. Additionally, a glass network is characterised bycontinual disturbance of the short-range order that destroys middle- and long-rangeorder. This glassy-like disorder in the second (cationic) coordination sphere aroundthe luminescence centres leads to the additional inhomogeneous broadening ofspectral lines. As a result, the Sm3+ and Yb3+ optical spectra in glasses with Li2B4O7composition are characterised by strong inhomogeneous broadening. Because the localstructures of oxide crystals and corresponding glasses with the same composition arevery similar [13, 14, 33] we can suppose that the Sm3+ and Yb3+ centres are alsolocated in Li+ sites of the Li2O–2B2O3 glass network. This suggestion needsconfirmation by the direct EXAFS (extended X-ray absorption fine structure)investigation of Sm and Yb impurity L3-edge in the crystal and glass with Li2B4O7composition that will be a subject of future work.
4. Conclusions
The Sm- and Yb-doped lithium tetraborate glasses (Li2B4O7:Sm and Li2B4O7:Yb) ofhigh optical quality and chemical purity were obtained by standard glass synthesis inair according to technology developed by the authors. On the basis of opticalspectroscopy data analysis we have shown the following:
1. The samarium and ytterbium impurities are incorporated into the Li2B4O7 glassnetwork as Sm3+ (4f 3, 4I9/2) and Yb3+ (4f 13, 2F7/2) ions, exclusively, and formthe Sm3+ and Yb3+ luminescence centres with characteristic optical absorption andluminescence spectra.
2. All the observed UV–VIS–IR transitions of the Sm3+ and Yb3+ centres in opticalabsorption and luminescence spectra have been identified. Optical spectra of the Sm3+
and Yb3+ centres in the Li2B4O7 glass network are quite similar to the Sm3+ and Yb3+
optical spectra, observed in other complex borate glasses and disordered crystals andare characterised by inhomogeneous broadening of spectral lines.
3. The luminescence kinetics of the Sm3+ centres for the 4G5/2 → 6H7/2 transition(λmax = 599 nm) in the Li2B4O7:Sm glass containing 0.4 mol% of Sm is satisfactorilydescribed by a single exponential decay with lifetime τ = 2.6 ms at T = 300 K that istypical of the 4G5/2 level of Sm3+ centres in other borate glasses.
4. The luminescence kinetics of the Yb3+ centres for 2F5/2 → 2F7/2 transition(λmax = 970 nm) in the Li2B4O7:Yb glass containing 0.4 mol% of Yb is satisfactorilydescribed by a single exponential decay with τ = 484 μs at T = 300 K that correlateswith corresponding data for Yb3+ centres in other borate glasses.
5. It was supposed that the Sm3+ and Yb3+ luminescence centres are localisedin the Li+ sites, coordinated by O2– positionally-disordered anions in the Li2B4O7glass network that is also characteristic of crystals with the same composition and

Optical spectra and luminescence kinetics of the Sm3+ and Yb 3+ centres ... 437
other borate glasses and disordered crystals. The multisite character of the Sm3+ andYb3+ luminescence centres in the glass and crystal with Li2B4O7 is related tothe presence of Li+ sites in their structure with different coordination numbers(N = 4–7) and statistically-distributed RE3+–O2– distances (positional disorder),which leads to distribution of Sm3+ and Yb3+ spectroscopic parameters and is revealedin the inhomogeneous broadening of their spectral lines.
Acknowledgements – This work was supported by the Ministry of Education and Science of Ukraine(scientific research project No. 0109U001063) and University of Zielona Góra (Poland).
References[1] BURAK YA.V., PADLYAK B.V., SHEVEL V.M., Radiation-induced centers in the Li2B4O7 single
crystals, Nuclear Instruments and Methods in Physics Research Section B 191(1–4), 2002,pp. 633–637.
[2] BURAK YA.V., PADLYAK B.V., SHEVEL V.M., Neutron-induced defects in the lithium tetraboratesingle crystals, Radiation Effects and Defects in Solids 157 (6–12), 2002, pp. 1101–1109.
[3] YEN W., SHIONOYA S. [Eds.], Phosphor Handbook, CRC Press, New York, 1999.[4] BLASSE G., GRABMAIER B.C., Luminescent Materials, Springer Verlag, Berlin, 1994.[5] DIAZ A., KESZLER D.A., Red, green, and blue Eu2+ luminescence in solid-state borates: A structure-
-property relationship, Materials Research Bulletin 31 (2), 1996, pp. 147–151.[6] DUBOVIK M.F., TOLMACHEV A.V., GRINYOV B.V., GRIN’ L.A., DOLZHENKOVA E.F.,
DOBROTVORSKAYA M.V., Luminescence and radiation-induced defects in Li2B4O7:Eu single crystals,Semiconductor Physics, Quantum Electronics and Optoelectronics 3 (3), 2000, pp. 420–422.
[7] SANTIAGO M., LESTER M., CASELLI E., LAVAT A., GES A., SPANO F., KESSLER C., Thermoluminescenceof sodium borate compounds containing copper, Journal of Materials Science Letters 17(15), 1998,pp. 1293–1296.
[8] CAN N., KARALI T., TOWNSEND P.D., YILDIZ F., TL and EPR studies of Cu, Ag and P doped Li2B4O7phosphor, Journal of Physics D: Applied Physics 39 (10), 2006, pp. 2038–2043.
[9] ISHII M., KUWANO Y., ASABA S., ASAI T., KAWAMURA M., SENGUTTUVAN N., HAYASHI T., KOBOYASHI M.,NIKL M., HOSOYA S., SAKAI K., ADACHI T., OKU T., SHIMIZU H.M., Luminescence of doped lithiumtetraborate single crystals and glass, Radiation Measurements 38 (4–6), 2004, pp. 571–574.
[10] ZADNEPROWSKI B.I., EREMIN N.V., PASKHALOV A.A., New inorganic scintillators on the basis of LBOglass for neutron registration, Functional Materials 12 (2), 2005, pp. 261–268.
[11] SASAKI T., MORI Y., YOSHIMURA M., YAP Y.K., KAMIMURA T., Recent development of nonlinearoptical borate crystals: key materials for generation of visible and UV light, Materials Science andEngineering R: Reports 30(1–2), 2000, pp. 1–54.
[12] GHOTBI M., EBRAHIM-ZADEH M., Optical second harmonic generation properties of BiB3O6, OpticsExpress 12(24), 2004, pp. 6002–6019.
[13] PADLYAK B.V., KUKLIŃSKI B., GRINBERG M., Synthesis, structure and spectroscopic properties ofCaO–Ga2O3–GeO2 glasses, Physics and Chemistry of Glasses 43C, 2002, pp. 392–397.
[14] PADLYAK B.V., RYBA-ROMANOWSKI W., LISIECKI R., Optical spectroscopy and local structure of Er3+
luminescence centres in CaO–Ga2O3–GeO2 glasses, Journal of Non-Crystalline Solids 354(35–39),2008, pp. 4249–4255.
[15] RZYSKI B.M., MORATO S.P., Luminescence studies of rare-earth doped lithium tetraborate, NuclearInstruments and Methods 175(1), 1980, pp. 62–64.
[16] KACZMAREK S.M., PODGÓRSKA D., BERKOWSKI M., Multivalent state of Mn and Yb ions in Li2B4O7single crystals and glasses, Abstracts of Polish-French-Israeli Symposium “Spectroscopy of ModernMaterials in Physics and Biology”, September 27–30, 2004, Będlewo (near Poznań), Poland, p. 64.

438 B. PADLYAK et al.
[17] PODGÓRSKA D., KACZMAREK S.M., DROZDOWSKI W., BERKOWSKI M., WORSZTYNOWICZ A., Growthand optical properties of Li2B4O7 single crystals pure and doped with Yb, Co and Mn ions fornonlinear applications, Acta Physica Polonica A 107(3), 2005, pp. 507–518.
[18] GRISCOM D.L., Electron spin resonance in glasses, Journal of Non-Crystalline Solids 40 (1–3), 1980,pp. 211–272.
[19] BRODBECK C.M., BUKREY R.R., Model calculations for the coordination of Fe3+ and Mn2+ ions inoxide glasses, Physical Review B 24 (5), 1981, pp. 2334–2342.
[20] CARNALL W.T., FIELDS P.R., RAJNAK K., Electronic Energy levels in the trivalent lantanide aquoions. I. Pr3+, Nd 3+, Pm3+, Sm3+, Dy3+, Ho3+, Er3+, and Tm3+, Journal of Chemical Physics 49(10),1968, pp. 4424–4442.
[21] STEFANI R., MAIA A.D., TEOTONIO E.E.S., MONTEIRO M.A.F., FELINTO M.C.F.C., BRITO H.F.,Photoluminescent behavior of SrB4O7:RE2+ (RE = Sm and Eu) prepared by Pechini, combustionand ceramic methods, Journal of Solid State Chemistry 179 (4), 2006, pp. 1086–1092.
[22] LIN H., YANG D.L., LIU G.S., MA T.C., ZHAI B., AN Q.D., YU J.Y., WANG X.J., LIU X.R., PUN E.Y.B.,Optical absorption and photoluminescence in Sm3+- and Eu3+-doped rare-earth borate glasses,Journal of Luminescence 113 (1–2), 2005, pp. 121–128.
[23] JAYASANKAR C.K., BABU P., Optical properties of Sm3+ ions in lithium borate and lithiumfluoroborate glasses, Journal of Alloys and Compounds 307 (1–2), 2000, pp. 82–95.
[24] SOUZA FILHO A.G., FREIRE P.T.C., GUEDES I., MELO F.E.A., MENDES FILHO J., CUSTÓDIO M.C.C.,LEBULLENGER R., HERNANDES A.C., High-pressure dependence of Sm3+ emission in PbO–PbF2––B2O3 glasses, Journal of Materials Science Letters 19(2), 2000, pp. 135–137.
[25] SAISUDHA M.B., RAMAKRISHNA J., Effect of host glass on the optical absorption properties of Nd3+,Sm3+, and Dy3+ in lead borate glasses, Phys. Rev. B 53(), 1995, pp. 6186–6196.
[26] KASSAB L.R.P., TATUMI S.H., MORAIS A.S., COURROL L.C., WETTER N.U., SALVADOR V.L.R.,Spectroscopic properties of lead fluoroborate glasses doped with ytterbium, Optics Express 8 (10),2001, pp. 585–589.
[27] YUJIN CHEN, YIDONG HUANG, ZUNDU LUO, Spectroscopic properties of Yb3+ in bismuth borateglasses, Chemical Physics Letters 382 (3–4), 2003, pp. 481–488.
[28] VIVIEN D., GEORGES P., Crystal growth, optical spectroscopy and laser experiments on newYb3+-doped borates and silicates, Optical Materials 22 (2), 2003, pp. 81–83.
[29] ROMERO J.J., JOHANNSEN J., MOND M., PETERMANN K., HUBER G., HEUMANN E., Continuous-wavelaser action of Yb3+-doped lanthanum scandium borate, Applied Physics B: Lasers and Optics 80 (2),2005, pp. 159–163.
[30] BURSHTEIN Z., KALISKY Y., LEVY S.Z., LE BOULANGER P., ROTMAN S., Impurity local phononnonradiative quenching of Yb3+ fluorescence in ytterbium-doped silicate glasses, IEEE Journal ofQuantum Electronics 36 (8), 2000, pp. 1000–1007.
[31] GUONIAN WANG, SHIXUN DAI, JUNJIE ZHANG, SHIQING XU, LILI HU, ZHONGHONG JIANG, Effect of F–
ions on emission cross-section and fluorescence lifetime of Yb3+-doped tellurite glasses, Journal ofNon-Crystalline Solids 351 (24–26), 2005, pp. 2147–2151.
[32] KROGH-MOE J., Refinement of the crystal structure of lithium diborate, Li2O.2B2O3, ActaCrystallographica Section B 24 (2), 1968, pp. 179–181.
[33] WITKOWSKA A., PADLYAK B., RYBICKI J., Influence of the rare-earth impurities on the Ge and Galocal structure in the Ca3Ga2Ge3O12 glass, Journal of Non-Crystalline Solids 352 (40–41), 2006,pp. 4346–4350.
Received November 12, 2009in revised form December 13, 2009

Optica Applicata, Vol. XL, No. 2, 2010
The influence of nanocrystallization process on thermal and optical parameter in oxyfluoride glasses
JANUSZ JAGLARZ1*, MANUELA REBEN2
1Cracow University of Technology, Institute of Physics, ul. Podchorążych 1, 30-084 Kraków, Poland
2AGH – University of Science and Technology, Faculty of Materials Science and Ceramics, al. Mickiewicza 30, 30-059 Kraków, Poland
*Corresponding author: [email protected]
The influence of nanocrystallization process in oxyfluoride glasses Na2O–Al2O3–SiO2––LaF3– NaF doped with rare earth (RE) ions on their thermal and optical properties isstudied. The thermal characteristics of oxyfluoride glasses (OG) with Tm3+, Yb3+ are presented.The effect of the glass crystallization on thermal stability of the glass and crystallizing phasesformed upon heat treatment is investigated by DTA/DSC and XRD methods. It has been foundthat the effect of nanocrystallization of LaF3 and incorporation of RE elements in formed uponheat treatment nanocrystallites depends on the kind of rare earth elements and is determined byfactors of crystallochemical nature and requires adequate proportions between the componentsforming glass structure.
The ellipsometric investigations are performed by M2000 spectroscopic ellipsometer. Thesemeasurements allowed us to determine dispersion of refractive indices in the range 190–1700 nmand depolarization coefficients. The influence of nanocrystallization process on refractive indicesis discussed.
Keywords: oxyfluoride glasses, rare earth elements, thermal and optical properties.
1. Introduction
In recent years, an increasing interest has been devoted to rare earth doped oxyfluorideglasses, particulary oxyfluoride transparent glass ceramic, because of their potentialuse for making optical devices, such as solid lasers and optical amplifiers, transparenthost materials based on rare earth (RE) ions [1]. Among numerous host materials,transparent oxyfluoride glass ceramics, which combine the advantages of the excellentoptical properties of fluoride and high chemical and thermal stability of oxide, haveattracted a great deal of attention [2]. An RE doped LaF3 single crystal, characterized

440 J. JAGLARZ, M. REBEN
by the low phonon energy and large transfer coefficient between the RE ions, has beenrevealed to be a suitable host to achieve laser and up-conversion. It is well known thatup-conversion is difficult to generate in conventional oxide glasses due to their highphonon energies, corresponding to the stretching vibrations of the oxide glass networkformer. But oxide glasses might be much better for practical applications because oftheir high thermal stability, chemical durability and not complicated fabrication [3].Rare earth ions are preferentially incorporated into crystalline phases with smallphonon energies of 350 cm–1. Consequently, excited-state lifetimes and opticalabsorption cross-sections of the doped RE ions become substantially larger in themthan in vitreous environments [4]. The glass host matrices are based on silicates withmechanically and chemically desirable characteristics. The lanthanum trifluoride LaF3is a classical host for studying thermal and optical properties of the trivalent RE ions.
1.1. Spectroscopic ellipsometry measurementsEllipsometry technique uses light of known polarization incident on a surface understudy and detects the polarization state of the reflected light [5].
Spectroscopic ellipsometry (SE) data can be acquired from ultraviolet to nearinfrared. SE determines two angles Ψ and Δ, with:
(1)
where rp and rs are complex Fresnel reflection coefficients for p and s polarizations,respectively, and Δ is a phase shift between both polarized waves. The fundamentalellipsometry equation (1) allows determination of thickness of a film and the spectraldependences of optical constants (i.e., the refractive index n and extinctioncoefficient k). Ellipsometric measurements also permit determination of the depthprofile and surface roughness, as has been done in this work. In each spectral range,different properties of materials are studied. However, the data must be analyzed toobtain useful information.
An optical model representing the assumed physical geometry and microstructureis developed, and Fresnel reflection coefficients calculated, allowing predictions ofΨ and Δ to compare with measured values. Model parameters, such as n, k androughness σ, vary in regression until the comparator function, such as mean squareerror, is minimized. The resulting parameters are the “best fit” values of n, k, and σ.
1.2. Experimental detailsFor each batch, the starting materials of high purity were fully mixed and melted ina covered platinum crucibles in an electric furnace at the temperature range from1400 to 1450 °C in air. The melts were poured out onto a steel plate forming a layerthickness of 2 to 5 mm and then cast into a brass mould followed by annealing ata temperature of 100 °C below the glass transition temperature determined bydifferential scanning calorimetry (DSC) to relinquish the inner stress. The following
ρ Ψtanrp
rs---------- eiΔ= =

The influence of nanocrystallization process ... 441
raw materials were used to prepare the batches: SiO2, Al2O3, Na2CO3, LaF3, NaF,Tm2O3 and Yb2O3. The compositions of the glasses are listed in Tab. 1.The crystallization ability of the glasses obtained was determined by DTA/DSCmeasurements conducted on the Perkin–Elmer DTA-7 System operating in heatflux DSC mode. The samples (60 mg) were heated in platinum crucibles at a rate10 °C/min in dry nitrogen atmosphere to the temperature 1000 °C. All glassesrevealing the effect of ceramization process were selected for further thermaltreatment. To obtain the ceramming effect the glasses were heated 20 min ata temperature of the maximum of the exothermal peak. The transparent glassy sampleswith 2–5 mm in thickness so produced were then cut into square coupons of about1 cm2, and heated to the ceramming temperature at a rate of 10 °C/min, held for 10 min,then cooled down to room temperature naturally to obtain transparent glass ceramics.
1.3. Ellipsometric studyThe spectroscopic measurements of Ψ and Δ for the layers presented were performedwith the use of Woollam M2000 spectroscopic ellipsometer in spectral range form190 to 1700 nm. The samples were measured for two angles of incidence (60°, 65°).To analyze the data, we combined all angular spectra and we fitted all datasimultaneously. The data have been analyzed using CompleteEASE 3.65 software.Also, the depolarization coefficient versus light wavelength has been determined.
2. Experimental results
The DTA and DSC thermal analysis are sensitive to changes in the chemicalcomposition of the glass and they are very easy methods to determine the character-istic temperature of glasses. From DTA/DSC curves the vitreous state transformation(glass transition temperature Tg), crystallization temperature Tcryst, as well asthe thermal effect accompanying them can be determined. In the course of cooling orheating the glass demonstrates the phenomenon of jump-like change of the molarheat Cp similarly to the phase transition of the 2-nd order according to Ehrenfest’sthermodynamic classification. The change in the value of Cp accompanying the glassystate transition (ΔCp), determined from the DSC curves is related to the degree ofrearrangement of the glass structure connected with this transition and depends onthe strength of modified bonds with the components of the glass network.
T a b l e 1. Composition of the rare earth doped oxyfluoride glasses.
Composition [mol%]Glass No. SiO2 Al2O3 Na2O LaF3 NaF Tm2O3 Yb2O3
O 42.55 31.32 10.08 14.50 1.55 – –O1 36.56 26.89 9.33 25.32 1.81 0.09 –O2 36.56 26.89 9.33 25.32 1.81 – 0.09O3 36.57 26.89 9.33 25.32 1.82 0.03 0.03

442 J. JAGLARZ, M. REBEN
Figure 1 shows the DSC curve of an as-prepared oxyfluoride glass doped with0.09 mol% of Tm2O3 and Yb2O3, respectively. The DSC curve shows a glass transitiontemperature Tg and exothermal effects, one just above Tg temperature which isconnected with ceramming process and the second one which occurs in highertemperatures. These exothermal effects indicate the same crystallization phases butthe first crystallization effect is connected with crystallization of LaF3 as a nanocrystal-lite and the second one with crystallization of LaF3 but in micro-sizes. The thermalstability factor ΔT has been frequently used as a rough estimate of the glass stability.To achieve a large working range of temperature during sample fiber drawing, it isdesirable for a glass host to have ΔT as large as possible.
From Table 2, it could be observed that the values of Tg, Tceram, Tcryst, and ΔT ofO1, O2 glass increased evidently compared to reference glass samples O. FromDTA/DSC curves of O1, O2, O3 glass it can be seen that the kind of rare earth ionshas a great influence on ceramming process. The maximum of ceramming tempera-tures increases with addition of Tm3+ and Yb3+ ions. Simultaneously, the enthalpy(ΔHcer) of this process becomes reduced. This is the evidence of an increasingability of the glass for ceramization, manifested by a decreasing value of the thermalstability index of the glass ΔT2. Simultaneously, the glass transition temperature is
Fig. 1. DTA/DSC curves of rare earthdoped oxyfluoride glasses.
T a b l e 2. Thermal characteristics of rare earth doped oxyfluoride glasses (ΔT1 = Tmax.cer – Tg,ΔT2 = Tmax.cryst – Tg).
Glass No.
Tg [°C]
ΔCp [Jg–1 °C–1]
Tmax. cer [°C]
ΔHcer [Jg–1]
1-st stage of crystal. (ceram.)
Tmax.cryst [°C]
ΔHcryst [Jg–1]
ΔT1 [°C]
ΔT2 [°C]
O 576 0.810 664 18.04 LaF3 908 41.15 88 332O1 593 0.491 671 53.25 LaF3 953 69.59 78 360O2 592 0.251 668 21.61 LaF3 933 78.85 76 341O3 560 0.252 657 19.69 LaF3 959 159.34 97 399

The influence of nanocrystallization process ... 443
shifted towards higher temperatures with addition of RE ions compared to glass Owithout RE. The addition of Tm3+ and Yb3+ ions causes the reduction of the specificheat (ΔCp) accompanying the glass transition region, which may be the evidence ofan increased flexibility of the glass network.
The XRD measurements were performed on as-prepared glass and its correspondingglass-ceramic. The XRD pattern for as-prepared glass presented in Fig. 2, does notshow diffraction peaks, indicating its amorphous structure by nature. But in Fig. 3a,the mild diffraction peaks for sample O1 heat treated at 671 °C for 10 min haveappeared. The marked peaks are matched with the diffraction peaks of crystalline LaF3reported earlier [2, 4, 6]. From XRD studies one can see in the case of glass O1 dopedwith Tm3+ ions that the heat treatment of this glass in the ceramming temperature671 °C for 10 min causes appearance of very weak diffraction peaks of crystallineLaF3. In the case of glass O2, the addition of Yb3+ ions causes appearance of verywell visible diffraction peaks of crystalline LaF3, when the glass is heat treated atthe maximum ceramization temperature of 668 °C for 10 min (Fig. 3b).
Fig. 2. XRD pattern for the host matrix glass prepared.
a b
Fig. 3. XRD pattern of glasses O1, O2 after cerammization process; O1, 671 °C, 10 min (a), O2, 668 °C,10 min (b).

444 J. JAGLARZ, M. REBEN
The spectral dependence of ellipsometric angles for samples O1 and O2 is shownin Fig. 4. In the same figure, the values of Ψ and Δ generated using the fitting Cauchymodel are given.
The Cauchy model describes dispersion relations for n and k indices namely:
(2)
(3)
where A, B, C and β are constant terms. The k and Ebandegde are the fit parameterswhich describe Urbach’s tail absorption and allow the shape of dispersion of extinction
Fig. 4. Spectral dependence of ellipsometric angles measured for O1 (a) and O2 (b) samples, respectively.
a
b
n λ( ) A Bλ2
----------- Cλ4
----------+ +=
k λ( ) keβ hc
λ----------- Ebandedge–⎝ ⎠⎛ ⎞
=
T a b l e 3. Values of parameters determined from ellipsometric measurements.
Sample no. A B×10–4 C×10–4 k×10–4 Roughness [nm] n at 633 nmO1 1.306±0.017 2.21±0.3 1.77±0.16 3.4±0.2 4.19±0.29 1.312O2 1.366±0.018 28.7±0.2 1.40±0.10 7.1±0.5 1.13±0.10 1.374

The influence of nanocrystallization process ... 445
coefficient to be determined. The values of these fit parameters for O1 and O2 samplesare presented in Tab. 3. Figure 5 shows the n and k dispersive relations in spectralrange from 190 to 1700 nm for the samples under study. Ellipsometric resultsallow surface roughness to be determined. In the samples investigated we assumedthe appearance of the surface roughness which can be described using the Bruggemaneffective medium approximation (EMA) [7]. This approximation uses a 50:50 mixtureof the material and air on the sample surface to get optical constants that approximatethe effect of the surface roughness. The obtained values of σ are presented in column 6of Tab. 3.
The oxyfluoride glasses (OG) doped with Tm ions exhibits lower opticalparameters than the one with Yt ions. Generally, the OG host matrix shows higherrefractive index in UV–VIS0–NIR range than rare earth doped glass.
Additionally, for the samples under investigation the depolarization coefficients [8](ratio of incoherent part to the total reflected radiation) have been determined. The resultsof depolarization state of reflected radiation of the samples are showed in Fig. 6.
The reflected light beam may consist of two or more components with well definedpolarization states. Yet, the resultant total beam does not exhibit a single welldefined polarization state. There is so in the case of a nonuniform film, or transparent
a b
Fig. 5. Cauchy dispersion dependences for refraction indices n (a) and extinction coefficients k (b).
Fig. 6. Degree of depolarization of reflected radiationfrom O1 and O2 samples versus wavelength.

446 J. JAGLARZ, M. REBEN
substrate exhibiting back reflection effects as is for the glass samples [9]. Howeverthe depolarization coefficient of reflected beam is much bigger than other mentionedeffect. This is because of depolarizing light in the bulk of OG glasses.
3. Conclusions
Stable glasses could be prepared in a relatively large composition domain of the NaF––LaF3 system. Unfortunately, the effect of LaF3 crystallization as the onlynanocrystalline phase, which is indispensable from the optoelectronics point of view,is strongly dependent on the rare earth content with respect to the kind of those ions.
The thermal properties of rare earth (RE) ion doped glass depend strongly on localenvironment of RE, and therefore differences in the DTA/DSC curves are expectedif they are placed in a glassy or in a crystalline surrounding of the glass ceramic.The advantages of oxyfluoride glass ceramic are that the rare earth ions would beincorporated selectively into the fluoride crystalline phase LaF3 after crystallization,and these materials possess good transparency due to the much smaller size ofprecipitated crystals than the wavelength of visible light. The thermal stability factorΔT has been frequently used as a rough estimate of the glass stability.
The index of refraction of oxyfluoride glasses is low (~1.4) in visible range.RE ions lower the refractive index of oxyfluoride host matrix. The doping of RE ionscauses change in coefficients n and k. The Yt ions doped to modify optical constantsenter the host matrix much more than the same quantity of Tb ions.
The depolarization of reflected beam results from light scattering in the bulk andbackscattering from the bottom surface of OG wafer. Depolarized light comes mainlyfrom scattering on nanocrystals appearing in the host matrix. The presence of RE ionsenhance nanocrystallization in OG glasses.
Reference[1] ZHONGCHAO DUAN, JUNJIE ZHANG, WEIDONG XIANG, HONGTAO SUN, LILI HU, Multicolor
upconversion of Er3+/Tm3+/Yb3+ doped oxyfluoride glass ceramics, Materials Letters 61(11–12),2007, pp. 2200–2203.
[2] REBEN M., WACŁAWSKA I., Structure and nanocrystallization of SiO2–Al2O3–Na2O–LaF3,Proceedings of the XXI ICG Strasbourg, 2007.
[3] PAN Z., JAMES K., CUI Y., BURGER A., CHEREPY N., PAYNE S.A., MU R., MORGAN S.H., Terbium--activated lithium–lanthanum–aluminosilicate oxyfluoride scintillating glass and glass-ceramic,Nuclear Instruments and Methods in Physics Research A 594 (2), 2008, pp. 215–219.
[4] REBEN M., WACŁAWSKA I., PALUSZKIEWICZ C., ŚRODA M., Thermal and structural studies ofnanocrystallization of oxyfluoride glasses, Journal of Thermal Analysis and Calorimetry 88 (1), 2007,pp. 285–289.
[5] AZZAM R.M.A., BASHARA N.M., Ellipsometry and Polarized Light, Nord Holland, 1987.[6] ŚRODA M., WACŁAWSKA I., STOCH L., REBEN M., DTA/DSC study of nanocrystallization in oxyfluoride
glasses, Journal of Thermal Analysis and Calorimetry 77 (1), 2004, pp. 193–200.

The influence of nanocrystallization process ... 447
[7] BRUGGEMAN D.A.G., Berechnung verschiedener physikalischer konstanten von heterogenensubstanzen, Annalen der Physik (Leipzig) B 24, 1935, pp. 636–674.
[8] JELLISON G.E., Spectroscopic ellipsometry data analysis: measured versus calculated quantities,Thin Solid Films 313–314, 1998, pp. 33–39.
[9] CompleteEasy Data Analysis Manual, J.A. Woolam Co., Inc., 2008.
Received November 12, 2009in revised form January 10, 2010

Optica Applicata, Vol. XL, No. 2, 2010
Stabilized detection scheme of surface acoustic waves by Michelson interferometer
OLEH MOKRYY1, 2*, VOLODYMYR KOSHOVYY1, IGOR ROMANYSHYN1, ROMAN SHARAMAGA1
1Karpenko Physico-Mechanical Institute of the National Academy of Science of Ukraine, Lviv, 79601, Ukraine
2Lviv Politechnic National University, Department of Photonics, 79013 Lviv, Ukraine
*Corresponding author: [email protected]
A new detection scheme of surface acoustic waves by Michelson interferometer has been proposed.A substantial advantage of this scheme lies in its being stabilized against vibration and independentsensitivity of the width of an optical beam. These effects were achieved by creating an interferencefield on the surface of a photodetector. The measurement scheme proposed was analyzed by meansof a numerical modeling method. Experiments confirming the fact of the sensitivity of the proposeddetection scheme being independent of vibration and width of optical beam have also been made.
Keywords: surface acoustic wave, Michelson interferometer, noncontact detection.
1. IntroductionSurface acoustic waves (SAW) are used for determining the space distribution ofthe elastic properties of coated materials, composite structures, materials that havesustained surface modifications. These materials are important for the aircraft industry,medicine and other applications. Laser ultrasound methods have been used forthe excitation and detection of SAW in recent years. These methods are successfulbecause they are noncontact and have a high space and time resolution. We considerthe problem of detection of SAW using Michelson interferometer. This is a detectionmethod of a sample surface displacement due to the acoustic wave [1–3]. It is quiteeasy to use and allows high sensitivity to be obtained. The sensitivity of Michelsoninterferometer is equal to zero when the optical path difference equals 0.5λN,where λ is the optical wavelength and N is an integer. Temperature drifts andvibrations can result in the change of optical path difference of several micrometers,thus seriously complicating an interferometer operation. Therefore, there is a problemof stabilization of Michelson interferometer against vibration. This problem is typicalof other interferometers, too. The active and passive methods are used forstabilization of interferometers. The changing path length is stabilized by displacementof an interferometer mirror or electro-optic cell [1, 4]. The feedback signal is usedin these methods. Another method is based on the quadrature dual interferometer. In

450 O. MOKRYY et al.
this method, two interference signals with a π /2 shift phase are detected bytwo photodetectors [1]. However, all these require an essential complication ofconstruction. We proposed a new stabilization scheme for detecting SAW byMichelson interferometer. A distinctive feature of this setup is that the interferencepattern is formed on the surface of a photodetector in the form of space periodic fringes.
The sensitivity of the Michelson interferometer depends on the optical beamsize [5]. When the optical beam size is proportional to the wavelength of SAWthe sensitivity is small because different parts of the optical beam have a differentoptical path. In this case, the intensity of one part of interference field is increased andthe intensity of another part of interference field is decreased, therefore the full signalhas been compensated. The measurement scheme which we proposed is free from thatdefect. The sensitivity of this scheme is independent of the optical beam size, whenthe optical beam size is larger than certain value. This effect is possible due tothe existing interference fringes with the width corresponding to the SAW length. Thisconclusion is confirmed by a numerical simulation and experiment.
2. Detection scheme of surface acoustic waves
A general scheme of the measurement setup is presented in Fig. 1. This setup differsa little from the classical setup of Michelson interferometer. Optical beams reflectedfrom the sample and from the interferometer mirror interact and an interferencepattern is formed. The intensity of interference field is registered by a photodetector.The displacement of the sample surface changes the optical path difference andcorrespondingly changes the intensity of interference field. A distinctive feature ofthe measurement setup proposed is that there is a certain angle between interferingbeams. This angle appears as a result of the inclination of interferometer mirror(Fig. 1). The presence of an angle between interfering beams results in appearance ofthe spatial periodically modulated interference pattern. Thus, the interference fieldon the surface of the sensitive area of the photodetector is formed as a result of actionof two factors: the angle between interference beams and modulation of phase shiftbetween these beams due to propagation of SAW through a sample.
Laser
Photodetector
Interference field
Sample
Mirror
Fig. 1. A scheme illustrating detectionof SAW by Michelson interferometer.
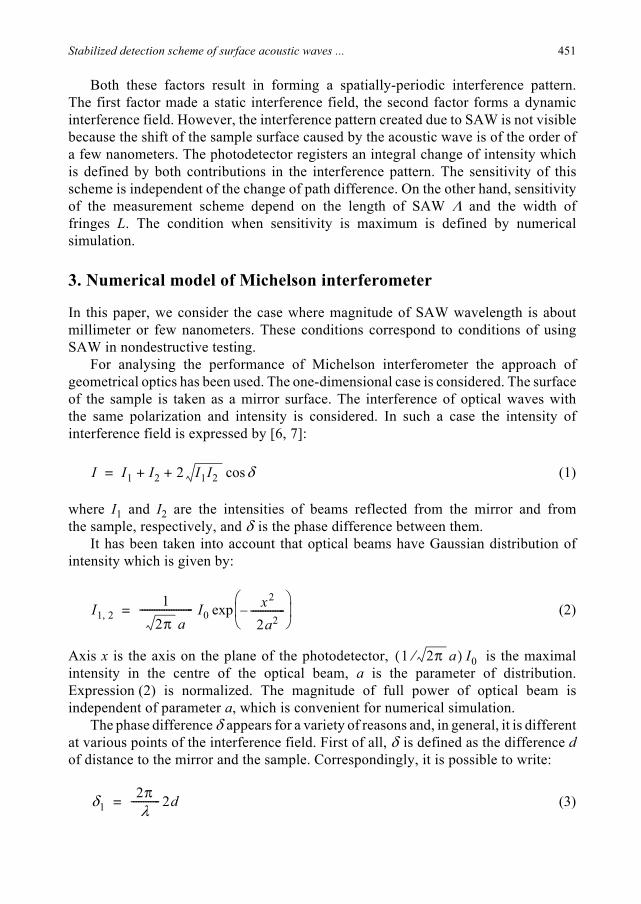
Stabilized detection scheme of surface acoustic waves ... 451
Both these factors result in forming a spatially-periodic interference pattern.The first factor made a static interference field, the second factor forms a dynamicinterference field. However, the interference pattern created due to SAW is not visiblebecause the shift of the sample surface caused by the acoustic wave is of the order ofa few nanometers. The photodetector registers an integral change of intensity whichis defined by both contributions in the interference pattern. The sensitivity of thisscheme is independent of the change of path difference. On the other hand, sensitivityof the measurement scheme depend on the length of SAW Λ and the width offringes L. The condition when sensitivity is maximum is defined by numericalsimulation.
3. Numerical model of Michelson interferometer
In this paper, we consider the case where magnitude of SAW wavelength is aboutmillimeter or few nanometers. These conditions correspond to conditions of usingSAW in nondestructive testing.
For analysing the performance of Michelson interferometer the approach ofgeometrical optics has been used. The one-dimensional case is considered. The surfaceof the sample is taken as a mirror surface. The interference of optical waves withthe same polarization and intensity is considered. In such a case the intensity ofinterference field is expressed by [6, 7]:
(1)
where I1 and I2 are the intensities of beams reflected from the mirror and fromthe sample, respectively, and δ is the phase difference between them.
It has been taken into account that optical beams have Gaussian distribution ofintensity which is given by:
(2)
Axis x is the axis on the plane of the photodetector, is the maximalintensity in the centre of the optical beam, a is the parameter of distribution.Expression (2) is normalized. The magnitude of full power of optical beam isindependent of parameter a, which is convenient for numerical simulation.
The phase difference δ appears for a variety of reasons and, in general, it is differentat various points of the interference field. First of all, δ is defined as the difference dof distance to the mirror and the sample. Correspondingly, it is possible to write:
(3)
I I1 I2 2 I1I2 δcos+ +=
I1 2,1
2π a---------------------- I0
x2
2a2--------------–
⎝ ⎠⎜ ⎟⎛ ⎞
exp=
1 2π a⁄( ) I0
δ12πλ
------------ 2d=

452 O. MOKRYY et al.
In the case where one beam is parallel to the axis of the interferometer andthe other one is inclined under a small angle β to this axis, the phase change betweenthem is described by the expression [6]:
(4)
Thus, the periodic interference fringes are formed having a width L = λ /sinβ.A particular feature of using Michelson interferometer for detection of the SAW
is that the surface of the sample through which a wave propagates is displaced underthe action of SAW. We considered the case where the frequency range of SAW is froma few MHz to tens of MHz (the wavelength ranges from less than a millimeter to a fewmillimeters) and its amplitude has value of a few nanometers. The minimal wavelengthof SAW is 0.2 mm in the area considered. Since the magnitude of SAW amplitude isaccepted as 1 nm, then the inclination of the surface is less than 2×10⁻⁵ radian. Thismagnitude is small and it can be assumed that the angle spectrum of the reflectedoptical wave is equal to the angle spectrum of the falling optical wave. The front ofthe reflected wave changes by a double value of surface displacement under the actionof SAW. The space distribution of change of the front reflected wave corresponds tothe space distribution displacement of the sample surfaces.
The phase shift between optical waves, caused by the SAW, will take the form:
(5)
where ω is the frequency of SAW and Λ is the length of SAW, h is the amplitudeof SAW.
Taking into account Eqs. (1)–(5) the distribution of intensity in plane ofinterference pattern can be written as follows:
(6)
For recording a signal the photodetector is placed in the interference field (Fig. 1).Photocurrent is proportional to the total intensity of incident light on the photodetector
(7)
s is the area of interference field on photodetector, which was determined throughthe diaphragm size, g is the coefficient of proportionality.
δ22πλ
------------ x βsin=
δ32πλ
------------ 2h ω t 2πΛ
------------ x+⎝ ⎠⎛ ⎞sin=
I I1 I2 2 I1I22πλ
------------ 2d x βsin 2h ωt 2πΛ
----------- x+⎝ ⎠⎛ ⎞sin+ +
⎩ ⎭⎨ ⎬⎧ ⎫cos+ +=
i g I d x∫s∫=

Stabilized detection scheme of surface acoustic waves ... 453
When describing the measurement setup for registration of SAW the parameter V,i.e., which is sensitivity, is used:
(8)
where Δi is the AC amplitude of the photodetector current.A change in the magnitude of length difference produces modulation of
the photocurrent. The depth modulation is:
(9)
Δimax and Δimin are maximum and minimum AC amplitudes of the photodetectorcurrent determined when the optical path difference is changed by the value λ /2.
The distribution of intensity in the interference field is determined by the numericalcalculation. The interference field is in the plane of photodiode. The plane ofphotodiode is divided into small elements and we accept that the optical intensity isconstant in each respective element. The intensity in one element is calculated byEq. (6). The total intensity is calculated as the sum of the intensities in all elements.The photocurrent is proportional to the total intensity. The photocurrent iscalculated for the different moments of time during the period of SAW. The amplitudeof photocurrent is determined this way and correspondingly its dependence onthe different parameters is calculated.
4. Numerical experiment
Equations (6)–(9) allow us to analyze the sensitivity of Michelson interferometer andto optimize parameters of the detecting scheme. The dependence of sensitivity V versusoptical beam size r and width L of interference fringes is considered.
For numerical modeling the following values of parameters were taken: a = 1.5 mm,ω = 6.28×10⁶ Hz, λ = 0.6 μm. A displacement h of the surface of the sample underthe action of the SAW was taken sufficiently smaller than the optical wavelength andwas equal to 1 nm, and this magnitude of displacement corresponds to the power ofa few mW/cm [8].
A change of a few millimeters in length difference of the interferometer arms wasconsidered in calculations. The wavelength of SAW is 1 mm.
The results of the numerical simulation are presented in Figs. 2–4. The sensitivitydependence of the optical beam width is shown in Fig. 2. This figure presents the casewhere the width of the interference fringes is infinity. The sensitivity is maximum
V Δi
hg I d x∫s∫
------------------------------=
GimaxΔ iminΔ–
imaxΔ iminΔ+--------------------------------------=

454 O. MOKRYY et al.
under condition of the width of the optical beam being small. This principle is wellknown and therefore small width of the optical beam is used in this scheme ofthe detection of SAW. The change of sensitivity due to the path difference of opticalbeams is shown in Fig. 3. The Michelson interferometer sensitivity is minimal whenthe distance difference is 2d = Nλ /2. This dependence illustrates the need forstabilization of the path difference.
The sensitivity dependence of the optical beam width and the change of pathdifference is shown in Fig. 4. The difference distance d is presented as a sum ofthe constant part d0 and variable part Δd. The cases when d0 = 0.1 mm (seeFigs. 4a–4c) and d0 = 2 mm (see Figs. 4d–4f ) are presented. As can be seen fromthe graphs there exists a strong dependence of sensitivity on magnitude Δd.The sensitivity changes in accordance with sinusoidal law from maximal value tozero. When the optical beam width increases the dependence sensitivity of the changein path difference decreases for all the cases presented in Fig. 4. Under condition ofΛ = L (Figs. 4b and 4e) the sensitivity approximates a constant magnitude but forΛ > L (see Figs. 4a, 4d) and Λ < L (see Figs. 4c, 4f) the sensitivity decreases to zero.The results of numerical simulation show that sensitivity is independent of the opticalbeam width when the latter is great.
The obtained results of numerical simulation agree with the known experimentaldata and show new possibilities for detection of SAW. In the traditional scheme ofMichelson interferometer the optical beam width is much less than the wavelength
Fig. 2. Sensitivity versus width of optical beam.
Fig. 3. Sensitivity versus distance difference,r = 0.1 mm.
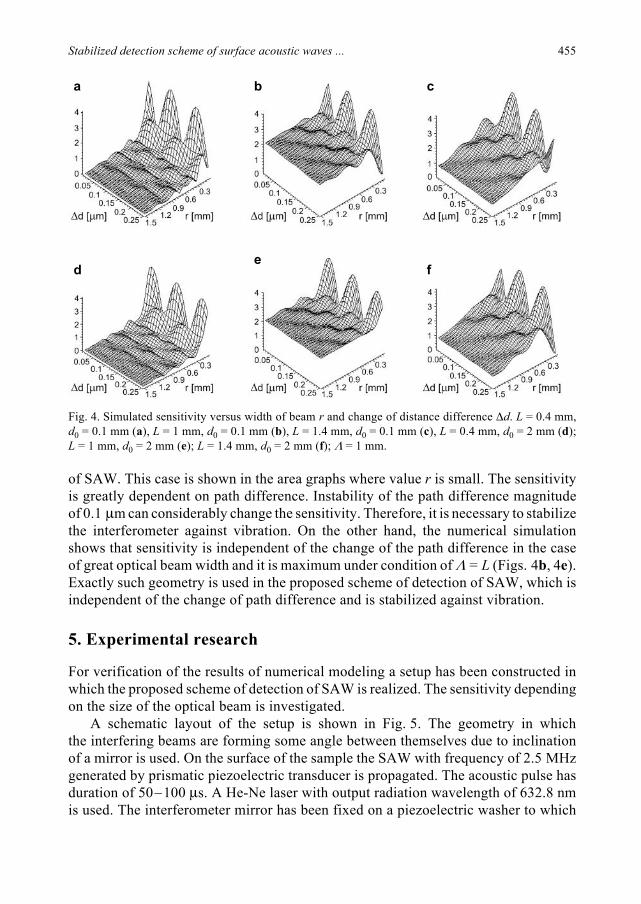
Stabilized detection scheme of surface acoustic waves ... 455
of SAW. This case is shown in the area graphs where value r is small. The sensitivityis greatly dependent on path difference. Instability of the path difference magnitudeof 0.1 μm can considerably change the sensitivity. Therefore, it is necessary to stabilizethe interferometer against vibration. On the other hand, the numerical simulationshows that sensitivity is independent of the change of the path difference in the caseof great optical beam width and it is maximum under condition of Λ = L (Figs. 4b, 4e).Exactly such geometry is used in the proposed scheme of detection of SAW, which isindependent of the change of path difference and is stabilized against vibration.
5. Experimental research
For verification of the results of numerical modeling a setup has been constructed inwhich the proposed scheme of detection of SAW is realized. The sensitivity dependingon the size of the optical beam is investigated.
A schematic layout of the setup is shown in Fig. 5. The geometry in whichthe interfering beams are forming some angle between themselves due to inclinationof a mirror is used. On the surface of the sample the SAW with frequency of 2.5 MHzgenerated by prismatic piezoelectric transducer is propagated. The acoustic pulse hasduration of 50–100 μs. A He-Ne laser with output radiation wavelength of 632.8 nmis used. The interferometer mirror has been fixed on a piezoelectric washer to which
Fig. 4. Simulated sensitivity versus width of beam r and change of distance difference Δd. L = 0.4 mm,d0 = 0.1 mm (a), L = 1 mm, d0 = 0.1 mm (b), L = 1.4 mm, d0 = 0.1 mm (c), L = 0.4 mm, d0 = 2 mm (d);L = 1 mm, d0 = 2 mm (e); L = 1.4 mm, d0 = 2 mm (f); Λ = 1 mm.
a b c
de
f

456 O. MOKRYY et al.
a sinusoidal signal with frequency of 46 kHz is supplied. It is the resonancefrequency of the piezoelectric washer. Under the action of this signal the mirroroscillates, which causes a change of distance difference d. An oscillation of mirrorsimulates vibrations and allows us to study experimentally their influence onthe sensitivity of the measurement setup. The oscillation swing of the mirror is a fewhundred nanometers. A signal which is supplied to the interferometer mirror anda pulse of the SAW are synchronized with each other. An interference pattern isregistered by the photodetector and the signal is observed on the oscilloscope.The signal is amplified by the band-pass amplifier. The setup also uses a diaphragmwhich allows changing of the width of the beam which falls onto the photodetector.The whole interfering field falls at the photodiode.
A glass plate is used as a specimen. The measured velocity of SAW is 3300 m/sand the wavelength is 1.32 mm. The result of the experiment is presented in Fig. 6.The sensitivity is maximum and changes very little with an increase in the size of optic
Fig. 5. Scheme of the experimental setup.
Laser
Generator Pulse generator
f = 46 kHz
SAW
f = 2.5 MHz
Amplifier OscilloscopePhotodetectorDiaphragm
transducers
Mirror on piezoelectric washer
Fig. 6. Sensitivity versus width of optical beam. The wavelength of SAW is 1.32 mm. The starting opticalpath is different for L = 1.0 mm, L = 1.32 mm and L = 1.6 mm.

Stabilized detection scheme of surface acoustic waves ... 457
beam r beginning from r ≈ 0.5 mm under condition of L = Λ. Otherwise, the sensitivitydecreases when the optic beam size is increased. These results of the experiment agreewith the results of the numerical calculation (Fig. 4).
The proposed scheme of measurement is stabilized against the change in pathdifference, too. The oscillograms of signals received at the registration of pulses ofSAW at vibrations of the interferometer mirror are shown in Fig. 7. In this case,the scheme for which L = Λ is used. The shape of the signal shows that the swing ofthe mirror vibration is greater than λ /4 (see Fig. 7a). The depth modulation decreaseswhen the optical beam size increases. The amplitudes of the mirror vibration in bothcases are equal. The shape of the signal (see Fig. 7b) shows that the sensitivity is lessdependent on the change of path difference. The depth of modulation decreases to0.07 when the width of optical beam increases to 1 millimeter. This result tells us thatthe proposed scheme of detection of SAW is stabilized against vibration.
6. Conclusions
A scheme for detecting SAW using Michelson interferometer in which the sensitivitydoes not depend on the change of length difference of interferometer arms has beenproposed. The sensitivity is also independent of the change of optical beam size.The numerical simulation and experimental investigation of this scheme have beenmade. The proposed scheme of SAW may be used under conditions of vibration andtemperature drifts.
References[1] WAGNER J.W., Optical detection of ultrasound in Physical Acoustics: Ultrasonic Measurement
Methods, R.N. Thurston, A.D. Pierce [Eds.], V. XIX. Academic Press, Boston, SanDiego, New York,London, Sydney, Tokyo, Toronto, 1990, pp. 201–265.
[2] KNUUTTILA J.V., TIKKA P.T., SALOMAA M.M., Scanning Michelson interferometer for imaging surfaceacoustic wave fields, Optics Letters 25(9), 2000, pp. 613–615.
[3] PRADA C., BALOGUN O., MURRAY T.W., Laser-based ultrasonic generation and detection ofzero-group velocity Lamb waves in thin plates, Applied Physics Letters 87 (19), 2005, p. 194109.
[4] REIBOLD R., MOLKENSTRUCK W., Laser interferometric measurement and computerized evaluation ofultrasonic displacements, Acustica 49 (3), 1981, pp. 205–211.
Fig. 7. Photocurrent at vibration of the interferometer mirror. Amplitude of the vibration larger thanλ /4, r = 0.1 mm (a), r = 1 mm (b).
a b

458 O. MOKRYY et al.
[5] GOLLWITZER A., HAUGG S., FISCHERAUER G., An auto-focusing approach for a dynamic quadratureinterferometer, Proceeding of the Conference Opto 2009, May 26–28, 2009, Nurnberg, pp. 29–34.
[6] VEST C.M., Holographic Interferometry, John Wiley & Sons, New York, 1979.[7] ANGELSKY O.V., MAKSIMYAK A.P., MAKSIMYAK P.P., HANSON S.G., Optical correlation diagnostics
of rough surfaces with large surface inhomogeneities, Optics Express 14(16), 2006, pp. 7299–7311.[8] GULYAEV YU.V., PLESSKII V.P., Propagation of acoustic surface waves in periodic structures, Soviet
Physics Uspekhi 32 (1), 1989, pp. 51–74.
Received June 21, 2009in revised form October 14, 2009

Optica Applicata, Vol. XL, No. 2, 2010
Optical correlation technique for cement particle size measurements
MYKHAYLO P. GORSKY*, PETER P. MAKSIMYAK, ANDREW P. MAKSIMYAK
Correlation Optic Department, Chernivtsi National University, 2 Kotsybunska St., Chernivtsi, Ukraine
*Corresponding author: [email protected]
Optical correlation technique of determining the cement particle size distribution is described. Itis based on transverse coherent function measurement using a polarization transverse shearinginterferometer. The proposed technique of data processing decreases the dependence of the resulton interferometer noise, emission source intensity fluctuations and difference of refractive indexmagnitudes of different cement particles. The technique allows fast and reliable determination ofthe size distribution function of cement particles.
Keywords: transverse coherence, polarization interferometer, cement, size distribution function.
1. IntroductionThe size distribution function of particles is an important characteristic of cement.Different kinds and brands of cement differ by particle sizes. For physical andmathematical modelling of different processes, which occur during specific hydrationand studying its mechanical, optical and other properties, it is necessary to knowthe size distribution function of particles. Cement particle size distributionmeasurements are taken by different methods, such as electrical zone sensing,sedimentation, scanning electron microscopy [1–5]. But these methods are toocomplicated and are not widely used. A standard procedure consists in measuringthe weight of the remains on the sieve during consecutive screening from the biggestmesh aperture to the smallest one. Laser light diffraction method [5] is also used.For determination of cement particle size we suggest using optical correlationtechnique [6, 7].
Cement is a complicated mixture of particles with different sizes and forms, whichby 95–97% consists of oxides CaO, SiO2, Al2O3 and Fe2O3. These compoundsconstitute minerals, the main of which are [1–4]:
– tricalcium silicate (alite), 3CaO·SiO2, 40–65%;– dicalcium silicate (belite), 2CaO·SiO2, 15–45%;– tricalcium aluminate, 3CaO·Al2O3, 4–12%;

460 M.P. GORSKY, P.P. MAKSIMYAK, A.P. MAKSIMYAK
– tetracalcium alumoferrite, 4CaO·Al2O3·Fe2O3,12–25%;– gypsum.The size of a particle with complex shape could be determined by the maximum
linear dimension or by the spherical particle diameter with equivalent volume. As isknown, optical properties are mathematically calculated only for spherical, cylindricaland spheroid forms [8, 9]. For practical use, in calculations of specific cement opticalproperties, it is convenient to approximate particles by spherical form [10]. Thisapproximation is used in laser radiation diffraction method [5]. But the distributionfound essentially depends on incoming parameters for calculation. One of theseparameters is the magnitude of relative refractive index. The refractive index ofcements is complex m = n + iχ, but its real and imaginary parts are found withinthe intervals of n = 1.5–1.7, χ = 0.003–1 [1–5]. As cement is a mixture of particleswith different chemical composition, each particle could have its own refractiveindex magnitude. In the case of measurement of laser radiation diffraction onisolated particles, consideration of this peculiarity is quite complicated. Usually, somerefractive index is set for all particles, which causes distortion of results.
It has been shown in papers [6, 7] that it is possible to determine sizes andconcentration of particles from the transverse coherent function of a particle’s image.However, this technique needs high measurement accuracy of coherence function, andsamples must provide only single scattering (distances between particles have toexceed maximum particle size). Often in practice, these conditions are hard to provide.We suggest the technique of processing and approximation of experimental results,which decreases the obtained particle size distribution function dependence onconcentration and spread in refractive index magnitudes.
2. Coherence function calculation
Under light scattering on large particles, particle images are projected into observationplane. It is easy to analyze particle images using the transverse coherence function:
(1)
where – transverse coherence function of particle images giving the data onparticle size distribution; ΓX – constant component describing non-scattered radiationintensity. Experimentally, the coherence function of a field is determined in transverseshearing interferometer. The transverse coherence function magnitudes for certaintransversal shares are determined from interference pattern visibility. For scalar opticalfields visibility is found as:
(2)
where Imax and Imin – maximum and minimum magnitudes of intensity, respectively.
Γ⊥ ρ( ) ψ⊥ ρ( ) ΓX+=
ψ⊥ ρ( )
VImax Imin–
Imax Imin+-------------------------------=

Optical correlation technique for cement particle size measurements 461
Let us find the transversal coherence function of spherical particle’s image withdiameter d. The correlation of particle images for transversal displacement ininterferometer leg ρ can be defined by overlapped zone square of particle image(Fig. 1):
(3)
Overlapped square normalization of particle images gives us the correlationfunction of image particle. Let us denote the radiant flux through a unit area by dI.The particle image overlaps radiant flux in the beam. Then, in interference maximum,the radiant flux at the observation plane behind the particle image would be the resultof beam interference with zero phase difference, and the total radiant flux would beequal to 4dI. Radiant flux in particle image area outside the overlapped image zonewould be equal to dI. The flux in overlapped zone is zero. Particle image zone square,outside the overlapped zone, equals 2[d2π /4 – sr(d, ρ )]. If the observation zone squareis larger than the particle image square by ρs times, then the observation zone square,without particle images, is determined as: ρs(d2π /4) – 2[d2π /4 – sr(d, ρ )] – sr(d, ρ ).Then, the maximum intensity for displacement ρ and particle diameter d could bewritten as:
(4)
where ρs – the ratio of the observation field square to the particle image square. Ininterference minimum, the observation field would be the result of beam interferencewith phase difference π, so that the radiant flux outside the particle images and inoverlapped image zone equals zero. The radiant flux in not overlapped zones of particle
Fig. 1. Image overlay for spherical particle with diameterd and transverse displacement ρ.
d ρ
sr d ρ,( ) d 2
2------------ ρ
d--------acos ρ
2-------- d 2 ρ2––=
Imax ρ d ρs, ,( )dI d 2 ρ
d---------acos d 2π ρs
32
-------–⎝ ⎠⎛ ⎞ ρ d 2 ρ2––+ , ρ d≤
dI d 2π ρs32
--------–⎝ ⎠⎛ ⎞ ,⋅ ρ d>
⎩⎪⎪⎨⎪⎪⎧
=

462 M.P. GORSKY, P.P. MAKSIMYAK, A.P. MAKSIMYAK
images is also equal to dI. Then, the minimum intensity in the transverse shearinginterferometer for displacement ρ and particle diameter d is:
(5)
Then, the transverse coherence function through the extreme magnitudes ofintensity is:
(6)
For the ensemble of particles with different sizes and the corresponding sizedistribution p(d ), the transverse coherence function is defined as:
(7)
Determination of the distribution function from these equations is verycomplicated. But, if we know the function p (d ), we could find its parameters usingthe least-squares method [11].
If an analytical form of function p (d ) is known, then determination of itsparameters is done by the following algorithm. From experimental data, by extrememagnitudes of intensity, the transverse coherence function magnitudes are determinedfor certain transverse shifts as interference pattern visibility. Then, using the least--squares method and Eq. (7), the best approximation is found, from which distributiveparameters and value ρs could be determined, which gives us particle concentration.
3. Measuring technique with polarization transverse shearing interferometer
For measuring the field’s transverse coherence function, we use a polarizationinterferometer arrangement (Fig. 2). It consists of two identical wedges 3 and 4
Imin ρ d,( )d I d 2π
2------------- ρ d 2 ρ2– d 2 ρ
d---------acos–+ , ρ d≤
dI d 2π2
------------- , ρ d>⎩⎪⎪⎨⎪⎪⎧
=
Γ⊥ ρ d ρs, ,( )Imax Imin–
Imax Imin+-------------------------------
d 2π ρs 2–( ) 2ρ d 2 ρ2–– 2d 2 ρd
---------acos+
d 2π ρs 1–( )---------------------------------------------------------------------------------------------------------------- , ρ d≤
ρs 2–
ρs 1–------------------- , ρ d>
⎩⎪⎪⎪⎨⎪⎪⎪⎧
= =
=
Γ ⊥total ρ ρs,( ) p d( )Γ⊥ ρ d ρs, ,( )dd
0
∞
∫=

Optical correlation technique for cement particle size measurements 463
forming a plane-parallel plate, which are placed between crossed polarizers 1 and 5.The main optical axes of wedges 3 and 4 are parallel and form 45° angles with planeof polarization of polarizers 1 and 5. Sample 2 is placed between polarizer 1 andwedge 3.
In Figure 2, the ordinary “o” and extraordinary “e” beam paths are shown. Spacedivision of the beams occurs on a way out from the first wedge 3. At normal incomingbeam incidence on the surface of wedge 3, refraction angles of ordinary ψo andextraordinary ψe beams could be written as:
(8)
where ϕ – incident angle, which is equal to prism angle; no and ne – refractive indicesof ordinary and extraordinary beams, respectively; n – refractive index of a surroundingmedium.
Transverse displacement between beams ρ is assigned by the distance betweenwedges h and depends on wedge angle and birefringence of the wedge. Fromthe geometry of Fig. 1 one gets:
(9)
As one can see, ρ is linearly dependent only on h (parameters ϕ, ψo, ψe are constantfor specific scheme realization). So, for transverse displacement determination it isnecessary to know the dependence ρ = f (h) = ah.
In the scheme of Fig. 2, transverse displacement ρ is accompanied by longitudinalone, ρ | |, determined from the equation:
(10)
Fig. 2. Beam paths in interferometer.
ψosinno
n----------- ϕsin=
ψesinne
n---------- ϕsin=
ρ h ψotan ψetan–⎝ ⎠⎛ ⎞ ϕcos ah= =
ρ | |1ψocos
------------------- 1ψecos
------------------–⎝ ⎠⎜ ⎟⎛ ⎞
ne ψotan ψetan–( ) ϕsin– h bh= =

464 M.P. GORSKY, P.P. MAKSIMYAK, A.P. MAKSIMYAK
Longitudinal displacement between the beams in an interferometer causesmodulation of the field intensity, whose dependence, while changing the distancebetween the wedges from zero to a defined value, is represented in Fig. 3. Aslongitudinal displacement between beams is linearly bound with transverse one, it isconvenient to calibrate transverse displacement with the extreme magnitudes oftotal field intensity for longitudinal displacements (Fig. 3). The distance betweenthe extrema (maximum and minimum) amounts to λ /2. Such a calibration could beprovided in case of substantial scale excess of longitudinal field modulation overtransverse modulation scale. So, even for irregular changes of the distance betweenwedges (Fig. 3), the magnitude of transverse displacement is known by extrema ofthe total field intensity at the output of an interferometer. In our experiment,the distance between neighbouring extrema corresponded to transverse displacementby 3.36 μm.
4. ExperimentFor the least-squares method implementation, it is necessary to know function p (d ).The analytic function p (d ) is not known. That is why in order to find this functionwe have investigated the images of cement particle samples. The samples consisted of
Fig. 3. Intensity changes measured vs. longitudinaldisplacements of interferometer wedges.
Fig. 4. Microscopic images of cement particles.

Optical correlation technique for cement particle size measurements 465
dry cement particles uniformly distributed on a glass plate surface. These samples werelater used for measurements in transversal shearing interferometer.
An example of microscopic images of cement particles is shown in Fig. 4. In orderto find the analytical view of function p (d ) for cement, we have analyzed microscopicsample images. Calculated from images the quantities of cement particles, incorresponding size interval are best approximated by Rayleigh distribution (Fig. 5):
(11)
where σ – the most probable magnitude of particle diameter.For measurement purposes we need to obtain images of cement particles. We use
an optical scheme shown in Fig. 6. The beam from laser 1, through inverse telescopicsystem 2, illuminates sample 3. Images of cement particles 3, through polarizationinterferometer 4, using a microobjective 5, are projected on a photodetector 6. Signalfrom a photodetector is recorded by computer 7.
Measurement precision was controlled each time by a microscope. Measurementswere performed for samples with high and low concentration of cement particles.Typical experimental dependences of intensity obtained from measurement usinginterferometer are shown in Fig. 7.
pr d σ,( ) d
σ 2------------ d 2
2σ 2----------------–
⎝ ⎠⎜ ⎟⎛ ⎞
exp=
Fig. 5. Calculated dependence of the quantitiesof cement particles vs. size (bar graph) andRayleigh distribution approximation (line).
Fig. 6. Experimental optical scheme: 1 – laser, 2 – inverse telescopic system with diaphragm, 3 – sample,4 – polarization interferometer, 5 – microobjective, 6 – photodetector, 7 – computer.

466 M.P. GORSKY, P.P. MAKSIMYAK, A.P. MAKSIMYAK
Finding the extreme magnitudes of the distribution function parameters wasbased on condition of the minimum mean square deviation of theoretical magnitudesof the transversal coherence function from the observed ones (Fig. 8). For opticalscheme defect correction we made some control measurements on interferometerwithout a sample. In ideal case, the coherence function value Γ⊥ for interferometer hasto be equal to 1, independently of the transversal displacement. But optical schemedefects cause interferometer noise, which we use for normalization of the obtainedexperimental magnitudes of the coherence function.
Original experimental data processing provides the particle size distributionmeasurement with error less than 10% for each measurement in comparison withmicroscopical results.
Each experimental measurement provides information about distribution ofparticles, which are found at the observation plane. That is why, in order to receivethe data on complete cement particle size distribution on a sample, we mademeasurements in different parts of the sample. The analysis of microscopical cementsample images shows that in different parts of the sample, the most probable particle
a b
Fig. 7. Experimental dependence of intensity on longitudinal displacement of wedges for high (a) andlow (b) concentration of particles.
Fig. 8. Experimentally obtained magnitudes of coherence function (dots) and theoretical graph followingthe least-squares method (line), for samples with large (a) and small (b) concentration of particles.
a b
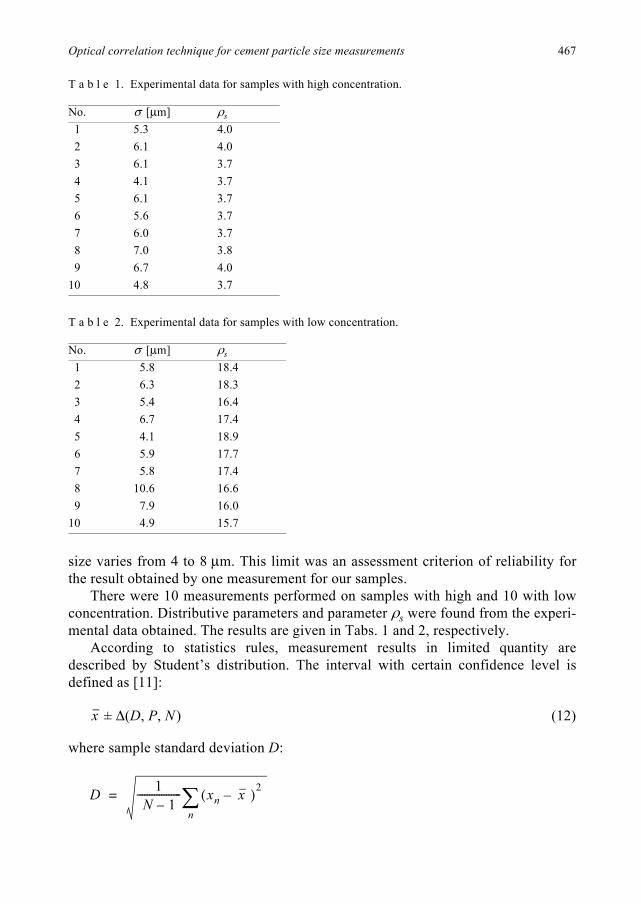
Optical correlation technique for cement particle size measurements 467
size varies from 4 to 8 μm. This limit was an assessment criterion of reliability forthe result obtained by one measurement for our samples.
There were 10 measurements performed on samples with high and 10 with lowconcentration. Distributive parameters and parameter ρs were found from the experi-mental data obtained. The results are given in Tabs. 1 and 2, respectively.
According to statistics rules, measurement results in limited quantity aredescribed by Student’s distribution. The interval with certain confidence level isdefined as [11]:
± Δ(D, P, N ) (12)
where sample standard deviation D:
T a b l e 1. Experimental data for samples with high concentration.
T a b l e 2. Experimental data for samples with low concentration.
No. σ [μm] ρs 1 5.3 4.02 6.1 4.03 6.1 3.74 4.1 3.75 6.1 3.76 5.6 3.77 6.0 3.78 7.0 3.89 6.7 4.0
10 4.8 3.7
No. σ [μm] ρs 1 5.8 18.42 6.3 18.33 5.4 16.44 6.7 17.45 4.1 18.96 5.9 17.77 5.8 17.48 10.6 16.69 7.9 16.0
10 4.9 15.7
x
D 1N 1–
------------------ xn x –( )2
n∑=

468 M.P. GORSKY, P.P. MAKSIMYAK, A.P. MAKSIMYAK
average value :
and P – confidence level, N – number of measurements, xn – result of the n-thmeasurement. For P = 0.95 and N = 10, the spread in the values is defined as:
Δ (D, 0.95, 10) = 2.262 D (13)
Processing of obtained results gives us such confidence intervals with confidencelevel P = 0.95: for samples with high concentration σ = 3.9–7.7 μm, and for sampleswith low concentration σ = 3.7–9.0 μm.
5. Conclusions
As can be seen from experimental results and calculations, confidence intervals forsamples with high concentration of particles are found in reliable limits. For sampleswith low concentration confidence intervals slightly overstep the reliable limits. So,upon further decreasing of cement particles concentration, reliable determination ofdistribution for samples with low concentration is complicated. Spread in calculatedvalues of distributive parameter σ arises from irregularity of particle distribution indifferent parts of the sample. Average experimental values of the most probablecement particle size σ = 5.6 μm for samples with high and σ = 6.3 μm for sampleswith low concentration of particles correspond to values obtained for this cement bysieve method.
Experimental technique for determination of particle size distribution functionused by us weakly depends on spread in refractive index values of separate particles,contary to the laser diffraction method. Calculation technique developed by usdecreases calculated coherent function dependence on interferometer noise, emissionsource intensity fluctuations and different cement particles overlapping image effect.The technique described allows the cement particle size distribution function to befound fast and with high reliability.
References[1] GORSKIY V.F., Plugging Materials and Solutions – Handbook, Oblpoligrafvydav, Chernivtsi, 2006,
p. 524 (in Ukrainian).[2] LEE F.M., The Chemistry of Cement and Concrete, 3rd Ed., Chemical Publishing Company, 1971.[3] RAMACHANDRAN V.S., BEAUDOIN J.J., Handbook of Analytical Techniques in Concrete Science and
Technology, National Research Council of Canada, Ottawa, Canada, 2001.[4] BULATOV A.I., DANYUSHEVSKIY V.S., Plugging Materials Reference Manual, Nadra, Moscow, 1987,
p. 280 (in Russian).
x
x 1N
--------- xnn∑=
Optical correlation technique for cement particle size measurements 469
[5] FERRARIS C.F., HACKLEY V.A., AVILES A.I., Measurement of particle size distribution in portlandcement powder: Analysis of ASTM round robin studies, Journal of Cement, Concrete andAggregates (CCA) 26 (2), 2004, p. CCA11920.
[6] ANGELSKY O.V., MAKSIMYAK P.P., Optical correlation method for studying disperse media, AppliedOptics 32 (30), 1993, pp. 6137–6141.
[7] MAKSIMYAK P.P., ANGELSKY O.V., An optical correlation method for measuring particle size andconcentration, Proceedings of IC Mechatronics 2000, Warsaw, Poland, pp. 466–468.
[8] ISHIMARU A., Wave Propagation and Scattering in Random Media, Vol. 1, 2, Academic Press,New York, 1978.
[9] BORN M., WOLF E., Principles of Optics, New York, Cambridge University Press, 1999.[10] GORSKY M.P., MAKSIMYAK P.P., MAKSIMYAK A.P., Studies of light backscattering at concrete during
its hydration, Ukrainian Journal of Physical Optics 10 (3), 2009, pp. 134–149.[11] KORN G.A., KORN T.M., Mathematical Handbook for Scientists and Engineers, McGraw-Hill, New
York, 1987.
Received July 10, 2009in revised form December 21, 2009

Optica Applicata, Vol. XL, No. 2, 2010
Investigation and analysis of time response in Geiger mode avalanche photodiode
M. DEHGHAN1, V. AHMADI 2*, E. DARABI 3
1Department of Electrical Engineering Islamic Azad University, Science and Research Branch, Tehran, Iran
2Department of Electrical Engineering, Tarbiat Modares University, Tehran, Iran
3Department of Plasma Physic Research Center, Islamic Azad University, Science and Research Branch, Tehran, Iran
*Corresponding author: [email protected]
Statistical properties of the impulse response of avalanche photodiode (APDs) are determined.The model is based on recurrence equations. These equations are solved numerically to calculatethe mean current impulse response and standard deviation as a function of time. In this paper, weinvestigate the effects of parameters such as ionization coefficient-multiplication thicknessproduct (αw), dead space, excess noise factor, mole fraction, temperature on the mean currentimpulse response of APD in the Geiger mode.
Keywords: avalanche photodiode, Geiger mode, time response.
1. IntroductionAvalanche photodiodes (APDs) are known as detectors in long-haul fiber opticsystems and Geiger mode applications due to their advantage of high internal gaingenerated by avalanche multiplication [1, 2]. According to the local-field avalanchetheory, both the multiplication noise and the gain-bandwidth product of APDs aredetermined by the ratio of the electron and hole ionization coefficients of the semicon-ductor in the multiplication region. Since this ratio is a material property, for a givenelectric field, efforts to improve the APD performance have focused on optimizingthe electric field profile and characterizing new materials. APDs can be operated inGeiger mode to count single photons. In this mode the APD is biased above itsbreakdown voltage. When the reverse bias voltage of a p-n junction is raised abovethe breakdown voltage, even a single carrier can trigger an avalanche process, leadingto a measurable current. The absorption of photon in the depletion layer initiatesthe avalanche breakdown, which can be easily detected. After breakdown, the currentis quenched and the diode is recharged to allow the detection of new photon. Silicon

472 M. DEHGHAN, V. AHMADI, E. DARABI
p-n junctions reverse biased above the breakdown voltage are usually called singlephoton avalanche diodes (SPADs).
Geiger mode APDs (GM-APDs) are excellent devices for detecting weak opticalsignals. Because of their excellent time resolution, they are often used for photontiming measurements. Recent advances in GM-APDs have made these devicespromising candidates for detectors in photon-counting receivers. Today, SPADs areprofitably used in various applications such as time-resolved spectroscopy, chemistry,physics, and biology [3], fluid velocimetry [4], laser ranging [5], optical time-domainreflectometry [6], single molecule detection [7, 8]. Several works have been done asregarding calculation and analysis of impulse response and quantum detectionefficiency of GM-APD [9, 10], but to the best of our knowledge the effects ofionization coefficient-multiplication thickness product (αw), temperature, molefraction, and dead space have not been demonstrated yet. In this paper, we studythese characteristics of GM-APD. This paper is organized as follows. In Section 2,a modified model to calculate the mean impulse response and standard deviation bysolving the recurrence equations is presented. In Section 3, the model is applied toSPADs and effects of αw, dead space, velocity and ionization coefficients on the meanimpulse response are discussed. Finally, conclusions are presented in Section 4.
2. Theory of model
We consider an APD with a multiplication region of width w. A parent photo-electronis injected into the multiplication region at x = 0 with a fixed velocity ve underthe effect of an electric field. After traveling a fixed dead space de, in the x-direction,the electron becomes capable of impact ionizing with an ionization coefficient α.Upon ionization, an electron–hole pair is generated, so that the parent electron isreplaced by two electrons and a hole. The hole travels in the (–x)-direction and becomescapable of impact ionizing with an impact ionization coefficient β only after travelinga dead space dh. This avalanche of ionization events continues until all carriers exitthe multiplication region. In the case of multiplication with a fixed dead space de,the probability density function (pdf) of carriers vs. time τ and distance ξ is given by
(1)
(2)
he ξ τ,( )0, ξ de≤
α α ξ de–( )– δ τ ξve
---------–⎝ ⎠⎛ ⎞ ,exp ξ de>
⎩⎪⎨⎪⎧
=
hh ξ τ,( )0, ξ dh≤
β β ξ dh–( )– δ τ ξvh
----------–⎝ ⎠⎛ ⎞ ,exp ξ dh>
⎩⎪⎨⎪⎧
=

Investigation and analysis of time response in Geiger mode avalanche photodiode 473
where de and dh are the electron and hole dead spaces, respectively, ve and vh arethe velocity of the electrons and holes, respectively; α and β are the ionization ratesfor electrons and holes, respectively, that are often modeled by standard equation[11, 12]
(3)
were A, Ec and m are the parameters taken from [13, 14]. With integration of thisdistribution function over the total time, the position dependent ionization pdf isgiven as
(4)
The recurrence equation for electron and hole mean current impulse response aregiven by [15]
(5)
(6)
where the first terms on the right-hand side of these equations represent the contributionsfrom the injected, primary currents . The probabilities that the injectedcarriers avoid ionizing before exiting the multiplication region before time t is given by
(7)
(8)
α E( ) β E( ), AEc
E-----------⎝ ⎠⎜ ⎟⎛ ⎞
m
–exp=
he h( ) ξ( ) he h( ) ξ τ,( )dτ0
∞
∫=
Ie z t,( )⟨ ⟩ Pe z t,( ) Ie z t,( )⟨ ⟩
2 Ie z ξ+ t ξve
---------–,⎝ ⎠⎛ ⎞⟨ ⟩ Ih z ξ+ t ξ
ve---------–,⎝ ⎠
⎛ ⎞⟨ ⟩+ he ξ( )dξ0
min w z– vet,( )
∫
+
+
=
Ih z t,( )⟨ ⟩ Ph z t,( ) Ih z t,( )⟨ ⟩
2 Ih z ξ+ t ξvh
---------–,⎝ ⎠⎛ ⎞⟨ ⟩ Ie z ξ+ t ξ
vh---------–,⎝ ⎠
⎛ ⎞⟨ ⟩+ hh ξ( )dξ0
min w z– vht,( )
∫
+
+
=
Ie h( ) z t,( )⟨ ⟩
Pe z t,( ) 1 he ξ( )dξ0
min w z– vet,( )
∫–=
Ph z t,( ) 1 hh ξ( )dξ0
min w z– vht,( )
∫–=
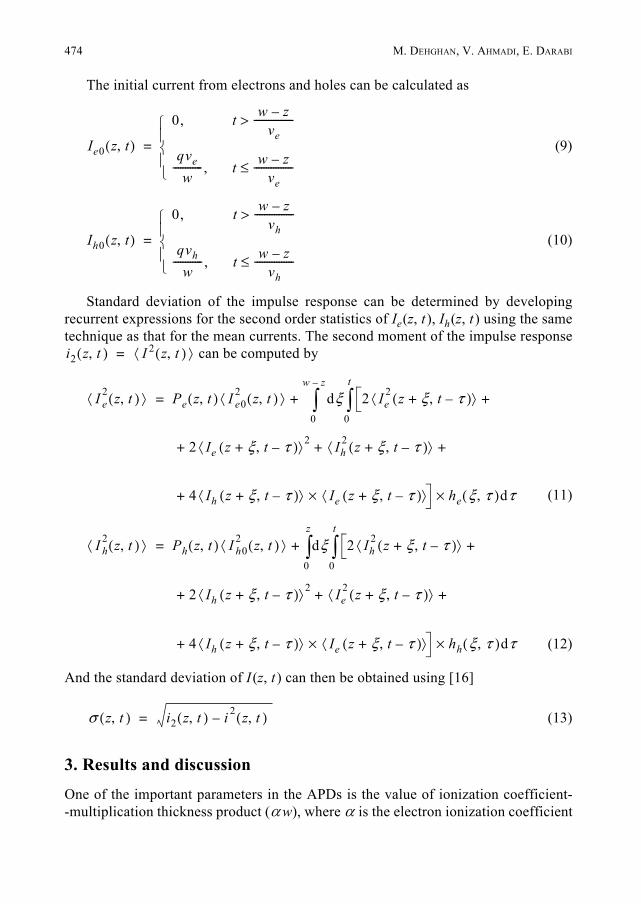
474 M. DEHGHAN, V. AHMADI, E. DARABI
The initial current from electrons and holes can be calculated as
(9)
(10)
Standard deviation of the impulse response can be determined by developingrecurrent expressions for the second order statistics of Ie(z, t ), Ih(z, t) using the sametechnique as that for the mean currents. The second moment of the impulse response
can be computed by
(11)
(12)
And the standard deviation of I (z, t ) can then be obtained using [16]
(13)
3. Results and discussion
One of the important parameters in the APDs is the value of ionization coefficient--multiplication thickness product (αw), where α is the electron ionization coefficient
Ie0 z t,( )
0, t w z–ve
---------------->
qve
w------------ , t w z–
ve----------------≤⎩
⎪⎨⎪⎧
=
Ih0 z t,( )
0, t w z–vh
---------------->
qvh
w------------ , t w z–
vh----------------≤⎩
⎪⎨⎪⎧
=
i2 z t,( ) I 2 z t,( )⟨ ⟩=
I e2 z t,( )⟨ ⟩ Pe z t,( ) I e0
2 z t,( )⟨ ⟩ dξ 2 Ie2 z ξ+ t τ–,( )⟨ ⟩
2 Ie z ξ+ t τ–,( )⟨ ⟩2 Ih2 z ξ+ t τ–,( )⟨ ⟩
4 Ih z ξ+ t τ–,( )⟨ ⟩ Ie z ξ+ t τ–,( )⟨ ⟩×
+
+ + +
+ he ξ τ,( )dτ×
0
t
∫0
w z–
∫+=
I h2 z t,( )⟨ ⟩ Ph z t,( ) I h0
2 z t,( )⟨ ⟩ dξ 2 Ih2 z ξ+ t τ–,( )⟨ ⟩
2 Ih z ξ+ t τ–,( )⟨ ⟩ 2 Ie2 z ξ+ t τ–,( )⟨ ⟩
4 Ih z ξ+ t τ–,( )⟨ ⟩ Ie z ξ+ t τ–,( )⟨ ⟩×
+
+ + +
+ hh ξ τ,( )dτ×
0
t
∫0
z
∫+=
σ z t,( ) i2 z t,( ) i 2 z t,( )–=

Investigation and analysis of time response in Geiger mode avalanche photodiode 475
and w is the thickness of multiplication region. With changing the value of αw,APD can operate in the Geiger or analogue mode. For smaller values of αw, the APDoperates in analogue mode. In Figure 1, the effect of αw on the mean current impulseresponse in Geiger mode, considering the dead space effect is shown which isnormalized to the injected primary current qve /w. According to this figure we findthat with an increase of αw, the value of impulse response increases with higher rate.
In Figure 2, the effect of dead space on impulse response is studied. In thisfigure, the impulse response without dead space effect (d /w = 0) and with dead space(d /w = 0.05 and 0.1) are shown. We find that the presence of dead space results ina reduction of the impulse response for all the times. According to this figure, the rateof response in APD decreases for higher values of dead space.
In Figure 3, the mean current impulse responses for different values of k (k = β /α )are shown. We find that the rate of response in APD increases with k.
Figure 4 shows the mean current impulse response for different ratios of carriervelocities. With an increase of the ratio vh /ve , the peak of current and therefore,the rate of response in APD are increased.
Fig. 1. Dimensionless mean current impulse response for different values of αw with vh = ve = 105 m/s,w = 100 nm, d /w = 0.1, k = 1.
Fig. 2. Dimensionless mean impulse response for different values of d /w and with αw = 2,vh = ve = 105 m/s, w = 100 nm, k = 1.

476 M. DEHGHAN, V. AHMADI, E. DARABI
Multiplication noise strongly depends on the carrier injection into the multiplicationregion. The noise becomes small when photogenerated electrons are selectivelyinjected into the multiplication region which has a large electron ionization rate α incomparison with that of holes. The photoabsorption in the multiplication region causescontamination by the hole injection which accompanies an increase of the multiplicationnoise. Transparency of the multiplication region is therefore essential to get low noiseperformance. In Figure 5, dimensionless standard deviation for different values of kis shown. According to this figure, the excess noise increases with k.
It is well known that the fluctuation of temperature changes the ionizationcoefficient parameters. With an increase of temperature, the value of ionizationcoefficient is decreased. In Figure 6, we compare the mean current impulse responsefor different values of temperature with w = 100 nm, d /w = 0.1, k = 1, vh /ve = 1.According to this figure, we find that with an increase of temperature the peak of meancurrent impulse response and the rate of response decrease. Meanwhile, we have betterGeiger mode characteristics at lower temperature.
In Figure 7, we study the effect of changing the mole fraction on the mean currentimpulse response. For each of the four materials (Al 0.6Ga0.4As, Al0.3Ga0.7As,
Fig. 3. Dimensionless mean impulse response for different values of k with αw = 2.5, vh = ve = 105 m/s,w = 100 nm, d /w = 0.1.
Fig. 4. Dimensionless mean impulse response for different values of vh /ve with αw = 2.5, w = 100 nm,d /w = 0.1, k = 1.

Investigation and analysis of time response in Geiger mode avalanche photodiode 477
Al0.15Ga 0.85As and GaAs) we are able to find a single set of parameters (A, Ec and m)that satisfy the exponential model presented in Eq. (3) independent of the multiplicationregion width. With a constant value of multiplication width, we have a larger value ofionization coefficient-multiplication thickness product (αw) with an increase of Al
Fig. 5. Dimensionless standard deviation for different values of k with αw = 2.5, w = 100 nm, d /w = 0.1,vh /ve = 1.
Fig. 6. Mean current impulse response for w = 100 nm with d /w = 0.1, k = 1, vh /ve = 1 at T = 200 K,250 K and 290 K.
Fig. 7. Effect of mole fraction variation on the mean current impulse response for w = 100 nm, d /w = 0.1,k = 1, vh /ve = 1.

478 M. DEHGHAN, V. AHMADI, E. DARABI
mole fraction and finally the peak of mean current impulse response increases andAPD has a good performance in the Geiger mode.
4. Conclusions
In this paper, using a model based on recurrence equations, we investigated the effectsof several parameters such as αw, dead space, excess noise factor, velocity onthe mean and standard deviation of impulse response time of avalanche photodiodein Geiger mode. We found that with an increase of αw, ratio vh /ve and k, the peak ofthe mean current impulse response in the Geiger mode is increased. We also studiedthe effect of temperature and mole fraction on the Geiger mode characteristics of APD,and we showed that for better operation, lower temperature and higher value of Almole fraction in Al xGa1–xAs-APD must be chosen.
References[1] CHEE HING TAN, DAVID J.P.R., PLIMMER S.A., REES G.J., TOZER R.C., GREY R., Low multiplication
noise thin Al0.6Ga0.4 As avalanche photodiodes, IEEE Transactions on Electron Devices 48 (7), 2001,pp. 1310–1317.
[2] CAMPBELL J.C., Recent advances in telecommunications avalanche photodiodes, Journal ofLightwave Technology 25 (1), 2007, pp. 109–121.
[3] LOUIS T.A., RIPAMONTI G., LACAITA A., Photoluminescence lifetime microscope spectrometer basedon time-correlated single-photon counting with an avalanche diode detector, Review of ScientificInstruments 61 (1), 1990, pp. 11–22.
[4] CUMMINS H.Z., PIKE E.R., Photon Correlation Spectroscopy and Velocimetry, Plenum, New York,1977.
[5] VEILLET C. [Ed.], 7th International Workshop on Laser Ranging Instrumentation, OCA/CERGA,Matera, Italy, October 2–8, 1989.
[6] BETHEA C.G., LEVINE B.F., COVA S., RIPAMONTI G., High-resolution and high-sensitivity optical--time-domain reflectometer, Optics Letters 13 (3), 1988, pp. 233–235.
[7] LI-QIANG LI, DAVIS L.M., Single photon avalanche diodes for single molecule detection, Review ofScientific Instruments 64(6), 1993, pp. 1524–1529.
[8] SPINELLI A., DAVIS L.M., DAUTET H., Single photon avalanche diode for high count rate applications,[In] Proc. 1995 OSA Ann. Mtg., Portland, OR, September 10–15, 1995.
[9] GROVES C., TAN C.H., DAVID J.P.R., REES G.J., HAYAT M.M., Exponential time response in analogueand Geiger mode avalanche photodiodes, IEEE Transactions on Electron Devices 52 (7), 2005,pp. 1527–1534.
[10] MAZZILLO M., PIAZZA A., CONDORELLI G., SANFILIPPO D., FALLICA G., BILLOTTA S., BELLUSO M.,BONANNO G., COSENTINO L., PAPPALARDO A., FINOCCHIARO P., Quantum detection efficiency in Geigermode avalanche photodiodes, IEEE Transactions on Nuclear Science 55 (6), 2008, pp. 3620–3625.
[11] MOLL J.L., MEYER N., Secondary multiplication in silicon, Solid-State Electronics 3 (2), 1961,pp. 155–158.
[12] SALEH M.A., HAYAT M.M., SALEH B.E.A., TEICH M.C., Dead-space based theory correctly predictsexcess noise factor for thin GaAs and AlGaAs avalanche photodiodes, IEEE Transactions onElectron Devices 47 (3), 2000, pp. 625–633.
[13] PLIMMER S.A., DAVID J.P.R., GREY R., REES G.J., Avalanche multiplication in AlxGa1–x As (x = 0to 0.60), IEEE Transactions on Electron Devices 47(5), 2000, pp. 1089–1097.
Investigation and analysis of time response in Geiger mode avalanche photodiode 479
[14] GROVES C., CHIA C.K., TOZER R.C., DAVID J.P.R., REES G.J., Avalanche noise characteristics ofsingle AlxGa1–x As (0.3 < x < 0.6)–GaAs heterojunction APDs, IEEE Journal of QuantumElectronics 41 (1), 2005, pp. 70–75.
[15] TAN C.H., HAMBLETON P.J., DAVID J.P.R., TOZER R.C., REES G.J., Calculation of APD impulseresponse using a space- and time-dependent ionization probability distribution function, Journalof Lightwave Technology 21 (1), 2003, pp. 155–159.
[16] HAYAT M.M., SALEH B.E.A., Statistical properties of the impulse response function of double-carriermultiplication avalanche photodiodes including the effect of dead space, Journal of LightwaveTechnology 10 (10), 1992, pp. 1415–1425.
Received April 21, 2009in revised form June 18, 2009

Optica Applicata, Vol. XL, No. 2, 2010
Higher-order space charge field effects on the self-deflection of bright screening spatial solitons in two-photon photorefractive crystals
QICHANG JIANG*, YANLI SU, XUANMANG JI
Department of Physics and Electronic Engineering, Yuncheng University, Yuncheng, 044000, China
*Corresponding authors: [email protected]
We investigate the effects of higher-order space charge field on the self-deflection of brightscreening spatial solitons due to two-photon photorefractive effects by a numerical methodunder steady-state conditions. The expression for an induced space charge electric fieldincluding higher-order space charge field terms is obtained. Numerical results indicate that brightscreening solitons undergo self-deflection process during propagation, and the solitons alwaysbend in the opposite direction of the c axis of the crystal. The self-deflection of bright screeningsolitons can experience considerable increase especially in the regime of high bias field strengths.Relevant examples are provided.
Keywords: non-linear optics, two-photon photorefractive effect, bright screening spatial solitons,self-deflection.
1. IntroductionDuring the last decade, the optical spatial solitons based on photorefractive effect haveattracted much interest, for these photorefractive spatial solitons can be formed at lowlight intensity and are potentially useful for all-optical switching, beam steering, andoptical interconnects. At present, three types of steady-state scalar solitons (screeningsolitons [1–3], photovoltaic solitons [4–7] and screening-photovoltaic solitons [8–10])have been predicted theoretically and found experimentally.
The diffusion process introduces an asymmetric tilt in the light-induced photo-refractive waveguide, which results in the self-deflection process of solitons [1].Self-deflection was firstly found in bright screening solitons in bias photorefractivecrystals [11, 12]. The self-deflection process was explained theoretically with first--order diffusion effect taken into account [13]. However, experimental results haveshown that self-deflection can exceed the deflection predicted by theory, especially inthe regime of high bias field strengths. To account for this discrepancy, SINGH et al. [14]investigated the effects that arise from the higher-order space charge field terms on

482 Q. JIANG, Y. SU, X. JI
the evolution of bright screening solitons. Recently, LIU and HAO [15] andZHANG et al. [16–18] investigated the higher-order space charge field effects onthe evolution of bright screening-photovoltaic soliton, bright photovoltaic soliton, darkscreening soliton, and dark photovoltaic soliton.
All of the above-mentioned solitons result from the single-photon photorefractiveeffect. Recently, CASTRO-CAMUS and MAGANA [19] provided a model of the two-photonphotorefractive effect. Later, screening solitons [20], photovoltaic solitons [21] andscreening-photovoltaic solitons [22] in two-photon photorefractive crystals havebeen predicted. On the other hand, incoherently coupled bright–bright, dark–dark,bright–dark, and grey–grey soliton pairs have been predicted [23–26] that result fromthe two-photon photorefractive effect. In this paper, we investigate the higher-orderspace charge field effects on the self-deflection of bright screening spatial solitons intwo-photon photorefractive crystals through an approach similar to that presented in[14–18]. The induced space charge field in which these higher-order terms areincluded is obtained, a dynamical evolution equation is derived in which the effectsthat arise from these higher-order terms are considered. Our results show that brightscreening solitons due to two-photon photorefractive effect possess a self-deflectionprocedure during propagation in the opposite direction of the crystal’s c axis onthe base of the first-order diffusion terms. Taking into account the higher-orderspace charge field, numerical results further indicate that the value of the spatial shiftthat is due to the first-order diffusion term alone is always smaller than that due toboth the first-order diffusion term and the higher-order space charge field termsacting together. This behavior is similar to that of bright screening solitons due tosingle-photon photorefractive effect.
2. Theoretical modelWe start with considering an optical beam that propagates in a biased photorefractivecrystal with the two-photon photorefractive effect along the z axis and is permitted todiffract only along the x direction. The crystal is proposed here to be SBN:60 with itsoptical c axis along the x coordinate and is illuminated by the gating beam. Moreover,let us assume that the optical beam is linearly polarized along the x direction. As usual,we express the optical field of the incident beam in terms of slowly varying envelope φ,i.e., E = φ (x, z)exp(ikz), where k = k0ne = (2π /λ0)ne, ne is the unperturbedextraordinary index of refraction, and λ0 is the free-space wavelength. Under theseconditions the optical beam satisfies the following envelope evolution equation:
(1)
where φz = ∂φ /∂z, φxx = ∂2φ /∂x2, r33 is the electro-optic coefficient, Esc = Escx isthe space charge field in the crystals. Following Ref. [20], the space charge field inEq. (1) can be obtained from the set of rate, current, and Poisson’s equations proposed
x
iφz1
2k---------- φxx
k0ne3r33Esc
2--------------------------------φ–+ 0=

Higher-order space charge field effects ... 483
by CASTRO-CAMUS and MAGANA [19] to describe the two-photon photorefractive effect.In the steady-state and under a strong bias field condition such that the photovoltaicfield can be neglected, or in a non-photovoltaic crystal, these equations are [19, 20]:
(2)
(3)
(4)
(5)
(6)
(7)
where N is the donor density, N+ is the ionized density, NA is the acceptor or trapdensity, and n is the density of the electrons in the condition band (CB); n1 is the densityof the electron in the intermediate state; n01 is the density of traps in the intermediatestate; s1 and s2 are cross section; β1 and β2 are the thermoionization probabilityconstants for the transitions of the value band (VB) to the allowed intermediatelevels (IL) and IL-CB, respectively. γ1, γ2 and γ3 are the recombination factors ofthe CB-VB, IL-VB, and CB-IL transitions, respectively; D is the diffusion coefficient;μ and e are the electron mobility and charge, respectively; ε0 and εr are the vacuumand relative dielectric constants, respectively; J is the current density; I1 is the intensityof the gating beam, which can be considered as a constant; I2 is the intensity ofthe soliton beam. According to Poynting’s theorem, I2 can be expressed in termsof the φ, that is, I2 = (ne /2η0)|φ |2 where η0 = (μ0 /ε0)1/2. One can neglect the term(n01 – n1) << N+ with respect to the other terms. In this case, from Eqs. (2) and (3)we have
(8)
The substitution of Eq. (8) into Eq. (2) yields
(9)
s1I1 β1+( ) N N +–( ) γ1n1N +– γ n N +– 0=
s1I1 β1+( ) N N +–( ) γ2n n01 n1–( ) γ1n1N +– s2 I2 β2+( )n1–+ + 0=
s2 I2 β2+( )n11e
------- ∂J∂x
---------- γ n N +– γ2n n01 n1–( )–+ 0=
ε0εr∂Esc
∂x---------------- e N + n– n1– NA–( )=
J eμ n Esc eD ∂n∂x
-----------+=
∂J∂x
---------- 0 or J const= =
n1γ N +n
s2 I2 β2+----------------------------=
ns1 I1 β1+( ) s2 I2 β2+( ) N N +–( )
γ N + s2 I2 β2 γ 1N++ +( )------------------------------------------------------------------------------------=

484 Q. JIANG, Y. SU, X. JI
Under the approximation n, n1 << N+, NA yields
(10)
In this case, from Eqs. (9) and (10) we have approximately [2]
(11)
According to Ref. [20], it can be assumed that the intensity of soliton beamattains asymptotically a constant value at infinity, that is, I2(x → ±∞, z) = I2∞. Inthese regions with uniform illumination, the space charge is also independent of x,namely, Esc (x → ±∞, z) = E0. If the spatial extent of the soliton beam is much less thanthe x-width W of the photorefractive medium, E0 is approximately given by ±V /W,where V is the applied bias voltage. From Eq. (11) the free-electron density n∞ atx → ±∞ can be given by
(12)
Equation (7) indicates that the current density J is constant everywhere andtherefore J = J∞. Thus from Eq. (6) we have
(13)
Substituting Eqs. (11) and (12) into (13), we find
(14)
where I2d = β2 /s2 is the dark irradiance intensity. It is similar to that given in [14].
N + NA 1ε0εr
eNA---------------
∂Esc
∂x----------------+
⎝ ⎠⎜ ⎟⎛ ⎞
=
ns1 I1 β1+( ) s2 I2 β2+( ) N NA–( )
γ NA s2 I2 β2 γ 1NA+ +( )------------------------------------------------------------------------------------ 1
1ε0εr
eNA---------------
∂Esc
∂x----------------+
-------------------------------------------------=
n∞s1 I1 β1+( ) s2 I2∞ β2+( ) N NA–( )
γ NA s2 I2∞ β2 γ 1NA+ +( )---------------------------------------------------------------------------------------=
eμ n∞ E0 eμ n Esc e D ∂n∂x
-----------+=
Esc E0
I2∞ I2d+( ) I2 I2dγ1NA
s2----------------+ +
⎝ ⎠⎜ ⎟⎛ ⎞
I2∞ I2dγ1NA
s2----------------+ +
⎝ ⎠⎜ ⎟⎛ ⎞
I2 I2d+( )
-------------------------------------------------------------------------------- 1ε0εr
eNA--------------
∂Esc
∂x--------------+
⎝ ⎠⎜ ⎟⎛ ⎞
Dγ1NA
μs2 I2 I2dγ1NA
s2----------------+ +
⎝ ⎠⎜ ⎟⎛ ⎞
I2 I2d+( )
------------------------------------------------------------------------------------∂I2
∂x-----------–
Dμ
--------ε0εr
eNA--------------
∂2Esc
∂x2------------------
+
+
=

Higher-order space charge field effects ... 485
Under strong bias conditions E0 will be large enough, and therefore the driftcomponent of the current in the medium will be dominant and moreover in typicalphotorefractive crystals the dimensionless quantity << 1. In this case, tothe first order, Esc is approximately given by
(15)
To study the effects arising from higher-order space charge field terms such as∂Esc /∂x and ∂2Esc /∂x2 in Eq. (14), we now use the first-order solution of Eq. (14),i.e., Eq. (15), and in turn the other terms are obtained in an iterative fashion. By doingso, the perturbative solution of the space charge field Esc reads as follows:
Esc = Esc0 + Eδ + Eδ 1 + Eδ 2 + Eδ 3 (16)
where:
(17a)
(17b)
(17c)
(17d)
It is important to note that Eq. (16) is valid as long as the perturbations Eδ and Eδ i(i = 1, 2, 3) are much smaller than the leading term of the space charge field Esc0.
ε0εreNA
---------------∂Esc∂x
----------------
Esc Esc0≈ E0
I2∞ I2d+( ) I2 I2dγ1NA
s2----------------+ +
⎝ ⎠⎜ ⎟⎛ ⎞
I2∞ I2dγ1NA
s2----------------+ +
⎝ ⎠⎜ ⎟⎛ ⎞
I2 I2d+( )
-------------------------------------------------------------------------------=
EδDγ1NA
μs2 I2 I2dγ1NA
s2----------------+ +
⎝ ⎠⎜ ⎟⎛ ⎞
I2 I2d+( )
------------------------------------------------------------------------------------∂I2
∂x-------------–=
Eδ 1ε0εr
eNA--------------
E 02 I2∞ I2d+( )2 I2 I2d
γ1NA
s2----------------+ +
⎝ ⎠⎜ ⎟⎛ ⎞ γ1NA
s2----------------
I2∞ I2dγ1NA
s2----------------+ +
⎝ ⎠⎜ ⎟⎛ ⎞2
I2 I2d+( )3
----------------------------------------------------------------------------------------------------------∂I2
∂x-------------–=
Eδ 22Dμ
------------ε0εr
eNA--------------
E 0 I2∞ I2d+( )γ1NA
s2----------------
I2∞ I2dγ1NA
s2----------------+ +
⎝ ⎠⎜ ⎟⎛ ⎞
I2 I2d+( )3
---------------------------------------------------------------------------------∂I2
∂x-------------⎝ ⎠⎜ ⎟⎛ ⎞
2
=
Eδ 3Dμ
--------ε0εr
eNA--------------
E 0 I2∞ I2d+( )γ1NA
s2----------------
I2∞ I2dγ1NA
s2----------------+ +
⎝ ⎠⎜ ⎟⎛ ⎞
I2 I2d+( )2
---------------------------------------------------------------------------------∂2I2
∂x2---------------–=
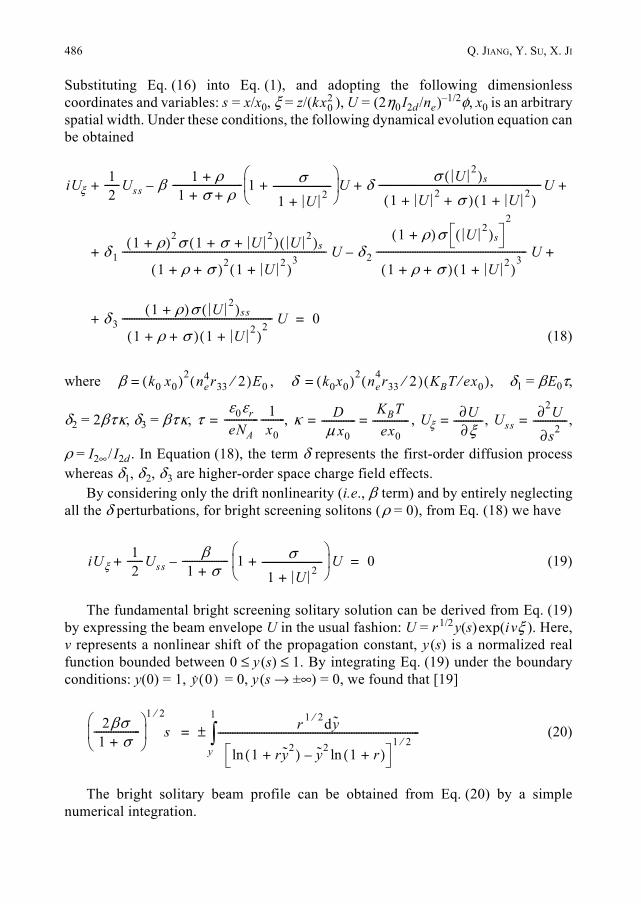
486 Q. JIANG, Y. SU, X. JI
Substituting Eq. (16) into Eq. (1), and adopting the following dimensionlesscoordinates and variables: s = x/x0, ξ = z/(k ), U = (2η0 I2d /ne)–1/2φ, x0 is an arbitraryspatial width. Under these conditions, the following dynamical evolution equation canbe obtained
(18)
where , , δ1 = βE0τ,
δ2 = 2βτκ, δ3 = βτκ, , , , ,
ρ = I2∞ /I2d . In Equation (18), the term δ represents the first-order diffusion processwhereas δ1, δ2, δ3 are higher-order space charge field effects.
By considering only the drift nonlinearity (i.e., β term) and by entirely neglectingall the δ perturbations, for bright screening solitons (ρ = 0), from Eq. (18) we have
(19)
The fundamental bright screening solitary solution can be derived from Eq. (19)by expressing the beam envelope U in the usual fashion: U = r1/2y(s)exp(ivξ ). Here,v represents a nonlinear shift of the propagation constant, y (s) is a normalized realfunction bounded between 0 ≤ y (s) ≤ 1. By integrating Eq. (19) under the boundaryconditions: y(0) = 1, = 0, y (s → ±∞) = 0, we found that [19]
(20)
The bright solitary beam profile can be obtained from Eq. (20) by a simplenumerical integration.
x02
iUξ12
------Uss β 1 ρ+1 σ ρ+ +
----------------------------- 1 σ1 U 2+
------------------------+⎝ ⎠⎜ ⎟⎛ ⎞
U– δ σ U 2( )s
1 U 2 σ+ +( ) 1 U 2+( )-------------------------------------------------------------------U
δ 11 ρ+( )2σ 1 σ U 2+ +( ) U 2( )s
1 ρ σ+ +( )2 1 U 2+( )3
------------------------------------------------------------------------------------ U δ 2
1 ρ+( )σ U 2( )s
2
1 ρ σ+ +( ) 1 U 2+( )3
-------------------------------------------------------------- U–
δ 31 ρ+( )σ U 2( )ss
1 ρ σ+ +( ) 1 U 2+( )2
-------------------------------------------------------------- U
+ + +
+ +
+ 0=
β k0 x0( )2 ne4r33 2⁄( )E0= δ k0x0( )2 ne
4r33 2⁄( ) KBT ex0⁄( )=
τε0εr
eNA-------------- 1
x0----------= κ D
μ x0--------------
KBTex0
---------------= = Uξ∂U∂ξ
------------= Uss∂2U
∂s2--------------=
iUξ12
-------Ussβ
1 σ+------------------- 1 σ
1 U 2+-------------------------+
⎝ ⎠⎜ ⎟⎛ ⎞
U–+ 0=
y· 0( )
2βσ1 σ+
-------------------⎝ ⎠⎜ ⎟⎛ ⎞1 2⁄
s r 1 2⁄ d y
1 ry2+( )ln y2 1 r+( )ln–1 2⁄
-----------------------------------------------------------------------------------y
1
∫±=

Higher-order space charge field effects ... 487
3. The self-deflection of bright screening solitons due to two-photon photorefractive effects
3.1. The self-deflection on base of the first-order diffusion termsWe will now investigate the first-order diffusion effects on the evolution of brightscreening solitons due to two-photon photorefractive effects. By assuming solitarywave solutions as input beam profiles, we solve Eq. (18) numerically ignoring allthe higher-order space charge field terms δ1, δ2, δ3 by using a finite-difference method.As an example, let us consider SBN:60 a crystal with following parameters [14]:γ33 = 237×10–12 m/V, NA = 4×1016 cm–3, εr = 880, λ0 = 0.5 μm, x0 = 25 μm, E0 == 1×10⁵ V/m, r = 10. We find that β = 34.5, δ = 0.35. By numerically solving Eq. (18),we obtain the intensity profile evolution of the bright screening in the two-photonphotorefractive crystal as shown in Fig. 1a. The evolution of the spatial shift on
the base of the first-order diffusion terms, denoted by Δs, which is defined asthe distance between s = 0 and the position of the beam centre at ξ, is shown in Fig. 1b.The results show that the bright screening solitons experience approximately adiabaticself-deflection in the opposite direction of the c axis of the crystal and the spatialshift moves on an approximately parabolic trajectory. Its behavior is similar to brightscreening solitons based on single-photon photorefractive effects [14].
3.2. The self-deflection on base of the higher-order space charge field
Now, we investigate the effects that arise from the higher-order terms δ1, δ2, δ3 onthe bright screening solitons. The parameters of the crystal being taken as above, wefind moreover that δ1 = 0.168, δ2 = 0.0035, δ3 = 0.0017. It is obvious that the termsδ2 and δ3 are much smaller than δ and δ1, so we neglect the effects of δ2 and δ3.Figure 2 compares the spatial shift due to δ alone to that obtained with δ and δ1 actingtogether at different strengths of applied electric field, i.e., E0 = 105 V/m,E0 = 2×10⁵ V/m, and E0 = 5×10⁵ V/m. The solid curves denote the dynamic evolutions
Fig. 1. Intensity profile evolution (a) and the corresponding evolution (b) of the spatial shift underthe influence of δ.
a b

488 Q. JIANG, Y. SU, X. JI
of spatial shift on base of the first-order diffusion term for various bias fields andthe dashed curves denote the dynamic evolutions of spatial shift in various bias fieldswhen δ and δ1 act together. It is quite clear from the figure that at low bias fieldsthe process is dominated by first-order diffusion effects whereas at high bias one needsto account for δ1 term, and the value of the spatial shift that is due to δ alone is alwayssmaller than that of δ and δ1 acting together. This behavior is similar to that of brightscreening solitons based on the single-photon photorefractive effects [14].
4. ConclusionsThe effects of higher-order space charge field terms on the self-deflection of brightscreening solitons for two-photon photorefractive model have been investigated bya numerical method. We have obtained an expression for the induced space chargefield in which higher-order space charge field terms are involved. Numerical resultsindicate that the higher-order space charge field terms result in a considerable increasein the self-deflection of bright screening solitons especially in the high bias fieldstrengths. That is, the value of the spatial shift that is due to both the first-orderdiffusion term and the higher-order space charge field terms acting together is alwayslarger than that due to the first-order diffusion term alone.
Acknowledgements – This work was supported by the Science and Technology Development Foundationof Higher Education of Shanxi Province, China (Grant No. 200611042).
References[1] SEGEV M., VALLEY G.C., CROSIGNANI B., DIPORTO P., YARIV A., Steady-state spatial screening solitons
in photorefractive materials with external applied field, Physical Review Letters 73(24), 1994,pp. 3211–3214.
[2] CHRISTODOULIDES D.N., CARVALHO M.I., Bright, dark and gray spatial soliton states in photorefractivemedia, Journal of the Optical Society of America B 12 (9),1995, pp. 1628–1633.
Fig. 2. Comparison of spatial shift obtained by considering the δ alone and the δ and δ1 together atdifferent applied electric fields.

Higher-order space charge field effects ... 489
[3] SHIH M.F., SEGEV M., VALLEY G.C., SALAMO G., CROSIGNANI B., DIPORTO P., Observation oftwo-dimensional steady-state photorefractive screening solitons, Electronics Letters 31 (10), 1995,pp. 826–827.
[4] VALLEY G.C., SEGEV M., CROSIGNANI B., YARIV A., FEJER M.M., BASHAW M.C., Dark and brightphotovoltaic spatial solitons, Physical Review A 50 (6), 1994, pp. R4457–R4460.
[5] TAYA M., BASHAW M.C., FEJER M.M., SEGEV M., VALLEY G.C., Observation of dark photovoltaicspatial solitons, Physical Review A 52 (4), 1995, pp. 3095–3100.
[6] SHE W.L, LEE K.K, LEE W.K., Observation of two-dimensional bright photovoltaic spatial solitons,Physical Review Letters 83(16), 1999, pp. 3182–3185.
[7] SHE W.L., XU C.C., GUO B., LEE W.K., Formation of photovoltaic bright spatial soliton inphotorefractive LiNbO3 crystal by a defocused laser beam induced by a background laser beam,Journal of the Optical Society of America B 23(10), 2006, pp. 2121–2126.
[8] LIU J.S., LU K.Q., Spatial solitaire wave in biased photovoltaic photorefractive crystals, ActaPhysica Sinica 47(9), 1998, pp. 1509–1514.
[9] LIU J.S., LU K.Q., Screening-photovoltaic spatial solitons in biased photovoltaic–photorefractivecrystals and their self-deflection, Journal of the Optical Society of America B 16 (4), 1999,pp. 550–555.
[10] FAZIO E., RENZI F., RINALDI R., BERTOLOTTI M., CHAUVET M., RAMADAN W., PETRIS A., VLAD V.I.,Screening-photovoltaic bright solitons in lithium niobate and associated single-mode waveguides,Applied Physics Letters 85(12), 2004, pp. 2193–2195.
[11] SHIH M.F., LEACH P., SEGEV M., GARRETT M.H., SALAMO G., VALLEY G.C., Two-dimensional steady--state photorefractive screening solitons, Optics Letters 21 (5), 1996, pp. 324–326.
[12] PETTER J., WEILNAU C., DENZ C., STEPKEN A., KAISER F., Self-bending of photorefractive solitons,Optics Communications 170 (4–6), 1999, pp. 291–297.
[13] CARVALHO M.I., SINGH S.R., CHRISTODOULIDES D.N., Self-deflection of steady-state bright spatialsolitons in biased photorefractive crystals, Optics Communications 120 (5–6), 1995, pp. 311–315.
[14] SINGH S.R., CARVALHO M.I., CHRISTODOULIDES D.N., Higher-order space charge field effects onthe evolution of spatial solitons in biased photorefractive crystals, Optics Communications130 (4–6), 1996, pp. 288–294.
[15] LIU J.S., HAO Z.H., Higher-order space-charge field effects on the self-deflection of bright screeningphotovoltaic spatial solitons, Journal of the Optical Society of America B 19 (3), 2002, pp. 513–521.
[16] ZHANG G.Y., LIU J.S., LIU S.X., ZHANG H.L., WANG C., The self-deflection of photovoltaic brightspatial solitons on the basis of higher-order space-charge field, Journal of Optics A: Pure andApplied Optics 8 (5), 2006, pp. 442–449.
[17] ZHANG G.Y., LIU J.S., LIU S.X., WANG C., ZHANG H.L., Self-deflection of dark screening spatialsolitons based on higher-order space charge field, Chinese Physics Letters 24(2), 2007,pp. 442–445.
[18] ZHANG G.Y., LIU J.S., ZHANG H.L., WANG C., LIU S.X., Higher-order space-charge field effects onthe self-deflection of photovoltaic dark spatial solitons, Optik 118 (9), 2007, pp. 440–444.
[19] CASTRO-CAMUS E., MAGANA L.F., Prediction of the physical response for the two-photonphotorefractive effect, Optics Letters 28(13), 2003, pp. 1129–1131.
[20] CHUNFENG HOU, YANBO PEI, ZHONGXIANG ZHOU, XIUDONG SUN, Spatial solitons in two-photonphotorefractive media, Physical Review A 71 (5), 2005, p. 053817.
[21] CHUNFENG HOU, YU ZHANG, YONGYUAN JIANG, YANBO PEI, Photovoltaic solitons in two-photonphotorefractive materials under open-circuit conditions, Optics Communications 273(2), 2007,pp. 544–548.
[22] ZHANG G.Y., LIU J.S., Screening-photovoltaic spatial solitons in biased two-photon photovoltaicphotorefractive crystals, Journal of the Optical Society of America B 26 (1), 2009, pp. 113–120.
[23] ZHANG Y., HOU C.F., SUN X.D., Incoherently coupled spatial soliton pairs in two-photonphotorefractive media, Acta Physica Sinica 56 (6), 2007, pp. 3261–3265.

490 Q. JIANG, Y. SU, X. JI
[24] LU K.Q., ZHAO W., YANG Y.L., YANG Y., ZHANG M., RUPP R.A., FALLY M., ZHANG Y., XU J.,One-dimensional incoherently coupled grey solitons in two-photon photorefractive media,Applied Physics B 87 (3), 2007, pp. 469–473.
[25] SRIVASTAVA S., KONAR S., Two-component coupled photovoltaic soliton pair in two-photonphotorefractive materials under open circuit conditions, Optics and Laser Technology 41 (4),2009, pp. 419–423.
[26] ZHANG Y., HOU C.F., WANG F., SUN X.D., Incoherently coupled grey–grey spatial soliton pairs dueto two-photon photorefractive media, Optik 119 (14), 2008, pp. 700–704.
Received July 4, 2009in revised form December 7, 2009
Optica Applicata, Vol. XL, No. 2, 2010
Extraordinary optical transmission by interference of diffracted wavelets
RAJ KUMAR
Central Scientific Instruments Organisation, Chandigarh-160030, India
Present affiliation: Institute for Plasma Research, Gandhinagar-382 428, India; e-mail: [email protected]
The phenomenon of extraordinary optical transmission is drawing much attention of researchersbecause of its potential applications in diverse emerging areas. In the present work, experimentalobservations on diffraction-Lloyd-mirror interferometer are reported, where two diffractedwavefronts are superimposed using Lloyd’s mirror. These observations provide directexperimental evidence in support of the idea that one of the main reasons of enhanced transmissionthrough subwavelength apertures is the coherent superposition of diffracted wavelets originatingfrom diffractive scattering at the apertures.
Keywords: extraordinary optical transmission, diffraction.
1. IntroductionThe discovery of extraordinary optical transmission [1] through subwavelengthapertures gave rise to an explosion of experimental and theoretical research in thisdirection. This research is motivated by both the brilliance and fundamental characterof this phenomenon and because of its tremendous potential applications in the newlyemerging areas such as subwavelength optics, opto-electronic devices, wavelength--tunable filters, optical modulators [2–5]. Although the photon tunneling effect haslong been well known, the attenuation of evanescent waves, involved in the photon--tunneling process, shows that this phenomenon is not the actual source of extraordinaryoptical transmission. Several other mechanisms such as excitation of delocalizedsurface plasmon Bloch modes, interference between incident and surface waves andlocalized coupling between adjacent structures, waveguide resonances, etc., have beenproposed as the possible origins of this phenomenon [2–10]. It is well known that toexcite surface plasmon polaritons a transverse-magnetic (TM) polarized light, i.e.,the magnetic field parallel to the slits, should be incident on the subwavelengthapertures [1–5, 11] because the surface plasmon polaritons have a TM wave-likecharacter. Recently it has been demonstrated that the extraordinary transmission isindependent of polarization of incident light [12] and can also be achieved with

492 R. KUMAR
transverse-electric (TE) polarized light. Besides it has been reported that enhancedtransmission can also be observed in marginally metallic Cr [13] and the non-metallictungsten hole arrays [14]. These observations show that extraordinary transmission isalso possible without exciting the surface plasmon polaritons. It is also argued thatthe quoted enhancement factor of 1000 for optical transmission through subwavelengthhole arrays is misleading, and that in fact placing a hole in an array leads toenhancement of its transmission coefficient by a factor of 7 at most at selectedwavelengths [15]. Those authors have suggested that enhanced transmission is due tointerference of light incident on the aperture and the composite diffracted evanescentwave. Recently, another model is reported that says that enhancement and suppressionin transmission is due to constructive and destructive interference of diffracted wavesgenerated by the subwavelength apertures, and classical as well as quantum mechanicaltheory of this process has been developed [16, 17].
In the present paper, based on the newly reported concept of superposition ofboundary diffraction waves using a Lloyd’s mirror [18, 19], we present experimentalobservations which support the above idea. We have used for the first time the physicalappealing boundary diffraction wave theory [20, 21] to explain the phenomenon ofextraordinary optical transmission. These investigations indicate that apart fromother possible processes, mutual interference of diffracted waves originating fromdiffractive scattering at the apertures is the main source for enhanced transmissionthrough subwavelength apertures.
2. Experimental detailsExperimental arrangement of the setup proposed is schematically shown in Fig. 1.A photograph of the experimental setup is shown in Fig. 2a, and Fig. 2b shows a closeview of the arrangement of knife-edge and Lloyd’s mirror used to generate interferencefringes due to superposition of diffracted waves. A transverse electric (vertical)polarized He-Ne laser L (Coherent Inc. Model No. 31-2140-000, 35 mW output at632.8 nm) is expanded and spatially filtered using spatial filtering (SF) assembly.A telescopic system of lenses L1 and L2 is used to generate the diffraction limited focusspot S. A knife-edge K (good quality razor blade) is positioned vertically in proximityof the focus such that a single diffraction fringe covers the field of view, as shown in
Fig. 1. Schematic experimental arrangement of diffraction Lloyd’s mirror interferometer.

Extraordinary optical transmission ... 493
Fig. 3. At this position knife-edge diffracts light from the Airy disk [22] andthereby diffracted light has maximum amplitude. In order to demonstrate that twodiffracted wavefronts could interfere, a Lloyd’s mirror M (20 mm×50 mm×1 mm,SiO2 protected front surface silver coated, reflectivity ~94%) is positioned nearthe knife-edge. Lloyd’s mirror and the knife-edge were mounted on precise translationstages for fine control. A λ /2 plate with its axis making an angle of 45° with the verticalwas used in the thin beam to change the state of polarization of initially verticallypolarized light into horizontally polarized light. Experimental results have beencaptured with a Canon S-50 Power Shot digital camera with 1024×768 pixel resolutionsettings.
3. Results and discussion
It is well known that in a conventional Lloyd’s mirror interferometer a geometricalwavefront in divided into two parts which are subsequently superimposed to generate
Knife-edge and
Fig. 2. Photograph of the experimental arrangement of diffraction Lloyd’s mirror interferometer (a) andclose view of the knife-edge and Lloyd’s mirror arrangement (b).
λ/2 plate
Spatial filtering
Knife-edge
Lloyd’s mirror
L1
L2
assembly
Lloyd’s mirror
Lase
r bea
m
a b
Fig. 3. A typical photograph of knife-edge diffractionpattern where single diffraction fringe covers the fieldof view.

494 R. KUMAR
the interference fringes. In our case the Lloyd’s mirror configuration is used ona diffracted wavefront (known as boundary diffraction wave), generated by diffractionof geometrical light at the knife-edge, to generate equi-spaced and straight interferencefringes analogous to those obtained with a conventional Lloyd’s mirror interferometer.
Formation of these fringes due to superposition of two diffracted wavefronts canbe explained with the physically appealing boundary diffraction wave theory [20, 21]which relates diffraction to the true cause of its origin, i.e., existence of the boundaryof diffracting aperture. According to this theory the diffracted field in the observationplane at point P is given by
U(P ) = U g(P ) + Ud(P ) (1)
where
(2)
and
(3)
where R is the distance from source to the point of observation P; s is the distancebetween point P and a typical point Q situated on the illuminated boundary Σ ofknife-edge K and r is the distance from source to point Q (Fig. 4). Here, d l isan infinitesimal element situated on Σ, n is a unit vector outward normal to the planeof diffracting aperture and j = . Here, Ug propagates according to the laws ofgeometrical optics and is known as the geometrical wave while Ud is generatedfrom every point of the illuminated boundary of the diffracting element and is calledthe boundary diffraction wave. The geometrical wave and the boundary diffractionwave are shown in Fig. 1 by solid and dotted lines, respectively. The intensitydistribution due to superposition of two boundary diffraction waves and a geometricalwave at the observation plane may be represented as:
I (P ) = (Ug + U d1 + Ud2 ) (Ug + Ud1 + Ud2)* (4)
U g P( )AR
--------- jkR( )exp when P is in the direct beam
0 when P is in geometrical shadow⎩⎪⎨⎪⎧
=
U d P( ) A4π
-----------jk r s+( )exp
rs----------------------------------------- n s,( )cos
1 s r,( )cos+------------------------------------- r dl,( )sin dl
Σ∫=
Fig. 4. Schematic representation of diffraction from a knife-edge.
1–

Extraordinary optical transmission ... 495
where Ud1 is the boundary diffraction wave starting from illuminated part ofthe knife-edge; Ud2 is the boundary diffraction wave starting from mirror imageof the knife-edge which works as a virtual source for this wave. It is known thatthe amplitude of boundary diffraction wave is maximum near the geometricallyilluminated to geometrically shadowed transition boundary where its value is approxi-mately equal to half of the incident light [20]. For subwavelength apertures the spacingbetween the edges is small and thus amplitude of interfering beams is maximum~Ug/2. Solving Eq. (4) and taking Ud1 = Ud2 = Ug/2 for the case of subwavelengthapertures, gives
(5)
where I0 represents intensity of the geometrical wave impinging on the aperture, φ isthe phase difference between the geometrical wave and the two boundary diffractionwaves, and ψ represents phase difference between the two boundary diffractionwaves reaching the observation point P. The fringes generated due to interference oftwo boundary diffraction waves are superimposed on the geometrical wave presentin observation plane as background light, as demonstrated in reference [19].
The fringe width of these fringes formed due to interference of two boundarydiffraction waves is given by
(6)
where λ is the wavelength of light used, D is the distance between the plane ofthe two-point sources (knife-edge and its virtual image) and the observation plane OP,and a is the distance between two-point sources. Equation (6) shows that the fringewidth β could become infinite when distance between the two-point sourcesapproaches zero. Experimentally, change in the fringe width was observed by changingthe distance between the knife-edge and Lloyd’s mirror, and two interferograms withdifferent fringe widths obtained using this system are shown in Fig. 5. These fringes
I P( ) I032
------- 2 ψ φcoscos 12
------- 2ψ( )cos+ +=
β λ Da
-------------∼
Fig. 5. Photographs of experimental results showing interferograms of different fringe widths obtainedby superposition of two boundary diffraction waves using a Lloyd’s mirror.
a b

496 R. KUMAR
are shown to reach an infinite fringe mode condition for the case of mirror-edgediffraction, where mirror-edge diffracts light and mirror surface folds it back [23, 24].This variation of fringe width with distance between the knife-edge and Lloyd’s mirrorconfirms that the illuminated part of the diffracting aperture acts as a real sourceof light wherefrom boundary diffraction wave originates. In order to see the effect ofpolarization of the incident beam on these fringes the polarization of the beam waschanged from vertical to horizontal one using a λ /2 plate, and interference fringesobtained with these polarization states are shown in Fig. 6 (with verticallypolarized – 6a and with horizontally polarized light – 6b). These photographs showthat formation of these fringes is independent of the state of polarization of incidentbeam and the intensity ratio for these fringes was also found to be the same, i.e.,I/I0 ~ 3.7. These observations on polarization effect on fringe formation are inagreement with the results reported in reference [12] on extraordinary transmissionof light through slit apertures.
It is known that one can achieve infinite fringe width condition only when twosources of light (knife-edge and its virtual image in our case) overlap each other orphysically speaking, when distance between them is of the order of subwavelength.Thus the infinite fringe width condition is easily satisfied for the case of subwavelengthapertures. As this is interference pattern of two waves originating from diffractivescattering at the apertures one would get a peak in the transmitted intensity when twointerfering boundary diffraction waves are in phase with each other (constructiveinterference) and a valley will be detected when these interfering beams are out ofphase (destructive interference). In the infinite fringe mode condition (bright field)all the three waves will travel along the same line and the same optical paths, i.e.,φ = ψ = 0 which means a is of the order of subwavelength. In this situation, itbecomes obvious from Eq. (5) that I = 4 I0, i.e., light transmitted through a singlesubwavelength slit is four times more intense than light incident on the slit.Experimental measurements in our setup give a ratio of I/I0 ~ 3.7. It may be notedthat the theoretically calculated value of intensity I/I0 = 4 is valid only for the case of
Fig. 6. Photographs of experimental results showing interferograms with different polarization statesof the incident laser beam; with vertical polarization (a) and with horizontal polarization (b).
a b

Extraordinary optical transmission ... 497
subwavelength apertures and the peak intensity will reduce with increase in slitwidth due to sharp decrease in amplitude of boundary diffraction wave away fromthe geometrically illuminated to geometrically shadowed transition boundary. Herewe have considered a single diffraction only but, actually, the process of multiplediffractions in the slit (as explained by KELLER [25]) will take place, which couldfurther increase the intensity of the transmitted beam. Due to subwavelength nature ofthe apertures, for the macroscopic point of view, the diffraction originates fromthe aperture as a whole entity and thus the transmitted light can be termed as originatingfrom the process of diffractive scattering from the aperture.
In the case of a slit or hole arrays the transmission is determined by coherentaddition of fields from all the diffracting apertures. The dependence of the fringewidth on the ratio λ /a shows that infinite fringe mode condition will be obtained atdifferent values of wavelengths for different slit widths. The infinite fringe modemaximum occurs when the interfering beams starting from edges of the apertures arein phase, i.e., path difference between them is a multiple of the wavelength of incidentlight. For an array of, say, N slits, each slit having width a and period d, there will betotal N waves of intensity given by Eq. (5) produced by these N independent slits. Forsuch a system of slits KUKHLEVSKY [16] has demonstrated that in the transmittedspectrum intensity peaks will be observed at wavelengths that satisfy the conditionλn = d /n, where n = 1, 2, 3, etc., which is applicable for the present case also.The dependence on wavelength of the transmitted intensity for such a system ispresented in Fig. 1 of reference [16]. Likewise, if the slit width is varied the wavelengthcorresponding to peak value will also be changed due to the condition of constructiveinterference of light waves. Further it may be noted that in the case of subwavelengthslits the phases of the boundary diffracted waves from the apertures have nearlythe same phase and thus adds constructively resulting an enhancement in the peakvalue of transmitted light that depends on the phases and amplitudes of the interferingbeams where intensity scales as the number of light sources squared, i.e., IN ~ N2 I1(I1 is the intensity from a single slit) regardless of periodicity, which is a requirementfor enhancement using equivalent circuit theory [26] and excitation of surfaceplasmons [1–5]. It may be noted that for large N experimental results may differfrom the theoretical dependence of peak intensity as N2 I1. In addition to the processof interference of diffracted wavelets transmitted intensity can further be enhanceddue to additional energy that could also be channeled through the slit by excitation ofsurface polaritons at periodic structures for resonant condition.
4. Conclusions
The phenomenon of extraordinary transmission through subwavelength apertures hasbeen discussed in the light of experimental observations on the diffraction Lloyd’smirror interferometer and is explained using the boundary diffraction wave theory. Ithas been shown that for the case of subwavelength apertures our observations strongly

498 R. KUMAR
support the recently reported model of far-field multiple-beam interference [16, 17],which requires that in the case of subwavelength apertures the mutual constructiveinterference of these diffracted waves, originating from diffractive scattering atthe apertures, is the main source for enhanced transmission.
Acknowledgements – The author thanks Dr. Sushil Kumar Kaura for helpful discussions andMr. D.P. Chhachhia for help in performing the experiments at Central Scientific Instruments Organisation,Chandigarh (India).
References[1] EBBESEN T.W., LEZEC H.J., GHAEMI H.F., THIO T., WOLFF P.A., Extraordinary optical transmission
through sub-wavelength hole arrays, Nature 391, 1998, pp. 667–669.[2] BARNES W.L., DEREUX A., EBBESEN T.W., Surface plasmon subwavelength optics, Nature 424,
2003, pp. 824–830.[3] ENGHETA N., Circuits with light at nanoscales: Optical nanocircuits inspired by metamaterials,
Science 317 (5845), 2007, pp. 1698–1702.[4] GENET C., EBBESEN T.W., Light in tiny holes, Nature 445, 2007, pp. 39–46.[5] GARCÍA DE ABAJO F.J., Light scattering by particle and hole arrays, Reviews of Modern
Physics 79 (4), 2007, pp. 1267–1290.[6] POPOV E., NEVIÈRE M., ENOCH S., REINISCH R., Theory of light transmission through subwavelength
periodic hole arrays, Physical Review B 62 (23), 2000, pp. 16100–16108.[7] GARCÍA-VIDAL F.J., LEZEC H.J., EBBESEN T.W., MARTÍN-MORENO L., Multiple paths to enhance
optical transmission through a single subwavelength slit, Physical Review Letters 90(21), 2003,p. 213901.
[8] LIU H., LALANNE P., Microscopic theory of the extraordinary optical transmission, Nature 452,2008, pp. 728–731.
[9] PACIFICI D., LEZEC H.J., ATWATER H.A., WEINER J., Quantitative determination of opticaltransmission through subwavelength slit arrays in Ag films: Role of surface wave interferenceand local coupling between adjacent slits, Physical Review B 77(11), 2008, p. 115411.
[10] PACIFICI D., LEZEC H.J., SWEATLOCK L.A., WALTERS R.J., ATWATER H.A., Universal opticaltransmission features in periodic and quasiperiodic hole arrays, Optics Express 16(12), 2008,pp. 9222–9238.
[11] PORTO J.A., GARCÍA-VIDAL F.J., PENDRY J.B., Transmission resonances on metallic gratings withvery narrow slits, Physical Review Letters 83 (14), 1999, pp. 2845–2848.
[12] LU Y., CHO M.H., LEE Y.P., RHEE J.Y., Polarization-independent extraordinary opticaltransmission in one-dimensional metallic gratings with broad slits, Applied Physics Letters 93 (6),2008, p. 061102.
[13] THIO T., GHAEMI H.F., LEZEC H.J., WOLFF P.A., EBBESEN T.W., Surface-plasmon-enhancedtransmission through hole arrays in Cr films, Journal of the Optical Society of America B 16(10),1999, pp. 1743–1748.
[14] SARRAZIN M., VIGNERON J.-P., Optical properties of tungsten thin films perforated witha bidimensional array of subwavelength holes, Physical Review E 68(1), 2003, p. 016603.
[15] LEZEC H.J., THIO T., Diffracted evanescent wave model for enhanced and suppressed opticaltransmission through subwavelength hole arrays, Optics Express 12(16), 2004, pp. 3629–3651.
[16] KUKHLEVSKY S.V., Enhanced transmission of light through subwavelength nanoapertures byfar-field multiple-beam interference, Physical Review A 78 (2), 2008, p. 023826.
Extraordinary optical transmission ... 499
[17] KUKHLEVSKY S.V., Interference-induced enhancement of intensity and energy of a quantumoptical field by a subwavelength array of coherent light sources, Applied Physics B 93 (1), 2008,pp. 145–150.
[18] KUMAR R., KAURA S.K., CHHACHHIA D.P., AGGARWAL A.K., Direct visualization of Young’s boundarydiffraction wave, Optics Communications 276(1), 2007, pp. 54–57.
[19] KUMAR R., Structure of boundary diffraction wave revisited, Applied Physics B 90 (3–4), 2008,pp. 379–382.
[20] RUBINOWICZ A., Thomas Young and the theory of diffraction, Nature 180, 1957, pp. 160–162.[21] BORN M., WOLF E., Principles of Optics, 6th Edition, Pergamon Press, Oxford, 1993, pp. 449–453.[22] KUMAR R., KAURA S.K., CHHACHHIA D.P., MOHAN D., AGGARWAL A.K., Comparative study of
different schlieren diffracting elements, Pramana – Journal of Physics 70 (1), 2008, pp. 121–129.[23] KUMAR R., CHHACHHIA D.P., AGGARWAL A.K., Folding mirror schlieren diffraction interferometer,
Applied Optics 45 (26), 2006, pp. 6708–6711.[24] KUMAR R., Interference and diffraction effects in folding mirror schlieren diffraction interferometer,
Applied Physics B 93(2–3), 2008, pp. 415–420.[25] KELLER J.B., Diffraction by an aperture, Journal of Applied Physics 28(4), 1957, pp. 426–444.[26] MARQUÈS R., MESA F., JELINEK L., MEDINA F., Analytical theory of extraordinary transmission
through metallic diffraction screens perforated by small holes, Optics Express 17(7), 2009,pp. 5571–5579.
Received April 13, 2009in revised form August 21, 2009

Optica Applicata, Vol. XL, No. 2, 2010
A polynomial approach for reflection, transmission, and ellipsometric parameters by isotropic stratified media
TAHER EL-AGEZ1, SOFYAN TAYA1*, AHMED EL TAYYAN2
1Physics Department, Islamic University of Gaza, Gaza, Palestine
2Physics Department, Al Azhar University, Gaza, Palestine
*Corresponding author: [email protected]
A polynomial approach for the calculation of the reflectance, the transmittance, andthe ellipsometric parameters of a stratified isotropic planar structure is presented. We showthat these parameters can be written in a very simple and compact form using the so-calledelementary symmetric functions that are extensively used in the mathematical theory ofpolynomials. This approach is applied to quarter-wave Bragg reflectors. The numerical resultsreveal an exact match with the well known matrix formalism.
Keywords: ellipsometry, reflectance, transmittance, ellipsometric parameters, quarter-wave Braggreflectors, stratified planar structure.
1. IntroductionEllipsometry offers a precise technique for measuring thin film properties. Advancedellipsometers have shown an excellent sensitivity for monitoring the growth of opticalfilms during film deposition. DRUDE [1] was the first to build an ellipsometer evenbefore the word “ellipsometry” was coined in 1954. In the aftermath, the equipmentbuilt by Drude received little attention for decades until the 1970’s, ellipsometryreceived an increasing interest and a considerable number of papers on ellipsometryhave been published [2–5].
Ellipsometry measures the changes in the state of polarization of light uponreflection or transmission from a sample. It has a number of advantages over traditionalintensity reflection and transmission measurements. Some of these advantages lie inthat it measures an intensity ratio and therefore it is less affected by intensityinstabilities of the light source. It also measures at least two parameters at eachwavelength.
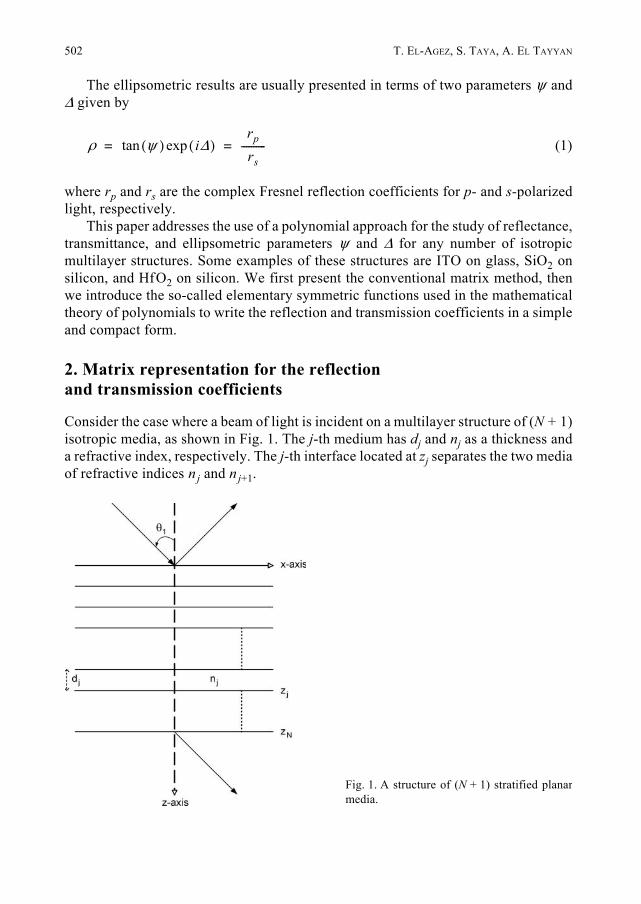
502 T. EL-AGEZ, S. TAYA, A. EL TAYYAN
The ellipsometric results are usually presented in terms of two parameters ψ andΔ given by
(1)
where rp and rs are the complex Fresnel reflection coefficients for p- and s-polarizedlight, respectively.
This paper addresses the use of a polynomial approach for the study of reflectance,transmittance, and ellipsometric parameters ψ and Δ for any number of isotropicmultilayer structures. Some examples of these structures are ITO on glass, SiO2 onsilicon, and HfO2 on silicon. We first present the conventional matrix method, thenwe introduce the so-called elementary symmetric functions used in the mathematicaltheory of polynomials to write the reflection and transmission coefficients in a simpleand compact form.
2. Matrix representation for the reflection and transmission coefficients
Consider the case where a beam of light is incident on a multilayer structure of (N + 1)isotropic media, as shown in Fig. 1. The j-th medium has dj and nj as a thickness anda refractive index, respectively. The j-th interface located at zj separates the two mediaof refractive indices nj and nj+1.
ρ ψ( ) iΔ( )exptanrp
rs----------= =
Fig. 1. A structure of (N + 1) stratified planarmedia.

A polynomial approach for reflection, transmission, and ellipsometric parameters ... 503
In general, the total field can be written as
(2)
where E +(z) and E –(z) denote the complex amplitudes of the forward and the backward--traveling plane waves at an arbitrary plane z. If we consider the fields at two differentplanes parallel to the interfaces, then the fields E1 and EN are related by a transformationmatrix [M ] according to the following equation [6]
(3)
For the last interface we have . So, the reflection and transmissioncoefficients of the whole system are given by
(4)
The Fresnel reflection and transmission coefficients rj, j+1 and tj, j+1 at the j, j + 1interface for s- and p-polarizations are given by [6]
(5)
(6)
(7)
(8)
The matrix [M ] can be expressed as the product of interface matrices andlayer matrices. The matrix of the j-th interface located at the plane zj between
E z( )E + z( )
E – z( )⎝ ⎠⎜ ⎟⎜ ⎟⎛ ⎞
=
E1+
E1–
⎝ ⎠⎜ ⎟⎜ ⎟⎛ ⎞ M11 M12
M21 M22⎝ ⎠⎜ ⎟⎜ ⎟⎛ ⎞ EN
+
EN–
⎝ ⎠⎜ ⎟⎜ ⎟⎛ ⎞
=
EN– 0=
rNE1
–
E1+
------------M21
M11---------------= =
tNEN
+
E1+
------------- 1M11
---------------= =⎭⎪⎪⎬⎪⎪⎫
rj j 1+,s nj θjcos nj 1+ θj 1+cos–
nj θjcos nj 1+ θj 1+cos+--------------------------------------------------------------=
tj j 1+,s 2nj θjcos
nj θjcos nj 1+ θj 1+cos+---------------------------------------------------------------=
rj j 1+,p nj 1+ θjcos nj θj 1+cos–
nj 1+ θjcos nj θj 1+cos+--------------------------------------------------------------=
tj j 1+,p 2nj θjcos
nj 1+ θjcos nj θj 1+cos+----------------------------------------------------------=
rjα[ ]

504 T. EL-AGEZ, S. TAYA, A. EL TAYYAN
two layers of refractive indices nj and nj+1 relates the fields on both sides ofthe interface, i.e.,
(9)
where α stands for p in p-polarization and for s in s-polarization, and ε is an infinitelysmall distance. The interface matrix is given by
(10)
The propagation of the fields across the same layer with refractive index nj betweentwo interfaces located at zj – 1 and zj = zj – 1 + dj is given by the matrix [φj], i.e.,
(11)
where the matrix [φj ] is given by
(12)
and ϕj = konjdj cos(θj ), with ko being the free space wave number.The M-matrix of such a system can be written as the product
(13)
3. Polynomial approach
The interface and layer matrices have the following commutation relation [7, 8]
(14)
The matrix is obtained by adding a phase term exp(±2 iϕj) to the element in the matrix in Eq. (10), i.e.,
(15)
Eα zj ε–( ) rjα Eα zj ε+( )=
rjα 1
tj j 1+,α
------------------ 1 rj j 1+,α
rj j 1+,α 1
=
Eα zj 1– ε+( ) φ j[ ] Eα zj ε–( )=
φ j
eiϕj 0
0 e iϕj–⎝ ⎠⎜ ⎟⎜ ⎟⎛ ⎞
=
MNα φ 1 r1
α φ 2 r2α … φN rN
α=
φj rjα rj
α ϕj( ) φj=
rjα ϕj( )[ ]
rj j 1+,α rj
α[ ]
rjα ϕj( ) 1
tj j 1+,α
------------------- 1 rj j 1+,α e2 iϕj
rj j 1+,α e 2 iϕj– 1
=
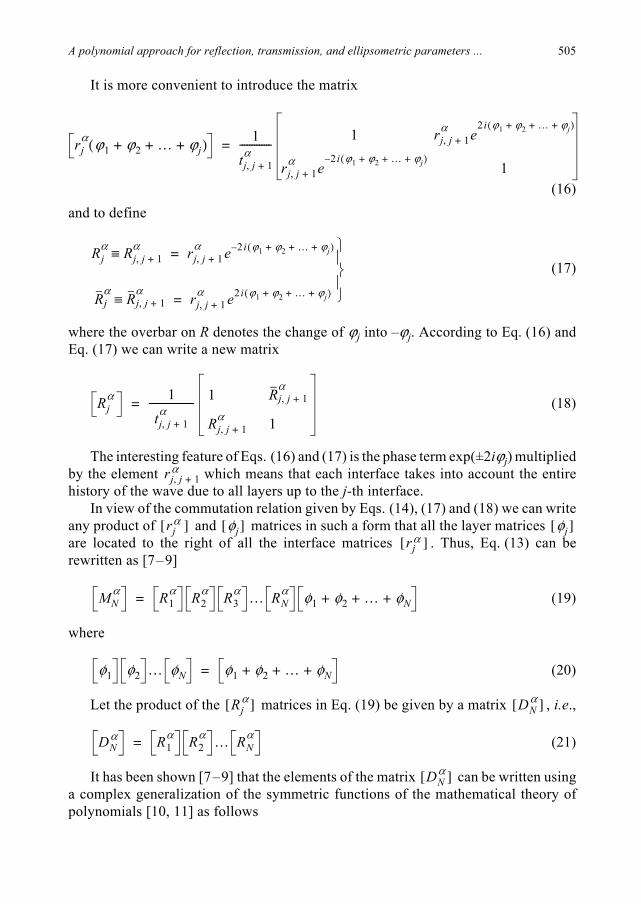
A polynomial approach for reflection, transmission, and ellipsometric parameters ... 505
It is more convenient to introduce the matrix
(16)and to define
(17)
where the overbar on R denotes the change of ϕj into –ϕj. According to Eq. (16) andEq. (17) we can write a new matrix
(18)
The interesting feature of Eqs. (16) and (17) is the phase term exp(±2iϕj) multipliedby the element which means that each interface takes into account the entirehistory of the wave due to all layers up to the j-th interface.
In view of the commutation relation given by Eqs. (14), (17) and (18) we can writeany product of and matrices in such a form that all the layer matrices are located to the right of all the interface matrices . Thus, Eq. (13) can berewritten as [7–9]
(19)
where
(20)
Let the product of the matrices in Eq. (19) be given by a matrix , i.e.,
(21)
It has been shown [7–9] that the elements of the matrix can be written usinga complex generalization of the symmetric functions of the mathematical theory ofpolynomials [10, 11] as follows
rjα ϕ1 ϕ2 … ϕj+ + +( ) 1
tj j 1+,α
------------- 1 rj j 1+,α e
2 i ϕ1 ϕ2 … ϕj+ + +( )
rj j 1+,α e
2 i ϕ1 ϕ2 … ϕj+ + +( )–1
=
Rjα Rj j 1+,
α≡ rj j 1+,α e 2 i ϕ1 ϕ2 … ϕj+ + +( )–=
Rjα
Rj j 1+,α
≡ rj j 1+,α e2 i ϕ1 ϕ2 … ϕj+ + +( )= ⎭
⎪⎬⎪⎫
Rjα 1
tj j 1+,α
------------------- 1 Rj j 1+,α
Rj j 1+,α 1
=
rj j 1+,α
rjα[ ] φj[ ] φj[ ]
rjα[ ]
MNα R1
α R2α R3
α … RNα φ1 φ2 … φN+ + +=
φ1 φ2 … φN φ1 φ2 … φN+ + +=
Rjα[ ] DN
α[ ]
DNα R1
α R2α … RN
α=
DNα[ ]

506 T. EL-AGEZ, S. TAYA, A. EL TAYYAN
(22)
where
(23a)
(23b)
(23c)
(23d)
(23e)
where P – terms in each sum. Equations (23) defines the elementary symmetricfunctions of the variables , , , ..., .
At this point, we emphasize the following:1. As mentioned above, the overbar in R denotes the change of ϕj into –ϕj ;2. SP is the sum of all possible products of P-terms Rj ;3. In each product term of Eqs. (23), the factors R and R appear alternatively with
the first factor being always R. This remark gives the meaning of , that is, R whenthe place of in the product is odd and R when the place of is even;
4. = 0 for P > N.Now, we can write the M-matrix, given by Eq. (19), as
(24)
DNα 1
tj j 1+,α
j 1=
N
∏------------------------------
S 2mα N,
⎝ ⎠⎛ ⎞
m 0≥∑ S 2m 1+
α N,⎝ ⎠⎛ ⎞
m 0≥∑
S 2m 1+α N,
⎝ ⎠⎛ ⎞
m 0≥∑ S 2m
α N,⎝ ⎠⎛ ⎞
m 0≥∑
=
S0α N, 1=
S1α N, Ri
α
i 1=
N
∑ R1α R2
α … RNα+ + += =
S2α N, Ri
α Rjα
1 i j N≤<≤∑ R1
α R2α
R1α R3
α… R1
α RNα
R2αR3
αR2αR4
α… R2
αRNα
… RN 1–α RN
α
+ + + +
+ + + + + +
= =
S3α N, Ri
α Rjα
Rkα
1 i j<≤ k N≤<∑ R1
α R2α
R3α R1
α R2α
R4α …
R1αR2
αRNα … RN 2–
α RN 1–α
RNα
+ + +
+ + +
= =
SPα N, Ri
α Rjα
Rkα R1
α…R
0wα
1 i j<≤ k … w N≤< < <∑=
R1α R2
α R3α RN
α
R0
R0
R0
SPα N,
MNα 1
tj j 1+,α
j 1=
N
∏------------------------------=
S 2mα N,
⎝ ⎠⎛ ⎞ e
i ϕ1 ϕ2 … ϕN+ + +( )
m 0≥∑ S 2m 1+
α N,⎝ ⎠⎛ ⎞ e
i– ϕ1 ϕ2 … ϕN+ + +( )
m 0≥∑
S 2m 1+α N,
⎝ ⎠⎛ ⎞ e
i ϕ1 ϕ2 … ϕN+ + +( )
m 0≥∑ S 2m
α N,⎝ ⎠⎛ ⎞ e
i– ϕ1 ϕ2 … ϕN+ + +( )
m 0≥∑

A polynomial approach for reflection, transmission, and ellipsometric parameters ... 507
Equation (24) enables us to write the overall reflection and transmissioncoefficients of the isotropic planar stratified structure in the general form
(25)
(26)
Moreover, the ellipsometric parameters ψ and Δ are then given by
(27)
4. Numerical applications and results
To demonstrate the validity of the polynomial approach we consider a planarmultilayer dielectric coating designed as a dielectric mirror. Dielectric mirrors (alsoknown as Bragg reflectors) have received an increasing interest due to their extremelylow losses at optical and infrared frequencies, as compared to ordinary metallicmirrors. A dielectric mirror usually consists of identical alternating layers of high andlow refractive indices, as shown in Fig. 2. The optical thicknesses are typically chosen
rNα M21
α
M11α
---------------
S 2m 1+α N,
m 0≥∑
S 2mα N,
⎝ ⎠⎛ ⎞
m 0≥∑
----------------------------------= =
tNα 1
M11α
----------------
tj j 1+,α
j 1=
N
∏
S 2mα N,
⎝ ⎠⎛ ⎞ e
i ϕ1 ϕ2 … ϕN+ + +( )
m 0≥∑
------------------------------------------------------------------------------= =
ψ( )eiΔtanrN
p
rNs
------------
S 2m 1+p N,
m 0≥∑ S 2m
s N,⎝ ⎠⎛ ⎞
m 0≥∑
S 2m 1+s N,
m 0≥∑ S 2m
p N,⎝ ⎠⎛ ⎞
m 0≥∑
-----------------------------------------------------------------= =
Fig. 2. Five-layer quarter-wave Bragg reflector(dielectric mirror).

508 T. EL-AGEZ, S. TAYA, A. EL TAYYAN
to be quarter-wavelength long at some center wavelength λo, that is, nH dH = nLdL == λo/4, where nH and nL are the indices of refraction of the high- and low-indexlayers, respectively, dH and dL are the thicknesses of the high- and low-index layers,respectively. The standard arrangement is to have an odd number of layers, withthe high index layer being the first and last layer [12].
The numerical calculation is done for a system of (2K + 1) stack of quarter--wavelength layers where K = 1, 2, and 3. The design wavelength of the Braggreflectors (filter) is centered at 550 nm. The reflectance and the ellipsometricparameters ψ and Δ were calculated using the well known matrix formulation [6] andthe model proposed. These calculations were performed for the systems underconsideration in the spectral range from 350 to 850 nm. The indices nH and nLcorrespond to layers of TiO2 and MgF2 on a glass substrate. The optical parameters ofthese layers were obtained from the handbook of optical constants of solids [13, 14].The results are depicted in Figs. 3 and 4. The calculated overall reflectance of3, 5, and 7 layer Bragg reflectors centered at λo = 550 nm are plotted in Fig. 3.The figure reveals an exact match between the polynomial and matrix formalisms.The ellipsometric parameters ψ and Δ are depicted in Fig. 4 for the same reflectorsmentioned above. A complete agreement between the two approaches is obvious.
5. ConclusionsIn this article, we have shown that the reflectance, transmittance, and the ellipsometricparameters can be calculated for any stack of layers using a simple method utilizingthe elementary symmetric functions. This approach exhibits an excellent agreement
Fig. 3. Calculated reflectance of 3, 5, 7 quarter-wavelength layer Bragg reflectors at normal incidence inthe spectral range of 350–850 nm for the polynomial approach (points) and the matrix formulation(solid lines).

A polynomial approach for reflection, transmission, and ellipsometric parameters ... 509
with the traditional matrix method for a system representing a dielectric mirror. Webelieve that this method is much easier than the traditional matrix multiplicationmethod.
References[1] DRUDE P., The Theory of Optics, Dover, New York, 1959.[2] ASPNES D.E., THEETEN J.B., Optical properties of the interface between Si and its thermally
grown oxide, Physical Review Letters 43(14), 1979, pp. 1046–1050.[3] IRENE E.A., Models for the oxidation of silicon, Critical Reviews in Solid State and Materials
Sciences 14 (2), 1988, pp. 175–223.[4] GONÇALVES D., IRENE E.A., Fundamentals and applications of spectroscopic ellipsometry, Quimica
Nova 25(5), 2002, pp. 794–800.
a
b
Fig. 4. Calculated ψ (a) and Δ (b) of 3, 5, 7 quarter-wavelength layer Bragg reflectors at a 70° angleof incidence in the spectral range of 350–850 nm for the polynomial approach (points) and the matrixformulation (solid lines).

510 T. EL-AGEZ, S. TAYA, A. EL TAYYAN
[5] POSTAVA K., MAZIEWSKI A., YAMAGUCHI T., OSSIKOVSKI R., VISNOVSKY S., PISTORA J., Null ellipsometerwith phase modulation, Optics Express 12(24), 2004, pp. 6040–6045.
[6] AZZAM R., BASHARA N., Ellipsometry and Polarized Light, North-Holland, Amsterdam, 1977.[7] VIGOUREUX J.M., Polynomial formulation of reflection and transmission by stratified structures,
Journal of the Optical Society of America A 8 (11), 1991, pp. 1697–1701.[8] GROSSEL PH., VIGOUREUX J.M., BAIDA F., Nonlocal approach to scattering in a one-dimensional
problem, Physical Review A 50 (5), 1994, pp. 3627–3637.[9] SHABAT M.M., TAYA S.A., A new matrix formulation for one-dimensional scattering in Dirac comb
(electromagnetic waves approach), Physica Scripta 67 (2), 2003, pp. 147–152.[10] WAERDEN B., Modern Algebra, Ungar, New York, 1966.[11] LANG S., Algebra, Addison-Wesley, MA, 1965.[12] ORFANIDIS S., Electromanetic Waves and Antennas, On-Line Textbook, Rutgers University;
http://www.ece.rutgers.edu/~orfanidi/ewa.[13] PALIK E., Handbook of Optical Constants of Solids, Vol. 2, Academic Press, San Diego, CA, 1991.[14] PALIK E., Handbook of Optical Constants of Solids, Vol. 1, Academic Press, San Diego, CA, 1998.
Received June 4, 2009in revised form October 24, 2009

Optica Applicata, Vol. XL, No. 2, 2010
Optimization of a FBG-based filtering module for a 40 Gb/s OSSB transmission system
MIGUEL V. DRUMMOND1*, ARTUR FERREIRA1, 2, TIAGO SILVEIRA1, 2, DANIEL FONSECA1, 2, ROGÉRIO N. NOGUEIRA1, 2, PAULO MONTEIRO1, 2
1Instituto de Telecomunicações, Campus Universitário de Santiago, 3810 Aveiro, Portugal
2Nokia Siemens Networks Portugal, 2720-093 Amadora, Portugal
*Corresponding author: [email protected]
We present the optimization of an optical filtering module (OFM) of a single-channel 40 Gb/stransmission system with optical single-sideband modulation and alternate mark inversionsignaling. Sideband suppression and dispersion compensation are simultaneously performed bythe fiber Bragg grating (FBG) optical filtering through amplitude and phase response, respectively.Different amounts of accumulated dispersion are compensated using an OFM based on opticalswitches and chirped FBGs with different accumulated dispersion. Linear transmission simulationsto assess the OFM effectiveness yield a Q-factor penalty variation lower than 1 dB relative toback-to-back considering a maximum accumulated dispersion of 20400 ps/nm. A transmissiondistance of 1040 km of nonlinear standard single mode fiber is achieved with a Q-factor higherthan 7.
Keywords: optical single sideband (OSSB), alternate mark inversion (AMI), dispersion compensation(DC), fiber Bragg gratings (FBG).
1. Introduction
The growing volume and bandwidth demand of data services is leading to an increasinginterest in ultradense wavelength division multiplexing (UDWDM) systems. The designof cost effective UDWDM systems greatly depends on the use of appropriate modulationformats. Such modulation formats enable high spectral efficiency, reduced signaldegradation caused by interchannel crosstalk, and enhanced tolerance to fiber groupvelocity dispersion (GVD) [1]. Advanced modulation formats such as differentialquadrature phase shift keying (DQPSK) [2], duobinary [1] or vestigial sideband [3]have been thoroughly investigated for use in such systems.
Optical single-sideband (OSSB) modulation has been proposed as a good candidatefor implementation in such systems [4]. The sideband suppression can be achievedusing one of two techniques: a phase-shift technique [4], or the use of a detuned optical
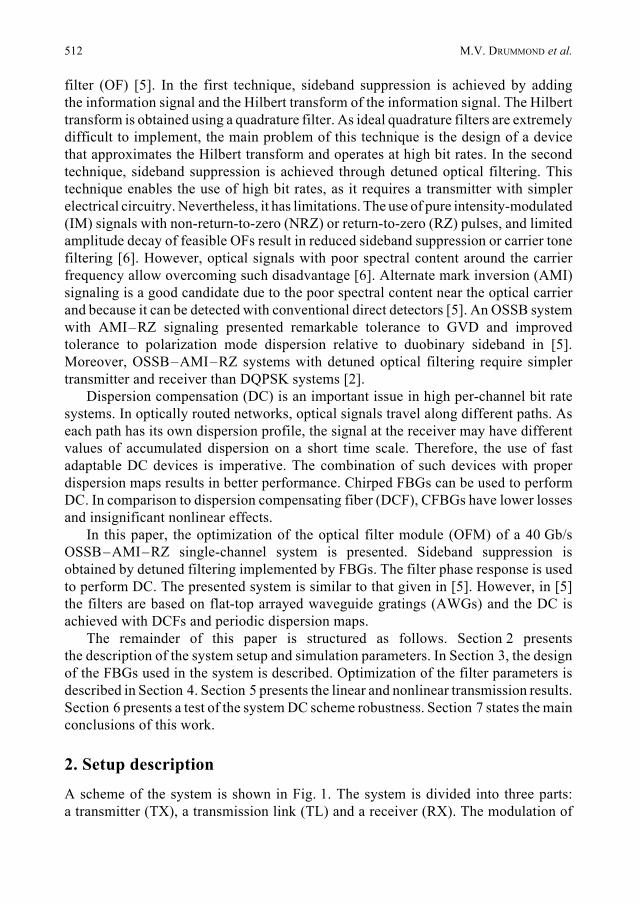
512 M.V. DRUMMOND et al.
filter (OF) [5]. In the first technique, sideband suppression is achieved by addingthe information signal and the Hilbert transform of the information signal. The Hilberttransform is obtained using a quadrature filter. As ideal quadrature filters are extremelydifficult to implement, the main problem of this technique is the design of a devicethat approximates the Hilbert transform and operates at high bit rates. In the secondtechnique, sideband suppression is achieved through detuned optical filtering. Thistechnique enables the use of high bit rates, as it requires a transmitter with simplerelectrical circuitry. Nevertheless, it has limitations. The use of pure intensity-modulated(IM) signals with non-return-to-zero (NRZ) or return-to-zero (RZ) pulses, and limitedamplitude decay of feasible OFs result in reduced sideband suppression or carrier tonefiltering [6]. However, optical signals with poor spectral content around the carrierfrequency allow overcoming such disadvantage [6]. Alternate mark inversion (AMI)signaling is a good candidate due to the poor spectral content near the optical carrierand because it can be detected with conventional direct detectors [5]. An OSSB systemwith AMI–RZ signaling presented remarkable tolerance to GVD and improvedtolerance to polarization mode dispersion relative to duobinary sideband in [5].Moreover, OSSB–AMI–RZ systems with detuned optical filtering require simplertransmitter and receiver than DQPSK systems [2].
Dispersion compensation (DC) is an important issue in high per-channel bit ratesystems. In optically routed networks, optical signals travel along different paths. Aseach path has its own dispersion profile, the signal at the receiver may have differentvalues of accumulated dispersion on a short time scale. Therefore, the use of fastadaptable DC devices is imperative. The combination of such devices with properdispersion maps results in better performance. Chirped FBGs can be used to performDC. In comparison to dispersion compensating fiber (DCF), CFBGs have lower lossesand insignificant nonlinear effects.
In this paper, the optimization of the optical filter module (OFM) of a 40 Gb/sOSSB–AMI–RZ single-channel system is presented. Sideband suppression isobtained by detuned filtering implemented by FBGs. The filter phase response is usedto perform DC. The presented system is similar to that given in [5]. However, in [5]the filters are based on flat-top arrayed waveguide gratings (AWGs) and the DC isachieved with DCFs and periodic dispersion maps.
The remainder of this paper is structured as follows. Section 2 presentsthe description of the system setup and simulation parameters. In Section 3, the designof the FBGs used in the system is described. Optimization of the filter parameters isdescribed in Section 4. Section 5 presents the linear and nonlinear transmission results.Section 6 presents a test of the system DC scheme robustness. Section 7 states the mainconclusions of this work.
2. Setup description
A scheme of the system is shown in Fig. 1. The system is divided into three parts:a transmitter (TX), a transmission link (TL) and a receiver (RX). The modulation of

Optimization of a FBG-based filtering module ... 513
the AMI–RZ optical signal is performed with a Mach–Zehnder modulator (MZM)and a delay interferometer, as described in [7]. The deBruijn sequences with 212
symbols are used to generate the data pattern. The frequency response of the TXelectrical circuitry is modeled by a third-order Bessel filter with a –3-dB cutofffrequency equal to the bitrate. The optical source is an ideal continuous wavelengthlaser with an average power of 10 dBm. The MZM has insertion losses of 6 dB.The optical PSK signal at the output of the MZM is amplified by an opticalamplifier (OA) that retrieves an average power of 18 dBm at its output. All the OAsof the system have a noise figure of 6 dB. A delay of 12.5 ps is used in the delayinterferometer (DI) in order to obtain RZ pulses with a duty-cycle of 50%. The OFMTX performs sideband suppression and DC. The variable optical attenuator (VOA)sets the defined optimum power at the input of the TL.
The TL consists of one or more 80 km standard single mode fiber (SSMF) sections,interleaved with OAs. The SSMF has a dispersion parameter of 17 ps/nm/km,dispersion slope of 80 fs/(nm2km), nonlinearity coefficient of 1.32 W–1km–1 andattenuation coefficient of 0.2 dB/km. The OAs fully compensate the losses associatedto one fiber section.
At the RX, a second OFM is used to compensate the remaining accumulateddispersion and perform noise filtering. The electrical part of the receiver is composedof an ideal square-law detector and an electrical filter modeled by a third-order Besselfilter with a –3-dB cutoff frequency of 28 GHz.
Figure 2 presents the OFM setup. Each device is composed by a five-portcirculator, three optical switches (OSs) and respective FBGs. The OSs selectthe operating FBGs, depending on the TL length. The OFM is divided into three stages.The first stage is performed by a 1×6 OS and respective FBGs, used to compensatethe accumulated dispersion of zero to five SSMF sections. If more accumulateddispersion needs to be compensated, the second stage is used. This stage is performed
Fig. 1. OSSB system setup.
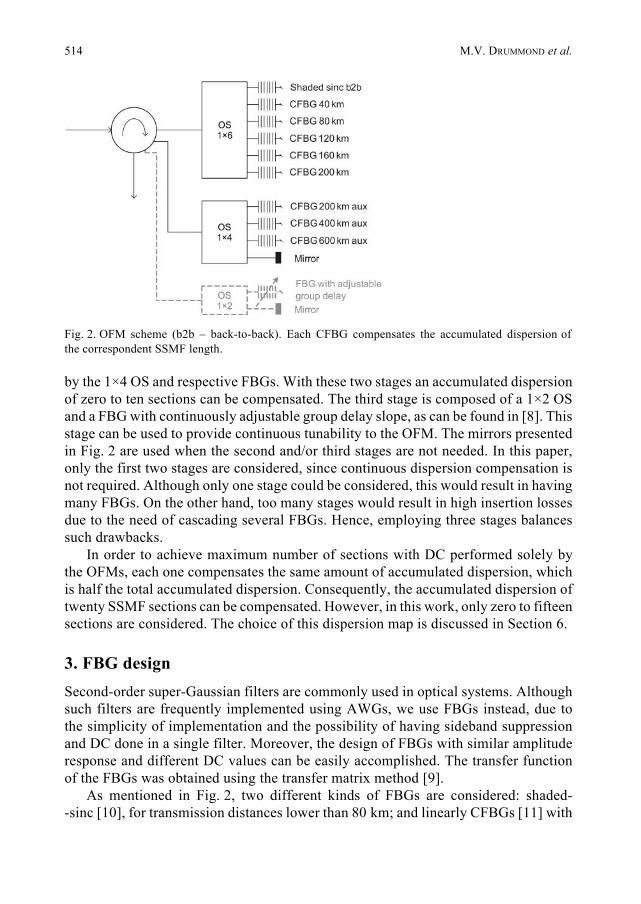
514 M.V. DRUMMOND et al.
by the 1×4 OS and respective FBGs. With these two stages an accumulated dispersionof zero to ten sections can be compensated. The third stage is composed of a 1×2 OSand a FBG with continuously adjustable group delay slope, as can be found in [8]. Thisstage can be used to provide continuous tunability to the OFM. The mirrors presentedin Fig. 2 are used when the second and/or third stages are not needed. In this paper,only the first two stages are considered, since continuous dispersion compensation isnot required. Although only one stage could be considered, this would result in havingmany FBGs. On the other hand, too many stages would result in high insertion lossesdue to the need of cascading several FBGs. Hence, employing three stages balancessuch drawbacks.
In order to achieve maximum number of sections with DC performed solely bythe OFMs, each one compensates the same amount of accumulated dispersion, whichis half the total accumulated dispersion. Consequently, the accumulated dispersion oftwenty SSMF sections can be compensated. However, in this work, only zero to fifteensections are considered. The choice of this dispersion map is discussed in Section 6.
3. FBG designSecond-order super-Gaussian filters are commonly used in optical systems. Althoughsuch filters are frequently implemented using AWGs, we use FBGs instead, due tothe simplicity of implementation and the possibility of having sideband suppressionand DC done in a single filter. Moreover, the design of FBGs with similar amplituderesponse and different DC values can be easily accomplished. The transfer functionof the FBGs was obtained using the transfer matrix method [9].
As mentioned in Fig. 2, two different kinds of FBGs are considered: shaded--sinc [10], for transmission distances lower than 80 km; and linearly CFBGs [11] with
Fig. 2. OFM scheme (b2b – back-to-back). Each CFBG compensates the accumulated dispersion ofthe correspondent SSMF length.

Optimization of a FBG-based filtering module ... 515
Gaussian apodization. These kinds of gratings differ in the apodization profile, asdepicted in Figs. 3a and 3b. Fourier theory is applicable to grating responses whenweak gratings (with reflectivity of approximately or less than 50%) are considered.Therefore, a sinc-shaped refractive index profile should result in a square overallreflection spectrum. Gratings with this refractive index profile have also proven to bealmost dispersion free. The apodization of this profile with a Gaussian function (alsocalled shading function) allows the control of the filter order without degradingsignificantly the group delay response (Fig. 3c). To obtain a second order super--Gaussian filter, a Gaussian shading function with a full width at half maximum(FWHM) of L/3.7 [9] is considered, where L is the grating length. Linearly CFBGsare useful for DC. To obtain a second-order super-Gaussian response, a second-orderGaussian profile with FWHM = L/3 is considered for all CFBGs. The adjustment ofthe refraction index, chirp and length of the grating allows changing the filter’sdispersion without altering significantly the amplitude response (Figs. 3d and 3e).
The losses associated to optical filtering in the TX and RX OFMs are less than 7and 5 dB, respectively. The FBGs maximum group delay ripple is 10 ps.
4. SSB filter optimizationIn this section, the performance criteria and TX filter optimization are presented. Ina first approach, the TX and RX OFM filtering is replaced by a single filter with
Fig. 3. Normalized refractive index profile of shaded sinc (a) and Gaussian apodizations (b); andfrequency response of shaded sinc (c), CFBG 80 km (d); and CBFG 200 km (e). In graphics (c), (d)and (e), the dashed curve is the amplitude response of an ideal super-Gaussian filter. RIV – refractionindex variation.
a b
c d e

516 M.V. DRUMMOND et al.
a second-order super-Gaussian response, as such filters can be implemented withFBGs.
Three different performance criteria are considered: –20 dB signal spectralbandwidth (SBW); Q-factor penalty (ΔQ) and sideband suppression ratio (SSR).The –20 dB SBW measurements are accomplished by finding the lowest spectral rangewith 99% of the total power of the optical signal. The Q-factor penalty in decibels isgiven by
ΔQ = 20log10(Qref ) – 20log10(QOSSB) (1)
where QOSSB and Qref are the Q-factor of the OSSB and reference signals, respectively.The reference signal is an unfiltered NRZ signal with an extinction ratio (ER) of 10 dB,as considered in [12] for 40-Gb/s signals long-haul transmission. A semi-analyticalapproach is employed to estimate Q-factor, where the signal waveform is obtainedusing a numerical simulation, while the impact of optical noise is taken into accountanalytically [13]. The SSR in decibels is
SSR = 10log10(PNSSB) – 10log10(PSSB) (2)
where PNSSB and PSSB are the optical powers of the non-suppressed and suppressedsidebands, respectively. A signal with SSR less than 20 dB is considered vestigialsideband, otherwise, it is considered SSB. The –20 dB SBW and SSR are measured atthe TX OF output.
The filter optimization has two main purposes: improving the robustness to fiberdispersion and compacting the signal spectra [5]. Hence, the following criteria are usedto select the filter settings: i) the –20 dB SBW is minimized; ii ) ΔQ is minimized, andiii ) the SSR is higher than 20 dB. Although the criteria chosen are similar to the onesused in [5], the optimum filter settings obtained in that work cannot be used inthe system presented, as the AMI–RZ signal at the TX OF input has a duty cycleof 50%.
The optimization of the filter bandwidth and detuning is performed in back-to--back, according to the scheme presented in Fig. 4. The bandwidth of the RX OF shouldbe high enough to enable reduced signal degradation and low enough in order to haveefficient noise filtering. Therefore, a bandwidth of 40 GHz is chosen. The RX OF hasequal detuning to the TX OF. At the RX OF output, an optical signal-to-noise ratio(OSNR) of 22.0 dB is considered. This value remains constant in all tests along
Fig. 4. TX OF optimization scheme.

Optimization of a FBG-based filtering module ... 517
this section, and results in a Q-factor of 7 when the reference signal is used.The optimization results are presented in Fig. 5. Following the performance criteriadescribed, a detuning of 24 GHz and a bandwidth of 35 GHz are considered. Withthese parameters, a filtered signal with a –2.7 dB of Q-factor penalty, 31.6 GHz of–20 dB SBW and 34.3 dB of SSR is obtained. Therefore, all FBGs were designed witha detuning of 24 GHz. The FBGs of the first stages of the TX and RX OFMs havea bandwidth of 35 and 40 GHz, respectively. The FBGs of the second stages musthave a larger bandwidth to avoid changing significantly the amplitude response ofcombined filtering of first and second stages. Hence, the FBGs of the second stagesof the TX and RX OFMs have a bandwidth of 55 GHz.
5. Transmission simulationsAfter optimizing the TX and RX FBG settings each OFM, the DC effectiveness andsystem performance are assessed.
The DC effectiveness is assessed with a linear transmission simulation.The simulation scheme is similar to the one presented in Fig. 1. Linear lossless SSMFsections are considered and an OSNR of 22.0 dB is set at the RX OFM output,independently of the number of sections. Figure 6 presents ΔQ as a function ofthe fiber length. The Q-factor penalty variation to the back-to-back case is lower than1 dB, proving that the effectiveness of the optical DC does not change significantlywith the fiber length considered.
The nonlinear transmission simulation scheme is the one presented in Fig. 1.The Q-factor as a function of the input power per section is presented in Fig. 7,
Fig. 5. Q-factor penalty (a), –20 dB SBW (b), and SSR (c) for the TX OF bandwidths and detuningsconsidered.
a b c

518 M.V. DRUMMOND et al.
considering different number of sections. Figure 7 shows that thirteen sections ofSSMF are achieved with a Q-factor higher than 7, proving that the signal degradationarises mainly from the noise accumulation and fiber nonlinear effects.
6. Dispersion compensation robustness
In this section, we investigate the robustness of the system to different dispersion mapsand small deviations in the DC. Thirteen sections and optimum input power per section(0 dBm) are considered. Both OFMs compensate half of the total accumulated
Fig. 6. Q-factor penalty for the linear transmission simulation. Inset: eye patterns for 0 and 480 kmof linear SSMF.
Fig. 7. Q-factor as a function of the input power per section.
Fig. 8. Q-factor as a function of dispersion map and RX OFM DC deviation.

Optimization of a FBG-based filtering module ... 519
dispersion. The dispersion variation is performed by two linear lossless fiber sections,each one placed after the TX and RX OFMs. Figure 8 presents the Q-factor asa function of the total DC performed at the TX and deviation of the DC performed atthe RX from the remaining DC. Considering optimum DC, a Q-factor variation of1.2 dB is obtained for the dispersion maps considered, proving that the use of differentdispersion maps results in negligible penalties. However, DC variations fromthe optimum value (dotted line) result in higher penalties. This attests the need forsmall adjustments of the DC, enabled by the third stage of the OFMs.
7. Conclusions
A 40 Gb/s OSSB transmission system with AMI–RZ signaling format and optical DChas been investigated. Sideband suppression and DC are both performed by opticalfiltering, implemented with FBGs. A scheme based on FBG switching has beenproposed to perform DC for different SSMF lengths. Linear transmission simulationyielded a Q-factor penalty variation to the back-to-back case lower than 1 dBconsidering a maximum transmission distance of 1200 km. Nonlinear transmissionsimulation achieved a Q-factor higher than 7 for 1040 km of SSMF using optimuminput power in each fiber section. Simulations with different dispersion maps yieldeda maximum Q-factor variation of 1.2 dB. The use of the DC scheme presentedwith equal DC at the TX and RX has proven to be almost ideal. Moreover, the systemhas proven to be robust to different dispersion maps. However, DC variations fromthe optimum value result in significant penalties, proving the need for smalladjustments of the DC.
Acknowledgements – THRONE (PTDC/EEA-TEL/66840/2006) Fundação para a Ciência e a Tecnologia(FCT) project is acknowledged. M.V. Drummond was supported by FCT under the SFRH/BD/40250/2007 scholarship.
References[1] WINZER P.J., ESSIAMBRE R.J., Advanced optical modulation formats, Proceedings of the IEEE 94 (5),
2006, pp. 952–985.[2] GRIFFIN R.A., CARTER A.C., Optical differential quadrature phase-shift key (oDQPSK) for high
capacity optical transmission, [In] Optical Fiber Communication Conference and Exhibit, OFC 2002,pp. 367–368.
[3] SU Y., MOLLER L., RYF R., CHONGJIN XIE, XIANG LIU, Feasibility study of 0.8-b/s/Hz spectral efficiencyat 160 Gb/s using phase-correlated RZ signals with vestigial sideband filtering, IEEE PhotonicsTechnology Letters 16 (5), 2004, pp. 1388–1390.
[4] FONSECA D., CARTAXO A.V.T., MONTEIRO P., Optical single-sideband transmitter for variouselectrical signaling formats, Journal of Lightwave Technology 24(5), 2006, pp. 2059–2069.
[5] CHARRUA P.M.A., CARTAXO A.V.T., Performance analysis of AMI-RZ single-sideband signals in40 Gbit/s transmission systems, IEE Proceedings – Optoelectronics 153(3), 2006, pp. 109–118.
[6] FONSECA D., CARTAXO A., MONTEIRO P., Comparison and optimisation of optical single sidebandtransmitters, IET Optoelectronics 1 (2), 2007, pp. 82–90.

520 M.V. DRUMMOND et al.
[7] WINZER P.J., GNAUCK A.H., RAYBON G., CHANDRASEKHAR S., SU Y., LEUTHOLD J., 40-Gb/sreturn-to-zero alternate-mark-inversion (RZ-AMI) transmission over 2000 km, IEEE PhotonicsTechnology Letters 15(5), 2003, pp. 766–768.
[8] MATSUMOTO S., OHIRA T., TAKABAYASHI M., YOSHIARA K., SUGIHARA T., Tunable dispersionequalizer with a divided thin-film heater for 40-Gb/s RZ transmissions, IEEE Photonics TechnologyLetters 13 (8), 2001, pp. 827–829.
[9] ERDOGAN T., Fiber grating spectra, Journal of Lightwave Technology 15 (8), 1997, pp. 1277–1294.[10] IBSEN M., DURKIN M.K., COLE M.J., LAMING R.I., Optimised square passband fibre Bragg grating
filter with in-band flat group delay response, Electronics Letters 34(8), 1998, pp. 800–802.[11] JUNHEE KIM, JUNKYE BAE, YOUNG-GEUN HAN, SANG HYUCK KIM, JE-MYUNG JEONG, SANG BAE LEE,
Effectively tunable dispersion compensation based on chirped fiber Bragg gratings without centralwavelength shift, IEEE Photonics Technology Letters 16 (3), 2004, pp. 849–851.
[12] International Telecommunication Union (ITU-T) Recommendation G.959.1, Optical TransportNetwork Physical Layer Interfaces.
[13] REBOLA J.L., CARTAXO A.V.T., Gaussian approach for performance evaluation of opticallypreamplified receivers with arbitrary optical and electrical filters, IEE Proceedings –Optoelectronics 148 (3), 2001, pp. 135–142.
Received November 6, 2009in revised form January 6, 2010

Optica Applicata, Vol. XL, No. 2, 2010
Theoretical analysis of electro-optical characteristics of the modified three cylindrical mirror analyzer
SZYMON KLEIN1, STANISŁAW KASZCZYSZYN1, ANDRZEJ GRZESZCZAK1, PIOTR KOŚCIELNIAK2
1Institute of Experimental Physics, University of Wrocław, Wrocław, Poland
2Department of Electron Technology, Silesian University of Technology, Gliwice, Poland
In this paper, theoretical electro-optical characteristics of a modified cylindrical mirror analyzerbased on three coaxial cylindrical electrodes obtained with numerical calculations are presented.It was shown, for the first time, that the image of a point source of electrons located on the analyzeroptical axis is in the form of a circle which does not depend on the entrance angle of electrons intothe analyzer within the range of angles α = 30°–40°. In particular, for the input angle α = 36° anddispersion Δα = ±3°, the relative energy resolution is equal to 0.01% at the analyzer constantK = 1.97.
Keywords: cylindrical mirror analyzer, TCMA analyzer, Bashforth–Adams–Moulton method.
1. Introduction
The control of physicochemical properties of solid state surfaces in view of the variousapplications stimulates the dynamic development of surface analytical methods, inparticular, methods of electron spectroscopy. In these methods the electron energyanalyzers play the most important role. Therefore, during the development ofthe electron spectroscopic methods, new technical improvements of electron energyanalyzer having the best analytical parameters are of great demand.
The most important parameters of the electron energy analyzers are: energyresolution, transmission coefficient, the input angle of electrons into the analyzer andthe speed of spectra registration. Moreover, in some types of analyzers the acceptanceangle also determines the sample–analyzer distance, which restricts a simultaneoususe of different surface analytical methods to control the same surface area.
In the conventional cylindrical mirror analyzer (CMA) [1] the distance betweenthe sample and analyzer is about 6–8 mm and remains the same also for the doublepass cylindrical mirror analyzer (DPCMA), because the same conditions of the secondorder focusing have to be fulfilled [2, 3]. The relative energy resolution for bothanalyzers can be increased only at the cost of decreasing the entrance slit in the innercylinder and transmission coefficient, at a constant sample–analyzer distance.

522 S. KLEIN et al.
In order to improve the energy resolution of a conventional CMA severalmodifications were proposed. In paper [4], the results of theoretical analysis ofa modified CMA analyzer were presented, for which the additional third cylindricalelectrode with properly made slits was proposed between the external and internalcylinders of the conventional CMA analyzer. After such modification for the settransmission coefficient, the relative energy resolution (of the order of 0.1%) ofthe CMA was evidently better than that of the conventional one. However, the distancebetween the sample and the analyzer was taken in such a way that the entrance angleof electrons was about α = 40°.
In another modification of a conventional CMA analyzer proposed byMENCHIKOV [5, 6], known as the three cylindrical mirror analyzer, three coaxialcylindrical electrodes were also used in a configuration shown in Fig. 1. In thesepapers, a perturbation theory analysis of the electro-optical properties of electron beamin such a system was carried out and the possibility of existence of the third orderfocusing conditions and relative energy resolution at the level of 0.01% was predicted.
In an earlier work [7], we presented the results of experimental investigations ofthe electro-optical characteristics of the electron energy analyzer (TCMA) designedand constructed on the basis of the theoretical prediction by MENCHIKOV [5, 6].The analytical parameters obtained were very far from the theoretically predicted ones.
In this paper, we present the results of numerical calculations of electro-opticalcharacteristics of the TCMA working under axis-ring focusing conditions.
2. Fundamentals
The TCMA consists of three coaxial metal cylinders, as shown in Fig. 1. It works inthe regime of axis-ring focusing [6].
The sample and the central cylinder are grounded. The voltage applied betweenthe outer and inner cylinders creates the electrostatic field which separates the electronsentering the analyzer.
The electrons emitted from the point source located on the analyzer axis, afterhaving passed the four slits in the central cylinder, are focused on a circle of radius r
Fig. 1. A simplified diagram of the three cylindrical mirror analyzer (TCMA), working in axis-ringfocusing mode, together with exemplary electron trajectories inside.

Theoretical analysis of electro-optical characteristics ... 523
close to the central cylinder. The calculation of electron trajectories was based onthe Bashforth–Adams–Moulton method implemented as ode113 function in theMATLAB package.
Equations of the electron motion were integrated forward and backwardsubsequently in order to control the numerical error of the trajectory coordinatesdefined as the difference in coordinate r between the results of forward and backwardintegration. The time step of the integration was chosen to keep this error at the levelbetter than 10–6 m. Our calculations were performed for the energy of electrons E andE±ΔE, where ΔE was equal to 0.1% E or to 0.01% E, respectively. For the abovementioned energies, the trajectories of electrons were analyzed for the entrance angleα in the range 30°–40°, and the constant value Δα = 3°.
3. Results and discussion
As is shown in Fig. 1, and in particular in Fig. 2, the electron beams which differ inenergy by about ΔE are not only well focused, but also their focuses are wellseparated.
The well-separated electron beams confirm that the energy resolution of the analyzeris at least equal to ΔE.
A next feature of the analyzer is clearly visible in Fig. 3.These dependences confirm that the separation of focuses is really equal to
ΔE = 0.1% E and ΔE = 0.01% E. Moreover, based on the analysis of the electrontrajectories for energy varying by ±ΔE one can conclude that, in a wide range ofinput angles and analyzer constant K, the energy resolution is at the level 0.1%. Forthe chosen values of K, one can obtain this value at the level 0.01% or even betterowing to the input angle in the range 30°–40°.
Fig. 2. An enlarged area of electron trajectories in the region of their focusing into the ring, wherethe input slit should be located. The focal length for α = 36° and Δα = ±3° is marked on the horizontal axis.

524 S. KLEIN et al.
Figure 4 shows the dependence of K on the distance between the focus and samplefor the chosen energy E and chosen values of entrance angle α.
It is clearly visible that all the curves are crossing at one joint point correspondingto K = 1.97 and L = 11.5125. This means that the TCMA working in the regime ofaxis-ring focusing is able to separate the electrons in a wide range of entrance angles.
This is well confirmed in Fig. 5, where the dependences of constant K ofthe analyzer on radius r of an image, are presented.
It is clearly visible that for different electron entrance angles of the analyzer,the crossing point of all the curves appears in a very narrow range of constantK = 1.97, similarly as for Fig. 3.
Fig. 3. The relative energy resolution of the analyzer as a function of constant K (defined as the ratioof pass energy to separation voltage), and entrance angle α.
Fig. 4. The analyzer constant K as a function of focal length for the entrance angles in the range 30°–40°.

Theoretical analysis of electro-optical characteristics ... 525
Thus, our analysis confirmed that, using the TCMA working in axis-ring focusingmode, one can obtain well-resolved energy distribution curves of electrons in a widerange of electron entrance angles of the analyzer without any change in position andsize of the analyzing slits, as well as without a change of the deflection potential onthe cylinders for the chosen relative energy resolution.
4. ConclusionsFrom the numerical calculation of electro-optical characteristics of the threecylindrical mirror analyzer working in axis-ring focusing mode, one can conclude that:
– the modified analyzer can reach an extremely high energy resolution at the level0.01%, or even better;
– this level of resolution is attainable also for a wide range of entrance angles ofelectrons entering the analyzer, which is a unique achievement of this work;
– for the chosen resolution, the analyzing slit can be twice as large as that ofthe conventional CMA analyzer;
– it can be interchanged with the conventional CMA without modification of boththe vacuum system and the electronics steering system.
Acknowledgements – This work was sponsored by the Institute of Experimental Physics, University ofWrocław, within the research project GBW 2016/IFD/W 2008, as well as by the Institute of Physics,Silesian University of Technology, Gliwice, within the research project BK/RMF1/2009. We thankDr. Stanisław Surma for valuable linguistic assistance.
References[1] GRZESZCZAK A., KASZCZYSZYN S., SIDORSKI Z., Home made cylindrical mirror analyzer (CMA):
construction and performance, Acta Universitatis Wratislaviensis 37, 1980, p. 351.[2] AKSELA S., KARRAS M., PESSA M., SUONINEN E., Study of the electron optical properties of an electron
spectrograph with coaxial cylindrical electrodes, Review of Scientific Instruments 41(3), 1970,p. 351.
Fig. 5. Constant K versus image radius r.

526 S. KLEIN et al.
[3] KOVER A., VARGA D., CSERNY I., SZMOLA E., MORIK G., GULYAS L., TOKESI K., A distorted fieldcylindrical mirror electron analyzer: II. Performances and application for studying ion–atomcollisions, Nuclear Instruments and Methods in Physics Research A 373 (1), 1996, pp. 51–56.
[4] FRANZEN W., TAAFFE J., Theory of modified cylindrical mirror electron spectrometer free of third--order aberration, Journal of Physics E: Scientific Instruments 13(7), 1980, p. 719.
[5] MENCHIKOV K.A., Elektrostaticheskii analizator zariazhennykh chastits s tremia koaksialnymitsilindricheskimi elektrodami: I. Konstruktsia s tremia kaskadami sluchai tonkogo srednego elektrodai fokusirovki tipa os’-os’, Journal of Technical Physics 51, 1981, p. 17 (in Russian).
[6] MENCHIKOV K.A., Elektrostaticheskii analizator zariazhennykh chastits s tremia koaksialnymitsilindricheskimi elektrodami: III. Konstruktsia s tremia kaskadami i fokusirovkoi obshchego vidakoltso-koltso, Journal of Technical Physics 52, 1982, p. 2245 (in Russian).
[7] KOŚCIELNIAK P., KASZCZYSZYN S., SZUBER J., A new type of electron energy analyzer based on threecoaxial cylindrical electrodes for Auger electron spectroscopy, Vacuum 63 (1–2), 2001, pp. 361–366.
Received July 9, 2009in revised form October 6, 2009

lnstructions for Authors
l. Papcrs wil l be considc rccl for publication in Optica Applicata i f thcy have not bccn prcv iously publi shcd clscwhcrc. T hcy shou ld clca l with origina l rcscarch in app liccl optics and may con ta in cxpc rim c nt a l as wcll as theorctical rcsult s. Ali papcrs will be subjcc tccl to rcfcrcci ng.
2. Manu sc ripts s hould be typed in cloub lc spacing o n one sidc of th c pagc on ly. Printcd manusc ripts shou lcl be sc nt in duplicale to th e Ecl itoria l Ofl'icc. We also acccpt elcetronie submi ss ion , prcferably in Word , tx t or rtf format.
3. Thc mathcmatical formulne should be ty pcd and carc shoulcl be takcn th at th c symbol s casi ly confusin g (e .g., supc rsc ripts and subscr ipts) arc vcry c lear ly cli s tinguishcd . formu lne shou lcl be numb ercel o n th c ri g ht-h ancl sicie in rouncl parcnthcscs.
4. Each papcr s houlcl be prcccclccl by an nbstrac t of no more th an 100 words. lt must includc thc scopc o f t he re sea rch and principal fincling s.
5. A li illu stration s, drawin gs and photographs shoulcl be submitt ed o n scpm·ate shcets. E lcetron ie submi ss ion as bmp o r tiff format with minimum resolution of 300 dpi is preferrcd . Aria ! or 1-lclvctica fonts typc sho ulcl be usccl (bolcl a nd italic are avoiclccl). Ali illu strations, incluclin g photog raph s, mu s t havc th c figure numbcr, thc author's namc and th e titl e of th e art ic lc. f-'i g urc caption s shou lcl be listcel on a scparate shee t at the end of th c manuscript.
6. Tablcs shoulcl be submittecl a lso on the separatc shcc ts, numbercel in Arabie numcral s, and refcn·ccl to t he text. Thc s i ze o f a ta b l e m u st not be larger than A3 .
7. Rcfcrcnccs shoulcl be numbercel conscc uti ve ly as thcy are citccl in thc tcxt and li s tcel aftc r tcxt. In th c li s t of rcfe rc nccs, the followin g information s ho ul cl be g ivcn: a) auth o r 's name and initials, b) t h e lilie o f th c journa l, c) j ourna l vo lume, year of issuc , and thc firs t pagc, ci) i f a book is c it ecl: p ubli sbing house, p lace, and yea r of issue .
8. T he au th ors rcceive one copy of th e manuscript (with changes suggcstcd by th c Eclitor) for th cir acccptancc and thi s copy sc nt back to th c Ecli to r will be thc basis for a ll th c proofrcacling macic by th c cclitoria l s taff. Thc Ecli tors rcscrvc th e msc lvcs th c right to charge thc au tb o r for t he a lt cra ti ons in t he proof o th e r th an t h e correcti o n o f printcr's crrors.
9. Thc authors o f eac h artic lc will rc cc ivc 25 rcprints o f thcir papcr frcc o f cha rge. 10. T hc a uth o r(s) o f thc papcr(s) submi tt ccl to publication and publi shccl in Optica Applicata agrcc
to cxc lus ivc transfer of th c cluc copyright to the publishcr.

Other Periodicals of the Wrocław University of Technology
Price 30 zł (0% VAT)
Operalians Research and Decisions does not only discuss theoretical problems but it also provides solutions to be applied in practice. In addition to original extensive research papers, reviews, communications and reports from conferences sponsored by Polish and foreign research centres are presented.
Studia Geotechnica et Mechanica is a unique journal in Poland entirely devoted to theoretical and experimental problems o f engineering sciences on soi l s and rocks.
Environment Protection Engineering covers the field of environmental protection engineering and i ts technical application: purification, wastewater treatment, water reuse, neutralization and utilization of industrial gases, noise and vibrations, ecological problems, solid waste disposal, legislation and forecasting dealing with the environmental problems.
Materia/s Science is an interdisciplinary journal devoted to experimental and theoretical research into the synthesis, structure, properties and applications o f materials.
Systems Science. The papers published in this periodical are devoted to a generał theory of systems, their mathematical models as well as to various applications of the analytical methods to industry, information science, biology, and other disciplines.
Orders shoułd be addressed to: Oficyna Wydawnicza Połitechniki Wrocławskiej Wybrzeże Wyspiańskiego 27, 50-370 Wrocław
CHZ "Ars Połona" S.A., Dział Prasy, ul. Obrońców 25,00-933 Warszawa "Ruch" S.A., Oddział Krajowej Dystrybucji Prasy
ul. Jana Kazimierza 31/33, 01-248 Warszawa or to any "Ruch" agency in Połand
PL ISSN 0078-5466