Taxonomy vs. Systematics Binomial Nomenclature vs. Phylogenetic Tree.
28
Taxonomy vs. Systematics Binomial Nomenclature vs. Phylogenetic T
-
Upload
lydia-beasley -
Category
Documents
-
view
241 -
download
9
Transcript of Taxonomy vs. Systematics Binomial Nomenclature vs. Phylogenetic Tree.

Taxonomy vs. SystematicsBinomial Nomenclature vs. Phylogenetic Tree
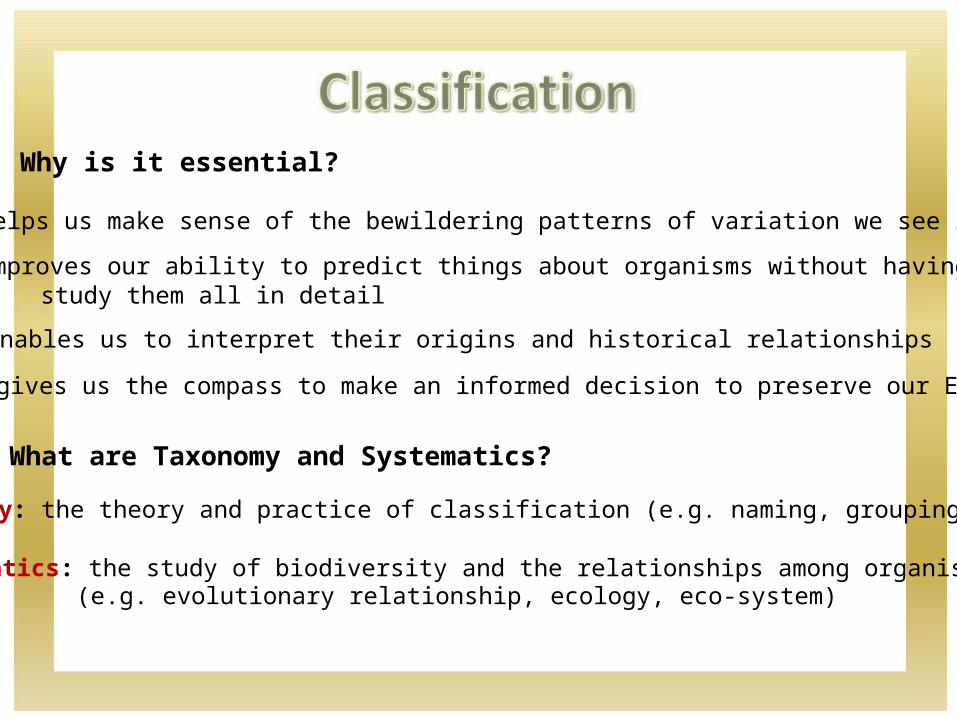
• It helps us make sense of the bewildering patterns of variation we see in nature
• It improves our ability to predict things about organisms without having tostudy them all in detail
• It enables us to interpret their origins and historical relationships
• It gives us the compass to make an informed decision to preserve our Earth.
Why is it essential?
What are Taxonomy and Systematics?
Taxonomy: the theory and practice of classification (e.g. naming, grouping)
Systematics: the study of biodiversity and the relationships among organisms(e.g. evolutionary relationship, ecology, eco-system)

Carolus Linnaeus (18th century):
••
Developed the modern classification systemUsed the generalized 6 kingdoms & John Ray’s idea of genera and species toformulate the two-name system called binomial nomenclature
The six (6) kingdoms are very general with each further specify into a series ofsmaller group called taxa:
Animalia Fungi
Plantae Bacteria
ProtistaArchaea bacteria
Seven (7) taxa are used to further organize organisms:
Kingdom Phylum Class Order Family Genus Species
e.g. Animalia Chordata Mammalia Carnivora Canidae Canis familiaris
“Kings Play Chess on Fine Green Sand”

• A two-word name system to name each species• 1st word in the name is the genus, with the first letter capitalized• 2nd word is the name of the species, not capitalized eg. Felis domesticus
The genus contains multiple species so more than one (1) species has a name withthe same genus:
e.g. Lynx canadensis (lynx) e.g. Lynx rufus (bobcat)
In addition to this nomenclature, organisms are also called by common names
e.g. nutmeg = Myristica fragrans
Common names are misleading because: A species can have multiple names e.g. N.A. cougar = panther = mountain lion Starfish and jellyfish are not part of the same phylum
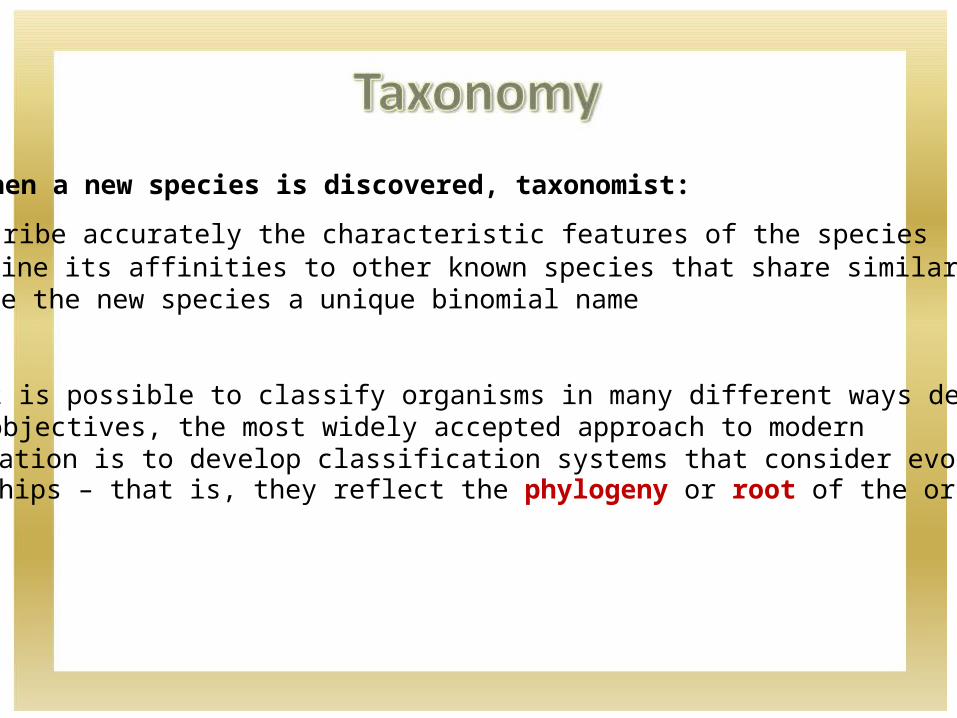
When a new species is discovered, taxonomist:
Describe accurately the characteristic features of the species Determine its affinities to other known species that share similar traits To give the new species a unique binomial name
While it is possible to classify organisms in many different ways dependingon our objectives, the most widely accepted approach to modernclassification is to develop classification systems that consider evolutionaryrelationships – that is, they reflect the phylogeny or root of the organisms.

Phylogenetic tree:• Based on evidence of evolutionary relationships among organisms• These evidence include a wide range of characters such as:
morphological developmental
structural biochemical
molecular data• Account degree of difference between species
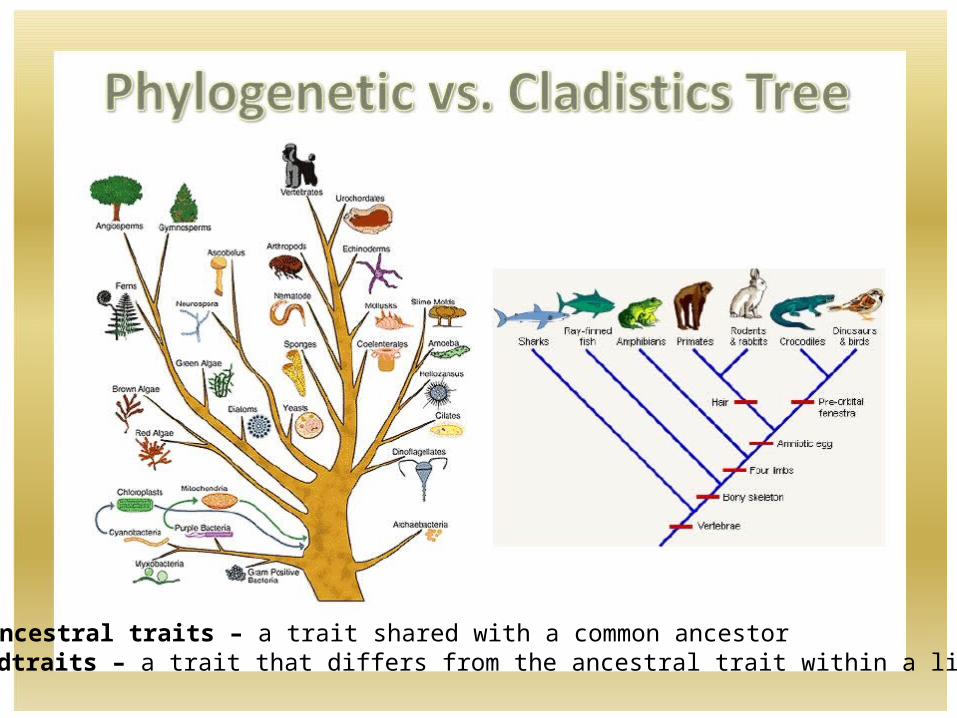
Cladistics tree:•
•
Similar to phylogenetic tree, but do not account the degree of differencebetween speciesDepicts evolutionary relationships by showing the points at which lineagesdiverged from common ancestral forms using ancestral and derived traits
Ancestral traits – a trait shared with a common ancestorDerived traits – a trait that differs from the ancestral trait within a lineage
Ancestral traits – a trait shared with a common ancestorDerivedtraits – a trait that differs from the ancestral trait within a lineage
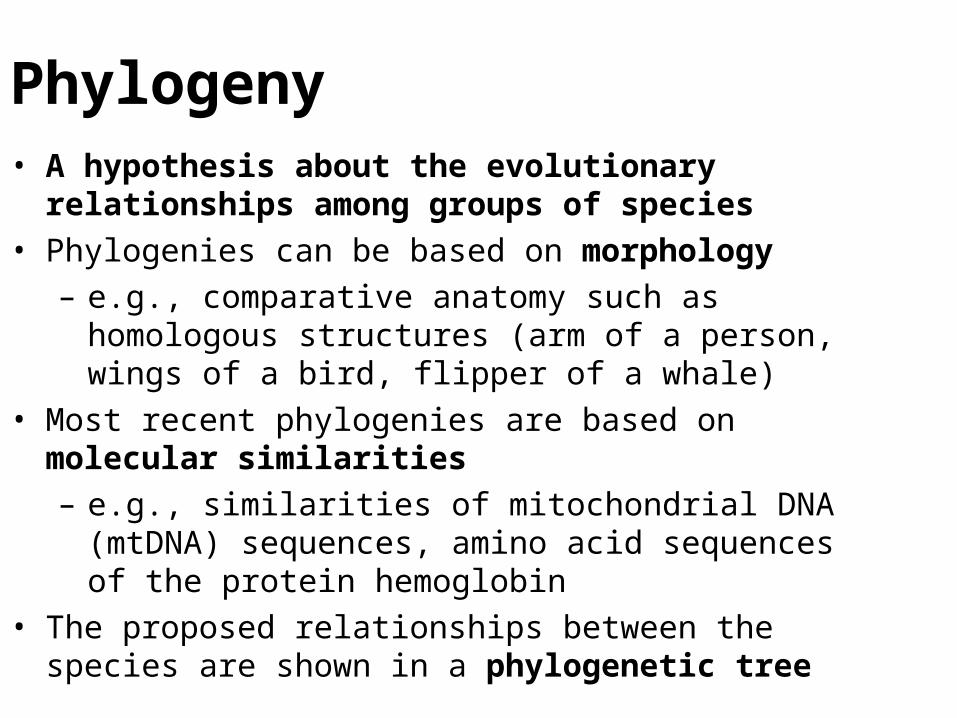
Phylogeny• A hypothesis about the evolutionary relationships among
groups of species• Phylogenies can be based on morphology
– e.g., comparative anatomy such as homologous structures (arm of a person, wings of a bird, flipper of a whale)
• Most recent phylogenies are based on molecular similarities – e.g., similarities of mitochondrial DNA (mtDNA) sequences,
amino acid sequences of the protein hemoglobin• The proposed relationships between the species are shown in
a phylogenetic tree
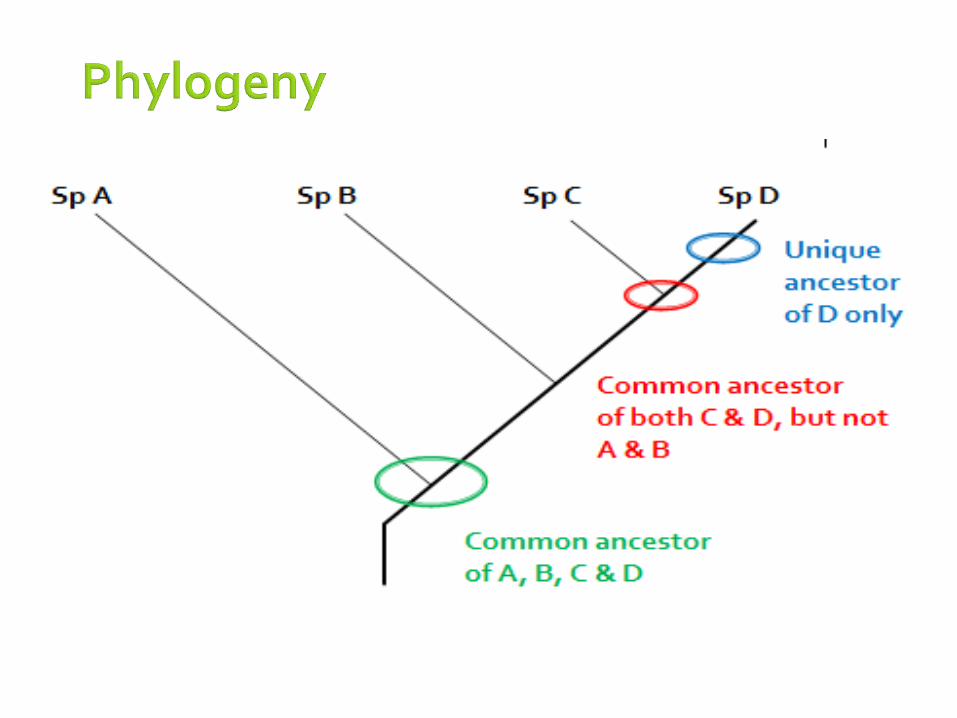
Phylogenetic Tree is like a family tree…
• Roots or base common ancestor • primitive characteristics: general characteristics that
are shared by all the species that evolved from it• Forks in each branch 2 new species
• derived characteristics: additional traits that create new species who have evolved from the common ancestor
• shared derived characteristics: specific traits shared by groups of organisms
• Upper ends of branches present-day descendant species • The more derived characteristics organisms share, the closer
the evolutionary relationship!
Cladistics• A scientific classification scheme that is based on phylogeny.• It only identifies and considers those characteristics of
organisms that are evolutionary innovations - new characteristics that arise as lineages evolve over time.
• Each new group of related species has one common ancestor, and organisms retain some ancestral characteristics.

A B C D
Species A, B, C & D all exist in modern times
Recenttime
Pasttime 11
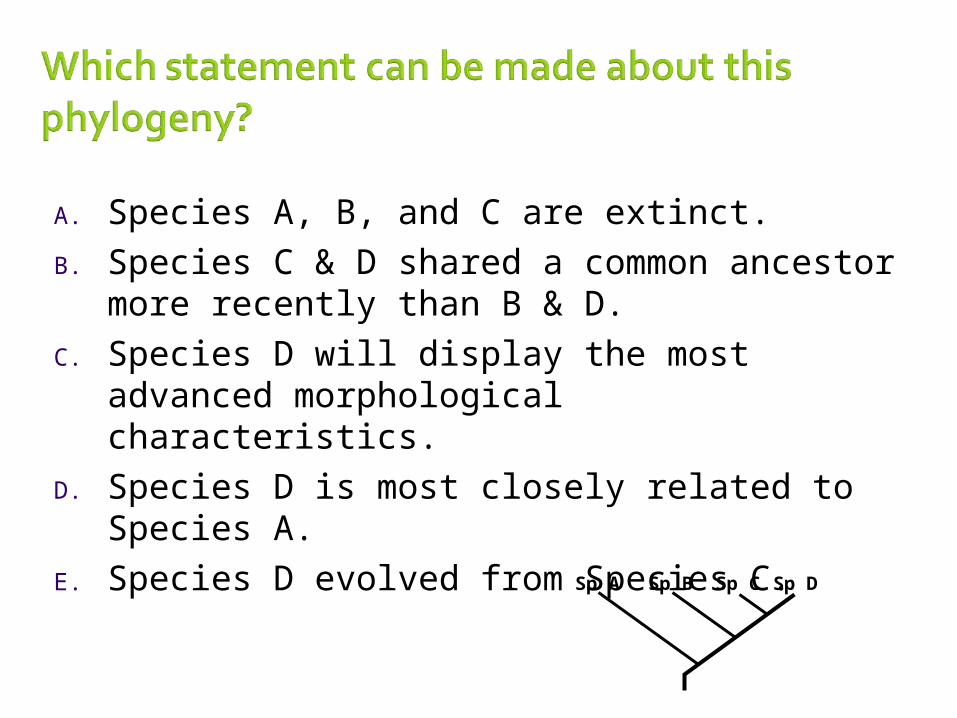
A. Species A, B, and C are extinct.
B. Species C & D shared a common ancestor more recently than B & D.
C. Species D will display the most advanced morphological characteristics.
D. Species D is most closely related to Species A.
E. Species D evolved from Species C.
Sp A Sp B Sp C Sp D
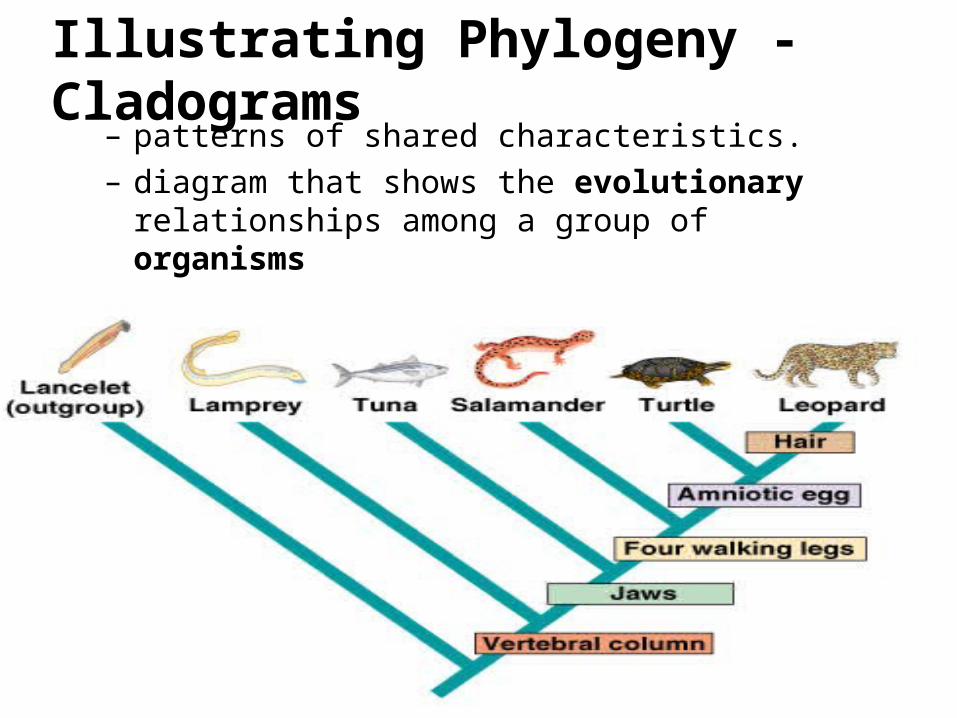
Illustrating Phylogeny - Cladograms– patterns of shared characteristics.– diagram that shows the evolutionary relationships among
a group of organisms
• classify organisms according to the order in time at which branches arise along its phylogenetic tree
• What shared derived character is common to the salmon, lizard, and rabbit, but not the lamprey?
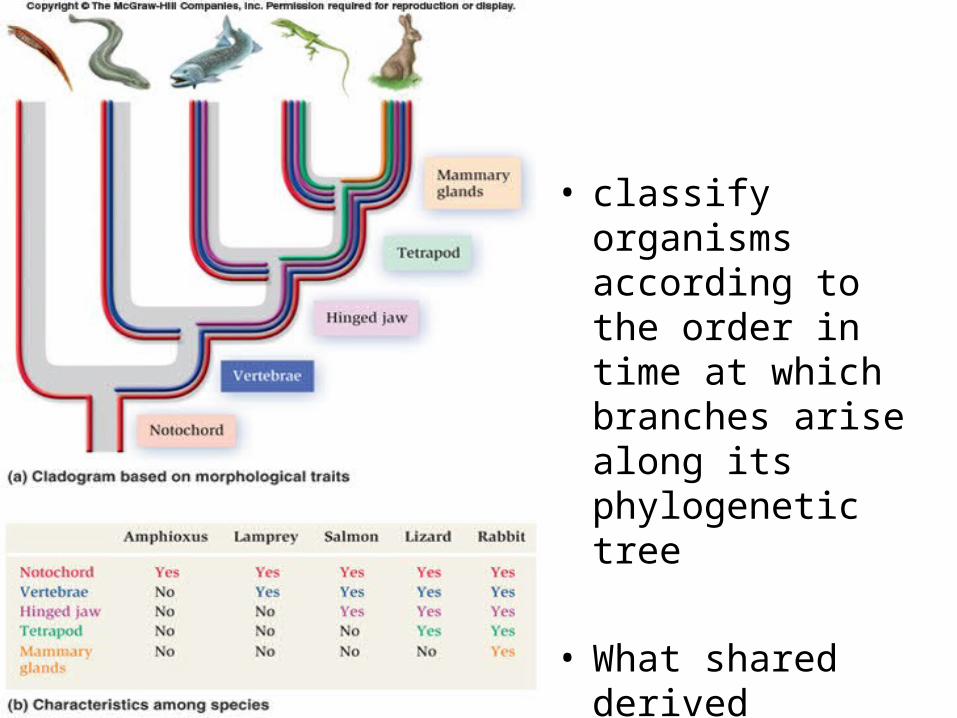
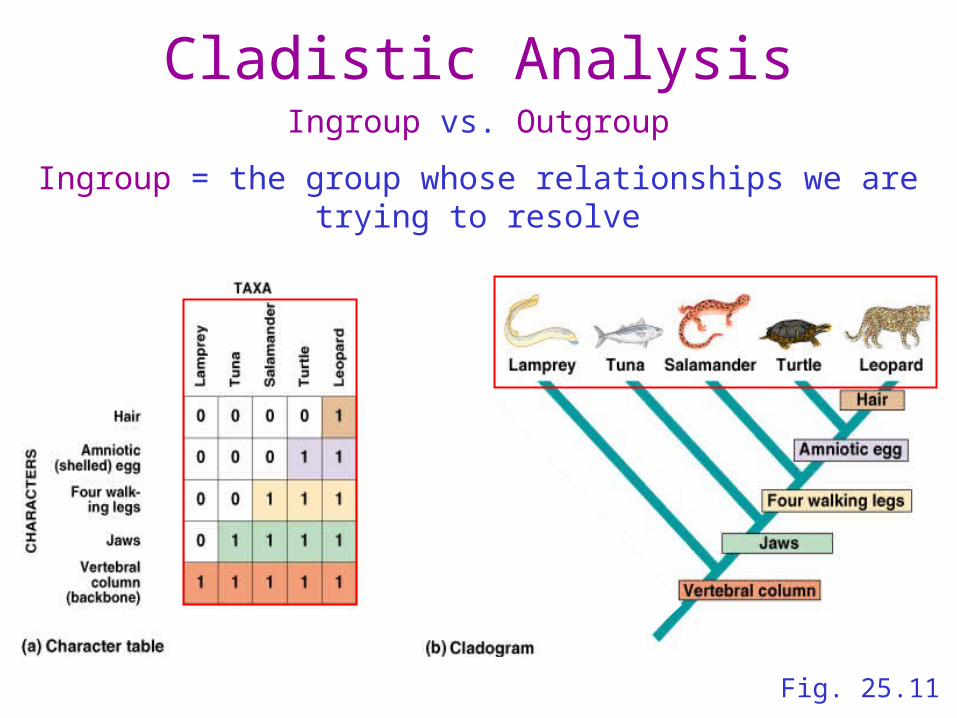
Outgroup Analysis• Determines which characteristics in a given group of taxa are primitive or which are derived
• An outgroup is usually a taxon that represents the primitive condition.–The amphioxus (figure on previous slide) is the outgroup
because it is a chordate without vertebrae. Also because of evidence based on the fossil record, and development.
• All other taxa are grouped according to shared derived characters.–The more derived structures two organisms share, the closer
is their evolutionary relationship -- that is, the more recently their common ancestor lived.
–Close relationships are shown by a recent fork from the supporting branch – the closer the fork in the branch between two organisms, the closer their relationship.
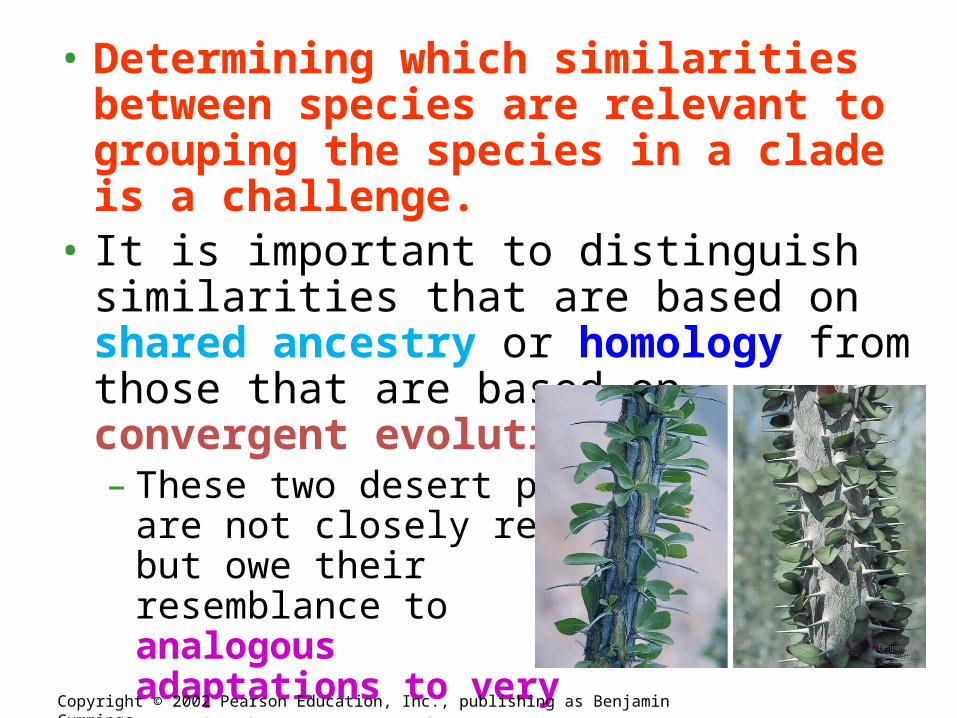
• Determining which similarities between species are relevant to grouping the species in a clade is a challenge.
• It is important to distinguish similarities that are based on shared ancestry or homology from those that are based on convergent evolution or analogy.– These two desert plants
are not closely relatedbut owe theirresemblance toanalogousadaptations to very
similar environments.Copyright © 2002 Pearson Education, Inc., publishing as Benjamin Cummings
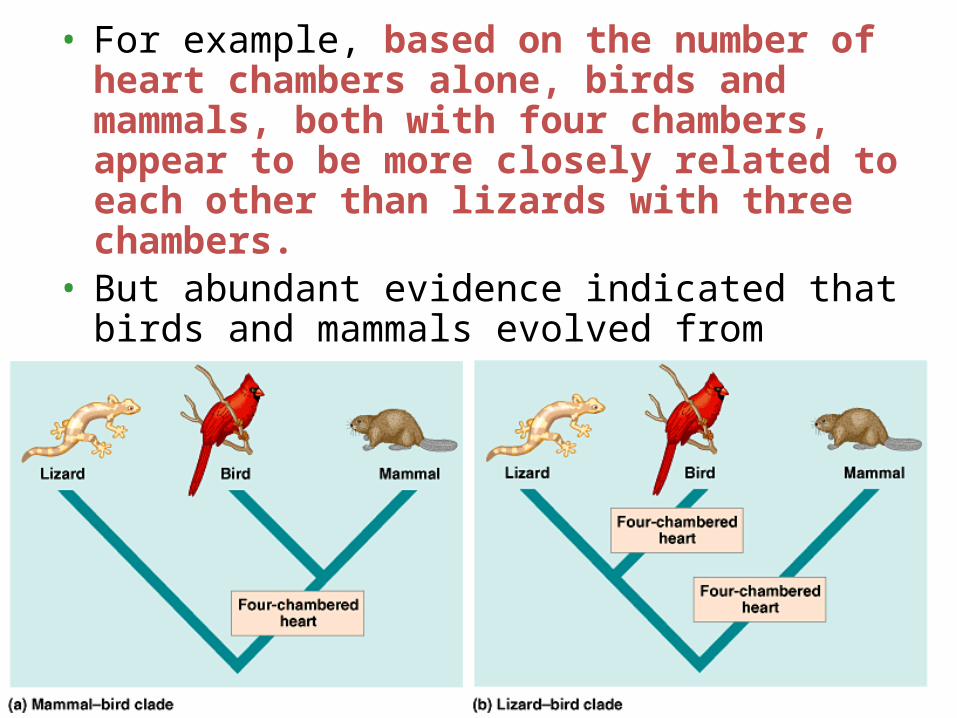
• For example, based on the number of heart chambers alone, birds and mammals, both with four chambers, appear to be more closely related to each other than lizards with three chambers.
• But abundant evidence indicated that birds and mammals evolved from different reptilian ancestors.– The four chambered hearts are analogous, not
homologous, leading to a misleading cladogram.

• As a general rule, the more homologous parts that two species share, the more closely related they are.
• Also, the more complex two structures are, the less likely that they evolved independently.
Copyright © 2002 Pearson Education, Inc., publishing as Benjamin Cummings
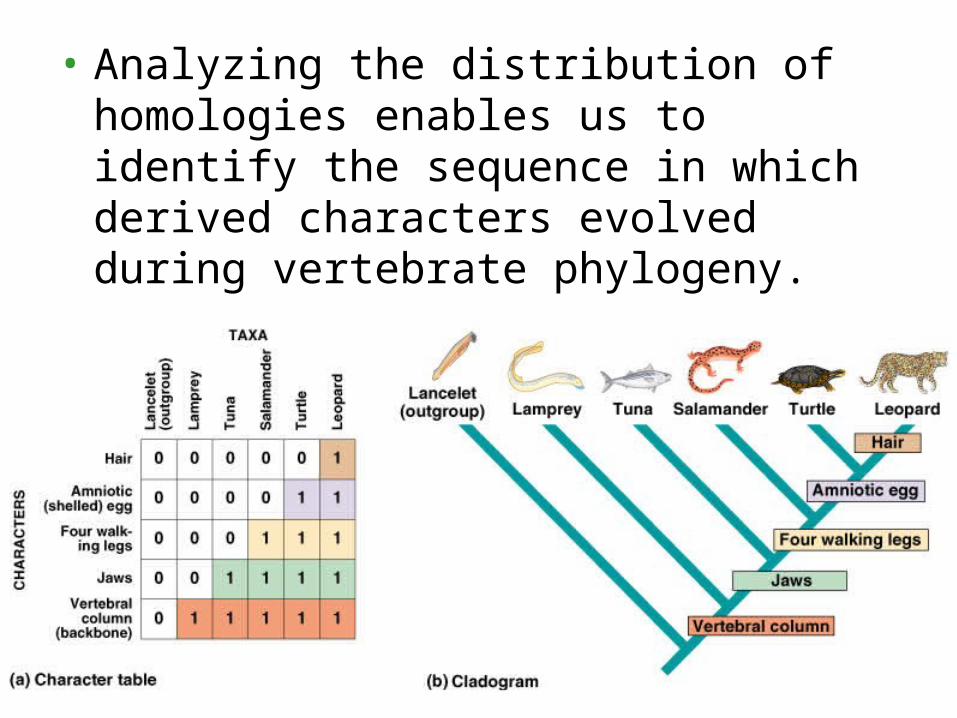
• Analyzing the distribution of homologies enables us to identify the sequence in which derived characters evolved during vertebrate phylogeny.
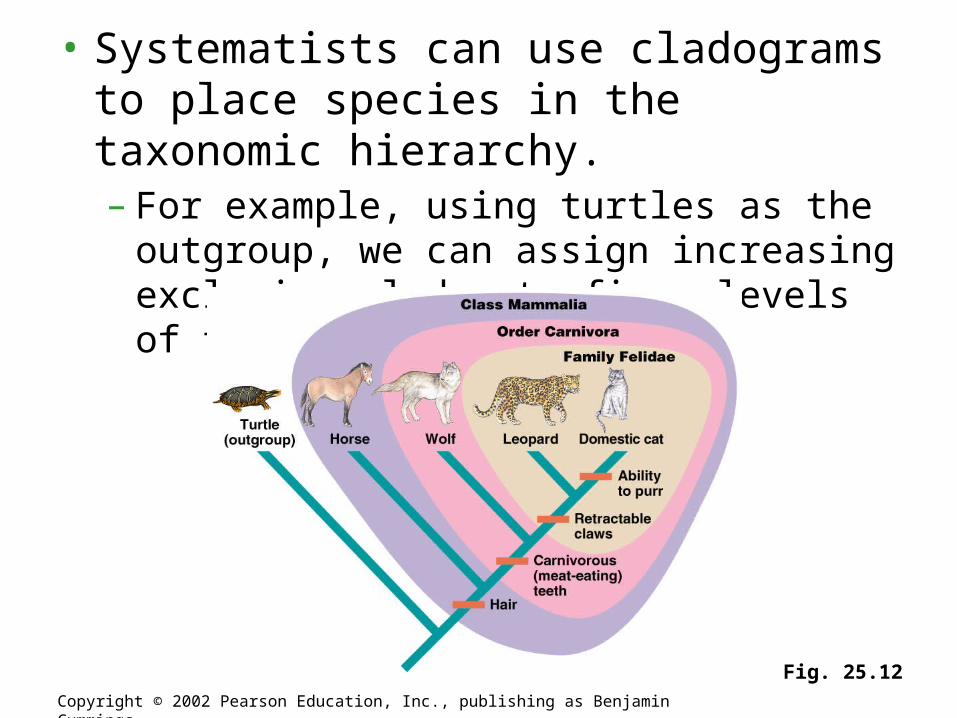
• Systematists can use cladograms to place species in the taxonomic hierarchy.– For example, using turtles as the outgroup, we can
assign increasing exclusive clades to finer levels of the hierarchy of taxa.
Copyright © 2002 Pearson Education, Inc., publishing as Benjamin Cummings
Fig. 25.12
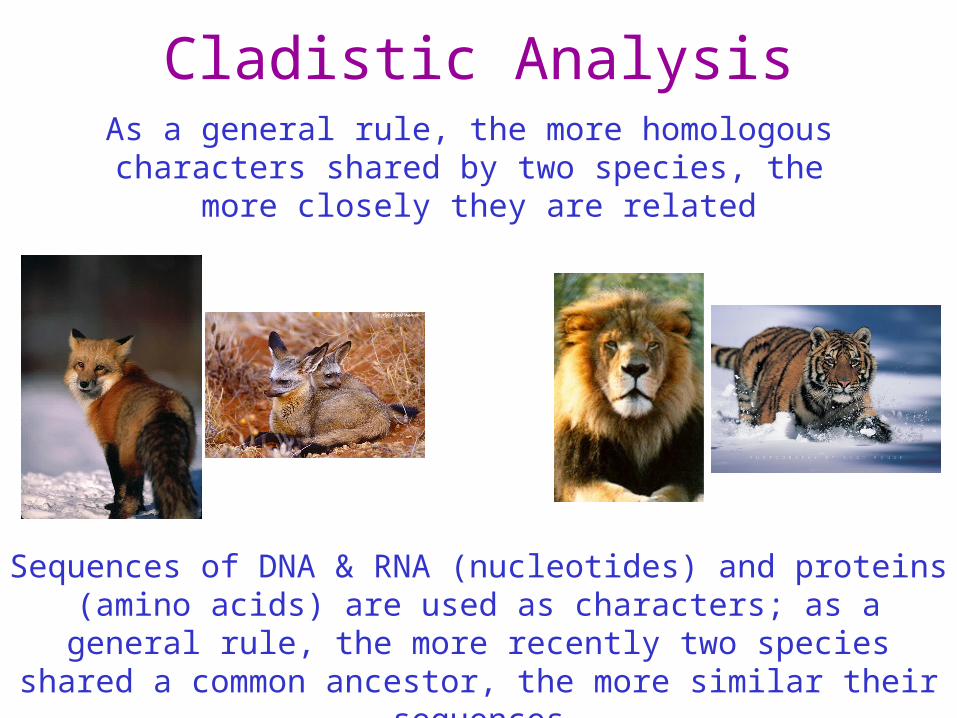
Cladistic AnalysisAs a general rule, the more homologous
characters shared by two species, the more closely they are related
Sequences of DNA & RNA (nucleotides) and proteins (amino acids) are used as characters; as a general rule, the more recently two species
shared a common ancestor, the more similar their sequences
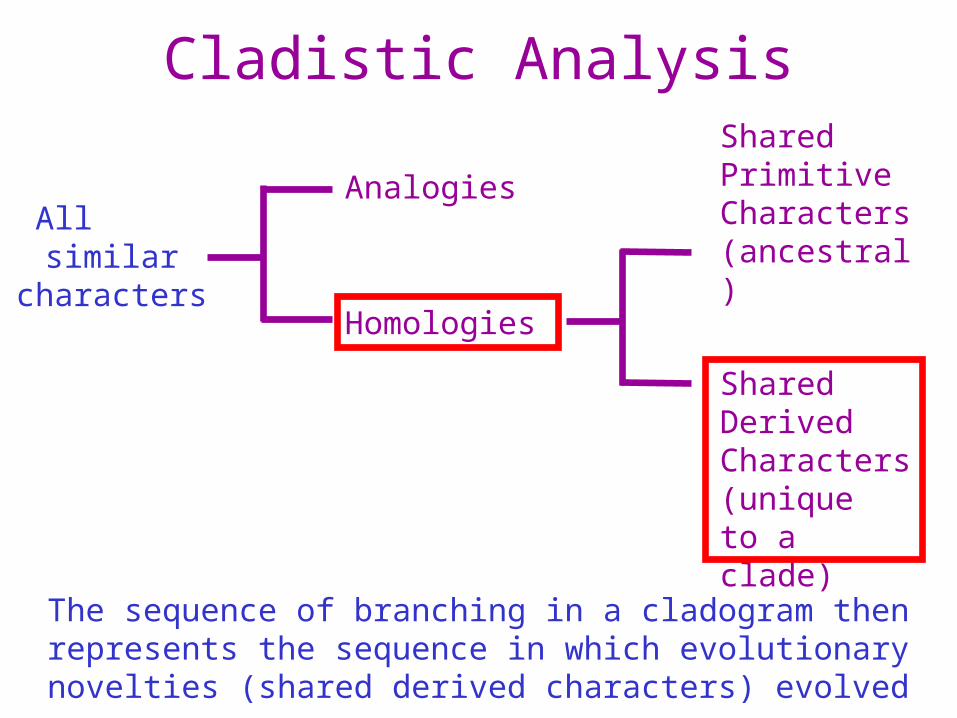
Cladistic Analysis
All similar characters
Analogies
Homologies
Shared Primitive Characters (ancestral)
Shared Derived Characters(unique to a clade)
The sequence of branching in a cladogram then represents the sequence in which evolutionary novelties (shared derived characters)
evolved
Cladistic Analysis
Fig. 25.11
Ingroup vs. Outgroup
Ingroup = the group whose relationships we are trying to resolve
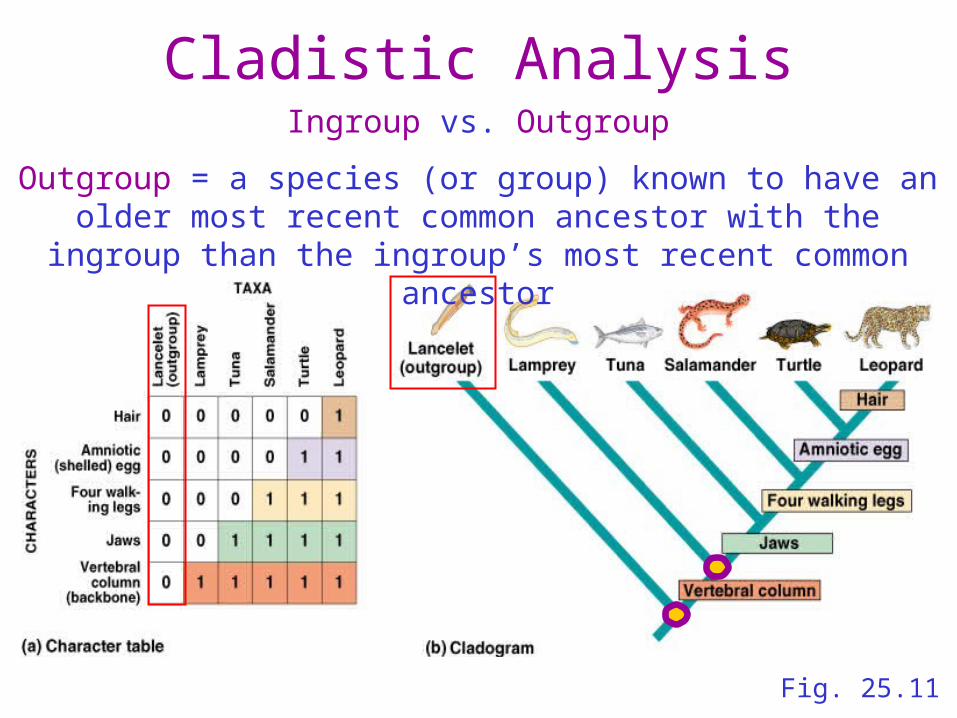
Cladistic Analysis
Fig. 25.11
Ingroup vs. Outgroup
Outgroup = a species (or group) known to have an older most recent common ancestor with the ingroup than the ingroup’s most recent
common ancestor
Cladistic Analysis
Fig. 25.11
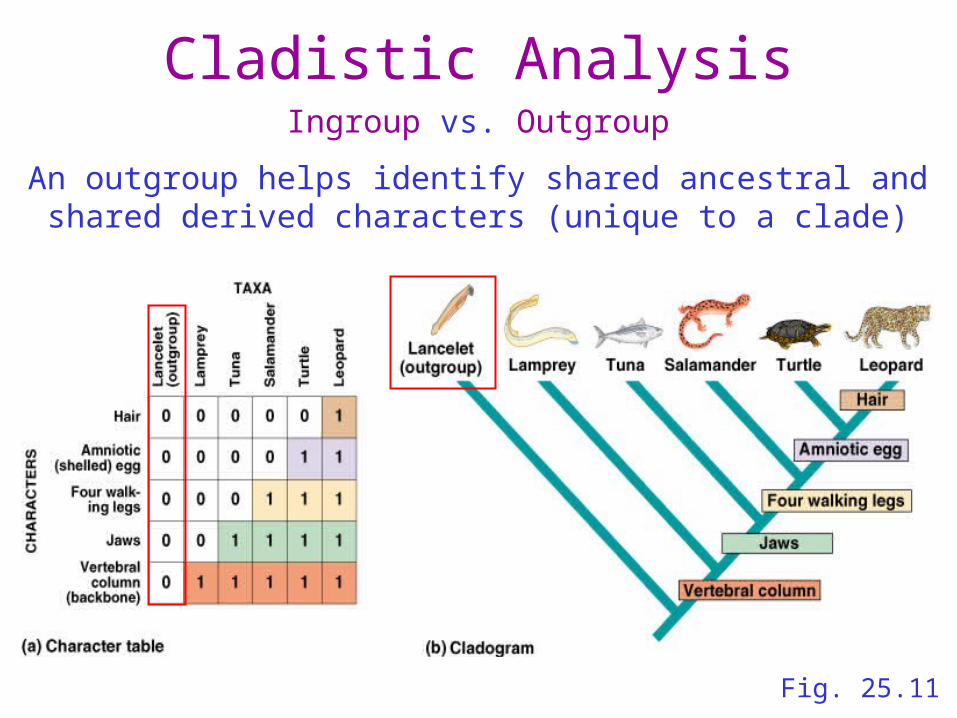
Ingroup vs. Outgroup
An outgroup helps identify shared ancestral and shared derived characters (unique to a clade)
Cladistic Analysis
Fig. 25.11
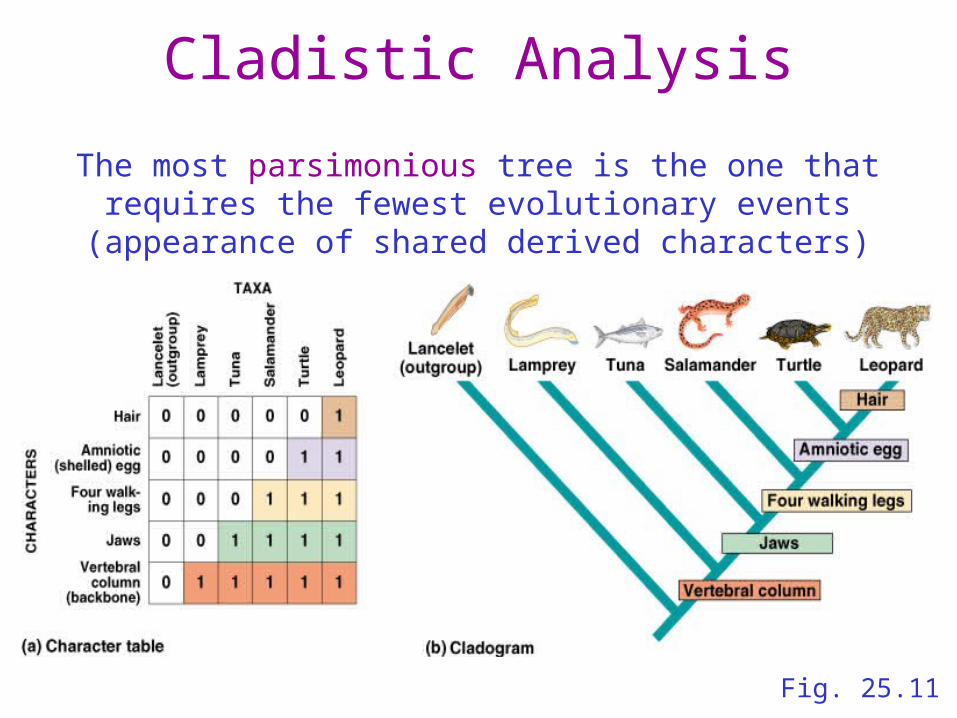
The most parsimonious tree is the one that requires the fewest evolutionary events (appearance of shared derived characters)
Cladistic Analysis
Fig. 25.11
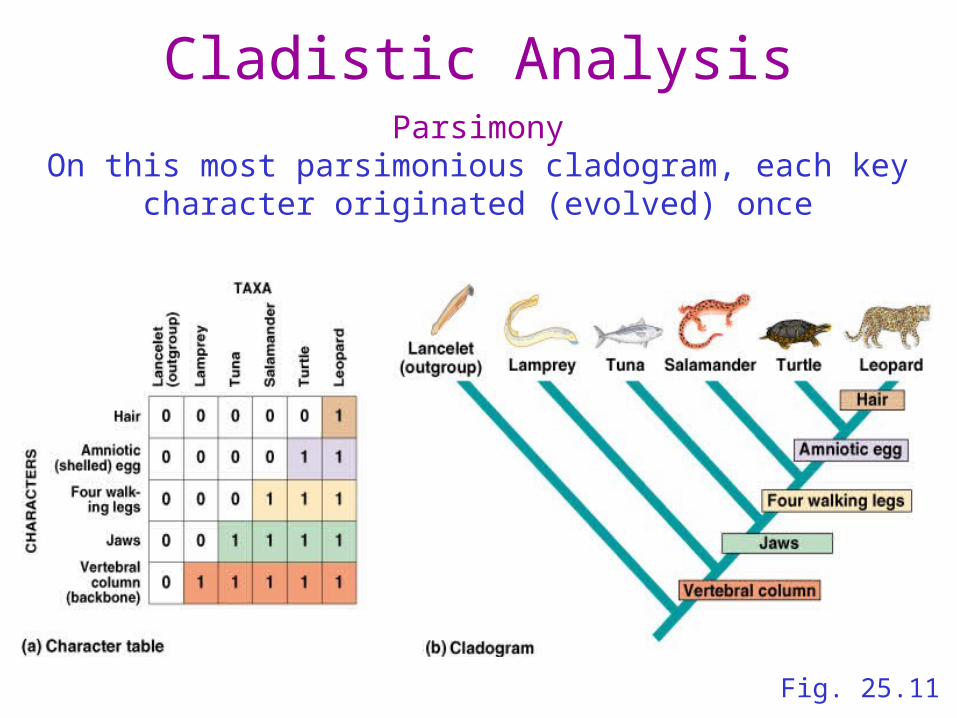
ParsimonyOn this most parsimonious cladogram, each key character originated
(evolved) once