
Taxonomy of Effortless Creation of Algorithm Visualizations Petri Ihantola, Ville Karavirta, Ari...
30
Taxonomy of Effortless Creation of Algorithm Visualizations Petri Ihantola, Ville Karavirta, Ari Korhonen and Jussi Nikander HELSINKI UNIVERSITY OF TECHNOLOGY Department of Computer Science and Engineering Laboratory of Information Processing Science
-
date post
21-Dec-2015 -
Category
Documents
-
view
215 -
download
0
Transcript of Taxonomy of Effortless Creation of Algorithm Visualizations Petri Ihantola, Ville Karavirta, Ari...

Taxonomy of Effortless Creation of Algorithm Visualizations
Taxonomy of Effortless Creation of Algorithm Visualizations
Petri Ihantola, Ville Karavirta, Ari Korhonen and Jussi Nikander
HELSINKI UNIVERSITY OF TECHNOLOGYDepartment of Computer Science and EngineeringLaboratory of Information Processing Science

ICER'05 Ari Korhonen Helsinki University of Technology
2
OutlineOutline
• What is Algorithm Visualization?
• Motivation & Objectives
• Taxonomy of Effortless Creation of AV
• Example Evaluation of 4 AV systems
• Conclusions

ICER'05 Ari Korhonen Helsinki University of Technology
3
Software VisualizationSoftware Visualization
• Visual = sight (lat.), but
• Visualization = “the power or process of forming a mental picture or vision of something not actually present to the sight”
• Research area in Software Engineering
• Algorithm Visualization is a subset of SV

ICER'05 Ari Korhonen Helsinki University of Technology
4
Example: JAWAAExample: JAWAA

ICER'05 Ari Korhonen Helsinki University of Technology
5
Areas of InterestAreas of Interest
• Visualization Techniques• Pretty-printing, graph models, program visualization,
algorithm animation, program auralization, specification styles
• Specialized Domains• Visualization of object-oriented programming,
functional programming, knowledge based systems, concurrent programs, etc.
• Visualization for Software Engineering• Integrated Development Environments (IDE)
• Visualization for Education & Evaluation

ICER'05 Ari Korhonen Helsinki University of Technology
6
MotivationMotivation
• SV research is technology driven• focus on new innovations such as
• “backward and forward animation” or• “multiple views” or• “smooth animation”
• Missing connection to CS education research• the above are “nice to have”, but do they
promote learning?
• Need for communication channel between• SV developers (SV research) and• CS educators (CSE research)

ICER'05 Ari Korhonen Helsinki University of Technology
7
ObjectivesObjectives
1. Methods and tools to analyse and evaluate Software Visualizations (SV) (in Educational context)
2. Focus on the “burden of creating new visualizations”, i.e., the time and effort required to design, integrate and maintain the visualizations
3. Taxonomy: effortlessness in AV systems

ICER'05 Ari Korhonen Helsinki University of Technology
8
Related workRelated work
• First evaluation of SV systems (2002) based on taxonomy of Price et al. (1993)• technical analysis, no link to CS education
• Questionnaire for CS educators (2004)• 22 answers (mostly from SV developers)
• Several other taxonomies and evaluations• e.g., Engagement taxonomy, Naps et al. (2003)
• The following taxonomy is a synthesis

ICER'05 Ari Korhonen Helsinki University of Technology
9
TaxonomyTaxonomy
Taxonomy of Effortless Creation of Algorithm Visualizations
1. Scope~ generic tools
2. Integrability~ list of features
3.1 Producer vs. AV system 3.2 Visualization vs. Consumer
3. Interaction~ use cases
Taxonomy3 Main Categories

ICER'05 Ari Korhonen Helsinki University of Technology
10
Category 1: ScopeCategory 1: Scope
• The range or area the tool deals with
• Generic tools like Animal or JAWAA• one can produce (almost) any kind content
• vs. non-generic tools like MatrixPro and Jeliot 3• content (almost always) related to CS education
• More fine-grained classification in the paper

ICER'05 Ari Korhonen Helsinki University of Technology
11
Example: AnimalExample: Animal
ICER'05 Ari Korhonen Helsinki University of Technology
12
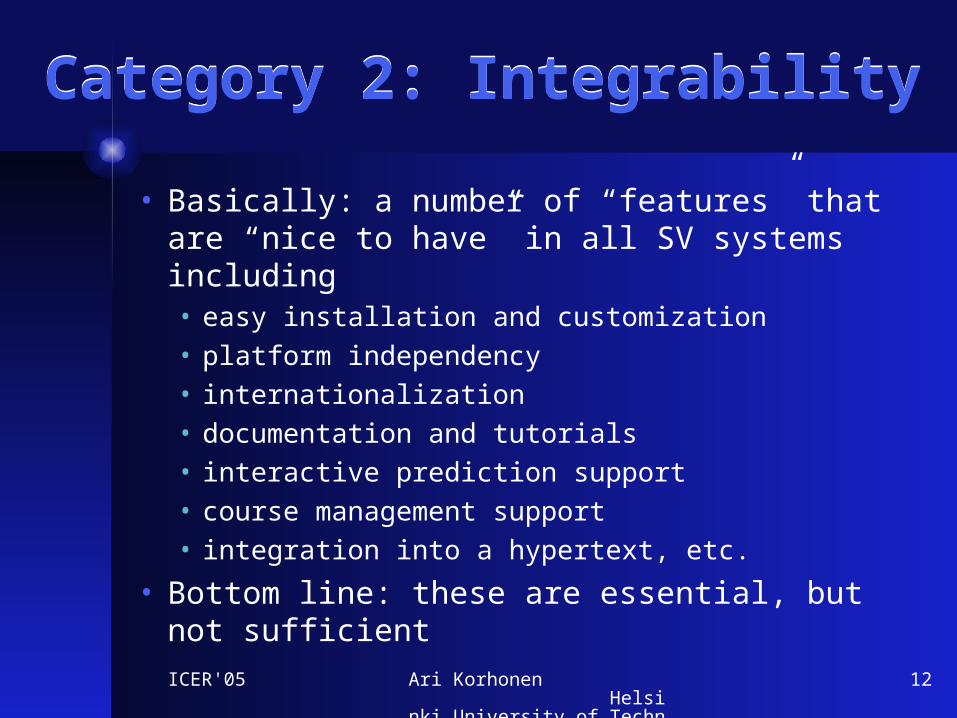
Category 2: IntegrabilityCategory 2: Integrability
• Basically: a number of “features” that are “nice to have” in all SV systems including• easy installation and customization
• platform independency
• internationalization
• documentation and tutorials
• interactive prediction support
• course management support
• integration into a hypertext, etc.
• Bottom line: these are essential, but not sufficient

ICER'05 Ari Korhonen Helsinki University of Technology
13
Category 3: InteractionCategory 3: Interaction
• Two kinds of interaction• Producer vs. System (PS)
• resulting new visualization
• Visualization vs. Consumer (VC)• use of the outcome
AV System
PS interaction VC interaction
Visualization
creation
Producer Consumer
ICER'05 Ari Korhonen Helsinki University of Technology
14
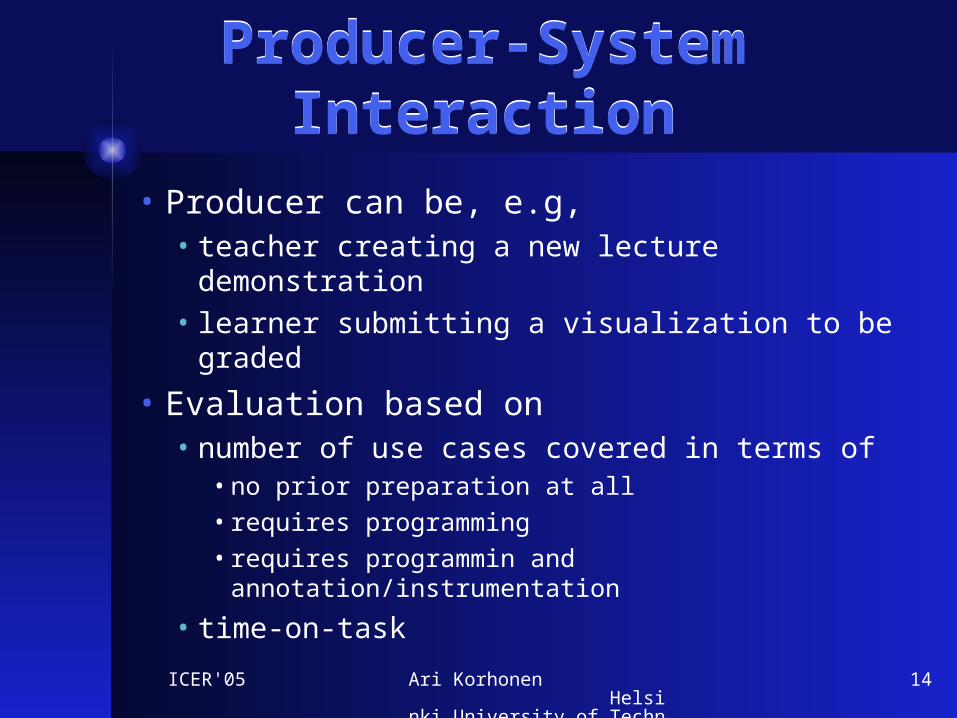
Producer-System InteractionProducer-System Interaction
• Producer can be, e.g,• teacher creating a new lecture demonstration• learner submitting a visualization to be graded
• Evaluation based on• number of use cases covered in terms of
• no prior preparation at all
• requires programming
• requires programmin and annotation/instrumentation
• time-on-task

ICER'05 Ari Korhonen Helsinki University of Technology
15
Use Cases(Based on Survey 2004)
Use Cases(Based on Survey 2004)
• Lecture• single lecture example (14)• answering strudent’s questions (14)• preparing questions for a lecture (14)
• Teaching material production• on-line illustrations (12)• static (e.g., lecturer’s notes) illustrations (12)
• Examination/summative evaluation (12)• Practice session material
• exercises (12)• demonstrations for tutor/close labs (9)• demonstrations for students/closed labs (7)• demonstrations for students/open labs (6)
ICER'05 Ari Korhonen Helsinki University of Technology
16
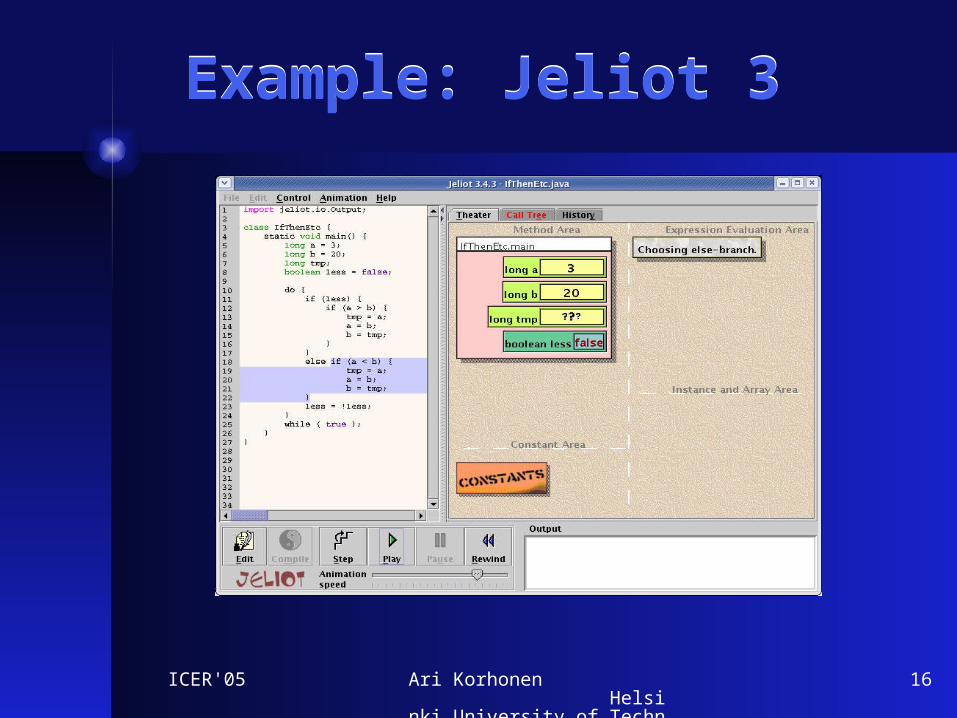
Example: Jeliot 3Example: Jeliot 3

ICER'05 Ari Korhonen Helsinki University of Technology
17
Producer-System InteractionProducer-System Interaction
• Producer can be, e.g,• teacher creating a new lecture demonstration• learner submitting a visualization to be graded
• Evaluation based on• number of use cases covered• time-on-task
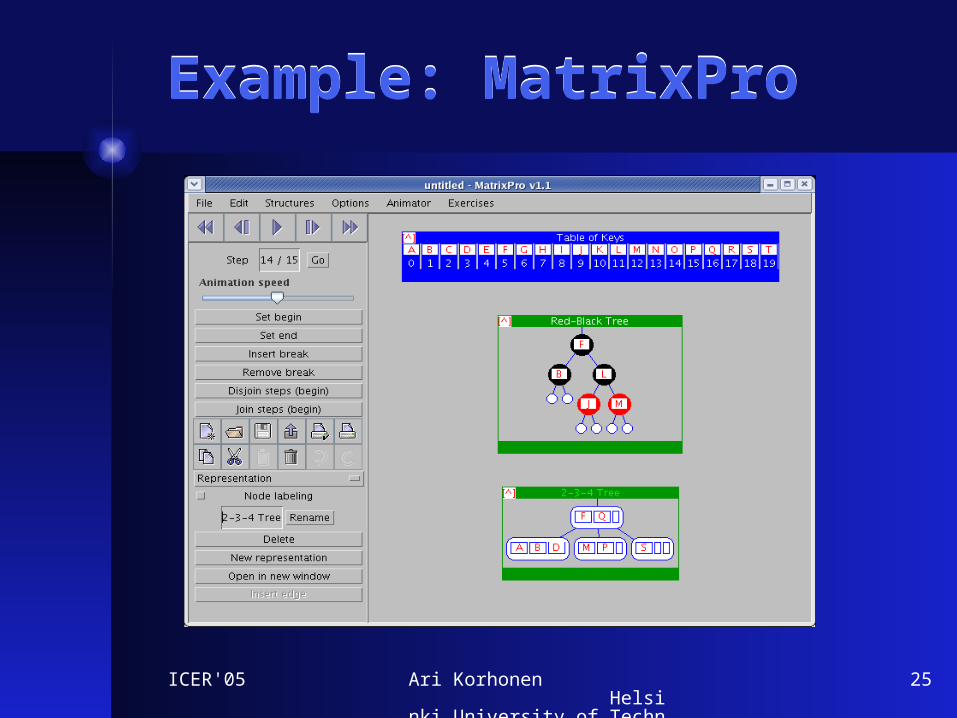
• Especially on-the-fly use like in MatrixPro• vs. prior preparation

ICER'05 Ari Korhonen Helsinki University of Technology
18
Example: MatrixProExample: MatrixPro
ICER'05 Ari Korhonen Helsinki University of Technology
19
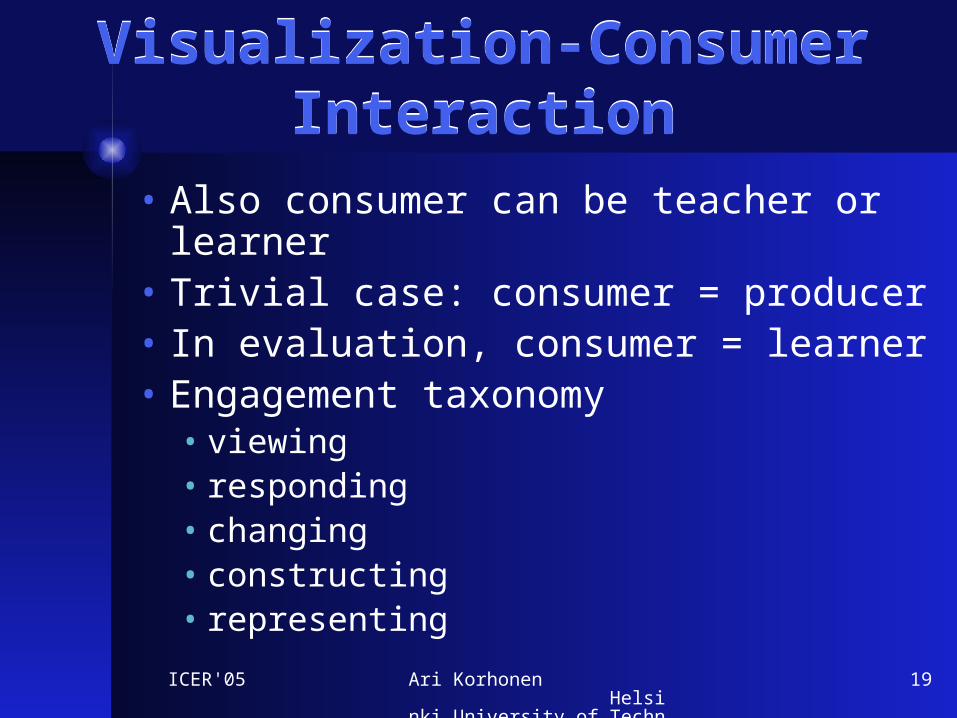
Visualization-Consumer Interaction
Visualization-Consumer Interaction
• Also consumer can be teacher or learner• Trivial case: consumer = producer• In evaluation, consumer = learner• Engagement taxonomy
• viewing• responding• changing• constructing• representing

ICER'05 Ari Korhonen Helsinki University of Technology
20
Example Evaluation of 4 Systems
Example Evaluation of 4 Systems
• Systems visualizing concepts in Algorithms and Data Structures course• Animal• JAWAA 2• Jeliot 3• MatrixPro
• Disclaimer: some other systems could have been evaluated instead or as well (actually, we did!). However, these are enough to demonstrate the taxonomy in context of algorithms and data structures.
ICER'05 Ari Korhonen Helsinki University of Technology
21
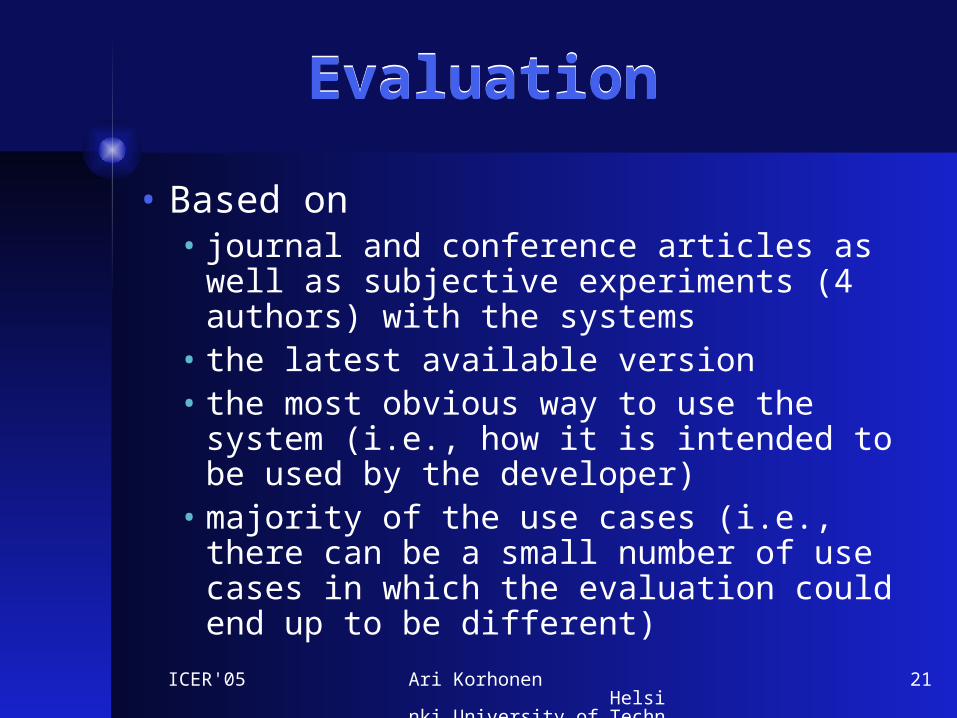
EvaluationEvaluation
• Based on • journal and conference articles as well as
subjective experiments (4 authors) with the systems
• the latest available version• the most obvious way to use the system (i.e.,
how it is intended to be used by the developer)• majority of the use cases (i.e., there can be a
small number of use cases in which the evaluation could end up to be different)

ICER'05 Ari Korhonen Helsinki University of Technology
22
Example: JAWAAExample: JAWAA
JAWAA animationbased on instrumentingcode (interesting events)
Separate editor available

ICER'05 Ari Korhonen Helsinki University of Technology
23
Example: AnimalExample: Animal

ICER'05 Ari Korhonen Helsinki University of Technology
24
Example: Jeliot 3Example: Jeliot 3
ICER'05 Ari Korhonen Helsinki University of Technology
25
Example: MatrixProExample: MatrixPro

ICER'05 Ari Korhonen Helsinki University of Technology
26
Results: IntegrabililtyResults: Integrabililty
• All the example systems fulfill most of the requirements• Actually, the systems were selected based on
some of these criteria in the first place :-)• i.e., we ruled out systems that we could not find
(anymore), install, etc.
• None of the requirements seems to be impossible to implement in an AV system
• There is no correlation to the other categories

ICER'05 Ari Korhonen Helsinki University of Technology
27
Results: Scope & InteractionResults: Scope & Interaction
Scope• Animal and JAWAA
can be considered to be general purpose systems, i.e. generic
• MatrixPro and Jeliot 3 are domain-specific tools, i.e., applicable only in CSE
Interaction• MatrixPro can be used on-
the-fly• Jeliot 3 requires
programming and do not support interactive prediction
• Animal and JAWAA require programming and annotation and do not support all the levels of engagement taxonomy

ICER'05 Ari Korhonen Helsinki University of Technology
28
ResultsResults
Scope
domain-specific
Interaction
generic
course-specific
lesson-specific
programming+annotation
programming on-the-flyuse
Animal &JAWAA
Jeliot 3MatrixPro
killerapplication?

ICER'05 Ari Korhonen Helsinki University of Technology
29
ConclusionsConclusions
• Taxonomy of Effortless Creation of AV• 3 categories: scope, integrability, interaction• Applicable only for educational software
• Example evaluation of 4 systems• Integrability important, but not sufficient• Correlation between scope and interaction:
• what a system gains in generality it loses in its level of interaction and vice versa
• No killer applications (yet?) for Data Structures and Algorithms
• In the future, more feedback from the educators needed in order to develop systems further

ICER'05 Ari Korhonen Helsinki University of Technology
30
Thank You!Thank You!
Any questions or comments?


![oh3abn.netoh3abn.net/sivut/wp-content/uploads/2016/11/VRCNosa2.pdf · Author: Ilmari Nikander [ ILMARI ] Created Date: 20101203115851Z](https://static.fdocuments.in/doc/165x107/5f0575377e708231d4130fb1/-author-ilmari-nikander-ilmari-created-date-20101203115851z.jpg)
