
Tax cute in tough times - who really gains?
25
Tax cuts in tough times – who really gains? Gavin Kelly – Resolution Foundation Matthew Whittaker – Resolution Foundation Tim Montgomerie – The Times Polly Toynbee – The Guardian Stephen Tall – Lib Dem Voice Gary Gibbon – Channel 4 #taxcuts
-
Upload
resolutionfoundation -
Category
Economy & Finance
-
view
354 -
download
0
Transcript of Tax cute in tough times - who really gains?

Tax cuts in tough times – who really gains?
Gavin Kelly – Resolution Foundation
Matthew Whittaker – Resolution Foundation
Tim Montgomerie – The Times
Polly Toynbee – The Guardian
Stephen Tall – Lib Dem Voice
Gary Gibbon – Channel 4#taxcuts

Tax cuts in tough times –
who really gains?
November 2014
Gavin Kelly & Matthew Whittaker

Been here before:
• Promises of tax cuts often precede post-election tax rises
But also an especially challenging context:
• Fall in living standards politics tax cuts
• Big deficit and fiscal constraint economics tax rises
Pre-election promises

All parties are pointing to some tax cuts
Different scale
Different sources of funding
(with distributional implications)
Shared rhetoric of supporting households on low to middle incomes/ low paid
Shared ‘candour deficit’ about tax rises/implications of fiscal tightening
Assessing the current debateSome differences, some similarities

Focused on tax cuts for low earners?
What about NI (‘forgotten’ tax payers)
Focused on disposable income of low to middle income families?
What about Universal Credit
Silence on both.....
Assessing the current debateSome shared blind spots

Our starting point?
• Even if tightening overall: still case for tax reform
• Context means distributional choices matter even more
• All proposals must be fully funded
Caveats• Raising living standards clearly depend on wider factors
• Narrow focus today on personal tax/in-work benefits
• If fiscal position deteriorates further then all bets off...
Presenting the alternativesSome important caveats

Recent – and proposed future – focus on incometax cuts does nothing for 5m lowest paid
Each increase in the personal allowance has increased the
number of employees who
no longer benefit from
further movements
Notes: Includes removal of marriage tax allowance. Source: RF analysis using IPPR tax benefit model

Recent – and proposed future – focus on incometax cuts does nothing for 5m lowest paid
By April 2015, gap between employee NI
threshold and personal
allowance will stand at around
£2,500
Notes: Includes removal of marriage tax allowance. Source: RF analysis using IPPR tax benefit model
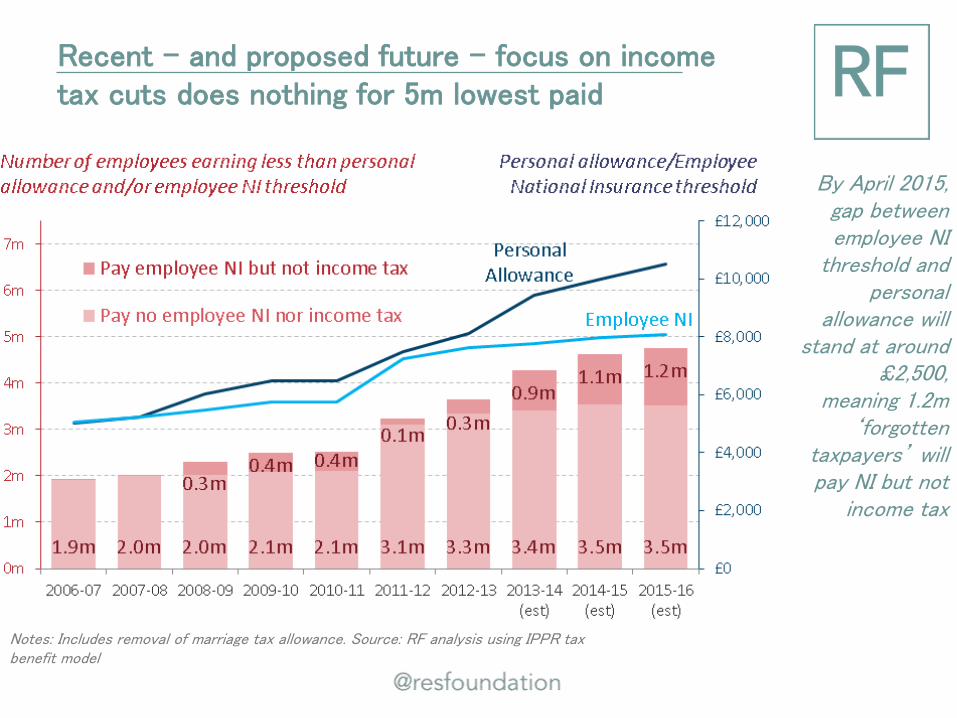
Recent – and proposed future – focus on incometax cuts does nothing for 5m lowest paid
By April 2015, gap between employee NI
threshold and personal
allowance will stand at around
£2,500, meaning 1.2m
‘forgotten taxpayers’ will pay NI but not
income tax
Notes: Includes removal of marriage tax allowance. Source: RF analysis using IPPR tax benefit model

Lib Dem approach provides biggest proportional gain in deciles 6-8 in 2020-21
Based on increasing
personal allowance to
£12.5k in April 2020 and removing
marriage tax allowance
Notes: Includes removal of marriage tax allowance. Source: RF analysis using IPPR tax benefit model

Conservative approach provides biggest proportional gain in deciles 7-9 in 2020-21
Based on increasing
personal allowance to
£12.5k in April 2020 and
raising higher rate threshold
to £50k
Source: RF analysis using IPPR tax benefit model

UKIP approach provides biggest proportional gain in deciles 7-9 in 2020-21
Based on increasing
personal allowance to
£13.5k in April 2020 (it might
be FAR higher) and introducing a 35p tax band that stretches from £47k to £61k by 2020
Notes: We model £13.5k PA in 2020, but UKIP’s proposal could be interpreted as equating to a level closer to £16k by then. 35p band is promised between existing higher rate threshold and £55k, we assume it rises with inflation over the course of the parliament. Source: RF analysis using IPPR tax benefit model

Labour approach provides biggest proportional gain in deciles 6-8 in 2020-21
10p band on the first £300
of income above the
personal allowance in 2016 (rising
with inflation for rest of
parliament). Labour say:
paid for by removing
marriage tax allowance
Notes: Includes removal of marriage tax allowance. Source: RF analysis using IPPR tax benefit model

Proposals vary hugely in size (and in regressivity) – but all skewed upwards
Modelled proposals vary from a cost of £900m to (at least) £13bn,
but households in the top half of the income
distribution consistently do
best
Source: RF analysis using IPPR tax benefit model

Clear majority of gains go to households in the top half of the distribution
Notes: Distribution of gains per £1 spent on the different proposals as modelled in 2020-21. Source: RF analysis using IPPR tax benefit model
Based on the distribution of costs
across household income deciles

Bottom half of households account for no morethan a quarter of the cost in all cases
Notes: Distribution of gains per £1 spent on the different proposals as modelled in 2020-21. Source: RF analysis using IPPR tax benefit model
Of every £1 spent, the bottom 50% account for
25p under the Lib Dems
24p under Labour
19p under UKIP
18p under the Conservatives

Top fifth of households account for between one-third and one-half
Notes: Distribution of gains per £1 spent on the different proposals as modelled in 2020-21. Source: RF analysis using IPPR tax benefit model
Of every £1 spent,the top 20% account for
31p under the Lib Dems
34p under Labour
43p under UKIP
46p under the Conservatives

Focusing support on work allowances underUC is more targeted
Based on a 20% increase in
‘lower’ work allowances and corresponding
cash increases in ‘higher’
work allowances
Source: RF analysis using IPPR tax benefit model

Combined – and funded – package provides more progressive outcome
Based on a 20% increase in
work allowances and realignment of
NI threshold and PA
Paid for via 3-year freeze in
PA; 2-year freeze in basic
rate limit; extension of NI to workers over
the state pension age
Source: RF analysis using IPPR tax benefit model

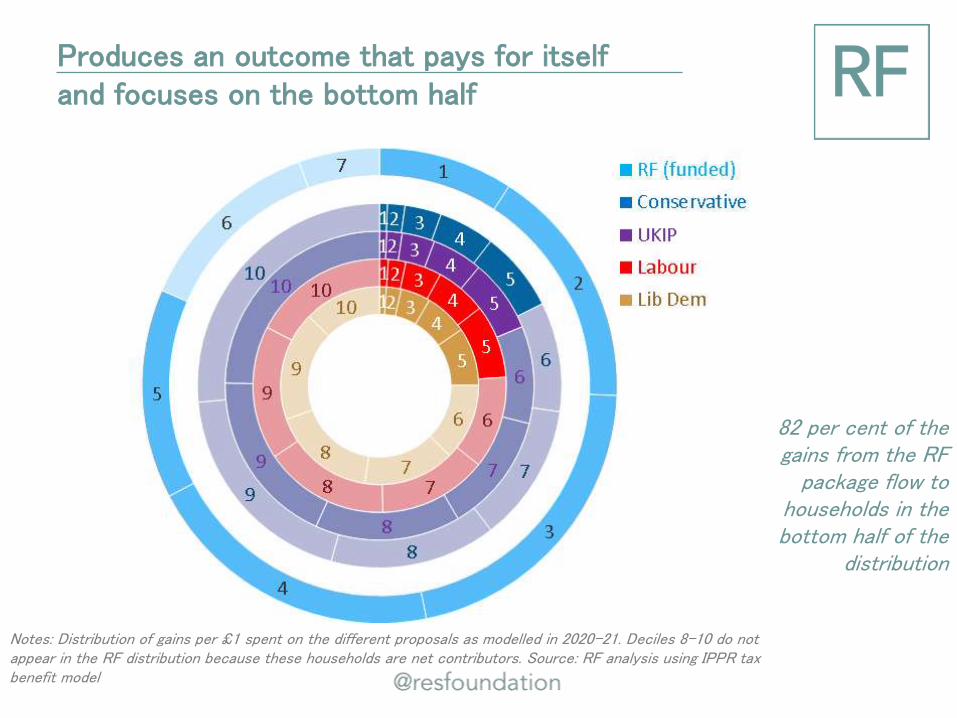
Produces an outcome that pays for itself and focuses on the bottom half
Notes: Distribution of gains per £1 spent on the different proposals as modelled in 2020-21. Deciles 8-10 do not appear in the RF distribution because these households are net contributors. Source: RF analysis using IPPR tax benefit model
82 per cent of the gains from the RF
package flow to households in the bottom half of the
distribution

• Unlike party promises, benefits enjoyed by low to middle income households, working-age, families with children and those earning less than £10.5k
Very different set of outcomes from theparty approaches

• Unlike party promises, benefits enjoyed by low to middle income households, working-age, families with children and those earning less than £10.5k
• Other benefits include:
– Reduced effective tax rates for some lower earners
– Major simplification of tax system
– Pre-requisite for integration of NI with income tax
Very different set of outcomes from theparty approaches

• Parties’ focus on income tax cuts are hard to justify during fiscally tough times
• They all miss the purported target. No rationale for benefiting those above £10.5k while ignoring those on £8k
• UC work allowances provide more targeted support
• As part of a majoritarian package that prioritises work allowances, raising the NI threshold is clearly better than raising the personal allowance and simplifies tax system
Other packages could be pursued – but the principle of prioritising UC remains

Tax cuts in tough times – who really gains?
Gavin Kelly – Resolution Foundation
Matthew Whittaker – Resolution Foundation
Tim Montgomerie – The Times
Polly Toynbee – The Guardian
Stephen Tall – Lib Dem Voice
Gary Gibbon – Channel 4#taxcuts