Taubman Centers, Inc. Issues Third Quarter...
15
Taubman Centers, Inc. Issues Third Quarter Results - Trailing 12-month Mall Tenant Sales Per Square Foot $802, Up 2.8 Percent - Fifth Consecutive Quarter of Positive Sales Growth BLOOMFIELD HILLS, Mich., Nov. 1, 2017 - - Taubman Centers, Inc. (NYSE: TCO) today reported financial results for the third quarter of 2017. September 30, 2017 Three Months Ended (1) September 30, 2016 Three Months Ended September 30, 2017 Nine Months Ended (1) September 30, 2016 Nine Months Ended (2) Net income attributable to common shareowners, diluted (in thousands) Growth rate $4,370 (76.7)% $18,794 $35,090 (55.2)% $78,254 Net income attributable to common shareowners (EPS) per diluted common share Growth rate $0.07 (77.4)% $0.31 $0.58 (55.0)% $1.29 Funds from Operations (FFO) per diluted common share Growth rate $0.77 (18.1)% $0.94 $2.49 (11.7)% $2.82 Adjusted Funds from Operations (Adjusted FFO) per diluted common share Growth rate $0.83 (11.7)% $0.94 $2.67 3.9% $2.57 (1) Adjusted FFO for the three and nine month periods ended September 30, 2017 excludes a restructuring charge and costs associated with shareowner activism. In addition, Adjusted FFO for the nine months ended September 30, 2017 excludes a charge recognized in connection with the partial write-off of deferred financing costs related to an amendment of the company’s primary line of credit in February 2017. (2) Adjusted FFO for the nine month period ended September 30, 2016 excludes a $21.7 million ($0.25 per share) lump sum termination payment the company received in the second quarter of 2016 for the termination of the company’s leasing services agreement at The Shops at Crystals (Las Vegas, Nev.). “Earnings were generally in line with our expectations. Higher rent per square foot and lower general and administrative expenses contributed to our results,” said Robert S. Taubman, chairman, president and chief executive officer of Taubman Centers. The company’s year-over-year results were impacted by two positive, one-time items that occurred in the third quarter last year, including a post-closing adjustment related to the sale of seven centers in 2014 and a one-time development success fee in Asia. These nonrecurring items contributed $0.08 to FFO and Adjusted FFO per share in the third quarter last year. -more- Taubman Centers, Inc. 200 East Long Lake Road Suite 300 Bloomfield Hills, Michigan 48304-2324 T 248.258.6800 www.taubman.com
Transcript of Taubman Centers, Inc. Issues Third Quarter...

Taubman Centers, Inc. Issues Third Quarter Results
- Trailing 12-month Mall Tenant Sales Per Square Foot $802, Up 2.8 Percent - Fifth Consecutive Quarter of Positive Sales Growth
BLOOMFIELD HILLS, Mich., Nov. 1, 2017 - - Taubman Centers, Inc. (NYSE: TCO) today reported financial results for the third quarter of 2017.
September 30, 2017
Three Months Ended (1)
September 30, 2016
Three Months Ended
September 30, 2017
Nine Months Ended (1)
September 30, 2016
Nine Months Ended (2)
Net income attributable to common shareowners, diluted (in thousands) Growth rate
$4,370 (76.7)%
$18,794
$35,090 (55.2)%
$78,254
Net income attributable to common shareowners (EPS) per diluted common share Growth rate
$0.07
(77.4)%
$0.31
$0.58
(55.0)%
$1.29
Funds from Operations (FFO) per diluted common share Growth rate
$0.77
(18.1)%
$0.94
$2.49
(11.7)%
$2.82
Adjusted Funds from Operations (Adjusted FFO) per diluted common share Growth rate
$0.83
(11.7)%
$0.94
$2.67 3.9%
$2.57
(1) Adjusted FFO for the three and nine month periods ended September 30, 2017 excludes a restructuring charge and costs associated with shareowner activism. In addition, Adjusted FFO for the nine months ended September 30, 2017 excludes a charge recognized in connection with the partial write-off of deferred financing costs related to an amendment of the company’s primary line of credit in February 2017.
(2) Adjusted FFO for the nine month period ended September 30, 2016 excludes a $21.7 million ($0.25 per share) lump sum termination payment the company received in the second quarter of 2016 for the termination of the company’s leasing services agreement at The Shops at Crystals (Las Vegas, Nev.).
“Earnings were generally in line with our expectations. Higher rent per square foot and lower general and administrative expenses contributed to our results,” said Robert S. Taubman, chairman, president and chief executive officer of Taubman Centers. The company’s year-over-year results were impacted by two positive, one-time items that occurred in the third quarter last year, including a post-closing adjustment related to the sale of seven centers in 2014 and a one-time development success fee in Asia. These nonrecurring items contributed $0.08 to FFO and Adjusted FFO per share in the third quarter last year.
-more-
Taubman Centers, Inc. 200 East Long Lake Road Suite 300 Bloomfield Hills, Michigan 48304-2324
T 248.258.6800 www.taubman.com
Taubman Centers/2 Operating Statistics Year-to-date total portfolio net operating income (NOI) was up 14.2 percent. For the quarter, total portfolio NOI was up 6.7 percent. Year-to-date comparable center NOI was up 2.3 percent (up 0.7 percent excluding lease cancellation income). For the quarter, comparable center NOI was down 1.3 percent (down 1.7 percent excluding lease cancellation income). Bad debt expense in the quarter was higher than last year, and impacted the quarterly NOI by 1.4 percent. The company's 12-month trailing comparable center mall tenant sales per square foot was $802, up 2.8 percent. Comparable center mall tenant sales per square foot increased 1.6 percent in the quarter. Year-to-date, mall tenant sales per square foot were up 2 percent. The company continues to backfill space created by the elevated level of tenant bankruptcies and store closures that occurred across the industry in late 2016 and in 2017. Leased space in comparable centers was 96.3 percent on September 30, 2017, 2.7 percent greater than in-place occupancy. Leased space in all centers was 95.9 percent, 2.4 percent greater than in-place occupancy and up 1 percent from June 30, 2017. Ending occupancy in comparable centers was 93.6 percent on September 30, 2017, down 1.4 percent from the prior year. The company expects ending occupancy in comparable centers to reach 96 percent by year-end. Ending occupancy in all centers was 93.5 percent on September 30, 2017, flat to last year, and up 0.8 percent from June 30, 2017. Average rent per square foot was $60.61 in the quarter, up 0.6 percent from $60.23 in the comparable period last year. Year-to-date, average rent per square foot was up 1 percent. Trailing 12-month releasing spreads per square foot for the period ended September 30, 2017 were 6.7 percent. As in the second quarter, a small number of leases with average lease terms of less than two-and-a-half years had a significant impact. Without these leases, spreads were over 15 percent. “As a whole, these operating statistics are solid in an otherwise highly volatile retail environment,” said Mr. Taubman. “We are well positioned with best-in-class assets that continue to enjoy very good demand for space.” Hurricane Irma On September 6 and September 9, Hurricane Irma made landfall in Puerto Rico and Florida, respectively. The company’s property in San Juan and five centers in Florida were minimally impacted. Damage was primarily limited to fallen trees, uprooted landscaping and signage. The company’s six centers were closed between four and 11 days following the hurricane, primarily due to power outages. No significant financial impact occurred as a result of Hurricane Irma.
-more-

Taubman Centers/3 Hurricane Maria On September 20, Hurricane Maria made landfall in Puerto Rico. Due to the impact of the hurricane and resulting power outage, The Mall of San Juan was closed for approximately one month. The center has reopened with reduced hours and 55 of approximately 90 tenants are now operating. Restoration efforts for the tenant spaces that were impacted are ongoing, and the company expects more retailers to reopen by the Holiday season. Both Nordstrom and Saks Fifth Avenue sustained significant damage, and the timing of their reopenings is still uncertain. The company maintains substantial insurance to cover hurricane and flood damage, as well as business interruption, with a single deductible of $2 million. As a result of Hurricane Maria and the substantial impact on the center’s performance for the foreseeable future, The Mall of San Juan has been excluded from the company’s comparable center guidance measures and operating statistics. 2017 Guidance The company is updating its 2017 EPS and FFO guidance. 2017 EPS is now expected to be in the range of $0.80 to $1.00 per diluted common share, revised from the previous range of $1.03 to $1.23. 2017 FFO is now expected to be in the range of $3.49 to $3.59 per diluted common share, revised from the previous range of $3.53 to $3.63. The company is reaffirming its previous 2017 Adjusted FFO guidance. Adjusted FFO, which excludes $0.18 per diluted common share of year-to-date adjustments, is expected to be in the range of $3.67 to $3.77 per diluted common share. The company’s 2017 Adjusted FFO is more likely to be in the lower end of the range, as the operations of The Mall of San Juan will be impacted by Hurricane Maria. The company previously assumed the NOI contribution from The Mall of San Juan would be about $3.5 million in the fourth quarter. Due to the substantial impact of the hurricane, the center’s fourth quarter performance will be lower. The Company anticipates that the adverse impact to the operations of the mall will be substantially mitigated by business interruption insurance. However, business interruption insurance proceeds are not likely to be received in the current year. The company is also reaffirming its previous comparable center NOI guidance. Including lease cancellation income, comparable center NOI is expected to be in the range of 1 to 3 percent for the year. Excluding lease cancellation income, comparable center NOI growth is expected to be in the range of flat to 2 percent. The company’s guidance does not reflect any future costs that may be incurred related to shareowner activism or certain ongoing restructuring activities.
-more-

Taubman Centers/4 Supplemental Investor Information Available The company provides supplemental investor information along with its earnings announcements, available online at www.taubman.com under “Investors.” This includes the following:
• Company Information • Income Statements • Earnings Reconciliations • Changes in Funds from Operations and Earnings Per Common Share • Components of Other Income, Other Operating Expense, and Nonoperating Income
(Expense), Net • Balance Sheets • Debt Summary • Other Debt, Equity and Certain Balance Sheet Information • Redevelopments and Disposition • Capital Spending • Operational Statistics • Summary of Key Guidance Measures • Owned Centers • Major Tenants in Owned Portfolio • Anchors in Owned Portfolio • Operating Statistics Glossary
Investor Conference Call The company will host a conference call at 10:00 a.m. EDT on Thursday, November 2 to discuss these results, business conditions and the company’s outlook for the remainder of 2017. The conference call will be simulcast at www.taubman.com. An online replay will follow shortly after the call and continue for approximately 90 days.
About Taubman
Taubman Centers is an S&P MidCap 400 Real Estate Investment Trust engaged in the ownership, management and/or leasing of 27 regional, super-regional and outlet shopping centers in the U.S. and Asia. Taubman’s U.S.-owned properties are the most productive in the publicly held U.S. regional mall industry. Founded in 1950, Taubman is headquartered in Bloomfield Hills, Mich. Taubman Asia, founded in 2005, is headquartered in Hong Kong. www.taubman.com. For ease of use, references in this press release to “Taubman Centers,” “company,” “Taubman” or an operating platform mean Taubman Centers, Inc. and/or one or more of a number of separate, affiliated entities. Business is actually conducted by an affiliated entity rather than Taubman Centers, Inc. itself or the named operating platform.
-more-

Taubman Centers/5 This press release may contain forward-looking statements within the meaning of Section 27A of the Securities Act of 1933, as amended, and Section 21E of the Securities Exchange Act of 1934, as amended. These statements reflect management's current views with respect to future events and financial performance. Forward-looking statements can be identified by words such as “will”, “may”, “could”, “expect”, “anticipate”, “believes”, “intends”, “should”, “plans”, “estimates”, “approximate”, “guidance” and similar expressions in this press release that predict or indicate future events and trends and that do not report historical matters. The forward-looking statements included in this release are made as of the date hereof. Except as required by law, the company assumes no obligation to update these forward-looking statements, even if new information becomes available in the future. Actual results may differ materially from those expected because of various risks, uncertainties and other factors. Such factors include, but are not limited to: changes in market rental rates; unscheduled closings or bankruptcies of tenants; relationships with anchor tenants; trends in the retail industry; the liquidity of real estate investments; the company’s ability to comply with debt covenants; the availability and terms of financings; changes in market rates of interest and foreign exchange rates for foreign currencies; changes in value of investments in foreign entities; the ability to hedge interest rate and currency risk; risks related to acquiring, developing, expanding, leasing and managing properties; changes in value of investments in foreign entities; risks related to joint venture properties; insurance costs and coverage; security breaches that could impact the company’s information technology, infrastructure or personal data; the loss of key management personnel; shareholder activism costs and related diversion of management time; terrorist activities; maintaining the company’s status as a real estate investment trust; changes in the laws of states, localities, and foreign jurisdictions that may increase taxes on the company’s operations; and changes in global, national, regional and/or local economic and geopolitical climates. You should review the company's filings with the Securities and Exchange Commission, including “Risk Factors” in its most recent Annual Report on Form 10-K and subsequent quarterly reports, for a discussion of such risks and uncertainties. CONTACTS: Ryan Hurren, Taubman, Director, Investor Relations, 248-258-7232 [email protected] Maria Mainville, Taubman, Director, Strategic Communications, 248-258-7469 [email protected]
# # #

Taubman Centers/6
TAUBMAN CENTERS, INC.Table 1 - Summary of ResultsFor the Periods Ended September 30, 2017 and 2016(in thousands of dollars, except as indicated)
Three Months Ended Year to Date2017 2016 2017 2016
Net income 14,251 35,184 74,673 137,257Noncontrolling share of income of consolidated joint ventures (1,230) (1,662) (4,279) (5,813)Noncontrolling share of income of TRG (2,298) (8,449) (16,302) (34,435)Distributions to participating securities of TRG (576) (537) (1,723) (1,573)Preferred stock dividends (5,784) (5,784) (17,353) (17,353)Net income attributable to Taubman Centers, Inc. common shareowners 4,363 18,752 35,016 78,083Net income per common share - basic 0.07 0.31 0.58 1.29Net income per common share - diluted 0.07 0.31 0.58 1.29Beneficial interest in EBITDA - Combined (1) 115,054 121,201 362,225 357,572Adjusted beneficial interest in EBITDA - Combined (1) 120,305 121,201 375,474 335,870Funds from Operations attributable to partnership unitholders and participating securities of TRG (1) 66,397 81,431 215,505 244,271Funds from Operations attributable to TCO's common shareowners (1) 47,443 57,556 152,946 172,617Funds from Operations per common share - basic (1) 0.78 0.95 2.52 2.86Funds from Operations per common share - diluted (1) 0.77 0.94 2.49 2.82Adjusted Funds from Operations attributable to partnership unitholders and participating securities of TRG (1) 71,648 81,431 231,981 222,569Adjusted Funds from Operations attributable to TCO's common shareowners (1) 50,775 57,556 164,330 157,282Adjusted Funds from Operations per common share - basic (1) 0.84 0.95 2.71 2.61Adjusted Funds from Operations per common share - diluted (1) 0.83 0.94 2.67 2.57Weighted average number of common shares outstanding - basic 60,710,184 60,396,902 60,654,026 60,341,863Weighted average number of common shares outstanding - diluted 60,999,151 60,831,063 61,018,855 60,774,789Common shares outstanding at end of period 60,712,037 60,405,097Weighted average units - Operating Partnership - basic 85,667,417 85,450,379 85,622,460 85,400,667Weighted average units - Operating Partnership - diluted 86,827,646 86,755,801 86,858,551 86,704,855Units outstanding at end of period - Operating Partnership 85,667,471 85,451,376Ownership percentage of the Operating Partnership at end of period 70.9% 70.7%Number of owned shopping centers at end of period 24 23
Operating Statistics:Net Operating Income - total portfolio growth % (1) 6.7% 10.6% 14.2% 8.8 %Net Operating Income excluding lease cancellation income - growth % (1)(2) -1.7% 4.5% 0.7% 5.5 %Net Operating Income including lease cancellation income - growth % (1)(2) -1.3% 3.6% 2.3% 4.6 %Average rent per square foot - Consolidated Businesses (3) 63.78 62.83 65.02 64.07Average rent per square foot - Unconsolidated Joint Ventures (3) 57.26 57.46 58.35 58.02Average rent per square foot - Combined (3) 60.61 60.23 61.78 61.16Average rent per square foot growth (3) 0.6% 1.0%Ending occupancy - all centers 93.5% 93.6% 93.5% 93.6 %Ending occupancy - comparable (3) 93.6% 95.0% 93.6% 95.0 %Leased space - all centers 95.9% 95.9% 95.9% 95.9 %Leased space - comparable (3) 96.3% 96.7% 96.3% 96.7 %Mall tenant sales - all centers (4) 1,475,440 1,319,794 4,349,233 3,815,182Mall tenant sales - comparable (3)(4) 1,110,111 1,132,953 3,368,564 3,352,811
12-Months Trailing2017 2016
Operating Statistics:Mall tenant sales - all centers (4) 6,307,665 5,415,921Mall tenant sales - comparable (3)(4) 4,936,785 4,843,447Sales per square foot (3)(4) 802 780All centers (4): Mall tenant occupancy costs as a percentage of tenant sales - Consolidated Businesses 15.0% 14.6% Mall tenant occupancy costs as a percentage of tenant sales - Unconsolidated Joint Ventures 14.2% 14.1% Mall tenant occupancy costs as a percentage of tenant sales - Combined 14.6% 14.4%Comparable centers (3)(4): Mall tenant occupancy costs as a percentage of tenant sales - Consolidated Businesses 14.2% 14.1% Mall tenant occupancy costs as a percentage of tenant sales - Unconsolidated Joint Ventures 14.0% 14.3% Mall tenant occupancy costs as a percentage of tenant sales - Combined 14.1% 14.2%

Taubman Centers/7
(1) EBITDA represents earnings before interest, income taxes, and depreciation and amortization of the Operating Partnership's consolidated and unconsolidated businesses. Beneficial interest in EBITDA represents the Operating Partnership’s share of the earnings before interest, income taxes, and depreciation and amortization of its consolidated and unconsolidated businesses. The Company believes EBITDA and beneficial interest in EBITDA provide useful indicators of operating performance, as it is customary in the real estate and shopping center business to evaluate the performance of properties on a basis unaffected by capital structure.
The Company uses Net Operating Income (NOI) as an alternative measure to evaluate the operating performance of centers, both on individual and stabilized portfolio bases. The Company defines NOI as property-level operating revenues (includes rental income excluding straight-line adjustments of minimum rent) less maintenance, taxes, utilities, promotion, ground rent (including straight-line adjustments), and other property operating expenses. Since NOI excludes general and administrative expenses, pre-development charges, interest income and expense, depreciation and amortization, impairment charges, restructuring charges, and gains from peripheral land and property dispositions, it provides a performance measure that, when compared period over period, reflects the revenues and expenses most directly associated with owning and operating rental properties, as well as the impact on their operations from trends in tenant sales, occupancy and rental rates, and operating costs. The Company also uses NOI excluding lease cancellation income as an alternative measure because this income may vary significantly from period to period, which can affect comparability and trend analysis. The Company generally provides separate projections for expected comparable center NOI growth and lease cancellation income. Comparable centers are generally defined as centers that were owned and open for the entire current and preceding period presented, excluding centers impacted by significant redevelopment activity. In addition, The Mall of San Juan has been excluded from “comparable center” statistics as a result of Hurricane Maria and the expectation that the center’s performance will be impacted for the foreseeable future.The National Association of Real Estate Investment Trusts (NAREIT) defines Funds from Operations (FFO) as net income (computed in accordance with Generally Accepted Accounting Principles (GAAP)), excluding gains (or losses) from extraordinary items and sales of properties and impairment write-downs of depreciable real estate, plus real estate related depreciation and after adjustments for unconsolidated partnerships and joint ventures. The Company believes that FFO is a useful supplemental measure of operating performance for REITs. Historical cost accounting for real estate assets implicitly assumes that the value of real estate assets diminishes predictably over time. Since real estate values instead have historically risen or fallen with market conditions, the Company and most industry investors and analysts have considered presentations of operating results that exclude historical cost depreciation to be useful in evaluating the operating performance of REITs. The Company primarily uses FFO in measuring performance and in formulating corporate goals and compensation.The Company may also present adjusted versions of NOI, beneficial interest in EBITDA, and FFO when used by management to evaluate operating performance when certain significant items have impacted results that affect comparability with prior or future periods due to the nature or amounts of these items. The Company believes the disclosure of the adjusted items is similarly useful to investors and others to understand management's view on comparability of such measures between periods. For the three and nine month periods ended September 30, 2017, FFO and EBITDA were adjusted to exclude a restructuring charge and costs incurred associated with shareowner activism. For the nine months ended September 30, 2017, FFO was also adjusted for a charge recognized in connection with the partial write-off of deferred financing costs related to an amendment of the Company's primary unsecured revolving line of credit in February 2017. For the nine months ended September 30, 2017, EBITDA was also adjusted to exclude a gain recognized in connection with the sale of the Valencia Place office tower at Country Club Plaza. For the nine months ended September 30, 2016, FFO and EBITDA were adjusted to exclude the lump sum payment received in May 2016 for the termination of the Company's third party leasing agreement at The Shops at Crystals (Crystals) due to a change in ownership of the center.
These non-GAAP measures as presented by the Company are not necessarily comparable to similarly titled measures used by other REITs due to the fact that not all REITs use the same definitions. These measures should not be considered alternatives to net income or as an indicator of the Company's operating performance. Additionally, these measures do not represent cash flows from operating, investing, or financing activities as defined by GAAP.
The Company provides its beneficial interest in certain financial information of its Unconsolidated Joint Ventures. This beneficial information is derived as the Company’s ownership interest in the investee multiplied by the specific financial statement item being presented. Investors are cautioned that deriving the Company’s beneficial interest in this manner may not accurately depict the legal and economic implications of holding a non-controlling interest in the investee.
(2) Statistics exclude non-comparable centers as defined in the respective periods and have not been subsequently restated for changes in the pools of comparable centers.
(3) Statistics exclude non-comparable centers for all periods presented. The trailing 12-month September 30, 2016 statistics have been restated to include comparable centers to 2017.
(4) Based on reports of sales furnished by mall tenants. Sales per square foot exclude spaces greater than or equal to 10,000 square feet.

Taubman Centers/8
TAUBMAN CENTERS, INC.Table 2 - Income StatementFor the Three Months Ended September 30, 2017 and 2016(in thousands of dollars)
2017 2016CONSOLIDATED UNCONSOLIDATED CONSOLIDATED UNCONSOLIDATED
BUSINESSES JOINT VENTURES (1) BUSINESSES JOINT VENTURES (1)
REVENUES:Minimum rents 84,487 83,337 81,402 67,297Percentage rents 3,600 6,358 6,264 2,807Expense recoveries 51,960 48,481 52,151 39,547Management, leasing, and development services 1,147 1,399Other 12,028 8,230 6,805 4,283
Total revenues 153,222 146,406 148,021 113,934
EXPENSES: Maintenance, taxes, utilities, and promotion 42,351 45,354 39,053 31,974Other operating 23,939 11,968 18,592 6,098Management, leasing, and development services 524 1,268General and administrative 9,482 11,578Restructuring charge 1,751Costs associated with shareowner activism 3,500Interest expense 27,782 32,108 22,129 26,583Depreciation and amortization 45,805 32,609 40,637 27,219
Total expenses 155,134 122,039 133,257 91,874
Nonoperating income (expense) 2,494 340 4,569 (594)582 24,707 19,333 21,466
Income tax benefit (expense) (54) (336) 460 (315)24,371 21,151
Equity in income of Unconsolidated Joint Ventures 13,723 15,391
Net income 14,251 35,184Net income attributable to noncontrolling interests:
Noncontrolling share of income of consolidated joint ventures (1,230) (1,662)Noncontrolling share of income of TRG (2,298) (8,449)
Distributions to participating securities of TRG (576) (537)Preferred stock dividends (5,784) (5,784)Net income attributable to Taubman Centers, Inc. common shareowners 4,363 18,752
SUPPLEMENTAL INFORMATION:EBITDA - 100% 74,169 89,424 82,099 75,268
EBITDA - outside partners' share (6,178) (42,361) (5,873) (30,293)Beneficial interest in EBITDA 67,991 47,063 76,226 44,975Beneficial interest expense (24,816) (16,574) (19,261) (14,274)Beneficial income tax benefit (expense) - TRG and TCO (41) (120) 471 (315)Beneficial income tax benefit - TCO (389)Non-real estate depreciation (933) (607)Preferred dividends and distributions (5,784) (5,784)Funds from Operations attributable to partnership unitholders and participating securitiesof TRG 36,028 30,369 51,045 30,386
STRAIGHTLINE AND PURCHASE ACCOUNTING ADJUSTMENTS:Net straight-line adjustments to rental revenue, recoveries, and ground rent expense atTRG% (2) 526 438 849
Country Club Plaza purchase accounting adjustments - minimum rents increase (decrease)at TRG% (59) 163
The Mall at Green Hills purchase accounting adjustments - minimum rents increase 48 51
(1) With the exception of the Supplemental Information, amounts include 100% of the Unconsolidated Joint Ventures. Amounts are net of intercompany transactions. The Unconsolidated Joint Ventures are presented at 100% in order to allow for measurement of their performance as a whole, without regard to the Company's ownership interest.

Taubman Centers/9
TAUBMAN CENTERS, INC.Table 3 - Income StatementFor the Nine Months Ended September 30, 2017 and 2016 (in thousands of dollars)
2017 2016CONSOLIDATED
BUSINESSES UNCONSOLIDATEDJOINT VENTURES (1)
CONSOLIDATEDBUSINESSES
UNCONSOLIDATEDJOINT VENTURES (1)
REVENUES:Minimum rents 255,577 251,819 246,073 191,312Percentage rents 7,354 16,635 9,960 6,027Expense recoveries 154,385 137,921 147,291 112,259Management, leasing, and development services (2) 3,439 26,323Other 36,226 22,844 16,719 9,747
Total revenues 456,981 429,219 446,366 319,345
EXPENSES:Maintenance, taxes, utilities, and promotion 121,581 115,958 109,908 86,759Other operating 65,356 34,867 57,782 14,926Management, leasing, and development services 1,698 3,034General and administrative 29,649 34,651Restructuring charge 4,063Costs associated with shareowner activism 12,000Interest expense 80,074 97,198 61,845 72,881Depreciation and amortization 122,958 97,263 100,099 63,837
Total expenses 437,379 345,286 367,319 238,403
Nonoperating income, net 8,347 2,551 8,715 51227,949 86,484 87,762 81,454
Income tax expense (375) (4,499) (284) (315)81,985
Gain on disposition, net of tax (3) 3,71385,698 81,139
Equity in income of Unconsolidated Joint Ventures 47,099 49,779
Net income 74,673 137,257Net income attributable to noncontrolling interests:
Noncontrolling share of income of consolidated joint ventures (4,279) (5,813)Noncontrolling share of income of TRG (16,302) (34,435)
Distributions to participating securities of TRG (1,723) (1,573)Preferred stock dividends (17,353) (17,353)Net income attributable to Taubman Centers, Inc. common shareowners 35,016 78,083
SUPPLEMENTAL INFORMATION:EBITDA - 100% 230,981 285,389 249,706 218,172EBITDA - outside partners' share (18,880) (135,265) (17,236) (93,070)Beneficial interest in EBITDA 212,101 150,124 232,470 125,102Beneficial share of gain on disposition (3) (2,814)Beneficial interest expense (71,136) (50,204) (54,459) (39,009)Beneficial income tax expense - TRG and TCO (288) (2,271) (265) (315)Beneficial income tax benefit - TCO (287) (19)Non-real estate depreciation (2,367) (1,881)Preferred dividends and distributions (17,353) (17,353)Funds from Operations attributable to partnership unitholders and participating securities of TRG 120,670 94,835 158,493 85,778
STRAIGHTLINE AND PURCHASE ACCOUNTING ADJUSTMENTS:Net straight-line adjustments to rental revenue, recoveries, and ground rent expense at TRG% 433 1,227 891 2,013Country Club Plaza purchase accounting adjustments - minimum rents increase (decrease) at TRG % (5) 163The Mall at Green Hills purchase accounting adjustments - minimum rents increase 130 167
(1) With the exception of the Supplemental Information, amounts include 100% of the Unconsolidated Joint Ventures. Amounts are net of intercompany transactions. The Unconsolidated Joint Ventures are presented at 100% in order to allow for measurement of their performance as a whole, without regard to the Company's ownership interest.
(2) The 2016 amount includes the $21.7 million lump sum payment received in May 2016 for the termination of the Company's third party leasing agreement at Crystals due to a change in ownership in the center.
(3) During the nine months ended September 30, 2017, the joint venture that owns the Valencia Place office tower at Country Club Plaza recognized a $4.4 million gain ($2.8 million at TRG's share) and $0.7 million of income tax expense ($0.7 million at TRG's share) in connection with the sale of the office tower.

Taubman Centers/10
TAUBMAN CENTERS, INC.Table 4 - Reconciliation of Net Income Attributable to Taubman Centers, Inc. Common Shareowners to Funds From Operations and Adjusted Funds From OperationsFor the Three Months Ended September 30, 2017 and 2016(in thousands of dollars except as noted; may not add or recalculate due to rounding)
2017 2016Shares Per Share Shares Per Share
Dollars /Units /Unit Dollars /Units /UnitNet income attributable to TCO common shareowners - basic 4,363 60,710,184 0.07 18,752 60,396,902 0.31
Add impact of share-based compensation 7 288,967 42 434,161
Net income attributable to TCO common shareowners - diluted 4,370 60,999,151 0.07 18,794 60,831,063 0.31
Add depreciation of TCO's additional basis 1,617 0.03 1,617 0.03Less TCO's additional income tax benefit (389) (0.01)
Net income attributable to TCO common shareowners,excluding step-up depreciation and additional income tax benefit 5,598 60,999,151 0.09 20,411 60,831,063 0.34
Add noncontrolling share of income of TRG 2,298 24,957,233 8,449 25,053,476Add distributions to participating securities of TRG 576 871,262 537 871,262
Net income attributable to partnership unitholdersand participating securities of TRG 8,472 86,827,646 0.09 29,397 86,755,801 0.34
Add (less) depreciation and amortization:Consolidated businesses at 100% 45,805 0.53 40,637 0.47Depreciation of TCO's additional basis (1,617) (0.02) (1,617) (0.02)Noncontrolling partners in consolidated joint ventures (1,969) (0.02) (1,332) (0.02)Share of Unconsolidated Joint Ventures 16,646 0.19 14,995 0.17Non-real estate depreciation (933) (0.01) (607) (0.01)
Less impact of share-based compensation (7) (0.00) (42) (0.00)
Funds from Operations attributable to partnership unitholdersand participating securities of TRG 66,397 86,827,646 0.76 81,431 86,755,801 0.94
TCO's average ownership percentage of TRG - basic (1) 70.9% 70.7%
Funds from Operations attributable to TCO's common shareowners,excluding additional income tax benefit (1) 47,054 0.76 57,556 0.94
Add TCO's additional income tax benefit 389 0.00
Funds from Operations attributable to TCO's common shareowners (1) 47,443 0.77 57,556 0.94
Funds from Operations attributable to partnership unitholdersand participating securities of TRG 66,397 86,827,646 0.76 81,431 86,755,801 0.94
Restructuring charge 1,751 0.02Costs associated with shareowner activism 3,500 0.04
Adjusted Funds from Operations attributable to partnership unitholdersand participating securities of TRG 71,648 86,827,646 0.83 81,431 86,755,801 0.94
TCO's average ownership percentage of TRG - basic (2) 70.9% 70.7%
Adjusted Funds from Operations attributable to TCO's common shareowners (2) 50,775 0.83 57,556 0.94
(1) For the three months ended September 30, 2017, Funds from Operations attributable to TCO's common shareowners was $46,815 using TCO's diluted average ownership percentage of TRG of 69.9%. For the three months ended September 30, 2016, Funds from Operations attributable to TCO's common shareowners was $56,690 using TCO's diluted average ownership percentage of TRG of 69.6%.
(2) For the three months ended September 30, 2017, Adjusted Funds from Operations attributable to TCO's common shareowners was $50,097 using TCO's diluted average ownership percentage of TRG of 69.9%. For the three months ended September 30, 2016, Adjusted Funds from Operations attributable to TCO's common shareowners was $56,690 using TCO's diluted average ownership percentage of TRG of 69.6%.

Taubman Centers/11
TAUBMAN CENTERS, INC.Table 5 - Reconciliation of Net Income Attributable to Taubman Centers, Inc. Common Shareowners to Funds from Operations and Adjusted Funds from OperationsFor the Nine Months Ended September 30, 2017 and 2016(in thousands of dollars except as noted; may not add or recalculate due to rounding)
2017 2016
Shares Per Share Shares Per ShareDollars /Units /Unit Dollars /Units /Unit
Net income attributable to TCO common shareowners - basic 35,016 60,654,026 0.58 78,083 60,341,863 1.29
Add impact of share-based compensation 74 364,829 171 432,926
Net income attributable to TCO common shareowners - diluted 35,090 61,018,855 0.58 78,254 60,774,789 1.29
Add depreciation of TCO's additional basis 4,851 0.08 4,851 0.08Less TCO's additional income tax benefit (287) (0.00) (19) (0.00)
Net income attributable to TCO common shareowners,excluding step-up depreciation and additional income tax benefit 39,654 61,018,855 0.65 83,086 60,774,789 1.37
Add noncontrolling share of income of TRG 16,302 24,968,434 34,435 25,058,804Add distributions to participating securities of TRG 1,723 871,262 1,573 871,262
Net income attributable to partnership unitholdersand participating securities of TRG 57,679 86,858,551 0.66 119,094 86,704,855 1.37
Add (less) depreciation and amortization:Consolidated businesses at 100% 122,958 1.42 100,099 1.15Depreciation of TCO's additional basis (4,851) (0.06) (4,851) (0.06)Noncontrolling partners in consolidated joint ventures (5,576) (0.06) (4,018) (0.05)Share of Unconsolidated Joint Ventures 49,819 0.57 35,999 0.42Non-real estate depreciation (2,367) (0.03) (1,881) (0.02)
Less beneficial gain on disposition, net of tax (2,083) (0.00)Less impact of share-based compensation (74) (0.00) (171) (0.00)
Funds from Operations attributable to partnership unitholdersand participating securities of TRG 215,505 86,858,551 2.48 244,271 86,704,855 2.82
TCO's average ownership percentage of TRG - basic (1) 70.8% 70.7%
Funds from Operations attributable to TCO's common shareowners,excluding additional income tax benefit (1) 152,659 2.48 172,598 2.82
Add TCO's additional income tax benefit 287 0.00 19 0.00
Funds from Operations attributable to TCO's common shareowners (1) 152,946 2.49 172,617 2.82
Funds from Operations attributable to partnership unitholdersand participating securities of TRG 215,505 86,858,551 2.48 244,271 86,704,855 2.82
Restructuring charge 4,063 0.05Costs associated with shareowner activism 12,000 0.14Partial write-off of deferred financing costs 413 0.00Crystals lump sum payment for termination of leasing agreement (21,702) (0.25)
Adjusted Funds from Operations attributable to partnership unitholdersand participating securities of TRG 231,981 86,858,551 2.67 222,569 86,704,855 2.57
TCO's average ownership percentage of TRG - basic (2) 70.8% 70.7%
Adjusted Funds from Operations attributable to TCO's common shareowners,excluding additional income tax benefit (2) 164,330 2.67 157,263 2.57
Add TCO's additional income tax benefit 19 0.00
Adjusted Funds from Operations attributable to TCO's common shareowners (2) 164,330 2.67 157,282 2.57
(1) For the nine months ended September 30, 2017, Funds from Operations attributable to TCO's common shareowners was $150,769 using TCO's diluted average ownership percentage of TRG of 69.8%. For the nine months ended September 30, 2016, Funds from Operations attributable to TCO's common shareowners was $170,032 using TCO's diluted average ownership percentage of TRG of 69.6%.
(2) For the nine months ended September 30, 2017, Adjusted Funds from Operations attributable to TCO's common shareowners was $161,987 using TCO's diluted average ownership percentage of TRG of 69.8%. For the nine months ended September 30, 2016, Adjusted Funds from Operations attributable to TCO's common shareowners was $154,193 using TCO's diluted average ownership percentage of TRG of 69.6%.

Taubman Centers/12
TAUBMAN CENTERS, INC.Table 6 - Reconciliation of Net Income to Beneficial Interest in EBITDA and Adjusted Beneficial Interest in EBITDAFor the Periods Ended September 30, 2017 and 2016(in thousands of dollars; amounts attributable to TCO may not recalculate due to rounding)
Three Months Ended Year to Date2017 2016 2017 2016
Net income 14,251 35,184 74,673 137,257
Add (less) depreciation and amortization:Consolidated businesses at 100% 45,805 40,637 122,958 100,099Noncontrolling partners in consolidated joint ventures (1,969) (1,332) (5,576) (4,018)Share of Unconsolidated Joint Ventures 16,646 14,995 49,819 35,999
Add (less) interest expense and income tax expense (benefit):Interest expense:
Consolidated businesses at 100% 27,782 22,129 80,074 61,845Noncontrolling partners in consolidated joint ventures (2,966) (2,868) (8,938) (7,386)Share of Unconsolidated Joint Ventures 16,574 14,274 50,204 39,009
Share of Income tax expense (benefit):Consolidated businesses at 100% 54 (471) 375 265Noncontrolling partners in consolidated joint ventures (13) (87)Share of Unconsolidated Joint Ventures 120 315 2,271 315Share of income tax expense on disposition 731
Less noncontrolling share of income of consolidated joint ventures (1,230) (1,662) (4,279) (5,813)
Beneficial interest in EBITDA 115,054 121,201 362,225 357,572
TCO's average ownership percentage of TRG - basic 70.9% 70.7% 70.8% 70.7%
Beneficial interest in EBITDA attributable to TCO 81,536 85,665 256,594 252,651
Beneficial interest in EBITDA 115,054 121,201 362,225 357,572
Add (less):Restructuring charge 1,751 4,063Costs associated with shareowner activism 3,500 12,000
Beneficial share of gain on disposition (2,814)Crystals lump sum payment for termination of leasing agreement (21,702)
Adjusted Beneficial interest in EBITDA 120,305 121,201 375,474 335,870
TCO's average ownership percentage of TRG - basic 70.9% 70.7% 70.8% 70.7%
Adjusted Beneficial interest in EBITDA attributable to TCO 85,257 85,665 265,980 237,318
Taubman Centers/13
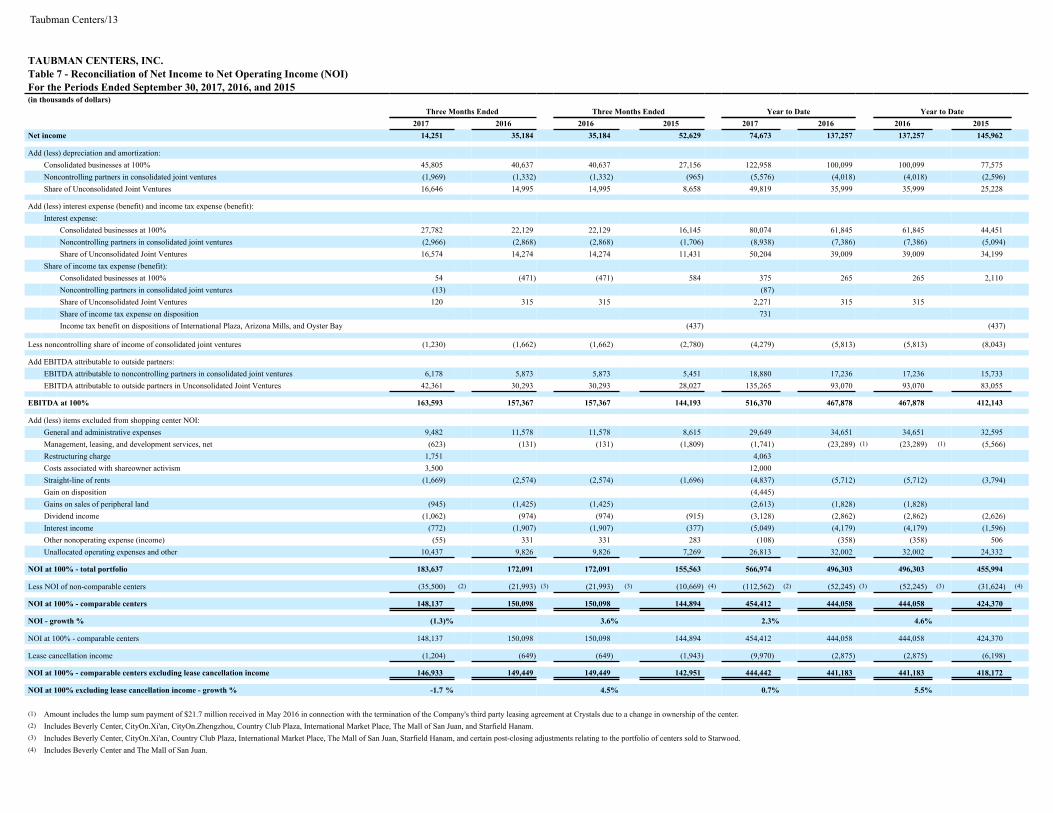
TAUBMAN CENTERS, INC.Table 7 - Reconciliation of Net Income to Net Operating Income (NOI)For the Periods Ended September 30, 2017, 2016, and 2015(in thousands of dollars)
Three Months Ended Three Months Ended Year to Date Year to Date2017 2016 2016 2015 2017 2016 2016 2015
Net income 14,251 35,184 35,184 52,629 74,673 137,257 137,257 145,962
Add (less) depreciation and amortization:Consolidated businesses at 100% 45,805 40,637 40,637 27,156 122,958 100,099 100,099 77,575Noncontrolling partners in consolidated joint ventures (1,969) (1,332) (1,332) (965) (5,576) (4,018) (4,018) (2,596)Share of Unconsolidated Joint Ventures 16,646 14,995 14,995 8,658 49,819 35,999 35,999 25,228
Add (less) interest expense (benefit) and income tax expense (benefit):Interest expense:
Consolidated businesses at 100% 27,782 22,129 22,129 16,145 80,074 61,845 61,845 44,451Noncontrolling partners in consolidated joint ventures (2,966) (2,868) (2,868) (1,706) (8,938) (7,386) (7,386) (5,094)Share of Unconsolidated Joint Ventures 16,574 14,274 14,274 11,431 50,204 39,009 39,009 34,199
Share of income tax expense (benefit):Consolidated businesses at 100% 54 (471) (471) 584 375 265 265 2,110Noncontrolling partners in consolidated joint ventures (13) (87)Share of Unconsolidated Joint Ventures 120 315 315 2,271 315 315Share of income tax expense on disposition 731Income tax benefit on dispositions of International Plaza, Arizona Mills, and Oyster Bay (437) (437)
Less noncontrolling share of income of consolidated joint ventures (1,230) (1,662) (1,662) (2,780) (4,279) (5,813) (5,813) (8,043)
Add EBITDA attributable to outside partners:EBITDA attributable to noncontrolling partners in consolidated joint ventures 6,178 5,873 5,873 5,451 18,880 17,236 17,236 15,733EBITDA attributable to outside partners in Unconsolidated Joint Ventures 42,361 30,293 30,293 28,027 135,265 93,070 93,070 83,055
EBITDA at 100% 163,593 157,367 157,367 144,193 516,370 467,878 467,878 412,143
Add (less) items excluded from shopping center NOI:General and administrative expenses 9,482 11,578 11,578 8,615 29,649 34,651 34,651 32,595Management, leasing, and development services, net (623) (131) (131) (1,809) (1,741) (23,289) (1) (23,289) (1) (5,566)Restructuring charge 1,751 4,063Costs associated with shareowner activism 3,500 12,000Straight-line of rents (1,669) (2,574) (2,574) (1,696) (4,837) (5,712) (5,712) (3,794)Gain on disposition (4,445)Gains on sales of peripheral land (945) (1,425) (1,425) (2,613) (1,828) (1,828)Dividend income (1,062) (974) (974) (915) (3,128) (2,862) (2,862) (2,626)Interest income (772) (1,907) (1,907) (377) (5,049) (4,179) (4,179) (1,596)Other nonoperating expense (income) (55) 331 331 283 (108) (358) (358) 506Unallocated operating expenses and other 10,437 9,826 9,826 7,269 26,813 32,002 32,002 24,332
NOI at 100% - total portfolio 183,637 172,091 172,091 155,563 566,974 496,303 496,303 455,994
Less NOI of non-comparable centers (35,500) (2) (21,993) (3) (21,993) (3) (10,669) (4) (112,562) (2) (52,245) (3) (52,245) (3) (31,624) (4)
NOI at 100% - comparable centers 148,137 150,098 150,098 144,894 454,412 444,058 444,058 424,370
NOI - growth % (1.3)% 3.6% 2.3% 4.6%
NOI at 100% - comparable centers 148,137 150,098 150,098 144,894 454,412 444,058 444,058 424,370
Lease cancellation income (1,204) (649) (649) (1,943) (9,970) (2,875) (2,875) (6,198)
NOI at 100% - comparable centers excluding lease cancellation income 146,933 149,449 149,449 142,951 444,442 441,183 441,183 418,172
NOI at 100% excluding lease cancellation income - growth % -1.7 % 4.5% 0.7% 5.5%
(1) Amount includes the lump sum payment of $21.7 million received in May 2016 in connection with the termination of the Company's third party leasing agreement at Crystals due to a change in ownership of the center.(2) Includes Beverly Center, CityOn.Xi'an, CityOn.Zhengzhou, Country Club Plaza, International Market Place, The Mall of San Juan, and Starfield Hanam.(3) Includes Beverly Center, CityOn.Xi'an, Country Club Plaza, International Market Place, The Mall of San Juan, Starfield Hanam, and certain post-closing adjustments relating to the portfolio of centers sold to Starwood.(4) Includes Beverly Center and The Mall of San Juan.

Taubman Centers/14
TAUBMAN CENTERS, INC.Table 8 - Balance SheetsAs of September 30, 2017 and December 31, 2016(in thousands of dollars)
As ofSeptember 30, 2017 December 31, 2016
Consolidated Balance Sheet of Taubman Centers, Inc.:
Assets:Properties 4,384,058 4,173,954Accumulated depreciation and amortization (1,245,581) (1,147,390)
3,138,477 3,026,564Investment in Unconsolidated Joint Ventures 563,012 604,808Cash and cash equivalents 37,796 40,603Restricted cash 3,660 932Accounts and notes receivable, net 68,727 60,174Accounts receivable from related parties 2,591 2,103Deferred charges and other assets 293,695 275,728
4,107,958 4,010,912Liabilities:
Notes payable, net 3,438,307 3,255,512Accounts payable and accrued liabilities 315,136 336,536Distributions in excess of investments in and net income of
Unconsolidated Joint Ventures 503,291 480,8634,256,734 4,072,911
Redeemable noncontrolling interest 9,150 8,704
Equity (Deficit):Taubman Centers, Inc. Shareowners' Equity:
Series B Non-Participating Convertible Preferred Stock 25 25Series J Cumulative Redeemable Preferred StockSeries K Cumulative Redeemable Preferred StockCommon Stock 607 604Additional paid-in capital 666,836 657,281Accumulated other comprehensive income (loss) (24,051) (35,916)Dividends in excess of net income (628,965) (549,914)
14,452 72,080Noncontrolling interests:
Noncontrolling interests in consolidated joint ventures (159,561) (155,919)Noncontrolling interests in partnership equity of TRG (12,817) 13,136
(172,378) (142,783)(157,926) (70,703)
4,107,958 4,010,912
Combined Balance Sheet of Unconsolidated Joint Ventures (1):Assets:
Properties 3,693,394 3,371,216Accumulated depreciation and amortization (733,742) (661,611)
2,959,652 2,709,605Cash and cash equivalents 120,860 83,882Accounts and notes receivable, net 115,665 87,612Deferred charges and other assets 120,857 67,167
3,317,034 2,948,266Liabilities:
Notes payable, net (2) 2,829,847 2,706,628Accounts payable and other liabilities 533,800 359,814
3,363,647 3,066,442Accumulated deficiency in assets:
Accumulated deficiency in assets - TRG (85,912) (145,679)Accumulated deficiency in assets - Joint Venture Partners 71,652 81,217Accumulated other comprehensive loss - TRG (12,490) (20,547)Accumulated other comprehensive loss - Joint Venture Partners (19,863) (33,167)
(46,613) (118,176)3,317,034 2,948,266
(1) As of December 31, 2016, Unconsolidated Joint Venture amounts exclude the balances of CityOn.Zhengzhou, which opened in March 2017.
(2) The December 31, 2016 balance excludes the construction financing outstanding for CityOn.Zhengzhou of $70.5 million ($34.5 million at TRG's share).

Taubman Centers/15
TAUBMAN CENTERS, INC.Table 9 - Annual Guidance(all dollar amounts per common share on a diluted basis; amounts may not add due to rounding)
Range for the Year EndedDecember 31, 2017
Adjusted Funds from Operations per common share 3.67 3.77
Restructuring charge (1) (0.05) (0.05)
Costs associated with shareowner activism (1) (0.14) (0.14)
Partial write-off of deferred financing costs (0.00) (0.00)
Funds from Operations per common share 3.49 3.59
Gain on disposition, net of tax 0.02 0.02
Real estate depreciation - TRG (2.57) (2.46)
Distributions to participating securities of TRG (0.03) (0.03)
Depreciation of TCO's additional basis in TRG (0.11) (0.11)
Net income attributable to common shareowners, per common share (EPS) 0.80 1.00
(1) Amount represents actual expense recognized through the third quarter of 2017. Amount does not include future assumptions of costs to be incurred.