Taste and Odor Mitigation Strategy - PNWS-AWWA
52
Copyright 2013 by CH2M HILL Engineers, Inc. Taste and Odor Mitigation Strategies Laboratory-Based Analysis 2013 PNWS-AWWA Conference Spokane, WA Kim Ervin, P.E., West Region Drinking Water Service Lead, CH2M HILL
Transcript of Taste and Odor Mitigation Strategy - PNWS-AWWA

Copyright 2013 by CH2M HILL Engineers, Inc.
Taste and Odor Mitigation Strategies Laboratory-Based Analysis
2013 PNWS-AWWA Conference
Spokane, WA
Kim Ervin, P.E., West Region Drinking Water Service
Lead, CH2M HILL
Copyright 2013 by CH2M HILL Engineers, Inc.
Outline
Introduction - Sources of Taste and Odor
Treatment Effectiveness
– DAF with Ozone
– Biological Filtration
– Powdered Activated Carbon (PAC) and Superfine PAC
– Oxidants and Advanced Oxidation
Comparing the Results
Copyright 2013 by CH2M HILL Engineers, Inc.
INTRODUCTION
Copyright 2013 by CH2M HILL Engineers, Inc.
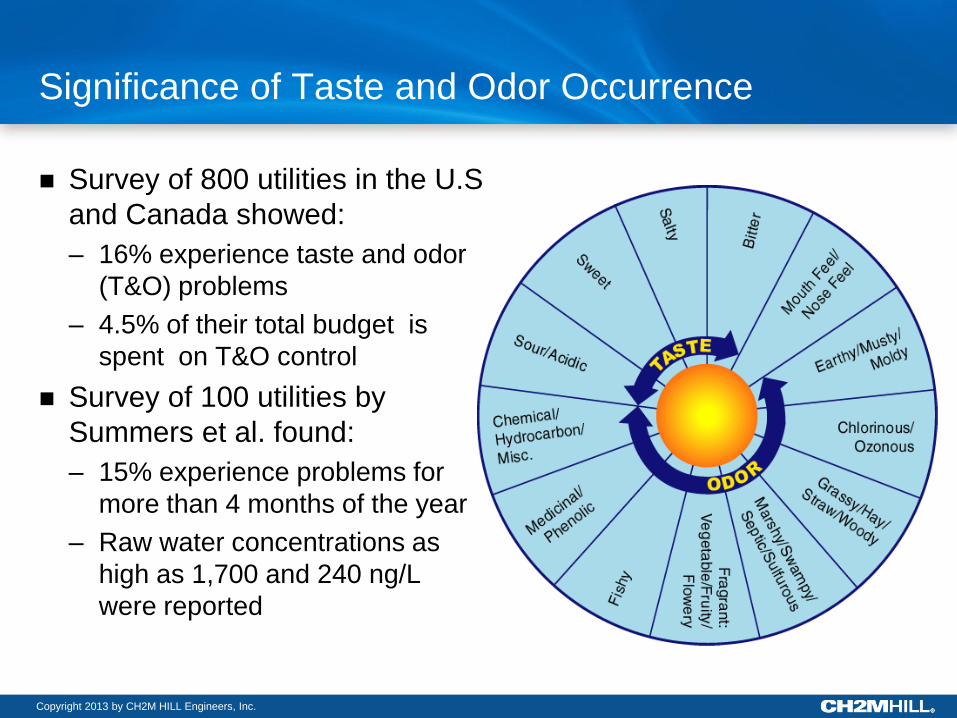
Significance of Taste and Odor Occurrence
Survey of 800 utilities in the U.S
and Canada showed:
– 16% experience taste and odor
(T&O) problems
– 4.5% of their total budget is
spent on T&O control
Survey of 100 utilities by
Summers et al. found:
– 15% experience problems for
more than 4 months of the year
– Raw water concentrations as
high as 1,700 and 240 ng/L
were reported
Copyright 2013 by CH2M HILL Engineers, Inc.
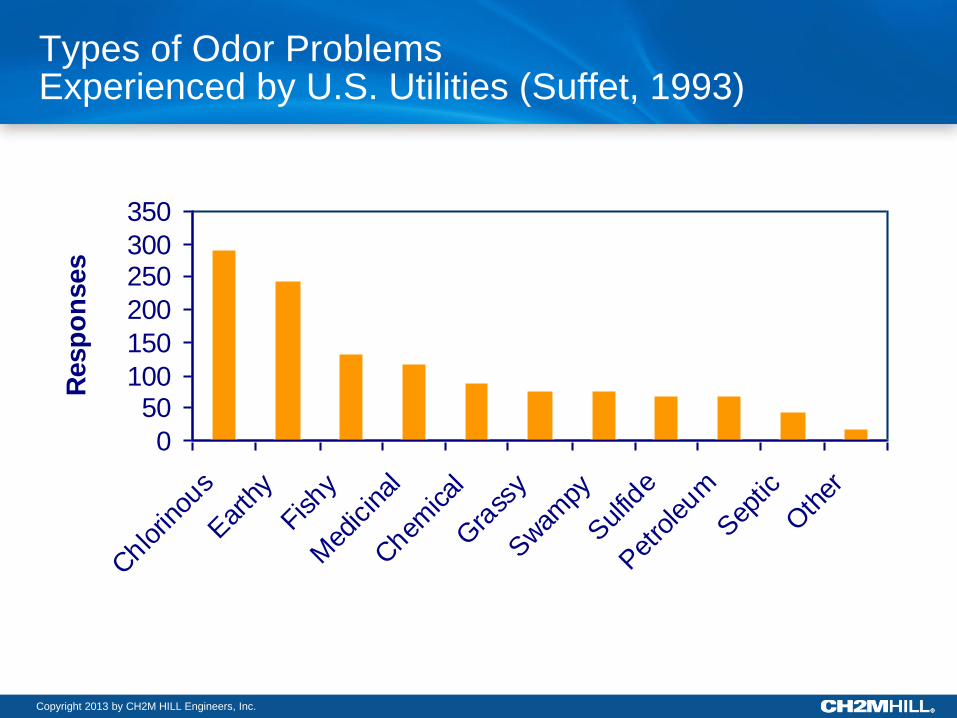
Types of Odor Problems Experienced by U.S. Utilities (Suffet, 1993)
0
50100
150
200
250300
350
Chlo
rinou
s
Ear
thy
Fishy
Med
icinal
Chem
ical
Gra
ssy
Swam
py
Sulfid
e
Pet
roleum
Sep
tic
Oth
er
Resp
on
ses
Copyright 2013 by CH2M HILL Engineers, Inc.
CONTROL AND TREATMENT LABORATORY-BASED ANALYSIS
Copyright 2013 by CH2M HILL Engineers, Inc.
CONTROL AND TREATMENT
DISSOLVED AIR FLOATATION (DAF) AND OZONE

Copyright 2013 by CH2M HILL Engineers, Inc.
Winnipeg High-Rate DAF Pilot Test
One of the first high-rate
DAF evaluations for a
large (105 mgd) WTP
Extensive piloting of both
conventional and high-
rate DAF reduced
construction costs
DAF cost model allowed
comparison of overall
costs for different
systems
Pre-negotiated DAF
equipment bid process to
shorten the construction
schedule
Copyright 2013 by CH2M HILL Engineers, Inc.
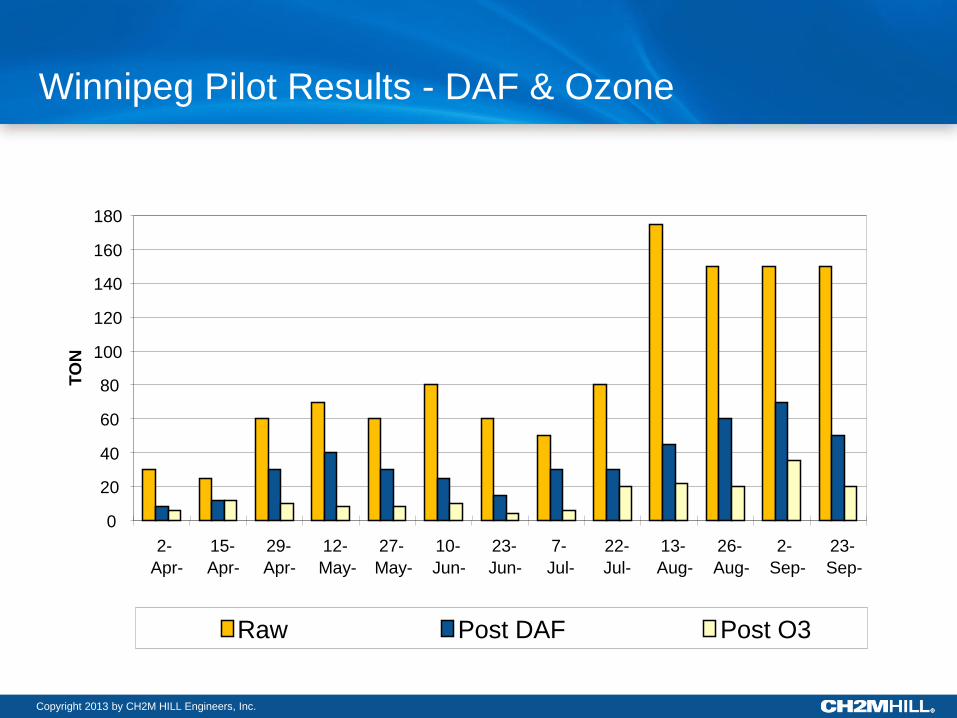
Winnipeg Pilot Results - DAF & Ozone
0
20
40
60
80
100
120
140
160
180
2-
Apr-
15-
Apr-
29-
Apr-
12-
May-
27-
May-
10-
Jun-
23-
Jun-
7-
Jul-
22-
Jul-
13-
Aug-
26-
Aug-
2-
Sep-
23-
Sep-
TO
N
Raw Post DAF Post O3
Copyright 2013 by CH2M HILL Engineers, Inc.
CONTROL AND TREATMENT
BIOLOGICAL FILTRATION
Copyright 2013 by CH2M HILL Engineers, Inc.
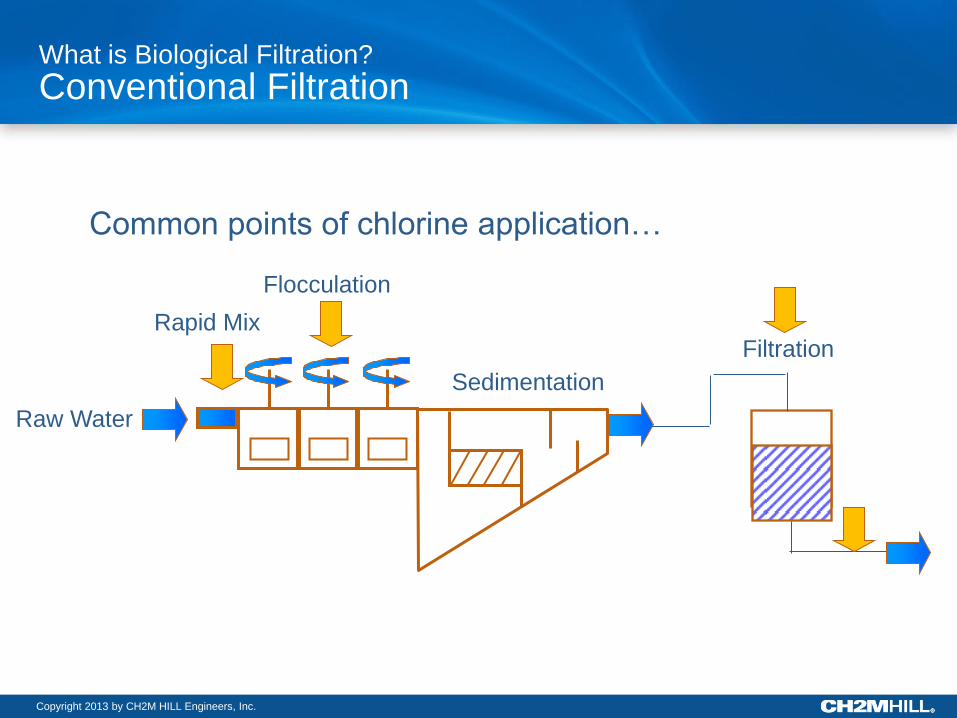
What is Biological Filtration?
Conventional Filtration
Raw Water
Sedimentation
Filtration
Common points of chlorine application…
Flocculation
Rapid Mix
Copyright 2013 by CH2M HILL Engineers, Inc.
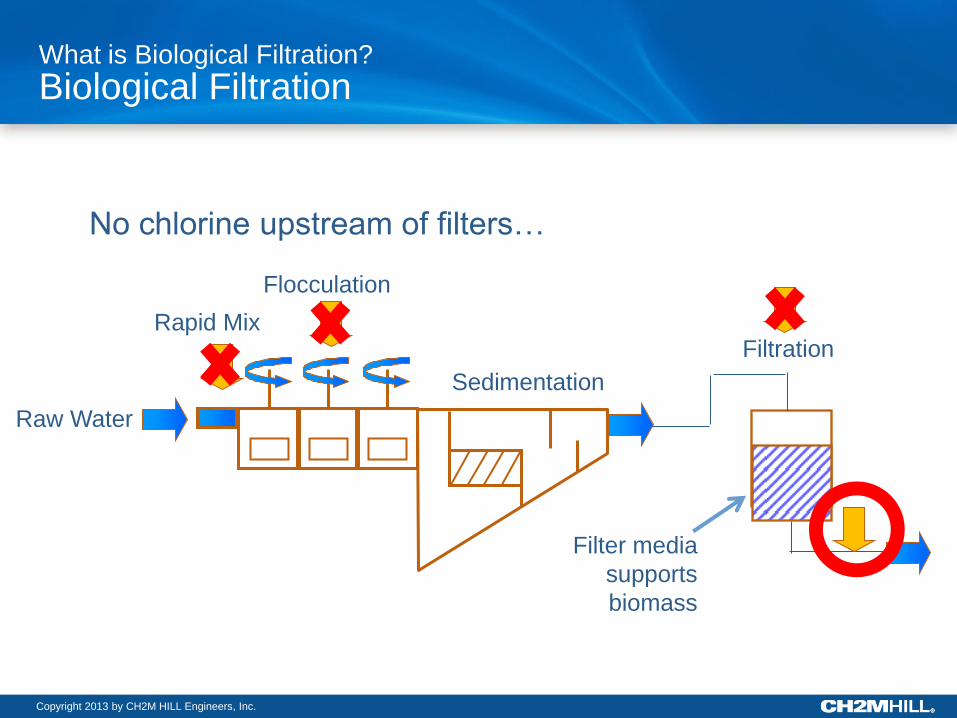
What is Biological Filtration?
Biological Filtration
Raw Water
Sedimentation
Filtration
No chlorine upstream of filters…
Flocculation
Rapid Mix
Filter media
supports
biomass
Copyright 2013 by CH2M HILL Engineers, Inc.
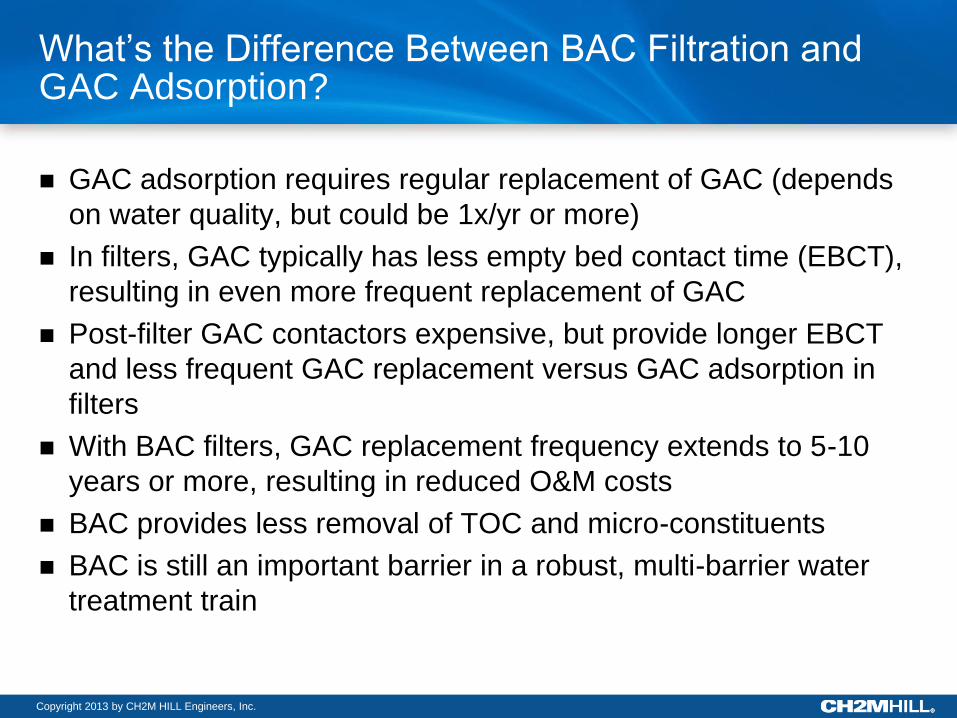
What’s the Difference Between BAC Filtration and GAC Adsorption?
GAC adsorption requires regular replacement of GAC (depends
on water quality, but could be 1x/yr or more)
In filters, GAC typically has less empty bed contact time (EBCT),
resulting in even more frequent replacement of GAC
Post-filter GAC contactors expensive, but provide longer EBCT
and less frequent GAC replacement versus GAC adsorption in
filters
With BAC filters, GAC replacement frequency extends to 5-10
years or more, resulting in reduced O&M costs
BAC provides less removal of TOC and micro-constituents
BAC is still an important barrier in a robust, multi-barrier water
treatment train
Copyright 2013 by CH2M HILL Engineers, Inc.
Acclimation Experiment Objectives
To investigate the impact of:
– Time on acclimation to MIB and geosmin
– Empty bed contact time (EBCT)

Tank 1 Tank 2
Sand BAC
Sand
Low
Temp
Sand
Low Ozone
MIB/Geosmin
Low Ozone
Sand BAC Sand
GAC
Backwash
Tank
To Waste
To Waste
Sand
Low
Temp
Feed
MIB (ng/L): 24
Geosmin (ng/L): 21 Feed
MIB (ng/L): 0
Geosmin (ng/L): 0
Copyright 2013 by CH2M HILL Engineers, Inc.
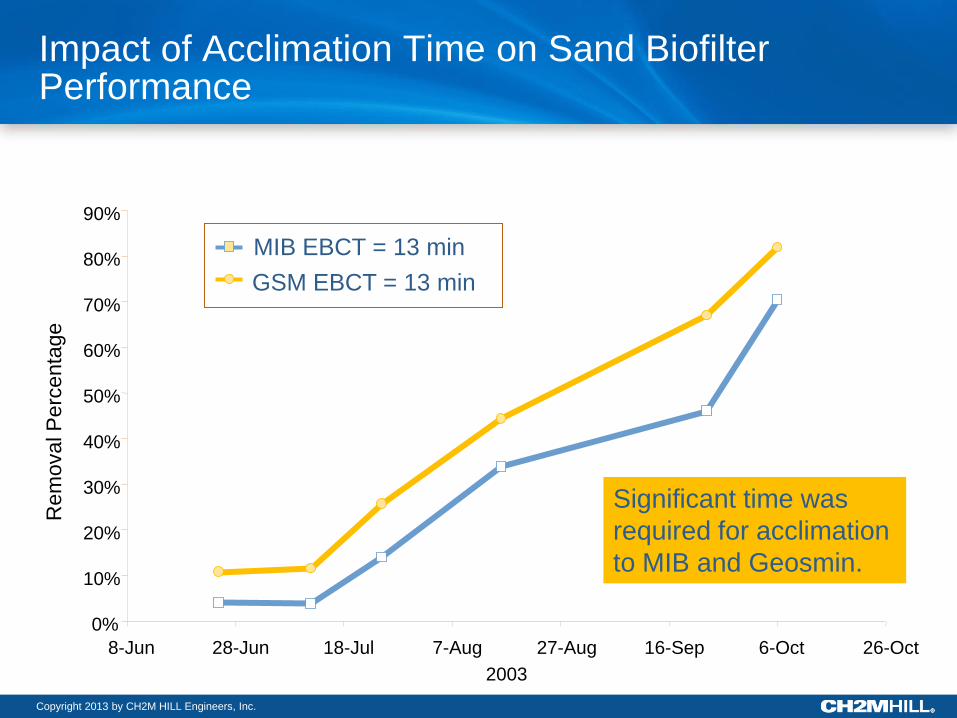
Impact of Acclimation Time on Sand Biofilter Performance
0%
10%
20%
30%
40%
50%
60%
70%
80%
90%
8-Jun 28-Jun 18-Jul 7-Aug 27-Aug 16-Sep 6-Oct 26-Oct
2003
Rem
oval P
erc
enta
ge
MIB EBCT = 13 min
GSM EBCT = 13 min
Significant time was
required for acclimation
to MIB and Geosmin.

Copyright 2013 by CH2M HILL Engineers, Inc.
Impact of Empty Bed Contact Time
0
10
20
30
40
50
60
70
80
90
100
4 13
Perc
en
t R
em
oval
(%)
Empty Bed Contact Time (min)
MIB
Geosmin
Note: Initial concentration of MIB and geosmin were 20 ng/L each.
Copyright 2013 by CH2M HILL Engineers, Inc.
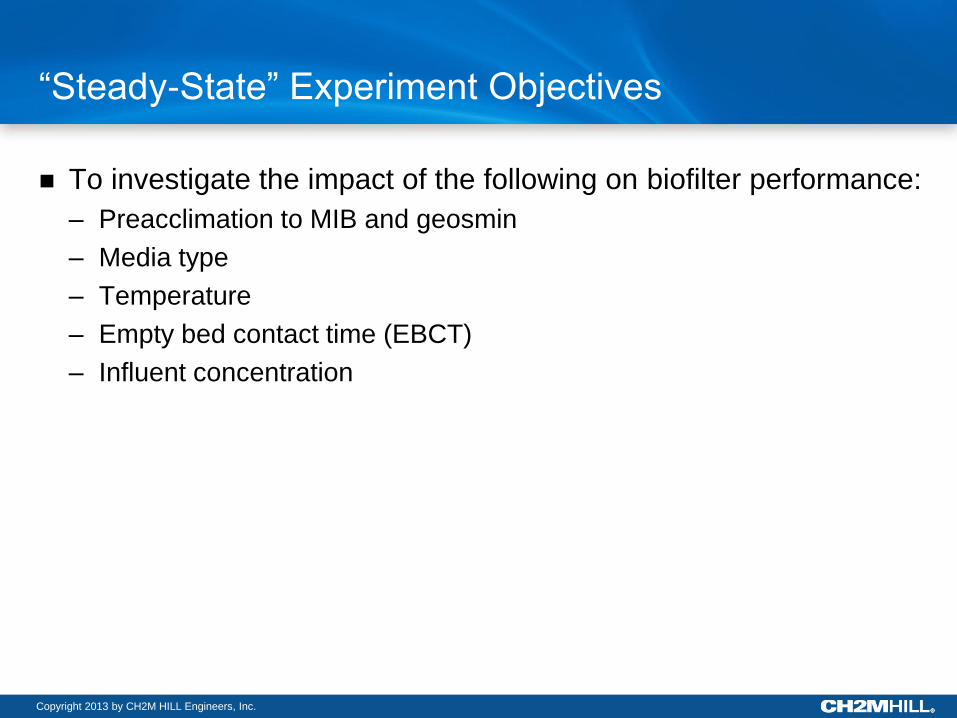
“Steady-State” Experiment Objectives
To investigate the impact of the following on biofilter performance:
– Preacclimation to MIB and geosmin
– Media type
– Temperature
– Empty bed contact time (EBCT)
– Influent concentration
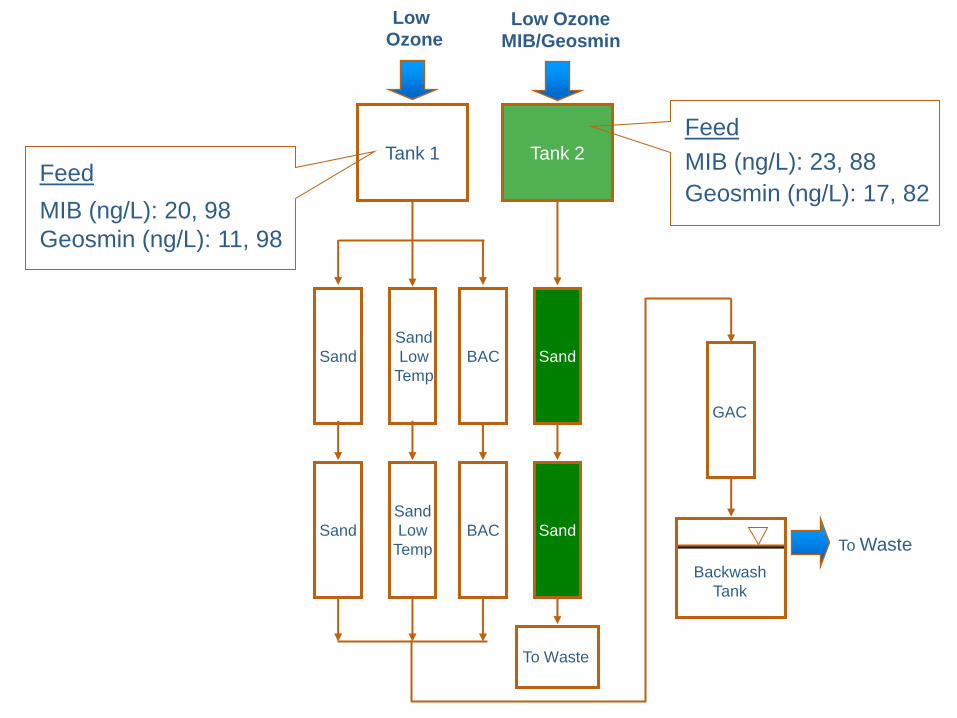
Tank 1 Tank 2
Sand BAC
Sand
Low
Temp
Sand
Low Ozone
MIB/Geosmin
Low Ozone
Sand BAC Sand
GAC
Backwash
Tank
To Waste
To Waste
Sand
Low
Temp
Feed
MIB (ng/L): 23, 88
Geosmin (ng/L): 17, 82 Feed
MIB (ng/L): 20, 98
Geosmin (ng/L): 11, 98
Copyright 2013 by CH2M HILL Engineers, Inc.
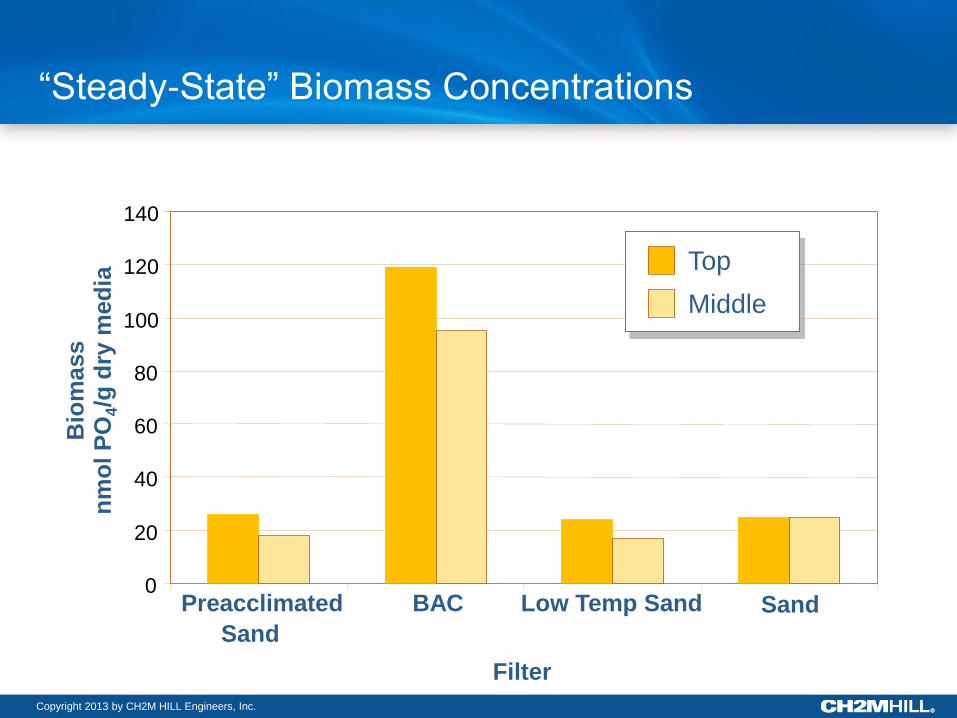
“Steady-State” Biomass Concentrations
0
20
40
60
80
100
120
140
Preacclimated BAC Low Temp Sand Sand
Filter
Bio
ma
ss
nm
ol P
O4/g
dry
med
ia Top
Middle
Sand
Copyright 2013 by CH2M HILL Engineers, Inc.
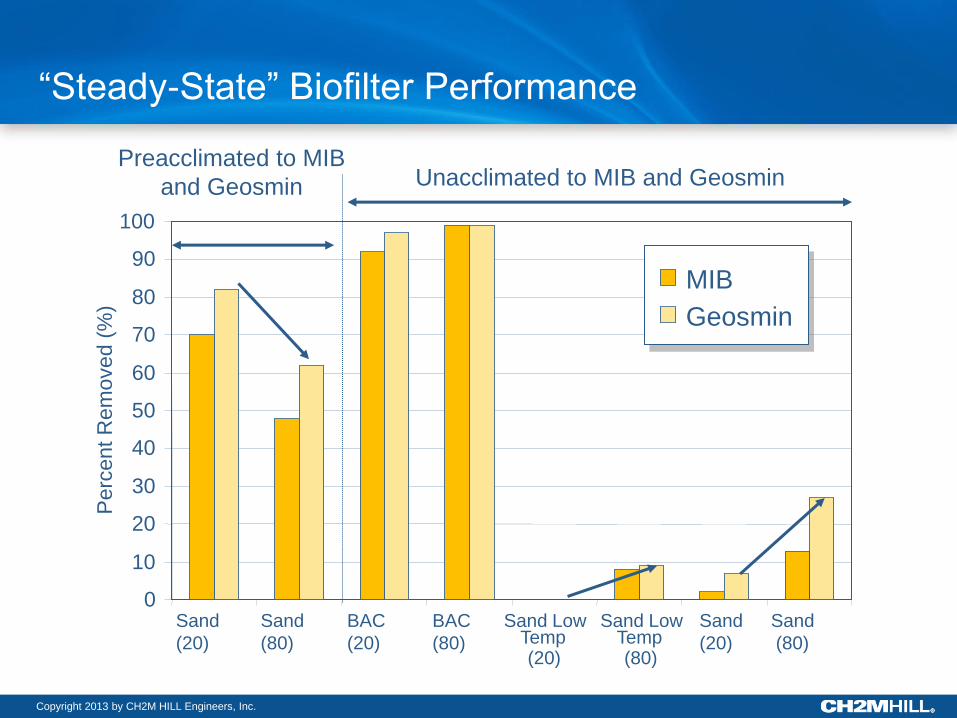
“Steady-State” Biofilter Performance
0
10
20
30
40
50
60
70
80
90
100
Sand
(20)
Sand
(80)
BAC
(20)
BAC
(80)
Sand Low Temp (20)
Sand Low Temp (80)
Sand
(20)
Sand
(80)
Perc
ent R
em
oved (
%)
MIB
Geosmin
Preacclimated to MIB
and Geosmin Unacclimated to MIB and Geosmin
Copyright 2013 by CH2M HILL Engineers, Inc.
Biological Filtration Summary
Preacclimation to MIB and geosmin was critical for biofilter
performance on sand media in pilot scale experiments.
BAC sustained higher concentrations of biomass and showed
increased removals of MIB and geosmin.
The lower temperature column showed lower removals of MIB
and geosmin.
Longer EBCTs may be required for adequate removal of MIB and
geosmin.
A “reacclimation” to higher influent concentrations was observed.

Copyright 2013 by CH2M HILL Engineers, Inc.
CONTROL AND TREATMENT
POWDERED ACTIVATED CARBON (PAC)
Copyright 2013 by CH2M HILL Engineers, Inc.
Powdered Activated Carbon
Contact Time
Application (or Dosing) Point
Adsorption capacity,
– Brand and Type of PAC
Interferences: natural organic matter (NOM), coagulants (such as
alum), chlorine
Chlorine consumption
Copyright 2013 by CH2M HILL Engineers, Inc.
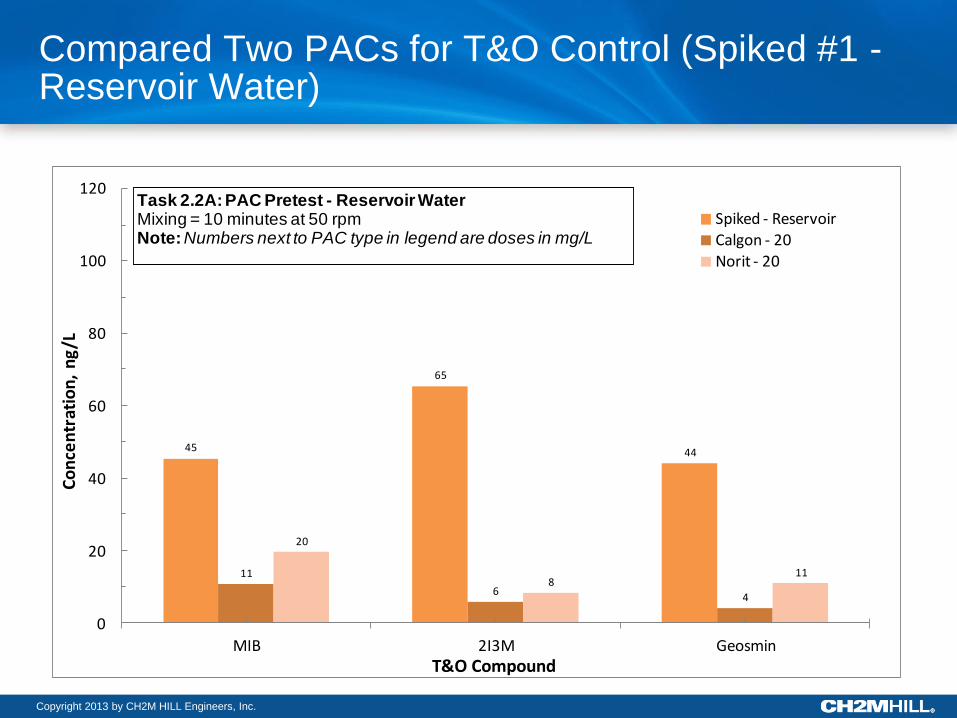
Compared Two PACs for T&O Control (Spiked #1 - Reservoir Water)
45
65
44
11
64
20
811
0
20
40
60
80
100
120
MIB 2I3M Geosmin
Co
nce
ntr
atio
n,
ng
/L
T&O Compound
Spiked - Reservoir
Calgon - 20Norit - 20
Task 2.2A: PAC Pretest - Reservoir WaterMixing = 10 minutes at 50 rpmNote: Numbers next to PAC type in legend are doses in mg/L
Copyright 2013 by CH2M HILL Engineers, Inc.
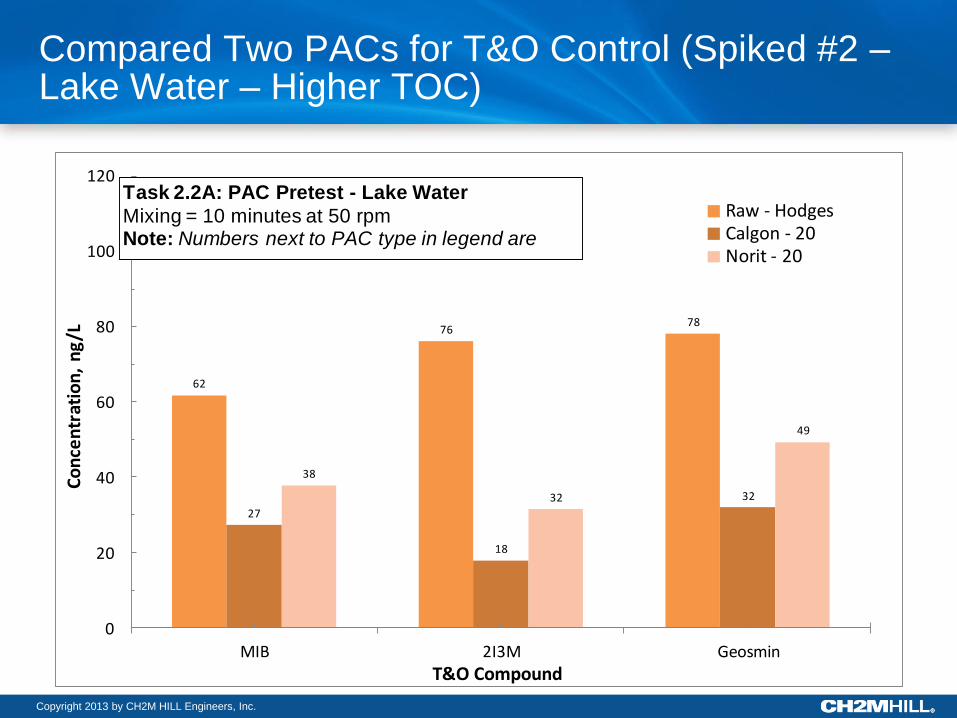
Compared Two PACs for T&O Control (Spiked #2 – Lake Water – Higher TOC)
62
7678
27
18
32
38
32
49
0
20
40
60
80
100
120
MIB 2I3M Geosmin
Co
nce
ntr
atio
n,
ng
/L
T&O Compound
Raw - HodgesCalgon - 20Norit - 20
Task 2.2A: PAC Pretest - Lake Water
Mixing = 10 minutes at 50 rpmNote: Numbers next to PAC type in legend are
Copyright 2013 by CH2M HILL Engineers, Inc.
PAC Summary
PAC products vary in terms of effectiveness
20 minutes of simultaneous coagulation/flocculation and PAC
contact time provided T&O removal
In Sample #1 Reservoir water, PAC provided:
– 90% Geosmin removal
– 50% MIB removal
– 80% 2I3M removal
In Sample #2 Lake water, TOC competition reduced effectiveness
significantly for Geosmin (50-80% removal) and MIB (40%
removal)
Copyright 2013 by CH2M HILL Engineers, Inc.
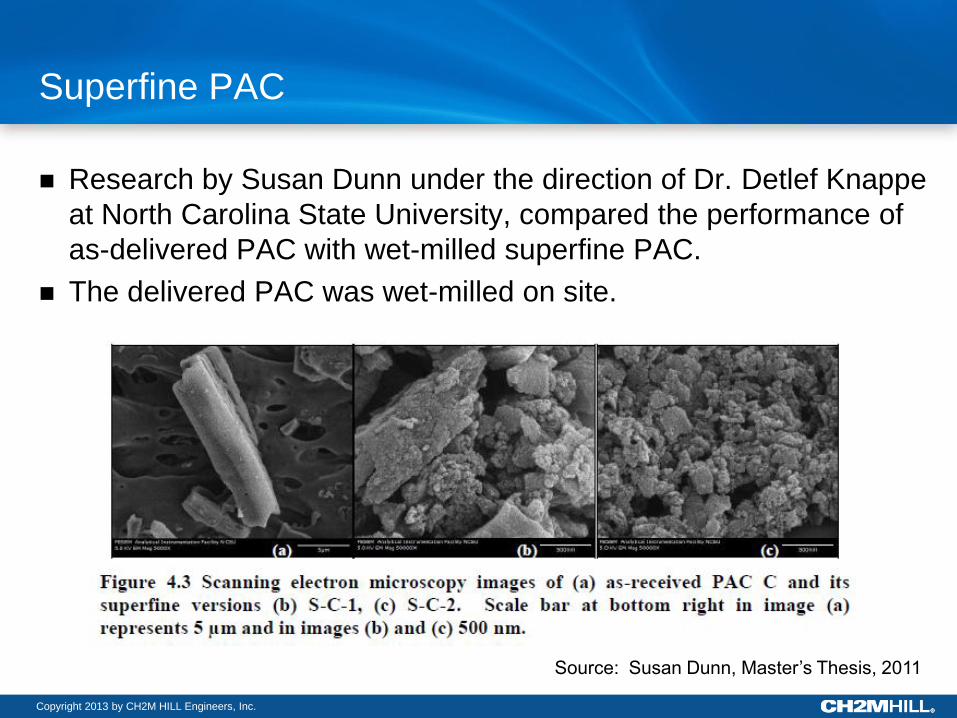
Superfine PAC
Research by Susan Dunn under the direction of Dr. Detlef Knappe
at North Carolina State University, compared the performance of
as-delivered PAC with wet-milled superfine PAC.
The delivered PAC was wet-milled on site.
Source: Susan Dunn, Master’s Thesis, 2011
Copyright 2013 by CH2M HILL Engineers, Inc.
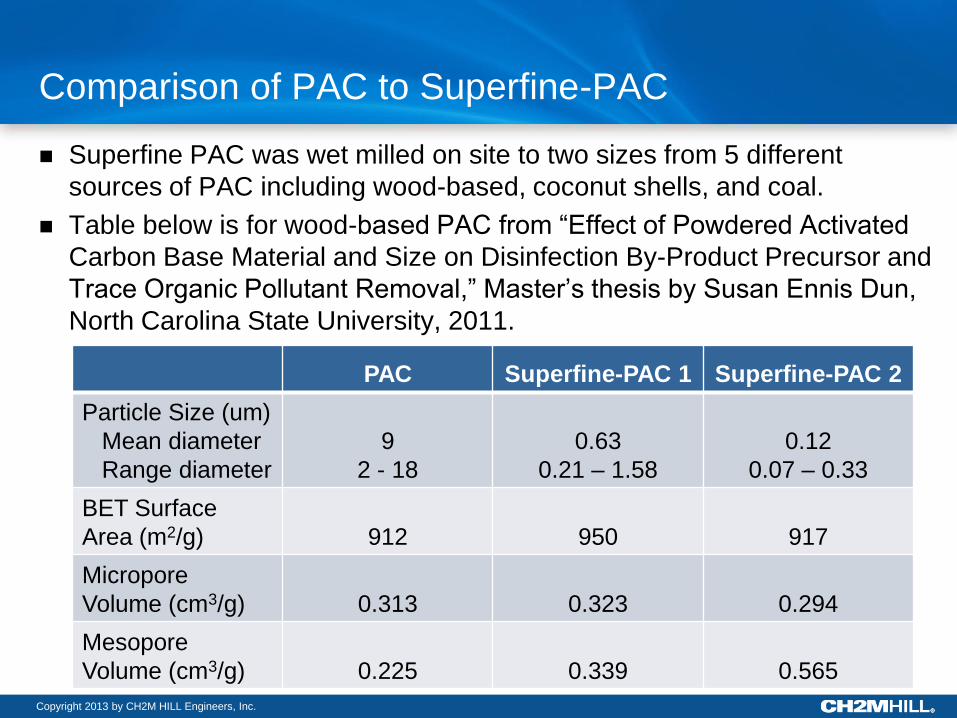
Comparison of PAC to Superfine-PAC
Superfine PAC was wet milled on site to two sizes from 5 different
sources of PAC including wood-based, coconut shells, and coal.
Table below is for wood-based PAC from “Effect of Powdered Activated
Carbon Base Material and Size on Disinfection By-Product Precursor and
Trace Organic Pollutant Removal,” Master’s thesis by Susan Ennis Dun,
North Carolina State University, 2011.
PAC Superfine-PAC 1 Superfine-PAC 2
Particle Size (um)
Mean diameter
Range diameter
9
2 - 18
0.63
0.21 – 1.58
0.12
0.07 – 0.33
BET Surface
Area (m2/g)
912
950
917
Micropore
Volume (cm3/g)
0.313
0.323
0.294
Mesopore
Volume (cm3/g)
0.225
0.339
0.565
Copyright 2013 by CH2M HILL Engineers, Inc.
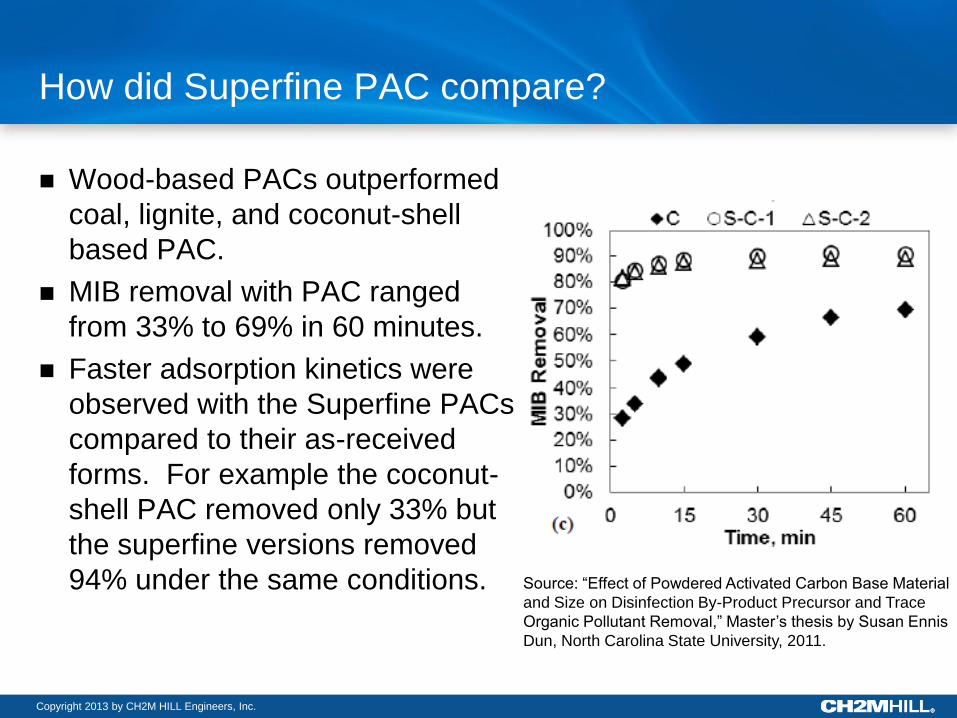
How did Superfine PAC compare?
Wood-based PACs outperformed
coal, lignite, and coconut-shell
based PAC.
MIB removal with PAC ranged
from 33% to 69% in 60 minutes.
Faster adsorption kinetics were
observed with the Superfine PACs
compared to their as-received
forms. For example the coconut-
shell PAC removed only 33% but
the superfine versions removed
94% under the same conditions. Source: “Effect of Powdered Activated Carbon Base Material
and Size on Disinfection By-Product Precursor and Trace
Organic Pollutant Removal,” Master’s thesis by Susan Ennis
Dun, North Carolina State University, 2011.
Copyright 2013 by CH2M HILL Engineers, Inc.
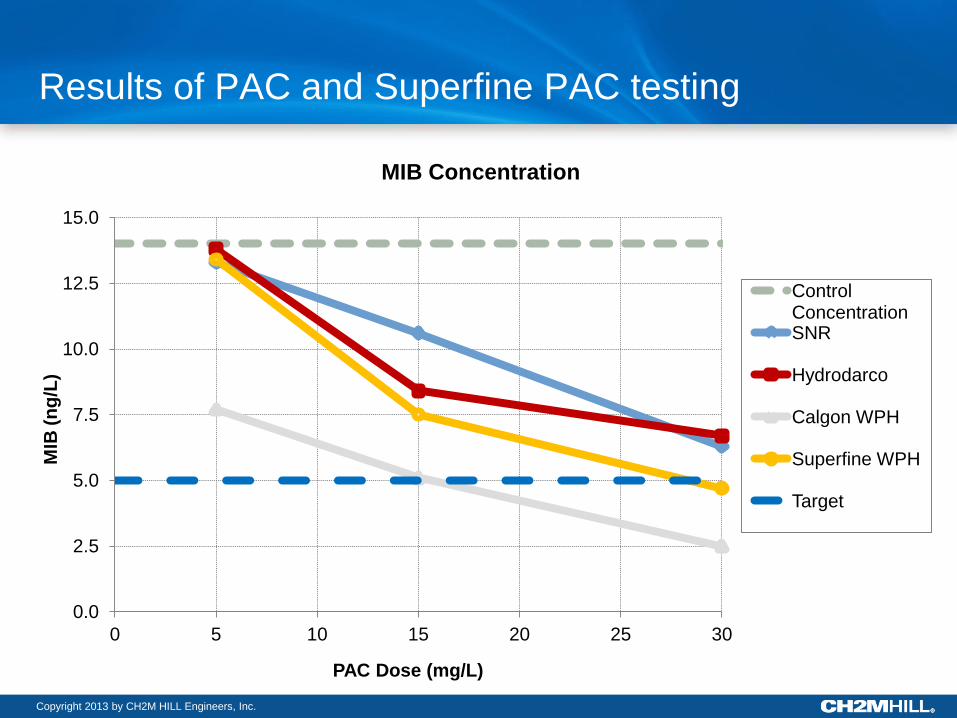
Results of PAC and Superfine PAC testing
0.0
2.5
5.0
7.5
10.0
12.5
15.0
0 5 10 15 20 25 30
MIB
(n
g/L
)
PAC Dose (mg/L)
MIB Concentration
Control Concentration SNR
Hydrodarco
Calgon WPH
Superfine WPH
Target

Copyright 2013 by CH2M HILL Engineers, Inc.
CONTROL AND TREATMENT
OXIDANTS
Copyright 2013 by CH2M HILL Engineers, Inc.
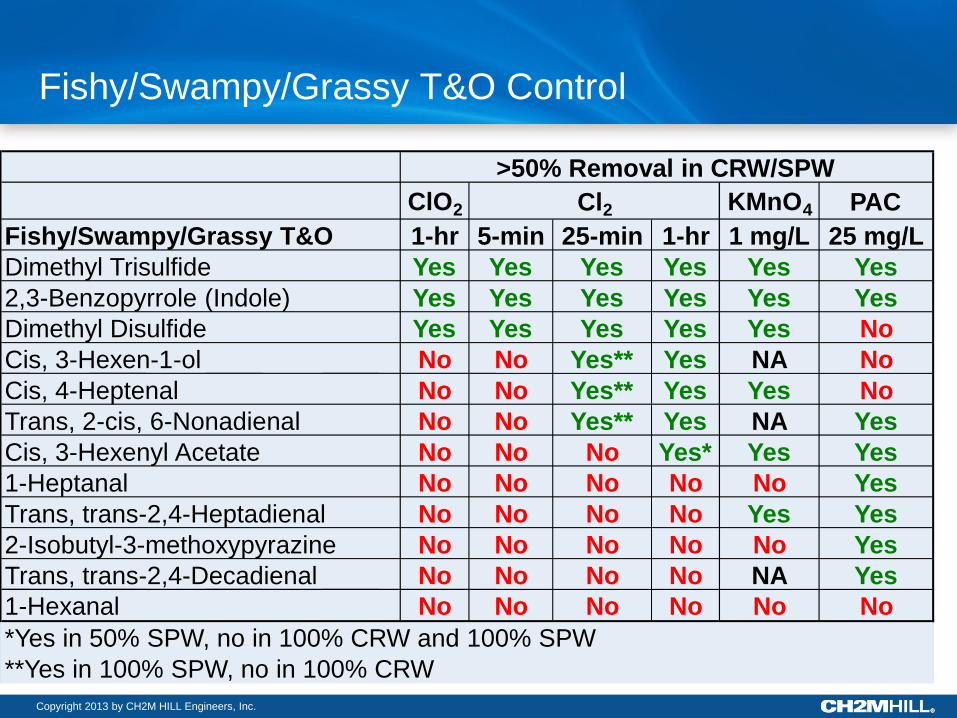
Fishy/Swampy/Grassy T&O Control
ClO 2 KMnO 4 PAC
Fishy/Swampy/Grassy T&O 1-hr 5-min 25-min 1-hr 1 mg/L 25 mg/L
Dimethyl Trisulfide Yes Yes Yes Yes Yes Yes
2,3-Benzopyrrole (Indole) Yes Yes Yes Yes Yes Yes
Dimethyl Disulfide Yes Yes Yes Yes Yes No
Cis, 3-Hexen-1-ol No No Yes** Yes NA No
Cis, 4-Heptenal No No Yes** Yes Yes No
Trans, 2-cis, 6-Nonadienal No No Yes** Yes NA Yes
Cis, 3-Hexenyl Acetate No No No Yes* Yes Yes
1-Heptanal No No No No No Yes
Trans, trans-2,4-Heptadienal No No No No Yes Yes
2-Isobutyl-3-methoxypyrazine No No No No No Yes
Trans, trans-2,4-Decadienal No No No No NA Yes
1-Hexanal No No No No No No
*Yes in 50% SPW, no in 100% CRW and 100% SPW
**Yes in 100% SPW, no in 100% CRW
>50% Removal in CRW/SPW
Cl 2
Copyright 2013 by CH2M HILL Engineers, Inc.
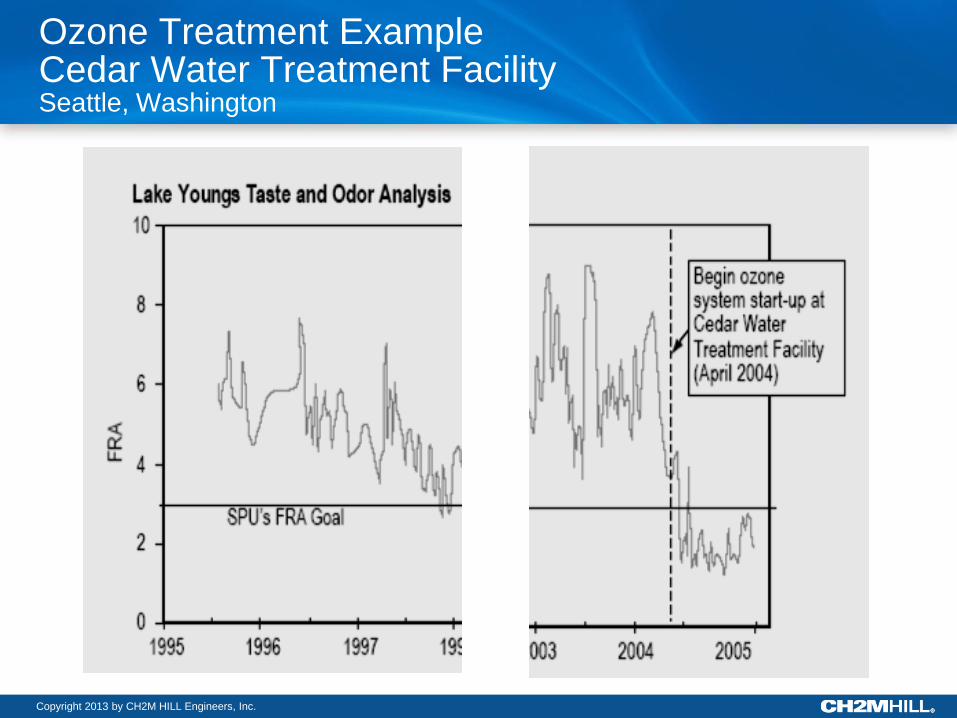
Ozone Treatment Example Cedar Water Treatment Facility Seattle, Washington
Copyright 2013 by CH2M HILL Engineers, Inc.
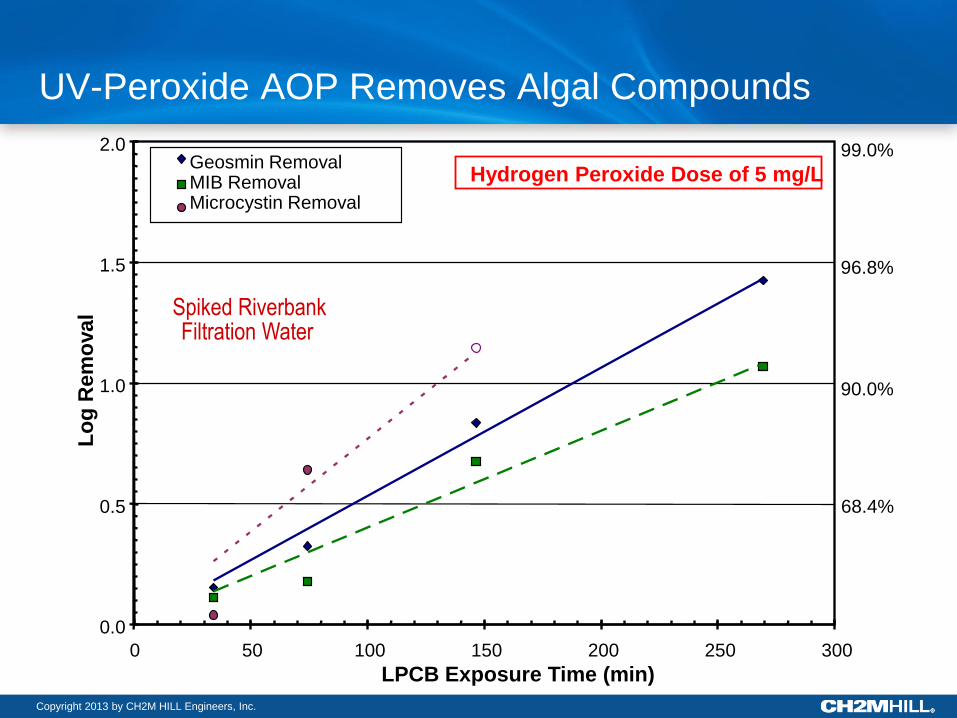
UV-Peroxide AOP Removes Algal Compounds
Spiked Riverbank Filtration Water
0.0
0.5
1.0
1.5
2.0
0 50 100 150 200 250 300
LPCB Exposure Time (min)
Lo
g R
em
oval
Geosmin Removal MIB Removal Microcystin Removal
Hydrogen Peroxide Dose of 5 mg/L
68.4%
90.0%
96.8%
99.0%
Copyright 2013 by CH2M HILL Engineers, Inc.
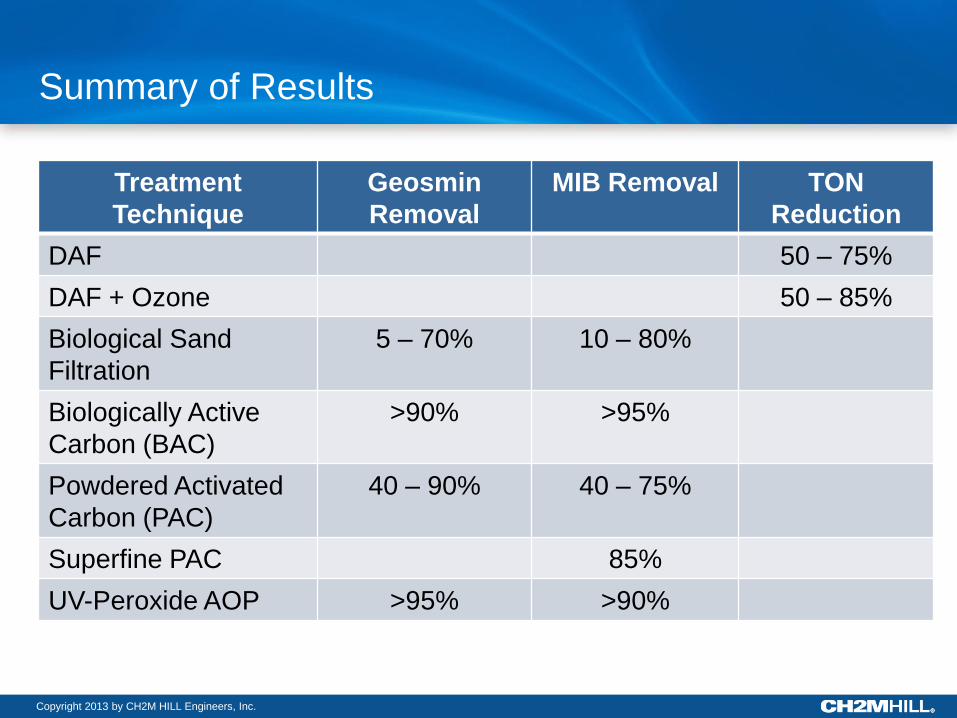
Summary of Results
Treatment
Technique
Geosmin
Removal
MIB Removal TON
Reduction
DAF 50 – 75%
DAF + Ozone 50 – 85%
Biological Sand
Filtration
5 – 70% 10 – 80%
Biologically Active
Carbon (BAC)
>90% >95%
Powdered Activated
Carbon (PAC)
40 – 90% 40 – 75%
Superfine PAC 85%
UV-Peroxide AOP >95% >90%

Copyright 2013 by CH2M HILL Engineers, Inc.
THE END
References and Acknowledgements:
1. “Effect of Powdered Activated Carbon Base Material and Size on Disinfection By-
Product Precursor and Trace Organic Pollutant Removal,” Master’s thesis by
Susan Ennis Dun, North Carolina State University, 2011.
2. CH2M HILL Applied Sciences Laboratory
3. Kerry Meyer/CH2M HILL, et al, “Biofiltration for MIB and Geosmin Removal”,
ACE 2005 podium presentation.
4. Others as cited.
Copyright 2013 by CH2M HILL Engineers, Inc.
EXTRA SLIDES
Copyright 2013 by CH2M HILL Engineers, Inc.
DETECTION MEASUREMENT
Copyright 2013 by CH2M HILL Engineers, Inc.
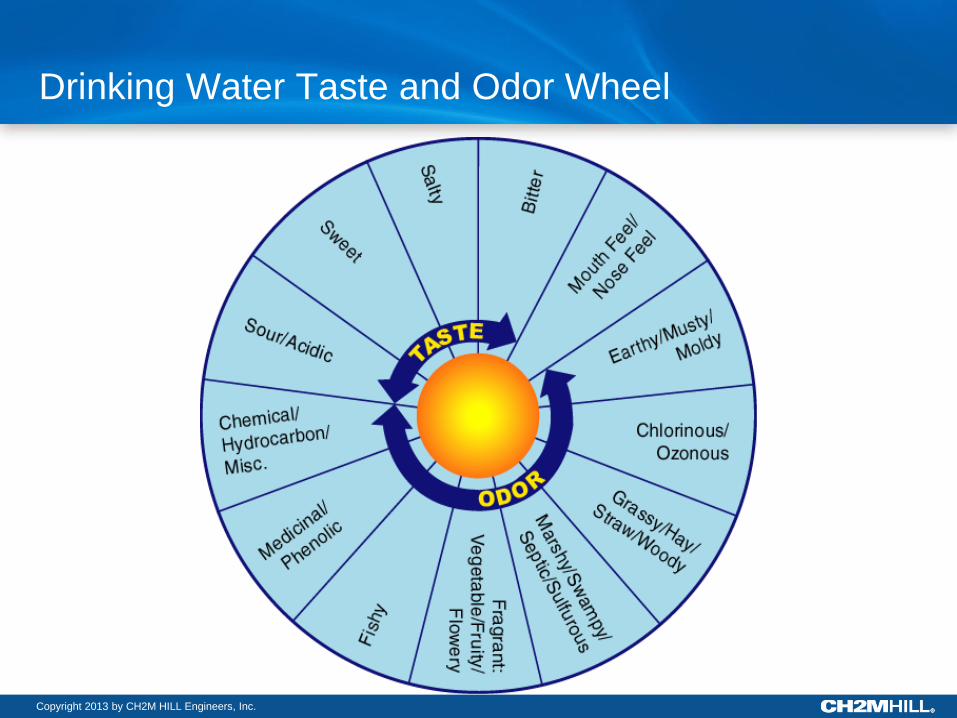
Drinking Water Taste and Odor Wheel
Copyright 2013 by CH2M HILL Engineers, Inc.
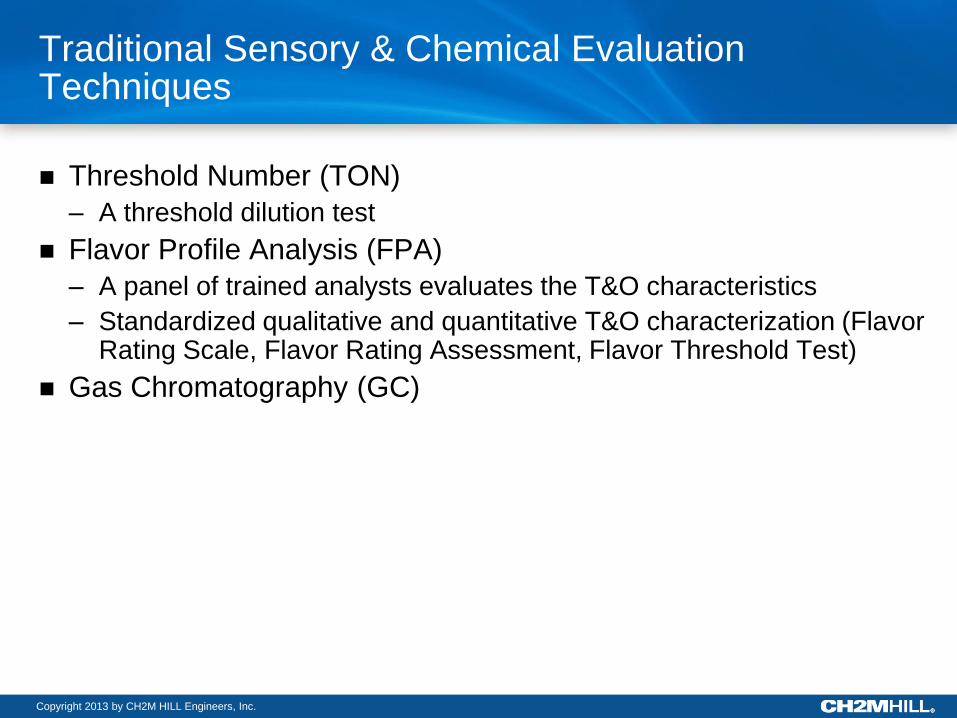
Traditional Sensory & Chemical Evaluation Techniques
Threshold Number (TON)
– A threshold dilution test
Flavor Profile Analysis (FPA)
– A panel of trained analysts evaluates the T&O characteristics
– Standardized qualitative and quantitative T&O characterization (Flavor Rating Scale, Flavor Rating Assessment, Flavor Threshold Test)
Gas Chromatography (GC)

Copyright 2013 by CH2M HILL Engineers, Inc.
New Sensory Techniques
Attribute Rating Test
Rating Method “difference method”
2-of-5 Odor Test

Copyright 2013 by CH2M HILL Engineers, Inc.
New Sensory Techniques Attribute Rating Test
Paired comparison test
Identify Geosmin or 2-MIB 15ng/L standard
Sample is < or = or > standard
Compared well with GC
More effective than TON
– American Water (PAC testing)
– Korea (PAC testing)
Copyright 2013 by CH2M HILL Engineers, Inc.
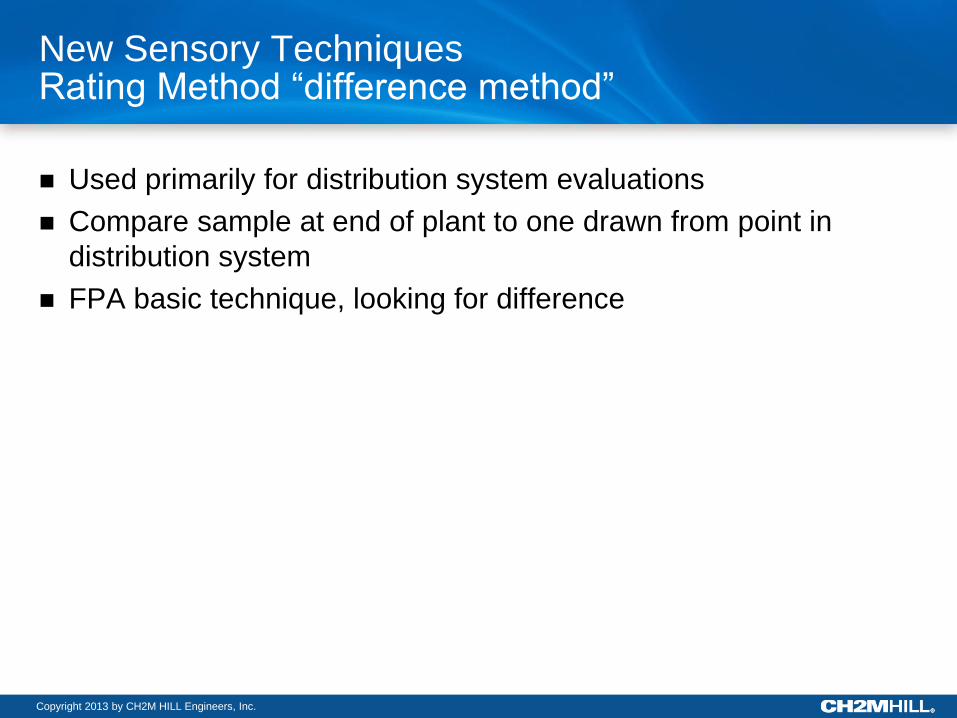
New Sensory Techniques Rating Method “difference method”
Used primarily for distribution system evaluations
Compare sample at end of plant to one drawn from point in
distribution system
FPA basic technique, looking for difference
Copyright 2013 by CH2M HILL Engineers, Inc.
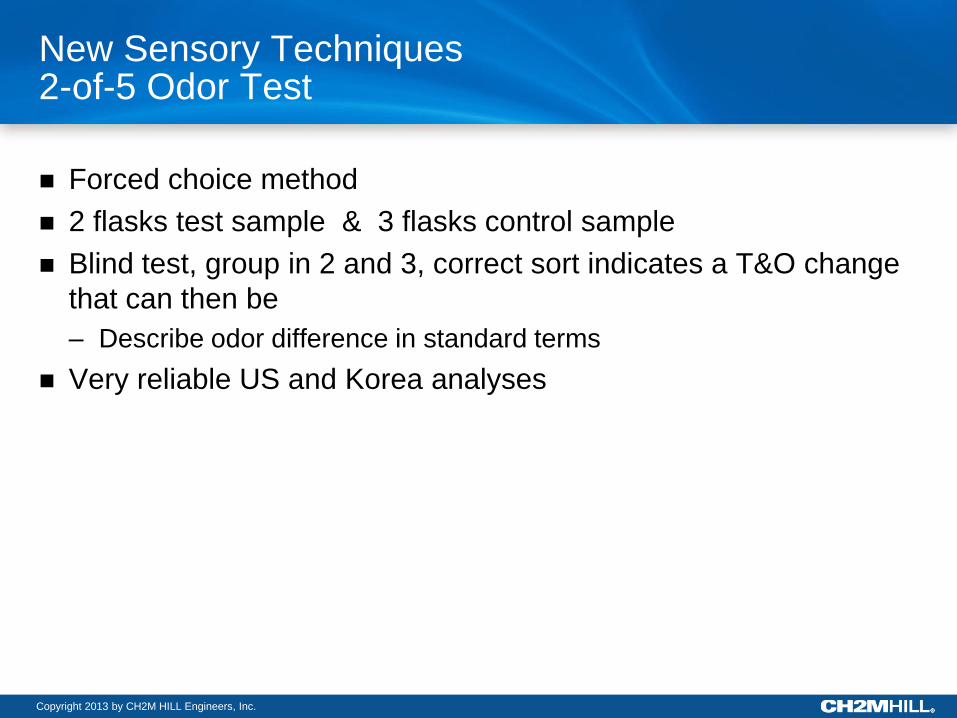
New Sensory Techniques 2-of-5 Odor Test
Forced choice method
2 flasks test sample & 3 flasks control sample
Blind test, group in 2 and 3, correct sort indicates a T&O change
that can then be
– Describe odor difference in standard terms
Very reliable US and Korea analyses
Copyright 2013 by CH2M HILL Engineers, Inc.
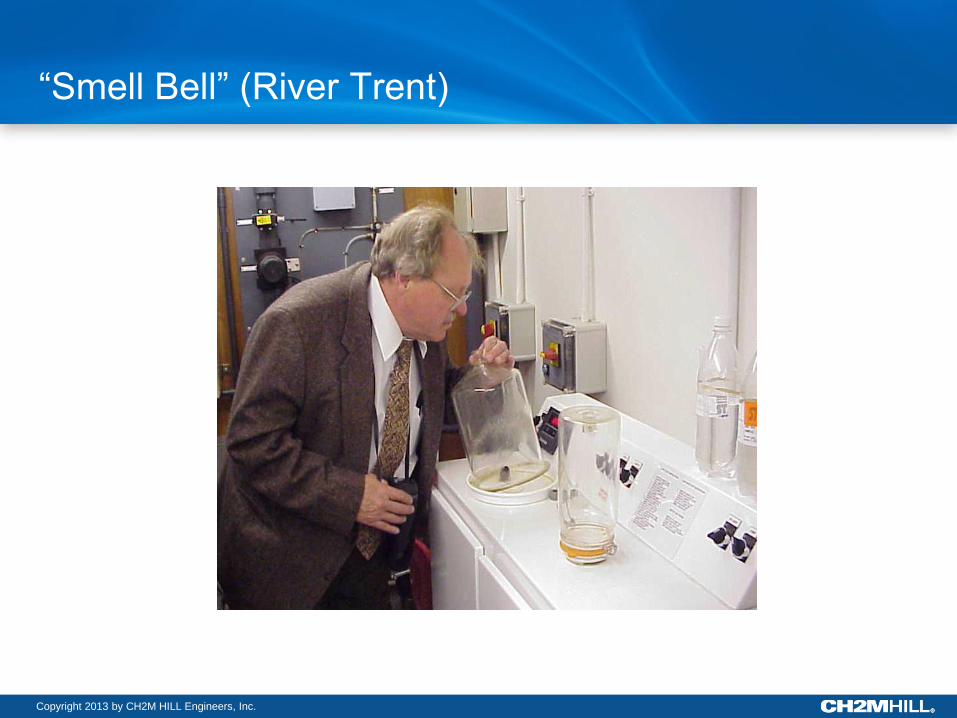
“Smell Bell” (River Trent)
Copyright 2013 by CH2M HILL Engineers, Inc.
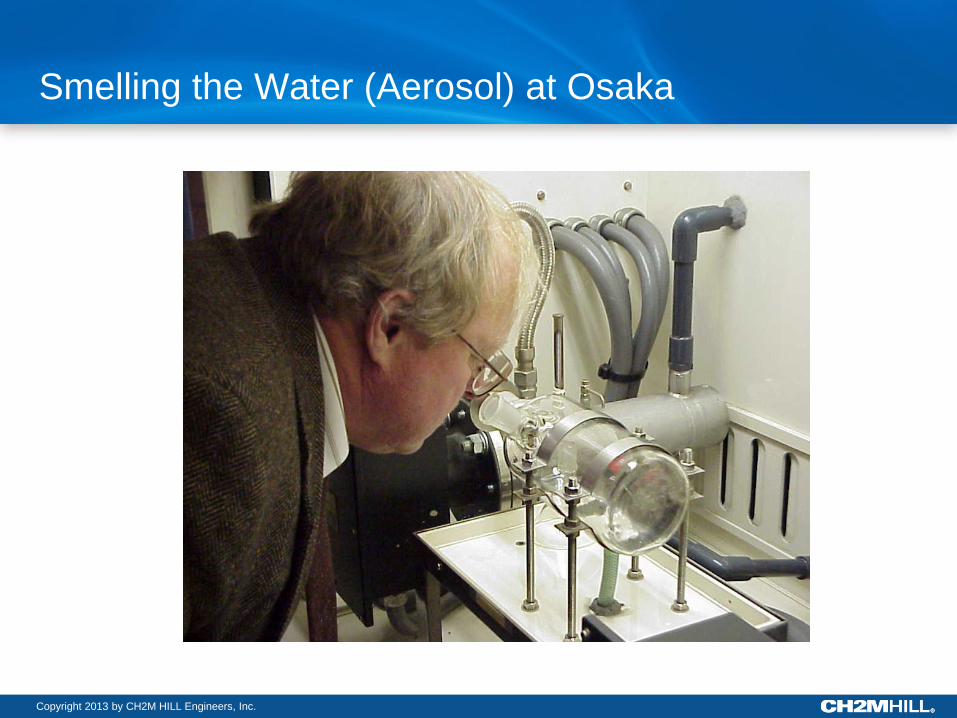
Smelling the Water (Aerosol) at Osaka
Copyright 2013 by CH2M HILL Engineers, Inc.
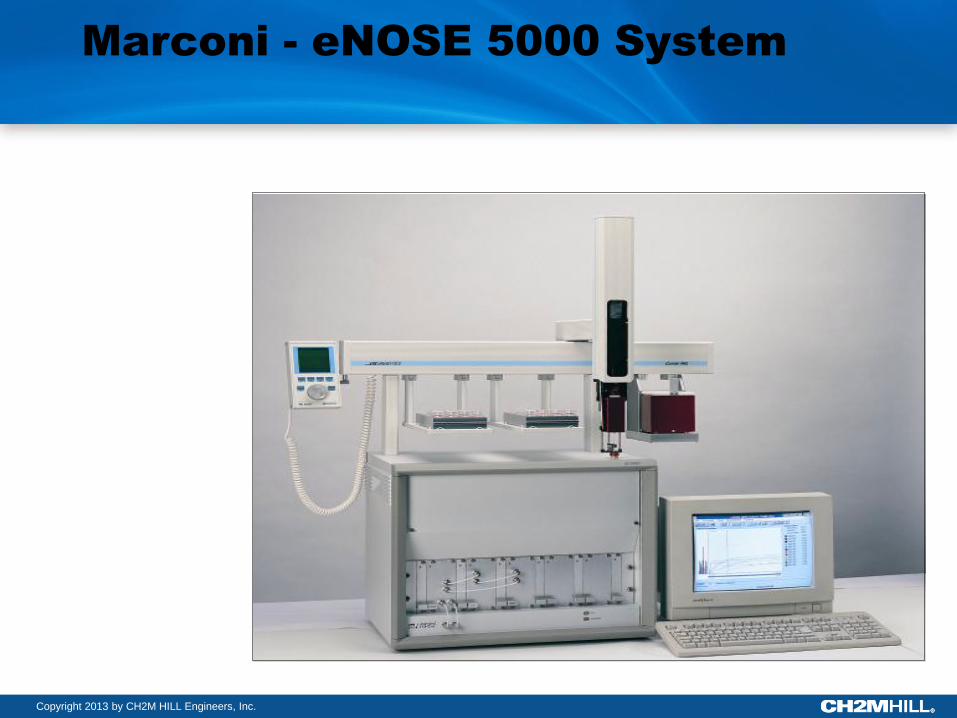
Marconi - eNOSE 5000 System
Copyright 2013 by CH2M HILL Engineers, Inc.
CONTROL AND TREATMENT
FILTRATION AND OZONE

Copyright 2013 by CH2M HILL Engineers, Inc.
T&O Treatment Examples Southern Delivery System – Lab Testing Colorado Springs, Colorado
0
20
40
60
80
100
120
140
160
Co
nc
en
tra
tio
n,
ng
/L
Raw Settled Ozonated Filtered
MIB (AM)
MIB (PM)
Geosmin (AM)
Geosmin (PM)
Human Detection Limit

Copyright 2013 by CH2M HILL Engineers, Inc.
Common Causes of Taste and Odor Geosmin and MIB
Geosmin (Trans-1,10-dimethyl-trans-9-decalol)
MIB (2-Methylisoborneol)
Produce earthy/musty odors not removed during conventional
treatment
Metabolic byproducts of algae (blue-green algae and
actinomycetes)
Occurrence – seasonal (summer and fall)
Geography – global, significant research conducted in Japan and
the U.S.
Odor threshold concentration (OTC) - 2 to10 ng/L
For comparison hydrogen sulfide (H2S) odor threshold - 5,000
ng/L
Copyright 2013 by CH2M HILL Engineers, Inc.
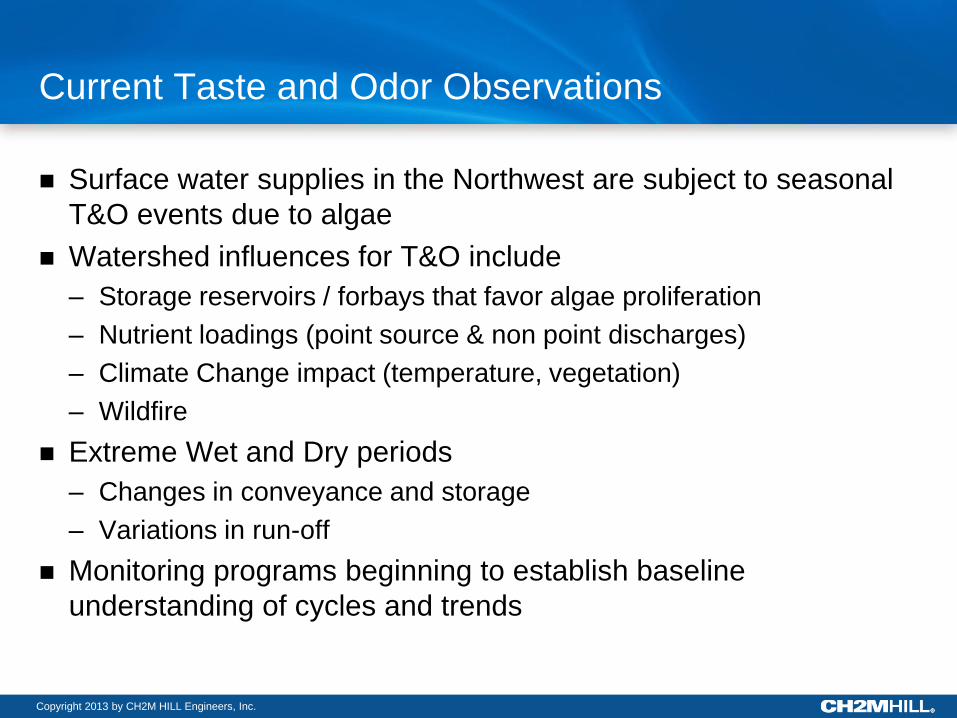
Current Taste and Odor Observations
Surface water supplies in the Northwest are subject to seasonal
T&O events due to algae
Watershed influences for T&O include
– Storage reservoirs / forbays that favor algae proliferation
– Nutrient loadings (point source & non point discharges)
– Climate Change impact (temperature, vegetation)
– Wildfire
Extreme Wet and Dry periods
– Changes in conveyance and storage
– Variations in run-off
Monitoring programs beginning to establish baseline
understanding of cycles and trends