Task Assignment 1A -001 Analysis of Bluetooth and Wi- Fi ...
198
Task Assignment 1A-001 Analysis of Bluetooth and Wi-Fi Technology to Measure Wait Times of Personal Vehicles at Arizona-Mexico Ports of Entry November 24, 2015 Prepared for: Arizona Department of Transportation Office of P3 Initiatives and International Affairs Prepared by: Lee Engineering, LLC
Transcript of Task Assignment 1A -001 Analysis of Bluetooth and Wi- Fi ...
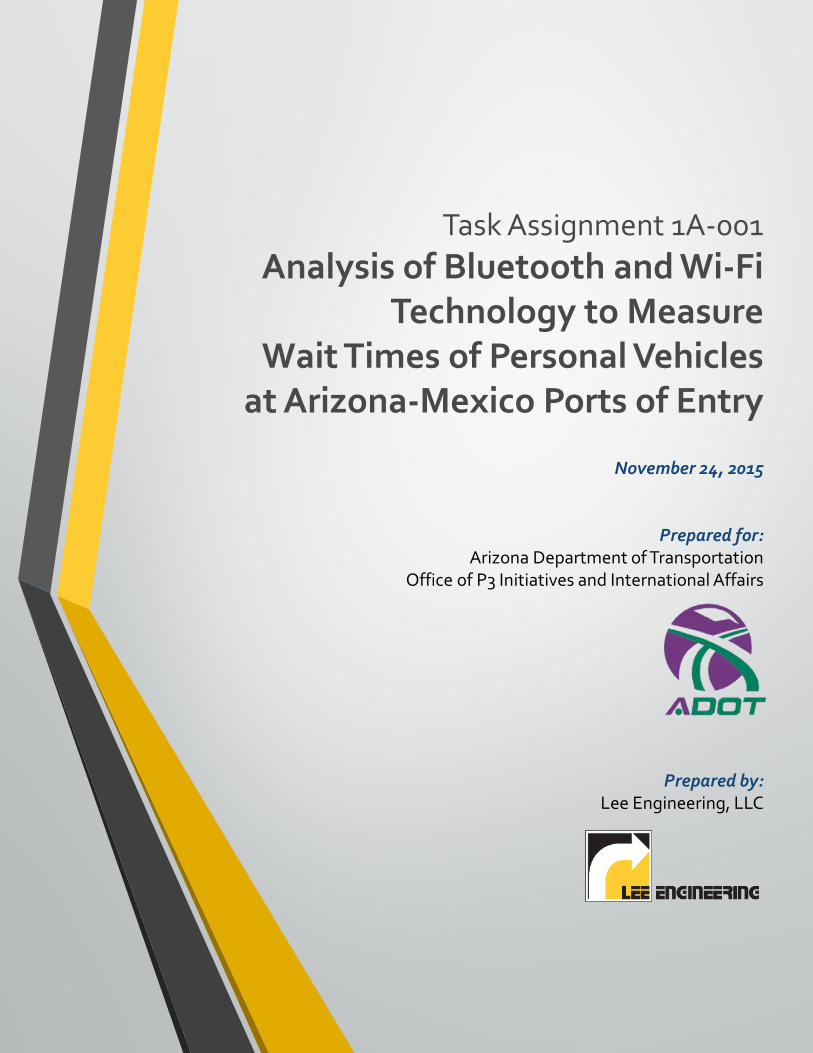
Task Assignment 1A-001Analysis of Bluetooth and Wi-Fi
Technology to Measure Wait Times of Personal Vehicles
at Arizona-Mexico Ports of Entry
November 24, 2015
Prepared for: Arizona Department of Transportation
Office of P3 Initiatives and International Affairs
Prepared by:Lee Engineering, LLC

Page 1 ANALYSIS OF BLUETOOTH AND WI-FI TECHNOLOGY
TO MEASURE WAIT TIMES OF PERSONAL VEHICLES AT ARIZONA-MEXICO PORTS OF ENTRY
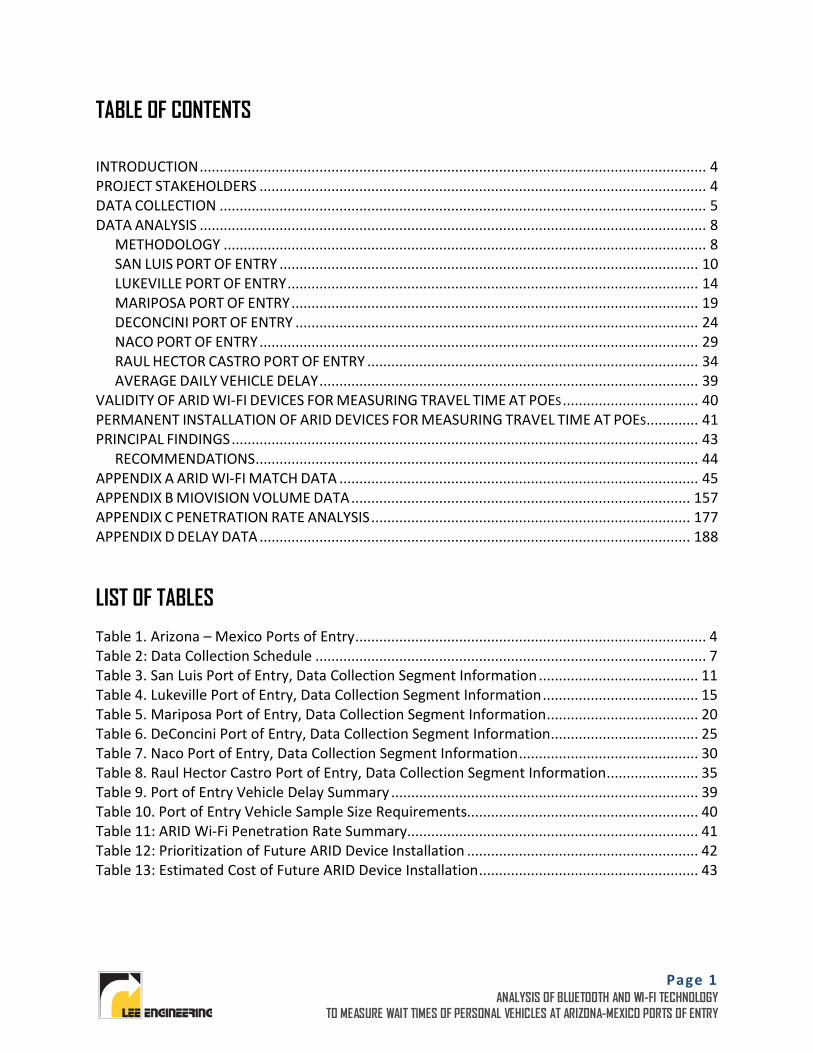
TABLE OF CONTENTS
INTRODUCTION ............................................................................................................................... 4 PROJECT STAKEHOLDERS ................................................................................................................ 4 DATA COLLECTION .......................................................................................................................... 5 DATA ANALYSIS ............................................................................................................................... 8
METHODOLOGY ......................................................................................................................... 8 SAN LUIS PORT OF ENTRY ......................................................................................................... 10 LUKEVILLE PORT OF ENTRY ....................................................................................................... 14 MARIPOSA PORT OF ENTRY ...................................................................................................... 19 DECONCINI PORT OF ENTRY ..................................................................................................... 24 NACO PORT OF ENTRY .............................................................................................................. 29 RAUL HECTOR CASTRO PORT OF ENTRY ................................................................................... 34 AVERAGE DAILY VEHICLE DELAY ............................................................................................... 39
VALIDITY OF ARID WI-FI DEVICES FOR MEASURING TRAVEL TIME AT POES .................................. 40 PERMANENT INSTALLATION OF ARID DEVICES FOR MEASURING TRAVEL TIME AT POES ............. 41 PRINCIPAL FINDINGS ..................................................................................................................... 43
RECOMMENDATIONS ............................................................................................................... 44 APPENDIX A ARID WI-FI MATCH DATA .......................................................................................... 45 APPENDIX B MIOVISION VOLUME DATA ..................................................................................... 157 APPENDIX C PENETRATION RATE ANALYSIS ................................................................................ 177 APPENDIX D DELAY DATA ............................................................................................................ 188
LIST OF TABLES
Table 1. Arizona – Mexico Ports of Entry ........................................................................................ 4 Table 2: Data Collection Schedule .................................................................................................. 7 Table 3. San Luis Port of Entry, Data Collection Segment Information ........................................ 11 Table 4. Lukeville Port of Entry, Data Collection Segment Information ....................................... 15 Table 5. Mariposa Port of Entry, Data Collection Segment Information ...................................... 20 Table 6. DeConcini Port of Entry, Data Collection Segment Information ..................................... 25 Table 7. Naco Port of Entry, Data Collection Segment Information ............................................. 30 Table 8. Raul Hector Castro Port of Entry, Data Collection Segment Information ....................... 35 Table 9. Port of Entry Vehicle Delay Summary ............................................................................. 39 Table 10. Port of Entry Vehicle Sample Size Requirements.......................................................... 40 Table 11: ARID Wi-Fi Penetration Rate Summary......................................................................... 41 Table 12: Prioritization of Future ARID Device Installation .......................................................... 42 Table 13: Estimated Cost of Future ARID Device Installation ....................................................... 43
Page 2 ANALYSIS OF BLUETOOTH AND WI-FI TECHNOLOGY
TO MEASURE WAIT TIMES OF PERSONAL VEHICLES AT ARIZONA-MEXICO PORTS OF ENTRY
LIST OF FIGURES Figure 1: ARID Deployment ............................................................................................................. 6 Figure 2: Wait Time and Crossing Time Diagram at a Port of Entry ............................................... 9 Figure 3. San Luis Port of Entry, Aerial View and Device Position Location ................................. 10 Figure 4. San Luis Port of Entry, Summary of ARID Wi-Fi and Miovision Data ............................. 12 Figure 5. San Luis Port of Entry, Quantity of Total Vehicles and ARID Wi-Fi Matches Observed in the Southbound Direction (1-4) .................................................................................................... 13 Figure 6. San Luis Port of Entry, Average Delay of Southbound Vehicles Exiting the U.S. (1-4) .. 13 Figure 7. Lukeville Port of Entry, Aerial View and Device Position Location ................................ 14 Figure 8. Lukeville Port of Entry, Summary of ARID Wi-Fi and Miovision Data ............................ 16 Figure 9. Lukeville Port of Entry, Quantity of Total Vehicles and ARID Wi-Fi Matches Observed in the Southbound Direction (1-2) .................................................................................................... 17 Figure 10. Lukeville Port of Entry, Average Delay of Southbound Vehicles Exiting the U.S. (1-2) 18 Figure 11. Mariposa Port of Entry, Aerial View and Device Position Location ............................. 19 Figure 12. Mariposa Port of Entry, Summary of ARID Wi-Fi and Miovision Data ........................ 21 Figure 13. Mariposa Port of Entry, Quantity of Total Vehicles and ARID Wi-Fi Matches Observed in the Northbound Direction (2-1) ................................................................................................ 22 Figure 14. Mariposa Port of Entry, Quantity of Total Vehicles and ARID Wi-Fi Matches Observed in the Southbound Direction (1-2) ................................................................................................ 22 Figure 15. Mariposa Port of Entry, Average Delay of Northbound Vehicles Entering the U.S. (3-2)....................................................................................................................................................... 23 Figure 16. Mariposa Port of Entry, Average Delay of Southbound Vehicles Exiting the U.S. (2-1)....................................................................................................................................................... 23 Figure 17. DeConcini Port of Entry, Aerial View and Device Position Location ............................ 24 Figure 18. DeConcini Port of Entry, Summary of ARID Wi-Fi and Miovision Data ....................... 26 Figure 19. DeConcini Port of Entry, Quantity of Total Vehicles and ARID Wi-Fi Matches Observed in the Northbound Direction (3-1) ................................................................................................ 27 Figure 20. DeConcini Port of Entry, Quantity of Total Vehicles and ARID Wi-Fi Matches Observed in the Southbound Direction (1-3) ................................................................................................ 27 Figure 21. DeConcini Port of Entry, Average Delay of Northbound Vehicles Entering the U.S. (3-1) ............................................................................................................................................... 28 Figure 22. DeConcini Port of Entry, Average Delay of Southbound Vehicles Exiting the U.S. (1-3)....................................................................................................................................................... 28 Figure 23. Naco Port of Entry, Aerial View and Device Position Location .................................... 29 Figure 24. Naco Port of Entry, Summary of ARID Wi-Fi and Miovision Data................................ 31 Figure 25. Naco Port of Entry, Quantity of Total Vehicles and ARID Wi-Fi Matches Observed in the Northbound Direction (2-1) .................................................................................................... 32 Figure 26. Naco Port of Entry, Quantity of Total Vehicles and ARID Wi-Fi Matches Observed in the Southbound Direction (1-2) .................................................................................................... 32 Figure 27. Naco Port of Entry, Average Delay of Northbound Vehicles Entering the U.S. (2-1) .. 33 Figure 28. Naco Port of Entry, Average Delay of Southbound Vehicles Exiting the U.S. (1-2) ..... 33 Figure 29. Raul Hector Castro Port of Entry, Aerial View and Device Position Location .............. 34 Figure 30. Raul Hector Castro Port of Entry, Summary of ARID Wi-Fi and Miovision Data ......... 36
Page 3 ANALYSIS OF BLUETOOTH AND WI-FI TECHNOLOGY
TO MEASURE WAIT TIMES OF PERSONAL VEHICLES AT ARIZONA-MEXICO PORTS OF ENTRY
Figure 31. Raul Hector Castro Port of Entry, Quantity of Total Vehicles and ARID Wi-Fi Matches Observed in the Northbound Direction (2-1) ............................................................................... 37 Figure 32. Raul Hector Castro Port of Entry, Quantity of Total Vehicles and ARID Wi-Fi Matches Observed in the Southbound Direction (1-2) ............................................................................... 37 Figure 33. Raul Hector Castro Port of Entry, Average Delay of Northbound Vehicles Entering the U.S. (2-1) ....................................................................................................................................... 38 Figure 34. Raul Hector Castro Port of Entry, Average Delay of Southbound Vehicles Exiting the U.S. (1-2) ....................................................................................................................................... 38
Page 4 ANALYSIS OF BLUETOOTH AND WI-FI TECHNOLOGY
TO MEASURE WAIT TIMES OF PERSONAL VEHICLES AT ARIZONA-MEXICO PORTS OF ENTRY
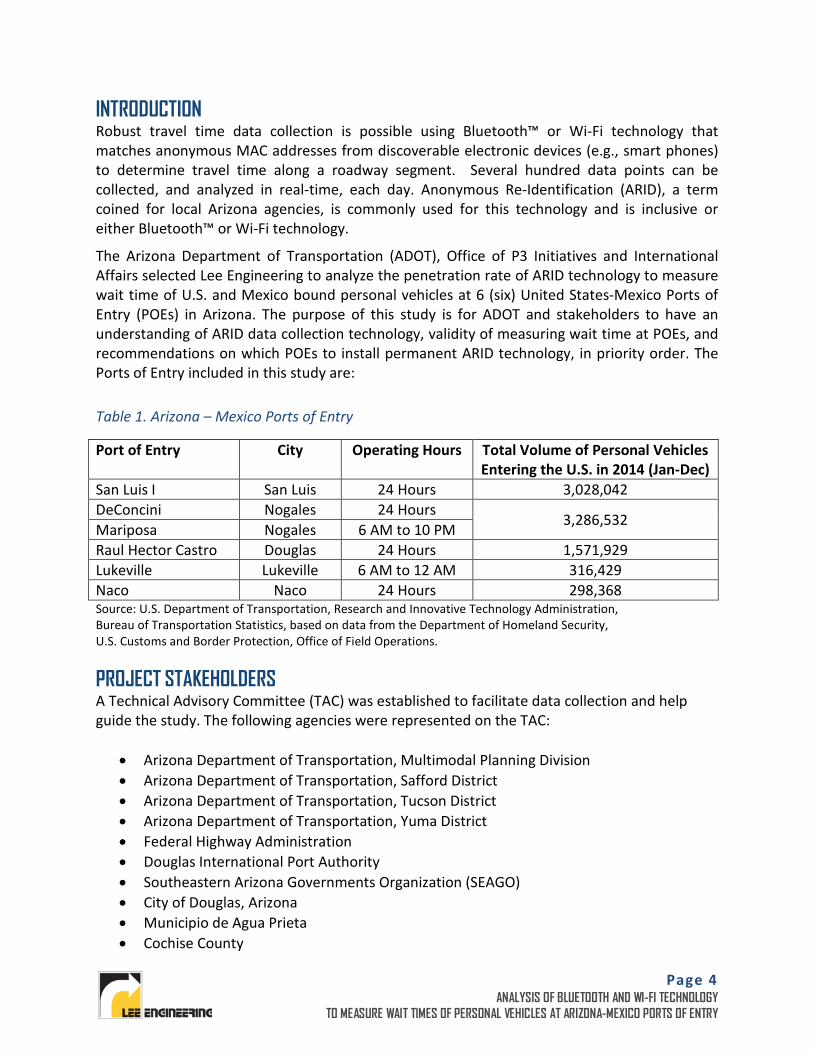
INTRODUCTION Robust travel time data collection is possible using Bluetooth™ or Wi-Fi technology that matches anonymous MAC addresses from discoverable electronic devices (e.g., smart phones) to determine travel time along a roadway segment. Several hundred data points can be collected, and analyzed in real-time, each day. Anonymous Re-Identification (ARID), a term coined for local Arizona agencies, is commonly used for this technology and is inclusive or either Bluetooth™ or Wi-Fi technology.
The Arizona Department of Transportation (ADOT), Office of P3 Initiatives and International Affairs selected Lee Engineering to analyze the penetration rate of ARID technology to measure wait time of U.S. and Mexico bound personal vehicles at 6 (six) United States-Mexico Ports of Entry (POEs) in Arizona. The purpose of this study is for ADOT and stakeholders to have an understanding of ARID data collection technology, validity of measuring wait time at POEs, and recommendations on which POEs to install permanent ARID technology, in priority order. The Ports of Entry included in this study are: Table 1. Arizona – Mexico Ports of Entry
Port of Entry City Operating Hours Total Volume of Personal Vehicles Entering the U.S. in 2014 (Jan-Dec)
San Luis I San Luis 24 Hours 3,028,042 DeConcini Nogales 24 Hours
3,286,532 Mariposa Nogales 6 AM to 10 PM Raul Hector Castro Douglas 24 Hours 1,571,929 Lukeville Lukeville 6 AM to 12 AM 316,429 Naco Naco 24 Hours 298,368 Source: U.S. Department of Transportation, Research and Innovative Technology Administration, Bureau of Transportation Statistics, based on data from the Department of Homeland Security, U.S. Customs and Border Protection, Office of Field Operations.
PROJECT STAKEHOLDERS A Technical Advisory Committee (TAC) was established to facilitate data collection and help guide the study. The following agencies were represented on the TAC:
• Arizona Department of Transportation, Multimodal Planning Division • Arizona Department of Transportation, Safford District • Arizona Department of Transportation, Tucson District • Arizona Department of Transportation, Yuma District • Federal Highway Administration • Douglas International Port Authority • Southeastern Arizona Governments Organization (SEAGO) • City of Douglas, Arizona • Municipio de Agua Prieta • Cochise County
Page 5 ANALYSIS OF BLUETOOTH AND WI-FI TECHNOLOGY
TO MEASURE WAIT TIMES OF PERSONAL VEHICLES AT ARIZONA-MEXICO PORTS OF ENTRY
• Greater Nogales Santa Cruz County Port Authority • Pima Association of Governments (PAG) • City of Nogales • Municipio de Nogales, Sonora • Santa Cruz County • Municipio de Sonoyta • Greater Yuma Port Authority • Yuma Metropolitan Planning Organization (YMPO) • City of San Luis • Municipio de San Luis Rio Colorado • Secretaria de Infraestructura y Desarrollo Urbano (SIDUR) • Secretaria de Comunicaciones y Transporte (SCT) • U.S. Customs and Border Protection (CBP) • Administración General de Aduanas (Mexican Customs) • U.S. General Services Administration (GSA)
DATA COLLECTION Lee Engineering and Crossborder Group collected travel time and traffic volumes in June and July of 2015 to evaluate the penetration rate or the sampling rate of Bluetooth or Wi-Fi anonymous re-identification technology at the six Arizona-Mexico POEs. Prior to field deployment, staff from Crossborder Group visited the six POEs along the Arizona-Sonora border to assess specific site location options and potential limitations for the deployment of video volume data collection and ARID technology equipment. Site locations were identified based on several factors including the availability of existing poles or parking areas for security, strength of cellular communications network, and traffic flow. The Technical Advisory Committee (TAC) provided input for preferred data collection sites and observation dates at each POE. The ease of installation, travel time between sites, avoiding holidays, and the overall project schedule was also considered.
Traffic volumes were obtained using MiovisionTM video cameras and processing. To estimate the number of passenger vehicles only, trucks were removed from the count.
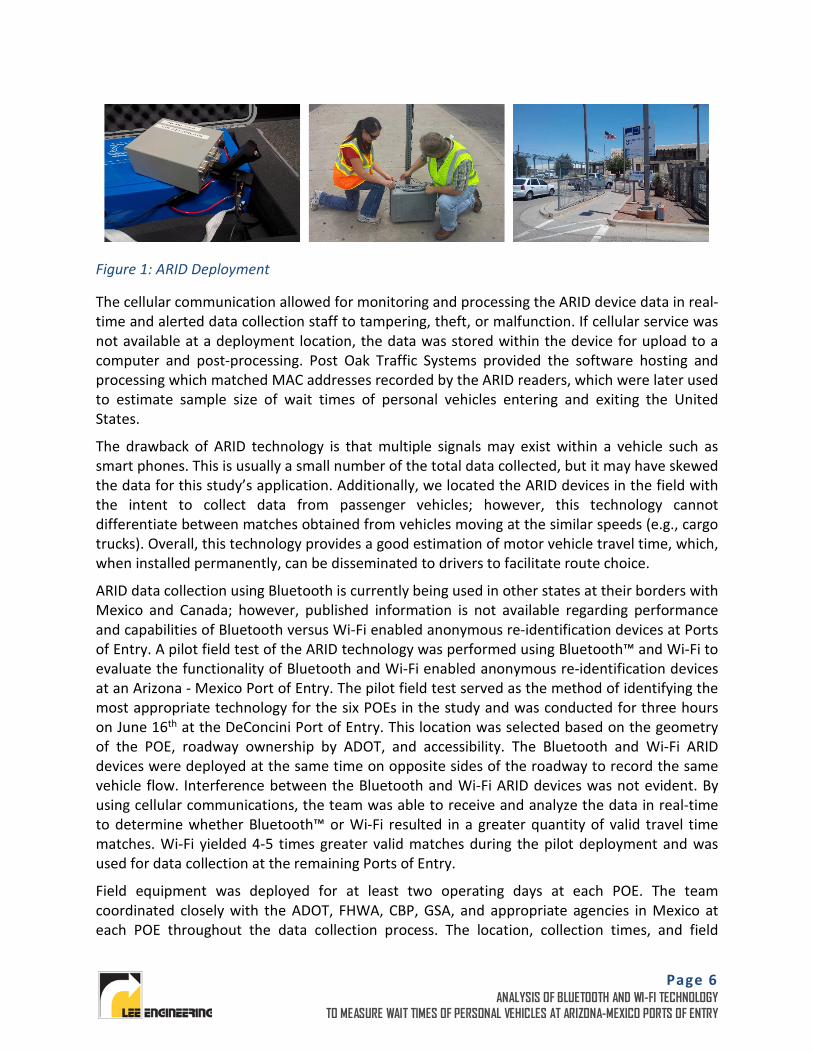
ARID travel time data collection devices developed by Post Oak Traffic Systems were used to collect travel times. The equipment included a deep cycle gel cell battery, data processing device, Bluetooth or Wi-Fi antenna, and cellular modem inside a Pelican hardcase. To minimize the chance of theft, the hardcase was joined to a fixed object with a heavy duty steel chain and lock or secured inside a locked vehicle. The pelican hardcase and an example arterial deployment are shown in Figure 1. The hardcase and antennas were secured to a light pole using locks and heavy duty steel chains.
Page 6 ANALYSIS OF BLUETOOTH AND WI-FI TECHNOLOGY
TO MEASURE WAIT TIMES OF PERSONAL VEHICLES AT ARIZONA-MEXICO PORTS OF ENTRY
Figure 1: ARID Deployment
The cellular communication allowed for monitoring and processing the ARID device data in real-time and alerted data collection staff to tampering, theft, or malfunction. If cellular service was not available at a deployment location, the data was stored within the device for upload to a computer and post-processing. Post Oak Traffic Systems provided the software hosting and processing which matched MAC addresses recorded by the ARID readers, which were later used to estimate sample size of wait times of personal vehicles entering and exiting the United States.
The drawback of ARID technology is that multiple signals may exist within a vehicle such as smart phones. This is usually a small number of the total data collected, but it may have skewed the data for this study’s application. Additionally, we located the ARID devices in the field with the intent to collect data from passenger vehicles; however, this technology cannot differentiate between matches obtained from vehicles moving at the similar speeds (e.g., cargo trucks). Overall, this technology provides a good estimation of motor vehicle travel time, which, when installed permanently, can be disseminated to drivers to facilitate route choice.
ARID data collection using Bluetooth is currently being used in other states at their borders with Mexico and Canada; however, published information is not available regarding performance and capabilities of Bluetooth versus Wi-Fi enabled anonymous re-identification devices at Ports of Entry. A pilot field test of the ARID technology was performed using Bluetooth™ and Wi-Fi to evaluate the functionality of Bluetooth and Wi-Fi enabled anonymous re-identification devices at an Arizona - Mexico Port of Entry. The pilot field test served as the method of identifying the most appropriate technology for the six POEs in the study and was conducted for three hours on June 16th at the DeConcini Port of Entry. This location was selected based on the geometry of the POE, roadway ownership by ADOT, and accessibility. The Bluetooth and Wi-Fi ARID devices were deployed at the same time on opposite sides of the roadway to record the same vehicle flow. Interference between the Bluetooth and Wi-Fi ARID devices was not evident. By using cellular communications, the team was able to receive and analyze the data in real-time to determine whether Bluetooth™ or Wi-Fi resulted in a greater quantity of valid travel time matches. Wi-Fi yielded 4-5 times greater valid matches during the pilot deployment and was used for data collection at the remaining Ports of Entry.
Field equipment was deployed for at least two operating days at each POE. The team coordinated closely with the ADOT, FHWA, CBP, GSA, and appropriate agencies in Mexico at each POE throughout the data collection process. The location, collection times, and field
Page 7 ANALYSIS OF BLUETOOTH AND WI-FI TECHNOLOGY
TO MEASURE WAIT TIMES OF PERSONAL VEHICLES AT ARIZONA-MEXICO PORTS OF ENTRY
equipment deployment description was provided to the appropriate local jurisdiction or security office in order to obtain a permit or clearance to conduct the data collection effort. Additional information including contact information for personnel conducting the collection effort was also provided. A contact card was secured to all portable ARID devices in the case that any field issues were encountered, to ensure immediate attention could be provided to address the situation.
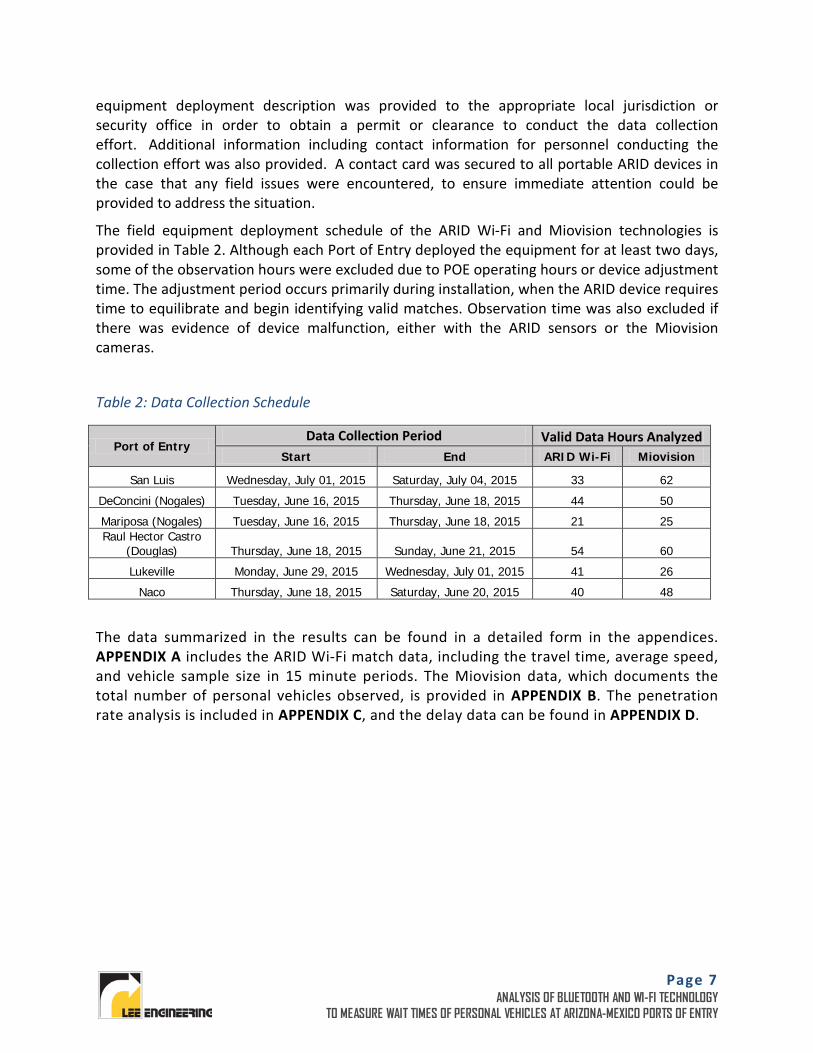
The field equipment deployment schedule of the ARID Wi-Fi and Miovision technologies is provided in Table 2. Although each Port of Entry deployed the equipment for at least two days, some of the observation hours were excluded due to POE operating hours or device adjustment time. The adjustment period occurs primarily during installation, when the ARID device requires time to equilibrate and begin identifying valid matches. Observation time was also excluded if there was evidence of device malfunction, either with the ARID sensors or the Miovision cameras.
Table 2: Data Collection Schedule
Port of Entry Data Collection Period Valid Data Hours Analyzed
Start End ARID Wi-Fi Miovision
San Luis Wednesday, July 01, 2015 Saturday, July 04, 2015 33 62
DeConcini (Nogales) Tuesday, June 16, 2015 Thursday, June 18, 2015 44 50
Mariposa (Nogales) Tuesday, June 16, 2015 Thursday, June 18, 2015 21 25 Raul Hector Castro
(Douglas) Thursday, June 18, 2015 Sunday, June 21, 2015 54 60
Lukeville Monday, June 29, 2015 Wednesday, July 01, 2015 41 26
Naco Thursday, June 18, 2015 Saturday, June 20, 2015 40 48
The data summarized in the results can be found in a detailed form in the appendices. APPENDIX A includes the ARID Wi-Fi match data, including the travel time, average speed, and vehicle sample size in 15 minute periods. The Miovision data, which documents the total number of personal vehicles observed, is provided in APPENDIX B. The penetration rate analysis is included in APPENDIX C, and the delay data can be found in APPENDIX D.
Page 8 ANALYSIS OF BLUETOOTH AND WI-FI TECHNOLOGY
TO MEASURE WAIT TIMES OF PERSONAL VEHICLES AT ARIZONA-MEXICO PORTS OF ENTRY
DATA ANALYSIS The purpose of the analysis was to determine whether ARID devices deployed at each Arizona-Mexico Port of Entry would collect a sufficient sample size of passenger vehicle travel time matches out of the total volume of passenger vehicles to confidently estimate wait times of U.S. and Mexico bound personal vehicles. The method in which crossing time, wait time, and delay are calculated are described in this section, along with a description and analysis of each Port of Entry.
METHODOLOGY
Penetration Rate Calculation:
The penetration rate is similar to sampling rate, which is essentially the number of unique devices detected by the ARID technology divided by the traffic volume for the same time period. The team used the following formula to calculate the penetration rate. Penetration Rate (% of traffic) = # 𝑜𝑜𝑜𝑜 𝑢𝑢𝑢𝑢𝑢𝑢𝑢𝑢𝑢𝑢𝑢𝑢 𝑑𝑑𝑢𝑢𝑑𝑑𝑢𝑢𝑑𝑑𝑢𝑢𝑑𝑑 𝑑𝑑𝑢𝑢𝑑𝑑𝑢𝑢𝑑𝑑𝑑𝑑𝑢𝑢𝑑𝑑 (𝑑𝑑𝑢𝑢𝑑𝑑𝑢𝑢𝑑𝑑𝑢𝑢𝑑𝑑 𝑝𝑝𝑢𝑢𝑝𝑝 ℎ𝑜𝑜𝑢𝑢𝑝𝑝)
𝑑𝑑𝑝𝑝𝑡𝑡𝑜𝑜𝑜𝑜𝑢𝑢𝑑𝑑 𝑑𝑑𝑜𝑜𝑣𝑣𝑢𝑢𝑣𝑣𝑢𝑢 (𝑑𝑑𝑡𝑡𝑝𝑝𝑑𝑑 𝑝𝑝𝑢𝑢𝑝𝑝 ℎ𝑜𝑜𝑢𝑢𝑝𝑝)
The penetration rate was calculated using a comparison of the ARID Wi-Fi data to the Miovision video data, which captured the volume of personal vehicles. In both data collection methods, the quantity of matches or vehicles (samples) can be compared in terms of 15 minute periods. To reduce bias of truck traffic or multiple Wi-Fi enabled devices identified in passenger vehicles, 15 minute periods with less than either three ARID Wi-Fi samples or three Miovision samples were excluded. This threshold value is based on a review of Port of Entry data and past experience in analyzing data from this technology. It was observed that making comparisons between ARID and Miovision data in 15 minute periods with less than three samples did not provide enough data to provide accurate representation.
The penetration rates of the six Ports of Entry are discussed in this report, and further information can be found in Appendix C.
Crossing Time, Wait Time and Delay Calculations:
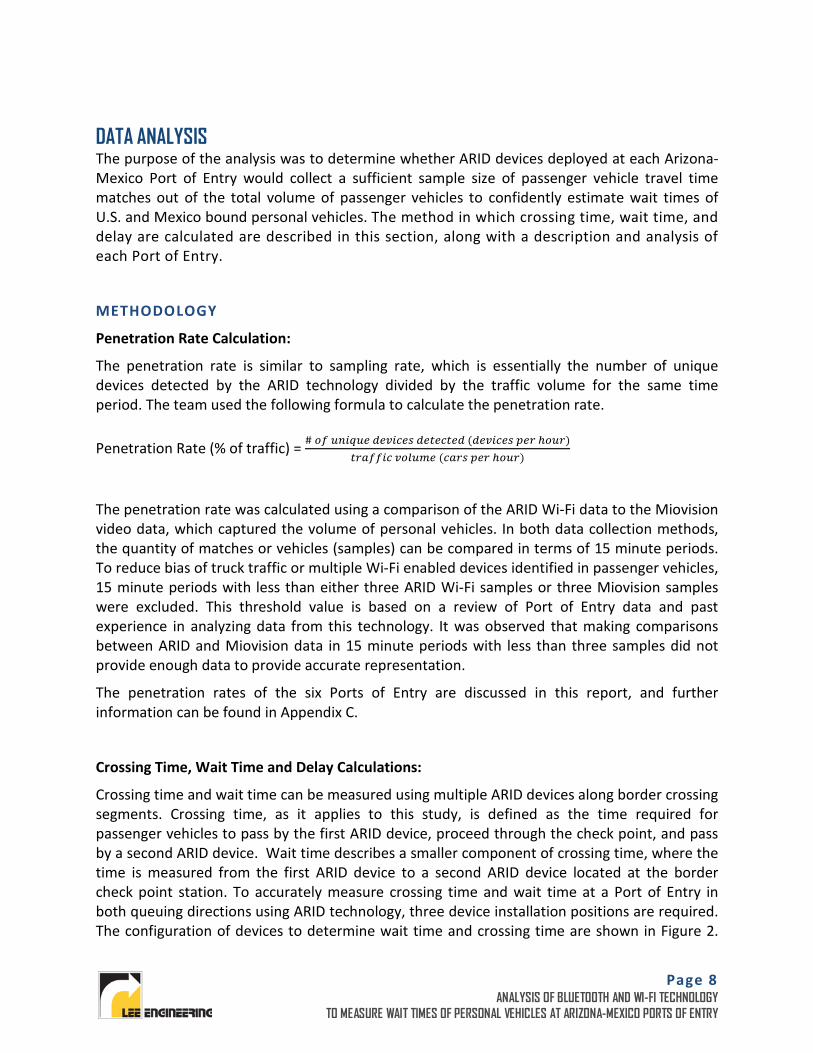
Crossing time and wait time can be measured using multiple ARID devices along border crossing segments. Crossing time, as it applies to this study, is defined as the time required for passenger vehicles to pass by the first ARID device, proceed through the check point, and pass by a second ARID device. Wait time describes a smaller component of crossing time, where the time is measured from the first ARID device to a second ARID device located at the border check point station. To accurately measure crossing time and wait time at a Port of Entry in both queuing directions using ARID technology, three device installation positions are required. The configuration of devices to determine wait time and crossing time are shown in Figure 2.
Page 9 ANALYSIS OF BLUETOOTH AND WI-FI TECHNOLOGY
TO MEASURE WAIT TIMES OF PERSONAL VEHICLES AT ARIZONA-MEXICO PORTS OF ENTRY
When ARID devices are permanently implemented at a Port of Entry, three devices should be installed to accurately measure both the crossing time and wait time in the entering and exiting U.S. directions.
Figure 2: Wait Time and Crossing Time Diagram at a Port of Entry
The wait time, delay, and vehicle delay are estimated using the following formulae:
Wait Time (seconds) = Crossing Time (seconds) - time required at free flow condition from check point to downstream ARID device (seconds)
Delay (hours) = Wait Time (hours) – time required at free flow condition (hours)
Vehicle Delay (cars-hours) = Delay (hours) X Number of vehicles (cars)
Page 10 ANALYSIS OF BLUETOOTH AND WI-FI TECHNOLOGY
TO MEASURE WAIT TIMES OF PERSONAL VEHICLES AT ARIZONA-MEXICO PORTS OF ENTRY
SAN LUIS PORT OF ENTRY
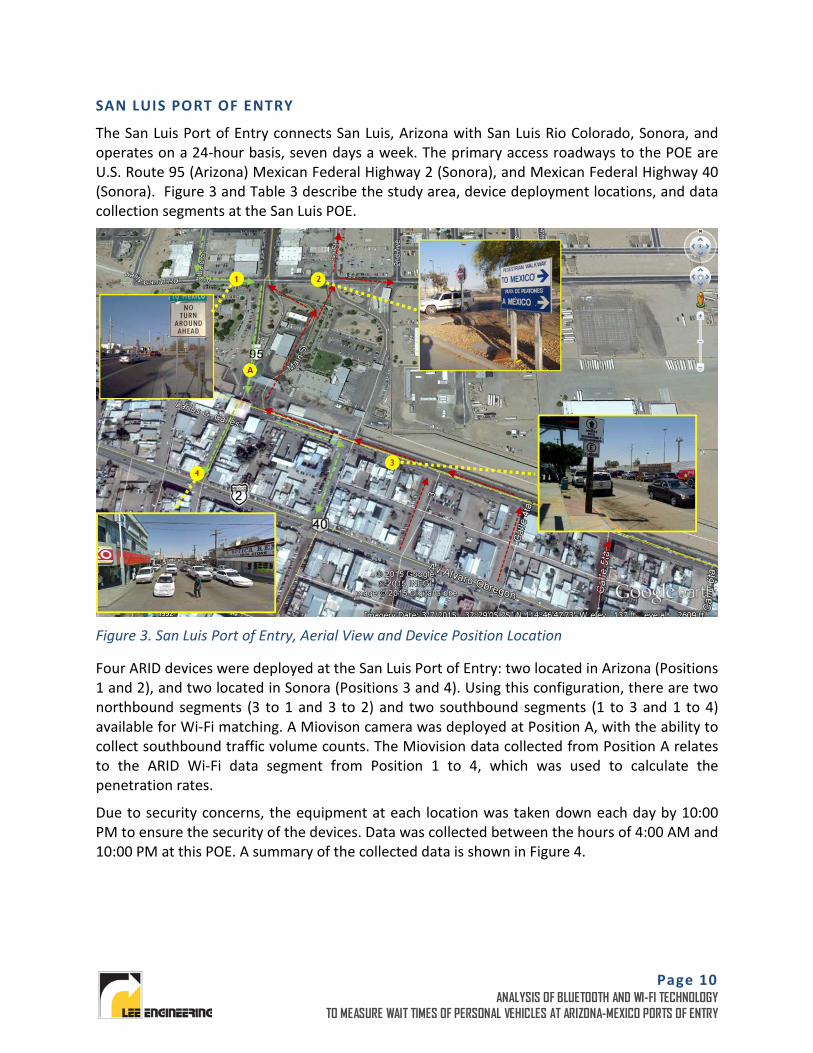
The San Luis Port of Entry connects San Luis, Arizona with San Luis Rio Colorado, Sonora, and operates on a 24-hour basis, seven days a week. The primary access roadways to the POE are U.S. Route 95 (Arizona) Mexican Federal Highway 2 (Sonora), and Mexican Federal Highway 40 (Sonora). Figure 3 and Table 3 describe the study area, device deployment locations, and data collection segments at the San Luis POE.
Figure 3. San Luis Port of Entry, Aerial View and Device Position Location
Four ARID devices were deployed at the San Luis Port of Entry: two located in Arizona (Positions 1 and 2), and two located in Sonora (Positions 3 and 4). Using this configuration, there are two northbound segments (3 to 1 and 3 to 2) and two southbound segments (1 to 3 and 1 to 4) available for Wi-Fi matching. A Miovison camera was deployed at Position A, with the ability to collect southbound traffic volume counts. The Miovision data collected from Position A relates to the ARID Wi-Fi data segment from Position 1 to 4, which was used to calculate the penetration rates.
Due to security concerns, the equipment at each location was taken down each day by 10:00 PM to ensure the security of the devices. Data was collected between the hours of 4:00 AM and 10:00 PM at this POE. A summary of the collected data is shown in Figure 4.
Page 11 ANALYSIS OF BLUETOOTH AND WI-FI TECHNOLOGY
TO MEASURE WAIT TIMES OF PERSONAL VEHICLES AT ARIZONA-MEXICO PORTS OF ENTRY
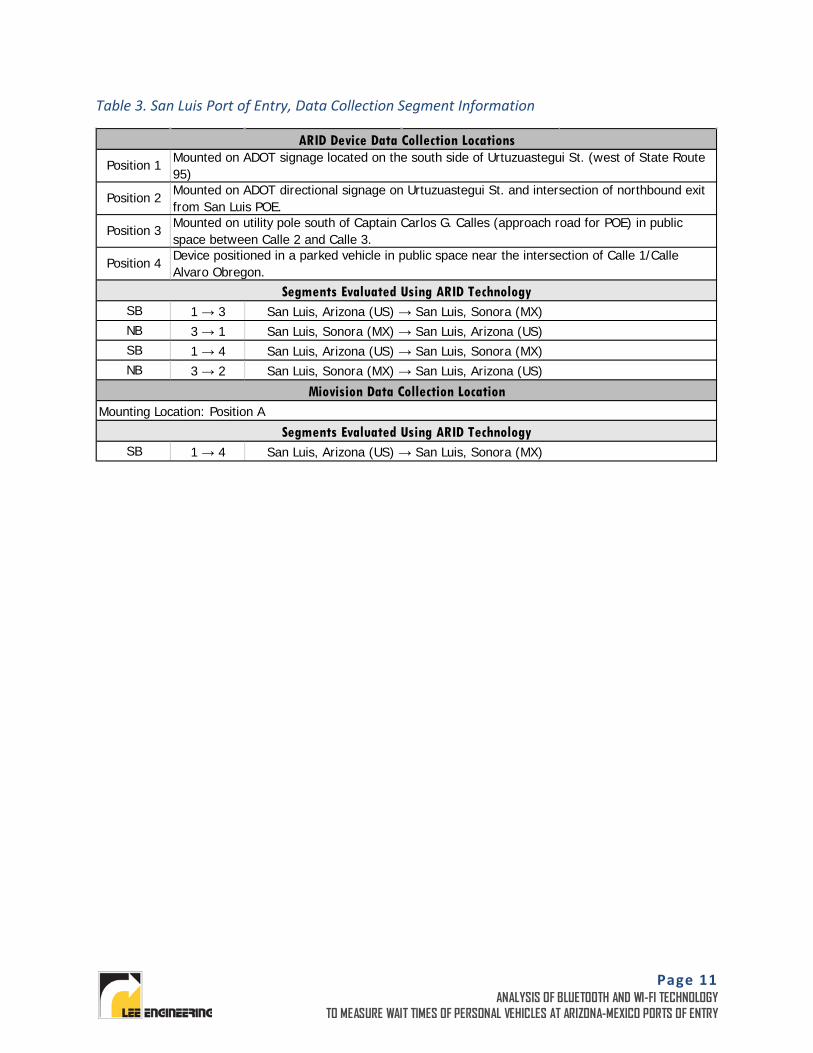
Table 3. San Luis Port of Entry, Data Collection Segment Information
SB 1 → 3NB 3 → 1SB 1 → 4NB 3 → 2
SB 1 → 4
Position 3 Mounted on utility pole south of Captain Carlos G. Calles (approach road for POE) in public space between Calle 2 and Calle 3.
ARID Device Data Collection Locations
Position 1 Mounted on ADOT signage located on the south side of Urtuzuastegui St. (west of State Route 95)
Position 2 Mounted on ADOT directional signage on Urtuzuastegui St. and intersection of northbound exit from San Luis POE.
Mounting Location: Position A
Segments Evaluated Using ARID Technology San Luis, Arizona (US) → San Luis, Sonora (MX)
Position 4 Device positioned in a parked vehicle in public space near the intersection of Calle 1/Calle Alvaro Obregon.
Segments Evaluated Using ARID Technology San Luis, Arizona (US) → San Luis, Sonora (MX) San Luis, Sonora (MX) → San Luis, Arizona (US) San Luis, Arizona (US) → San Luis, Sonora (MX) San Luis, Sonora (MX) → San Luis, Arizona (US)
Miovision Data Collection Location
Page 12 ANALYSIS OF BLUETOOTH AND WI-FI TECHNOLOGY
TO MEASURE WAIT TIMES OF PERSONAL VEHICLES AT ARIZONA-MEXICO PORTS OF ENTRY
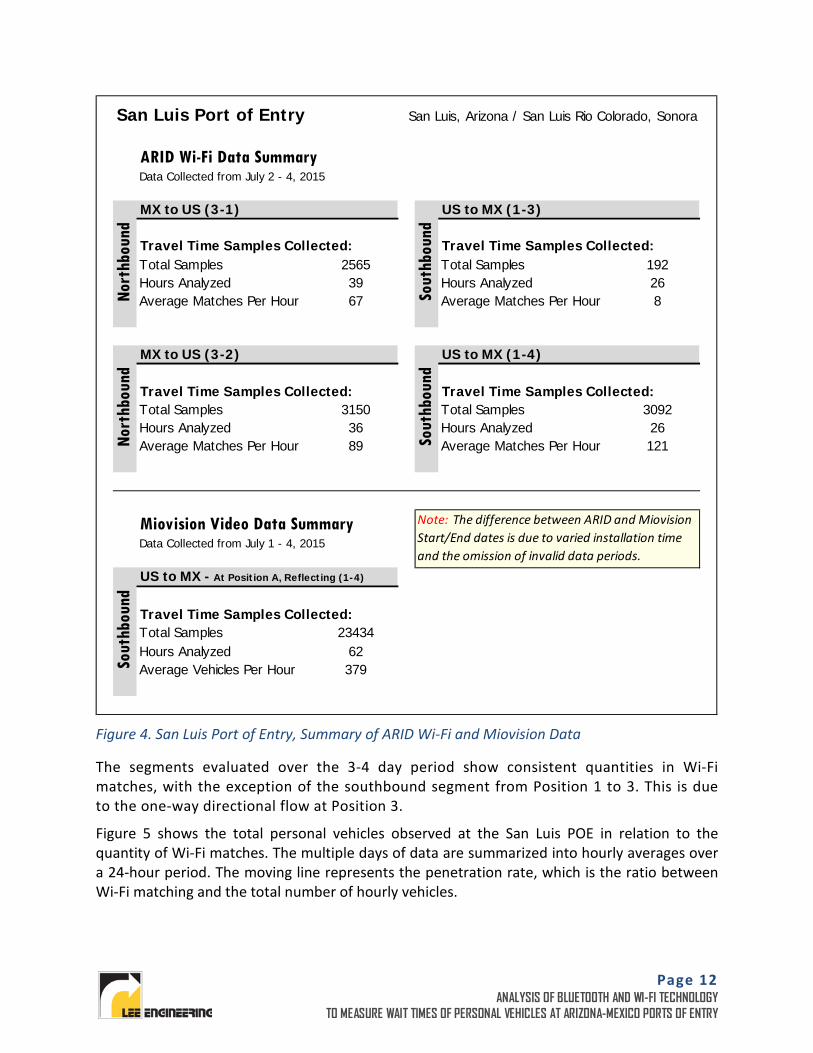
Figure 4. San Luis Port of Entry, Summary of ARID Wi-Fi and Miovision Data
The segments evaluated over the 3-4 day period show consistent quantities in Wi-Fi matches, with the exception of the southbound segment from Position 1 to 3. This is due to the one-way directional flow at Position 3.
Figure 5 shows the total personal vehicles observed at the San Luis POE in relation to the quantity of Wi-Fi matches. The multiple days of data are summarized into hourly averages over a 24-hour period. The moving line represents the penetration rate, which is the ratio between Wi-Fi matching and the total number of hourly vehicles.
San Luis Port of Entry San Luis, Arizona / San Luis Rio Colorado, Sonora
ARID Wi-Fi Data Summary Data Collected from July 2 - 4, 2015
MX to US (3-1) US to MX (1-3)
Travel Time Samples Collected: Travel Time Samples Collected:Total Samples Total SamplesHours Analyzed Hours AnalyzedAverage Matches Per Hour Average Matches Per Hour
MX to US (3-2) US to MX (1-4)
Travel Time Samples Collected: Travel Time Samples Collected:Total Samples Total SamplesHours Analyzed Hours AnalyzedAverage Matches Per Hour Average Matches Per Hour
Miovision Video Data Summary Data Collected from July 1 - 4, 2015
Travel Time Samples Collected:Total SamplesHours AnalyzedAverage Vehicles Per Hour
2667 8
Nort
hbou
nd
Sout
hbou
nd3150 309236 2689
Nort
hbou
nd
Sout
hbou
nd
2565 19239
121
Sout
hbou
nd
2343462379
US to MX - At Position A, Reflecting (1-4)
Note: The difference between ARID and Miovision Start/End dates is due to varied installation time and the omission of invalid data periods.
Page 13 ANALYSIS OF BLUETOOTH AND WI-FI TECHNOLOGY
TO MEASURE WAIT TIMES OF PERSONAL VEHICLES AT ARIZONA-MEXICO PORTS OF ENTRY
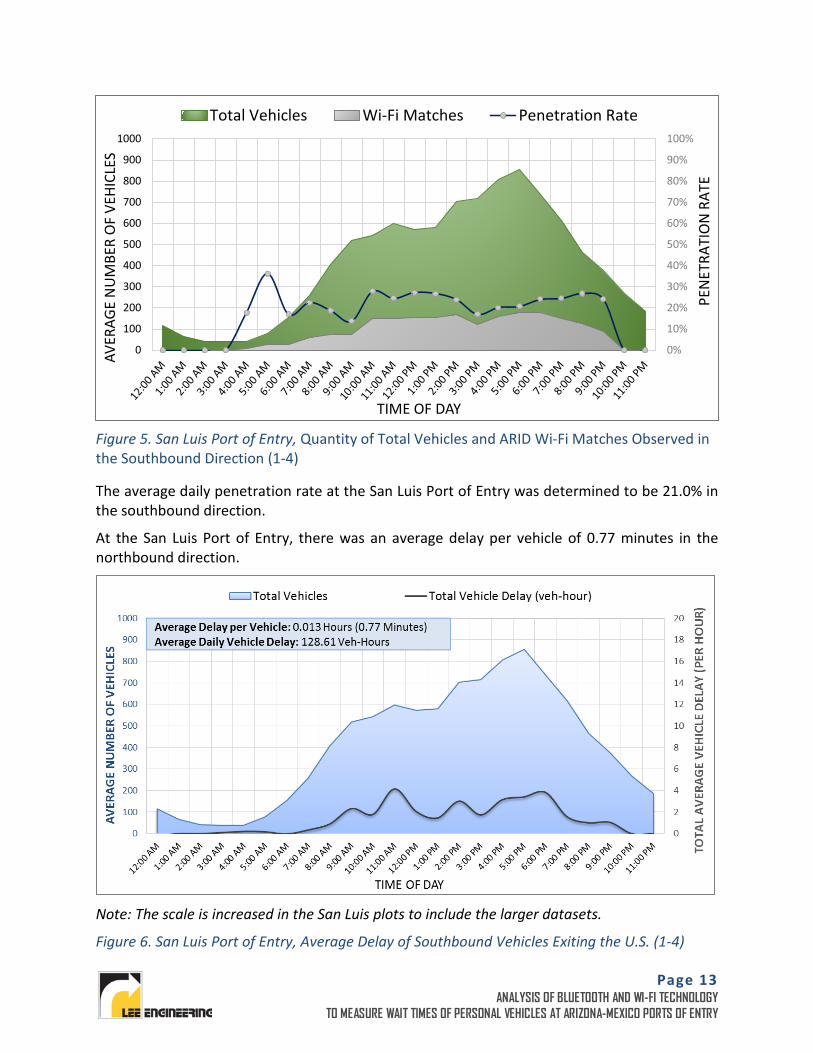
Figure 5. San Luis Port of Entry, Quantity of Total Vehicles and ARID Wi-Fi Matches Observed in the Southbound Direction (1-4)
The average daily penetration rate at the San Luis Port of Entry was determined to be 21.0% in the southbound direction.
At the San Luis Port of Entry, there was an average delay per vehicle of 0.77 minutes in the northbound direction.
Note: The scale is increased in the San Luis plots to include the larger datasets.
Figure 6. San Luis Port of Entry, Average Delay of Southbound Vehicles Exiting the U.S. (1-4)
0%
10%
20%
30%
40%
50%
60%
70%
80%
90%
100%
0
100
200
300
400
500
600
700
800
900
1000
AVER
AGE
NU
MBE
R O
F VE
HICL
ES
TIME OF DAY
Total Vehicles Wi-Fi Matches Penetration Rate
PEN
ETRA
TIO
N R
ATE
Page 14 ANALYSIS OF BLUETOOTH AND WI-FI TECHNOLOGY
TO MEASURE WAIT TIMES OF PERSONAL VEHICLES AT ARIZONA-MEXICO PORTS OF ENTRY
LUKEVILLE PORT OF ENTRY
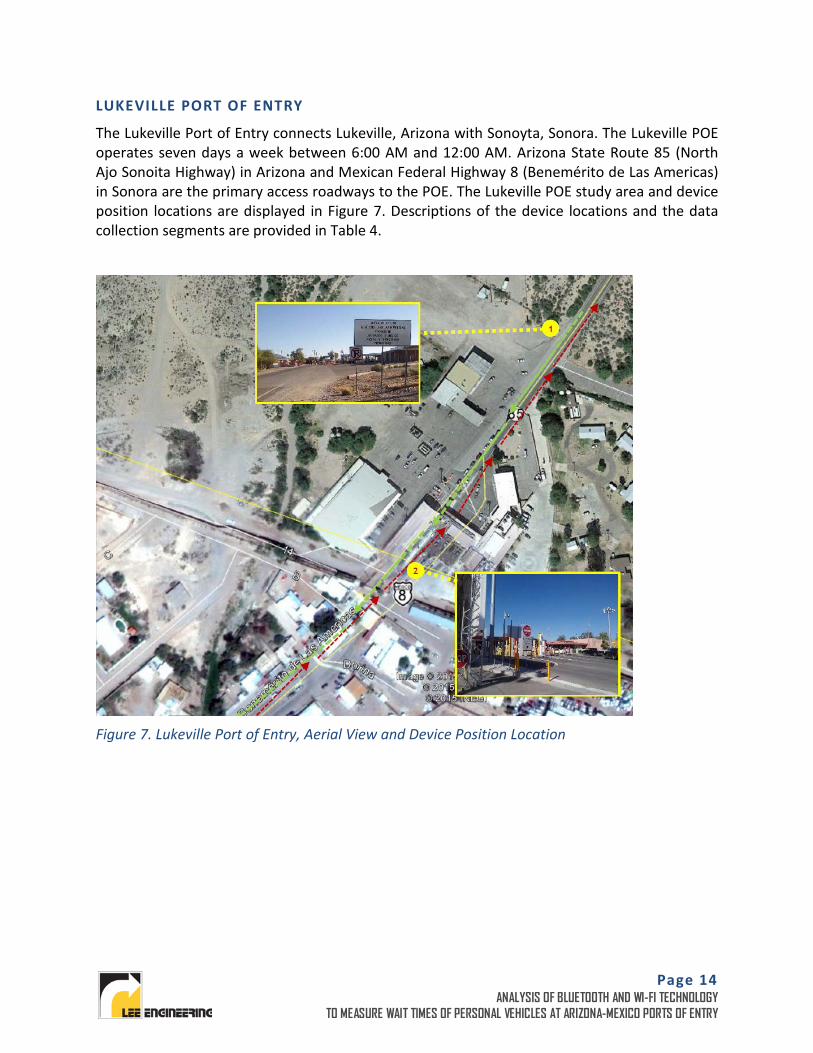
The Lukeville Port of Entry connects Lukeville, Arizona with Sonoyta, Sonora. The Lukeville POE operates seven days a week between 6:00 AM and 12:00 AM. Arizona State Route 85 (North Ajo Sonoita Highway) in Arizona and Mexican Federal Highway 8 (Benemérito de Las Americas) in Sonora are the primary access roadways to the POE. The Lukeville POE study area and device position locations are displayed in Figure 7. Descriptions of the device locations and the data collection segments are provided in Table 4.
Figure 7. Lukeville Port of Entry, Aerial View and Device Position Location
Page 15 ANALYSIS OF BLUETOOTH AND WI-FI TECHNOLOGY
TO MEASURE WAIT TIMES OF PERSONAL VEHICLES AT ARIZONA-MEXICO PORTS OF ENTRY
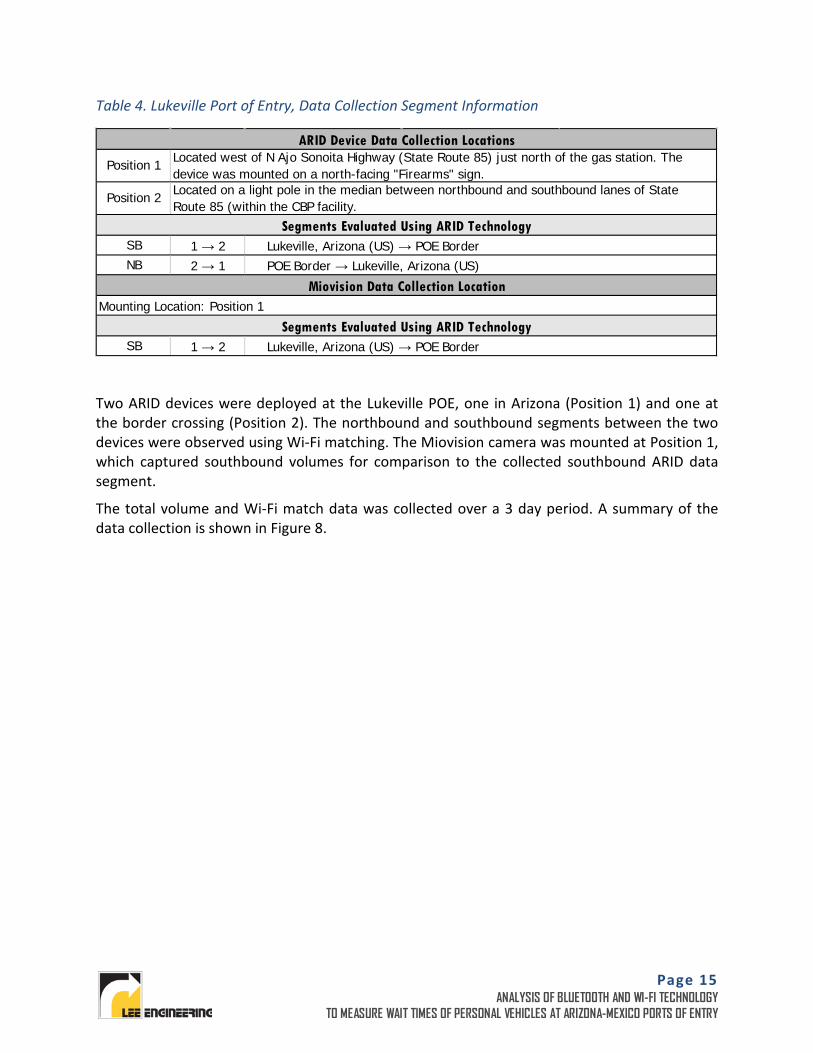
Table 4. Lukeville Port of Entry, Data Collection Segment Information
Two ARID devices were deployed at the Lukeville POE, one in Arizona (Position 1) and one at the border crossing (Position 2). The northbound and southbound segments between the two devices were observed using Wi-Fi matching. The Miovision camera was mounted at Position 1, which captured southbound volumes for comparison to the collected southbound ARID data segment.
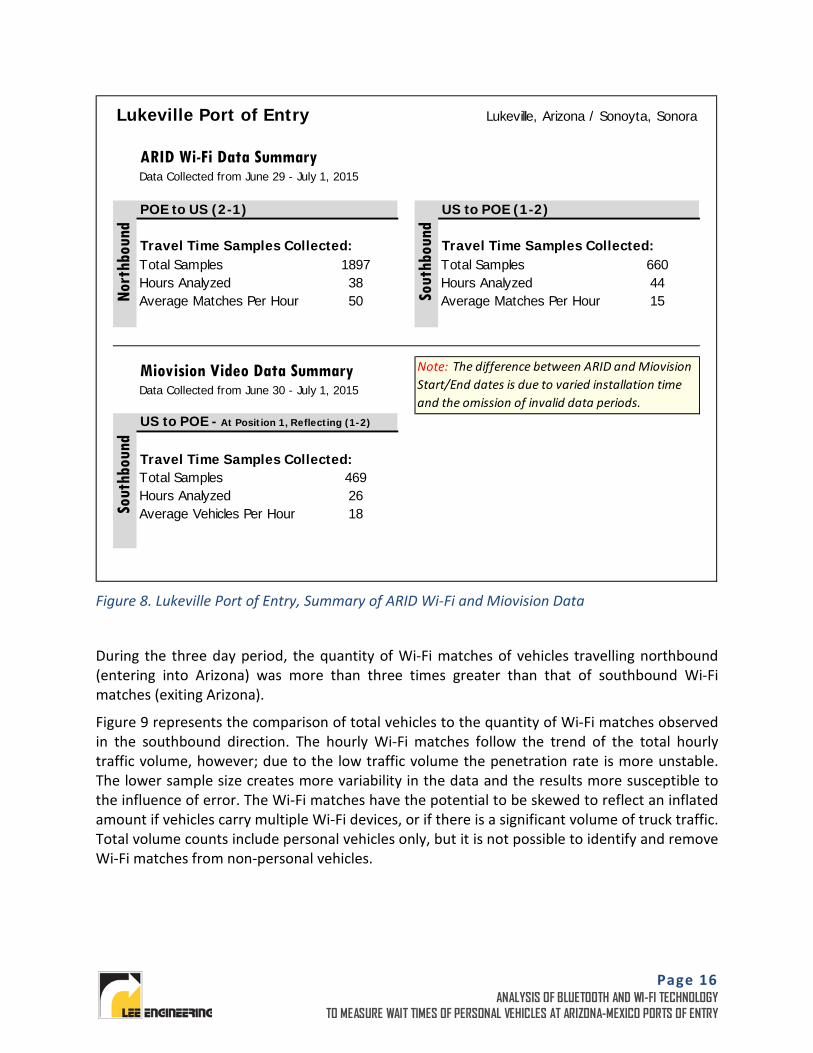
The total volume and Wi-Fi match data was collected over a 3 day period. A summary of the data collection is shown in Figure 8.
SB 1 → 2NB 2 → 1
SB 1 → 2
ARID Device Data Collection Locations
Position 1 Located west of N Ajo Sonoita Highway (State Route 85) just north of the gas station. The device was mounted on a north-facing "Firearms" sign.
Position 2 Located on a light pole in the median between northbound and southbound lanes of State Route 85 (within the CBP facility.
Mounting Location: Position 1
Segments Evaluated Using ARID Technology Lukeville, Arizona (US) → POE Border
Segments Evaluated Using ARID Technology Lukeville, Arizona (US) → POE Border POE Border → Lukeville, Arizona (US)
Miovision Data Collection Location
Page 16 ANALYSIS OF BLUETOOTH AND WI-FI TECHNOLOGY
TO MEASURE WAIT TIMES OF PERSONAL VEHICLES AT ARIZONA-MEXICO PORTS OF ENTRY
Figure 8. Lukeville Port of Entry, Summary of ARID Wi-Fi and Miovision Data
During the three day period, the quantity of Wi-Fi matches of vehicles travelling northbound (entering into Arizona) was more than three times greater than that of southbound Wi-Fi matches (exiting Arizona).
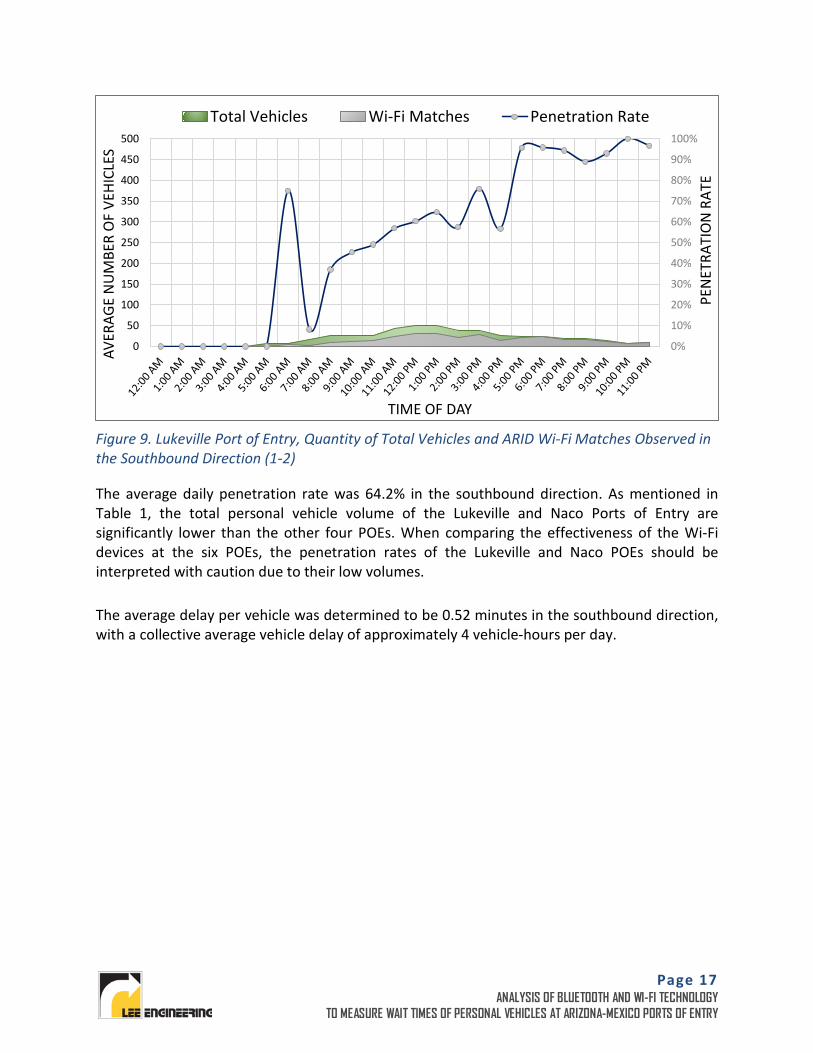
Figure 9 represents the comparison of total vehicles to the quantity of Wi-Fi matches observed in the southbound direction. The hourly Wi-Fi matches follow the trend of the total hourly traffic volume, however; due to the low traffic volume the penetration rate is more unstable. The lower sample size creates more variability in the data and the results more susceptible to the influence of error. The Wi-Fi matches have the potential to be skewed to reflect an inflated amount if vehicles carry multiple Wi-Fi devices, or if there is a significant volume of truck traffic. Total volume counts include personal vehicles only, but it is not possible to identify and remove Wi-Fi matches from non-personal vehicles.
Lukeville Port of Entry Lukeville, Arizona / Sonoyta, Sonora
ARID Wi-Fi Data Summary Data Collected from June 29 - July 1, 2015
POE to US (2-1) US to POE (1-2)
Travel Time Samples Collected: Travel Time Samples Collected:Total Samples Total SamplesHours Analyzed Hours AnalyzedAverage Matches Per Hour Average Matches Per Hour
Miovision Video Data Summary Data Collected from June 30 - July 1, 2015
Travel Time Samples Collected:Total SamplesHours AnalyzedAverage Vehicles Per Hour
4450 15No
rthb
ound
Sout
hbou
nd
1897 66038
Sout
hbou
nd
4692618
US to POE - At Position 1, Reflecting (1-2)
Note: The difference between ARID and Miovision Start/End dates is due to varied installation time and the omission of invalid data periods.
Page 17 ANALYSIS OF BLUETOOTH AND WI-FI TECHNOLOGY
TO MEASURE WAIT TIMES OF PERSONAL VEHICLES AT ARIZONA-MEXICO PORTS OF ENTRY
Figure 9. Lukeville Port of Entry, Quantity of Total Vehicles and ARID Wi-Fi Matches Observed in the Southbound Direction (1-2)
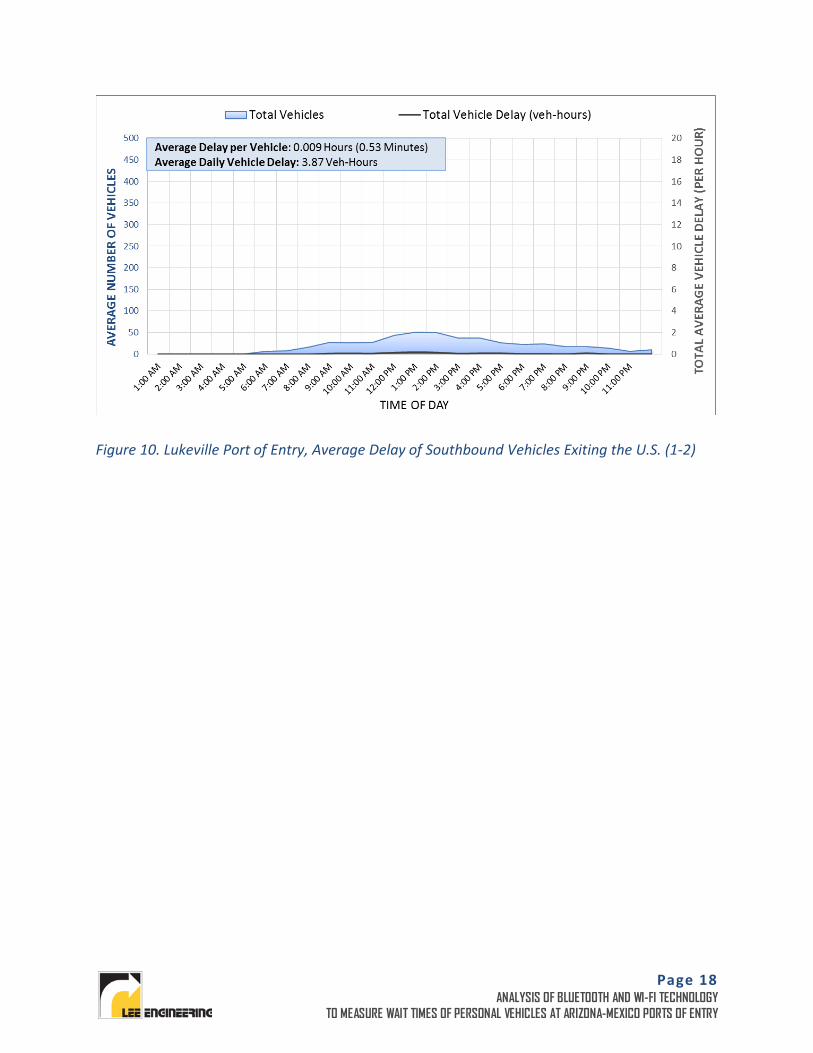
The average daily penetration rate was 64.2% in the southbound direction. As mentioned in Table 1, the total personal vehicle volume of the Lukeville and Naco Ports of Entry are significantly lower than the other four POEs. When comparing the effectiveness of the Wi-Fi devices at the six POEs, the penetration rates of the Lukeville and Naco POEs should be interpreted with caution due to their low volumes.
The average delay per vehicle was determined to be 0.52 minutes in the southbound direction, with a collective average vehicle delay of approximately 4 vehicle-hours per day.
0%
10%
20%
30%
40%
50%
60%
70%
80%
90%
100%
0
50
100
150
200
250
300
350
400
450
500
AVER
AGE
NU
MBE
R O
F VE
HICL
ES
TIME OF DAY
Total Vehicles Wi-Fi Matches Penetration Rate
PEN
ETRA
TIO
N R
ATE
Page 18 ANALYSIS OF BLUETOOTH AND WI-FI TECHNOLOGY
TO MEASURE WAIT TIMES OF PERSONAL VEHICLES AT ARIZONA-MEXICO PORTS OF ENTRY
Figure 10. Lukeville Port of Entry, Average Delay of Southbound Vehicles Exiting the U.S. (1-2)
Page 19 ANALYSIS OF BLUETOOTH AND WI-FI TECHNOLOGY
TO MEASURE WAIT TIMES OF PERSONAL VEHICLES AT ARIZONA-MEXICO PORTS OF ENTRY
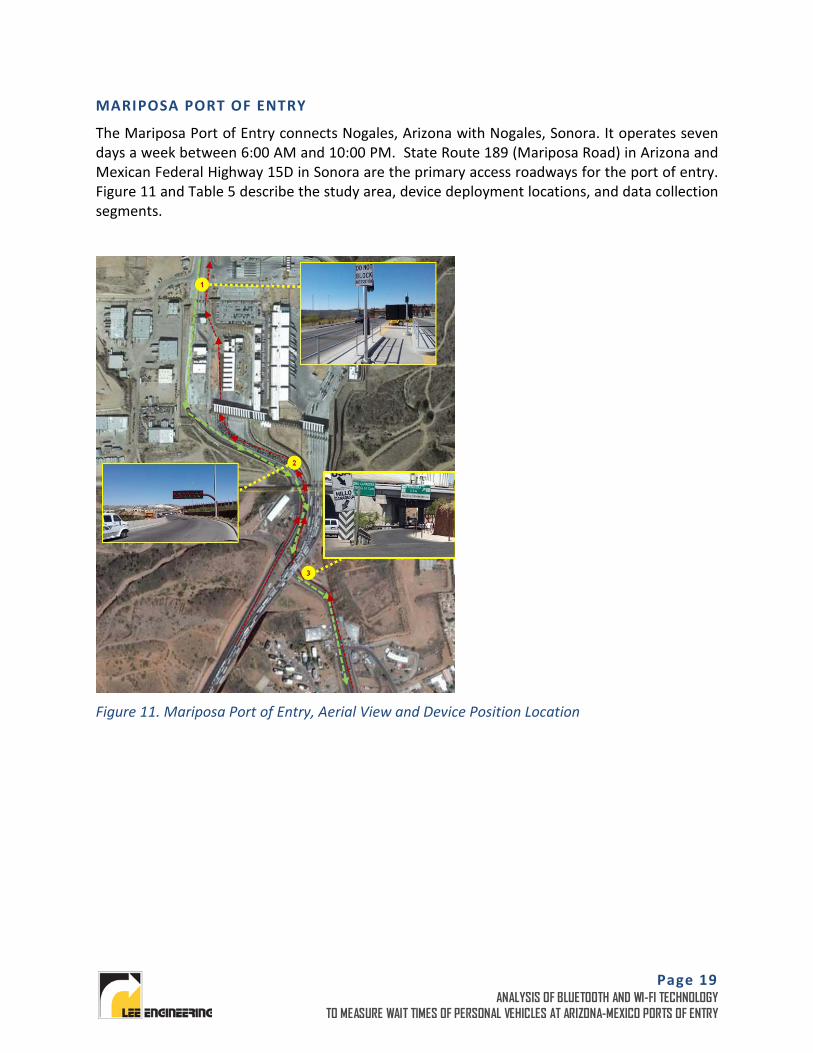
MARIPOSA PORT OF ENTRY
The Mariposa Port of Entry connects Nogales, Arizona with Nogales, Sonora. It operates seven days a week between 6:00 AM and 10:00 PM. State Route 189 (Mariposa Road) in Arizona and Mexican Federal Highway 15D in Sonora are the primary access roadways for the port of entry. Figure 11 and Table 5 describe the study area, device deployment locations, and data collection segments.
Figure 11. Mariposa Port of Entry, Aerial View and Device Position Location
Page 20 ANALYSIS OF BLUETOOTH AND WI-FI TECHNOLOGY
TO MEASURE WAIT TIMES OF PERSONAL VEHICLES AT ARIZONA-MEXICO PORTS OF ENTRY
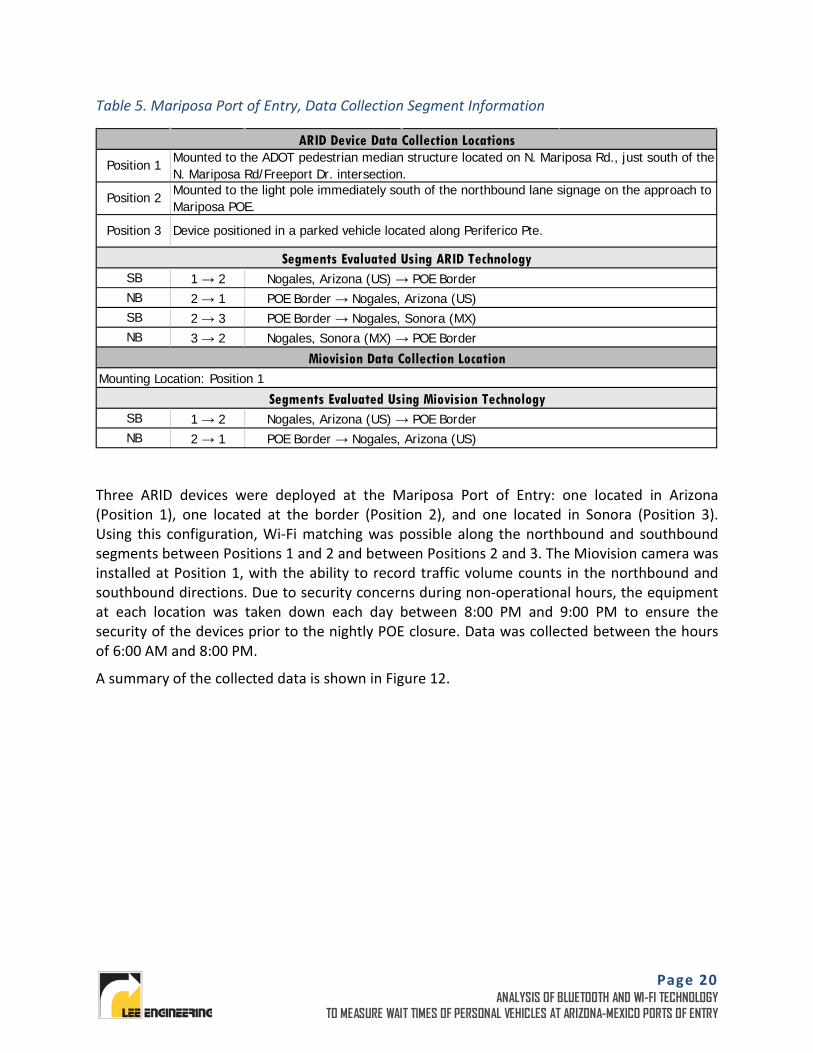
Table 5. Mariposa Port of Entry, Data Collection Segment Information
Three ARID devices were deployed at the Mariposa Port of Entry: one located in Arizona (Position 1), one located at the border (Position 2), and one located in Sonora (Position 3). Using this configuration, Wi-Fi matching was possible along the northbound and southbound segments between Positions 1 and 2 and between Positions 2 and 3. The Miovision camera was installed at Position 1, with the ability to record traffic volume counts in the northbound and southbound directions. Due to security concerns during non-operational hours, the equipment at each location was taken down each day between 8:00 PM and 9:00 PM to ensure the security of the devices prior to the nightly POE closure. Data was collected between the hours of 6:00 AM and 8:00 PM.
A summary of the collected data is shown in Figure 12.
SB 1 → 2NB 2 → 1SB 2 → 3NB 3 → 2
SB 1 → 2NB 2 → 1
Mounting Location: Position 1
Segments Evaluated Using Miovision Technology Nogales, Arizona (US) → POE Border POE Border → Nogales, Arizona (US)
Segments Evaluated Using ARID Technology Nogales, Arizona (US) → POE Border POE Border → Nogales, Arizona (US) POE Border → Nogales, Sonora (MX) Nogales, Sonora (MX) → POE Border
Miovision Data Collection Location
Position 3 Device positioned in a parked vehicle located along Periferico Pte.
ARID Device Data Collection Locations
Position 1 Mounted to the ADOT pedestrian median structure located on N. Mariposa Rd., just south of the N. Mariposa Rd/Freeport Dr. intersection.
Position 2 Mounted to the light pole immediately south of the northbound lane signage on the approach to Mariposa POE.
Page 21 ANALYSIS OF BLUETOOTH AND WI-FI TECHNOLOGY
TO MEASURE WAIT TIMES OF PERSONAL VEHICLES AT ARIZONA-MEXICO PORTS OF ENTRY
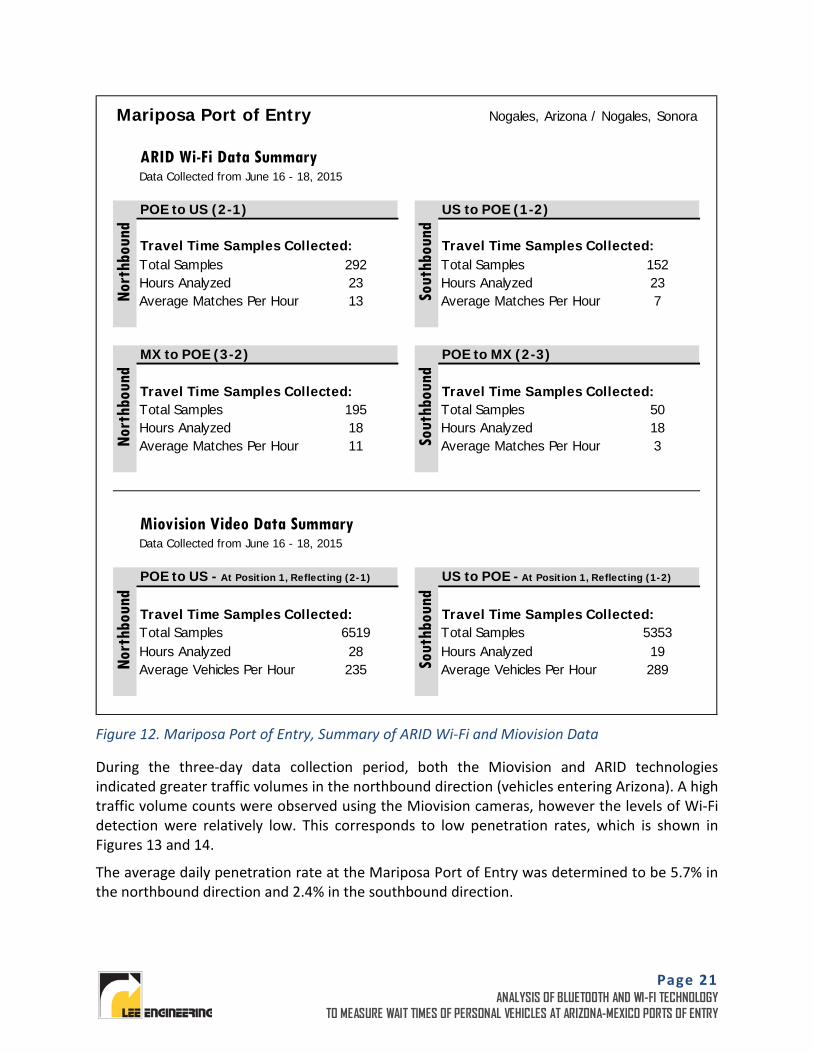
Figure 12. Mariposa Port of Entry, Summary of ARID Wi-Fi and Miovision Data
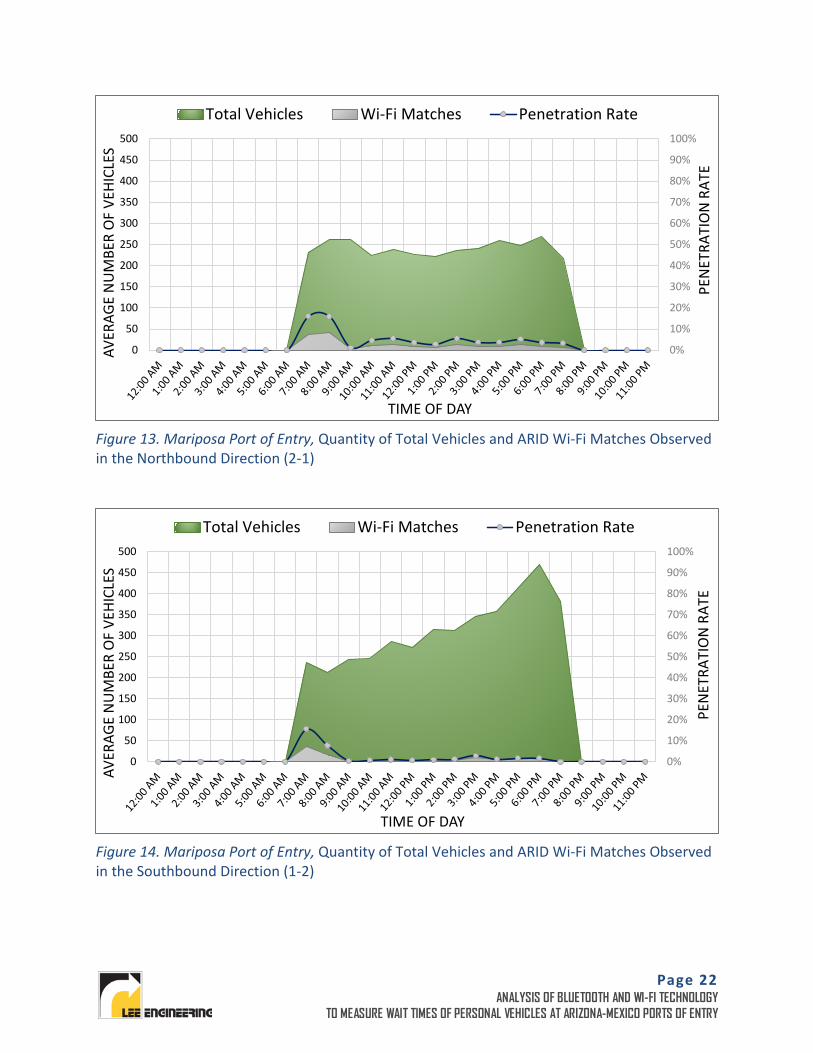
During the three-day data collection period, both the Miovision and ARID technologies indicated greater traffic volumes in the northbound direction (vehicles entering Arizona). A high traffic volume counts were observed using the Miovision cameras, however the levels of Wi-Fi detection were relatively low. This corresponds to low penetration rates, which is shown in Figures 13 and 14.
The average daily penetration rate at the Mariposa Port of Entry was determined to be 5.7% in the northbound direction and 2.4% in the southbound direction.
Mariposa Port of Entry Nogales, Arizona / Nogales, Sonora
ARID Wi-Fi Data Summary Data Collected from June 16 - 18, 2015
POE to US (2-1) US to POE (1-2)
Travel Time Samples Collected: Travel Time Samples Collected:Total Samples Total SamplesHours Analyzed Hours AnalyzedAverage Matches Per Hour Average Matches Per Hour
MX to POE (3-2) POE to MX (2-3)
Travel Time Samples Collected: Travel Time Samples Collected:Total Samples Total SamplesHours Analyzed Hours AnalyzedAverage Matches Per Hour Average Matches Per Hour
Miovision Video Data Summary Data Collected from June 16 - 18, 2015
Travel Time Samples Collected: Travel Time Samples Collected:Total Samples Total SamplesHours Analyzed Hours AnalyzedAverage Vehicles Per Hour Average Vehicles Per HourNo
rthb
ound
Sout
hbou
nd
6519 535328 19235 289
US to POE - At Position 1, Reflecting (1-2)POE to US - At Position 1, Reflecting (2-1)
2313 7
Nort
hbou
nd
Sout
hbou
nd195 5018 1811
Nort
hbou
nd
Sout
hbou
nd
292 15223
3
Page 22 ANALYSIS OF BLUETOOTH AND WI-FI TECHNOLOGY
TO MEASURE WAIT TIMES OF PERSONAL VEHICLES AT ARIZONA-MEXICO PORTS OF ENTRY
Figure 13. Mariposa Port of Entry, Quantity of Total Vehicles and ARID Wi-Fi Matches Observed in the Northbound Direction (2-1)
Figure 14. Mariposa Port of Entry, Quantity of Total Vehicles and ARID Wi-Fi Matches Observed in the Southbound Direction (1-2)
0%
10%
20%
30%
40%
50%
60%
70%
80%
90%
100%
0
50
100
150
200
250
300
350
400
450
500
AVER
AGE
NU
MBE
R O
F VE
HICL
ES
TIME OF DAY
Total Vehicles Wi-Fi Matches Penetration Rate
PEN
ETRA
TIO
N R
ATE
0%
10%
20%
30%
40%
50%
60%
70%
80%
90%
100%
0
50
100
150
200
250
300
350
400
450
500
AVER
AGE
NU
MBE
R O
F VE
HICL
ES
TIME OF DAY
Total Vehicles Wi-Fi Matches Penetration Rate
PEN
ETRA
TIO
N R
ATE
Page 23 ANALYSIS OF BLUETOOTH AND WI-FI TECHNOLOGY
TO MEASURE WAIT TIMES OF PERSONAL VEHICLES AT ARIZONA-MEXICO PORTS OF ENTRY
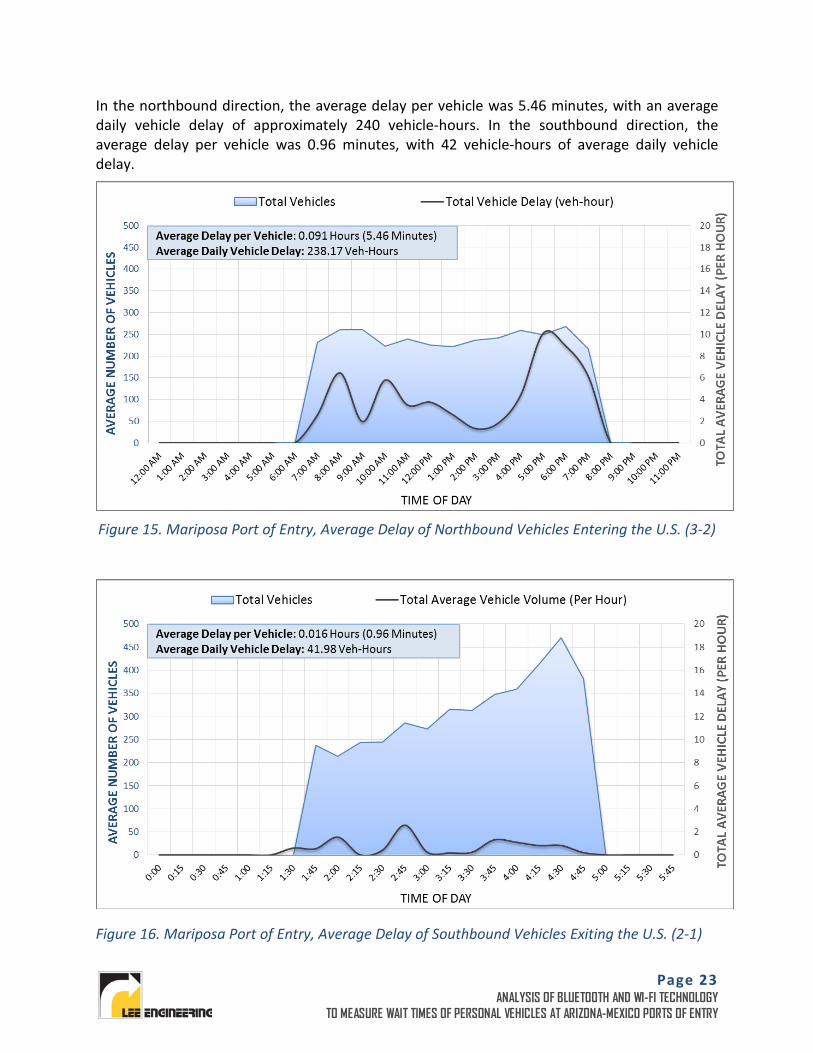
In the northbound direction, the average delay per vehicle was 5.46 minutes, with an average daily vehicle delay of approximately 240 vehicle-hours. In the southbound direction, the average delay per vehicle was 0.96 minutes, with 42 vehicle-hours of average daily vehicle delay.
Figure 15. Mariposa Port of Entry, Average Delay of Northbound Vehicles Entering the U.S. (3-2)
Figure 16. Mariposa Port of Entry, Average Delay of Southbound Vehicles Exiting the U.S. (2-1)
Page 24 ANALYSIS OF BLUETOOTH AND WI-FI TECHNOLOGY
TO MEASURE WAIT TIMES OF PERSONAL VEHICLES AT ARIZONA-MEXICO PORTS OF ENTRY
DECONCINI PORT OF ENTRY
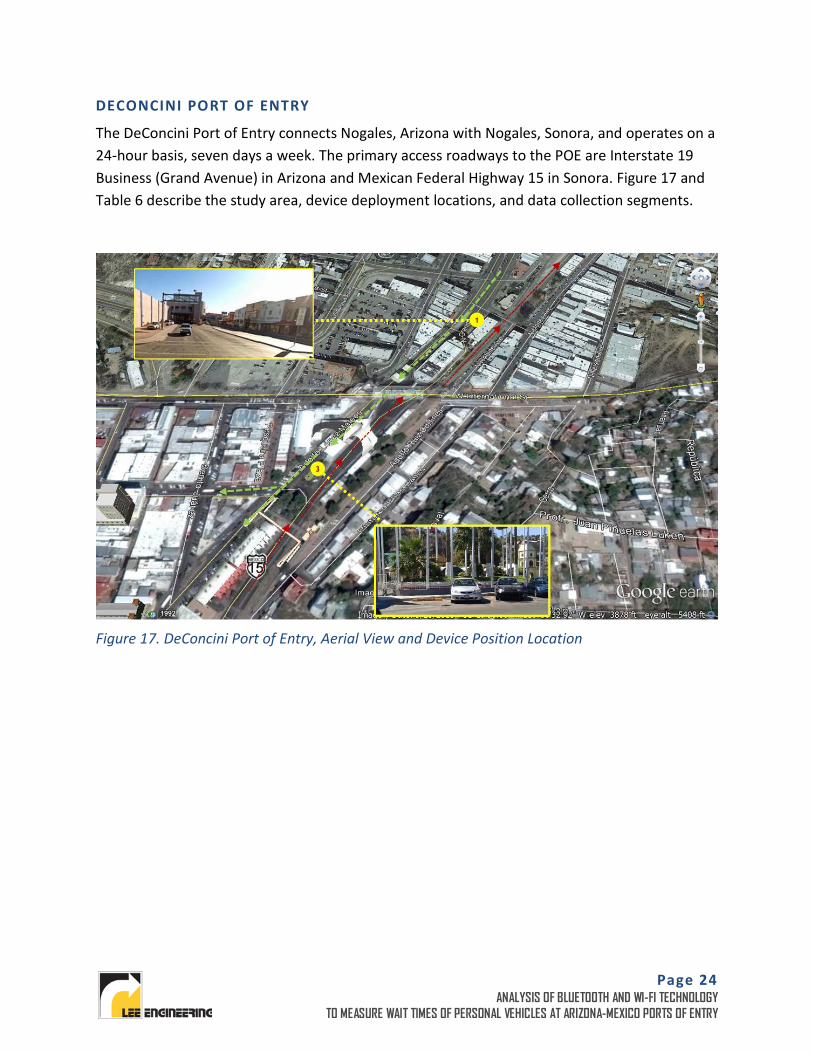
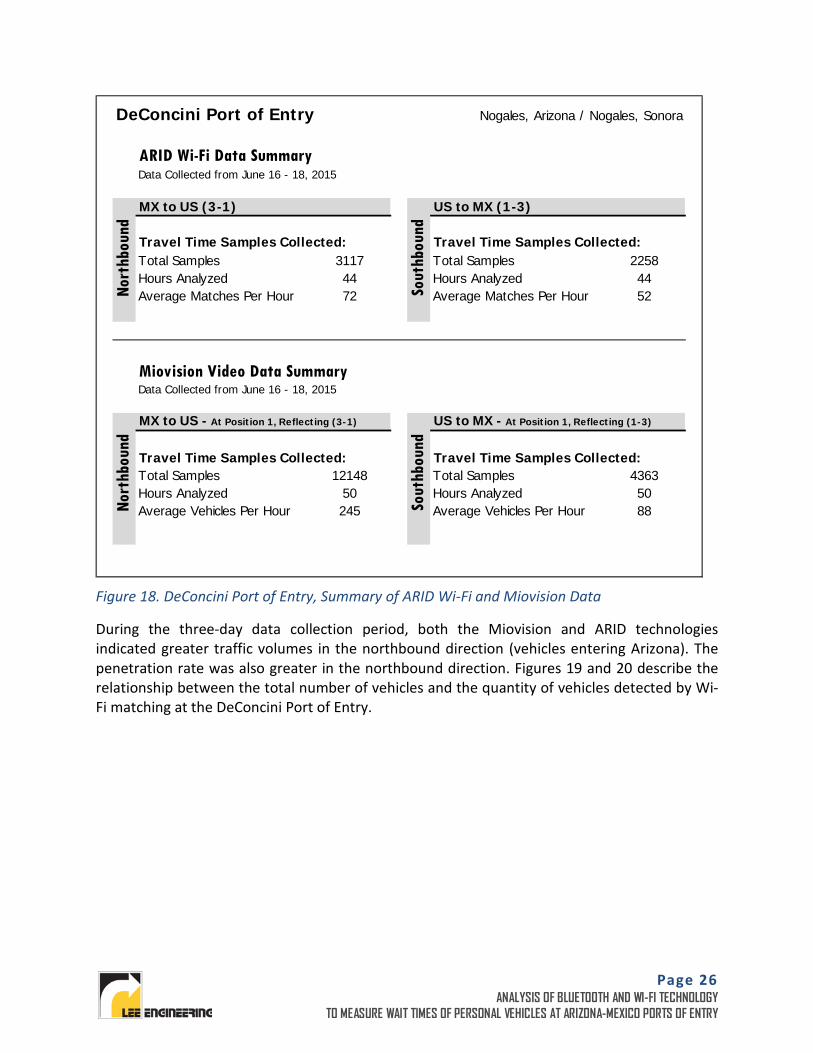
The DeConcini Port of Entry connects Nogales, Arizona with Nogales, Sonora, and operates on a 24-hour basis, seven days a week. The primary access roadways to the POE are Interstate 19 Business (Grand Avenue) in Arizona and Mexican Federal Highway 15 in Sonora. Figure 17 and Table 6 describe the study area, device deployment locations, and data collection segments.
Figure 17. DeConcini Port of Entry, Aerial View and Device Position Location
Page 25 ANALYSIS OF BLUETOOTH AND WI-FI TECHNOLOGY
TO MEASURE WAIT TIMES OF PERSONAL VEHICLES AT ARIZONA-MEXICO PORTS OF ENTRY
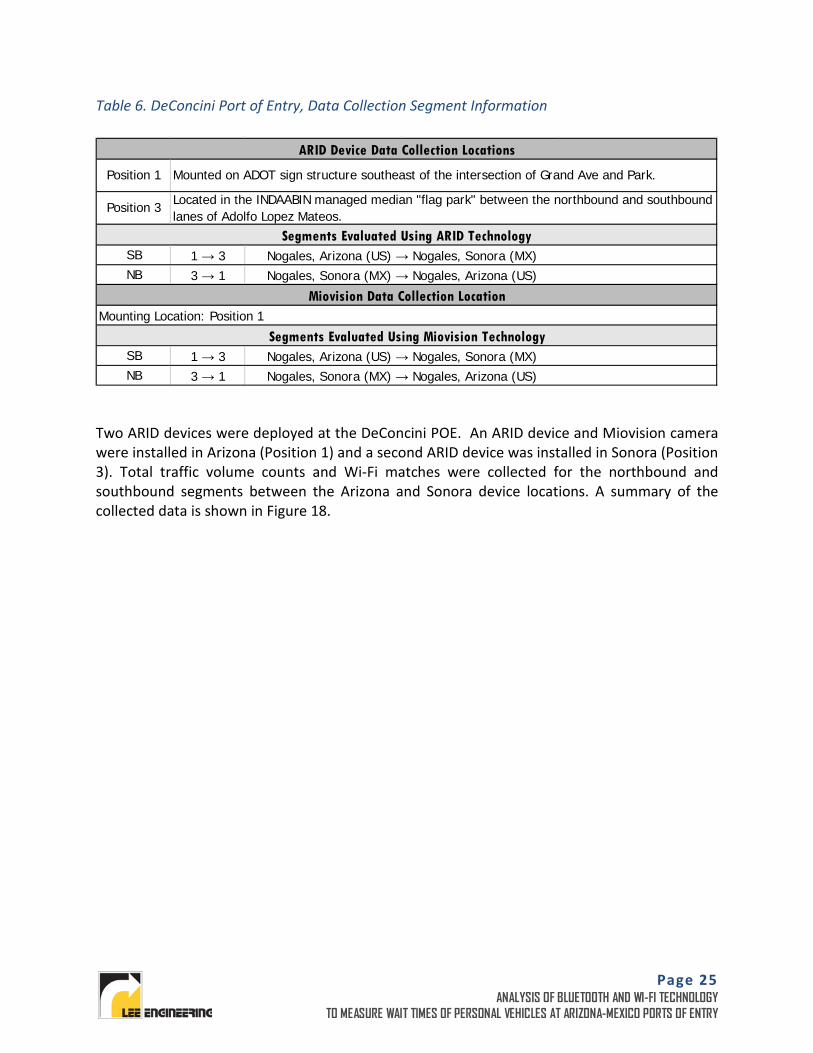
Table 6. DeConcini Port of Entry, Data Collection Segment Information
Two ARID devices were deployed at the DeConcini POE. An ARID device and Miovision camera were installed in Arizona (Position 1) and a second ARID device was installed in Sonora (Position 3). Total traffic volume counts and Wi-Fi matches were collected for the northbound and southbound segments between the Arizona and Sonora device locations. A summary of the collected data is shown in Figure 18.
SB 1 → 3NB 3 → 1
SB 1 → 3NB 3 → 1
Mounting Location: Position 1
Segments Evaluated Using Miovision Technology Nogales, Arizona (US) → Nogales, Sonora (MX) Nogales, Sonora (MX) → Nogales, Arizona (US)
Segments Evaluated Using ARID Technology Nogales, Arizona (US) → Nogales, Sonora (MX) Nogales, Sonora (MX) → Nogales, Arizona (US)
Miovision Data Collection Location
ARID Device Data Collection Locations
Position 1 Mounted on ADOT sign structure southeast of the intersection of Grand Ave and Park.
Position 3 Located in the INDAABIN managed median "flag park" between the northbound and southbound lanes of Adolfo Lopez Mateos.
Page 26 ANALYSIS OF BLUETOOTH AND WI-FI TECHNOLOGY
TO MEASURE WAIT TIMES OF PERSONAL VEHICLES AT ARIZONA-MEXICO PORTS OF ENTRY
Figure 18. DeConcini Port of Entry, Summary of ARID Wi-Fi and Miovision Data
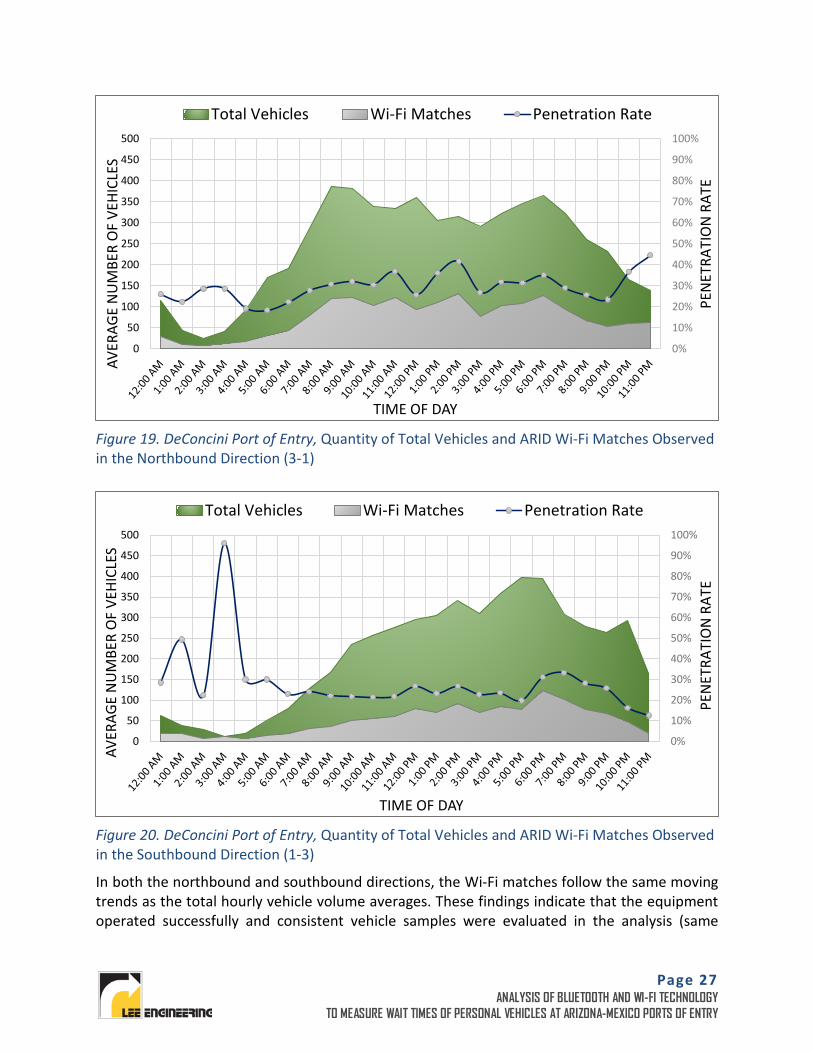
During the three-day data collection period, both the Miovision and ARID technologies indicated greater traffic volumes in the northbound direction (vehicles entering Arizona). The penetration rate was also greater in the northbound direction. Figures 19 and 20 describe the relationship between the total number of vehicles and the quantity of vehicles detected by Wi-Fi matching at the DeConcini Port of Entry.
DeConcini Port of Entry Nogales, Arizona / Nogales, Sonora
ARID Wi-Fi Data Summary Data Collected from June 16 - 18, 2015
MX to US (3-1) US to MX (1-3)
Travel Time Samples Collected: Travel Time Samples Collected:Total Samples Total SamplesHours Analyzed Hours AnalyzedAverage Matches Per Hour Average Matches Per Hour
Miovision Video Data Summary Data Collected from June 16 - 18, 2015
Travel Time Samples Collected: Travel Time Samples Collected:Total Samples Total SamplesHours Analyzed Hours AnalyzedAverage Vehicles Per Hour Average Vehicles Per HourNo
rthb
ound
Sout
hbou
nd
12148 436350 50245 88
MX to US - At Position 1, Reflecting (3-1) US to MX - At Position 1, Reflecting (1-3)
4472 52No
rthb
ound
Sout
hbou
nd
3117 225844
Page 27 ANALYSIS OF BLUETOOTH AND WI-FI TECHNOLOGY
TO MEASURE WAIT TIMES OF PERSONAL VEHICLES AT ARIZONA-MEXICO PORTS OF ENTRY
Figure 19. DeConcini Port of Entry, Quantity of Total Vehicles and ARID Wi-Fi Matches Observed in the Northbound Direction (3-1)
Figure 20. DeConcini Port of Entry, Quantity of Total Vehicles and ARID Wi-Fi Matches Observed in the Southbound Direction (1-3)
In both the northbound and southbound directions, the Wi-Fi matches follow the same moving trends as the total hourly vehicle volume averages. These findings indicate that the equipment operated successfully and consistent vehicle samples were evaluated in the analysis (same
0%
10%
20%
30%
40%
50%
60%
70%
80%
90%
100%
0
50
100
150
200
250
300
350
400
450
500
AVER
AGE
NU
MBE
R O
F VE
HICL
ES
TIME OF DAY
Total Vehicles Wi-Fi Matches Penetration Rate
PEN
ETRA
TIO
N R
ATE
0%
10%
20%
30%
40%
50%
60%
70%
80%
90%
100%
0
50
100
150
200
250
300
350
400
450
500
AVER
AGE
NU
MBE
R O
F VE
HICL
ES
TIME OF DAY
Total Vehicles Wi-Fi Matches Penetration Rate
PEN
ETRA
TIO
N R
ATE
Page 28 ANALYSIS OF BLUETOOTH AND WI-FI TECHNOLOGY
TO MEASURE WAIT TIMES OF PERSONAL VEHICLES AT ARIZONA-MEXICO PORTS OF ENTRY
location, days, time periods, etc.) The average daily penetration rate was determined to be 30.6% in the northbound direction and 24.5% in the southbound direction.
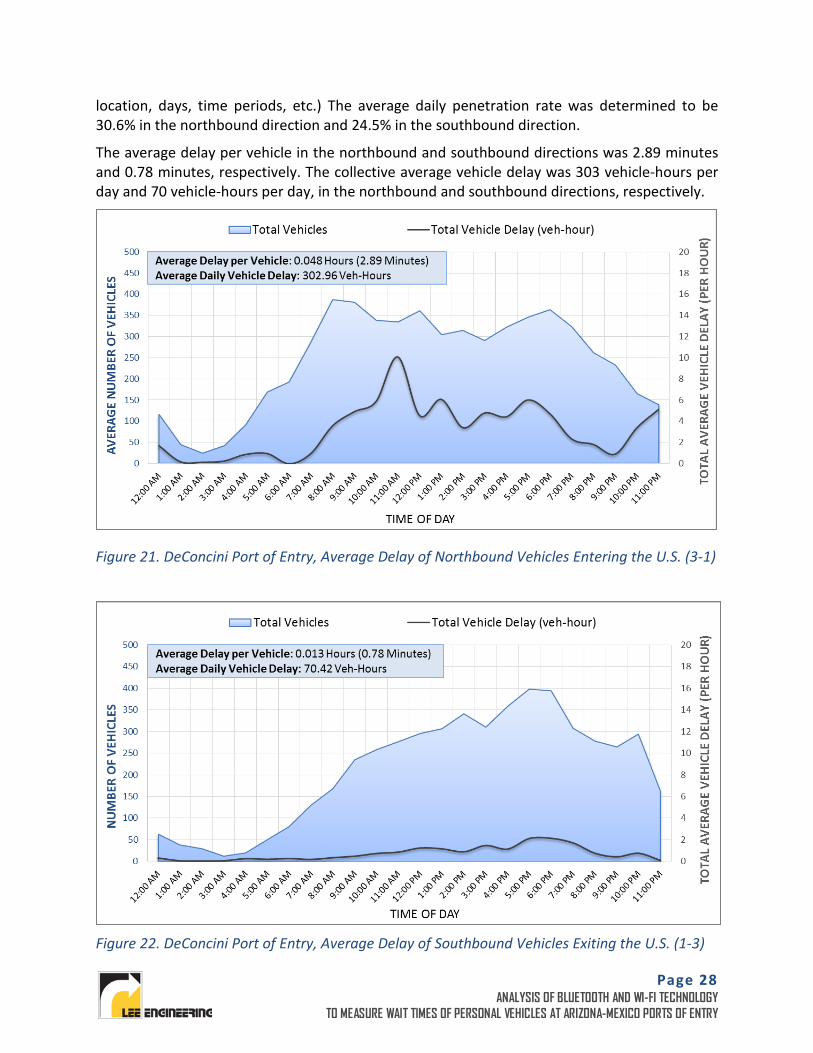
The average delay per vehicle in the northbound and southbound directions was 2.89 minutes and 0.78 minutes, respectively. The collective average vehicle delay was 303 vehicle-hours per day and 70 vehicle-hours per day, in the northbound and southbound directions, respectively.
Figure 21. DeConcini Port of Entry, Average Delay of Northbound Vehicles Entering the U.S. (3-1)
Figure 22. DeConcini Port of Entry, Average Delay of Southbound Vehicles Exiting the U.S. (1-3)
Page 29 ANALYSIS OF BLUETOOTH AND WI-FI TECHNOLOGY
TO MEASURE WAIT TIMES OF PERSONAL VEHICLES AT ARIZONA-MEXICO PORTS OF ENTRY
NACO PORT OF ENTRY
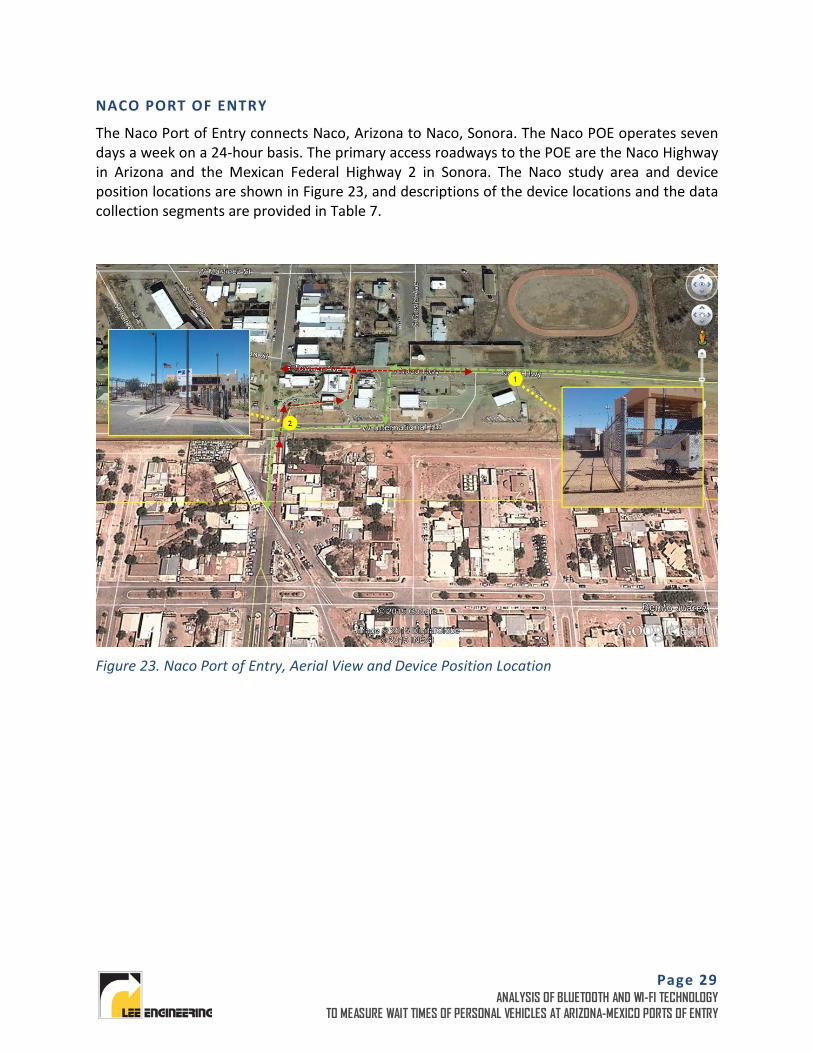
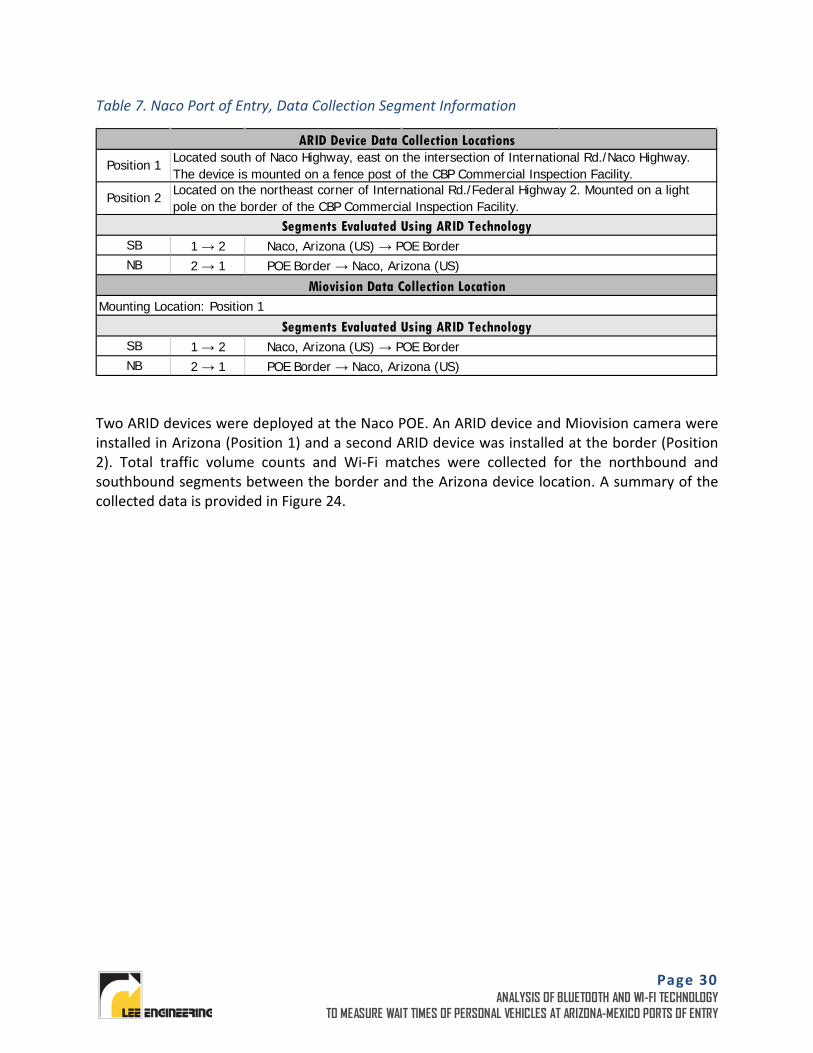
The Naco Port of Entry connects Naco, Arizona to Naco, Sonora. The Naco POE operates seven days a week on a 24-hour basis. The primary access roadways to the POE are the Naco Highway in Arizona and the Mexican Federal Highway 2 in Sonora. The Naco study area and device position locations are shown in Figure 23, and descriptions of the device locations and the data collection segments are provided in Table 7.
Figure 23. Naco Port of Entry, Aerial View and Device Position Location
Page 30 ANALYSIS OF BLUETOOTH AND WI-FI TECHNOLOGY
TO MEASURE WAIT TIMES OF PERSONAL VEHICLES AT ARIZONA-MEXICO PORTS OF ENTRY
Table 7. Naco Port of Entry, Data Collection Segment Information
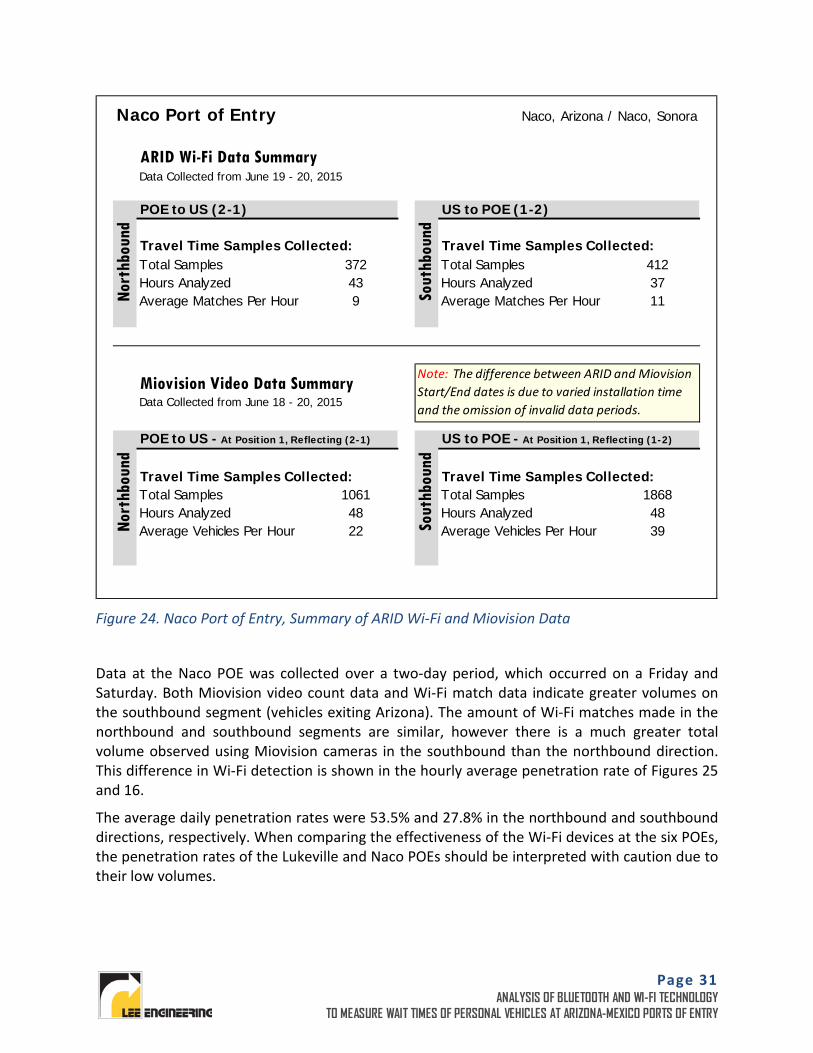
Two ARID devices were deployed at the Naco POE. An ARID device and Miovision camera were installed in Arizona (Position 1) and a second ARID device was installed at the border (Position 2). Total traffic volume counts and Wi-Fi matches were collected for the northbound and southbound segments between the border and the Arizona device location. A summary of the collected data is provided in Figure 24.
SB 1 → 2NB 2 → 1
SB 1 → 2NB 2 → 1
ARID Device Data Collection Locations
Position 1 Located south of Naco Highway, east on the intersection of International Rd./Naco Highway. The device is mounted on a fence post of the CBP Commercial Inspection Facility.
Position 2 Located on the northeast corner of International Rd./Federal Highway 2. Mounted on a light pole on the border of the CBP Commercial Inspection Facility.
Mounting Location: Position 1
Segments Evaluated Using ARID Technology Naco, Arizona (US) → POE Border POE Border → Naco, Arizona (US)
Segments Evaluated Using ARID Technology Naco, Arizona (US) → POE Border POE Border → Naco, Arizona (US)
Miovision Data Collection Location
Page 31 ANALYSIS OF BLUETOOTH AND WI-FI TECHNOLOGY
TO MEASURE WAIT TIMES OF PERSONAL VEHICLES AT ARIZONA-MEXICO PORTS OF ENTRY
Figure 24. Naco Port of Entry, Summary of ARID Wi-Fi and Miovision Data
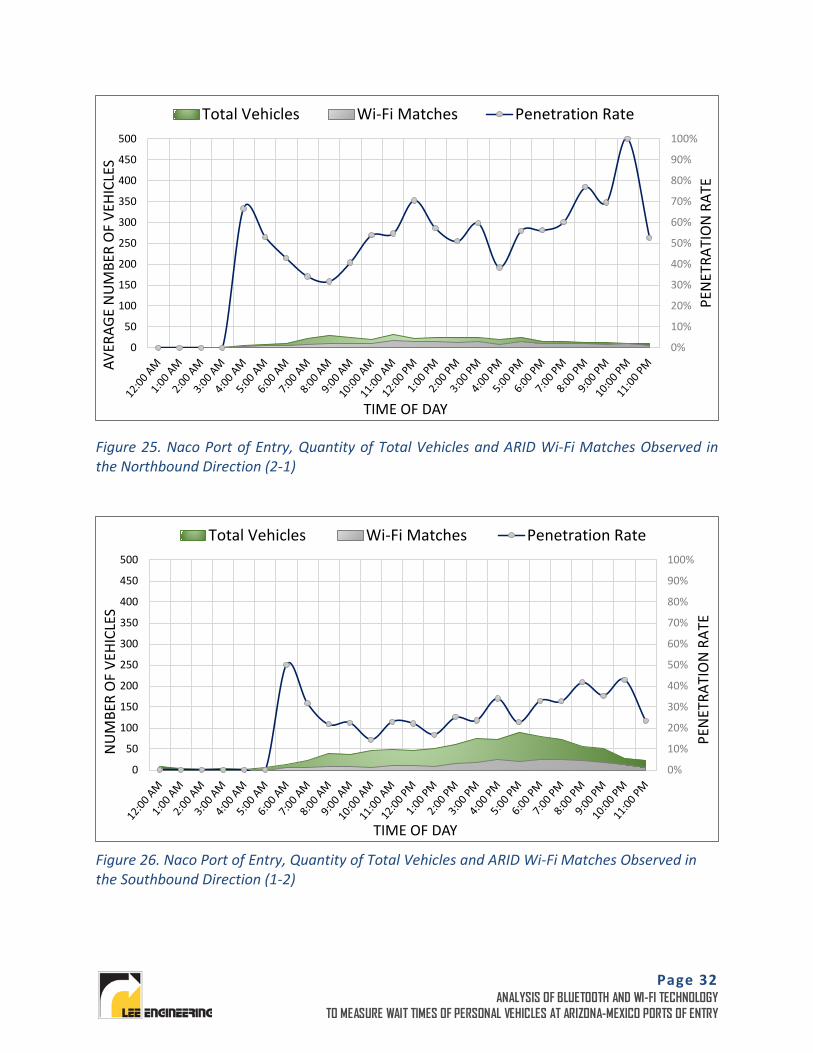
Data at the Naco POE was collected over a two-day period, which occurred on a Friday and Saturday. Both Miovision video count data and Wi-Fi match data indicate greater volumes on the southbound segment (vehicles exiting Arizona). The amount of Wi-Fi matches made in the northbound and southbound segments are similar, however there is a much greater total volume observed using Miovision cameras in the southbound than the northbound direction. This difference in Wi-Fi detection is shown in the hourly average penetration rate of Figures 25 and 16.
The average daily penetration rates were 53.5% and 27.8% in the northbound and southbound directions, respectively. When comparing the effectiveness of the Wi-Fi devices at the six POEs, the penetration rates of the Lukeville and Naco POEs should be interpreted with caution due to their low volumes.
Naco Port of Entry Naco, Arizona / Naco, Sonora
ARID Wi-Fi Data Summary Data Collected from June 19 - 20, 2015
POE to US (2-1) US to POE (1-2)
Travel Time Samples Collected: Travel Time Samples Collected:Total Samples Total SamplesHours Analyzed Hours AnalyzedAverage Matches Per Hour Average Matches Per Hour
Miovision Video Data Summary Data Collected from June 18 - 20, 2015
Travel Time Samples Collected: Travel Time Samples Collected:Total Samples Total SamplesHours Analyzed Hours AnalyzedAverage Vehicles Per Hour Average Vehicles Per Hour
379 11No
rthb
ound
Sout
hbou
nd
372 41243
Nort
hbou
nd
Sout
hbou
nd
1061 186848 4822 39
POE to US - At Position 1, Reflecting (2-1) US to POE - At Position 1, Reflecting (1-2)
Note: The difference between ARID and Miovision Start/End dates is due to varied installation time and the omission of invalid data periods.
Page 32 ANALYSIS OF BLUETOOTH AND WI-FI TECHNOLOGY
TO MEASURE WAIT TIMES OF PERSONAL VEHICLES AT ARIZONA-MEXICO PORTS OF ENTRY
Figure 25. Naco Port of Entry, Quantity of Total Vehicles and ARID Wi-Fi Matches Observed in the Northbound Direction (2-1)
Figure 26. Naco Port of Entry, Quantity of Total Vehicles and ARID Wi-Fi Matches Observed in the Southbound Direction (1-2)
0%
10%
20%
30%
40%
50%
60%
70%
80%
90%
100%
0
50
100
150
200
250
300
350
400
450
500
AVER
AGE
NU
MBE
R O
F VE
HICL
ES
TIME OF DAY
Total Vehicles Wi-Fi Matches Penetration Rate
PEN
ETRA
TIO
N R
ATE
0%
10%
20%
30%
40%
50%
60%
70%
80%
90%
100%
0
50
100
150
200
250
300
350
400
450
500
NU
MBE
R O
F VE
HICL
ES
TIME OF DAY
Total Vehicles Wi-Fi Matches Penetration Rate
PEN
ETRA
TIO
N R
ATE
Page 33 ANALYSIS OF BLUETOOTH AND WI-FI TECHNOLOGY
TO MEASURE WAIT TIMES OF PERSONAL VEHICLES AT ARIZONA-MEXICO PORTS OF ENTRY
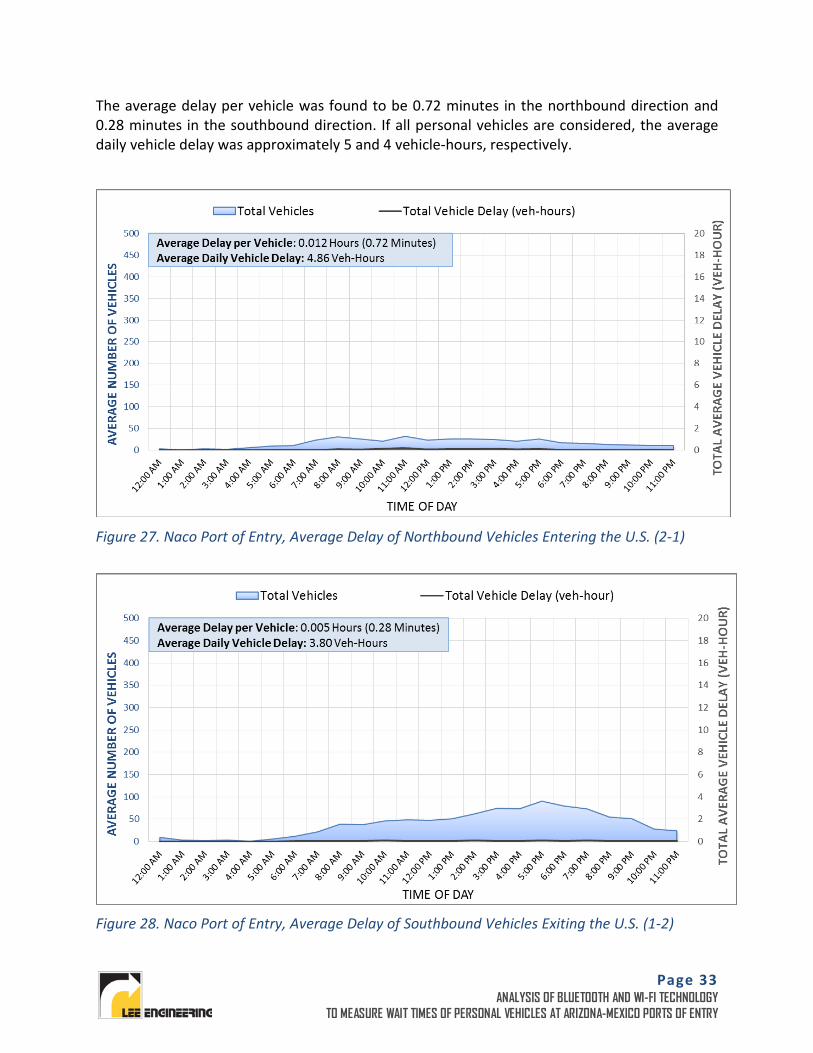
The average delay per vehicle was found to be 0.72 minutes in the northbound direction and 0.28 minutes in the southbound direction. If all personal vehicles are considered, the average daily vehicle delay was approximately 5 and 4 vehicle-hours, respectively.
Figure 27. Naco Port of Entry, Average Delay of Northbound Vehicles Entering the U.S. (2-1)
Figure 28. Naco Port of Entry, Average Delay of Southbound Vehicles Exiting the U.S. (1-2)
Page 34 ANALYSIS OF BLUETOOTH AND WI-FI TECHNOLOGY
TO MEASURE WAIT TIMES OF PERSONAL VEHICLES AT ARIZONA-MEXICO PORTS OF ENTRY
RAUL HECTOR CASTRO / DOUGLAS PORT OF ENTRY
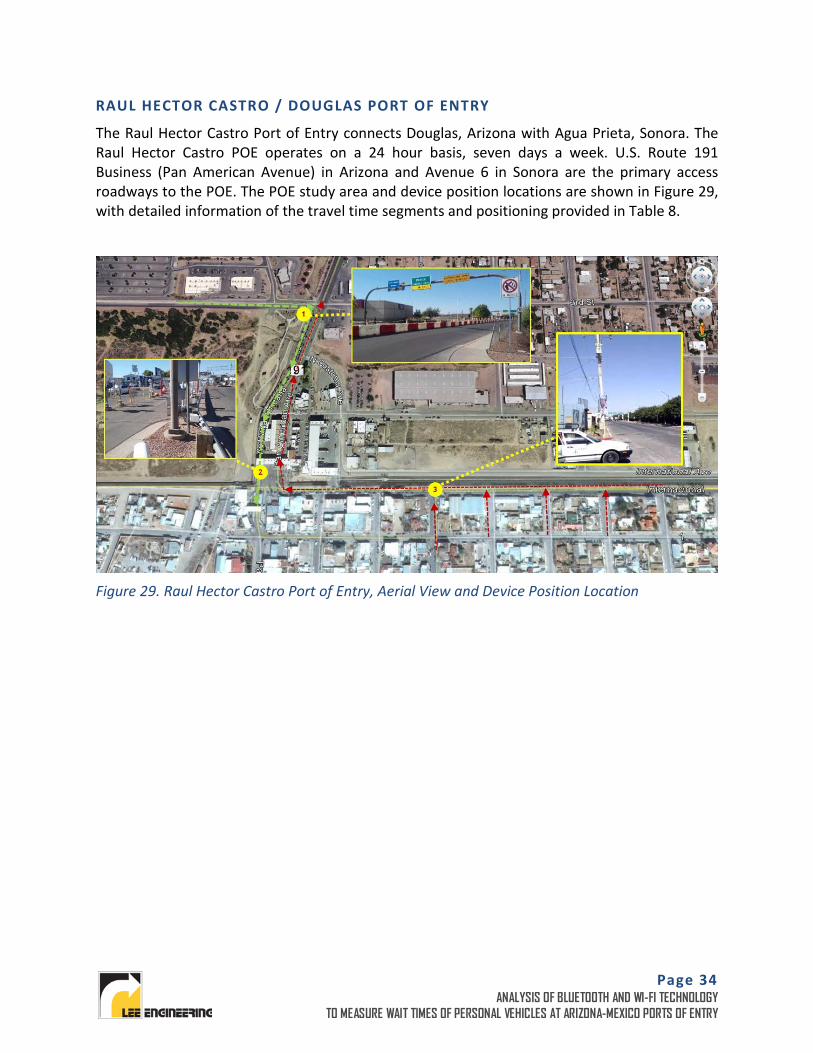
The Raul Hector Castro Port of Entry connects Douglas, Arizona with Agua Prieta, Sonora. The Raul Hector Castro POE operates on a 24 hour basis, seven days a week. U.S. Route 191 Business (Pan American Avenue) in Arizona and Avenue 6 in Sonora are the primary access roadways to the POE. The POE study area and device position locations are shown in Figure 29, with detailed information of the travel time segments and positioning provided in Table 8.
Figure 29. Raul Hector Castro Port of Entry, Aerial View and Device Position Location
Page 35 ANALYSIS OF BLUETOOTH AND WI-FI TECHNOLOGY
TO MEASURE WAIT TIMES OF PERSONAL VEHICLES AT ARIZONA-MEXICO PORTS OF ENTRY
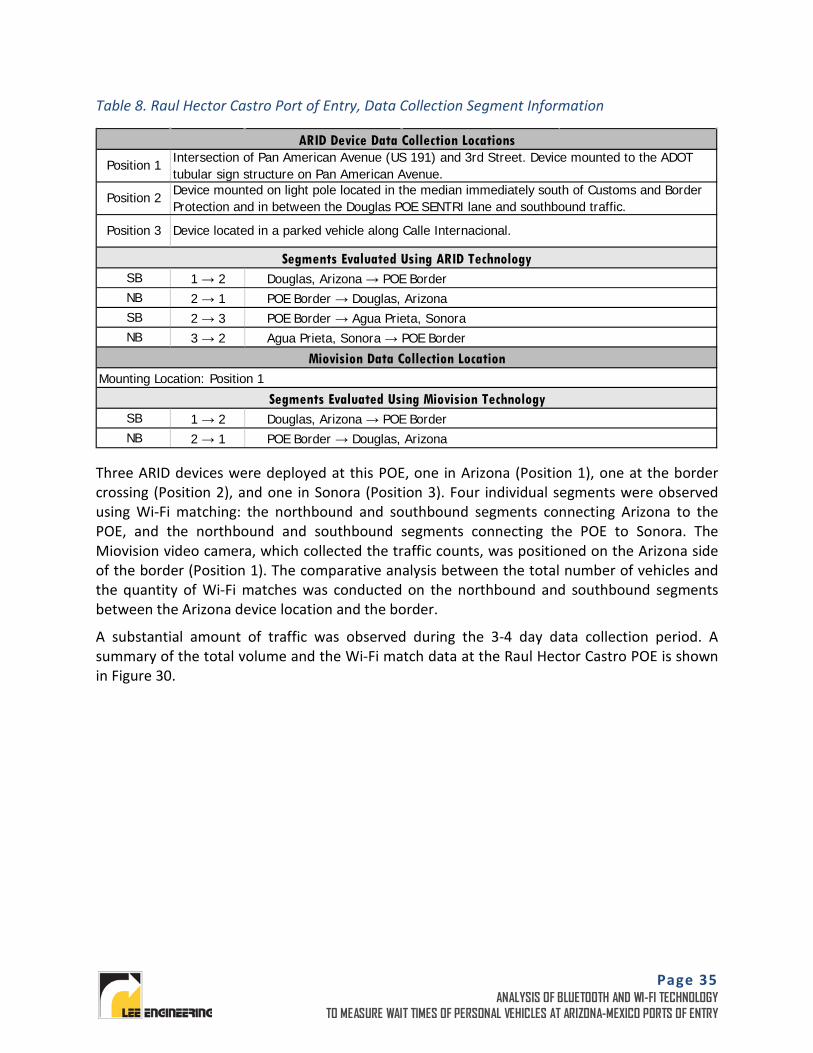
Table 8. Raul Hector Castro Port of Entry, Data Collection Segment Information
Three ARID devices were deployed at this POE, one in Arizona (Position 1), one at the border crossing (Position 2), and one in Sonora (Position 3). Four individual segments were observed using Wi-Fi matching: the northbound and southbound segments connecting Arizona to the POE, and the northbound and southbound segments connecting the POE to Sonora. The Miovision video camera, which collected the traffic counts, was positioned on the Arizona side of the border (Position 1). The comparative analysis between the total number of vehicles and the quantity of Wi-Fi matches was conducted on the northbound and southbound segments between the Arizona device location and the border.
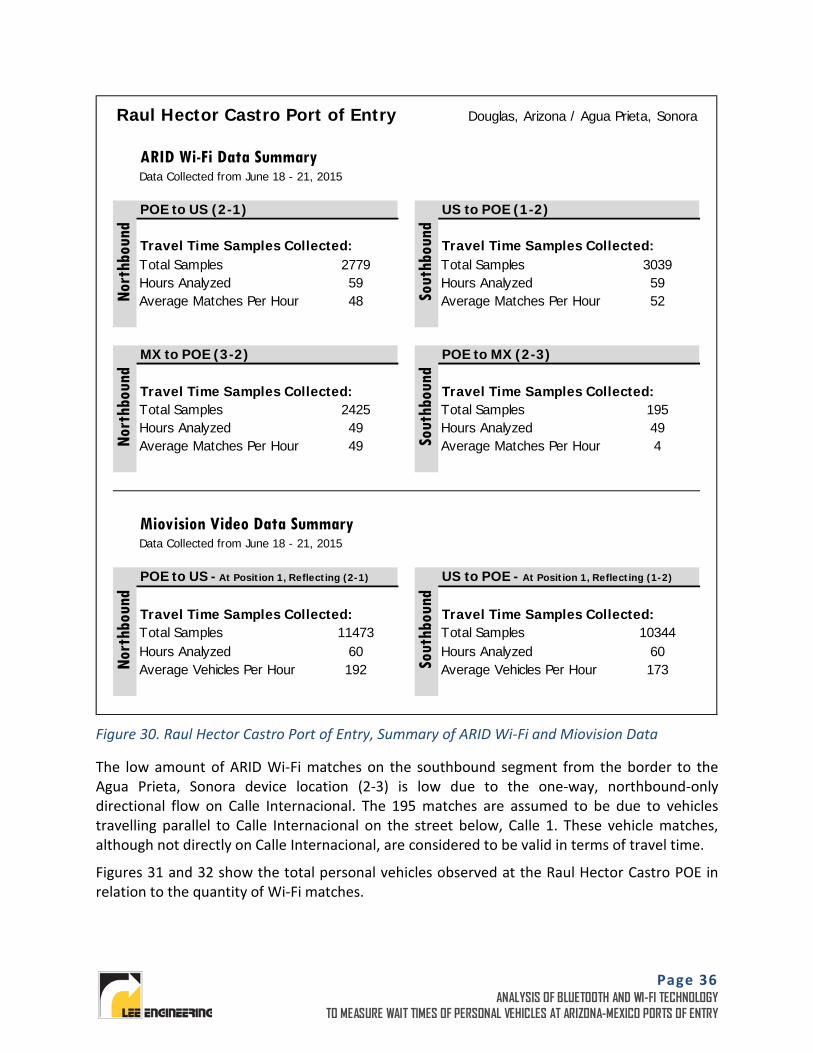
A substantial amount of traffic was observed during the 3-4 day data collection period. A summary of the total volume and the Wi-Fi match data at the Raul Hector Castro POE is shown in Figure 30.
SB 1 → 2NB 2 → 1SB 2 → 3NB 3 → 2
SB 1 → 2NB 2 → 1
Position 3 Device located in a parked vehicle along Calle Internacional.
ARID Device Data Collection Locations
Segments Evaluated Using ARID Technology
Intersection of Pan American Avenue (US 191) and 3rd Street. Device mounted to the ADOT tubular sign structure on Pan American Avenue.Device mounted on light pole located in the median immediately south of Customs and Border Protection and in between the Douglas POE SENTRI lane and southbound traffic.
Position 2
Position 1
Douglas, Arizona → POE Border POE Border → Douglas, Arizona POE Border → Agua Prieta, Sonora Agua Prieta, Sonora → POE Border
POE Border → Douglas, Arizona Douglas, Arizona → POE Border
Miovision Data Collection LocationMounting Location: Position 1
Segments Evaluated Using Miovision Technology
Page 36 ANALYSIS OF BLUETOOTH AND WI-FI TECHNOLOGY
TO MEASURE WAIT TIMES OF PERSONAL VEHICLES AT ARIZONA-MEXICO PORTS OF ENTRY
Figure 30. Raul Hector Castro Port of Entry, Summary of ARID Wi-Fi and Miovision Data
The low amount of ARID Wi-Fi matches on the southbound segment from the border to the Agua Prieta, Sonora device location (2-3) is low due to the one-way, northbound-only directional flow on Calle Internacional. The 195 matches are assumed to be due to vehicles travelling parallel to Calle Internacional on the street below, Calle 1. These vehicle matches, although not directly on Calle Internacional, are considered to be valid in terms of travel time.
Figures 31 and 32 show the total personal vehicles observed at the Raul Hector Castro POE in relation to the quantity of Wi-Fi matches.
Raul Hector Castro Port of Entry Douglas, Arizona / Agua Prieta, Sonora
ARID Wi-Fi Data Summary Data Collected from June 18 - 21, 2015
POE to US (2-1) US to POE (1-2)
Travel Time Samples Collected: Travel Time Samples Collected:Total Samples Total SamplesHours Analyzed Hours AnalyzedAverage Matches Per Hour Average Matches Per Hour
MX to POE (3-2) POE to MX (2-3)
Travel Time Samples Collected: Travel Time Samples Collected:Total Samples Total SamplesHours Analyzed Hours AnalyzedAverage Matches Per Hour Average Matches Per Hour
Miovision Video Data Summary Data Collected from June 18 - 21, 2015
Travel Time Samples Collected: Travel Time Samples Collected:Total Samples Total SamplesHours Analyzed Hours AnalyzedAverage Vehicles Per Hour Average Vehicles Per Hour
2779 3039
48 525959
60 60
Nort
hbou
nd
Sout
hbou
nd2425 195
POE to US - At Position 1, Reflecting (2-1) US to POE - At Position 1, Reflecting (1-2)
Nort
hbou
nd
Sout
hbou
nd
11473 10344
192 173
49 4949 4
Nort
hbou
nd
Sout
hbou
nd
Page 37 ANALYSIS OF BLUETOOTH AND WI-FI TECHNOLOGY
TO MEASURE WAIT TIMES OF PERSONAL VEHICLES AT ARIZONA-MEXICO PORTS OF ENTRY
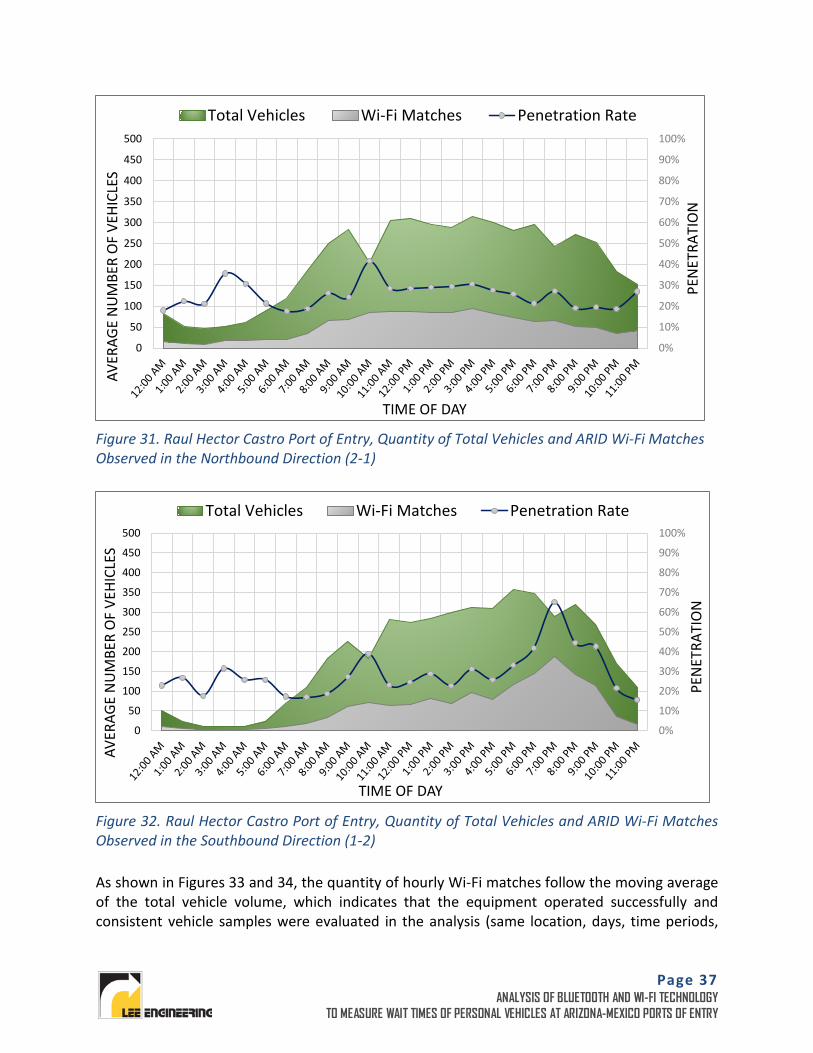
Figure 31. Raul Hector Castro Port of Entry, Quantity of Total Vehicles and ARID Wi-Fi Matches Observed in the Northbound Direction (2-1)
Figure 32. Raul Hector Castro Port of Entry, Quantity of Total Vehicles and ARID Wi-Fi Matches Observed in the Southbound Direction (1-2)
As shown in Figures 33 and 34, the quantity of hourly Wi-Fi matches follow the moving average of the total vehicle volume, which indicates that the equipment operated successfully and consistent vehicle samples were evaluated in the analysis (same location, days, time periods,
0%
10%
20%
30%
40%
50%
60%
70%
80%
90%
100%
0
50
100
150
200
250
300
350
400
450
500
AVER
AGE
NU
MBE
R O
F VE
HICL
ES
TIME OF DAY
Total Vehicles Wi-Fi Matches Penetration Rate
PEN
ETRA
TIO
N
0%
10%
20%
30%
40%
50%
60%
70%
80%
90%
100%
0
50
100
150
200
250
300
350
400
450
500
AVER
AGE
NU
MBE
R O
F VE
HICL
ES
TIME OF DAY
Total Vehicles Wi-Fi Matches Penetration Rate
PEN
ETRA
TIO
N
Page 38 ANALYSIS OF BLUETOOTH AND WI-FI TECHNOLOGY
TO MEASURE WAIT TIMES OF PERSONAL VEHICLES AT ARIZONA-MEXICO PORTS OF ENTRY
etc.) The average daily penetration rate was determined to be 25.8% in the northbound direction and 32.0% in the southbound direction.
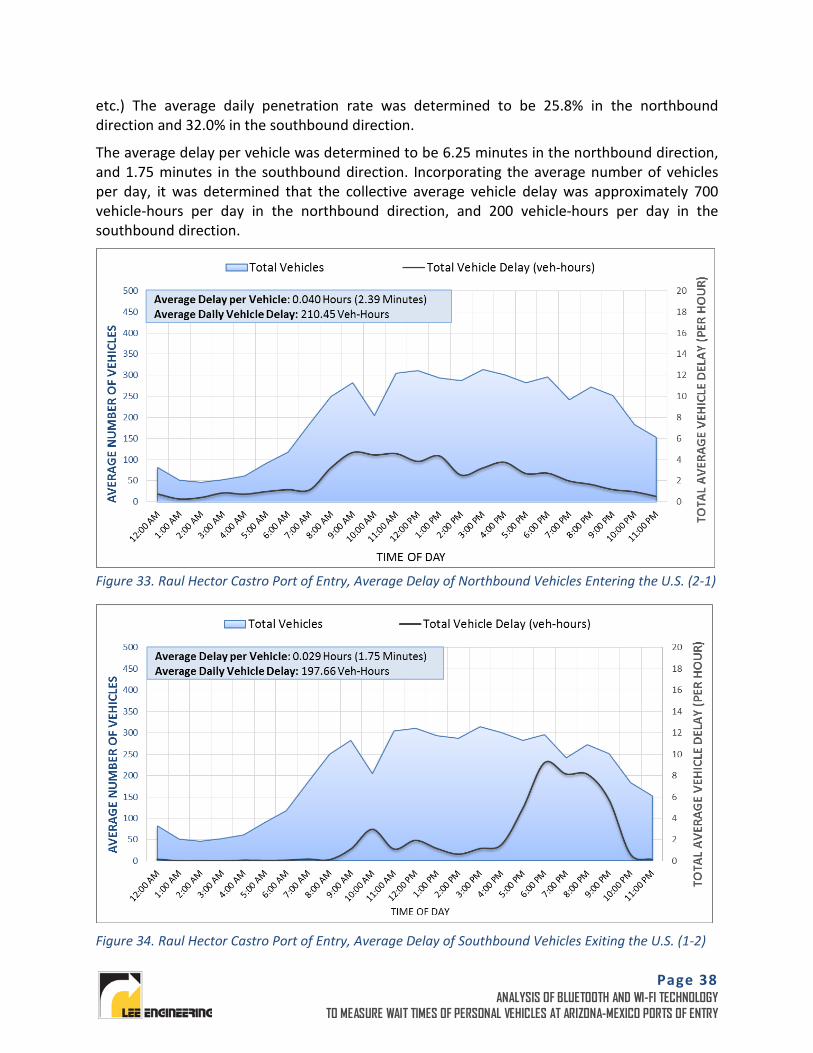
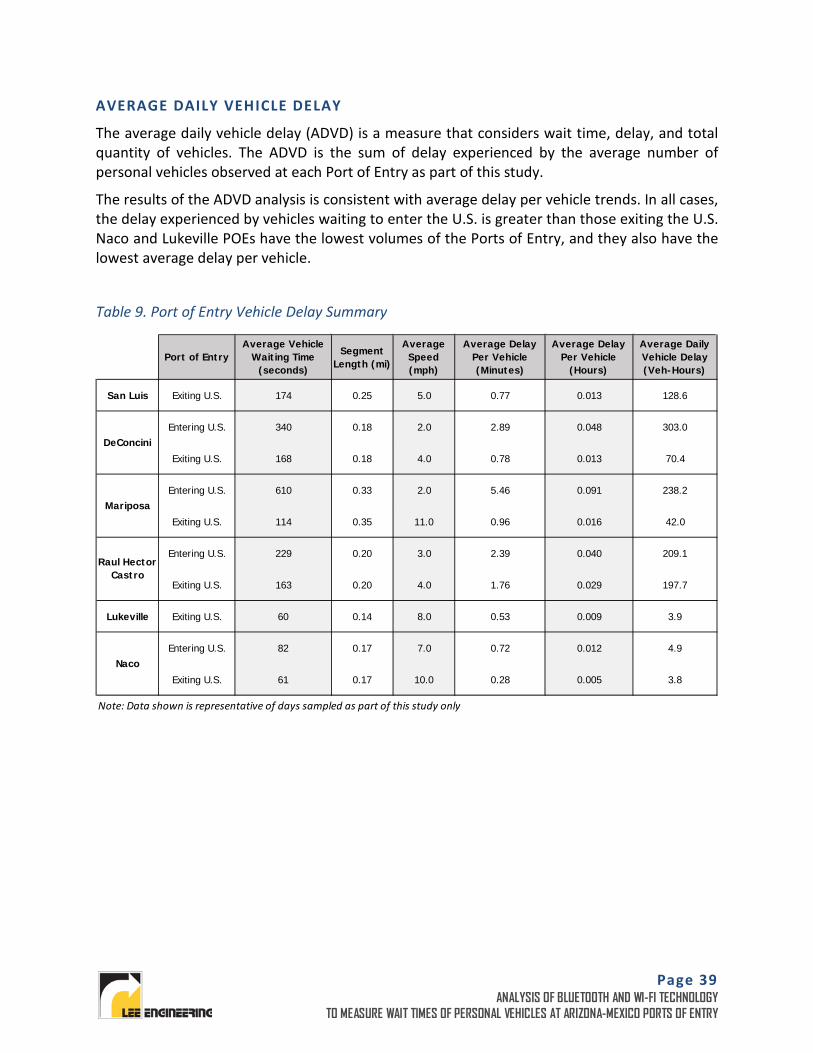
The average delay per vehicle was determined to be 6.25 minutes in the northbound direction, and 1.75 minutes in the southbound direction. Incorporating the average number of vehicles per day, it was determined that the collective average vehicle delay was approximately 700 vehicle-hours per day in the northbound direction, and 200 vehicle-hours per day in the southbound direction.
Figure 33. Raul Hector Castro Port of Entry, Average Delay of Northbound Vehicles Entering the U.S. (2-1)
Figure 34. Raul Hector Castro Port of Entry, Average Delay of Southbound Vehicles Exiting the U.S. (1-2)
Page 39 ANALYSIS OF BLUETOOTH AND WI-FI TECHNOLOGY
TO MEASURE WAIT TIMES OF PERSONAL VEHICLES AT ARIZONA-MEXICO PORTS OF ENTRY
AVERAGE DAILY VEHICLE DELAY
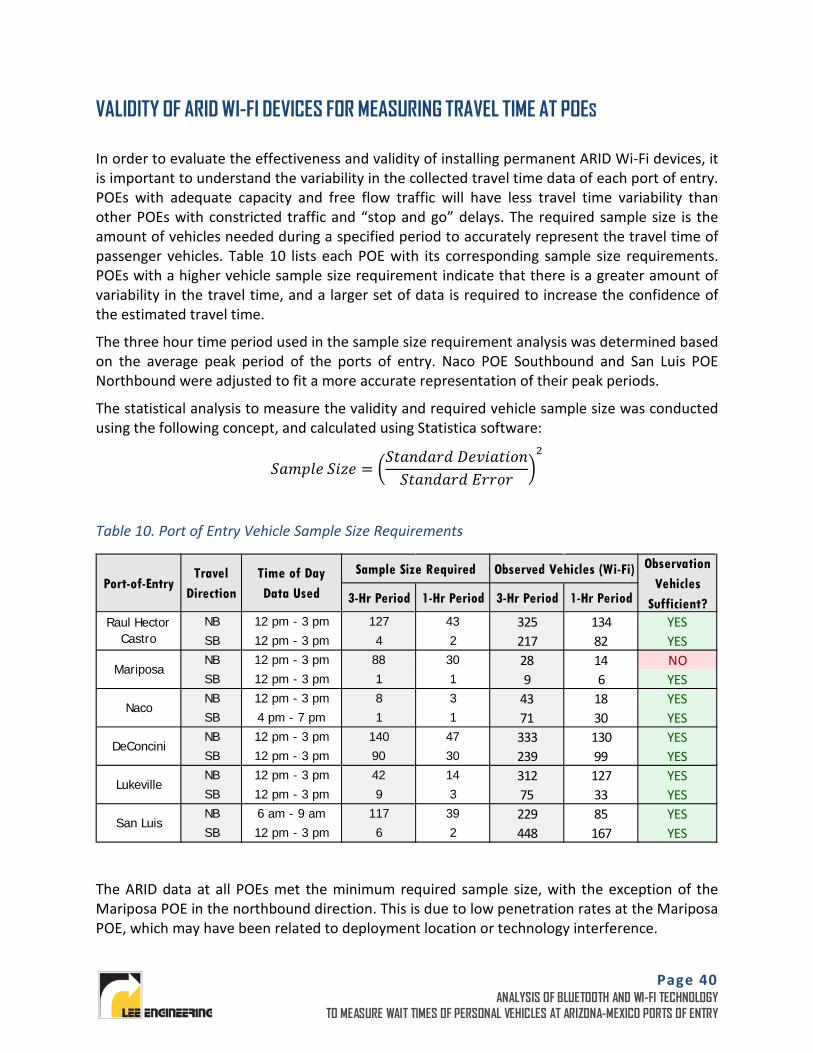
The average daily vehicle delay (ADVD) is a measure that considers wait time, delay, and total quantity of vehicles. The ADVD is the sum of delay experienced by the average number of personal vehicles observed at each Port of Entry as part of this study.
The results of the ADVD analysis is consistent with average delay per vehicle trends. In all cases, the delay experienced by vehicles waiting to enter the U.S. is greater than those exiting the U.S. Naco and Lukeville POEs have the lowest volumes of the Ports of Entry, and they also have the lowest average delay per vehicle.
Table 9. Port of Entry Vehicle Delay Summary
Port of EntryAverage Vehicle
Waiting Time (seconds)
Segment Length (mi)
Average Speed (mph)
Average Delay Per Vehicle (Minutes)
Average Delay Per Vehicle
(Hours)
Average Daily Vehicle Delay (Veh-Hours)
San Luis Exiting U.S. 174 0.25 5.0 0.77 0.013 128.6
Entering U.S. 340 0.18 2.0 2.89 0.048 303.0
Exiting U.S. 168 0.18 4.0 0.78 0.013 70.4
Entering U.S. 610 0.33 2.0 5.46 0.091 238.2
Exiting U.S. 114 0.35 11.0 0.96 0.016 42.0
Entering U.S. 229 0.20 3.0 2.39 0.040 209.1
Exiting U.S. 163 0.20 4.0 1.76 0.029 197.7
Lukeville Exiting U.S. 60 0.14 8.0 0.53 0.009 3.9
Entering U.S. 82 0.17 7.0 0.72 0.012 4.9
Exiting U.S. 61 0.17 10.0 0.28 0.005 3.8
Note: Data shown is representative of days sampled as part of this study only
Naco
DeConcini
Raul Hector Castro
Mariposa
Page 40 ANALYSIS OF BLUETOOTH AND WI-FI TECHNOLOGY
TO MEASURE WAIT TIMES OF PERSONAL VEHICLES AT ARIZONA-MEXICO PORTS OF ENTRY
VALIDITY OF ARID WI-FI DEVICES FOR MEASURING TRAVEL TIME AT POES
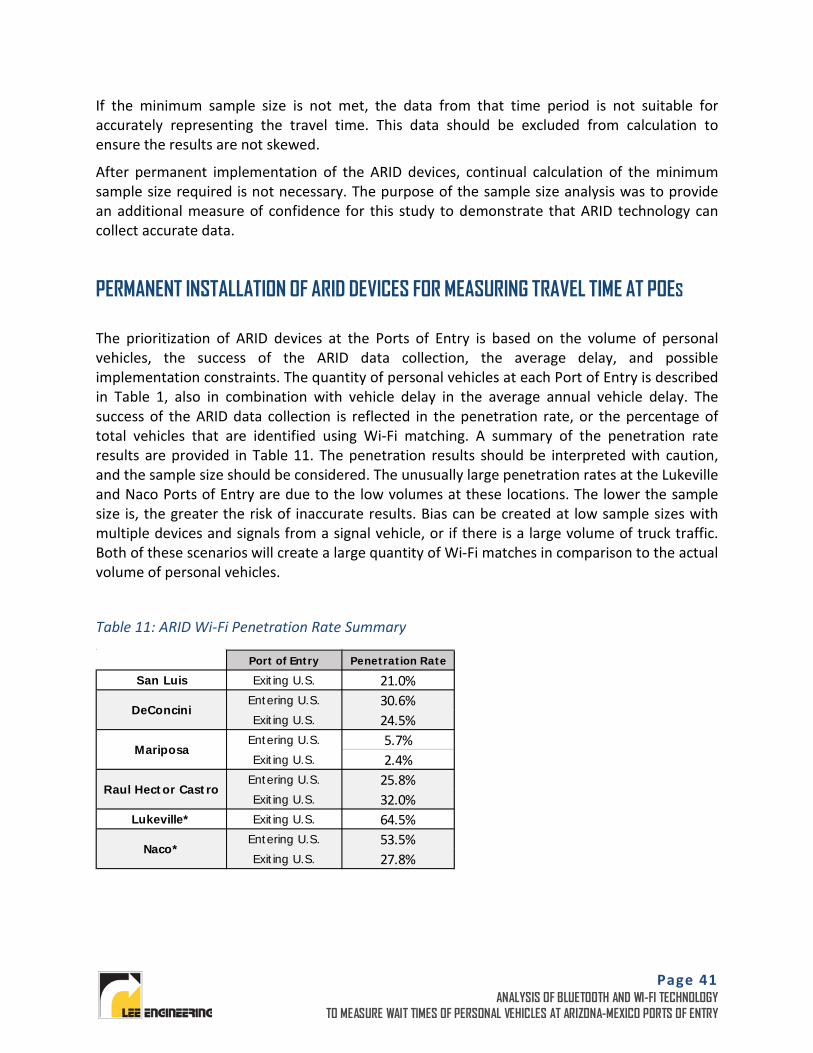
In order to evaluate the effectiveness and validity of installing permanent ARID Wi-Fi devices, it is important to understand the variability in the collected travel time data of each port of entry. POEs with adequate capacity and free flow traffic will have less travel time variability than other POEs with constricted traffic and “stop and go” delays. The required sample size is the amount of vehicles needed during a specified period to accurately represent the travel time of passenger vehicles. Table 10 lists each POE with its corresponding sample size requirements. POEs with a higher vehicle sample size requirement indicate that there is a greater amount of variability in the travel time, and a larger set of data is required to increase the confidence of the estimated travel time.
The three hour time period used in the sample size requirement analysis was determined based on the average peak period of the ports of entry. Naco POE Southbound and San Luis POE Northbound were adjusted to fit a more accurate representation of their peak periods.
The statistical analysis to measure the validity and required vehicle sample size was conducted using the following concept, and calculated using Statistica software:
𝑆𝑆𝑆𝑆𝑆𝑆𝑆𝑆𝑆𝑆𝑆𝑆 𝑆𝑆𝑆𝑆𝑆𝑆𝑆𝑆 = �𝑆𝑆𝑆𝑆𝑆𝑆𝑆𝑆𝑆𝑆𝑆𝑆𝑆𝑆𝑆𝑆 𝐷𝐷𝑆𝑆𝐷𝐷𝑆𝑆𝑆𝑆𝑆𝑆𝑆𝑆𝐷𝐷𝑆𝑆𝑆𝑆𝑆𝑆𝑆𝑆𝑆𝑆𝑆𝑆𝑆𝑆𝑆𝑆𝑆𝑆 𝐸𝐸𝑆𝑆𝑆𝑆𝐷𝐷𝑆𝑆
�2
Table 10. Port of Entry Vehicle Sample Size Requirements
The ARID data at all POEs met the minimum required sample size, with the exception of the Mariposa POE in the northbound direction. This is due to low penetration rates at the Mariposa POE, which may have been related to deployment location or technology interference.
3-Hr Period 1-Hr Period 3-Hr Period 1-Hr Period
NB 12 pm - 3 pm 127 43 325 134 YESSB 12 pm - 3 pm 4 2 217 82 YESNB 12 pm - 3 pm 88 30 28 14 NOSB 12 pm - 3 pm 1 1 9 6 YESNB 12 pm - 3 pm 8 3 43 18 YESSB 4 pm - 7 pm 1 1 71 30 YESNB 12 pm - 3 pm 140 47 333 130 YESSB 12 pm - 3 pm 90 30 239 99 YESNB 12 pm - 3 pm 42 14 312 127 YESSB 12 pm - 3 pm 9 3 75 33 YESNB 6 am - 9 am 117 39 229 85 YESSB 12 pm - 3 pm 6 2 448 167 YES
San Luis
Raul Hector Castro
Mariposa
Naco
DeConcini
Lukeville
Port-of-EntryTravel
DirectionTime of Day Data Used
Sample Size Required Observed Vehicles (Wi-Fi) Observation Vehicles
Sufficient?
Page 41 ANALYSIS OF BLUETOOTH AND WI-FI TECHNOLOGY
TO MEASURE WAIT TIMES OF PERSONAL VEHICLES AT ARIZONA-MEXICO PORTS OF ENTRY
If the minimum sample size is not met, the data from that time period is not suitable for accurately representing the travel time. This data should be excluded from calculation to ensure the results are not skewed.
After permanent implementation of the ARID devices, continual calculation of the minimum sample size required is not necessary. The purpose of the sample size analysis was to provide an additional measure of confidence for this study to demonstrate that ARID technology can collect accurate data.
PERMANENT INSTALLATION OF ARID DEVICES FOR MEASURING TRAVEL TIME AT POES
The prioritization of ARID devices at the Ports of Entry is based on the volume of personal vehicles, the success of the ARID data collection, the average delay, and possible implementation constraints. The quantity of personal vehicles at each Port of Entry is described in Table 1, also in combination with vehicle delay in the average annual vehicle delay. The success of the ARID data collection is reflected in the penetration rate, or the percentage of total vehicles that are identified using Wi-Fi matching. A summary of the penetration rate results are provided in Table 11. The penetration results should be interpreted with caution, and the sample size should be considered. The unusually large penetration rates at the Lukeville and Naco Ports of Entry are due to the low volumes at these locations. The lower the sample size is, the greater the risk of inaccurate results. Bias can be created at low sample sizes with multiple devices and signals from a signal vehicle, or if there is a large volume of truck traffic. Both of these scenarios will create a large quantity of Wi-Fi matches in comparison to the actual volume of personal vehicles.
Table 11: ARID Wi-Fi Penetration Rate Summary
Port of Entry Penetration Rate
San Luis Exiting U.S. 21.0%Entering U.S. 30.6%Exiting U.S. 24.5%
Entering U.S. 5.7%Exiting U.S. 2.4%
Entering U.S. 25.8%Exiting U.S. 32.0%
Lukeville* Exiting U.S. 64.5%Entering U.S. 53.5%Exiting U.S. 27.8%
DeConcini
Mariposa
Raul Hector Castro
Naco*
Page 42 ANALYSIS OF BLUETOOTH AND WI-FI TECHNOLOGY
TO MEASURE WAIT TIMES OF PERSONAL VEHICLES AT ARIZONA-MEXICO PORTS OF ENTRY
Excluding the Lukeville and Naco POEs, the penetration rate analysis showed the greatest success (in descending order) at the Raul Hector Castro, DeConcini, San Luis, and Mariposa Ports of Entry.
The other factor is the amount of delay experienced at each POE, which involves the average annual vehicle delay. In terms of the most significant vehicle delay, the POEs are ranked as follows: Raul Hector Castro, DeConcini, San Luis, Mariposa, Lukeville, and Naco.
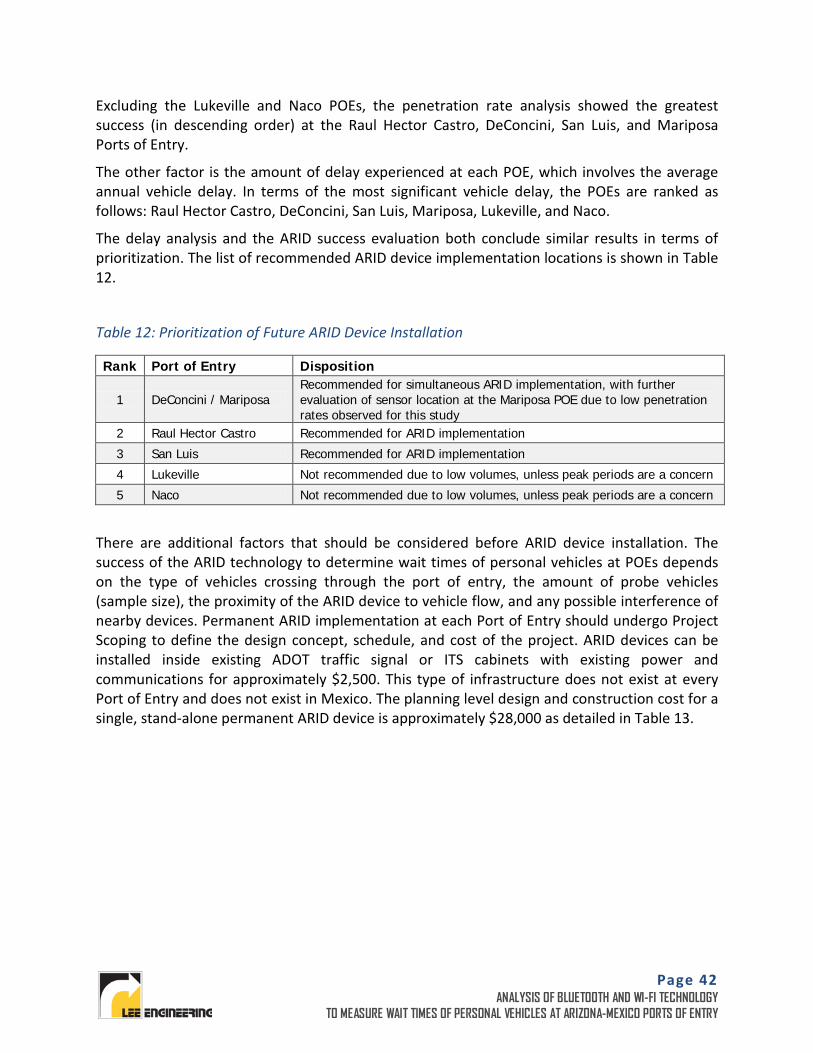
The delay analysis and the ARID success evaluation both conclude similar results in terms of prioritization. The list of recommended ARID device implementation locations is shown in Table 12.
Table 12: Prioritization of Future ARID Device Installation
Rank Port of Entry Disposition
1 DeConcini / Mariposa Recommended for simultaneous ARID implementation, with further evaluation of sensor location at the Mariposa POE due to low penetration rates observed for this study
2 Raul Hector Castro Recommended for ARID implementation
3 San Luis Recommended for ARID implementation
4 Lukeville Not recommended due to low volumes, unless peak periods are a concern
5 Naco Not recommended due to low volumes, unless peak periods are a concern
There are additional factors that should be considered before ARID device installation. The success of the ARID technology to determine wait times of personal vehicles at POEs depends on the type of vehicles crossing through the port of entry, the amount of probe vehicles (sample size), the proximity of the ARID device to vehicle flow, and any possible interference of nearby devices. Permanent ARID implementation at each Port of Entry should undergo Project Scoping to define the design concept, schedule, and cost of the project. ARID devices can be installed inside existing ADOT traffic signal or ITS cabinets with existing power and communications for approximately $2,500. This type of infrastructure does not exist at every Port of Entry and does not exist in Mexico. The planning level design and construction cost for a single, stand-alone permanent ARID device is approximately $28,000 as detailed in Table 13.
Page 43 ANALYSIS OF BLUETOOTH AND WI-FI TECHNOLOGY
TO MEASURE WAIT TIMES OF PERSONAL VEHICLES AT ARIZONA-MEXICO PORTS OF ENTRY
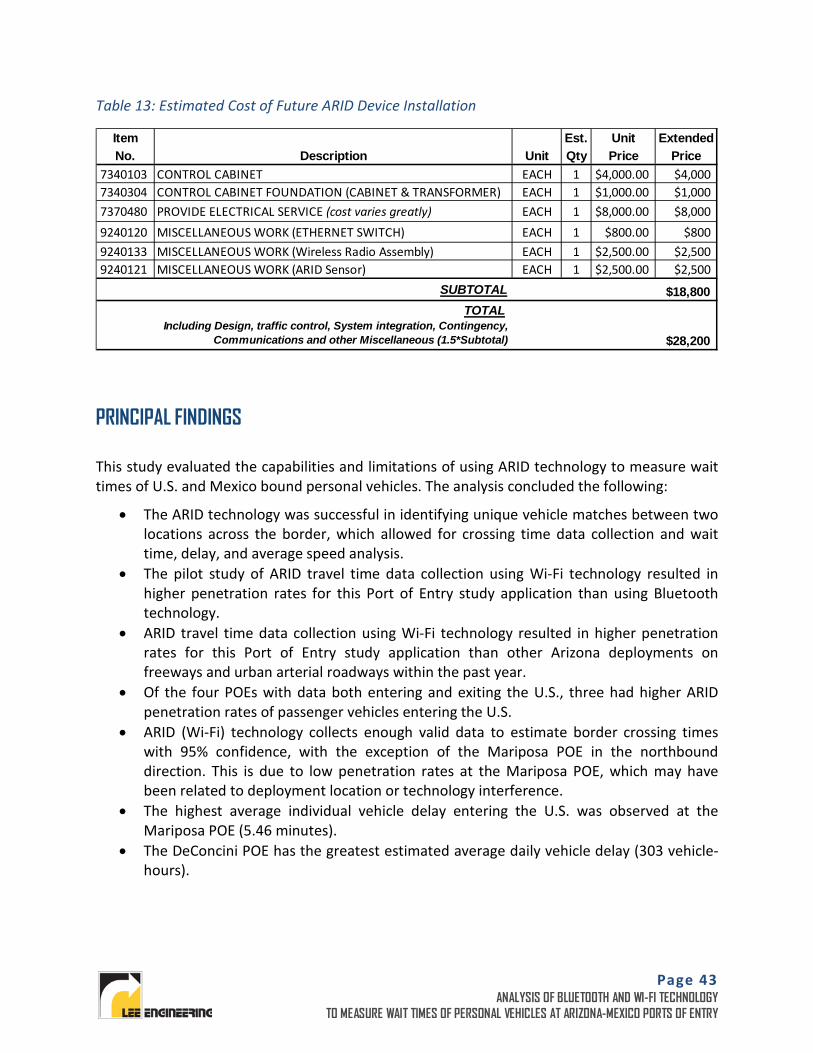
Table 13: Estimated Cost of Future ARID Device Installation
PRINCIPAL FINDINGS
This study evaluated the capabilities and limitations of using ARID technology to measure wait times of U.S. and Mexico bound personal vehicles. The analysis concluded the following:
• The ARID technology was successful in identifying unique vehicle matches between two locations across the border, which allowed for crossing time data collection and wait time, delay, and average speed analysis.
• The pilot study of ARID travel time data collection using Wi-Fi technology resulted in higher penetration rates for this Port of Entry study application than using Bluetooth technology.
• ARID travel time data collection using Wi-Fi technology resulted in higher penetration rates for this Port of Entry study application than other Arizona deployments on freeways and urban arterial roadways within the past year.
• Of the four POEs with data both entering and exiting the U.S., three had higher ARID penetration rates of passenger vehicles entering the U.S.
• ARID (Wi-Fi) technology collects enough valid data to estimate border crossing times with 95% confidence, with the exception of the Mariposa POE in the northbound direction. This is due to low penetration rates at the Mariposa POE, which may have been related to deployment location or technology interference.
• The highest average individual vehicle delay entering the U.S. was observed at the Mariposa POE (5.46 minutes).
• The DeConcini POE has the greatest estimated average daily vehicle delay (303 vehicle-hours).
Item Est. Unit ExtendedNo. Description Unit Qty Price Price
7340103 CONTROL CABINET EACH 1 $4,000.00 $4,0007340304 CONTROL CABINET FOUNDATION (CABINET & TRANSFORMER) EACH 1 $1,000.00 $1,0007370480 PROVIDE ELECTRICAL SERVICE (cost varies greatly) EACH 1 $8,000.00 $8,0009240120 MISCELLANEOUS WORK (ETHERNET SWITCH) EACH 1 $800.00 $8009240133 MISCELLANEOUS WORK (Wireless Radio Assembly) EACH 1 $2,500.00 $2,5009240121 MISCELLANEOUS WORK (ARID Sensor) EACH 1 $2,500.00 $2,500
$18,800
$28,200
SUBTOTALTOTAL
Including Design, traffic control, System integration, Contingency, Communications and other Miscellaneous (1.5*Subtotal)
Page 44 ANALYSIS OF BLUETOOTH AND WI-FI TECHNOLOGY
TO MEASURE WAIT TIMES OF PERSONAL VEHICLES AT ARIZONA-MEXICO PORTS OF ENTRY
RECOMMENDATIONS
The implementation of permanent ARID devices at the Arizona-Mexico border are recommended in the following order, based on the amount of delay experienced at each location, the total personal vehicle volume, and the success of the ARID Wi-Fi deployments:
1. DeConcini/Mariposa 2. Raul Hector Castro 3. San Luis 4. Lukeville 5. Naco
The implementation of the ARID devices, specifically at the DeConcini, Mariposa, Raul Hector Castro, and San Luis Ports of Entry are expected to have the greatest impact and allow for the greatest vehicle flow and corresponding delay to be monitored and reported. Although the implementation at the Lukeville and Naco POEs would also yield beneficial wait time information and analysis, the significantly lower vehicle volumes lessens their priority. The DeConcini and Mariposa POEs are recommended to be implemented together with highest priority due to the observed vehicle delay, annual volumes, and close proximity in location allowing them to serve as alternate routes to each other. The DeConcini and Mariposa Ports of Entry are located approximately 1.4 miles (2.25 km) apart in Nogales, Arizona/Sonora, and have a combined annual vehicle volume of 3,286,532.
Permanent ARID implementation at each Port of Entry should undergo Project Scoping to define the design concept, schedule, and cost of the project. The planning level design and construction cost for a single, stand-alone permanent ARID device is approximately $28,000. This cost is highly dependent on the cost to provide electrical service to the site. Deployment at sites with existing power and communications infrastructure will significantly reduce implementation costs.
ANALYSIS OF BLUETOOTH AND WI-FI TECHNOLOGY
TO MEASURE WAIT TIMES OF PERSONAL VEHICLES AT ARIZONA-MEXICO PORTS OF ENTRY
APPENDIX A ARID WI-FI MATCH DATA
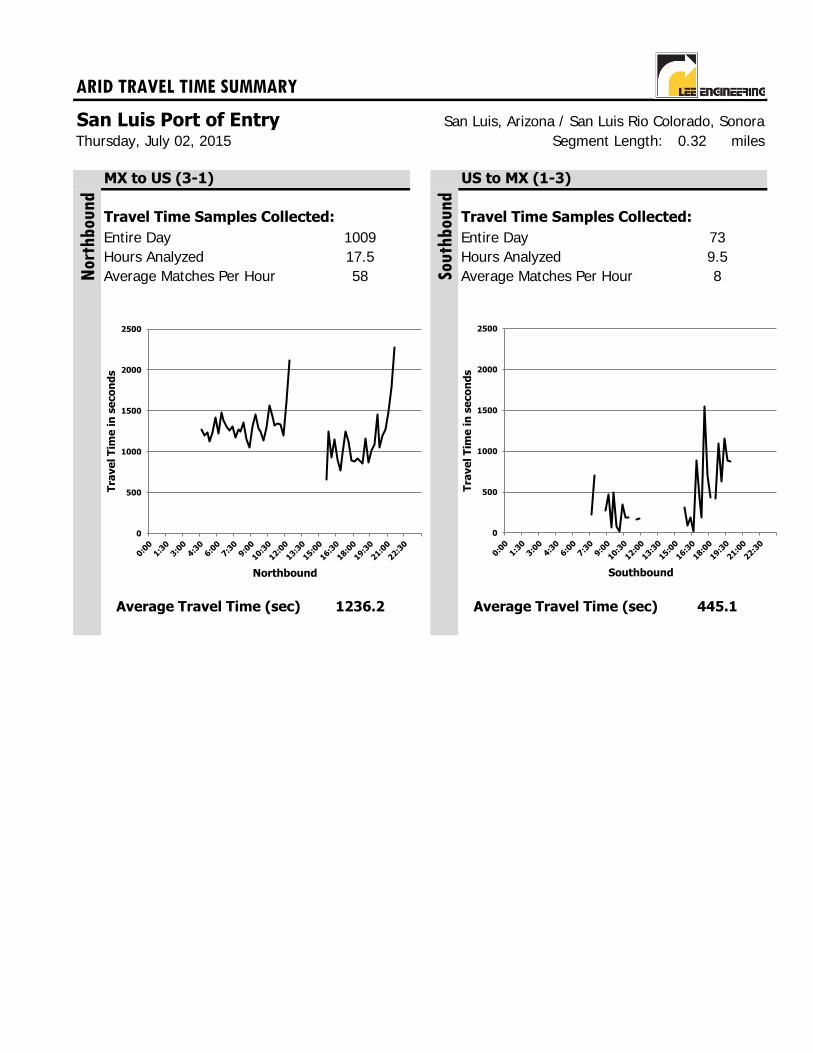
ARID TRAVEL TIME SUMMARY
San Luis Port of Entry San Luis, Arizona / San Luis Rio Colorado, SonoraSegment Length: 0.32 miles
MX to US (3-1) US to MX (1-3)
Travel Time Samples Collected: Travel Time Samples Collected:
Entire Day Entire DayHours Analyzed Hours AnalyzedAverage Matches Per Hour Average Matches Per Hour
Average Travel Time (sec) Average Travel Time (sec)
Thursday, July 02, 2015
1009 7317.5 9.558
1236.2 445.1
Nor
thbou
nd
Sou
thb
ound
8
0
500
1000
1500
2000
2500
Tra
ve
l T
ime
in
se
co
nd
s
Northbound
0
500
1000
1500
2000
2500
Tra
ve
l T
ime
in
se
co
nd
s
Southbound
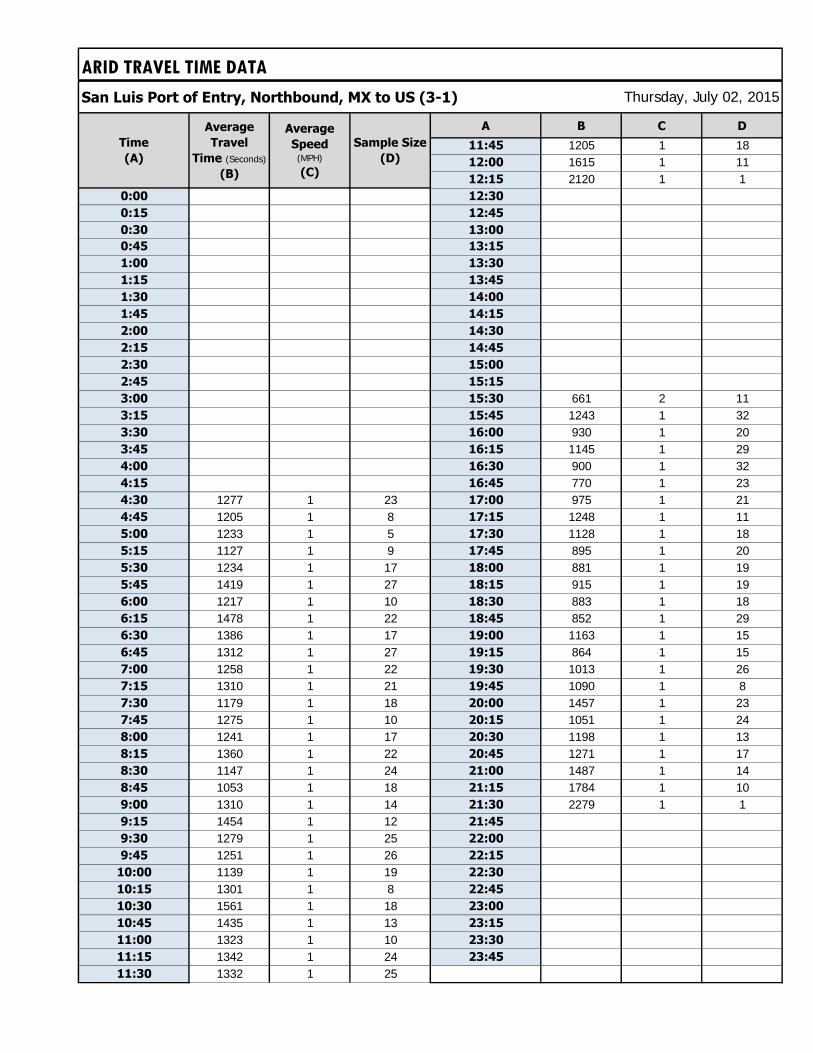
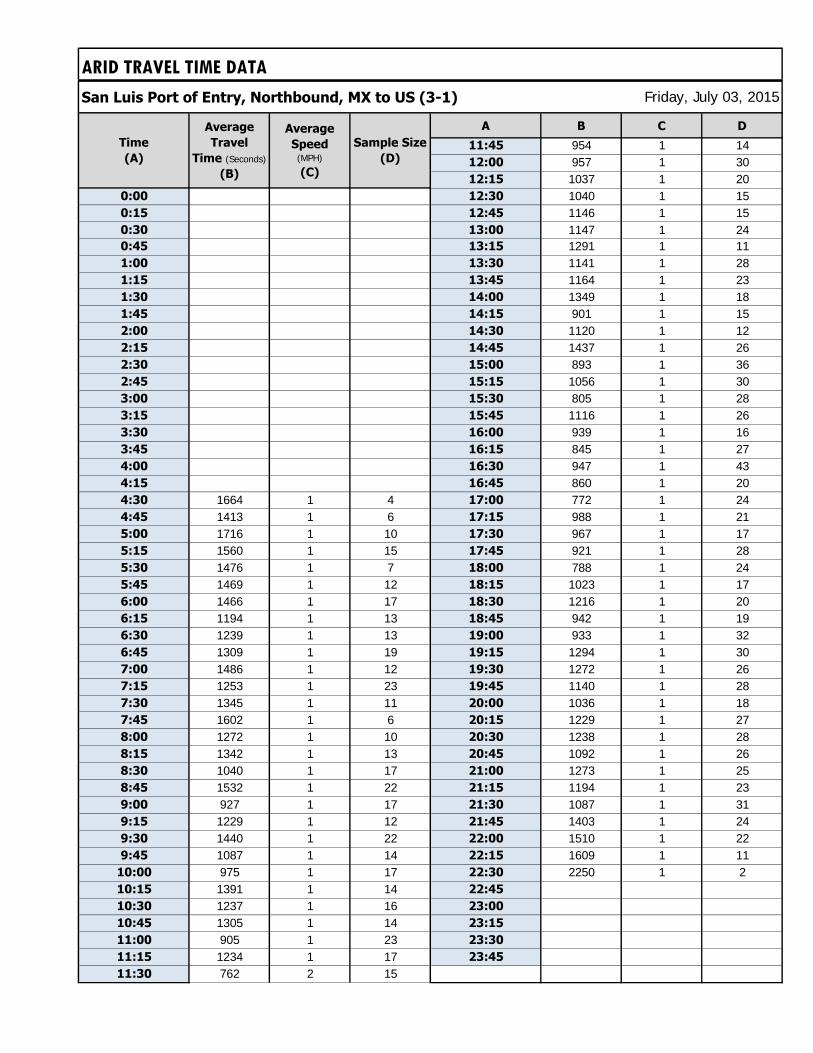
ARID TRAVEL TIME DATA
San Luis Port of Entry, Northbound, MX to US (3-1)
A B C D
11:45 1205 1 1812:00 1615 1 1112:15 2120 1 1
0:00 12:30
0:15 12:45
0:30 13:00
0:45 13:15
1:00 13:30
1:15 13:45
1:30 14:00
1:45 14:15
2:00 14:30
2:15 14:45
2:30 15:00
2:45 15:15
3:00 15:30 661 2 113:15 15:45 1243 1 323:30 16:00 930 1 203:45 16:15 1145 1 294:00 16:30 900 1 324:15 16:45 770 1 234:30 1277 1 23 17:00 975 1 214:45 1205 1 8 17:15 1248 1 115:00 1233 1 5 17:30 1128 1 185:15 1127 1 9 17:45 895 1 205:30 1234 1 17 18:00 881 1 195:45 1419 1 27 18:15 915 1 196:00 1217 1 10 18:30 883 1 186:15 1478 1 22 18:45 852 1 296:30 1386 1 17 19:00 1163 1 156:45 1312 1 27 19:15 864 1 157:00 1258 1 22 19:30 1013 1 267:15 1310 1 21 19:45 1090 1 87:30 1179 1 18 20:00 1457 1 237:45 1275 1 10 20:15 1051 1 248:00 1241 1 17 20:30 1198 1 138:15 1360 1 22 20:45 1271 1 178:30 1147 1 24 21:00 1487 1 148:45 1053 1 18 21:15 1784 1 109:00 1310 1 14 21:30 2279 1 19:15 1454 1 12 21:45
9:30 1279 1 25 22:00
9:45 1251 1 26 22:15
10:00 1139 1 19 22:30
10:15 1301 1 8 22:45
10:30 1561 1 18 23:00
10:45 1435 1 13 23:15
11:00 1323 1 10 23:30
11:15 1342 1 24 23:45
11:30 1332 1 25
Thursday, July 02, 2015
Time
(A)
Average
Travel
Time (Seconds)
(B)
Average
Speed (MPH)
(C)
Sample Size
(D)
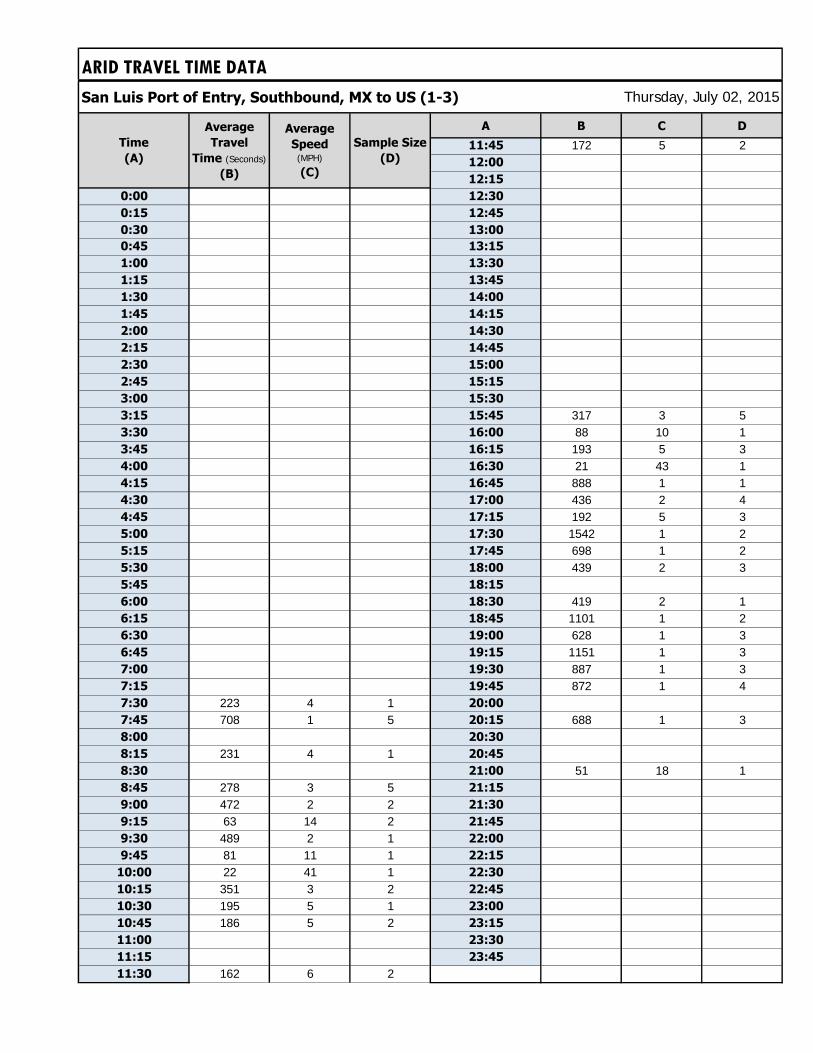
ARID TRAVEL TIME DATA
San Luis Port of Entry, Southbound, MX to US (1-3)
A B C D
11:45 172 5 212:00
12:15
0:00 12:30
0:15 12:45
0:30 13:00
0:45 13:15
1:00 13:30
1:15 13:45
1:30 14:00
1:45 14:15
2:00 14:30
2:15 14:45
2:30 15:00
2:45 15:15
3:00 15:30
3:15 15:45 317 3 53:30 16:00 88 10 13:45 16:15 193 5 34:00 16:30 21 43 14:15 16:45 888 1 14:30 17:00 436 2 44:45 17:15 192 5 35:00 17:30 1542 1 25:15 17:45 698 1 25:30 18:00 439 2 35:45 18:15
6:00 18:30 419 2 16:15 18:45 1101 1 26:30 19:00 628 1 36:45 19:15 1151 1 37:00 19:30 887 1 37:15 19:45 872 1 47:30 223 4 1 20:00
7:45 708 1 5 20:15 688 1 38:00 20:30
8:15 231 4 1 20:45
8:30 21:00 51 18 18:45 278 3 5 21:15
9:00 472 2 2 21:30
9:15 63 14 2 21:45
9:30 489 2 1 22:00
9:45 81 11 1 22:15
10:00 22 41 1 22:30
10:15 351 3 2 22:45
10:30 195 5 1 23:00
10:45 186 5 2 23:15
11:00 23:30
11:15 23:45
11:30 162 6 2
Thursday, July 02, 2015
Time
(A)
Average
Speed (MPH)
(C)
Sample Size
(D)
Average
Travel
Time (Seconds)
(B)
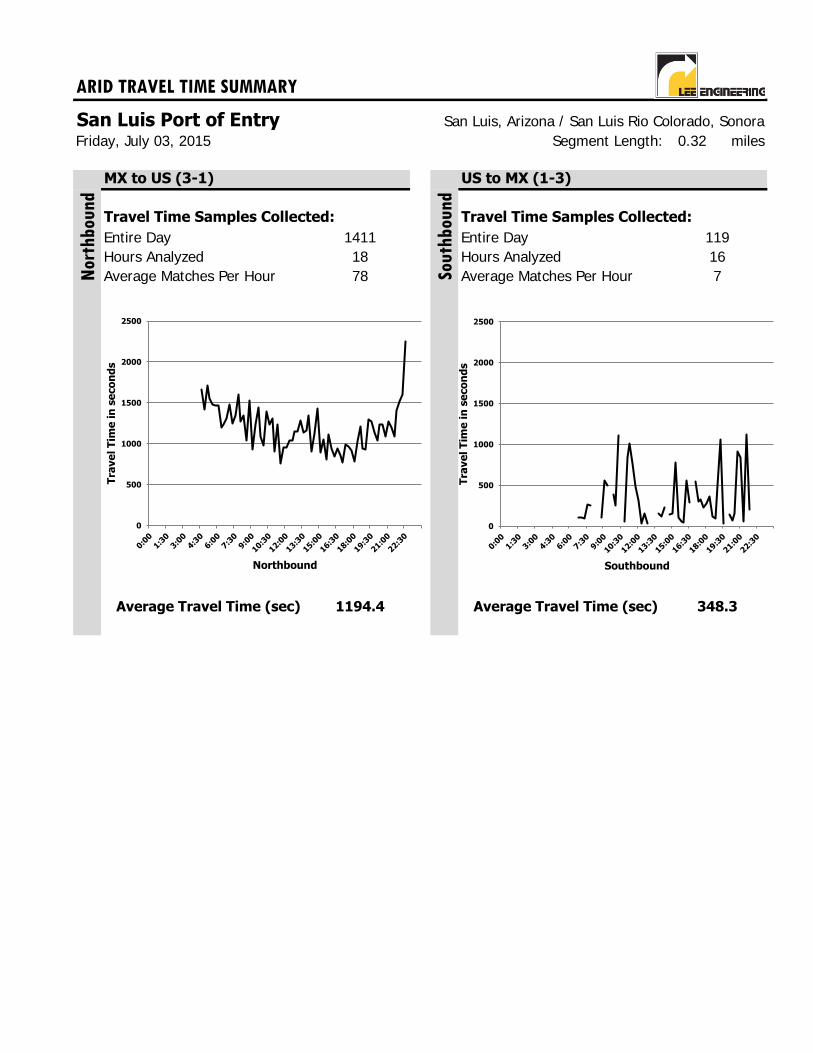
ARID TRAVEL TIME SUMMARY
San Luis Port of Entry San Luis, Arizona / San Luis Rio Colorado, SonoraSegment Length: 0.32 miles
MX to US (3-1) US to MX (1-3)
Travel Time Samples Collected: Travel Time Samples Collected:
Entire Day Entire DayHours Analyzed Hours AnalyzedAverage Matches Per Hour Average Matches Per Hour
Average Travel Time (sec) Average Travel Time (sec)
Friday, July 03, 2015
1411 11918 1678
1194.4 348.3
Nor
thbou
nd
Sou
thb
ound
7
0
500
1000
1500
2000
2500
Tra
ve
l T
ime
in
se
co
nd
s
Northbound
0
500
1000
1500
2000
2500
Tra
ve
l T
ime
in
se
co
nd
s
Southbound
ARID TRAVEL TIME DATA
San Luis Port of Entry, Northbound, MX to US (3-1)
A B C D
11:45 954 1 1412:00 957 1 3012:15 1037 1 20
0:00 12:30 1040 1 150:15 12:45 1146 1 150:30 13:00 1147 1 240:45 13:15 1291 1 111:00 13:30 1141 1 281:15 13:45 1164 1 231:30 14:00 1349 1 181:45 14:15 901 1 152:00 14:30 1120 1 122:15 14:45 1437 1 262:30 15:00 893 1 362:45 15:15 1056 1 303:00 15:30 805 1 283:15 15:45 1116 1 263:30 16:00 939 1 163:45 16:15 845 1 274:00 16:30 947 1 434:15 16:45 860 1 204:30 1664 1 4 17:00 772 1 244:45 1413 1 6 17:15 988 1 215:00 1716 1 10 17:30 967 1 175:15 1560 1 15 17:45 921 1 285:30 1476 1 7 18:00 788 1 245:45 1469 1 12 18:15 1023 1 176:00 1466 1 17 18:30 1216 1 206:15 1194 1 13 18:45 942 1 196:30 1239 1 13 19:00 933 1 326:45 1309 1 19 19:15 1294 1 307:00 1486 1 12 19:30 1272 1 267:15 1253 1 23 19:45 1140 1 287:30 1345 1 11 20:00 1036 1 187:45 1602 1 6 20:15 1229 1 278:00 1272 1 10 20:30 1238 1 288:15 1342 1 13 20:45 1092 1 268:30 1040 1 17 21:00 1273 1 258:45 1532 1 22 21:15 1194 1 239:00 927 1 17 21:30 1087 1 319:15 1229 1 12 21:45 1403 1 249:30 1440 1 22 22:00 1510 1 229:45 1087 1 14 22:15 1609 1 11
10:00 975 1 17 22:30 2250 1 210:15 1391 1 14 22:45
10:30 1237 1 16 23:00
10:45 1305 1 14 23:15
11:00 905 1 23 23:30
11:15 1234 1 17 23:45
11:30 762 2 15
Friday, July 03, 2015
Time
(A)
Average
Travel
Time (Seconds)
(B)
Average
Speed (MPH)
(C)
Sample Size
(D)
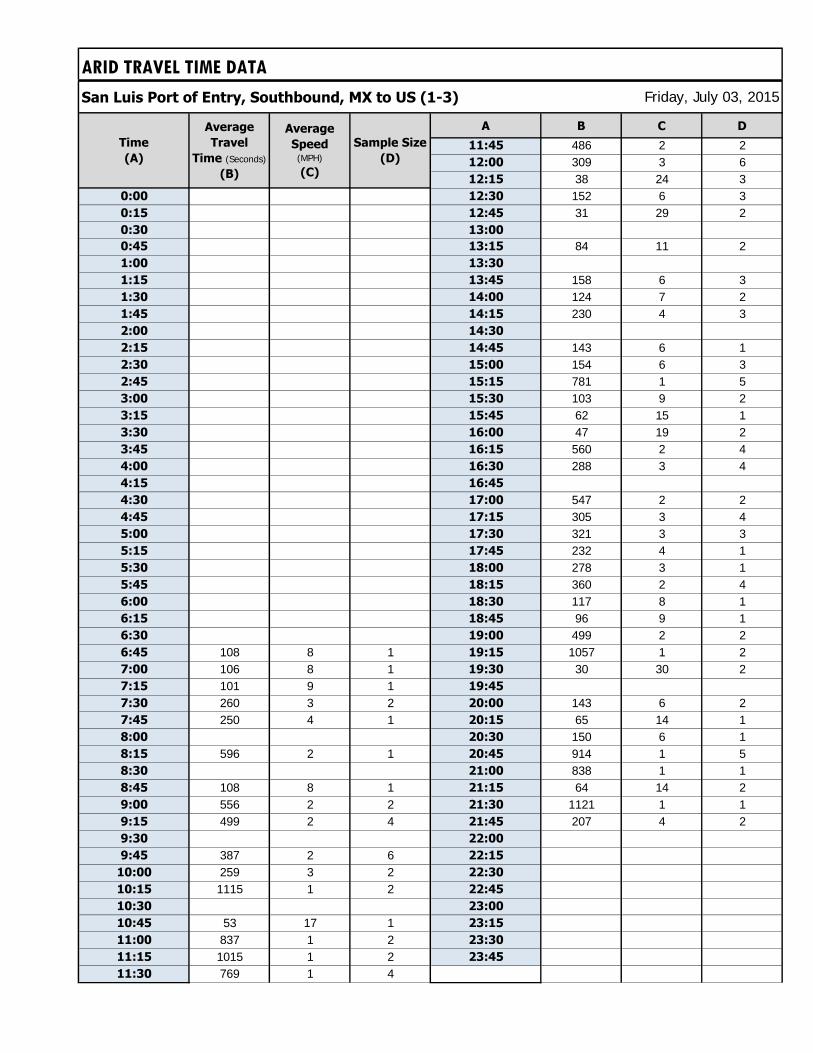
ARID TRAVEL TIME DATA
San Luis Port of Entry, Southbound, MX to US (1-3)
A B C D
11:45 486 2 212:00 309 3 612:15 38 24 3
0:00 12:30 152 6 30:15 12:45 31 29 20:30 13:00
0:45 13:15 84 11 21:00 13:30
1:15 13:45 158 6 31:30 14:00 124 7 21:45 14:15 230 4 32:00 14:30
2:15 14:45 143 6 12:30 15:00 154 6 32:45 15:15 781 1 53:00 15:30 103 9 23:15 15:45 62 15 13:30 16:00 47 19 23:45 16:15 560 2 44:00 16:30 288 3 44:15 16:45
4:30 17:00 547 2 24:45 17:15 305 3 45:00 17:30 321 3 35:15 17:45 232 4 15:30 18:00 278 3 15:45 18:15 360 2 46:00 18:30 117 8 16:15 18:45 96 9 16:30 19:00 499 2 26:45 108 8 1 19:15 1057 1 27:00 106 8 1 19:30 30 30 27:15 101 9 1 19:45
7:30 260 3 2 20:00 143 6 27:45 250 4 1 20:15 65 14 18:00 20:30 150 6 18:15 596 2 1 20:45 914 1 58:30 21:00 838 1 18:45 108 8 1 21:15 64 14 29:00 556 2 2 21:30 1121 1 19:15 499 2 4 21:45 207 4 29:30 22:00
9:45 387 2 6 22:15
10:00 259 3 2 22:30
10:15 1115 1 2 22:45
10:30 23:00
10:45 53 17 1 23:15
11:00 837 1 2 23:30
11:15 1015 1 2 23:45
11:30 769 1 4
Friday, July 03, 2015
Time
(A)
Average
Speed (MPH)
(C)
Sample Size
(D)
Average
Travel
Time (Seconds)
(B)
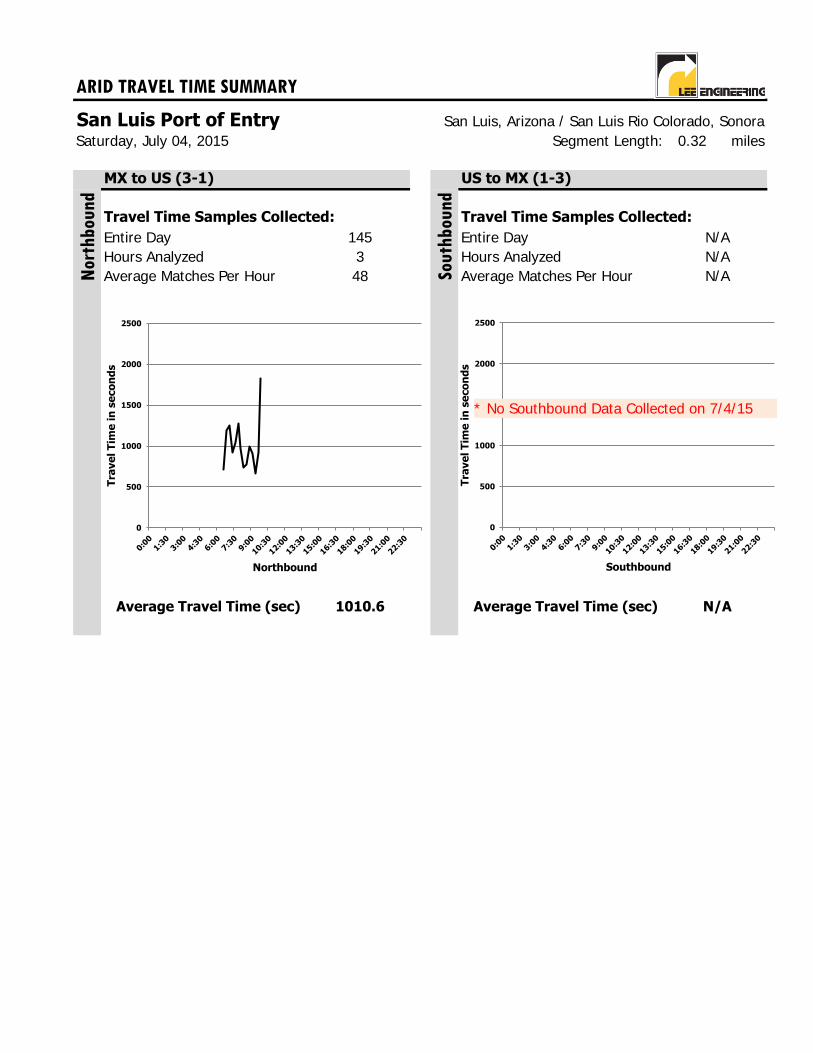
ARID TRAVEL TIME SUMMARY
San Luis Port of Entry San Luis, Arizona / San Luis Rio Colorado, SonoraSegment Length: 0.32 miles
MX to US (3-1) US to MX (1-3)
Travel Time Samples Collected: Travel Time Samples Collected:
Entire Day Entire DayHours Analyzed Hours AnalyzedAverage Matches Per Hour Average Matches Per Hour
Average Travel Time (sec) Average Travel Time (sec)
Saturday, July 04, 2015
145 N/A3 N/A48
1010.6 N/A
Nor
thbou
nd
Sou
thb
ound
N/A
0
500
1000
1500
2000
2500
Tra
ve
l T
ime
in
se
co
nd
s
Northbound
0
500
1000
1500
2000
2500
Tra
ve
l T
ime
in
se
co
nd
s
Southbound
* No Southbound Data Collected on 7/4/15

ARID TRAVEL TIME DATA
San Luis Port of Entry, Northbound, MX to US (3-1)
A B C D
11:45
12:00
12:15
0:00 12:30
0:15 12:45
0:30 13:00
0:45 13:15
1:00 13:30
1:15 13:45
1:30 14:00
1:45 14:15
2:00 14:30
2:15 14:45
2:30 15:00
2:45 15:15
3:00 15:30
3:15 15:45
3:30 16:00
3:45 16:15
4:00 16:30
4:15 16:45
4:30 17:00
4:45 17:15
5:00 17:30
5:15 17:45
5:30 18:00
5:45 18:15
6:00 18:30
6:15 18:45
6:30 708 2 10 19:00
6:45 1194 1 8 19:15
7:00 1251 1 10 19:30
7:15 916 1 11 19:45
7:30 1039 1 10 20:00
7:45 1276 1 10 20:15
8:00 965 1 5 20:30
8:15 732 2 10 20:45
8:30 771 1 22 21:00
8:45 989 1 13 21:15
9:00 905 1 16 21:30
9:15 660 2 10 21:45
9:30 918 1 7 22:00
9:45 1824 1 3 22:15
10:00 22:30
10:15 22:45
10:30 23:00
10:45 23:15
11:00 23:30
11:15 23:45
11:30
Saturday, July 04, 2015
Time
(A)
Average
Travel
Time (Seconds)
(B)
Average
Speed (MPH)
(C)
Sample Size
(D)
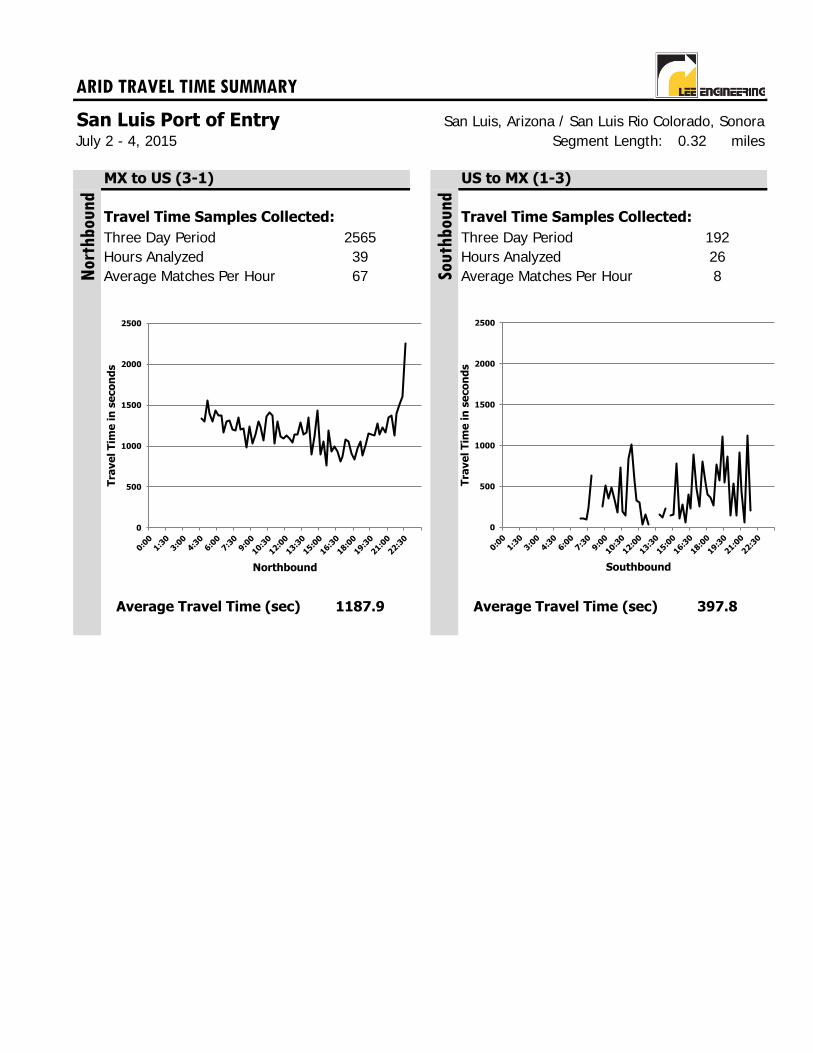
ARID TRAVEL TIME SUMMARY
San Luis Port of Entry San Luis, Arizona / San Luis Rio Colorado, SonoraSegment Length: 0.32 miles
MX to US (3-1) US to MX (1-3)
Travel Time Samples Collected: Travel Time Samples Collected:
Three Day Period Three Day PeriodHours Analyzed Hours AnalyzedAverage Matches Per Hour Average Matches Per Hour
Average Travel Time (sec) Average Travel Time (sec)
8
1187.9 397.8
July 2 - 4, 2015
Nor
thbou
nd
Sou
thb
ound
2565 19239 2667
0
500
1000
1500
2000
2500
Tra
ve
l T
ime
in
se
co
nd
s
Northbound
0
500
1000
1500
2000
2500
Tra
ve
l T
ime
in
se
co
nd
s
Southbound
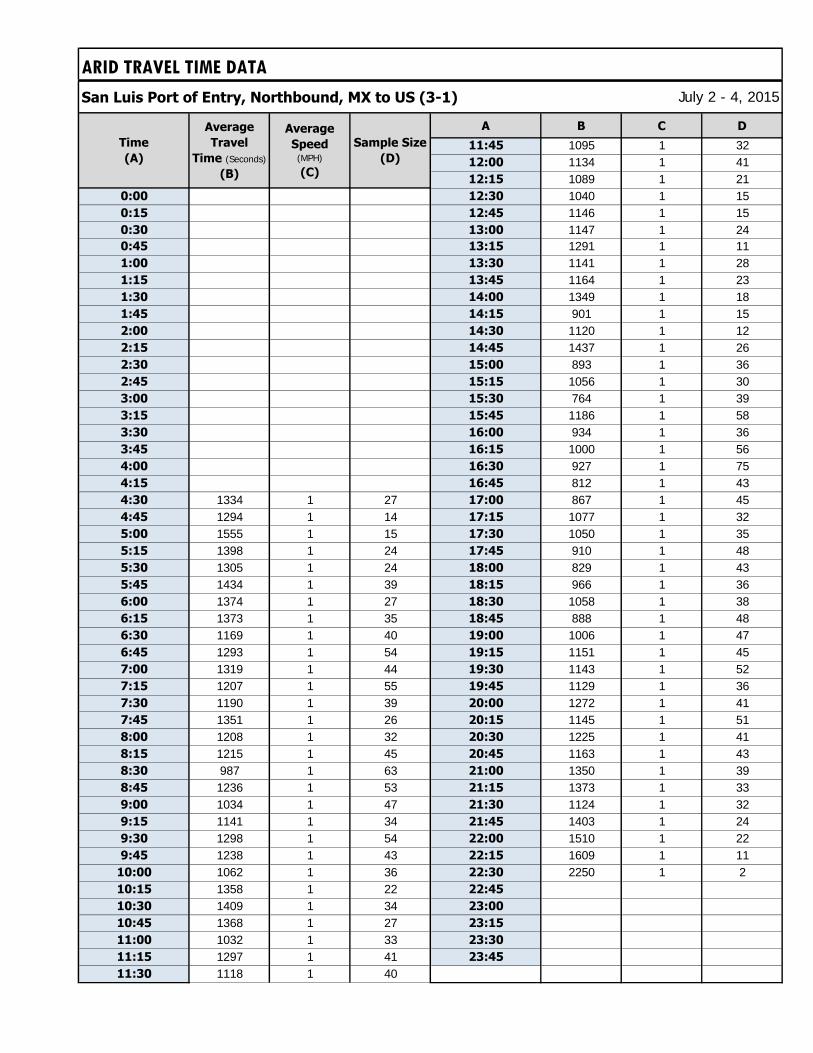
ARID TRAVEL TIME DATA
San Luis Port of Entry, Northbound, MX to US (3-1)
A B C D
11:45 1095 1 3212:00 1134 1 4112:15 1089 1 21
0:00 12:30 1040 1 150:15 12:45 1146 1 150:30 13:00 1147 1 240:45 13:15 1291 1 111:00 13:30 1141 1 281:15 13:45 1164 1 231:30 14:00 1349 1 181:45 14:15 901 1 152:00 14:30 1120 1 122:15 14:45 1437 1 262:30 15:00 893 1 362:45 15:15 1056 1 303:00 15:30 764 1 393:15 15:45 1186 1 583:30 16:00 934 1 363:45 16:15 1000 1 564:00 16:30 927 1 754:15 16:45 812 1 434:30 1334 1 27 17:00 867 1 454:45 1294 1 14 17:15 1077 1 325:00 1555 1 15 17:30 1050 1 355:15 1398 1 24 17:45 910 1 485:30 1305 1 24 18:00 829 1 435:45 1434 1 39 18:15 966 1 366:00 1374 1 27 18:30 1058 1 386:15 1373 1 35 18:45 888 1 486:30 1169 1 40 19:00 1006 1 476:45 1293 1 54 19:15 1151 1 457:00 1319 1 44 19:30 1143 1 527:15 1207 1 55 19:45 1129 1 367:30 1190 1 39 20:00 1272 1 417:45 1351 1 26 20:15 1145 1 518:00 1208 1 32 20:30 1225 1 418:15 1215 1 45 20:45 1163 1 438:30 987 1 63 21:00 1350 1 398:45 1236 1 53 21:15 1373 1 339:00 1034 1 47 21:30 1124 1 329:15 1141 1 34 21:45 1403 1 249:30 1298 1 54 22:00 1510 1 229:45 1238 1 43 22:15 1609 1 11
10:00 1062 1 36 22:30 2250 1 210:15 1358 1 22 22:45
10:30 1409 1 34 23:00
10:45 1368 1 27 23:15
11:00 1032 1 33 23:30
11:15 1297 1 41 23:45
11:30 1118 1 40
July 2 - 4, 2015
Time
(A)
Average
Travel
Time (Seconds)
(B)
Average
Speed (MPH)
(C)
Sample Size
(D)
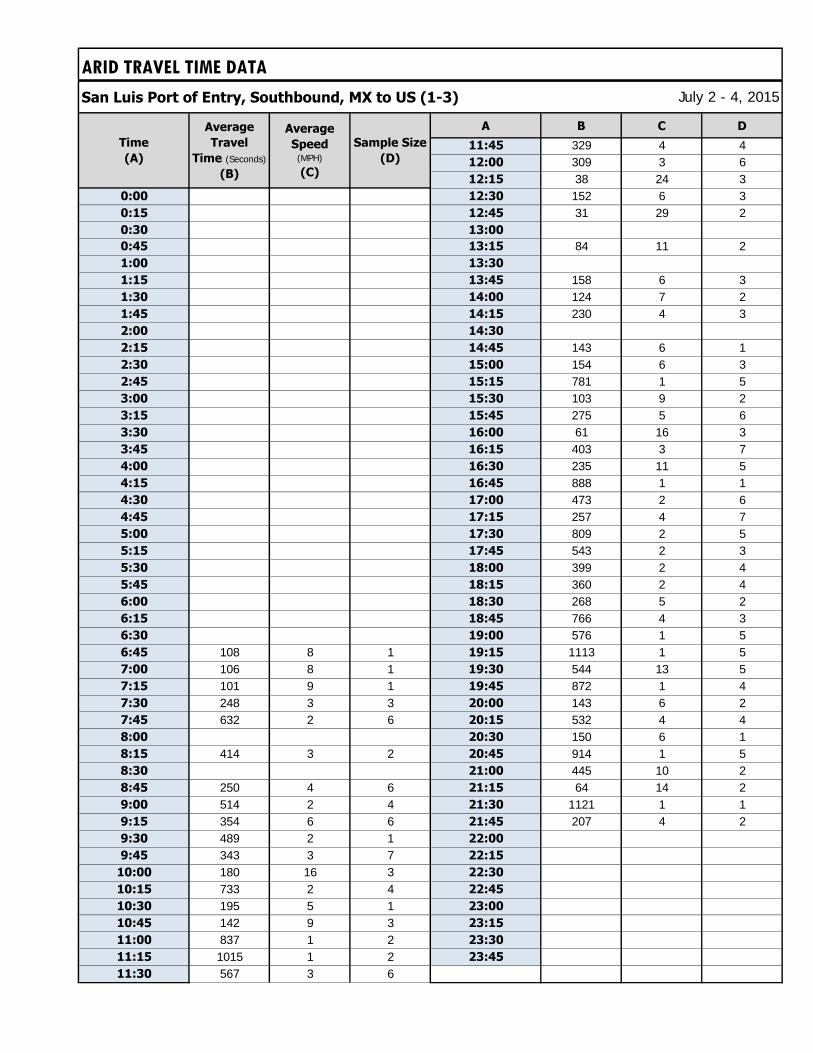
ARID TRAVEL TIME DATA
San Luis Port of Entry, Southbound, MX to US (1-3)
A B C D
11:45 329 4 412:00 309 3 612:15 38 24 3
0:00 12:30 152 6 30:15 12:45 31 29 20:30 13:00
0:45 13:15 84 11 21:00 13:30
1:15 13:45 158 6 31:30 14:00 124 7 21:45 14:15 230 4 32:00 14:30
2:15 14:45 143 6 12:30 15:00 154 6 32:45 15:15 781 1 53:00 15:30 103 9 23:15 15:45 275 5 63:30 16:00 61 16 33:45 16:15 403 3 74:00 16:30 235 11 54:15 16:45 888 1 14:30 17:00 473 2 64:45 17:15 257 4 75:00 17:30 809 2 55:15 17:45 543 2 35:30 18:00 399 2 45:45 18:15 360 2 46:00 18:30 268 5 26:15 18:45 766 4 36:30 19:00 576 1 56:45 108 8 1 19:15 1113 1 57:00 106 8 1 19:30 544 13 57:15 101 9 1 19:45 872 1 47:30 248 3 3 20:00 143 6 27:45 632 2 6 20:15 532 4 48:00 20:30 150 6 18:15 414 3 2 20:45 914 1 58:30 21:00 445 10 28:45 250 4 6 21:15 64 14 29:00 514 2 4 21:30 1121 1 19:15 354 6 6 21:45 207 4 29:30 489 2 1 22:00
9:45 343 3 7 22:15
10:00 180 16 3 22:30
10:15 733 2 4 22:45
10:30 195 5 1 23:00
10:45 142 9 3 23:15
11:00 837 1 2 23:30
11:15 1015 1 2 23:45
11:30 567 3 6
July 2 - 4, 2015
Time
(A)
Average
Travel
Time (Seconds)
(B)
Average
Speed (MPH)
(C)
Sample Size
(D)
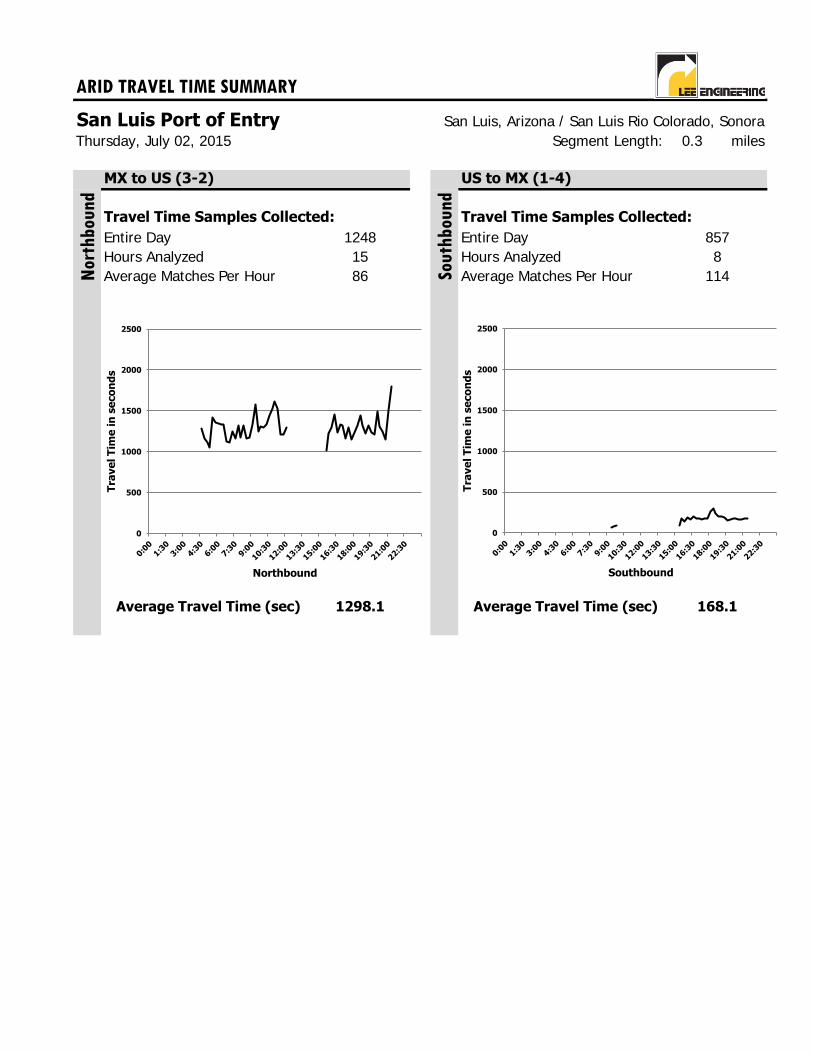
ARID TRAVEL TIME SUMMARY
San Luis Port of Entry San Luis, Arizona / San Luis Rio Colorado, SonoraSegment Length: 0.3 miles
MX to US (3-2) US to MX (1-4)
Travel Time Samples Collected: Travel Time Samples Collected:
Entire Day Entire DayHours Analyzed Hours AnalyzedAverage Matches Per Hour Average Matches Per Hour
Average Travel Time (sec) Average Travel Time (sec)
11486
1298.1 168.1
Nor
thbou
nd
Sou
thb
ound
Thursday, July 02, 2015
1248 85715 8
0
500
1000
1500
2000
2500
Tra
ve
l T
ime
in
se
co
nd
s
Northbound
0
500
1000
1500
2000
2500
Tra
ve
l T
ime
in
se
co
nd
s
Southbound

ARID TRAVEL TIME DATA
San Luis Port of Entry, Northbound, MX to US (3-2)
A B C D
11:45 1214 1 3012:00 1295 1 612:15
0:00 12:30
0:15 12:45
0:30 13:00
0:45 13:15
1:00 13:30
1:15 13:45
1:30 14:00
1:45 14:15
2:00 14:30
2:15 14:45
2:30 15:00
2:45 15:15
3:00 15:30 1020 1 53:15 15:45 1225 1 313:30 16:00 1296 1 283:45 16:15 1452 1 344:00 16:30 1229 1 254:15 16:45 1328 1 274:30 1281 1 23 17:00 1326 1 424:45 1159 1 9 17:15 1157 1 105:00 1110 1 5 17:30 1297 1 205:15 1046 1 10 17:45 1150 1 335:30 1420 1 11 18:00 1239 1 205:45 1355 1 30 18:15 1326 1 186:00 1340 1 13 18:30 1439 1 186:15 1328 1 28 18:45 1323 1 256:30 1329 1 19 19:00 1221 1 316:45 1130 1 25 19:15 1319 1 157:00 1114 1 26 19:30 1239 1 417:15 1244 1 21 19:45 1210 1 197:30 1159 1 29 20:00 1491 1 307:45 1324 1 14 20:15 1310 1 288:00 1170 1 20 20:30 1241 1 288:15 1315 1 25 20:45 1154 1 188:30 1167 1 34 21:00 1506 1 198:45 1170 1 29 21:15 1799 1 119:00 1336 1 25 21:30
9:15 1583 1 16 21:45
9:30 1248 1 27 22:00
9:45 1307 1 31 22:15
10:00 1295 1 28 22:30
10:15 1328 1 12 22:45
10:30 1439 1 25 23:00
10:45 1526 1 8 23:15
11:00 1621 1 18 23:30
11:15 1534 1 30 23:45
11:30 1212 1 45
Time
(A)
Average
Travel
Time (Seconds)
(B)
Average
Speed (MPH)
(C)
Sample Size
(D)
Thursday, July 02, 2015
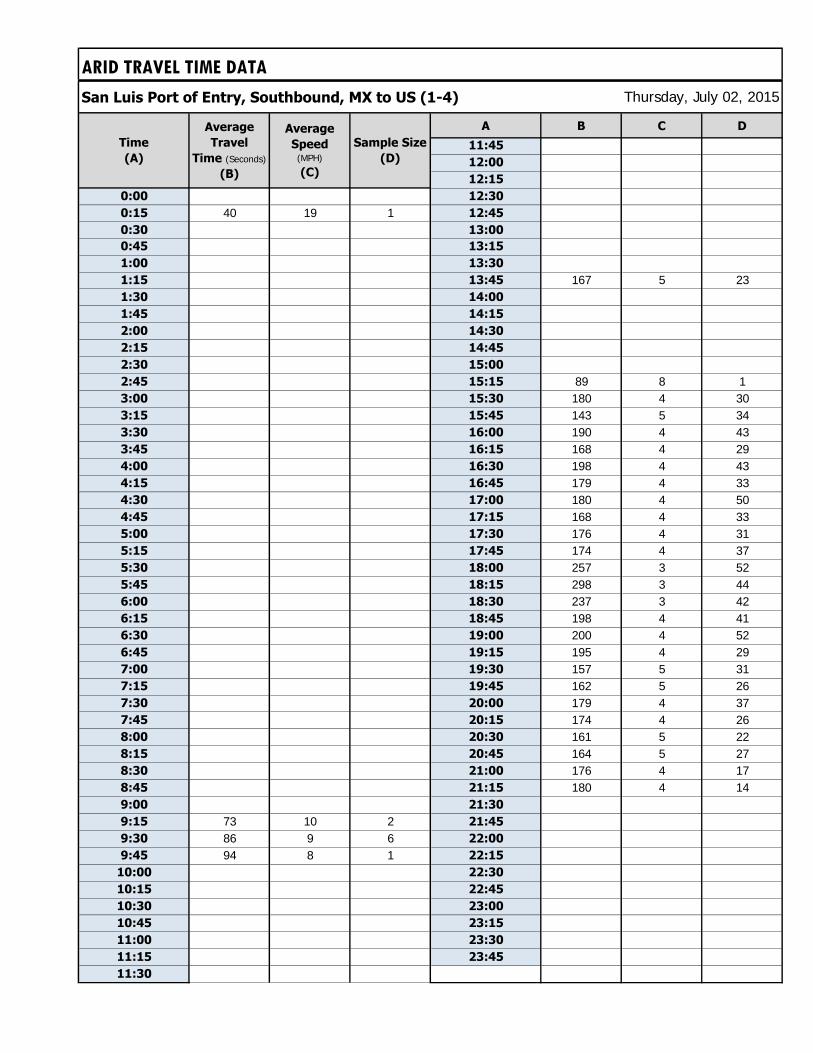
ARID TRAVEL TIME DATA
San Luis Port of Entry, Southbound, MX to US (1-4)
A B C D
11:45
12:00
12:15
0:00 12:30
0:15 40 19 1 12:45
0:30 13:00
0:45 13:15
1:00 13:30
1:15 13:45 167 5 231:30 14:00
1:45 14:15
2:00 14:30
2:15 14:45
2:30 15:00
2:45 15:15 89 8 13:00 15:30 180 4 303:15 15:45 143 5 343:30 16:00 190 4 433:45 16:15 168 4 294:00 16:30 198 4 434:15 16:45 179 4 334:30 17:00 180 4 504:45 17:15 168 4 335:00 17:30 176 4 315:15 17:45 174 4 375:30 18:00 257 3 525:45 18:15 298 3 446:00 18:30 237 3 426:15 18:45 198 4 416:30 19:00 200 4 526:45 19:15 195 4 297:00 19:30 157 5 317:15 19:45 162 5 267:30 20:00 179 4 377:45 20:15 174 4 268:00 20:30 161 5 228:15 20:45 164 5 278:30 21:00 176 4 178:45 21:15 180 4 149:00 21:30
9:15 73 10 2 21:45
9:30 86 9 6 22:00
9:45 94 8 1 22:15
10:00 22:30
10:15 22:45
10:30 23:00
10:45 23:15
11:00 23:30
11:15 23:45
11:30
Average
Speed (MPH)
(C)
Sample Size
(D)
Average
Travel
Time (Seconds)
(B)
Time
(A)
Thursday, July 02, 2015
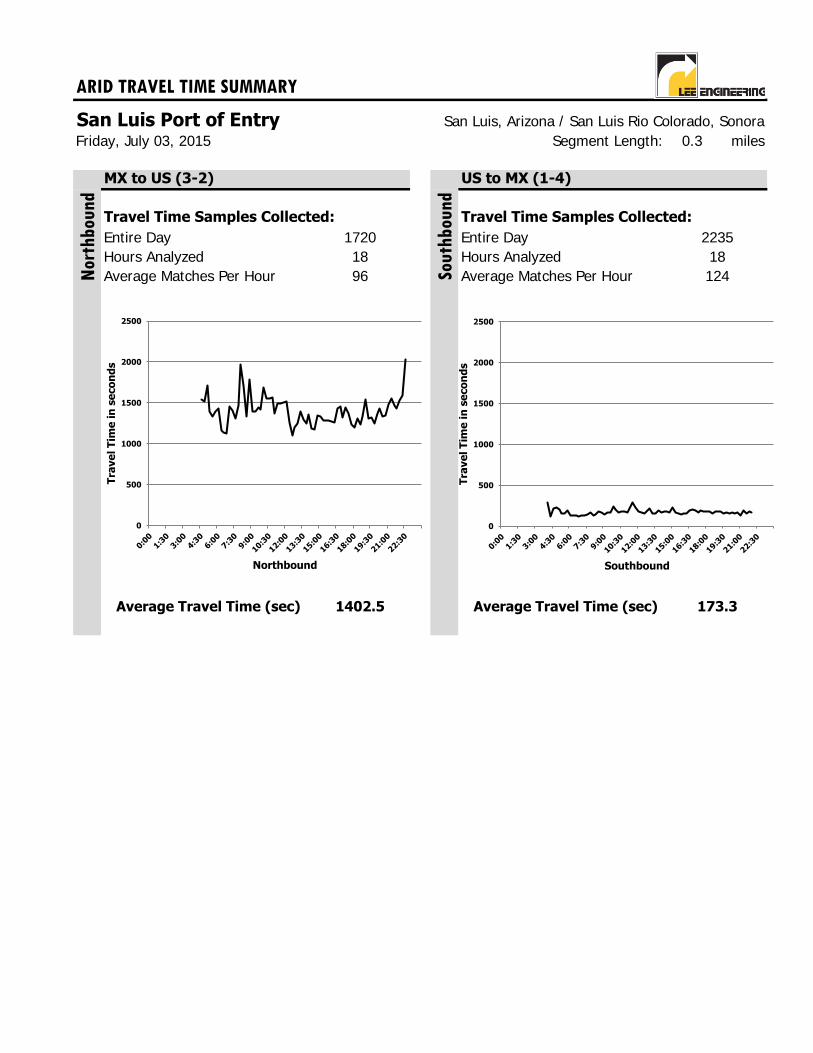
ARID TRAVEL TIME SUMMARY
San Luis Port of Entry San Luis, Arizona / San Luis Rio Colorado, SonoraSegment Length: 0.3 miles
MX to US (3-2) US to MX (1-4)
Travel Time Samples Collected: Travel Time Samples Collected:
Entire Day Entire DayHours Analyzed Hours AnalyzedAverage Matches Per Hour Average Matches Per Hour
Average Travel Time (sec) Average Travel Time (sec)
12496
1402.5 173.3
Nor
thbou
nd
Sou
thb
ound
Friday, July 03, 2015
1720 223518 18
0
500
1000
1500
2000
2500
Tra
ve
l T
ime
in
se
co
nd
s
Northbound
0
500
1000
1500
2000
2500
Tra
ve
l T
ime
in
se
co
nd
s
Southbound
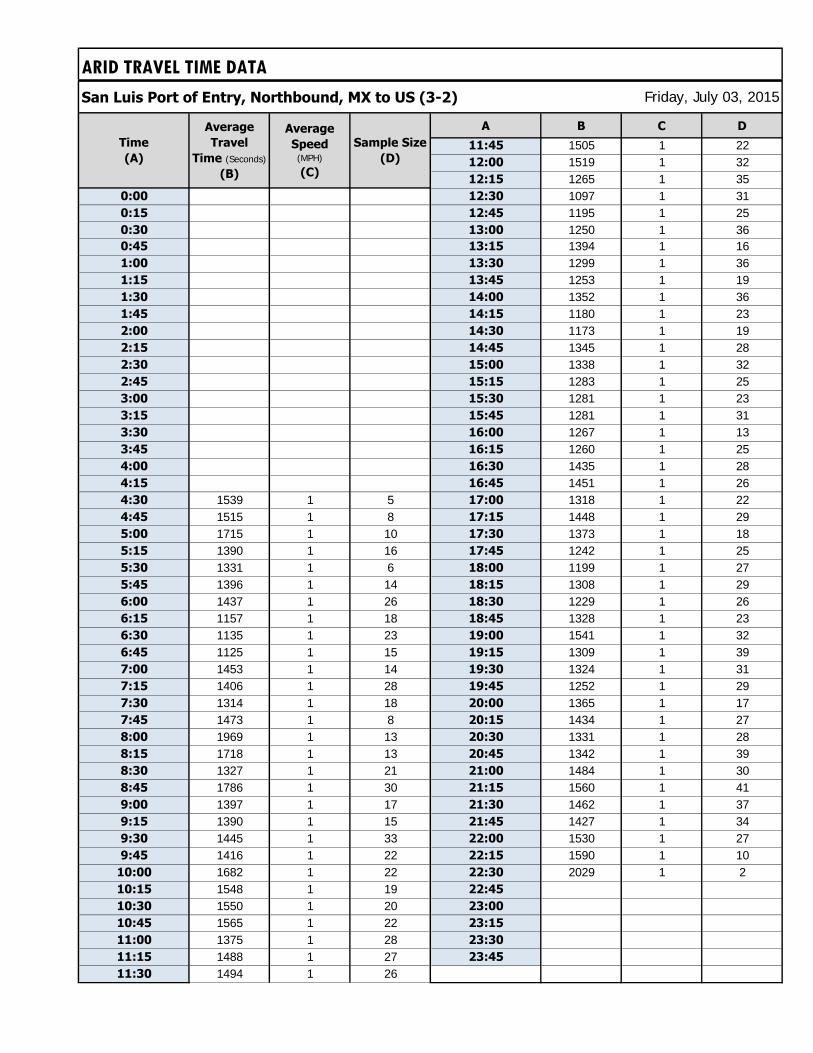
ARID TRAVEL TIME DATA
San Luis Port of Entry, Northbound, MX to US (3-2)
A B C D
11:45 1505 1 2212:00 1519 1 3212:15 1265 1 35
0:00 12:30 1097 1 310:15 12:45 1195 1 250:30 13:00 1250 1 360:45 13:15 1394 1 161:00 13:30 1299 1 361:15 13:45 1253 1 191:30 14:00 1352 1 361:45 14:15 1180 1 232:00 14:30 1173 1 192:15 14:45 1345 1 282:30 15:00 1338 1 322:45 15:15 1283 1 253:00 15:30 1281 1 233:15 15:45 1281 1 313:30 16:00 1267 1 133:45 16:15 1260 1 254:00 16:30 1435 1 284:15 16:45 1451 1 264:30 1539 1 5 17:00 1318 1 224:45 1515 1 8 17:15 1448 1 295:00 1715 1 10 17:30 1373 1 185:15 1390 1 16 17:45 1242 1 255:30 1331 1 6 18:00 1199 1 275:45 1396 1 14 18:15 1308 1 296:00 1437 1 26 18:30 1229 1 266:15 1157 1 18 18:45 1328 1 236:30 1135 1 23 19:00 1541 1 326:45 1125 1 15 19:15 1309 1 397:00 1453 1 14 19:30 1324 1 317:15 1406 1 28 19:45 1252 1 297:30 1314 1 18 20:00 1365 1 177:45 1473 1 8 20:15 1434 1 278:00 1969 1 13 20:30 1331 1 288:15 1718 1 13 20:45 1342 1 398:30 1327 1 21 21:00 1484 1 308:45 1786 1 30 21:15 1560 1 419:00 1397 1 17 21:30 1462 1 379:15 1390 1 15 21:45 1427 1 349:30 1445 1 33 22:00 1530 1 279:45 1416 1 22 22:15 1590 1 10
10:00 1682 1 22 22:30 2029 1 210:15 1548 1 19 22:45
10:30 1550 1 20 23:00
10:45 1565 1 22 23:15
11:00 1375 1 28 23:30
11:15 1488 1 27 23:45
11:30 1494 1 26
Time
(A)
Average
Travel
Time (Seconds)
(B)
Average
Speed (MPH)
(C)
Sample Size
(D)
Friday, July 03, 2015

ARID TRAVEL TIME DATA
San Luis Port of Entry, Southbound, MX to US (1-4)
A B C D
11:45 228 3 3912:00 177 4 3412:15 168 4 47
0:00 12:30 156 5 270:15 12:45 186 4 470:30 13:00 214 4 420:45 13:15 156 5 261:00 13:30 150 5 301:15 13:45 186 4 331:30 14:00 163 5 411:45 14:15 182 4 482:00 14:30 182 4 352:15 14:45 162 5 432:30 15:00 229 3 472:45 15:15 162 5 383:00 15:30 161 5 473:15 15:45 148 5 453:30 16:00 152 5 413:45 16:15 154 5 334:00 290 3 3 16:30 187 4 434:15 117 6 1 16:45 201 4 574:30 219 3 1 17:00 193 4 554:45 229 3 2 17:15 162 5 475:00 208 4 3 17:30 189 4 495:15 151 5 9 17:45 176 4 525:30 152 5 8 18:00 175 4 405:45 194 4 8 18:15 177 4 526:00 129 6 4 18:30 158 5 336:15 130 6 6 18:45 183 4 526:30 134 6 6 19:00 184 4 466:45 117 6 10 19:15 180 4 437:00 126 6 7 19:30 152 5 417:15 135 6 10 19:45 163 5 347:30 142 5 18 20:00 151 5 337:45 165 5 23 20:15 168 4 328:00 136 6 13 20:30 156 5 378:15 137 6 18 20:45 167 5 348:30 184 4 15 21:00 133 6 298:45 162 5 30 21:15 189 4 289:00 146 5 27 21:30 152 5 249:15 171 4 26 21:45 179 4 239:30 166 5 36 22:00 171 4 209:45 243 3 45 22:15
10:00 201 4 40 22:30
10:15 168 4 34 22:45
10:30 184 4 32 23:00
10:45 181 4 45 23:15
11:00 162 5 31 23:30
11:15 220 3 33 23:45
11:30 289 3 44
Average
Speed (MPH)
(C)
Sample Size
(D)
Average
Travel
Time (Seconds)
(B)
Time
(A)
Friday, July 03, 2015
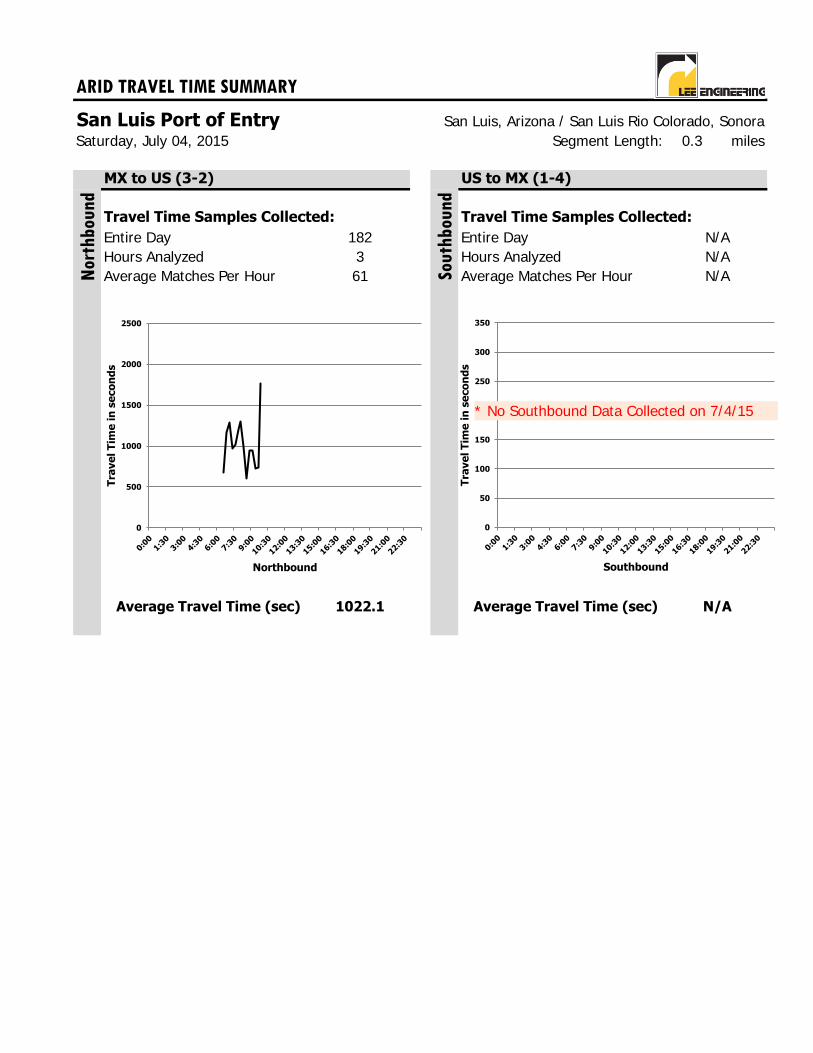
ARID TRAVEL TIME SUMMARY
San Luis Port of Entry San Luis, Arizona / San Luis Rio Colorado, SonoraSegment Length: 0.3 miles
MX to US (3-2) US to MX (1-4)
Travel Time Samples Collected: Travel Time Samples Collected:
Entire Day Entire DayHours Analyzed Hours AnalyzedAverage Matches Per Hour Average Matches Per Hour
Average Travel Time (sec) Average Travel Time (sec)
N/A61
1022.1 N/A
Nor
thbou
nd
Sou
thb
ound
Saturday, July 04, 2015
182 N/A3 N/A
0
500
1000
1500
2000
2500
Tra
ve
l T
ime
in
se
co
nd
s
Northbound
0
50
100
150
200
250
300
350
Tra
ve
l T
ime
in
se
co
nd
s
Southbound
* No Southbound Data Collected on 7/4/15

ARID TRAVEL TIME DATA
San Luis Port of Entry, Northbound, MX to US (3-2)
A B C D
11:45
12:00
12:15
0:00 12:30
0:15 12:45
0:30 13:00
0:45 13:15
1:00 13:30
1:15 13:45
1:30 14:00
1:45 14:15
2:00 14:30
2:15 14:45
2:30 15:00
2:45 15:15
3:00 15:30
3:15 15:45
3:30 16:00
3:45 16:15
4:00 16:30
4:15 16:45
4:30 17:00
4:45 17:15
5:00 17:30
5:15 17:45
5:30 18:00
5:45 18:15
6:00 18:30
6:15 18:45
6:30 673 2 10 19:00
6:45 1164 1 10 19:15
7:00 1282 1 12 19:30
7:15 970 1 11 19:45
7:30 1017 1 12 20:00
7:45 1197 1 9 20:15
8:00 1301 1 6 20:30
8:15 989 1 18 20:45
8:30 607 2 29 21:00
8:45 944 1 17 21:15
9:00 939 1 20 21:30
9:15 727 2 15 21:45
9:30 738 2 8 22:00
9:45 1762 1 5 22:15
10:00 22:30
10:15 22:45
10:30 23:00
10:45 23:15
11:00 23:30
11:15 23:45
11:30
Time
(A)
Average
Travel
Time (Seconds)
(B)
Average
Speed (MPH)
(C)
Sample Size
(D)
Saturday, July 04, 2015
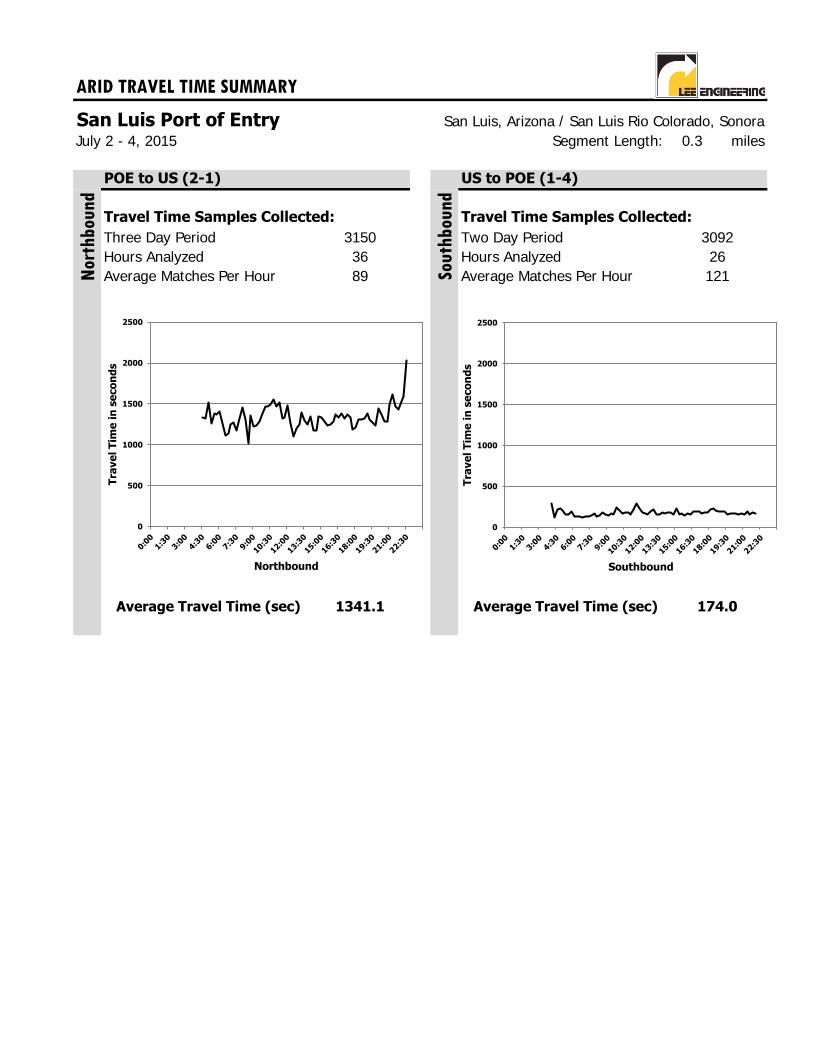
ARID TRAVEL TIME SUMMARY
San Luis Port of Entry San Luis, Arizona / San Luis Rio Colorado, SonoraSegment Length: 0.3 miles
POE to US (2-1) US to POE (1-4)
Travel Time Samples Collected: Travel Time Samples Collected:
Three Day Period Two Day PeriodHours Analyzed Hours AnalyzedAverage Matches Per Hour Average Matches Per Hour
Average Travel Time (sec) Average Travel Time (sec)
July 2 - 4, 2015
Nor
thbou
nd
Sou
thb
ound
3150 309236 2689 121
1341.1 174.0
0
500
1000
1500
2000
2500
Tra
ve
l T
ime
in
se
co
nd
s
Northbound
0
500
1000
1500
2000
2500
Tra
ve
l T
ime
in
se
co
nd
s
Southbound
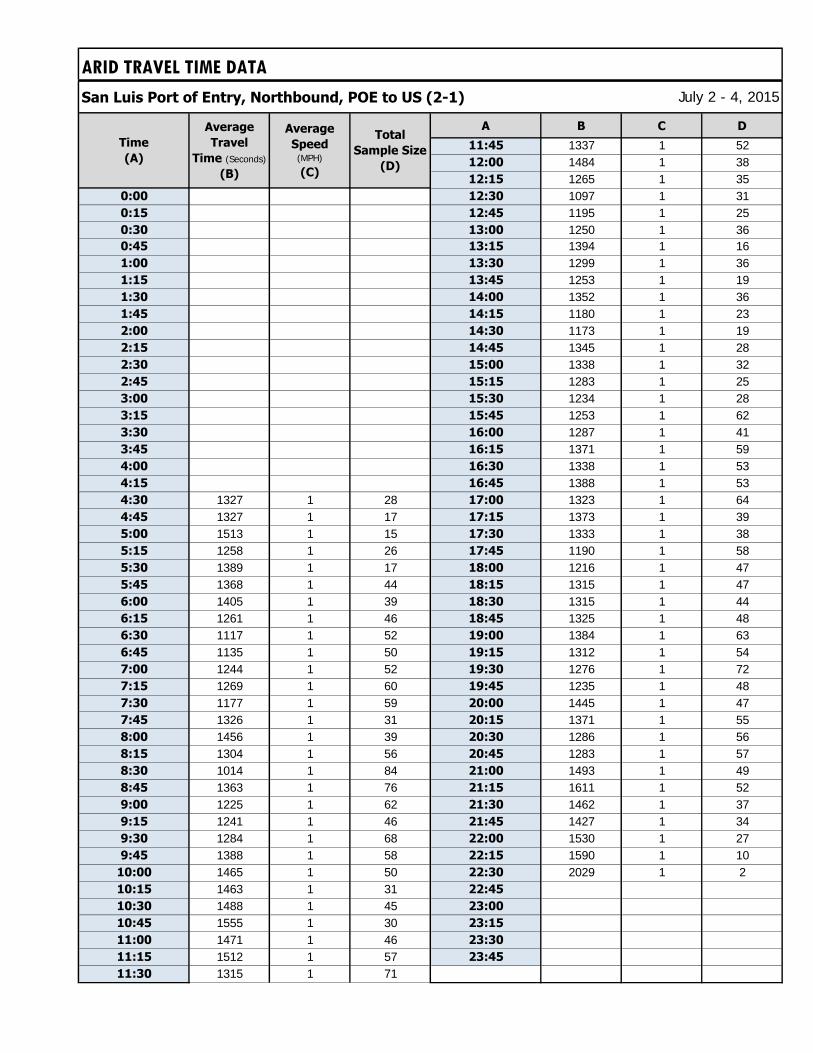
ARID TRAVEL TIME DATA
San Luis Port of Entry, Northbound, POE to US (2-1)
A B C D
11:45 1337 1 5212:00 1484 1 3812:15 1265 1 35
0:00 12:30 1097 1 310:15 12:45 1195 1 250:30 13:00 1250 1 360:45 13:15 1394 1 161:00 13:30 1299 1 361:15 13:45 1253 1 191:30 14:00 1352 1 361:45 14:15 1180 1 232:00 14:30 1173 1 192:15 14:45 1345 1 282:30 15:00 1338 1 322:45 15:15 1283 1 253:00 15:30 1234 1 283:15 15:45 1253 1 623:30 16:00 1287 1 413:45 16:15 1371 1 594:00 16:30 1338 1 534:15 16:45 1388 1 534:30 1327 1 28 17:00 1323 1 644:45 1327 1 17 17:15 1373 1 395:00 1513 1 15 17:30 1333 1 385:15 1258 1 26 17:45 1190 1 585:30 1389 1 17 18:00 1216 1 475:45 1368 1 44 18:15 1315 1 476:00 1405 1 39 18:30 1315 1 446:15 1261 1 46 18:45 1325 1 486:30 1117 1 52 19:00 1384 1 636:45 1135 1 50 19:15 1312 1 547:00 1244 1 52 19:30 1276 1 727:15 1269 1 60 19:45 1235 1 487:30 1177 1 59 20:00 1445 1 477:45 1326 1 31 20:15 1371 1 558:00 1456 1 39 20:30 1286 1 568:15 1304 1 56 20:45 1283 1 578:30 1014 1 84 21:00 1493 1 498:45 1363 1 76 21:15 1611 1 529:00 1225 1 62 21:30 1462 1 379:15 1241 1 46 21:45 1427 1 349:30 1284 1 68 22:00 1530 1 279:45 1388 1 58 22:15 1590 1 10
10:00 1465 1 50 22:30 2029 1 210:15 1463 1 31 22:45
10:30 1488 1 45 23:00
10:45 1555 1 30 23:15
11:00 1471 1 46 23:30
11:15 1512 1 57 23:45
11:30 1315 1 71
Average
Travel
Time (Seconds)
(B)
Average
Speed (MPH)
(C)
Total
Sample Size
(D)
July 2 - 4, 2015
Time
(A)
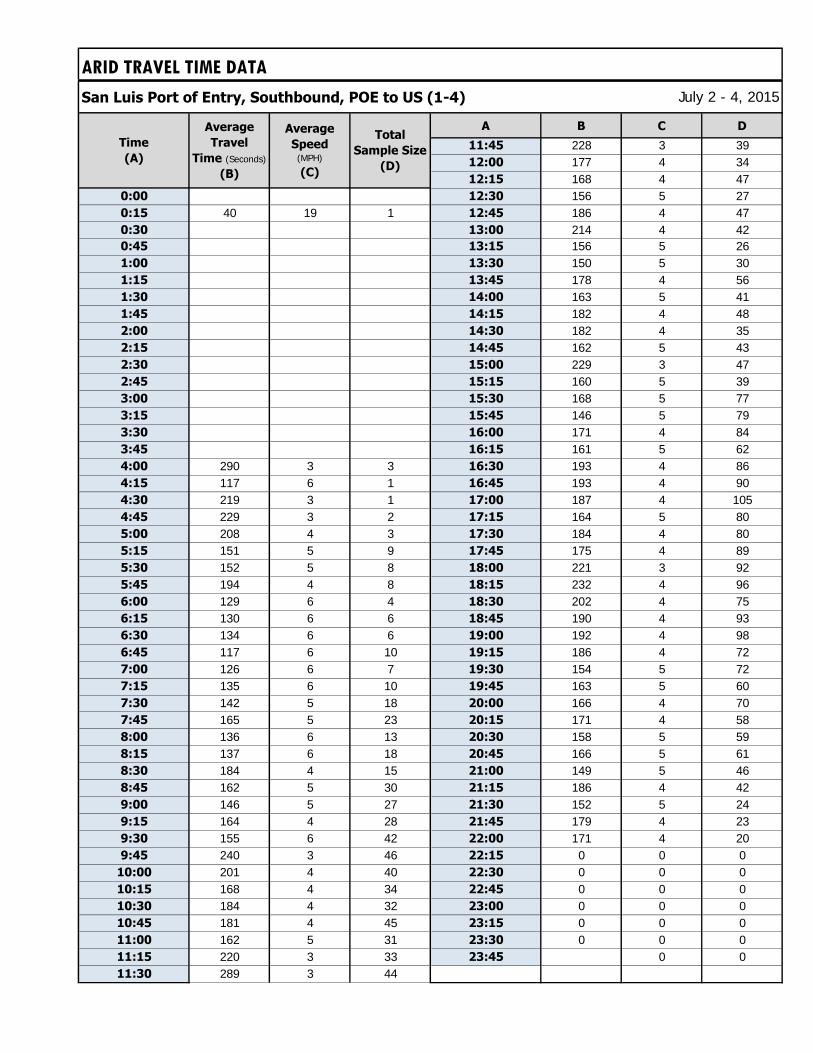
ARID TRAVEL TIME DATA
San Luis Port of Entry, Southbound, POE to US (1-4)
A B C D
11:45 228 3 3912:00 177 4 3412:15 168 4 47
0:00 12:30 156 5 270:15 40 19 1 12:45 186 4 470:30 13:00 214 4 420:45 13:15 156 5 261:00 13:30 150 5 301:15 13:45 178 4 561:30 14:00 163 5 411:45 14:15 182 4 482:00 14:30 182 4 352:15 14:45 162 5 432:30 15:00 229 3 472:45 15:15 160 5 393:00 15:30 168 5 773:15 15:45 146 5 793:30 16:00 171 4 843:45 16:15 161 5 624:00 290 3 3 16:30 193 4 864:15 117 6 1 16:45 193 4 904:30 219 3 1 17:00 187 4 1054:45 229 3 2 17:15 164 5 805:00 208 4 3 17:30 184 4 805:15 151 5 9 17:45 175 4 895:30 152 5 8 18:00 221 3 925:45 194 4 8 18:15 232 4 966:00 129 6 4 18:30 202 4 756:15 130 6 6 18:45 190 4 936:30 134 6 6 19:00 192 4 986:45 117 6 10 19:15 186 4 727:00 126 6 7 19:30 154 5 727:15 135 6 10 19:45 163 5 607:30 142 5 18 20:00 166 4 707:45 165 5 23 20:15 171 4 588:00 136 6 13 20:30 158 5 598:15 137 6 18 20:45 166 5 618:30 184 4 15 21:00 149 5 468:45 162 5 30 21:15 186 4 429:00 146 5 27 21:30 152 5 249:15 164 4 28 21:45 179 4 239:30 155 6 42 22:00 171 4 209:45 240 3 46 22:15 0 0 0
10:00 201 4 40 22:30 0 0 010:15 168 4 34 22:45 0 0 010:30 184 4 32 23:00 0 0 010:45 181 4 45 23:15 0 0 011:00 162 5 31 23:30 0 0 011:15 220 3 33 23:45 0 011:30 289 3 44
Time
(A)
July 2 - 4, 2015
Average
Travel
Time (Seconds)
(B)
Average
Speed (MPH)
(C)
Total
Sample Size
(D)

ARID TRAVEL TIME SUMMARY
Lukeville Port of Entry Lukeville, Arizona / Sonoyta, SonoraSegment Length: 0.14 miles
POE to US (2-1) US to POE (1-2)
Travel Time Samples Collected: Travel Time Samples Collected:
Entire Day Entire DayHours Analyzed Hours AnalyzedAverage Matches Per Hour Average Matches Per Hour
Average Travel Time (sec) Average Travel Time (sec)
Tuesday, June 30, 2015
498 19315 1533
177.8 55.3
Nor
thbou
nd
Sou
thb
ound
13
0
500
1000
1500
2000
2500
Tra
ve
l T
ime
in
se
co
nd
s
Northbound
0
500
1000
1500
2000
2500
Tra
ve
l T
ime
in
se
co
nd
s
Southbound
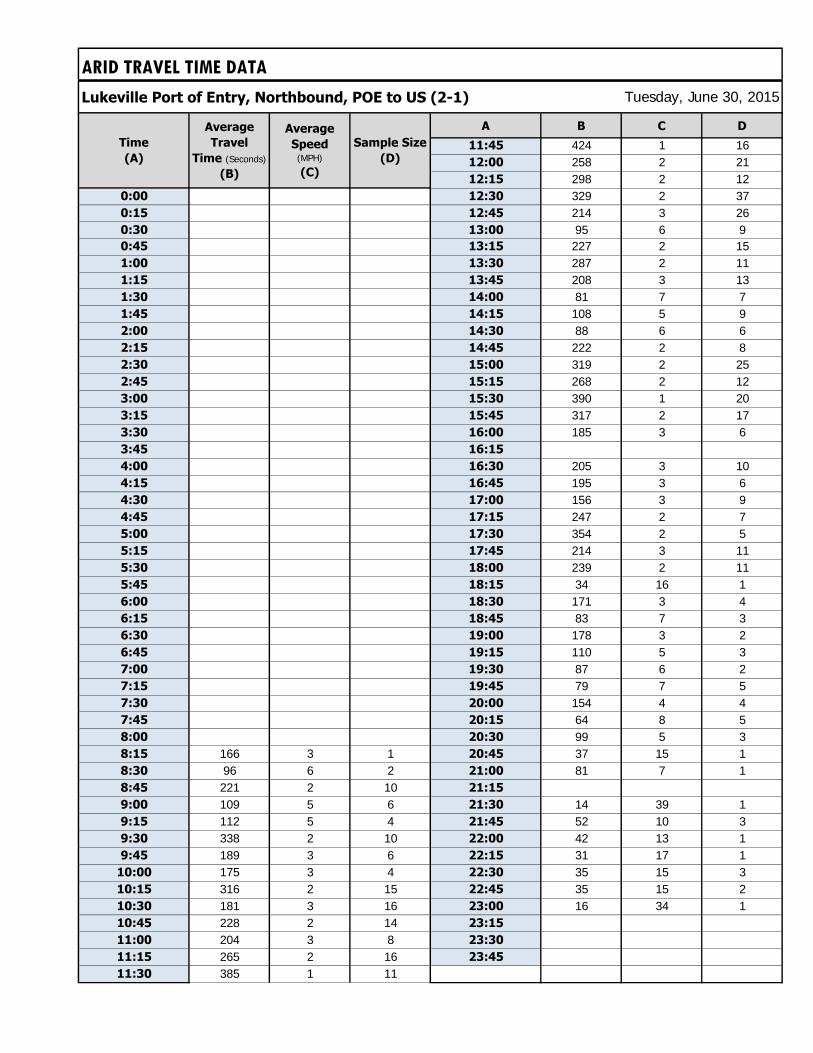
ARID TRAVEL TIME DATA
Lukeville Port of Entry, Northbound, POE to US (2-1)
A B C D
11:45 424 1 1612:00 258 2 2112:15 298 2 12
0:00 12:30 329 2 370:15 12:45 214 3 260:30 13:00 95 6 90:45 13:15 227 2 151:00 13:30 287 2 111:15 13:45 208 3 131:30 14:00 81 7 71:45 14:15 108 5 92:00 14:30 88 6 62:15 14:45 222 2 82:30 15:00 319 2 252:45 15:15 268 2 123:00 15:30 390 1 203:15 15:45 317 2 173:30 16:00 185 3 63:45 16:15
4:00 16:30 205 3 104:15 16:45 195 3 64:30 17:00 156 3 94:45 17:15 247 2 75:00 17:30 354 2 55:15 17:45 214 3 115:30 18:00 239 2 115:45 18:15 34 16 16:00 18:30 171 3 46:15 18:45 83 7 36:30 19:00 178 3 26:45 19:15 110 5 37:00 19:30 87 6 27:15 19:45 79 7 57:30 20:00 154 4 47:45 20:15 64 8 58:00 20:30 99 5 38:15 166 3 1 20:45 37 15 18:30 96 6 2 21:00 81 7 18:45 221 2 10 21:15
9:00 109 5 6 21:30 14 39 19:15 112 5 4 21:45 52 10 39:30 338 2 10 22:00 42 13 19:45 189 3 6 22:15 31 17 1
10:00 175 3 4 22:30 35 15 310:15 316 2 15 22:45 35 15 210:30 181 3 16 23:00 16 34 110:45 228 2 14 23:15
11:00 204 3 8 23:30
11:15 265 2 16 23:45
11:30 385 1 11
Tuesday, June 30, 2015
Time
(A)
Average
Travel
Time (Seconds)
(B)
Average
Speed (MPH)
(C)
Sample Size
(D)

ARID TRAVEL TIME DATA
Lukeville Port of Entry, Southbound, POE to US (1-2)
A B C D
11:45 147 4 212:00 108 5 212:15 67 8 10
0:00 12:30 66 8 20:15 12:45 57 9 90:30 13:00 107 5 40:45 13:15 33 16 71:00 13:30 111 5 81:15 13:45 41 13 31:30 14:00 42 13 41:45 14:15 23 23 42:00 14:30 26 21 32:15 14:45 110 5 22:30 15:00 52 10 72:45 15:15 39 14 73:00 15:30 35 15 113:15 15:45 69 8 33:30 16:00 68 8 43:45 16:15 30 18 14:00 16:30 123 4 64:15 16:45 40 14 64:30 17:00 39 14 14:45 17:15 53 10 25:00 17:30
5:15 17:45 44 12 15:30 18:00 45 12 15:45 18:15 42 13 36:00 18:30
6:15 18:45 42 13 36:30 19:00 38 14 56:45 19:15 31 17 17:00 19:30 35 15 37:15 19:45 57 9 17:30 20:00 31 17 17:45 20:15 31 17 48:00 12 45 1 20:30 49 11 28:15 37 15 2 20:45
8:30 21:00 32 17 28:45 32 17 4 21:15 31 17 19:00 91 6 2 21:30 27 20 49:15 70 8 5 21:45 56 10 29:30 34 16 5 22:00
9:45 11 49 1 22:15 15 36 110:00 22:30 45 12 110:15 43 13 4 22:45 26 21 210:30 128 4 5 23:00 46 12 110:45 42 13 3 23:15 61 9 311:00 40 14 2 23:30
11:15 132 4 4 23:45
11:30 157 3 5
Tuesday, June 30, 2015
Time
(A)
Average
Speed (MPH)
(C)
Sample Size
(D)
Average
Travel
Time (Seconds)
(B)
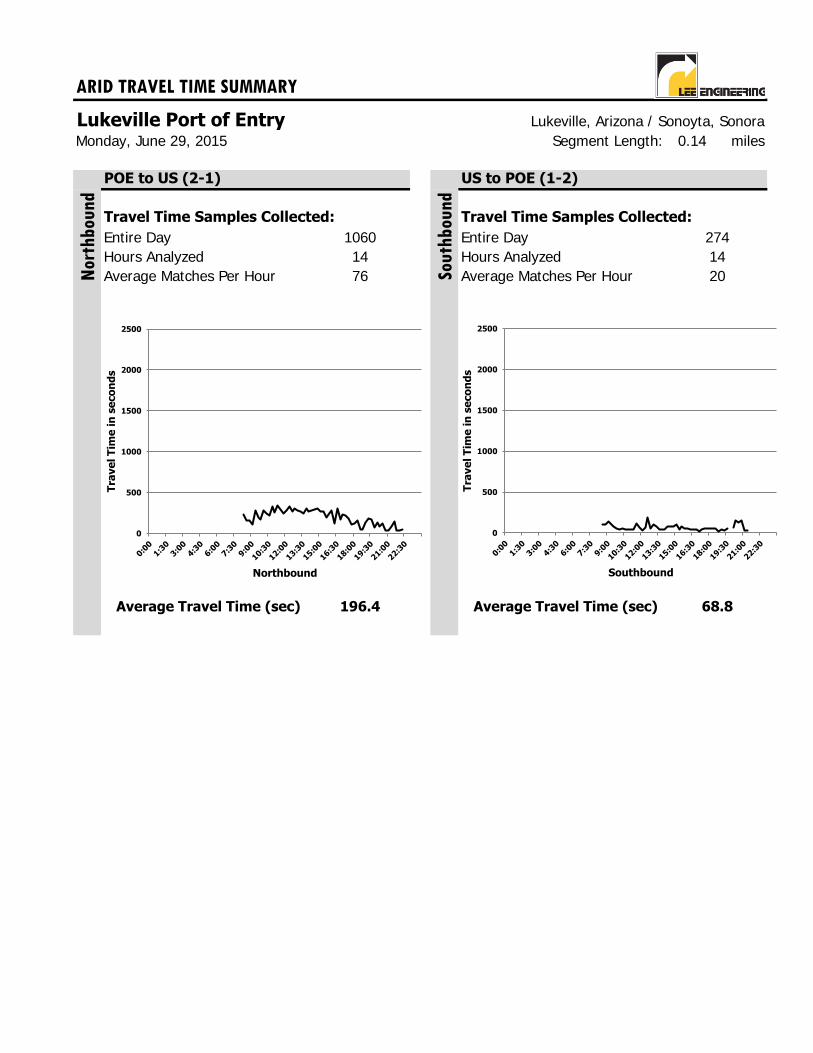
ARID TRAVEL TIME SUMMARY
Lukeville Port of Entry Lukeville, Arizona / Sonoyta, SonoraSegment Length: 0.14 miles
POE to US (2-1) US to POE (1-2)
Travel Time Samples Collected: Travel Time Samples Collected:
Entire Day Entire DayHours Analyzed Hours AnalyzedAverage Matches Per Hour Average Matches Per Hour
Average Travel Time (sec) Average Travel Time (sec)
Monday, June 29, 2015
1060 27414 1476
196.4 68.8
Nor
thbou
nd
Sou
thb
ound
20
0
500
1000
1500
2000
2500
Tra
ve
l T
ime
in
se
co
nd
s
Northbound
0
500
1000
1500
2000
2500
Tra
ve
l T
ime
in
se
co
nd
s
Southbound
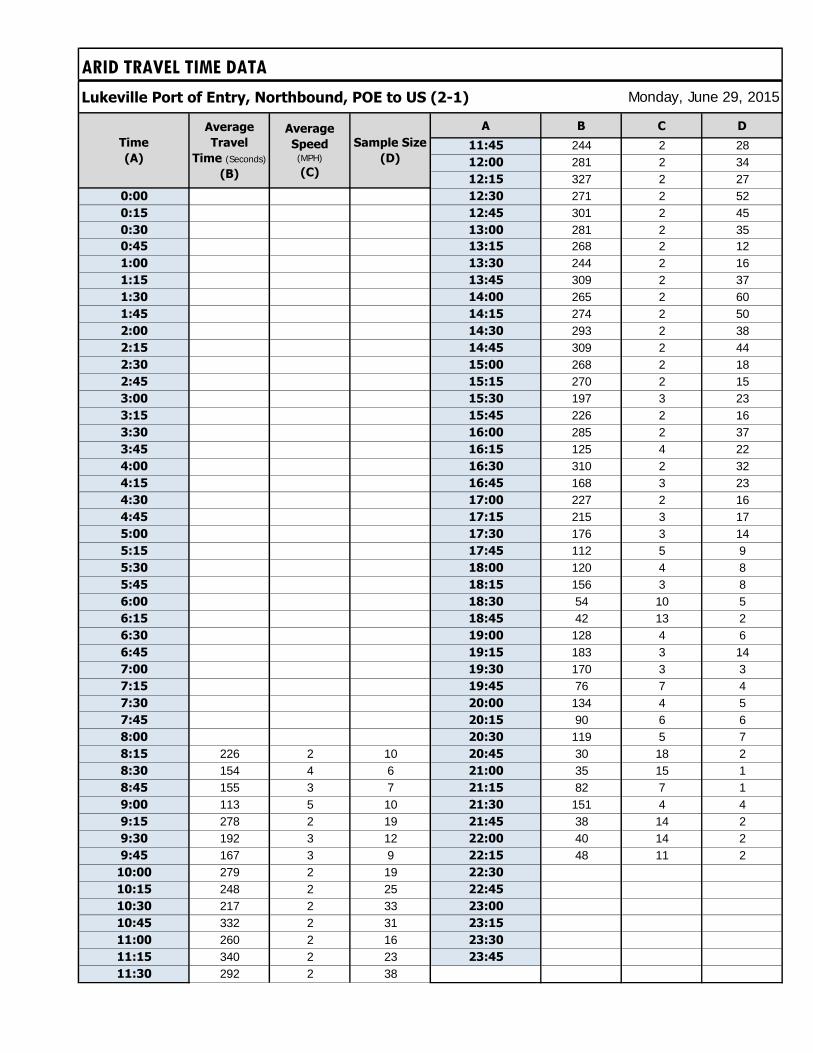
ARID TRAVEL TIME DATA
Lukeville Port of Entry, Northbound, POE to US (2-1)
A B C D
11:45 244 2 2812:00 281 2 3412:15 327 2 27
0:00 12:30 271 2 520:15 12:45 301 2 450:30 13:00 281 2 350:45 13:15 268 2 121:00 13:30 244 2 161:15 13:45 309 2 371:30 14:00 265 2 601:45 14:15 274 2 502:00 14:30 293 2 382:15 14:45 309 2 442:30 15:00 268 2 182:45 15:15 270 2 153:00 15:30 197 3 233:15 15:45 226 2 163:30 16:00 285 2 373:45 16:15 125 4 224:00 16:30 310 2 324:15 16:45 168 3 234:30 17:00 227 2 164:45 17:15 215 3 175:00 17:30 176 3 145:15 17:45 112 5 95:30 18:00 120 4 85:45 18:15 156 3 86:00 18:30 54 10 56:15 18:45 42 13 26:30 19:00 128 4 66:45 19:15 183 3 147:00 19:30 170 3 37:15 19:45 76 7 47:30 20:00 134 4 57:45 20:15 90 6 68:00 20:30 119 5 78:15 226 2 10 20:45 30 18 28:30 154 4 6 21:00 35 15 18:45 155 3 7 21:15 82 7 19:00 113 5 10 21:30 151 4 49:15 278 2 19 21:45 38 14 29:30 192 3 12 22:00 40 14 29:45 167 3 9 22:15 48 11 2
10:00 279 2 19 22:30
10:15 248 2 25 22:45
10:30 217 2 33 23:00
10:45 332 2 31 23:15
11:00 260 2 16 23:30
11:15 340 2 23 23:45
11:30 292 2 38
Monday, June 29, 2015
Time
(A)
Average
Travel
Time (Seconds)
(B)
Average
Speed (MPH)
(C)
Sample Size
(D)
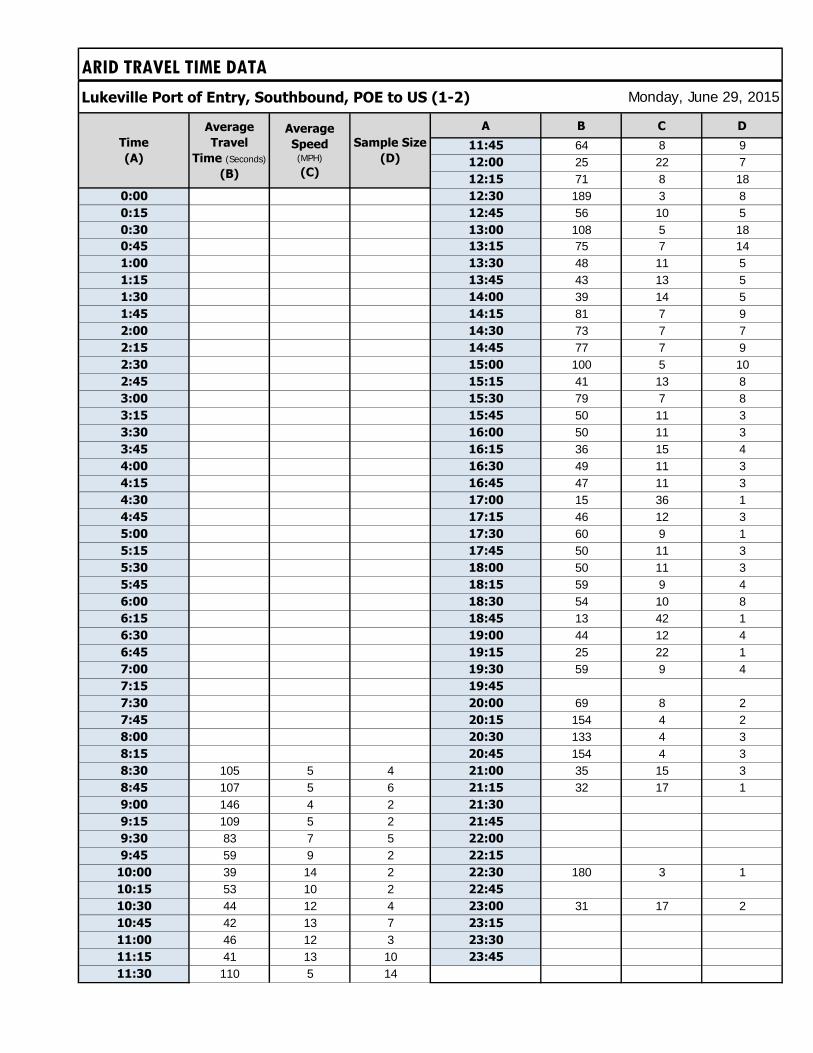
ARID TRAVEL TIME DATA
Lukeville Port of Entry, Southbound, POE to US (1-2)
A B C D
11:45 64 8 912:00 25 22 712:15 71 8 18
0:00 12:30 189 3 80:15 12:45 56 10 50:30 13:00 108 5 180:45 13:15 75 7 141:00 13:30 48 11 51:15 13:45 43 13 51:30 14:00 39 14 51:45 14:15 81 7 92:00 14:30 73 7 72:15 14:45 77 7 92:30 15:00 100 5 102:45 15:15 41 13 83:00 15:30 79 7 83:15 15:45 50 11 33:30 16:00 50 11 33:45 16:15 36 15 44:00 16:30 49 11 34:15 16:45 47 11 34:30 17:00 15 36 14:45 17:15 46 12 35:00 17:30 60 9 15:15 17:45 50 11 35:30 18:00 50 11 35:45 18:15 59 9 46:00 18:30 54 10 86:15 18:45 13 42 16:30 19:00 44 12 46:45 19:15 25 22 17:00 19:30 59 9 47:15 19:45
7:30 20:00 69 8 27:45 20:15 154 4 28:00 20:30 133 4 38:15 20:45 154 4 38:30 105 5 4 21:00 35 15 38:45 107 5 6 21:15 32 17 19:00 146 4 2 21:30
9:15 109 5 2 21:45
9:30 83 7 5 22:00
9:45 59 9 2 22:15
10:00 39 14 2 22:30 180 3 110:15 53 10 2 22:45
10:30 44 12 4 23:00 31 17 210:45 42 13 7 23:15
11:00 46 12 3 23:30
11:15 41 13 10 23:45
11:30 110 5 14
Monday, June 29, 2015
Time
(A)
Average
Speed (MPH)
(C)
Sample Size
(D)
Average
Travel
Time (Seconds)
(B)

ARID TRAVEL TIME SUMMARY
Lukeville Port of Entry Lukeville, Arizona / Sonoyta, SonoraSegment Length: 0.14 miles
POE to US (2-1) US to POE (1-2)
Travel Time Samples Collected: Travel Time Samples Collected:
Entire Day Entire DayHours Analyzed Hours AnalyzedAverage Matches Per Hour Average Matches Per Hour
Average Travel Time (sec) Average Travel Time (sec)
Wednesday, July 01, 2015
339 1939 1538
85.4 55.3
Nor
thbou
nd
Sou
thb
ound
13
0
500
1000
1500
2000
2500
Tra
ve
l T
ime
in
se
co
nd
s
Northbound
0
500
1000
1500
2000
2500
Tra
ve
l T
ime
in
se
co
nd
s
Southbound
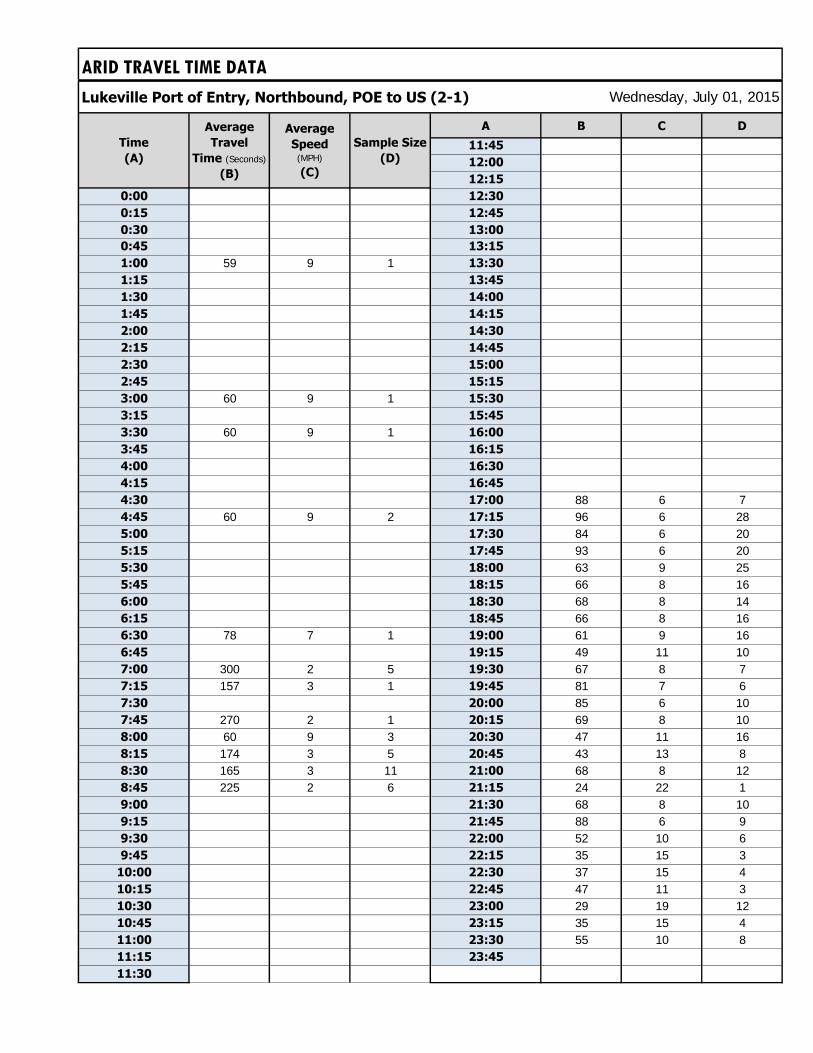
ARID TRAVEL TIME DATA
Lukeville Port of Entry, Northbound, POE to US (2-1)
A B C D
11:45
12:00
12:15
0:00 12:30
0:15 12:45
0:30 13:00
0:45 13:15
1:00 59 9 1 13:30
1:15 13:45
1:30 14:00
1:45 14:15
2:00 14:30
2:15 14:45
2:30 15:00
2:45 15:15
3:00 60 9 1 15:30
3:15 15:45
3:30 60 9 1 16:00
3:45 16:15
4:00 16:30
4:15 16:45
4:30 17:00 88 6 74:45 60 9 2 17:15 96 6 285:00 17:30 84 6 205:15 17:45 93 6 205:30 18:00 63 9 255:45 18:15 66 8 166:00 18:30 68 8 146:15 18:45 66 8 166:30 78 7 1 19:00 61 9 166:45 19:15 49 11 107:00 300 2 5 19:30 67 8 77:15 157 3 1 19:45 81 7 67:30 20:00 85 6 107:45 270 2 1 20:15 69 8 108:00 60 9 3 20:30 47 11 168:15 174 3 5 20:45 43 13 88:30 165 3 11 21:00 68 8 128:45 225 2 6 21:15 24 22 19:00 21:30 68 8 109:15 21:45 88 6 99:30 22:00 52 10 69:45 22:15 35 15 3
10:00 22:30 37 15 410:15 22:45 47 11 310:30 23:00 29 19 1210:45 23:15 35 15 411:00 23:30 55 10 811:15 23:45
11:30
Wednesday, July 01, 2015
Time
(A)
Average
Travel
Time (Seconds)
(B)
Average
Speed (MPH)
(C)
Sample Size
(D)
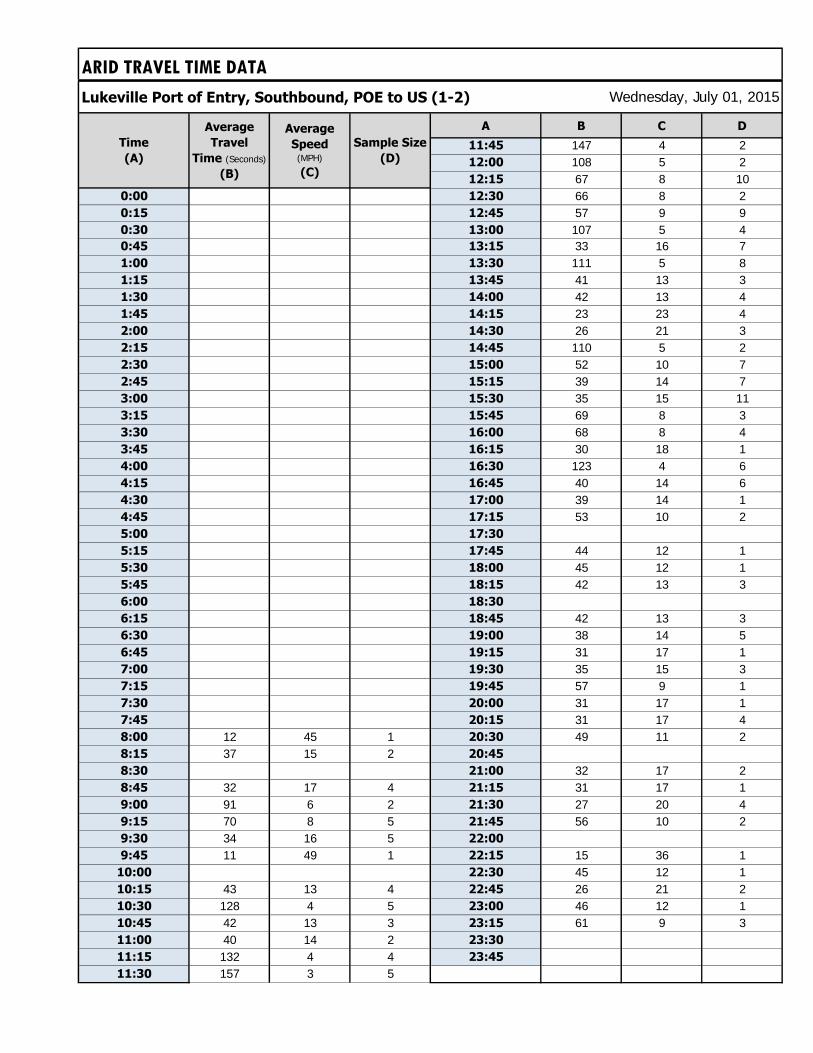
ARID TRAVEL TIME DATA
Lukeville Port of Entry, Southbound, POE to US (1-2)
A B C D
11:45 147 4 212:00 108 5 212:15 67 8 10
0:00 12:30 66 8 20:15 12:45 57 9 90:30 13:00 107 5 40:45 13:15 33 16 71:00 13:30 111 5 81:15 13:45 41 13 31:30 14:00 42 13 41:45 14:15 23 23 42:00 14:30 26 21 32:15 14:45 110 5 22:30 15:00 52 10 72:45 15:15 39 14 73:00 15:30 35 15 113:15 15:45 69 8 33:30 16:00 68 8 43:45 16:15 30 18 14:00 16:30 123 4 64:15 16:45 40 14 64:30 17:00 39 14 14:45 17:15 53 10 25:00 17:30
5:15 17:45 44 12 15:30 18:00 45 12 15:45 18:15 42 13 36:00 18:30
6:15 18:45 42 13 36:30 19:00 38 14 56:45 19:15 31 17 17:00 19:30 35 15 37:15 19:45 57 9 17:30 20:00 31 17 17:45 20:15 31 17 48:00 12 45 1 20:30 49 11 28:15 37 15 2 20:45
8:30 21:00 32 17 28:45 32 17 4 21:15 31 17 19:00 91 6 2 21:30 27 20 49:15 70 8 5 21:45 56 10 29:30 34 16 5 22:00
9:45 11 49 1 22:15 15 36 110:00 22:30 45 12 110:15 43 13 4 22:45 26 21 210:30 128 4 5 23:00 46 12 110:45 42 13 3 23:15 61 9 311:00 40 14 2 23:30
11:15 132 4 4 23:45
11:30 157 3 5
Wednesday, July 01, 2015
Time
(A)
Average
Speed (MPH)
(C)
Sample Size
(D)
Average
Travel
Time (Seconds)
(B)
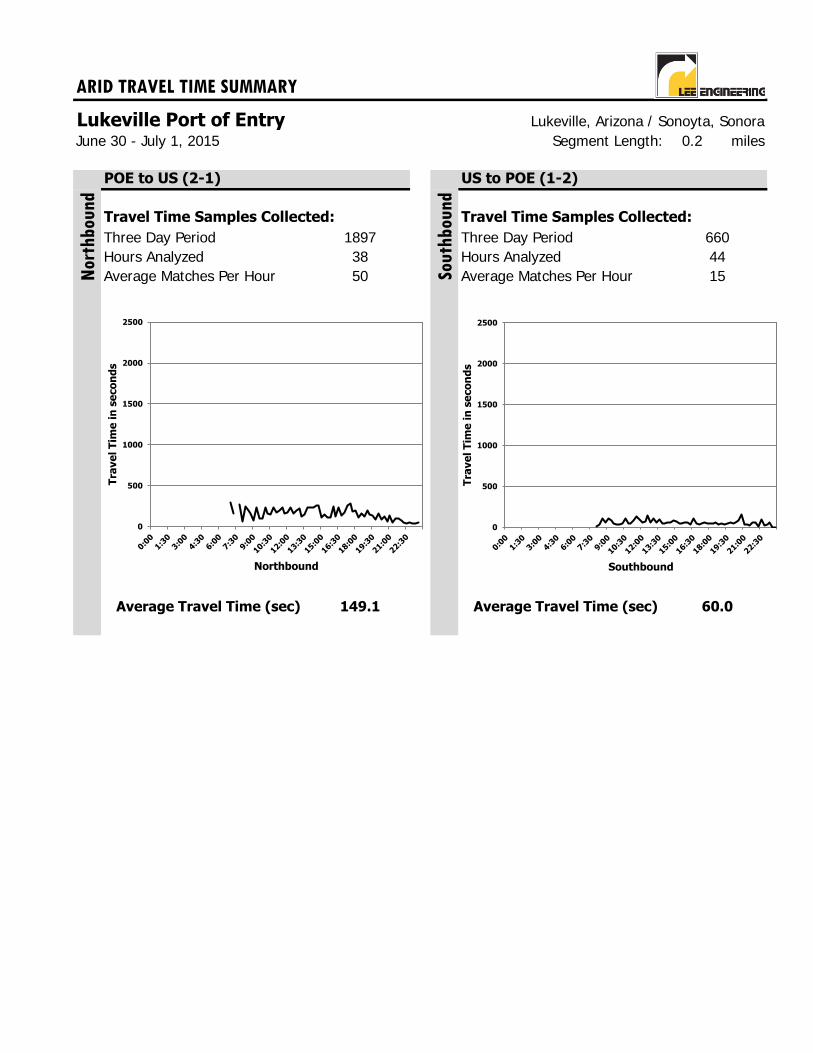
ARID TRAVEL TIME SUMMARY
Lukeville Port of Entry Lukeville, Arizona / Sonoyta, SonoraSegment Length: 0.2 miles
POE to US (2-1) US to POE (1-2)
Travel Time Samples Collected: Travel Time Samples Collected:
Three Day Period Three Day PeriodHours Analyzed Hours AnalyzedAverage Matches Per Hour Average Matches Per Hour
Average Travel Time (sec) Average Travel Time (sec)
June 30 - July 1, 2015
Nor
thbou
nd
Sou
thb
ound
1897 66038 4450 15
149.1 60.0
0
500
1000
1500
2000
2500
Tra
ve
l T
ime
in
se
co
nd
s
Northbound
0
500
1000
1500
2000
2500
Tra
ve
l T
ime
in
se
co
nd
s
Southbound
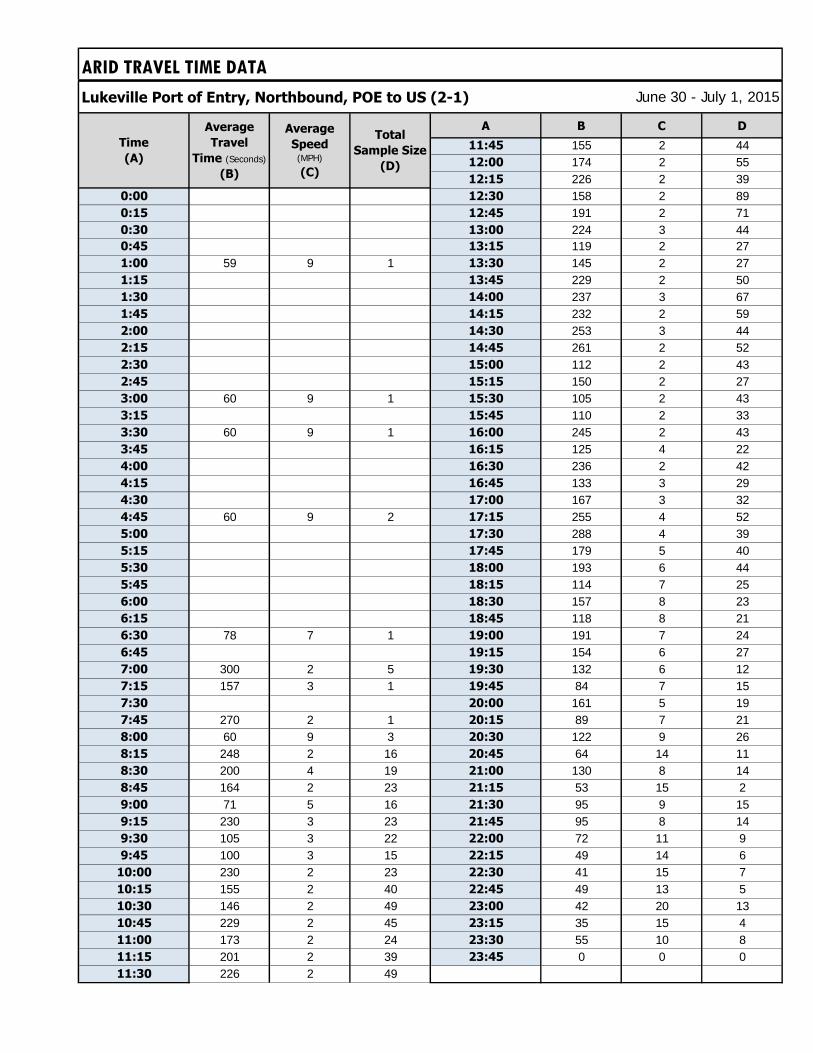
ARID TRAVEL TIME DATA
Lukeville Port of Entry, Northbound, POE to US (2-1)
A B C D
11:45 155 2 4412:00 174 2 5512:15 226 2 39
0:00 12:30 158 2 890:15 12:45 191 2 710:30 13:00 224 3 440:45 13:15 119 2 271:00 59 9 1 13:30 145 2 271:15 13:45 229 2 501:30 14:00 237 3 671:45 14:15 232 2 592:00 14:30 253 3 442:15 14:45 261 2 522:30 15:00 112 2 432:45 15:15 150 2 273:00 60 9 1 15:30 105 2 433:15 15:45 110 2 333:30 60 9 1 16:00 245 2 433:45 16:15 125 4 224:00 16:30 236 2 424:15 16:45 133 3 294:30 17:00 167 3 324:45 60 9 2 17:15 255 4 525:00 17:30 288 4 395:15 17:45 179 5 405:30 18:00 193 6 445:45 18:15 114 7 256:00 18:30 157 8 236:15 18:45 118 8 216:30 78 7 1 19:00 191 7 246:45 19:15 154 6 277:00 300 2 5 19:30 132 6 127:15 157 3 1 19:45 84 7 157:30 20:00 161 5 197:45 270 2 1 20:15 89 7 218:00 60 9 3 20:30 122 9 268:15 248 2 16 20:45 64 14 118:30 200 4 19 21:00 130 8 148:45 164 2 23 21:15 53 15 29:00 71 5 16 21:30 95 9 159:15 230 3 23 21:45 95 8 149:30 105 3 22 22:00 72 11 99:45 100 3 15 22:15 49 14 6
10:00 230 2 23 22:30 41 15 710:15 155 2 40 22:45 49 13 510:30 146 2 49 23:00 42 20 1310:45 229 2 45 23:15 35 15 411:00 173 2 24 23:30 55 10 811:15 201 2 39 23:45 0 0 011:30 226 2 49
Average
Travel
Time (Seconds)
(B)
Average
Speed (MPH)
(C)
Total
Sample Size
(D)
June 30 - July 1, 2015
Time
(A)

ARID TRAVEL TIME DATA
Lukeville Port of Entry, Southbound, POE to US (1-2)
A B C D
11:45 90 7 1312:00 55 16 1112:15 69 8 38
0:00 12:30 148 5 120:15 12:45 57 9 230:30 13:00 108 5 260:45 13:15 54 12 281:00 13:30 96 6 211:15 13:45 42 13 111:30 14:00 41 13 131:45 14:15 54 15 172:00 14:30 51 13 132:15 14:45 87 6 132:30 15:00 72 8 242:45 15:15 40 14 223:00 15:30 47 13 303:15 15:45 63 9 93:30 16:00 63 9 113:45 16:15 34 16 64:00 16:30 108 5 154:15 16:45 41 13 154:30 17:00 31 21 34:45 17:15 50 11 75:00 17:30 60 9 15:15 17:45 48 11 55:30 18:00 48 11 55:45 18:15 49 11 106:00 18:30 54 10 86:15 18:45 38 17 76:30 19:00 40 13 146:45 19:15 29 19 37:00 19:30 45 13 107:15 19:45 57 9 27:30 20:00 50 13 47:45 20:15 56 14 108:00 12 45 2 20:30 85 8 78:15 37 15 4 20:45 154 4 38:30 105 5 4 21:00 33 16 78:45 64 12 14 21:15 31 17 39:00 109 5 6 21:30 27 20 89:15 77 8 12 21:45 56 10 49:30 50 13 15 22:00 60 0 09:45 35 29 4 22:15 15 36 2
10:00 39 14 2 22:30 90 9 310:15 45 12 10 22:45 26 21 410:30 104 6 14 23:00 39 15 410:45 42 13 13 23:15 61 9 611:00 43 13 7 23:30 0 0 011:15 81 9 18 23:45 0 0 011:30 130 4 24
Time
(A)
June 30 - July 1, 2015
Average
Travel
Time (Seconds)
(B)
Average
Speed (MPH)
(C)
Total
Sample Size
(D)
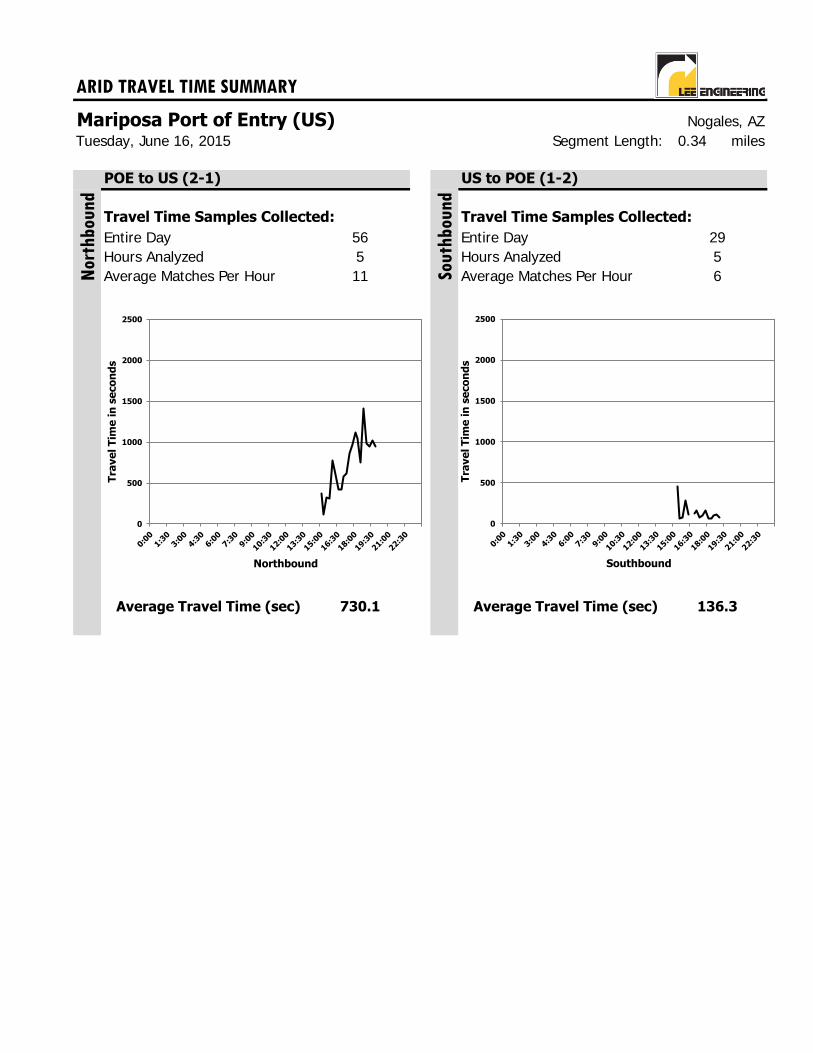
ARID TRAVEL TIME SUMMARY
Mariposa Port of Entry (US) Nogales, AZSegment Length: 0.34 miles
POE to US (2-1) US to POE (1-2)
Travel Time Samples Collected: Travel Time Samples Collected:
Entire Day Entire DayHours Analyzed Hours AnalyzedAverage Matches Per Hour Average Matches Per Hour
Average Travel Time (sec) Average Travel Time (sec)
Tuesday, June 16, 2015
56 295 511
730.1 136.3
Nor
thbou
nd
Sou
thb
ound
6
0
500
1000
1500
2000
2500
Tra
ve
l T
ime
in
se
co
nd
s
Northbound
0
500
1000
1500
2000
2500
Tra
ve
l T
ime
in
se
co
nd
s
Southbound
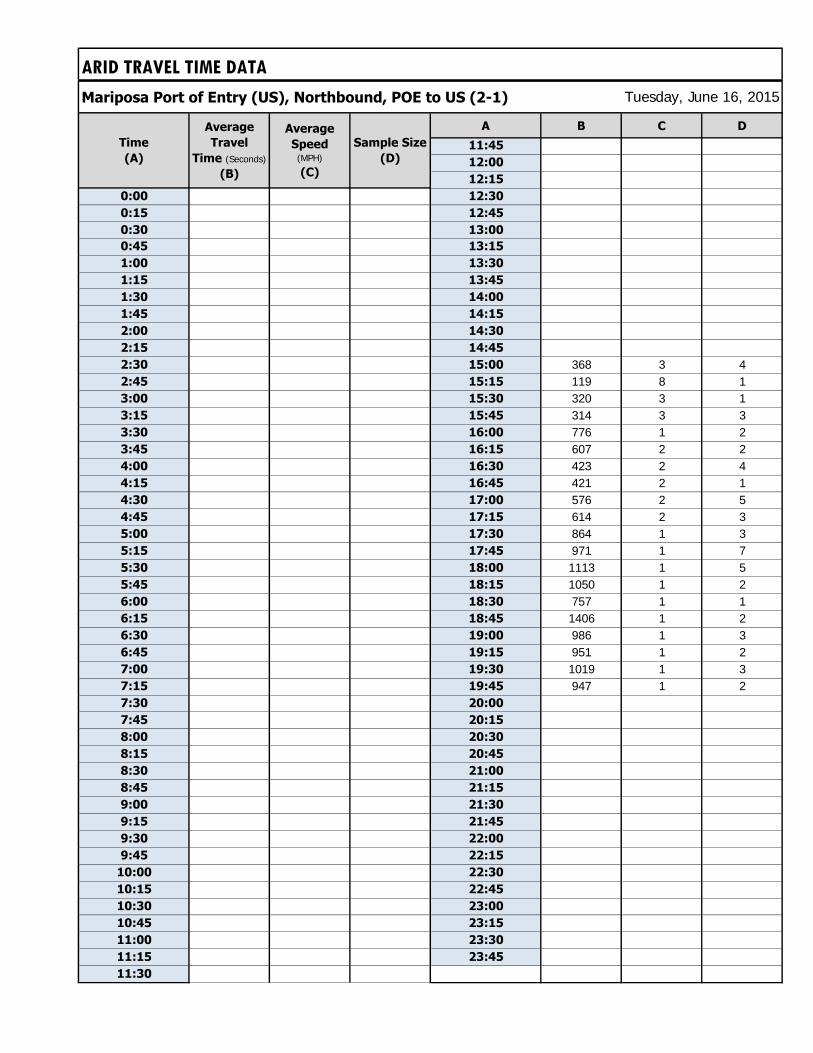
ARID TRAVEL TIME DATA
Mariposa Port of Entry (US), Northbound, POE to US (2-1)
A B C D
11:45
12:00
12:15
0:00 12:30
0:15 12:45
0:30 13:00
0:45 13:15
1:00 13:30
1:15 13:45
1:30 14:00
1:45 14:15
2:00 14:30
2:15 14:45
2:30 15:00 368 3 42:45 15:15 119 8 13:00 15:30 320 3 13:15 15:45 314 3 33:30 16:00 776 1 23:45 16:15 607 2 24:00 16:30 423 2 44:15 16:45 421 2 14:30 17:00 576 2 54:45 17:15 614 2 35:00 17:30 864 1 35:15 17:45 971 1 75:30 18:00 1113 1 55:45 18:15 1050 1 26:00 18:30 757 1 16:15 18:45 1406 1 26:30 19:00 986 1 36:45 19:15 951 1 27:00 19:30 1019 1 37:15 19:45 947 1 27:30 20:00
7:45 20:15
8:00 20:30
8:15 20:45
8:30 21:00
8:45 21:15
9:00 21:30
9:15 21:45
9:30 22:00
9:45 22:15
10:00 22:30
10:15 22:45
10:30 23:00
10:45 23:15
11:00 23:30
11:15 23:45
11:30
Tuesday, June 16, 2015
Time
(A)
Average
Travel
Time (Seconds)
(B)
Average
Speed (MPH)
(C)
Sample Size
(D)
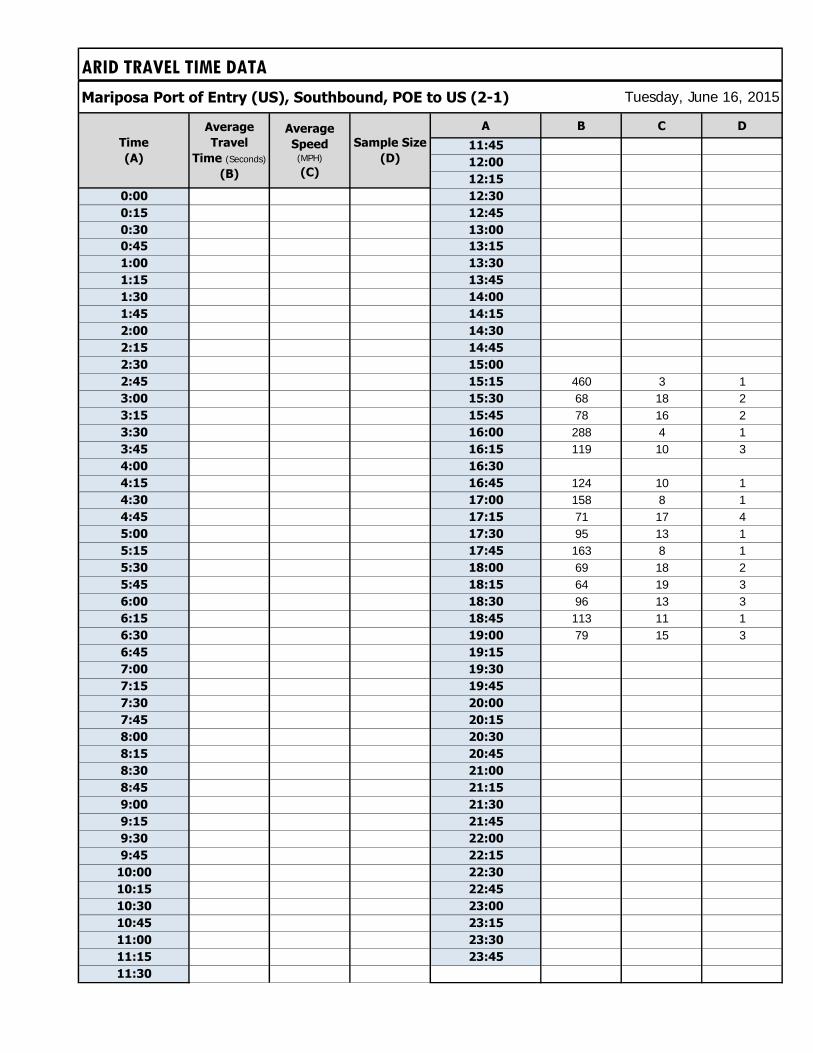
ARID TRAVEL TIME DATA
Mariposa Port of Entry (US), Southbound, POE to US (2-1)
A B C D
11:45
12:00
12:15
0:00 12:30
0:15 12:45
0:30 13:00
0:45 13:15
1:00 13:30
1:15 13:45
1:30 14:00
1:45 14:15
2:00 14:30
2:15 14:45
2:30 15:00
2:45 15:15 460 3 13:00 15:30 68 18 23:15 15:45 78 16 23:30 16:00 288 4 13:45 16:15 119 10 34:00 16:30
4:15 16:45 124 10 14:30 17:00 158 8 14:45 17:15 71 17 45:00 17:30 95 13 15:15 17:45 163 8 15:30 18:00 69 18 25:45 18:15 64 19 36:00 18:30 96 13 36:15 18:45 113 11 16:30 19:00 79 15 36:45 19:15
7:00 19:30
7:15 19:45
7:30 20:00
7:45 20:15
8:00 20:30
8:15 20:45
8:30 21:00
8:45 21:15
9:00 21:30
9:15 21:45
9:30 22:00
9:45 22:15
10:00 22:30
10:15 22:45
10:30 23:00
10:45 23:15
11:00 23:30
11:15 23:45
11:30
Tuesday, June 16, 2015
Time
(A)
Average
Speed (MPH)
(C)
Sample Size
(D)
Average
Travel
Time (Seconds)
(B)
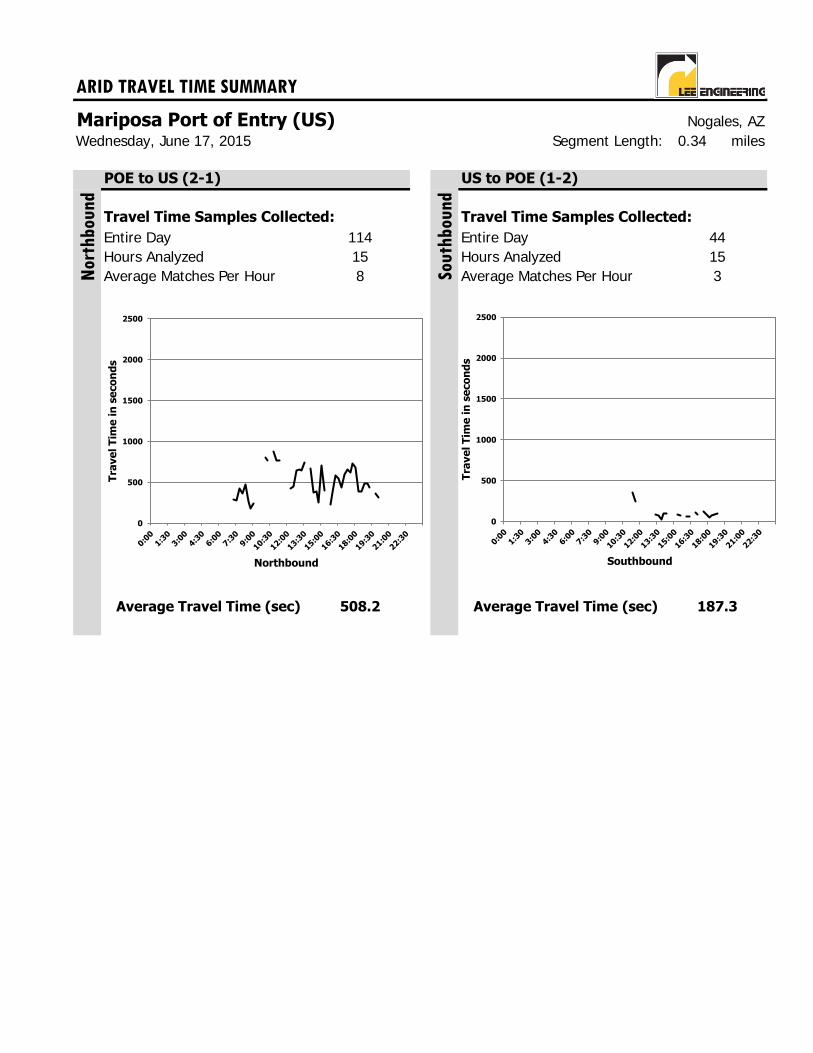
ARID TRAVEL TIME SUMMARY
Mariposa Port of Entry (US) Nogales, AZSegment Length: 0.34 miles
POE to US (2-1) US to POE (1-2)
Travel Time Samples Collected: Travel Time Samples Collected:
Entire Day Entire DayHours Analyzed Hours AnalyzedAverage Matches Per Hour Average Matches Per Hour
Average Travel Time (sec) Average Travel Time (sec)
Wednesday, June 17, 2015
114 4415 158
508.2 187.3
Nor
thbou
nd
Sou
thb
ound
3
0
500
1000
1500
2000
2500
Tra
ve
l T
ime
in
se
co
nd
s
Northbound
0
500
1000
1500
2000
2500
Tra
ve
l T
ime
in
se
co
nd
s
Southbound
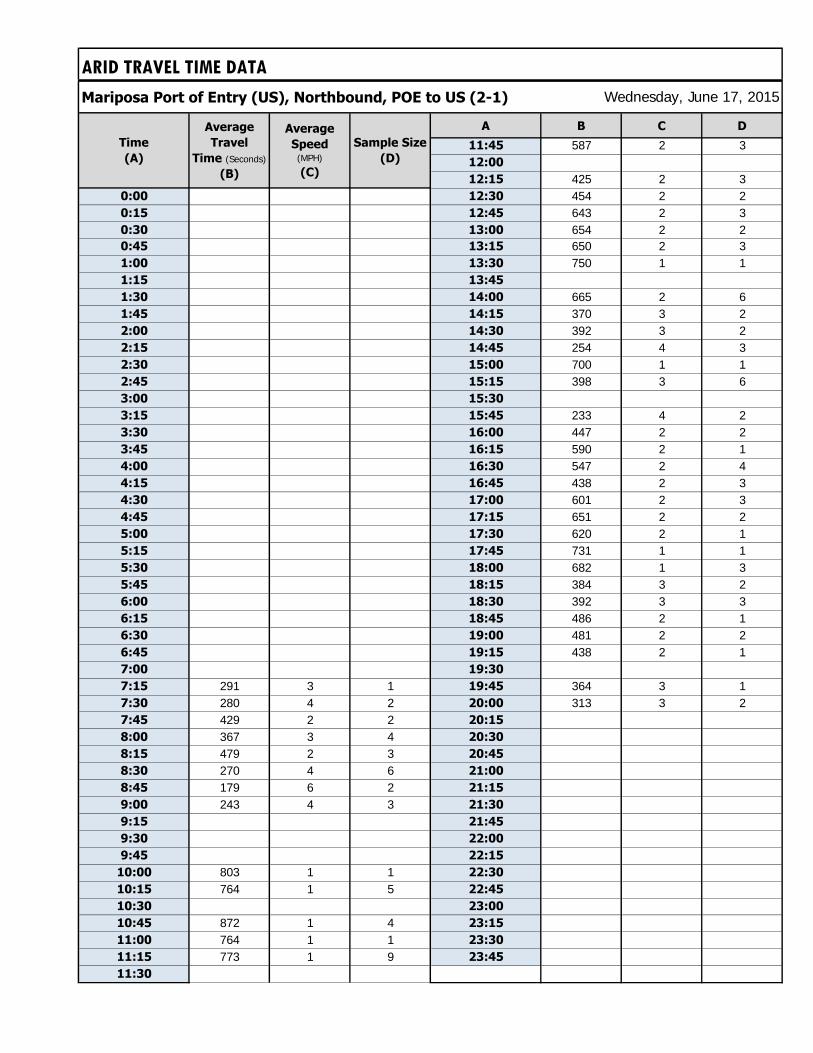
ARID TRAVEL TIME DATA
Mariposa Port of Entry (US), Northbound, POE to US (2-1)
A B C D
11:45 587 2 312:00
12:15 425 2 30:00 12:30 454 2 20:15 12:45 643 2 30:30 13:00 654 2 20:45 13:15 650 2 31:00 13:30 750 1 11:15 13:45
1:30 14:00 665 2 61:45 14:15 370 3 22:00 14:30 392 3 22:15 14:45 254 4 32:30 15:00 700 1 12:45 15:15 398 3 63:00 15:30
3:15 15:45 233 4 23:30 16:00 447 2 23:45 16:15 590 2 14:00 16:30 547 2 44:15 16:45 438 2 34:30 17:00 601 2 34:45 17:15 651 2 25:00 17:30 620 2 15:15 17:45 731 1 15:30 18:00 682 1 35:45 18:15 384 3 26:00 18:30 392 3 36:15 18:45 486 2 16:30 19:00 481 2 26:45 19:15 438 2 17:00 19:30
7:15 291 3 1 19:45 364 3 17:30 280 4 2 20:00 313 3 27:45 429 2 2 20:15
8:00 367 3 4 20:30
8:15 479 2 3 20:45
8:30 270 4 6 21:00
8:45 179 6 2 21:15
9:00 243 4 3 21:30
9:15 21:45
9:30 22:00
9:45 22:15
10:00 803 1 1 22:30
10:15 764 1 5 22:45
10:30 23:00
10:45 872 1 4 23:15
11:00 764 1 1 23:30
11:15 773 1 9 23:45
11:30
Wednesday, June 17, 2015
Time
(A)
Average
Travel
Time (Seconds)
(B)
Average
Speed (MPH)
(C)
Sample Size
(D)
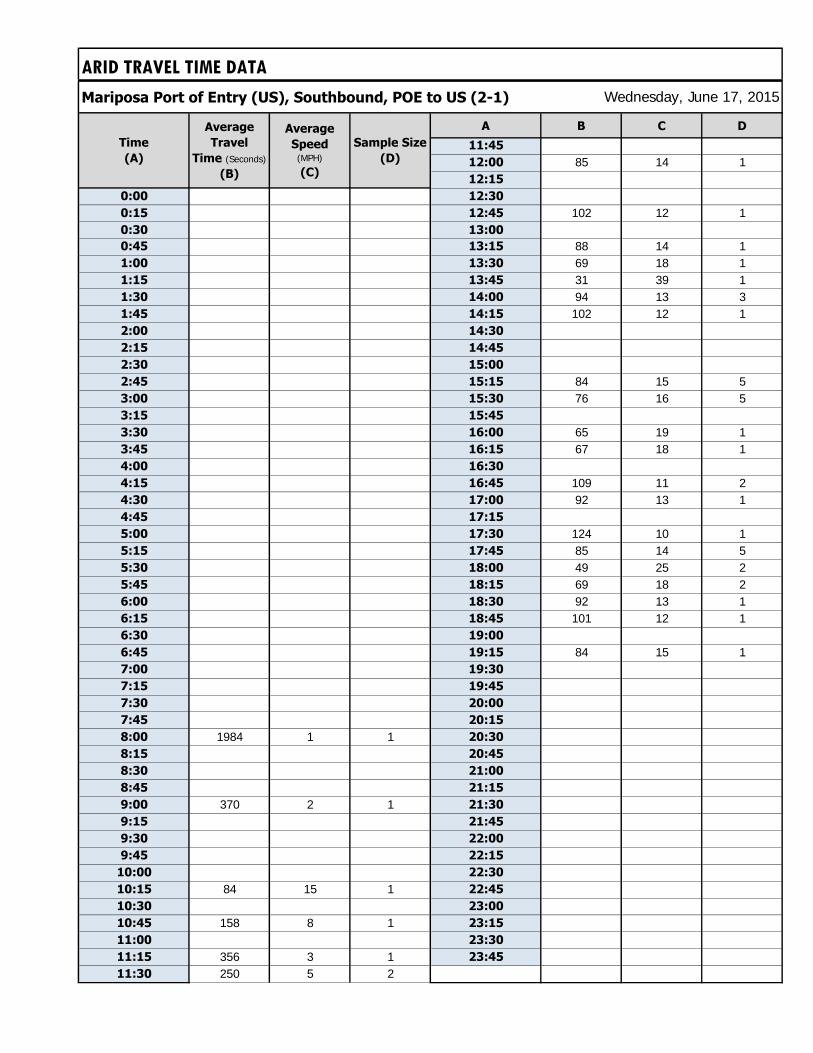
ARID TRAVEL TIME DATA
Mariposa Port of Entry (US), Southbound, POE to US (2-1)
A B C D
11:45
12:00 85 14 112:15
0:00 12:30
0:15 12:45 102 12 10:30 13:00
0:45 13:15 88 14 11:00 13:30 69 18 11:15 13:45 31 39 11:30 14:00 94 13 31:45 14:15 102 12 12:00 14:30
2:15 14:45
2:30 15:00
2:45 15:15 84 15 53:00 15:30 76 16 53:15 15:45
3:30 16:00 65 19 13:45 16:15 67 18 14:00 16:30
4:15 16:45 109 11 24:30 17:00 92 13 14:45 17:15
5:00 17:30 124 10 15:15 17:45 85 14 55:30 18:00 49 25 25:45 18:15 69 18 26:00 18:30 92 13 16:15 18:45 101 12 16:30 19:00
6:45 19:15 84 15 17:00 19:30
7:15 19:45
7:30 20:00
7:45 20:15
8:00 1984 1 1 20:30
8:15 20:45
8:30 21:00
8:45 21:15
9:00 370 2 1 21:30
9:15 21:45
9:30 22:00
9:45 22:15
10:00 22:30
10:15 84 15 1 22:45
10:30 23:00
10:45 158 8 1 23:15
11:00 23:30
11:15 356 3 1 23:45
11:30 250 5 2
Wednesday, June 17, 2015
Time
(A)
Average
Speed (MPH)
(C)
Sample Size
(D)
Average
Travel
Time (Seconds)
(B)
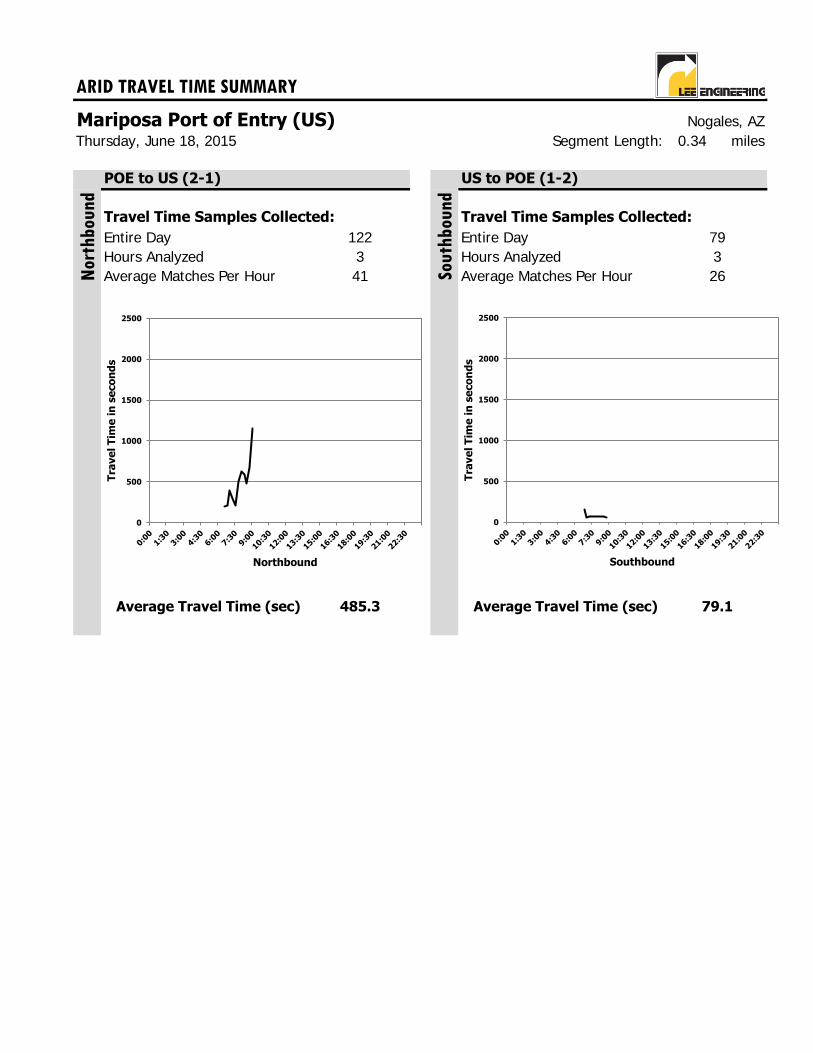
ARID TRAVEL TIME SUMMARY
Mariposa Port of Entry (US) Nogales, AZSegment Length: 0.34 miles
POE to US (2-1) US to POE (1-2)
Travel Time Samples Collected: Travel Time Samples Collected:
Entire Day Entire DayHours Analyzed Hours AnalyzedAverage Matches Per Hour Average Matches Per Hour
Average Travel Time (sec) Average Travel Time (sec)
Thursday, June 18, 2015
122 793 341
485.3 79.1
Nor
thbou
nd
Sou
thb
ound
26
0
500
1000
1500
2000
2500
Tra
ve
l T
ime
in
se
co
nd
s
Northbound
0
500
1000
1500
2000
2500
Tra
ve
l T
ime
in
se
co
nd
s
Southbound
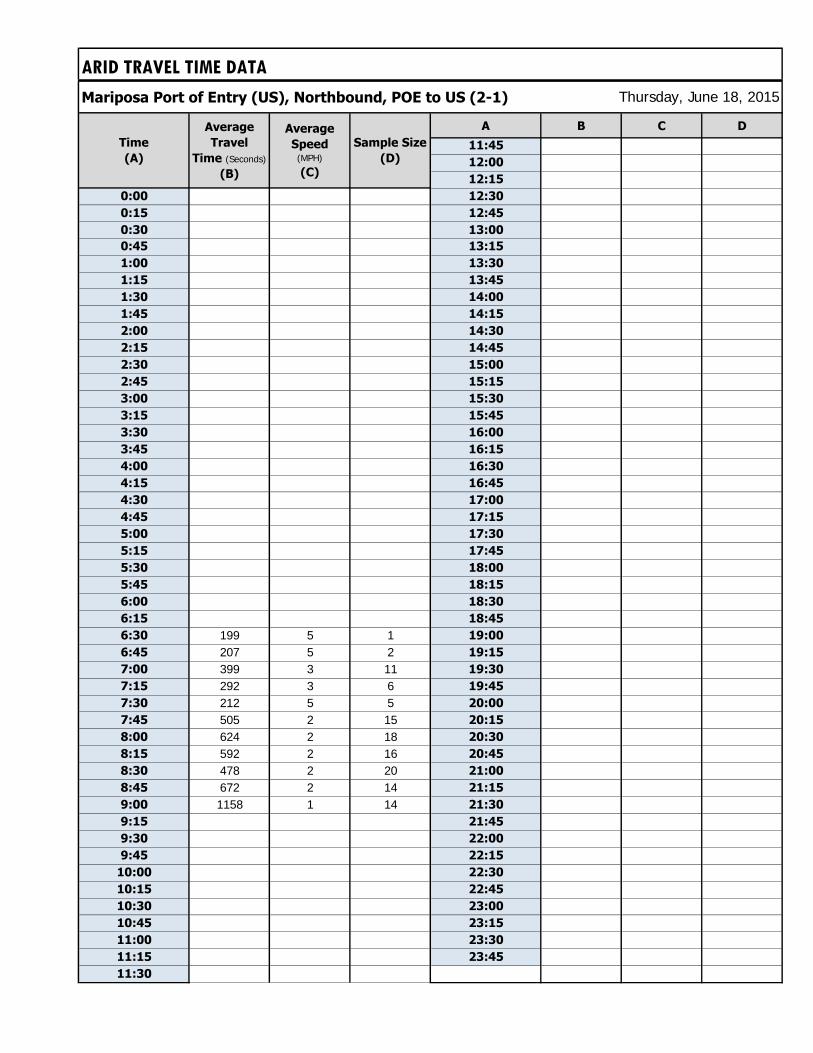
ARID TRAVEL TIME DATA
Mariposa Port of Entry (US), Northbound, POE to US (2-1)
A B C D
11:45
12:00
12:15
0:00 12:30
0:15 12:45
0:30 13:00
0:45 13:15
1:00 13:30
1:15 13:45
1:30 14:00
1:45 14:15
2:00 14:30
2:15 14:45
2:30 15:00
2:45 15:15
3:00 15:30
3:15 15:45
3:30 16:00
3:45 16:15
4:00 16:30
4:15 16:45
4:30 17:00
4:45 17:15
5:00 17:30
5:15 17:45
5:30 18:00
5:45 18:15
6:00 18:30
6:15 18:45
6:30 199 5 1 19:00
6:45 207 5 2 19:15
7:00 399 3 11 19:30
7:15 292 3 6 19:45
7:30 212 5 5 20:00
7:45 505 2 15 20:15
8:00 624 2 18 20:30
8:15 592 2 16 20:45
8:30 478 2 20 21:00
8:45 672 2 14 21:15
9:00 1158 1 14 21:30
9:15 21:45
9:30 22:00
9:45 22:15
10:00 22:30
10:15 22:45
10:30 23:00
10:45 23:15
11:00 23:30
11:15 23:45
11:30
Thursday, June 18, 2015
Time
(A)
Average
Travel
Time (Seconds)
(B)
Average
Speed (MPH)
(C)
Sample Size
(D)
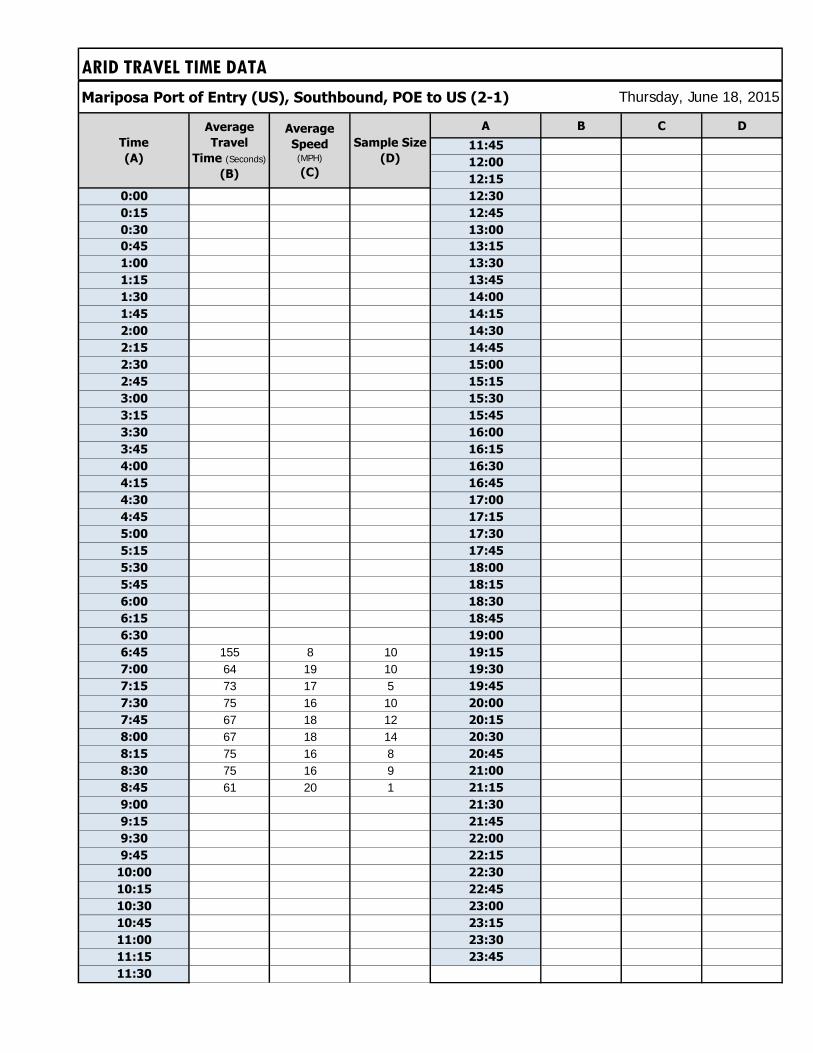
ARID TRAVEL TIME DATA
Mariposa Port of Entry (US), Southbound, POE to US (2-1)
A B C D
11:45
12:00
12:15
0:00 12:30
0:15 12:45
0:30 13:00
0:45 13:15
1:00 13:30
1:15 13:45
1:30 14:00
1:45 14:15
2:00 14:30
2:15 14:45
2:30 15:00
2:45 15:15
3:00 15:30
3:15 15:45
3:30 16:00
3:45 16:15
4:00 16:30
4:15 16:45
4:30 17:00
4:45 17:15
5:00 17:30
5:15 17:45
5:30 18:00
5:45 18:15
6:00 18:30
6:15 18:45
6:30 19:00
6:45 155 8 10 19:15
7:00 64 19 10 19:30
7:15 73 17 5 19:45
7:30 75 16 10 20:00
7:45 67 18 12 20:15
8:00 67 18 14 20:30
8:15 75 16 8 20:45
8:30 75 16 9 21:00
8:45 61 20 1 21:15
9:00 21:30
9:15 21:45
9:30 22:00
9:45 22:15
10:00 22:30
10:15 22:45
10:30 23:00
10:45 23:15
11:00 23:30
11:15 23:45
11:30
Thursday, June 18, 2015
Time
(A)
Average
Speed (MPH)
(C)
Sample Size
(D)
Average
Travel
Time (Seconds)
(B)
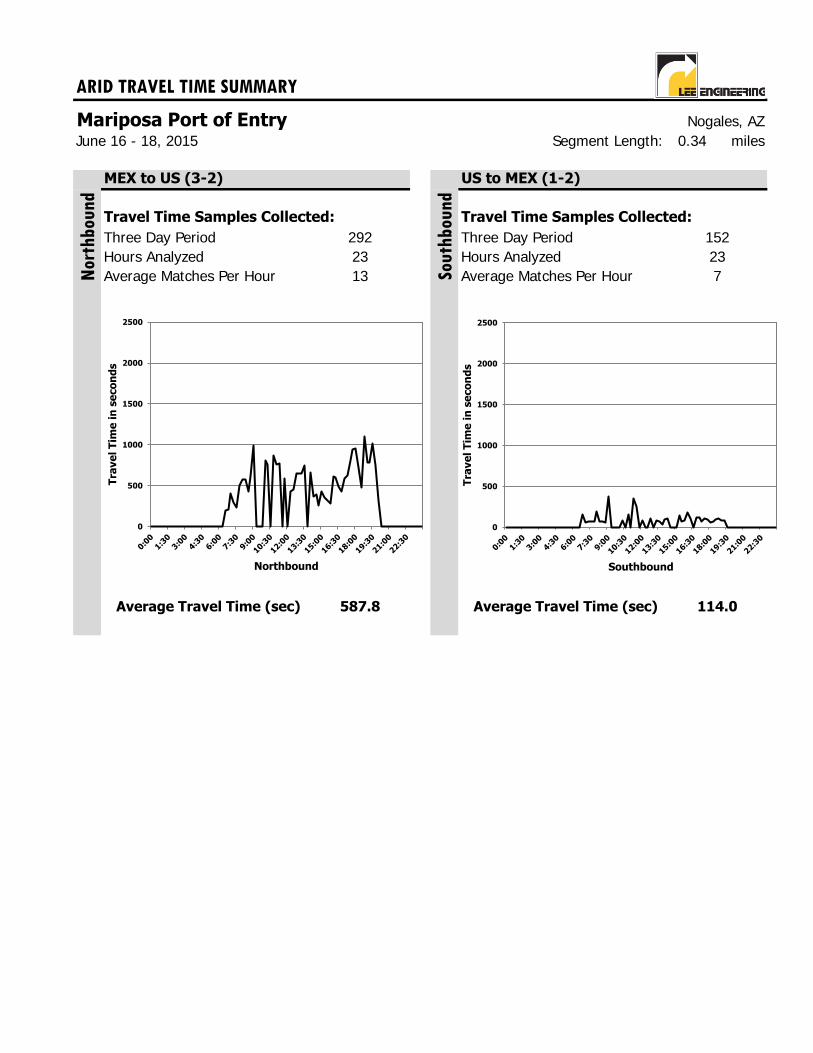
ARID TRAVEL TIME SUMMARY
Mariposa Port of Entry Nogales, AZSegment Length: 0.34 miles
MEX to US (3-2) US to MEX (1-2)
Travel Time Samples Collected: Travel Time Samples Collected:
Three Day Period Three Day PeriodHours Analyzed Hours AnalyzedAverage Matches Per Hour Average Matches Per Hour
Average Travel Time (sec) Average Travel Time (sec)
June 16 - 18, 2015
Nor
thbou
nd
Sou
thb
ound
292 15223 2313 7
587.8 114.0
0
500
1000
1500
2000
2500
Tra
ve
l T
ime
in
se
co
nd
s
Northbound
0
500
1000
1500
2000
2500
Tra
ve
l T
ime
in
se
co
nd
s
Southbound
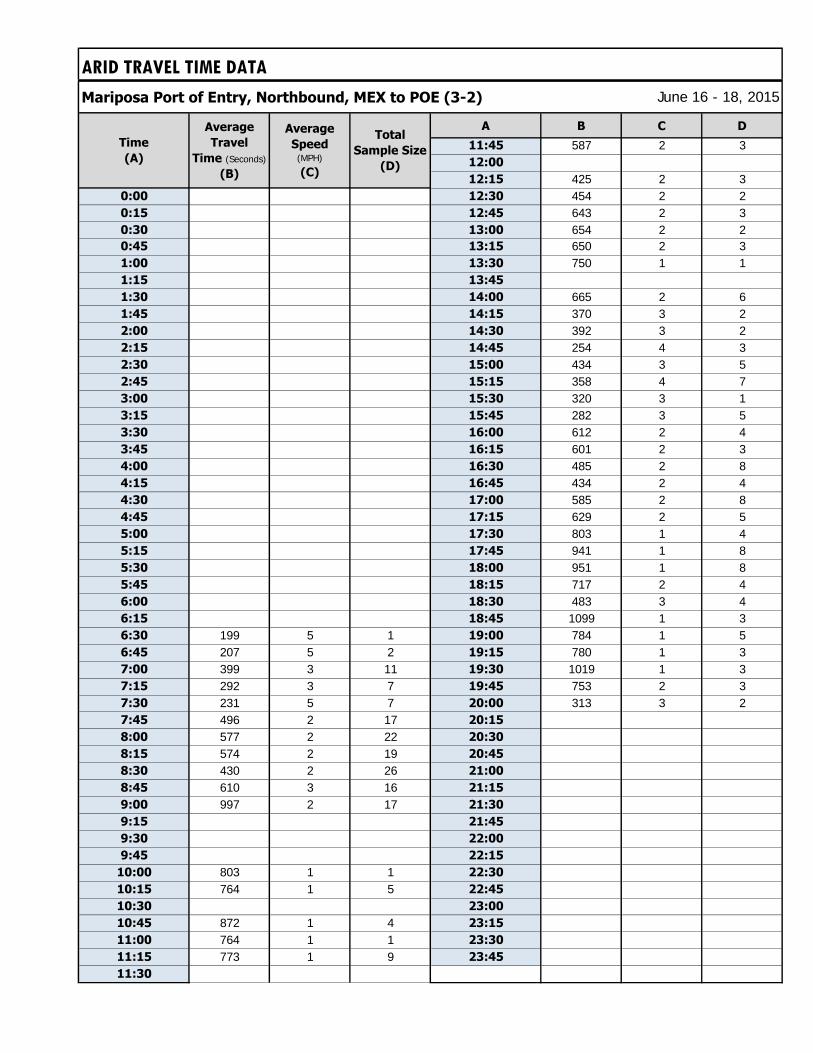
ARID TRAVEL TIME DATA
Mariposa Port of Entry, Northbound, MEX to POE (3-2)
A B C D
11:45 587 2 312:00
12:15 425 2 30:00 12:30 454 2 20:15 12:45 643 2 30:30 13:00 654 2 20:45 13:15 650 2 31:00 13:30 750 1 11:15 13:45
1:30 14:00 665 2 61:45 14:15 370 3 22:00 14:30 392 3 22:15 14:45 254 4 32:30 15:00 434 3 52:45 15:15 358 4 73:00 15:30 320 3 13:15 15:45 282 3 53:30 16:00 612 2 43:45 16:15 601 2 34:00 16:30 485 2 84:15 16:45 434 2 44:30 17:00 585 2 84:45 17:15 629 2 55:00 17:30 803 1 45:15 17:45 941 1 85:30 18:00 951 1 85:45 18:15 717 2 46:00 18:30 483 3 46:15 18:45 1099 1 36:30 199 5 1 19:00 784 1 56:45 207 5 2 19:15 780 1 37:00 399 3 11 19:30 1019 1 37:15 292 3 7 19:45 753 2 37:30 231 5 7 20:00 313 3 27:45 496 2 17 20:15
8:00 577 2 22 20:30
8:15 574 2 19 20:45
8:30 430 2 26 21:00
8:45 610 3 16 21:15
9:00 997 2 17 21:30
9:15 21:45
9:30 22:00
9:45 22:15
10:00 803 1 1 22:30
10:15 764 1 5 22:45
10:30 23:00
10:45 872 1 4 23:15
11:00 764 1 1 23:30
11:15 773 1 9 23:45
11:30
Average
Travel
Time (Seconds)
(B)
Average
Speed (MPH)
(C)
Total
Sample Size
(D)
June 16 - 18, 2015
Time
(A)
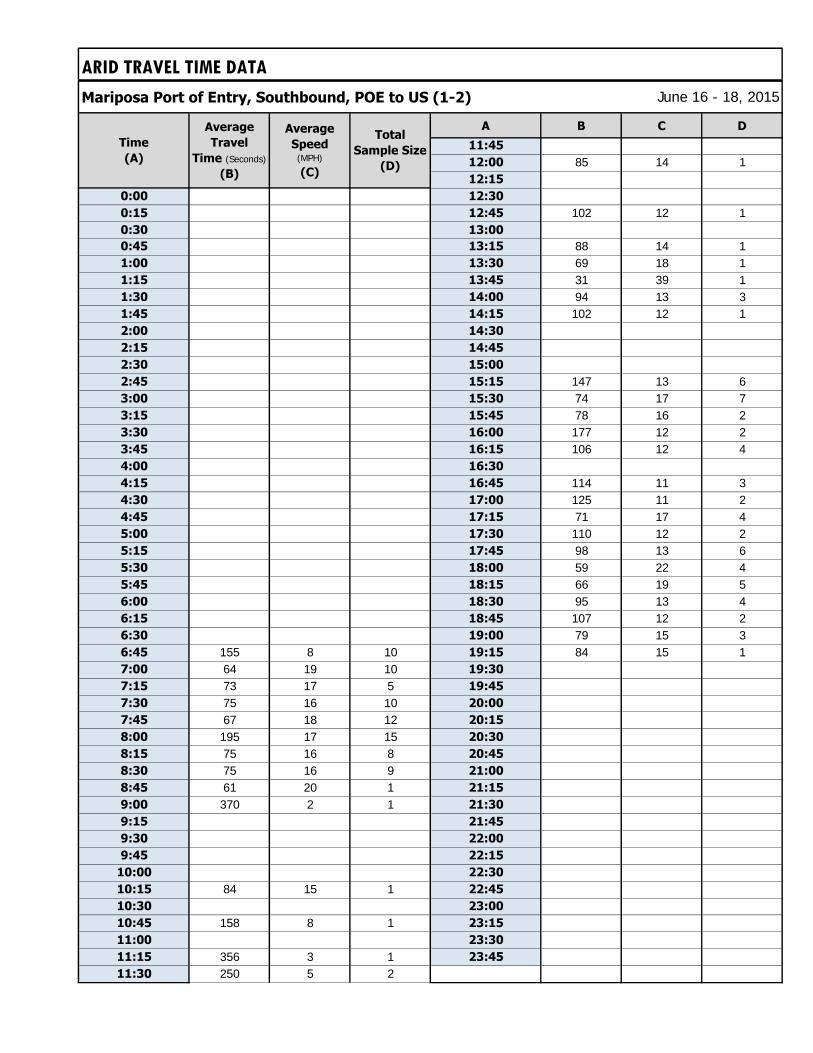
ARID TRAVEL TIME DATA
Mariposa Port of Entry, Southbound, POE to US (1-2)
A B C D
11:45
12:00 85 14 112:15
0:00 12:30
0:15 12:45 102 12 10:30 13:00
0:45 13:15 88 14 11:00 13:30 69 18 11:15 13:45 31 39 11:30 14:00 94 13 31:45 14:15 102 12 12:00 14:30
2:15 14:45
2:30 15:00
2:45 15:15 147 13 63:00 15:30 74 17 73:15 15:45 78 16 23:30 16:00 177 12 23:45 16:15 106 12 44:00 16:30
4:15 16:45 114 11 34:30 17:00 125 11 24:45 17:15 71 17 45:00 17:30 110 12 25:15 17:45 98 13 65:30 18:00 59 22 45:45 18:15 66 19 56:00 18:30 95 13 46:15 18:45 107 12 26:30 19:00 79 15 36:45 155 8 10 19:15 84 15 17:00 64 19 10 19:30
7:15 73 17 5 19:45
7:30 75 16 10 20:00
7:45 67 18 12 20:15
8:00 195 17 15 20:30
8:15 75 16 8 20:45
8:30 75 16 9 21:00
8:45 61 20 1 21:15
9:00 370 2 1 21:30
9:15 21:45
9:30 22:00
9:45 22:15
10:00 22:30
10:15 84 15 1 22:45
10:30 23:00
10:45 158 8 1 23:15
11:00 23:30
11:15 356 3 1 23:45
11:30 250 5 2
Time
(A)
June 16 - 18, 2015
Average
Travel
Time (Seconds)
(B)
Average
Speed (MPH)
(C)
Total
Sample Size
(D)
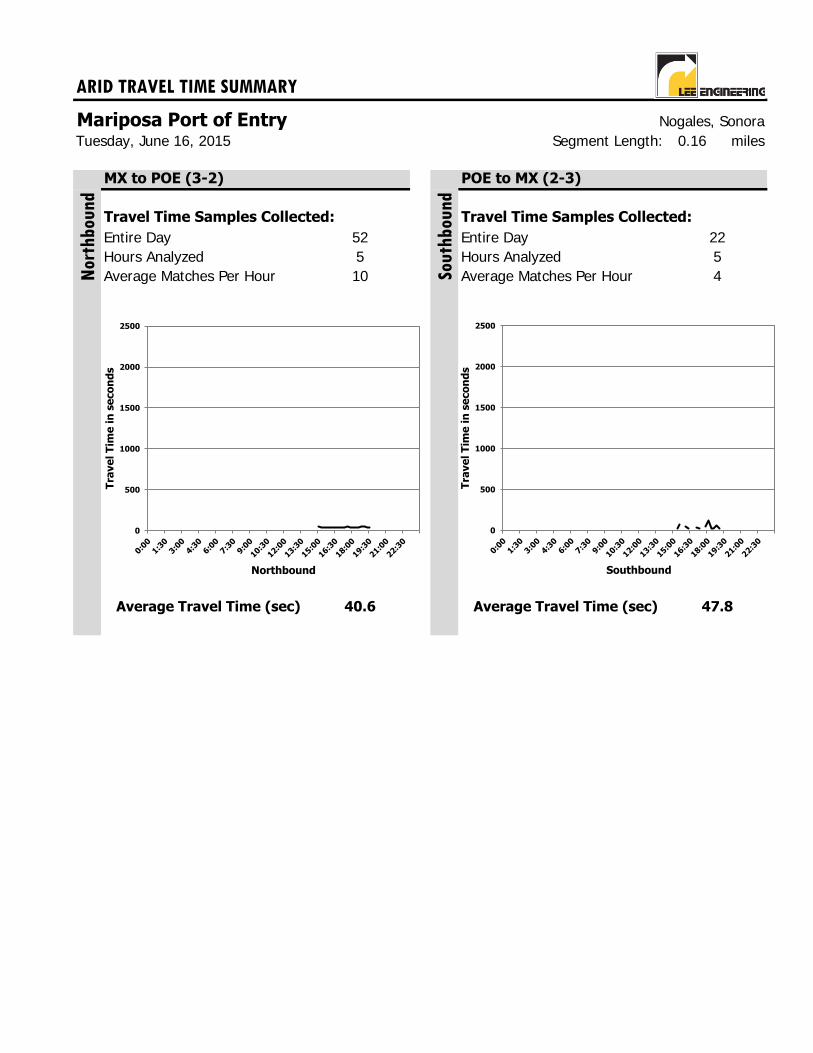
ARID TRAVEL TIME SUMMARY
Mariposa Port of Entry Nogales, SonoraSegment Length: 0.16 miles
MX to POE (3-2) POE to MX (2-3)
Travel Time Samples Collected: Travel Time Samples Collected:
Entire Day Entire DayHours Analyzed Hours AnalyzedAverage Matches Per Hour Average Matches Per Hour
Average Travel Time (sec) Average Travel Time (sec)
Sou
thb
ound
Tuesday, June 16, 2015
52 225 510
40.6
Nor
thbou
nd
4
47.8
0
500
1000
1500
2000
2500
Tra
ve
l T
ime
in
se
co
nd
s
Northbound
0
500
1000
1500
2000
2500
Tra
ve
l T
ime
in
se
co
nd
s
Southbound

ARID TRAVEL TIME DATA
Mariposa Port of Entry, Northbound, MX to POE (3-2)
A B C D
11:45
12:00
12:15
0:00 12:30
0:15 12:45
0:30 13:00
0:45 13:15
1:00 13:30
1:15 13:45
1:30 14:00
1:45 14:15
2:00 14:30
2:15 14:45
2:30 15:00 45 13 12:45 15:15 38 15 13:00 15:30 37 16 33:15 15:45 35 16 23:30 16:00 36 16 23:45 16:15 37 16 44:00 16:30 39 15 24:15 16:45 36 16 34:30 17:00 35 16 34:45 17:15 43 13 45:00 17:30 45 13 35:15 17:45 43 13 25:30 18:00 42 14 25:45 18:15 44 13 76:00 18:30 44 13 16:15 18:45 46 13 26:30 19:00 47 12 36:45 19:15 43 13 37:00 19:30 40 14 37:15 19:45
7:30 20:00
7:45 20:15 36 16 18:00 20:30
8:15 20:45
8:30 21:00
8:45 21:15
9:00 21:30
9:15 21:45
9:30 22:00
9:45 22:15
10:00 22:30
10:15 22:45
10:30 23:00
10:45 23:15
11:00 23:30
11:15 23:45
11:30
Tuesday, June 16, 2015
Time
(A)
Average
Travel
Time (Seconds)
(B)
Average
Speed (MPH)
(C)
Sample Size
(D)
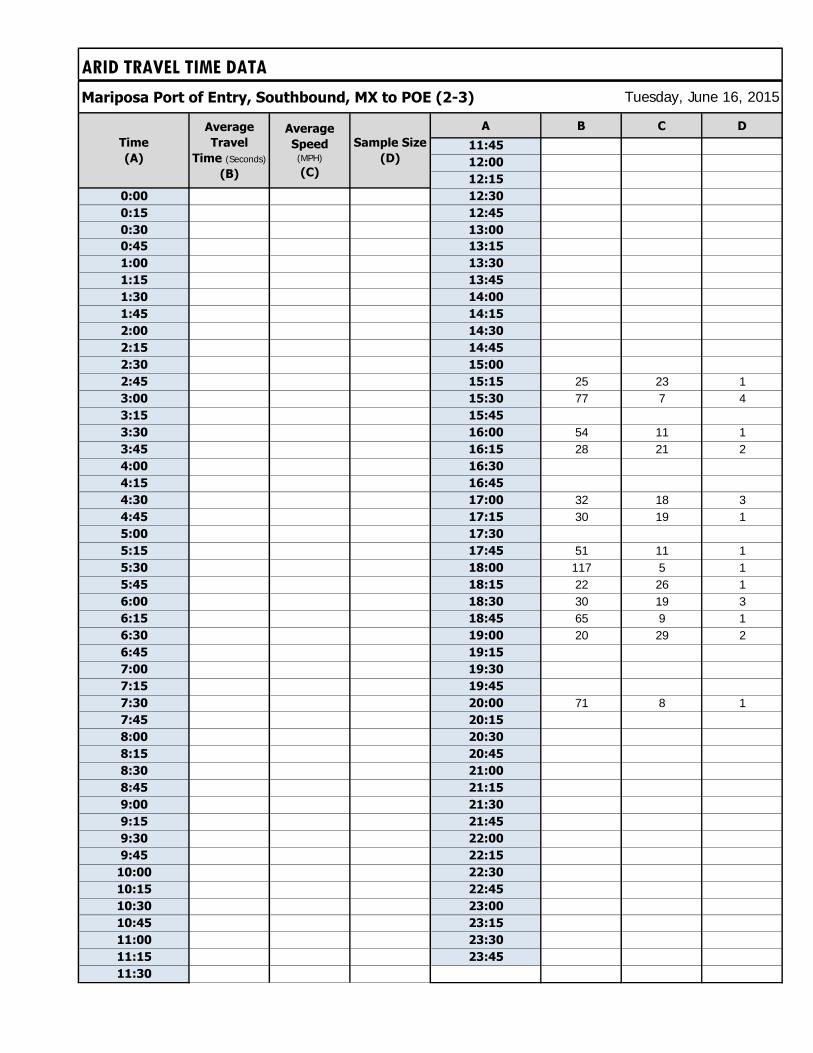
ARID TRAVEL TIME DATA
Mariposa Port of Entry, Southbound, MX to POE (2-3)
A B C D
11:45
12:00
12:15
0:00 12:30
0:15 12:45
0:30 13:00
0:45 13:15
1:00 13:30
1:15 13:45
1:30 14:00
1:45 14:15
2:00 14:30
2:15 14:45
2:30 15:00
2:45 15:15 25 23 13:00 15:30 77 7 43:15 15:45
3:30 16:00 54 11 13:45 16:15 28 21 24:00 16:30
4:15 16:45
4:30 17:00 32 18 34:45 17:15 30 19 15:00 17:30
5:15 17:45 51 11 15:30 18:00 117 5 15:45 18:15 22 26 16:00 18:30 30 19 36:15 18:45 65 9 16:30 19:00 20 29 26:45 19:15
7:00 19:30
7:15 19:45
7:30 20:00 71 8 17:45 20:15
8:00 20:30
8:15 20:45
8:30 21:00
8:45 21:15
9:00 21:30
9:15 21:45
9:30 22:00
9:45 22:15
10:00 22:30
10:15 22:45
10:30 23:00
10:45 23:15
11:00 23:30
11:15 23:45
11:30
Tuesday, June 16, 2015
Time
(A)
Average
Speed (MPH)
(C)
Sample Size
(D)
Average
Travel
Time (Seconds)
(B)

ARID TRAVEL TIME SUMMARY
Mariposa Port of Entry Nogales, SonoraSegment Length: 0.16 miles
MX to POE (3-2) POE to MX (2-3)
Travel Time Samples Collected: Travel Time Samples Collected:
Entire Day Entire DayHours Analyzed Hours AnalyzedAverage Matches Per Hour Average Matches Per Hour
Average Travel Time (sec) Average Travel Time (sec)
Sou
thb
ound
Wednesday, June 17, 2015
143 2813 1311
44.2
Nor
thbou
nd
2
132.7
0
500
1000
1500
2000
2500
Tra
ve
l T
ime
in
se
co
nd
s
Northbound
0
500
1000
1500
2000
2500
Tra
ve
l T
ime
in
se
co
nd
s
Southbound
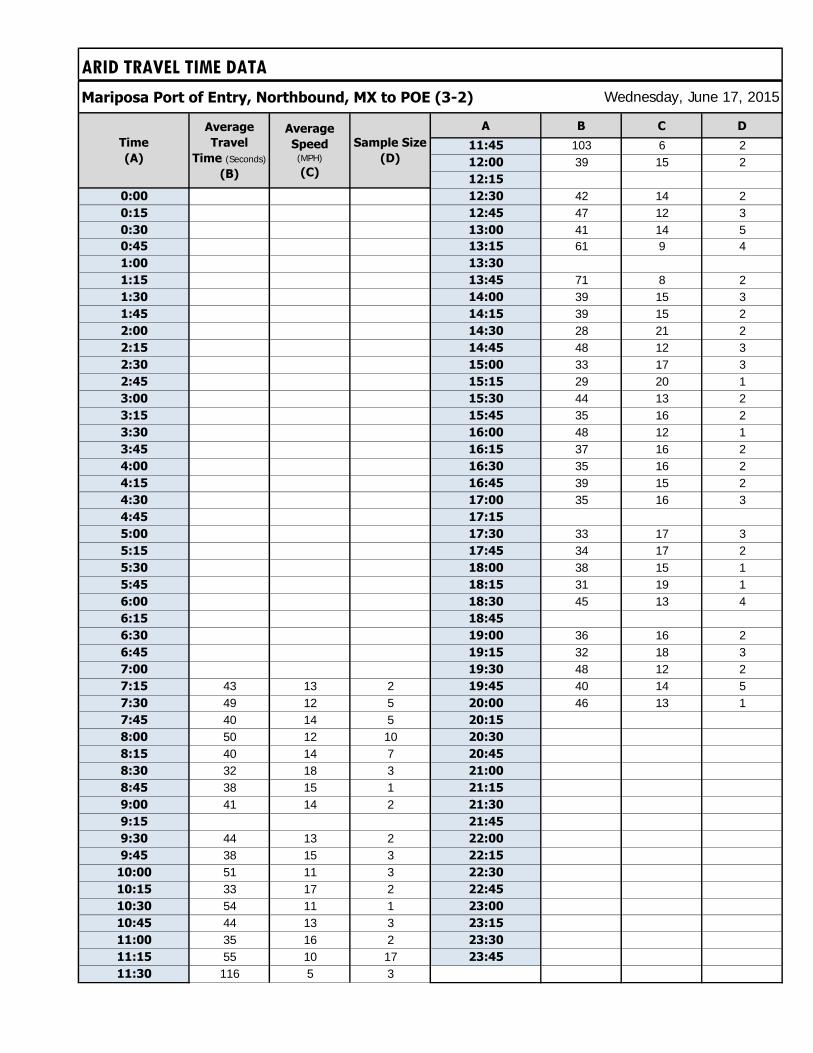
ARID TRAVEL TIME DATA
Mariposa Port of Entry, Northbound, MX to POE (3-2)
A B C D
11:45 103 6 212:00 39 15 212:15
0:00 12:30 42 14 20:15 12:45 47 12 30:30 13:00 41 14 50:45 13:15 61 9 41:00 13:30
1:15 13:45 71 8 21:30 14:00 39 15 31:45 14:15 39 15 22:00 14:30 28 21 22:15 14:45 48 12 32:30 15:00 33 17 32:45 15:15 29 20 13:00 15:30 44 13 23:15 15:45 35 16 23:30 16:00 48 12 13:45 16:15 37 16 24:00 16:30 35 16 24:15 16:45 39 15 24:30 17:00 35 16 34:45 17:15
5:00 17:30 33 17 35:15 17:45 34 17 25:30 18:00 38 15 15:45 18:15 31 19 16:00 18:30 45 13 46:15 18:45
6:30 19:00 36 16 26:45 19:15 32 18 37:00 19:30 48 12 27:15 43 13 2 19:45 40 14 57:30 49 12 5 20:00 46 13 17:45 40 14 5 20:15
8:00 50 12 10 20:30
8:15 40 14 7 20:45
8:30 32 18 3 21:00
8:45 38 15 1 21:15
9:00 41 14 2 21:30
9:15 21:45
9:30 44 13 2 22:00
9:45 38 15 3 22:15
10:00 51 11 3 22:30
10:15 33 17 2 22:45
10:30 54 11 1 23:00
10:45 44 13 3 23:15
11:00 35 16 2 23:30
11:15 55 10 17 23:45
11:30 116 5 3
Wednesday, June 17, 2015
Time
(A)
Average
Travel
Time (Seconds)
(B)
Average
Speed (MPH)
(C)
Sample Size
(D)

ARID TRAVEL TIME DATA
Mariposa Port of Entry, Southbound, MX to POE (2-3)
A B C D
11:45
12:00
12:15
0:00 12:30
0:15 12:45
0:30 13:00
0:45 13:15
1:00 13:30 47 12 11:15 13:45 151 4 11:30 14:00 114 5 11:45 14:15
2:00 14:30
2:15 14:45
2:30 15:00
2:45 15:15 50 12 33:00 15:30 75 8 13:15 15:45
3:30 16:00 130 4 13:45 16:15
4:00 16:30
4:15 16:45 127 5 14:30 17:00 45 13 24:45 17:15 152 4 25:00 17:30 107 5 25:15 17:45 42 14 25:30 18:00 16 36 15:45 18:15
6:00 18:30 81 7 16:15 18:45
6:30 19:00 66 9 16:45 19:15 20 29 17:00 19:30
7:15 19:45
7:30 20:00
7:45 20:15
8:00 311 2 1 20:30
8:15 20:45
8:30 21:00
8:45 21:15
9:00 21:30
9:15 21:45
9:30 385 1 1 22:00
9:45 22:15
10:00 22:30
10:15 407 1 1 22:45
10:30 23:00
10:45 201 3 1 23:15
11:00 23:30
11:15 23:45
11:30 126 5 3
Wednesday, June 17, 2015
Time
(A)
Average
Speed (MPH)
(C)
Sample Size
(D)
Average
Travel
Time (Seconds)
(B)
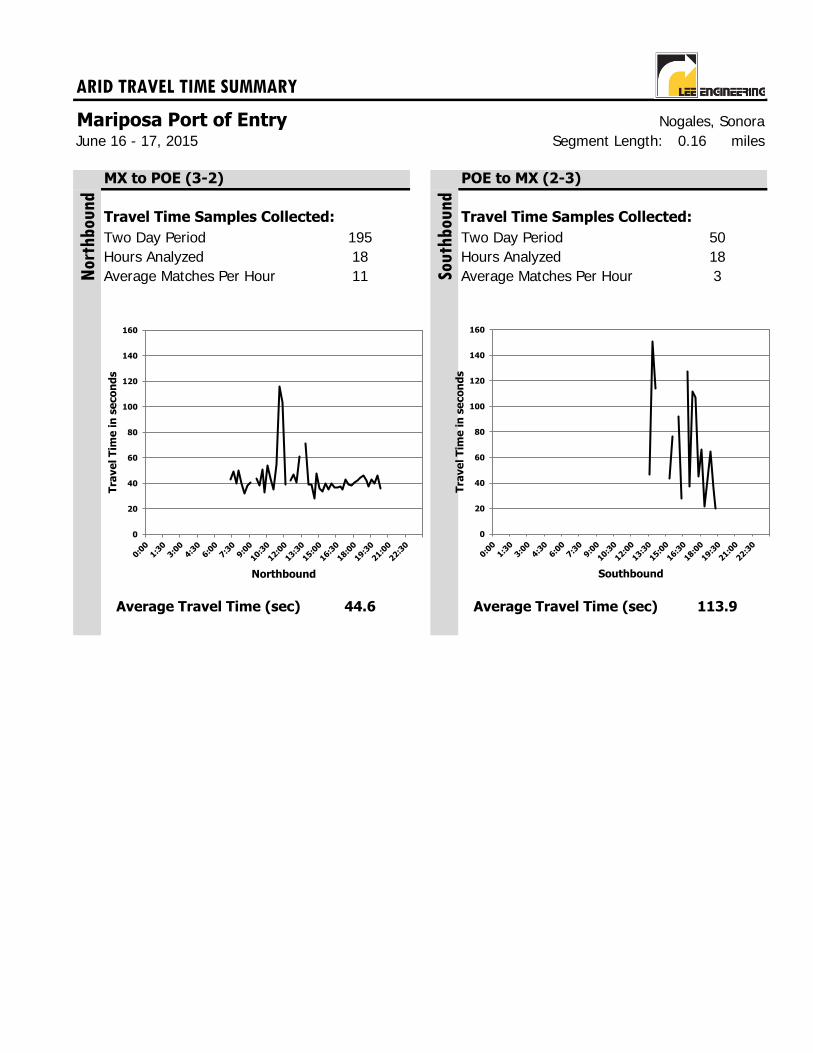
ARID TRAVEL TIME SUMMARY
Mariposa Port of Entry Nogales, SonoraSegment Length: 0.16 miles
MX to POE (3-2) POE to MX (2-3)
Travel Time Samples Collected: Travel Time Samples Collected:
Two Day Period Two Day PeriodHours Analyzed Hours AnalyzedAverage Matches Per Hour Average Matches Per Hour
Average Travel Time (sec) Average Travel Time (sec)
3
44.6 113.9
June 16 - 17, 2015
Nor
thbou
nd
Sou
thb
ound
195 5018 1811
0
20
40
60
80
100
120
140
160
Tra
ve
l T
ime
in
se
co
nd
s
Northbound
0
20
40
60
80
100
120
140
160
Tra
ve
l T
ime
in
se
co
nd
s
Southbound
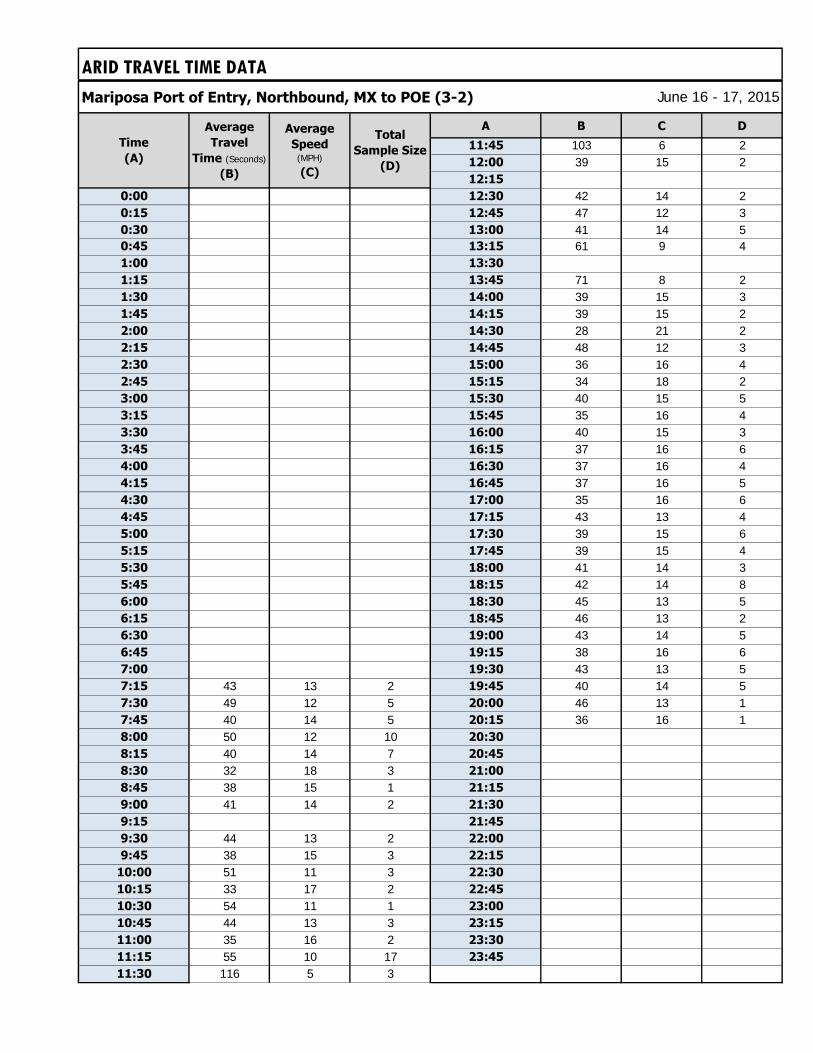
ARID TRAVEL TIME DATA
Mariposa Port of Entry, Northbound, MX to POE (3-2)
A B C D
11:45 103 6 212:00 39 15 212:15
0:00 12:30 42 14 20:15 12:45 47 12 30:30 13:00 41 14 50:45 13:15 61 9 41:00 13:30
1:15 13:45 71 8 21:30 14:00 39 15 31:45 14:15 39 15 22:00 14:30 28 21 22:15 14:45 48 12 32:30 15:00 36 16 42:45 15:15 34 18 23:00 15:30 40 15 53:15 15:45 35 16 43:30 16:00 40 15 33:45 16:15 37 16 64:00 16:30 37 16 44:15 16:45 37 16 54:30 17:00 35 16 64:45 17:15 43 13 45:00 17:30 39 15 65:15 17:45 39 15 45:30 18:00 41 14 35:45 18:15 42 14 86:00 18:30 45 13 56:15 18:45 46 13 26:30 19:00 43 14 56:45 19:15 38 16 67:00 19:30 43 13 57:15 43 13 2 19:45 40 14 57:30 49 12 5 20:00 46 13 17:45 40 14 5 20:15 36 16 18:00 50 12 10 20:30
8:15 40 14 7 20:45
8:30 32 18 3 21:00
8:45 38 15 1 21:15
9:00 41 14 2 21:30
9:15 21:45
9:30 44 13 2 22:00
9:45 38 15 3 22:15
10:00 51 11 3 22:30
10:15 33 17 2 22:45
10:30 54 11 1 23:00
10:45 44 13 3 23:15
11:00 35 16 2 23:30
11:15 55 10 17 23:45
11:30 116 5 3
June 16 - 17, 2015
Time
(A)
Average
Travel
Time (Seconds)
(B)
Average
Speed (MPH)
(C)
Total
Sample Size
(D)

ARID TRAVEL TIME DATA
Mariposa Port of Entry, Southbound, MX to POE (2-3)
A B C D
11:45
12:00
12:15
0:00 12:30
0:15 12:45
0:30 13:00
0:45 13:15
1:00 13:30 47 12 11:15 13:45 151 4 11:30 14:00 114 5 11:45 14:15
2:00 14:30
2:15 14:45
2:30 15:00
2:45 15:15 44 15 43:00 15:30 77 7 53:15 15:45
3:30 16:00 92 8 23:45 16:15 28 21 24:00 16:30
4:15 16:45 127 5 14:30 17:00 37 16 54:45 17:15 111 9 35:00 17:30 107 5 25:15 17:45 45 13 35:30 18:00 67 21 25:45 18:15 22 26 16:00 18:30 43 16 46:15 18:45 65 9 16:30 19:00 35 22 36:45 19:15 20 29 17:00 19:30
7:15 19:45
7:30 20:00 71 8 17:45 20:15
8:00 311 2 1 20:30
8:15 20:45
8:30 21:00
8:45 21:15
9:00 21:30
9:15 21:45
9:30 385 1 1 22:00
9:45 22:15
10:00 22:30
10:15 407 1 1 22:45
10:30 23:00
10:45 201 3 1 23:15
11:00 23:30
11:15 23:45
11:30 126 5 3
June 16 - 17, 2015
Time
(A)
Average
Travel
Time (Seconds)
(B)
Average
Speed (MPH)
(C)
Total
Sample Size
(D)
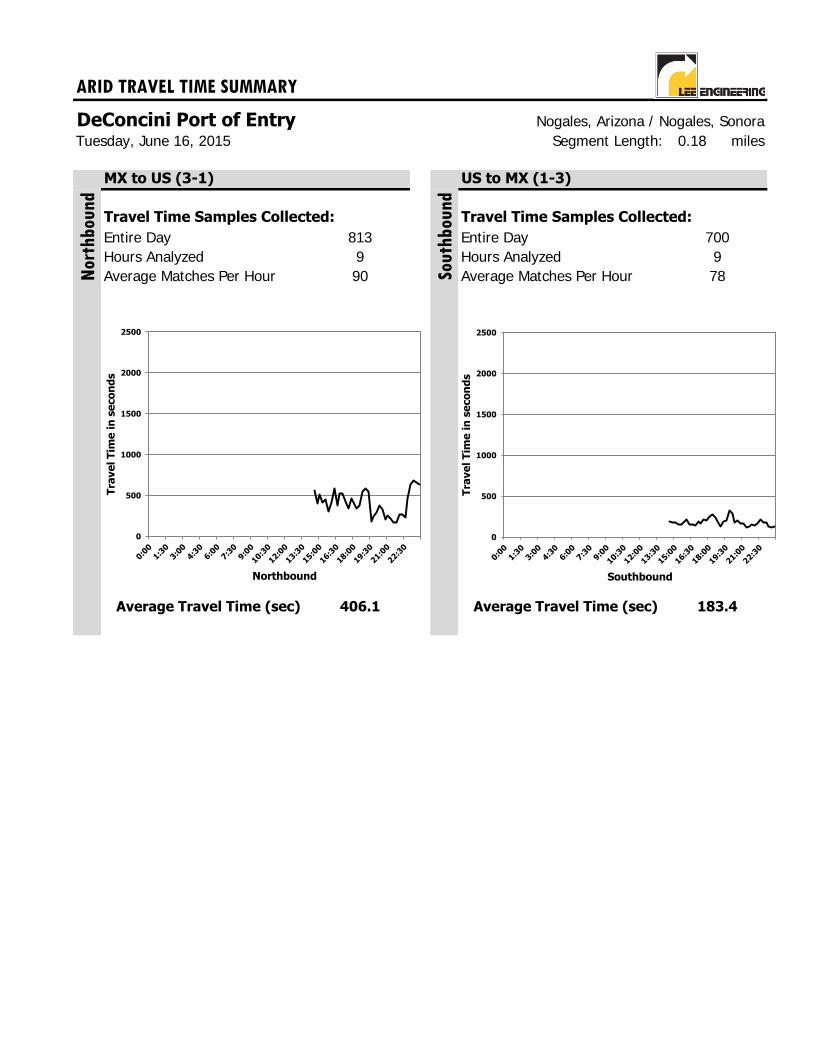
ARID TRAVEL TIME SUMMARY
DeConcini Port of Entry Nogales, Arizona / Nogales, SonoraSegment Length: 0.18 miles
MX to US (3-1) US to MX (1-3)
Travel Time Samples Collected: Travel Time Samples Collected:
Entire Day Entire DayHours Analyzed Hours AnalyzedAverage Matches Per Hour Average Matches Per Hour
Average Travel Time (sec) Average Travel Time (sec)
Tuesday, June 16, 2015
813 700
90 7899
406.1 183.4
Nor
thbou
nd
Sou
thb
ound
0
500
1000
1500
2000
2500
Tra
ve
l T
ime
in
se
co
nd
s
Northbound
0
500
1000
1500
2000
2500
Tra
ve
l T
ime
in
se
co
nd
s
Southbound
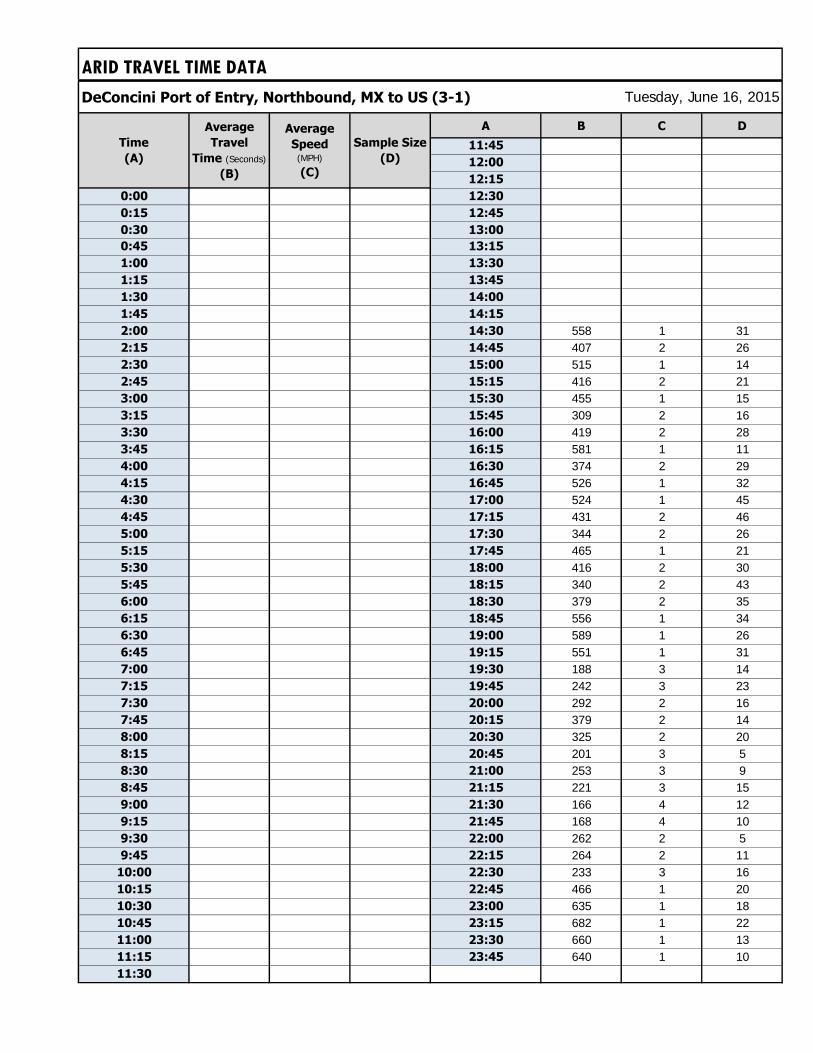
ARID TRAVEL TIME DATA
DeConcini Port of Entry, Northbound, MX to US (3-1)
A B C D
11:45
12:00
12:15
0:00 12:30
0:15 12:45
0:30 13:00
0:45 13:15
1:00 13:30
1:15 13:45
1:30 14:00
1:45 14:15
2:00 14:30 558 1 312:15 14:45 407 2 262:30 15:00 515 1 142:45 15:15 416 2 213:00 15:30 455 1 153:15 15:45 309 2 163:30 16:00 419 2 283:45 16:15 581 1 114:00 16:30 374 2 294:15 16:45 526 1 324:30 17:00 524 1 454:45 17:15 431 2 465:00 17:30 344 2 265:15 17:45 465 1 215:30 18:00 416 2 305:45 18:15 340 2 436:00 18:30 379 2 356:15 18:45 556 1 346:30 19:00 589 1 266:45 19:15 551 1 317:00 19:30 188 3 147:15 19:45 242 3 237:30 20:00 292 2 167:45 20:15 379 2 148:00 20:30 325 2 208:15 20:45 201 3 58:30 21:00 253 3 98:45 21:15 221 3 159:00 21:30 166 4 129:15 21:45 168 4 109:30 22:00 262 2 59:45 22:15 264 2 11
10:00 22:30 233 3 1610:15 22:45 466 1 2010:30 23:00 635 1 1810:45 23:15 682 1 2211:00 23:30 660 1 1311:15 23:45 640 1 1011:30
Tuesday, June 16, 2015
Time
(A)
Average
Travel
Time (Seconds)
(B)
Average
Speed (MPH)
(C)
Sample Size
(D)
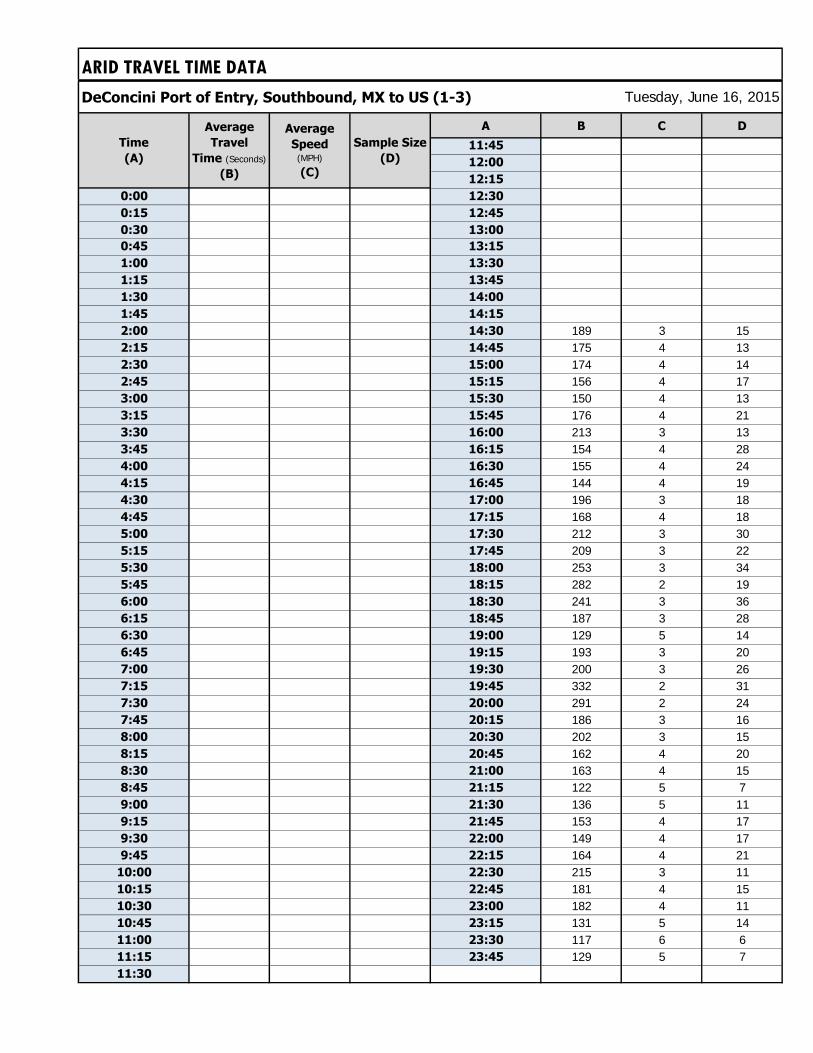
ARID TRAVEL TIME DATA
DeConcini Port of Entry, Southbound, MX to US (1-3)
A B C D
11:45
12:00
12:15
0:00 12:30
0:15 12:45
0:30 13:00
0:45 13:15
1:00 13:30
1:15 13:45
1:30 14:00
1:45 14:15
2:00 14:30 189 3 152:15 14:45 175 4 132:30 15:00 174 4 142:45 15:15 156 4 173:00 15:30 150 4 133:15 15:45 176 4 213:30 16:00 213 3 133:45 16:15 154 4 284:00 16:30 155 4 244:15 16:45 144 4 194:30 17:00 196 3 184:45 17:15 168 4 185:00 17:30 212 3 305:15 17:45 209 3 225:30 18:00 253 3 345:45 18:15 282 2 196:00 18:30 241 3 366:15 18:45 187 3 286:30 19:00 129 5 146:45 19:15 193 3 207:00 19:30 200 3 267:15 19:45 332 2 317:30 20:00 291 2 247:45 20:15 186 3 168:00 20:30 202 3 158:15 20:45 162 4 208:30 21:00 163 4 158:45 21:15 122 5 79:00 21:30 136 5 119:15 21:45 153 4 179:30 22:00 149 4 179:45 22:15 164 4 21
10:00 22:30 215 3 1110:15 22:45 181 4 1510:30 23:00 182 4 1110:45 23:15 131 5 1411:00 23:30 117 6 611:15 23:45 129 5 711:30
Tuesday, June 16, 2015
Average
Speed (MPH)
(C)
Sample Size
(D)
Time
(A)
Average
Travel
Time (Seconds)
(B)
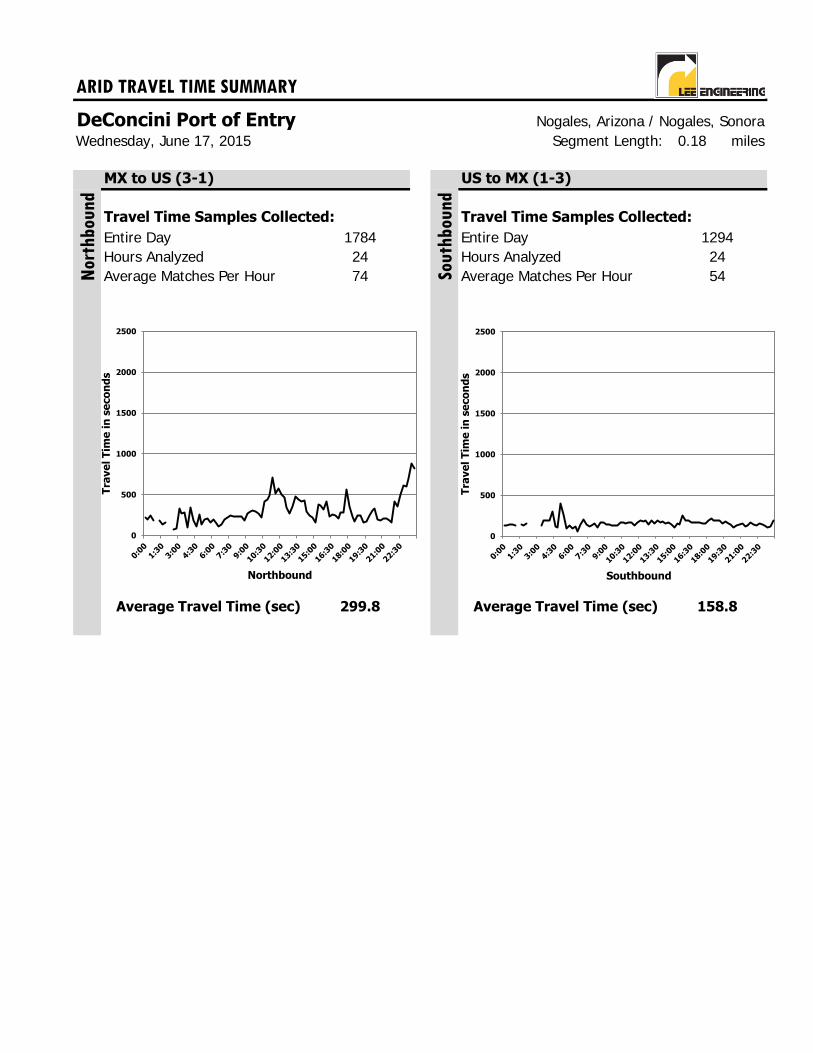
ARID TRAVEL TIME SUMMARY
DeConcini Port of Entry Nogales, Arizona / Nogales, SonoraSegment Length: 0.18 miles
MX to US (3-1) US to MX (1-3)
Travel Time Samples Collected: Travel Time Samples Collected:
Entire Day Entire DayHours Analyzed Hours AnalyzedAverage Matches Per Hour Average Matches Per Hour
Average Travel Time (sec) Average Travel Time (sec)
Sou
thb
ound
158.8
Wednesday, June 17, 2015
1784 129424 2474N
orth
bou
nd
299.8
54
0
500
1000
1500
2000
2500
Tra
ve
l T
ime
in
se
co
nd
s
Northbound
0
500
1000
1500
2000
2500
Tra
ve
l T
ime
in
se
co
nd
s
Southbound

ARID TRAVEL TIME DATA
DeConcini Port of Entry, Northbound, MX to US (3-1)
A B C D
11:45 577 1 3512:00 503 1 3012:15 462 1 29
0:00 225 3 3 12:30 347 2 220:15 193 3 3 12:45 270 2 120:30 239 3 10 13:00 352 2 260:45 186 3 7 13:15 477 1 231:00 13:30 441 1 421:15 186 3 2 13:45 422 2 191:30 134 5 2 14:00 432 2 381:45 164 4 2 14:15 290 2 342:00 14:30 241 3 352:15 14:45 220 3 242:30 71 9 1 15:00 162 4 192:45 90 7 1 15:15 377 2 203:00 327 2 1 15:30 367 2 273:15 272 2 5 15:45 322 2 243:30 283 2 5 16:00 419 2 313:45 92 7 1 16:15 232 3 274:00 338 2 5 16:30 254 3 224:15 178 4 3 16:45 244 3 254:30 110 6 2 17:00 205 3 164:45 252 3 5 17:15 277 2 55:00 135 5 8 17:30 286 2 225:15 201 3 3 17:45 562 1 365:30 205 3 12 18:00 359 2 275:45 166 4 5 18:15 229 3 336:00 193 3 7 18:30 171 4 246:15 149 4 14 18:45 249 3 306:30 117 6 13 19:00 247 3 286:45 139 5 14 19:15 160 4 247:00 197 3 9 19:30 176 4 217:15 219 3 24 19:45 242 3 207:30 240 3 25 20:00 306 2 217:45 236 3 28 20:15 334 2 278:00 231 3 29 20:30 201 3 128:15 230 3 46 20:45 181 4 198:30 231 3 23 21:00 203 3 198:45 183 4 25 21:15 206 3 209:00 275 2 28 21:30 183 4 109:15 289 2 39 21:45 163 4 149:30 310 2 31 22:00 416 2 129:45 289 2 30 22:15 360 2 13
10:00 272 2 32 22:30 508 1 2610:15 219 3 22 22:45 609 1 1810:30 416 2 22 23:00 598 1 1810:45 446 1 27 23:15 703 1 2011:00 483 1 21 23:30 880 1 911:15 713 1 24 23:45 820 1 1411:30 515 1 43
Wednesday, June 17, 2015
Time
(A)
Average
Travel
Time (Seconds)
(B)
Average
Speed (MPH)
(C)
Sample Size
(D)

ARID TRAVEL TIME DATA
DeConcini Port of Entry, Southbound, MX to US (1-3)
A B C D
11:45 166 4 2212:00 196 3 1912:15 185 4 18
0:00 129 5 5 12:30 190 3 240:15 132 5 4 12:45 145 4 180:30 147 4 3 13:00 196 3 160:45 147 4 5 13:15 153 4 141:00 134 5 8 13:30 188 3 221:15 13:45 162 4 191:30 139 5 1 14:00 182 4 291:45 136 5 2 14:15 158 4 292:00 160 4 4 14:30 171 4 142:15 14:45 139 5 192:30 15:00 104 6 132:45 15:15 154 4 133:00 15:30 149 4 213:15 132 5 2 15:45 257 3 293:30 187 3 7 16:00 196 3 133:45 187 3 3 16:15 193 3 224:00 194 3 1 16:30 161 4 284:15 296 2 4 16:45 162 4 214:30 124 5 1 17:00 163 4 254:45 102 6 1 17:15 165 4 45:00 394 2 3 17:30 155 4 235:15 264 2 5 17:45 160 4 175:30 90 7 2 18:00 190 3 205:45 137 5 9 18:15 219 3 356:00 95 7 3 18:30 187 3 346:15 122 5 8 18:45 197 3 396:30 60 11 1 19:00 191 3 246:45 146 4 6 19:15 155 4 347:00 205 3 9 19:30 182 4 247:15 146 4 2 19:45 158 4 317:30 122 5 9 20:00 148 4 347:45 134 5 5 20:15 110 6 148:00 157 4 5 20:30 131 5 128:15 111 6 9 20:45 142 5 228:30 164 4 13 21:00 160 4 278:45 163 4 12 21:15 124 5 149:00 148 4 7 21:30 137 5 179:15 139 5 11 21:45 161 4 289:30 127 5 12 22:00 140 5 219:45 135 5 16 22:15 130 5 22
10:00 130 5 16 22:30 158 4 2510:15 162 4 9 22:45 138 5 1110:30 166 4 13 23:00 132 5 1110:45 157 4 17 23:15 110 6 511:00 164 4 13 23:30 123 5 611:15 171 4 12 23:45 197 3 111:30 130 5 13
Wednesday, June 17, 2015
Time
(A)
Average
Speed (MPH)
(C)
Sample Size
(D)
Average
Travel
Time (Seconds)
(B)
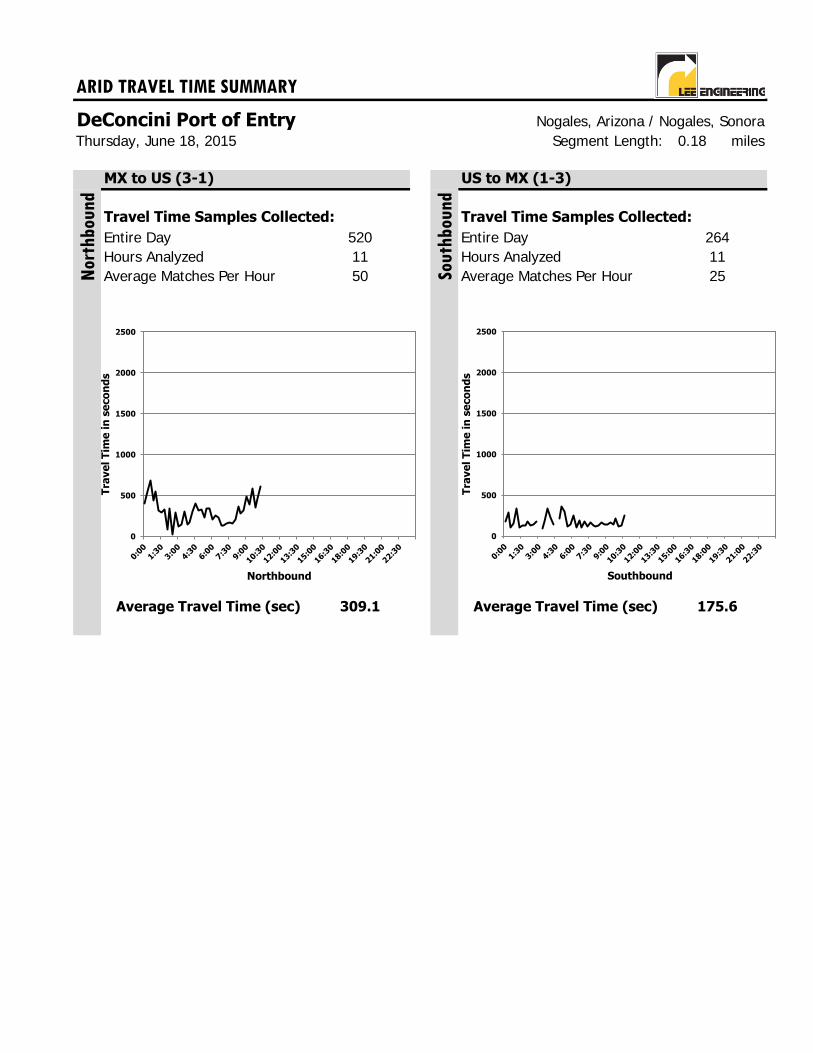
ARID TRAVEL TIME SUMMARY
DeConcini Port of Entry Nogales, Arizona / Nogales, SonoraSegment Length: 0.18 miles
MX to US (3-1) US to MX (1-3)
Travel Time Samples Collected: Travel Time Samples Collected:
Entire Day Entire DayHours Analyzed Hours AnalyzedAverage Matches Per Hour Average Matches Per Hour
Average Travel Time (sec) Average Travel Time (sec)
Sou
thb
ound
Thursday, June 18, 2015
520 26411 1150
309.1
Nor
thbou
nd
25
175.6
0
500
1000
1500
2000
2500
Tra
ve
l T
ime
in
se
co
nd
s
Northbound
0
500
1000
1500
2000
2500
Tra
ve
l T
ime
in
se
co
nd
s
Southbound
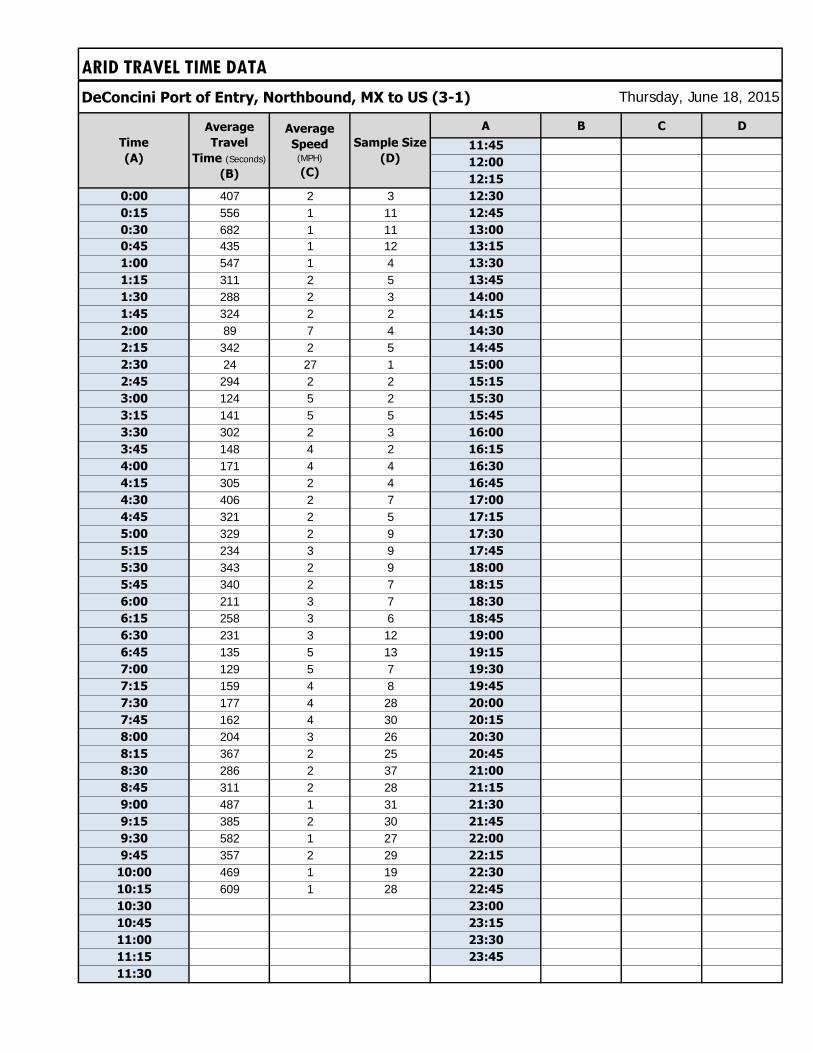
ARID TRAVEL TIME DATA
DeConcini Port of Entry, Northbound, MX to US (3-1)
A B C D
11:45
12:00
12:15
0:00 407 2 3 12:30
0:15 556 1 11 12:45
0:30 682 1 11 13:00
0:45 435 1 12 13:15
1:00 547 1 4 13:30
1:15 311 2 5 13:45
1:30 288 2 3 14:00
1:45 324 2 2 14:15
2:00 89 7 4 14:30
2:15 342 2 5 14:45
2:30 24 27 1 15:00
2:45 294 2 2 15:15
3:00 124 5 2 15:30
3:15 141 5 5 15:45
3:30 302 2 3 16:00
3:45 148 4 2 16:15
4:00 171 4 4 16:30
4:15 305 2 4 16:45
4:30 406 2 7 17:00
4:45 321 2 5 17:15
5:00 329 2 9 17:30
5:15 234 3 9 17:45
5:30 343 2 9 18:00
5:45 340 2 7 18:15
6:00 211 3 7 18:30
6:15 258 3 6 18:45
6:30 231 3 12 19:00
6:45 135 5 13 19:15
7:00 129 5 7 19:30
7:15 159 4 8 19:45
7:30 177 4 28 20:00
7:45 162 4 30 20:15
8:00 204 3 26 20:30
8:15 367 2 25 20:45
8:30 286 2 37 21:00
8:45 311 2 28 21:15
9:00 487 1 31 21:30
9:15 385 2 30 21:45
9:30 582 1 27 22:00
9:45 357 2 29 22:15
10:00 469 1 19 22:30
10:15 609 1 28 22:45
10:30 23:00
10:45 23:15
11:00 23:30
11:15 23:45
11:30
Thursday, June 18, 2015
Time
(A)
Average
Travel
Time (Seconds)
(B)
Average
Speed (MPH)
(C)
Sample Size
(D)
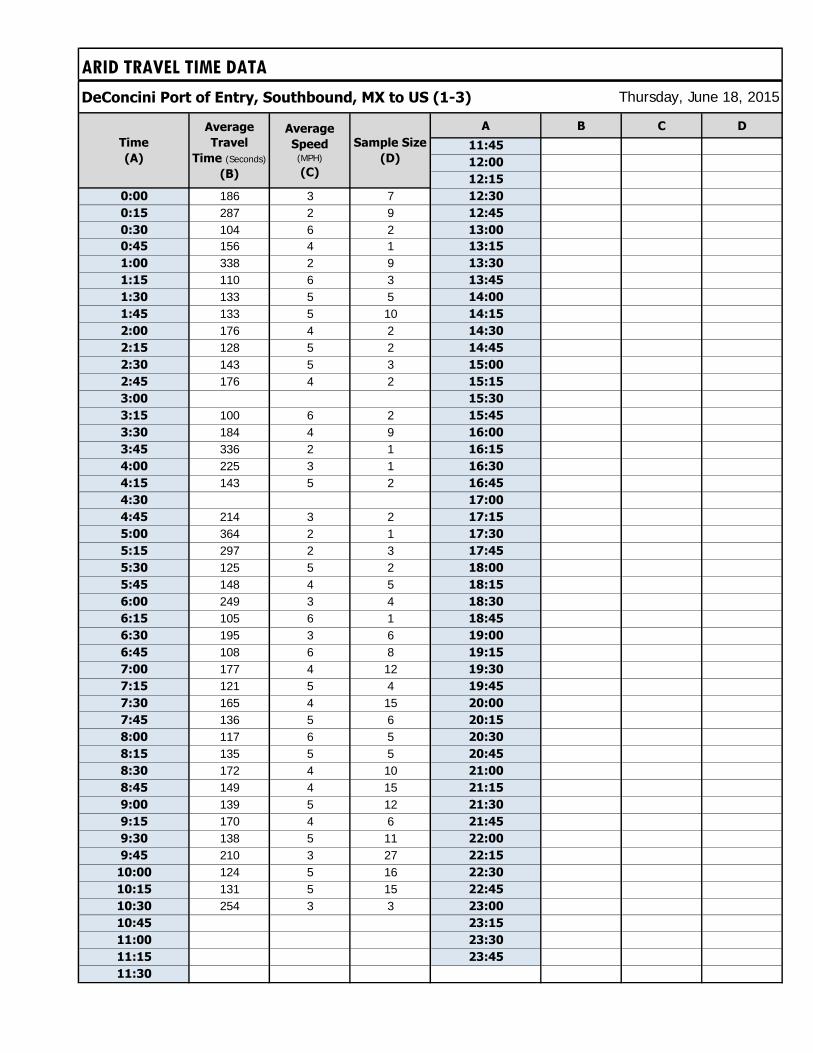
ARID TRAVEL TIME DATA
DeConcini Port of Entry, Southbound, MX to US (1-3)
A B C D
11:45
12:00
12:15
0:00 186 3 7 12:30
0:15 287 2 9 12:45
0:30 104 6 2 13:00
0:45 156 4 1 13:15
1:00 338 2 9 13:30
1:15 110 6 3 13:45
1:30 133 5 5 14:00
1:45 133 5 10 14:15
2:00 176 4 2 14:30
2:15 128 5 2 14:45
2:30 143 5 3 15:00
2:45 176 4 2 15:15
3:00 15:30
3:15 100 6 2 15:45
3:30 184 4 9 16:00
3:45 336 2 1 16:15
4:00 225 3 1 16:30
4:15 143 5 2 16:45
4:30 17:00
4:45 214 3 2 17:15
5:00 364 2 1 17:30
5:15 297 2 3 17:45
5:30 125 5 2 18:00
5:45 148 4 5 18:15
6:00 249 3 4 18:30
6:15 105 6 1 18:45
6:30 195 3 6 19:00
6:45 108 6 8 19:15
7:00 177 4 12 19:30
7:15 121 5 4 19:45
7:30 165 4 15 20:00
7:45 136 5 6 20:15
8:00 117 6 5 20:30
8:15 135 5 5 20:45
8:30 172 4 10 21:00
8:45 149 4 15 21:15
9:00 139 5 12 21:30
9:15 170 4 6 21:45
9:30 138 5 11 22:00
9:45 210 3 27 22:15
10:00 124 5 16 22:30
10:15 131 5 15 22:45
10:30 254 3 3 23:00
10:45 23:15
11:00 23:30
11:15 23:45
11:30
Thursday, June 18, 2015
Time
(A)
Average
Speed (MPH)
(C)
Sample Size
(D)
Average
Travel
Time (Seconds)
(B)
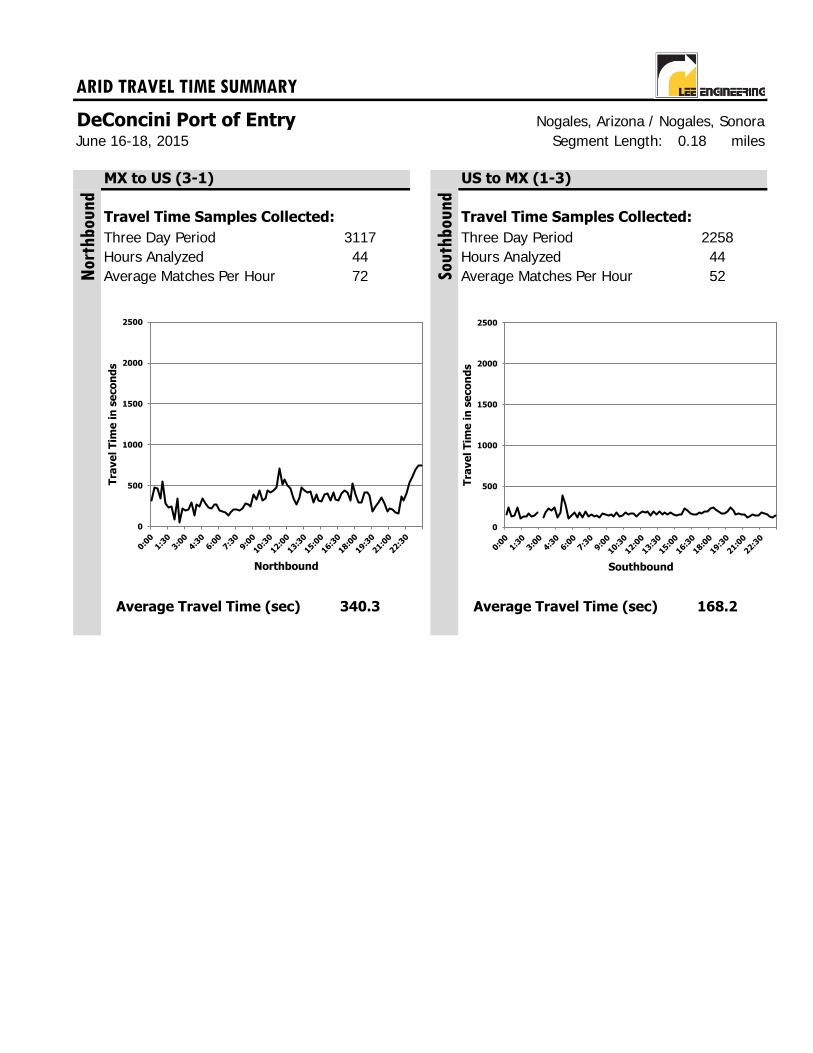
ARID TRAVEL TIME SUMMARY
DeConcini Port of Entry Nogales, Arizona / Nogales, SonoraJune 16-18, 2015 Segment Length: 0.18 miles
MX to US (3-1) US to MX (1-3)
Travel Time Samples Collected: Travel Time Samples Collected:
Three Day Period Three Day PeriodHours Analyzed Hours AnalyzedAverage Matches Per Hour Average Matches Per Hour
Average Travel Time (sec) Average Travel Time (sec)
Nor
thbou
nd
Sou
thb
ound
3117 225844 4472 52
340.3 168.2
0
500
1000
1500
2000
2500
Tra
ve
l T
ime
in
se
co
nd
s
Northbound
0
500
1000
1500
2000
2500
Tra
ve
l T
ime
in
se
co
nd
s
Southbound

ARID TRAVEL TIME DATA
DeConcini Port of Entry, Northbound, MX to US (3-1)
A B C D
11:45 577 1 3512:00 503 1 3012:15 462 1 29
0:00 316 3 6 12:30 347 2 220:15 478 1 14 12:45 270 2 120:30 471 2 21 13:00 352 2 260:45 343 2 19 13:15 477 1 231:00 547 1 4 13:30 441 1 421:15 275 2 7 13:45 422 2 191:30 226 3 5 14:00 432 2 381:45 244 3 4 14:15 290 2 342:00 89 7 4 14:30 390 2 662:15 342 2 5 14:45 317 2 502:30 48 18 2 15:00 312 3 332:45 226 4 3 15:15 397 2 413:00 192 4 3 15:30 398 2 423:15 207 4 10 15:45 317 2 403:30 290 2 8 16:00 419 2 593:45 129 5 3 16:15 333 2 384:00 264 3 9 16:30 322 2 514:15 251 3 7 16:45 402 2 574:30 340 3 9 17:00 440 2 614:45 287 3 10 17:15 416 2 515:00 238 3 17 17:30 317 2 485:15 226 3 12 17:45 526 1 575:30 264 3 21 18:00 389 2 575:45 268 3 12 18:15 292 2 766:00 202 3 14 18:30 294 3 596:15 182 4 20 18:45 412 2 646:30 172 5 25 19:00 412 2 546:45 137 5 27 19:15 380 2 557:00 167 4 16 19:30 181 4 357:15 204 3 32 19:45 242 3 437:30 207 4 53 20:00 300 2 377:45 198 4 58 20:15 349 2 418:00 218 3 55 20:30 279 2 328:15 278 3 71 20:45 185 4 248:30 265 2 60 21:00 219 3 288:45 251 3 53 21:15 212 3 359:00 386 1 59 21:30 174 4 229:15 331 2 69 21:45 165 4 249:30 437 2 58 22:00 371 2 179:45 322 2 59 22:15 316 2 24
10:00 345 2 51 22:30 403 2 4210:15 437 2 50 22:45 534 1 3810:30 416 2 22 23:00 617 1 3610:45 446 1 27 23:15 692 1 4211:00 483 1 21 23:30 750 1 2211:15 713 1 24 23:45 745 1 2411:30 515 1 43
Average
Travel
Time (Seconds)
(B)
Average
Speed (MPH)
(C)
Total
Sample Size
(D)
June 16-18, 2015
Time
(A)
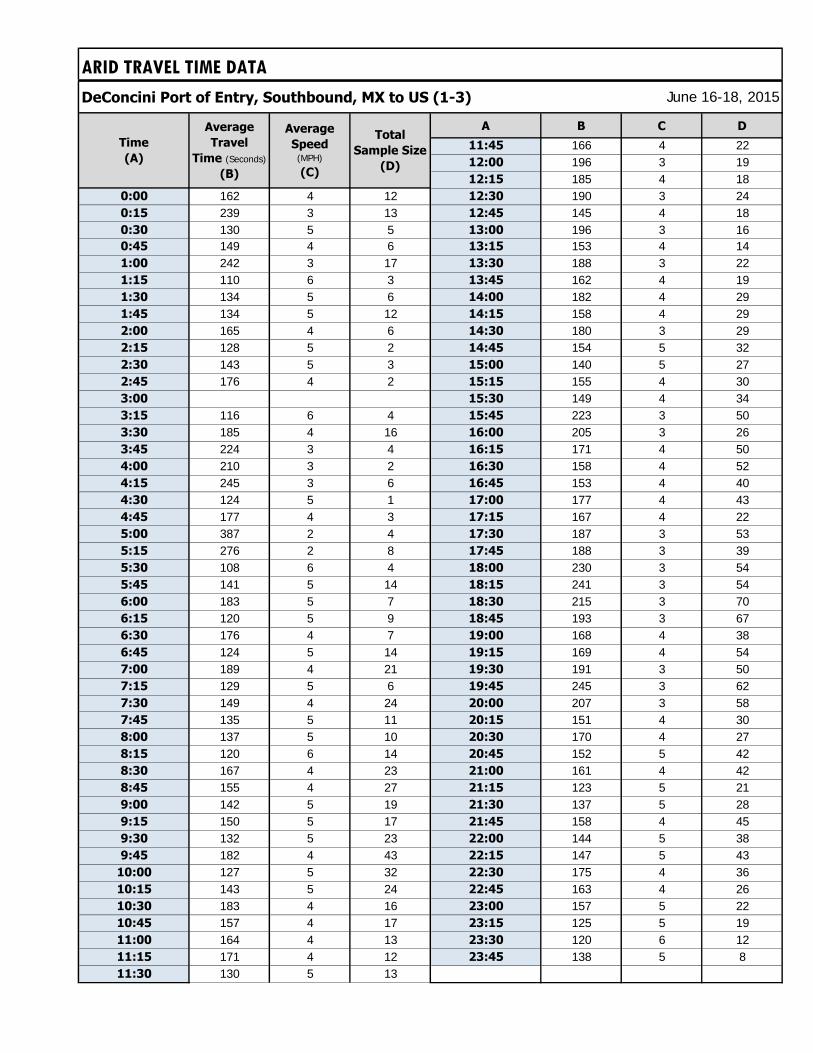
ARID TRAVEL TIME DATA
DeConcini Port of Entry, Southbound, MX to US (1-3)
A B C D
11:45 166 4 2212:00 196 3 1912:15 185 4 18
0:00 162 4 12 12:30 190 3 240:15 239 3 13 12:45 145 4 180:30 130 5 5 13:00 196 3 160:45 149 4 6 13:15 153 4 141:00 242 3 17 13:30 188 3 221:15 110 6 3 13:45 162 4 191:30 134 5 6 14:00 182 4 291:45 134 5 12 14:15 158 4 292:00 165 4 6 14:30 180 3 292:15 128 5 2 14:45 154 5 322:30 143 5 3 15:00 140 5 272:45 176 4 2 15:15 155 4 303:00 15:30 149 4 343:15 116 6 4 15:45 223 3 503:30 185 4 16 16:00 205 3 263:45 224 3 4 16:15 171 4 504:00 210 3 2 16:30 158 4 524:15 245 3 6 16:45 153 4 404:30 124 5 1 17:00 177 4 434:45 177 4 3 17:15 167 4 225:00 387 2 4 17:30 187 3 535:15 276 2 8 17:45 188 3 395:30 108 6 4 18:00 230 3 545:45 141 5 14 18:15 241 3 546:00 183 5 7 18:30 215 3 706:15 120 5 9 18:45 193 3 676:30 176 4 7 19:00 168 4 386:45 124 5 14 19:15 169 4 547:00 189 4 21 19:30 191 3 507:15 129 5 6 19:45 245 3 627:30 149 4 24 20:00 207 3 587:45 135 5 11 20:15 151 4 308:00 137 5 10 20:30 170 4 278:15 120 6 14 20:45 152 5 428:30 167 4 23 21:00 161 4 428:45 155 4 27 21:15 123 5 219:00 142 5 19 21:30 137 5 289:15 150 5 17 21:45 158 4 459:30 132 5 23 22:00 144 5 389:45 182 4 43 22:15 147 5 43
10:00 127 5 32 22:30 175 4 3610:15 143 5 24 22:45 163 4 2610:30 183 4 16 23:00 157 5 2210:45 157 4 17 23:15 125 5 1911:00 164 4 13 23:30 120 6 1211:15 171 4 12 23:45 138 5 811:30 130 5 13
Time
(A)
June 16-18, 2015
Average
Travel
Time (Seconds)
(B)
Average
Speed (MPH)
(C)
Total
Sample Size
(D)
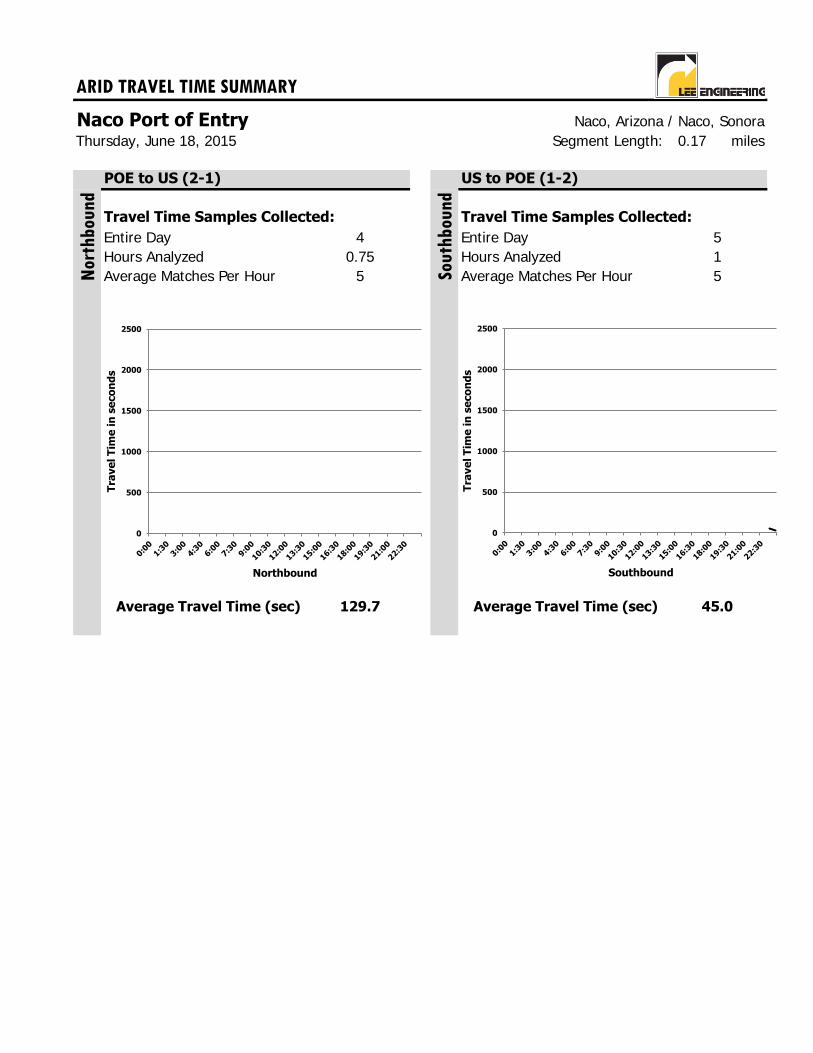
ARID TRAVEL TIME SUMMARY
Naco Port of Entry Naco, Arizona / Naco, SonoraSegment Length: 0.17 miles
POE to US (2-1) US to POE (1-2)
Travel Time Samples Collected: Travel Time Samples Collected:
Entire Day Entire DayHours Analyzed Hours AnalyzedAverage Matches Per Hour Average Matches Per Hour
Average Travel Time (sec) Average Travel Time (sec)
55
129.7 45.0
Nor
thbou
nd
Sou
thb
ound
Thursday, June 18, 2015
4 50.75 1
0
500
1000
1500
2000
2500
Tra
ve
l T
ime
in
se
co
nd
s
Northbound
0
500
1000
1500
2000
2500
Tra
ve
l T
ime
in
se
co
nd
s
Southbound

ARID TRAVEL TIME DATA
Naco Port of Entry, Northbound, POE to US (2-1)
A B C D
11:45
12:00
12:15
0:00 12:30
0:15 12:45
0:30 13:00
0:45 13:15
1:00 13:30
1:15 13:45
1:30 14:00
1:45 14:15
2:00 14:30
2:15 14:45
2:30 15:00
2:45 15:15
3:00 15:30
3:15 15:45
3:30 16:00
3:45 16:15
4:00 16:30
4:15 16:45
4:30 17:00
4:45 17:15
5:00 17:30
5:15 17:45
5:30 18:00
5:45 18:15
6:00 18:30
6:15 18:45
6:30 19:00
6:45 19:15
7:00 19:30
7:15 19:45
7:30 20:00
7:45 20:15
8:00 20:30
8:15 20:45
8:30 21:00
8:45 21:15
9:00 21:30
9:15 21:45
9:30 22:00
9:45 22:15
10:00 22:30
10:15 22:45 280 2 110:30 23:00
10:45 23:15 53 12 211:00 23:30
11:15 23:45 56 11 111:30
Time
(A)
Average
Travel
Time (Seconds)
(B)
Average
Speed (MPH)
(C)
Sample Size
(D)
Thursday, June 18, 2015
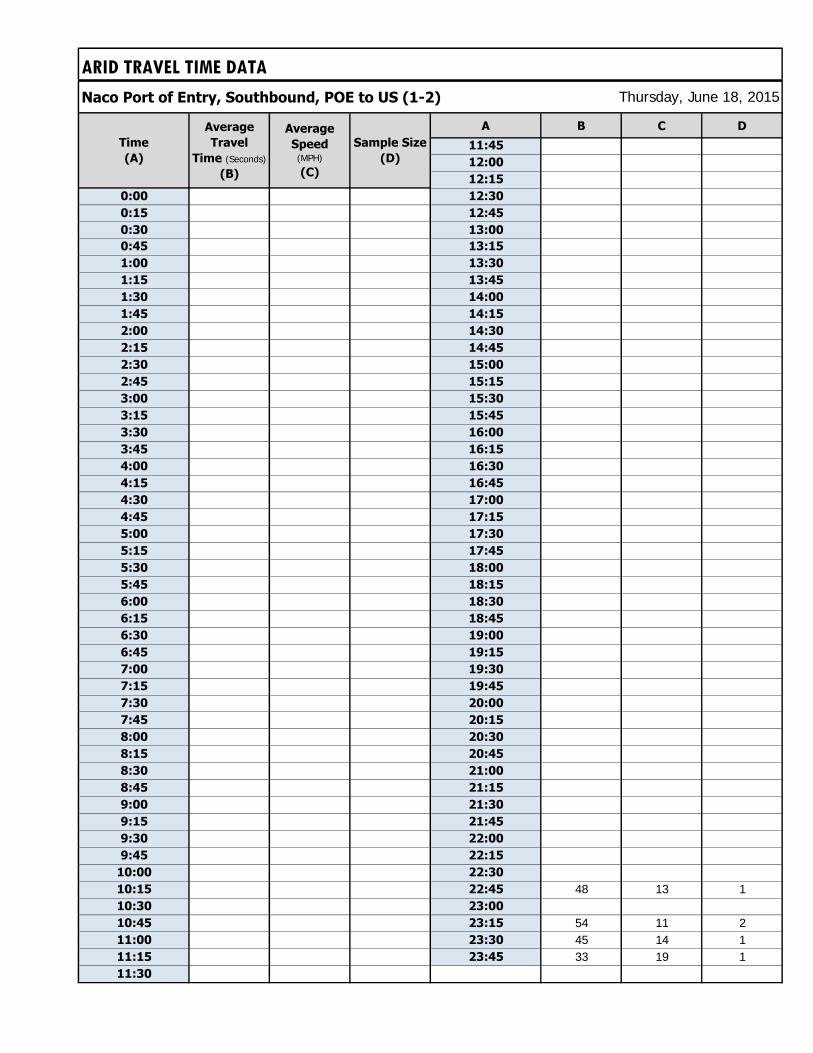
ARID TRAVEL TIME DATA
Naco Port of Entry, Southbound, POE to US (1-2)
A B C D
11:45
12:00
12:15
0:00 12:30
0:15 12:45
0:30 13:00
0:45 13:15
1:00 13:30
1:15 13:45
1:30 14:00
1:45 14:15
2:00 14:30
2:15 14:45
2:30 15:00
2:45 15:15
3:00 15:30
3:15 15:45
3:30 16:00
3:45 16:15
4:00 16:30
4:15 16:45
4:30 17:00
4:45 17:15
5:00 17:30
5:15 17:45
5:30 18:00
5:45 18:15
6:00 18:30
6:15 18:45
6:30 19:00
6:45 19:15
7:00 19:30
7:15 19:45
7:30 20:00
7:45 20:15
8:00 20:30
8:15 20:45
8:30 21:00
8:45 21:15
9:00 21:30
9:15 21:45
9:30 22:00
9:45 22:15
10:00 22:30
10:15 22:45 48 13 110:30 23:00
10:45 23:15 54 11 211:00 23:30 45 14 111:15 23:45 33 19 111:30
Average
Speed (MPH)
(C)
Sample Size
(D)
Average
Travel
Time (Seconds)
(B)
Time
(A)
Thursday, June 18, 2015
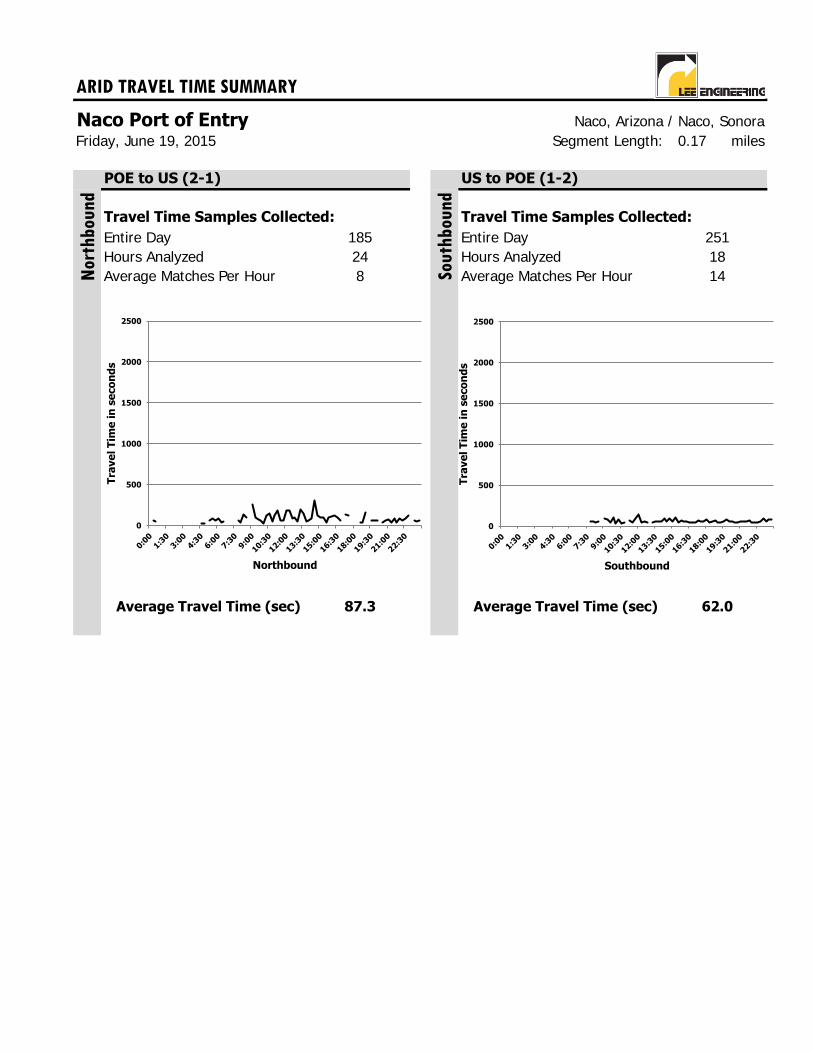
ARID TRAVEL TIME SUMMARY
Naco Port of Entry Naco, Arizona / Naco, SonoraSegment Length: 0.17 miles
POE to US (2-1) US to POE (1-2)
Travel Time Samples Collected: Travel Time Samples Collected:
Entire Day Entire DayHours Analyzed Hours AnalyzedAverage Matches Per Hour Average Matches Per Hour
Average Travel Time (sec) Average Travel Time (sec)
148
87.3 62.0
Nor
thbou
nd
Sou
thb
ound
Friday, June 19, 2015
185 25124 18
0
500
1000
1500
2000
2500
Tra
ve
l T
ime
in
se
co
nd
s
Northbound
0
500
1000
1500
2000
2500
Tra
ve
l T
ime
in
se
co
nd
s
Southbound
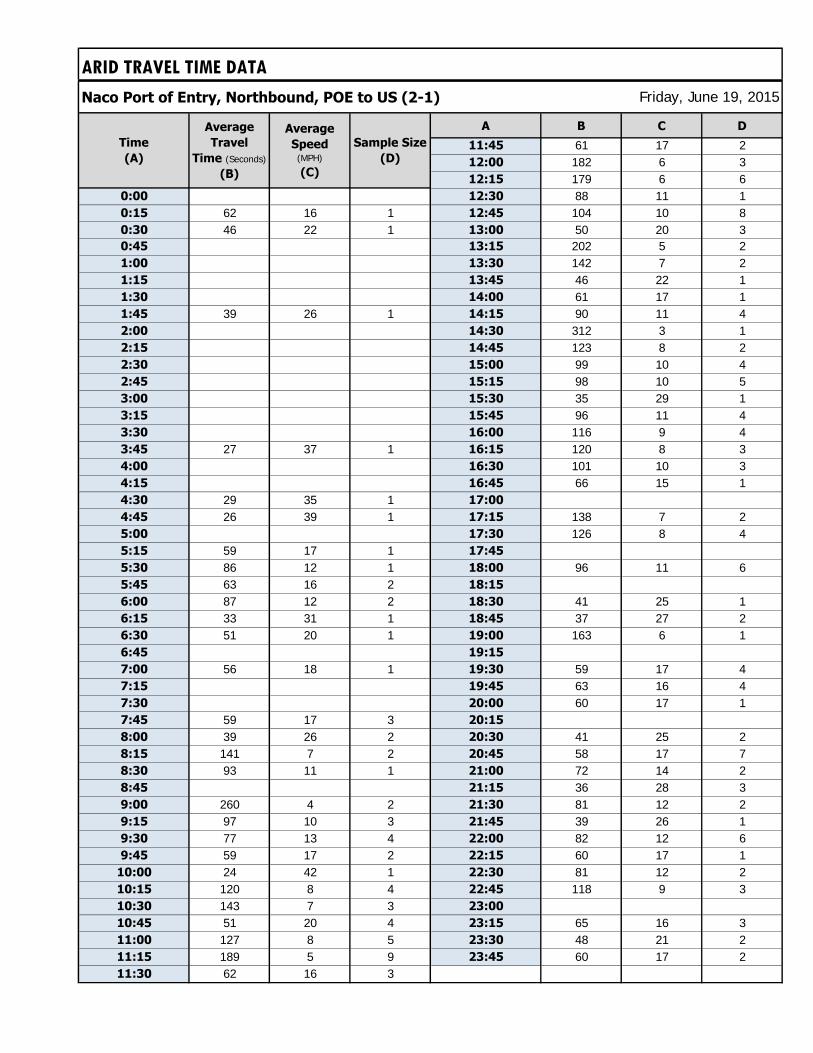
ARID TRAVEL TIME DATA
Naco Port of Entry, Northbound, POE to US (2-1)
A B C D
11:45 61 17 212:00 182 6 312:15 179 6 6
0:00 12:30 88 11 10:15 62 16 1 12:45 104 10 80:30 46 22 1 13:00 50 20 30:45 13:15 202 5 21:00 13:30 142 7 21:15 13:45 46 22 11:30 14:00 61 17 11:45 39 26 1 14:15 90 11 42:00 14:30 312 3 12:15 14:45 123 8 22:30 15:00 99 10 42:45 15:15 98 10 53:00 15:30 35 29 13:15 15:45 96 11 43:30 16:00 116 9 43:45 27 37 1 16:15 120 8 34:00 16:30 101 10 34:15 16:45 66 15 14:30 29 35 1 17:00
4:45 26 39 1 17:15 138 7 25:00 17:30 126 8 45:15 59 17 1 17:45
5:30 86 12 1 18:00 96 11 65:45 63 16 2 18:15
6:00 87 12 2 18:30 41 25 16:15 33 31 1 18:45 37 27 26:30 51 20 1 19:00 163 6 16:45 19:15
7:00 56 18 1 19:30 59 17 47:15 19:45 63 16 47:30 20:00 60 17 17:45 59 17 3 20:15
8:00 39 26 2 20:30 41 25 28:15 141 7 2 20:45 58 17 78:30 93 11 1 21:00 72 14 28:45 21:15 36 28 39:00 260 4 2 21:30 81 12 29:15 97 10 3 21:45 39 26 19:30 77 13 4 22:00 82 12 69:45 59 17 2 22:15 60 17 1
10:00 24 42 1 22:30 81 12 210:15 120 8 4 22:45 118 9 310:30 143 7 3 23:00
10:45 51 20 4 23:15 65 16 311:00 127 8 5 23:30 48 21 211:15 189 5 9 23:45 60 17 211:30 62 16 3
Time
(A)
Average
Travel
Time (Seconds)
(B)
Average
Speed (MPH)
(C)
Sample Size
(D)
Friday, June 19, 2015
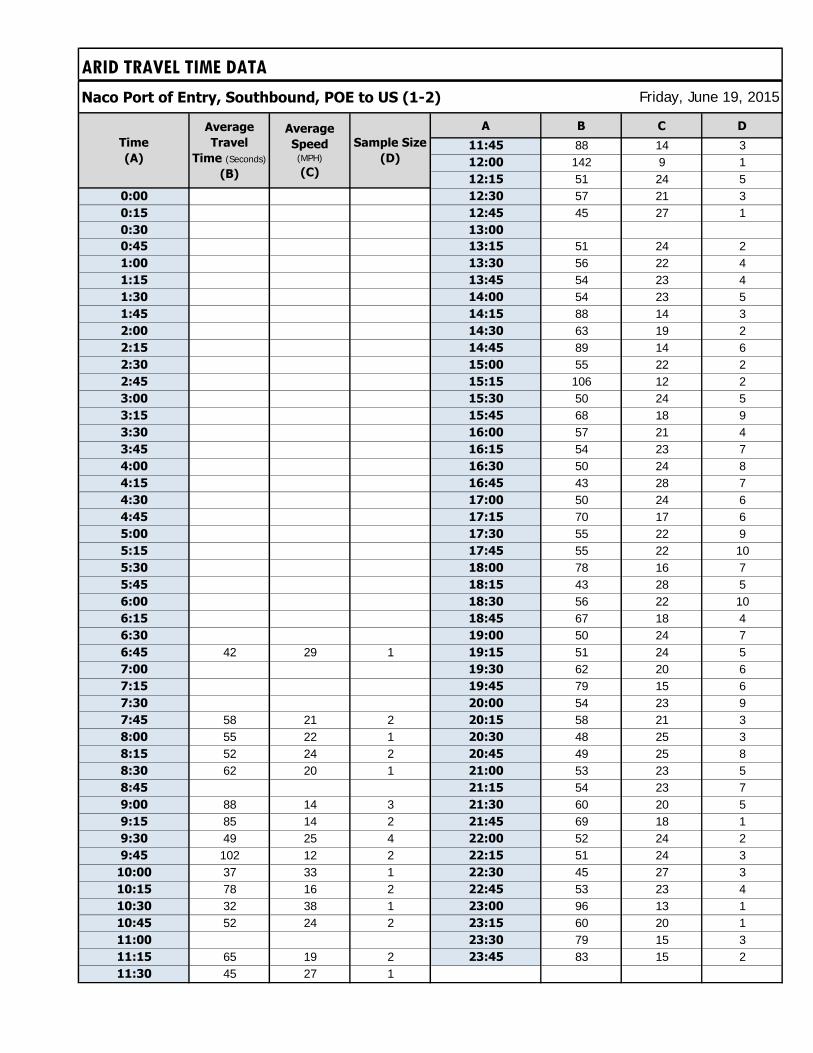
ARID TRAVEL TIME DATA
Naco Port of Entry, Southbound, POE to US (1-2)
A B C D
11:45 88 14 312:00 142 9 112:15 51 24 5
0:00 12:30 57 21 30:15 12:45 45 27 10:30 13:00
0:45 13:15 51 24 21:00 13:30 56 22 41:15 13:45 54 23 41:30 14:00 54 23 51:45 14:15 88 14 32:00 14:30 63 19 22:15 14:45 89 14 62:30 15:00 55 22 22:45 15:15 106 12 23:00 15:30 50 24 53:15 15:45 68 18 93:30 16:00 57 21 43:45 16:15 54 23 74:00 16:30 50 24 84:15 16:45 43 28 74:30 17:00 50 24 64:45 17:15 70 17 65:00 17:30 55 22 95:15 17:45 55 22 105:30 18:00 78 16 75:45 18:15 43 28 56:00 18:30 56 22 106:15 18:45 67 18 46:30 19:00 50 24 76:45 42 29 1 19:15 51 24 57:00 19:30 62 20 67:15 19:45 79 15 67:30 20:00 54 23 97:45 58 21 2 20:15 58 21 38:00 55 22 1 20:30 48 25 38:15 52 24 2 20:45 49 25 88:30 62 20 1 21:00 53 23 58:45 21:15 54 23 79:00 88 14 3 21:30 60 20 59:15 85 14 2 21:45 69 18 19:30 49 25 4 22:00 52 24 29:45 102 12 2 22:15 51 24 3
10:00 37 33 1 22:30 45 27 310:15 78 16 2 22:45 53 23 410:30 32 38 1 23:00 96 13 110:45 52 24 2 23:15 60 20 111:00 23:30 79 15 311:15 65 19 2 23:45 83 15 211:30 45 27 1
Average
Speed (MPH)
(C)
Sample Size
(D)
Average
Travel
Time (Seconds)
(B)
Time
(A)
Friday, June 19, 2015
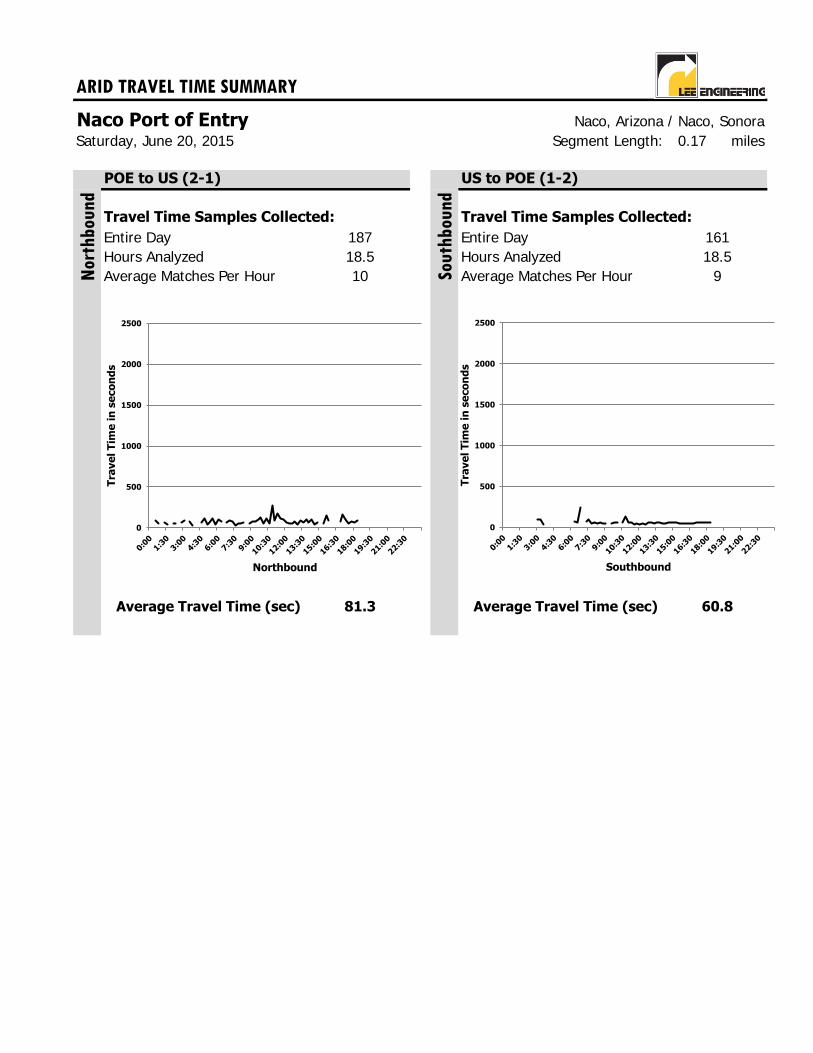
ARID TRAVEL TIME SUMMARY
Naco Port of Entry Naco, Arizona / Naco, SonoraSegment Length: 0.17 miles
POE to US (2-1) US to POE (1-2)
Travel Time Samples Collected: Travel Time Samples Collected:
Entire Day Entire DayHours Analyzed Hours AnalyzedAverage Matches Per Hour Average Matches Per Hour
Average Travel Time (sec) Average Travel Time (sec)
910
81.3 60.8
Nor
thbou
nd
Sou
thb
ound
Saturday, June 20, 2015
187 16118.5 18.5
0
500
1000
1500
2000
2500
Tra
ve
l T
ime
in
se
co
nd
s
Northbound
0
500
1000
1500
2000
2500
Tra
ve
l T
ime
in
se
co
nd
s
Southbound
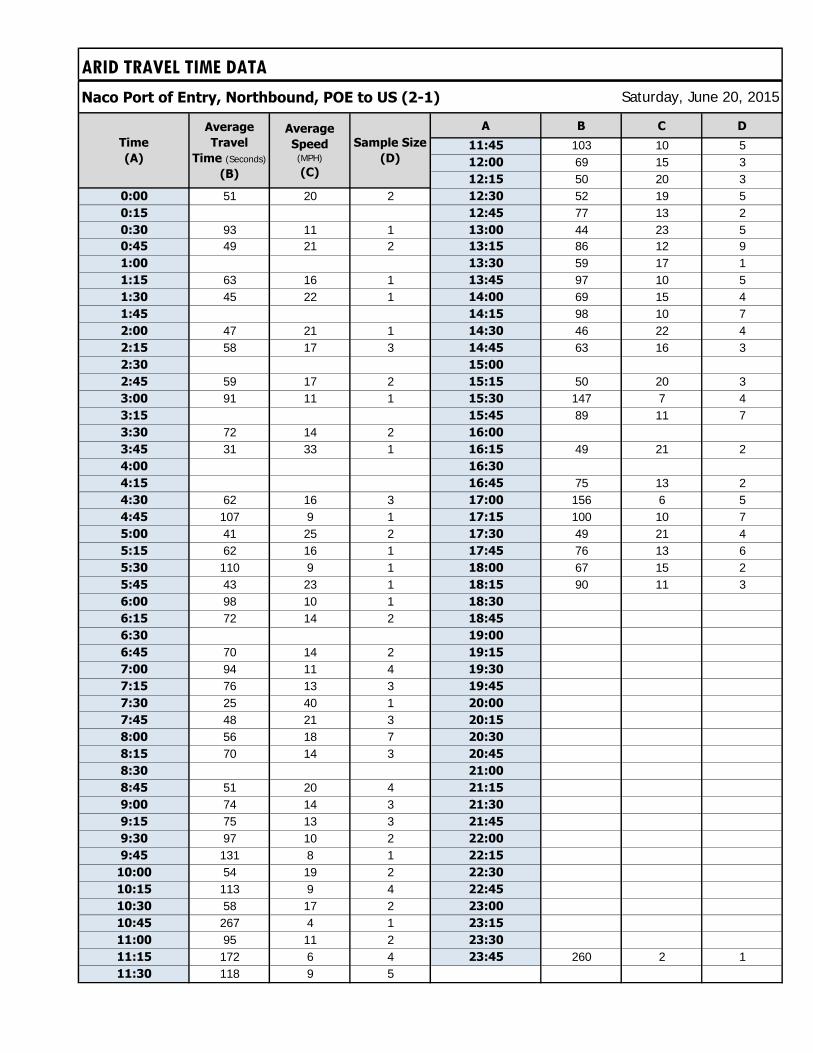
ARID TRAVEL TIME DATA
Naco Port of Entry, Northbound, POE to US (2-1)
A B C D
11:45 103 10 512:00 69 15 312:15 50 20 3
0:00 51 20 2 12:30 52 19 50:15 12:45 77 13 20:30 93 11 1 13:00 44 23 50:45 49 21 2 13:15 86 12 91:00 13:30 59 17 11:15 63 16 1 13:45 97 10 51:30 45 22 1 14:00 69 15 41:45 14:15 98 10 72:00 47 21 1 14:30 46 22 42:15 58 17 3 14:45 63 16 32:30 15:00
2:45 59 17 2 15:15 50 20 33:00 91 11 1 15:30 147 7 43:15 15:45 89 11 73:30 72 14 2 16:00
3:45 31 33 1 16:15 49 21 24:00 16:30
4:15 16:45 75 13 24:30 62 16 3 17:00 156 6 54:45 107 9 1 17:15 100 10 75:00 41 25 2 17:30 49 21 45:15 62 16 1 17:45 76 13 65:30 110 9 1 18:00 67 15 25:45 43 23 1 18:15 90 11 36:00 98 10 1 18:30
6:15 72 14 2 18:45
6:30 19:00
6:45 70 14 2 19:15
7:00 94 11 4 19:30
7:15 76 13 3 19:45
7:30 25 40 1 20:00
7:45 48 21 3 20:15
8:00 56 18 7 20:30
8:15 70 14 3 20:45
8:30 21:00
8:45 51 20 4 21:15
9:00 74 14 3 21:30
9:15 75 13 3 21:45
9:30 97 10 2 22:00
9:45 131 8 1 22:15
10:00 54 19 2 22:30
10:15 113 9 4 22:45
10:30 58 17 2 23:00
10:45 267 4 1 23:15
11:00 95 11 2 23:30
11:15 172 6 4 23:45 260 2 111:30 118 9 5
Time
(A)
Average
Travel
Time (Seconds)
(B)
Average
Speed (MPH)
(C)
Sample Size
(D)
Saturday, June 20, 2015

ARID TRAVEL TIME DATA
Naco Port of Entry, Southbound, POE to US (1-2)
A B C D
11:45 44 28 1012:00 39 31 312:15 46 27 3
0:00 54 23 2 12:30 31 39 10:15 12:45 63 19 40:30 47 26 2 13:00 65 19 10:45 13:15 51 24 31:00 13:30 65 19 21:15 13:45 61 20 11:30 14:00 44 28 11:45 14:15 45 27 62:00 14:30 56 22 42:15 14:45 62 20 42:30 15:00 60 20 12:45 15:15 57 21 53:00 91 13 1 15:30 48 25 63:15 91 13 1 15:45 47 26 53:30 32 38 1 16:00 41 30 53:45 16:15 51 24 84:00 16:30 50 24 44:15 16:45 51 24 74:30 17:00 60 20 14:45 17:15 53 23 15:00 17:30 60 20 15:15 17:45 53 23 75:30 18:00 65 19 65:45 18:15 54 23 46:00 18:30
6:15 74 17 1 18:45
6:30 61 20 4 19:00
6:45 246 5 1 19:15
7:00 19:30
7:15 67 18 5 19:45
7:30 93 13 2 20:00
7:45 47 26 5 20:15
8:00 54 23 3 20:30
8:15 48 25 5 20:45
8:30 64 19 4 21:00
8:45 45 27 1 21:15
9:00 46 27 1 21:30
9:15 21:45
9:30 46 27 2 22:00
9:45 54 23 3 22:15
10:00 53 23 2 22:30
10:15 22:45
10:30 65 19 4 23:00
10:45 134 9 1 23:15
11:00 59 21 1 23:30
11:15 66 19 2 23:45
11:30 40 31 3
Average
Speed (MPH)
(C)
Sample Size
(D)
Average
Travel
Time (Seconds)
(B)
Time
(A)
Saturday, June 20, 2015
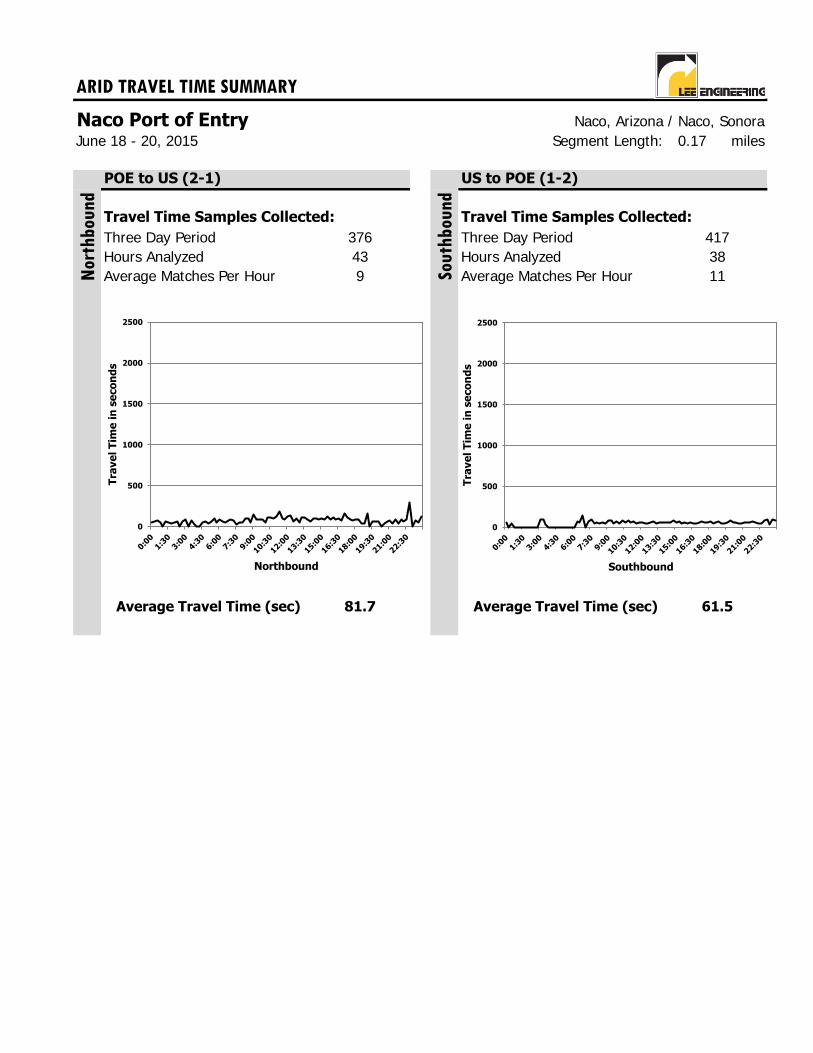
ARID TRAVEL TIME SUMMARY
Naco Port of Entry Naco, Arizona / Naco, SonoraSegment Length: 0.17 miles
POE to US (2-1) US to POE (1-2)
Travel Time Samples Collected: Travel Time Samples Collected:
Three Day Period Three Day PeriodHours Analyzed Hours AnalyzedAverage Matches Per Hour Average Matches Per Hour
Average Travel Time (sec) Average Travel Time (sec)
June 18 - 20, 2015
Nor
thbou
nd
Sou
thb
ound
376 41743 389 11
81.7 61.5
0
500
1000
1500
2000
2500
Tra
ve
l T
ime
in
se
co
nd
s
Northbound
0
500
1000
1500
2000
2500
Tra
ve
l T
ime
in
se
co
nd
s
Southbound
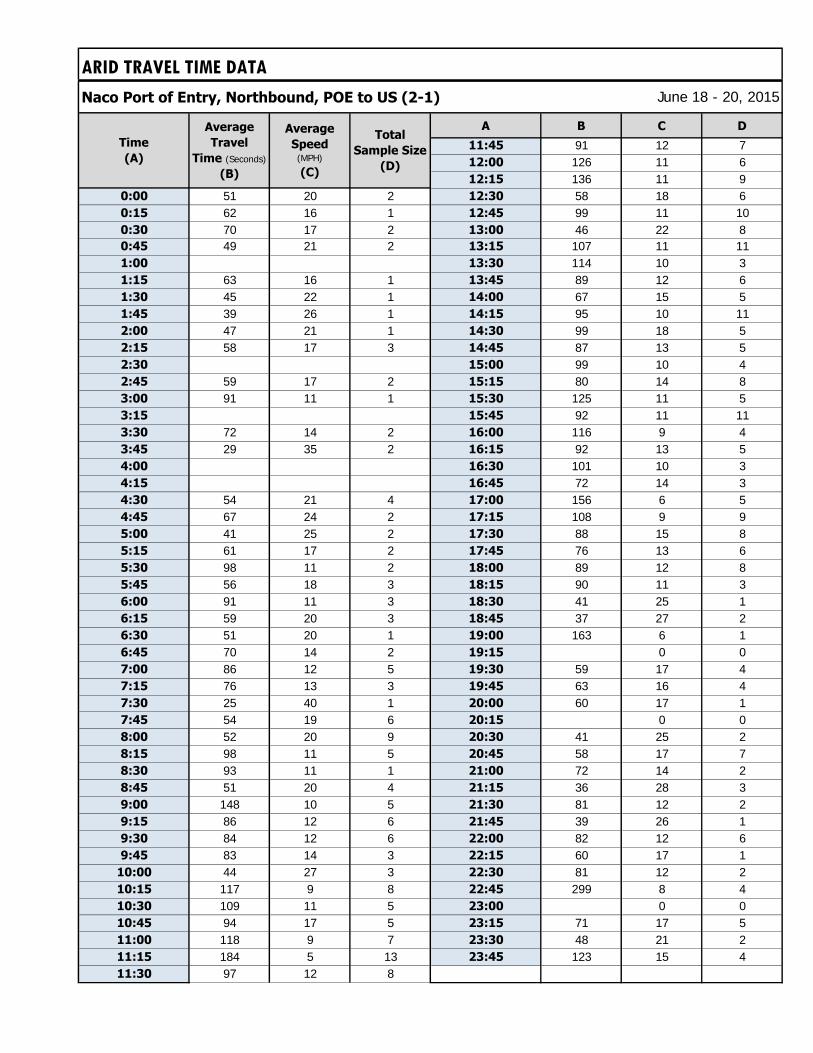
ARID TRAVEL TIME DATA
Naco Port of Entry, Northbound, POE to US (2-1)
A B C D
11:45 91 12 712:00 126 11 612:15 136 11 9
0:00 51 20 2 12:30 58 18 60:15 62 16 1 12:45 99 11 100:30 70 17 2 13:00 46 22 80:45 49 21 2 13:15 107 11 111:00 13:30 114 10 31:15 63 16 1 13:45 89 12 61:30 45 22 1 14:00 67 15 51:45 39 26 1 14:15 95 10 112:00 47 21 1 14:30 99 18 52:15 58 17 3 14:45 87 13 52:30 15:00 99 10 42:45 59 17 2 15:15 80 14 83:00 91 11 1 15:30 125 11 53:15 15:45 92 11 113:30 72 14 2 16:00 116 9 43:45 29 35 2 16:15 92 13 54:00 16:30 101 10 34:15 16:45 72 14 34:30 54 21 4 17:00 156 6 54:45 67 24 2 17:15 108 9 95:00 41 25 2 17:30 88 15 85:15 61 17 2 17:45 76 13 65:30 98 11 2 18:00 89 12 85:45 56 18 3 18:15 90 11 36:00 91 11 3 18:30 41 25 16:15 59 20 3 18:45 37 27 26:30 51 20 1 19:00 163 6 16:45 70 14 2 19:15 0 07:00 86 12 5 19:30 59 17 47:15 76 13 3 19:45 63 16 47:30 25 40 1 20:00 60 17 17:45 54 19 6 20:15 0 08:00 52 20 9 20:30 41 25 28:15 98 11 5 20:45 58 17 78:30 93 11 1 21:00 72 14 28:45 51 20 4 21:15 36 28 39:00 148 10 5 21:30 81 12 29:15 86 12 6 21:45 39 26 19:30 84 12 6 22:00 82 12 69:45 83 14 3 22:15 60 17 1
10:00 44 27 3 22:30 81 12 210:15 117 9 8 22:45 299 8 410:30 109 11 5 23:00 0 010:45 94 17 5 23:15 71 17 511:00 118 9 7 23:30 48 21 211:15 184 5 13 23:45 123 15 411:30 97 12 8
Average
Travel
Time (Seconds)
(B)
Average
Speed (MPH)
(C)
Total
Sample Size
(D)
June 18 - 20, 2015
Time
(A)
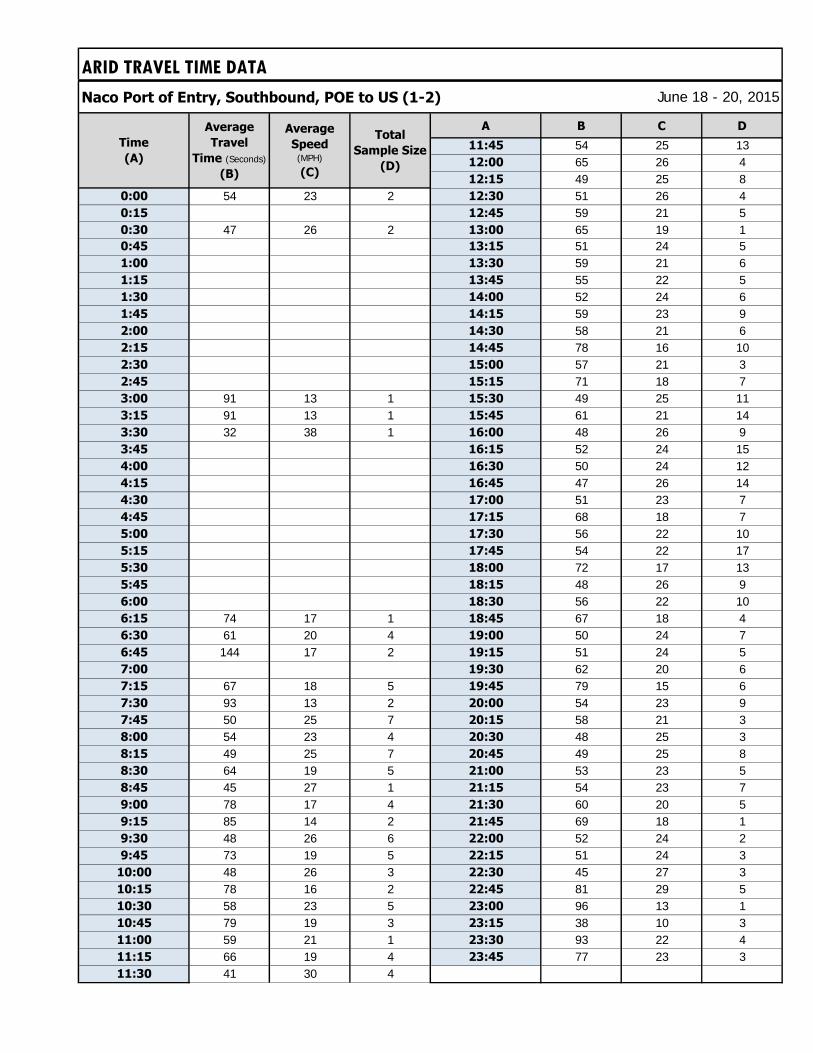
ARID TRAVEL TIME DATA
Naco Port of Entry, Southbound, POE to US (1-2)
A B C D
11:45 54 25 1312:00 65 26 412:15 49 25 8
0:00 54 23 2 12:30 51 26 40:15 12:45 59 21 50:30 47 26 2 13:00 65 19 10:45 13:15 51 24 51:00 13:30 59 21 61:15 13:45 55 22 51:30 14:00 52 24 61:45 14:15 59 23 92:00 14:30 58 21 62:15 14:45 78 16 102:30 15:00 57 21 32:45 15:15 71 18 73:00 91 13 1 15:30 49 25 113:15 91 13 1 15:45 61 21 143:30 32 38 1 16:00 48 26 93:45 16:15 52 24 154:00 16:30 50 24 124:15 16:45 47 26 144:30 17:00 51 23 74:45 17:15 68 18 75:00 17:30 56 22 105:15 17:45 54 22 175:30 18:00 72 17 135:45 18:15 48 26 96:00 18:30 56 22 106:15 74 17 1 18:45 67 18 46:30 61 20 4 19:00 50 24 76:45 144 17 2 19:15 51 24 57:00 19:30 62 20 67:15 67 18 5 19:45 79 15 67:30 93 13 2 20:00 54 23 97:45 50 25 7 20:15 58 21 38:00 54 23 4 20:30 48 25 38:15 49 25 7 20:45 49 25 88:30 64 19 5 21:00 53 23 58:45 45 27 1 21:15 54 23 79:00 78 17 4 21:30 60 20 59:15 85 14 2 21:45 69 18 19:30 48 26 6 22:00 52 24 29:45 73 19 5 22:15 51 24 3
10:00 48 26 3 22:30 45 27 310:15 78 16 2 22:45 81 29 510:30 58 23 5 23:00 96 13 110:45 79 19 3 23:15 38 10 311:00 59 21 1 23:30 93 22 411:15 66 19 4 23:45 77 23 311:30 41 30 4
Time
(A)
June 18 - 20, 2015
Average
Travel
Time (Seconds)
(B)
Average
Speed (MPH)
(C)
Total
Sample Size
(D)
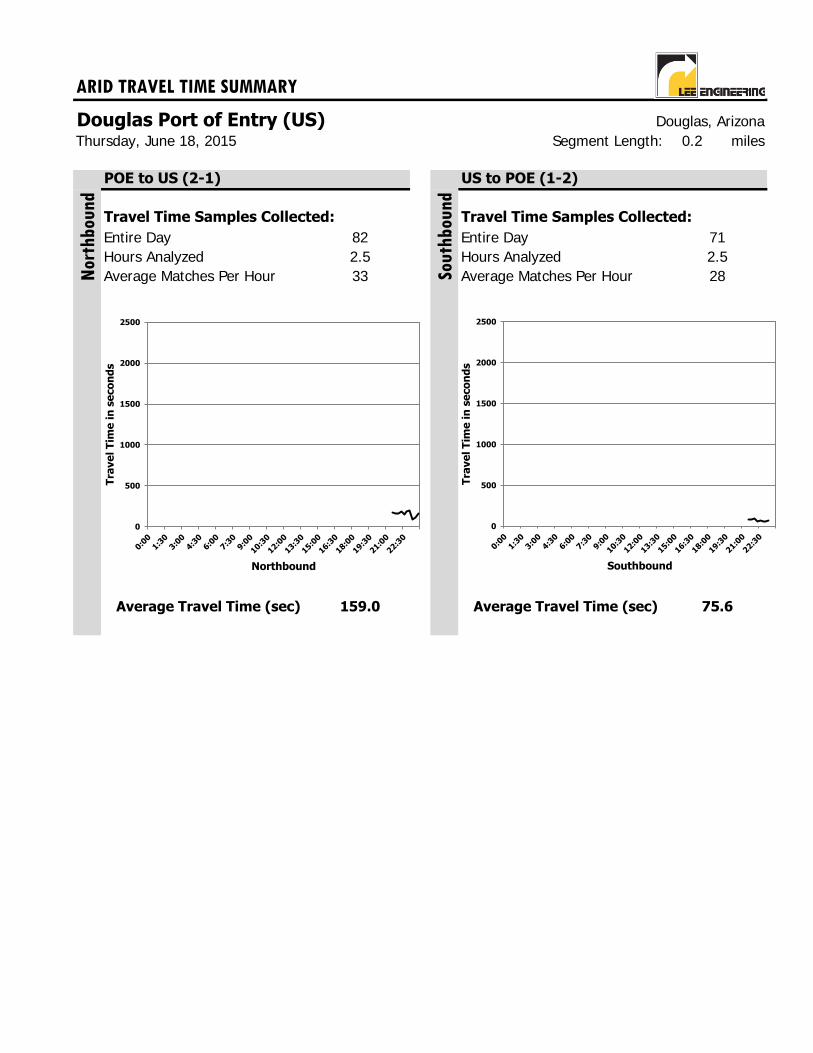
ARID TRAVEL TIME SUMMARY
Douglas Port of Entry (US) Douglas, ArizonaSegment Length: 0.2 miles
POE to US (2-1) US to POE (1-2)
Travel Time Samples Collected: Travel Time Samples Collected:
Entire Day Entire DayHours Analyzed Hours AnalyzedAverage Matches Per Hour Average Matches Per Hour
Average Travel Time (sec) Average Travel Time (sec)
Thursday, June 18, 2015
82 712.5 2.533
159.0 75.6
Nor
thbou
nd
Sou
thb
ound
28
0
500
1000
1500
2000
2500
Tra
ve
l T
ime
in
se
co
nd
s
Northbound
0
500
1000
1500
2000
2500
Tra
ve
l T
ime
in
se
co
nd
s
Southbound
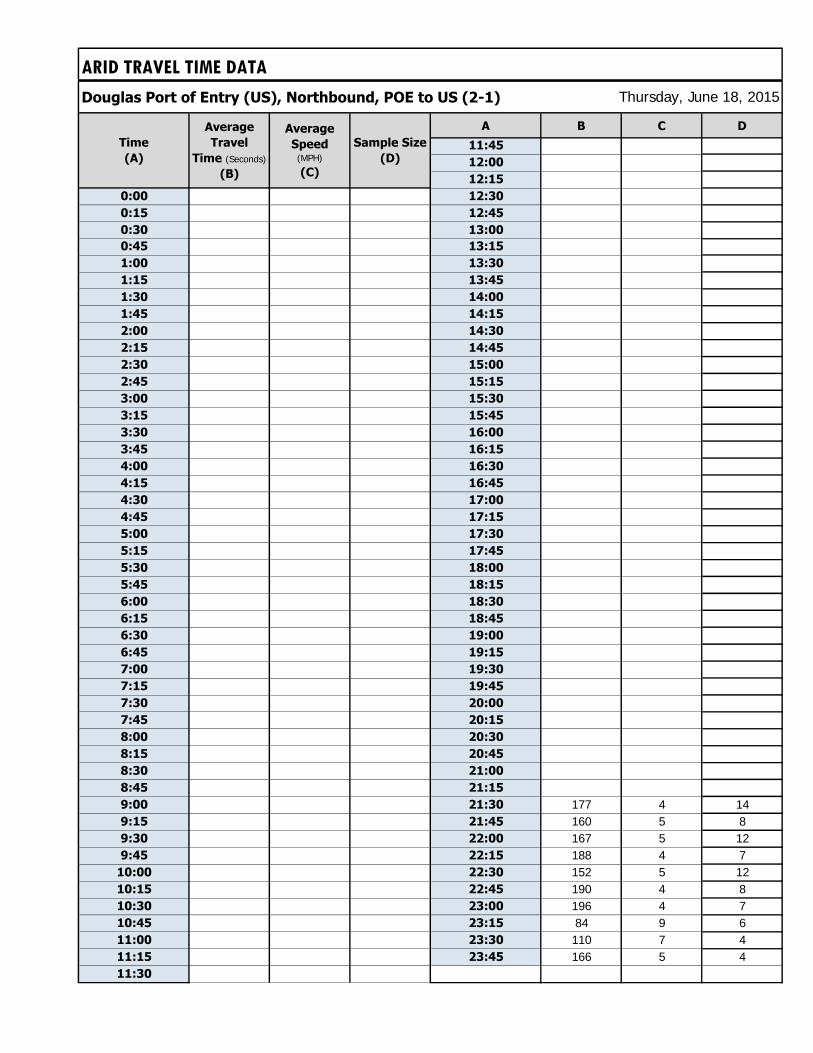
ARID TRAVEL TIME DATA
Douglas Port of Entry (US), Northbound, POE to US (2-1)
A B C D
11:45
12:00
12:15
0:00 12:30
0:15 12:45
0:30 13:00
0:45 13:15
1:00 13:30
1:15 13:45
1:30 14:00
1:45 14:15
2:00 14:30
2:15 14:45
2:30 15:00
2:45 15:15
3:00 15:30
3:15 15:45
3:30 16:00
3:45 16:15
4:00 16:30
4:15 16:45
4:30 17:00
4:45 17:15
5:00 17:30
5:15 17:45
5:30 18:00
5:45 18:15
6:00 18:30
6:15 18:45
6:30 19:00
6:45 19:15
7:00 19:30
7:15 19:45
7:30 20:00
7:45 20:15
8:00 20:30
8:15 20:45
8:30 21:00
8:45 21:15
9:00 21:30 177 4 149:15 21:45 160 5 89:30 22:00 167 5 129:45 22:15 188 4 7
10:00 22:30 152 5 1210:15 22:45 190 4 810:30 23:00 196 4 710:45 23:15 84 9 611:00 23:30 110 7 411:15 23:45 166 5 411:30
Thursday, June 18, 2015
Time
(A)
Average
Travel
Time (Seconds)
(B)
Average
Speed (MPH)
(C)
Sample Size
(D)
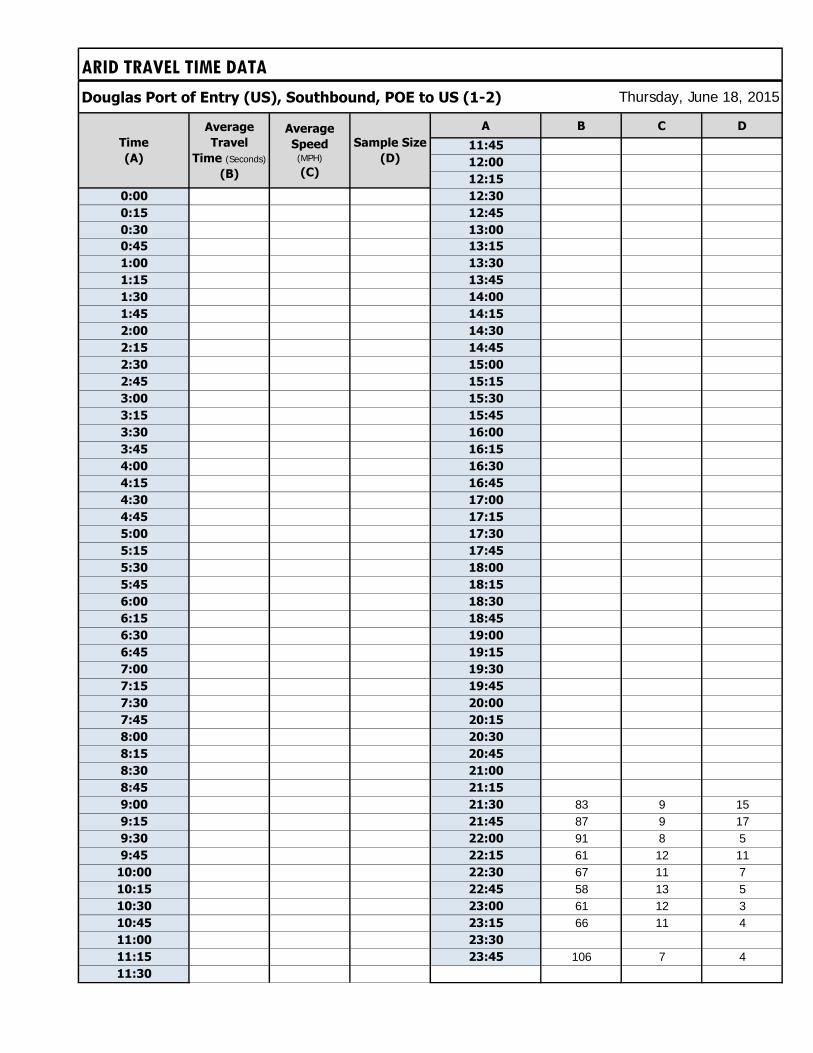
ARID TRAVEL TIME DATA
Douglas Port of Entry (US), Southbound, POE to US (1-2)
A B C D
11:45
12:00
12:15
0:00 12:30
0:15 12:45
0:30 13:00
0:45 13:15
1:00 13:30
1:15 13:45
1:30 14:00
1:45 14:15
2:00 14:30
2:15 14:45
2:30 15:00
2:45 15:15
3:00 15:30
3:15 15:45
3:30 16:00
3:45 16:15
4:00 16:30
4:15 16:45
4:30 17:00
4:45 17:15
5:00 17:30
5:15 17:45
5:30 18:00
5:45 18:15
6:00 18:30
6:15 18:45
6:30 19:00
6:45 19:15
7:00 19:30
7:15 19:45
7:30 20:00
7:45 20:15
8:00 20:30
8:15 20:45
8:30 21:00
8:45 21:15
9:00 21:30 83 9 159:15 21:45 87 9 179:30 22:00 91 8 59:45 22:15 61 12 11
10:00 22:30 67 11 710:15 22:45 58 13 510:30 23:00 61 12 310:45 23:15 66 11 411:00 23:30
11:15 23:45 106 7 411:30
Thursday, June 18, 2015
Time
(A)
Average
Speed (MPH)
(C)
Sample Size
(D)
Average
Travel
Time (Seconds)
(B)
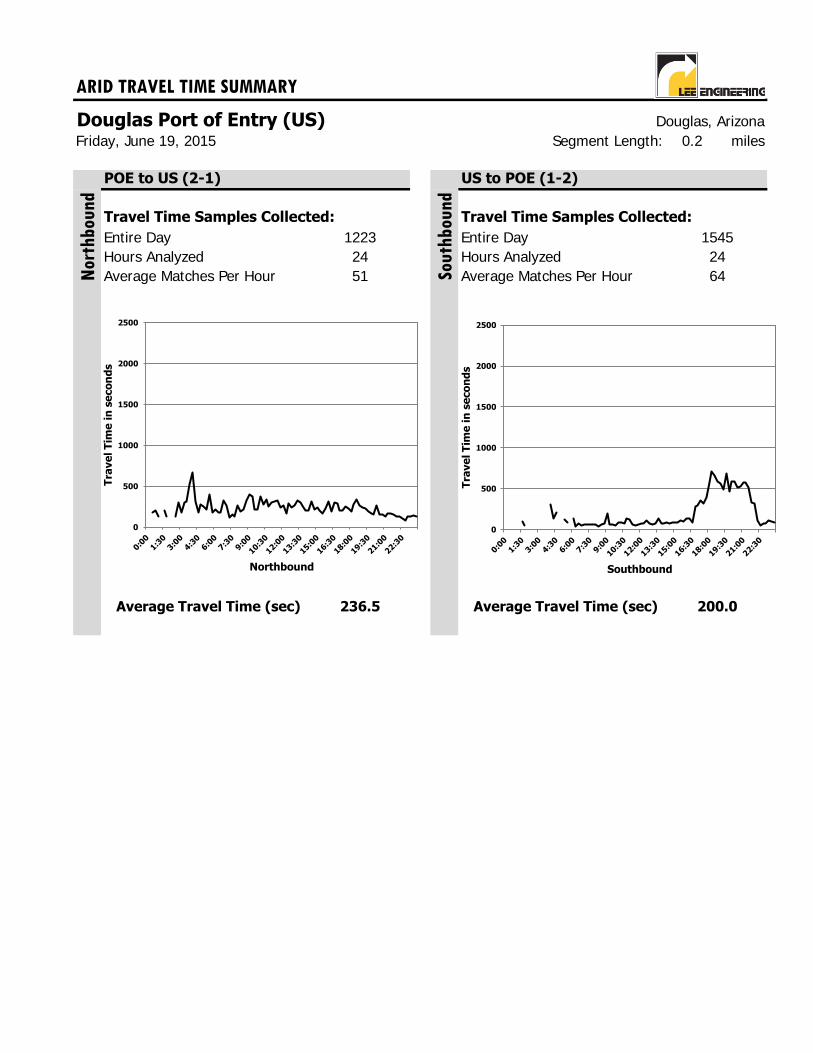
ARID TRAVEL TIME SUMMARY
Douglas Port of Entry (US) Douglas, ArizonaSegment Length: 0.2 miles
POE to US (2-1) US to POE (1-2)
Travel Time Samples Collected: Travel Time Samples Collected:
Entire Day Entire DayHours Analyzed Hours AnalyzedAverage Matches Per Hour Average Matches Per Hour
Average Travel Time (sec) Average Travel Time (sec)
Friday, June 19, 2015
1223 154524 2451
236.5 200.0
Nor
thbou
nd
Sou
thb
ound
64
0
500
1000
1500
2000
2500
Tra
ve
l T
ime
in
se
co
nd
s
Northbound
0
500
1000
1500
2000
2500
Tra
ve
l T
ime
in
se
co
nd
s
Southbound
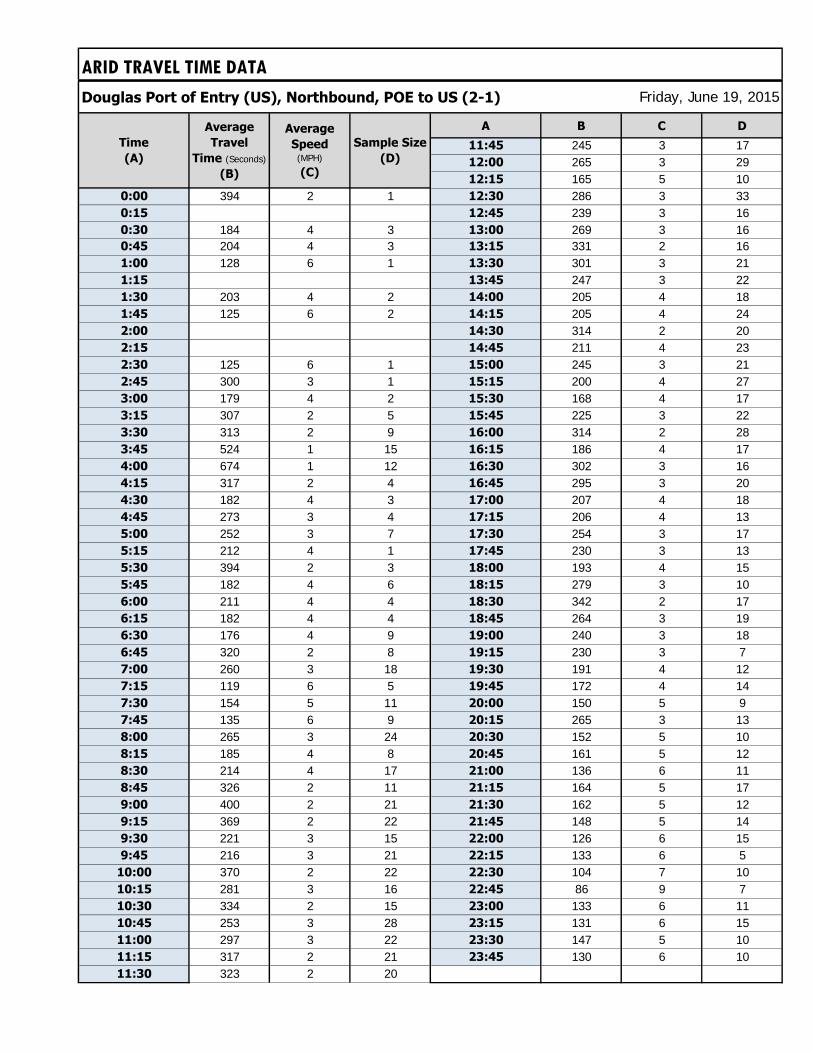
ARID TRAVEL TIME DATA
Douglas Port of Entry (US), Northbound, POE to US (2-1)
A B C D
11:45 245 3 1712:00 265 3 2912:15 165 5 10
0:00 394 2 1 12:30 286 3 330:15 12:45 239 3 160:30 184 4 3 13:00 269 3 160:45 204 4 3 13:15 331 2 161:00 128 6 1 13:30 301 3 211:15 13:45 247 3 221:30 203 4 2 14:00 205 4 181:45 125 6 2 14:15 205 4 242:00 14:30 314 2 202:15 14:45 211 4 232:30 125 6 1 15:00 245 3 212:45 300 3 1 15:15 200 4 273:00 179 4 2 15:30 168 4 173:15 307 2 5 15:45 225 3 223:30 313 2 9 16:00 314 2 283:45 524 1 15 16:15 186 4 174:00 674 1 12 16:30 302 3 164:15 317 2 4 16:45 295 3 204:30 182 4 3 17:00 207 4 184:45 273 3 4 17:15 206 4 135:00 252 3 7 17:30 254 3 175:15 212 4 1 17:45 230 3 135:30 394 2 3 18:00 193 4 155:45 182 4 6 18:15 279 3 106:00 211 4 4 18:30 342 2 176:15 182 4 4 18:45 264 3 196:30 176 4 9 19:00 240 3 186:45 320 2 8 19:15 230 3 77:00 260 3 18 19:30 191 4 127:15 119 6 5 19:45 172 4 147:30 154 5 11 20:00 150 5 97:45 135 6 9 20:15 265 3 138:00 265 3 24 20:30 152 5 108:15 185 4 8 20:45 161 5 128:30 214 4 17 21:00 136 6 118:45 326 2 11 21:15 164 5 179:00 400 2 21 21:30 162 5 129:15 369 2 22 21:45 148 5 149:30 221 3 15 22:00 126 6 159:45 216 3 21 22:15 133 6 5
10:00 370 2 22 22:30 104 7 1010:15 281 3 16 22:45 86 9 710:30 334 2 15 23:00 133 6 1110:45 253 3 28 23:15 131 6 1511:00 297 3 22 23:30 147 5 1011:15 317 2 21 23:45 130 6 1011:30 323 2 20
Friday, June 19, 2015
Time
(A)
Average
Travel
Time (Seconds)
(B)
Average
Speed (MPH)
(C)
Sample Size
(D)
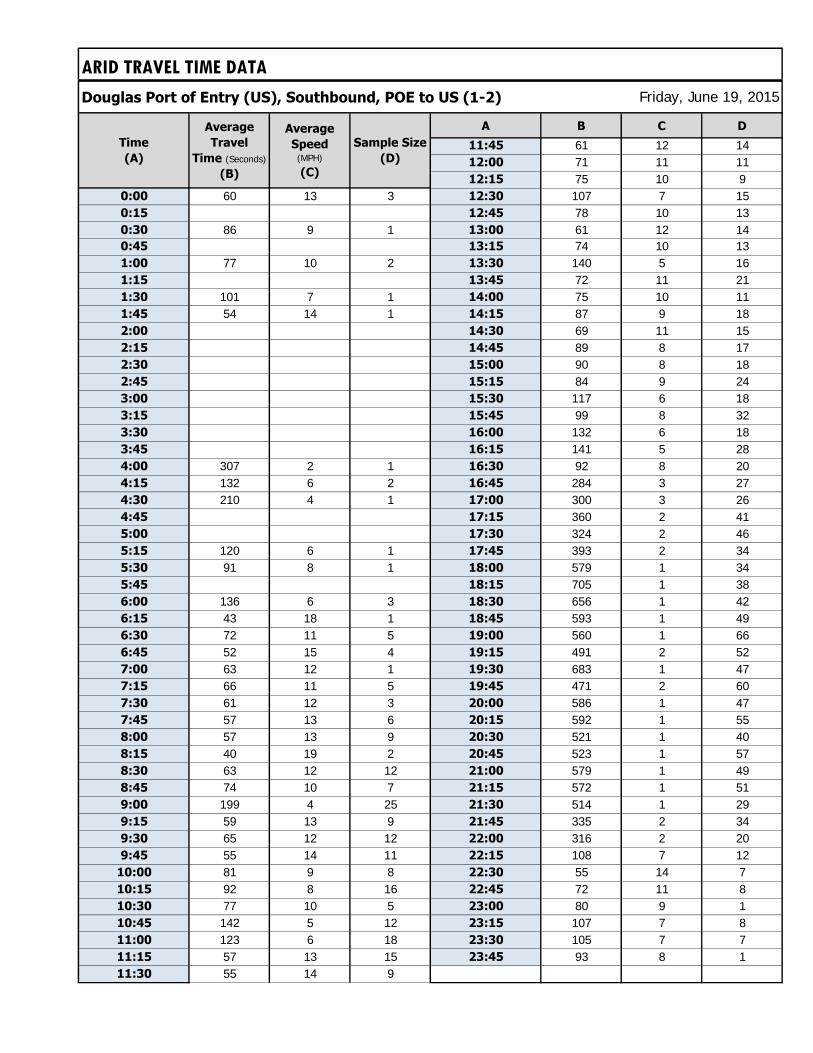
ARID TRAVEL TIME DATA
Douglas Port of Entry (US), Southbound, POE to US (1-2)
A B C D
11:45 61 12 1412:00 71 11 1112:15 75 10 9
0:00 60 13 3 12:30 107 7 150:15 12:45 78 10 130:30 86 9 1 13:00 61 12 140:45 13:15 74 10 131:00 77 10 2 13:30 140 5 161:15 13:45 72 11 211:30 101 7 1 14:00 75 10 111:45 54 14 1 14:15 87 9 182:00 14:30 69 11 152:15 14:45 89 8 172:30 15:00 90 8 182:45 15:15 84 9 243:00 15:30 117 6 183:15 15:45 99 8 323:30 16:00 132 6 183:45 16:15 141 5 284:00 307 2 1 16:30 92 8 204:15 132 6 2 16:45 284 3 274:30 210 4 1 17:00 300 3 264:45 17:15 360 2 415:00 17:30 324 2 465:15 120 6 1 17:45 393 2 345:30 91 8 1 18:00 579 1 345:45 18:15 705 1 386:00 136 6 3 18:30 656 1 426:15 43 18 1 18:45 593 1 496:30 72 11 5 19:00 560 1 666:45 52 15 4 19:15 491 2 527:00 63 12 1 19:30 683 1 477:15 66 11 5 19:45 471 2 607:30 61 12 3 20:00 586 1 477:45 57 13 6 20:15 592 1 558:00 57 13 9 20:30 521 1 408:15 40 19 2 20:45 523 1 578:30 63 12 12 21:00 579 1 498:45 74 10 7 21:15 572 1 519:00 199 4 25 21:30 514 1 299:15 59 13 9 21:45 335 2 349:30 65 12 12 22:00 316 2 209:45 55 14 11 22:15 108 7 12
10:00 81 9 8 22:30 55 14 710:15 92 8 16 22:45 72 11 810:30 77 10 5 23:00 80 9 110:45 142 5 12 23:15 107 7 811:00 123 6 18 23:30 105 7 711:15 57 13 15 23:45 93 8 111:30 55 14 9
Friday, June 19, 2015
Time
(A)
Average
Speed (MPH)
(C)
Sample Size
(D)
Average
Travel
Time (Seconds)
(B)
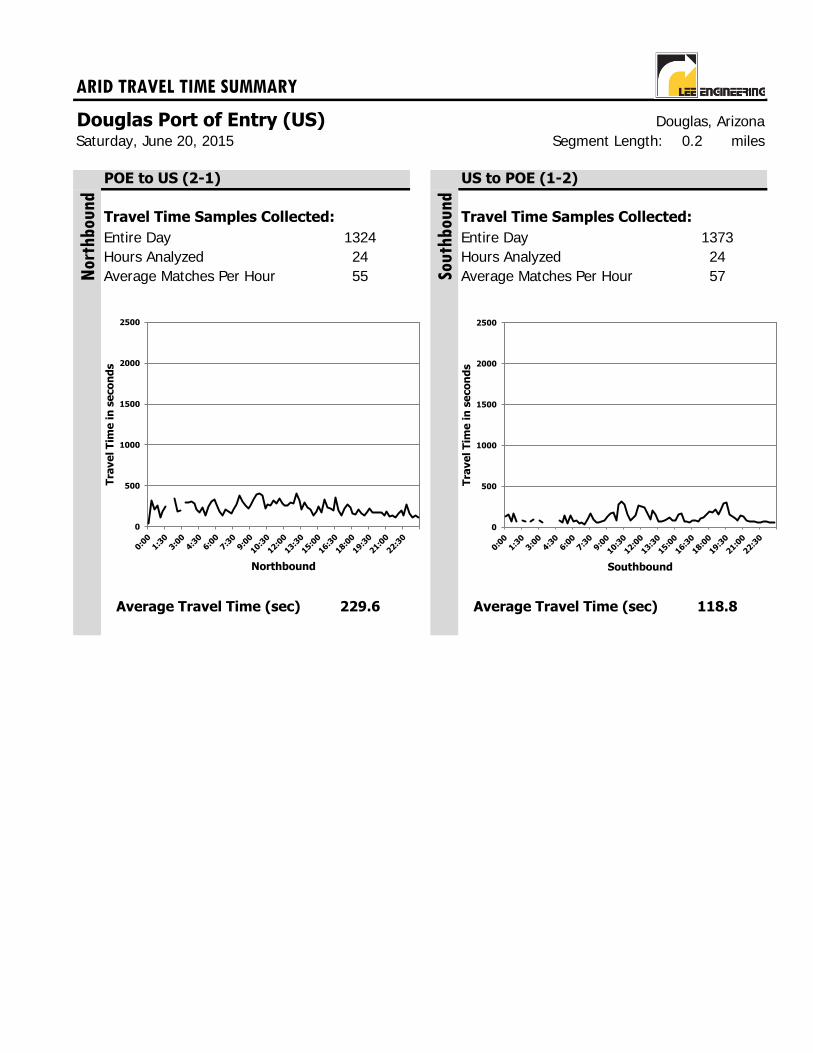
ARID TRAVEL TIME SUMMARY
Douglas Port of Entry (US) Douglas, ArizonaSegment Length: 0.2 miles
POE to US (2-1) US to POE (1-2)
Travel Time Samples Collected: Travel Time Samples Collected:
Entire Day Entire DayHours Analyzed Hours AnalyzedAverage Matches Per Hour Average Matches Per Hour
Average Travel Time (sec) Average Travel Time (sec)
Saturday, June 20, 2015
1324 137324 2455
229.6 118.8
Nor
thbou
nd
Sou
thb
ound
57
0
500
1000
1500
2000
2500
Tra
ve
l T
ime
in
se
co
nd
s
Northbound
0
500
1000
1500
2000
2500
Tra
ve
l T
ime
in
se
co
nd
s
Southbound

ARID TRAVEL TIME DATA
Douglas Port of Entry (US), Northbound, POE to US (2-1)
A B C D
11:45 281 3 2312:00 263 3 1312:15 265 3 22
0:00 44 17 2 12:30 292 3 320:15 320 2 3 12:45 279 3 220:30 216 3 4 13:00 404 2 160:45 264 3 2 13:15 324 2 241:00 118 6 5 13:30 215 4 271:15 190 4 1 13:45 298 3 281:30 246 3 3 14:00 236 3 141:45 14:15 210 4 332:00 14:30 131 6 202:15 343 2 4 14:45 182 4 172:30 190 4 3 15:00 249 3 262:45 202 4 1 15:15 176 4 303:00 15:30 328 2 253:15 301 3 1 15:45 241 3 233:30 296 3 9 16:00 222 3 223:45 308 2 4 16:15 198 4 234:00 280 3 5 16:30 361 2 184:15 209 4 6 16:45 199 4 224:30 174 4 1 17:00 135 6 174:45 240 3 5 17:15 218 3 145:00 134 6 3 17:30 267 3 285:15 251 3 8 17:45 242 3 255:30 308 2 3 18:00 167 5 125:45 331 2 8 18:15 144 5 206:00 266 3 3 18:30 216 3 136:15 186 4 10 18:45 165 5 206:30 137 6 3 19:00 137 6 176:45 206 4 7 19:15 184 4 207:00 187 4 3 19:30 218 3 147:15 163 5 13 19:45 168 4 297:30 206 4 14 20:00 175 4 187:45 268 3 6 20:15 172 4 178:00 383 2 14 20:30 175 4 138:15 311 2 16 20:45 132 6 128:30 261 3 27 21:00 185 4 88:45 226 3 14 21:15 127 6 159:00 263 3 15 21:30 142 5 129:15 333 2 13 21:45 119 6 99:30 389 2 16 22:00 158 5 49:45 401 2 14 22:15 199 4 11
10:00 382 2 23 22:30 138 5 510:15 218 3 17 22:45 277 3 710:30 267 3 21 23:00 166 5 1410:45 256 3 28 23:15 112 7 911:00 317 2 24 23:30 135 6 1311:15 283 3 25 23:45 112 7 2011:30 341 2 21
Saturday, June 20, 2015
Time
(A)
Average
Travel
Time (Seconds)
(B)
Average
Speed (MPH)
(C)
Sample Size
(D)
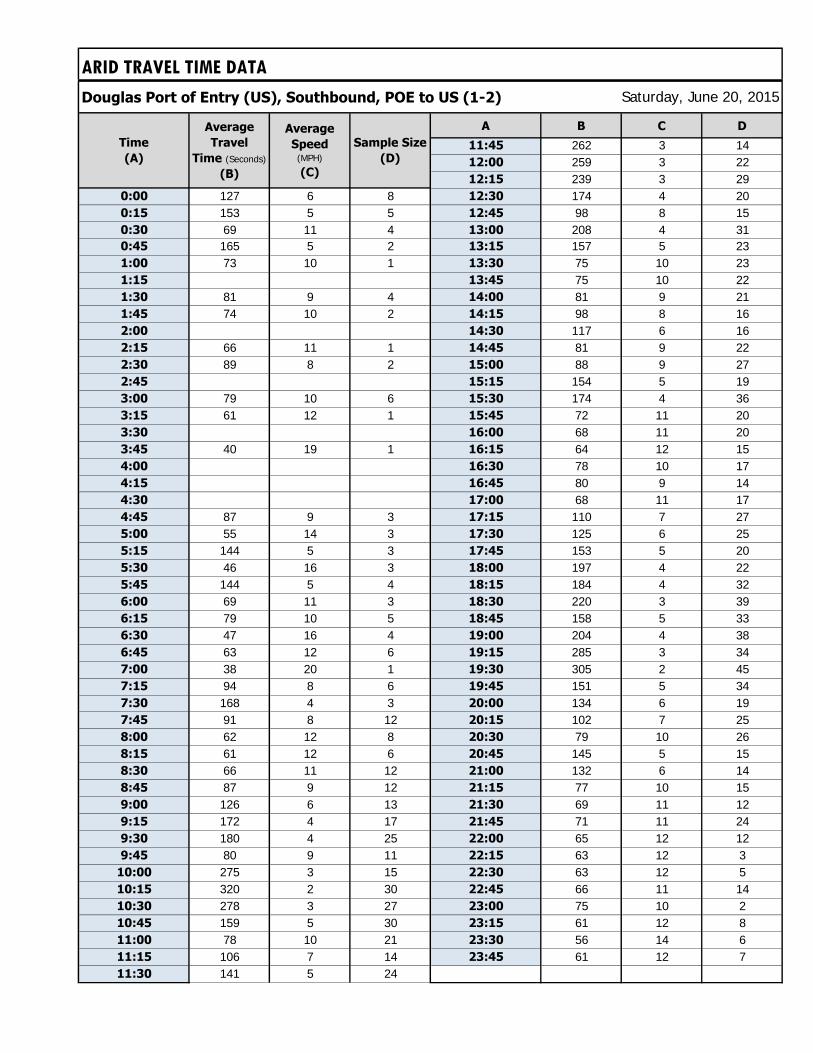
ARID TRAVEL TIME DATA
Douglas Port of Entry (US), Southbound, POE to US (1-2)
A B C D
11:45 262 3 1412:00 259 3 2212:15 239 3 29
0:00 127 6 8 12:30 174 4 200:15 153 5 5 12:45 98 8 150:30 69 11 4 13:00 208 4 310:45 165 5 2 13:15 157 5 231:00 73 10 1 13:30 75 10 231:15 13:45 75 10 221:30 81 9 4 14:00 81 9 211:45 74 10 2 14:15 98 8 162:00 14:30 117 6 162:15 66 11 1 14:45 81 9 222:30 89 8 2 15:00 88 9 272:45 15:15 154 5 193:00 79 10 6 15:30 174 4 363:15 61 12 1 15:45 72 11 203:30 16:00 68 11 203:45 40 19 1 16:15 64 12 154:00 16:30 78 10 174:15 16:45 80 9 144:30 17:00 68 11 174:45 87 9 3 17:15 110 7 275:00 55 14 3 17:30 125 6 255:15 144 5 3 17:45 153 5 205:30 46 16 3 18:00 197 4 225:45 144 5 4 18:15 184 4 326:00 69 11 3 18:30 220 3 396:15 79 10 5 18:45 158 5 336:30 47 16 4 19:00 204 4 386:45 63 12 6 19:15 285 3 347:00 38 20 1 19:30 305 2 457:15 94 8 6 19:45 151 5 347:30 168 4 3 20:00 134 6 197:45 91 8 12 20:15 102 7 258:00 62 12 8 20:30 79 10 268:15 61 12 6 20:45 145 5 158:30 66 11 12 21:00 132 6 148:45 87 9 12 21:15 77 10 159:00 126 6 13 21:30 69 11 129:15 172 4 17 21:45 71 11 249:30 180 4 25 22:00 65 12 129:45 80 9 11 22:15 63 12 3
10:00 275 3 15 22:30 63 12 510:15 320 2 30 22:45 66 11 1410:30 278 3 27 23:00 75 10 210:45 159 5 30 23:15 61 12 811:00 78 10 21 23:30 56 14 611:15 106 7 14 23:45 61 12 711:30 141 5 24
Saturday, June 20, 2015
Time
(A)
Average
Speed (MPH)
(C)
Sample Size
(D)
Average
Travel
Time (Seconds)
(B)
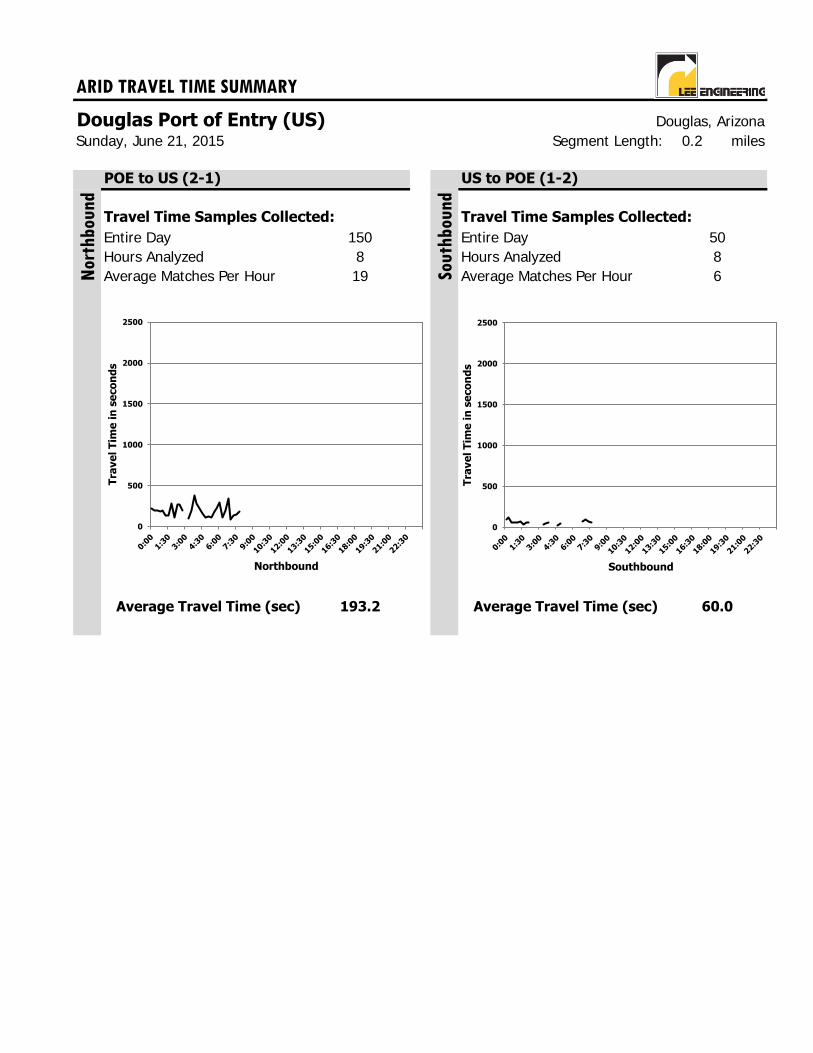
ARID TRAVEL TIME SUMMARY
Douglas Port of Entry (US) Douglas, ArizonaSegment Length: 0.2 miles
POE to US (2-1) US to POE (1-2)
Travel Time Samples Collected: Travel Time Samples Collected:
Entire Day Entire DayHours Analyzed Hours AnalyzedAverage Matches Per Hour Average Matches Per Hour
Average Travel Time (sec) Average Travel Time (sec)
Sunday, June 21, 2015
150 508 819
193.2 60.0
Nor
thbou
nd
Sou
thb
ound
6
0
500
1000
1500
2000
2500
Tra
ve
l T
ime
in
se
co
nd
s
Northbound
0
500
1000
1500
2000
2500
Tra
ve
l T
ime
in
se
co
nd
s
Southbound
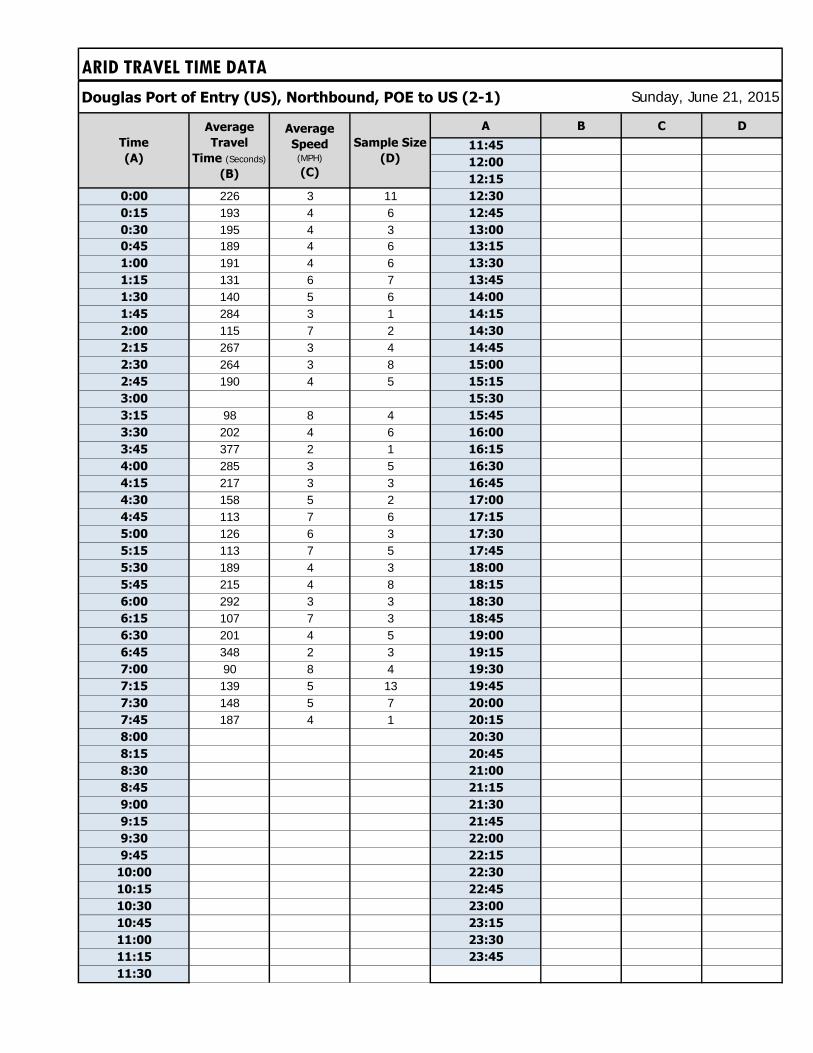
ARID TRAVEL TIME DATA
Douglas Port of Entry (US), Northbound, POE to US (2-1)
A B C D
11:45
12:00
12:15
0:00 226 3 11 12:30
0:15 193 4 6 12:45
0:30 195 4 3 13:00
0:45 189 4 6 13:15
1:00 191 4 6 13:30
1:15 131 6 7 13:45
1:30 140 5 6 14:00
1:45 284 3 1 14:15
2:00 115 7 2 14:30
2:15 267 3 4 14:45
2:30 264 3 8 15:00
2:45 190 4 5 15:15
3:00 15:30
3:15 98 8 4 15:45
3:30 202 4 6 16:00
3:45 377 2 1 16:15
4:00 285 3 5 16:30
4:15 217 3 3 16:45
4:30 158 5 2 17:00
4:45 113 7 6 17:15
5:00 126 6 3 17:30
5:15 113 7 5 17:45
5:30 189 4 3 18:00
5:45 215 4 8 18:15
6:00 292 3 3 18:30
6:15 107 7 3 18:45
6:30 201 4 5 19:00
6:45 348 2 3 19:15
7:00 90 8 4 19:30
7:15 139 5 13 19:45
7:30 148 5 7 20:00
7:45 187 4 1 20:15
8:00 20:30
8:15 20:45
8:30 21:00
8:45 21:15
9:00 21:30
9:15 21:45
9:30 22:00
9:45 22:15
10:00 22:30
10:15 22:45
10:30 23:00
10:45 23:15
11:00 23:30
11:15 23:45
11:30
Sunday, June 21, 2015
Time
(A)
Average
Travel
Time (Seconds)
(B)
Average
Speed (MPH)
(C)
Sample Size
(D)

ARID TRAVEL TIME DATA
Douglas Port of Entry (US), Southbound, POE to US (1-2)
A B C D
11:45
12:00
12:15
0:00 92 8 1 12:30
0:15 116 7 1 12:45
0:30 52 15 6 13:00
0:45 54 14 4 13:15
1:00 52 15 3 13:30
1:15 66 11 2 13:45
1:30 28 27 2 14:00
1:45 55 14 1 14:15
2:00 63 12 2 14:30
2:15 14:45
2:30 15:00
2:45 96 8 1 15:15
3:00 15:30
3:15 35 22 1 15:45
3:30 45 17 1 16:00
3:45 59 13 1 16:15
4:00 16:30
4:15 16:45
4:30 20 38 1 17:00
4:45 50 15 1 17:15
5:00 17:30
5:15 41 18 3 17:45
5:30 18:00
5:45 44 17 1 18:15
6:00 18:30
6:15 18:45
6:30 19:00
6:45 75 10 4 19:15
7:00 89 8 7 19:30
7:15 74 10 3 19:45
7:30 54 14 4 20:00
7:45 20:15
8:00 20:30
8:15 20:45
8:30 21:00
8:45 21:15
9:00 21:30
9:15 21:45
9:30 22:00
9:45 22:15
10:00 22:30
10:15 22:45
10:30 23:00
10:45 23:15
11:00 23:30
11:15 23:45
11:30
Sunday, June 21, 2015
Time
(A)
Average
Speed (MPH)
(C)
Sample Size
(D)
Average
Travel
Time (Seconds)
(B)

ARID TRAVEL TIME SUMMARY
Douglas Port of Entry (US) Douglas, ArizonaSegment Length: 0.2 miles
POE to US (2-1) US to POE (1-2)
Travel Time Samples Collected: Travel Time Samples Collected:
Four Day Period Four Day PeriodHours Analyzed Hours AnalyzedAverage Matches Per Hour Average Matches Per Hour
Average Travel Time (sec) Average Travel Time (sec)
June 18 - 21, 2015
Nor
thbou
nd
Sou
thb
ound
2779 303958.5 58.548 52
229.2 162.7
0
500
1000
1500
2000
2500
Tra
ve
l T
ime
in
se
co
nd
s
Northbound
0
500
1000
1500
2000
2500
Tra
ve
l T
ime
in
se
co
nd
s
Southbound
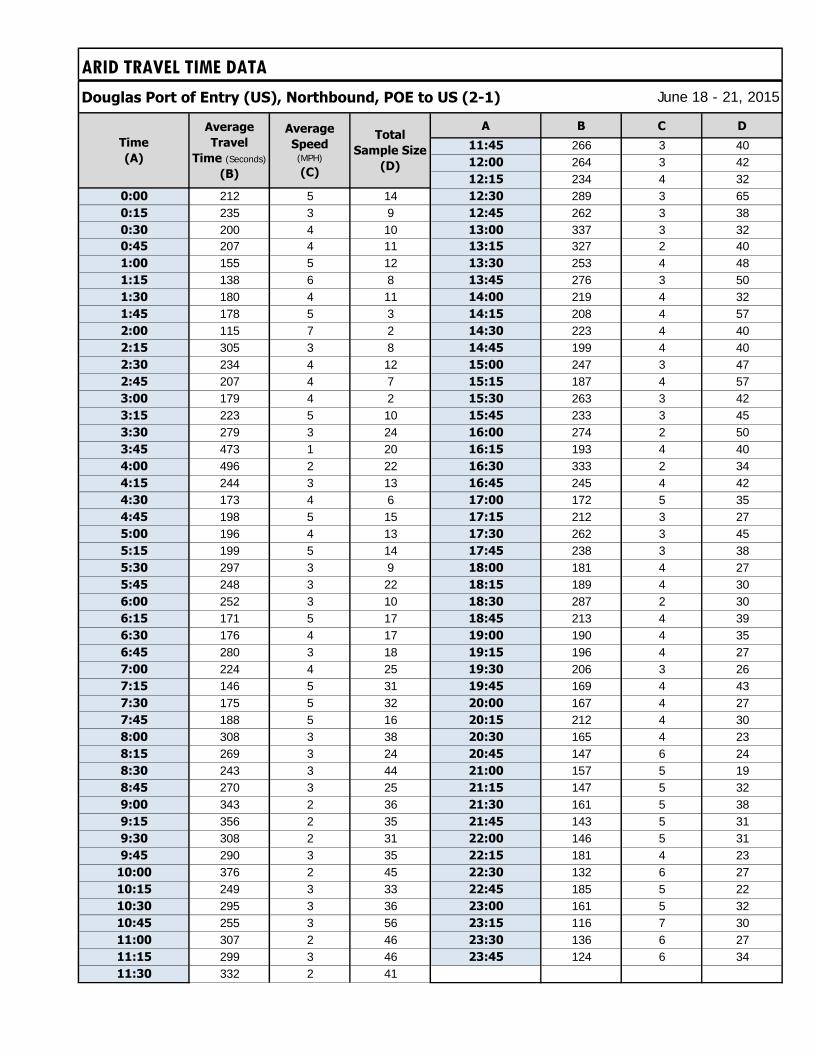
ARID TRAVEL TIME DATA
Douglas Port of Entry (US), Northbound, POE to US (2-1)
A B C D
11:45 266 3 4012:00 264 3 4212:15 234 4 32
0:00 212 5 14 12:30 289 3 650:15 235 3 9 12:45 262 3 380:30 200 4 10 13:00 337 3 320:45 207 4 11 13:15 327 2 401:00 155 5 12 13:30 253 4 481:15 138 6 8 13:45 276 3 501:30 180 4 11 14:00 219 4 321:45 178 5 3 14:15 208 4 572:00 115 7 2 14:30 223 4 402:15 305 3 8 14:45 199 4 402:30 234 4 12 15:00 247 3 472:45 207 4 7 15:15 187 4 573:00 179 4 2 15:30 263 3 423:15 223 5 10 15:45 233 3 453:30 279 3 24 16:00 274 2 503:45 473 1 20 16:15 193 4 404:00 496 2 22 16:30 333 2 344:15 244 3 13 16:45 245 4 424:30 173 4 6 17:00 172 5 354:45 198 5 15 17:15 212 3 275:00 196 4 13 17:30 262 3 455:15 199 5 14 17:45 238 3 385:30 297 3 9 18:00 181 4 275:45 248 3 22 18:15 189 4 306:00 252 3 10 18:30 287 2 306:15 171 5 17 18:45 213 4 396:30 176 4 17 19:00 190 4 356:45 280 3 18 19:15 196 4 277:00 224 4 25 19:30 206 3 267:15 146 5 31 19:45 169 4 437:30 175 5 32 20:00 167 4 277:45 188 5 16 20:15 212 4 308:00 308 3 38 20:30 165 4 238:15 269 3 24 20:45 147 6 248:30 243 3 44 21:00 157 5 198:45 270 3 25 21:15 147 5 329:00 343 2 36 21:30 161 5 389:15 356 2 35 21:45 143 5 319:30 308 2 31 22:00 146 5 319:45 290 3 35 22:15 181 4 23
10:00 376 2 45 22:30 132 6 2710:15 249 3 33 22:45 185 5 2210:30 295 3 36 23:00 161 5 3210:45 255 3 56 23:15 116 7 3011:00 307 2 46 23:30 136 6 2711:15 299 3 46 23:45 124 6 3411:30 332 2 41
Average
Travel
Time (Seconds)
(B)
Average
Speed (MPH)
(C)
Total
Sample Size
(D)
June 18 - 21, 2015
Time
(A)
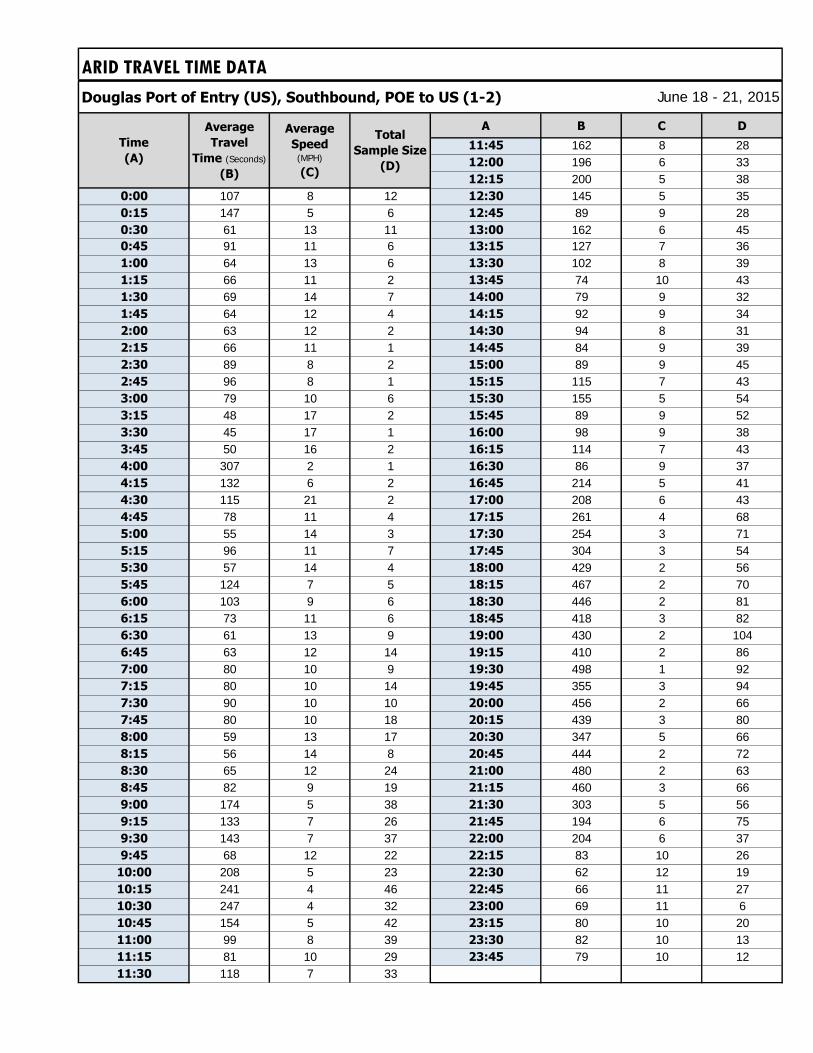
ARID TRAVEL TIME DATA
Douglas Port of Entry (US), Southbound, POE to US (1-2)
A B C D
11:45 162 8 2812:00 196 6 3312:15 200 5 38
0:00 107 8 12 12:30 145 5 350:15 147 5 6 12:45 89 9 280:30 61 13 11 13:00 162 6 450:45 91 11 6 13:15 127 7 361:00 64 13 6 13:30 102 8 391:15 66 11 2 13:45 74 10 431:30 69 14 7 14:00 79 9 321:45 64 12 4 14:15 92 9 342:00 63 12 2 14:30 94 8 312:15 66 11 1 14:45 84 9 392:30 89 8 2 15:00 89 9 452:45 96 8 1 15:15 115 7 433:00 79 10 6 15:30 155 5 543:15 48 17 2 15:45 89 9 523:30 45 17 1 16:00 98 9 383:45 50 16 2 16:15 114 7 434:00 307 2 1 16:30 86 9 374:15 132 6 2 16:45 214 5 414:30 115 21 2 17:00 208 6 434:45 78 11 4 17:15 261 4 685:00 55 14 3 17:30 254 3 715:15 96 11 7 17:45 304 3 545:30 57 14 4 18:00 429 2 565:45 124 7 5 18:15 467 2 706:00 103 9 6 18:30 446 2 816:15 73 11 6 18:45 418 3 826:30 61 13 9 19:00 430 2 1046:45 63 12 14 19:15 410 2 867:00 80 10 9 19:30 498 1 927:15 80 10 14 19:45 355 3 947:30 90 10 10 20:00 456 2 667:45 80 10 18 20:15 439 3 808:00 59 13 17 20:30 347 5 668:15 56 14 8 20:45 444 2 728:30 65 12 24 21:00 480 2 638:45 82 9 19 21:15 460 3 669:00 174 5 38 21:30 303 5 569:15 133 7 26 21:45 194 6 759:30 143 7 37 22:00 204 6 379:45 68 12 22 22:15 83 10 26
10:00 208 5 23 22:30 62 12 1910:15 241 4 46 22:45 66 11 2710:30 247 4 32 23:00 69 11 610:45 154 5 42 23:15 80 10 2011:00 99 8 39 23:30 82 10 1311:15 81 10 29 23:45 79 10 1211:30 118 7 33
Time
(A)
June 18 - 21, 2015
Average
Travel
Time (Seconds)
(B)
Average
Speed (MPH)
(C)
Total
Sample Size
(D)
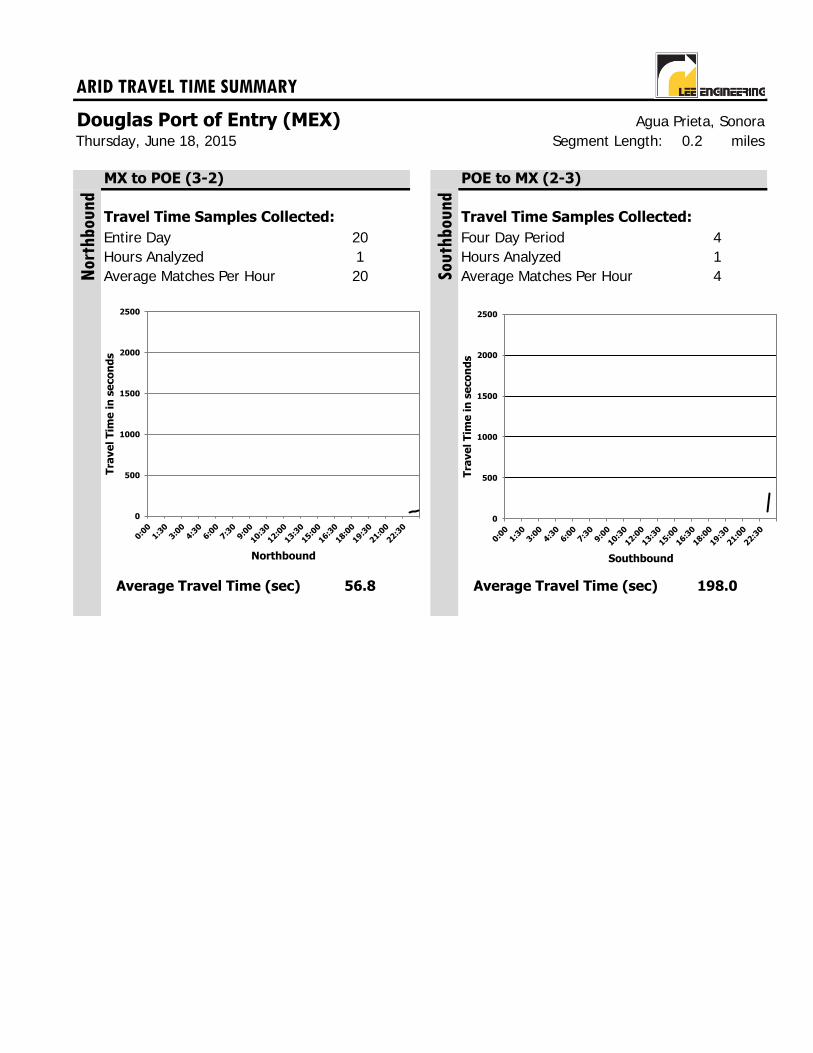
ARID TRAVEL TIME SUMMARY
Douglas Port of Entry (MEX) Agua Prieta, SonoraSegment Length: 0.2 miles
MX to POE (3-2) POE to MX (2-3)
Travel Time Samples Collected: Travel Time Samples Collected:
Entire Day Four Day PeriodHours Analyzed Hours AnalyzedAverage Matches Per Hour Average Matches Per Hour
Average Travel Time (sec) Average Travel Time (sec)
4
198.0
41
Thursday, June 18, 2015
20120
56.8
Nor
thbou
nd
Sou
thb
ound
0
500
1000
1500
2000
2500
Tra
ve
l T
ime
in
se
co
nd
s
Northbound
0
500
1000
1500
2000
2500
Tra
ve
l T
ime
in
se
co
nd
s
Southbound
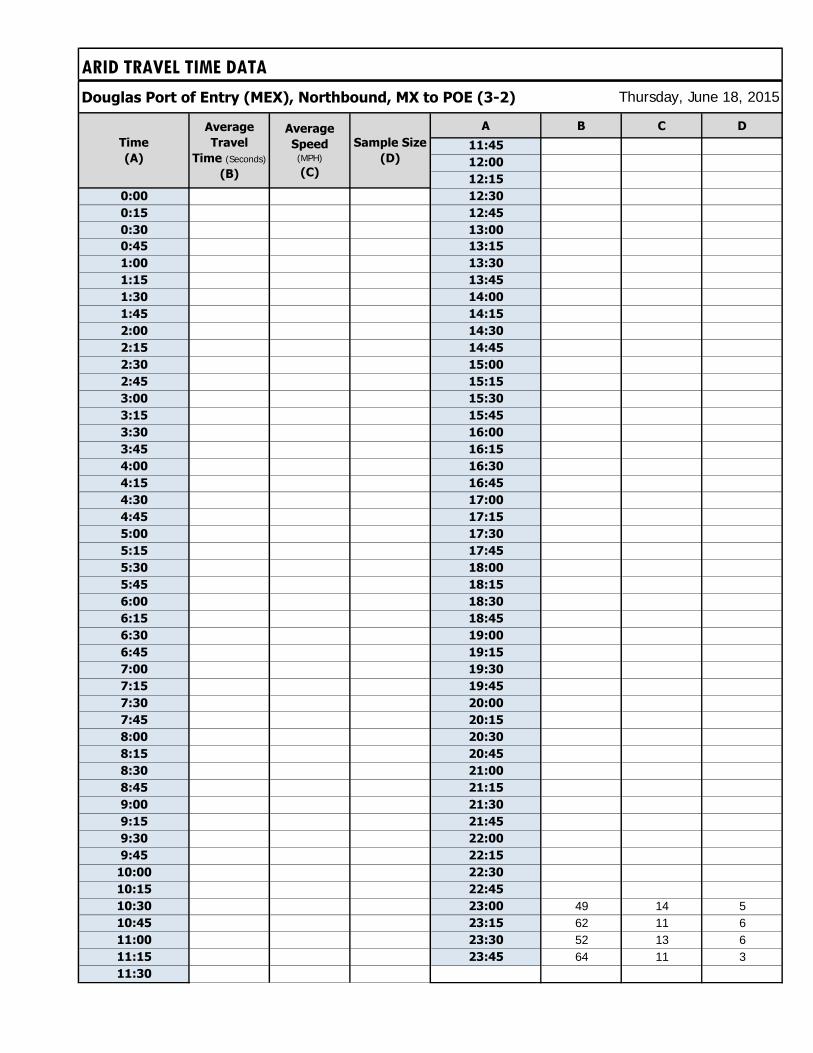
ARID TRAVEL TIME DATA
Douglas Port of Entry (MEX), Northbound, MX to POE (3-2)
A B C D
11:45
12:00
12:15
0:00 12:30
0:15 12:45
0:30 13:00
0:45 13:15
1:00 13:30
1:15 13:45
1:30 14:00
1:45 14:15
2:00 14:30
2:15 14:45
2:30 15:00
2:45 15:15
3:00 15:30
3:15 15:45
3:30 16:00
3:45 16:15
4:00 16:30
4:15 16:45
4:30 17:00
4:45 17:15
5:00 17:30
5:15 17:45
5:30 18:00
5:45 18:15
6:00 18:30
6:15 18:45
6:30 19:00
6:45 19:15
7:00 19:30
7:15 19:45
7:30 20:00
7:45 20:15
8:00 20:30
8:15 20:45
8:30 21:00
8:45 21:15
9:00 21:30
9:15 21:45
9:30 22:00
9:45 22:15
10:00 22:30
10:15 22:45
10:30 23:00 49 14 510:45 23:15 62 11 611:00 23:30 52 13 611:15 23:45 64 11 311:30
Time
(A)
Average
Travel
Time (Seconds)
(B)
Average
Speed (MPH)
(C)
Sample Size
(D)
Thursday, June 18, 2015
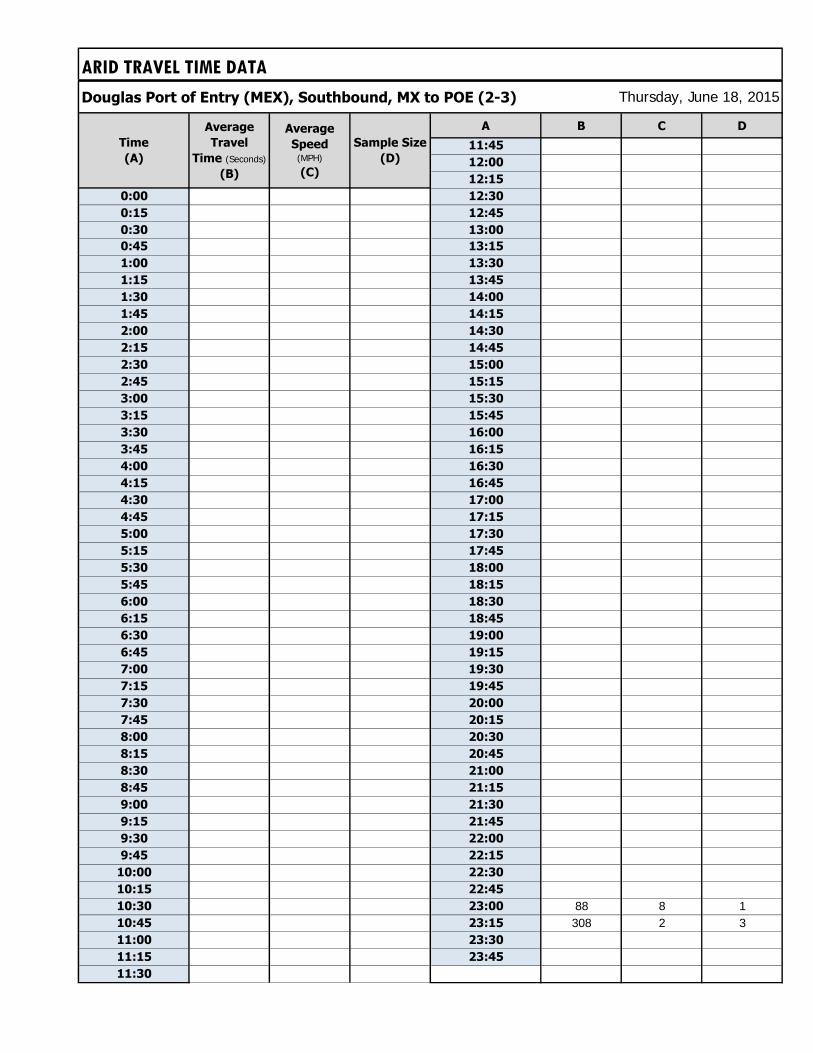
ARID TRAVEL TIME DATA
Douglas Port of Entry (MEX), Southbound, MX to POE (2-3)
A B C D
11:45
12:00
12:15
0:00 12:30
0:15 12:45
0:30 13:00
0:45 13:15
1:00 13:30
1:15 13:45
1:30 14:00
1:45 14:15
2:00 14:30
2:15 14:45
2:30 15:00
2:45 15:15
3:00 15:30
3:15 15:45
3:30 16:00
3:45 16:15
4:00 16:30
4:15 16:45
4:30 17:00
4:45 17:15
5:00 17:30
5:15 17:45
5:30 18:00
5:45 18:15
6:00 18:30
6:15 18:45
6:30 19:00
6:45 19:15
7:00 19:30
7:15 19:45
7:30 20:00
7:45 20:15
8:00 20:30
8:15 20:45
8:30 21:00
8:45 21:15
9:00 21:30
9:15 21:45
9:30 22:00
9:45 22:15
10:00 22:30
10:15 22:45
10:30 23:00 88 8 110:45 23:15 308 2 311:00 23:30
11:15 23:45
11:30
Average
Speed (MPH)
(C)
Sample Size
(D)
Average
Travel
Time (Seconds)
(B)
Time
(A)
Thursday, June 18, 2015
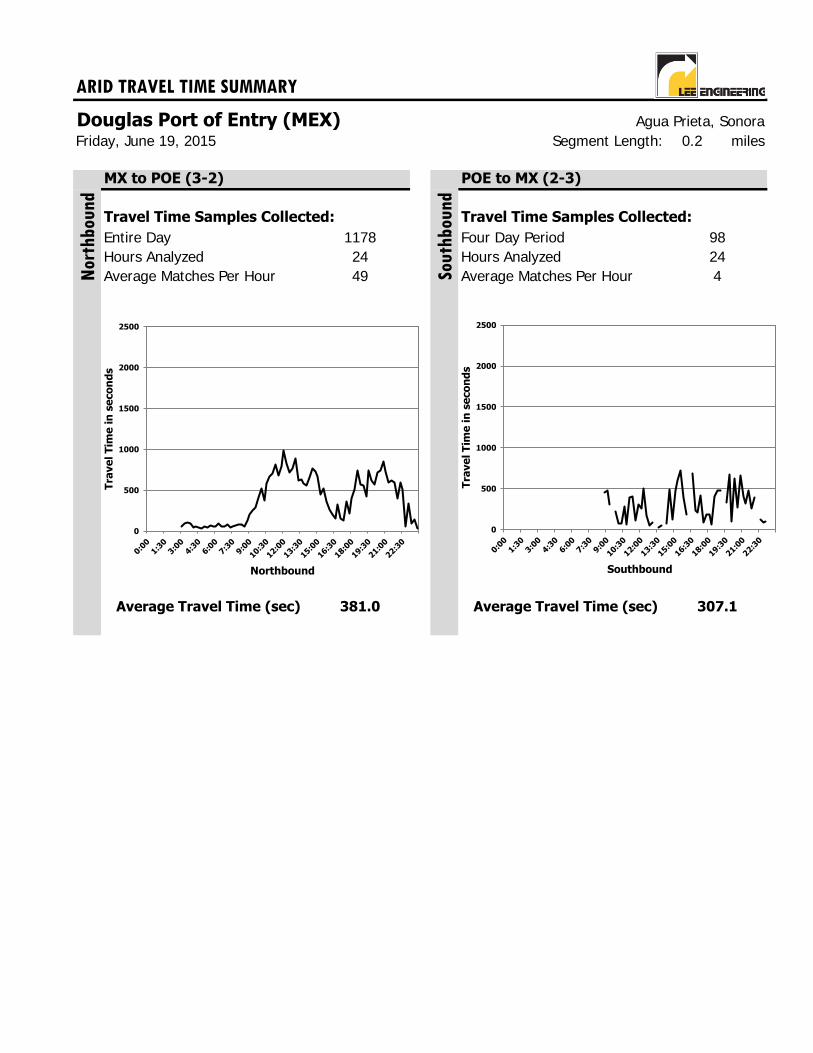
ARID TRAVEL TIME SUMMARY
Douglas Port of Entry (MEX)Segment Length: 0.2 miles
MX to POE (3-2) POE to MX (2-3)
Travel Time Samples Collected: Travel Time Samples Collected:
Entire Day Four Day PeriodHours Analyzed Hours AnalyzedAverage Matches Per Hour Average Matches Per Hour
Average Travel Time (sec) Average Travel Time (sec)
4
Agua Prieta, Sonora
49
381.0 307.1
Sou
thb
ound
Nor
thbou
nd
Friday, June 19, 2015
1178 9824 24
0
500
1000
1500
2000
2500
Tra
ve
l T
ime
in
se
co
nd
s
Northbound
0
500
1000
1500
2000
2500
Tra
ve
l T
ime
in
se
co
nd
s
Southbound
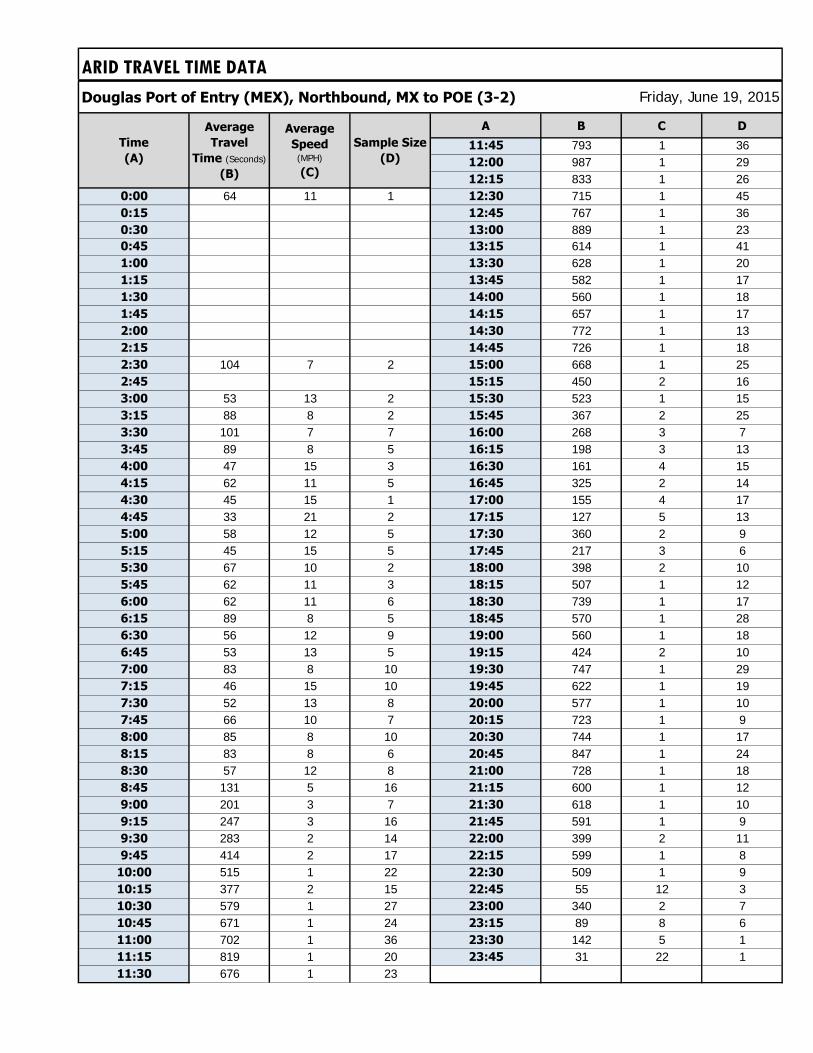
ARID TRAVEL TIME DATA
Douglas Port of Entry (MEX), Northbound, MX to POE (3-2)
A B C D
11:45 793 1 3612:00 987 1 2912:15 833 1 26
0:00 64 11 1 12:30 715 1 450:15 12:45 767 1 360:30 13:00 889 1 230:45 13:15 614 1 411:00 13:30 628 1 201:15 13:45 582 1 171:30 14:00 560 1 181:45 14:15 657 1 172:00 14:30 772 1 132:15 14:45 726 1 182:30 104 7 2 15:00 668 1 252:45 15:15 450 2 163:00 53 13 2 15:30 523 1 153:15 88 8 2 15:45 367 2 253:30 101 7 7 16:00 268 3 73:45 89 8 5 16:15 198 3 134:00 47 15 3 16:30 161 4 154:15 62 11 5 16:45 325 2 144:30 45 15 1 17:00 155 4 174:45 33 21 2 17:15 127 5 135:00 58 12 5 17:30 360 2 95:15 45 15 5 17:45 217 3 65:30 67 10 2 18:00 398 2 105:45 62 11 3 18:15 507 1 126:00 62 11 6 18:30 739 1 176:15 89 8 5 18:45 570 1 286:30 56 12 9 19:00 560 1 186:45 53 13 5 19:15 424 2 107:00 83 8 10 19:30 747 1 297:15 46 15 10 19:45 622 1 197:30 52 13 8 20:00 577 1 107:45 66 10 7 20:15 723 1 98:00 85 8 10 20:30 744 1 178:15 83 8 6 20:45 847 1 248:30 57 12 8 21:00 728 1 188:45 131 5 16 21:15 600 1 129:00 201 3 7 21:30 618 1 109:15 247 3 16 21:45 591 1 99:30 283 2 14 22:00 399 2 119:45 414 2 17 22:15 599 1 8
10:00 515 1 22 22:30 509 1 910:15 377 2 15 22:45 55 12 310:30 579 1 27 23:00 340 2 710:45 671 1 24 23:15 89 8 611:00 702 1 36 23:30 142 5 111:15 819 1 20 23:45 31 22 111:30 676 1 23
Time
(A)
Average
Travel
Time (Seconds)
(B)
Average
Speed (MPH)
(C)
Sample Size
(D)
Friday, June 19, 2015

ARID TRAVEL TIME DATA
Douglas Port of Entry (MEX), Southbound, MX to POE (2-3)
A B C D
11:45 302 2 212:00 260 3 312:15 509 1 1
0:00 12:30 174 4 20:15 12:45 51 13 10:30 13:00 83 8 10:45 13:15
1:00 13:30 29 24 11:15 13:45 52 13 21:30 14:00
1:45 14:15 72 10 12:00 14:30 489 1 42:15 14:45 119 6 12:30 15:00 482 1 22:45 15:15 594 1 23:00 15:30 722 1 23:15 15:45 391 2 13:30 16:00 180 4 13:45 16:15
4:00 432 2 1 16:30 684 1 24:15 16:45 234 3 24:30 17:00 210 3 54:45 17:15 416 2 35:00 17:30 83 8 35:15 17:45 178 4 25:30 18:00 184 4 15:45 18:15 57 12 16:00 18:30 407 2 26:15 18:45 479 1 26:30 19:00 474 1 36:45 19:15
7:00 19:30 333 2 17:15 19:45 670 1 27:30 600 1 1 20:00 94 7 17:45 20:15 621 1 48:00 20:30 271 3 38:15 20:45 659 1 28:30 21:00 399 2 38:45 454 2 1 21:15 322 2 19:00 475 1 1 21:30 473 1 29:15 305 2 1 21:45 262 3 29:30 22:00 388 2 29:45 218 3 1 22:15
10:00 74 9 2 22:30 118 6 110:15 76 9 2 22:45 82 8 110:30 278 2 3 23:00 102 7 210:45 63 11 1 23:15
11:00 391 2 1 23:30
11:15 399 2 2 23:45
11:30 107 6 1
Average
Speed (MPH)
(C)
Sample Size
(D)
Average
Travel
Time (Seconds)
(B)
Time
(A)
Friday, June 19, 2015
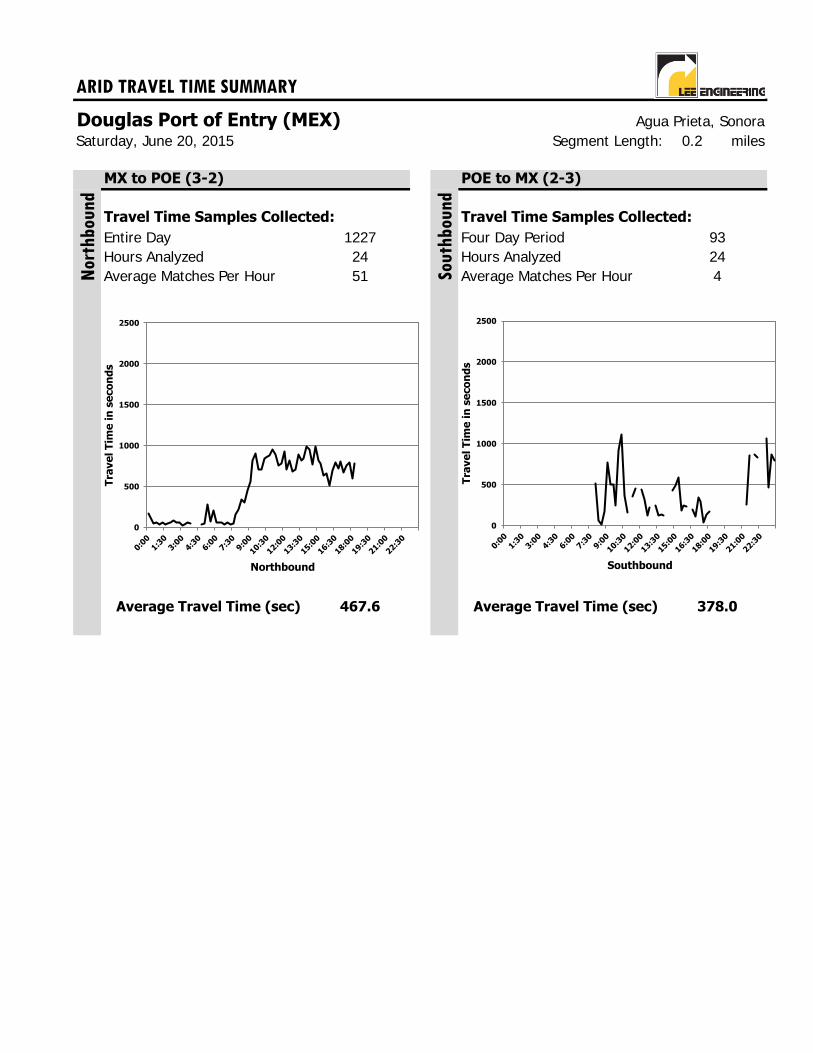
ARID TRAVEL TIME SUMMARY
Douglas Port of Entry (MEX)Segment Length: 0.2 miles
MX to POE (3-2) POE to MX (2-3)
Travel Time Samples Collected: Travel Time Samples Collected:
Entire Day Four Day PeriodHours Analyzed Hours AnalyzedAverage Matches Per Hour Average Matches Per Hour
Average Travel Time (sec) Average Travel Time (sec)
4
Agua Prieta, Sonora
51
467.6 378.0
Sou
thb
ound
Nor
thbou
nd
Saturday, June 20, 2015
1227 9324 24
0
500
1000
1500
2000
2500
Tra
ve
l T
ime
in
se
co
nd
s
Northbound
0
500
1000
1500
2000
2500
Tra
ve
l T
ime
in
se
co
nd
s
Southbound
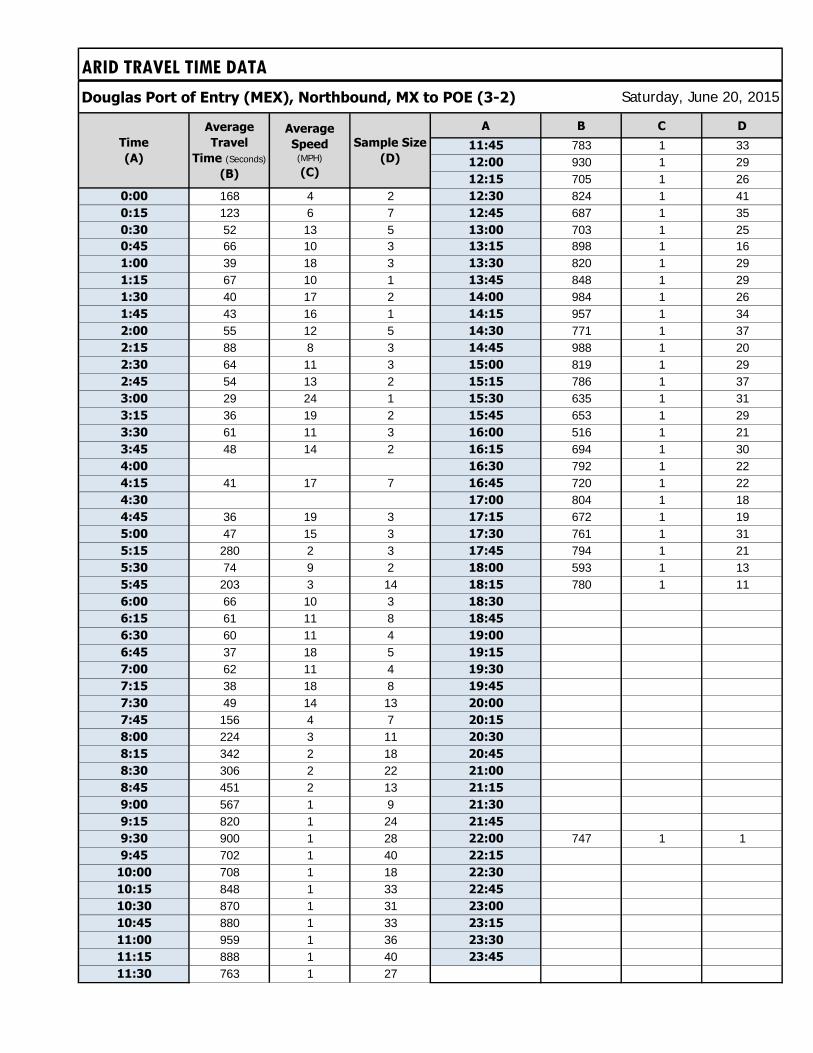
ARID TRAVEL TIME DATA
Douglas Port of Entry (MEX), Northbound, MX to POE (3-2)
A B C D
11:45 783 1 3312:00 930 1 2912:15 705 1 26
0:00 168 4 2 12:30 824 1 410:15 123 6 7 12:45 687 1 350:30 52 13 5 13:00 703 1 250:45 66 10 3 13:15 898 1 161:00 39 18 3 13:30 820 1 291:15 67 10 1 13:45 848 1 291:30 40 17 2 14:00 984 1 261:45 43 16 1 14:15 957 1 342:00 55 12 5 14:30 771 1 372:15 88 8 3 14:45 988 1 202:30 64 11 3 15:00 819 1 292:45 54 13 2 15:15 786 1 373:00 29 24 1 15:30 635 1 313:15 36 19 2 15:45 653 1 293:30 61 11 3 16:00 516 1 213:45 48 14 2 16:15 694 1 304:00 16:30 792 1 224:15 41 17 7 16:45 720 1 224:30 17:00 804 1 184:45 36 19 3 17:15 672 1 195:00 47 15 3 17:30 761 1 315:15 280 2 3 17:45 794 1 215:30 74 9 2 18:00 593 1 135:45 203 3 14 18:15 780 1 116:00 66 10 3 18:30
6:15 61 11 8 18:45
6:30 60 11 4 19:00
6:45 37 18 5 19:15
7:00 62 11 4 19:30
7:15 38 18 8 19:45
7:30 49 14 13 20:00
7:45 156 4 7 20:15
8:00 224 3 11 20:30
8:15 342 2 18 20:45
8:30 306 2 22 21:00
8:45 451 2 13 21:15
9:00 567 1 9 21:30
9:15 820 1 24 21:45
9:30 900 1 28 22:00 747 1 19:45 702 1 40 22:15
10:00 708 1 18 22:30
10:15 848 1 33 22:45
10:30 870 1 31 23:00
10:45 880 1 33 23:15
11:00 959 1 36 23:30
11:15 888 1 40 23:45
11:30 763 1 27
Time
(A)
Average
Travel
Time (Seconds)
(B)
Average
Speed (MPH)
(C)
Sample Size
(D)
Saturday, June 20, 2015
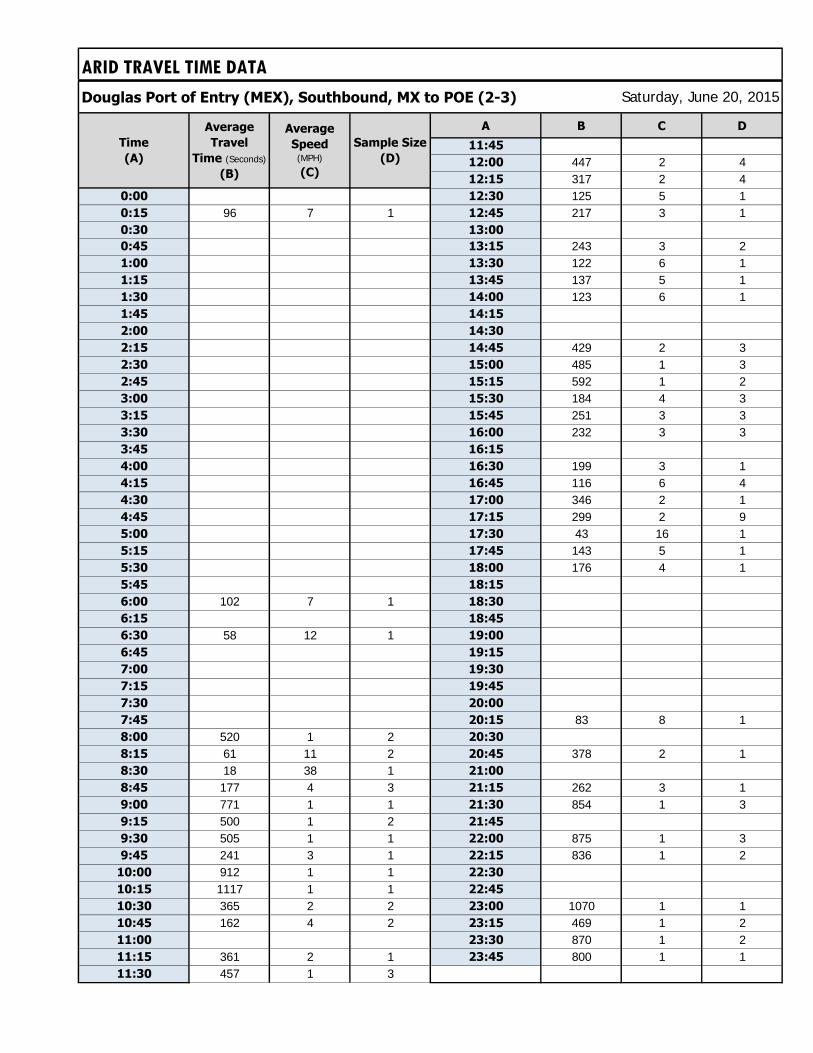
ARID TRAVEL TIME DATA
Douglas Port of Entry (MEX), Southbound, MX to POE (2-3)
A B C D
11:45
12:00 447 2 412:15 317 2 4
0:00 12:30 125 5 10:15 96 7 1 12:45 217 3 10:30 13:00
0:45 13:15 243 3 21:00 13:30 122 6 11:15 13:45 137 5 11:30 14:00 123 6 11:45 14:15
2:00 14:30
2:15 14:45 429 2 32:30 15:00 485 1 32:45 15:15 592 1 23:00 15:30 184 4 33:15 15:45 251 3 33:30 16:00 232 3 33:45 16:15
4:00 16:30 199 3 14:15 16:45 116 6 44:30 17:00 346 2 14:45 17:15 299 2 95:00 17:30 43 16 15:15 17:45 143 5 15:30 18:00 176 4 15:45 18:15
6:00 102 7 1 18:30
6:15 18:45
6:30 58 12 1 19:00
6:45 19:15
7:00 19:30
7:15 19:45
7:30 20:00
7:45 20:15 83 8 18:00 520 1 2 20:30
8:15 61 11 2 20:45 378 2 18:30 18 38 1 21:00
8:45 177 4 3 21:15 262 3 19:00 771 1 1 21:30 854 1 39:15 500 1 2 21:45
9:30 505 1 1 22:00 875 1 39:45 241 3 1 22:15 836 1 2
10:00 912 1 1 22:30
10:15 1117 1 1 22:45
10:30 365 2 2 23:00 1070 1 110:45 162 4 2 23:15 469 1 211:00 23:30 870 1 211:15 361 2 1 23:45 800 1 111:30 457 1 3
Average
Speed (MPH)
(C)
Sample Size
(D)
Average
Travel
Time (Seconds)
(B)
Time
(A)
Saturday, June 20, 2015

ARID TRAVEL TIME SUMMARY
Douglas Port of Entry (MEX) Agua Prieta, SonoraSegment Length: 0.2 miles
MX to POE (3-2) POE to MX (2-3)
Travel Time Samples Collected: Travel Time Samples Collected:
Entire Day Four Day PeriodHours Analyzed Hours AnalyzedAverage Matches Per Hour Average Matches Per Hour
Average Travel Time (sec) Average Travel Time (sec) N/A
21
Sunday, June 21, 2015
11
N/A
Nor
thbou
nd
Sou
thb
ound
0
500
1000
1500
2000
2500
Tra
ve
l T
ime
in
se
co
nd
s
Northbound
0
500
1000
1500
2000
2500
Tra
ve
l T
ime
in
se
co
nd
s
Southbound
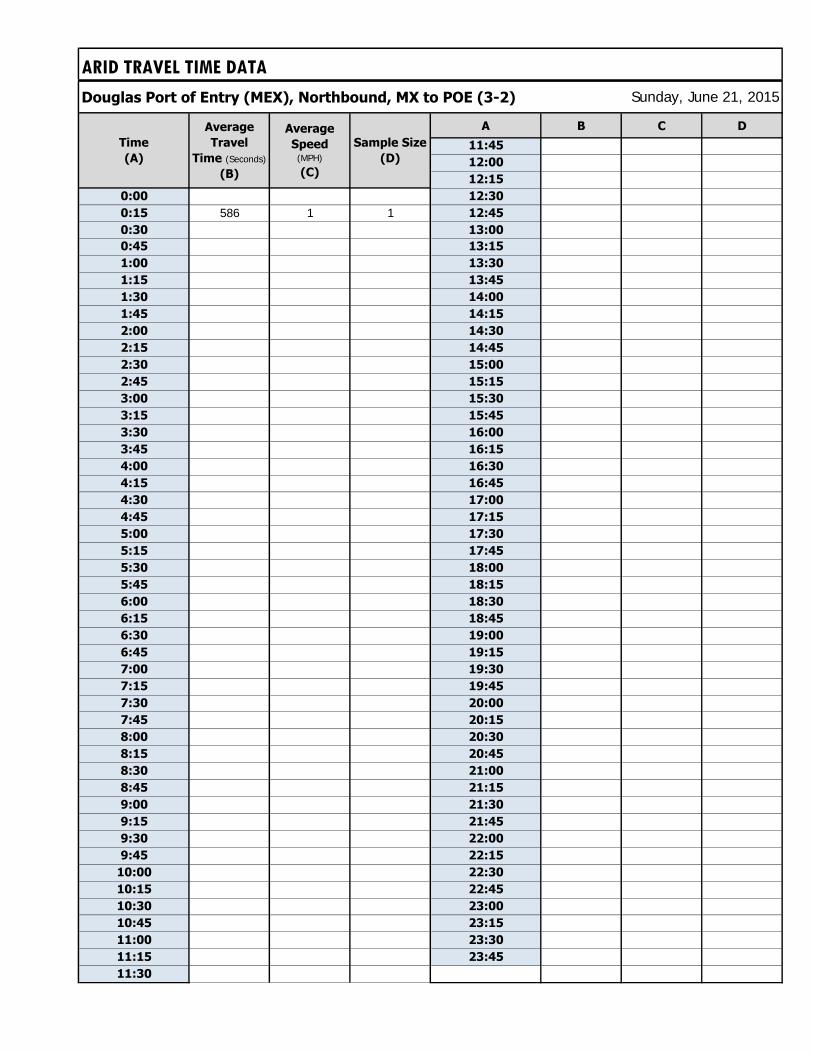
ARID TRAVEL TIME DATA
Douglas Port of Entry (MEX), Northbound, MX to POE (3-2)
A B C D
11:45
12:00
12:15
0:00 12:30
0:15 586 1 1 12:45
0:30 13:00
0:45 13:15
1:00 13:30
1:15 13:45
1:30 14:00
1:45 14:15
2:00 14:30
2:15 14:45
2:30 15:00
2:45 15:15
3:00 15:30
3:15 15:45
3:30 16:00
3:45 16:15
4:00 16:30
4:15 16:45
4:30 17:00
4:45 17:15
5:00 17:30
5:15 17:45
5:30 18:00
5:45 18:15
6:00 18:30
6:15 18:45
6:30 19:00
6:45 19:15
7:00 19:30
7:15 19:45
7:30 20:00
7:45 20:15
8:00 20:30
8:15 20:45
8:30 21:00
8:45 21:15
9:00 21:30
9:15 21:45
9:30 22:00
9:45 22:15
10:00 22:30
10:15 22:45
10:30 23:00
10:45 23:15
11:00 23:30
11:15 23:45
11:30
Time
(A)
Average
Travel
Time (Seconds)
(B)
Average
Speed (MPH)
(C)
Sample Size
(D)
Sunday, June 21, 2015

ARID TRAVEL TIME DATA
Douglas Port of Entry (MEX), Southbound, MX to POE (2-3)
A B C D
11:45
12:00
12:15
0:00 464 1 1 12:30
0:15 12:45
0:30 13:00
0:45 13:15
1:00 13:30
1:15 249 3 1 13:45
1:30 14:00
1:45 14:15
2:00 14:30
2:15 14:45
2:30 15:00
2:45 15:15
3:00 15:30
3:15 15:45
3:30 16:00
3:45 16:15
4:00 16:30
4:15 16:45
4:30 17:00
4:45 17:15
5:00 17:30
5:15 17:45
5:30 18:00
5:45 18:15
6:00 18:30
6:15 18:45
6:30 19:00
6:45 19:15
7:00 19:30
7:15 19:45
7:30 20:00
7:45 20:15
8:00 20:30
8:15 20:45
8:30 21:00
8:45 21:15
9:00 21:30
9:15 21:45
9:30 22:00
9:45 22:15
10:00 22:30
10:15 22:45
10:30 23:00
10:45 23:15
11:00 23:30
11:15 23:45
11:30
Average
Speed (MPH)
(C)
Sample Size
(D)
Average
Travel
Time (Seconds)
(B)
Time
(A)
Sunday, June 21, 2015
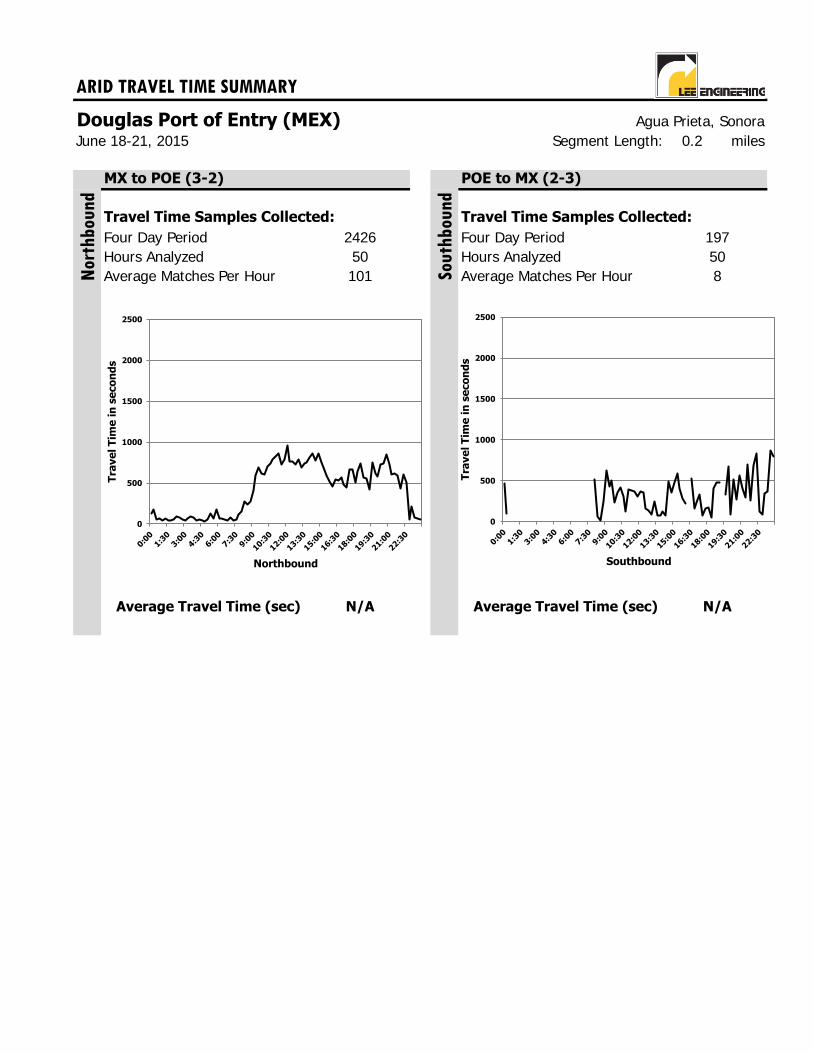
ARID TRAVEL TIME SUMMARY
Douglas Port of Entry (MEX) Agua Prieta, SonoraSegment Length: 0.2 miles
MX to POE (3-2) POE to MX (2-3)
Travel Time Samples Collected: Travel Time Samples Collected:
Four Day Period Four Day PeriodHours Analyzed Hours AnalyzedAverage Matches Per Hour Average Matches Per Hour
Average Travel Time (sec) Average Travel Time (sec)
June 18-21, 2015
Nor
thbou
nd
Sou
thb
ound
2426 19750 50101 8
N/A N/A
0
500
1000
1500
2000
2500
Tra
ve
l T
ime
in
se
co
nd
s
Northbound
0
500
1000
1500
2000
2500
Tra
ve
l T
ime
in
se
co
nd
s
Southbound
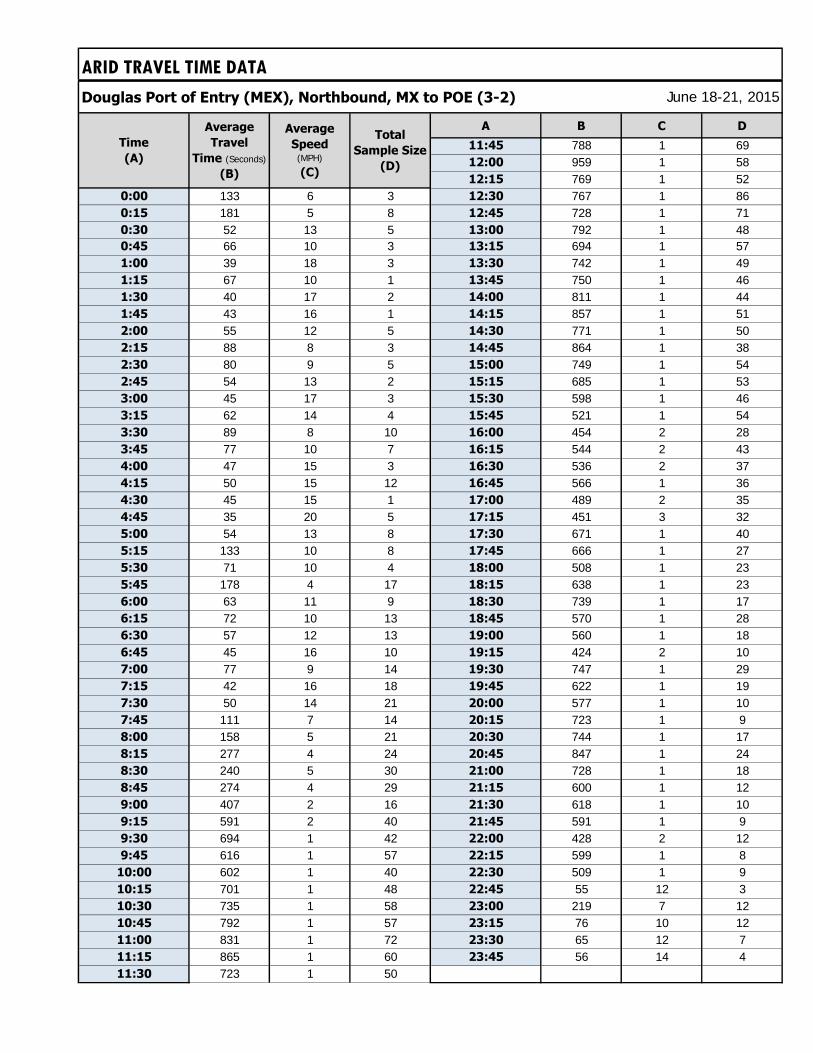
ARID TRAVEL TIME DATA
Douglas Port of Entry (MEX), Northbound, MX to POE (3-2)
A B C D
11:45 788 1 6912:00 959 1 5812:15 769 1 52
0:00 133 6 3 12:30 767 1 860:15 181 5 8 12:45 728 1 710:30 52 13 5 13:00 792 1 480:45 66 10 3 13:15 694 1 571:00 39 18 3 13:30 742 1 491:15 67 10 1 13:45 750 1 461:30 40 17 2 14:00 811 1 441:45 43 16 1 14:15 857 1 512:00 55 12 5 14:30 771 1 502:15 88 8 3 14:45 864 1 382:30 80 9 5 15:00 749 1 542:45 54 13 2 15:15 685 1 533:00 45 17 3 15:30 598 1 463:15 62 14 4 15:45 521 1 543:30 89 8 10 16:00 454 2 283:45 77 10 7 16:15 544 2 434:00 47 15 3 16:30 536 2 374:15 50 15 12 16:45 566 1 364:30 45 15 1 17:00 489 2 354:45 35 20 5 17:15 451 3 325:00 54 13 8 17:30 671 1 405:15 133 10 8 17:45 666 1 275:30 71 10 4 18:00 508 1 235:45 178 4 17 18:15 638 1 236:00 63 11 9 18:30 739 1 176:15 72 10 13 18:45 570 1 286:30 57 12 13 19:00 560 1 186:45 45 16 10 19:15 424 2 107:00 77 9 14 19:30 747 1 297:15 42 16 18 19:45 622 1 197:30 50 14 21 20:00 577 1 107:45 111 7 14 20:15 723 1 98:00 158 5 21 20:30 744 1 178:15 277 4 24 20:45 847 1 248:30 240 5 30 21:00 728 1 188:45 274 4 29 21:15 600 1 129:00 407 2 16 21:30 618 1 109:15 591 2 40 21:45 591 1 99:30 694 1 42 22:00 428 2 129:45 616 1 57 22:15 599 1 8
10:00 602 1 40 22:30 509 1 910:15 701 1 48 22:45 55 12 310:30 735 1 58 23:00 219 7 1210:45 792 1 57 23:15 76 10 1211:00 831 1 72 23:30 65 12 711:15 865 1 60 23:45 56 14 411:30 723 1 50
June 18-21, 2015
Time
(A)
Average
Travel
Time (Seconds)
(B)
Average
Speed (MPH)
(C)
Total
Sample Size
(D)
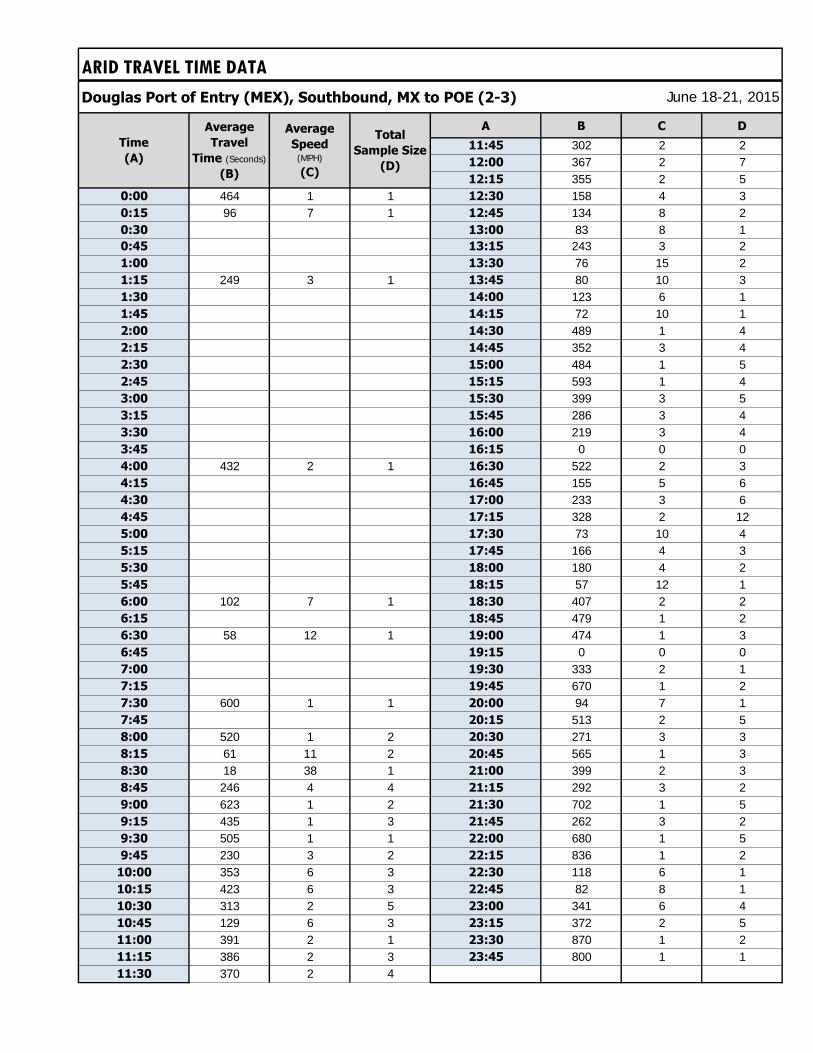
ARID TRAVEL TIME DATA
Douglas Port of Entry (MEX), Southbound, MX to POE (2-3)
A B C D
11:45 302 2 212:00 367 2 712:15 355 2 5
0:00 464 1 1 12:30 158 4 30:15 96 7 1 12:45 134 8 20:30 13:00 83 8 10:45 13:15 243 3 21:00 13:30 76 15 21:15 249 3 1 13:45 80 10 31:30 14:00 123 6 11:45 14:15 72 10 12:00 14:30 489 1 42:15 14:45 352 3 42:30 15:00 484 1 52:45 15:15 593 1 43:00 15:30 399 3 53:15 15:45 286 3 43:30 16:00 219 3 43:45 16:15 0 0 04:00 432 2 1 16:30 522 2 34:15 16:45 155 5 64:30 17:00 233 3 64:45 17:15 328 2 125:00 17:30 73 10 45:15 17:45 166 4 35:30 18:00 180 4 25:45 18:15 57 12 16:00 102 7 1 18:30 407 2 26:15 18:45 479 1 26:30 58 12 1 19:00 474 1 36:45 19:15 0 0 07:00 19:30 333 2 17:15 19:45 670 1 27:30 600 1 1 20:00 94 7 17:45 20:15 513 2 58:00 520 1 2 20:30 271 3 38:15 61 11 2 20:45 565 1 38:30 18 38 1 21:00 399 2 38:45 246 4 4 21:15 292 3 29:00 623 1 2 21:30 702 1 59:15 435 1 3 21:45 262 3 29:30 505 1 1 22:00 680 1 59:45 230 3 2 22:15 836 1 2
10:00 353 6 3 22:30 118 6 110:15 423 6 3 22:45 82 8 110:30 313 2 5 23:00 341 6 410:45 129 6 3 23:15 372 2 511:00 391 2 1 23:30 870 1 211:15 386 2 3 23:45 800 1 111:30 370 2 4
June 18-21, 2015
Time
(A)
Average
Travel
Time (Seconds)
(B)
Average
Speed (MPH)
(C)
Total
Sample Size
(D)
ANALYSIS OF BLUETOOTH AND WI-FI TECHNOLOGY
TO MEASURE WAIT TIMES OF PERSONAL VEHICLES AT ARIZONA-MEXICO PORTS OF ENTRY
APPENDIX B MIOVISION VOLUME DATA

MIOVISION DATA COLLECTION
Douglas Port of Entry
Time Northbound (2-1) Southbound (1-2) Time Northbound (2-1) Southbound (1-2)
0:00 12:00
0:15 12:15
0:30 12:30
0:45 12:45
1:00 13:00
1:15 13:15
1:30 13:30
1:45 13:45
2:00 14:00
2:15 14:15
2:30 14:30
2:45 14:45
3:00 15:00
3:15 15:15
3:30 15:30
3:45 15:45
4:00 16:00
4:15 16:15
4:30 16:30
4:45 16:45
5:00 17:00
5:15 17:15
5:30 17:30
5:45 17:45
6:00 18:00
6:15 18:15
6:30 18:30
6:45 18:45
7:00 19:00
7:15 19:15
7:30 19:30
7:45 19:45
8:00 20:00 77 67
8:15 20:15 69 67
8:30 20:30 81 74
8:45 20:45 66 75
9:00 21:00 63 63
9:15 21:15 61 74
9:30 21:30 61 69
9:45 21:45 57 48
10:00 22:00 42 42
10:15 22:15 42 49
10:30 22:30 52 33
10:45 22:45 36 23
11:00 23:00 35 21
11:15 23:15 24 25
11:30 23:30 20 12
11:45 23:45 12 12
Thursday, June 18, 2015
QUANTITY OF VEHICLES OBSERVED QUANTITY OF VEHICLES OBSERVED

MIOVISION DATA COLLECTION
Douglas Port of Entry
Time Northbound (2-1) Southbound (1-2) Time Northbound (2-1) Southbound (1-2)
0:00 13 15 12:00 87 68
0:15 10 8 12:15 75 63
0:30 14 9 12:30 77 72
0:45 5 8 12:45 71 54
1:00 7 5 13:00 94 64
1:15 3 4 13:15 81 73
1:30 7 2 13:30 83 67
1:45 6 3 13:45 65 69
2:00 3 1 14:00 62 71
2:15 7 1 14:15 73 65
2:30 4 2 14:30 68 87
2:45 5 1 14:45 67 64
3:00 5 2 15:00 78 77
3:15 9 0 15:15 67 82
3:30 18 0 15:30 71 74
3:45 16 1 15:45 88 94
4:00 12 1 16:00 82 79
4:15 10 2 16:15 58 74
4:30 17 3 16:30 78 98
4:45 18 1 16:45 83 88
5:00 31 5 17:00 73 91
5:15 23 6 17:15 72 95
5:30 28 4 17:30 64 97
5:45 19 8 17:45 76 102
6:00 30 16 18:00 80 82
6:15 36 13 18:15 67 86
6:30 32 17 18:30 76 82
6:45 50 23 18:45 86 91
7:00 49 18 19:00 68 91
7:15 49 27 19:15 57 75
7:30 56 25 19:30 0 0
7:45 52 39 19:45 76 84
8:00 79 38 20:00 71 96
8:15 56 42 20:15 60 96
8:30 70 46 20:30 66 73
8:45 65 46 20:45 62 97
9:00 78 51 21:00 74 90
9:15 63 58 21:15 81 71
9:30 82 52 21:30 50 58
9:45 68 51 21:45 70 80
10:00 75 71 22:00 61 51
10:15 71 63 22:15 43 58
10:30 83 54 22:30 58 41
10:45 74 55 22:45 56 31
11:00 68 62 23:00 42 43
11:15 75 65 23:15 49 33
11:30 71 58 23:30 31 35
11:45 65 76 23:45 35 31
QUANTITY OF VEHICLES OBSERVED QUANTITY OF VEHICLES OBSERVED
Friday, June 19, 2015
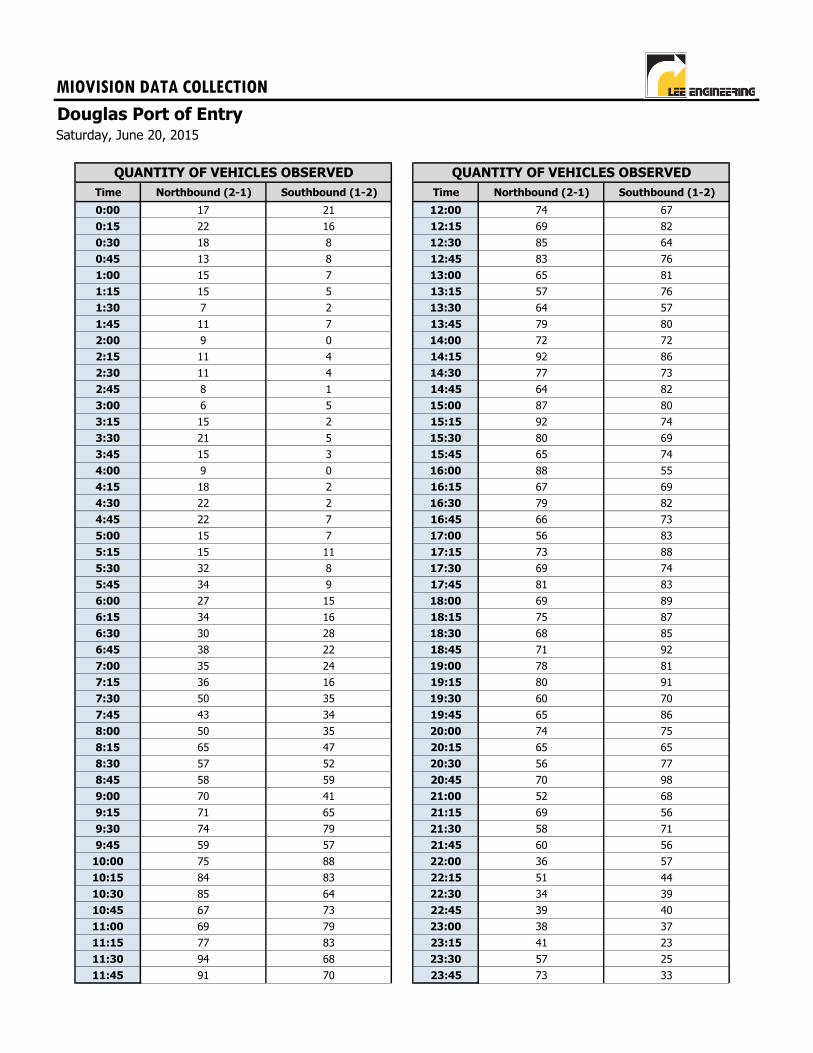
MIOVISION DATA COLLECTION
Douglas Port of Entry
Time Northbound (2-1) Southbound (1-2) Time Northbound (2-1) Southbound (1-2)
0:00 17 21 12:00 74 67
0:15 22 16 12:15 69 82
0:30 18 8 12:30 85 64
0:45 13 8 12:45 83 76
1:00 15 7 13:00 65 81
1:15 15 5 13:15 57 76
1:30 7 2 13:30 64 57
1:45 11 7 13:45 79 80
2:00 9 0 14:00 72 72
2:15 11 4 14:15 92 86
2:30 11 4 14:30 77 73
2:45 8 1 14:45 64 82
3:00 6 5 15:00 87 80
3:15 15 2 15:15 92 74
3:30 21 5 15:30 80 69
3:45 15 3 15:45 65 74
4:00 9 0 16:00 88 55
4:15 18 2 16:15 67 69
4:30 22 2 16:30 79 82
4:45 22 7 16:45 66 73
5:00 15 7 17:00 56 83
5:15 15 11 17:15 73 88
5:30 32 8 17:30 69 74
5:45 34 9 17:45 81 83
6:00 27 15 18:00 69 89
6:15 34 16 18:15 75 87
6:30 30 28 18:30 68 85
6:45 38 22 18:45 71 92
7:00 35 24 19:00 78 81
7:15 36 16 19:15 80 91
7:30 50 35 19:30 60 70
7:45 43 34 19:45 65 86
8:00 50 35 20:00 74 75
8:15 65 47 20:15 65 65
8:30 57 52 20:30 56 77
8:45 58 59 20:45 70 98
9:00 70 41 21:00 52 68
9:15 71 65 21:15 69 56
9:30 74 79 21:30 58 71
9:45 59 57 21:45 60 56
10:00 75 88 22:00 36 57
10:15 84 83 22:15 51 44
10:30 85 64 22:30 34 39
10:45 67 73 22:45 39 40
11:00 69 79 23:00 38 37
11:15 77 83 23:15 41 23
11:30 94 68 23:30 57 25
11:45 91 70 23:45 73 33
QUANTITY OF VEHICLES OBSERVED QUANTITY OF VEHICLES OBSERVED
Saturday, June 20, 2015
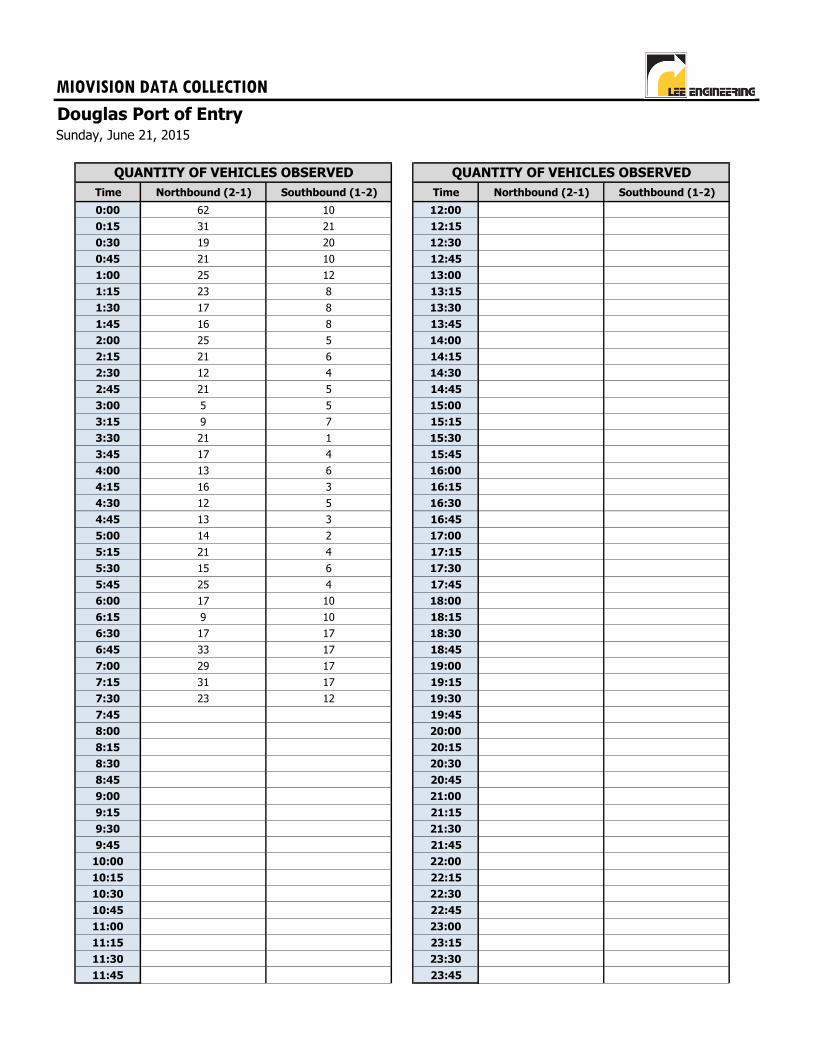
MIOVISION DATA COLLECTION
Douglas Port of Entry
Time Northbound (2-1) Southbound (1-2) Time Northbound (2-1) Southbound (1-2)
0:00 62 10 12:00
0:15 31 21 12:15
0:30 19 20 12:30
0:45 21 10 12:45
1:00 25 12 13:00
1:15 23 8 13:15
1:30 17 8 13:30
1:45 16 8 13:45
2:00 25 5 14:00
2:15 21 6 14:15
2:30 12 4 14:30
2:45 21 5 14:45
3:00 5 5 15:00
3:15 9 7 15:15
3:30 21 1 15:30
3:45 17 4 15:45
4:00 13 6 16:00
4:15 16 3 16:15
4:30 12 5 16:30
4:45 13 3 16:45
5:00 14 2 17:00
5:15 21 4 17:15
5:30 15 6 17:30
5:45 25 4 17:45
6:00 17 10 18:00
6:15 9 10 18:15
6:30 17 17 18:30
6:45 33 17 18:45
7:00 29 17 19:00
7:15 31 17 19:15
7:30 23 12 19:30
7:45 19:45
8:00 20:00
8:15 20:15
8:30 20:30
8:45 20:45
9:00 21:00
9:15 21:15
9:30 21:30
9:45 21:45
10:00 22:00
10:15 22:15
10:30 22:30
10:45 22:45
11:00 23:00
11:15 23:15
11:30 23:30
11:45 23:45
QUANTITY OF VEHICLES OBSERVED QUANTITY OF VEHICLES OBSERVED
Sunday, June 21, 2015
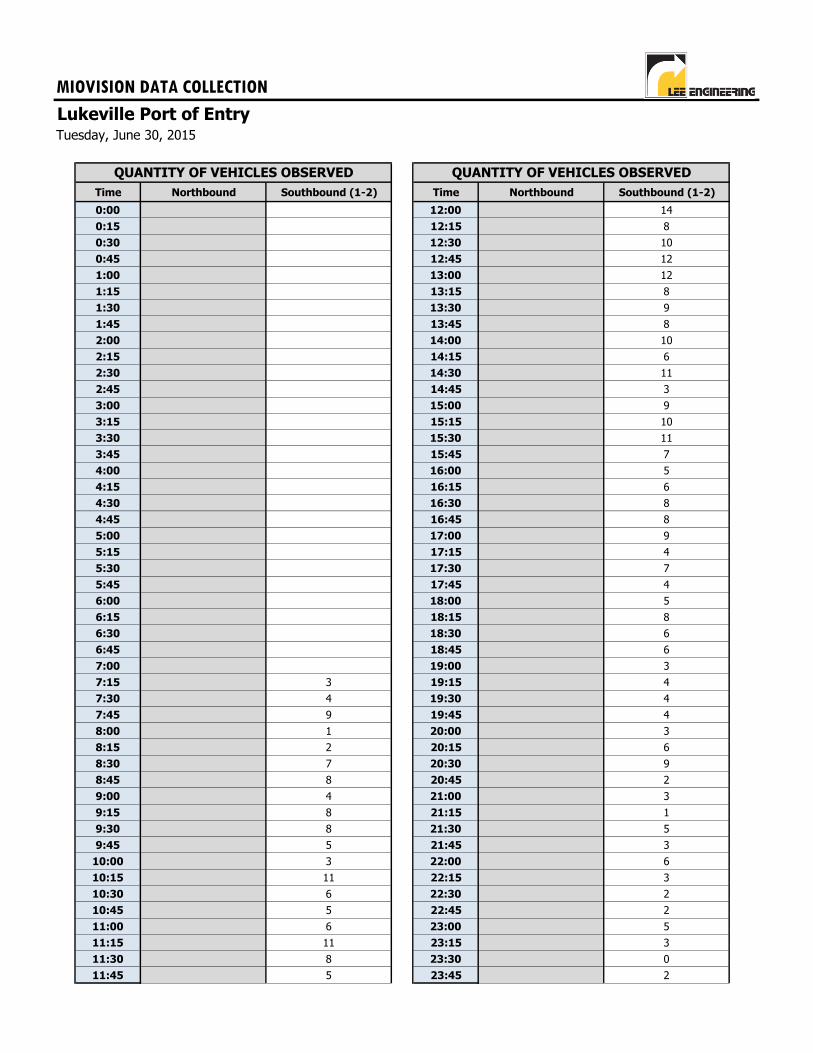
MIOVISION DATA COLLECTION
Lukeville Port of Entry
Time Northbound Southbound (1-2) Time Northbound Southbound (1-2)
0:00 12:00 14
0:15 12:15 8
0:30 12:30 10
0:45 12:45 12
1:00 13:00 12
1:15 13:15 8
1:30 13:30 9
1:45 13:45 8
2:00 14:00 10
2:15 14:15 6
2:30 14:30 11
2:45 14:45 3
3:00 15:00 9
3:15 15:15 10
3:30 15:30 11
3:45 15:45 7
4:00 16:00 5
4:15 16:15 6
4:30 16:30 8
4:45 16:45 8
5:00 17:00 9
5:15 17:15 4
5:30 17:30 7
5:45 17:45 4
6:00 18:00 5
6:15 18:15 8
6:30 18:30 6
6:45 18:45 6
7:00 19:00 3
7:15 3 19:15 4
7:30 4 19:30 4
7:45 9 19:45 4
8:00 1 20:00 3
8:15 2 20:15 6
8:30 7 20:30 9
8:45 8 20:45 2
9:00 4 21:00 3
9:15 8 21:15 1
9:30 8 21:30 5
9:45 5 21:45 3
10:00 3 22:00 6
10:15 11 22:15 3
10:30 6 22:30 2
10:45 5 22:45 2
11:00 6 23:00 5
11:15 11 23:15 3
11:30 8 23:30 0
11:45 5 23:45 2
QUANTITY OF VEHICLES OBSERVED QUANTITY OF VEHICLES OBSERVED
Tuesday, June 30, 2015
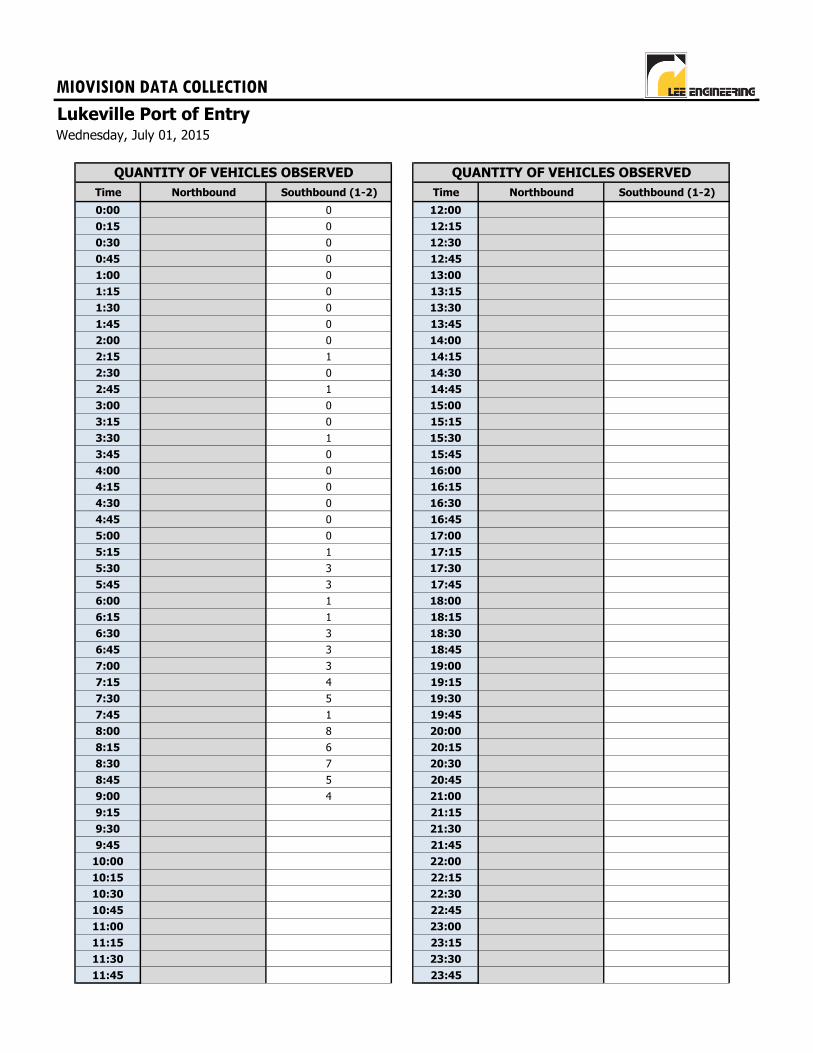
MIOVISION DATA COLLECTION
Lukeville Port of Entry
Time Northbound Southbound (1-2) Time Northbound Southbound (1-2)
0:00 0 12:00
0:15 0 12:15
0:30 0 12:30
0:45 0 12:45
1:00 0 13:00
1:15 0 13:15
1:30 0 13:30
1:45 0 13:45
2:00 0 14:00
2:15 1 14:15
2:30 0 14:30
2:45 1 14:45
3:00 0 15:00
3:15 0 15:15
3:30 1 15:30
3:45 0 15:45
4:00 0 16:00
4:15 0 16:15
4:30 0 16:30
4:45 0 16:45
5:00 0 17:00
5:15 1 17:15
5:30 3 17:30
5:45 3 17:45
6:00 1 18:00
6:15 1 18:15
6:30 3 18:30
6:45 3 18:45
7:00 3 19:00
7:15 4 19:15
7:30 5 19:30
7:45 1 19:45
8:00 8 20:00
8:15 6 20:15
8:30 7 20:30
8:45 5 20:45
9:00 4 21:00
9:15 21:15
9:30 21:30
9:45 21:45
10:00 22:00
10:15 22:15
10:30 22:30
10:45 22:45
11:00 23:00
11:15 23:15
11:30 23:30
11:45 23:45
QUANTITY OF VEHICLES OBSERVED QUANTITY OF VEHICLES OBSERVED
Wednesday, July 01, 2015
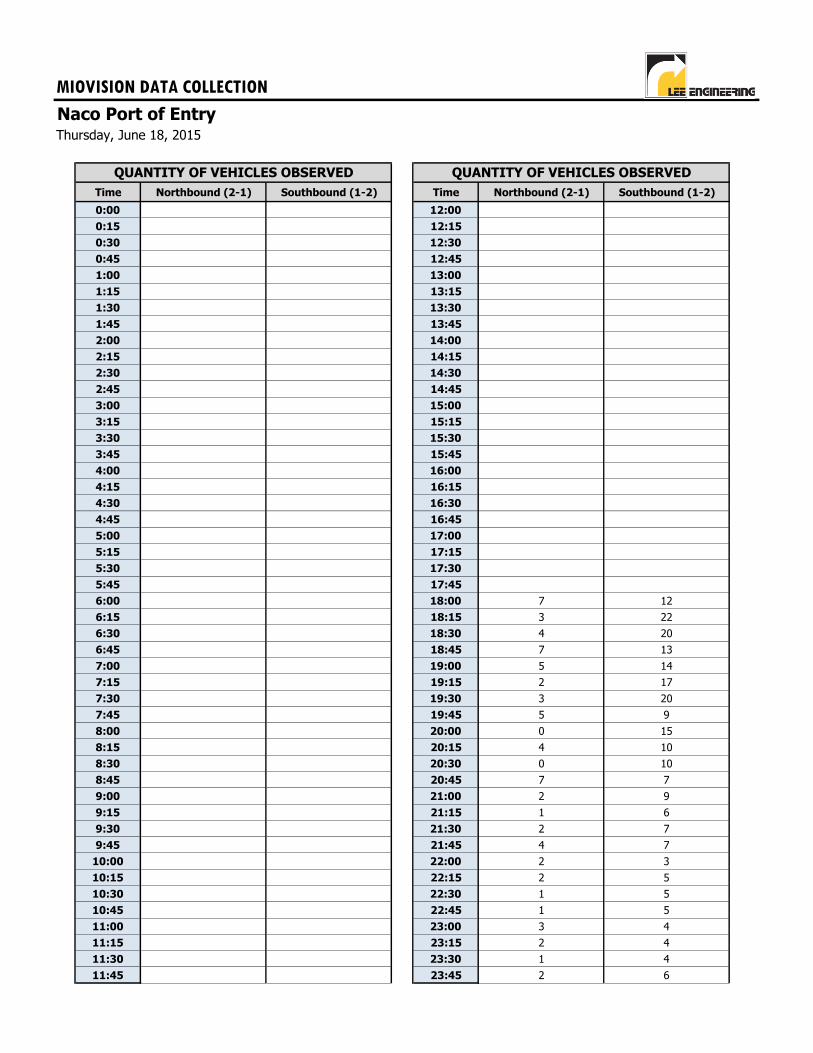
MIOVISION DATA COLLECTION
Naco Port of Entry
Time Northbound (2-1) Southbound (1-2) Time Northbound (2-1) Southbound (1-2)
0:00 12:00
0:15 12:15
0:30 12:30
0:45 12:45
1:00 13:00
1:15 13:15
1:30 13:30
1:45 13:45
2:00 14:00
2:15 14:15
2:30 14:30
2:45 14:45
3:00 15:00
3:15 15:15
3:30 15:30
3:45 15:45
4:00 16:00
4:15 16:15
4:30 16:30
4:45 16:45
5:00 17:00
5:15 17:15
5:30 17:30
5:45 17:45
6:00 18:00 7 12
6:15 18:15 3 22
6:30 18:30 4 20
6:45 18:45 7 13
7:00 19:00 5 14
7:15 19:15 2 17
7:30 19:30 3 20
7:45 19:45 5 9
8:00 20:00 0 15
8:15 20:15 4 10
8:30 20:30 0 10
8:45 20:45 7 7
9:00 21:00 2 9
9:15 21:15 1 6
9:30 21:30 2 7
9:45 21:45 4 7
10:00 22:00 2 3
10:15 22:15 2 5
10:30 22:30 1 5
10:45 22:45 1 5
11:00 23:00 3 4
11:15 23:15 2 4
11:30 23:30 1 4
11:45 23:45 2 6
QUANTITY OF VEHICLES OBSERVED QUANTITY OF VEHICLES OBSERVED
Thursday, June 18, 2015
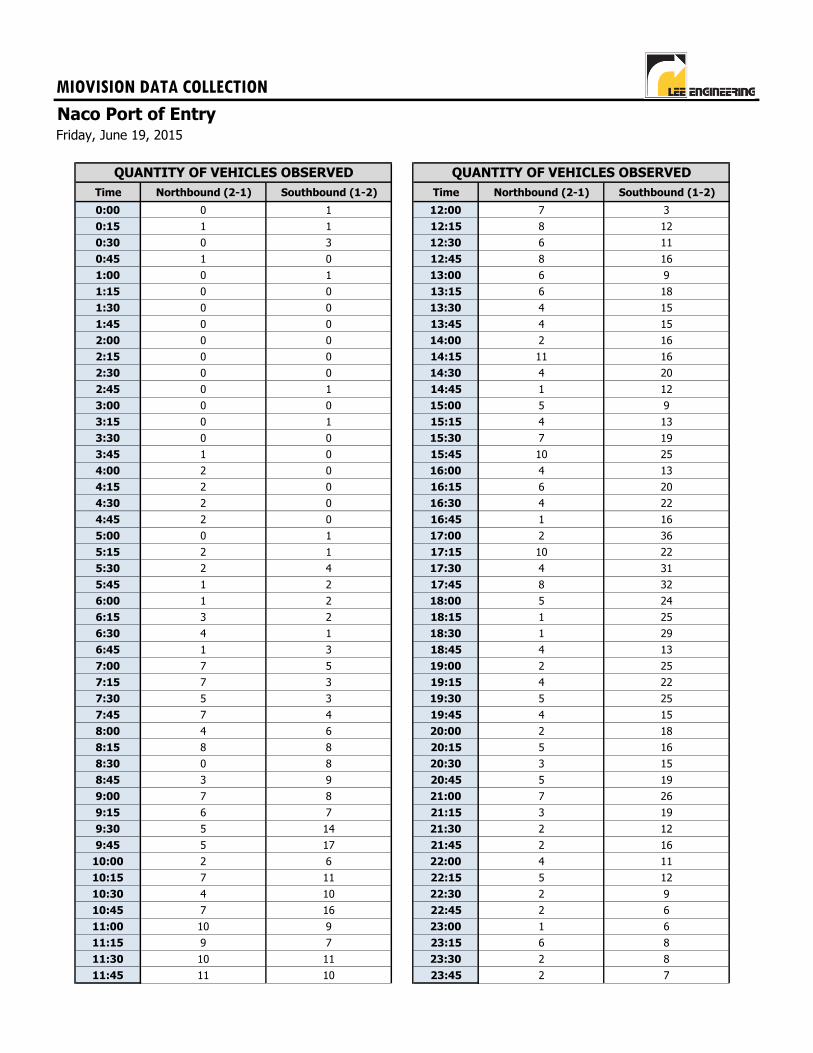
MIOVISION DATA COLLECTION
Naco Port of Entry
Time Northbound (2-1) Southbound (1-2) Time Northbound (2-1) Southbound (1-2)
0:00 0 1 12:00 7 3
0:15 1 1 12:15 8 12
0:30 0 3 12:30 6 11
0:45 1 0 12:45 8 16
1:00 0 1 13:00 6 9
1:15 0 0 13:15 6 18
1:30 0 0 13:30 4 15
1:45 0 0 13:45 4 15
2:00 0 0 14:00 2 16
2:15 0 0 14:15 11 16
2:30 0 0 14:30 4 20
2:45 0 1 14:45 1 12
3:00 0 0 15:00 5 9
3:15 0 1 15:15 4 13
3:30 0 0 15:30 7 19
3:45 1 0 15:45 10 25
4:00 2 0 16:00 4 13
4:15 2 0 16:15 6 20
4:30 2 0 16:30 4 22
4:45 2 0 16:45 1 16
5:00 0 1 17:00 2 36
5:15 2 1 17:15 10 22
5:30 2 4 17:30 4 31
5:45 1 2 17:45 8 32
6:00 1 2 18:00 5 24
6:15 3 2 18:15 1 25
6:30 4 1 18:30 1 29
6:45 1 3 18:45 4 13
7:00 7 5 19:00 2 25
7:15 7 3 19:15 4 22
7:30 5 3 19:30 5 25
7:45 7 4 19:45 4 15
8:00 4 6 20:00 2 18
8:15 8 8 20:15 5 16
8:30 0 8 20:30 3 15
8:45 3 9 20:45 5 19
9:00 7 8 21:00 7 26
9:15 6 7 21:15 3 19
9:30 5 14 21:30 2 12
9:45 5 17 21:45 2 16
10:00 2 6 22:00 4 11
10:15 7 11 22:15 5 12
10:30 4 10 22:30 2 9
10:45 7 16 22:45 2 6
11:00 10 9 23:00 1 6
11:15 9 7 23:15 6 8
11:30 10 11 23:30 2 8
11:45 11 10 23:45 2 7
QUANTITY OF VEHICLES OBSERVED QUANTITY OF VEHICLES OBSERVED
Friday, June 19, 2015
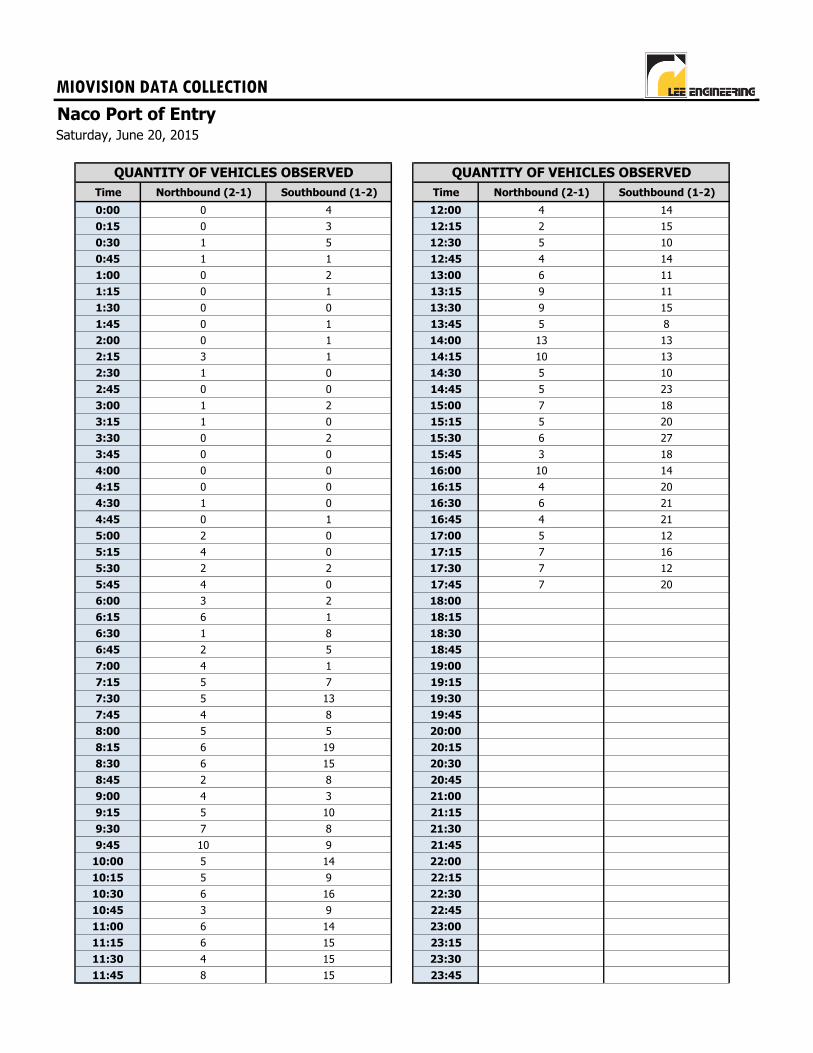
MIOVISION DATA COLLECTION
Naco Port of Entry
Time Northbound (2-1) Southbound (1-2) Time Northbound (2-1) Southbound (1-2)
0:00 0 4 12:00 4 14
0:15 0 3 12:15 2 15
0:30 1 5 12:30 5 10
0:45 1 1 12:45 4 14
1:00 0 2 13:00 6 11
1:15 0 1 13:15 9 11
1:30 0 0 13:30 9 15
1:45 0 1 13:45 5 8
2:00 0 1 14:00 13 13
2:15 3 1 14:15 10 13
2:30 1 0 14:30 5 10
2:45 0 0 14:45 5 23
3:00 1 2 15:00 7 18
3:15 1 0 15:15 5 20
3:30 0 2 15:30 6 27
3:45 0 0 15:45 3 18
4:00 0 0 16:00 10 14
4:15 0 0 16:15 4 20
4:30 1 0 16:30 6 21
4:45 0 1 16:45 4 21
5:00 2 0 17:00 5 12
5:15 4 0 17:15 7 16
5:30 2 2 17:30 7 12
5:45 4 0 17:45 7 20
6:00 3 2 18:00
6:15 6 1 18:15
6:30 1 8 18:30
6:45 2 5 18:45
7:00 4 1 19:00
7:15 5 7 19:15
7:30 5 13 19:30
7:45 4 8 19:45
8:00 5 5 20:00
8:15 6 19 20:15
8:30 6 15 20:30
8:45 2 8 20:45
9:00 4 3 21:00
9:15 5 10 21:15
9:30 7 8 21:30
9:45 10 9 21:45
10:00 5 14 22:00
10:15 5 9 22:15
10:30 6 16 22:30
10:45 3 9 22:45
11:00 6 14 23:00
11:15 6 15 23:15
11:30 4 15 23:30
11:45 8 15 23:45
QUANTITY OF VEHICLES OBSERVED QUANTITY OF VEHICLES OBSERVED
Saturday, June 20, 2015
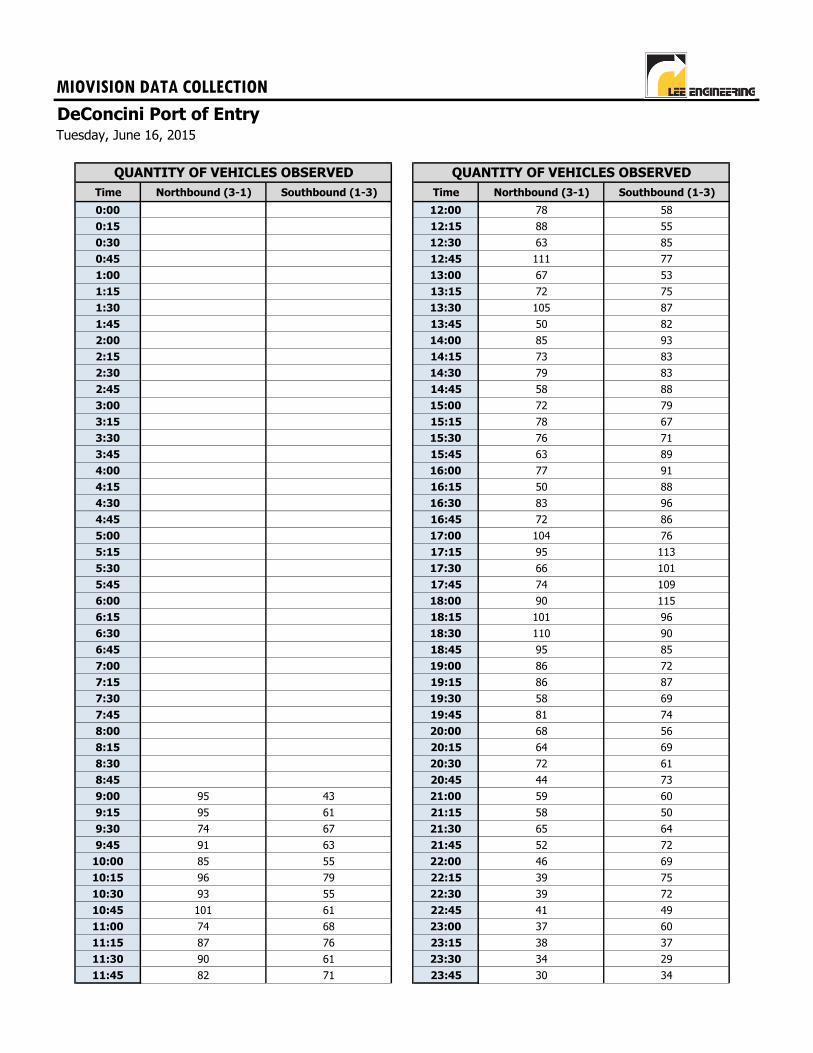
MIOVISION DATA COLLECTION
DeConcini Port of Entry
Time Northbound (3-1) Southbound (1-3) Time Northbound (3-1) Southbound (1-3)
0:00 12:00 78 58
0:15 12:15 88 55
0:30 12:30 63 85
0:45 12:45 111 77
1:00 13:00 67 53
1:15 13:15 72 75
1:30 13:30 105 87
1:45 13:45 50 82
2:00 14:00 85 93
2:15 14:15 73 83
2:30 14:30 79 83
2:45 14:45 58 88
3:00 15:00 72 79
3:15 15:15 78 67
3:30 15:30 76 71
3:45 15:45 63 89
4:00 16:00 77 91
4:15 16:15 50 88
4:30 16:30 83 96
4:45 16:45 72 86
5:00 17:00 104 76
5:15 17:15 95 113
5:30 17:30 66 101
5:45 17:45 74 109
6:00 18:00 90 115
6:15 18:15 101 96
6:30 18:30 110 90
6:45 18:45 95 85
7:00 19:00 86 72
7:15 19:15 86 87
7:30 19:30 58 69
7:45 19:45 81 74
8:00 20:00 68 56
8:15 20:15 64 69
8:30 20:30 72 61
8:45 20:45 44 73
9:00 95 43 21:00 59 60
9:15 95 61 21:15 58 50
9:30 74 67 21:30 65 64
9:45 91 63 21:45 52 72
10:00 85 55 22:00 46 69
10:15 96 79 22:15 39 75
10:30 93 55 22:30 39 72
10:45 101 61 22:45 41 49
11:00 74 68 23:00 37 60
11:15 87 76 23:15 38 37
11:30 90 61 23:30 34 29
11:45 82 71 23:45 30 34
QUANTITY OF VEHICLES OBSERVED QUANTITY OF VEHICLES OBSERVED
Tuesday, June 16, 2015

MIOVISION DATA COLLECTION
DeConcini Port of Entry
Time Northbound (3-1) Southbound (1-3) Time Northbound (3-1) Southbound (1-3)
0:00 36 22 12:00 96 58
0:15 18 17 12:15 89 87
0:30 15 14 12:30 91 89
0:45 18 11 12:45 105 81
1:00 13 17 13:00 83 85
1:15 9 5 13:15 59 65
1:30 15 6 13:30 103 95
1:45 10 14 13:45 71 70
2:00 5 13 14:00 87 69
2:15 4 8 14:15 92 91
2:30 4 7 14:30 84 78
2:45 6 3 14:45 72 97
3:00 8 1 15:00 71 71
3:15 12 3 15:15 65 75
3:30 10 3 15:30 83 82
3:45 9 1 15:45 73 87
4:00 15 2 16:00 109 86
4:15 13 4 16:15 91 85
4:30 21 4 16:30 94 96
4:45 35 7 16:45 68 89
5:00 29 6 17:00 53 114
5:15 36 13 17:15 96 95
5:30 50 15 17:30 104 89
5:45 45 14 17:45 99 99
6:00 40 15 18:00 78 112
6:15 34 12 18:15 89 112
6:30 60 23 18:30 86 95
6:45 49 26 18:45 79 84
7:00 46 29 19:00 91 71
7:15 66 27 19:15 73 91
7:30 84 34 19:30 87 80
7:45 86 31 19:45 84 71
8:00 94 35 20:00 66 80
8:15 100 37 20:15 98 78
8:30 102 52 20:30 52 73
8:45 90 44 20:45 59 67
9:00 94 41 21:00 56 84
9:15 103 62 21:15 62 66
9:30 89 67 21:30 68 55
9:45 101 48 21:45 45 77
10:00 75 54 22:00 46 96
10:15 67 56 22:15 36 94
10:30 82 84 22:30 43 74
10:45 77 72 22:45 40 58
11:00 65 49 23:00 44 57
11:15 101 79 23:15 39 54
11:30 93 78 23:30 26 33
11:45 76 71 23:45 30 23
QUANTITY OF VEHICLES OBSERVED QUANTITY OF VEHICLES OBSERVED
Wednesday, June 17, 2015
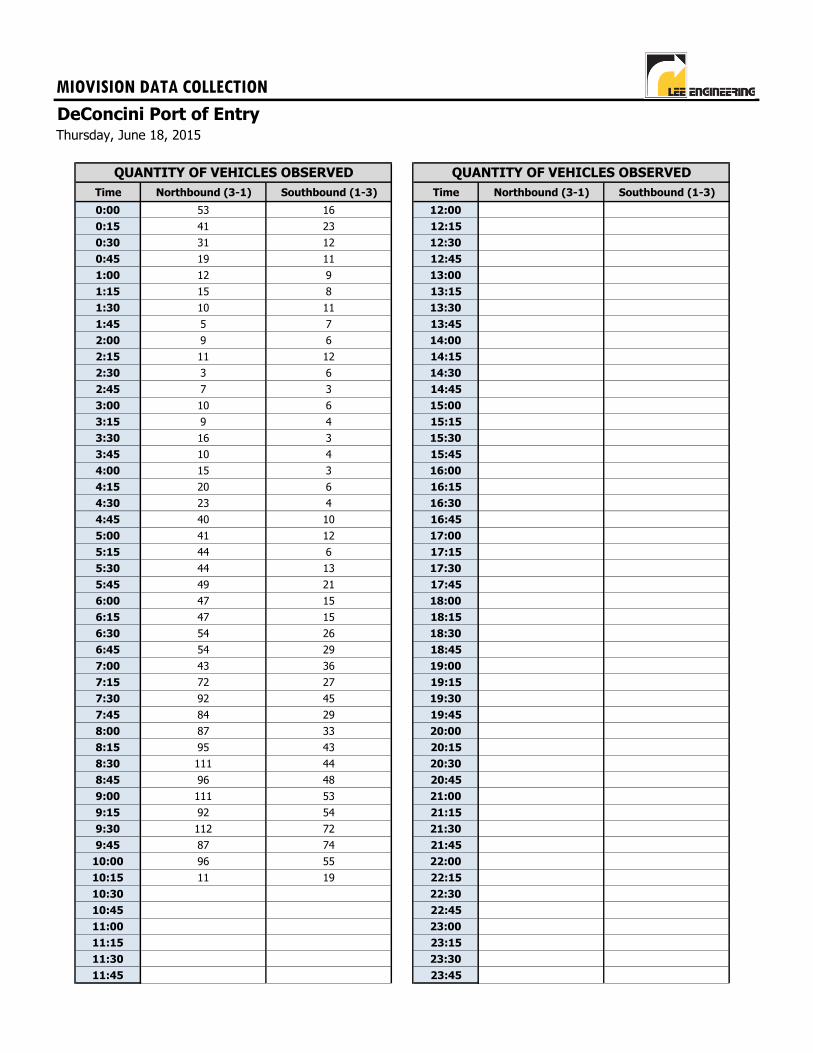
MIOVISION DATA COLLECTION
DeConcini Port of Entry
Time Northbound (3-1) Southbound (1-3) Time Northbound (3-1) Southbound (1-3)
0:00 53 16 12:00
0:15 41 23 12:15
0:30 31 12 12:30
0:45 19 11 12:45
1:00 12 9 13:00
1:15 15 8 13:15
1:30 10 11 13:30
1:45 5 7 13:45
2:00 9 6 14:00
2:15 11 12 14:15
2:30 3 6 14:30
2:45 7 3 14:45
3:00 10 6 15:00
3:15 9 4 15:15
3:30 16 3 15:30
3:45 10 4 15:45
4:00 15 3 16:00
4:15 20 6 16:15
4:30 23 4 16:30
4:45 40 10 16:45
5:00 41 12 17:00
5:15 44 6 17:15
5:30 44 13 17:30
5:45 49 21 17:45
6:00 47 15 18:00
6:15 47 15 18:15
6:30 54 26 18:30
6:45 54 29 18:45
7:00 43 36 19:00
7:15 72 27 19:15
7:30 92 45 19:30
7:45 84 29 19:45
8:00 87 33 20:00
8:15 95 43 20:15
8:30 111 44 20:30
8:45 96 48 20:45
9:00 111 53 21:00
9:15 92 54 21:15
9:30 112 72 21:30
9:45 87 74 21:45
10:00 96 55 22:00
10:15 11 19 22:15
10:30 22:30
10:45 22:45
11:00 23:00
11:15 23:15
11:30 23:30
11:45 23:45
QUANTITY OF VEHICLES OBSERVED QUANTITY OF VEHICLES OBSERVED
Thursday, June 18, 2015
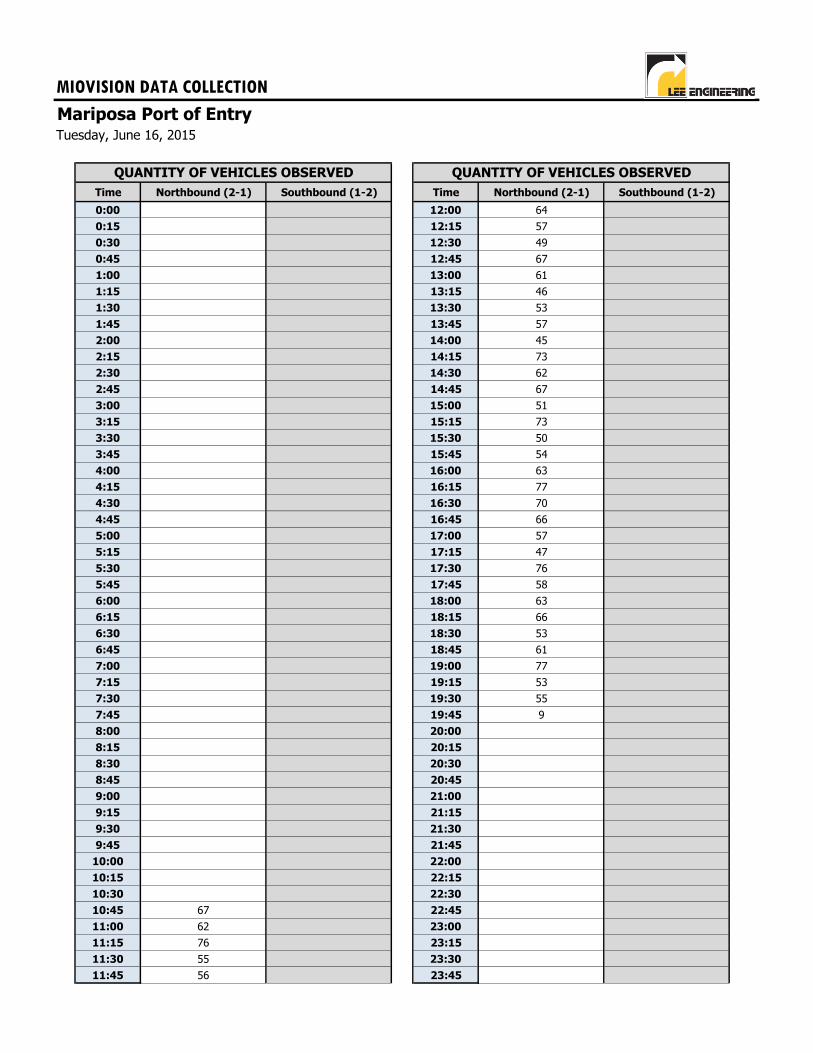
MIOVISION DATA COLLECTION
Mariposa Port of Entry
Time Northbound (2-1) Southbound (1-2) Time Northbound (2-1) Southbound (1-2)
0:00 12:00 64
0:15 12:15 57
0:30 12:30 49
0:45 12:45 67
1:00 13:00 61
1:15 13:15 46
1:30 13:30 53
1:45 13:45 57
2:00 14:00 45
2:15 14:15 73
2:30 14:30 62
2:45 14:45 67
3:00 15:00 51
3:15 15:15 73
3:30 15:30 50
3:45 15:45 54
4:00 16:00 63
4:15 16:15 77
4:30 16:30 70
4:45 16:45 66
5:00 17:00 57
5:15 17:15 47
5:30 17:30 76
5:45 17:45 58
6:00 18:00 63
6:15 18:15 66
6:30 18:30 53
6:45 18:45 61
7:00 19:00 77
7:15 19:15 53
7:30 19:30 55
7:45 19:45 9
8:00 20:00
8:15 20:15
8:30 20:30
8:45 20:45
9:00 21:00
9:15 21:15
9:30 21:30
9:45 21:45
10:00 22:00
10:15 22:15
10:30 22:30
10:45 67 22:45
11:00 62 23:00
11:15 76 23:15
11:30 55 23:30
11:45 56 23:45
QUANTITY OF VEHICLES OBSERVED QUANTITY OF VEHICLES OBSERVED
Tuesday, June 16, 2015
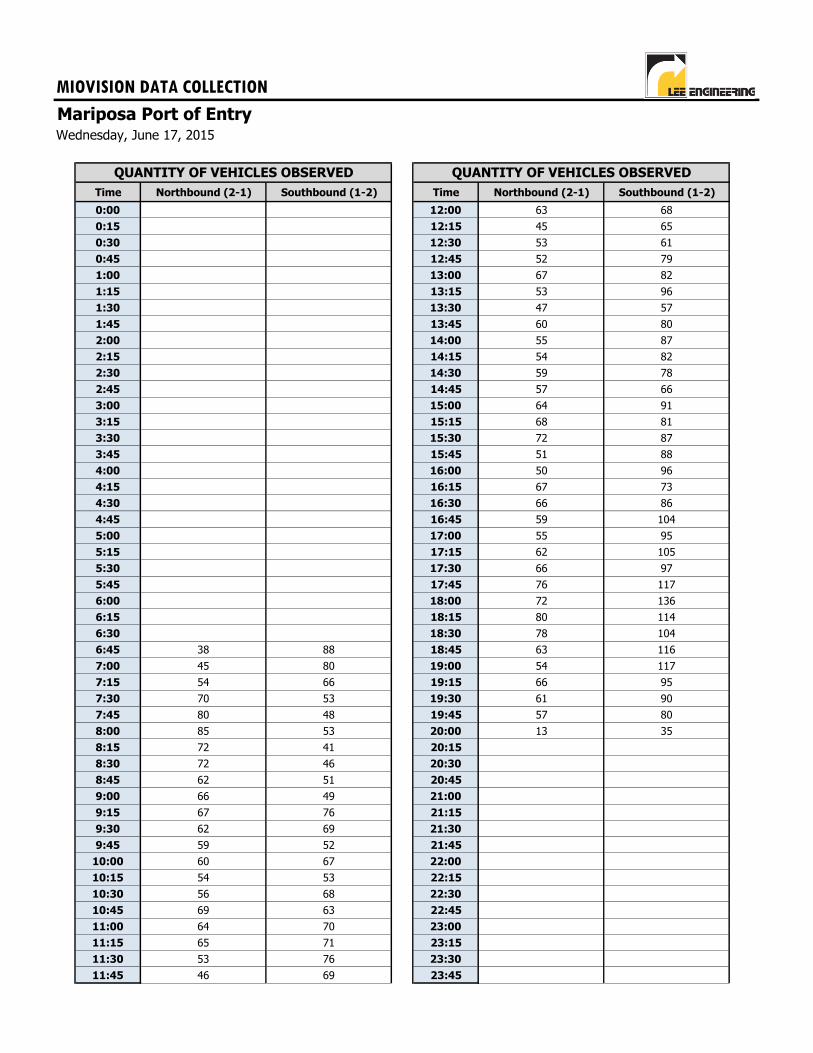
MIOVISION DATA COLLECTION
Mariposa Port of Entry
Time Northbound (2-1) Southbound (1-2) Time Northbound (2-1) Southbound (1-2)
0:00 12:00 63 68
0:15 12:15 45 65
0:30 12:30 53 61
0:45 12:45 52 79
1:00 13:00 67 82
1:15 13:15 53 96
1:30 13:30 47 57
1:45 13:45 60 80
2:00 14:00 55 87
2:15 14:15 54 82
2:30 14:30 59 78
2:45 14:45 57 66
3:00 15:00 64 91
3:15 15:15 68 81
3:30 15:30 72 87
3:45 15:45 51 88
4:00 16:00 50 96
4:15 16:15 67 73
4:30 16:30 66 86
4:45 16:45 59 104
5:00 17:00 55 95
5:15 17:15 62 105
5:30 17:30 66 97
5:45 17:45 76 117
6:00 18:00 72 136
6:15 18:15 80 114
6:30 18:30 78 104
6:45 38 88 18:45 63 116
7:00 45 80 19:00 54 117
7:15 54 66 19:15 66 95
7:30 70 53 19:30 61 90
7:45 80 48 19:45 57 80
8:00 85 53 20:00 13 35
8:15 72 41 20:15
8:30 72 46 20:30
8:45 62 51 20:45
9:00 66 49 21:00
9:15 67 76 21:15
9:30 62 69 21:30
9:45 59 52 21:45
10:00 60 67 22:00
10:15 54 53 22:15
10:30 56 68 22:30
10:45 69 63 22:45
11:00 64 70 23:00
11:15 65 71 23:15
11:30 53 76 23:30
11:45 46 69 23:45
QUANTITY OF VEHICLES OBSERVED QUANTITY OF VEHICLES OBSERVED
Wednesday, June 17, 2015
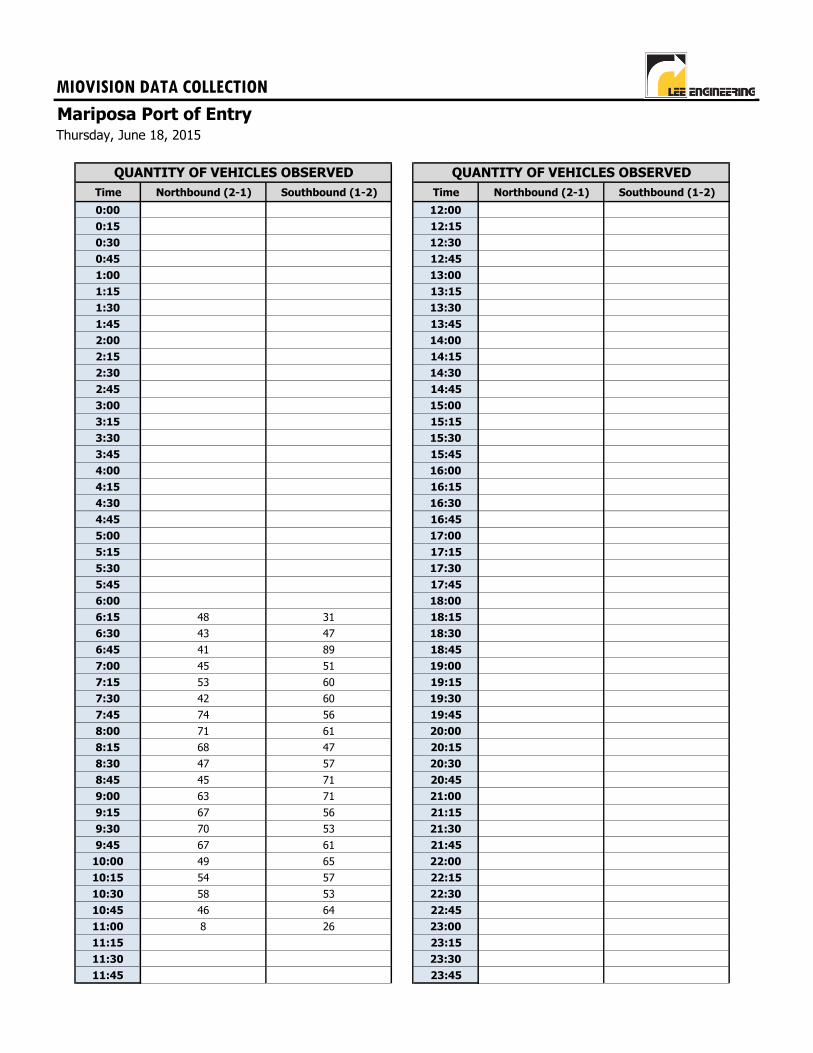
MIOVISION DATA COLLECTION
Mariposa Port of Entry
Time Northbound (2-1) Southbound (1-2) Time Northbound (2-1) Southbound (1-2)
0:00 12:00
0:15 12:15
0:30 12:30
0:45 12:45
1:00 13:00
1:15 13:15
1:30 13:30
1:45 13:45
2:00 14:00
2:15 14:15
2:30 14:30
2:45 14:45
3:00 15:00
3:15 15:15
3:30 15:30
3:45 15:45
4:00 16:00
4:15 16:15
4:30 16:30
4:45 16:45
5:00 17:00
5:15 17:15
5:30 17:30
5:45 17:45
6:00 18:00
6:15 48 31 18:15
6:30 43 47 18:30
6:45 41 89 18:45
7:00 45 51 19:00
7:15 53 60 19:15
7:30 42 60 19:30
7:45 74 56 19:45
8:00 71 61 20:00
8:15 68 47 20:15
8:30 47 57 20:30
8:45 45 71 20:45
9:00 63 71 21:00
9:15 67 56 21:15
9:30 70 53 21:30
9:45 67 61 21:45
10:00 49 65 22:00
10:15 54 57 22:15
10:30 58 53 22:30
10:45 46 64 22:45
11:00 8 26 23:00
11:15 23:15
11:30 23:30
11:45 23:45
QUANTITY OF VEHICLES OBSERVED QUANTITY OF VEHICLES OBSERVED
Thursday, June 18, 2015
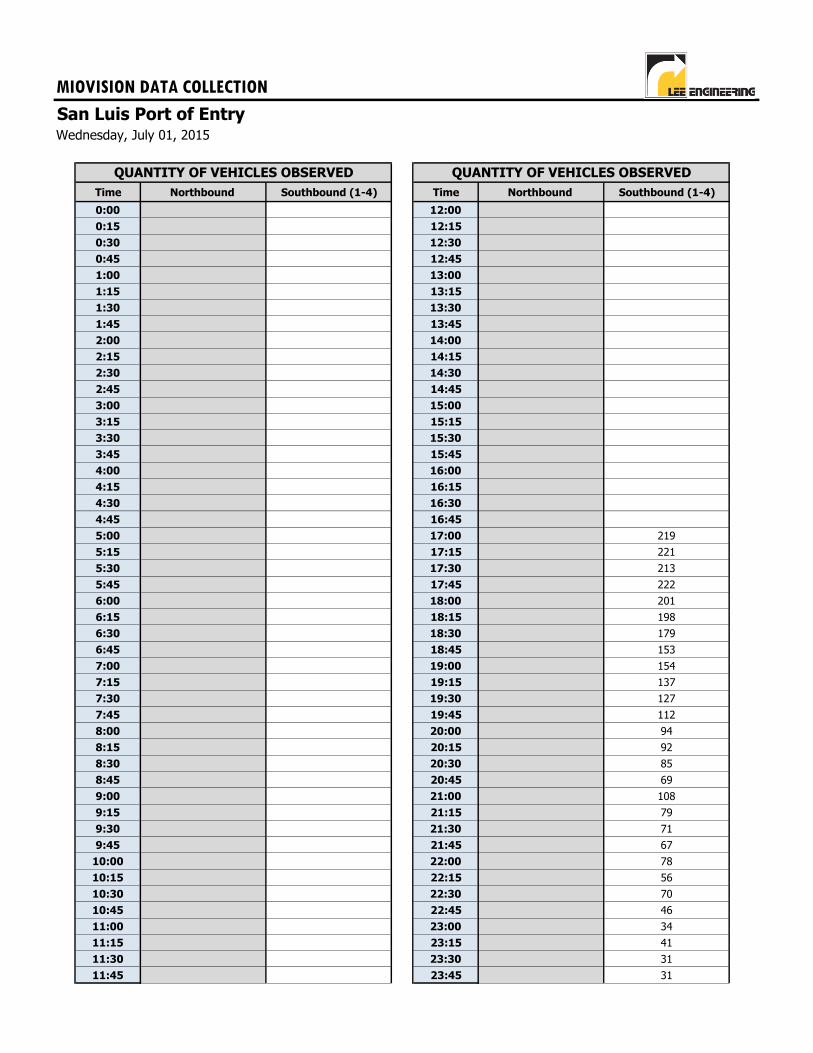
MIOVISION DATA COLLECTION
San Luis Port of Entry
Time Northbound Southbound (1-4) Time Northbound Southbound (1-4)
0:00 12:00
0:15 12:15
0:30 12:30
0:45 12:45
1:00 13:00
1:15 13:15
1:30 13:30
1:45 13:45
2:00 14:00
2:15 14:15
2:30 14:30
2:45 14:45
3:00 15:00
3:15 15:15
3:30 15:30
3:45 15:45
4:00 16:00
4:15 16:15
4:30 16:30
4:45 16:45
5:00 17:00 219
5:15 17:15 221
5:30 17:30 213
5:45 17:45 222
6:00 18:00 201
6:15 18:15 198
6:30 18:30 179
6:45 18:45 153
7:00 19:00 154
7:15 19:15 137
7:30 19:30 127
7:45 19:45 112
8:00 20:00 94
8:15 20:15 92
8:30 20:30 85
8:45 20:45 69
9:00 21:00 108
9:15 21:15 79
9:30 21:30 71
9:45 21:45 67
10:00 22:00 78
10:15 22:15 56
10:30 22:30 70
10:45 22:45 46
11:00 23:00 34
11:15 23:15 41
11:30 23:30 31
11:45 23:45 31
QUANTITY OF VEHICLES OBSERVED QUANTITY OF VEHICLES OBSERVED
Wednesday, July 01, 2015
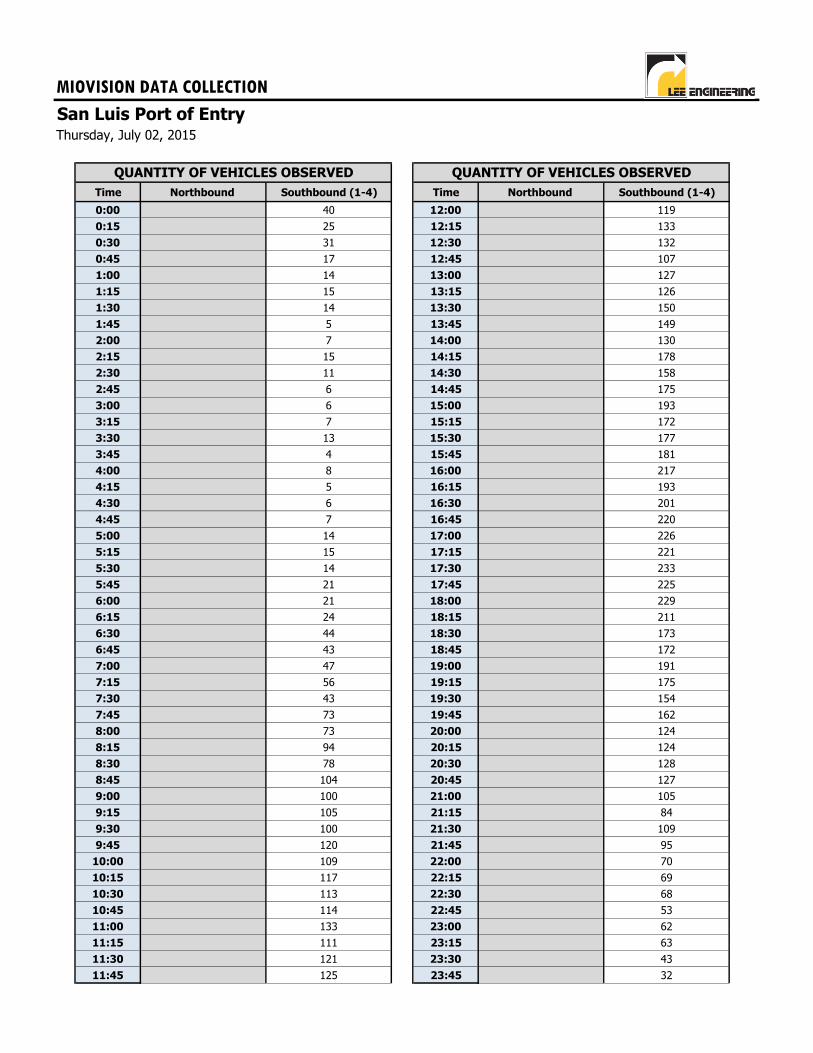
MIOVISION DATA COLLECTION
San Luis Port of Entry
Time Northbound Southbound (1-4) Time Northbound Southbound (1-4)
0:00 40 12:00 119
0:15 25 12:15 133
0:30 31 12:30 132
0:45 17 12:45 107
1:00 14 13:00 127
1:15 15 13:15 126
1:30 14 13:30 150
1:45 5 13:45 149
2:00 7 14:00 130
2:15 15 14:15 178
2:30 11 14:30 158
2:45 6 14:45 175
3:00 6 15:00 193
3:15 7 15:15 172
3:30 13 15:30 177
3:45 4 15:45 181
4:00 8 16:00 217
4:15 5 16:15 193
4:30 6 16:30 201
4:45 7 16:45 220
5:00 14 17:00 226
5:15 15 17:15 221
5:30 14 17:30 233
5:45 21 17:45 225
6:00 21 18:00 229
6:15 24 18:15 211
6:30 44 18:30 173
6:45 43 18:45 172
7:00 47 19:00 191
7:15 56 19:15 175
7:30 43 19:30 154
7:45 73 19:45 162
8:00 73 20:00 124
8:15 94 20:15 124
8:30 78 20:30 128
8:45 104 20:45 127
9:00 100 21:00 105
9:15 105 21:15 84
9:30 100 21:30 109
9:45 120 21:45 95
10:00 109 22:00 70
10:15 117 22:15 69
10:30 113 22:30 68
10:45 114 22:45 53
11:00 133 23:00 62
11:15 111 23:15 63
11:30 121 23:30 43
11:45 125 23:45 32
QUANTITY OF VEHICLES OBSERVED QUANTITY OF VEHICLES OBSERVED
Thursday, July 02, 2015

MIOVISION DATA COLLECTION
San Luis Port of Entry
Time Northbound Southbound (1-4) Time Northbound Southbound (1-4)
0:00 31 12:00 180
0:15 36 12:15 162
0:30 31 12:30 159
0:45 24 12:45 151
1:00 17 13:00 154
1:15 15 13:15 131
1:30 22 13:30 151
1:45 12 13:45 170
2:00 7 14:00 211
2:15 14 14:15 183
2:30 11 14:30 185
2:45 10 14:45 185
3:00 14 15:00 163
3:15 12 15:15 186
3:30 8 15:30 170
3:45 8 15:45 189
4:00 11 16:00 190
4:15 10 16:15 220
4:30 14 16:30 189
4:45 10 16:45 183
5:00 12 17:00 199
5:15 21 17:15 203
5:30 38 17:30 188
5:45 20 17:45 192
6:00 33 18:00 180
6:15 43 18:15 178
6:30 39 18:30 165
6:45 60 18:45 170
7:00 61 19:00 184
7:15 74 19:15 149
7:30 70 19:30 160
7:45 93 19:45 141
8:00 98 20:00 178
8:15 111 20:15 139
8:30 133 20:30 108
8:45 123 20:45 122
9:00 152 21:00 105
9:15 125 21:15 104
9:30 168 21:30 101
9:45 168 21:45 97
10:00 151 22:00 75
10:15 151 22:15 72
10:30 166 22:30 74
10:45 164 22:45 67
11:00 171 23:00 65
11:15 184 23:15 53
11:30 161 23:30 57
11:45 190 23:45 43
QUANTITY OF VEHICLES OBSERVED QUANTITY OF VEHICLES OBSERVED
Friday, July 03, 2015
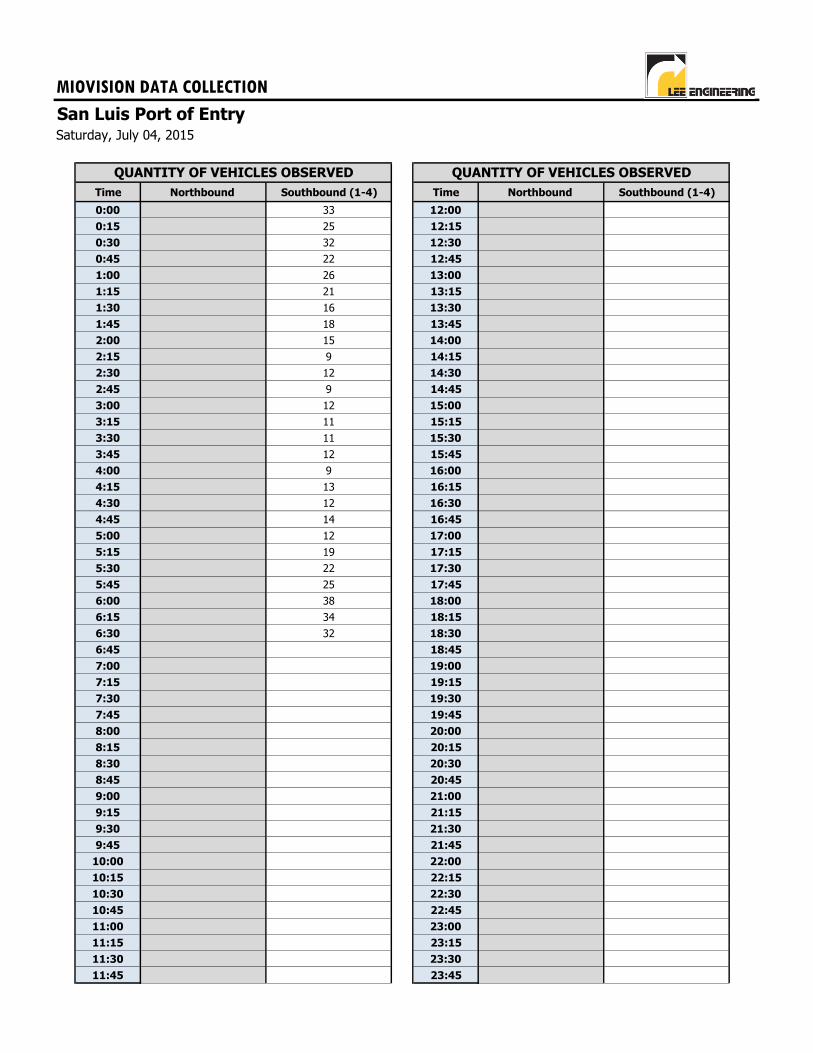
MIOVISION DATA COLLECTION
San Luis Port of Entry
Time Northbound Southbound (1-4) Time Northbound Southbound (1-4)
0:00 33 12:00
0:15 25 12:15
0:30 32 12:30
0:45 22 12:45
1:00 26 13:00
1:15 21 13:15
1:30 16 13:30
1:45 18 13:45
2:00 15 14:00
2:15 9 14:15
2:30 12 14:30
2:45 9 14:45
3:00 12 15:00
3:15 11 15:15
3:30 11 15:30
3:45 12 15:45
4:00 9 16:00
4:15 13 16:15
4:30 12 16:30
4:45 14 16:45
5:00 12 17:00
5:15 19 17:15
5:30 22 17:30
5:45 25 17:45
6:00 38 18:00
6:15 34 18:15
6:30 32 18:30
6:45 18:45
7:00 19:00
7:15 19:15
7:30 19:30
7:45 19:45
8:00 20:00
8:15 20:15
8:30 20:30
8:45 20:45
9:00 21:00
9:15 21:15
9:30 21:30
9:45 21:45
10:00 22:00
10:15 22:15
10:30 22:30
10:45 22:45
11:00 23:00
11:15 23:15
11:30 23:30
11:45 23:45
QUANTITY OF VEHICLES OBSERVED QUANTITY OF VEHICLES OBSERVED
Saturday, July 04, 2015
ANALYSIS OF BLUETOOTH AND WI-FI TECHNOLOGY
TO MEASURE WAIT TIMES OF PERSONAL VEHICLES AT ARIZONA-MEXICO PORTS OF ENTRY
APPENDIX C PENETRATION RATE ANALYSIS
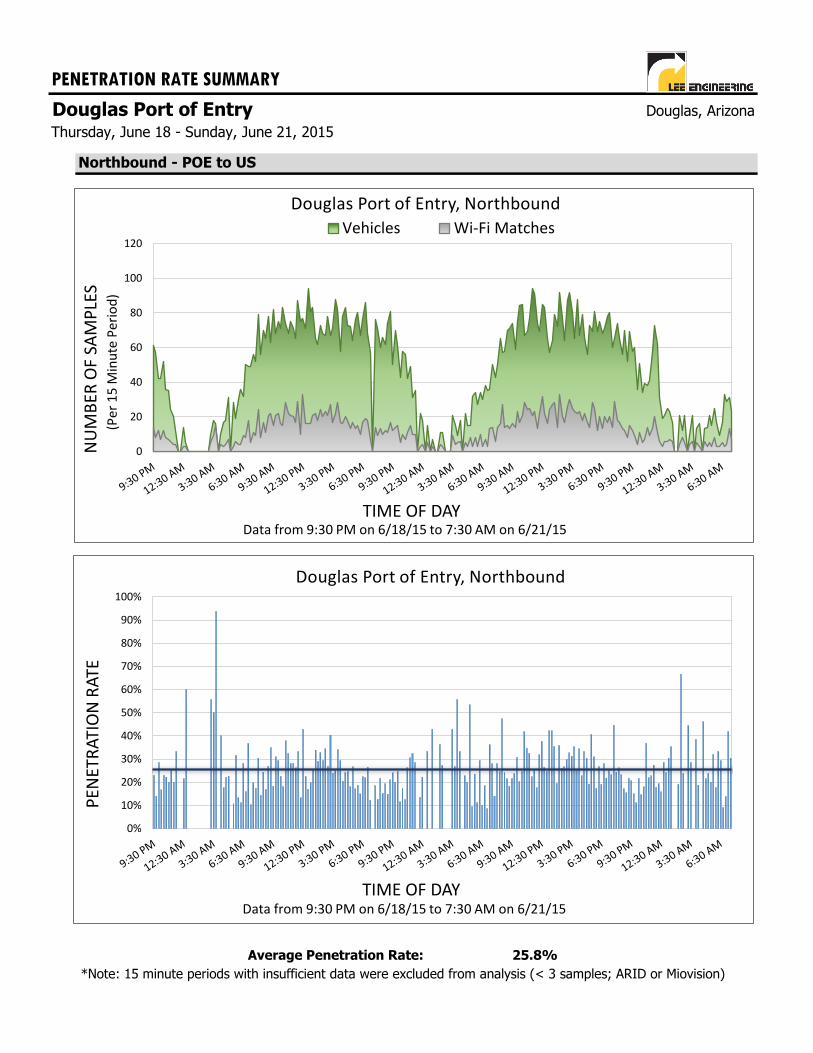
PENETRATION RATE SUMMARY
Douglas Port of EntryThursday, June 18 - Sunday, June 21, 2015
Northbound - POE to US
25.8%
Douglas, Arizona
Average Penetration Rate:
*Note: 15 minute periods with insufficient data were excluded from analysis (< 3 samples; ARID or Miovision)
0
20
40
60
80
100
120
NU
MB
ER O
F SA
MP
LES
TIME OF DAY
Douglas Port of Entry, Northbound
Vehicles Wi-Fi Matches
(Per
15
Min
ute
Per
iod
)
Data from 9:30 PM on 6/18/15 to 7:30 AM on 6/21/15
0%
10%
20%
30%
40%
50%
60%
70%
80%
90%
100%
PEN
ETR
ATI
ON
RA
TE
TIME OF DAY
Douglas Port of Entry, Northbound
Data from 9:30 PM on 6/18/15 to 7:30 AM on 6/21/15
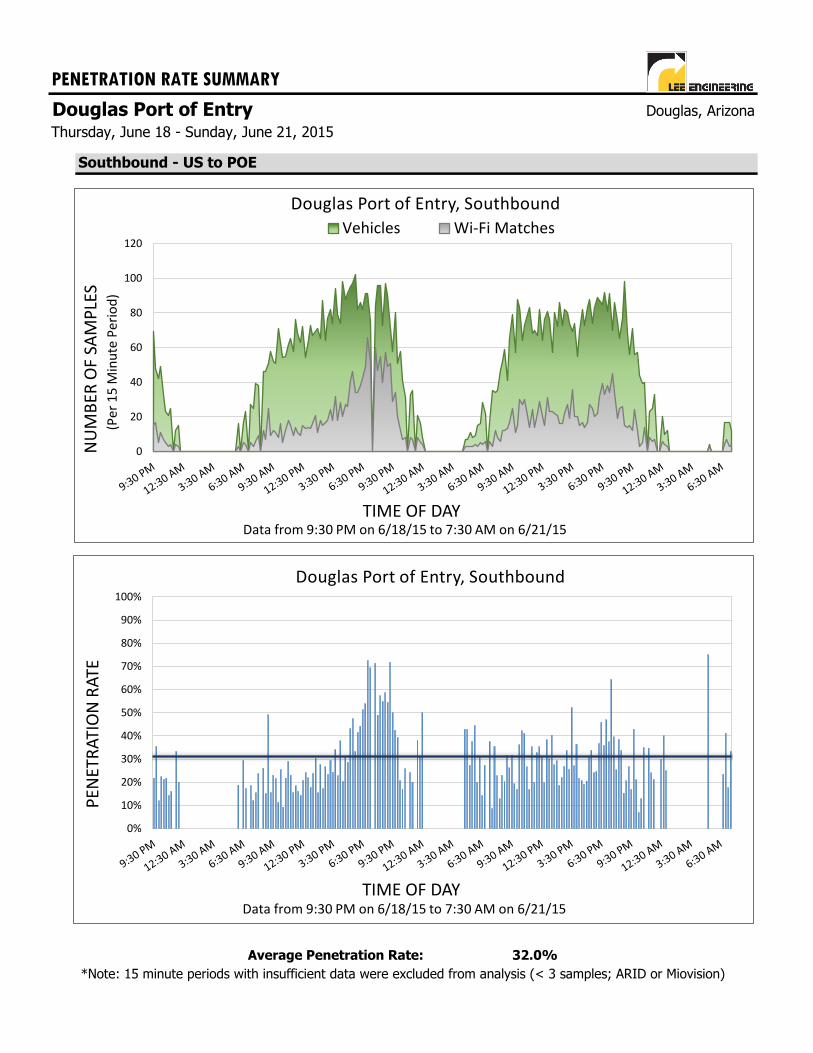
PENETRATION RATE SUMMARY
Douglas Port of EntryThursday, June 18 - Sunday, June 21, 2015
Southbound - US to POE
32.0%
Douglas, Arizona
*Note: 15 minute periods with insufficient data were excluded from analysis (< 3 samples; ARID or Miovision)
Average Penetration Rate:
0
20
40
60
80
100
120
NU
MB
ER O
F SA
MP
LES
TIME OF DAY
Douglas Port of Entry, Southbound
Vehicles Wi-Fi Matches
(Per
15
Min
ute
Per
iod
)
Data from 9:30 PM on 6/18/15 to 7:30 AM on 6/21/15
0%
10%
20%
30%
40%
50%
60%
70%
80%
90%
100%
PEN
ETR
ATI
ON
RA
TE
TIME OF DAY
Douglas Port of Entry, Southbound
Data from 9:30 PM on 6/18/15 to 7:30 AM on 6/21/15
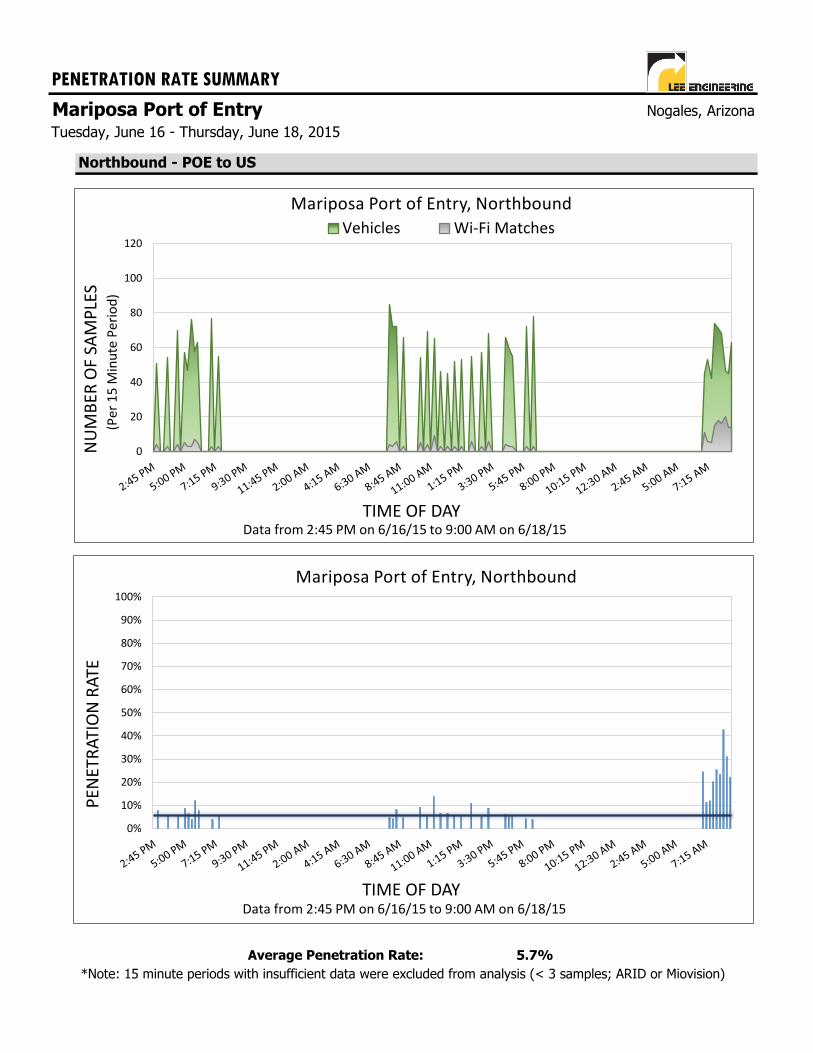
PENETRATION RATE SUMMARY
Mariposa Port of EntryTuesday, June 16 - Thursday, June 18, 2015
Northbound - POE to US
5.7%
Nogales, Arizona
*Note: 15 minute periods with insufficient data were excluded from analysis (< 3 samples; ARID or Miovision)
Average Penetration Rate:
0
20
40
60
80
100
120
NU
MB
ER O
F SA
MP
LES
TIME OF DAY
Mariposa Port of Entry, Northbound
Vehicles Wi-Fi Matches
(Per
15
Min
ute
Per
iod
)
Data from 2:45 PM on 6/16/15 to 9:00 AM on 6/18/15
0%
10%
20%
30%
40%
50%
60%
70%
80%
90%
100%
PEN
ETR
ATI
ON
RA
TE
TIME OF DAY
Mariposa Port of Entry, Northbound
Data from 2:45 PM on 6/16/15 to 9:00 AM on 6/18/15
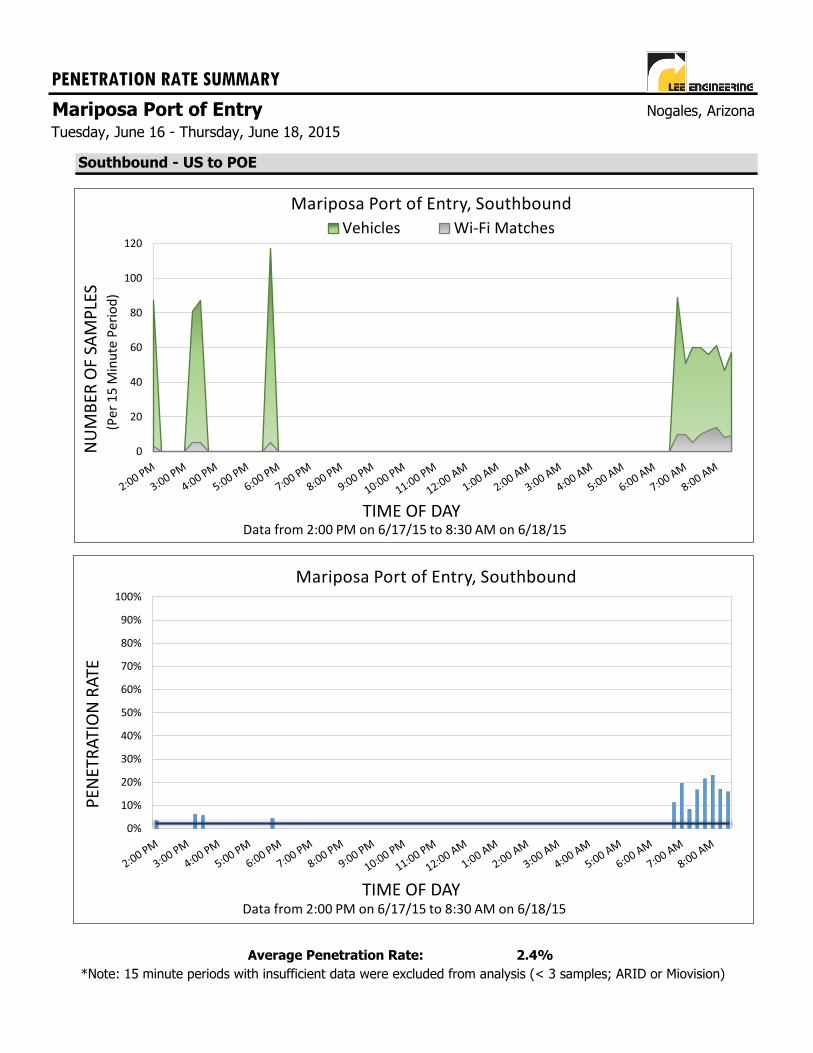
PENETRATION RATE SUMMARY
Mariposa Port of EntryTuesday, June 16 - Thursday, June 18, 2015
Southbound - US to POE
2.4%
Nogales, Arizona
*Note: 15 minute periods with insufficient data were excluded from analysis (< 3 samples; ARID or Miovision)
Average Penetration Rate:
0
20
40
60
80
100
120
NU
MB
ER O
F SA
MP
LES
TIME OF DAY
Mariposa Port of Entry, Southbound
Vehicles Wi-Fi Matches
(Per
15
Min
ute
Per
iod
)
Data from 2:00 PM on 6/17/15 to 8:30 AM on 6/18/15
0%
10%
20%
30%
40%
50%
60%
70%
80%
90%
100%
PEN
ETR
ATI
ON
RA
TE
TIME OF DAY
Mariposa Port of Entry, Southbound
Data from 2:00 PM on 6/17/15 to 8:30 AM on 6/18/15
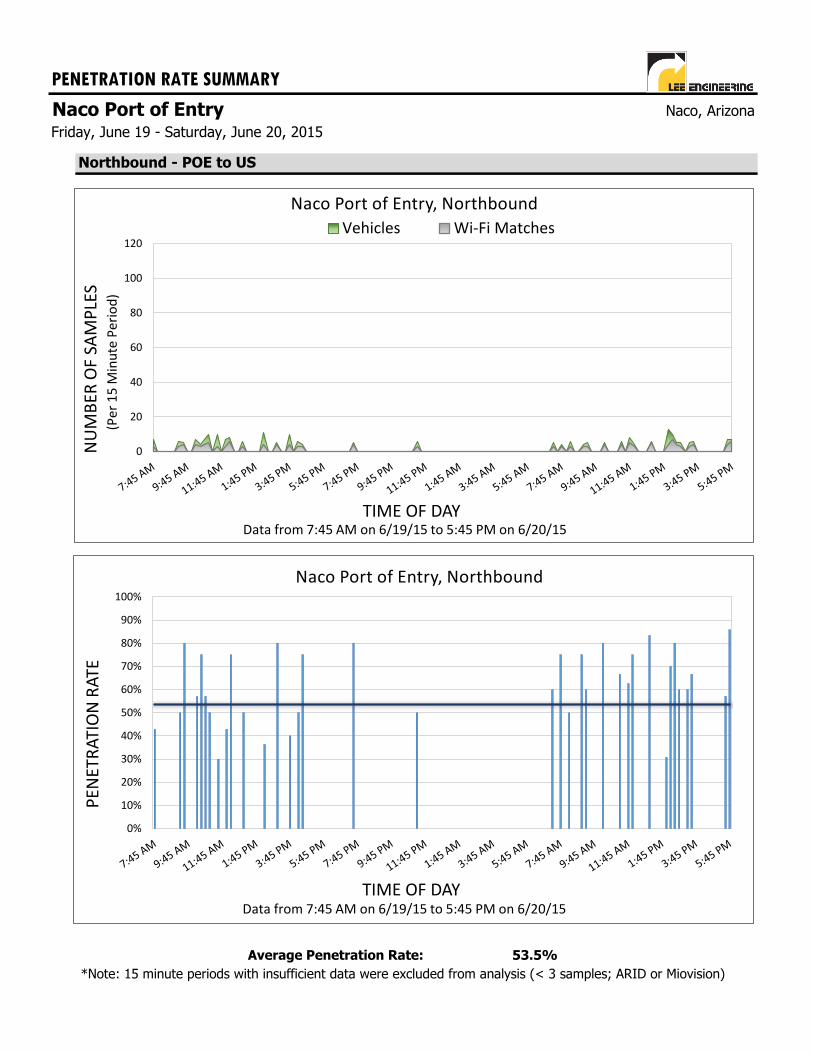
PENETRATION RATE SUMMARY
Naco Port of EntryFriday, June 19 - Saturday, June 20, 2015
Northbound - POE to US
53.5%Average Penetration Rate:
*Note: 15 minute periods with insufficient data were excluded from analysis (< 3 samples; ARID or Miovision)
Naco, Arizona
0
20
40
60
80
100
120
NU
MB
ER O
F SA
MP
LES
TIME OF DAY
Naco Port of Entry, Northbound
Vehicles Wi-Fi Matches
(Per
15
Min
ute
Per
iod
)
Data from 7:45 AM on 6/19/15 to 5:45 PM on 6/20/15
0%
10%
20%
30%
40%
50%
60%
70%
80%
90%
100%
PEN
ETR
ATI
ON
RA
TE
TIME OF DAY
Naco Port of Entry, Northbound
Data from 7:45 AM on 6/19/15 to 5:45 PM on 6/20/15
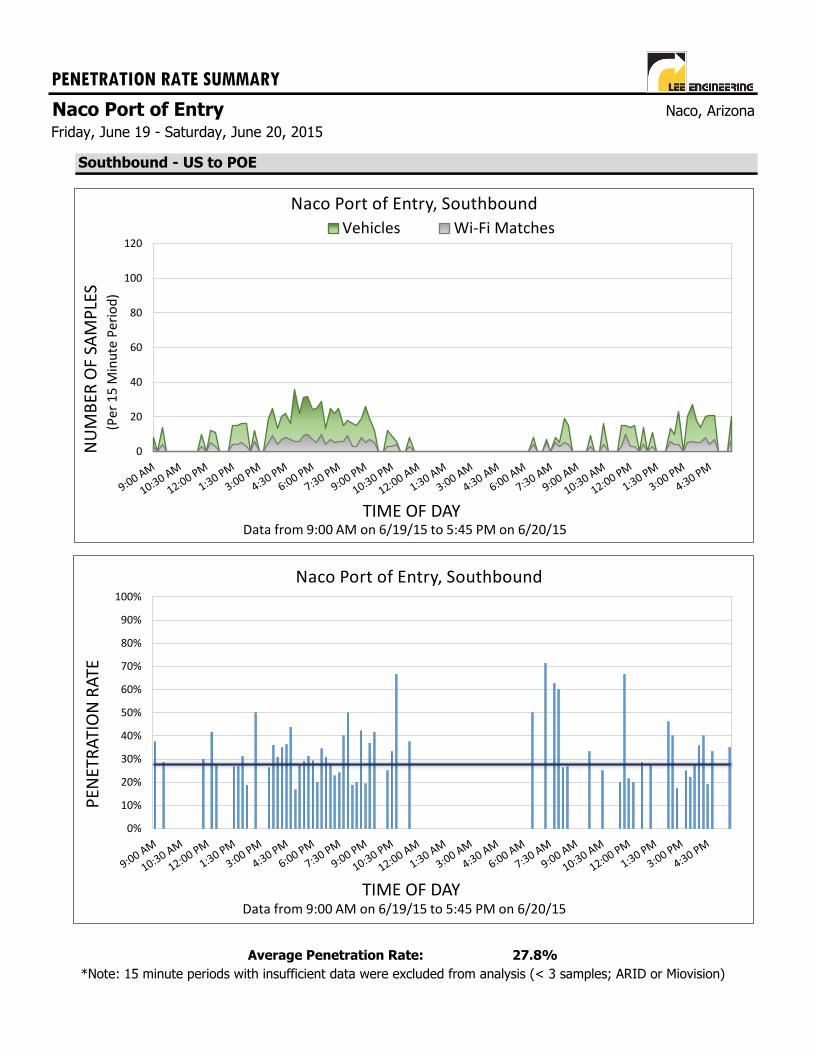
PENETRATION RATE SUMMARY
Naco Port of EntryFriday, June 19 - Saturday, June 20, 2015
Southbound - US to POE
27.8%Average Penetration Rate:
*Note: 15 minute periods with insufficient data were excluded from analysis (< 3 samples; ARID or Miovision)
Naco, Arizona
0
20
40
60
80
100
120
NU
MB
ER O
F SA
MP
LES
TIME OF DAY
Naco Port of Entry, Southbound
Vehicles Wi-Fi Matches
(Per
15
Min
ute
Per
iod
)
Data from 9:00 AM on 6/19/15 to 5:45 PM on 6/20/15
0%
10%
20%
30%
40%
50%
60%
70%
80%
90%
100%
PEN
ETR
ATI
ON
RA
TE
TIME OF DAY
Naco Port of Entry, Southbound
Data from 9:00 AM on 6/19/15 to 5:45 PM on 6/20/15
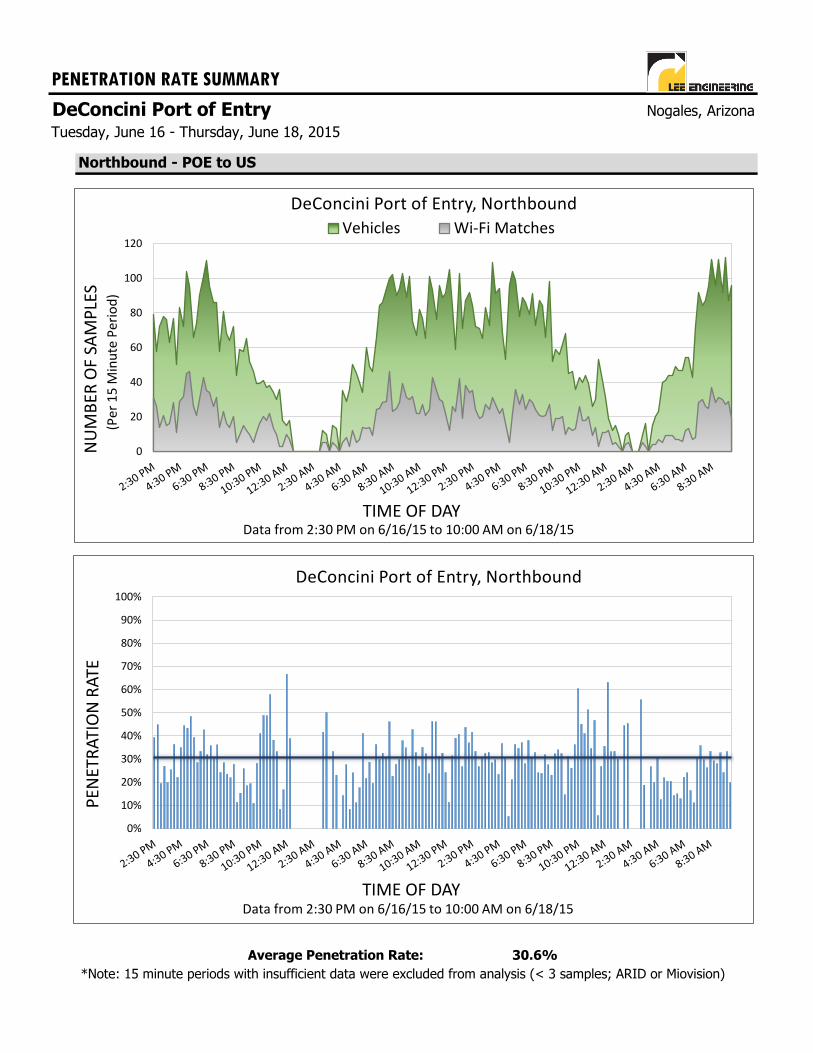
PENETRATION RATE SUMMARY
DeConcini Port of EntryTuesday, June 16 - Thursday, June 18, 2015
Northbound - POE to US
30.6%
Nogales, Arizona
*Note: 15 minute periods with insufficient data were excluded from analysis (< 3 samples; ARID or Miovision)
Average Penetration Rate:
0
20
40
60
80
100
120
NU
MB
ER O
F SA
MP
LES
TIME OF DAY
DeConcini Port of Entry, Northbound
Vehicles Wi-Fi Matches
(Per
15
Min
ute
Per
iod
)
Data from 2:30 PM on 6/16/15 to 10:00 AM on 6/18/15
0%
10%
20%
30%
40%
50%
60%
70%
80%
90%
100%
PEN
ETR
ATI
ON
RA
TE
TIME OF DAY
DeConcini Port of Entry, Northbound
Data from 2:30 PM on 6/16/15 to 10:00 AM on 6/18/15
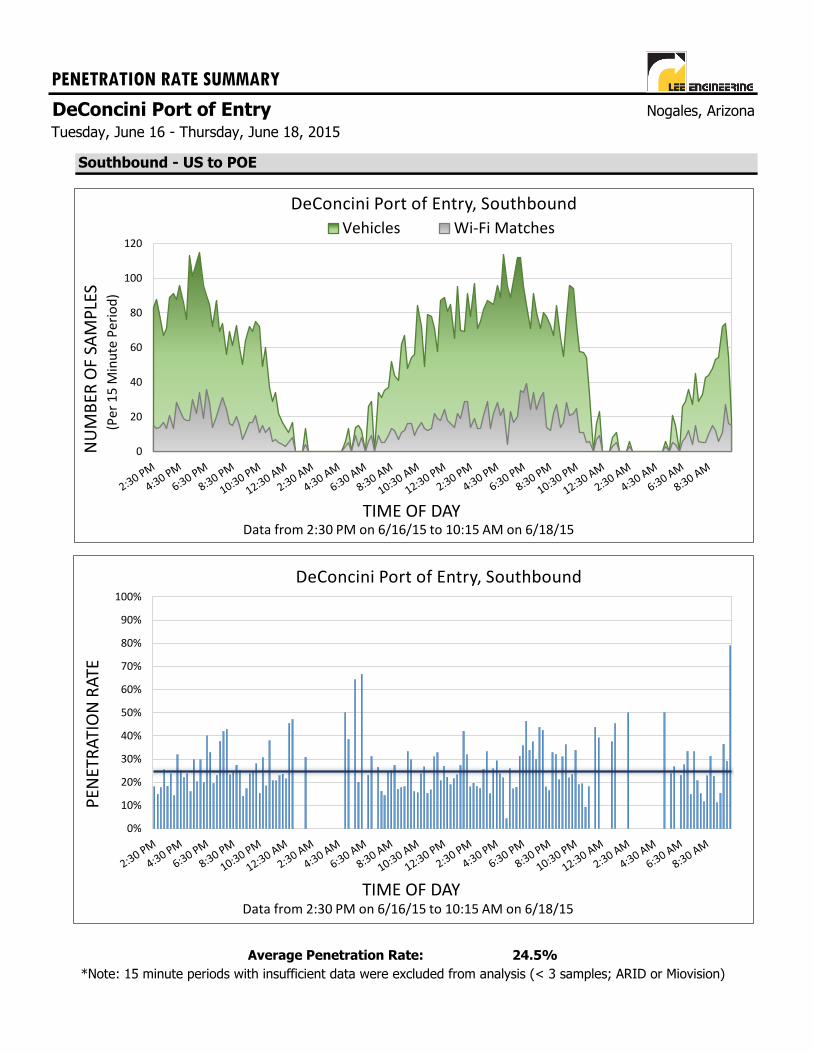
PENETRATION RATE SUMMARY
DeConcini Port of EntryTuesday, June 16 - Thursday, June 18, 2015
Southbound - US to POE
24.5%
Nogales, Arizona
*Note: 15 minute periods with insufficient data were excluded from analysis (< 3 samples; ARID or Miovision)
Average Penetration Rate:
0
20
40
60
80
100
120
NU
MB
ER O
F SA
MP
LES
TIME OF DAY
DeConcini Port of Entry, Southbound
Vehicles Wi-Fi Matches
(Per
15
Min
ute
Per
iod
)
Data from 2:30 PM on 6/16/15 to 10:15 AM on 6/18/15
0%
10%
20%
30%
40%
50%
60%
70%
80%
90%
100%
PEN
ETR
ATI
ON
RA
TE
TIME OF DAY
DeConcini Port of Entry, Southbound
Data from 2:30 PM on 6/16/15 to 10:15 AM on 6/18/15
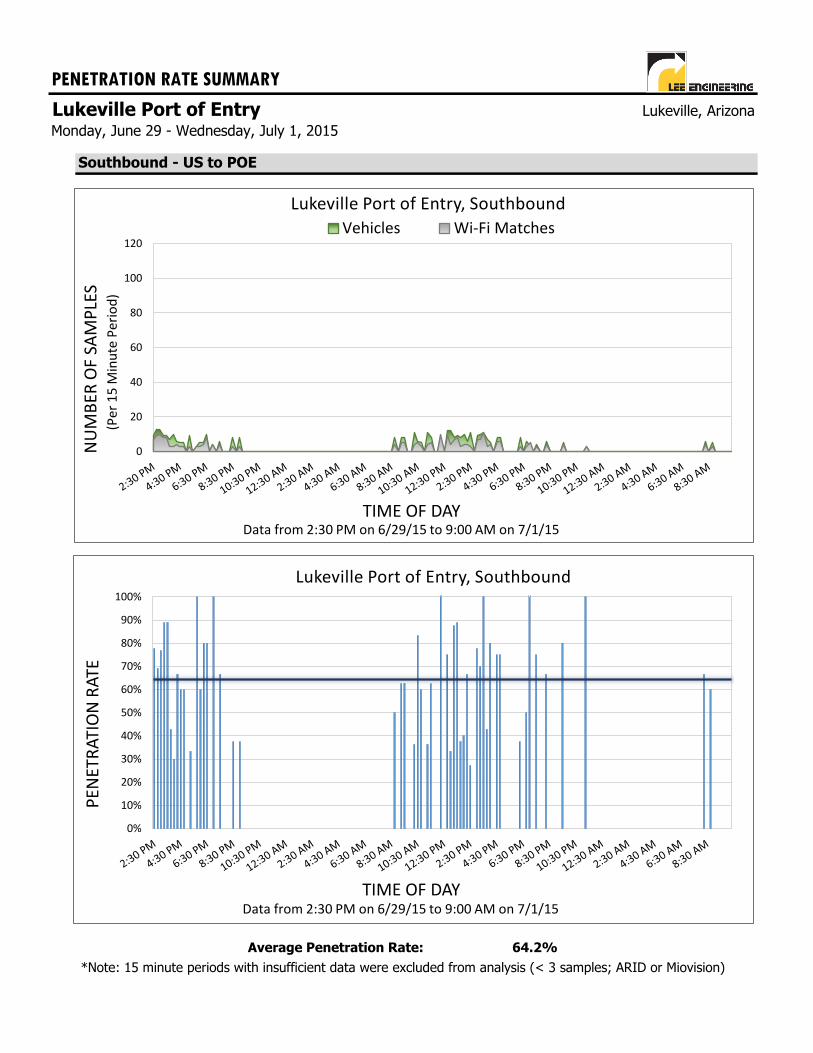
PENETRATION RATE SUMMARY
Lukeville Port of EntryMonday, June 29 - Wednesday, July 1, 2015
Southbound - US to POE
64.2%Average Penetration Rate:
*Note: 15 minute periods with insufficient data were excluded from analysis (< 3 samples; ARID or Miovision)
Lukeville, Arizona
0
20
40
60
80
100
120
NU
MB
ER O
F SA
MP
LES
TIME OF DAY
Lukeville Port of Entry, Southbound
Vehicles Wi-Fi Matches
(Per
15
Min
ute
Per
iod
)
Data from 2:30 PM on 6/29/15 to 9:00 AM on 7/1/15
0%
10%
20%
30%
40%
50%
60%
70%
80%
90%
100%
PEN
ETR
ATI
ON
RA
TE
TIME OF DAY
Lukeville Port of Entry, Southbound
Data from 2:30 PM on 6/29/15 to 9:00 AM on 7/1/15
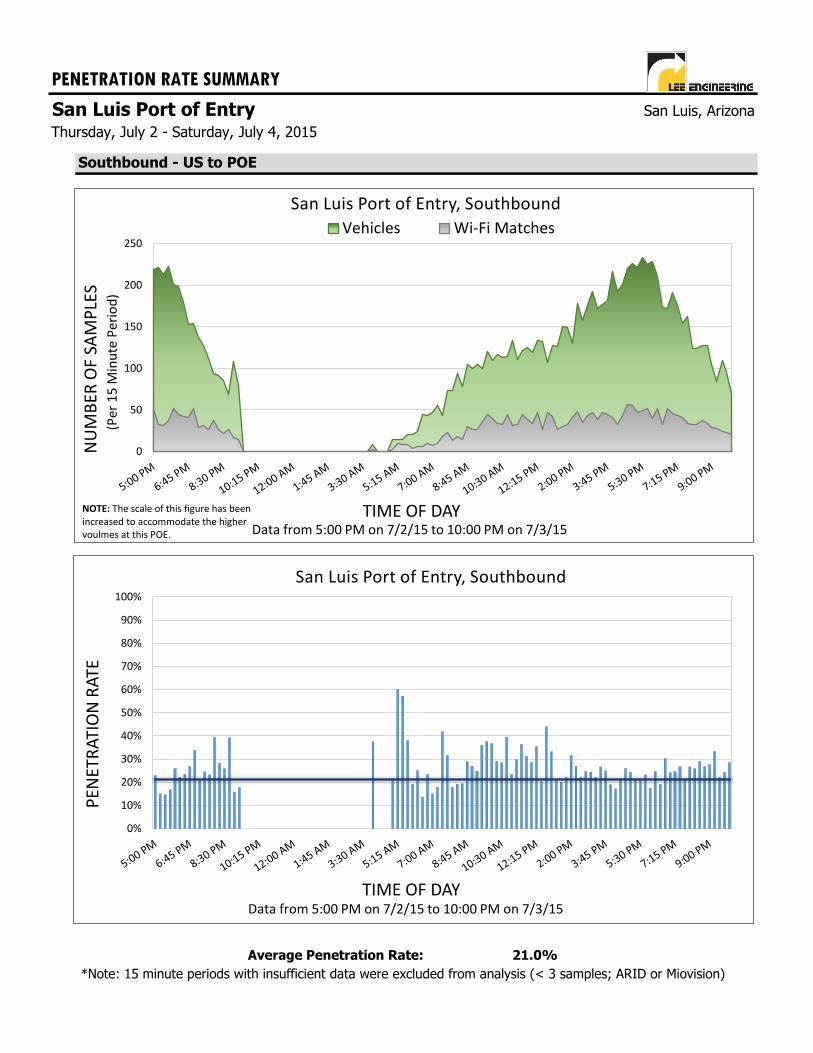
PENETRATION RATE SUMMARY
San Luis Port of EntryThursday, July 2 - Saturday, July 4, 2015
Southbound - US to POE
21.0%
San Luis, Arizona
*Note: 15 minute periods with insufficient data were excluded from analysis (< 3 samples; ARID or Miovision)
Average Penetration Rate:
0
50
100
150
200
250
NU
MB
ER O
F SA
MP
LES
TIME OF DAY
San Luis Port of Entry, Southbound
Vehicles Wi-Fi Matches
(Per
15
Min
ute
Per
iod
)
Data from 5:00 PM on 7/2/15 to 10:00 PM on 7/3/15
0%
10%
20%
30%
40%
50%
60%
70%
80%
90%
100%
PEN
ETR
ATI
ON
RA
TE
TIME OF DAY
San Luis Port of Entry, Southbound
Data from 5:00 PM on 7/2/15 to 10:00 PM on 7/3/15
NOTE: The scale of this figure has been increased to accommodate the higher voulmes at this POE.

ANALYSIS OF BLUETOOTH AND WI-FI TECHNOLOGY
TO MEASURE WAIT TIMES OF PERSONAL VEHICLES AT ARIZONA-MEXICO PORTS OF ENTRY
APPENDIX D DELAY DATA
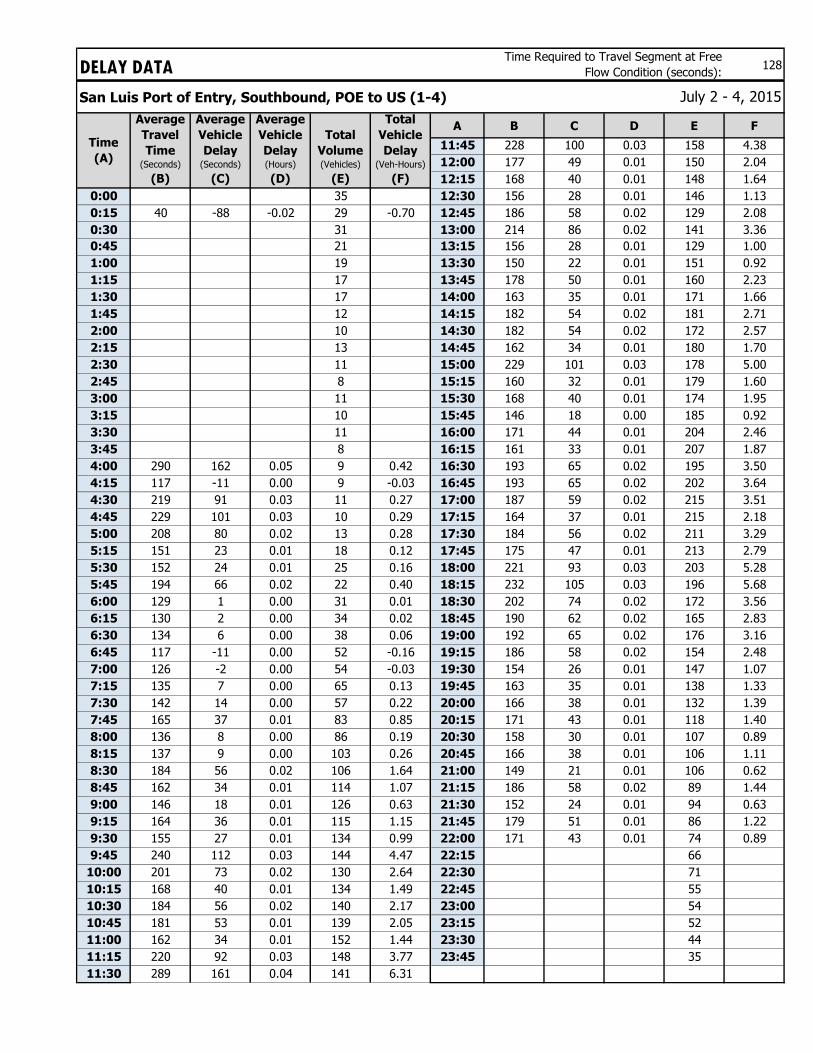
128
San Luis Port of Entry, Southbound, POE to US (1-4)
A B C D E F
11:45 228 100 0.03 158 4.38
12:00 177 49 0.01 150 2.04
12:15 168 40 0.01 148 1.64
0:00 35 12:30 156 28 0.01 146 1.13
0:15 40 -88 -0.02 29 -0.70 12:45 186 58 0.02 129 2.08
0:30 31 13:00 214 86 0.02 141 3.36
0:45 21 13:15 156 28 0.01 129 1.00
1:00 19 13:30 150 22 0.01 151 0.92
1:15 17 13:45 178 50 0.01 160 2.23
1:30 17 14:00 163 35 0.01 171 1.66
1:45 12 14:15 182 54 0.02 181 2.71
2:00 10 14:30 182 54 0.02 172 2.57
2:15 13 14:45 162 34 0.01 180 1.70
2:30 11 15:00 229 101 0.03 178 5.00
2:45 8 15:15 160 32 0.01 179 1.60
3:00 11 15:30 168 40 0.01 174 1.95
3:15 10 15:45 146 18 0.00 185 0.92
3:30 11 16:00 171 44 0.01 204 2.46
3:45 8 16:15 161 33 0.01 207 1.87
4:00 290 162 0.05 9 0.42 16:30 193 65 0.02 195 3.50
4:15 117 -11 0.00 9 -0.03 16:45 193 65 0.02 202 3.64
4:30 219 91 0.03 11 0.27 17:00 187 59 0.02 215 3.51
4:45 229 101 0.03 10 0.29 17:15 164 37 0.01 215 2.18
5:00 208 80 0.02 13 0.28 17:30 184 56 0.02 211 3.29
5:15 151 23 0.01 18 0.12 17:45 175 47 0.01 213 2.79
5:30 152 24 0.01 25 0.16 18:00 221 93 0.03 203 5.28
5:45 194 66 0.02 22 0.40 18:15 232 105 0.03 196 5.68
6:00 129 1 0.00 31 0.01 18:30 202 74 0.02 172 3.56
6:15 130 2 0.00 34 0.02 18:45 190 62 0.02 165 2.83
6:30 134 6 0.00 38 0.06 19:00 192 65 0.02 176 3.16
6:45 117 -11 0.00 52 -0.16 19:15 186 58 0.02 154 2.48
7:00 126 -2 0.00 54 -0.03 19:30 154 26 0.01 147 1.07
7:15 135 7 0.00 65 0.13 19:45 163 35 0.01 138 1.33
7:30 142 14 0.00 57 0.22 20:00 166 38 0.01 132 1.39
7:45 165 37 0.01 83 0.85 20:15 171 43 0.01 118 1.40
8:00 136 8 0.00 86 0.19 20:30 158 30 0.01 107 0.89
8:15 137 9 0.00 103 0.26 20:45 166 38 0.01 106 1.11
8:30 184 56 0.02 106 1.64 21:00 149 21 0.01 106 0.62
8:45 162 34 0.01 114 1.07 21:15 186 58 0.02 89 1.44
9:00 146 18 0.01 126 0.63 21:30 152 24 0.01 94 0.63
9:15 164 36 0.01 115 1.15 21:45 179 51 0.01 86 1.22
9:30 155 27 0.01 134 0.99 22:00 171 43 0.01 74 0.89
9:45 240 112 0.03 144 4.47 22:15 66
10:00 201 73 0.02 130 2.64 22:30 71
10:15 168 40 0.01 134 1.49 22:45 55
10:30 184 56 0.02 140 2.17 23:00 54
10:45 181 53 0.01 139 2.05 23:15 52
11:00 162 34 0.01 152 1.44 23:30 44
11:15 220 92 0.03 148 3.77 23:45 35
11:30 289 161 0.04 141 6.31
Total
Volume (Vehicles)
(E)
Total
Vehicle
Delay (Veh-Hours)
(F)
Time
(A)
Average
Travel
Time (Seconds)
(B)
Average
Vehicle
Delay (Seconds)
(C)
Average
Vehicle
Delay (Hours)
(D)
Time Required to Travel Segment at Free
Flow Condition (seconds):
July 2 - 4, 2015
DELAY DATA
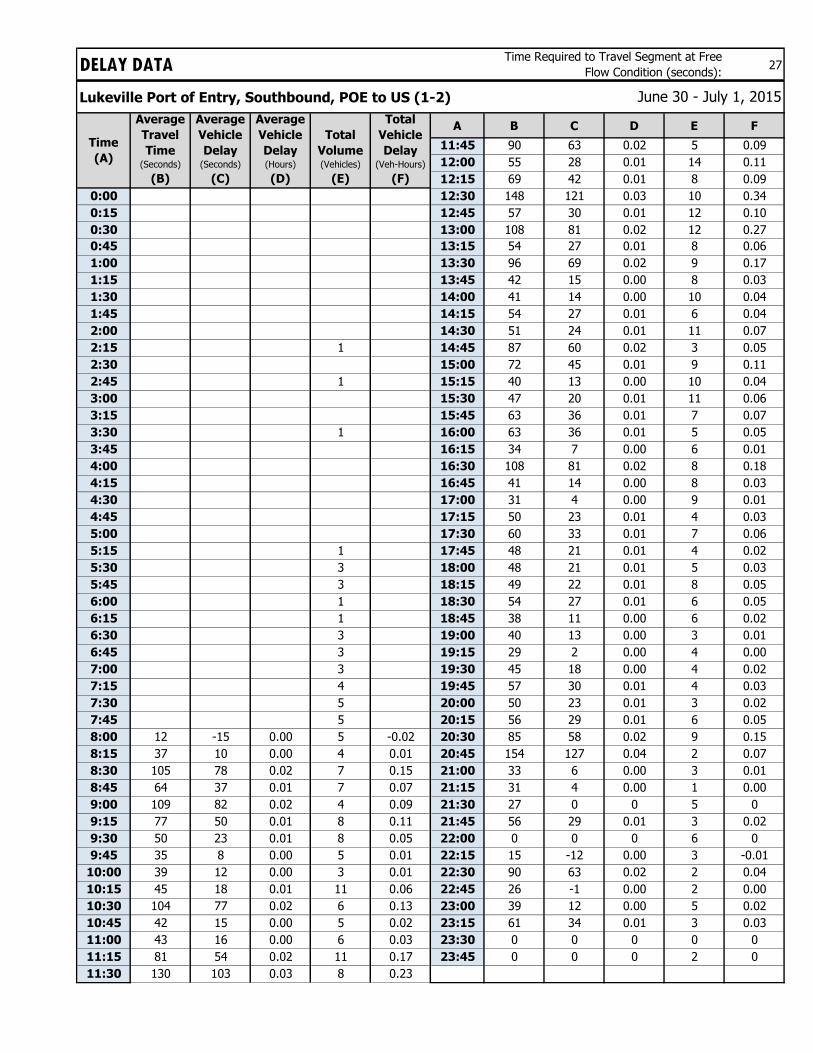
27
Lukeville Port of Entry, Southbound, POE to US (1-2)
A B C D E F
11:45 90 63 0.02 5 0.09
12:00 55 28 0.01 14 0.11
12:15 69 42 0.01 8 0.09
0:00 12:30 148 121 0.03 10 0.34
0:15 12:45 57 30 0.01 12 0.10
0:30 13:00 108 81 0.02 12 0.27
0:45 13:15 54 27 0.01 8 0.06
1:00 13:30 96 69 0.02 9 0.17
1:15 13:45 42 15 0.00 8 0.03
1:30 14:00 41 14 0.00 10 0.04
1:45 14:15 54 27 0.01 6 0.04
2:00 14:30 51 24 0.01 11 0.07
2:15 1 14:45 87 60 0.02 3 0.05
2:30 15:00 72 45 0.01 9 0.11
2:45 1 15:15 40 13 0.00 10 0.04
3:00 15:30 47 20 0.01 11 0.06
3:15 15:45 63 36 0.01 7 0.07
3:30 1 16:00 63 36 0.01 5 0.05
3:45 16:15 34 7 0.00 6 0.01
4:00 16:30 108 81 0.02 8 0.18
4:15 16:45 41 14 0.00 8 0.03
4:30 17:00 31 4 0.00 9 0.01
4:45 17:15 50 23 0.01 4 0.03
5:00 17:30 60 33 0.01 7 0.06
5:15 1 17:45 48 21 0.01 4 0.02
5:30 3 18:00 48 21 0.01 5 0.03
5:45 3 18:15 49 22 0.01 8 0.05
6:00 1 18:30 54 27 0.01 6 0.05
6:15 1 18:45 38 11 0.00 6 0.02
6:30 3 19:00 40 13 0.00 3 0.01
6:45 3 19:15 29 2 0.00 4 0.00
7:00 3 19:30 45 18 0.00 4 0.02
7:15 4 19:45 57 30 0.01 4 0.03
7:30 5 20:00 50 23 0.01 3 0.02
7:45 5 20:15 56 29 0.01 6 0.05
8:00 12 -15 0.00 5 -0.02 20:30 85 58 0.02 9 0.15
8:15 37 10 0.00 4 0.01 20:45 154 127 0.04 2 0.07
8:30 105 78 0.02 7 0.15 21:00 33 6 0.00 3 0.01
8:45 64 37 0.01 7 0.07 21:15 31 4 0.00 1 0.00
9:00 109 82 0.02 4 0.09 21:30 27 0 0 5 0
9:15 77 50 0.01 8 0.11 21:45 56 29 0.01 3 0.02
9:30 50 23 0.01 8 0.05 22:00 0 0 0 6 0
9:45 35 8 0.00 5 0.01 22:15 15 -12 0.00 3 -0.01
10:00 39 12 0.00 3 0.01 22:30 90 63 0.02 2 0.04
10:15 45 18 0.01 11 0.06 22:45 26 -1 0.00 2 0.00
10:30 104 77 0.02 6 0.13 23:00 39 12 0.00 5 0.02
10:45 42 15 0.00 5 0.02 23:15 61 34 0.01 3 0.03
11:00 43 16 0.00 6 0.03 23:30 0 0 0 0 0
11:15 81 54 0.02 11 0.17 23:45 0 0 0 2 0
11:30 130 103 0.03 8 0.23
Time Required to Travel Segment at Free
Flow Condition (seconds):
June 30 - July 1, 2015
DELAY DATA
Average
Vehicle
Delay (Seconds)
(C)
Average
Vehicle
Delay (Hours)
(D)
Total
Volume (Vehicles)
(E)
Total
Vehicle
Delay (Veh-Hours)
(F)
Time
(A)
Average
Travel
Time (Seconds)
(B)
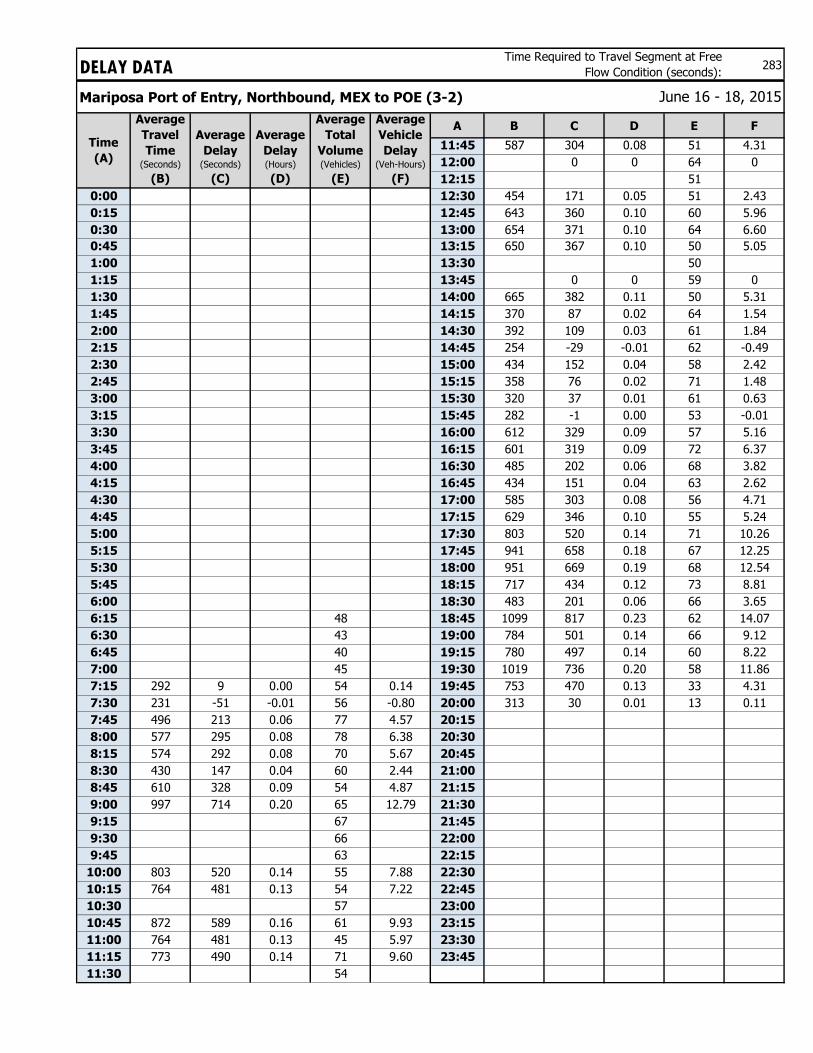
DELAY DATA 283
Mariposa Port of Entry, Northbound, MEX to POE (3-2)
A B C D E F
11:45 587 304 0.08 51 4.31
12:00 0 0 64 0
12:15 51
0:00 12:30 454 171 0.05 51 2.43
0:15 12:45 643 360 0.10 60 5.96
0:30 13:00 654 371 0.10 64 6.60
0:45 13:15 650 367 0.10 50 5.05
1:00 13:30 50
1:15 13:45 0 0 59 0
1:30 14:00 665 382 0.11 50 5.31
1:45 14:15 370 87 0.02 64 1.54
2:00 14:30 392 109 0.03 61 1.84
2:15 14:45 254 -29 -0.01 62 -0.49
2:30 15:00 434 152 0.04 58 2.42
2:45 15:15 358 76 0.02 71 1.48
3:00 15:30 320 37 0.01 61 0.63
3:15 15:45 282 -1 0.00 53 -0.01
3:30 16:00 612 329 0.09 57 5.16
3:45 16:15 601 319 0.09 72 6.37
4:00 16:30 485 202 0.06 68 3.82
4:15 16:45 434 151 0.04 63 2.62
4:30 17:00 585 303 0.08 56 4.71
4:45 17:15 629 346 0.10 55 5.24
5:00 17:30 803 520 0.14 71 10.26
5:15 17:45 941 658 0.18 67 12.25
5:30 18:00 951 669 0.19 68 12.54
5:45 18:15 717 434 0.12 73 8.81
6:00 18:30 483 201 0.06 66 3.65
6:15 48 18:45 1099 817 0.23 62 14.07
6:30 43 19:00 784 501 0.14 66 9.12
6:45 40 19:15 780 497 0.14 60 8.22
7:00 45 19:30 1019 736 0.20 58 11.86
7:15 292 9 0.00 54 0.14 19:45 753 470 0.13 33 4.31
7:30 231 -51 -0.01 56 -0.80 20:00 313 30 0.01 13 0.11
7:45 496 213 0.06 77 4.57 20:15
8:00 577 295 0.08 78 6.38 20:30
8:15 574 292 0.08 70 5.67 20:45
8:30 430 147 0.04 60 2.44 21:00
8:45 610 328 0.09 54 4.87 21:15
9:00 997 714 0.20 65 12.79 21:30
9:15 67 21:45
9:30 66 22:00
9:45 63 22:15
10:00 803 520 0.14 55 7.88 22:30
10:15 764 481 0.13 54 7.22 22:45
10:30 57 23:00
10:45 872 589 0.16 61 9.93 23:15
11:00 764 481 0.13 45 5.97 23:30
11:15 773 490 0.14 71 9.60 23:45
11:30 54
Time Required to Travel Segment at Free
Flow Condition (seconds):
June 16 - 18, 2015
Time
(A)
Average
Travel
Time (Seconds)
(B)
Average
Delay (Seconds)
(C)
Average
Delay (Hours)
(D)
Average
Total
Volume (Vehicles)
(E)
Average
Vehicle
Delay (Veh-Hours)
(F)
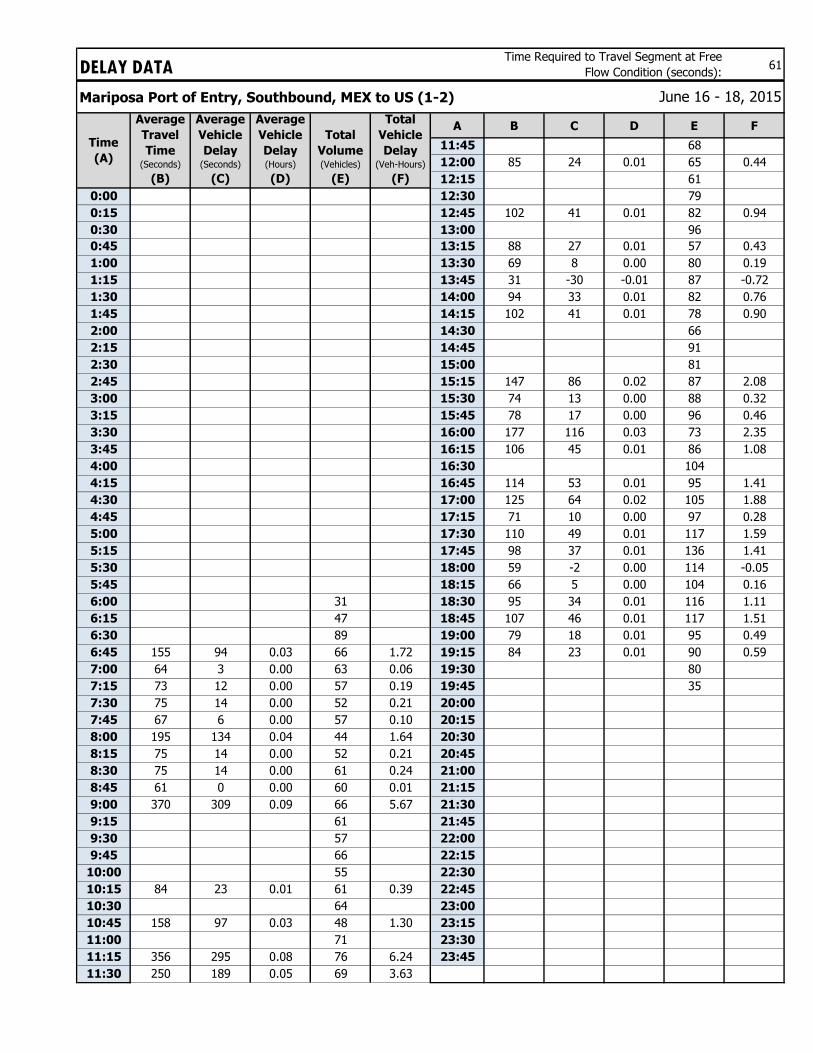
DELAY DATA 61
Mariposa Port of Entry, Southbound, MEX to US (1-2)
A B C D E F
11:45 68
12:00 85 24 0.01 65 0.44
12:15 61
0:00 12:30 79
0:15 12:45 102 41 0.01 82 0.94
0:30 13:00 96
0:45 13:15 88 27 0.01 57 0.43
1:00 13:30 69 8 0.00 80 0.19
1:15 13:45 31 -30 -0.01 87 -0.72
1:30 14:00 94 33 0.01 82 0.76
1:45 14:15 102 41 0.01 78 0.90
2:00 14:30 66
2:15 14:45 91
2:30 15:00 81
2:45 15:15 147 86 0.02 87 2.08
3:00 15:30 74 13 0.00 88 0.32
3:15 15:45 78 17 0.00 96 0.46
3:30 16:00 177 116 0.03 73 2.35
3:45 16:15 106 45 0.01 86 1.08
4:00 16:30 104
4:15 16:45 114 53 0.01 95 1.41
4:30 17:00 125 64 0.02 105 1.88
4:45 17:15 71 10 0.00 97 0.28
5:00 17:30 110 49 0.01 117 1.59
5:15 17:45 98 37 0.01 136 1.41
5:30 18:00 59 -2 0.00 114 -0.05
5:45 18:15 66 5 0.00 104 0.16
6:00 31 18:30 95 34 0.01 116 1.11
6:15 47 18:45 107 46 0.01 117 1.51
6:30 89 19:00 79 18 0.01 95 0.49
6:45 155 94 0.03 66 1.72 19:15 84 23 0.01 90 0.59
7:00 64 3 0.00 63 0.06 19:30 80
7:15 73 12 0.00 57 0.19 19:45 35
7:30 75 14 0.00 52 0.21 20:00
7:45 67 6 0.00 57 0.10 20:15
8:00 195 134 0.04 44 1.64 20:30
8:15 75 14 0.00 52 0.21 20:45
8:30 75 14 0.00 61 0.24 21:00
8:45 61 0 0.00 60 0.01 21:15
9:00 370 309 0.09 66 5.67 21:30
9:15 61 21:45
9:30 57 22:00
9:45 66 22:15
10:00 55 22:30
10:15 84 23 0.01 61 0.39 22:45
10:30 64 23:00
10:45 158 97 0.03 48 1.30 23:15
11:00 71 23:30
11:15 356 295 0.08 76 6.24 23:45
11:30 250 189 0.05 69 3.63
Time Required to Travel Segment at Free
Flow Condition (seconds):
June 16 - 18, 2015
Average
Vehicle
Delay (Hours)
(D)
Total
Volume (Vehicles)
(E)
Total
Vehicle
Delay (Veh-Hours)
(F)
Time
(A)
Average
Travel
Time (Seconds)
(B)
Average
Vehicle
Delay (Seconds)
(C)
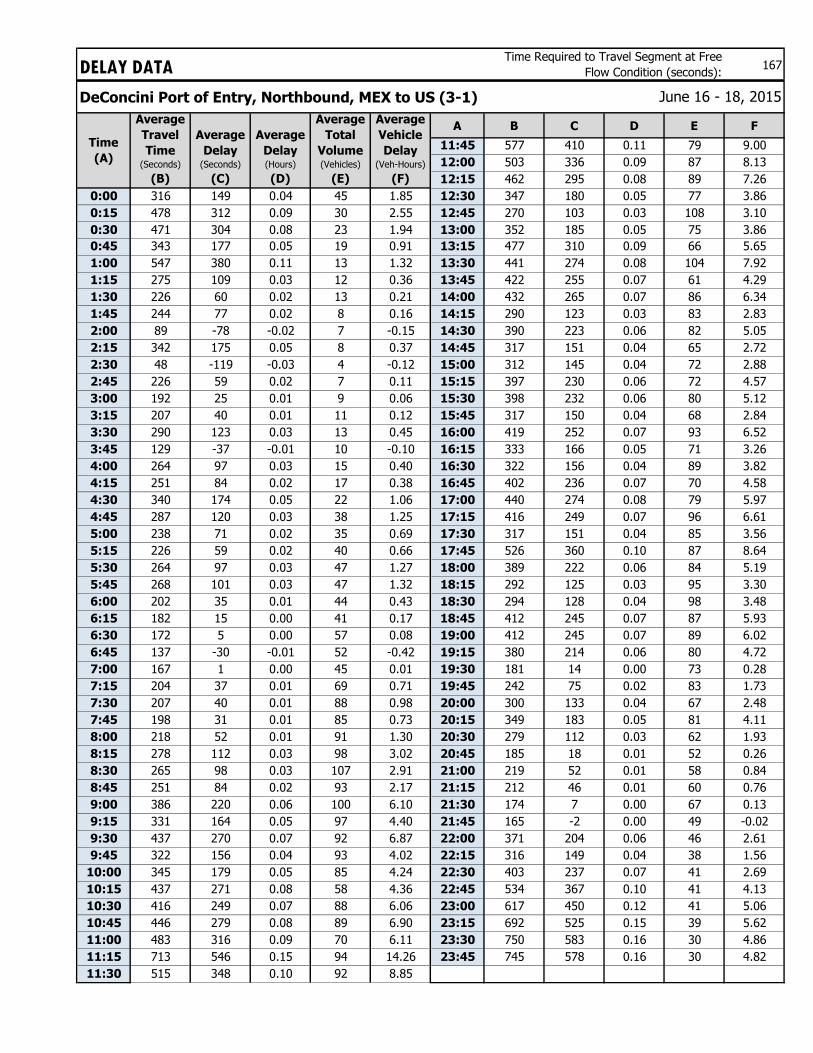
DELAY DATA 167
DeConcini Port of Entry, Northbound, MEX to US (3-1)
A B C D E F
11:45 577 410 0.11 79 9.00
12:00 503 336 0.09 87 8.13
12:15 462 295 0.08 89 7.26
0:00 316 149 0.04 45 1.85 12:30 347 180 0.05 77 3.86
0:15 478 312 0.09 30 2.55 12:45 270 103 0.03 108 3.10
0:30 471 304 0.08 23 1.94 13:00 352 185 0.05 75 3.86
0:45 343 177 0.05 19 0.91 13:15 477 310 0.09 66 5.65
1:00 547 380 0.11 13 1.32 13:30 441 274 0.08 104 7.92
1:15 275 109 0.03 12 0.36 13:45 422 255 0.07 61 4.29
1:30 226 60 0.02 13 0.21 14:00 432 265 0.07 86 6.34
1:45 244 77 0.02 8 0.16 14:15 290 123 0.03 83 2.83
2:00 89 -78 -0.02 7 -0.15 14:30 390 223 0.06 82 5.05
2:15 342 175 0.05 8 0.37 14:45 317 151 0.04 65 2.72
2:30 48 -119 -0.03 4 -0.12 15:00 312 145 0.04 72 2.88
2:45 226 59 0.02 7 0.11 15:15 397 230 0.06 72 4.57
3:00 192 25 0.01 9 0.06 15:30 398 232 0.06 80 5.12
3:15 207 40 0.01 11 0.12 15:45 317 150 0.04 68 2.84
3:30 290 123 0.03 13 0.45 16:00 419 252 0.07 93 6.52
3:45 129 -37 -0.01 10 -0.10 16:15 333 166 0.05 71 3.26
4:00 264 97 0.03 15 0.40 16:30 322 156 0.04 89 3.82
4:15 251 84 0.02 17 0.38 16:45 402 236 0.07 70 4.58
4:30 340 174 0.05 22 1.06 17:00 440 274 0.08 79 5.97
4:45 287 120 0.03 38 1.25 17:15 416 249 0.07 96 6.61
5:00 238 71 0.02 35 0.69 17:30 317 151 0.04 85 3.56
5:15 226 59 0.02 40 0.66 17:45 526 360 0.10 87 8.64
5:30 264 97 0.03 47 1.27 18:00 389 222 0.06 84 5.19
5:45 268 101 0.03 47 1.32 18:15 292 125 0.03 95 3.30
6:00 202 35 0.01 44 0.43 18:30 294 128 0.04 98 3.48
6:15 182 15 0.00 41 0.17 18:45 412 245 0.07 87 5.93
6:30 172 5 0.00 57 0.08 19:00 412 245 0.07 89 6.02
6:45 137 -30 -0.01 52 -0.42 19:15 380 214 0.06 80 4.72
7:00 167 1 0.00 45 0.01 19:30 181 14 0.00 73 0.28
7:15 204 37 0.01 69 0.71 19:45 242 75 0.02 83 1.73
7:30 207 40 0.01 88 0.98 20:00 300 133 0.04 67 2.48
7:45 198 31 0.01 85 0.73 20:15 349 183 0.05 81 4.11
8:00 218 52 0.01 91 1.30 20:30 279 112 0.03 62 1.93
8:15 278 112 0.03 98 3.02 20:45 185 18 0.01 52 0.26
8:30 265 98 0.03 107 2.91 21:00 219 52 0.01 58 0.84
8:45 251 84 0.02 93 2.17 21:15 212 46 0.01 60 0.76
9:00 386 220 0.06 100 6.10 21:30 174 7 0.00 67 0.13
9:15 331 164 0.05 97 4.40 21:45 165 -2 0.00 49 -0.02
9:30 437 270 0.07 92 6.87 22:00 371 204 0.06 46 2.61
9:45 322 156 0.04 93 4.02 22:15 316 149 0.04 38 1.56
10:00 345 179 0.05 85 4.24 22:30 403 237 0.07 41 2.69
10:15 437 271 0.08 58 4.36 22:45 534 367 0.10 41 4.13
10:30 416 249 0.07 88 6.06 23:00 617 450 0.12 41 5.06
10:45 446 279 0.08 89 6.90 23:15 692 525 0.15 39 5.62
11:00 483 316 0.09 70 6.11 23:30 750 583 0.16 30 4.86
11:15 713 546 0.15 94 14.26 23:45 745 578 0.16 30 4.82
11:30 515 348 0.10 92 8.85
Time Required to Travel Segment at Free
Flow Condition (seconds):
June 16 - 18, 2015
Time
(A)
Average
Travel
Time (Seconds)
(B)
Average
Delay (Seconds)
(C)
Average
Delay (Hours)
(D)
Average
Total
Volume (Vehicles)
(E)
Average
Vehicle
Delay (Veh-Hours)
(F)
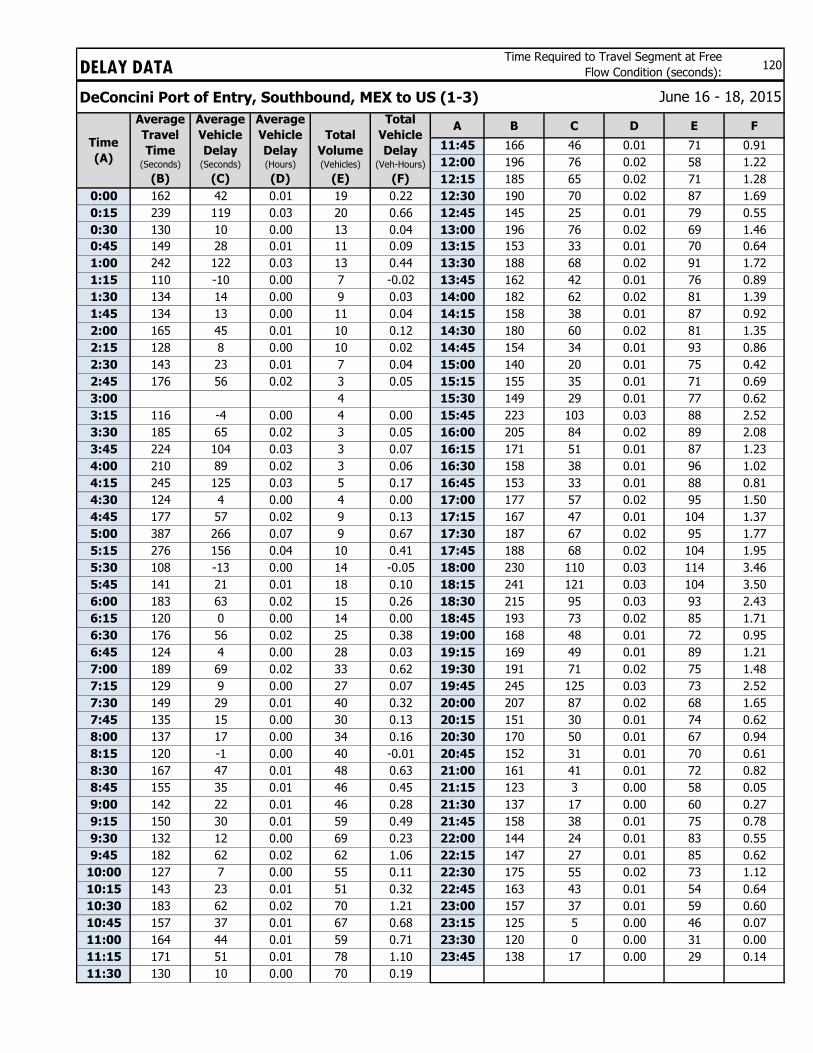
DELAY DATA 120
DeConcini Port of Entry, Southbound, MEX to US (1-3)
A B C D E F
11:45 166 46 0.01 71 0.91
12:00 196 76 0.02 58 1.22
12:15 185 65 0.02 71 1.28
0:00 162 42 0.01 19 0.22 12:30 190 70 0.02 87 1.69
0:15 239 119 0.03 20 0.66 12:45 145 25 0.01 79 0.55
0:30 130 10 0.00 13 0.04 13:00 196 76 0.02 69 1.46
0:45 149 28 0.01 11 0.09 13:15 153 33 0.01 70 0.64
1:00 242 122 0.03 13 0.44 13:30 188 68 0.02 91 1.72
1:15 110 -10 0.00 7 -0.02 13:45 162 42 0.01 76 0.89
1:30 134 14 0.00 9 0.03 14:00 182 62 0.02 81 1.39
1:45 134 13 0.00 11 0.04 14:15 158 38 0.01 87 0.92
2:00 165 45 0.01 10 0.12 14:30 180 60 0.02 81 1.35
2:15 128 8 0.00 10 0.02 14:45 154 34 0.01 93 0.86
2:30 143 23 0.01 7 0.04 15:00 140 20 0.01 75 0.42
2:45 176 56 0.02 3 0.05 15:15 155 35 0.01 71 0.69
3:00 4 15:30 149 29 0.01 77 0.62
3:15 116 -4 0.00 4 0.00 15:45 223 103 0.03 88 2.52
3:30 185 65 0.02 3 0.05 16:00 205 84 0.02 89 2.08
3:45 224 104 0.03 3 0.07 16:15 171 51 0.01 87 1.23
4:00 210 89 0.02 3 0.06 16:30 158 38 0.01 96 1.02
4:15 245 125 0.03 5 0.17 16:45 153 33 0.01 88 0.81
4:30 124 4 0.00 4 0.00 17:00 177 57 0.02 95 1.50
4:45 177 57 0.02 9 0.13 17:15 167 47 0.01 104 1.37
5:00 387 266 0.07 9 0.67 17:30 187 67 0.02 95 1.77
5:15 276 156 0.04 10 0.41 17:45 188 68 0.02 104 1.95
5:30 108 -13 0.00 14 -0.05 18:00 230 110 0.03 114 3.46
5:45 141 21 0.01 18 0.10 18:15 241 121 0.03 104 3.50
6:00 183 63 0.02 15 0.26 18:30 215 95 0.03 93 2.43
6:15 120 0 0.00 14 0.00 18:45 193 73 0.02 85 1.71
6:30 176 56 0.02 25 0.38 19:00 168 48 0.01 72 0.95
6:45 124 4 0.00 28 0.03 19:15 169 49 0.01 89 1.21
7:00 189 69 0.02 33 0.62 19:30 191 71 0.02 75 1.48
7:15 129 9 0.00 27 0.07 19:45 245 125 0.03 73 2.52
7:30 149 29 0.01 40 0.32 20:00 207 87 0.02 68 1.65
7:45 135 15 0.00 30 0.13 20:15 151 30 0.01 74 0.62
8:00 137 17 0.00 34 0.16 20:30 170 50 0.01 67 0.94
8:15 120 -1 0.00 40 -0.01 20:45 152 31 0.01 70 0.61
8:30 167 47 0.01 48 0.63 21:00 161 41 0.01 72 0.82
8:45 155 35 0.01 46 0.45 21:15 123 3 0.00 58 0.05
9:00 142 22 0.01 46 0.28 21:30 137 17 0.00 60 0.27
9:15 150 30 0.01 59 0.49 21:45 158 38 0.01 75 0.78
9:30 132 12 0.00 69 0.23 22:00 144 24 0.01 83 0.55
9:45 182 62 0.02 62 1.06 22:15 147 27 0.01 85 0.62
10:00 127 7 0.00 55 0.11 22:30 175 55 0.02 73 1.12
10:15 143 23 0.01 51 0.32 22:45 163 43 0.01 54 0.64
10:30 183 62 0.02 70 1.21 23:00 157 37 0.01 59 0.60
10:45 157 37 0.01 67 0.68 23:15 125 5 0.00 46 0.07
11:00 164 44 0.01 59 0.71 23:30 120 0 0.00 31 0.00
11:15 171 51 0.01 78 1.10 23:45 138 17 0.00 29 0.14
11:30 130 10 0.00 70 0.19
Time Required to Travel Segment at Free
Flow Condition (seconds):
June 16 - 18, 2015
Average
Vehicle
Delay (Hours)
(D)
Total
Volume (Vehicles)
(E)
Total
Vehicle
Delay (Veh-Hours)
(F)
Time
(A)
Average
Travel
Time (Seconds)
(B)
Average
Vehicle
Delay (Seconds)
(C)
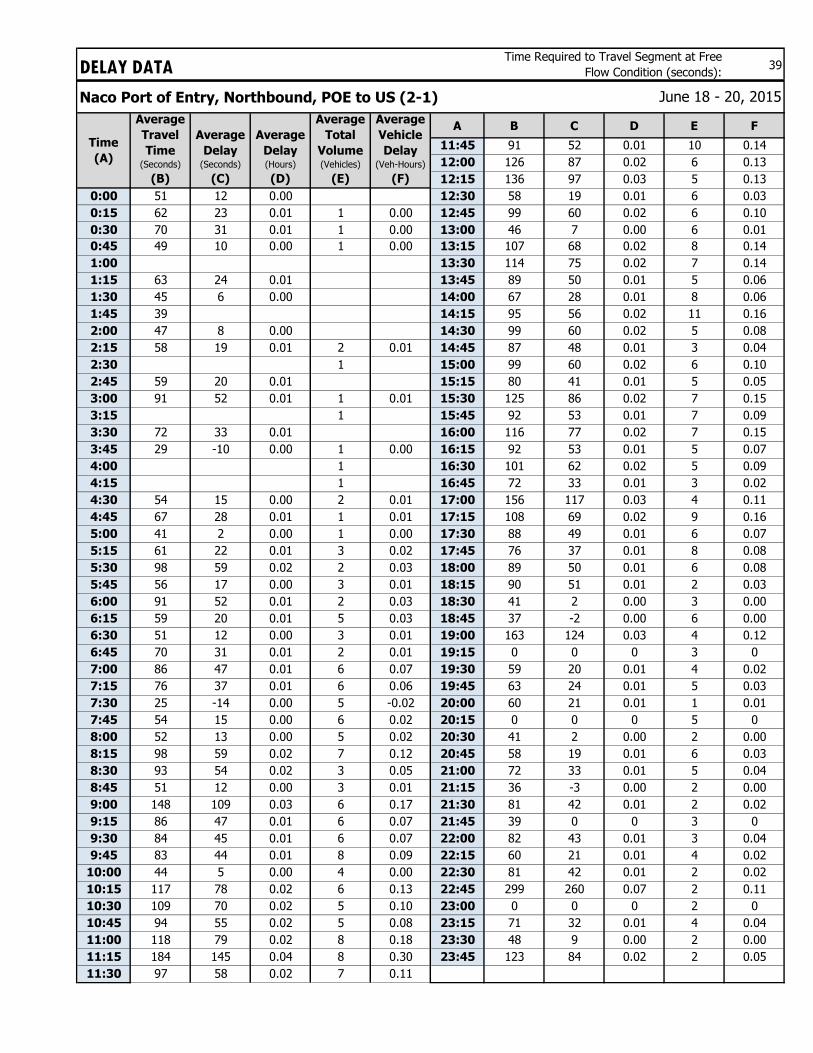
DELAY DATA 39
Naco Port of Entry, Northbound, POE to US (2-1)
A B C D E F
11:45 91 52 0.01 10 0.14
12:00 126 87 0.02 6 0.13
12:15 136 97 0.03 5 0.13
0:00 51 12 0.00 12:30 58 19 0.01 6 0.03
0:15 62 23 0.01 1 0.00 12:45 99 60 0.02 6 0.10
0:30 70 31 0.01 1 0.00 13:00 46 7 0.00 6 0.01
0:45 49 10 0.00 1 0.00 13:15 107 68 0.02 8 0.14
1:00 13:30 114 75 0.02 7 0.14
1:15 63 24 0.01 13:45 89 50 0.01 5 0.06
1:30 45 6 0.00 14:00 67 28 0.01 8 0.06
1:45 39 14:15 95 56 0.02 11 0.16
2:00 47 8 0.00 14:30 99 60 0.02 5 0.08
2:15 58 19 0.01 2 0.01 14:45 87 48 0.01 3 0.04
2:30 1 15:00 99 60 0.02 6 0.10
2:45 59 20 0.01 15:15 80 41 0.01 5 0.05
3:00 91 52 0.01 1 0.01 15:30 125 86 0.02 7 0.15
3:15 1 15:45 92 53 0.01 7 0.09
3:30 72 33 0.01 16:00 116 77 0.02 7 0.15
3:45 29 -10 0.00 1 0.00 16:15 92 53 0.01 5 0.07
4:00 1 16:30 101 62 0.02 5 0.09
4:15 1 16:45 72 33 0.01 3 0.02
4:30 54 15 0.00 2 0.01 17:00 156 117 0.03 4 0.11
4:45 67 28 0.01 1 0.01 17:15 108 69 0.02 9 0.16
5:00 41 2 0.00 1 0.00 17:30 88 49 0.01 6 0.07
5:15 61 22 0.01 3 0.02 17:45 76 37 0.01 8 0.08
5:30 98 59 0.02 2 0.03 18:00 89 50 0.01 6 0.08
5:45 56 17 0.00 3 0.01 18:15 90 51 0.01 2 0.03
6:00 91 52 0.01 2 0.03 18:30 41 2 0.00 3 0.00
6:15 59 20 0.01 5 0.03 18:45 37 -2 0.00 6 0.00
6:30 51 12 0.00 3 0.01 19:00 163 124 0.03 4 0.12
6:45 70 31 0.01 2 0.01 19:15 0 0 0 3 0
7:00 86 47 0.01 6 0.07 19:30 59 20 0.01 4 0.02
7:15 76 37 0.01 6 0.06 19:45 63 24 0.01 5 0.03
7:30 25 -14 0.00 5 -0.02 20:00 60 21 0.01 1 0.01
7:45 54 15 0.00 6 0.02 20:15 0 0 0 5 0
8:00 52 13 0.00 5 0.02 20:30 41 2 0.00 2 0.00
8:15 98 59 0.02 7 0.12 20:45 58 19 0.01 6 0.03
8:30 93 54 0.02 3 0.05 21:00 72 33 0.01 5 0.04
8:45 51 12 0.00 3 0.01 21:15 36 -3 0.00 2 0.00
9:00 148 109 0.03 6 0.17 21:30 81 42 0.01 2 0.02
9:15 86 47 0.01 6 0.07 21:45 39 0 0 3 0
9:30 84 45 0.01 6 0.07 22:00 82 43 0.01 3 0.04
9:45 83 44 0.01 8 0.09 22:15 60 21 0.01 4 0.02
10:00 44 5 0.00 4 0.00 22:30 81 42 0.01 2 0.02
10:15 117 78 0.02 6 0.13 22:45 299 260 0.07 2 0.11
10:30 109 70 0.02 5 0.10 23:00 0 0 0 2 0
10:45 94 55 0.02 5 0.08 23:15 71 32 0.01 4 0.04
11:00 118 79 0.02 8 0.18 23:30 48 9 0.00 2 0.00
11:15 184 145 0.04 8 0.30 23:45 123 84 0.02 2 0.05
11:30 97 58 0.02 7 0.11
June 18 - 20, 2015
Time
(A)
Average
Travel
Time (Seconds)
(B)
Average
Delay (Seconds)
(C)
Average
Delay (Hours)
(D)
Average
Total
Volume (Vehicles)
(E)
Average
Vehicle
Delay (Veh-Hours)
(F)
Time Required to Travel Segment at Free
Flow Condition (seconds):
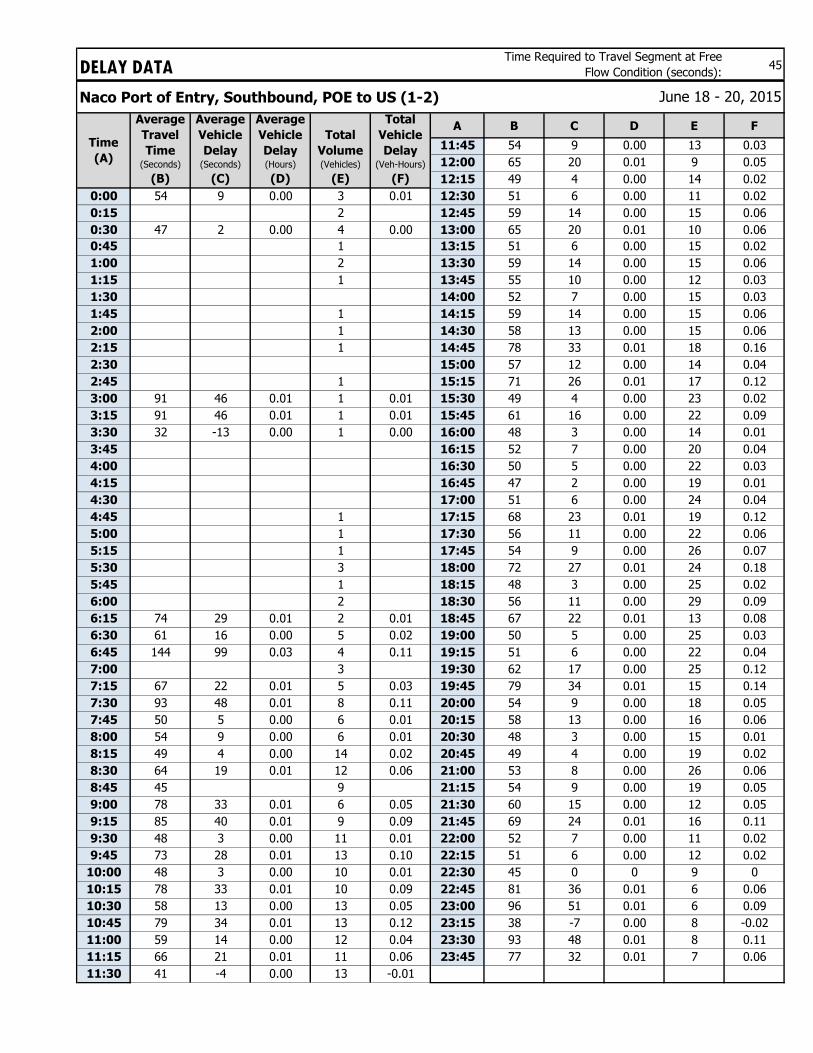
DELAY DATA 45
Naco Port of Entry, Southbound, POE to US (1-2)
A B C D E F
11:45 54 9 0.00 13 0.03
12:00 65 20 0.01 9 0.05
12:15 49 4 0.00 14 0.02
0:00 54 9 0.00 3 0.01 12:30 51 6 0.00 11 0.02
0:15 2 12:45 59 14 0.00 15 0.06
0:30 47 2 0.00 4 0.00 13:00 65 20 0.01 10 0.06
0:45 1 13:15 51 6 0.00 15 0.02
1:00 2 13:30 59 14 0.00 15 0.06
1:15 1 13:45 55 10 0.00 12 0.03
1:30 14:00 52 7 0.00 15 0.03
1:45 1 14:15 59 14 0.00 15 0.06
2:00 1 14:30 58 13 0.00 15 0.06
2:15 1 14:45 78 33 0.01 18 0.16
2:30 15:00 57 12 0.00 14 0.04
2:45 1 15:15 71 26 0.01 17 0.12
3:00 91 46 0.01 1 0.01 15:30 49 4 0.00 23 0.02
3:15 91 46 0.01 1 0.01 15:45 61 16 0.00 22 0.09
3:30 32 -13 0.00 1 0.00 16:00 48 3 0.00 14 0.01
3:45 16:15 52 7 0.00 20 0.04
4:00 16:30 50 5 0.00 22 0.03
4:15 16:45 47 2 0.00 19 0.01
4:30 17:00 51 6 0.00 24 0.04
4:45 1 17:15 68 23 0.01 19 0.12
5:00 1 17:30 56 11 0.00 22 0.06
5:15 1 17:45 54 9 0.00 26 0.07
5:30 3 18:00 72 27 0.01 24 0.18
5:45 1 18:15 48 3 0.00 25 0.02
6:00 2 18:30 56 11 0.00 29 0.09
6:15 74 29 0.01 2 0.01 18:45 67 22 0.01 13 0.08
6:30 61 16 0.00 5 0.02 19:00 50 5 0.00 25 0.03
6:45 144 99 0.03 4 0.11 19:15 51 6 0.00 22 0.04
7:00 3 19:30 62 17 0.00 25 0.12
7:15 67 22 0.01 5 0.03 19:45 79 34 0.01 15 0.14
7:30 93 48 0.01 8 0.11 20:00 54 9 0.00 18 0.05
7:45 50 5 0.00 6 0.01 20:15 58 13 0.00 16 0.06
8:00 54 9 0.00 6 0.01 20:30 48 3 0.00 15 0.01
8:15 49 4 0.00 14 0.02 20:45 49 4 0.00 19 0.02
8:30 64 19 0.01 12 0.06 21:00 53 8 0.00 26 0.06
8:45 45 9 21:15 54 9 0.00 19 0.05
9:00 78 33 0.01 6 0.05 21:30 60 15 0.00 12 0.05
9:15 85 40 0.01 9 0.09 21:45 69 24 0.01 16 0.11
9:30 48 3 0.00 11 0.01 22:00 52 7 0.00 11 0.02
9:45 73 28 0.01 13 0.10 22:15 51 6 0.00 12 0.02
10:00 48 3 0.00 10 0.01 22:30 45 0 0 9 0
10:15 78 33 0.01 10 0.09 22:45 81 36 0.01 6 0.06
10:30 58 13 0.00 13 0.05 23:00 96 51 0.01 6 0.09
10:45 79 34 0.01 13 0.12 23:15 38 -7 0.00 8 -0.02
11:00 59 14 0.00 12 0.04 23:30 93 48 0.01 8 0.11
11:15 66 21 0.01 11 0.06 23:45 77 32 0.01 7 0.06
11:30 41 -4 0.00 13 -0.01
June 18 - 20, 2015
Total
Volume (Vehicles)
(E)
Total
Vehicle
Delay (Veh-Hours)
(F)
Time
(A)
Average
Travel
Time (Seconds)
(B)
Average
Vehicle
Delay (Seconds)
(C)
Average
Vehicle
Delay (Hours)
(D)
Time Required to Travel Segment at Free
Flow Condition (seconds):
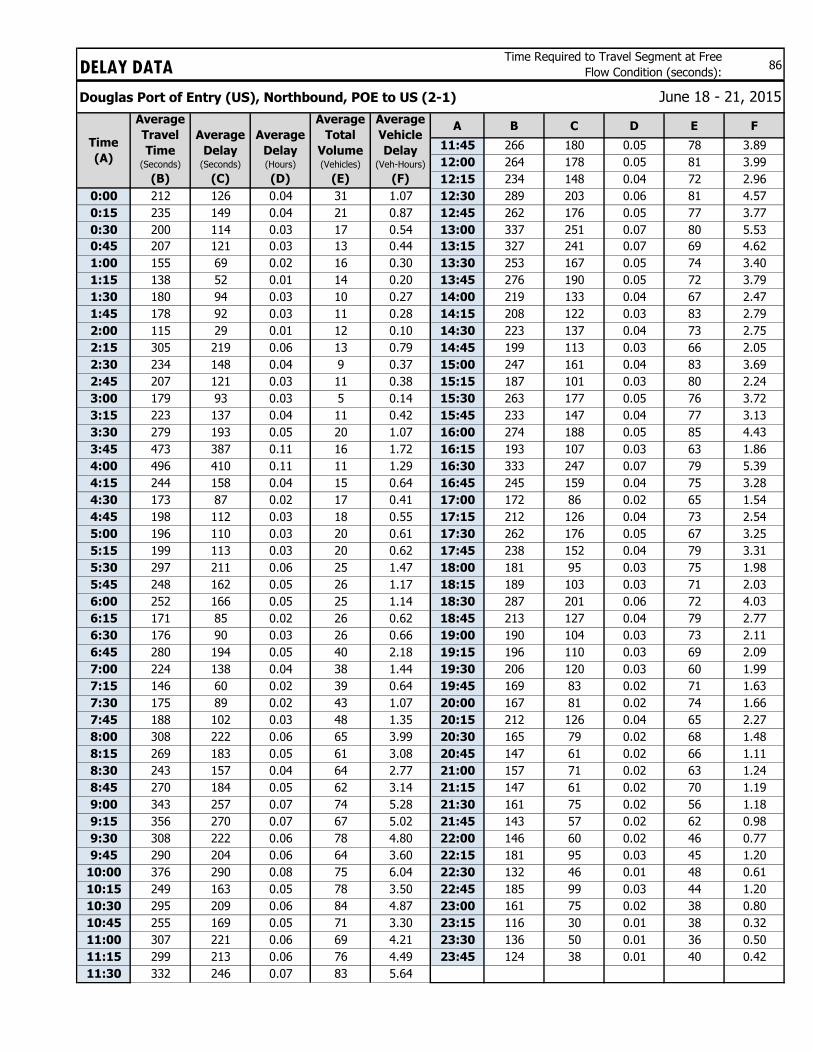
DELAY DATA 86
Douglas Port of Entry (US), Northbound, POE to US (2-1)
A B C D E F
11:45 266 180 0.05 78 3.89
12:00 264 178 0.05 81 3.99
12:15 234 148 0.04 72 2.96
0:00 212 126 0.04 31 1.07 12:30 289 203 0.06 81 4.57
0:15 235 149 0.04 21 0.87 12:45 262 176 0.05 77 3.77
0:30 200 114 0.03 17 0.54 13:00 337 251 0.07 80 5.53
0:45 207 121 0.03 13 0.44 13:15 327 241 0.07 69 4.62
1:00 155 69 0.02 16 0.30 13:30 253 167 0.05 74 3.40
1:15 138 52 0.01 14 0.20 13:45 276 190 0.05 72 3.79
1:30 180 94 0.03 10 0.27 14:00 219 133 0.04 67 2.47
1:45 178 92 0.03 11 0.28 14:15 208 122 0.03 83 2.79
2:00 115 29 0.01 12 0.10 14:30 223 137 0.04 73 2.75
2:15 305 219 0.06 13 0.79 14:45 199 113 0.03 66 2.05
2:30 234 148 0.04 9 0.37 15:00 247 161 0.04 83 3.69
2:45 207 121 0.03 11 0.38 15:15 187 101 0.03 80 2.24
3:00 179 93 0.03 5 0.14 15:30 263 177 0.05 76 3.72
3:15 223 137 0.04 11 0.42 15:45 233 147 0.04 77 3.13
3:30 279 193 0.05 20 1.07 16:00 274 188 0.05 85 4.43
3:45 473 387 0.11 16 1.72 16:15 193 107 0.03 63 1.86
4:00 496 410 0.11 11 1.29 16:30 333 247 0.07 79 5.39
4:15 244 158 0.04 15 0.64 16:45 245 159 0.04 75 3.28
4:30 173 87 0.02 17 0.41 17:00 172 86 0.02 65 1.54
4:45 198 112 0.03 18 0.55 17:15 212 126 0.04 73 2.54
5:00 196 110 0.03 20 0.61 17:30 262 176 0.05 67 3.25
5:15 199 113 0.03 20 0.62 17:45 238 152 0.04 79 3.31
5:30 297 211 0.06 25 1.47 18:00 181 95 0.03 75 1.98
5:45 248 162 0.05 26 1.17 18:15 189 103 0.03 71 2.03
6:00 252 166 0.05 25 1.14 18:30 287 201 0.06 72 4.03
6:15 171 85 0.02 26 0.62 18:45 213 127 0.04 79 2.77
6:30 176 90 0.03 26 0.66 19:00 190 104 0.03 73 2.11
6:45 280 194 0.05 40 2.18 19:15 196 110 0.03 69 2.09
7:00 224 138 0.04 38 1.44 19:30 206 120 0.03 60 1.99
7:15 146 60 0.02 39 0.64 19:45 169 83 0.02 71 1.63
7:30 175 89 0.02 43 1.07 20:00 167 81 0.02 74 1.66
7:45 188 102 0.03 48 1.35 20:15 212 126 0.04 65 2.27
8:00 308 222 0.06 65 3.99 20:30 165 79 0.02 68 1.48
8:15 269 183 0.05 61 3.08 20:45 147 61 0.02 66 1.11
8:30 243 157 0.04 64 2.77 21:00 157 71 0.02 63 1.24
8:45 270 184 0.05 62 3.14 21:15 147 61 0.02 70 1.19
9:00 343 257 0.07 74 5.28 21:30 161 75 0.02 56 1.18
9:15 356 270 0.07 67 5.02 21:45 143 57 0.02 62 0.98
9:30 308 222 0.06 78 4.80 22:00 146 60 0.02 46 0.77
9:45 290 204 0.06 64 3.60 22:15 181 95 0.03 45 1.20
10:00 376 290 0.08 75 6.04 22:30 132 46 0.01 48 0.61
10:15 249 163 0.05 78 3.50 22:45 185 99 0.03 44 1.20
10:30 295 209 0.06 84 4.87 23:00 161 75 0.02 38 0.80
10:45 255 169 0.05 71 3.30 23:15 116 30 0.01 38 0.32
11:00 307 221 0.06 69 4.21 23:30 136 50 0.01 36 0.50
11:15 299 213 0.06 76 4.49 23:45 124 38 0.01 40 0.42
11:30 332 246 0.07 83 5.64
Average
Total
Volume (Vehicles)
(E)
Time
(A)
Average
Travel
Time (Seconds)
(B)
Average
Delay (Seconds)
(C)
Average
Vehicle
Delay (Veh-Hours)
(F)
Average
Delay (Hours)
(D)
Time Required to Travel Segment at Free
Flow Condition (seconds):
June 18 - 21, 2015
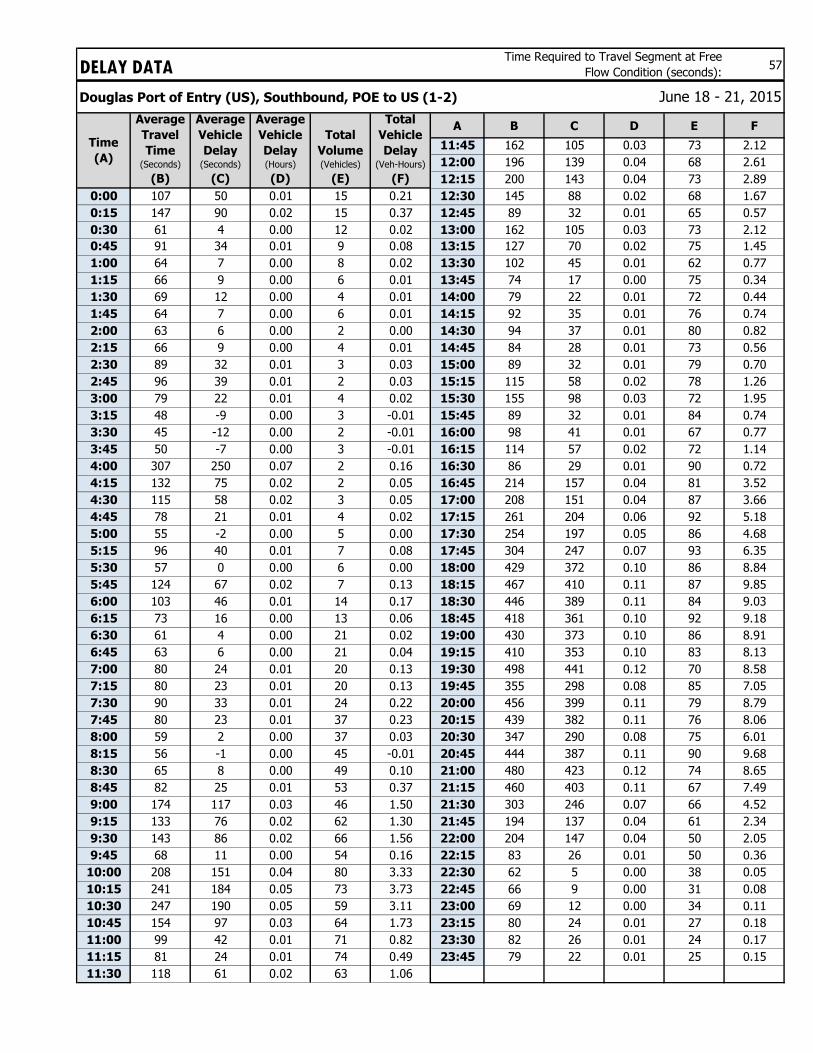
DELAY DATA 57
Douglas Port of Entry (US), Southbound, POE to US (1-2)
A B C D E F
11:45 162 105 0.03 73 2.12
12:00 196 139 0.04 68 2.61
12:15 200 143 0.04 73 2.89
0:00 107 50 0.01 15 0.21 12:30 145 88 0.02 68 1.67
0:15 147 90 0.02 15 0.37 12:45 89 32 0.01 65 0.57
0:30 61 4 0.00 12 0.02 13:00 162 105 0.03 73 2.12
0:45 91 34 0.01 9 0.08 13:15 127 70 0.02 75 1.45
1:00 64 7 0.00 8 0.02 13:30 102 45 0.01 62 0.77
1:15 66 9 0.00 6 0.01 13:45 74 17 0.00 75 0.34
1:30 69 12 0.00 4 0.01 14:00 79 22 0.01 72 0.44
1:45 64 7 0.00 6 0.01 14:15 92 35 0.01 76 0.74
2:00 63 6 0.00 2 0.00 14:30 94 37 0.01 80 0.82
2:15 66 9 0.00 4 0.01 14:45 84 28 0.01 73 0.56
2:30 89 32 0.01 3 0.03 15:00 89 32 0.01 79 0.70
2:45 96 39 0.01 2 0.03 15:15 115 58 0.02 78 1.26
3:00 79 22 0.01 4 0.02 15:30 155 98 0.03 72 1.95
3:15 48 -9 0.00 3 -0.01 15:45 89 32 0.01 84 0.74
3:30 45 -12 0.00 2 -0.01 16:00 98 41 0.01 67 0.77
3:45 50 -7 0.00 3 -0.01 16:15 114 57 0.02 72 1.14
4:00 307 250 0.07 2 0.16 16:30 86 29 0.01 90 0.72
4:15 132 75 0.02 2 0.05 16:45 214 157 0.04 81 3.52
4:30 115 58 0.02 3 0.05 17:00 208 151 0.04 87 3.66
4:45 78 21 0.01 4 0.02 17:15 261 204 0.06 92 5.18
5:00 55 -2 0.00 5 0.00 17:30 254 197 0.05 86 4.68
5:15 96 40 0.01 7 0.08 17:45 304 247 0.07 93 6.35
5:30 57 0 0.00 6 0.00 18:00 429 372 0.10 86 8.84
5:45 124 67 0.02 7 0.13 18:15 467 410 0.11 87 9.85
6:00 103 46 0.01 14 0.17 18:30 446 389 0.11 84 9.03
6:15 73 16 0.00 13 0.06 18:45 418 361 0.10 92 9.18
6:30 61 4 0.00 21 0.02 19:00 430 373 0.10 86 8.91
6:45 63 6 0.00 21 0.04 19:15 410 353 0.10 83 8.13
7:00 80 24 0.01 20 0.13 19:30 498 441 0.12 70 8.58
7:15 80 23 0.01 20 0.13 19:45 355 298 0.08 85 7.05
7:30 90 33 0.01 24 0.22 20:00 456 399 0.11 79 8.79
7:45 80 23 0.01 37 0.23 20:15 439 382 0.11 76 8.06
8:00 59 2 0.00 37 0.03 20:30 347 290 0.08 75 6.01
8:15 56 -1 0.00 45 -0.01 20:45 444 387 0.11 90 9.68
8:30 65 8 0.00 49 0.10 21:00 480 423 0.12 74 8.65
8:45 82 25 0.01 53 0.37 21:15 460 403 0.11 67 7.49
9:00 174 117 0.03 46 1.50 21:30 303 246 0.07 66 4.52
9:15 133 76 0.02 62 1.30 21:45 194 137 0.04 61 2.34
9:30 143 86 0.02 66 1.56 22:00 204 147 0.04 50 2.05
9:45 68 11 0.00 54 0.16 22:15 83 26 0.01 50 0.36
10:00 208 151 0.04 80 3.33 22:30 62 5 0.00 38 0.05
10:15 241 184 0.05 73 3.73 22:45 66 9 0.00 31 0.08
10:30 247 190 0.05 59 3.11 23:00 69 12 0.00 34 0.11
10:45 154 97 0.03 64 1.73 23:15 80 24 0.01 27 0.18
11:00 99 42 0.01 71 0.82 23:30 82 26 0.01 24 0.17
11:15 81 24 0.01 74 0.49 23:45 79 22 0.01 25 0.15
11:30 118 61 0.02 63 1.06
Average
Travel
Time (Seconds)
(B)
Average
Vehicle
Delay (Seconds)
(C)
Total
Vehicle
Delay (Veh-Hours)
(F)
Total
Volume (Vehicles)
(E)
Average
Vehicle
Delay (Hours)
(D)
Time
(A)
Time Required to Travel Segment at Free
Flow Condition (seconds):
June 18 - 21, 2015