
Unit 1. Listening & Speaking Task 1 Task 2 Task 3 Task 4 Task 5.

42
SCCER-SoE Science Report 2018
Task 1.3
Title
Hydrothermal heat exploitation and storage
Projects (presented on the following pages)
Geoelectrical methods: new insights for geothermal energy prospection and explorationAurore Carrier, Matteo Lupi, Carole Nawratil de Bono, Federico Fischanger, Gianfranco Morelli, Julien Gance
Numerical Modelling of the Geneva Basin: from reservoir to geothermal simulationsMarine Collignon, Marion Alcanié, Øystein Klemetsdal, Olav Møyner, Halvard Nilsen, Knut-Andreas Lie, Antonio Rinaldi, Matteo Lupi
Modelling two-phase flow with boiling and gas partitioningAlina Yapparova, Dmitrii Kulik, George-Dan Miron, Thomas Driesner
Thermo-hydraulic testing of fractured rock mass for heat storage projectsReza Sohrabi, Benoît Valley
Investigating mineral reactions during high-temperature aquifer thermal energy storage (HT-ATES) in the Swiss Molasse BasinDB van den Heuvel, C Wanner, U Mäder, LW Diamond
HEATSTORELuca Guglielmetti, Andrea Moscariello, Thomas Driesner, Martin Saar, Benoit Valley, Reza Sohrabi, Larryn Diamond, Daniela van den Heuvel, Christoph Wanner, Carole Nawratil de Bono, Michel Meyer, Francois Martin, David Dupuy, PierVittorio Radogna, Energie Wasser Bern

SCCER-SoE Science Report 2018
43
SCCER-SoE Annual Conference 2018
Motivation-Energetic transition -> developing geothermal energy use-Previous geological, petrophysical and geophysical studies highlight high geothermal potential of Great Geneva Basin-To evaluate in situ parameters drillings could be made but are very expansive and do not provide 3D information-Deep ERT = cheaper alternative
Geoelectrical methods : new insights for geothermal energy prospection and exploration
Aurore Carrier, Matteo Lupi, Federico Fischanger, Gianfranco Morelli, Julien Gance
Discussion and Perspectives
-Well data : Molasse 10 to 50 Ohm.m and Cretaceous limestones 100 to 150 Ohm.m, drinkable water 10 to 20 Ohm.m-Low resistivity body correlated with high porosity/low density rocks-Improve acquisition geometry to increase sensitivity would need more time on the field-3D experiment with more receiver units-Bring key information for fluid flow modelling-Refine inversion using prior information
Results
Obtained data are processed and inverted using FullWave Viewer and ERTLab softwares provided by IRIS instruments and GeoStudy Astier.
ReferencesClerc, N., Rusillon, E., Moscariello, A., Renard, P., Paolacci, S., & Meyer, M. (2015). Detailed structural and reservoirrock typing characterisation of the Greater Geneva Basin, Switzerland, for geothermal resource assessment.Chelle-Michou, C., Do Couto, D., Moscariello, A., Renard, P., Rusillon, E., 630 2017. Geothermal state of the deep western alpine molasse basin, franceswitzerland. Geothermics.www.geomol.eu, www.geothermie2020.chSommaruga, A., Eichenberger, U., Marillier, F., 2012. Seismic Atlas of the Swiss Molasse Basin. Technical Report. Federal office of Topography, swisstopo.Morelli G., Fischanger F., Gualerzi D., Occhi M., Ranieri G., Santarato G., 2010. 3D Cross-hole Electrical ResistivityTomography to Control the Injection of Expanding Resins: A Case History in Venice (Italy). Proceedings of 16th European Meeting of Environmental Engineering Geophysics (Near Surface Geophysics), Zurich (CH), September 6-8, 2010.
Material
- Lighter Cableless- Freedom of geometry of acquisition-Independent receivers and injection units enable to adapat to field constrains- VIP 5000 to generate currentup to 5 Amps- 50 meters spacing between
electrodes- Continous acquisition
(handle electrical noise)
Figure 2: A) Schematic representation of acquisition dispositif for ERT acquisition using FullWavers. Both injection and receivers units record continuoulsy the current. All units are independant and are synchronized in time via GPS data.B) Raw data obtained for one injection (B1-A2 electrodes of injection) at receiver position 1 for the first channel. Signal amplitude on RX1 isthe order of 500 mV and chargeability curves can be obtained.
N S
S
S
N
N
E W
Line 1
Line 2
Line 3
Line 4
Z (m)X (m)
-Data are obtained up to 1km depth-Resistivity values are consistent with local geology and range between10 to 600 Ohm.m.-Observed resistivity variations within layers are consistent with previoulsyobserved faults
Figure 1: A) Topography of the investigated area and available data. Blue lines : previous active seismic lines, red lines: interpreted faults (GeoMol project), circle points: wells reaching top mesozoic unit, the color corresponds to the lithologicalunit reached (lithostratigraphiccolumn in panel B). Purple lines: deep ERT profiles performed for this study.
Figure 3: Resistivity (Ohm.m) profiles obtained for lines 1 to 4 (c.f. location figure 1). Data misfit crossplots are shown on the right of eachcross section. Lower coverage areas are below white lines.
Figure 4: Resistivityprofile compares to density (black), porosity (blue) and resistivity (purple) from borehole data and active seismicsfor line 1.

44
SCCER-SoE Science Report 2018
SCCER - SoE Annual Conference13th &14th September 2018
Numerical modelling of the Geneva Basin: From reservoir to geothermal simulationsM. Collignon1, M. Alcanie1, Ø. Klemetsdal2, O. Møyner2, H. Nilsen2, K.-A. Lie2, A. Rinaldi3, M.Lupi1
1. Department of Earth Sciences, University of Geneva, Rue de Maraîchers 13, CH-1205 Genève.2. Department of Applied Mathematics, SINTEF, Forskningsveien 1, NO-0373 Oslo 3. SED, ETH, Sonneggstrasse 5, Zürich
1. Introduction
Water flow
2. Numerical Model4. Heat Storage
1
2 3Water flow model
1: Rain infiltration 2: Percolation 3: Resurgence
Simulation 1 Simulation 3
280 290 300 310 320 330
280 290 300 310 320 330
280 290 300 310 320 330
280 290 300 310 320 330
280 290 300 310 320 330
280 290 300 310 320 330
280 290 300 310 320 330 280 290 300 310 320 330
t = 1 yr
t = 10 yr
t = 100 yr
t = 1000 yr
20 40 60 80 100 120 140 bar
20 40 60 80 100 120 140 bar
20 40 60 80 100 120 140 bar
20 40 60 80 100 120 140 bar
20 40 60 80 100 120 140 bar
20 40 60 80 100 120 140 bar
20 40 60 80 100 120 140 bar
20 40 60 80 100 120 140 bar
t = 1 yr
t = 10 yr
t = 100 yr
t = 1000 yr
Simulation 1 Simulation 3
Temperature (K)
3. “Satigny” type Model
Pressure (bar)
5. Further development
We are currently developping a Matlab-based ge-othermal module to investigate the geothermal potential and heat storage strategies in the Geneva Basin. This module is based on MRST (Matlab Reservoir Simulation Toolbox), which is an open source Matlab toolbox, developed by the Department of Applied Mathematics at Sintef, Oslo, Norway (Lie et al., 2016). MRST was initial-ly developed for oil and gas simulations but no thermal equations were implemented in the tool-box. Furthermore, an adequate formulation of the p,T-dependent parameters (i.e. density, viscosity, heat capacity, etc), required to produce realistic models for geothermal applications, is still lacking in MRST.
0 200 400 600 800 1000
60
70
80
0 200 400 600 800 1000
80
90
100
0 200 400 600 800 1000
70
80
90
0 200 400 600 800 1000
80
90
100
0 200 400 600 800 100066
68
70
0 200 400 600 800 100066
67
68
pt1
pt2
pt3
pt4
pt5
pt6
Temperature (K) Pressure (bar)
0 200 400 600 800 1000
306
307
308
0 200 400 600 800 1000
300
304
308
0 200 400 600 800 1000308
309
310
0 200 400 600 800 1000
307
308
309
0 200 400 600 800 1000
309
311
313
0 200 400 600 800 1000
285
295
305
pt1
pt2
pt3
pt4
pt5
pt6 Simu1Simu2Simu3Simu4
The model of Satigny is loosely based on the preliminary results of the ERT (electric resistivity tomography) done by Carrier et al. (cf. poster). The model dimensions are 5000x1x1000 m (2.5D) with a cell resolution of 10x1x10 m (i.e. 500x1x100 cells). The layers have a dip of ~6º, which is consistent with the regional formation dipping in the Geneva Basin. We considered a model with three layers that represent the quaternary, the molasse and the upper Jurassic.
To mimic the lateral inflow of water from the Jura Mountains, a pressure and associated temperature conditions were applied on the left side of the domain. We considered successively the case where the water is infiltrating in outcrop-ping Jurassic units (simu 1,2) and the case where infitration takes place in the outcropping molasse (simu 3,4).
Geothermal module (implemented) - single phase model (fully saturated) - two-immiscible phase model - p,T - dependent density equation for brine (Spivey et al., 2004).
Benchmark
Comparison between MRST and Tough2. Same initial setup and boundary conditions.
Physical domain: 2000x100x2000Mesh: 20x1x20Ztop = 1000 m Zbot = 3000 m Pinit = PhydTinit = 283 K
BCs: top: Ptop, bot: Pbot (hydro).face left side, P: 300 barno flux for T.
Pressure on the red faces (bar)
250
260
270
280
0 20 40 60 80 100 120 140 160 180 200 0 20 40 60 80 100 120 140 160 180 200
Pressure in the centre (bar)
204
208
212
216
Tough2MRST
Tough2MRST
Permeability (mD) Porosity (-)Top 0.0035 0.05Middle 5 (simu 1,2) - 10 (simu 3,4) 0.1Bottom 5 (simu 3,4) - 10 (simu 1,2) 0.1Fault1 10 0.1Fault1_l 0.0001 0.01Fault2 0.0001 0.01Fault3 10 0.1Fault4 10 0.1
100
150
200
250
300
50
0
0 200 300 400 500 600 700 800 900 1000100 100200
300
pt1 pt2pt3 pt4 pt5
0 200 300 400 500 600 700 800 900 1000100
0100
200300
100
150
200
250
300
50
0
pt1 pt2pt3 pt4 pt5
For the heat storage simulations, we considered a simple 3D bloc of 1000*300*300 m with a cell resolution of 10*10*10 m and three layers of different thickness. We impose a pressure and temperature conditions on the left and right faces of the model while all other faces have a no flux condition. A casi hydrostatic pressure and a thermal gradient of 32º/km, with a surface temperature of 293K are prescribed as initial conditions. To the left we applied a fixed pressure P = Phyd + 10 bars and a fixed temperature T = dT (initial temperature gradient). To the right we applied a fixed pressure P = Phydr and a fixed temperature T = dT. The aquifer has a permeability of 5 mD and a porosity of 0.1. The top and bottom layers have a permeability of 0.001 mD and a porosity of 0.05.
We considered a cycle of 10 years. From July to September, we inject hot water at a rate of 10-4 m3s-1 and a temperature of 350K in Well 1 (blue well), while we pump cold water from the reservoir at the same rate in well 2 (green well). Octo-ber to December is a period of rest, where nothing is injected nor pumped. From January to March, the water is exc-tracted from the reservoir in well 1, while cold water (290 K) is injected in well 2. Finally, April to June is a period of rest. In these two simulations, we investigated the effect of the aquifer thickness on the dissipation of heat in the aquifer. We monitor the temperature and pressure in 6 different points in the reservoir.
0
200
400
600
800
1000
1200
1400
1600
1800
2000
20001800
16001400
12001000
800600
400200
00
10050
We setup for the initial pressure conditions a ca-si-hydrostatic pressure (the density was kept con-stant to compute the initial pressure) and for the in-itial temperature conditions a thermal gradient of 32º/km and a surface temperature of 293 k. The infiltrated fluid has either a fixed temperature of 290 K or depth-dependent temperature, with a lower thermal gradient. In the second case we con-sidered that the fluid already warm up since its infil-tration in the Jura mountains.
The rapid economic development has triggered a constantly rising demand for energy. However, the limited amount of natural resources, as well as the global warming and pollution caused by industrial gas emissions and wastes urge to the development and production of renewable and sustainable energy. In addition to production, energy conserva-tion and storage became equally crucial to make use of excess energy and waste in future times of high energy demand.
Over the last two decades, several geological and geophysical studies were conducted in the Geneva Basin to inves-tigate its geothermal potential for energy production. A large data set is now available, including exploration wells, active seismic, gravity and geoelectrical data. If the production of electricity might be challenging due to the low geo-thermal gradient, the shallower horizons (within the first 2 km) are now investigated for seasonal heat storage or direct heat production for modern buildings whose heating systems do not require high temperature (> 80ºC). How-ever, if a static model of the Geneva Basin has already been proposed based on existing data, no flow modelling model exists. The Geneva Basin is located between two mountain ranges (the Alps and the Jura Moutains) and is drained by the Rhone River which takes its course in the Leman Lake. We here aim at developing a realistic large scale fluid flow model of the Geneva Basin that integrates the influence of the regional geology (i.e. infiltration from the Jura, lake, topography, faults, etc).
Clerc et al. 2015
References: Clerc N., Rusillon E., Moscariello A., Renard P., Paolacci S. and Meyer M., 2015, “Detailed Structural and Reservoir Rock Typing Characterization of the Greater Geneva Basin, Switzerland for Geothermal Resource Assessment”, World Geother-mal Congress 2015. Lie K.-A., 2016, “An introduction to reservoir simulation using MATLAB: User guide for the Matlab Reservoir Simulation Tool-box (MRST)”. SINTEF ICT, http://www.sintef.no/projectweb/mrst/.
Acknowledgment: Marine Collignon and Marion Alcanié are funded by GENERATE, SNF pro-ject (PYAPP2_166900, PI Matteo Lupi).
pt1
pt2
pt3
pt4 pt5 pt6
Fault1Fault2Fault3
Fault4
Top
Middle
Bottom
100
200
300
400
500
600
700
800
900
1000
1100
0
0 500 1000 1500 2000 2500 3000 3500 4000 4500 50000
10.5
Fault1_l
Model not to scale
Simu1 Simu2 Simu3 Simu4Top no flux P,T no flux P,T no flux P,T no flux P,TBottom no flux P,T no flux P,T no flux P,T no flux P,TLeft bottom only, fixed P,T bottom only, fixed P,T middle only, fixed P,T middle only, fixed P,T
P: Phyd + 10 bar. T: 290K P: Phyd + 10 bar. T: dT-5 P: Phyd + 10 bar. T: 290K P: Phyd + 10 bar. T: dT-5Right fixed P,T fixed P,T fixed P,T fixed P,T
P: Phyd. T: dT P: Phyd. T: dT P: Phyd. T: dT P: Phyd. T: dTFront no flux P,T no flux P,T no flux P,T no flux P,TBack (lake) few cells, fixed P,T few cells, fixed P,T few cells, fixed P,T few cells, fixed P,T
P: Phyd + 10 bar. T: 280K P: Phyd + 10 bar. T: 280K P: Phyd + 10 bar. T: 280K P: Phyd + 10 bar. T: 280K
Several implementations are still required in the Geothermal Module:
- 2 phase miscible model to account for phase transitions (in high-enthalpy systems) or exsolution of gas in water.- salt transport to account for convection cells that may develop in the aquifer during heat storage. - p,T - dependent formulations of the parameters such as density, viscosity, heat capacity.
Additional modules of MRST (some still under development) could be later coupled to the Geothermal Module to build up more realistic but complicated models that take into account the rock-fluid interaction, the dual porosity, or the ge-omechanics.
300
320
340
25
30
35
290
295
300
20
30
40
298.7
298.71
298.72
30
32
34
298.705
298.71
298.715
25
35
35
298.7095
298.71
298.7105
24
26
28
300
320
25
30
290
300
297.11
297.115
297.12
297.125
297.13
26
27
28
29
30
20
25
297.1
297.11
297.12
22
24
26
297.11
297.115
297.12
20
22
24
0 2 4 6 8 10
0 2 4 6 8 10
0 2 4 6 8 10 0 2 4 6 8 10
0 2 4 6 8 10
0 2 4 6 8 10
0 2 4 6 8 10
0 2 4 6 8 10
0 2 4 6 8 10
0 2 4 6 8 10
pt1
pt2
pt3
pt4
pt5
pt1
pt2
pt3
pt4
pt5

SCCER-SoE Science Report 2018
45
SCCER-SoE Annual Conference 2018
Motivation: Geothermal systems
Magma-driven, high enthalpy geothermal systems are currently the only type of geothermal reservoirs that is routinely utilized for electrical power generation. The transient evolution of geochemical processes in the subsurface of these systems has remained elusive because direct observation is hampered by the extreme conditions in the boiling reservoir. Fig. 1. Schematic section of a volcanic geothermal system depicting the origin, interaction, and possible evolution of fluids. (Arnorsson et al., 2007).
Modelling two-phase flow with boiling and gas partitioningA. Yapparova (ETH Zurich), D.A. Kulik (PSI), G.D. Miron (PSI), T. Driesner (ETH Zurich)
Results and Discussion
Volatile species (CO2, H2S, CH4, H2) preferentially partition into the vapour phase. An increase of CO2 concentration ahead of the two-phase zone has a major effect on the pH of a boiling solution. The simulation predicts a narrow highly acidic zone that may develop at the border between the vapour-dominated and boiling/condensation zones, due to the specifics of HCl partitioning.
Fig. 3. Molality concentrations of CO2, H2S, CH4 and H2 in vapour and liquid phases after 300 years of the RTM simulation. Note the logarithmic scale on the right.
Fig. 4. Solution pH, liquid saturation, molality of HCl in vapour and liquid phases, and total chlorine molarity in liquid after 300 years of the RTM simulation.
1D Model Setup
Hot low-salinity vapour at 300°C, 61 bar is injected from the left into the warm 5 wt% NaCl liquid at 200°C, 30 bar. Initial fluid composition is representative of a natural hydrothermal fluid.A boiling/condensation zone develops in the middle part of the model, volatiles partition between the liquid and vapour phases.
Fig. 2. Temperature, pressure, liquid saturation and aqueous fluid salinity after 300 years of the RTM simulation
References1) Arnorsson, S., Stefansson, A., Bjarnason, J.O., Fluid-Fluid interactions in geothermal
systems. Reviews in Mineralogy & Geochemistry (2007) 65, 259-312.2) Driesner, T., 2007. The system H2O-NaCl. Part II: Correlations for molar volume,
enthalpy, and isobaric heat capacity from 0 to 1000C, 1 to 5000bar, and 0 to 1 XNaCl. Geochimica et Cosmochimica Acta 71 (20), 4902–4919.
3) Driesner, T., Heinrich, C. A., 2007. The system H2O NaCl . Part I : Correlation formulae for phase relations in temperature pressure composition space from 0 to 1000C , 0 to 5000 bar , and 0 to 1 XNaCl. Geochimica et Cosmochimica Acta 71, 4880–4901.
4) Kulik, D. A., Wagner, T., Dmytrieva, S. V., Kosakowski, G., Hingerl, F. F., Chudnenko, K. V., Berner, U. R., 2013. GEM-Selektor geochemical modeling package: Revised algorithm and GEMS3K numerical kernel for coupled simulation codes. Computational Geosciences 17 (1), 1–24.
5) Weis, P., Driesner, T., Coumou, D., Geiger, S., 2014. Hydrothermal, multi-phase convection of H2O-NaCl fluids from ambient to magmatic temperatures: A new numerical scheme and benchmarks for code comparison. Geofluids 14 (3), 347–371.
Methods
The CSMP++GEM reactive transport code:
• Control volume finite element method (CVFEM) to solve PDEs for two-phase flow and heat transport in terms of pressure, enthalpy and salinity on unstructured grids (Weis et al., 2014).
• Accurate thermodynamic representation of fluid properties –Equation of state for a H2O-NaCl system (Driesner&Heinrich, 2007; Driesner, 2007).
• Chemical equilibrium calculations using the Gibbs energy minimisation method (GEM), implemented within the GEMS3K code (Kulik et al.,2013).
• Sequential Non-Iterative Approach (SNIA) for transport-chemistry coupling for fast reactive transport calculations (compared to SIA and fully implicit methods).
Conclusion
The CSMP++GEM reactive transport modelling code represents a powerful tool for studying complex natural systems, having access to state of the art heat flow and chemical models, and allows us to explore the interplay of chemical reactions and two-phase transport in ore forming and high-enthalpy hydrothermal systems.

46
SCCER-SoE Science Report 2018
Summer Fall Winter Spring
Short term storage Short term storage
Seasonalstorage Hours
Bal
ance
of a
vaila
ble
was
tehe
at a
nd h
eat d
eman
d [M
W]
SCCER-SoE Annual Conference 2018
Thermo-Hydraulic Testing of FracturedRock Mass for Heat Storage Projects
Reza Sohrabi & Benoît ValleyCentre for Hydrogeology and Geothermics (CHYN), Laboratory of Geothermics and Reservoir Geomechanics, University of Neuchâtel
Thermo-elastic fracture closureHot fluid injection will induce a thermo-mechanical response of the rockthat in turn can impact the hydraulic characteristic of the aquifer. Forexample, thermo-elastic rock expansion could induce fracture closure(Figure 4) and thus the transmissivity of the reservoir will decrease. It isrequired to measure the mechanical conditions in the reservoir (e.g.stress state) in order to assess the impact of such effects on an aquiferthermal storage system.
ReferencesQuiquerez et al. (2015). Réseaux thermiques multi-ressourcesefficients et renouvelables: Etude de cas de la connexion des réseauxthermiques CADIOM (chaleur fatale) et CADSIG (gaz) à Genève etperspectives d’évolution. SIG, Genève.
ApproachThe approach in this project is to use numerical simulations and in-situ well tests in order to:
1) Define the relevant key aquifer parameters that must bedetermined to provide reliable heat storage design in fracturedaquifers;
2) Propose well testing approaches (single well configuration) thatcan be deployed to estimate these key aquifers parameters;
3) Assess the feasibility of these testing approaches throughnumerical simulations and field tests;
4) Provide testing protocols, simplified test design guidelines andapplication examples in order to support the acceptance of thesetesting approaches as an industry standard for heat storage projectdevelopment in fractured aquifers.
The fundamental assumption of this project is that standard well testsused to determine aquifer transmissivity are not sufficient to generatereliable design parameters for heat storage projects. In the followingwe present initial ideas concerning the key processes and parametersthat need to be determined and possible single well test approachesthat could be used to estimate these parameters.
Motivation and objectivesSpace heating demand is highly seasonal while heat production fromindustrial processes is regular throughout the year. It would be efficientto store excess heat in summer and recover it during the cold season(Figure 1). Medium depth aquifers that are not exploited for drinkingwater are a target for heat storage. It requires however a knowledgeof characteristics of the aquifers that cannot be derived from standardwell tests. The objectives of this research is to provide well testingprotocols that are adapted for heat storage projects in fracturedaquifers at early project stage, i.e. when a single well is available.
Figure 1: Opportunity for waste heat storage illustrate by heat availability anddemand balance in Geneva, after Quiquerez et al. 2015.
(b)(a) (d)( )c
Fracture closure dueto thermo-elasticrock expansion
Hot fluid injection
Heat transport byadvection and conduction
wel
lbor
e
natural fracture
Ambient flowNatural flow occurs in aquifers and it is essential to characterise it forthe design of a heat storage system. If ambient flow is too vigorous, thedeployment of a heat storage system can even be precluded. In asingle well configuration, a dilution test can be used to estimateambient flow. A dilution test consist of mixing a tracer in the well volumeand to measure at what rate the tracer is leaving the well, captured bythe ambient flow (Figure 2).
Figure 2: Schematic representation of ambient flow occurring in an aquifer and its impact on heat storage.
Heat exchanger geometryThe structures in the aquifer will control the flow geometry (Figure 3).At same bulk aquifer transmissivity, the flow geometry can differsignificantly. This will have a large impact on heat exchangeproperties of the reservoir. Push-pull tests of hot water or of tracersmix with variable reactivity with the in-situ rocks can be used toquantify the exchange capacity of a reservoir, which reflect the heatexchanger geometry.
Figure 3: Schematic of various possible heat exchanger geometry. a) dominated byfew large features; b) distributed and well connected network of features; c)channelling on planar features and d) conduits formed by karstic processes.
Figure 4: Schematic representation of fracture closure in response to hot water injection.
AcknowledgementsThese initial ideas will be tested using numerical simulations and in-situ testing in the framework of the European Project Heatstore. It issupported by the Swiss Federal Office of Energy SFOE and isdeveloped in collaboration with Industrial Services of Geneva (SIG).
Swiss Federal Office of Energy
SCCER-SoE Science Report 2018
47
SCCER-SoE Annual Conference 2018
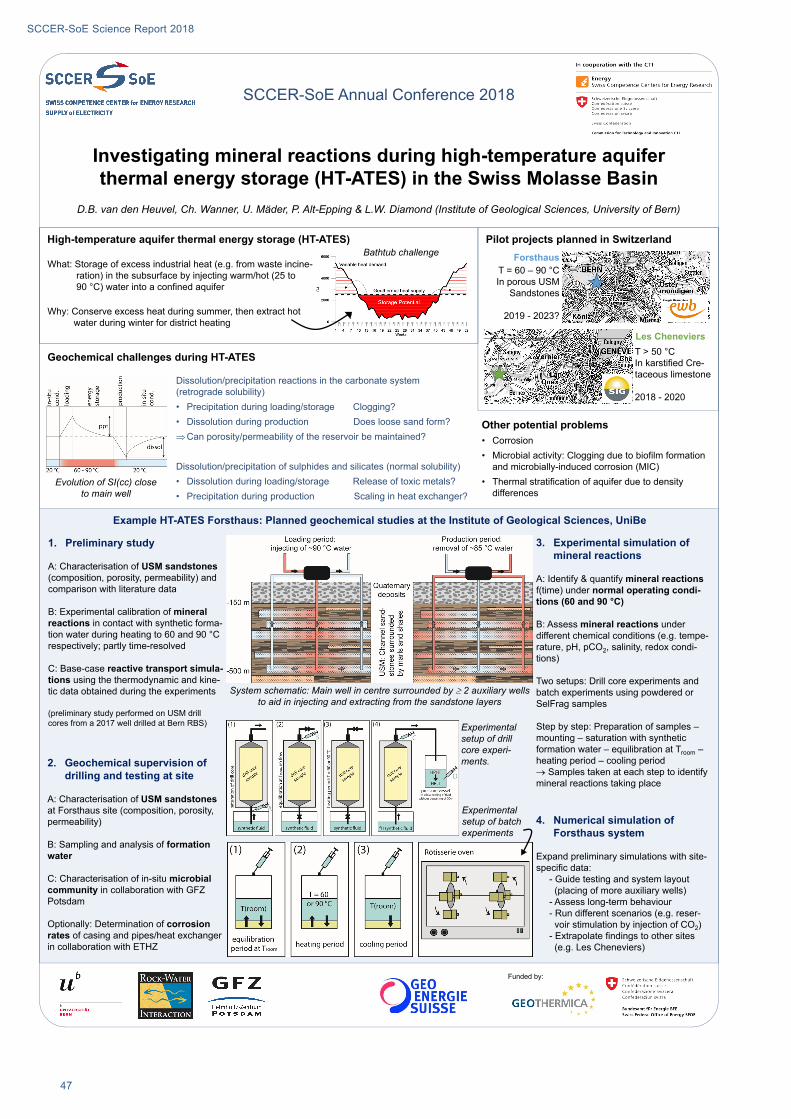
Investigating mineral reactions during high-temperature aquifer thermal energy storage (HT-ATES) in the Swiss Molasse Basin
D.B. van den Heuvel, Ch. Wanner, U. Mäder, P. Alt-Epping & L.W. Diamond (Institute of Geological Sciences, University of Bern)
What: Storage of excess industrial heat (e.g. from waste incine-ration) in the subsurface by injecting warm/hot (25 to90 °C) water into a confined aquifer
Why: Conserve excess heat during summer, then extract hot water during winter for district heating
Les Cheneviers
Pilot projects planned in SwitzerlandForsthaus
T > 50 °CIn karstified Cre-taceous limestone
2018 - 2020
T = 60 – 90 °CIn porous USM
Sandstones
2019 - 2023?
Other potential problems• Corrosion• Microbial activity: Clogging due to biofilm formation
and microbially-induced corrosion (MIC) • Thermal stratification of aquifer due to density
differences
High-temperature aquifer thermal energy storage (HT-ATES)
Geochemical challenges during HT-ATES
Example HT-ATES Forsthaus: Planned geochemical studies at the Institute of Geological Sciences, UniBe
1. Preliminary study
A: Characterisation of USM sandstones (composition, porosity, permeability) and comparison with literature data
B: Experimental calibration of mineral reactions in contact with synthetic forma-tion water during heating to 60 and 90 °C respectively; partly time-resolved
C: Base-case reactive transport simula-tions using the thermodynamic and kine-tic data obtained during the experiments
(preliminary study performed on USM drill cores from a 2017 well drilled at Bern RBS)
Dissolution/precipitation reactions in the carbonate system (retrograde solubility)• Precipitation during loading/storage Clogging?• Dissolution during production Does loose sand form?Can porosity/permeability of the reservoir be maintained?
Dissolution/precipitation of sulphides and silicates (normal solubility)• Dissolution during loading/storage Release of toxic metals?• Precipitation during production Scaling in heat exchanger?
Evolution of SI(cc) closeto main well
System schematic: Main well in centre surrounded by 2 auxiliary wells to aid in injecting and extracting from the sandstone layers
Bathtub challenge
2. Geochemical supervision of drilling and testing at site
A: Characterisation of USM sandstones at Forsthaus site (composition, porosity, permeability)
B: Sampling and analysis of formation water
C: Characterisation of in-situ microbial community in collaboration with GFZ Potsdam
Optionally: Determination of corrosion rates of casing and pipes/heat exchanger in collaboration with ETHZ
Experimental setup of drill core experi-ments.
Experimental setup of batch experiments
Funded by:
3. Experimental simulation of mineral reactions
A: Identify & quantify mineral reactions f(time) under normal operating condi-tions (60 and 90 °C)
B: Assess mineral reactions under different chemical conditions (e.g. tempe-rature, pH, pCO2, salinity, redox condi-tions)
Two setups: Drill core experiments and batch experiments using powdered or SelFrag samples
Step by step: Preparation of samples –mounting – saturation with synthetic formation water – equilibration at Troom –heating period – cooling period Samples taken at each step to identify mineral reactions taking place
4. Numerical simulation of Forsthaus system
Expand preliminary simulations with site-specific data:
- Guide testing and system layout (placing of more auxiliary wells)
- Assess long-term behaviour- Run different scenarios (e.g. reser-voir stimulation by injection of CO2)
- Extrapolate findings to other sites (e.g. Les Cheneviers)

48
SCCER-SoE Science Report 2018
SCCER-SoE Annual Conference 2018
Luca Guglielmetti*, Andrea Moscariello*, Thomas Driesner#, Martin Saar#, Benoit Valley-, Reza Sohrabi-, Larryn Diamond=, Daniela van den Heuvel=, Christoph Wanner=, Carole Nawratil de Bono^, Michel Meyer^, Francois Martin^, David Dupuyû, PierVittorio Radognaû, Energie Wasser Bern+
* Department of Earth Sciences, University of Geneva – Rue des Maraichers 13, CH-1205 Geneva # Department of Earth Sciences, ETH Zurich - Sonneggstr. 5, CH-8092 Zurich
-Centre fro Hydrogeology and Geothermics, University of Neuchatel Ð Rue Emile Argand 11, CH-2000 Neuchatel =Rock–Water Interaction Group, Institute of Geological Sciences, University of Bern - Baltzerstrasse 3, CH-3012 Bern ^Services Industriels de Geneve – Chemin Chateau-Bloch 2 – CH1219 Le Lignon
ûGeo2X - Rue du centre 6, CH-1377 – Oulens-sous-Echallens +
Objec&ves:• De-riskandprovethefeasibilityofdeep(>300m)high-temperature(25-130°C)aquiferthermalenergystorage(HT-ATES)
•Characterizethegeological,hydrogeological,andhydro-chemicalseLngs•DevelopatoolboxtopredictandopNmisethesubsurfacedynamics,performancesandeconomics•DesignandimplementpilotdemonstraNonprojects•Monitortheperformance•DeterminethecurrentandrequiredstakeholderengagementandadapttheregulatorycondiNons•Deliverafast-trackmarketuptakefromdemonstraNontocommercialdeployment
HEATSTORE
50%ofthetotalenergyconsumedinSwitzerlandisneededtosupplyheat.
Householdsandservicesuseabout92%oftheirtotalenergyneedsfor
heaNngapplicaNonsLet‘sconvertwasteheatintoa
resource
UndergroundHeatStorageprovidesseveralsoluNonstoopNmizethewholeenergysystemandreducetheCO2footprint
byreplacingfossilfuels
InSwitzerlandhundredsofindustrialacNviNescanbesuitableforthistechnologyaddifferentscalesofapplicaNon
EnergyStorageisoneofthemostimportantkeyelementswithintheSwissFederalEnergyStrategyinordertomeettheCO2emissionreduc&ontargets.Regulatory
Framework
BusinessScenarios
SubsurfaceCharacterizaNo
n
PilotImplementaNon
GENEVAPilotSite
BERNPilotSite