TAS Dynamic Profile™ (“TAS Boxes”) - TAS Market Profile · PDF fileTAS...
6
TAS Dynamic Profile™ (“TAS Boxes”) The TAS Boxes™ offer a dynamic representation of developing commercial balance areas. The “red line” represents the upper resistance boundary of the balance area; the “blue line” represents the lower support boundary; and the “black line” (“white line” on some platforms) represents the Point of Control (POC). The indicator setup screen for TAS Boxes™ includes the three inputs of MinSignal_123, Length, and MapLength: MinSignal_123: measures how established the commercial interest creating the balance area must be to create a new TAS Box™. Stated another way, this input is a measure of the “strength” of the box. Length: takes into consideration the relative “momentum” behind the move and how extended the move has before a new TAS Box will appear. MapLength: specifies the number of bars of data used to create the parameters of the TAS Box. Basically, the first two inputs determine how often a new TAS Box™ will appear – the higher the input numbers the less often and harder it is to establish a new box, and vice versa. The last input simply determines how much data is included in the calculation of the new TAS Box™. We recommend using either 2-14-7 or 3-4-50 as your standard inputs – these settings work well with any tradable instrument, provided sufficient liquidity exists. TAS Boxes™ can be displayed on a chart of any time frame (e.g. 1-minute, 5-minute, 20-minute, daily, weekly, etc.). Boxes displayed on longer time frames designate more significant balance areas and can be used to locate higher probability entries. Boxes on shorter time frames can be used to identify if the tradable instrument is currently in balance or breaking out, and pinpoint entries accordingly.
Transcript of TAS Dynamic Profile™ (“TAS Boxes”) - TAS Market Profile · PDF fileTAS...
TAS Dynamic Profile™ (“TAS Boxes”)The TAS Boxes™ offer a dynamic representation of developing commercial balance areas. The “red line” represents the upper resistance boundary of the balance area; the “blue line” represents the lower support boundary; and the “black line” (“white line” on some platforms) represents the Point of Control (POC).
The indicator setup screen for TAS Boxes™ includes the three inputs of MinSignal_123, Length, and MapLength:
MinSignal_123: measures how established the commercial interest creating the balance area must be to create a new TAS Box™. Stated another way, this input is a measure of the “strength” of the box.
Length: takes into consideration the relative “momentum” behind the move and how extended the move has before a new TAS Box will appear.
MapLength: specifies the number of bars of data used to create the parameters of the TAS Box.
Basically, the first two inputs determine how often a new TAS Box™ will appear – the higher the input numbers the less often and harder it is to establish a new box, and vice versa. The last input simply determines how much data is included in the calculation of the new TAS Box™. We recommend using either 2-14-7 or 3-4-50 as your standard inputs – these settings work well with any tradable instrument, provided sufficient liquidity exists.
TAS Boxes™ can be displayed on a chart of any time frame (e.g. 1-minute, 5-minute, 20-minute, daily, weekly, etc.). Boxes displayed on longer time frames designate more significant balance areas and can be used to locate higher probability entries. Boxes on shorter time frames can be used to identify if the tradable instrument is currently in balance or breaking out, and pinpoint entries accordingly.

The TAS Boxes™ are used to identify low risk, high probability areas to trade:
> When price is trading within the boundaries of a normal to wide range commercial balance area, in general, we should look for entries around the support or resistance areas provided by the blue and red box lines with profit targets around the POC or opposite boundary.
• What constitutes a normal range for a TAS Box™ is relative based on the time frame being used for the chart (e.g. a range of anywhere from 2.5 to 5.5 points would be considered a normal range for 1 to 5-minute charts).
• When taking trades at both the upper and lower boundaries, we like to see the POC near the middle of the box’s range. This is known as a “symmetrical box.”
• If the POC is plotted tightly against either the blue or red line, we refer to this as forming a “wall” and anticipate stronger commercial interest providing support or resistance in this area.
• If the box appears as part of an overall trending move, we might try to establish an entry in the direction of the trend around the POC.
• When trading above or below the current box, price is said to be in breakout.
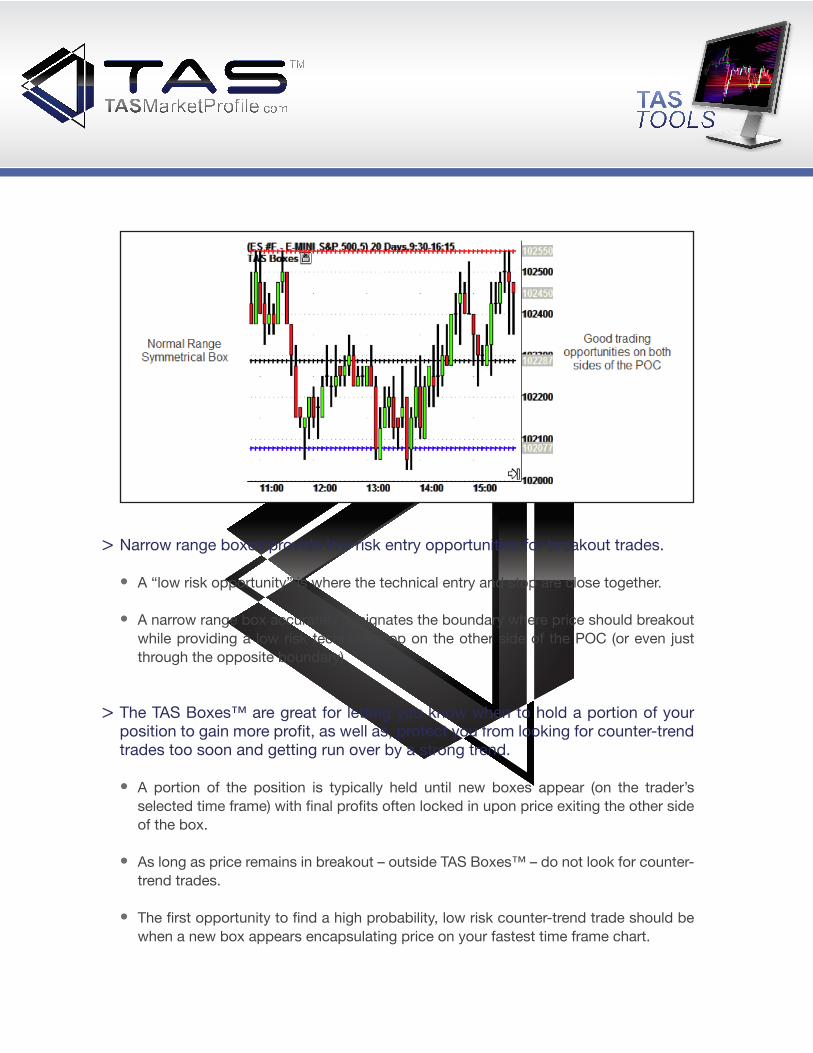
> Narrow range boxes provide low risk entry opportunities for breakout trades.
• A “low risk opportunity” is where the technical entry and stop are close together.
• A narrow range box accurately designates the boundary where price should breakout while providing a low risk technical stop on the other side of the POC (or even just through the opposite boundary).
> The TAS Boxes™ are great for letting you know when to hold a portion of your position to gain more profit, as well as, protect you from looking for counter-trend trades too soon and getting run over by a strong trend.
• A portion of the position is typically held until new boxes appear (on the trader’s selected time frame) with final profits often locked in upon price exiting the other side of the box.
• As long as price remains in breakout – outside TAS Boxes™ – do not look for counter-trend trades.
• The first opportunity to find a high probability, low risk counter-trend trade should be when a new box appears encapsulating price on your fastest time frame chart.
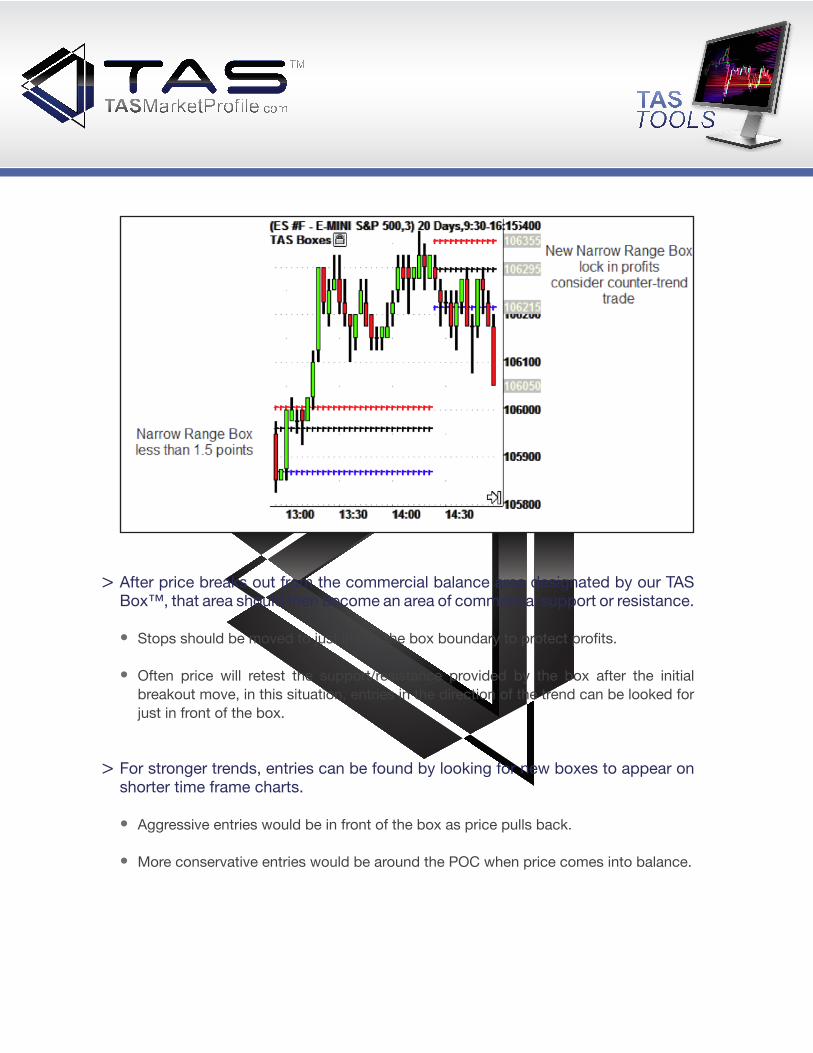
> After price breaks out from the commercial balance area designated by our TAS Box™, that area should then become an area of commercial support or resistance.
• Stops should be moved to just inside the box boundary to protect profits.
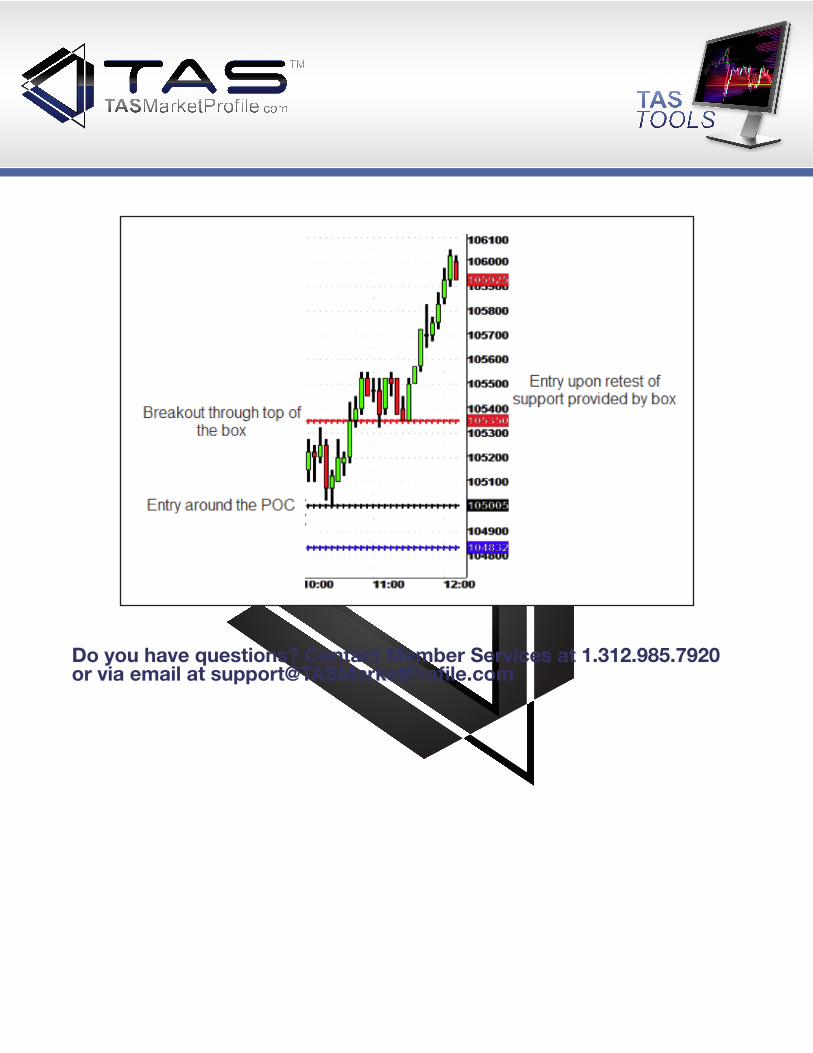
• Often price will retest the support/resistance provided by the box after the initial breakout move, in this situation, entries in the direction of the trend can be looked for just in front of the box.
> For stronger trends, entries can be found by looking for new boxes to appear on shorter time frame charts.
• Aggressive entries would be in front of the box as price pulls back.
• More conservative entries would be around the POC when price comes into balance.
Do you have questions? Contact Member Services at 1.312.985.7920 or via email at [email protected]
RISk DISCLOSuRe: TheRe IS A RISk Of LOSS In TRADIng fuTuReS COnTRACTS AnD COMMODITy OPTIOnS. ThIS RISk CAn Be SuBSTAnTIAL AnD TheRefORe InveSTORS ShOuLD CARefuLLy COnSIDeR TheIR fInAnCIAL SuITABILITy PRIOR TO TRADIng. InveSTORS MuST fuLLy unDeRSTAnD The RISkS InvOLveD AnD MuST ASSuMe The ReSPOnSIBILITy fOR The ReSuLTS. PAST PeRfORMAnCe IS nOT neCeSSARILy InDICATIve Of fuTuRe PeRfORMAnCe. In nO evenT ShOuLD The COnTenT Of ThIS WeBSITe Be COnSTRueD AS An exPReSS OR IMPLIeD PROMISe, guARAnTee OR IMPLICATIOn By OR fROM, TASMARkeTPROfILe.COM OR ITS AffILIATeS, ThAT yOu WILL PROfIT OR ThAT LOSSeS CAn OR WILL Be LIMITeD In Any MAnneR WhATSOeveR. InfORMATIOn PROvIDeD In ThIS DOCuMenT AnD On The WeBSITe IS InTenDeD SOLeLy fOR InfORMATIve PuRPOSeS AnD IS OBTAIneD fROM SOuRCeS BeLIeveD TO Be ReLIABLe. InfORMATIOn IS In nO WAy guARAnTeeD AnD IS PROvIDeD AS A COuRTeSy OnLy. TheRe ARe nO RefunDS On PAID SuBSCRIPTIOnS AnD MeMBeRS ARe SOLeLy ReSPOnSIBLe fOR CAnCeLLIng ReCuRRIng SuBSCRIPTIOnS A MInIMuM Of 3 DAyS PRIOR TO The ReneWAL BILLIng DATe AS OuTLIneD In The fuLL TeRMS Of uSe On The WeBSITe.
Copyright © 2012 TASMarketProfile.com, All Rights Reserved