Targets Classification on Multispectral Images using ...
6
American Journal of Physics and Applications 2015; 3(3): 86-91 Published online April 24, 2015 (http://www.sciencepublishinggroup.com/j/ajpa) doi: 10.11648/j.ajpa.20150303.14 ISSN: 2330-4286 (Print); ISSN: 2330-4308 (Online) Targets Classification on Multispectral Images using Connectionists Methods Samir Zeriouh, Mustapha Boutahri, Said El Yamani, Ahmed Roukhe Information Optronic Treatment Team, Atomic, Mechanical, Photonic and Energy Laboratory, Faculty of Science, Moulay Ismail University, Zitoune, Meknès, Morocco Email address: [email protected] (S. Zeriouh) To cite this article: Samir Zeriouh, Mustapha Boutahri, Said El Yamani, Ahmed Roukhe. Targets Classification on Multispectral Images using Connectionists Methods. American Journal of Physics and Applications. Vol. 3, No. 3, 2015, pp. 86-91. doi: 10.11648/j.ajpa.20150303.14 Abstract: Identification of targets on remote sensing images depends mainly on the databases representing different classes. In this context, this paper proposes a connectionist system using a two-dimensional Kohonen self-organizing map to build a database of some identified targets on a multi-band satellite image. After an enhancing process, essentially based on a non-linear filtering, the system performs a non-supervised classification of a reference image in order to extract the sequence of samples of the reflectance coefficients related to the desired targets. This classification will be used later for automatic extraction of these targets on other stages. Keywords: Multispectral Image, Classification, Identification, Artificial Neural Networks, Self-Organizing Map 1. Introduction The use of topographic maps remains of paramount importance in several areas such as agriculture, hydrography and geography. Their usefulness is also necessary and of high importance in the military field. Indeed, the movement of ground vehicles and gear in unknown terrain, especially in war, is generally based on conventional techniques of topographic maps readings, which provide a global view of the field to cross (Fig. 1). However these maps do not take into account the nature of soil and all the changes that can occur on the maneuver field due to climate and human factors (moist, flooded areas, wetlands and woodlands.). The topographic data become less reliable and could therefore affect the progress of the mobility means on the battlefield. As part of the defense sector (military intelligence), our job is specifically to classify areas with barriers to mobility, such as swamps, dense forests and surface water, on a reference portion of land. This will be used for detection and subsequent identification on satellite images of other regions. On a multispectral image of the Kenitra region (Gharb), and after applying a nonlinear median filter type for the purpose of improvement, we operated a non-supervised Artificial Neural Networks (ANNs) classification. Subsequently, by comparing the data to the terrain, we extract the spectral signatures of different regions and points representing the existence of forests, surface water or wetlands. This allowed us to build diverse databases of different aspects of interest. Figure 1. Topographic map of Kenitra region, scale: 1/50 000. 2. Preprocessing of the Reference Image To build our database, we used a satellite image of eight
Transcript of Targets Classification on Multispectral Images using ...

American Journal of Physics and Applications 2015; 3(3): 86-91
Published online April 24, 2015 (http://www.sciencepublishinggroup.com/j/ajpa)
doi: 10.11648/j.ajpa.20150303.14
ISSN: 2330-4286 (Print); ISSN: 2330-4308 (Online)
Targets Classification on Multispectral Images using Connectionists Methods
Samir Zeriouh, Mustapha Boutahri, Said El Yamani, Ahmed Roukhe
Information Optronic Treatment Team, Atomic, Mechanical, Photonic and Energy Laboratory, Faculty of Science, Moulay Ismail University,
Zitoune, Meknès, Morocco
Email address: [email protected] (S. Zeriouh)
To cite this article: Samir Zeriouh, Mustapha Boutahri, Said El Yamani, Ahmed Roukhe. Targets Classification on Multispectral Images using Connectionists
Methods. American Journal of Physics and Applications. Vol. 3, No. 3, 2015, pp. 86-91. doi: 10.11648/j.ajpa.20150303.14
Abstract: Identification of targets on remote sensing images depends mainly on the databases representing different classes. In
this context, this paper proposes a connectionist system using a two-dimensional Kohonen self-organizing map to build a
database of some identified targets on a multi-band satellite image. After an enhancing process, essentially based on a non-linear
filtering, the system performs a non-supervised classification of a reference image in order to extract the sequence of samples of
the reflectance coefficients related to the desired targets. This classification will be used later for automatic extraction of these
targets on other stages.
Keywords: Multispectral Image, Classification, Identification, Artificial Neural Networks, Self-Organizing Map
1. Introduction
The use of topographic maps remains of paramount
importance in several areas such as agriculture, hydrography
and geography. Their usefulness is also necessary and of high
importance in the military field. Indeed, the movement of
ground vehicles and gear in unknown terrain, especially in war,
is generally based on conventional techniques of topographic
maps readings, which provide a global view of the field to
cross (Fig. 1). However these maps do not take into account
the nature of soil and all the changes that can occur on the
maneuver field due to climate and human factors (moist,
flooded areas, wetlands and woodlands.). The topographic
data become less reliable and could therefore affect the
progress of the mobility means on the battlefield.
As part of the defense sector (military intelligence), our job
is specifically to classify areas with barriers to mobility, such
as swamps, dense forests and surface water, on a reference
portion of land. This will be used for detection and subsequent
identification on satellite images of other regions.
On a multispectral image of the Kenitra region (Gharb), and
after applying a nonlinear median filter type for the purpose of
improvement, we operated a non-supervised Artificial Neural
Networks (ANNs) classification. Subsequently, by comparing
the data to the terrain, we extract the spectral signatures of
different regions and points representing the existence of
forests, surface water or wetlands. This allowed us to build
diverse databases of different aspects of interest.
Figure 1. Topographic map of Kenitra region, scale: 1/50 000.
2. Preprocessing of the Reference Image
To build our database, we used a satellite image of eight

American Journal of Physics and Applications 2015; 3(3): 86-91 87
bands of Kenitra region, taken by an ETM+1 sensor on board
the Landsat-7 satellite on February 25th, 2011. We excluded
the panchromatic band (Number. 8) since it has a wavelength
bands covering numbers 2, 3 and 4 (green, blue and
near-infrared). A colored composition of three strips (393x473
window) of the aforesaid image is shown in Figure .2.
Figure 2. Colored composition of three Landsat 7 bands of Kenitra region (a-
Visible spectrum: combination 1, 2 and 3. b- Infrared domain: combination
4, 5 and 7)
The choice of this region is based on the fact that it
encompasses wetlands, a river, wooded plots of land and part
of the sea. This aspect allows for consistent classes matching
our targets and therefore facilitates their extraction.
Upon acquisition of such images, a quality degradation is
often observed due to some factors usually related to
interactions between the acquisition system, air and soil
1 High resolution multispectral scanning Radiometer providing radiation in the
visible and infrared eight distinct bands. It is an improved version of the sensor
Thematic Mapper (TM), which provides increased spatial resolution thermal
infrared band (band 6), improved radiometric calibration and addition of a
panchromatic band. It is designed to collect and detect the radiation of earth in a
185 km band wide.
behavior [1]. In our study, and for effective distinction of
classes, we are interested in the speckle due to random
interference between the waves at the surface reflection [2].
The origin of this noise (salt and pepper) is in the infinity of
elementary reflectors composing a resolution cell. He then
takes the form of a multiplicative noise where the intensity
measured in the respective resolution cell (i,j) is the product of
radar reflectivity and a noise-related term s.
( ) ( ) ( ), , * ,I i j r i j s i j= (1)
In order to eliminate these cumulative noise on different
bands, we conducted a non-linear filtering of the seven bands,
with a median filter [3]. This allowed us not only to attenuate
the high frequencies (isolated pixels), but also reduce the
uniform or Gaussian additive noise while preserving edges
(Fig. 2) [4].
The principle of this filter is to move an odd-sized window
on the image carrier, and then to replace the central pixel with
the median value of the pixels.
Figure 3. Band n 1 of the reference image (Kenitra region)(a- Pre-processing.
b- Post-processing using 3*3 window).
88 Samir Zeriouh et al.: Targets Classification on Multispectral Images using Connectionists Methods
3. Non-Supervised Classification
To extract the spectral signatures [5] of different targets on
the reference image, we proceeded firstly to a non-supervised
classification and the confrontation of the chosen classes with
those of the reference field.
To do this, we used a connectionist method based on
Kohonen Self Organizing Map (SOM) [6,7]. This method
allowed to make an effective classification despite the
influence of the physical parameters, including the
atmosphere, the sensor configuration and topography. These
factors seriously affect the quality of the classification in the
case of conventional approaches (maximum likelihood,
ISODATA, etc.) [8].
SOM ANNs maps are mainly used for clustering and
non-linear projection of the data [9,10].
3.1. Network Architecture
The network built from classifying spectral data of the
image studied is a two-dimensional self-organizing map
consisted of nine neurons (3 * 3) (Figure .3).
The choice of this dimension is due to the fact that nine
classes are sufficient and effective to distinguish four targets.
In effect, a larger dimension gives more classes and makes
therefore the distinction between classes very difficult on
terrain. Also, a smaller size will not provide enough of classes
among which we can choose our targets.
The input vector E = [e1; e2; e3; e4; e5; e6; e7] represents
the standard reflectance of the seven bands characterizing a
voxel, and is linked to all neurons. (ei is the vector of
393*473 pixels of the band i).
External connections of the neuron i with the input vector E
are materialized by a synaptic weight vector Pi = [pi1 pi2 …pi7],
with 1,...,9i = .
Similarly, neurons of the map are interconnected (internal
connections) and their connection weights Wij are expressed
by a Gaussian "Mexican hat" [11]. The feature of these
interactions is that they depend on the distance between the
neurons.
Figure 4. Architecture of the proposed SOM (3*3).
The activation function of the network used for the
evaluation of the output is a sigmoid f :
( ) ( )1
x
x
ef x
e
α
αβ = +
(2)
Since the manipulated data is normalized, we take and we
shall have:
( )1
x
x
ef x
e=
+ (3)
The output Si of the neuron i at time t is then expressed as
follows:
( ) ( )( )
. . 1i ik k ij j
k j
i j
S t f p E w S t
≠
= + −
∑ ∑ (4)
It is based on the weighted sum of the inputs ∑ pik . Ek and
the weighted sum of the outputs of neighboring neurons at
time t: ∑ wij . Sj (t-1).
3.2. Learning Process of the SOM
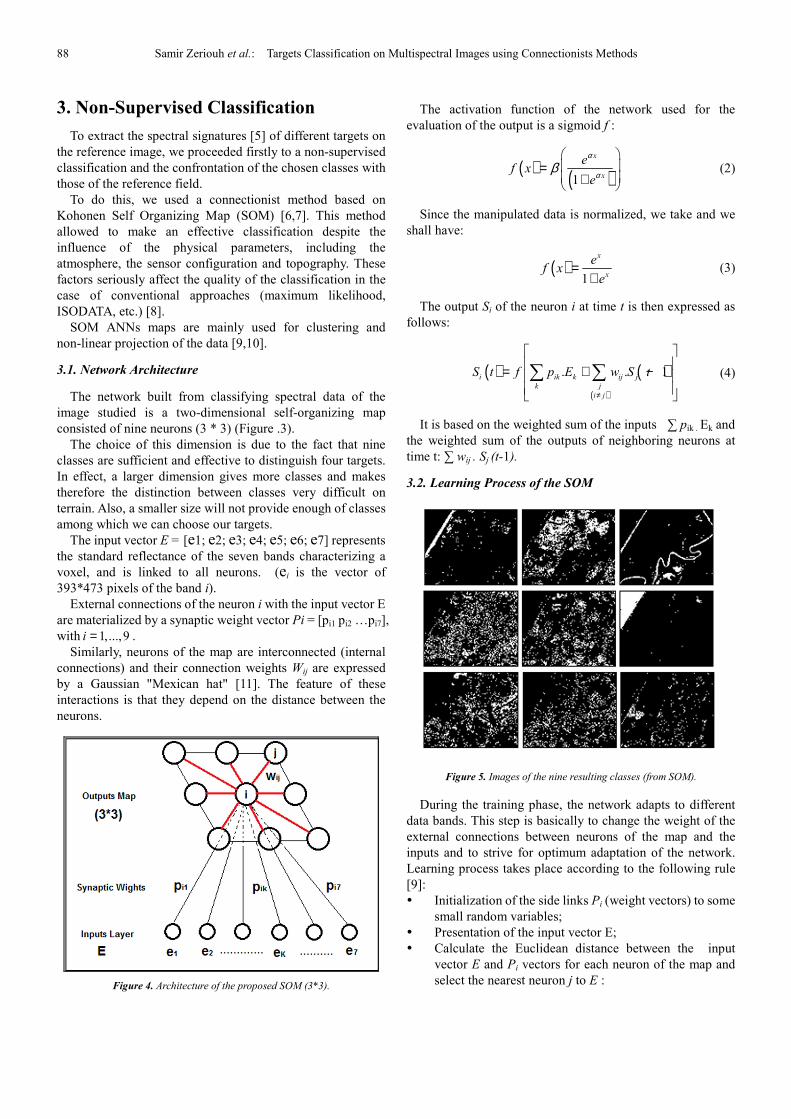
Figure 5. Images of the nine resulting classes (from SOM).
During the training phase, the network adapts to different
data bands. This step is basically to change the weight of the
external connections between neurons of the map and the
inputs and to strive for optimum adaptation of the network.
Learning process takes place according to the following rule
[9]:
� Initialization of the side links Pi (weight vectors) to some
small random variables;
� Presentation of the input vector E;
� Calculate the Euclidean distance between the input
vector E and Pi vectors for each neuron of the map and
select the nearest neuron j to E :

American Journal of Physics and Applications 2015; 3(3): 86-91 89
( )2
i j ij
j
E P E P− = −∑ (5)
( )minj c i
d E P E P= − = − (6)
2. Learning and update of the weights Pk according to the
neighborhood rule h(k,dj):
( ) ( ) ( ) ( ) ( ) ( )( )1 , .k k j k
P t P t t h k d E t P tρ+ = + − (7)
h is the neighborhood rule and ρ the learning step value.
Repeat steps 2, 3 and 4 until the complete stabilization of
the weights. The neighborhood is shrinking and the learning
coefficient decreases over time. Thus, at the end of the
learning process, the map is self-organized into nine groupings.
After resizing the nine outputs and the establishment of new
matrices (393x473), we obtain new binary images, each
representing a different class (Fig. 5).
3.3. Building of the Database
At this stage, we compared the binary images obtained with
real aspect of the ground. This allowed us to identify the areas
of the desired target on the original image (Fig. 6).
Figure 6. Classification of the SOM images.
This comparison is simplified by the color composite images containing the desired classes (Fig.7).
Figure 7. Classification of the desired target on the basis of colored compositions of the images obtained by the SOM map.

90 Samir Zeriouh et al.: Targets Classification on Multispectral Images using Connectionists Methods
Finally, once the targets are identified on the seven
reference bands image, we extracted eight samples of the
normalized reflectances of the aforesaid each target.
In this study, we chose the most relevant and essential: non
deep water, sandy soil, wooded area and wet soil (Table 1).
Table 1. Samples of the targets taken from the (7-bands) reference image.
Bands SAND OR LOW DENSITY FLOOR
1 0,21 0,21 0,21 0,21 0,20 0,21 0,21 0,21
2 0,33 0,32 0,32 0,32 0,35 0,34 0,34 0,32
3 0,35 0,34 0,34 0,34 0,36 0,4 0,33 0,41
4 0,33 0,33 0,32 0,33 0,34 0,33 0,33 0,32
5 0,28 0,29 0,26 0,3 0,31 0,32 0,27 0,29
6 0,52 0,52 0,52 0,52 0,53 0,52 0,52 0,52
7 0,27 0,21 0,29 0,21 0,31 0,36 0,29 0,3
NON DEEP WATER
1 0,61 0,61 0,61 0,61 0,62 0,62 0,69 0,68
2 0,72 0,68 0,67 0,67 0,67 0,67 0,69 0,66
3 0,55 0,64 0,53 0,54 0,54 0,55 0,54 0,53
4 0,45 0,54 0,53 0,54 0,54 0,54 0,55 0,54
5 0,46 0,45 0,45 0,45 0,45 0,45 0,45 0,44
6 0,42 0,42 0,42 0,42 0,42 0,42 0,42 0,42
7 0,54 0,43 0,47 0,57 0,64 0,75 0,4 0,6
MUD OR WET FLOOR
1 0,51 0,51 0,51 0,51 0,51 0,51 0,50 0,51
2 0,61 0,59 0,58 0,56 0,61 0,59 0,57 0,56
3 0,34 0,34 0,33 0,33 0,34 0,34 0,34 0,33
4 0,34 0,34 0,33 0,33 0,34 0,35 0,34 0,34
5 0,65 0,64 0,64 0,64 0,65 0,64 0,64 0,64
6 0,02 0,01 0 0,01 0,02 0,02 0 0
7 0,41 0,39 0,38 0,36 0,41 0,38 0,37 0,34
WOODED AREA
1 0,31 0,31 0,31 0,31 0,31 0,31 0,31 0,31
2 0,41 0,39 0,38 0,36 0,31 0,39 0,34 0,36
3 0,34 0,34 0,33 0,34 0,34 0,33 0,33 0,34
4 0,34 0,34 0,43 0,33 0,34 0,35 0,34 0,04
5 0,01 0,01 0,01 0,01 0 0 0 0,01
6 0,05 0,04 0,01 0 0,01 0 0 0
7 0,01 0 0 0 0,01 0 0 0
We see that the reflectance values obtained in table 1 differ
from one band to another and from one class to another. This
indicates and confirms the difference of the answer of the
target classes to the wavelengths emitted by the onboard radar
(spectral signatures). In addition, for samples of the same strip,
these values are very close together, and even equal in some
cases, which shows the effectiveness of the made
classification.
4. Conclusions
In this paper, we proceeded to the application of a
nonlinear median filter type over a multiband image. This
filtering enabled us to eliminate the speckle noise and
preserve the shape of the boundaries between the different
classes of the image. Then we presented a connectionist
approach to building a database on four targets of major
interest. To do this, we performed a clustering filtered images
representing the seven bands and, using a map scale SOM
(3*3). This network has allowed us to define new classes on
this image. Comparison of these classes with the real
aspects of the ground finally allowed us to define the nature
and position of our target on the satellite image and obtain
therefore a reference reflectance database.
The target identification studied on other images taken by
the same sensor can be performed thereafter with a
supervised classification of the reference data.
Thus, thanks to the robustness of their models, Artificial
Neural Networks seem to be remarkably well adapted to
different targets. Their adaptation to nonlinear problems, is a
major asset for a very *satisfactory solution to the
classification and identification.
References
[1] Mukesh C. Motwani, Mukesh C. Gadiya, Rakhi C. Motwani, Frederick C. Harris, Jr, “Survey of Image Denoising Techniques,” Proc. of GSPx 2004, Santa Clara Convention Center, Santa Clara, CA, 2004, pp. 27-30.
[2] H. Guo, J. E. Odegard, M. Lang, R. A. Gopinath, I.W. Selesnick, and C. S. Burrus, “Wavelet based Speckle Reduction with Application to SAR based ATD/R,” First International Conference on Image Processing, 1, 1994, pp. 75-79.
[3] Maïtine Bergounioux. Quelques méthodes de filtrages en traitement d’image.CIMPA, hal-00512280v1, 2011.

American Journal of Physics and Applications 2015; 3(3): 86-91 91
[4] E. Nezry, Amélioration radiométrique et préservation de la réflectivité radar des images SAR par les filtres de speckle adaptatifs : Théorie et résultats expérimentaux, Centre commun de recherche, Institut des applications de la télédétection, Commission européenne, 1994, pp.3-7.
[5] J. Philippe, G. Etchegorry, F. Adragna, Y. Kerr, J. Lagouarde, M. Leroy et T. Le Toan, Observation spaciale des paramètres de surface, (Paramètres de surface et signatures spectrales), La télédétection en Francophonie : analyse et perspectives, Edition AUF2000, pp. 299-317.
[6] N. Allinson, H. Yin, N. Allinson and J. Slack Eds. Self-Organizing Maps.Springer, 2001, pp.95-101.
[7] T. Kohonen, Essentials of the self-organizing map, Neural Networks 37, 2013, pp. 52–65.
[8] T. Kohonen, Self-Organizing Maps, Springer Series in Information Sciences, Vol.30, 2°edition, 1997.
[9] M. Hendel, A. Benyettou, F. Hendel, H. Khilil, « Classification automatique des signaux ECG par les réseaux de neurones probabilistes », "Applications Médicales de l'Informatique : Nouvelles Approches", Monastir-Tunisie, 13, 14 et 15 Novembre 2008.
[10] R. Le page, Détection et analyse de l’onde P d’un électrocardiogramme : application au dépistage de la fibrillation auriculaire, Thèse Doctorat d’état électronique. L’université de Bretagne occidentale, 2003.
[11] Teuvo Kohonen, Jussi Hynninen, Jari Kangas and Jorma Laaksonen. Som-pak, the self-organizing map program package. SOM programming team of Helsinki University of Technology, April 1995.