Targeting Material characterization by Raman - Lahat Material characterization by Raman. ......
60
Targeting Material characterization by Raman Dr Enrique Lozano Sales Director MMS E&A
Transcript of Targeting Material characterization by Raman - Lahat Material characterization by Raman. ......

Targeting Material characterization by
Raman
Dr Enrique Lozano
Sales Director MMS E&A

Raman is a technique largely used for mat.
Char. mostly due to the fingerprinrt
characteristics materials show under this
technique, plus other considerations:
• Capability of quantification
• Confocality potential
• Fiber compatible
• Many sources of light
• Complement other techniques

IR and Raman - Complementary Excitation spectrum
Absorption spectrum
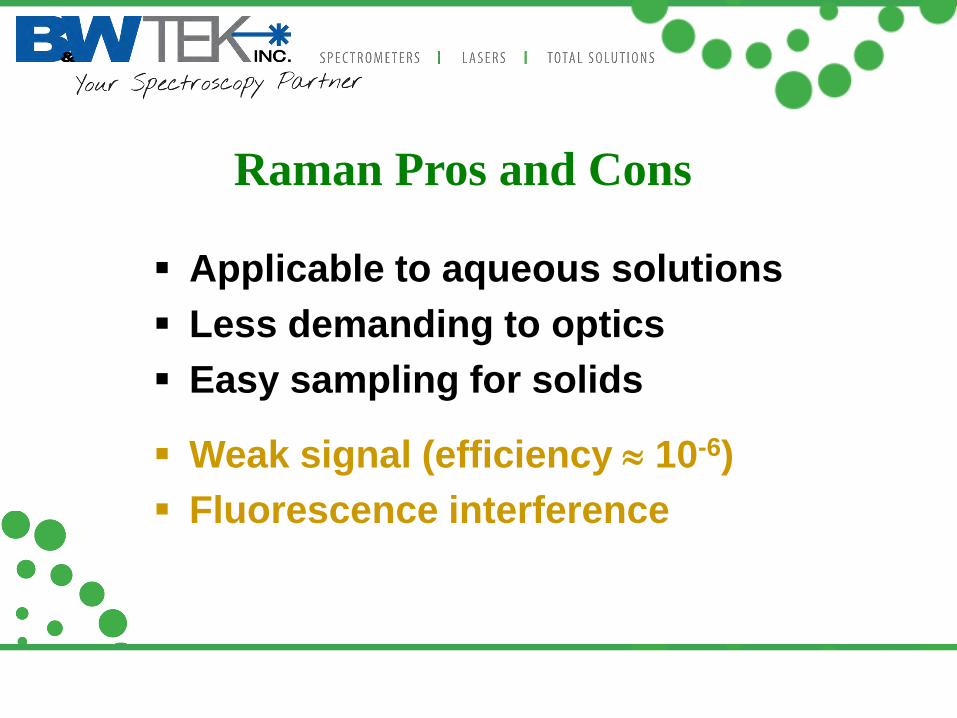
Raman Pros and Cons
Applicable to aqueous solutions
Less demanding to optics
Easy sampling for solids
Weak signal (efficiency ≈ 10-6)
Fluorescence interference
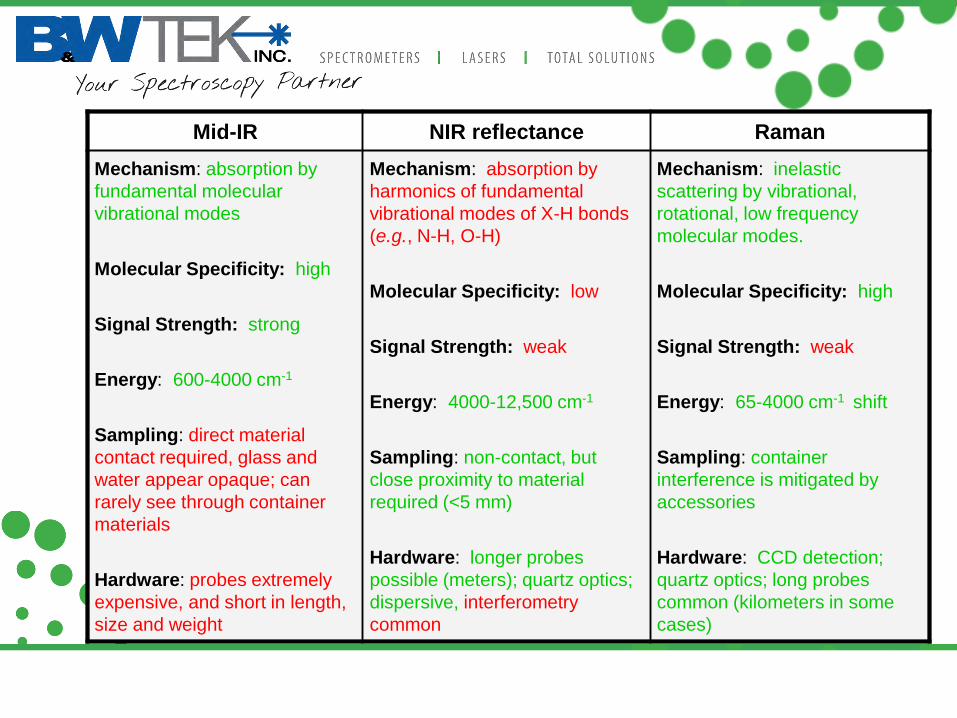
Mid-IR NIR reflectance Raman
Mechanism: absorption by
fundamental molecular
vibrational modes
Molecular Specificity: high
Signal Strength: strong
Energy: 600-4000 cm-1
Sampling: direct material
contact required, glass and
water appear opaque; can
rarely see through container
materials
Hardware: probes extremely
expensive, and short in length,
size and weight
Mechanism: absorption by
harmonics of fundamental
vibrational modes of X-H bonds
(e.g., N-H, O-H)
Molecular Specificity: low
Signal Strength: weak
Energy: 4000-12,500 cm-1
Sampling: non-contact, but
close proximity to material
required (<5 mm)
Hardware: longer probes
possible (meters); quartz optics;
dispersive, interferometry
common
Mechanism: inelastic
scattering by vibrational,
rotational, low frequency
molecular modes.
Molecular Specificity: high
Signal Strength: weak
Energy: 65-4000 cm-1 shift
Sampling: container
interference is mitigated by
accessories
Hardware: CCD detection;
quartz optics; long probes
common (kilometers in some
cases)
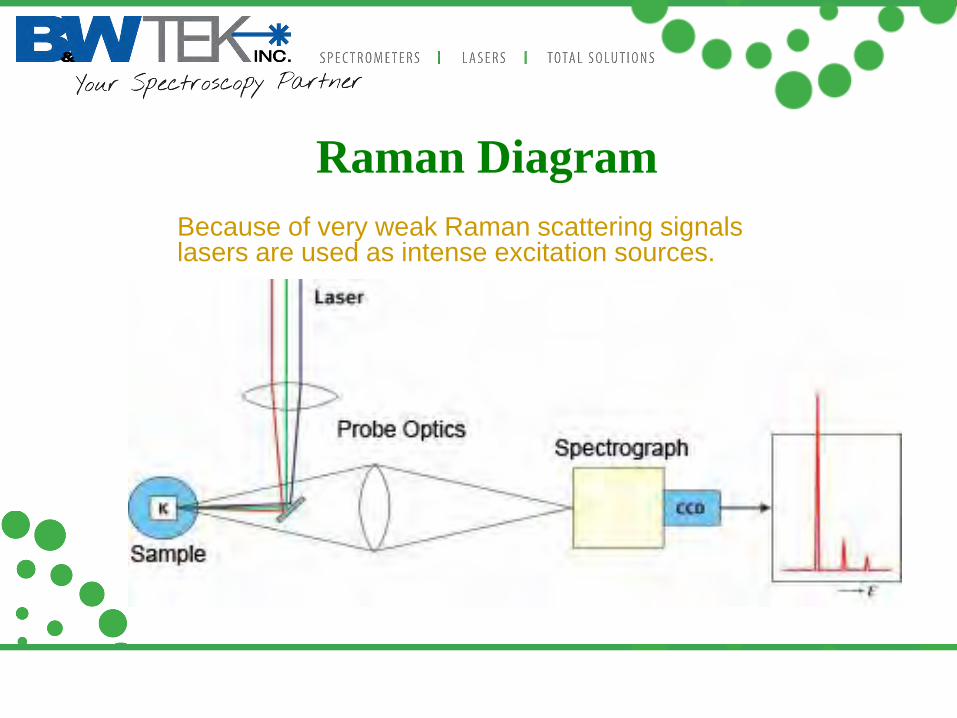
Raman Diagram
Because of very weak Raman scattering signals lasers are used as intense excitation sources.

Bench Top
Large size
$50K to >$150 K
Resolution: 0.1 to 5 cm-1
Expensive parts
Portable
Compact, small footprint
$10 K - $45 K
Resolution: 3, 5, 10 cm-1
Low maintenance
Bench Top Raman vs. Portable Raman

Portable Raman Spectrometer
Rugged design
Small size
Light weight
Fiber probe
Battery option
High performance to cost ratio

Pharmaceutical Industry
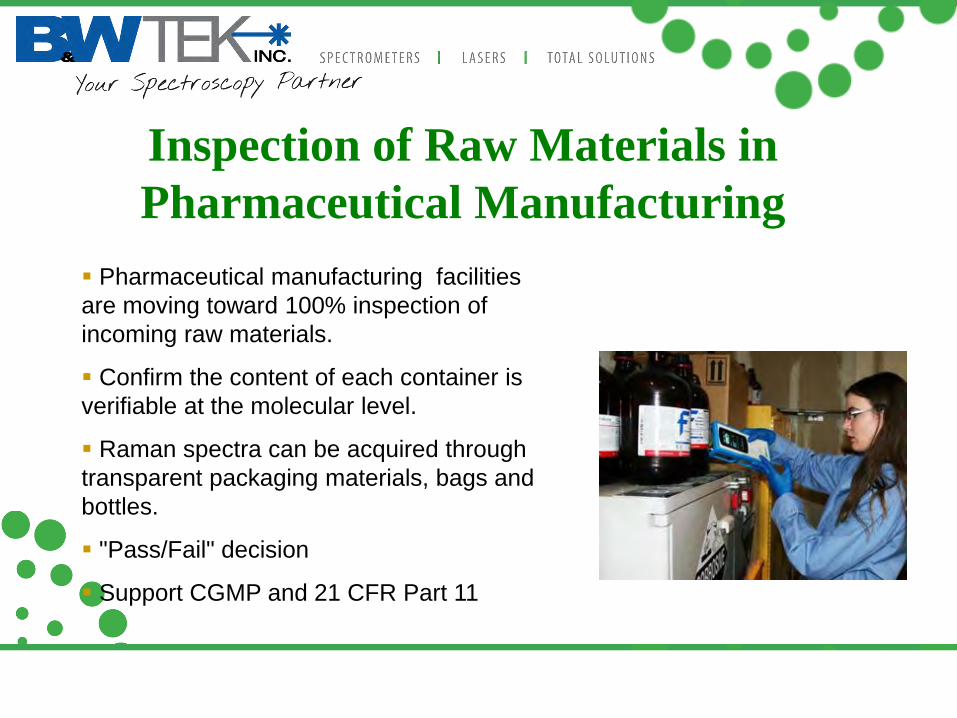
Pharmaceutical manufacturing facilities
are moving toward 100% inspection of
incoming raw materials.
Confirm the content of each container is
verifiable at the molecular level.
Raman spectra can be acquired through
transparent packaging materials, bags and
bottles.
"Pass/Fail" decision
Support CGMP and 21 CFR Part 11
Inspection of Raw Materials in
Pharmaceutical Manufacturing

Rapid Screening of Protein
Therapeutics Products
US FDA used B&W Tek MiniRam™ series in their pilot program of rapid Screening of Protein Therapeutics Products in the fields.
Insulin methods: to distinguish insulins with different origins and formulations, as well as insulins that have been modified by external stresses such as heat and agitation
Heparin sodium methods: to detect the presence of over-sulfated chondroitin sulfate in API
Advantageous for process control
Effectively maintaining safe supply
of protein-based pharma products

Manufacturing
Raman spectral change during
HSWG (High Shear Wet Granulation)
polymorph transformation
New Raman bands for form B
appear and for form A disappear

Material Characterization
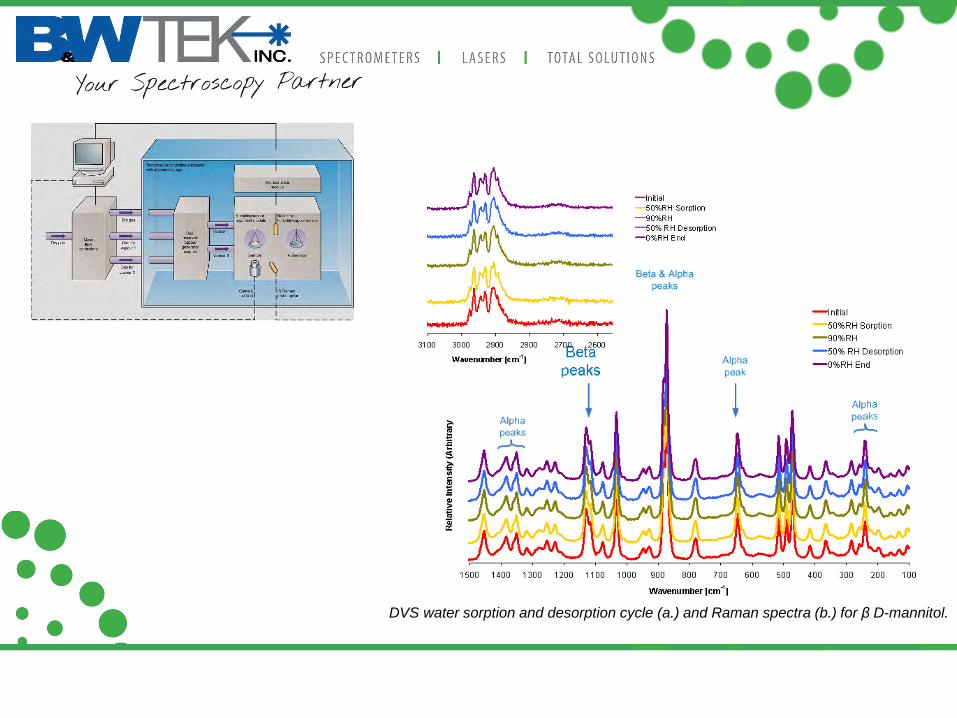
DVS water sorption and desorption cycle (a.) and Raman spectra (b.) for β D-mannitol.

Chemical Industry
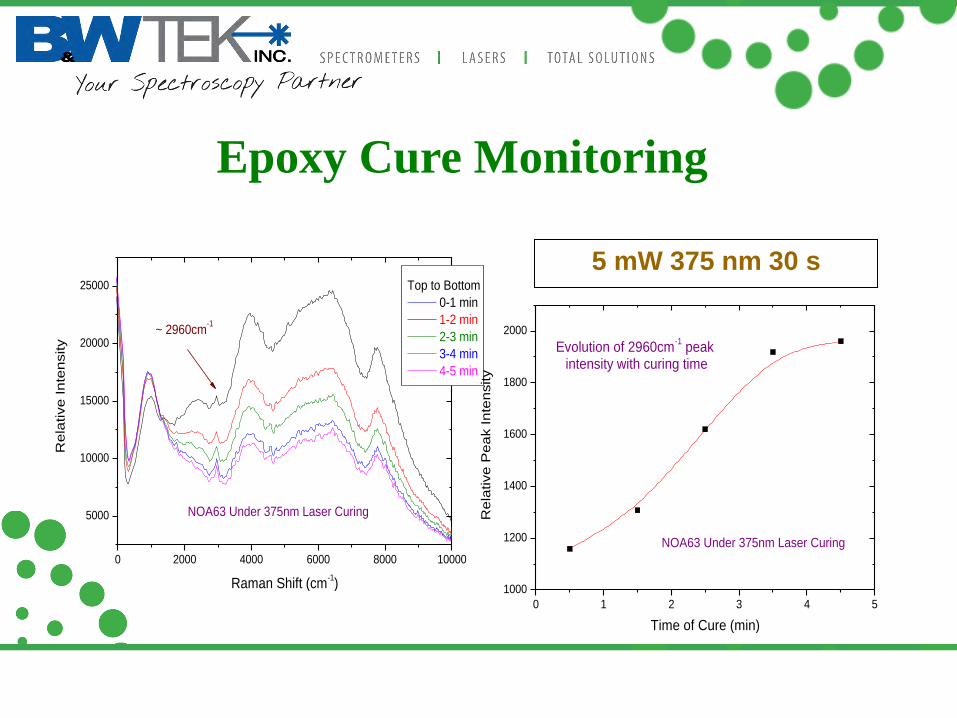
0 2000 4000 6000 8000 10000
5000
10000
15000
20000
25000 Top to Bottom
0-1 min
1-2 min
2-3 min
3-4 min
4-5 min
NOA63 Under 375nm Laser Curing
~ 2960cm-1
Re
lative
In
ten
sity
Raman Shift (cm-1)
5 mW 375 nm 30 s
Epoxy Cure Monitoring
0 1 2 3 4 5
1000
1200
1400
1600
1800
2000
NOA63 Under 375nm Laser Curing
Re
lative
Pea
k In
ten
sity
Time of Cure (min)
Evolution of 2960cm-1 peak
intensity with curing time

Polystyrene identification
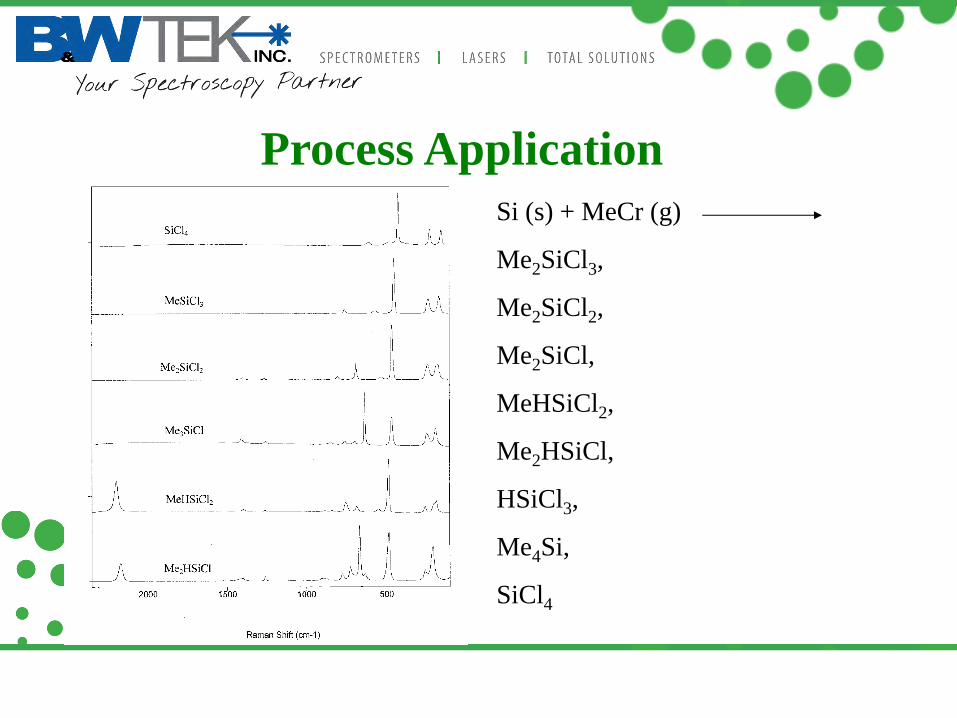
Process Application
Si (s) + MeCr (g)
Me2SiCl3,
Me2SiCl2,
Me2SiCl,
MeHSiCl2,
Me2HSiCl,
HSiCl3,
Me4Si,
SiCl4

TiO2·H2SO4·H2O → TiO2·H2SO4 →TiO2 (nanophase) → TiO2 (anatase)
→ TiO2 (rutile)
Process Application
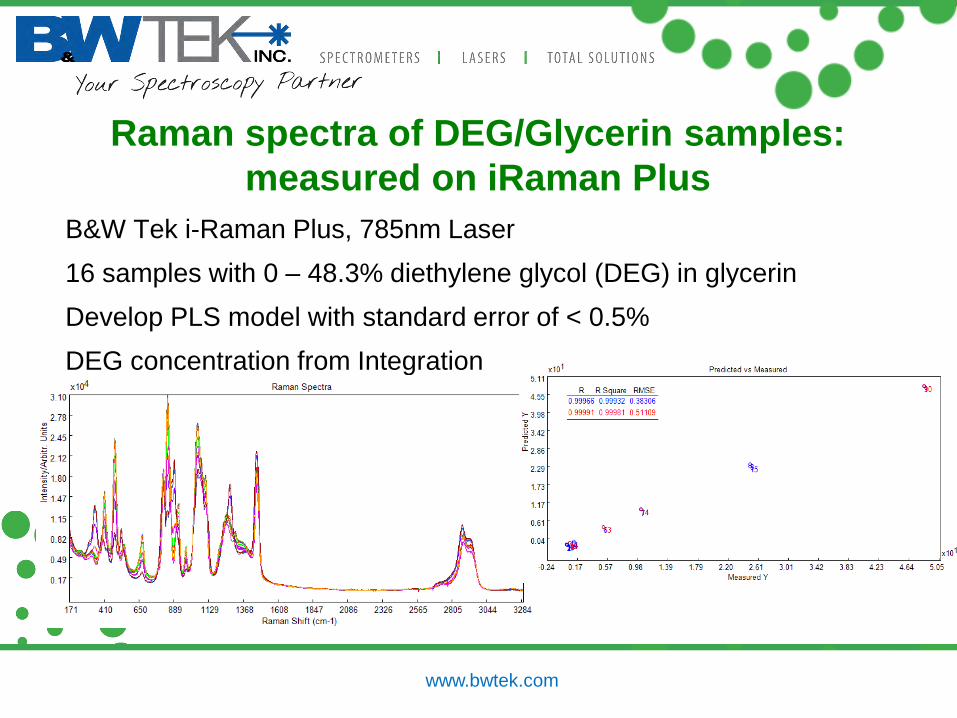
B&W Tek i-Raman Plus, 785nm Laser
16 samples with 0 – 48.3% diethylene glycol (DEG) in glycerin
Develop PLS model with standard error of < 0.5%
DEG concentration from Integration
Raman spectra of DEG/Glycerin samples:
measured on iRaman Plus
www.bwtek.com

Quantitative analysis of olive oils at
1064nm. iRaman EX Extra virgin olive oil (EVOO) samples
were spiked with small amounts of
light olive oil
8 samples with 0.21- 19.15% were
measured on the i-Raman EX
BWIQ software used to develop a
quantitative model for light oil in
EVOO
Feasibility of this measurement
shown with limited sample set
www.bwtek.com 21
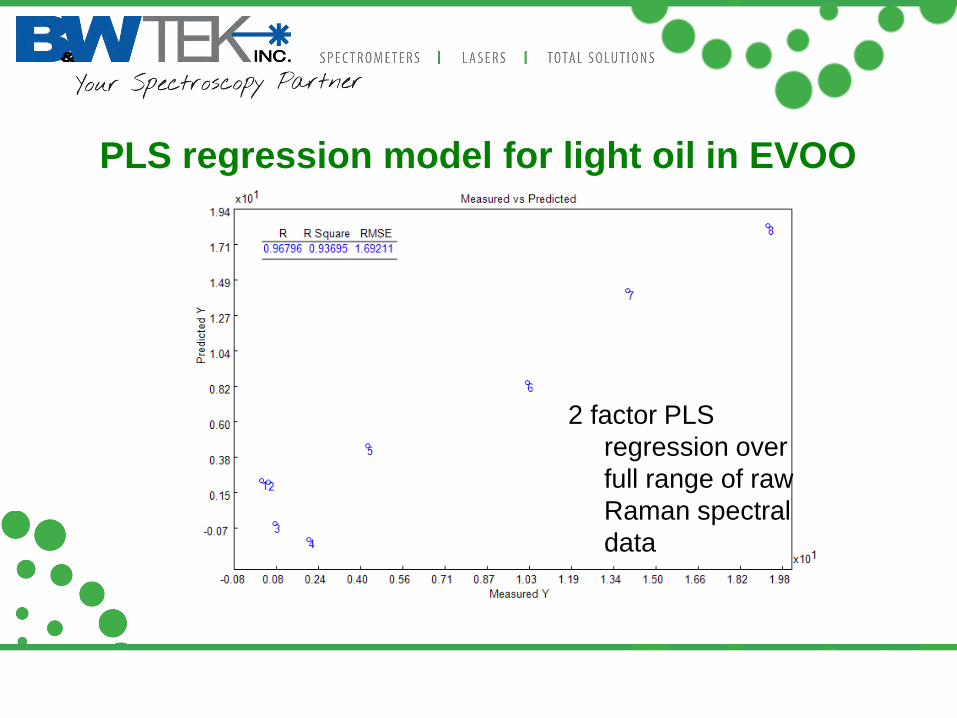
PLS regression model for light oil in EVOO
2 factor PLS
regression over
full range of raw
Raman spectral
data
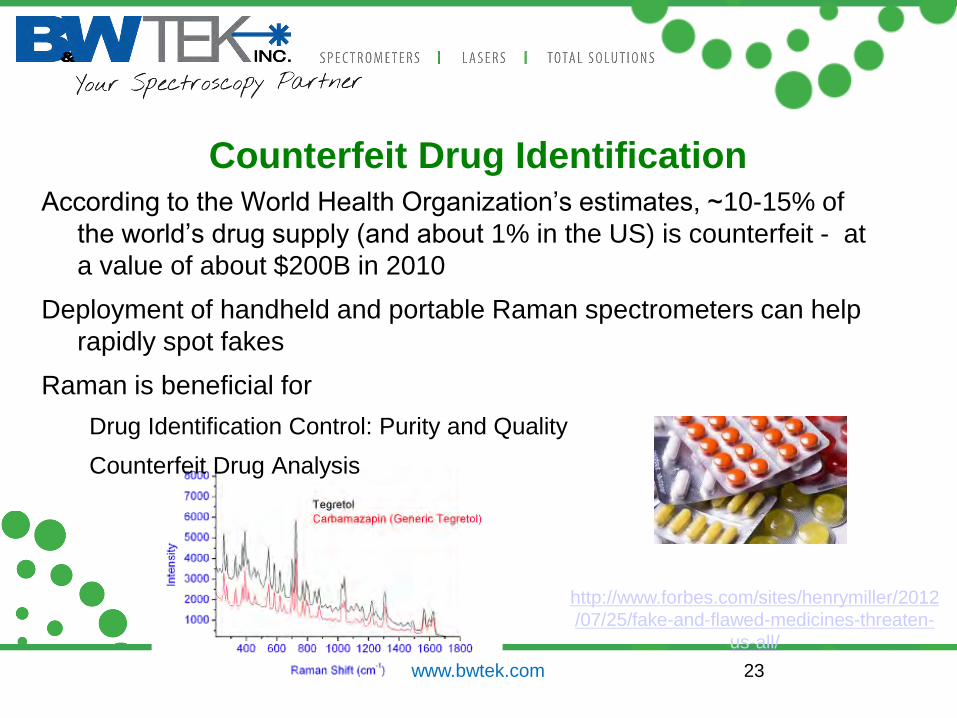
Counterfeit Drug Identification According to the World Health Organization’s estimates, ~10-15% of
the world’s drug supply (and about 1% in the US) is counterfeit - at
a value of about $200B in 2010
Deployment of handheld and portable Raman spectrometers can help
rapidly spot fakes
Raman is beneficial for
Drug Identification Control: Purity and Quality
Counterfeit Drug Analysis
23 Best 785
http://www.forbes.com/sites/henrymiller/2012
/07/25/fake-and-flawed-medicines-threaten-
us-all/
www.bwtek.com

Security
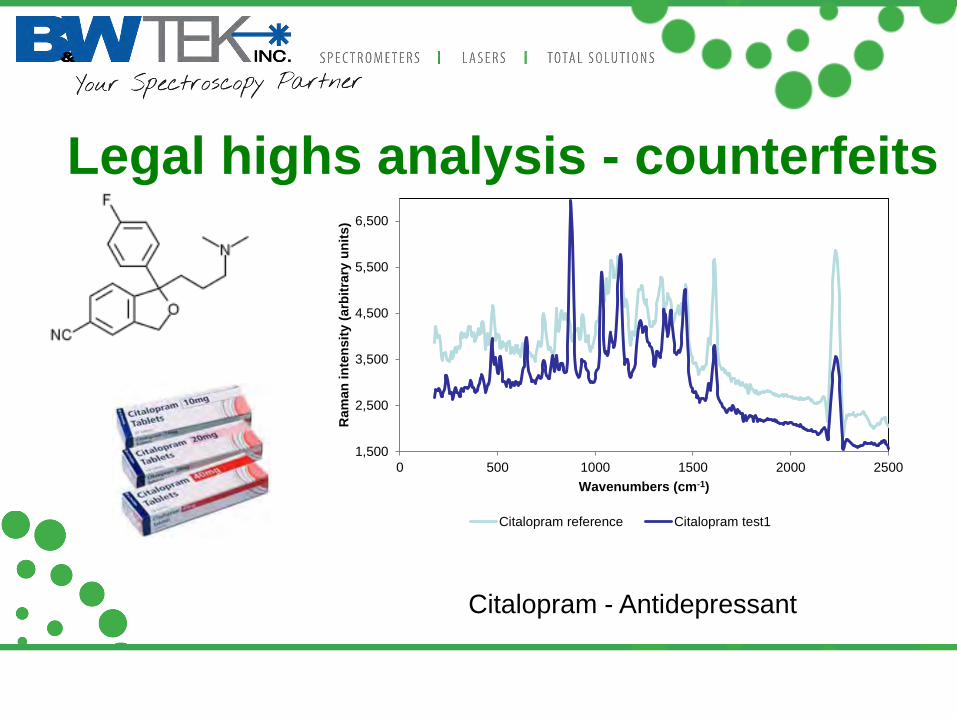
Legal highs analysis - counterfeits
1,500
2,500
3,500
4,500
5,500
6,500
0 500 1000 1500 2000 2500
Ram
an
in
ten
sit
y (
arb
itra
ry u
nit
s)
Wavenumbers (cm-1)
Citalopram reference Citalopram test1
Citalopram - Antidepressant

Counterfeit analysis
2,000
2,500
3,000
3,500
4,000
4,500
5,000
5,500
6,000
6,500
7,000
0 500 1000 1500 2000 2500
Ram
an
in
ten
sit
y (
arb
itra
ry u
nit
s)
Wavenumber (cm-1)
Sertraline reference Sertraline test 1
Sertraline.- Antidepressant

Counterfeit analysis
0
2,000
4,000
6,000
8,000
10,000
12,000
14,000
16,000
0 500 1000 1500 2000 2500 3000
Ram
an
in
ten
sit
y (
arb
itra
ry u
nit
s)
Wavenumbers (cm-1)
Aspirin reference Aspirin test 1
Aspirin: analgesic (reduce pain), antipyretic (reduce fever), anti-inflamatory
and anti-platelet

Street drugs, Cocaine
Cocaine vs Tetracaine
(legal local anesthetic)

Amphetamine
(pure)
Amphetamine (cut),
strong fluorescence
Street drugs, amphetamine

ingredient in “fake” "ecstasy" tablets
α-Pyrrolidinopropiophenone (α-PPP)
Stimulant drug
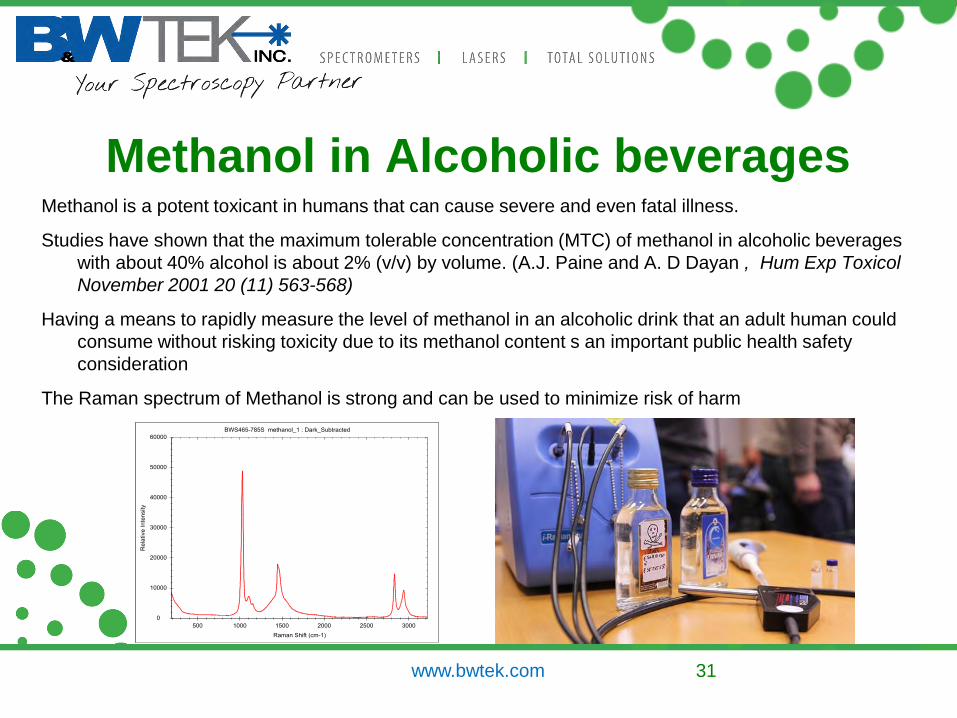
Methanol in Alcoholic beverages Methanol is a potent toxicant in humans that can cause severe and even fatal illness.
Studies have shown that the maximum tolerable concentration (MTC) of methanol in alcoholic beverages
with about 40% alcohol is about 2% (v/v) by volume. (A.J. Paine and A. D Dayan , Hum Exp Toxicol
November 2001 20 (11) 563-568)
Having a means to rapidly measure the level of methanol in an alcoholic drink that an adult human could
consume without risking toxicity due to its methanol content s an important public health safety
consideration
The Raman spectrum of Methanol is strong and can be used to minimize risk of harm
www.bwtek.com 31

Methanol in flavored rum
CH3 bending vibration at
1032 cm-1 increases with
methanol concentration.
Can readily measure
concentration of MeOH in
alcoholic beverage by
Raman
Dilution of beverages with
water can also be
measured by Raman
www.bwtek.com 32

Art, Geology and Gemology
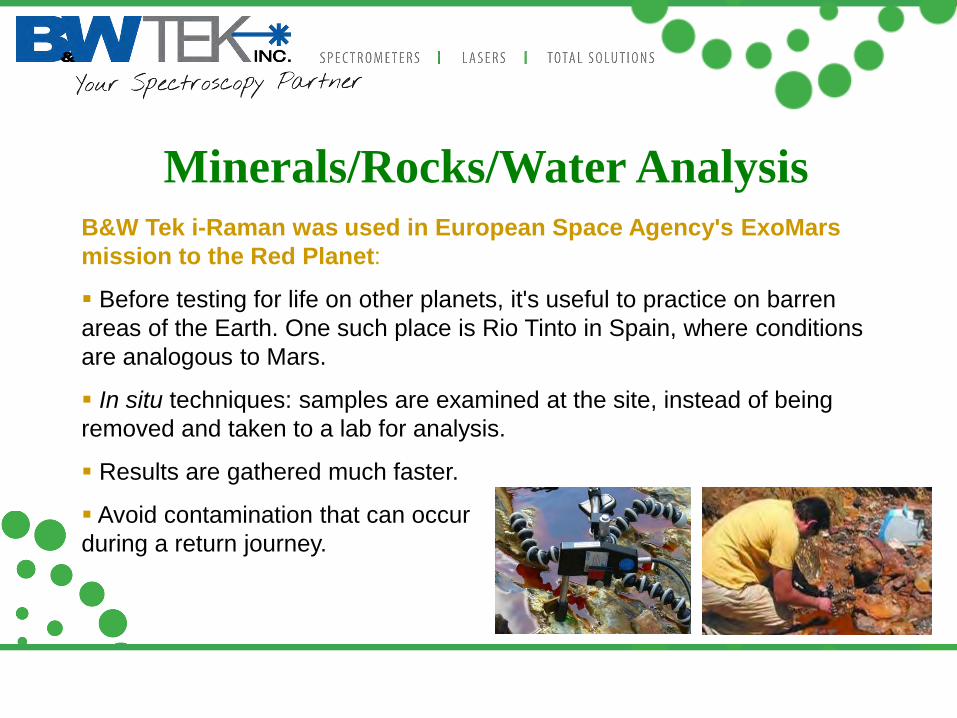
Minerals/Rocks/Water Analysis B&W Tek i-Raman was used in European Space Agency's ExoMars
mission to the Red Planet:
Before testing for life on other planets, it's useful to practice on barren
areas of the Earth. One such place is Rio Tinto in Spain, where conditions
are analogous to Mars.
In situ techniques: samples are examined at the site, instead of being
removed and taken to a lab for analysis.
Results are gathered much faster.
Avoid contamination that can occur
during a return journey.

Deteriorated Civil Building Stones
B&W Tek i-Raman was used to measure aragonite in a violet-coloured piece of shell in sample (a); gypsum in sample (b)
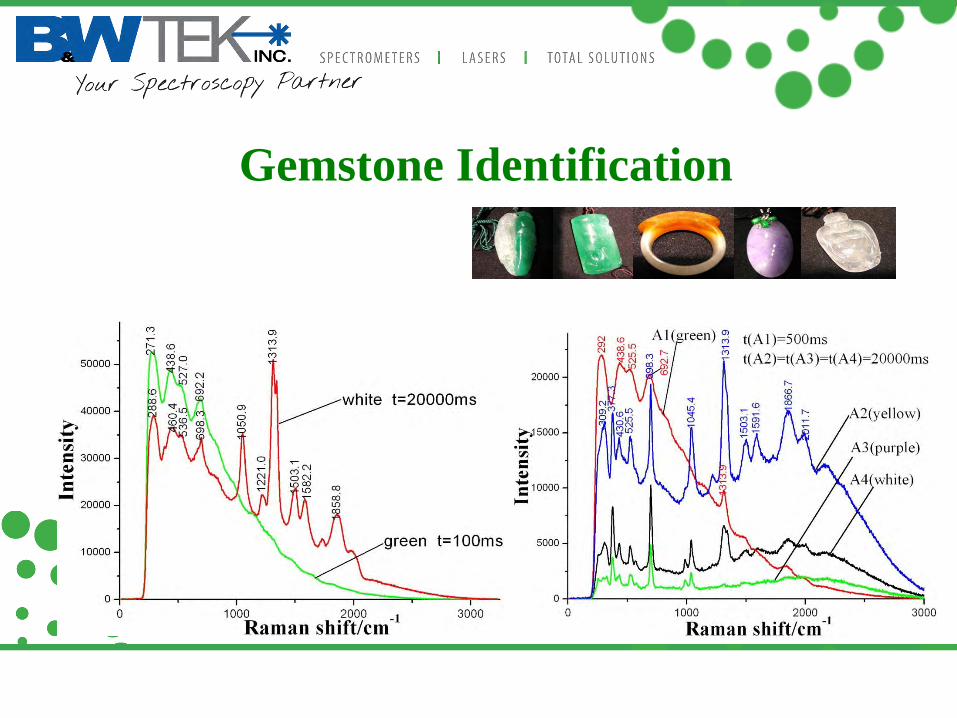
Gemstone Identification
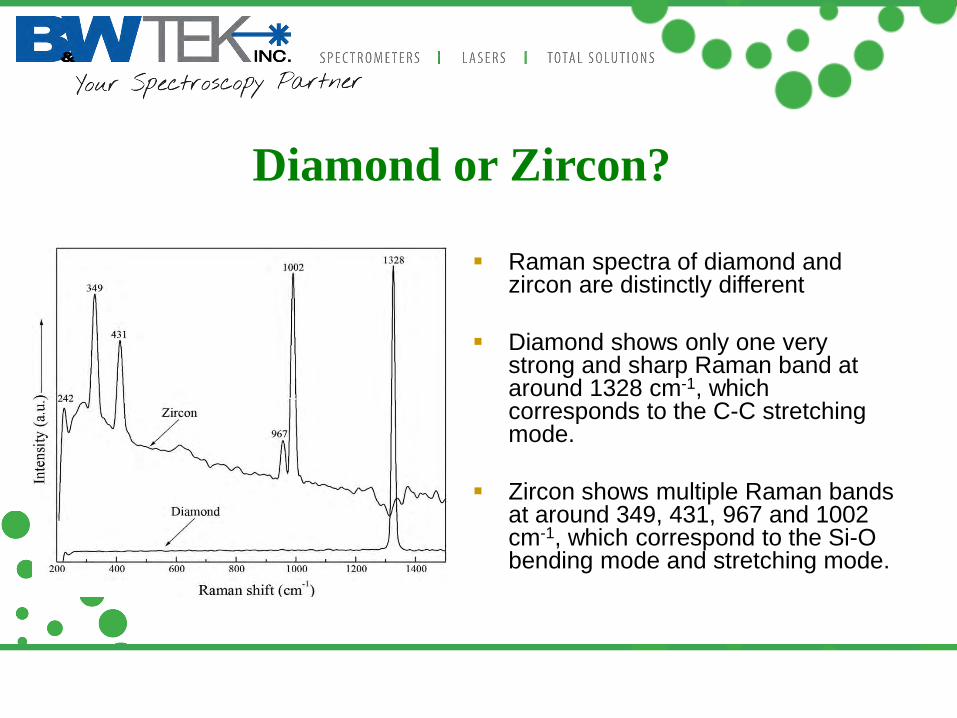
Diamond or Zircon?
Raman spectra of diamond and zircon are distinctly different
Diamond shows only one very strong and sharp Raman band at around 1328 cm-1, which corresponds to the C-C stretching mode.
Zircon shows multiple Raman bands at around 349, 431, 967 and 1002 cm-1, which correspond to the Si-O bending mode and stretching mode.

Examination of Inclusions in Minerals
Raman spectrum of a ruby sample when the excitation laser light is focused in the vicinity of one of its inclusions (a)
Raman bands at 710 and 1085 cm-1 match well with the Raman bands of calcite (b)
The inclusion substance of the ruby is calcite
This ruby sample is natural without undergoing heat treatment.

Paint and Pigment Analysis
B&W Tek i-Raman was used for analysis
of blue pigment, lazurite, on a Buddha statue.
Surface Enhanced Raman
Spectroscopy (SERS)
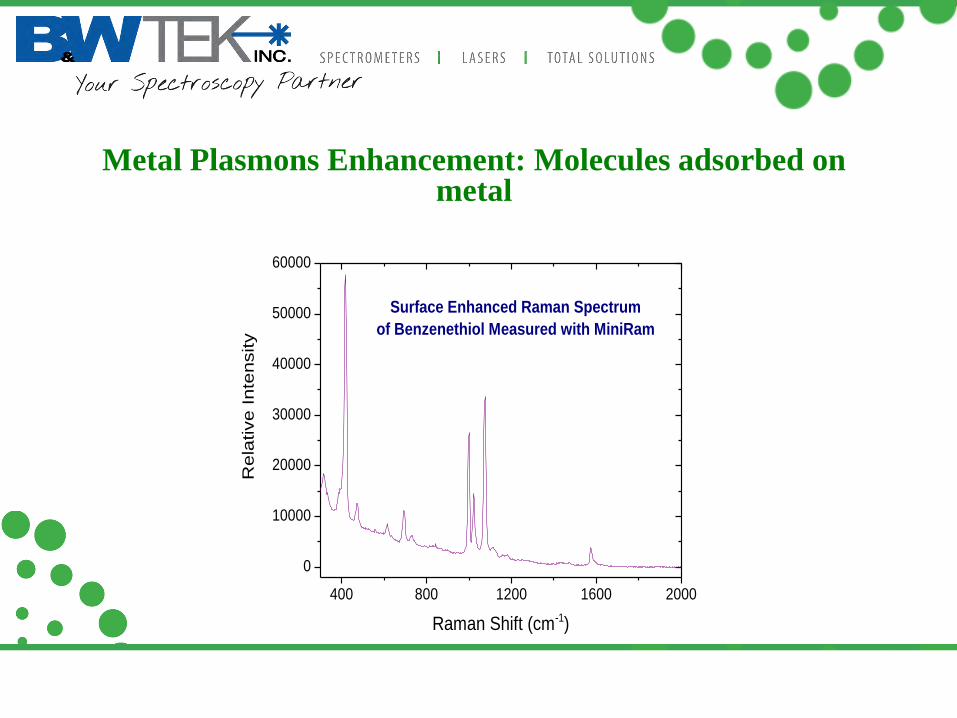
Metal Plasmons Enhancement: Molecules adsorbed on metal
400 800 1200 1600 2000
0
10000
20000
30000
40000
50000
60000
Re
lative
In
ten
sity
Raman Shift (cm-1)
Surface Enhanced Raman Spectrum
of Benzenethiol Measured with MiniRam

Detection of Melamine in Gluten Using SERS
Structure and SEM image of a
KlariteTM SERS active gold substrate
Average SERS spectra (n = 4) acquired from
extracts of wheat gluten containing different
concentrations of melamine: 2.0% (a), 1.0% (b),
0.5% (c), 0.1% (d), 0% (e).

Forensic Analysis
Non-destructive sample
Probe through various
packaging materials
Rapid results
Portability
C4 plastic explosive
TNT
Sodium nitrite fertilizer bomb

BWTEK Raman Family
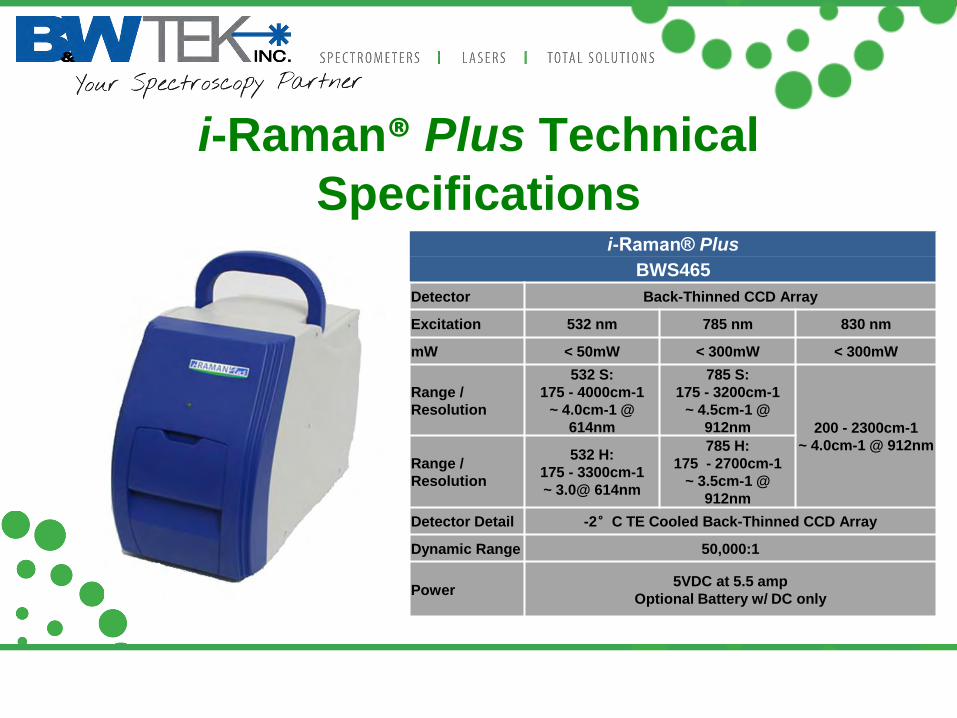
i-Raman® Plus Technical
Specifications i-Raman® Plus
BWS465
Detector Back-Thinned CCD Array
Excitation 532 nm 785 nm 830 nm
mW < 50mW < 300mW < 300mW
Range /
Resolution
532 S:
175 - 4000cm-1
~ 4.0cm-1 @
614nm
785 S:
175 - 3200cm-1
~ 4.5cm-1 @
912nm 200 - 2300cm-1
~ 4.0cm-1 @ 912nm
Range /
Resolution
532 H:
175 - 3300cm-1
~ 3.0@ 614nm
785 H:
175 - 2700cm-1
~ 3.5cm-1 @
912nm
Detector Detail -2°C TE Cooled Back-Thinned CCD Array
Dynamic Range 50,000:1
Power 5VDC at 5.5 amp
Optional Battery w/ DC only

i-Raman® Plus Higher S/N ratio allows for greater
specificity of materials
Greater range allows you to see
more C-H Stretching
BWIQ allows users to develop
Quantitative Raman methods for:
Mixture analysis
BWID allows user to develop
libraries for
Final Product Identification
Counterfeit Detection
Comprehensive suite of
accessories, software, allow
versatility and portability
CH stretching
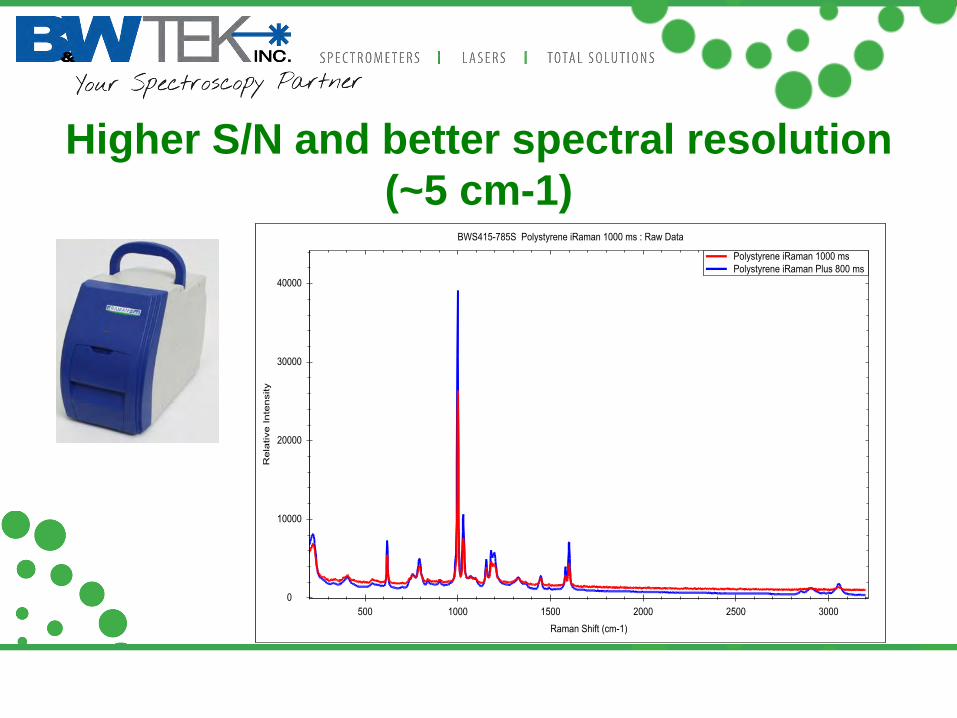
Higher S/N and better spectral resolution
(~5 cm-1)

i-Raman® EX Technical Specifications i-Raman® EX
BWS485
Detector TE Cooled InGaAs
Excitation 1064 nm
mW <450 mW
Laser Power
Control 0 to 100%
Range /
Resolution
175 - 2500cm-1
~ 4.0cm-1 @ 614nm
Dynamic Range 25,000:1
Digitization
Resolution 16 bit or 65,535:1
Integration Time 200 μs to >20 minutes
DC Power 12V DC at 6.6 Amps
Battery Optional

i-Raman® EX
Material Fluorescence reduces
applicability on a small subset
of materials
Utilize 1064 nm excitation
Reduce fluorescence
Increase productivity
Research Grade Enhance
material characterization
opportunities
Extra Virgin Olive Oil with 785nm (in Red) and 1064nm (in Blue)

Applications on 1064nm i-Raman EX
Dye: Rhodamine 6G_785vs1064
Applications on 1064nm i-Raman EX
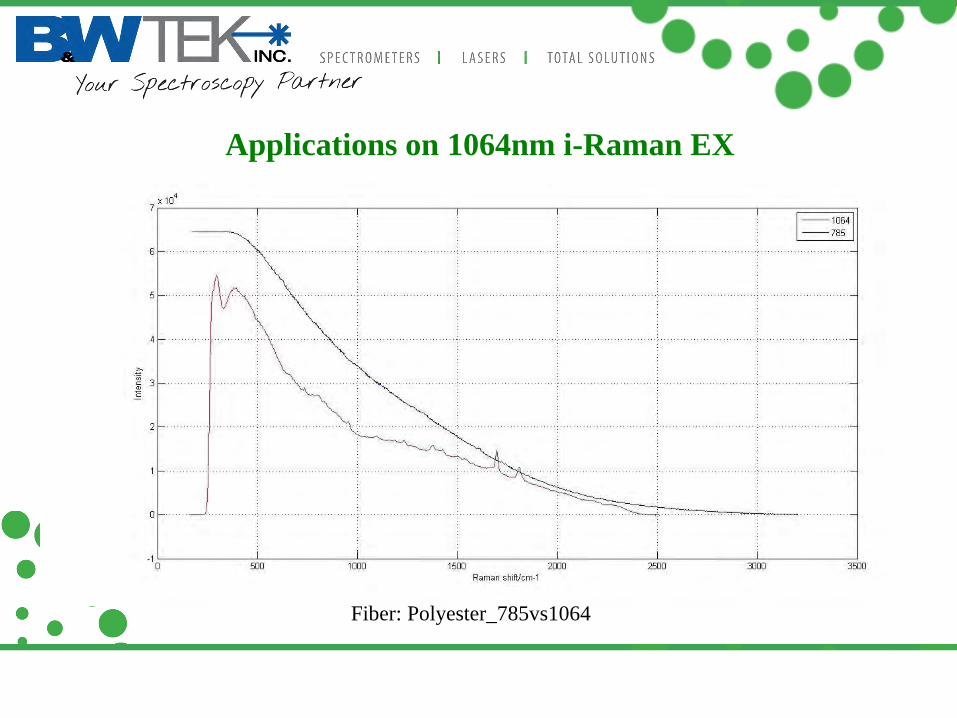
Fiber: Polyester_785vs1064
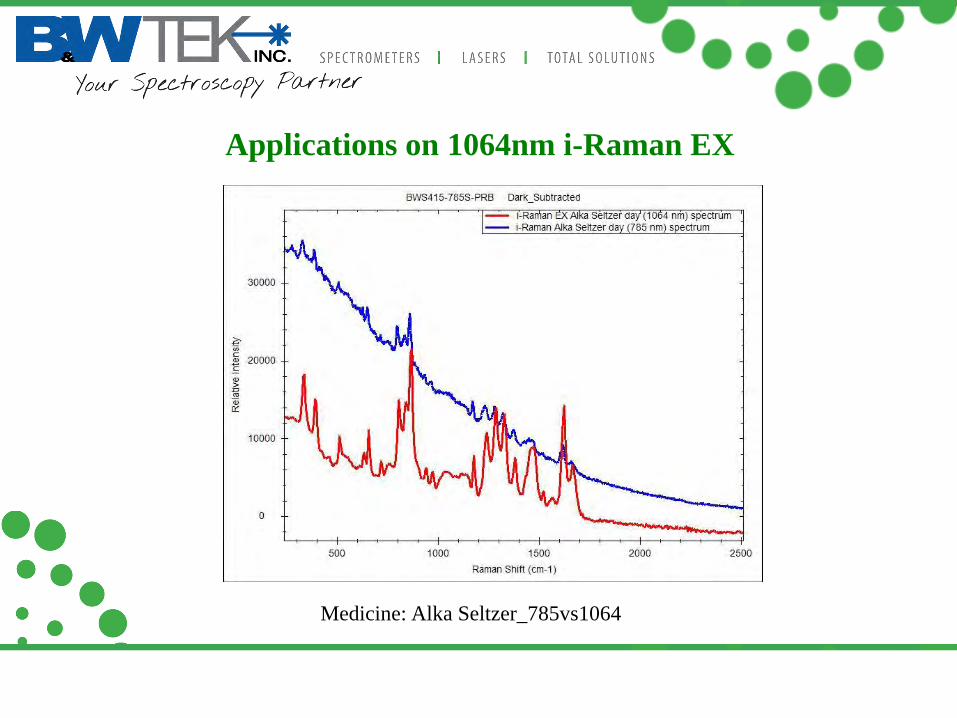
Applications on 1064nm i-Raman EX
Medicine: Alka Seltzer_785vs1064

Comparison of Sesame oil spectra
Applications on 1064nm i-Raman EX

NanoRam Technical Specifications NanoRam
BWS455
Detector TE Cooled linear CCD Array
Excitation
785nm ± 0.5nm, Stability <0.5cm-1, Linewidth <2.0cm-
1
mW tunable from 0 mW to 300 mW
Laser Power
Control 0 to 100% in 10% increments
Range /
Resolution
176cm-1 to 2900cm-1
~ 9.0 cm-1 @ 785nm
Display High Visibility OLED touch screen, 3.7" size
Barcode
Reader 1D and 2D barcodes
Data Formats .txt, .csv, .spc
DC Power 12V DC at 6.6 Amps
Battery Rechargeable Li-ion Battery, > 5 hours operation
PC Software NID
Computer
Interface Ethernet, Wi-Fi

MiniRam
MiniRam®
BTR111
Detector TE cooled linear CCD Array
Excitation 532 nm 785 nm
mW < 50mW < 300mW
Range /
Resolution
175 - 4000cm-1
~ 15cm-1 @ 614nm
175 - 3200cm-1
~ 10cm-1 @ 912nm
Detector Detail -14°C TE Cooled linear CCD Array
Dynamic Range 300:1
Power 12VDC at 10.8 amp
Optional Battery w/ DC only

Chemometric (Spectral) Analysis
• Correlation analysis for material identification and/or verification
(Qualitative)
• Uncover underlying trends or patterns, classification
Multivariate analysis of complex systems with large data sets (Quantitative)
Develop models to predict response in unknown data sets
The use of mathematical and statistical methods for analysis of chemical or spectral data
BWIDTM BWIQTM
www.bwtek.com

How to choose excitation wavelength
• 532nm
• 785nm
• 1064nm
How to choose suitable sampling device
• Lab grade Raman probe
• Industrial Raman probe
• Flow cell
Portable Raman Applications Pharmaceutical Industry
cGMP (Current Good Manufacturing Process):
PAT (Process Analytical Technology): on-line, at-line process monitoring and control
QC: 100% incoming raw material identification
Counterfeit drug identification
Painting and Pigment
Forensic Analysis
Biomedical Analysis
Surface Enhanced Raman Spectroscopy (SERS)