A powerful tool for material identification: Raman ... · II. RAMAN AND INFRARED SPECTROSCOPY Raman...
8
Abstract—In present time different analytical methods with specific limitations serves for material identification. Raman spectroscopy is one of the most essential laser spectroscopic methods. In principle, Raman spectroscopy has the potential to answer a number of questions pertaining to chemical details of molecular structure what makes this technique definitely proper for material identification. Raman spectroscopy has recently proved progressive benefits and become a powerful research tool which finds assertion in almost all sciences and a wide range of technical and industrial branches. Doubtless advantages as non-destructiveness, contactless measurements, rapidity or no demand for sample preparation makes Raman spectroscopy attractive, convenient and effective. In the light of these facts, the popularity of Raman spectroscopy is still growing in analytical laboratories all over the world. Although the fundamental principle of this method is known almost one hundred years, extensive potentialities which Raman spectroscopy offers are finally able due to a technical advancement and novel engineering solution of the recent years. This paper briefly introduces the principle of the method, highlights its advantages, discusses drawbacks and compares its possibilities with infrared spectroscopy. Great applicability of Raman spectroscopy is demonstrated in the paper, other currently examined applications as determination of carcinogenic hexavalent chromium or epoxy resin crosslinking monitoring are also presented. Keywords— Fluorescence, identification, material properties, Raman spectroscopy, spectra. I. INTRODUCTION ASER spectroscopic research yields essential knowledge necessary for the insight into the world of atoms and molecules dimensions. Especially Raman spectroscopy is a powerful analytic method providing detailed and specific information at a molecular level. In regard of its versatility this method can offer information that can be below possibilities of other spectroscopic methods [1]. From a general point of view an interaction of electromagnetic radiation with a matter, particularly a specific emission and absorption of light, provides essential and valuable acquaintances of chemical agents. Manuscript received June 29, 2011: Revised version received June 29, 2011. This work is supported by the Ministry of Education, Youth and Sports of the Czech Republic under the Research Plan No. MSM 7088352102 and by the European Regional Development Fund under the project CEBIA-Tech No. CZ.1.05/2.1.00/03.0089. H. Vaskova is with the Tomas Bata University in Zlin, Faculty of Applied Informatics, nam. T.G.Masaryka 5555, 760 01 Zlín, Czech (phone: +420 576 035 228; e-mail: [email protected]). Raman effect was discovered more than eighty years ago. For a long time it remained only on a theoretical level and practically was marginalized because of low sensitivity and difficulties with overcoming fluorescence phenomena. However, renaissance of Raman spectroscopy is coming even in the last two decades hand in hand with technical advancements as are new extremely sensitive detection devices latest developments, efficient filters for filtering Raman scattered light from the Rayleigh scattering and introducing lasers as light sources and also innovative laser technology designs [2]. The fact, that Raman spectroscopy is very flexible method in majority of sciences and technical branches, has been repeatedly proven during recent years, when problems from different scientific areas have been solved. A structure and a composition of materials influence their physical utility properties and consequently characteristics of products fabricated from these materials. In many cases strict and specific conditions that must be complied are given. Critical properties on the possibility borders of examination must be attested. Raman spectroscopy is a powerful tool for such verification within a wide range of scientific disciplines. This rapid technique allows quick identification of materials, gives information on the structure, spatial arrangement of molecules and structural analyses. Analogically to the reality that every human being in the world has different – unique – set of fingerprints by which can be identified, also every individual substance has its own unique Raman spectrum characteristic only for the respective substance. Except material identification Raman spectroscopy also enables observation of the structural changes dynamics, mapping of samples and depth scanning. With regard to Raman molecular structure fingerprint this analytical method is suitable particularly for qualitative analyses, but can be also used for quantification, because the intensity of Raman scattered light is related to the amount of particular substance in a sample. Quantitative studies require often non-linear calibrations and standardization of the Raman signal. When doing quantitative analyses it is crucial to have as stable instrument as is possible, to assure measurement parameters identity as are laser power, time of irradiation, spectral resolution, number of acquisitions or sample orientation and also consider data post-processing. Obviously doing quantitative analyses of liquids and (water) solutions is better and more proper than analyses of solids because of their bigger homogeneity. A powerful tool for material identification: Raman spectroscopy Hana Vašková L INTERNATIONAL JOURNAL OF MATHEMATICAL MODELS AND METHODS IN APPLIED SCIENCES Issue 7, Volume 5, 2011 1205
Transcript of A powerful tool for material identification: Raman ... · II. RAMAN AND INFRARED SPECTROSCOPY Raman...
Abstract—In present time different analytical methods with
specific limitations serves for material identification. Raman
spectroscopy is one of the most essential laser spectroscopic
methods. In principle, Raman spectroscopy has the potential to
answer a number of questions pertaining to chemical details of
molecular structure what makes this technique definitely proper for
material identification. Raman spectroscopy has recently proved
progressive benefits and become a powerful research tool which finds
assertion in almost all sciences and a wide range of technical and
industrial branches. Doubtless advantages as non-destructiveness,
contactless measurements, rapidity or no demand for sample
preparation makes Raman spectroscopy attractive, convenient and
effective. In the light of these facts, the popularity of Raman
spectroscopy is still growing in analytical laboratories all over the
world. Although the fundamental principle of this method is known
almost one hundred years, extensive potentialities which Raman
spectroscopy offers are finally able due to a technical advancement
and novel engineering solution of the recent years. This paper briefly
introduces the principle of the method, highlights its advantages,
discusses drawbacks and compares its possibilities with infrared
spectroscopy. Great applicability of Raman spectroscopy is
demonstrated in the paper, other currently examined applications as
determination of carcinogenic hexavalent chromium or epoxy resin
crosslinking monitoring are also presented.
Keywords— Fluorescence, identification, material properties,
Raman spectroscopy, spectra.
I. INTRODUCTION
ASER spectroscopic research yields essential knowledge
necessary for the insight into the world of atoms and
molecules dimensions. Especially Raman spectroscopy is
a powerful analytic method providing detailed and specific
information at a molecular level. In regard of its versatility this
method can offer information that can be below possibilities of
other spectroscopic methods [1]. From a general point of view
an interaction of electromagnetic radiation with a matter,
particularly a specific emission and absorption of light,
provides essential and valuable acquaintances of chemical
agents.
Manuscript received June 29, 2011: Revised version received June 29,
2011. This work is supported by the Ministry of Education, Youth and Sports
of the Czech Republic under the Research Plan No. MSM 7088352102 and
by the European Regional Development Fund under the project CEBIA-Tech
No. CZ.1.05/2.1.00/03.0089.
H. Vaskova is with the Tomas Bata University in Zlin, Faculty of Applied
Informatics, nam. T.G.Masaryka 5555, 760 01 Zlín, Czech (phone:
+420 576 035 228; e-mail: [email protected]).
Raman effect was discovered more than eighty years ago.
For a long time it remained only on a theoretical level and
practically was marginalized because of low sensitivity and
difficulties with overcoming fluorescence phenomena.
However, renaissance of Raman spectroscopy is coming even
in the last two decades hand in hand with technical
advancements as are new extremely sensitive detection devices
latest developments, efficient filters for filtering Raman
scattered light from the Rayleigh scattering and introducing
lasers as light sources and also innovative laser technology
designs [2].
The fact, that Raman spectroscopy is very flexible method
in majority of sciences and technical branches, has been
repeatedly proven during recent years, when problems from
different scientific areas have been solved.
A structure and a composition of materials influence their
physical utility properties and consequently characteristics of
products fabricated from these materials. In many cases strict
and specific conditions that must be complied are given.
Critical properties on the possibility borders of examination
must be attested. Raman spectroscopy is a powerful tool for
such verification within a wide range of scientific disciplines.
This rapid technique allows quick identification of materials,
gives information on the structure, spatial arrangement of
molecules and structural analyses. Analogically to the reality
that every human being in the world has different – unique –
set of fingerprints by which can be identified, also every
individual substance has its own unique Raman spectrum
characteristic only for the respective substance. Except
material identification Raman spectroscopy also enables
observation of the structural changes dynamics, mapping of
samples and depth scanning.
With regard to Raman molecular structure fingerprint this
analytical method is suitable particularly for qualitative
analyses, but can be also used for quantification, because the
intensity of Raman scattered light is related to the amount of
particular substance in a sample. Quantitative studies require
often non-linear calibrations and standardization of the Raman
signal. When doing quantitative analyses it is crucial to have
as stable instrument as is possible, to assure measurement
parameters identity as are laser power, time of irradiation,
spectral resolution, number of acquisitions or sample
orientation and also consider data post-processing. Obviously
doing quantitative analyses of liquids and (water) solutions is
better and more proper than analyses of solids because of their
bigger homogeneity.
A powerful tool for material identification:
Raman spectroscopy
Hana Vašková
L
INTERNATIONAL JOURNAL OF MATHEMATICAL MODELS AND METHODS IN APPLIED SCIENCES
Issue 7, Volume 5, 2011 1205
II. RAMAN AND INFRARED SPECTROSCOPY
Raman spectroscopy and infrared spectroscopy are adverted
as complementary techniques. Both methods provide
information about vibrational and rotational transitions in
molecule and serve as a good tool for material identification
even though principles of these methods are different.
However, Raman spectroscopy is not so popular for the
chemical analysis of materials as is infrared spectroscopy.
Infrared spectroscopy is an absorption technique dealing
with the fact that molecules absorb specific frequencies that
define their structure. The output data are absorption spectra.
On the other hand Raman spectroscopy provides emission
spectra originated during interaction of the monochromatic
excitation laser beam with molecules, which emit on for the
matter characteristic frequencies. This elemental difference is
shown in Fig. 1.
Fig. 1 Differences of light-matter interaction of infrared and
Raman spectroscopy
Certain substances have high-quality both Raman and IR
features, but for instance centrosymmetric molecules modes
give a rise either Raman or infrared spectra but not both.
Strong infrared absorptions usually appear as weak Raman
signal and vice versa. Infrared spectroscopy has more intensive
signal for small polar molecules and single bonded chemical
compounds like C-C, C-O, C-H etc. Large absorption bands of
water caused by containment of high absorptivity values
functional groups disallow infrared measurement of water
solutions. On the contrary presence of water in a sample can
be determined with ease. Intensive spectra of polyatomic
inorganic chemical compounds and majority of organic
matters yields Raman spectroscopy. Raman spectrum of water
is minimal thereby substances dissolved in water can be
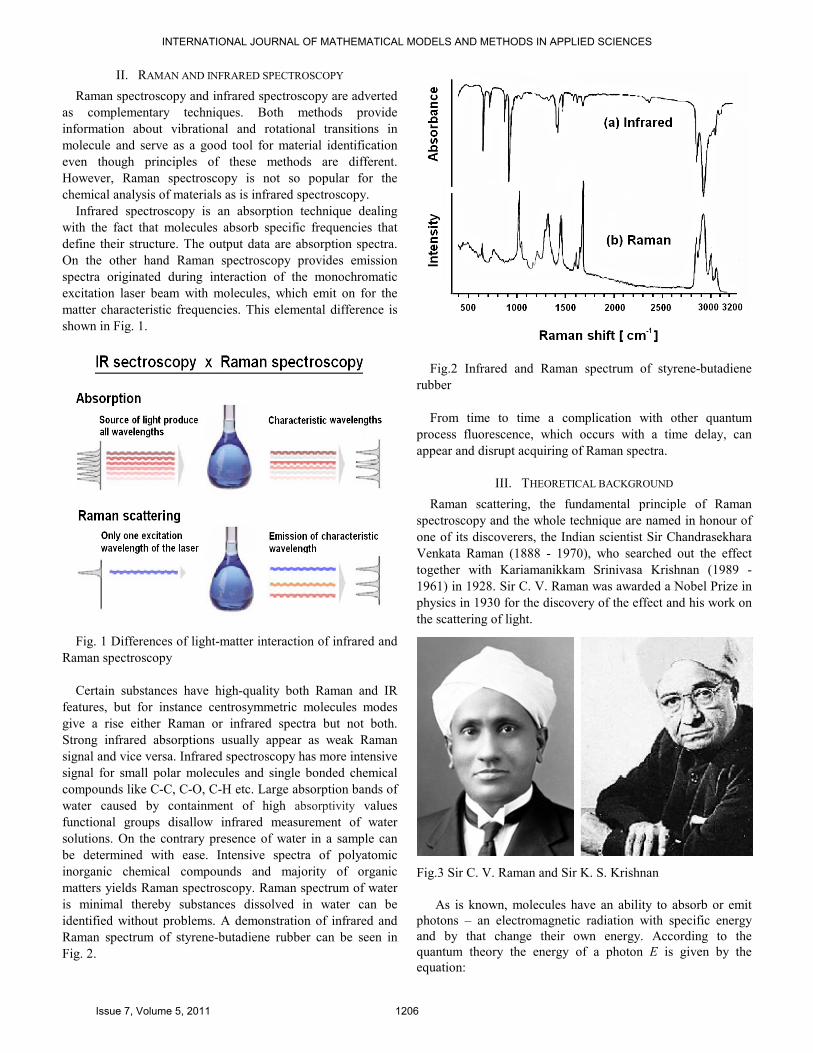
identified without problems. A demonstration of infrared and
Raman spectrum of styrene-butadiene rubber can be seen in
Fig. 2.
Fig.2 Infrared and Raman spectrum of styrene-butadiene
rubber
From time to time a complication with other quantum
process fluorescence, which occurs with a time delay, can
appear and disrupt acquiring of Raman spectra.
III. THEORETICAL BACKGROUND
Raman scattering, the fundamental principle of Raman
spectroscopy and the whole technique are named in honour of
one of its discoverers, the Indian scientist Sir Chandrasekhara
Venkata Raman (1888 - 1970), who searched out the effect
together with Kariamanikkam Srinivasa Krishnan (1989 -
1961) in 1928. Sir C. V. Raman was awarded a Nobel Prize in
physics in 1930 for the discovery of the effect and his work on
the scattering of light.
Fig.3 Sir C. V. Raman and Sir K. S. Krishnan
As is known, molecules have an ability to absorb or emit
photons – an electromagnetic radiation with specific energy
and by that change their own energy. According to the
quantum theory the energy of a photon E is given by the
equation:
INTERNATIONAL JOURNAL OF MATHEMATICAL MODELS AND METHODS IN APPLIED SCIENCES
Issue 7, Volume 5, 2011 1206
νhE = (1)
or
νhcE = , (2)
where h is Planck’s constant, ν is its frequency, ν is the
wavenumber, thus the reciprocal wavelength. Mentioned
specific energy ∆E have to fulfill following quantum condition
λ
νhc
hEEE qp ==−=∆ . (3)
Ep and Eq are energies of different quantum states in which a
molecule can exists, c is the velocity of light and λ is the
wavelength. So the energy of a molecule will be changed by an
amount E, if the molecule absorbs or emits the photon.
Raman effect occurs when a researched material is
irradiated by an intense monochromatic light. A major part of
light beam usually from near infrared, visible or near
ultraviolet range is scattered without changes in frequency, no
energy is gained or lost, i. e. Rayleigh (elastic) scattering, a
part is absorbed and a remained tiny fraction, important for the
origin of the spectra, is non-elastically scattered. After
interaction of the photon with the molecule, particularly with
the electron cloud and the bonds of the molecule, the photon
evokes molecule excitation from the ground state to a virtual
energy state.
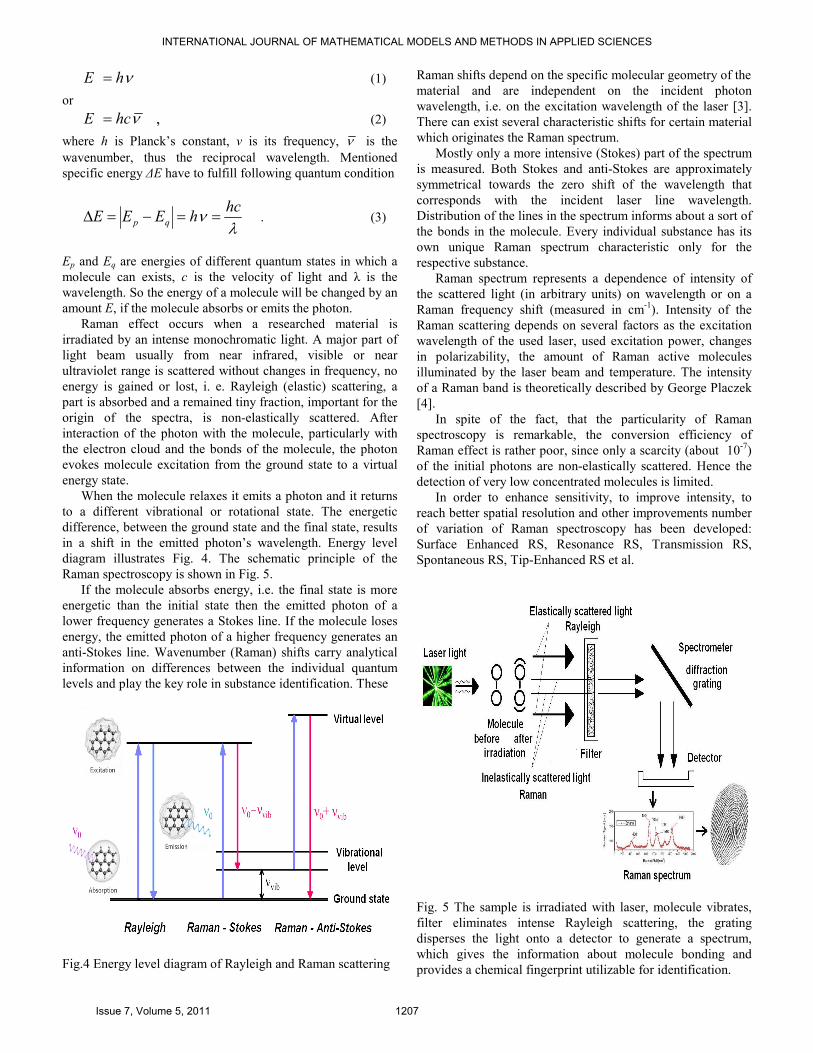
When the molecule relaxes it emits a photon and it returns
to a different vibrational or rotational state. The energetic
difference, between the ground state and the final state, results
in a shift in the emitted photon’s wavelength. Energy level
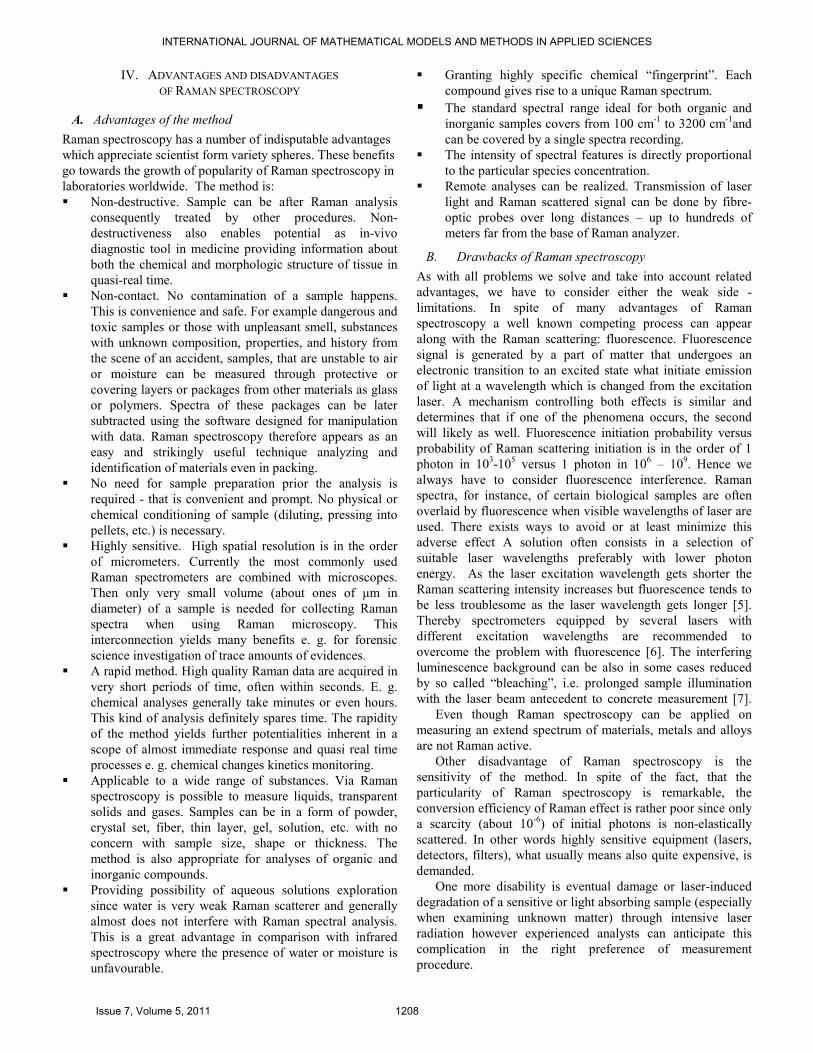
diagram illustrates Fig. 4. The schematic principle of the
Raman spectroscopy is shown in Fig. 5.
If the molecule absorbs energy, i.e. the final state is more
energetic than the initial state then the emitted photon of a
lower frequency generates a Stokes line. If the molecule loses
energy, the emitted photon of a higher frequency generates an
anti-Stokes line. Wavenumber (Raman) shifts carry analytical
information on differences between the individual quantum
levels and play the key role in substance identification. These
Fig.4 Energy level diagram of Rayleigh and Raman scattering
Raman shifts depend on the specific molecular geometry of the
material and are independent on the incident photon
wavelength, i.e. on the excitation wavelength of the laser [3].
There can exist several characteristic shifts for certain material
which originates the Raman spectrum.
Mostly only a more intensive (Stokes) part of the spectrum
is measured. Both Stokes and anti-Stokes are approximately
symmetrical towards the zero shift of the wavelength that
corresponds with the incident laser line wavelength.
Distribution of the lines in the spectrum informs about a sort of
the bonds in the molecule. Every individual substance has its
own unique Raman spectrum characteristic only for the
respective substance.
Raman spectrum represents a dependence of intensity of
the scattered light (in arbitrary units) on wavelength or on a
Raman frequency shift (measured in cm-1
). Intensity of the
Raman scattering depends on several factors as the excitation
wavelength of the used laser, used excitation power, changes
in polarizability, the amount of Raman active molecules
illuminated by the laser beam and temperature. The intensity
of a Raman band is theoretically described by George Placzek
[4].
In spite of the fact, that the particularity of Raman
spectroscopy is remarkable, the conversion efficiency of
Raman effect is rather poor, since only a scarcity (about 10-7
)
of the initial photons are non-elastically scattered. Hence the
detection of very low concentrated molecules is limited.
In order to enhance sensitivity, to improve intensity, to
reach better spatial resolution and other improvements number
of variation of Raman spectroscopy has been developed:
Surface Enhanced RS, Resonance RS, Transmission RS,
Spontaneous RS, Tip-Enhanced RS et al.
Fig. 5 The sample is irradiated with laser, molecule vibrates,
filter eliminates intense Rayleigh scattering, the grating
disperses the light onto a detector to generate a spectrum,
which gives the information about molecule bonding and
provides a chemical fingerprint utilizable for identification.
INTERNATIONAL JOURNAL OF MATHEMATICAL MODELS AND METHODS IN APPLIED SCIENCES
Issue 7, Volume 5, 2011 1207
IV. ADVANTAGES AND DISADVANTAGES
OF RAMAN SPECTROSCOPY
A. Advantages of the method
Raman spectroscopy has a number of indisputable advantages
which appreciate scientist form variety spheres. These benefits
go towards the growth of popularity of Raman spectroscopy in
laboratories worldwide. The method is:
� Non-destructive. Sample can be after Raman analysis
consequently treated by other procedures. Non-
destructiveness also enables potential as in-vivo
diagnostic tool in medicine providing information about
both the chemical and morphologic structure of tissue in
quasi-real time.
� Non-contact. No contamination of a sample happens.
This is convenience and safe. For example dangerous and
toxic samples or those with unpleasant smell, substances
with unknown composition, properties, and history from
the scene of an accident, samples, that are unstable to air
or moisture can be measured through protective or
covering layers or packages from other materials as glass
or polymers. Spectra of these packages can be later
subtracted using the software designed for manipulation
with data. Raman spectroscopy therefore appears as an
easy and strikingly useful technique analyzing and
identification of materials even in packing.
� No need for sample preparation prior the analysis is
required - that is convenient and prompt. No physical or
chemical conditioning of sample (diluting, pressing into
pellets, etc.) is necessary.
� Highly sensitive. High spatial resolution is in the order
of micrometers. Currently the most commonly used
Raman spectrometers are combined with microscopes.
Then only very small volume (about ones of µm in
diameter) of a sample is needed for collecting Raman
spectra when using Raman microscopy. This
interconnection yields many benefits e. g. for forensic
science investigation of trace amounts of evidences.
� A rapid method. High quality Raman data are acquired in
very short periods of time, often within seconds. E. g.
chemical analyses generally take minutes or even hours.
This kind of analysis definitely spares time. The rapidity
of the method yields further potentialities inherent in a
scope of almost immediate response and quasi real time
processes e. g. chemical changes kinetics monitoring.
� Applicable to a wide range of substances. Via Raman
spectroscopy is possible to measure liquids, transparent
solids and gases. Samples can be in a form of powder,
crystal set, fiber, thin layer, gel, solution, etc. with no
concern with sample size, shape or thickness. The
method is also appropriate for analyses of organic and
inorganic compounds.
� Providing possibility of aqueous solutions exploration
since water is very weak Raman scatterer and generally
almost does not interfere with Raman spectral analysis.
This is a great advantage in comparison with infrared
spectroscopy where the presence of water or moisture is
unfavourable.
� Granting highly specific chemical “fingerprint”. Each
compound gives rise to a unique Raman spectrum.
� The standard spectral range ideal for both organic and
inorganic samples covers from 100 cm-1
to 3200 cm-1
and
can be covered by a single spectra recording. � The intensity of spectral features is directly proportional
to the particular species concentration.
� Remote analyses can be realized. Transmission of laser
light and Raman scattered signal can be done by fibre-
optic probes over long distances – up to hundreds of
meters far from the base of Raman analyzer.
B. Drawbacks of Raman spectroscopy
As with all problems we solve and take into account related
advantages, we have to consider either the weak side -
limitations. In spite of many advantages of Raman
spectroscopy a well known competing process can appear
along with the Raman scattering: fluorescence. Fluorescence
signal is generated by a part of matter that undergoes an
electronic transition to an excited state what initiate emission
of light at a wavelength which is changed from the excitation
laser. A mechanism controlling both effects is similar and
determines that if one of the phenomena occurs, the second
will likely as well. Fluorescence initiation probability versus
probability of Raman scattering initiation is in the order of 1
photon in 103-10
5 versus 1 photon in 10
6 – 10
9. Hence we
always have to consider fluorescence interference. Raman
spectra, for instance, of certain biological samples are often
overlaid by fluorescence when visible wavelengths of laser are
used. There exists ways to avoid or at least minimize this
adverse effect A solution often consists in a selection of
suitable laser wavelengths preferably with lower photon
energy. As the laser excitation wavelength gets shorter the
Raman scattering intensity increases but fluorescence tends to
be less troublesome as the laser wavelength gets longer [5].
Thereby spectrometers equipped by several lasers with
different excitation wavelengths are recommended to
overcome the problem with fluorescence [6]. The interfering
luminescence background can be also in some cases reduced
by so called “bleaching”, i.e. prolonged sample illumination
with the laser beam antecedent to concrete measurement [7].
Even though Raman spectroscopy can be applied on
measuring an extend spectrum of materials, metals and alloys
are not Raman active.
Other disadvantage of Raman spectroscopy is the
sensitivity of the method. In spite of the fact, that the
particularity of Raman spectroscopy is remarkable, the
conversion efficiency of Raman effect is rather poor since only
a scarcity (about 10-6
) of initial photons is non-elastically
scattered. In other words highly sensitive equipment (lasers,
detectors, filters), what usually means also quite expensive, is
demanded.
One more disability is eventual damage or laser-induced
degradation of a sensitive or light absorbing sample (especially
when examining unknown matter) through intensive laser
radiation however experienced analysts can anticipate this
complication in the right preference of measurement
procedure.
INTERNATIONAL JOURNAL OF MATHEMATICAL MODELS AND METHODS IN APPLIED SCIENCES
Issue 7, Volume 5, 2011 1208
V. APPLICATIONS
Raman spectroscopy has been reborn in recent years. As the
more sophisticated spectroscopic and computer technology
access increased, Raman spectroscopy has become a tool for
not only purely research, but also for contrivable routine
industrial analyses. These days, Raman spectroscopy finds
applications, which number is still rising, in variety scientific
and industrial disciplines and branches such as:
� Material sciences including semiconductor industry,
nanotechnology, solid state physics, synthetic polymer
materials and others. Raman spectroscopy is one of the
best-known methods, it is of central importance for all
the specification and structural analysis of almost all
kinds of materials (amorphous, partially crystallic,
transparent, non-transparent samples, samples with
different surface textures).
� Nanotechnology. Raman spectroscopy is suitable
technique for characterization of nanomaterials as nano-
composites, nano-sized crystals, polymers and
semiconductors developed in a form of films, wires or
dots or modern and ancient ceramics. The method
provides determination of nanocrystals, chirality,
semidiameters in nanomaterials, also characterizing
micromechanical behavior or synthesis processes control
(polymer curing, laser ablation, electrochemical
deposition). It is a good tool for mapping and probing
nanophases dispersed in matrix.
� Semiconductor industry. Raman spectroscopy allows
semiconductor impurities determination in silicone
substrates and diamond-like carbon coatings (a point
measurement on silicone can be obtained in about 0.1
second), identification of defects particles on the material
surfaces. Such results notably affect device yields and the
economics of the process line.
� Solid-state physics. Raman spectroscopy systems find
application in material characterization, finding the
crystallographic orientation, etc.
� Synthetic polymer materials. Raman spectroscopy
serves for real-time monitoring of polymerization
reactions for the purpose of controlling the processing
time, for plastic identification for recycling purposes,
measuring the thickness of polymers such as protective
and coating films, evaluation of polymer material under
applied strain or quality control of incoming/outgoing
products.
� Chemistry. Raman spectroscopy provides a chemical
fingerprint for identification of a molecule, since
vibrational information is specific to the chemical bonds
and symmetry of molecules. Except for identification the
method is used for characterization and analyses of
organic and inorganic substances, including carbon
materials, solvents, films and for chemical processes
monitoring.
� Forensic sciences. Forensic scientists often deals with
really unknown samples that cannot be reproduced,
require multiple analyses, but their amount is limited.
Raman spectroscopy/microscopy is becoming a tool of
major importance in forensic science since it satisfies
most of forensic examination criteria, as are mentioned
above in advantages: it is a non-destructive, non-contact
method without the necessity of sample preparation and
possibility of application on a wide range of materials.
In-situ measurements can be realized, meaning no
contamination of evidences during taking samples [4].
Raman microscopy brings benefits of optical microscopy,
what means that the sample can be surveyed under
microscope, particles or locations isolated and
consequently their Raman spectra acquired.
Method is used for forensic analyses and rapid
identification of trace amounts of substances in evidential
materials as are paints, inks from documents, pigments,
explosive particles, inflammables, drugs, illegal active
ingredients, fibers, gunpowder residues, chemical and
biological agents, plastics and other various forensic
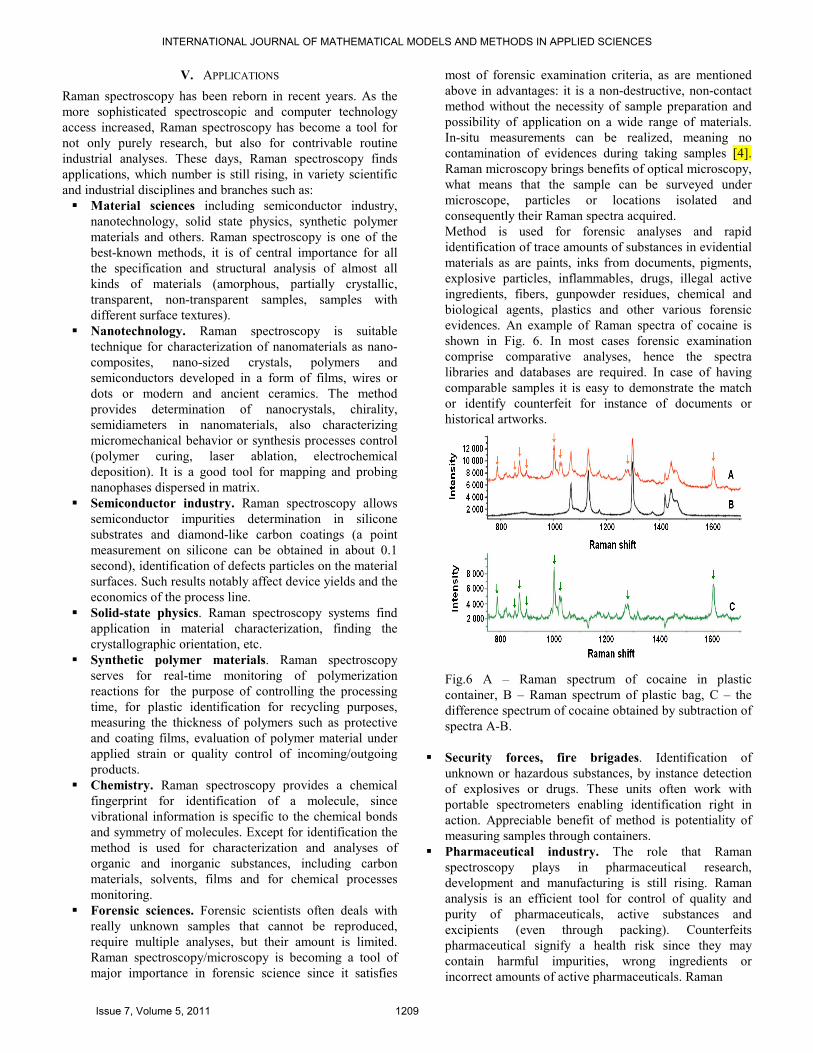
evidences. An example of Raman spectra of cocaine is
shown in Fig. 6. In most cases forensic examination
comprise comparative analyses, hence the spectra
libraries and databases are required. In case of having
comparable samples it is easy to demonstrate the match
or identify counterfeit for instance of documents or
historical artworks.
Fig.6 A – Raman spectrum of cocaine in plastic
container, B – Raman spectrum of plastic bag, C – the
difference spectrum of cocaine obtained by subtraction of
spectra A-B.
� Security forces, fire brigades. Identification of
unknown or hazardous substances, by instance detection
of explosives or drugs. These units often work with
portable spectrometers enabling identification right in
action. Appreciable benefit of method is potentiality of
measuring samples through containers.
� Pharmaceutical industry. The role that Raman
spectroscopy plays in pharmaceutical research,
development and manufacturing is still rising. Raman
analysis is an efficient tool for control of quality and
purity of pharmaceuticals, active substances and
excipients (even through packing). Counterfeits
pharmaceutical signify a health risk since they may
contain harmful impurities, wrong ingredients or
incorrect amounts of active pharmaceuticals. Raman
INTERNATIONAL JOURNAL OF MATHEMATICAL MODELS AND METHODS IN APPLIED SCIENCES
Issue 7, Volume 5, 2011 1209
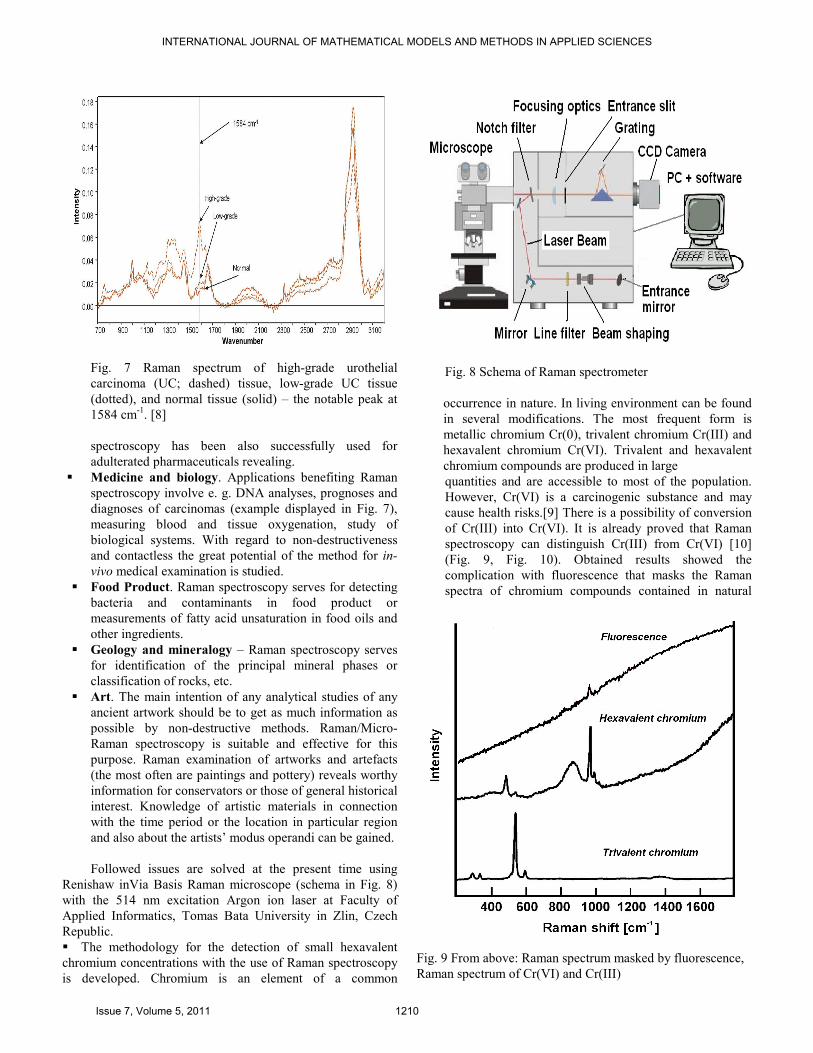
Fig. 7 Raman spectrum of high-grade urothelial
carcinoma (UC; dashed) tissue, low-grade UC tissue
(dotted), and normal tissue (solid) – the notable peak at
1584 cm-1
. [8]
spectroscopy has been also successfully used for
adulterated pharmaceuticals revealing.
� Medicine and biology. Applications benefiting Raman
spectroscopy involve e. g. DNA analyses, prognoses and
diagnoses of carcinomas (example displayed in Fig. 7),
measuring blood and tissue oxygenation, study of
biological systems. With regard to non-destructiveness
and contactless the great potential of the method for in-
vivo medical examination is studied.
� Food Product. Raman spectroscopy serves for detecting
bacteria and contaminants in food product or
measurements of fatty acid unsaturation in food oils and
other ingredients.
� Geology and mineralogy – Raman spectroscopy serves
for identification of the principal mineral phases or
classification of rocks, etc.
� Art. The main intention of any analytical studies of any
ancient artwork should be to get as much information as
possible by non-destructive methods. Raman/Micro-
Raman spectroscopy is suitable and effective for this
purpose. Raman examination of artworks and artefacts
(the most often are paintings and pottery) reveals worthy
information for conservators or those of general historical
interest. Knowledge of artistic materials in connection
with the time period or the location in particular region
and also about the artists’ modus operandi can be gained.
Followed issues are solved at the present time using
Renishaw inVia Basis Raman microscope (schema in Fig. 8)
with the 514 nm excitation Argon ion laser at Faculty of
Applied Informatics, Tomas Bata University in Zlin, Czech
Republic.
� The methodology for the detection of small hexavalent
chromium concentrations with the use of Raman spectroscopy
is developed. Chromium is an element of a common
Fig. 8 Schema of Raman spectrometer
occurrence in nature. In living environment can be found
in several modifications. The most frequent form is
metallic chromium Cr(0), trivalent chromium Cr(III) and
hexavalent chromium Cr(VI). Trivalent and hexavalent
chromium compounds are produced in large
quantities and are accessible to most of the population.
However, Cr(VI) is a carcinogenic substance and may
cause health risks.[9] There is a possibility of conversion
of Cr(III) into Cr(VI). It is already proved that Raman
spectroscopy can distinguish Cr(III) from Cr(VI) [10]
(Fig. 9, Fig. 10). Obtained results showed the
complication with fluorescence that masks the Raman
spectra of chromium compounds contained in natural
Fig. 9 From above: Raman spectrum masked by fluorescence,
Raman spectrum of Cr(VI) and Cr(III)
INTERNATIONAL JOURNAL OF MATHEMATICAL MODELS AND METHODS IN APPLIED SCIENCES
Issue 7, Volume 5, 2011 1210
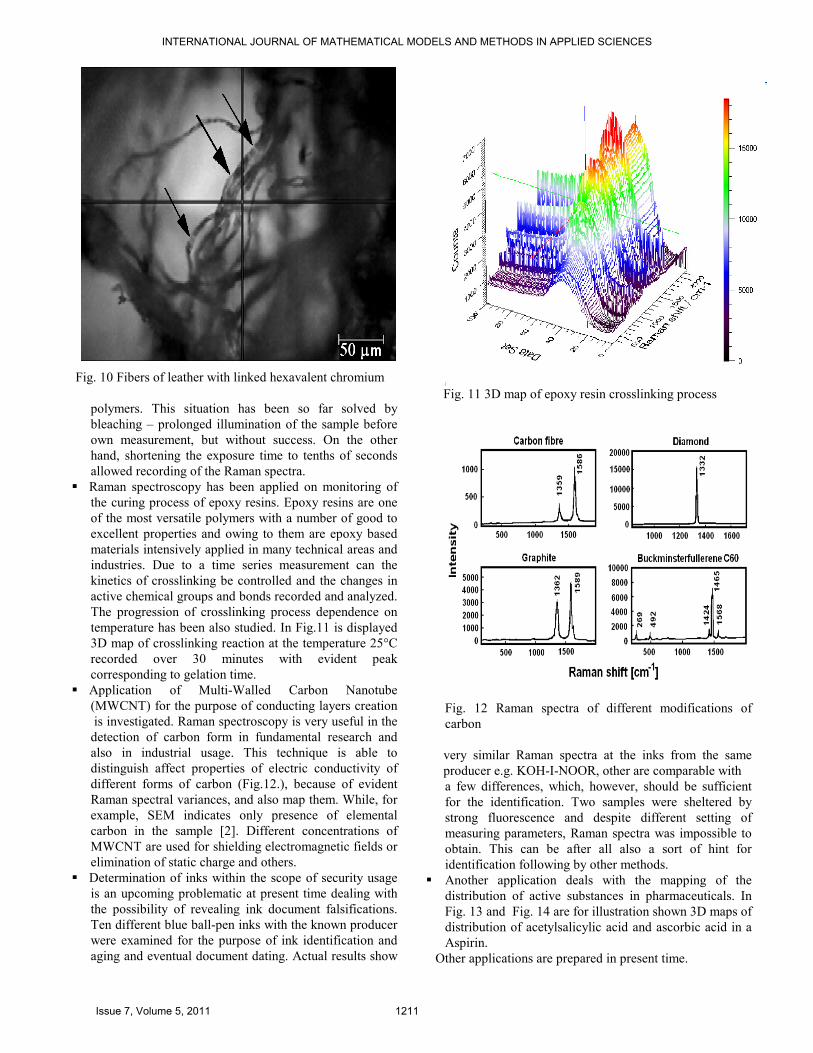
Fig. 10 Fibers of leather with linked hexavalent chromium
polymers. This situation has been so far solved by
bleaching – prolonged illumination of the sample before
own measurement, but without success. On the other
hand, shortening the exposure time to tenths of seconds
allowed recording of the Raman spectra.
� Raman spectroscopy has been applied on monitoring of
the curing process of epoxy resins. Epoxy resins are one
of the most versatile polymers with a number of good to
excellent properties and owing to them are epoxy based
materials intensively applied in many technical areas and
industries. Due to a time series measurement can the
kinetics of crosslinking be controlled and the changes in
active chemical groups and bonds recorded and analyzed.
The progression of crosslinking process dependence on
temperature has been also studied. In Fig.11 is displayed
3D map of crosslinking reaction at the temperature 25°C
recorded over 30 minutes with evident peak
corresponding to gelation time.
� Application of Multi-Walled Carbon Nanotube
(MWCNT) for the purpose of conducting layers creation
is investigated. Raman spectroscopy is very useful in the
detection of carbon form in fundamental research and
also in industrial usage. This technique is able to
distinguish affect properties of electric conductivity of
different forms of carbon (Fig.12.), because of evident
Raman spectral variances, and also map them. While, for
example, SEM indicates only presence of elemental
carbon in the sample [2]. Different concentrations of
MWCNT are used for shielding electromagnetic fields or
elimination of static charge and others.
� Determination of inks within the scope of security usage
is an upcoming problematic at present time dealing with
the possibility of revealing ink document falsifications.
Ten different blue ball-pen inks with the known producer
were examined for the purpose of ink identification and
aging and eventual document dating. Actual results show
Fig. 11 3D map of epoxy resin crosslinking process
Fig. 12 Raman spectra of different modifications of
carbon
very similar Raman spectra at the inks from the same
producer e.g. KOH-I-NOOR, other are comparable with
a few differences, which, however, should be sufficient
for the identification. Two samples were sheltered by
strong fluorescence and despite different setting of
measuring parameters, Raman spectra was impossible to
obtain. This can be after all also a sort of hint for
identification following by other methods.
� Another application deals with the mapping of the
distribution of active substances in pharmaceuticals. In
Fig. 13 and Fig. 14 are for illustration shown 3D maps of
distribution of acetylsalicylic acid and ascorbic acid in a
Aspirin.
Other applications are prepared in present time.
INTERNATIONAL JOURNAL OF MATHEMATICAL MODELS AND METHODS IN APPLIED SCIENCES
Issue 7, Volume 5, 2011 1211
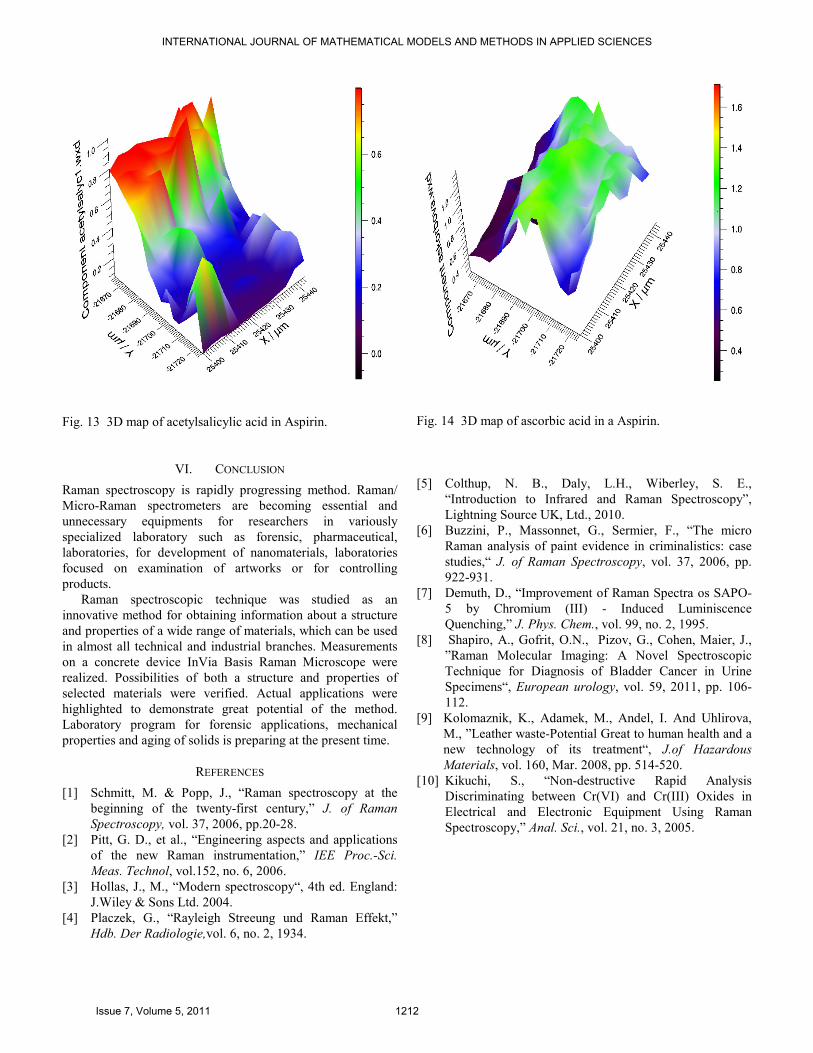
Fig. 13 3D map of acetylsalicylic acid in Aspirin.
VI. CONCLUSION
Raman spectroscopy is rapidly progressing method. Raman/
Micro-Raman spectrometers are becoming essential and
unnecessary equipments for researchers in variously
specialized laboratory such as forensic, pharmaceutical,
laboratories, for development of nanomaterials, laboratories
focused on examination of artworks or for controlling
products.
Raman spectroscopic technique was studied as an
innovative method for obtaining information about a structure
and properties of a wide range of materials, which can be used
in almost all technical and industrial branches. Measurements
on a concrete device InVia Basis Raman Microscope were
realized. Possibilities of both a structure and properties of
selected materials were verified. Actual applications were
highlighted to demonstrate great potential of the method.
Laboratory program for forensic applications, mechanical
properties and aging of solids is preparing at the present time.
REFERENCES
[1] Schmitt, M. & Popp, J., “Raman spectroscopy at the
beginning of the twenty-first century,” J. of Raman
Spectroscopy, vol. 37, 2006, pp.20-28.
[2] Pitt, G. D., et al., “Engineering aspects and applications
of the new Raman instrumentation,” IEE Proc.-Sci.
Meas. Technol, vol.152, no. 6, 2006.
[3] Hollas, J., M., “Modern spectroscopy“, 4th ed. England:
J.Wiley & Sons Ltd. 2004.
[4] Placzek, G., “Rayleigh Streeung und Raman Effekt,”
Hdb. Der Radiologie,vol. 6, no. 2, 1934.
Fig. 14 3D map of ascorbic acid in a Aspirin.
[5] Colthup, N. B., Daly, L.H., Wiberley, S. E.,
“Introduction to Infrared and Raman Spectroscopy”,
Lightning Source UK, Ltd., 2010.
[6] Buzzini, P., Massonnet, G., Sermier, F., “The micro
Raman analysis of paint evidence in criminalistics: case
studies,“ J. of Raman Spectroscopy, vol. 37, 2006, pp.
922-931.
[7] Demuth, D., “Improvement of Raman Spectra os SAPO-
5 by Chromium (III) - Induced Luminiscence
Quenching,” J. Phys. Chem., vol. 99, no. 2, 1995.
[8] Shapiro, A., Gofrit, O.N., Pizov, G., Cohen, Maier, J.,
”Raman Molecular Imaging: A Novel Spectroscopic
Technique for Diagnosis of Bladder Cancer in Urine
Specimens“, European urology, vol. 59, 2011, pp. 106-
112.
[9] Kolomaznik, K., Adamek, M., Andel, I. And Uhlirova,
M., ”Leather waste-Potential Great to human health and a
new technology of its treatment“, J.of Hazardous
Materials, vol. 160, Mar. 2008, pp. 514-520.
[10] Kikuchi, S., “Non-destructive Rapid Analysis
Discriminating between Cr(VI) and Cr(III) Oxides in
Electrical and Electronic Equipment Using Raman
Spectroscopy,” Anal. Sci., vol. 21, no. 3, 2005.
INTERNATIONAL JOURNAL OF MATHEMATICAL MODELS AND METHODS IN APPLIED SCIENCES
Issue 7, Volume 5, 2011 1212