Tampere University of Technology. Publication 788
263
Transcript of Tampere University of Technology. Publication 788

Tampereen teknillinen yliopisto. Julkaisu 788 Tampere University of Technology. Publication 788 Jukka Perko IT Governance and Enterprise Architecture as Prerequisites for Assimilation of Service-Oriented Architecture
An Empirical Study of Large Finnish Companies Thesis for the degree of Doctor of Technology to be presented with due permission for public examination and criticism in Tietotalo Building, Auditorium TB104, at Tampere University of Technology, on the 19th of December 2008, at 12 noon. Tampereen teknillinen yliopisto - Tampere University of Technology Tampere 2008

ISBN 978-952-15-2093-8 (printed) ISBN 978-952-15-2119-5 (PDF) ISSN 1459-2045

Perko, Jukka. 2008. IT Governance and Enterprise Architecture as Prerequisites for Assimilation of Service-Oriented Architecture. An Empirical Study of Large Finnish Companies. Department of Business Information Management and Logistics, Tampere University of Technology, Tampere, Finland.
Keywords: IT governance, enterprise architecture, service-oriented architecture, information technology diffusion, maturity models.
iii
Abstract
Companies are facing increasing requirements for adaptivity and flexibility but also for efficiency and cost-effectiveness. Information technology has become more complex and often limits a company’s ability to change. IT governance and enterprise architecture (EA) are approaches intended to assist companies in ensuring value from IT and managing change. Service-oriented architecture (SOA) is a new design paradigm and a technical architecture. The study researched the aggregated adoptions of these innovations in large Finnish companies.
The study attempts to answer the following research questions: 1) How widely is SOA adopted by top 50 Finnish companies and what are the companies’ perceptions of SOA characteristics? 2) What is the level of the companies’ IT governance capabilities and IT governance performance? 3) How mature is enterprise architecture in large Finnish companies? 4) Does the study suggest a relationship between an organization’s IT governance capabilities, EA maturity and SOA adoption? The theoretical background of this dissertation relies on existing knowledge of IT governance, EA and SOA, and maturity models. The research framework is based on traditional and IT diffusion research literature. The main data-gathering method was survey, conducted as conversational telephone interviews. Statistical methods were used to assist in the data analysis. Yet, the main purpose of the study was to understand, interpret and explain IT governance, EA and SOA in large Finnish companies.
The study found that the diffusion of IT governance has saturated, while EA and SOA have reached the late majority adoption phase. The wide-scale adoption rate of SOA is increasing; financial and insurance, ICT, and transportation and storage industries are among the early adopters. The study describes the differences in IT governance capabilities, EA maturity characteristics and SOA perceptions between SOA adopters and non-SOA adopters. The study found indications of a relationship between IT governance and EA; high EA maturity was found positively related with high IT governance performance. In addition, high EA maturity had a positive effect on many IT governance capabilities. The results of the study suggest that IT governance and EA can be regarded as prerequisites for assimilation of SOA; two thirds of companies at assimilation stage of SOA had adopted EA while the adoption rate for non-SOA adopters was found to be significantly lower.

iv
Tiivistelmä
Yrityksiltä vaaditaan enenevässä määrin sopeutumiskykyä ja joustavuutta, mutta toisaalta myös tehokkuutta ja taloudellisuutta. Informaatioteknologiasta on tullut entistä monimutkaisempaa, mikä usein rajoittaa yrityksen kykyä muuttua. IT governance (hyvä tiedonhallintatapa) ja kokonaisarkkitehtuuri ovat lähestymistapoja, jotka auttavat yritystä IT:n lisäarvon tuottamisessa ja muutoksen hallinnassa. Palvelukeskeinen arkkitehtuuri (SOA) on uusi suunnitteluparadigma ja tekninen arkkitehtuuri. Väitöstutkimuksessa tarkastellaan näiden innovaatioden käyttöönottojen yhdistelmää suomalaisissa suuryrityksissä.
Tutkimuksen tavoitteena on vastata seuraaviin tutkimuskysymyksiin: 1) Miten laajasti SOA on otettu käyttöön suomalaisissa suuryrityksissä? 2) Millä tasolla yritysten IT governance- kyvykkyydet ja IT governance-suorituskyky ovat? 3) Mikä on suurten suomalaisten yritysten kokonaisarkkitehtuurin kypsyysaste? 4) Antaako tutkimus viitteitä riippuvuuksista yrityksen IT governance-kyvykkyyksien, kokonaisarkkitehtuurin kypsyysasteen ja SOAn käyttöönoton välillä? Tutkimuksen viitekehys perustuu perinteisen ja informaatioteknologian diffuusiotutkimuksen kirjallisuuteen. Tutkimusaineisto kerättiin kyselytutkimuksella, joka toteutettiin vuorovaikutteisena puhelinhaastatteluna. Tutkimuksessa sovellettiin tilastollisia menetelmiä tietoaineiston analysointiin. Tästä huolimatta tutkimuksen pääasiallinen tarkoitus oli ymmärtää, tulkita ja selittää IT governancen, kokonaisarkkitehtuurin ja SOAn käyttöönottoja suomalaisissa suuryrityksissä.
Väitöstutkimuksen mukaan IT governance-diffuusio on saavuttanut kyllästymisasteen, kun taas kokonaisarkkitehtuurin ja SOAn diffuusio on myöhäisen enemmistön vaiheessa. SOA- assimilaatioiden (laajamittaisten SOA-käyttöönottojen) määrän kasvu on kiihtymässä; finanssi ja vakuutus, ICT, sekä kuljetus ja varastointi ovat toimialoista ensimmäisiä laajamittaisia käyttöönottajia. Tutkimus löysi eroavuuksia SOA-käyttöönottajien ja muiden tutkittujen yritysten välillä IT governance-kyvykkyyksissä, kokonaisarkkitehtuurin kypsyysasteessa ja SOA-näkemyksissä. Tutkimus antaa viitteitä IT governancen ja kokonaisarkkitehtuurin välisestä riippuvuussuhteesta. Tutkimuksen mukaan yrityksillä, jotka ovat saavuttaneet korkean kokonaisarkkitehtuurin kypsyysasteen, on usein myös korkea IT governance-suorityskyky. Korkealla kokonaisarkkitehtuurin kypsyysasteella havaittiin olevan positiivinen vuorovaikutussuhde monien IT governance-kyvykkyyksien kanssa. Tutkimus viittaa siihen, että IT governancen ja kokokonaisarkkitehtuurin käyttöönottoja voidaan pitää SOA-assimilaation etukäteisvaatimuksina. Kaksi kolmasosaa yrityksistä, jotka käyttävät SOAa laajamittaisesti ovat ottaneet käyttöön myös kokonaisarkkitehtuurin; niiden yritysten joukossa, jotka eivät olleet ottaneet SOAa käyttöön, kokonaisarkkitehtuurin käyttöönottoaste on merkittävästi alhaisempi.

v
Acknowledgements
Conducting the research for this dissertation has been a challenging and yet rewarding project. In many phases, it has been a process of learning by doing - making mistakes, analyzing the causes and then correcting the mistakes. Starting the study and carrying on with it would not have been possible without several people.
First, I wish to thank Professor Mika Hannula for guiding my research, giving encouragement when it was needed, and giving valuable comments during the various phases of the project. Since the first meeting, his positive attitude motivated hard work that was needed to overcome the challenges.
Dr. Marja Naaranoja and Professor Jukka Heikkilä reviewed the manuscript of this thesis. Discussions with them were inspiring and their constructive criticism and comments assisted me significantly in improving the manuscript.
M.Sc. Jaani Väisänen assisted me in the choice and use of statistical methods and tools that were used in the analysis of the survey data. I am also grateful to M.A. Anne Monto for reviewing the language of the manuscript.
In the early phases of the study, comments by Professor Erkki Uusi-Rauva, Dr. Petri Suomala and post-graduate student colleagues assisted me in selecting the research topic.
I would like to thank the pilot group that assisted me in designing and improving the questionnaire of the survey. Many thanks also belong to the persons that agreed to be interviewed despite of their busy schedules - without their assistance the study would have failed in one of its critical phases.
My employer, the Finnish Defence Forces, sponsored the project in the form of leave of absence for my studies.
My sincere thanks for my wife Tuula; she had the strength to support me through the project. Finally, I would like to thank my daughter Laura; by starting her own studies, she inspired me to start mine.

vi
Table of Contents
ABSTRACT.......................................................................................................................................... III TIIVISTELMÄ ..................................................................................................................................... IV ACKNOWLEDGEMENTS................................................................................................................... V TABLE OF CONTENTS...................................................................................................................... VI LIST OF FIGURES .............................................................................................................................. IX LIST OF TABLES................................................................................................................................ XI 1. INTRODUCTION .............................................................................................................................. 1
1.1. BACKGROUND FOR THE RESEARCH ................................................................................ 1 1.2. PREVIOUS RESEARCH........................................................................................................... 6
2. RESEARCH PROBLEM AND STRATEGY .................................................................................. 14 2.1. RESEARCH PROCESS........................................................................................................... 14 2.2. SELECTION OF THE RESEARCH TOPIC ........................................................................... 15 2.3. FORMULATION OF THE RESEARCH PROBLEM ............................................................ 17 2.4. PLANNING OF THE RESEARCH STRATEGY ................................................................... 19
3. UNDERLYING THEORIES AND CONCEPTS............................................................................. 24 3.1. IT GOVERNANCE.................................................................................................................. 24
3.1.1 Enterprise governance....................................................................................................... 24 3.1.2 Why do we need IT governance?...................................................................................... 26 3.1.3 What is IT governance? .................................................................................................... 28 3.1.4 Approaches to IT governance ........................................................................................... 32 3.1.5 Benefits and challenges of IT governance ........................................................................ 36
3.2. ENTERPRISE ARCHITECTURE........................................................................................... 39 3.2.1 Why do we need enterprise architecture? ......................................................................... 39 3.2.2 What is enterprise architecture? ........................................................................................ 41 3.2.3 EA governance and management...................................................................................... 47 3.2.4 Approaches to enterprise architecture............................................................................... 48 3.2.5 Benefits and challenges of Enterprise Architecture .......................................................... 51
3.3. IT GOVERNANCE & ENTERPRISE ARCHITECTURE ..................................................... 54 3.4. SERVICE-ORIENTED ARCHITECTURE (SOA) ................................................................. 59
3.4.1 What is Service-Oriented Architecture? ........................................................................... 59 3.4.2 Why do we need Service-oriented architecture?............................................................... 60 3.4.3 Key concepts of Service-Oriented Architecture ............................................................... 62 3.4.4 Benefits of SOA ................................................................................................................ 69

vii
3.4.5 Transition to SOA ............................................................................................................. 71 3.5. ASSESSMENT AND MATURITY MODELS ....................................................................... 74
3.5.1 Balanced scorecard, TQM and assessment models........................................................... 74 3.5.2 Maturity models ................................................................................................................ 76 3.5.3 Assessment of IT governance ........................................................................................... 79 3.5.4 Enterprise architecture maturity........................................................................................ 82
3.6. DIFFUSION OF INNOVATIONS........................................................................................... 86 3.6.1 What is innovation?........................................................................................................... 86 3.6.2 What is diffusion? ............................................................................................................. 91 3.6.3 Diffusion of information systems and information technology ........................................ 97 3.6.4 Assimilation gaps ............................................................................................................ 100
4. DESIGN AND IMPLEMENTATION OF THE EMPIRICAL STUDY........................................ 101 4.1. RESEARCH FRAMEWORK ................................................................................................ 101 4.2. DESIGN OF THE SURVEY.................................................................................................. 105
4.2.1 Construct of the survey ................................................................................................... 105 4.2.2 Selection of the survey sample and method.................................................................... 107 4.2.3 Design of the questionnaire............................................................................................. 109 4.2.4 Questionnaire contents .................................................................................................... 110
4.3. DATA GATHERING............................................................................................................. 115 4.3.1 Description of the data gathering process ....................................................................... 115 4.3.2 Assessment of the data gathering process....................................................................... 117
4.4. DATA PROCESSING, ANALYSIS AND INTERPRETATION ......................................... 120 4.4.1 Description of data processing ........................................................................................ 120 4.4.2 Methods used in data analysis and interpretation ........................................................... 121
5. RESULTS OF THE EMPIRICAL STUDY ................................................................................... 124 5.1. RESULTS OF THE SURVEY............................................................................................... 124
5.1.1 SOA Adoption................................................................................................................. 124 5.1.2 IT governance capabilities .............................................................................................. 128 5.1.3 Enterprise architecture maturity...................................................................................... 134 5.1.4 Perceived SOA characteristics ........................................................................................ 145 5.1.5 Perceived organizational characteristics ......................................................................... 150
5.2. ANALYSIS OF THE SURVEY RESULTS .......................................................................... 151 5.2.1 Adoptions of SOA, IT governance and EA .................................................................... 151 5.2.2 Comparison of SOA adopters and non-adopters............................................................. 160 5.2.3 Reflection of results ........................................................................................................ 182
6. INTEGRATION OF RESULTS..................................................................................................... 186 6.1. KEY FINDINGS OF THE STUDY ....................................................................................... 186

viii
6.1.1 Service-oriented architecture adoption ........................................................................... 186 6.1.2 IT governance capabilities and EA maturity................................................................... 187 6.1.3 Perceived SOA characteristics ........................................................................................ 192 6.1.4 Organizational characteristics ......................................................................................... 193 6.1.5 IT governance and EA as prerequisites for assimilation of SOA ................................... 194
6.2. LIMITATIONS OF THE STUDY ......................................................................................... 195 6.3. IMPLICATIONS OF THE STUDY....................................................................................... 198
6.3.1 Implications for theory.................................................................................................... 198 6.3.2 Implications for the practitioners .................................................................................... 199 6.3.3 Suggestions for further research...................................................................................... 201
6.4. DISCUSSION......................................................................................................................... 202 7. REFERENCES ............................................................................................................................... 205 APPENDIX A: THE QUESTIONNAIRE IN ENGLISH .................................................................. 224 APPENDIX B: THE QUESTIONNAIRE IN FINNISH.................................................................... 236
ix
List of Figures
Figure 1-1 Characteristics of Push and Pull systems (based on Brown & Hagel 2005)......................... 3 Figure 1-2 The role of IT function in organizations (Salle 2004) .......................................................... 4 Figure 1-3 Distribution of the surveyed papers in time (Langenberg & Wegmann 2004)..................... 8 Figure 1-4 Top EA objectives (Infosys 2005) ...................................................................................... 10 Figure 2-1 The research process of the study, based on McNabb (2004, 67), Olkkonen (1994), and Jenkins (1985)....................................................................................................................................... 14 Figure 2-2 The research timeline .......................................................................................................... 15 Figure 2-3 The basic setting for the research........................................................................................ 17 Figure 2-4 Relative positioning of research approaches (Kasanen et al 1991) .................................... 20 Figure 3-1 Enterprise governance framework (IFAC 2004, 20) .......................................................... 25 Figure 3-2 IT project resolution history (Standish group CHAOS database, cited in Johnson 2006).. 27 Figure 3-3 The strategic alignment model (Henderson & Venkatraman 1993, 476) ........................... 29 Figure 3-4 The focus of IT Governance and IT Management (Peterson 2003) ................................... 31 Figure 3-5 The most common patterns of governance for all enterprises (Weill & Ross 2004a, 64) .. 34 Figure 3-6 Information systems architecture framework (Zachman & Sofa 1992) ............................. 44 Figure 3-7 EA Transition Strategy (OMB 2005, 35, based on Zachman & Sofa 1992) ...................... 46 Figure 3-8 TOGAF Architecture Development Cycle with expansion (The Opengroup 2003a)......... 49 Figure 3-9 Federal Enterprise Architecture Framework, Level III (CIO Council 1999) ..................... 50 Figure 3-10 A foundation for strategy execution (Ross et al 2006, 10) ............................................... 55 Figure 3-11 The focus of enterprise governance and IT governance in relation to EA ....................... 56 Figure 3-12 Enterprise architecture value in relation to scope (Bredemayer & Malan 2004).............. 57 Figure 3-13 Different types of integration and standardization needs (Ross et al 2006) ..................... 58 Figure 3-14 The service provide and service consumer communicate via messages........................... 63 Figure 3-15 The discovery of services (based on Campbell & Mohun 2007, 162).............................. 65 Figure 3-16 An example of a business activity (based on Cabrera et al 2004) .................................... 66 Figure 3-17 The model-driven enterprise (Kano et al 2005, 670) ........................................................ 67 Figure 3-18 Enterprise processing locig and structure of layers in SOA (Erl 2005, 337).................... 68 Figure 3-19 Three stages of orchestration maturity (Hagel et al 2002)................................................ 72 Figure 3-20 Value and complexity of SOA adoption (Campbell & Mohun 2007, 289) ...................... 73 Figure 3-21 Structure of CMM (Paulk et al 1993, 15) ......................................................................... 77 Figure 3-22 The five levels of process maturity (Paulk et al 1993, based on Humphrey 1988) .......... 77 Figure 3-23 ITIM maturity stages and critical processes (GAO 2004a, 11) ........................................ 81 Figure 3-24 EAMMF matrix with five maturity stages (GAO 2003, 7)............................................... 83 Figure 3-25 The six maturity stages of OMB EA Assessment Framework (OMB2005)..................... 84 Figure 3-26 The four stages of enterprise architecture maturity (Ross 2006) ...................................... 86 Figure 3-27 Conceptualizing a technological system (Tether 2003, 15) .............................................. 89 Figure 3-28 Innovation process (based on Tidd et al 2005, 66-67)...................................................... 90 Figure 3-29 The Diffusion Process (Rogers 2003, 11)......................................................................... 92

x
Figure 3-30 The innovation-decision process (Rogers 2003, 170)....................................................... 93 Figure 3-31 Revised technology adoption life cycle (Moore 2006, 16) ............................................... 95 Figure 3-32 IT Diffusion Framework (Fichman 1992) ........................................................................ 98 Figure 3-33 Assimilation gap (Fichman and Kemerer 1999) ............................................................. 100 Figure 4-1 The research framework for the study .............................................................................. 101 Figure 4-2 A process for conducting survey research, based on Kasunic (2005, 7) .......................... 105 Figure 4-3 Respondents’ job title........................................................................................................ 119 Figure 5-1 SOA adoption rate in large Finnish companies ................................................................ 125 Figure 5-2 Aggregated IT governance capabilities............................................................................. 134 Figure 5-3 Operating models and SOA adoption ............................................................................... 135 Figure 5-4 Enterprise architecture adoption ....................................................................................... 136 Figure 5-5 The primary EA development focus area representing the current EA stage ................... 137 Figure 5-6 Secondary EA development focus across EA maturity stages ......................................... 138 Figure 5-7 Overall EA completion maturity....................................................................................... 142 Figure 5-8 Overall EA results maturity .............................................................................................. 144 Figure 5-9 Aggregated EA maturity characteristics ........................................................................... 144 Figure 5-10 Aggregated perceived SOA characteristics..................................................................... 149 Figure 5-11 Service-oriented architecture’s diffusion stage in large Finnish companies................... 151 Figure 5-12 Initial and wide scale adoption of SOA, the SOA assimilation gap ............................... 152 Figure 5-13 Current state of SOA adopters by their initial SOA adoption year................................. 153 Figure 5-14 IT governance performance ............................................................................................ 155 Figure 5-15 IT governance performance in relation to year of adoption............................................ 156 Figure 5-16 IT investment maturity according to ITIM maturity model............................................ 157 Figure 5-17 IT governance performance in relation to IT investment maturity ................................. 158 Figure 5-18 IT governance adoption rate for SOA adopters and non-SOA adopters......................... 161 Figure 5-19 Comparison of IT governance performance ................................................................... 163 Figure 5-20 Years between EA adoption and SOA adoption............................................................. 169 Figure 5-21 Enterprise architecture maturity stage relative to SOA adoption ................................... 171 Figure 5-22 SOA adoptions across EA stages .................................................................................... 172 Figure 5-23 Characteristics of SOA adopters and non-SOA adopters ............................................... 175 Figure 5-24 Strategic position of SOA across SOA adoption stages ................................................. 177 Figure 5-25 EA maturity in U.S. government agencies and large Finnish companies....................... 184 Figure 6-1 Adoption of IT governance and EA in relation to assimilation of SOA........................... 194 Figure 6-2 SOA adoption rate in subgroups of population................................................................. 197

xi
List of Tables
Table 2-1 Methodologies in MIS research (Palvia et al 2003) ............................................................. 22 Table 3-1 Constrains for Zachman framework viewpoints (Zachman & Sofa 1992) .......................... 45 Table 3-2 The characteristics of earlier adopters, based on Rogers (2003, 233, 240, 257, 288-291) .. 96 Table 4-1 Comparison of referenced models and the research framework of the study .................... 102 Table 4-2 Required sample size for desired level of precision where the population size = 50......... 118 Table 5-1 Company’s relation to SOA ............................................................................................... 124 Table 5-2 SOA adoption rates ............................................................................................................ 125 Table 5-3 Share of SOA-based investments of all IT investments..................................................... 126 Table 5-4 Success of SOA projects .................................................................................................... 126 Table 5-5 SOA challenges .................................................................................................................. 127 Table 5-6 Year of IT governance adoption......................................................................................... 128 Table 5-7 Importance and success of IT governance outcomes ......................................................... 129 Table 5-8 IT project success ............................................................................................................... 129 Table 5-9 Effectiveness of IT value generation mechanism usage .................................................... 130 Table 5-10 Enterprise alignment capabilities ..................................................................................... 131 Table 5-11 IT-related risk mitigation capabilities .............................................................................. 132 Table 5-12 Business agility and enterprise flexibility ........................................................................ 132 Table 5-13 Organizational IT capabilities and learning ..................................................................... 133 Table 5-14 Operation model clarity.................................................................................................... 135 Table 5-15 Year of EA adoption......................................................................................................... 137 Table 5-16 Importance of enterprise architecture domains ................................................................ 139 Table 5-17 Enterprise architecture completion maturity .................................................................... 139 Table 5-18 Enterprise architecture results maturity............................................................................ 142 Table 5-19 Perceived relative advantage of SOA............................................................................... 145 Table 5-20 Additional SOA benefits .................................................................................................. 146 Table 5-21 Perceived compatibility of SOA....................................................................................... 147 Table 5-22 Perceived complexity of SOA.......................................................................................... 148 Table 5-23 Other perceived SOA characteristics ............................................................................... 149 Table 5-24 Perceived organizational characterises related to SOA.................................................... 150 Table 5-25 Organization’s absorptive capacity .................................................................................. 151 Table 5-26 Differences between SOA projects and all IT projects .................................................... 154 Table 5-27 IT governance performance in relation to IT investment maturity .................................. 158 Table 5-28 Relation of IT governance performance to EA characteristics ........................................ 159 Table 5-29 Relationships between IT governance capabilities and EA characteristics...................... 160 Table 5-30 Year of IT governance adoption for SOA adopters and non-SOA adopters.................... 161 Table 5-31 Differences in perceived importance and success of IT governance outcomes ............... 162 Table 5-32 Comparison of IT governance performance..................................................................... 163

xii
Table 5-33 Differences in IT project success ..................................................................................... 164 Table 5-34 Differences in IT value generation capabilities................................................................ 164 Table 5-35 Differences in enterprise alignment ................................................................................. 165 Table 5-36 Differences in IT risk mitigation capabilities................................................................... 166 Table 5-37 Differences in business agility and enterprise flexibility ................................................. 166 Table 5-38 Comparison of aggregated IT governance capabilities .................................................... 167 Table 5-39 Differences in operating model clarity ............................................................................. 168 Table 5-40 Differences in EA adoption rate ....................................................................................... 169 Table 5-41 Differences in EA completion maturity ........................................................................... 173 Table 5-42 Differences in EA results maturity ................................................................................... 174 Table 5-43 Comparison of aggregated EA maturity characteristics................................................... 174 Table 5-44 Differences in perceived SOA benefits ............................................................................ 176 Table 5-45 Differences in perceived SOA compatibility ................................................................... 178 Table 5-46 Differences in SOA complexity ....................................................................................... 178 Table 5-47 Differences in other perceived SOA characteristics......................................................... 179 Table 5-48 Differences in other perceived organizational characteristics.......................................... 179 Table 5-49 Differences of industry groups ......................................................................................... 180 Table 5-50 Differences in organizational absorptive capacity ........................................................... 180 Table 5-51 Comparison of organization size and profitability ........................................................... 182 Table 6-1 Differences in IT governance capability characteristics .................................................... 195 Table 6-2 Differences in EA maturity characteristics ........................................................................ 195

1
1. INTRODUCTION
1.1. Background for the research
Information technology (IT) is a term known to all, yet, it has a variety of definitions. Narrowly defined, it consists primarily of computers (Brynjolffson & Young, 1996); a wide definition of IT includes software and related services. In this study, a wide definition of information technology is adopted (ITMRA 1996):
”The term information technology (IT), with respect to an organization means any equipment or interconnected system or subsystem of equipment, that is used in the automatic acquisition, storage, manipulation, management, movement, control, display, switching, interchange, transmission, or reception of data or information by the organization. Information technology includes computers, ancillary equipment, software, firmware and similar procedures, services (including support services), and related resources.”
The evolution of IT can be viewed from at least two perspectives: information and technology. From the information viewpoint, IT has evolved from processing of fragments of data to effective processing of information and management of knowledge. In an organizational context, Davenport & Prusak (1998, 2-3) define data as “structured records of transactions” and information as a “message which is transferred from the sender to the receiver and is meant to have an impact on the receivers judgement and behavior.” Information consists of data that in its entity makes a difference. Knowledge is "broader, deeper, and richer than data and information" (ibid, 5). Awad & Ghaziri (2003, 33) define knowledge as "understanding gained through experience or study." Through his or her experience, a knowledgeable receiver instantly and intuitively knows what to do with information in whatever context it may appear. A key trend in the evolution of information processing is integration (Maier 2002). Originally, all applications were isolated; no special attention was given to data. Database technology enabled data integration: horizontal integration makes the same data available for all areas across the enterprise, whereas vertical integration enables usage of same data for all types of information needs (strategic, tactic and operational). These integration processes are currently taking place and organizations are starting to pay more attention to the management of information life cycle. Companies that use information effectively and efficiently are turning into knowledge-intensive organizations or knowledge companies (Sveiby 1992).

2
From the technology viewpoint, information technology has advanced from isolated computers to global networks. Lucas (1999, 6-7) divides the growth of IT into three major eras: 1) the development of the computer; 2) the development of new storage technologies that enabled the development of large databases; and 3) the development of communications. The combination of computers, databases and networks has expanded the range of technology from purely computational to a powerful communication medium.
According to Pinto (2001), these technologies continue to drive the development of information technology, and form the basis for the three laws of technology:
1. The processing power of a microchip doubles every 18 months - Moore’s law 2. The total bandwidth of communication systems triples every twelve months - Gilder’s
law 3. The value of a network is proportional to the square of the number of nodes: the value
of being connected grows exponentially - Metcalfe’s law.
The cost of computing power has continued to decrease exponentially as proposed by Moore (1965). Metcalf, the inventor of Ethernet, proposed that if you connect any number, ”n” of machines - whether computers, phones - you get ”n” squared potential value (Gilder 1993). Gilder made this proposition known as the Metcalf’s law. The Metcalf’s law implies that the real value of computers is in networks, just as the value of cars lies in the existence of roads. Later, in the 1990s, Gilder (1996) proposed a paradigm shift: “the new paradigm will be based on the runaway expansion of bandwidth.” He predicted that in the future bandwidth would be practically free and compensate for the limitations of computer and network architectures and that the most common computer of the new era will be a digital cellular phone with an IP address. The new paradigm is beginning to realize. For example, IP-enabled cellular phones are emerging, peer-to-peer (P2P) networks use bandwidth in favour of computing power, and commercial services, such as Google architecture (Barroso et al 2003), use extensive parallelization of networked computers to provide superior performance.
An important characteristic of IT evolution is that new eras do not completely replace the previous era. The previously built components play an important role in the new evolutional level. This kind of incremental improvement is also typical of maturity models. While the maturity increases, each higher maturity level adds new requirements, practises and characteristics, and integrates them with the previous ones. Similarly, as the maturity of IT increases, the components or services of the previous level become commodity components or commodity services that are needed to produce the services at the higher maturity level.

3
The increased capabilities for information processing enable new types of enterprise models. Brown and Hagel (2005) define two types of enterprise models according to how enterprises mobilize resources. They state that most companies are trying to achieve competitive advantages by executing operations more efficiently than their competitors do. For this, they are automating their factories and service platforms, creating standardized processes, adopting massive enterprise applications and educating people for standard, predetermined sequences of experiences. These push systems assume that they can anticipate demand and that their way of mobilizing resources is the best way to meet this demand (Figure 1-1).
Pull systemsPush systems
• demand can be anticipated• top-down design• centralized control• procedural• tightly coupled• resource centric• participation restricted
(few participants)• focus on efficiency• limited number of major
reengineering efforts• zero sum rewards
(dominated by extrinsic rewards)
• demand is highly uncertain• emergent design
• decentralized initiative• modular
• loosely coupled• people centric
• participation open(many diverse participants)
• focus on innovation• rapid, incremental innovation
• positive-sum rewards(dominated by intrinsic rewards)
Figure 1-1 Characteristics of Push and Pull systems (based on Brown & Hagel 2005)
Push systems have tightly coupled centralized structure and procedures, which limit innovation and learning, make incremental rapid innovations difficult, and only allow a limited number of participants. Brown and Hagel state that in the future, demand may become harder to forecast, which may cause push systems to fail despite of their efficiency. New models of mobilizing resources are emerging as response to growing uncertainty. Pull models continually strive to expand the choices available by creating loose connections between networks of specialized distributed resources, and by providing the tools and resources required to take initiative and creatively address opportunities as they arise. According to Hagel & Brown (2005), push systems typically compete for market share in stable markets whereas pull systems can create new markets by open innovations.
Push model companies often build value from a value chain, whereas pull model companies build complex networks of interconnected processes. These process networks are also called value networks. According to Allee (2000), they encompass much more than the flow of products, services, and revenue of the traditional value chain. In value networks, the flow of information and knowledge and intangible value are of equal importance. Thus, the success

4
of a company that utilizes pull model depends on building a rich web of trusted relationships with partners, and rapidly mobilizing them to create value to customers. (ibid)
The new enterprise models need new types of IT solutions. Traditional applications and enterprise systems are optimized for push-model systems; they are designed to achieve operational efficiency at local or enterprise level. A pull system requires optimization at value-network level. The loosely coupled nature of pull systems and their high requirements for collaboration create new challenges for IT solutions, such as rapid changes in configuration, high scalability and easy connectivity. Service-oriented architecture (SOA) and Web service technologies promise to fulfil these requirements and deliver the new type of solutions needed. (Brown et al 2005) Similarly, new types of capabilities are required from IT organizations to provide these service-oriented solutions - the IT function needs to transform itself from a technology provider to a strategic partner of business.
Salle (2004) describes the evolution of the role of IT function in organizations as a three-stage approach (Figure 1-2).
TechnologyProvider
ServiceProvider
StrategicPartner
Time
IT functionmaturity
IT InfrastructureManagement
IT Service Management
IT Governance
TechnologyProvider
ServiceProvider
StrategicPartner
Time
IT functionmaturity
IT InfrastructureManagement
IT Service Management
IT Governance
Figure 1-2 The role of IT function in organizations (Salle 2004)
At the first stage, IT function acts mostly as a technology provider focusing on developing and acquiring the applications for the enterprise, and the infrastructure needed for them. IT function is often extensively technology-oriented and may even ignore business goals in favour of achieving its technology interests. At the service provider stage, the IT function focuses more on identifying and fulfilling customers’ needs with services that consider requirements for availability, performance and security - service level management becomes the most important process in the IT process map. (ibid)
At the highest stage, the focus of IT should move from supporting transactions to supporting company’s strategic business initiatives, enabling effective cooperation both internally and externally, and to the creation, distribution and application of knowledge. At this stage, IT

5
becomes a strategic partner of business. To accomplish this, IT governance – the structures, processes and mechanisms to govern IT use in the company - have to be introduced. (ibid) The objective of IT governance is to ensure that IT services are aligned with the strategy, support the current and future business needs, and that IT resources are used optimally. (ITGI 2003)
According to Nayak et al (1992), there are three approaches to improving processes incremental improvement, redesign and rethinking. The opportunity to rethink processes is often undervalued or forgotten. Incremental improvement and redesign base on existing processes, whereas rethinking the problem area often ends up with removing some of current processes and introducing some new, completely different kind of processes. To transform itself from a technology or a service provider to a strategic partner of business requires that IT function must rethink its role, and redesign its structure and related processes.
The new enterprise models require adaptivity and flexibility. The pull model extends the scope of IT use beyond the boundaries of the enterprise, and may need to create networks of interconnected business processes on an ad-hoc basis. Paradoxically, only an enterprise that is well architected, designed and implemented can enable ad-hoc structures and processes. Enterprise architecture (EA) is an approach that provides a framework and processes to manage the complexity of modern enterprises.
Brown and Hagel (2003) claim that “The gap between IT’s potential and business’s realization of that potential has not narrowed. Instead, it has steadily widened over the past several decades.” This indicates that the IT function has not been able to facilitate the realization of this potential. SOA is further increasing the potential of IT by enabling systems that allow easier reconfiguration, collaboration, and integration of distributed resources. To take advantage of these new capabilities and to implement an architecture based on SOA, a disciplined approach with supporting tools and methods is required. EA is such a tool: it describes the current and target architectures and assists in creating a roadmap for SOA adoption. Yet, to realize the roadmap, IT governance is needed to make the critical decisions concerning the implementation and ensuring that the value promised is delivered.
The need for a disciplined approach is evident. According to Charan & Colvin (1999), when enterprises fail to achieve their visions, in most cases, approximately 70 percent of cases, it is not about the vision or the strategy, the problem is bad execution: not getting things done, being indecisive and not delivering on commitments. According to Neilson, Pasternack and Mendes (2003), the organization’s capability to execute is “deeply woven into the warp and woof of organizations.” The ”rules of the game”, expressions and definitions of how the organization should function, are defined in its management processes, relationships,

6
measurements, incentives and beliefs. An organization does not execute its strategy as a separate process by the management; instead, it is executed by the daily decisions and actions of every stakeholder in the company. IT governance, together with EA, are intended to create the “rules of the game” for IT use in the company and to bring the discipline needed for successful implementation of business and IT strategies.
Based on the previous discussion, it would seem logical that companies, especially the largest companies, have adopted IT governance and EA However, knowing is not doing. Although a company may acknowledge the potential of IT governance and EA, it may be unable to convert that knowledge into action i.e. it may not have adopted IT governance and EA approaches. Pfeiffer and Setton (1999) describe this as the knowing-doing gap. Thus, the IT governance capabilities and EA maturity of the companies are probably at different level depending on whether the company has adopted formal approaches to IT governance and EA or not. Similarly, these adoptions may affect to a possible adoption of SOA. This study attempts to research the IT governance capabilities and enterprise architecture maturity in large Finnish companies, and explore their relationship with SOA adoption.
1.2. Previous research
Brown and Grant (2005) conducted a literature review of IT governance research and studied over 200 articles from academic journals, business press and books. They found that the majority of IT governance research is conceptual and examines proposed IT governance frameworks; only a few empirical studies on IT governance were found.
Brown and Grant found two parallel streams of research that together provide a basis for contemporary views of IT governance: IT governance forms and IT governance contingency analysis. The first stream studies different forms of IT governance structures used in organizations with two main research topics: the basic locus of IT decision-making and expanded IT decision-making structures. According to Brown and Grant (ibid), two basic IT decision-making structures exist: centralized and decentralized IT governance. Organizations often need to balance between these two extremes and use expanded IT decision-making structures. Brown and Grant report a number of studies of both vertical and horizontal expansion of the basic IT governance structures.
The second stream - IT governance contingency analysis - focuses on what type of governance is best for which organization. These studies have attempted to define the factors that affect IT governance adoption and how an organization should choose its IT governance form. The later of these have attempted to study non-uniform governance

7
frameworks, i.e. using different types of governance structures for different business units or different IT services. (ibid)
The studies of both these parallel research paths have increased the understanding of IT governance and provide a basis for contemporary IT governance frameworks. One important result of these studies is that researchers agree that no universal best IT governance structure exist (ibid). MIT Sloan School of Management’s Centre for Information Systems Research (CISR) has recently focused on research of IT governance and related issues. As a summary of the MIT research, Weill & Woodham (2002) presented a framework for IT governance and Weill and Ross (2004a) discuss the framework in more detail. Section 3.1.4 provides a description of this framework.
According to Brown and Grant (2005), Weill and Ross’s framework represents the convergence and aggregation of the two previous IT governance research streams. The framework’s decision-making structures mirror previous research of IT governance structures. The governance arrangement matrix ties the types of IT decisions to different governance archetypes; building on research of what type of governance to use on which type of IT service categories. Weill and Ross also give five primary factors that determine which type of governance arrangement to use, building on studies of what antecedents influence the selection of IT governance form.
Most studies have focused on ”what, why and how” of IT governance. The IT Governance Institute conducted research on IT governance (ITGI 2004b) in cooperation with the PricewaterhouseCoopers International Survey Unit. The study’s goal was to survey and analyze the degree to which the concept IT governance is recognized, established and accepted, and which tools and frameworks organizations have adopted. The results base on a survey-interview of 335 CEO or CIO-level persons throughout the world. The study found that half of the boards have IT regularly on the board’s agenda, although it is mostly a low priority issue. Twenty-five percent of the companies had implemented IT governance and fifteen percent were in the process of implementation (32% and 14% in Europe). Alignment of business and IT strategies was the most widely implemented IT governance practise. Many companies were actually implementing IT governance practises while they claimed not to be doing so. In other words, they were unaware of the concept.
The previously mentioned MIT CISR studies (Weill & Ross 2004a) found that only thirty-eight percent of managers in leadership positions could describe their IT governance. The average assessment (among a group of 40 CIOs) on how well their IT governance integrated with the governance of the other key assets was less than three on a five-point scale. Yet, the key MIT researchers, Weill and Ross, believe that IT governance is the most important factor in generating business value from IT.

8
KPMG made an IT governance survey in 2004 in the Europe, Middle East and Africa regions (KPMG 2004), 198 respondents from a wide range of industries completed the survey. The majority of the respondents felt IT governance was not an integrated part of the enterprise governance structures of their organisation. In addition, majority of the organisations did not use recognised IT governance frameworks. Frameworks such as CobiT and ITIL had fewer adopters than expected. This reveals that IT governance has yet to mature to the same level that enterprise governance has in many organisations.
In Finland, the Ministry of Finance and Bearing Point made a survey of the current state of shared IT-services in Finnish government (Rissanen 2005). The key findings of the study concerning IT governance were: most of the organizations did not have a designed, documented model of IT governance; across the government there is little coordination and cooperation; a more central approach of IT governance is needed to enhance coordination; and the role of IT should be more strategic and senior management should be more involved in IT governance.
Langenberg & Wegmann (2004) studied the state of the art in EA research, based on an analysis of the publicly available publications. They found EA to be a young research area, but the researcher’s interest in it was growing at the time as implied by the growing number of papers as shown in Figure 1-3.
05
10152025303540
1996 1997 1998 1999 2000 2001 2002 2003 2004Distribution of the surveyed papers in time Estimate
The 2004 estimate is based on the count of 12 papers published betw een Jan-Apr
Figure 1-3 Distribution of the surveyed papers in time (Langenberg & Wegmann 2004)
The study also identified the lack of academic basic research on EA as a threat to enterprise architecture maturation. The authors of most papers worked for consulting companies, the second largest group was the academics. The majority of the papers targeted or adopted Zachman framework (Zachman et al 1992). According to Langenberg & Wegmann (2004),

9
the focus of publications is mostly on the adoption. If adopter companies would publish their experience, EA could gain even more recognition.
Since then EA has gained wider interest, both from practitioners and researchers. For example, in Finland many researchers have studied enterprise architecture. Pienimäki (2005) studied business application architectures in manufacturing industry with a multiple case study approach. The key findings of his study was that if an appropriate business application framework, such as the one constructed in the study, is used, a target architecture with less applications and less complexity can be achieved with the same functionality as the initial architecture.
Hirvonen (2005) studied enterprise architecture from the ICT service provider and end-user perspective as an action research. The study consisted of sub studies that created methods and tools for application of enterprise architecture with consultation projects. Hirvonen’s studies were part of LARKKI-research project that was conducted at the Information Technology Research Institute (ITRI) of the University of Jyväskylä. The aim of the project was to develop methods and tools for dealing with large information systems architectures. Most of the articles published as the results of LARKKI-project concern of how to develop an EA (e.g. Hirvonen & Pulkkinen 2004, Hirvonen 2005, Pulkkinen & Hirvonen 2005). Recently, the researchers at the University of Jyväskylä have been active in the research intended to support the development of a governmental enterprise architecture, and in EA topics such as the evaluation and assessment of EA (Ylimäki 2006).
Infosys (2005, 2007) has made electronic survey gathering information provided by ClOs, Enterprise Architects and Heads of Enterprise Architecture about the key concerns, approaches, focus areas, and key success factors for an Enterprise Architecture practice. In 2005, the survey obtained 45 responses whereas in 2007 the data consists of 262 responses.

10
38.2 %
24.0 %
24.0 %
19.5 %
19.1 %
22.0 %
19.0 %
17.0 %
19.0 %
9.0 %
17.0 %
9.0 %
24.0 %
18.7 %
17.6 %
0 % 5 % 10 % 15 % 20 % 25 % 30 % 35 % 40 % 45 %
Enable greater flexibility in business processes
Simplify technology and application portfo lio
Better align business and IT organizations
Improve process effectiveness
M ove to a loosely coupled,component-basedarchitecture
Support and enable business change
Reduce time to deliver IT pro jects
Reduce IT cost
2005 2007
Figure 1-4 Top EA objectives (Infosys 2005)
In 2005, the most important objective the companies were trying to achieve with the adoption of EA was IT cost reduction; this can be achieved by simplifying technology and applications portfolios. EA is used to fight the complexity of IT as described by Mattern et al (2003): “In a sense, the companies are now finishing a job they didn't have time to complete during the bubble years. The goal is to turn a plate of spaghetti into something that looks more like a set of Lego blocks - modular, logical, with a minimum of interconnecting pipes.” Enabling business process flexibility has become the most important of EA objectives; the share of responders has more than doubled from 2005 to 2007. Cutting costs is no longer the number one priority, however, by achieving the other objects, IT cost are probably also reduced.
According to both Infosys surveys, 57% of EA efforts were spent on application and technical architecture. While the efforts spent on business architecture have increased from 14 percent in 2005 to 19 percent in 2007, in the future the focus should shift more to the business architecture. Only 24 percent of the organizations were evaluating the acceptance of their EA in the organization in 2007 and 44 percent were not using any measurements.
Institute for Enterprise Architecture Developments (Schekkerman 2005) has made a web-based survey for three consecutive years 2003-2005. According to the survey, 149 countries

11
are identified as being active in EA domain; the top five most active countries in 2005 were the United States of America, United Kingdom, Canada, Netherlands and Australia.
The government sector in the United States has made significant efforts since the late 1990s to promote the implementation of EA at both the federal agency and the state level. According a study of the National Association of Chief Information Officers (NASCIO), there has been a strong adoption of the EA discipline across the states (NASCIO 2005). Until recently, the focus of these adoptions has been on technology architecture, but EA programs are now being broadened into other architectural areas. However, the United States General Accounting Office (GAO) reported in a study (GAO 2004b) that “in general the agencies’ management of architecture programs was not mature”. Using its Enterprise Architecture Management Maturity (EAMM) framework as a benchmark, GAO found little change in overall maturity between 2001 and 2003. Only 20 of 96 agencies examined (21%) had established at least the foundation for effective architecture management.
Service-oriented architecture (SOA) is based on open standards and typically implemented as Web services. Research of SOA and Web services has mainly focused on the technological side of SOA. The articles on SOA adoption have been primarily vendor-based or written by consultants in SOA; according to Haines (2007) few academic studies have been conducted related to the adoption of SOA and Web services.
Legner and Heutschi (2007) studied SOA adoptions with four case studies and compared the early SOA implementations with the theoretical view of SOA concepts. According to them, SOA literature largely agrees on the architectural elements of SOA, but has different opinions on the essential SOA design principles. The study found that the case companies were still at the early stages of SOA implementation. Three main objectives for the adoption of SOA were identified: 1) SOA was adopted as a standardized integration infrastructure; 2) SOA was used to decouple the application domains, i.e. to reduce the dependencies and redundancies; and 3) SOA projects were aimed for flexible user and business process integration achieved by simpler and faster adaptation or new development of cross-application processes. The companies studied were not emphasizing business process orchestrations at that time. Legner and Heutschi propose three necessary steps for the adoption of SOA: 1) introduction of new roles and processes to IT function, formulation of architectural guidelines, and 3) the realization of service-based concepts and design principles in SOA projects.
Haines (2007) studied the impact of SOA on how information systems are developed and how the IT function is formed. He found preliminary evidence that adoption of SOA will require changes in developer skills, roles, tools, the development process, and changes in the organizational culture. Similarly, the adoption of SOA affects the other phases of

12
information system lifecycle; Kajko-Mattsson et al (2007) propose a framework for defining the roles needed in evolving, maintaining and supporting SOA-based systems. They state that these roles are related to SOA infrastructure providing a stable platform and tools for developers, applications that are created by discovering and composing services, and service provider tasks focusing on the description and granularity of services that can be easily located and used with acceptable Quality-of-Service (QoS). The framework identifies tasks such as SOA management, SOA Design, SOA Quality Assurance, Front-End and Back-End Support. To accomplish these tasks, roles such as SOA Business Manager, SOA Governance Manager, Business Process Orchestrator and Business Process Integrator are needed.
SOA Consortium held a series of SOA Executive Summits in 2007 with leading CIOs and CTOs representing Fortune 1000 corporations, major government agencies and nongovernmental organizations. The key findings from the Summits’ roundtable discussions on real-world SOA implementation opportunities and challenges were (OMG 2007):
1. SOA changes the role of CIO and IT – CIO must contribute to the execution of the company’s strategy
2. SOA adoption is a key enabler for the 21st century enterprise, however, achieving the benefits requires significant changes for both business and IT executives
3. SOA requires business and IT collaboration - to enable that the IT organization must become business-smart and speak a common language with the business
4. SOA means essentially “execute the business model” 5. SOA will change the applications markets – in the future companies do not need to buy
applications, instead they can subscribe to services. These subscribed services will be deployed and mixed with own services to develop new next generation IT solutions.
In 2005, AMR Research surveyed globally 134 manufacturing and service companies with 1000 or more employees on their use of SOA (Austvold et al 2005). According to that study, only 21% of respondents were deploying SOA and 11% were planning to implement it in 12 months. The found SOA adoption rate is relatively low. Yet, it is not significantly different from those previously reported for IT governance and EA.
While the interest in SOA research is growing, Kontogiannis et al (2008) propose a preliminary SOA research taxonomy. They state, “the development of a service-oriented system requires business, engineering and operations decisions to be made, as well as other cross-cutting decisions.” Thus, their taxonomy is based on these decision areas. According to Kontogiannis et al (ibid), SOA research can be divided into four research areas: business, engineering, operations and cross-cutting. The business area is concerned with topics such as SOA strategy, business cases and organizational structures, while the engineering area is

13
concerned for example about process and lifecycle, service selection, and architecture and design. Operation research area studies SOA adoption, monitoring, support, and operation indicators. The cross-cutting research area consists of research topics such as governance, stakeholder management, and training and education. Software Engineering Institute (SEI) at the Carnegie Mellon University sponsors the project developing the research categories. According to Kontogiannis et al (ibid), “The complete final report will provide the rationale, current efforts, and challenges and gaps for each of the research topics identified in the taxonomy.”
As a summary, according to the previous research IT governance, EA and SOA are gaining wider acceptance. Yet, their current adoption rate and the characteristics of the adoptions in Finnish organizations were not known. Although there were indications of increasing interest in SOA, its adoption rate was expected to be the lowest of the three. It is not common to study the aggregated adoptions of two or more innovations. Thus, it was quite expected that studies addressing both IT governance and EA or their relation to SOA adoption could not be found.

14
2. RESEARCH PROBLEM AND STRATEGY
2.1. Research process
According to McNabb (2004, 6), research is the “activity scientists do to gain a better understanding of how their world works.” Another way to describe research is to view it as a process that gathers and analyzes data to answer a question. This study adopts a generic research process, the systematic process of research strategy and methods, which is quite similarly described for example by McNabb (2004, 67), Olkkonen (1994) and Jenkins (1985). Figure 2-1 presents the research process of this study:
IDEA
RESEARCH TOPIC
RESEARCHPROBLEM
RESEARCHSTRATEGY
DATAGATHERING
DATA ANALYSIS
PUBLISHRESULTS
Figure 2-1 The research process of the study, based on McNabb (2004, 67), Olkkonen (1994), and Jenkins (1985)
The research process of the study consisted of the following phases (Figure 2-1):
- Idea – the initial idea was to study information technology from a wider perspective; IT governance (ITG) and enterprise architecture (EA) were considered as possible research areas. Another topic of interest was service-oriented architecture (SOA).
- Selection of the research topic - the research areas (ITG, EA and SOA) were explored and possible research problems and approaches were considered. Two alternative research problems were considered in more detail: the effects of and a possible relationship between the adoptions of IT governance and EA; and the factors affecting the adoption of service-oriented architecture (SOA). Finally, a decision was made to study the aggregated adoptions of all three innovations.
- Identification of the research problem – in the next phase, a statement defining the research problem and the research questions were defined. In addition, the study objectives were formulated to define what the study intended to accomplish. In this phase, also the study’s scope was defined.
- Planning of the research strategy – the objective of this phase is to select and design the methods to collect information that is needed to answer the research questions. Survey

15
was selected as the main research method, supported by descriptive and statistical methods to assist in the data analysis.
- Data-gathering – this phase included the design of the empirical part of the study and the actual data collection.
- Data processing, analysis and interpretation – the meaning of the collected information was identified using the selected descriptive and statistical methods.
- Preparing and presenting the research results – the results of the survey and the findings of the study were prepared to answer the research question. A manuscript for the dissertation was prepared and the need for additional research was identified.
Figure 2-2 presents the research timeline according to the structure of the research process.
1-3 4-6 7-9 10-12 1-3 4-6 7-9 10-12 1-3 4-6 7-9 10-12 1-3 4-6Identification of possible research topics
Selection of the research topicAnalysis of concepts and theoriesIdentification of the research problem Planning of the research strategy
Design of the empirical study
Data gatheringData processing, analysis and interpretationPreparing and presenting the research results
Writing of the study
2005 2006 2007 2008
Figure 2-2 The research timeline
The research was not conducted as a full-time research, yet a relatively tight schedule was planned to ensure the actuality of the research results.
2.2. Selection of the research topic
The selection of the research topic and formulation of the research questions are the foundations of any meaningful research. The researcher’s interests naturally affect the initial selection of the research area and topic. However, the more general interests should guide the selection of the research topic. The effort that must be spent on the research is significant, so it should be well justified. IT governance, enterprise architecture and service-

16
oriented architecture were the initial research areas of interest. However, the selection of the research problem in those areas required careful consideration.
Benbasat and Zmud (1999) argue that empirical research in information systems (IS) has had a credibility gap because “most IS academic research lack relevance to practise.” They state that, to avoid lack of relevance, the researcher should consider the following dimensions of relevance when selecting the research topic:
- interesting – the research should address the problems and challenges that are of concern to IS professional
- applicable – the knowledge and results should be useful to practitioners
- current – the topic should be current at the time of publication of the results
- accessible – the results should be expressed in a style and format that make the results understandable by IS professionals.
IT governance, EA and SOA are all current topics; research that addresses issues related to them is probably relevant for practitioners. According to Westfall (1999), issues where management predominates, rather than technology is a category of research that offers opportunities to be relevant for external constituencies. These topics study the interactions of technology with the social settings of people and procedures. A study of the adoptions of IT governance and EA and their possible relationship with SOA adoption can be classified as such research. IT governance and EA are approaches that are intended to improve a company’s capabilities to make important decisions about IT use in the company, such as the adoption of SOA.
According to Rogers (Rogers 2003, 12), an innovation is “an idea, practice, or object that is perceived as new by an individual or other unit of adoption.” Because of personal experiences of having met significant challenges in adopting approaches, such as TQM and strategic management, diffusion research was found interesting. Rogers’ (2003) diffusion theory is a model that is widely used to explain or predict the rate and pattern of adoption. According to Rogers, an idea presented typically needs a considerable amount of efforts and time to become a widely adopted and assimilated innovation.
A typical diffusion study would research the adoption of a single innovation: the characteristics of the innovation, and characteristics of the potential adopter to find out the factors that affect adoption. Fichman (2001) states that because IT has become increasingly integrated, the focus of adoption studies is shifting from “an organization's ability to innovate with respect to a narrowly defined, single IT innovation to its capability to innovate with respect to an array of possibly interrelated innovations.” This finding generated the idea of studying the aggregated adoptions of IT governance, EA and SOA.

17
2.3. Formulation of the research problem
According to Jenkins (1985), the most difficult phase in the research process is the definition of the research problem. An unambiguously stated research problem with clear and precise statements of the objectives of the study is essential in guiding the decisions that are required in the subsequent phases of the research process. The errors made in the definition of the research problem may turn the research into a waste of time and labour. A well-defined research problem consists of two parts (McNabb 2004, 69):
- a statement of the problem as it is seen by the researcher
- the research questions that will be addressed and answered in the research.
Figure 2-3 presents the basic setting for the study. The research problem is formulated as follows:
The purpose of the study is to research IT governance capabilities, enterprise architecture maturity and service-oriented architecture adoption in large Finnish companies, and to find out what kind of relationship - if any - the adoptions of IT governance and EA have on the adoption of SOA.
IT governancecapabilities
Enterprise architecture
maturity
Adoption of SOA
Figure 2-3 The basic setting for the research
The consequences of adopting or not adopting IT governance are reflected in a company’s IT governance capabilities; the study assesses these through the expected benefits of adopting IT governance. While the expected benefits of adopting EA are quite similar to those of adopting IT governance (see sections 3.1.5 and 3.2.5), the study assesses the consequences of adopting or not adopting EA through the maturity of a company’s EA.

18
The study attempts to answer the following research questions:
Q1: How widely is SOA adopted by large Finnish companies? - What is the adoption stage across companies? - What are the companies’ perceptions of SOA characteristics? - How do these perceptions affect SOA adoption?
Q2: What is the level of the companies’ IT governance capabilities? - Have they adopted a formal IT governance approach? - What is their perceived IT governance performance? - At what level is their IT investment maturity?
Q3: How mature is enterprise architecture in large Finnish companies? - Have the companies adopted a formal EA approach? - What is the stage of their actual EA? - At what level is their EA maturity?
Q4: Does the study suggest a relationship between an organization’s IT governance capabilities, EA maturity and SOA adoption?
- Is there a relationship between IT governance and EA? - May IT governance and EA be considered as prerequisites for adopting SOA?
The following working hypotheses were made to guide the research process:
Hypothesis 1: Large Finnish companies have adopted formal IT governance approach.
Large companies are subject to various regulatory requirements, such as Sarbanes-Oxley, thus they must define formal governance structures, processes and mechanisms to comply with these regulations i.e. they have to adopt IT governance
Hypothesis 2: Large Finnish companies have adopted formal EA approach.
The large size of the companies implies that their business and IT architectures are too complex to manage without adopting a formal EA approach.
Hypothesis 3: IT governance and EA are positively related to each other.
According to literature (e.g. GAO 2004a), the concurrent development of IT investment practices and EA significantly increases a company’s possibilities to make successful IT investments that fulfil their business needs.
No hypothesis about the relationship of IT governance capabilities and EA maturity to SOA adopting was made because a key purpose of the study is to explore whether such relationships exists and what IT governance capabilities and characteristics of EA maturity possibly affect the adoption of SOA.

19
The following research objectives will be achieved by successfully answering the research questions:
- the body of knowledge for IS research is added with increased understanding of the concepts IT governance, enterprise architectures and SOA and their possible relationships
- an overview of the state of IT governance, enterprise architecture and SOA in large Finnish companies is presented
- the results of the study provide a benchmark against which companies can assess their own capabilities and perceptions
- the companies which are considering SOA adoption may evaluate what kind of actions they should take
Companies are increasingly creating partnerships and partner networks. This implies that it would be possible to study IT governance, EA and SOA in a wider context, in the context of a network of companies. However, the context of this study is limited to that of a single company.
IT governance, EA and SOA are all relatively recent innovations. Large companies often adopt innovations before small companies do; for example, IT Governance Institute (2004) found a significant difference in the implementation status of IT governance between large and small companies: twenty-nine percent of large companies had implemented IT governance while only nineteen percent of small companies had done so. A similar difference in adoption rates of ITG, EA and SOA could exist between large and small companies in Finland. To ensure that a sufficient number of adoptions for the analysis would be found, the focus and scope of the study was defined to be large Finnish companies.
2.4. Planning of the research strategy
In the context of research, as well as in other contexts, strategy means making choices. The planning of the research strategy should be based on the research problem. However, other factors, such as the traditions of science and the geographical area typically affect the selection of the research strategy. For example, the US American research often focuses on testing theories with a small number of variables with a large sample, whereas in Europe qualitative methods and in-depth studies of a small number of cases are more common (Matzler & Rentzl 2001).

20
Over the centuries, many categorizations of research have been created. The purpose of these categorizations is to guide the researcher in the selection of appropriate methods for the research. According to Olkkonen (1994, 26) a commonly agreed categorization is to divide research by its philosophical foundations into positivism and hermeneutics. Positivistic research paradigm has its philosophical backgrounds in realism, and assumes that science is based on objective observations of reality that can be verified. Hermeneutic research paradigm has its roots in idealism; it emphasizes the concepts of interpretation, explanation and understanding. Natural science has its foundations on positivism whereas humanistic science often uses methods based on hermeneutic.
A research approach is “a set of research methods that can be applied to the similar research objects and research questions (Järvinen 2004).” Kasanen, Lukka and Siitonen (1991) state that different research approaches in industrial management can be represented as a matrix of theoretical versus empirical perspectives and descriptive versus normative perspectives (Figure 2-4). The goal of concept analysis is to develop or improve conceptual systems. Nomothetic research approach aims to discover general laws or causal relationships between concepts using a sample of quantitative data from a large population. Decision-making approaches typically develop mathematical or computer-based models to assist in decision-making. In action analysis, the researcher’s objective is to understand the phenomenon – typically a problem related to some aspect of operation inside an organization – either by making observations of the system or by taking part in the activities and trying to influence it. Olkkonen (1994) describes constructive research approach as innovative, creative, normative research that aims at resolving a solution to a complex problem.
ConstructiveDecision-makinganalysisNormative
NomotheticConcept analysisDescriptive
EmpiricalTheoretical
Action analysis
Figure 2-4 Relative positioning of research approaches (Kasanen et al 1991)
Empirical research approaches can be divided into quantitative approaches and qualitative approaches. Quantitative approaches typically rely on precise quantitative data that can be analyzed and verified with statistical instruments. Thus, quantitative approaches typically rely on a positivist philosophical background. Qualitative approaches on the other hand do not rely on any specific research approach or method, yet they have one thing in common,

21
their “underlying objective is the understanding of the event, circumstance, or phenomenon under study” (McNabb 2004, 104).
In the context of IS research, hermeneutic analysis means interpreting or trying to make sense of the whole system comprising of people, organization and information technology (Myers 1997). This study attempts to understand and interpret the adoptions of IT governance and EA in the context of a possible SOA adoption. These adoptions take place in the context of a social system consisting of people, organizational structures and processes, and information technology. Thus, from the perspective of its main objective, the study is closer to the hermeneutic than positivistic research paradigm.
No strict rules exist of what methods one should use for any specific research. Studies of applied sciences, such as industrial management or management of information systems, often use a combination of different approaches (Olkkonen 1994, 28, 53). Many taxonomies of information system research have been proposed to assist the selection of proper research approach (for example Järvinen 2004, Galliers & Land 1987, Nunamaker et al 1991). Palvia, Mao and Salam (2003) studied articles published in major Management of Information Systems (MIS) journals between 1993 and 1997 and identified twelve different methodologies that were used to study management of information systems (Table 2-1).
For some research problem areas, researchers tend to use only a limited number of research methods. Choudrie & Dwivedi (2003) studied articles published during the period 1992-2003 from two American and two European IS journals. The articles addressing technology adoption used only two research methods: survey (74%) and case study (26%). Thus, these represented natural choices for methods of the study.
According to Gummeson (1993) a general reason for doing a case study research is to understand complex phenomena better. Case study research relies mostly on qualitative data, which sometimes is complemented with quantitative data. For this study, case study approach was not considered appropriate for several reasons: 1) the selection of suitable companies for the case studies would have been difficult; 2) more than just a few case studies would have had to be conducted to answer the research questions; and 3) the resources available for the study would have limited the number of case studies insufficient to solve the selected research problem.

22
Table 2-1 Methodologies in MIS research (Palvia et al 2003)
Methodology Definition
Speculation / commentary
Research that derives from thinly supported arguments or opinions with little or no empirical evidence.
Frameworks and Conceptual Models
Research that intends to develop a framework or a conceptual model
Library Research Research that is based mainly on the review of existing literature
Literature Analysis Research that critiques, analyzes, and extends existing literature and attempts to build new groundwork. e.g., it includes meta analysis
Case Study Study of a single phenomenon (e.g. an application, a technology, a decision) in an organization over a logical time frame
Survey Research that uses predefined and structured questionnaires to capture data from individuals.
Field Study Study of single or multiple and related processes/phenomena in single or multiple organizations
Field Experiment Research in organizational setting that manipulates and controls the various experimental variables and subjects
Laboratory Experiment
Research in simulated laboratory environment that manipulates and controls the various experimental variables and subjects
Interview Research in which information is obtained by asking respondents questions directly. The questions may be loosely defined, and the responses may be open-ended
Secondary Data A study that utilizes existing organizational and business data, e.g. financial and accounting reports, archival data, published statistics, etc.
Qualitative Research Qualitative research methods are designed to help understand people and the social and cultural contexts within which they live. These methods include ethnography, action research, case research, interpretive studies, and examination of documents and texts.
Based on previous discussion, survey was selected for the research method. Survey is typically used with nomothetic research approaches; accordingly the empirical part of the study can be described as nomothetic research. Yet, the survey was designed to serve two purposes: to understand and interpret the consequences of the adoptions of IT governance

23
and EA; and to discover whether there is a relationship between a company’s IT governance capabilities and EA maturity with the adoption of SOA.
The study applies a combination of methodologies from Table 2-1:
- Survey research - “research that uses predefined and structured questionnaires to capture data from individuals”
- Field study – “study of single or multiple and related processes/phenomena in single or multiple organizations”
- Interview – “research in which information is obtained by asking respondents questions directly”
- Secondary data – “a study that utilizes existing organizational and business data”
In the context of the Kasanen, Lukka & Siitonen matrix the study can be described as concept analytical, nomothetic and constructive. An analysis of concepts and theories had to be conducted to derive a theoretical basis for the empirical approach; survey and statistic methods are used to discover a possible relationship between the adoptions of IT governance and EA to the adoption of SOA; and the empirical study required design of a research framework and a method of data collection.

24
3. UNDERLYING THEORIES AND CONCEPTS
3.1. IT Governance
3.1.1 Enterprise governance
According to Williamson (1999, 1090), governance is “a means by which to infuse order in a relation where potential conflict threatens to undo or upset opportunities to realize mutual gains.” Whenever people make temporary or stable arrangements to carry on a specific activity, such conflicts may appear and governance is needed.
Common types of such arrangements are companies, enterprises or organizations. Davenport & Prusak (1998, xiii) define a company as “a collection of people organized to produce something, whether it be goods, services, or some combination of the two.” According to the United States General Accounting Office (GAO 2003a, 1) an enterprise “can be (1) a single organization or (2) a functional or mission area that transcends more than one organizational boundary.” For the purposes of this study, an enterprise denotes a single organization. Rogers (2003, 404) defines an organization as “a stable system of individuals who work together to achieve common goals through a hierarchy of ranks and a division of labour.”
Organizations, companies and enterprises have many characteristics in common. They consist of a formal group of persons having the same goals and carrying out a planned, coordinated, purposeful action. Each uses prescribed roles and a formal authority structure with rules and regulations to govern decisions and actions. In addition to a formal structure, they have informal patterns such as practises, norms and social relationships among their members. Their purpose is either to produce tangible or intangible products or services to make profit for their owners (profit-organizations); or try to bring about certain effects in their surrounding world (non-profit organizations). To complete their mission, they need and have access to both tangible and intangible assets. (ibid)
In the context of a company, a potential conflict of interests exists between the owners of the company and the management. The falls of large companies, such as Enron and WorldCom, are examples of where this conflict can lead and make it clear that there is a need for enterprise governance (or corporate governance). Enron was an example of poor enterprise governance and inadequate implementation of control practises (Powers et al 2002, 10). The root cause for Enron’s bankruptcy was that the management took no responsibility of oversight and the board had a very limited view on what was happening in the company (JCS 2003, 23).

25
Shareholders own the company and appoint a board to guide and oversee the executive management to ensure optimal use of the company's resources. Globalization has significantly increased companies’ complexity; in many cases, the role of management has become dominant. As long as the company is successful, the board is not concerned about the increased role of the management. Yet, when problems occur, the role of the board becomes critical. An adequate governance framework ensures that the board and the executive management are able to take full responsibility of the company, even in challenging circumstances. (Greenspan 2002)
The Organisation for Economic Co-operation and Development (OECD 2004, 11) defines corporate governance as "involving a set of relationships between a company’s management, its board, its shareholders and other stakeholders. Corporate governance also provides the structure through which the objectives of the company are set, and the means of attaining those objectives and monitoring performance are determined." The concept of corporate governance is two-fold: the behavioral side addresses the relationships and desirable behaviors of the different stakeholders, and the normative side sets the rules for these relationships and behaviors. Corporate governance defines the structures, processes and mechanisms that are used to govern the company.
The International Federation of Accountants (IFAC 2004) divides corporate governance to conformance and performance dimensions (Figure 3-1).
Enterprise Governance
ConformanceProcesses
PerformanceProcesses
• Chairman / CEO• Non Executive Directors• Audit Committee• Remuneration Committee• Risk Management• Internal Audit
• Strategic Planning and Alignment• Strategic Decision Making• Strategic Risk Management• Scorecards• Strategic Enterprise Systems• Continous Improvement
AccountabilityAssurance
Value CreationResouce Utilisation
Figure 3-1 Enterprise governance framework (IFAC 2004, 20)
The conformance dimension takes a historic view, managing the risks and monitoring accountabilities. The performance side is forward-looking, managing company’s strategy

26
and its execution, setting objectives and measuring performance, and ensuring continuous improvement. After the recent failures, the conformance side of corporate governance is often overemphasized. However, to be successful companies “need to balance between conformance and performance.” (ibid)
The board and the executive management have the responsibility for creating a framework for enterprise governance. The purpose of this framework is to enable efficient cooperation of the board and the executive management, and enforce alignment of company's strategic and operational goals. Thus, enterprise governance improves efficiency of the enterprise. Employees and other stakeholders are valued as a key resource in the organization's long-term success and should participate in governance practises (OECD 2004, 11-13, 46-48).
3.1.2 Why do we need IT governance?
As a logical follow-up of enterprise governance, IT governance is starting to appear in the agendas of board and management. The underlying needs for IT governance are analogous to those of enterprise governance. The failures of IT and IT projects emphasize the need for better control of IT and the strategic objectives of the company drive for more efficient strategic guidance of IT. Thus, a key driver for IT governance is the increasing demands from enterprise governance.
According to Weill and Ross (2004a, 15), IT is the most important capital investment for many enterprises. On average, the share of IT investment is greater than 4.2 percent of annual revenues, which exceeds 50 percent of the annual total capital investment of many enterprises. Yet, the mere level or amount of IT investment is not a guarantee of IT value generation. Poor IT governance may have serious consequences. Failure of IT may lead to business losses, reputation damage and a weakened competitive position. IT investments may fail completely, projects may deliver systems that cannot be used effectively or investments may fail to bring the benefits they promised. If the company is unable to adopt and assimilate available new technologies, its IT infrastructure and information systems may become inadequate or even obsolete. (ITGI 2003, Weill et al 2002)
According to a KPMG study (2005), forty-nine percent of organizations had experienced at least one project failure in the last 12 months and only two percent of organizations achieved targeted benefits all the time. The Standish Group has studied IT projects since 1994 and categorizes them into three groups (The Standish Group 2001). Successful projects complete on time and on budget, with all features and functions originally specified. Challenged projects are completed and operational, but over-budget, over the time estimate, and with fewer features and functions than initially specified. Projects that have been

27
cancelled or never implemented are categorized as failed. Figure 3-2 presents the IT project resolution history between 1994 and 2004 (Johnson 2006).
0 %
10 %
20 %
30 %
40 %
50 %
60 %
Succeeded 16 % 27 % 26 % 28 % 34 % 29 %
Challenged 53 % 33 % 46 % 49 % 51 % 53 %
Failed 31 % 40 % 28 % 23 % 15 % 18 %
1994 1996 1998 2000 2002 2004
Figure 3-2 IT project resolution history (Standish group CHAOS database, cited in Johnson 2006)
The Standish Group data shows that between 1994 and 2004 over 70 percent of IT projects either failed or were challenged (Johnson 2006). Although the percentage of failed projects has decreased since the mid-1990s, it is still significant.
In Finland, a recent well-known example of how challenging an IT project can be is the information systems modernization project of Finnish Vehicle Administration (AKE). The project started in 1999, and should have been complete in 2003. However, in 2007, the estimated year of completion was 2011 - eight years later than planned. The project lead has changed many times. The estimated costs are now up to 36.2 million euros, over twice the amount initially planned 16 million euros. Yet the reported costs do not include the costs of in-house development - the work of 50 to 70 AKE developers. Incomplete requirements and immature technologies are claimed to be the root cause for the delays and budget overruns. (Tolvanen 2007)
The role of information technology has increased and IT has become an integral part of the business. Thus, a more strategic control of IT is needed. At the same time, the complexity of IT has increased significantly, which implies that the executive management has often left IT planning and decisions to the experts, i.e. the IT function and management. Because of the tight linkage between IT and business processes, senior management needs to be more involved in the governance of IT (Weill et al 2004a).

28
3.1.3 What is IT governance?
While IT governance is a natural phenomenon, as a concept it is rather new. Early definitions of IT governance (e.g. Henderson & Venkatraman 1993, Luftman et al 1993, Brown and Magil 1994) consider IT decision-making and responsibility of IT. Typically, these researchers define IT governance as specifications of authority, structures and mechanisms of IT-related decision-making; and specifications of responsibility of IT. Luftman and Brier’s definition (1999) emphasizes a process-based view of IT governance and business-IT alignment as one of the key goals. Luftman also adds two new constituents to IT governance: setting of IT priorities and allocating resources to IT use. Recent definitions of IT governance (ITGI 2003, Weill and Woodham 2002, Gartner 2002, Van Grembergen 2000, The Opengroup 2003a, Weill and Ross 2004a) derive from the concept of enterprise governance. Thus, these definitions include both the behavioral and normative side of governance. This study adopts the following definition of IT governance by Weill and Ross (2004a):
“IT governance is the process by which firms align IT actions with their performance goals and assign accountability for those actions and their outcomes. IT governance is the decision rights and accountability framework for encouraging desirable behaviors in the use of IT."
The alignment of business and IT was a popular research topic in the 1990s. According to Dahlberg & Kivijärvi (2006), these studies address mainly three research questions: 1) What antecedents, contingency factors or enablers/inhibitors impact business-IT alignment? 2) How is alignment carried out? and 3) What are the outcomes of alignment or how are these outcomes measured? Luftman & Brier (1999) state that the importance of business-IT alignment has been acknowledged since the late 1970s. They define business-IT alignment as “applying IT in an appropriate and timely way and in harmony with business strategies, goals and needs.” Luftman & Brier’s definition is based on Henderson and Venkatraman’s (1993) model for strategic alignment (Figure 3-3).

29
Business scope
Distinctivecompetencies
Businessgovernance
Technologyscope
Systemiccompetencies
ITgovernance
Administrativeinfrastructure
Processes Skills
Architectures
Processes Skills
Business strategy IT strategy
Organizational infrastructureand processes
IT infrastructure and processes
Automation LinkageStrategic Fit
Functional integrationBusiness IT
Business scope
Distinctivecompetencies
Businessgovernance
Business scope
Distinctivecompetencies
Businessgovernance
Technologyscope
Systemiccompetencies
ITgovernance
Technologyscope
Systemiccompetencies
ITgovernance
Administrativeinfrastructure
Processes Skills
Administrativeinfrastructure
Processes Skills
Architectures
Processes Skills
Architectures
Processes Skills
Business strategy IT strategy
Organizational infrastructureand processes
IT infrastructure and processes
Automation LinkageStrategic Fit
Functional integrationBusiness IT
Figure 3-3 The strategic alignment model (Henderson & Venkatraman 1993, 476)
The key concepts of the strategic alignment model are strategic fit between the enterprise strategy and its organizational administrative structure that supports strategy execution, and functional integration between an organization’s business and IT domains. The functional integration consists of strategic integration and operational integration. According to Luftman et al (1993), the strategic alignment model is based on the view that “business success depends on the harmony of business strategy, IT strategy, organizational infrastructure and processes, and IT infrastructure and processes.“ All these domains are linked together and must be balanced; focusing too much or too little on any of these domains might be harmful for the enterprise and lead to unutilized resources and capabilities.
A typical framework for IT governance defines the structures, processes and mechanisms used to make key decisions about information technology in the enterprise (ITGI 2003, Weill & Woodham 2002, Weill et al 2004a, Van Grembergen & De Haes 2004):
1. IT governance processes are used to - provide strategic guidance and oversight for IT use in the enterprise - make decisions about the resources allocated to IT use in the enterprise - provide input and make decisions about business application needs and IT
investments

30
- create constructive relationships between business, IT and external partners - monitor IT’s performance and value creation - make decisions about the acceptable levels of IT-related risks - make decisions about IT architecture and technology standards.
2. Structures are used to engage different stakeholders to IT governance activities, common structures include:
- IT strategy committees with members from the board and executive management
- IT steering committees comprised of executive and senior management - CIO on board - IT leadership committees comprised of IT leaders - Process teams with IT members - IT councils comprised of business and IT executives - Architecture committees - Capital approval committees (investment committees).
3. Mechanisms are used to improve and promote the efficiency and effectiveness the enterprise’s IT use, these include:
- Service Level Agreements (SLAs) - IT scorecards - Chargeback arrangements - IT projects and resource usage tracking - IT business cases - IT portfolio management
Other types of commonly used mechanism include active conflict resolution, terminating underperforming projects and services, and using cross-functional business-IT job rotation.
Typically, governance mechanisms are unique to each enterprise asset (e.g. human, financial, physical and information and IT); however, Weill & Ross argue (2004a, 7) that use of shared governance mechanisms achieve better integration and create more value. Similarly, a key finding from a roundtable meeting between IT professionals and corporate governance experts was that "IT and corporate governance should not be treated as separate entities" (CIPS 2005). Unfortunately, this may not realize in the near future while another key finding from the same meeting was that "recognition of IT at the board level needs to be elevated from today’s low – and in some cases non-existent – levels." (ibid) As boards seem not to be ready to take full responsibility of governing IT and integrating IT governance to enterprise governance, it is important that companies implement a separate governance framework to govern IT.

31
The concepts IT governance and IT management are interrelated, yet distinct concepts. However, the distinction between IT governance and IT management is not often well understood. The following discusses the distinction between IT governance and IT management.
The goal of IT management is to deliver the IT services needed in the enterprise. IT management is typically the responsibility of the Chief Information Officer (CIO). According to ITSMF (2004), IT services should: 1) be developed in cooperation with the business; 2) meet the existing requirements; 3) be easily adapted to the future requirements; and 4) make effective use of all IT resources.
In the context of Henderson and Venkatraman’s strategic alignment model (Figure 3-3), the focus of IT management is on the IT infrastructure and processes, and on the operational alignment with organizational infrastructure and processes. On the other hand, the focus of IT governance is on IT strategy and its execution. IT governance attempts: 1) to ensure that IT strategy is aligned with business strategy; 2) to make decisions about the scope and focus of IT use and IT investments; and 3) to assess what competencies and capabilities are needed. Thus, IT governance is responsible for the strategic integration and IT management of the operational integration between business and IT domains.
Peterson (2003) presents a comparison of IT governance and IT management (Figure 3-4) that resembles Henderson and Venkatraman’s strategic alignment model, however, Peterson adds time as a new dimension.
Internal
External
Businessorientation
TimeOrientation
IT Management
IT Governance
Present Future
Figure 3-4 The focus of IT Governance and IT Management (Peterson 2003)
According to Peterson (ibid), the focus of IT management is more on the present than the future, and on the management of internal IT processes and structures to deliver the agreed

32
IT services. The focus of IT governance is more on the business side, on the contribution of IT to the current and future business needs. This also implies that IT governance is concerned mostly with processes and structures external to the IT function – mechanisms that link IT with the board, executive management, business units, business processes and other stakeholders (ibid). Salle’s (2004) description of different levels of maturity for IT function’s role in organizations (Figure 1-2) is similar to Peterson’s comparison of IT governance and IT management. However, instead of plotting business orientation against time, it plots IT function maturity against time. By combining the ideas by Peterson and Salle, one can argue that when IT function attempts to transform itself into a strategic partner of business and succeeds to increase its maturity, the role of IT governance is emphasized over IT management.
According to Weill et al (2004a), the company’s senior management has the best knowledge of the company’s strategy and operating model needed to make high-level decisions about IT use in the enterprise. However, senior managers cannot be involved with all IT decision-making. To overcome this limitation, the IT governance framework provides guidance for IT management by setting the direction, goals and resources for IT use and defining the responsibilities and accountabilities that ensure the desired outcomes are achieved. In addition, the framework provides senior managers the necessary information for making IT-related decisions. More importantly, it provides them a possibility to learn about new strategic opportunities created by IT, the risks attached with IT and the value created by IT.
3.1.4 Approaches to IT governance
Efficient implementation of IT governance requires a solid framework. International consulting companies have their own proprietary IT governance frameworks and use them as the basis for their consulting services. Two well-known public IT governance frameworks exist: the CobiT framework released by the CobiT Steering Committee and the IT Governance institute (ITGI 2005), and MIT CISR research-based IT governance framework developed by Weill & Woodham (2002) and revised by Weill & Ross (2004a, 2004b). Several other approaches intended for governance of IT have been introduced (e.g. Henderson & Venkatraman 1993, Dvorak et al 1997, Brown & Ross 1999, Popper 2000, Van Grembergen & De Haes 2004, Broadbent & Kitzis 2005, Symons et al 2005). None of these frameworks has achieved a de-facto standard status and companies often use a framework of their own.
ITIL (ITSMF 2004) and ISO 17799 (ISO 2005) are often mentioned as IT governance frameworks. Yet, ITIL is a library of best practises with the focus on IT service management and ISO 17799 is a standard on information security.

33
According Weill and Ross (2004a, 10-11), an effective IT governance framework must address three key questions: what decisions must be made, who should make these decisions, and how these decisions are made and how the outcomes are monitored. To answer the first question of IT governance, IT decision-making is divided in five key decision domains: IT principles define the business role of IT; IT architecture defines integration and standardization requirements; IT infrastructure strategies determine shared and enabling services; Business application needs specify the business need for purchased or internally developed IT applications; and IT investment and prioritization decisions choose which initiatives to fund and how much to spend.
Davenport et al (1992) studied information approaches in more than twenty-five companies to identify their information politics: the way companies made their decisions about the use and definition of information and information management. They identified five models for information politics: technocratic utopianism, anarchy, feudalism, monarchy and federalism. Weill & Ross (2004a, 12) build on these and define six decision-making archetypes. Business monarchy is a group or individual business executive, whereas IT monarchy consists of individuals or groups of IT executives. Federal archetype uses a combination of the centralized and the business unit decision-making with or without IT people involved. IT duopoly has two groups - IT executives and top management or business unit leaders –connected by a relationship manager. In a feudal arrangement, each business unit or business process is making independent decisions and anarchy means that an isolated individual or a small group is making all IT decisions.
The five key questions and decision-making archetypes are combined to an IT governance arrangement matrix; Figure 3-5 also presents the most common patterns of governance, according to MIT research (ibid, 64). The matrix has decision domains as columns and decision-making archetypes as rows. The flow of decision-making in the matrix is from left to right. First, the IT principles must be decided leading to decisions about the IT architecture, which in turn determine the selection of IT infrastructure. IT infrastructure provides capabilities on which business applications are built based on the needs of business process owners. A company uses all these decisions to drive the decisions about IT investments.

34
0020201021Anarchy
3062717233015343615Duopoly
279330816594461483Federal
30181210030Feudal
908059107320181IT monarchy
3011217060270Business monarchy
DecisionInputDecisionInputDecisionInputDecisionInputDecisionInput
ARCHETYPES
IT Investment
Business Appllication
Needs
IT Infrastructure
StrategiesIT
ArchitechtureIT Principles
DECISION
Most common decision patterns for all enterprises
Most common input patterns for all enterprises
Figure 3-5 The most common patterns of governance for all enterprises (Weill & Ross 2004a, 64)
Each archetype determines the type of people involved in the IT decision-making. Most enterprises use a variety of decision arrangements across the five decision domains. The challenge is to find the right responsibilities both for providing input to the decisions and to the actual decision-making. Organizations commonly use federal or duopoly arrangements to provide input for decisions. IT function typically makes IT architecture and IT infrastructure decisions, probably because the senior management finds these domains too complex to be involved in the decision. Arrangements for other decisions vary across enterprises. Many enterprises seem to treat IT investments like other investments – business people are commonly involved and often alone in charge of those decisions. The executive management clearly does not have enough knowledge to decide on IT principles; duopoly arrangement is the most common pattern to decide on IT principles. (Weill & Ross 2004a, 64-70)
The IT governance arrangement matrix answers to the questions what and who about IT decision-making. To answer the last question – how – enterprises typically use governance mechanisms. Decision-making structures are the most visible IT governance mechanisms, companies with different archetypes rely on different decision-making structures. Alignment

35
processes ensure all stakeholders make daily decisions that are consistent with IT policies and provide input and feedback to decisions such as IT investment proposal and evaluation processes, architecture exception processes, service-level agreements, chargeback, and metrics. Communication approaches are used in the form of announcements, advocates, channels, and education efforts to disseminate IT governance principles and policies and outcomes of IT decision-making process. The goal of communication is to create high awareness of how IT is governed and what are the desirable behaviors of IT use in the company. (Weill & Ross 2004a, 2004b)
The framework for Control Objectives for Information and related Technology (CobiT) was created by the Information Systems Audit and Control Foundation in 1996 to support the audit and control of IT in enterprises (ITGI 2004a, 5). While strategic management has become the most popular and successful management tool (Rigby 2005), many audit-based management frameworks, such as CobiT and ISO 9000 series, have also adopted strategy as their key driver. The latest version of CobiT includes the behavioral and normative sides of governance.
CobiT is a business-focused, process-oriented, control-based and measurement-driven framework (ITGI 2005). Its goal is to ensure that IT provides the information the enterprise requires to achieve its objectives. According to CobiT, to ensure this the enterprise needs to manage and control IT resources using a structured set of processes and related activities. CobiT provides good practices for IT processes and activities. The performance of IT is measured with a balanced scorecard - the IT scorecard - and the organization’s progress of IT governance is assessed with maturity models. The basic principle of the CobiT framework is that IT resources are managed by IT processes to achieve IT goals that respond to the business requirements. Because of its background, the focus of CobiT is not purely an IT governance framework; it also includes processes for IT management, such as acquiring, implementing and delivering IT systems and services.
The latest version of CobiT identifies enterprise architecture as a key factor in IT governance. The visible role of enterprise architecture in CobiT framework is an important indication of the fact that EA is gaining wider acceptance, and its role as a key to successful IT governance is acknowledged.
In the United States, the Information Technology and Management Reform Act of 1996 - the Clinger-Cohen Act (ITMRA 1996) initiated extensive development of federal IT management practises. The federal guidance addresses the key institutional IT governance and IT management disciplines that are interrelated and critical to ensuring, among other things, the integrity, security, and efficiency of IT systems. Domains addressed (GAO 2003b) include EA management, IT investment management, IT security management, and

36
system acquisition management. To assess and guide the implementation of these domains several frameworks are used: EA maturity frameworks (e.g. NASCIO 2003, GAO 2003a, DOC 2003, OMB 2005), maturity models for IT planning and IT investment management (DoC 2006, GAO 2004a), Information Security Management guidelines (GAO 1998) and SEI’s Software Acquisition Capability Maturity Model (SEI 2002a). Together these guidelines and frameworks provide an efficient and effective IT governance framework, the usability of which is by no means limited to the federal government.
3.1.5 Benefits and challenges of IT governance
The studies of MIT CISR (Weill et al 2002, Weill et al 2004a) have indicated that good IT governance pays off, and that firms with effective IT governance are constantly able to get returns from their IT investments that are above industry average. Although return on investment (ROI) is an essential requirement for all investments, in the case of adopting IT governance it may be hard to measure because almost all benefits are indirect. The following is a summary of the benefits of IT governance (Weill et al 2002, Weill et al 2004a, ITGI 2003, Broadbent & Kitzis 2005, GAO 2004a, Gartner 2002, CIPS 2005):
1. Enterprise alignment that is accomplished through - Clearly expressed business strategies and the role of IT in achieving them - IT strategy that is aligned with the business strategy - Organizational structures that facilitate the implementation of strategy and
goals - Considered decisions about where and how IT resources should be focused - Guiding implementation of IT strategy by addressing the level and allocation of
IT investments, and balancing the investments between those supporting and growing the enterprise
- a culture of openness and collaboration
2. Increased value from IT that is achieved by - A CIO who provides leadership on both the demand and supply sides - Ascertaining that IT delivers against the strategy through clear expectations and
measurement - Prioritized, cost-effective, reliable IT services which are consistent with the
enterprise operations and goals - Delivering solutions with the appropriate quality and functionality; on time, on
budget, with features and functions initially specified, and with expected benefits
- Taking an IT portfolio management approach to promote proper ranking and prioritization

37
- Knowing which services or processes are to be centralized or delivered as shared services, and which are to be decentralized or provided at individual business levels
- Responsible, efficient use of IT resources and being more adept in sharing and reusing IT assets
3. Reduced IT-related risks and increased awareness of them - Adopting an IT control framework to achieve clear roles, responsibilities and
accountabilities - Awareness and management of IT’s impact on business continuity due to
increasing reliance on information and IT in all aspects of the enterprise - Appropriate management of IT-related risks: mitigation, transfer to partners and
insurance, monitoring and accepting current risk levels - Enabling the implementation of compliance to regulatory requirements such as
Sarbanes-Oxley - Avoidance of IT failures, affecting the enterprise’s value and reputation
4. Increased business agility and enterprise flexibility from - Maintaining IT’s ability to support the organization’s business growth – both
organic and by mergers and acquisitions - Faster response to new requirements from the business environment - Effective use of information and knowledge by IT-enabled knowledge
collection, building and distribution - Having a capacity to follow and understand major technological events and
trends to enable IT-driven strategic business change - Taking advantage of IT’s enabling capacity for new business models
5. Enhanced organizational learning and capabilities through communication - More involvement of senior management and board in information technology - Widespread participation and understanding of governing IT use in the
enterprise - Creating constructive relationships and effective communications between the
business and IT, and with external partners - Assigning accountability for the organizational changes required to benefit
from new IT capabilities - Better and faster IT-related decisions accomplished through learning from each
implementation
IT governance has benefits that affect all levels of a company from personnel to the executive management and the board. Yet, the adoption of IT governance may be a challenging because an optimal IT governance framework for each organization is unique. While the objective and purpose of IT governance are easy to understand, people typically resist change. Resistance may be persistent and hard to overcome when it involves changes in authority and responsibility. Thus, the adoption may not lead to intended benefits.

38
For many reasons, IT governance may fail to deliver what it promised. Business executives mainly focus on the interests of their own business, not on the overall success of the enterprise. The IT function may be reluctant to change its way of thinking into a more business-oriented approach. In some cases, the adoption of IT governance is a synonym to central decision-making and may introduce a dictatorship of what may be done - business units and functions may find this hard to accept. The adopted IT governance practises may be bureaucratic, and inefficient to produce the intended results. In addition, they may cause delays to decision-making, which may lead to lost organizational inertia or a missed opportunity.
Governance structures may be ineffective and inefficient for reason such as: business executives who should attend the meetings are busy and delegate attendance to a level that has too little authority in their business units; committees end up in never-ending discussions and do not provide the input or decisions needed; they may consist of people who mainly govern the interests of their of group, not the interest of the whole company; and politics may appear in the form of interest groups trading approval of their own investments against approving others’ proposed investments. According to Meyer (2006), there are two main reasons for ineffective governance structures: 1) the governance structures have been formed for the wrong reasons, and 2) they are formed with vague purpose. Meyer states the following possible wrong purposes why a committee may have been formed:
- to gain access to business executives – a committee does not make the issue valuable for the business executive
- to gain support for IT initiatives – business does not support IT initiatives because a committee agreed to it
- To gain greater business involvement in IT – business is involved in IT if the value proposition is right
- To communicate better with the business – as a communication channel a committee is ineffective and insufficient, it is better to have more focused meetings
- To approve decisions made by staff – a committee rarely has sufficient knowledge to approve technical decisions, such as architectural standards. These decisions are unnecessary bureaucracy and disempower the staff.
If the purpose of a governance structure is not clear, it may become involved in domains that are not its responsibility, confusing and disempowering staff, slowing innovation and making poor decisions. (ibid)
Another key reason why IT governance may fail is communication; without effective communication, stakeholders of IT do not know how and by whom IT-related decisions

39
should be made. Yet, such knowledge should be institutionalized throughout the company. While governance structures provide forums for communication, they are not guarantees of effective communication. A key objective of communication inside an organization is to create shared knowledge about where the enterprise currently is and where it wants to go. Without this, IT governance may lead to decisions that do not optimally support the execution of a company’s strategy. Thus, IT governance needs tools to provide this knowledge and means for communicating it – IT governance needs enterprise architecture.
3.2. Enterprise Architecture
3.2.1 Why do we need enterprise architecture?
Architecture is a concept with a wide usage; it can be used to connote abstract, natural and human-made things. O’Rourke et al (2003, 6) define architecture as “the design of any type of structure, whether physical or conceptual, real or virtual.” In enterprise architecture (EA) the concept to be designed and described is the enterprise. EA has evolved from the need for more careful planning of the enterprise - to be able to guide and support effective use of information technology in the enterprise.
The increasing pace of information technology evolution is an important factor influencing the need for enterprise architecture. Zachman (1999, 4-5) claims that the adoption of EA approach is a key to survival because of complexity and high rates of change. To achieve its vision, a company needs to understand where it currently is, where it wants to be, and what actions have to be taken to get there. Communicating these is challenging without appropriate methods and tools. EA describes the current and future states of the enterprise with visual models that make communication easier and more effective; “a picture is worth a thousand words.”
According to Weill & Ross (2004a, 34) organizations need a stable platform to build on to enable support for the constantly changing business needs - EA is needed to provide that flexibility. "The paradox of agile enterprise is that short-term implementation creates the illusion of agile enterprise. Short-term implementation creates only temporary relief to the enterprise, whereas a long-term implementation strategy using enterprise architecture makes the enterprise truly agile" (O'Rourke et al 2003, 545). The traditional approach to develop information systems is to build or purchase applications for the purposes of one functional area or business at a time. This often leads to an application silo architecture (Ross 2003, 35) where applications address a specific business need, each application is hosted on the best available technology platform and processes are limited to a single function or geographical location. According to Ross, this kind of architecture encourages innovation,

40
but introduces many types of problems: it lacks integration, has redundancies at many levels, focuses on local optimization, becomes increasingly complex and eventually makes IT to a bottleneck that prevents the organization from changing and growing.
The root cause for implementing application silo architecture lies at the enterprise level: the lack of a holistic view of an enterprise provides insufficient scope for an appropriate evaluation of an investment. Paradoxically local solutions rarely provide an optimal solution to the enterprise’s needs – although in many cases it may seem so. A holistic enterprise architecture describing the current and future states of the enterprise provides the reference needed for a proper evaluation of a proposed IT investment.
To overcome the problems of application silo architecture, many companies have adopted enterprise resource planning (ERP) systems. In an ERP system, the complexity still exists, although inside one specific system. A successful ERP implementation requires a sound business case to drive the implementation: making changes to business processes, training people instead of customizing the application, unlearning from old working habits, and delivering the whole system in controllable stages (Millman 2004). When adopting a staged approach, an organization needs to describe its current state, define what functionality of an ERP system it needs, and create a road map of how this is accomplished – in other words, an organization needs EA to manage this change.
The logic of an ERP system is hard-wired, which significantly limits what kind of changes can be made. In addition, modifications to ERP systems are costly and timely. Companies can rarely manage their information processing needs by using only an ERP system – they need other information systems to satisfy other needs of the business. Companies typically need to integrate these other systems with an ERP system – a task that is both complex and costly. EA is needed to describe the integration between these systems at business process, information system and hardware levels. A typical challenge in integration is master data management; enterprise architecture provides assistance for this by defining the enterprise’s key data and information, its lifecycle management, and the standards for information exchange.
An example of a concrete situation where enterprises need EA is a merger or a reorganization of the enterprise. Typically, a major reconfiguration of organization and business processes may take years, and introduce performance problems. However, a well-designed and implemented enterprise architecture and concurrent development of business and IT architecture enables quick transformations of the enterprise. In such cases, the timeframe required for the reorganization may be weeks instead of years, as in the case of Nokia’s major organizational change in the year 2004 (HP 2005b, 9).

41
3.2.2 What is enterprise architecture?
Zachman (1987) introduced the concept of Information Systems Architecture (ISA), later known as the Zachman Framework for Enterprise Architecture, in short, the Zachman Framework; it is the foundation for most of the later architecture frameworks.
The definitions of enterprise architecture fall into two categories: the first types of definitions emphasize enterprise architecture as a framework (e.g. Zachman & Sofa 1992, Zachman 1997, Harmon 2003, GAO 2004b, Kaisler et al 2005, The Opengroup 2003a). An example of this type of definition is Zachman’s definition (1997): "Enterprise architecture is set of design artefacts, or descriptive representations, that are relevant for describing an object such that it can be produced to requirements (quality) as well as maintained over a period of its useful life (change).” The second category of definitions represents the recent views of enterprise architecture and emphasizes EA as a process to transform and change the enterprise (e.g. Burke 2004, Langenberg & Wegmann 2004, NASCIO 2004, Gartner 2006). An example of such definition is Gartner’s definition of EA (Gartner 2006): “Enterprise architecture is the process of translating business vision and strategy into effective enterprise change by creating, communicating and improving the key principles and models that describe the enterprise's future state and enable its evolution.”
By combining these two categories, it can be concluded that enterprise architecture consists of a framework that specifies the methods, models, tools, and artefacts used in architecting the enterprise, and structures, processes and mechanisms that are used to govern and manage the design and use of EA artefacts.
For the purposes of this study, the following definition of EA given by Kaisler et al (2005) is adopted:
"An enterprise architecture (EA) identifies the main components of the organization, its information systems, the ways in which these components work together in order to achieve defined business objectives, and the way in which the information systems support the business processes of the organization.”
When Zachman (1987) introduced the concept information system architecture, he used an analogy to classical architecture to describe it because for most people architecture denotes a building architecture or city architecture. Building a house in a modern city environment requires architectural plans at many levels, from the city architecture guidelines to the detailed contractor implementation plans. A comprehensive set of plans is needed to fulfil the requirements and constraints of all different stakeholders. These plans describe the

42
construct of a building to the various parties involved. A key role of these plans is to assist the stakeholders in communicating why and where the building is going to be built, what it is going to look like, how and when it is to be built, who are the different stakeholders in this undertaking and what are their responsibilities.
The architectural plans also have an important role after the design and construction processes of the building. Later on, the owner and other stakeholders need these plans to maintain, modify and finally demolish the house. Without documented plans and descriptions, all required information would have to be separately collected each time a specific need arises. Thus, the architectural plans and related documentation of the building can effectively be used throughout its whole lifecycle.
The following describes Zachman’s Framework as an introduction to enterprise architecture. The Zachman framework is a matrix that combines two ideas: the use of different viewpoints each with a specific view, and the use of different types of descriptions to describe the system. A view is “a part of an architecture description that addresses a set of related concerns and is addressed to a set of stakeholders.” (ter Doest et al 2004, 10). According to ISO/IEC (ISO 2007), a viewpoint is a “pattern or template from which to develop individual views by establishing the purposes and audience for a view and the techniques for its creation and analysis.” The techniques, or types of descriptions, one should consider for a viewpoint include the concepts, models, analysis techniques and visualisations. In simple terms, “a view is what you see, and a viewpoint is where you are looking from.” (ter Doest et al 2004, 10) The six different types of descriptions of the Zachman Framework answer to the question words what, how, where, who, when and why. For every viewpoint, a different kind of model is used to describe the entity. (Zachman 1987, Zachman et al 1992)
The following paragraphs describe the Zachman framework’s viewpoints and views (Zachman et al 1992, 591-592, Zachman 1998 & O’Rourke 2003, 11). The first viewpoint is scope - the planner’s view. These are the architect’s first sketches and drawings that base on the owner's requirements and describe the idea about what the product would look like. The purpose of these sketches is to help in communicating and agreeing on the initial design and scope of the product; and to provide an estimate of what it would cost, and how it would perform. In the context of EA, these descriptions would list things important to the enterprise, processes the business performs, locations where the business operates, organizations important to the business, events significant to the business and the business goals and strategies of the enterprise. These define the scope and boundaries for the enterprise.
In classical architecture, Zachman Framework’s enterprise model or business model correspond to the architect’s drawings describing the final building from the owner’s

43
perspective. In EA, this row contains models of the actual enterprise things (objects and assets), business processes, logistic system, and workflow – that is, the allocation of roles and responsibilities and specifications of work products, master schedule, and business plan. These models describe what is the enterprise’s mission, vision and strategy, how the enterprise operates, who and where is responsible for carrying out the work, what information and other assets are needed, and what the important cycles or timeframes for the operation are.
The system model represents the designer’s view and translates the architect’s plans into detailed specifications from the designer’s perspective. The designer must consider technical and physical constraints of the real world and produce a model of the building that is achievable. The models in the designer’s view describe a technology neutral presentation of the enterprise’s information, systems used for information processing, system implementation of the business logistics system and human interaction architecture – that is the roles and specifications related to work and its management. In addition, this row contains a logical model of system events and cycles, and a logical representation of the enterprise business rules.
The system model is the input for the builder’s view; the builder creates a technology model of the product, which is the implementation of the system model with a consideration of tools, technology, and materials available. In EA, the technology model describes how to implement the information processing logic with the technology available; technology dependent models for information, processing logic, hardware, human interface, and implementations of control structures and business rules.
The construct of buildings, and increasingly information systems, involves several parties; the descriptions in the subcontractor’s view represent the shop plans that specify the details of parts or subsections – the components of the building. In EA, these correspond to the detailed specifications of the individual components of the system. The plans in the first four viewpoints from the planner’s view to builder’s view are in-context as they describe the product in entity. However, the plans at the component level are out-context as they concern only parts of the total structure. This distinction is significant, because being out-context makes these components highly reusable; if they are highly standardized, they can be used in many contexts – at least in contexts with quite similar characteristics.
The result of combining the ideas of using different viewpoints and different types of descriptions is the Zachman Framework presented in Figure 3-6. Zachman’s initial information systems architecture (Zachman 1987) consisted of the first three columns, Zachman & Sofa (1992) later extended the framework by adding the last three columns.

44
What? Data
Entities
How? Function Functions
Where? Network Links /
integration
Who? People
Organization / responsibilities
When? Time
Cycles
Why? Motivation
Ends
Scope (planner)
List of important
things
List of processes
List of operating locations
List of important
organizations / business units
List of significant
events
List of business
goals/strategy
Enterprise model (owner)
Entity diagram
Process model
Logistic network
Organization chart
Master schedule
Business plan
System model
(designer)
Data model
Data flow diagram
Distributed system
architecture
Human interface
architecture
Processing structure
Knowledge architecture
Technology model
(builder)
Data design
Structure chart
System architecture
Human technology architecture
Control structure
Knowledge design
Components (sub-
contractor)
Data definition
Program Network architecture
Security architecture
Timing definition
Knowledge definition
Functioning
system Data Function Network Organization
Schedule Strategy
Figure 3-6 Information systems architecture framework (Zachman & Sofa 1992)
The different representations in each viewpoint have different levels of detail. However, their different nature makes them significant. Different viewpoints are required simply because “modern systems are too complex to be grasped all at once (Clements 2005, 15).” The primary goal of architecture is to give a holistic description of the enterprise and provide all stakeholders the information they need. Different stakeholders need and typically use different viewpoints and views to understand and describe the system.
Ter Doest et al (2004, viii) suggest that three main types of purposes for a view should be considered:
- Design viewpoints support architects and designers of the construct, the models used are typically different types of diagrams, such as UML.
- Decision viewpoints help managers in decision-making, and offer information and give insights for cross-domain architectural relations. The information for a decision maker is typically described by cross-reference tables, landscape maps, lists and reports.
- Information viewpoints are used to communicate the architecture to any stakeholder to create shared understanding, commitment and to provide advisory information. Examples of such are illustrations, animations, cartoons and flyers.

45
An important feature of Zachman’s Framework is that the different views provide additive constraints for the enterprise. Table 3-1 summarizes the constraints for different Zachman Framework viewpoints (Zachman & Sofa 1992). Primary constraints for any enterprise are financial. The external operating environment is another major factor, setting constraints and requirements for the scope of the system. In the owner’s view, usability constraints are derived from the enterprise’s policies, and the intended use of the system. The system model sets the design constraints defining the structure and operation of the system, which is then implemented by the subcontractor according to the construction constraints of the technology model in the builder’s perspective. Thus, the final implementation of the system is subject to all constraints and requirements of every perspective of the framework.
Table 3-1 Constrains for Zachman framework viewpoints (Zachman & Sofa 1992)
Viewpoint Constraint Model
Planner Financial / external Scope
Owner Usage / Policy Enterprise Model
Designer Structure / operation System model
Builder Technology Technology model
Subcontractor Implementation Out-of-context models
An enterprise is implemented by transforming the requirements and descriptions of enterprise architecture in the higher row to a new model in the lower row. Ideally, these two models are consistent, that is, there are no gaps between the two models. This implies that the higher-row model can be reverse engineered from the new lower-row model. In practise, the transformation easily introduces gaps; the only way to try to avoid the gaps between the models is the cooperation of the designer and all parties involved in the transformation. (ibid)
Enterprises are not often built from scratch, thus the primary purpose of enterprise architecture is to enable an enterprise to change and evolve. The basic rules for Zachman framework state that the logic of the architecture framework is recursive, which means that several versions of each framework cell can exist. In practise, this implies that a company with mature enterprise architecture has described both the current and the intended future state of the enterprise. A transition strategy or a road map is an important part of EA describing how the vision of the enterprise can be achieved by going from the “as-is” state through a set of intermediate states to the “to-be” state of the enterprise (Figure 3-7). (Zachman & Sofa 1992, OMB 2005)

46
CurrentArchitecture
(”As-Is”)
CurrentArchitecture
(”As-Is”)
TargetArchitecture
(”To-Be”)
TargetArchitecture
(”To-Be”)
TransitionStrategy
Figure 3-7 EA Transition Strategy (OMB 2005, 35, based on Zachman & Sofa 1992)
Enterprise architecture is thus a kind of “master plan for managing the business, the information, the applications and the ICT infrastructure.” (Hirvonen & Pulkkinen 2004)
An EA framework typically includes (CIO Council 1999, 16-17, Campbell & Mohun 2007, 233):
- Business architecture – the descriptions of the enterprises business i.e. critical elements of the enterprise strategy and processes, and how they drive IT
- Information architecture – the definitions of what information and data is needed to support the business, and how they are delivered and managed
- Application architecture – the portfolio of applications and IT systems to support the needs of the organization and business processes
- Technology architecture – the definitions of what supporting technology is in place to provide an environment for applications; the IT infrastructure, security, management, networking and other capabilities required to support the organization.
The concept IT architecture is often used to denote the compound set of information, application and technology architectures. Weill & Ross (2004b, 30) define IT architecture as “the organizing logic for data, applications, and infrastructure, captured in a set of policies, relationships, and technical choices to achieve desired business and technical standardization and integration.” This implies that enterprise architecture consists of business architecture and IT architecture; these represent the business and IT domains of the enterprise.
In the context of EA, the previously described concept of Business-IT alignment (see section 3.1.3) can be interpreted as follows: when there is a high alignment between business and IT, the business architecture represents the real requirements and needs of the business and the lower level architectures are defined and implemented in a way that no significant gaps between these architectural levels exist.

47
3.2.3 EA governance and management
A mature, well-managed and governed enterprise architecture provides flexibility and adaptability for the enterprise. According to Burke (2004), to enable adaptive enterprise, EA should be:
- Consistent with the existing environment and create harmony between the different architectural domains (business, information, application and technology)
- Extensible – every architecture component should be designed to encompass the full enterprise
- Scalable – solutions should be highly scalable to enable the enterprise to grow
- Supportable – solutions should support business, and the solutions themselves should be supportable on a global basis
- Comprehensive – the architecture should cover the whole of the current and future environments of the enterprise
- Lucid – the architecture should be business-change-driven and have clear targets for change and support both incremental and disruptive changes
- Modular – the architecture should be component-based to establish a culture of optimum reuse and portability.
To ensure that enterprise architecture achieves these objectives, it needs appropriate governance and management. The distinction between EA governance and EA management is comparable to the distinction between IT governance and IT management discussed in section 3.1.2. The management of EA is often the responsibility of chief architect, who should be accountable to the governing body of EA, such as an architecture committee or the CIO. Similar to the focus of IT management, the focus of EA management is to provide the services and EA artefacts required by the enterprise stakeholders. To be effective, the deliverables of EA must be produced according to business requirements and needs, be easy to understand and provide the information the different types of users need.
According to Baker & Januzewski (2005), EA governance refers to “how an organization makes decisions, sets priorities, allocates resources, designates accountability, and manages its architectural processes.“ Like IT governance, EA governance must address both behavioral and normative sides of governance; and define appropriate structures, processes and mechanisms to govern EA.
The behavioral side of governance includes processes to provide vision, principles and goals for the use of EA in the organization; to guide its design and management; and to give guidance about when compliance with EA is required and when it is not required. The

48
processes for the normative side of EA governance must ensure that enterprise architecture deliverables are produced according to EA principles and goals; that they are adhered and communicated across the organization; and that they are used and achieve the desired outcomes (Aziz et al 2006, Campbell & Mohun 2007). Typical structures used for EA governance are (Aziz et al 2005, Ross et al 2006): architecture steering committees, chief architects, and architecture groups at lines of businesses and key focus areas. The key mechanisms of EA governance are IT investment review and related exception handling, and having architects at projects teams to ensure architecture compliance.
It is important to understand the role of exceptions. EA evolves in two ways: by analysing the gaps between the current and the future states of EA, and creating and executing a related transition plan; or by fulfilling the unforeseen needs of the business or taking new unplanned opportunities created by emerging technologies (GAO 2004a, 25). Like the enterprise, EA needs agility and flexibility - architectural agility is achieved by exceptions. An approved exception requires that the architects have to make changes to EA. This may lead to reluctance to accept the exceptions even when they might prove beneficial to the enterprise and enterprise architecture. Thus, EA governance must ensure that the organization has an efficient and effective architecture exception process.
Ylimäki (2006) states that assessment and evaluation is a key part of EA governance. It is the responsibility of EA management to inform EA governance of the maturity and value of EA efforts. The maturity of EA is relatively easy to assess and several frameworks for EA maturity assessment exist. According to Aziz et al (2006), EA performance measurement could include activity-oriented metrics based on activities completed, acceptance oriented metrics describing EA acceptance in the enterprise, and value oriented metrics evaluating the costs, benefits, quality and risks related to enterprise architecture. Measurement is a key to achieve goals, “you are what you measure” (Hauser et al 1998) - in other words, if you cannot measure it you will not get it.
3.2.4 Approaches to enterprise architecture
According to a recent Infosys web survey (Infosys 2007), the most commonly used frameworks among the responded companies were The Zachman Framework (28%), The Open Group Architecture Framework - TOGAF (27%), the Federal Architecture Framework - FEAF (8%) and the Department of Defence Architecture Framework - DODAF (7%). The survey targeted enterprise architects and IT decision makers from the Infosys customer base; the survey results are based on 262 responses. The Zachman framework was described previously; the following gives an overview of TOGAF and FEAF architecture frameworks.

49
The Open Group Architecture Framework (TOGAF) consists of three main parts (The Opengroup 2003a):
- The TOGAF Architecture Development Method (ADM), which explains how to derive an organization-specific enterprise architecture that addresses business requirements
- The Enterprise Continuum, a "virtual repository" of all the architecture assets - models, patterns, architecture descriptions, etc. - that exist both within the enterprise and in the IT industry at large, which the enterprise considers itself to have available for the development of architectures.
- The TOGAF Resource Base, which is a set of resources - guidelines, templates, background information, etc. - to help the architect in the use of the ADM.
TOGAF’s Architecture Development Method (Figure 3-8) describes a systematic approach to enterprise architecture development, which can be applied regardless of what enterprise framework the enterprise chooses to use.
DTechnologyArchitecture
AArchitecture
VisionB
BusinessArchitecture
CInformation
SystemArchitecture
HArchitecture
ChangeManagement
GImplementation
Governance
FMigrationPlanning E
Opportunitiesand Solutions
Prelim:Framework
and Principles
Requirements
2.Consider
Views 3. Createarch.model
4.Select
Services
5.Confirmbus. objs6.
DetermineCriteria
7.Definearch.
8.Conduct
gapanalysis
1.Create
Baseline
Figure 3-8 TOGAF Architecture Development Cycle with expansion (The Opengroup 2003a)

50
The key driver of the TOGAF architecture framework is the architecture vision. To implement this vision, the baseline (as-is) architectures and target (to-be) architectures for business, information systems (information and application) and technology architectures are developed. The information of baseline and target architectures is used to conduct a gap analysis, the opportunities are then identified and business requirements converted to solutions that implement the target architecture. This iterative development cycle is then applied again to update the EA vision, the future target architecture and the steps needed to implement it (The Opengroup 2003a).
The Federal Architecture Framework (FEAF) is an enterprise architecture framework developed and maintained by the Chief Information Officers Council of the U.S. Federal Government. Its goal is to promote interoperability, resource sharing and potential for reduced costs, increase the ability to information sharing and provide support for capital IT investment planning in the United States Federal Government (CIO Council 1999, 4). In U.S. Federal Government, enterprise architecture is seen as a cornerstone for the effective use of information technology, thus each government agency is required to develop and maintain enterprise architecture of its own (ITMRA 1996).
The FEAF is composed of eight components (Figure 3-9): architecture drivers, strategic direction, current and target enterprise architectures, transitional processes, architecture segments, architectural models and standards. It extends Zachman framework with a segmented structure (Figure 3-9). Architecture segments are typically key business areas and allow individual parts of architecture to be developed independently from others while still maintaining an integrated larger EA. (CIO Council 1999)
Target
Architecture
BusinessArchitecture
DataArchitecture
ApplicationsArchitecture
TechnologyArchitecture
Vision
StrategicDirection
Principles
BusinessArchitecture
DataArchitecture
ApplicationsArchitecture
TechnologyArchitecture
Current
Architecture
BusinessArchitecture
DataArchitectureBusiness
Drivers
TechnologyArchitecture
ArchitecturalSegments
ApplicationsTechnology
DataSecurity
InvestmentReview
SegmentCoordination
MarketResearch
AssetManagement
Architectural Models
Transitional Processes
Standards
DesignDrivers
ArchitectureDrivers
ApplicationsArchitecture
Figure 3-9 Federal Enterprise Architecture Framework, Level III (CIO Council 1999)

51
The Federal Enterprise Architecture Framework uses four different levels of abstraction to help understand the enterprise architecture. The highest level, level 1, introduces the eight components of FEAF; level 2 shows how business and design aspects of the architecture are related; level 3 describes in detail the components of the architecture (Figure 3-9); and finally level 4 applies the Zachman framework to describe the business and design architectures: business, data, applications and technology (ibid).
3.2.5 Benefits and challenges of Enterprise Architecture
Enterprise architecture has potential benefits at many levels of the organization and at different focus areas of business and IT. Most EA benefits are indirect, depend on the scope of EA adoption (what architecture domains of EA are included) and the completion maturity of EA domains, and are best realized when EA is widely accepted and used. EA has potential to be a key enabler of business-IT alignment at all levels: from governance to management, from strategy to operations.
The following summarizes the benefits of enterprise architecture (Boh et al 2003, Ross et al 2006, O’Rourke et al 2003, Aziz et al 2005, Campbell & Mohun 2007, Brown 2004, Burke 2004, GAO 2003a, GAO 2004a, GAO 2006):
1. EA enables better enterprise governance and accountability - EA clarifies and explicitly documents the mission, vision, strategy, policies and
the operating model of the enterprise - EA provides a basis for defining and documenting goals and desirable
behaviors for asset use in the enterprise (such as IT) - EA helps to establish discipline in transforming and managing the enterprise
2. EA provides an engagement model for business and IT - EA provides means for communication and senior management involvement - EA creating an EA transition plan shows business and IT initiatives on the same
strategic timeline - the execution of the transition strategy implements the “to-be” enterprise
project by project
3. EA defines appropriate level of integration and standardization - EA’s holistic approach shifts focus from local to global optimization - standardization of technology, data and processes enables integration,
modularization, reusability, and interoperability - EA eliminates redundancies, yet promotes a diversity of capabilities by
enabling local innovation

52
4. EA achieves more value from IT - EA minimizes assumptions about the enterprise and provides the understanding
needed to assess the levels of risk attached to business and IT initiatives - EA enables more focused IT investments, eliminating redundancies and killing
projects with no clear benefits - EA promotes increased efficiency, coordination, transparency and agility of IT
use and IT services delivery - EA promotes enterprise agility, adaptability, flexibility, growth and reduced
time to market - EA plays a critical role in deciding when to adopt new technologies
5. EA enables increased shared understanding and organizational learning - EA is primarily a tool for thinking, reasoning, and communicating - EA helps to overcome the complexity of understanding and changing the
enterprise - EA provides a basis for setting selecting and funding initiatives - EA helps to understand, organize, save and communicate the data, information
and knowledge needed in the enterprise
The summary of EA benefits makes it obvious that many of the benefits of enterprise architecture are quite similar to the benefits of IT governance (see section 3.1.5). This is an indication that IT governance and EA are interrelated. Effective IT governance needs EA, thus adoption of IT governance promotes adoption of EA. When used together, the benefits that are attainable from EA and IT governance increase. The types of benefits achieved and EA’s relationship with IT governance typically evolves while its adoption matures. This relationship between IT governance and EA is further discussed in section (3.3).
Zachman introduced the concept of enterprise architecture in the late 1980s; the importance of EA is widely accepted, yet EA has not been widely adopted. The benefits of EA adoption can be significant, thus one could claim that an EA-related knowing-doing gap exists in many organizations. The following paragraphs discuss the key challenges of EA that probably explain why EA has not been as widely adopted and used as one could expect.
Zachman (1999) states four reasons why EA has not emerged in the enterprise agenda: 1) architecture is countercultural, its value is hard to measure; 2) EA is not perceived to be an enterprise survival issue; 3) we do not know how to actually do all of it; and 4) EA takes time and actual work. Baker and Januszewski (2005) claim that mainly two reasons explain why organizations have difficulties with EA: 1) frameworks are not often readily actionable, organizations have to design EA management processes themselves; and 2) the results of EA efforts are often difficult to communicate, and enterprise linkages and interactions are not well understood or documented - making it difficult to use EA as a business enabler.

53
Documenting EA is a time-consuming task. However, without proper documentation, only tacit knowledge and assumptions exist about EA; communicating an EA that exists only in architects’ minds is an impossible task. Some organizations have not adopted EA because they consider EA excessively documentation-intensive; this may be true especially if an organization’s goals for EA are too ambitious. Appleton (2004) states that “an enterprise is not … a deterministic system whose behavior can be manipulated by direct actions.” The larger the enterprise, the more impossible it is to “engineer” the enterprise to act as a single entity. An enterprise is always dependent both on its internal characteristics and on its operating environment. Appleton argues also that while EA creates the discipline needed for enterprise transformation, the discipline has to be of the “right type.” By right type of discipline he means that EA does not try to specify everything.
To avoid trying to specify everything, it is necessary to determine the scope of enterprise architecture activities. In a small or midsize enterprise, it may be sufficient to have EA activities on the enterprise level only. However, in a large enterprise, EA activities are needed at all business levels such as a division or a business unit (Campbell & Mohun 2007, 235). To manage the appropriate level of guidance and control, Malan & Bredemayer (2002) suggest considering a minimalist approach; keeping the architecture decision set as small as possible. The organization should carefully define what decisions are architectural at enterprise level - needed to maintain enterprise integrity, a single, unified overall design, form, or structure - and what decisions can be made at narrower EA domain levels, such as individual business unit level, without violating the integrity (ibid).
Distributing architectural decision to an appropriate level is important because by trying to use too much power – central guidance and constraints – an organization will encounter resistance (ibid). According to Burke (2004), companies usually have the right EA vision and strategy but fail to execute it. He argues that the problems with EA are often cultural, structural, or organizational. As EA is a tool for change, people may also resist tools that promote change. Yet, Burke states that it is important to understand that EA itself is not a driver for change. Changes in business requirements and operating environment are the key drivers for change, not EA - its role is to create an adaptive framework within which the creativity of the enterprise’s stakeholders can be applied (Appleton 2004).
EA has its roots in information technology development. While EA includes business architecture and thus describes the enterprise business model, EA adopters may have a separate BPM (Business Process Management) or TQM (Total Quality Management) initiative ongoing. In such cases, EA governance and EA management have failed to integrate EA into the governance of the enterprise’s key resources. Many enterprise architects have an IT background; such background is often expressed to be advantageous for an enterprise architect. For example, Baker and Januzewski (2005) claim that “enterprise

54
architects grow from within the technical architecture ranks.” However, to “sell” EA to business people, more enterprise architects should have business background. The IT background is also reflected in how organizations use EA. Campbell and Mohun (2007, 234) argue that most organizations use EA only to manage their infrastructure and technology. EA should deliver much more to fulfil the business needs, and the enterprise architecture team should focus more on the business side of enterprise architecture. (ibid)
An adoption of any approach, tool or framework that is intended to improve the enterprise’s operations should be treated as an investment. While the benefits of EA may not be clearly visible and often take a considerable time to achieve, an enterprise may have difficulties to create a strong business case for EA adoption. Yet, the proper use of EA that is complete enough can provide the benefits expected - some of them even in short-term. Benchmarking can be an important way to find evidence needed to make a solid business case for EA.
3.3. IT Governance & Enterprise Architecture
IT governance and EA are described as closely interrelated concepts that are intended to be used together. For example, the U.S. General Accounting Office (GAO) states that the concurrent evaluation and development of both IT investment management processes - key processes of IT governance - and EA can “greatly increase the chances that an organization’s operational and IT environments will be pursued in a way that optimizes mission performance.“ (GAO 2004a, 6)
However, the literature often does not emphasize that the concepts are related. For example, Brown and Grant (2005) present a literature review of IT governance; the concept of enterprise architecture is not mentioned in their article, and IT architecture is only mentioned with reference to the IT governance framework developed by Weill and Ross (2004a). Similarly, Chan & Reich (2007) present a literature review of research on business-IT alignment and do not mention the concept EA. Yet, Chan & Reich present the strategic alignment model of Henderson & Venkatraman (1993) in their article. By comparing the strategic alignment model with the Zachman Framework, it can be concluded that the strategic alignment model includes most of the key constituents of EA (see sections 3.1.3 and 3.2.2). Thus, a relationship between IT governance and EA would seem logical. In addition, the expected benefits of EA, described in section 3.2.5, would expectedly have an effect on governance of IT. The following discusses the relation between IT governance and EA in more detail.
According to Ross, Weill and Robertson (2006, 8-10), an enterprise initiates strategic initiatives of varying size to achieve its vision (Figure 3-10). Strategic initiatives are

55
“corporate programs aimed at creating new business processes or transforming existing ones to accomplish major goals, such as enhancing productivity or improving customer service” (Roberto & Levesque 2005). Today practically all strategic initiatives rely on information technology. According to Ross et al (2006, 8-10), the company’s current EA defines its core capabilities, in terms of business and IT, and limits the enterprise’s strategic initiatives However, the knowledge of current EA is a valuable asset in deciding which strategic initiatives the enterprise is capable of implementing - and which not.
Operating Model
Enterprise architecture
Enterprise architecture
Foundationfor execution
Core business processesIT infrastructure
Engagement model
Strategicinitiatives
Strategicinitiatives
Strategicinitiatives
Strategicinitiatives
Establishespriorities
Learning andexploitation
Define core capabilities Updates and evolves
Defines strategic limits
Definesintegration and standardizationrequirements
Figure 3-10 A foundation for strategy execution (Ross et al 2006, 10)
The core capabilities created by EA form the enterprise’s foundation for execution. It consists of the company’s core business processes and IT infrastructure, thus EA defines the platform on which the enterprise can execute its operations. (ibid) The following builds on this idea of viewing EA as a platform for the business.
While EA as a whole can be viewed as a platform for the enterprise operations, the different layers of EA can also be interpreted as platforms (Figure 3-11). The lower level architectures are driven by the goals, needs and requirements of the higher levels. In return, they provide the required capabilities and services for the higher levels. Thus, one can view EA as a stack of different types of platforms. At the lowest level, technology architecture provides a platform where applications or service-oriented solutions are executed. At the next levels, these solutions provide a platform to manage enterprise’s key information assets, and similarly the IT architecture as a whole creates a platform for the enterprise processes to be executed. At the highest level, the business architecture provides a platform

56
on which the enterprise mission and vision are executed to fulfil the needs of key enterprise stakeholders, such as owners, customers and personnel.
IT architecture
The enterprise mission and strategy
Business architecture
Information architecture
Application / service architecture
Technology architecture
Business goals,needs and
requirements
IT capabilitiesand services
Enterprise governance focus
IT governance focus
Figure 3-11 The focus of enterprise governance and IT governance in relation to EA
EA is a critical tool for both enterprise governance and IT governance (Figure 3-11). A mature EA describes what the enterprise currently is, specifies what it should be in the future, and describes the transition strategy, i.e. how the vision can be achieved. The focus of enterprise governance is to ensure a proper fit between the enterprise’s business architecture and its mission, vision and objectives as set by the enterprise owners. Enterprise governance makes decisions about what strategic initiatives are initiated; the target state and transition strategy defined by EA assist in selecting the right initiatives.
The focus of IT governance is to ensure alignment of business and IT architectures - at strategic and operational levels. IT governance defines the goals, needs and requirements to create the capabilities and services, and ensures that they are fulfilled (Figure 3-11). IT governance makes decisions about how IT is developed to provide the new capabilities needed by the enterprise’s strategic initiatives. Thus, EA informs IT governance of what IT investments are needed.
The idea of viewing EA as “platforms on platforms” makes it easier to understand why it is vital to adopt an enterprise architecture approach. According to Moore (1999), a key characteristic of platforms is that they enable incremental innovations and provide increasing returns as new capabilities can be built on existing ones (Moore 1999). If applications or solutions are implemented without reference to “a master plan”, it is hardly

57
possible to create an adaptive platform at any layer. Without EA, the evaluation of each individual IT investment is based on the problem at hand, not on a holistic view of the enterprise. This often leads to waste of time and resources, and to solutions that are not reusable. EA provides a sound basis for evaluating IT investments in a holistic way and enables the development of an adaptive architecture platform.
An enterprise needs to have a mature EA to create adaptive platforms – typically; it takes several years to reach such maturity. An organization should strive for high EA maturity because the value of EA increases as its scope widens as shown in Figure 3-12. (Bredemayer & Malan 2004). At the same time, EA’s role to IT governance changes and EA becomes more important. The following discusses EA’s role to IT governance (based on Bredemayer and Malan 2004, OMB 2005, GAO 2004a).
Scope
EA with onlytechnical architecture
EA with IT architecture
EA with business And IT architectures
Figure 3-12 Enterprise architecture value in relation to scope (Bredemayer & Malan 2004)
Organizations typically start adopting EA to assist in standardizing their technological platform. Later they may extend it to an enterprise-wide IT architecture, and finally to an enterprise-wide business architecture. While these new standardized architectural platforms create increasing returns, the value of EA grows exponentially. At lower EA maturity levels, EA’s role to IT governance is to ensure an architectural fit with current architecture; investments are required to comply with technological standards and fit with current IT applications and solutions. This kind of IT-driven EA benefits IT investment management processes because it leads to solutions that more consistent with the previous ones. However, to achieve more value from EA, both business and IT architectures have to be included in the scope of EA.
When all architecture domains are included in EA and have at least a high-level specification of their target state, each IT investment is often required to bring the enterprise

58
closer to its vision that is represented by EA’s target state. IT governance also becomes more business-driven when business goals, needs and requirements are more clearly defined and understood.
At the highest EA maturity levels, an enterprise has created a transition strategy and related plans to implement its target EA. At this stage, it has also learned how to use EA to transform the enterprise. EA is used to drive the enterprise’s IT governance processes, especially IT investment management. Thus, when EA matures, its role for IT governance evolves from a supporting role to the key driver of IT governance.
Enterprises have different types of strategies and operating models. Ross, Weill and Robertson (2006) define the operating model of an enterprise based on the degree of business process integration and standardization requirements (Figure 3-13). The standardization of business processes typically implies the standardization of related IT systems. The integration of business processes, in turn, requires the integration of their related data and information. Thus, the selection of an operating model highly affects the requirements and needs for development of EA.
Business Process Standardization
CoordinationCoordination UnificationUnification
DiversificationDiversification ReplicationReplication
Low
Hig
h
Low High
Figure 3-13 Different types of integration and standardization needs (Ross et al 2006)
According to Treacy and Wiersema (1997, 32), an operating model consists of the main organization structure, core processes, culture, management systems and information technology. The planner’s view in Zachman Framework contains the enterprise vision and strategy, and all key constituents of the enterprise operating model as defined by Treacy and Wiersema (1997). While the lower levels contain the IT related views of the enterprise, it can be concluded that EA effectively describes the enterprise strategy and its operating model.

59
3.4. Service-Oriented Architecture (SOA)
3.4.1 What is Service-Oriented Architecture?
Enterprise architecture (EA) is intended to assist an enterprise in creating an adaptable IT platform for its business processes to operate on. However, this objective is often difficult to achieve with traditional information systems and technologies. Service-oriented architecture (SOA) is often claimed to fulfil this objective. In a services-oriented architecture, the capabilities and processing logic are modelled and implemented as services and new applications can be implemented by dynamically reconfigurating compositions of these services. A Service-Oriented Enterprise (SOE) is a vision of an enterprise having all its capabilities and processing logic componentized as collections of interacting services (Cherbakov et al 2005, Erl 2005). Componentization enables agility and allows an enterprise to respond to the changing requirements from its business environment quickly. According to Hagel and Brown (2005), a SOE is fully capable of orchestrating resources and creating global process networks to implement the emerging pull enterprise model (see section 1.1).
The term service-oriented is commonly used by software vendors, however, it is ambiguously defined and is most often used in the context of a technical architecture. SOA is a technical architecture. More importantly, SOA is a new design paradigm for creating solutions that utilize loosely coupled services to implement the processing logic an enterprise needs. Service-orientation is a way of thinking about business activities in terms of services and often requires a change in the mindset (The Opengroup 2006, Erl 2005). Hagel and Brown (2003, 9) argue that service-oriented architecture “could be viewed as a business operating system, generating new services from pre-existing building blocks and then orchestrating these services to support changing business needs.” By using a set of different types of abstraction layers, SOA enables a full separation of a business process from its actual technical implementation. Thus, SOA enables the creation of an adaptable EA that uses a set of different types of platforms and implements capabilities as reconfigurable loosely coupled services.
The ideas behind service-oriented architecture are not new - attempts for distributed computing have been made before. The Object Management Group’s Common Object Request Broker Architecture (CORBA) defined specifications that enabled vendor-independent architecture and infrastructure for applications to work together over networks (OMG 2008). However, in the 1990s the technical infrastructure needed was difficult and expensive to implement, which probably was one of the key reasons that prevented wide adoption of such techniques.

60
Recent definitions of service-oriented architecture (Erl 2005, OASIS 2006a, Durvasula et al 2006a, The Open Group 2006, IBM 2007), especially the definitions of vendor independent organizations, emphasize SOA more as a design paradigm or an architectural style than a technical architecture. According to OASIS (2006a), people and organizations build capabilities to solve or support business-related problems; these capabilities are often intended to fulfil the needs of other persons and organizations. SOA uses services as the mechanism to bring together the needs and capabilities. Accordingly, OASIS (ibid) gives the following definition for SOA, also adopted for this study:
“Service Oriented Architecture (SOA) is a paradigm for organizing and utilizing distributed capabilities that may be under the control of different ownership domains. It provides a uniform means to offer, discover, interact with and use capabilities to produce desired effects consistent with measurable preconditions and expectations.”
The OASIS definition emphasizes SOA as a design paradigm. However, it also states that SOA is a technical architecture that has uniform, i.e. standards-based, means for utilizing the capabilities that are implemented as services.
SOA is commonly realised through Web services technology platform. According to Erl (2005, 56-57), this often leads to a misinterpretations that SOA is a synonym for Web services and that all Web service applications are service-oriented. Web services consist of a set of standards and technologies to create secure, reliable connections between two services (applications). Three international consortiums contribute to the development of most Web services standards: The World Wide Web Consortium (W3C), Web Services Interoperability Organization (WS-I) and Organization for the Advancement of Structured Information Standards (OASIS).
Implementation of SOA is typically based on open standards and specifications such as XML, SOAP, WSDL, UDDI and WS*-specifications. Thus, SOA is vendor-independent as long as the vendor supports the standard resources used (Crawford et al 2005). This allows the customers of different major vendors - IBM, Microsoft, SAP and Oracle - to interact with each other, both within and across enterprises.
3.4.2 Why do we need Service-oriented architecture?
Many organizations have a heterogeneous IT environment with applications that cannot share data and communicate with each other; application-based thinking typically results in an application-based architecture. In some cases, mergers and acquisition have lead to this, yet, it is often the result of poorly coordinated IT development projects fulfilling local

61
needs. Transforming the enterprise to a new target architecture that enables business process integration and consolidates information is costly, time-consuming and often requires the replacement of numerous applications and IT infrastructure. Sometimes this kind of transformation and consolidation is not even possible, for example because of financial or operational reasons. SOA promises a solution to this by enabling solutions that can connect processes both inside an enterprise as well as between enterprises. Often the current EA can be SOA-enabled by using service adapters; new solutions can be implemented on top of the current applications by using these services. In the case of mergers, this may make massive consolidation projects unnecessary.
Many of the driving forces of SOA are the same forces that drive enterprise architectures and IT governance. The key driving forces behind SOA adoption are (Channabasavaiah et al 2004, Ross et al 2006, Campbell and Mohun 2007, OASIS 2006a, Hagel and Brown 2003, Brown and Hagel 2003):
- Failure of IT to response to the changing business needs of the enterprise – enterprises need more adaptability, flexibility, better support for large-scale growth and shorter IT solution delivery time
- Cost and complexity of IT – cost of buying or building applications, complexity of building technology-enabling capabilities, cost of integrating everything together and maintaining it over a longer period of time
- Problems with current “Best of Breed” application silo architectures – current architectures are missing capabilities for communication and adaptivity, have redundancy and low quality of data and information, and poor support for processes that span functional boundaries
- Cost and complexity of inter-organization integration, need to create and support intra and inter-enterprise business processes – traditional architectures use hard-wired connections between intra and inter-organizational processes that are complex and expensive to implement and maintain
- Need to standardize and integrate business processes, need to have multi-channel access to business functionality and data – enterprises seek to implement enterprise-wide standardized business processes which integrate all key information used, and provide a single view of the customer independently from the channel used
- Need to standardize technology infrastructure – standardization and virtualization provide cost savings and additional flexibility
- Need to adopt new standard-based technologies – many organizations are willing to adopt new technologies such as EAI, Web and mobile interfaces for applications, but have had difficulties in doing so

62
- Need to create and support global process networks – traditional technologies do not enable dynamic global process networks and partnerships
- Business process outsourcing – organizations are willing to outsource processes that are not their core processes. However, as these processes are integrated with their core processes, outsourcing would require extensive process integration
- Need to focus on business model and business process development instead of technology –while many parts of IT have become utility, organizations need approaches that enable them to be more business-focused while creating IT solutions.
- Need for incremental approaches to improve business processes – traditional technologies are more oriented towards a “big bang” approach than incremental improvement.
According to Hagel & Brown (2003), a modern enterprise needs a strategic architecture focused on five to ten years. This long-term horizon creates a background for decision-making in an uncertain environment. In addition, a much shorter-term horizon of six to twelve months is needed to provide a foreground for operational and organizational strategic initiatives. This kind of new strategic architecture enables continuous innovation and initiatives with aggressive performance objects. The repeated incremental innovations depend on the previous ones, thus the competitors are not able to replicate them. In addition, the risks of any single initiative are reduced because of the relatively small size and short timeframe.
Hagel & Brown (ibid) argue that the biggest barrier to adopting such a new strategic architecture is the current hard-wired IT architecture. They claim that tightly coupled application-based IT architectures “paradoxically encourage executives to support ‘big bang’ approaches to IT spending.” The traditional processes of delivering new IT solutions require a “frozen process” approach – in order to design and implement the IT solution, the business process has first to be defined and fixed. The problem is, that large scale IT investments projects hardly ever deliver what they promised. In addition, tightly coupled architectures are expensive, and difficult to implement and maintain. For this reason, enterprises optimize solutions for resource usage and cost – not for flexibility. SOA promises to offer the solution by delivering the flexibility needed to enable the incremental innovations of the new strategic architecture (ibid).
3.4.3 Key concepts of Service-Oriented Architecture
Service is the basic building block of service-oriented architecture. A service can be understood as having a capability to offer and perform a specified unit of work to others. The OASIS Reference Model for Service Oriented Architecture (OASIS 2006a) defines

63
service as a “mechanism to enable access to one or more capabilities, where the access is provided using a prescribed interface and is exercised consistent with constraints and policies as specified by the service description.” Brown and Hagel (2005) define service as a “course-grained, discoverable software entity that exists as a single instance and interacts with applications and other services through a loosely coupled (often asynchronous), message-based communication model.”
In relation to another service, a service may be either a service provider – a service that provides one or more capability to other services, or a service consumer that seeks to use the capabilities provided by the service provider. The service consumer communicates with the service provider via service request and service response messages (Figure 3-14). Any particular service is often both a service provider and service consumer - it uses the capabilities of other services to provide new capabilities to other services.
serviceconsumer
serviceprovider
service request
service responseservice
consumerserviceprovider
service request
service response
Figure 3-14 The service provide and service consumer communicate via messages
Services resemble objects in object-oriented programming, the key distinction being that objects are stateful, use tightly coupled programming routines and fine-grained interfaces whereas services should be stateless, promote loose coupling and have coarse-crained interfaces. Services are autonomous, composable units of processing logic, which communicate with other services via prescribed messaging mechanism. (Erl 2005, 107-108)
According to OASIS (2006), the key concepts related to a service are:
- Visibility – service consumers must be aware of the service provider, they must be willing to interact and the service provider must be reachable to the service consumer.
- Service description – describes and specifies the nature of interaction between services. A service description consists of an information model describing the structure and semantics of the message exchange and a behavior model which consists of the action model describing the actions that may be invoked against the service and the process model that characterizes the temporal dependencies between actions on the service. A service interface is the mechanism for interacting with the service.
- Interaction – involves performing actions against the service, typically this initiated by message exchange between services.

64
- Real World Effect – by interacting with the service provider, the service consumer is typically trying to get some real world task done such as airline ticket reservation. The interaction makes changes to the shared state, the set of facts shared by services - the changes in shared state are a means to the real world effects.
- Policies and contracts – a policy is a constraint or condition related to a service, a contract is an agreement by two or more parties. Policies are applied to security, privacy, manageability, and Quality-of-Service (QoS) aspects of service. Contracts can be quality of service agreements, interface and choreography agreements and commercial agreements.
- The Execution Context – is the set of infrastructure elements, process entities, policy assertions and agreements that are identified as part of an instantiated service. The execution context is the path between the service consumer and the service provider and identifies an instance of the service from other instances.
Not all services are service-oriented, for example, making legacy applications available as services via service adapters, does not make them truly service-oriented. According to Erl (2005, 37) the key principles of SOA are:
- Loose coupling – to interact services need only be aware of each other
- Service contract – an agreement of communications is defined by one or more service descriptions and related documents
- Autonomy – services have control over the logic they encapsulate
- Abstraction – the abstraction of service logic is described in the service contract, the actual logic is hidden from the outside world
- Reusability – service logic is constructed in a way to promote service reusability
- Composability – new services can be composed by coordinating and combining other services into a service collection
- Statelessness – services minimize the information that is retained about a specific activity
- Discoverability – services are designed to be found and assessed via available discovery mechanisms.
Creation of a true service-oriented architecture requires that service-oriented thinking is applied and services are designed according to service-oriented principles and specific rules.
Service descriptions and the messaging framework are the keys to loose coupling, service abstraction and autonomy. Service descriptions are typically written in Web service description language (WSDL) (W3C 2001) - an XML format for describing network services - and contain all the information needed to use the functions provided by the

65
service. A WSDL service description consists of an abstract definition, which describes the service interface, operations and messages without any reference to the technology, and a concrete definition, which contains the information about the implemented, real service interface used to interact with the service. (Erl 2005, 131-136)
Service-oriented architecture’s messaging framework typically relies on Simple Object Access Protocol (SOAP) (W3C 2000), which is a protocol intended for message exchange in a distributed environment. While the sequences of message exchanges between services can be complex, all message exchange patterns (MEPs) can be constructed from the primitive message exchange patterns: the fire-and-forget MEP that sends a message and does not expect a response and the request-response MEP where a response is expected from the target service. The messages, like services, should be autonomous having enough intelligence to self-govern their part of the processing logic because the service has no control of what happens to the message after it has sent it. (Erl 2005, 35, 162-165).
The discovery of services is a key requirement for SOA; this can be achieved via publishing the WSDL service descriptions in private or public service repositories (Figure 3-15).
serviceconsumer
serviceprovider4. service request
5. service response
servicerepository
2. query for services available
1. publish servicedescription3. query response
(service description)
Figure 3-15 The discovery of services (based on Campbell & Mohun 2007, 162)
Standard discovery mechanisms such as UDDI (Universal Description, Discovery and Integration) are used to query the repository for the services available. When a suitable service is found by querying the service descriptions, the service consumer invokes the service provider by issuing a service request message, defined in the service description. The design and understanding of service descriptions is an essential task of SOA yet, it is not possible to specify the semantics and other information about a service completely and unambiguously. (Campbell & Mohun 2007, Erl 2005)
The basic standard mechanisms needed for service interaction in SOA are defined by several Web service specifications. WS-Coordination (OASIS 2007a), WS-AtomicTransaction (OASIS 2007b) and WS-BusinessActivity (OASIS 2007c) specifications provide a standard

66
way for services to interact in a single coordination agreement to execute a business activity. A business activity is a complex service activity, which often extends the scope of the activity to outside business partners. It often includes human actions such as approval, manufacturing or delivery. The buying process presented in Figure 3-16 is a typical business activity.
request for quotation
provide quotation
request for quotation
decline
send a purchase order
Buyerservice
Sellerservice A
Sellerservice B
or cancel
Orchestration Choreography
request for quotation
provide quotation
request for quotation
decline
send a purchase order
Buyerservice
Sellerservice A
Sellerservice B
or cancel
Orchestration Choreography
Figure 3-16 An example of a business activity (based on Cabrera et al 2004)
A buyer service acts as a coordinator for the process. It sends a request for quotation to a seller service; the seller provides either a quote or declines. As the last step of the buying process, the buyer decides whether to buy and sends a purchase order to the seller, or cancels and sends a cancel notification to the seller. (Cabrera et al 2004, Erl 2005).
A reliable messaging framework, support for describing constraints and conditions for service usage, and an appropriate level of security are essential for the implementation of business activities. These are provided by the following specifications: WS-Addressing (W3C 2004a) provides transport-neutral mechanisms to address Web services and messages; WS-ReliableMessaging (OASIS 2008) describes a protocol enabling reliable transferring of messages between nodes; and WS-Policy (W3C 2006a) defines a general-purpose model and syntax for describing the constraints or conditions – the policies - related to a service. WS-Security (OASIS 2006b), XML-Signature (W3C 2002a) and XML-

67
Encryption (W3C 2002b) together provide support for the security features needed, such as integrity, confidentiality and authentication.
The potential of service-oriented architecture lies in its ability to use different levels of abstraction and to tie them together to form an adaptive service-oriented enterprise. A service-oriented enterprise is also a model-driven enterprise (Figure 3-17) consisting of separate layers of models where only the lowest model level is platform-specific.
Strategy models
Business operation models
Platform-independent models
Platform-specific models
Figure 3-17 The model-driven enterprise (Kano et al 2005, 670)
The layers are loosely coupled, which means that the higher-level models can be easily reconfigured without modifications to the lower level models. This implies that the business process model is separate from its actual implementation and is not dependent on a specific technological platform. In SOA, the models of different levels are interconnected, which implies that changes made at higher levels are immediately executable. In this perspective, SOA is quite different from a traditional EA, where modifications at higher-level models typically require manual changes in models at lower levels of EA (see Figure 3-11). An additional benefit of being model-driven is that it is possible to make simulations and evaluations in terms of performance and cost. (Kano et al 2005, 669, Erl 2005)
Enterprise architecture consists of business architecture and IT architecture. Similarly, enterprise logic consists of two domains (Erl 2005, 280-281): business logic and application logic. Business logic is typically represented as business processes; SOA implements business process logic as service orchestrations. According to Peltz (2003), “orchestration describes how web services can interact with each other at the message level, including the business logic and execution order of the interactions.” Orchestrations are described using The Web Services Business Process Execution Language (WS-BPEL 2.0), which is a “model and grammar for describing the behavior of a business process based on interactions between the process and its partners (OASIS 2007d).” The orchestration itself is represented as a process service. A WS-BPEL process defines how the service interacts with its partners to execute a coordinated business activity, such as the buying process presented in Figure

68
3-16. WS-BPEL processes define an abstract process describing the observable behavior of the process without all details of its execution and an executable process covering all execution details. Abstract and executable processes separate the public and private processes and thus promote privacy by hiding the actual implementation details from the external partners. WS-BPEL promotes vendor independency; an orchestration defined in WS-BPEL is executable on any WS-BPEL-compliant platform. All major SOA platform vendors have been involved in the development of WS-BPEL and support it. (OASIS 2007d, OASIS 2007e, Erl 2005, 200-207)
The application logic in SOA consists of reusable, generic application services, which are solution-agnostic. In a real enterprise, application logic is often a mixture of purchased and custom-built services, and may include an interface to legacy applications with service adapters. Application services that integrate capabilities from other application services are called integration services. Technology services (utility services) provide access to functions such as event handling and monitoring, presentation service, workflow management and logging. (Erl 2005, 333-337)
Service-oriented architecture typically uses an additional layer, the service-interface layer, between business logic and application logic. It is often further divided into three separate layers: the orchestration layer, business service layer and application service layer (Figure 3-18).
business logic
applicationlogic
busi
ness
proc
ess
laye
rse
rvic
ein
terfa
cela
yer
appl
icat
ion
laye
r
orchestrationservice layer
business service layerapplicationservice layer
application A(.NET)
application B(J2EE)
application C(legacy)
Figure 3-18 Enterprise processing locig and structure of layers in SOA (Erl 2005, 337)

69
The orchestration service layer includes business process orchestrations; these use business services at the business service layer containing business logic needed. Two types of business services exist: entity-centric business services provide functions belonging to a specific business entity, such as purchase order or customer, and task-centric business services correspond to specific business tasks, such as payment processing or shipment handling. Business services interact with application services at the application services layer to implement the business logic with applications and technologies the enterprise has selected to use. The usage of separate layers for different types of services supports different levels of abstraction and promotes the principles of service-orientation. (Erl 2005, 333-347)
Orchestrations are typically created and used within organizational boundaries. However, one of the key goals of SOA is to enable inter-organizational communication, interaction and interoperability. Choreographies enable collaborations between two or more parties. According to W3C (2004b), a choreography defines “the types of information that is exchanged, for example an order sent between a buyer and a seller” and “the sequence and conditions under which the information is sent.” The rules and interactions of a choreography can be precisely described in the Web Services Choreography Description Language (WS-CDL) (W3C 2005). The observable behavior of a service is defined in its WSDL service description, a choreography describes the common collaborative observable behavior of the services participating in the choreography. Choreographies are based on an ordered set of peer-to-peer interactions where all the parties remain autonomous, that is, there is no master party controlling the message exchanges between the parties. (W3C 2006b)
The automated buying process presented in Figure 3-16 is an example of choreography: it consists of three parties each having their own orchestration, the buyer service, the seller service A and the seller service B. To create the choreography, the parties collaborate to define the rules and sequence of interactions in the purchase process and generate together a WS-CDL description representing its details. Each individual organization then independently decides on how to implement their part of the choreography.
3.4.4 Benefits of SOA
Service-oriented architecture promises many different types of benefits. The fact that SOA is both a technical architecture and a design paradigm implies that an enterprise may consider SOA as a technical architecture, or a completely new way of thinking about the enterprise in terms of services. The benefits of SOA depend on the chosen SOA adoption strategy and implementation approach. As a technical architecture, SOA provides technologies that enable easier and cheaper integration of applications and business processes. In addition, SOA allows separation of the presentation layer from the application

70
logic, which enables multi-channel access to key information. However, to fully realize the benefits of SOA, the scope of SOA adoption must include business process logic – the orchestrations of business services.
Metcalfe’s law, presented in section 1.1 can be applied to services and the value of service-oriented architecture; by connecting n services, you get n2 of potential value. The real value of services lies in the loose coupling of services; when the number of composable services increases, the potential value of SOA increases exponentially. However, this value depends largely on how a single enterprise and its potential group of interacting partners have designed and built their services. To realize the benefits of loose coupling, an enterprise must have a vision of SOA, and service-oriented principles have to be deployed accordingly at all levels of SOA.
The following is a summary of SOA benefits (Crawford et al 2005, Erl 2005, OASIS 2006a, Hagel and Brown 2003, Campbell et al 2007):
- Leveraging of existing assets – adapters enable legacy systems and other existing IT assets to participate in service-oriented architecture.
- Commoditization of infrastructure – Standards-based SOA encourages the use of technologies, such as virtualization and grid services, that promote the standardization of infrastructure making it essentially a commodity element.
- Reduced costs – Cost reductions can be achieved from a diversity of sources: consolidation of IT infrastructure, easier and cheaper integration of business processes, information and applications, reduced complexity of supporting intra and inter-organization co-operation, reduced application / solution development costs from inherent reuse of services.
- Faster time to market – SOA creates the ability to quickly build and modify business processes from adaptable high-level business services leading to faster solution implementation. Loose coupling creates agility because changes in business processes can be made dynamically - flexibility and adaptability increases with each new service.
- Risk mitigation – inherent reuse minimizes the risk of introducing new errors and potential points of failure.
- Better support for manageable growth – SOA is scalable because it makes the fewest possible assumptions about the network and minimizes any trust assumptions. Services can be dynamically distributed across the network.
- Support for incremental business process improvement – SOA achieves easier automation of business processes that are modeled as orchestrations. Orchestrations also provide increased information about process performance to support continuous process improvements.

71
- True support for process innovation – services are context-free, i.e. they can easily be deployed in a new business context. Rapid prototyping enables quick testing of new products, new business processes and even new business models. Loose coupling also supports business innovation beyond the boundaries of the enterprise; new external resources can be utilized to add value to the customer.
- Support for managing uncertainty - in traditional approach uncertainty makes the organization focus on internal operations. The flexibility brought by SOA allows the management to see uncertainty as an opportunity to create new value and explore new opportunities with business partners and customers.
- SOA creates a platform for radical incrementalism - it is easier to implement incremental changes to business practices at the local level, leading over time to radical changes in overall business practices and business structures. This supports the strategic learning loop by focusing on the near-term strategic initiatives, yet SOA provides a foundation and enough flexibility for the long-term business goals.
- SOA architecture is customer-centric – current architectures tend to be application centric; a customer-oriented architecture provides a used-configurable approach rather than one-size-fits-all prepackaged workflow.
Paradoxically, SOA enables a true fusion of business and IT, because it allows decoupling of the business domain from the IT domain. In a service-oriented enterprise, the business-IT fusion is achieved when the enterprise architect, as a business domain designer, models a business process and provides the IT solution on the fly. In a real enterprise, all capabilities needed would not yet exist; the task of IT domain is to implement the services needed. (Crawford et al 2005).
3.4.5 Transition to SOA
The transformation from a traditional enterprise to a service-oriented enterprise (SOE) has to be done in stages such as shown in Figure 3-19. (Hagel et al 2002)
At the first stage, a company has to acquire basic orchestration skills. A key basic skill is defining and adopting specific business standards to support the coordination of intra and inter-organization activities. In addition, the organization needs to understand the needs, capabilities and economics of different types of businesses, and to learn what it takes to build loose relationships with these businesses. An enterprise can acquire this basic skillset for example by orchestrating a limited set of business processes and implementing collaborations with selected partners. (ibid)

72
Degree of loose
couplingbetweenbusiness
and technologyarchitecture
Low
Stage 1Orchestration Skill-Building
Stage 2Self-Orchestration
Stage 3Process Network Orchestration
High
Low HighScope and depth of process network
Figure 3-19 Three stages of orchestration maturity (Hagel et al 2002)
At the second stage, the enterprise employs these basic skills to orchestrate all key business processes with key business partners. While the orchestrated process networks are still closed, the enterprise builds a capability of adding new service providers to the process network, and improving their performance in supporting the network. When the enterprise has reached the final stage, its traditional core business becomes obsolete as the enterprise has become a pure process network orchestrator. A pure process network orchestrator has full capabilities of mobilizing the assets and capabilities of other companies. (ibid)
A business architecture that is built on orchestrated process networks requires more than just service-oriented technology architecture; it requires a complete change in the mindset. The transformation takes a considerably longer period than what it takes to implement the services.
While SOA can be adopted as a technical architecture or as a design paradigm, different approaches for adoption are needed. Campbell and Mohun (2007, 289) present three approaches for SOA adoption: project, portfolio or enterprise level adoption of SOA (Figure 3-20). When adopting the project-by-project approach, an enterprise typically uses SOA for service-oriented integration or uses service-oriented application development tools and methods. With this approach, the enterprise does not necessarily have a long-term vision or a related SOA adoption strategy. Thus, goals are set and benefits achieved mainly at project level.

73
Enterprise Business Process Portfolio MgmtIT Porfolio Management & Consolidation
Service Model GovernanceEnterprise Master Data Management
Service-Oriented Lifecycle Management &Infrastructure Standards
Business Process Management Solutions
Service-Oriented Application Development
Service-Oriented Integration
Value & Complexity
People
Techn
ology
Method
ology
Proces
ses
Cross-organizationalconsiderations
Can be”grass roots”based Project-by-Project
Approach
PortfolioManagement
Approach
EnterpriseTransformation
Approach
Figure 3-20 Value and complexity of SOA adoption (Campbell & Mohun 2007, 289)
With the portfolio, management approach an enterprise evaluates its current IT investment portfolio and selects potential projects for SOA adoption. In addition to achieving project and portfolio level benefits from SOA, the goal is to prepare the enterprise for the adoption of SOA at enterprise-level. With this approach, business process management (BPM) solutions are the focus of SOA adoption, and enterprise-wide service-oriented lifecycle management and infrastructure standards are developed. When an enterprise decides to adopt SOA at enterprise level, it has already set a vision and long-term goal of transforming the enterprise to a service-oriented enterprise. The enterprise level approach has to consider the whole of the enterprise’s business process and IT portfolios to ensure full service reusability and to achieve full potential of consolidation. The enterprise level adoption of SOA has the potential to realize the full benefits and value of SOA. However, the complexity of adoption increases with the scope of adoption. In an enterprise level adoption, service governance issues play an important role; governance and enterprise master data management may become key challenges for the adoption. (ibid)
When an organization is making a decision about an SOA pilot project or about the focus of a wider SOA adoption, it should consider the following factors (Campbell & Mohun 2007, 293 adapted from Momentum SI Inc):
- Strategic or tactic value - an SOA pilot should address an important business problem that serves as a good SOA proof. Revenue-generating projects are better than cost-savings projects.
- Complexity and time to value – less complex projects often bring value earlier.

74
- User-facing vs. integration projects – a pilot project bringing a differentiating user experience is more visible than integration
- Internal vs. external usage – internal usage has lower risk and complexity
- Future reuse – services should provide both near-term value and long-term benefits from service reuse
- transactional vs. query-oriented services – transactional services have more complexity and higher risks
- budgeting model – SOA projects often require new IT infrastructure, the way shared IT infrastructure is budgeted may affect the selection of pilot projects
- breadth of SOA experience gained – a key objective of a pilot project is to learn on different aspects of adopting SOA, this requires balancing risk vs. long-term benefits.
The objective of pilot projects is often to initiate learning as well as to fulfil a specific business need. Selecting a problem area that provides quick benefits without high risks makes building a business case for SOA easier. Selling SOA to business executives or even to IT people may prove to be challenging. This is partly because SOA means different things to different people; for IT people SOA may appear as a new technology and development tool, while a business executive would expect it to mean adaptivity, flexibility and reduced costs. The changes needed when adopting SOA are different for different groups of people; to overcome the resistance, different methods will have to be used to address the distinct concerns of each group.
3.5. Assessment and maturity models
3.5.1 Balanced scorecard, TQM and assessment models
To be successful, organizations must continually evaluate and improve their performance against the goals and objectives they are trying to achieve. Until the 1990s, organizations mostly used financial measures to assess their performance. However, financial measures typically only tell what happened in the past. Balanced Scorecard (BSC) was developed to guide and evaluate the drivers of the future performance, the organization’s investments in customers, suppliers, employees, processes, technology and innovation (Kaplan et al 1996, 7-8). A balanced scorecard typically measures performance using four perspectives with the following generic measures:
- financial –measures return on investment (ROI) and economic value added (EVA)
- customer – measures customer satisfaction, retention and market share

75
- internal - measures internal processes such as quality, response time, cost and new product introductions
- learning and growth – measures employee satisfaction, employee and organizational competencies and capabilities, information technology adoption, and knowledge management.
A well-designed BSC is based on the organization’s strategy and measures the success of meeting the strategic objectives and the fulfillment of strategic initiatives. It enables the execution of the strategy and provides a basis for priorization and decision-making. (ibid)
Van Gremergen et al (2003) suggest building an IT BSC for measuring the value of IT; it should be built at the same time as the business BSC. The perspectives of a Strategic IT BSC could be:
- corporate contribution – ensuring effective IT governance
- customer orientation – measuring how IT meets the business expectations
- operational excellence – carrying out the roles of IT division’s mission
- future orientation – building the foundation for delivery and continuous learning and growth. (ibid)
The IT scorecard must be linked to the business scorecard to provide support for business-IT alignment, and to ensure effective IT governance. Building and using scorecards is an ongoing process; the scorecard and its measures have to be continuously evaluated to ensure dynamics and effectivity of performance measurement.
Total Quality Management (TQM) is a “customer focused management philosophy that continuously seeks to improve business processes using analytic tools and teamwork involving all employees” (EIPA 2002). The intent of TQM frameworks is to provide tools and guidance for development of distinct aspects of the organization. Several TQM frameworks exist. Some of them, like ISO 9000 series, are standards that can be used for auditing and certification purposes. If an enterprise conforms to the standard, other enterprises and customers may regard this as a guarantee of having appropriate policies and practises that typically provide quality products and services. In most cases, an external certificate may be acquired as an evidence of conformance to the standard.
Quality award frameworks - such as the EFQM, the Common Assessment Framework (CAF), the Speyer and the Malcolm Baldridge models - use self-assessments as a method of improvement. Self-assessment is a holistic approach to evaluate the organization’s policies, processes, practises, methods and improvement initiatives. In addition, these frameworks also assess the organization’s performance. They also provide a basis for benchmarking and

76
the possibility of external assessment in the form of Quality Awards such as the Finnish Quality Award and the European Quality Award.
As compared to the balanced scorecard, assessment models provide a more holistic view of the organization. Yet, an organization that uses a self-assessment framework to guide their organizational development typically also uses a BSC for performance measurement.
3.5.2 Maturity models
A maturity model is another type of framework to support organizational improvement. Capability maturity models focus on the improvement of organizational processes and “contain the essential elements of effective processes for one or more bodies of knowledge.” (SEI 2002b)
Many maturity models are based on the Capability Maturity Model for Software (SW-CMM) (Paulk et al 1993). Carnegie Mellon University’s Software Engineering Institute (SEI) developed SW-CMM between 1986 and 1993 as an initiative sponsored by the US Department of Defence. The idea of CMM is based on Crosby’s (1979) Quality Management Maturity Grid, which describes an organizations quality capabilities with five quality maturity stages: uncertainty, awakening, enlightment, wisdom and certainty An initial process maturity framework was described by Humphrey (1987), and was further developed by SEI and published in 1993.
The common structure of a Capability Maturity Model (CMM) is presented in (Figure 3-21). A CMM typically defines a set of recommended key practises for activities in a number of key process areas that enhance the process capability in the topic area. It also provides guidance on what issues to address to gain full control of the processes. With the implementation of these common features, the organization matures and creates a culture of excellence. Gradually the organization is capable of understanding and controlling the factors affecting the continuing success of processes. (Paulk et al 1993)

77
Key Practises
Maturity Levels
Key Process Areas
Common Features
contain
organized by
contain
Processcapability
Goals
Implementation orInstitutionalization
Infrastructure orActivities
describe
address
achieve
indicate
Figure 3-21 Structure of CMM (Paulk et al 1993, 15)
Many maturity models, such as SW-CMM, use the maturity levels of Humphrey’s initial maturity framework for software process. Humphrey (1988) categorizes the processes in five maturity levels: initial, repeatable, defined, managed and optimized (Figure 3-22). Humphrey states that these maturity levels were chosen because they: 1) represent the actual historical phases of evolutionary improvement reasonably well, 2) represent a measure of improvement that is reasonable to achieve from the prior level, 3) suggest interim improvement goals and progress measures, and 4) make obvious a set of immediate improvement priorities, once an organization’s status in this framework is known. (ibid)
Disciplinedprocess
Initial(1)
Repeatable(2)
Defined(3)
Managed(4)
Optimizing(5)
Standard,consistentprocess
Predictableprocess
Continouslyimprovingprocess
Figure 3-22 The five levels of process maturity (Paulk et al 1993, based on Humphrey 1988)
At the initial level, the organization’s processes are in an ad hoc state where the success or failure of processes depends on individuals, and is not known in advance. At the repeatable level, the organization has disciplined management of processes, which leads to stable but varying processes. Although the processes may vary across the organization, the success of

78
one project can be repeated because of documented procedures. The defined level has well-defined standardized processes, which have criteria and verification mechanisms for readiness. The managed level provides a basis for better process performance with measurements of process quality and productivity. Finally, the evaluation of measurements and continuous improvement of processes enable the organization to achieve the highest level of process maturity, the optimized level (Paulk et al 1993).
Capability Maturity Model Integration (CMMI) models are integrated capability maturity models developed to prevent the problems that an organization might encounter when trying to use multiple maturity models (SEI 2002b). Currently, the Software Engineering Institute of Carnegie Mellon University has defined CMMI models acquisition, systems engineering, software engineering, integrated product and process development, and supplier sourcing.
Maturity models can be used both by internal and external stakeholders of the enterprise. Internally, they are used as tools for organizational capability development: to assess the current state, to determine its strengths and weaknesses, to set goals for future state and to monitor the success of implementing the improvements. External stakeholders such as owners, partners or customers can use maturity models to assess the capability of the enterprise to evaluate how the organization meets the requirements they have set for it. In addition, organizations can use maturity models in benchmarking their capabilities to the industry. Maturity models thus provide a mutual interest for internal and external stakeholders, and a means to reach a common understanding, agreement of what the organization’s expected capability to produce its products and services is, and what areas of the processes should be improved. (Paulk et al 1993, GAO 2003a, GAO 2004a)
Independent external assessment is available for some maturity models such as SW-CMM. The evidence of high maturity level from an external assessment can be used to improve the image of the company. Image building and capability assurance probably explains why most of the India’s leading outsourcing firms, according to Hagel (2004), operate at the highest level of the SEI’s SW-CMM.
Maturity models and standard-based TQM frameworks consider and assess the policies, processes and practises of the organization. However, their focus is not to measure the actual results achieved. Thus, conformance to TQM standard or high process maturity does not guarantee high process performance, yet it usually provides better chances for it.

79
3.5.3 Assessment of IT governance
According to Simonsson and Johnson (2008), a good assessment method is essential to evaluate what kind of improvement efforts for IT governance the organization should initiate. However, they state that only a few such methods exist.
The MIT CISR research-based IT governance framework (Weill & Woodham 2002, Weill & Ross 2004a), presented in section 3.1.4, defines what decisions and by whom IT governance must make; it also describes various mechanisms and processes that organizations typically use for IT governance. However, it does not give guidance of what kind of mechanisms and processes an enterprise should use at different IT governance maturity levels. The Gartner framework for measuring IT governance (Gartner 2002) is based on Weill et al’s IT governance framework. It has three maturity stages: control, coordination, and business value of IT that are used to give an overview of how IT governance maturity is related to governance mechanisms and processes.
CobiT 4.0 (ITGI 2005) defines a generic maturity model and a separate maturity model for each of the 34 IT processes of the CobiT framework. While this approach makes the improvement of each process easier, it involves more work in the maturity assessment process. This may create barriers for adopting the CobiT approach for IT governance maturity. CobiT maturity models adopt the maturity stages of SEI’s CMM (Paulk et al 1993) – non-existent, initial, repeatable, defined, managed and optimized. Simonsson and Johnson (2008) evaluated CobiT’s goodness as an assessment framework by using concepts of measurement theory - validity, reliability and costs of assessment. They found weaknesses in CobiT, especially in CobiT’s operationalization and support for efficient data collection and analysis. To overcome these weaknesses they propose a method for model-based assessment of IT governance, the IT Organization Modelling and Assessment Tool (ITOMAT). Their method is based on CobiT and evaluates all of CobiT’s 34 processes. However, it uses different operationalization and automates the data analysis. A claimed key benefit of using their method is that the person performing the analysis part does not have to be an IT governance expert, which should result in cost savings. The fact that ITOMAT method is based on CobiT limits is general usability.
This study assesses a company’s IT governance capabilities through the expected benefits of IT governance adoption (see section 3.1.5). Thus, that part of the empirical study is an assessment method for IT governance by itself. In addition, two methods for assessment of IT governance are used: the IT governance performance index, created by Weill and Ross (2004a); and the maturity model for Information Technology Investment Management (ITIM), created by the United States General Accounting Office (GAO 2004a). The following paragraphs describe these in further detail.

80
Weill & Ross (2004a, 120-121, 239-240) designed an instrument to assess an organization’s IT governance performance. According to Weill & Ross, IT governance can be assessed by “evaluating the effectiveness of IT governance in delivering four objectives by their importance to the enterprise:
1. Cost-effective use of IT 2. Effective use of IT for asset utilization 3. Effective use of IT for growth 4. Effective use of IT for business flexibility.” (ibid, 121) To calculate IT governance performance index, we evaluate the importance of the four IT governance objectives to the company (on a scale from 1 = not important to 5 = very important) and what is the influence of IT governance to successfully deliver them (on a scale from 1 = not successful to 5 = very successful). IT governance performance is calculated as IT governance performance =
The formula implies that the maximum score for IT governance performance is 100 and the minimum score is 20. (ibid, 240)
ITIM is intended to be used in analyzing and improving the organization’s IT investment management processes. It can also be used for external assessments of how maturely an organization manages its IT investments. Like CobiT’s maturity model, ITIM is based on SEI’s CMM. Its maturity levels are called maturity stages, and they are named in a manner that describes the maturity of the investment processes as shown in Figure 3-23. Each maturity stage describes the organization’s capabilities to make efficient and effective investments in information technology.
ITIM defines a set of critical processes, such as the creation of investment criteria and the creation of an investment portfolio, for each maturity stage (Figure 3-23). Each critical process has a set of key practises that must be performed to implement the critical process. The implementation of key practises requires organizational commitments in the form of policies and senior management sponsorship, and the fulfilment or several prerequisites such as allocation of resources, establishment of organizational structures and sufficient training.

81
- IT spending without disciplined investment processes
- Instituting the investment board- Meeting business needs- Selecting an investment- Providing investment oversight- Capturing investment information
Stage 1: Creating investment awareness
Stage 2: Building the investmentfoundation
- Defining the portfolio criteria- Creating the portfolio- Evaluating the portfolio- Conducting postimplementation reviews
Stage 3: Developing a completeinvestment portfolio
- Improving the portfolio’s performance- Managing the succession of information systems
Stage 4: Improving the investment portfolio
- Improving the portfolio’s performance- Managing the succession of information systems
Stage 5: Leveraging IT forstrategic outcomes
Figure 3-23 ITIM maturity stages and critical processes (GAO 2004a, 11)
The following describes an organization at ITIM stage 5 – Leveraging IT for strategic outcomes.
An organization at the highest ITIM level can continuously select investment projects that create most value for the organization, control their successful implementation and evaluate both the value promised and the value delivered by the actual investment process. The selection of investments is based on business needs; investments are assessed according to an appropriate investment criterion that evaluates the cost, benefit and risk attached. The selection of investments is also based on the evaluation of the complete IT investment portfolio to ensure that right prioritizations are made. The organization has high conversion effectiveness (Weill 1992, Lucas 1999) meaning that it can effectively convert an investment to valuable IT services by using efficient IT investment oversight processes. An organization at the highest ITIM maturity stage can manage the succession of information systems i.e. information systems lifecycle to optimize support costs against the value generated. It also constantly optimizes its investment processes and is able to use IT to drive strategic business change (GAO 2004a).
While ITIM addresses many of the critical IT governance issues defined by Weill & Ross, the focus of ITIM is on IT investment management. Investments determine the long-term value of IT; yet, ITIM alone is not sufficient to assess the maturity of IT governance as a whole.
No IT governance framework has gained a de facto status; similarly, no IT governance maturity model has done so. While many consulting companies have an IT governance

82
framework of their own, they may also have defined an IT governance maturity model as the basis of their IT governance consulting efforts (e.g. Symons et al 2005). None of the IT governance maturity models may be appropriate as such for a company searching for a tool to assist in improving its IT governance. However, a company may benefit from being acquainted with more than one of them, and then select one or create the company’s own maturity model based on a combination of these. If the purpose is to benchmark the organization to industry average, an overall maturity benchmark can be made with CobiT; the IT Governance Institute (ITGI 2008, 23) reports public data about the overall IT governance maturity of different industries.
3.5.4 Enterprise architecture maturity
One of the key purposes of enterprise architecture is to provide a tool for transforming and changing the enterprise. While EA matures, changes must occur at each maturity level in each EA domain - business, information, application and technology. According to Debevoise (2007), a maturity framework would ideally indicate what changes are necessary, what new or changed practises are needed and how they should be implemented. However, as each enterprise is unique, EA maturity frameworks - like other types of maturity frameworks - only give guidelines of what kind of processes, practises and artefacts should exist, not how to implement them.
Several frameworks for assessing enterprise architecture maturity exist. Commonly known public EA maturity frameworks are: NASCIO Enterprise Architecture Maturity Model (NASCIO EAMM) developed by the National Association of State Chief Information Officers (NASCIO 2003), A Framework for Assessing and Improving Enterprise Architecture Management (EAMMF) developed by the United States General Accounting Office (GAO 2003a), IT Architecture Capability Maturity Model (IACMM) developed by the United States Department of Commerce (DOC 2003), OMB Enterprise Architecture Assessment Framework developed by the United States Office of Management and Budget (OMB 2005), and Extended Enterprise Architecture Maturity Model (E2AMM) developed by the Institute For Enterprise Architecture Developments (IFEAD 2006).
Most of these EA maturity frameworks are based on the SEI’s CMM framework. However, the level of detail in their specifications varies. The most comprehensive frameworks are the EAMMF and the OMB EA Assessment Framework; they are widely used in the United States federal agencies.
The earlier frameworks, such as NASCIO EAMM, EAMMF and IACMM focus on the maturity of EA program - the development of EA - rather than the outcomes of enterprise architecture efforts. An example of these is the Enterprise Architecture Management

83
Maturity Framework, (EAMMF). It is based on SEI’s CMM, however, it is not a process based model. EAMMF consists of five maturity stages, associated critical success attributes for management processes and core elements that an enterprise must implement to achieve a high EA management maturity (Figure 3-24). The United States General Accounting Office has developed both ITIM and EAMMF. The frameworks are intended to be used together, thus, it is natural that they resemble each other.
Critical success attributes Stage 1: Creating EA Awareness
Demonstrates Commitment core elements (2) core elements (1) core elements (1) core elements (1)
Provides Capability to Meet Commitment
core elements (3) core elements (1) core elements (1) core elements (2)
Demonstrates Satisfaction of Commitment
core elements (3) core elements (3) core elements (5) core elements (3)
Verifies Satisfaction of Commitment
core elements (1) core elements (1) core elements (1) core elements (2)
Stage 5: Leveraging the EA to Manage Change
Stage 2: Building the EA Management Foundation
Stage 3: Developing the EA
Stage 4: Completing the EA
Figure 3-24 EAMMF matrix with five maturity stages (GAO 2003, 7)
The five maturity stages of EAMMF are described as follows: At stage 1, Creating EA Awareness, the organization may have some unorganized EA activities initiated. At stage 2, Building the EA Management Foundation, an enterprise creates structures, roles and responsibilities for EA governance and allocates resources for EA implementation and development. At stage 4, Developing the EA, the enterprise focuses on using EA tools to produce EA products that describe current (“as-is”) and future (“to-be”) states and a transition plan on how to transform from current state to the future state. Stage 4, Completing the EA, is reached when completed EA products describe the enterprise’s current and future states in terms of business, information, service or application, and technology. In addition, a sequencing plan on how to perform the transition is approved. At the highest stage, Leveraging the EA to Manage Change, EA is used to select investments that are strategically linked and ensure maximum system interoperability. At this stage, all IT investment must comply with architecture unless they are granted an exception, the benefits of EA are measured and the EA management process is continuously improved.
The OMB EA Assessment Framework version 2 has six maturity levels described in Figure 3-25. The OMB EAAF defines a set of practises associated with each maturity level. These practises were compiled from different EA frameworks, EA framework guides, and previous maturity frameworks. The purpose of the framework is to help organization to assess the capability of its EA program to guide and inform how IT investments support organization’s strategic objectives. A better understanding of the current state of an EA helps to improve

84
organization’s EA efforts and assists in creating a better integration of EA with IT decision-making. (OMB 2005)
5
4
3
2
1
0 Undefined: No evidence presented
Initial: Informal and ad-hoc EA processes. Practices and artefacts exist but may be incomplete and inconsistent
Managed: EA processes are planned and managed, andartefacts are complete at least at a high level of definition
Utilized: EA processes and products are documented, understood, and are being used in at least in some decision-making
Results-Oriented: EA processes are measured for effectiveness against a set of established performancecriteria
Optimized: EA processes continously drive business improvement. Demonstrable improvements in efficiency, costsavings and service quality.
Figure 3-25 The six maturity stages of OMB EA Assessment Framework (OMB2005)
The OMB EAAF consists of three capability areas: completion, use and results. The completion capability area assesses the maturity of the organization’s EA and EA products. The use capability area focuses on how EA is governed, managed, used and integrated in IT investment management. The results capability area evaluates how and what results EA achieves: how business-driven EA is, how collaboration and reuse is being demonstrated, and to what level business processes and services and IT implementation are being improved. The assessment of a company’s EA maturity in the empirical part of the study is based on the completion and results maturity areas of the OMB EAAF. The descriptions for these maturity stages are presented in section 5.1.3 along with the results of the study.
As compared to the EAMMF, the OMB EAAF is more focused on the outcomes of adopting EA. This indicates that the focus of EA maturity frameworks is evolving from assessing EA development efforts to the assessment of the organization’s capability to use EA efficiently and effectively. It is also an indication of EA becoming more widely accepted and mature as an approach.
Each EA maturity framework addresses the same topics, but from a slightly different viewpoint and focus. Because of this, some organizations have combined features from several EA maturity frameworks and created an EA maturity framework of their own. However, for most users of an EA maturity framework convergence to one widely accepted

85
framework would be desirable. This would enable easier benchmarking, and if necessary, allow independent external auditing of EA maturity.
The previously described EA maturity frameworks assess the adoption of EA approach. However, the maturity of the actual enterprise architecture can also be assessed. According to Ross, Weill and Robertson (2006, 71) companies move through enterprise architecture stages as they learn how to apply IT and business processes to fulfil their strategic outcomes (Figure 3-26). The actual enterprise architecture may evolve unconsciously and companies may be unaware of what their current EA stage is. In addition, the actual EA evolves constantly independent of whether the company has adopted EA or not. Yet, the adoption of EA increases awareness of the company’s current EA stage and the possibility of consciously trying to achieve higher EA stages.
The first EA stage is business silo architecture characterised by local applications and their supporting IT infrastructure. At this stage, the main objective is local optimization i.e. to maximize the benefits achieved from supporting individual business unit or function needs. When companies try to achieve more efficient IT use, they enter the next stage, standardized technology architecture. At this stage, they standardize technology and increase centralization of technology management.
The third stage, optimized core architecture, focuses on a companywide standardization of business processes and the integration of related data. The objective is to achieve operational excellence in both business and related IT use. Often, standardization, centralization and global processes limit agility and flexibility. To overcome this, companies try to move to the fourth stage, business modularity architecture, and create loosely coupled IT-enabled application and business process components to enable strategic business agility and better integration of business and IT (Ross et al 2006, 71-79).
In addition to the four stages presented in (Figure 3-26), Ross, Weill and Robertson (2006, 184-186) have added a fifth stage, dynamic venturing. In this stage, companies are creating self-contained business process components that provide a capability for a seamless merging of their partner’s systems to their own systems using standardized interfaces. The objective of this stage is to enable dynamic organic reconfiguration to create ROI with dynamic venturing.

86
Value received from IT
Architecture Maturity
BusinessSilos
StandardizedTechnology
OptimizedCore
BusinessModularity
11% 14% 17% 18%
35%40% 35% 33%
18%21% 32% 34%
36%25% 16% 15%
Local/Functionaloptimization
IT Efficiency
OperationalEfficiency
StrategicAgility
LocalApplications
EnterpriseSystems
SharedInfrastructure
SharedData
% of FirmsIT Budget
12%100%
48%85%
35%75%
6%120%
% o
f IT
inve
stm
ents
100%
Figure 3-26 The four stages of enterprise architecture maturity (Ross 2006)
When compared to the stages of orchestration maturity presented in Figure 3-19 (Hagel et al 2002), the fourth stage, business modularity, is a description of a company at self-orchestration stage; and the fifth stage, dynamic venturing, describes a process-network orchestrator. Thus, the fourth stage implies that an organization has adopted service-oriented architecture and is currently orchestrating its business processes with SOA. At the highest stage, an organization is actively attempting to transform itself to a service-oriented enterprise that is dynamically mobilizing resources by creating process choreographies, which connect its business process orchestrations to those of its partners.
3.6. Diffusion of innovations
3.6.1 What is innovation?
According to Rogers (2003, 12) an innovation is “an idea, practice, or object that is perceived as new by an individual or other unit of adoption”; this definition is adopted for the purposes of this study. Rogers’ definition implies that the innovation needs not to be new in absolute terms, as long as it is new to the unit that considers its adoption. Innovation is also often defined as a process, as for example in DTI’s practical definition “the successful exploitation of new ideas” (DTI 2003, 8).

87
Tether (2003) argues that there are three different conceptualisations of innovation, which people often have in mind, but frequently confuse:
- the innovation as achievement – either a significant leap forward in the technological frontier leading to new technologies, or re-conceptualizing existing problems and restructuring technological systems associated with creative uses of existing technologies
- the innovation as consequences of achievement – the extent to which an innovation is valued or comes to have an impact on a social system that adopts it. The consequences may be intended or unintended, positive or negative.
- the innovation as dynamic capabilities – innovative firms have the strategic and organizational skills required to learn and adapt; they have dynamic capabilities.
According to Teece et al (1997), dynamic capabilities are “the firm’s ability to integrate, build, and reconfigure internal and external competences to address rapidly changing environments.” It is important to distinguish between these three different conceptualisations of innovation. For example, Microsoft’s MS-DOS and Windows operating systems are not considered as great innovations in perspective of technological achievement; however, they provided a standard platform that was adopted by most PC manufacturers. Consequently, their wide adoption created new opportunities for the whole of software industry and provided a great variety of programs for the user of these operating systems.
Tidd et al (2005, 10) classify four types of innovations:
- product innovation – changes in products/services
- process innovation – changes in the way products/services are created and delivered.
- position innovation – changes in the context in which the products/services are introduced
- paradigm innovation – changes in the underlying mental models which frame what the organization does.
IT governance and enterprise architecture are process innovations, they change the way a company’s business and IT services are created and delivered. However, service-oriented architecture is, to some extent, all of these types:
1. SOA is a paradigm innovation – it changes the mental models of how an organization should think about business processes and the supporting technology as services
2. SOA is a process innovation – by enabling the interconnections between the enterprise’s business processes, and between the business processes across the

88
enterprises, it changes the way the enterprise’s products/services are produced and delivered. In addition, SOA changes the ways the enterprise’s IT services are designed and delivered by enabling a fusion of business and IT.
3. SOA is a product innovation – it introduces new technology platforms and related products to implement the services
4. SOA is also a position innovation – the concept of service is now positioned in a new context of technology architecture.
Literature also classifies innovations as radical (also called disruptive or discontinuous) or incremental innovations. An incremental innovation introduces changes to an existing innovation, whereas a radical innovation provides fundamental changes to existing innovations or completely replaces the existing one. Rogers (2003, 526) defines radical innovation as “such a major change that represents a new paradigm for carrying out a task.” Both radical and incremental innovations can be achieved either by introducing a new technology or by using a new combination of existing technologies. An innovation that completely replaces an existing one may be highly disruptive to the social system that adopts it because its adoption may require a completely new skillset and new ways of thinking. It is also important to note, that a possible rejection of a disruptive innovation may be fatal to the social system.
Most innovations are incremental. Tidd et al (2005, 14) emphasize the importance of incremental innovations created by incremental improvements; a chain of continuous incremental improvements creates increasing returns and results over time in much greater benefits than the occasional radical innovations do.
A technological system can be hierarchically decomposed into sub-systems, components and sub-components (Figure 3-27).

89
System Sub-system Component Sub-component
Radical innovation
Figure 3-27 Conceptualizing a technological system (Tether 2003, 15)
An innovation can be considered radical at all these levels. For example, if the innovation totally replaces a component, it is a radical innovation at the component level. A radical innovation at the lower levels is less disruptive at the system level and the replacement of a component with an innovation may be an incremental innovation at the system level (Tether 2003, 14-16).
SOA extends the enterprise’s technology architecture by creating a system of systems by interconnecting existing IT systems. This new concept is comprised of new levels of abstraction – the various service layers and services implemented at each layer. At the component level, one may consider service-oriented architecture incremental or radical depending on how the services are implemented. At system level, SOA is initially incremental, because services, the components of SOA, are added incrementally.
An enterprise evolves towards a service-oriented enterprise by incrementally implementing services; this evolution is analogous to the evolution of computer networks. Computer networks were first adopted in the context of a single organization. Later, these private networks were connected together forming larger networks and now practically every computer is connected to a global network – the internet. The evolution has had an immense effect on the value generated by networks; according to Metcalfe’s law, the value grows exponentially. Likewise, the value of services is dependant on the amount of reusable services: each time a new service is added, the way new compositions of services and loosely coupled connections between these compositions can be created grows exponentially. Thus, the incremental innovations created by adding new services or creating orchestrations and choreographies from existing services gradually becomes radical at the

90
system level as each new service exponentially increases the capabilities of the system as a whole.
According to Tidd et al (2005, 66-67), innovation should be a core business process within a modern organization. Tidd et al emphasize the learning aspect and describe the innovation process as a process of seeking, selecting, implementing and learning (Figure 3-28).
SearchingScanning the environment for, and processing relevant signalsabout threats, and opportunitiesfor change
SelectingDeciding (on the basis of the enterprise strategy) how to respondto these signals
ImplementingTranslating the potential in the trigger idea into something new and launching it in an internal orexternal market
Learning
Learning from the implementations: building the knowledge base and improving the process.
Figure 3-28 Innovation process (based on Tidd et al 2005, 66-67)
The implementation of the trigger idea requires acquiring information to enable the innovation, executing the implementation project under conditions of uncertainty, launching the innovation and managing the initial adoption, and sustaining adoption and use in long-term. A central part of the innovation process is learning in all its phases. An organization has an opportunity to learn from each implementation. Unfortunately, not every organization takes this opportunity. (ibid)
The previous indicates, that the innovation process is, to a high degree, a process of learning by doing. Learning by doing usually involves experimenting with new ideas or approaches with the emphasis on results and action. When the actions taken are successful at once, single-loop learning takes place. However, if the approach fails, the governing variables that affect the outcome should be examined to find out a better way to produce the desired outcome. When the modified actions succeed, a double-loop learning takes place. (Argyris 1991)
The organizational capabilities that are acquired by learning from continuous implementation of innovations are hard to imitate. A single-loop process can be repeated

91
and the capabilities built by it imitated whereas the double-loop learning process is path-dependant and may provide strategic competitive advantages.
According to Argyris (ibid), highly skilled professionals, such as IT professionals, are often very good in single-loop learning, but because they seldom fail, they are poor in double-loop learning. When they fail, they typically become defensive and put the blame on others; they stop learning when they need it most. The reason for failures is often that they unintentionally design and implement actions they do not intend; their espoused and actual theories of action are inconsistent. Argyris (ibid) states that the key to learning is to start analyzing these inconsistencies and make corrections to theories-in-use.
Learning in the organizational context requires both individual and organizational learning skills, and joint contribution to understanding of complex problems. According to (Teece et al 1997), much of the organizational knowledge generated by learning resides in new routines and new logic of the organization. Although some of these routines may exist at the individual level, most of them affect the behaviors at group or even at the organizational level. Processes, mechanisms and structures for IT governance and EA are examples of organizational routines which reflect the outcomes from the organizational learning in these areas.
3.6.2 What is diffusion?
According to Rogers (2003), diffusion theories originate from the studies of farmers’ purchase patterns of hybrid seeds in the 1940s. Rogers later formalized these studies; the first edition of Diffusion of Innovations was published in 1962. Rogers’ theory is a widely applied and referenced model that is used to explain or predict the rate and pattern of adoption. This section relies heavily on Rogers’ Theory of Diffusion of Innovations.
Rogers defines diffusion as “the process by which an innovation is communicated through certain channels over time among the members of a social system.” In this context, Rogers defines communication as a “process in which participants create and share information with one another in order to reach a mutual understanding.” First, a rather small group of early adopters adopts innovation (Figure 3-29).

92
Time
100%
Lateradopters
Take-OffEarlier adopters
Innovation I
Innovation II
Time
100%
Lateradopters
Take-OffEarlier adopters
Innovation I
Innovation II
Figure 3-29 The Diffusion Process (Rogers 2003, 11)
When the critical mass of adopters is reached, the innovation “takes off” and the rate of adoption increases. When a high percentage of potential adopters have adopted the innovation, the adoption rate decreases – the “market becomes saturated.”
The diffusion of an innovation consist of four elements: 1) The innovation, which is not required to be objectively new, however, it must be new to the unit of adoption; 2) Communication channels, the means by which the knowledge about the innovation is communicated to the adopter; 3) Time, either the time taken by the innovation-decision process, the relative earliness or lateness of the adoption as compared with the other members of the system or the rate of the adoption; and 4) Social system, a “set of interrelated units that are engaged in joint problem-solving to accomplish a common goal consisting of individuals, informal groups, organizations and/or subsystems. (Rogers 2003, 23)”
Most social systems have opinion leaders whose opinions affect the adoption of an innovation. Change agents try to affect opinion leaders to promote the adoption, or in some cases to reject the innovation. According to Rogers (ibid, 6), “diffusion is a kind of social change”, the diffusion process requires and has consequences on the social system. In addition to the attitudes and actions of change agents and opinion leaders, the norms, social and communication structures of the social system affect the innovation-decision and the rate of adoption.
The innovation-decision process (Figure 3-30) is “the process through which an individual (or other decision-making unit) passes from first knowledge of an innovation, to forming an

93
attitude toward the innovation, to a decision to adopt or reject, to implementation of the new idea, and to confirmation of this decision” (ibid, 170)
Knowledge Persuasion Decision Implementation Confirmation
Prior conditions:1. Previous practise2. Felt needs/problems3. Innovativeness4. Norms of the social
system
Characteristics of the decision-making unit:
1. Socioeconomicchracteristics
2. Personality variables3. Communication behavior
Perceived characteristicsof the innnovation:
1. Relative advantage2. Compatibility3. Complexity4. Trialibility5. Observability
Communication channels
Adoption
Rejection
Continued AdoptionLater Adoption
RejectionContinued Rejection
Figure 3-30 The innovation-decision process (Rogers 2003, 170)
Rogers’ innovation-decision model has five stages: 1) Knowledge, building awareness and learning what the innovation is, how it works and why it works; 2) Persuasion, creating an attitude toward the innovation, favourable or unfavourable; 3) Decision, engaging in activities that lead to a decision to adopt or reject the innovation; 4) Implementation, taking the actions to put the innovation in use; and 5) Confirmation, making a final commitment to the innovation or reversing the previous decision and rejecting the innovation.
The knowledge state may be active or passive, depending on whether the information about the information is actively searched or not. After considering the cost and benefits of a potential adoption, a decision to adopt or reject the innovation is made. The adoption of the innovation is always an active decision whereas a passive rejection takes place if the persuasion stage is not even entered. In the implementation stage, the innovation is tested, pilot implementation projects are conducted, and evaluated before the wide adoption is finally confirmed or the innovation is rejected.
According to Rogers, three main factors affect the adoption: prior conditions, the characteristics of the decision-making unit and the perceived characteristics of the innovation. The fact that prior conditions affect the adoption is intuitive, history matters; where the organization can go depends on its previous path and the possible paths ahead. According to Teece et al (1997), the adoption of an innovation is influenced by the factors describing the organization’s prior conditions and previous practise such as:
- prior utilization of technological assets
- prior utilization of complementary assets, that is, related assets required for the adoption
- financial assets define the organization’s capability to invest in innovations

94
- reputation assets are a kind of summary about the firm current assets and position, and its likely future behavior
- structural assets define the formal and informal structure of the organization and their external linkages
- market assets define the organization’s market position and the required rate of change
- organizational boundaries i.e. the degree of integration (vertical, lateral and horizontal)
The adoption process continues to the persuasion phase only if there is a need or relevancy for the innovation. According to Rogers need is a “state of dissatisfaction or frustration that occurs when individual’s desires outweighs individual’s actualities.”(Rogers 2003, 172). There is no clear answer to the question “which comes first, needs or awareness of an innovation?” For many innovations, such as medical innovations, there is a clear need. However, the awareness of a new innovation and learning about its characteristics can create the need, as in the case of a mobile phone – many people initially did not think they need one, but after learning more about it, found it convenient and decided to acquire one.
According to Rogers (2003, 22), innovativeness is “the degree to which an individual or other unit of adoption is relatively earlier in adopting new ideas that the other members of a system”. Schwabsky et al (2004) state that innovativeness “refers to the organization's openness to new ideas, as well as to its capacity to innovate, to implement and to adopt the new idea, process or product successfully.” Innovativeness and learning are interrelated – while the organization learns, it increases its innovative capacity, also, the greater its innovative capacity, the better ability it has for learning (ibid). Hurley and Hult (1998) point out that “organizations whose cultures emphasize innovation when resources are available tend to implement more innovations and develop competitive advantage”
Rogers (2003, 282-285) categorizes adopters into five categories based on innovativeness: innovators, early adopters, early majority, late majority and laggards (Figure 3-31). In the context of technology product adoption these categories can be described as follows (Moore 2006, 11-12): innovators like technology for its own sake; early adopters are not technologists, but rely on their instincts and vision of how the adoption of an emerging technology could provide potential benefits to them; the early majority is driven by a strong sense of practicality and wants to see well-established references before investing substantially; the late majority shares the concerns of the early majority. However, it consists of people who are not comfortable with their ability to handle a technology product. This makes them reluctant to buy high-technology products; and laggards do not want to be involved with new technology. The only time they ever buy a technology product is when it is hidden inside the product.

95
Innovators(2,5%)
EarlyAdopters(13,5%)
EarlyMajority
(34%)
LateMajority
(34%)
Laggars16%
Time
Number ofadoptions
Figure 3-31 Revised technology adoption life cycle (Moore 2006, 16)
The diffusion of an innovation is usually normally distributed as indicated by the S-shape curve in Figure 3-29 presenting how the number of adoptions is distributed against time. Moore (2006, 15-18) states that, for high technology products, there are crosses in the chasm (Figure 3-31). According to Moore, the first gap is between the early adopters and the early majority. Another important gap is between the early majority and late majority. For every product, there is a window of opportunity, if the momentum is lost, the diffusion may cease and another emerging product will take the markets.
The early adopters like to take chances to benefit from the potential of innovation, and are thus willing to tolerate the probable immaturity of innovation. However, the early majority likes to evaluate and buy whole products (Moore 2006, 107). A whole product consists of the product itself and of additional services, support, knowledge and ancillary products that are needed to adopt it. The late majority is not willing to become technologically competent; even a whole product is not enough for them. To increase the diffusion among the late majority the innovation has to be made increasingly easy to adopt.
According to Tether (2003), adoption requires learning and adaptation of behaviors. The ability to adapt behaviors depends on norms of the social system. Norms are “the established behavior patterns for the members of a social system” (Rogers 2003, 26). Norms often provide resistance and create barriers for the adoption. Adoption requires not only learning new ways of thinking and doing; often learning away from the old habits of doing things is even more difficult. According to Rogers (2003, 419) recent studies of adoption of information technology such as PCs and email show that even when the advantages of adoption are obvious, the diffusion is not as rapid and relatively effortless as could be thought. As Pfeffer and Sutton (1999, 25) state, "there is only a loose and imperfect relationship between knowing what to do and the ability to act on that knowledge.”

96
The characteristics of the decision-making unit that affect the innovation-decision are its socioeconomic characteristics, personality variables and communication behavior. Table 3-2 presents the characteristics of earlier adopters as compared to later adopters.
Table 3-2 The characteristics of earlier adopters, based on Rogers (2003, 233, 240, 257, 288-291)
• have more social participation• are more highly interconnected• are more cosmopolite• have more contact with change agents• have greater exposure to mass media• have greater exposure to interpersonal communication channels• seek information about innovations more actively• have greater knowledge of innovations• have a higher degree of opinion leadership
• have greater empathy• may be less dogmatic (the degree to which an individual has a relatively closed belief system)• have a greater ability to deal with abstractions• have greater rationality and more intelligence• have a more favorable attitude toward change• are better able to cope with uncertainty and risk• have more favourable attitude toward science• are less fatalistic• have higher aspirations for education, status and occupation
• have more years of formal education• have higher social status • have larger-sized units
Communication behaviourPersonality variablesSocioeconomic characteristics
According to Rogers, the following five characteristics of an innovation affect to its adoption: 1) The relative advantage, the ratio of the expected benefits and the cost of adoption. The innovation must provide some advantages over the currently used innovations; 2) Compatibility, the degree to which an innovation is perceived as consistent with the existing values, past experiences, and needs of potential adopters. Typically, the innovation should be compatible with experiences. However, in the case of radical innovations, low compatibility may increase the rate of adoption; 3) Complexity, the degree to which an innovation is perceived as relatively difficult to understand and use. Typically, ideas that are simpler to understand and require no special skills are adopted more quickly; 4) Trialability, the degree to which an innovation may be experimented with on a limited basis. The trial of the innovation reduces the uncertainty related to its adoption, in addition, the innovation can be adopted with “learning by doing” approach; and 5) Observability, the degree to which the results of an innovation are visible to users and other stakeholders - if the benefits of the adoption are clearly visible, the likelihood of its adoption is increased.
The decision of either adopting or rejecting the innovation may have:
- Desirable versus undesirable consequences
- Direct versus indirect consequences
- Anticipated versus unanticipated consequences.

97
Change agents often promote an innovation with the expected benefits of its adoption. However, the desirable consequences may not be achieved. Sometimes the consequences are indirect and may occur only after a considerable period. Thus, it may be difficult to anticipate or verify that they are related with the adoption of a particular innovation. In the real world nothing is perfect; the adoption of an innovation may have undesirable consequences that may be even more significant to the social system than the desirable consequences for the sake of which the decision to adopt the innovation was made.
3.6.3 Diffusion of information systems and information technology
According to Rogers (2003, xviii), diffusion research is extremely popular: “no other field of behavior science research represents more effort by scholars in more disciplines in more nations.” However, the diffusion research of information systems (IS) and information technology (IT) seems to be different. McMaster (2000) found indications of surprisingly little common knowledge by studying references of published papers; the most common citations were references to Rogers’s diffusion of innovations theory. McMaster claims, “there are certainly no strong indications of a tradition.”
Fichman (1992) conducted a critical review of 18 published adoption studies identifying how well Rogers’s classical diffusion theory could be applied in IS and IT studies. The classical diffusion theory was developed to study voluntary adoption of innovations that are used independently from each other. IT decisions in organizations are typically made by the management, which may encourage or even mandate the use of IT. In addition, the decision to adopt may depend on external factors such as industry-wide level of adoption. Thus, in IS and IT research it is not appropriate to apply classical diffusion theory as such. (ibid)

98
Fichman (1992) presents a framework to guide research in IT diffusion, the IT Diffusion Framework (Figure 3-32). He uses a broad definition of information technology and defines IT as “any system, product or process whose underlying technology base is composed of computer or communications software or hardware.”
OrganizationIndividual
Type 2
High knowledge burden orhigh user interdependencies
Class of Technology
Type 2
High knowledge burden orhigh user interdependencies
Type 1
Low knowledge burden, low user interdependencies
• Classical diffusion variables • Managerial influences• Critical mass• Absorptive capacity• Implementation characteristics• Institutions for loweringknowledge barriers
• Classical diffusion variables • Perceived innovationcharacteristics• Adopter characteristics• Information sources and communication channels• Change agents and opinion leaders
• Managerial influences
• Classical diffusion variables• Organizational characteristics• Organizational decision processes• Stage of implementation• Competitive effects (adopter industry)• Supply side factors• Economic factors (price)• IT group characteristics
• Cell 2 and 3 variables
1• Classical diffusion variables
• Perceived innovationcharacteristics• Adopter characteristics• Information sources and communication channels• Change agents and opinion leaders
• Managerial influences
1
3 4
2
Figure 3-32 IT Diffusion Framework (Fichman 1992)
The IT Diffusion Framework maps two broad classes of technology against the locus of adoption. The locus of adoption refers to the context examined - individual or organizational. Individual adopter studies typically have adoption or rejection, time of adoption and frequency of use as dependant variables. Organizational studies typically research adoption at large aggregates such as companies, business units or departments. Typical dependant variables are adoption or rejection and the stage of implementation. The other dimension in Fichman’s framework is the class of technology. The adoption of type one technologies (e.g. PCs, laptops, spreadsheets) are independent from other users adoptions and do not require a substantial knowledge from the adopters where as type two technologies (e.g. structured system analysis, relational databases, email) are characterized by high knowledge barriers or significant user interdependencies or both. SOA is a type two technology having a high knowledge burden and is usually adopted in organizational context.

99
According to Fichman (1992), the classical diffusion variables fit studies of individual adoptions of type one technology; in some cases, it may be necessary to consider managerial influences. In the organizational context, new variables describing factors such as organizational characteristics, organizational decision processes, industry specific competitive effects and economic factors are needed. The adoption of type 2 technologies requires introduction of variables such as critical mass, absorptive capacity (innovative capability), implementation characteristics and extent of access to institutions for lowering knowledge barriers.
The study of user acceptance is another popular type of diffusion research for IS and IT. Acceptance is defined as “the demonstrable willingness within a user group to employ information technology for the tasks it is designed to support” (Dillon et al 1996). The purpose of the acceptance theory is to model and predict the process of user acceptance of any information technology for intended purposes. Venkatesh et al (2003) compared eight theoretical models which have been used to study the adoption of IS and IT. The results from the comparison were used as a basis in formulating a Unified Theory of Acceptance and Use of Technology (UTAUT). Acceptance models, such as the UTAUT, are intended to be used in studies of IS and IT adoption by individuals, thus they are not appropriate for studying the adoption of service-oriented architecture in the organizational context. Instead, Fichman’s IT Diffusion Framework or a similar framework should be used.
Jeyaraj et al (2006) conducted a literature review of 48 empirical studies on individual and 51 studies on organizational IT adoption published between 1992 and 2003. The sample consisted of both qualitative and quantitative studies. The purpose of the study was to “assess predictors, linkages, and biases in individual and organizational IT adoption research” (ibid). In total, 135 independent variables were studied. According to Jeyaraj et al (ibid), ”a dominant research paradigm has emerged…The dominant paradigm posits that the more individuals and organizations possess of the right independent variables, the more the IT innovation will be adopted.” They categorize the studied independent variables into four categories: Innovation Characteristics, Individual Characteristics, Organizational Characteristics and Environmental Characteristics. The best predictors of IT adoption (as an aggregated construct) in organizational context were Top Management Support, External Pressure, Professionalism of the IS Unit and External Information Sources. When IT adoption was defined as a binary construct (denoting adopter or non-adopter), the best predictors were Top Management Support, External Pressure and Organization Size. All these are included in Fichman’s IT Diffusion Framework, which was selected to be used as the basis for the research framework.

100
3.6.4 Assimilation gaps
Fichman and Kemerer (1997) introduced the concept of assimilation gap. Researchers often define adoption of a technological innovation as the time of its acquisition. Typically, but not always, deployment follows the acquisition of an innovation. An assimilation gap occurs, when there is a widening gap between two alternate diffusion events (Figure 3-33).
Fichman and Kremerer (Fichman and Kemerer 1999) define an assimilation gap as “the difference between the pattern of cumulative acquisitions and cumulative deployments of an innovation across a population of potential adopters.” An assimilation gap may lead to an illusory picture and erroneous judgements about the diffusion the innovation and its future.
Time
Per
cent
of A
dopt
ions
100%
DeploymentEarlier adopters
Acquisition
Assimilation Gap
Figure 3-33 Assimilation gap (Fichman and Kemerer 1999)
Assimilation gaps are explained by two key factors: 1) Many technological innovations, such as platforms, provide increasing returns. This may lead to unrealistic expectations and early acquisitions of technologies that are not sufficiently mature and perhaps never will be. 2) Complex innovations often have significant knowledge barriers that the adopter organization must overcome before it can deploy them. Sometimes, the organization that acquired the innovation is not able or willing to overcome these barriers. (ibid)
As an implication of the possible existence of assimilation gaps Fichman and Kemerer (ibid) suggest that “when assimilation gaps are apt to be present diffusion researchers should use deployment, either instead of, or in addition to, acquisition.“ In this study, the assimilation gap is assessed as the difference between the initial and wide-scale adoptions of SOA.

101
4. DESIGN AND IMPLEMENTATION OF THE EMPIRICAL STUDY
4.1. Research framework
The purpose of the study was to research the adoptions of IT governance, EA and SOA, and to explore a possible relationship of an organization’s IT governance capabilities and EA maturity on adoption of SOA in large Finnish companies. The research framework, presented in Figure 4-1, is based on Rogers’ (2003, 170) model of innovation-decision process and Fichman’s (1992) IT Diffusion Framework (see sections 3.6.2 and 3.6.3).
Organizational characteristics:1. Industry2. Operating model3. Organization size4. Profitability5. Absorptive capacity6. Access to knowledge
Perceived characteristics of SOA 1. Relative advantage2. Compatibility3. Complexity4. Trialibility5. Observability6. Cost7. Technological maturity
IT governance capabilities1. IT governance performance 2. IT value generation3. Enterprise alignment4. IT related risk mitigation5. Business agility and enterprise flexibility6. Organizational IT capabilities and learning
Enterprise architecture maturity1. Operating model2. Formal EA approach3. Current EA stage4. EA effort focus5. EA completition6. EA effectiveness and value
Adoption /rejectionof SOA
Figure 4-1 The research framework for the study
Fichman’s framework is an extension to Roger’s model; it is intended to be used in adoption studies of an IT innovation. Table 4-1 describes how Fichman’s framework extends Rogers’ model for studies of adoption of a complex IT innovation in organizational context, such as SOA.

102
Table 4-1 Comparison of referenced models and the research framework of the study
Model of innovation-decision process, published in 1962 (Rogers 2003)
IT Diffusion Framework (Fichman 1992)
Prior conditions:
- Previous practise
- Felt needs/problems
- Innovativeness - Norms of the social system Characteristics of the decision-making unit: - Socioeconomic characteristics - Personality variables - Communication behavior Perceived characteristics of the innovation: - Relative advantage - Compatibility - Complexity - Trialability - Observability
Roger’s classical diffusion variables
Variables for high knowledge burden or high user interdependencies: - Managerial influences - Critical mass - Absorptive capacity - Implementation characteristics - Institutions for lowering knowledge barriers
Variables for organizational IT adoptions: - Organizational characteristics - Organizational decision processes - Stage of implementation - Competitive effects (adopter industry) - Supply side factors - Economic factors (price) - IT group characteristics
One of the key purposes of this study was to examine whether an organization’s IT governance capabilities and its current level of EA maturity are determinants of adoption of SOA, thus these had to be included as independent variables in the research framework. This implied that it was not possible to use Fichman’s framework for the purposes of this study as such. The following discusses the research framework as compared to Roger’s model of innovation-decision process and Fichman’s IT Diffusion Framework (Table 4-1).
The independent variables in the research framework are: Organizational characteristics, IT governance capabilities, Enterprise architecture maturity and Perceived characteristics of SOA. These were selected for the following reasons: 1) The research problem implies that IT governance capabilities and EA maturity have to be included as variables. 2) Both Roger’s model and Fichman’s framework consider “perceived characteristics of innovation”, thus it was included in the framework as a variable. 3) Many organizational characteristics, such as attitude to change, size and organizational slack affect an organization’s innovativeness (Rogers 2003, 411). These have to be considered in the research framework, otherwise they

103
would become lurking variables i.e. variables that have an “important effect on the relationship among the variables in a study, but are not included among the variables studied” (Moore et al 1998, 156)
The following discusses the research framework in further detail with Roger’s model and Fichman’s framework as references.
- Variables for the characteristics of the decision-making unit in Roger’s model comprise of (2003, 287-292): socioeconomic characteristics, personality variables and communication behavior. None of the characteristics considering individual adopters are included in the model because they are not appropriate when studying adoption in an organizational context. However, the attributes of other variables address some of their concerns.
- Personality variables consist of attributes such as empathy, dogmatism (i.e. how strongly held the individuals set of beliefs is), the capability of dealing with abstractions, rationality, intelligence, the attitude to change, and the ability to cope with uncertainty and risk. These are not included as such in the model. The research framework’s attributes of IT governance capabilities, EA maturity, and organizational innovation cover some of these. The capability of dealing with abstractions, rationality and intelligence are demonstrated with high EA completion and results maturity, the ability to cope with uncertainty is demonstrated by the organization’s capabilities for IT-related risk mitigation, and the attitude to change measured as an attribute of Absorptive capacity.
- According to Rogers (2003), organization’s size and organizational slack, the degree to which an organization has uncommitted resources available affects adoption as wealth and innovativeness often seem to appear together. Organizational slack was not included as an attribute; instead Profitability is used to measure the potential resources available for adoption.
- Communication behavior characteristics include the adopter attributes such as contact with change agents, exposure to mass media and interpersonal communication channels; how actively the adopters seek information of innovations; how knowledgeable they are of innovations; and how high a degree of opinion leadership they have. These variables are not included in the model. However, these issues are addressed by variables included in the model. Business agility and enterprise flexibility assesses the organization’s capability to follow and understand technological trends; a high capability typically requires exposure to mass media, interpersonal communication channels, and contacts with change agents. The communication behaviors between different stakeholders in IT are assessed as attributes of Organizational IT capabilities and learning.

104
- Attributes of prior conditions in Roger’s model are: previous practice, felt needs and problems, innovativeness and the norms of the social system. Previous practice generally describes previously adopted innovations that may be related to adoption of innovation. In the research framework, an organization’s previous practice of actual IT use is determined by Current EA stage; it describes the maturity of an organization’s IT environment, and may affect its capability to adopt SOA. Felt needs and problems are assessed as an attribute of Perceived SOA compatibility i.e. by asking how compatible SOA is with the felt needs and problems of the organization. Innovativeness as such is not included as a variable in the research framework. However, the issue is addressed by an organization’s Absorptive capacity. The norms of the social system are assessed by the research framework’s variable IT value generation which has several attributes describing the norms of an organization’s IT decision-making and related practices. Enterprise alignment also describes the previous practice and norms of a social system; its attributes measure how aligned an organization is required to be.
- Fichman’s IT Diffusion framework has variables for innovations with a high knowledge burden or high user interdependencies: managerial influences, critical mass, absorptive capacity, implementation characteristics, and institutions for lowering knowledge barriers. Managerial influence typically connotes the influence managers have on adoptions of individual users - in this sense; it is not relevant for this study. However, the variable organizational IT capabilities and learning has several attributes addressing managerial engagement in the IT decision-making process. The Absorptive capacity, “the organization's ability to recognize the value of new information, assimilate it, and apply it to productive ends” (Fichman 1992) is included in the model.
- According to Fichman, implementation characteristics, that affect the adoption, include “the transferability (maturity and communicability), organizational complexity (number of people and functions affected), and divisibility (ability to divide implementation by stages or by sub-populations) of the innovation” (ibid). Technological maturity measures innovation maturity and Perceived SOA trialability measures the ability to implement SOA with pilot projects. Institutions for lowering knowledge barriers are typically service firms and consultants. According to Fichman (ibid), access to these rather than the classical communication variables affect adoption of a complex organizational innovation. Access to knowledge measures how the organization perceives the availability of knowledge and support.
- The attributes for perceived innovation characteristics of Roger’s model, Perceived SOA complexity and Perceived SOA observability are included in the research framework.
- Different industries have different types of needs for IT use; the competitive environment of an enterprise may affect the adoption of SOA. Thus, Industry is included as an attribute of Organizational characteristics in the research framework. In

105
addition, enterprise’s make different types of decisions on how to carry out their operations, thus Operating model, describing these basic decisions, is included in the research framework.
- Fichman’s model includes the following variables for IT adoptions in an organizational context: organizational characteristics, organizational decision processes, stage of implementation, competitive effects (adopter industry), supply side factors, economic factors (price) and IT group characteristics. Attributes for IT governance capabilities and EA maturity describe both organizational characteristics, decision processes and IT group characteristics. According to Fichman (1992), in an organizational context, it is important to measure the Stage of implementation; this is measured as an attribute of SOA adoption. As a supply side factor, the perceived maturity of SOA technologies is assessed an attribute of Organizational characteristics. Economic factors, i.e. the perceived relative price of SOA implementation are included as an attribute Cost in the research framework.
The previous discussion shows that although the research framework of the study is not a direct derivation from Rogers’ classical model of innovation-decision process nor from the Fichman’s Framework for IT Diffusion, it includes the attributes of most of their key constituents.
4.2. Design of the survey
4.2.1 Construct of the survey
The selected method for the collection of empirical data was survey. Thus, the research framework presented in Figure 4-1 was operationalized by constructing a questionnaire for the survey.
According to Fink (2006, 1) a survey is an “information collection method used to describe, compare, or explain individual and societal knowledge, feelings, values, preferences, and behavior.” A survey can be self-administered meaning that the respondent answers to the questions of a mailed or online survey without any guidance, or a survey interview where the interviewer asks the questions and records the interview. Kasunic (2005, 4-7) describes a survey as a seven-step process that uses a questionnaire as the instrument (Figure 4-2).
Identifythe research
objectives
Identify and characterize
the target audience
Design the sampling
plan
Design and write
the questionnaire
Pilot testthe questionnaire
Distributethe questionnaire
orconduct interviews
Analyze the results
and write a report
Figure 4-2 A process for conducting survey research, based on Kasunic (2005, 7)

106
To conduct a survey: 1) the objectives of the survey have to be determined; 2) the target audience and its characteristics, such as their knowledge about the subject area and proper means of contact, are identified; 3) a representative sample of the target population is selected; 4) the survey objectives and internal questions are translated into a questionnaire; 5) the questionnaire is pilot-tested and the required improvements are made to it; 6) the questionnaire is distributed or the interviews are conducted; and 7) the results of the survey are analyzed and a report presenting the results and findings is written. (ibid, 7)
The goal of a survey interview is to make the interview repeatable. Thus, it is quite different from an in-depth interview where the interviewer has a list of topics and possible questions, but the flow of the interview is free and controlled by the researcher conducting the interviews. Case studies require less standardized interviews and often use in-depth interviews instead of survey interviews. (Fowler & Mangione 1990)
Two types of survey interviews exist: in a standardized survey interview, the interviewer does not give additional information to the respondents, whereas in a conversational survey interview the researcher may give additional information about the questions when needed. According to Schober and Condrad (1997), conversational survey interviews should be seen as special conversations; the intent of the interviewer is to help the respondent to interpret the questions as intended. Both standardized and conversational survey interviews improve data quality. If the concepts of the questionnaire are complicated to understand, the accuracy of a standardized interview can be poor - a better accuracy may be achieved by using a conversational survey interview. Yet, the cost of better data quality is that conversational interviewing increases the length of the interview. (ibid)
In a self-administered survey, the response rate can be low. For example, a response rate of 16 percent from a sample of 1000 companies was reported in a study of a relationship between software development process maturity and project performance conducted by Jiang et al (2003). In another study researching IS development projects (Lee & Xia 2003), a 29 percent response rate was considered high because the target group consisted of busy IT project managers.
Survey interviews typically lead to higher response rates. For example, the National Science Foundation. (NSF 2004) surveyed a sample of 2344 companies using a computer aided telephone interview (CATI) and was able to achieve a 57.2 percent response rate. Pirttimäki (2007) reports the response rates of two studies (Hannula & Pirttimäki 2003, Pirttimäki 2007) that targeted the top 50 Finnish companies to research their Business Intelligence practises. The response rate of the first survey in 2002 was 92 percent and that of the survey conducted in 2005 was 82 percent. The targeted responders in companies were middle managers responsible of the subject area - business intelligence. While survey interviews

107
achieve higher response rates, interviewing is costly, which implies that the sample size has to be much smaller.
A high quality survey produces reliable and valid information (Moore 2000, 130-135). According to Litwin (1995), a valid survey item measures what it is intended to measure. A measurement process typically has some degree of bias systematically overstating or understating the true value of the property it measures. In addition, a measurement may have a random error, that is, repeated measurements give different results. A measurement is reliable if the random error is small. (Moore 2000, 130-135)
The general formula for the measured value is (ibid, 135):
Measured value = true value + bias + random error.
Kasunic (2005, 8) states three important issues that have to be considered with surveys: 1) the usefulness of the survey results is determined by the survey process; 2) to create a useful survey both knowledge of survey design and domain expertise are required; and 3) those who will eventually use the survey data bear a responsibility to ensure that the survey is asking the right questions that lead to problem understanding and effective decision-making.
Fowler and Mangione (1990, 14) give four principal sources of errors in surveys: the sample of the survey, questions of the survey, interviewer (in the case of interviews), and incorrect coding of the answers. All these must be considered properly to achieve as error-free results as possible.
4.2.2 Selection of the survey sample and method
Rogers (2003, 257) states that the complexity of innovation is negatively related to its adoption. Complex innovations are more difficult to adopt and may require large initial investments. According to Rogers (ibid, 288), earlier adopters typically “have larger-sized units than do later adopters”. IT governance, EA and SOA are quite recent innovations, which implies that the probability of their adoption is higher among large organizations than among small organizations. Decision-making in public organizations may require a considerably longer time for persuasion than that in companies; thus, large companies were selected as the target audience of the survey.
Survey research typically selects a sample of the population and generalizes the results to the population. A probability sample is a sample where “each person in the population has a fair or equal chance of being selected (Kasunic 2005, 21).” A non-probability sample does not ensure equal probability of selection for the whole population; the selection of a sample

108
is made by convenience, by judgement or by self-selecting. If the objective of the survey is to generalize, strict rules and a probability sample have to be used.
A good candidate for the population of the survey was the list of 500 largest Finnish companies by the financial magazine Talouselämä (2006). With a proper sample and a succeeded implementation, the results of such survey provide generalizations for the “top 500” Finnish companies. However, the population of the survey was selected to be the top 50 companies in Talouselämä 500 list of companies, and a census, that is, no sampling was decided to be used. The key reasons for this decision were:
1. The top 50 companies are successful, large as measured with turnover or personnel, have sufficient resources available to adopt innovations and constantly seek potential sources of competitive advantage. Other companies typically are not as successful in these respects.
2. The key concepts of the study are quite recent and some do not have a widely accepted definition (for example SOA). This implies that a self-administered survey would probably have led to poor accuracy and low response rate. In addition, a complex and long questionnaire was required, which would probably have made the response rate even lower. Thus, conversational telephone survey interview was chosen as the survey method to achieve a higher respond rate and to improve the data quality.
3. The resources available limited the maximum number of telephone interviews to fifty. While a probability sample would have promoted generalizability, the largest, global companies could have been excluded from the sample. To avoid this, the sample was decided to be the top 50 companies in Talouselämä 500 list of companies.
The targeted responders from the companies were selected to be the companies’ Chief Information Officers (CIOs) or their direct subordinates. The views of business people, such as Chief Execution Officer (CEO), Chief Strategy Officer (CSO) or business analyst would have been interesting. However, they might not have been sufficiently familiar with SOA. Chief architects would probably have known the state of EA in their company better than CIOs, yet they probably look at EA more from management than governance perspective. In addition, the single person that typically is responsible for the implementation of IT governance and EA, and adoptions of new technologies or design paradigms is CIO. While the resources allowed only one person from the company to be interviewed, the CIOs were selected as the target audience.
Although the survey population is fairly limited, the survey was expected to provide a sufficient amount of data to explore the state of IT governance, EA and SOA adoption in the largest Finnish companies, and to allow a study of a possible relationship between an organization’s IT governance capabilities, EA maturity and SOA adoption.

109
4.2.3 Design of the questionnaire
The design of the questionnaire was addressed carefully, mainly because after the survey data is gathered, not much can be done to improve the quality of the data. A poorly designed questionnaire may not produce the information intended and required and the efforts put into the survey can not be justified.
According to Kasunic (2005, 33) key inputs to the design and writing of questionnaire are the research objectives and the characteristics of the target audience. The goals of the study have to be clearly defined and used to drive the design of the questionnaire. The proper design of the questionnaire, with the target audience in mind, is also important because the survey questions can introduce errors in the following situations (Fowler et al 1990, 14):
- when they are misunderstood
- when they require information that respondents do not have or cannot recall accurately
- when respondents are not willing to answer accurately.
The questionnaire was derived from the research framework presented in Figure 4-1. Most survey questions are closed-ended questions with order choices, i.e. Likert scale, having a scale from one (strongly disagree) to five (strongly agree). Where necessary, the questionnaire added an additional choice of “not used”, or “no opinion” as an option. Closed-ended questions were preferred over open-ended questions, because they do not require the additional interpreting, organizing and categorizing that open-ended questions do. Two open-ended questions were included: 1) to ask the respondent about the most challenging issues in a possible SOA adoption, and 2) to ask about an additional benefit of SOA, that is, a benefit not included in the questionnaire. The questions for determining EA maturity were expressed as descriptive choices of each maturity level, from which the respondent had select the one that best represented the situation in his or her organization.
The questions were grouped together according to the variables of the research framework. According to Venkatesh and Davis (1995), grouping questions does not introduce bias as compared to intermixing questions, and thus does not affect the reliability and validity of the study. Venkatesh and Davis also found grouped questionnaires to be more respondent-friendly, as intermixing of questions was found to be confusing to respondents and could even introduce a random error.
Fink (2006, 18-20) gives rules for constructing closed survey questions:
1. Each question should be meaningful to respondents 2. Standard English should be used i.e. no specialized words or abbreviations 3. Questions should be concrete, close to respondents’ experience

110
4. Biased words and phrases should be avoided 5. Survey writer should check his own bias to create unbiased wording 6. Caution should be used when asking for personal information 7. Each question should have just one thought.
Suessbrick et al (2001) found that when respondents are given definitions of the concepts, they can interpret questions more uniformly, which improves data quality. Although the research topics and concepts were expected to be familiar to respondents, many of these key concepts do not have a generally agreed definition. Thus, the definitions of key concepts were included in the survey to assist the respondents.
The initial version of the questionnaire was pilot tested with a small sample consisting of four respondents in a similar position (CIO) as the respondents of the target population. After the interviews, the respondents were asked to evaluate the questionnaire and give suggestions for improvements. Many suggested corrections were made, especially to question wording. In addition, the strategy of how to assess project success was changed. The initial strategy was to ask the respondent to give the percentage of projects belonging to categories “succeeded”, “challenged” and “failed” as defined by The Standish Group (see section 3.1.2). While the respondents seemed to have difficulties to give answer to this question, the strategy was changed to ask the project success on a Likert scale. Another reason for this change was that the respondents seemed to be unwilling to give answers with such accuracy about failed projects. One new question about the importance of different EA domains was added because the respondents were voluntarily explaining this while assessing the maturity of their enterprise architecture domains.
After the pilot test, an evaluation of the questionnaire was made to ensure that the data would provide answers to the research questions. Improvements in this final questionnaire design phase consisted mostly of the removal of biased and unnecessarily complex expressions.
4.2.4 Questionnaire contents
The questionnaire contents are described in this section. An English version of the questionnaire is presented as Appendix A. The original Finnish version of the questionnaire, which was used in data collection, is presented as Appendix B.
The questionnaire was structured according to the research framework presented in Figure 4-1. The first part of the questionnaire addresses the attributes of the dependent variable: Adoption or rejection of SOA and the characteristics of a possible SOA adoption. The following parts determine the attributes of the independent variables: the company’s IT

111
governance capabilities; the maturity of the company’s enterprise architecture; the company’s perceptions of SOA; and as the only surveyed attribute for organizational characteristics, a company’s absorptive capacity (data for other attributes was retrieved from the Talouselämä website).
The first part of the survey studies the current stage of an organization’s SOA adoption. To survey this and the characteristics of the possible adoption, the following questions were asked:
1. What is the current stage of SOA adoption?
The overall adoption stage of SOA is either adoption or rejection. The stage of company’s SOA adoption is determined as a stage of Roger’s model of innovation-decision process (see section 3.8.2) i.e. knowledge, persuasion, decision, implementation and confirmation.
2. When was the first SOA implementation project started?
3. When was a decision made to move from implementing SOA pilot projects to a wider-scale SOA adoption i.e. when was SOA adoption confirmed?
These two questions were used to analyze the diffusion curves and the existence of a possible assimilation gap for SOA. In addition, they were used to analyse in what sequence the possible adoptions of other innovations had been made.
4. What percentage of total money spent on new IT investments is based on SOA?
The share of IT investments spent on SOA supports the question of wide-scale SOA adoption, i.e. how widely SOA is assimilated.
5. How successful the SOA implementation projects have been in terms of time, cost, implementation of planned features and functions, and delivering the expected benefits and value?
6. What have been the most challenging issues in SOA adoption?
IT investments are typically implemented as projects. Thus, it is relevant to know whether SOA projects are more or less successful than other IT projects. The open-ended question gives additional information about the challenges of SOA implementation.
The second part of the survey assesses organization’s IT governance capabilities. The following questions were asked:

112
1. Has the organization adopted a formal IT governance approach?
Although IT governance is a natural phenomenon, an organization that has adopted a formal approach for IT governance, may have better capabilities to adopt new IT innovations. In addition, the year of IT governance adoption was asked to determine the diffusion S-curve for IT governance.
2. a) What is the organization’s IT governance performance?
Weill & Ross (2004a, 120-121, 239-240) designed an instrument to assess an organization’s IT governance performance. To calculate IT governance performance index, we need to know how important the following objectives are for the company and how successful IT governance is in delivering them: 1) cost-effective use of IT, 2) effective use of IT for asset utilization, 3) effective use of IT for asset growth, and 4) effective use of IT for business flexibility.
b) How successful are the organization’s IT projects?
As another measure of IT governance performance, the success of IT projects was assessed. An organization that has a history of successes in managing their projects and delivering the benefits and value expected may be more willing to adopt new IT innovations. On the other hand, if an organization is striving for high IT project success, it may not be willing to take a chance by adopting a new or complex IT innovation.
The following questions evaluate the organization’s capabilities to achieve the expected benefits of IT governance.
3. What kind of capabilities the organization has built for ensuring IT value generation?
An organization can generate value from IT by setting clear objectives and measuring how they are achieved. At the strategic level, a tool such as an IT Balanced Scorecard can be used (Grembergen et al 2003). At the operational level, typically Service Level Agreements (SLAs) are used. In addition, practises for ensuring the success of IT investments are critical. An enterprise needs them to convert an IT investment into a valuable IT service that can be included as part of its IT service portfolio.
The questions were formulated in a way that allows an assessment of a company’s IT investment maturity (see section 3.5.3).

113
4. How aligned is the enterprise?
According to Luftman et al (1993), an organization needs business-IT alignment both at strategic and operational level. Similarly, alignment is needed at the different levels of organization and at project level (Fonstad et al 2006).
5. What are the organization’s capabilities for IT-related risk mitigation?
Effective management of IT-related risks is critical for any organization. According to Rogers (2003, 290), “earlier adopters are better able to cope with uncertainty and risk than are later adopters.” An organization that is confident with its IT control framework, has high awareness and management of IT’s impact on business continuity, and appropriate management and approved level of current risks may have better capabilities to adopt new innovations.
6. What are the organization’s capabilities for business agility and enterprise flexibility?
Business agility and enterprise flexibility are the key expected benefits of SOA, thus an organization with poor capabilities of these would probably benefit more from SOA than an organization with good capabilities for business agility and enterprise flexibility. However, according to Rogers (2003) the paradox of innovations is that those who would most benefit from adopting the innovation are often less likely to adopt it.
7. What are the organization’s capabilities for organizational IT capabilities and learning?
Adopting a complex IT innovation such as SOA requires organizational capabilities to overcome knowledge barriers. The commitment of senior management and widespread understanding of IT governance are stated as critical success factors of IT governance (Weill et al 2004). To achieve benefits from IT innovations, an organization must usually also make changes to its organizational structure and processes. Thus, organizational IT capabilities and learning could affect the adoption of SOA.
The third part of the survey assesses the organization’s enterprise architecture maturity. The following questions were asked:
1. How clearly the senior management has articulated the enterprise operating model and strategy, and IT’s role in achieving them?
The successful fulfilment of company’s IT needs requires understanding of the selected operating model and strategy. In addition, business and IT should have agreed on the role of IT in supporting the operating model and executing the company strategy.

114
2. Has the organization adopted a formal enterprise architecture approach?
Most businesses use many key elements of EA, such as business process management. However, the adoption of an EA framework and EA governance structures, processes and mechanisms may provide a more holistic approach that integrates the development of different EA domains.
In addition, a possible EA adoption affects how the respondents understand other questions about EA maturity, thus we need to be able to separate these two groups of companies.
The respondents were also asked about the year of EA adoption in order to determine the diffusion S-curve for EA. In addition, it was also to determine the sequence of the adoptions of IT governance, EA and SOA, the goal of which was to determine whether IT governance and EA could be considered as prerequisites of SOA.
3. What are the focus areas of the organization’s EA development efforts?
This question is asked to determine the organization’s actual EA stage as defined by Ross, Weill and Robertson (see section 3.3). A company’s current EA stage defines, in part, its prior conditions and thus affects adoption of other innovations.
4. How important are different architecture domains in terms of current development efforts?
The importance of different EA domains could explain their relevant maturity.
5. What is the organization’s current EA completion maturity?
6. What is the organization’s current enterprise architecture results maturity?
The last two questions assess the maturity of EA approach. These questions were derived from the OMB EAAF maturity framework (OMB 2005).
According to Rogers (2003), perceived innovation characteristics are key factors affecting its adoption:
1. How does the organization perceive the potential relative advantage from SOA?
The key benefits of SOA from section 3.4.4 were used to assess the perceived relative advantage of SOA.
2. How compatible is the organization with SOA?

115
These questions assess the organization’s compatibility with the following: management of business and business processes, applications portfolio, IT infrastructure, security policies and architecture, IT investment funding methods, and with business and IT skills and competencies.
In addition, SOA’s compatibility with the organization’s current business and IT needs was asked.
3. The perceived SOA complexity was assessed by asking how complex SOA is to understand, learn and adopt?
Complex innovations require more from the adopter, thus the perceived complexity may affect the adoption.
4. Other SOA characteristics
This section includes questions about SOA trialability and observability, both of which may affect the adoption. In addition, it has questions about the maturity of SOA technologies, the availability of knowledge and support, SOA’s initial investment costs, and possible perceived industry pressure.
The last part of the questionnaire determines the organization’s absorptive capacity, that is, its capacity to adopt innovations and successfully deploy them. These questions ask how successful the companies are in conducting the innovation process suggested by Tidd et al (2005, 66-67), presented in section 3.6.1.
4.3. Data gathering
4.3.1 Description of the data gathering process
Survey data
As the survey population was small, the following rigorous process for data gathering was followed:
1. The respondents’ contact information - telephone and email - was gathered.
2. The researcher tried to contact the respondents by phone. Whenever this trial was successful, an interview was arranged at a time best suitable for the respondent. In some cases, the respondent requested more information about the study and a later contact for

116
the interview request was agreed. If the respondent agreed with the interview, the survey questions were delivered by email in advance.
If the initial contact was not successful, both a voice mail message was left and an email giving information about the study, and a related interview request was sent.
3. The researcher made several new attempts to contact persons who were initially not contacted by phone. Finally, after many attempts, an email remainder was sent. Yet, four respondents were not contacted at all.
4. Five respondents declined the interview or a suitable time could not be agreed. In addition, two previously agreed interviews were later cancelled.
5. Two respondents were willing to participate in the survey, but were too busy to be interviewed. Instead of an interview, they responded by email.
6. All other responds to the survey were gathered in a conversational telephone interview with the researcher and the respondent.
Since the survey questions were sent in advance, most respondents had at least read the questionnaire in advance; many had all or some of their answers ready. Thus, to save time in all but one case it was agreed, that the interviewer should not read the questions aloud, instead the respondent gave his or hers answers to each question. When the respondent told that he or she did not understand a particular question well, the interviewer gave more information about what was meant by the question and related concepts. A similar explanation to any particular questions was given for each.
The respondents were also encouraged to give comments to their answers and give additional background information to support the analysis. However, this information was optional. A telephone interview does not give the respondent the same kind of contact to the interviewer as face-off interviews do. Thus, for confidentiality reasons, the interviews were not taped. Unfortunately, this implied that the additional information gathered as a by-product from the interviews could not be analyzed.
During the interviews, the survey data collection was paper-based; the answers were recorded to hard copy forms of the questionnaire. Special care was taken to record the right answers because the interviews were not taped, thus it is not possible to verify them later. At the same time, the additional comments and notes were recorded with word-processing software. These provided the empirical data to the next phases.

117
Secondary data
In addition to the survey, the study uses secondary data to determine some of the organizational characteristics. The company’s organization size is measured as turnover and personnel. To assess the resources potentially available for the adoption, profitability measures for EBIT (Earnings Before Interest and Taxes), ROI (Return on Investment) and ROE (Return on Equity) are used.
The data for organization size and profitability was gathered from the TE500 list of companies (Talouselämä 2006). Instead of using the industry classification given by the TE500 list, companies were classified according to the sectors of The European Classification of Economic Activities (NACE) (Eurostat 2008b), which is the “European reference framework for the production and the dissemination of statistics related to economic activities” (Eurostat 2008a).
4.3.2 Assessment of the data gathering process
The data gathering process was a harder and more time-consuming task than initially thought for two reasons: 1) Most of the respondents were extremely busy, only a few first calls contacted the respondent. In addition, when the respondents were contacted, the interview often could not be arranged inside the initial period planned for the data gathering. Thus, the time required for the interviews was much longer than expected. 2) While the researcher did not conduct the study as a full time job, about half of the interviews had to be mixed with the normal daily working activities, which was quite challenging. Yet, this helped to appreciate the time given by the respondents because they were in a similar situation as the researcher - giving their precious working time to assist in the research.
According to the OMB Standards and Guidelines for Statistical Surveys (OMB 2006), a response rate of 80 percent is required to be able to give statistically significant generalizations about the population. If generalizations are required, and the response rate is lower, one should conduct an analysis of the nonresponse bias. However, the OMB standard is only valid when the sample size is large.
According to Israel (1992) three variables: level of precision, level of confidence and degree of variability have to be considered when making a decision of a survey sample size. The level of precision or sampling error is “the range in which the true value of the population is estimated to be (ibid).” Sampling error is typically expressed in percentage points, for example ±5 percent. If the sampling error is ±5 percent, and the study found that 40 percent of companies had adopted SOA, it could be concluded that SOA adoption rate is between 35 and 45 percent. The confidence level represents the level of risk that a sample does not

118
represent the true population value. For example, a confidence level of 90 percent would mean that 90 out of 100 samples would have the true population value within the range of precision selected. The degree of variability describes how the attributes being measured are distributed in the population. The less variable, that is, the more homogenous the population, the smaller sample size is required. The maximum variability in a population is 50 percent or .5, which is often used in determining a conservative sample size, a sample with a size larger than if the true degree of variability of the population was used.
When the sample size is small, according to Kasunic (2005, 30), Yamane’s (1973, 727) simplified formula to calculate the required sample size can be used.
n = N / (1 + Ne2)
where n is the sample size, N is the population and e is the desired level of precision.
Table 4-2 presents the required sample size - the number of collected responses – for the desired level of precision and a population size of fifty as calculated from Yamane’s formula. To provide valid generalizations for the population, i.e. the group of fifty largest companies by using statistic methods, to achieve ±5 percent level of precision a response rate of 88 percent is required. However, with a target group consisting of busy CIOs, this proved to be impossible with the resources available.
Table 4-2 Required sample size for desired level of precision where the population size = 50
Level of precision Sample size Response rate± 5% 44 88 %± 6% 42 84 %± 7% 40 80 %
± 7,5% 39 78 %± 8% 38 76 %± 9% 36 72 %± 10% 33 66 %
Thirty-nine companies responded to the survey, which implies that the survey response rate is 78 percent and level of precision is ±7.5 percent. The goal for the response rate was 80 percent to avoid non-response bias. The actual response rate is close to it, the non-responding companies represent a variety of industries, varied sizes and varied profitability characteristics, which implies that there is no reason to suspect significant non-response bias. In addition, while Kelley et al (2003) state that 75 percent is an acceptable response rate for interviews, one can consider the response rate very satisfactory.

119
The resources available for the study limited the number of interviews. While only one person from each company was interviewed, CIOs were selected as respondents (see section 4.2.2). The actual respondent group consisted of companies’ CIOs or their direct subordinates. Figure 4-3 presents the distribution of respondent by their job title.
Other, 8 %
CIO, 82 %
Chief Architect,
10 %
Figure 4-3 Respondents’ job title
Eighty-two percent of responders were CIOs, ten percent were Chief Architects, most of who reported to the CIO, and eight percent of the responders had other job titles. Thus, ninety-two percent of the responders belong to the targeted respondent group. The persons whose job title was other than CIO or Chief Architect had a close working relationship with their company’s CIO or had the responsibility for one or more of the study’s focus areas, either in their current position or previous position.
A comprehensive assessment or evaluation of IT governance capabilities and EA maturity would require an audit where several people were interviewed and documents and data would be presented to support the assessment. Clearly, such a procedure is beyond the limits of a study like this. If the perceptions of only one person are gathered, any findings about a single company may be misleading. However, the compound data from the survey interviews was intended to be used to analyze the group of top 50 companies, not to make findings about any single company.
According to Litwin (1995, 34-45), survey validity can be measured in four forms: face validity, content validity, criterion validity and construct validity. Untrained judges may give the questionnaire a measure of face validity, they can tell you whether the questions are ok or not. When subject matter experts evaluate the questionnaire, its content validity is measured. This approach was taken by discussing the validity of the questionnaire with the test group. Criterion validity measures how well the instrument performs against another instrument of predictor, and how well the instrument can forecast future events. No such

120
instruments were available and the future predictability of the questionnaire can only be assessed afterwards.
Litwin (ibid) states that construct validity is the most valuable and most difficult measure of validity. It measures how meaningful the instrument is when it is in practical use. Construct validity can be evaluated for example by obtaining the same information using several methods. In the case of this study, an assessment of the instrument’s construct validity was possible because the pilot group included previously known organizations. The researcher could compare the responses with the previous knowledge about these organizations. Accordingly, the identification of problem areas, such as confounding wordings, was easier, and the instrument could be respectively improved.
4.4. Data processing, analysis and interpretation
4.4.1 Description of data processing
A spreadsheet program, Excel, was considered sufficient for statistical analysis and graphical representation of the study data. A spreadsheet matrix was prepared from the survey data having the responders as rows and questions as columns. In a later phase, statistic discovery software, SAS JMP, was used for visual analysis of the data and verification of the statistic analyses made with the spreadsheet program.
According to Fink (2006, 87-90), survey data should be cleaned before analysis is started. Data can become dirty for reasons such as miscoding, incorrect data entry and missing answers. Fink suggests that to ensure reliable coding for a small survey, with one person doing all the coding, one should code all data twice. The second coding should take place about a week after the first coding. As the survey consisted of closed-ended questions, coding was pre-determined. However, a similar method was used to ensure reliability of data entry. Data was first entered into the spreadsheet immediately after the interviews. This also allowed a preliminary analysis of data during the data collection phase. After the last interview all survey data was entered a second time to a copy of the spreadsheet organized for the data. The two spreadsheets were compared and all mismatches i.e. data entry errors were corrected.
Missing answers may be an issue with surveys, unless carefully planned. In the survey design phase, the approach was to provide a choice of “no opinion” where appropriate, and in the interviewing phase, insisting on getting answers to all questions during the interviews.

121
All descriptive statistics and statistical test were verified. By using the statistic discovery software package, the verification was much easier than by conducting the same analyses twice with the spreadsheet program. However, some of the analyses had to be verified by conducting them twice with the same tool.
4.4.2 Methods used in data analysis and interpretation
The questionnaire uses questions with ordinal Likert-scale choices. While Likert-scale items are ordered, the intervals between the items are not constant (Kasunic 2005, 86). This implies that calculating means makes no sense. Thus, the study reports response information as frequencies within each category, and uses median to report centre of the distribution. When appropriate, the study also reports the share of respondents who agree to the statement, i.e. the sum of frequencies of two highest categories, denoted in this study as the high percentage (high %). At the beginning of analysis, the distributions were analysed graphically. However, tables are mostly used to report the response information.
The analysis of differences in characteristics of SOA adopters and non-SOA adopters – the companies, which have not adopted SOA - is based on a method suggested by Romano et al (2006): raw differences are used to compare the difference between the two groups. To compare raw difference between SOA adopters and non-SOA adopters, the data for both groups is dichotomized (two groups are created): the responders who agree to the statement make up the first group - the top half , in this study referred to as high percentage - while the other responders make up the second group. The top half of SOA adopters is then compared to that of non-SOA adopters. While the study’s level of precision is ±7.5 percent, raw differences of more than 15 percentage points were considered significant and reported. Differences less than 15 percentage points are considered insignificant and not reported.
Statistical tests, such as t-test or chi-square test, are often used to test the significance of found differences. The t-test is based on comparing group means and thus could not be used to analyse the differences of Likert-scale variables. However, the statistical significance of the differences in secondary data was tested with t-test.
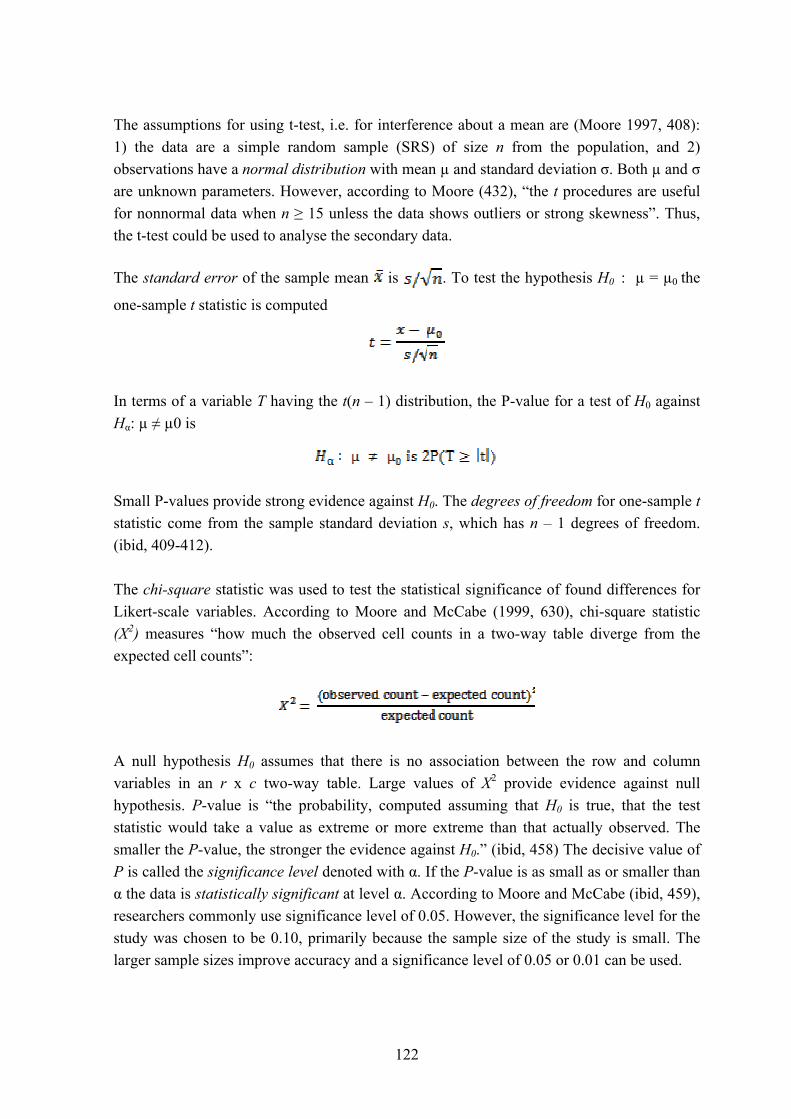
122
The assumptions for using t-test, i.e. for interference about a mean are (Moore 1997, 408): 1) the data are a simple random sample (SRS) of size n from the population, and 2) observations have a normal distribution with mean µ and standard deviation σ. Both µ and σ are unknown parameters. However, according to Moore (432), “the t procedures are useful for nonnormal data when n ≥ 15 unless the data shows outliers or strong skewness”. Thus, the t-test could be used to analyse the secondary data.
The standard error of the sample mean is . To test the hypothesis H0 : µ = µ0 the
one-sample t statistic is computed
In terms of a variable T having the t(n – 1) distribution, the P-value for a test of H0 against Hα: µ ≠ µ0 is
Small P-values provide strong evidence against H0. The degrees of freedom for one-sample t statistic come from the sample standard deviation s, which has n – 1 degrees of freedom. (ibid, 409-412).
The chi-square statistic was used to test the statistical significance of found differences for Likert-scale variables. According to Moore and McCabe (1999, 630), chi-square statistic (Χ2) measures “how much the observed cell counts in a two-way table diverge from the expected cell counts”:
A null hypothesis H0 assumes that there is no association between the row and column variables in an r x c two-way table. Large values of Χ2 provide evidence against null hypothesis. P-value is “the probability, computed assuming that H0 is true, that the test statistic would take a value as extreme or more extreme than that actually observed. The smaller the P-value, the stronger the evidence against H0.” (ibid, 458) The decisive value of P is called the significance level denoted with α. If the P-value is as small as or smaller than α the data is statistically significant at level α. According to Moore and McCabe (ibid, 459), researchers commonly use significance level of 0.05. However, the significance level for the study was chosen to be 0.10, primarily because the sample size of the study is small. The larger sample sizes improve accuracy and a significance level of 0.05 or 0.01 can be used.

123
The assumptions for chi-square test are (Romano et al 2006): 1) the data for the population is normally distributed, and 2) the table frequencies are sufficient. According to Moore and McCabe (1999, 634), for a 2 x 2 table, all four expected cell counts should be five or greater. For larger tables, the average expected cell count should be at least five and the minimum cell count one. This implies that the chi-square test could not be used to test the statistical significance of each variable and their individual attribute. When the assumptions were not met, for aggregated variables, an attempt was made to change the threshold value for high category to meet the assumptions. Yet, for some variables the chi-square test could not be used, these cases are reported as “chi-square test not applicable (expected cell count assumption not met)”.

124
5. RESULTS OF THE EMPIRICAL STUDY
5.1. Results of the survey
The following sections present the results of the survey following the structure of the questionnaire. The first part of the questionnaire addressed SOA adoption.
5.1.1 SOA Adoption
The state of service-oriented architecture (SOA) diffusion in large Finnish companies was determined by asking the respondents to assess what their company’s relation to SOA is (Table 5-1).
Table 5-1 Company’s relation to SOA
Company's relation to SOA n (39) % Adoption stage 1
We are not aware of SOA 0 0.0 % Not adoptedWe are aware of SOA, but have not tried to learn more about it 4 10.3 % Not adoptedWe are actively seeking knowledge of SOA, what is, how it works and why it works 3 7.7 % Not adoptedWe have learned about SOA characteristics and are currently assessing its potential benefits for us 5 12.8 % Not adoptedWe are currently preparing for the decision of either adopting or rejecting SOA 3 7.7 % Not adoptedWe have just decided to reject SOA adoption, at least for the time being 0 0.0 % Not adoptedWe have just decided to adopt SOA 5 12.8 % AdoptedWe are currently implementing SOA with one or more selected pilot projects 7 17.9 % AdoptedWe have implemented one or more pilot projects, but have decided not to expand our adoption of SOA. 1 2.6 % AdoptedWe have implemented one or more pilot projects and have decided to expand our adoption of SOA 9 23.1 % AdoptedWe are already committed to SOA and are widely implementing it 2 5.1 % Adopted1) Companies, which had decided to adopt SOA were included in the 'adopted' category
The survey data shows that all companies are aware of SOA. Four companies (10.3%) do not have SOA on their current task list; all other companies are active with SOA. The reasons for not having tried to learn more about SOA were the following: two companies stated ERP-rollouts as the reason, one company was waiting for developments from their current ERP vendor, and one company was not sufficiently confident about stability of a service-oriented environment.

125
According to the survey, service-oriented architecture is adopted in 24 (61.5%) of the top fifty Finnish companies (Figure 5-1). A company has adopted SOA, if: 1) the company has just decided to adopt SOA, 2) the company is currently implementing pilot projects or 3) the company has confirmed its adoption of SOA.
Not Adopted, 38.5 %
Adopted, 61.5 %
Figure 5-1 SOA adoption rate in large Finnish companies
One company had implemented SOA pilot projects, but had decided not to expand its SOA adoption. An explanation to this was a recent merger; the new parent company had mandated new applications and IT solutions, implying that an expansion of the prior SOA adoption was not currently on the company agenda.
Table 5-2 presents SOA adoption rates since 2002. After the first SOA adoption in 2002, diffusion has accelerated i.e. two thirds of adopters have adopted SOA since 2005. Fifteen companies (38.5%) have made a decision of a wide-scale adoption of SOA.
Table 5-2 SOA adoption rates
Year n (24)Percentage of SOA adoptions
Cumulative % of SOA
adoptions
Cumulative % of all
companies n (15)Cumulative % of
all companies2002 1 4.2 % 4.2 % 2.6 % 0 0.0 %2003 5 20.8 % 25.0 % 15.4 % 1 2.6 %2004 2 8.3 % 33.3 % 20.5 % 0 2.6 %2005 5 20.8 % 54.2 % 33.3 % 3 10.3 %2006 5 20.8 % 75.0 % 46.2 % 4 20.5 %2007 6 25.0 % 100.0 % 61.5 % 7 38.5 %
Year of decision of wide-scale SOA adoption
Year of first SOA implementation
Companies, which have adopted SOA, spend an average of 18.1% of the money invested in IT on SOA-based solutions. For a clear majority of SOA adopters (62.5%), the share of SOA-based investments is not significant, that is, it is at most 20% of all IT investments (Table 5-3). However, two companies have almost all of their IT investments based on SOA.

126
Table 5-3 Share of SOA-based investments of all IT investments
Share of SOA based investments
Count % of SOA adopters
Cumulative % of SOA adopters
1-10 9 37.5 % 37.5 %11-20 6 25.0 % 62.5 %21-30 2 8.3 % 70.8 %31-40 0 0.0 % 70.8 %41-50 2 8.3 % 79.2 %51-60 2 8.3 % 87.5 %61-70 1 4.2 % 91.7 %81-90 1 4.2 % 95.8 %91-100 1 4.2 % 100.0 %Total 24 100.0 % 100.0 %
Table 5-4 presents the distribution, median and high percentage (high %), the share of responses belonging to the two highest categories of SOA project success.
Table 5-4 Success of SOA projects
1 2 3 4 5 High MedianImplemented with all features and functions initially specified 0.0 % 0.0 % 11.8 % 70.6 % 17.6 % 88.2 % 4Delivering the benefits and value expected 0.0 % 11.8 % 23.5 % 58.8 % 5.9 % 64.7 % 4Completed on budget 0.0 % 5.9 % 41.2 % 52.9 % 0.0 % 52.9 % 4Completed on time 0.0 % 11.8 % 41.2 % 47.1 % 0.0 % 47.1 % 3
4-7 8-10 11-13 14-16 17-20 High MedianAggregated success of SOA projects 0.0 % 0.0 % 35.3 % 52.9 % 11.8 % 64.7 % 15
Count of companies = 17Scale: 1 (not successful) to 5 (very successful, High = 4 to 5 (14 to 20, aggregated)
According to SOA adopters, SOA projects typically implement the features and functions initially specified. About two thirds of projects deliver the benefits and value expected. Completing projects on budgets and on schedules is more challenging for the companies. The median aggregated success of SOA projects, calculated as the sum of individual project success items, is relatively high (15 out of 20), and there are no indications of major SOA project failures, which was also confirmed by the interviews.
Table 5-5 lists encountered SOA challenges and the count of how many times they were mentioned. Many SOA adopters have had difficulties in creating a solid business case for SOA. Platform investments typically have significant costs, but create benefits only after a longer period, which makes creation of a business case harder. In addition, the first project implementing SOA has to build the infrastructure, thus it may take a longer period to

127
complete. This may create a significant barrier for SOA adoption, especially when SOA adoption is considered at project level. SOA governance is another key challenge of SOA adoption - wide-scale SOA adoption requires the creation of new governance mechanisms, such as service registries describing the service interfaces, and Service Level Agreements (SLAs) addressing the details of their usage.
Table 5-5 SOA challenges
IT governance issues CountDifficulties in creating a business case for SOA. Platform investments typically create long-term benefits instead of short-term benefits. 4First project implementing SOA has to create the platform, which causes delays for its completion. 2SOA needs different type of governance than previous architectures, which takes time and resources to create and learn 2Security issues, especially when using services outside organizational boundaries 1Enterprise architecture issues CountNo special technology challenges 3Master Data Management (MDM) issues and poor data quality in current systems 2Maturity of SOA technologies 2Previous experiences of business process modeling only from business unit level 1
Initially longer solution development time, though development cycles gradually shorten 1Heterogenous technology architecture 1Current systems are interdependent, fixing one does not help a lot 1Compability of SOA technologies from different vendors 1Skills and competency issues CountResistance to change from own developers 3
How to build services that are reusable, scalable and fullfil the future needs without redesign? 3How to sell SOA to senior management with limited SOA information? 1Lack of proven competencies (partners and suppliers) 1Availability of relevant information for SOA adoption 1SOA is seen as a technology, IT matter, not as a new paradigm 1
Two companies have met challenges with maturity of SOA technologies, however, this probably depends on selected tools and vendors, and because three companies emphasized that, they had not confronted technology challenges with SOA adoption. According to the background information given in the interviews, most SOA adoptions were integration-related, thus it is not surprising that master data management and poor information quality were mentioned as challenges.
Skills and competencies have created perhaps the biggest challenges for SOA adoption. SOA adopters have met these challenges at many levels: 1) Selling SOA to senior managers; decision-making about SOA adoption takes time when both business and IT people have limited knowledge of SOA and its effects. 2) Availability of information; relevant

128
information to support decision and adoption is difficult to find. 3) Lack of proven competencies; it is difficult to select vendor and supplier, as they do not have a proven track of successes with SOA. 4) Knowledge of how to build services; little knowledge is available of how to build services to avoid rework. 5) IT people resist change; developers are at least as conservative as others are. 6) SOA is seen as a technology; business people typically see SOA as an IT-related technology matter, not as a concern for them.
5.1.2 IT governance capabilities
The questionnaire defines IT governance adoption to mean that the company has defined structures, processes and mechanisms for governance of IT. IT governance is widely adopted in large Finnish companies – all but one of the 39 companies had adopted it. Thus, IT governance adoption rate was 97.4 %. – the adoption is already saturated among the population of the survey. Although widely adopted, IT governance is still a relatively new approach in large Finnish companies as 50.0% of adopters have adopted it after 2003 (Table 5-6). The year of the first adoption was 1987.
The adoption rates for the years before 2002 were summarized because recalling years accurately is not an easy task; to recall events that took place more than five years ago reliably is even more challenging. However, the actual years of these IT governance adoptions are not important for the study.
Table 5-6 Year of IT governance adoption
Count % Cumulative % Count % Cumulative %
Before 2002 5 20.8 % 20.8 % 3 23.1 % 23.1 %2002 5 20.8 % 41.7 % 1 7.7 % 30.8 %2003 3 12.5 % 54.2 % 1 7.7 % 38.5 %2004 5 20.8 % 75.0 % 0 0.0 % 38.5 %2005 2 8.3 % 83.3 % 3 23.1 % 61.5 %2006 3 12.5 % 95.8 % 4 30.8 % 92.3 %2007 0 0.0 % 95.8 % 1 7.7 % 100.0 %
All 23 95.8 % 13 100.0 %1) Year of ITG adoption was not known in 2 companies
SOA adopters (n=24) Non-SOA adopters (n=13) 1
Table 5-7 presents the distribution and median for importance and success of IT governance outcomes – these are later used in section 5.1.2 to calculate the companies’ IT governance performance index.

129
Table 5-7 Importance and success of IT governance outcomes
1 2 3 4 5 High MedianImportance 0.0 % 2.6 % 10.3 % 28.2 % 59.0 % 87.2 % 5Success 0.0 % 5.1 % 25.6 % 53.8 % 15.4 % 69.2 % 4Importance 2.6 % 0.0 % 12.8 % 46.2 % 38.5 % 84.6 % 4Success 0.0 % 12.8 % 35.9 % 33.3 % 17.9 % 51.3 % 4Importance 0.0 % 2.6 % 25.6 % 43.6 % 28.2 % 71.8 % 4Success 2.6 % 15.4 % 53.8 % 28.2 % 0.0 % 28.2 % 3Importance 2.6 % 5.1 % 23.1 % 25.6 % 43.6 % 69.2 % 4Success 0.0 % 15.4 % 28.2 % 43.6 % 12.8 % 56.4 % 4
Importance: scale 1 (not important) to 5 (very important), High= 4 to 5
Success: scale 1 (not successful) to 5 (very successful), High= 4 to 5
Effective use of IT for company’s growth
Effective use of IT for asset utilizationEffective use of IT for business flexibility
Cost-effective use of IT
Almost all companies (87.2%) consider cost-effective use of IT very important; it is also the outcome where the companies succeed best. Almost as important is effective use of IT for asset utilization. However, in this outcome the success is not as high. Effective use of IT for company’s growth is important for majority of the companies. IT governance succeeds to produce this outcome about as well as for effective use of IT for asset utilization. However, effective use of IT for business flexibility seems to be challenging for most of the companies. Although considered important, it has the lowest median success, significantly lower share of the companies belonging to the two highest categories (28.2%), and not a single company considered itself “very successful” in this respect.
The success of IT projects is presented in Table 5-8. Most IT projects deliver the features and functions initially specified. However, the survey suggests that this may be accomplished at the cost of completing projects on budgets and on schedules. Many companies have difficulties in assessing how well IT projects deliver the benefits and value expected. This is reflected in almost half of the companies taking a neutral position.
Table 5-8 IT project success
1 2 3 4 5 High MedianImplemented with all features and functions initially specified 2.6 % 10.3 % 15.4 % 66.7 % 5.1 % 71.8 % 4Completed on budget 2.6 % 20.5 % 35.9 % 38.5 % 2.6 % 41.0 % 3Delivering the benefits and value expected 2.6 % 7.7 % 48.7 % 41.0 % 0.0 % 41.0 % 3Completed on time 5.1 % 20.5 % 35.9 % 33.3 % 5.1 % 38.5 % 3
4-7 8-10 11-13 14-16 17-20 High MedianAggregated IT project success 2.6 % 10.3 % 33.3 % 46.2 % 7.7 % 53.8 % 14Scale: 1 (not successfull) to 5 (very successfull), High = 4 to 5 (14 to 20, aggregated)

130
The median aggregated IT project success is fourteen out of twenty, which is slightly lower than the median aggregated success of SOA projects (15 out of 20). One should note, that the responses given for IT project success are already “filtered” because they describe the average IT project success in the companies. This explains the strong central tendency of the data. Most companies probably have examples of both extremes of IT project success, that is, examples of failed and very successful projects.
The top 50 companies use various mechanisms, such as IT performance measurement, Service Level Agreements and IT investment management practises to ensure IT value generation. Table 5-9 presents n, the number of companies using these mechanisms, distribution, median and high percentage of how effective the companies perceive they are in using these mechanisms.
Table 5-9 Effectiveness of IT value generation mechanism usage
n 1 2 3 4 5 High 2 MedianEffective use of Service Level Agreements (SLAs) 36 0,0 % 13,9 % 19,4 % 52,8 % 13,9 % 66,7 % 4Effective procudure for EA compliance checking 35 0,0 % 14,3 % 28,6 % 42,9 % 14,3 % 57,1 % 4Effective procedure for business case evaluation 38 2,6 % 15,8 % 26,3 % 42,1 % 13,2 % 55,3 % 4Effective IT portfolio approach 33 3,0 % 9,1 % 36,4 % 45,5 % 6,1 % 51,5 % 4Effective use of IT performance measurement 33 0,0 % 18,2 % 39,4 % 42,4 % 0,0 % 42,4 % 3Effective procedure for post-implementation reviews 32 12,5 % 37,5 % 31,3 % 18,8 % 0,0 % 18,8 % 3
0-10 11-15 16-20 21-25 26-30 High 2
Aggregated IT value generation capabilities 1 39 7,7 % 15,4 % 46,2 % 30,8 % 0,0 % 30,8 % 191) "Not used" coded as 0 2) High = 4 to 5 (21 to 30, aggregated)
All value generation mechanisms surveyed are widely used; the least used mechanism is post-implementation review (PIR), which is used by 32 companies (82.1%). Two-thirds (66.7%) of the companies are using SLAs effectively. More than fifty percent of the companies consider their use of business cases, EA compliance checking and IT portfolio approach effective. According to the survey, majority of the companies could improve their IT performance measurement; only 42.4% of the companies find its use even somewhat effective. While more than eighty percent of the companies use post-implementation reviews, only 18.8% find it effective and fifty percent of the companies find their use of PIRs ineffective.
According to the aggregated IT value generation capabilities measure the companies surveyed are not using these mechanisms very effectively. Most companies (46%) reside at the medium level category, and no companies reside at the highest category level.

131
The survey assessed a company’s enterprise alignment capabilities at strategic, operational and architectural levels. Almost all companies (87.2%) consider that their IT strategy is aligned with their business strategy (Table 5-10). About two thirds of the companies have appropriate IT governance structures and mechanisms that succeed in facilitating their IT strategy implementation. At the operational level, majority of the companies (59.0%) find their IT systems and services aligned with the needs and requirements of their business processes and operating model. EA alignment at enterprise and business unit and function levels has the same median value (4 out of 5) as other alignment characteristics. However, its distribution is more varied. The fact that some of the companies only have a single business unit explains the relatively high share of the companies at the highest category – for them, EA alignment is easier to achieve.
Table 5-10 Enterprise alignment capabilities
1 2 3 4 5 High 2 MedianIT strategy alignment with business strategy 0.0 % 2.6 % 10.3 % 51.3 % 35.9 % 87.2 % 4
Appropriate IT governance structures and mechanisms facilitating the implementation of IT strategy 0.0 % 5.1 % 30.8 % 53.8 % 10.3 % 64.1 % 4Operational alignment of IT systems and services 2.6 % 5.1 % 33.3 % 51.3 % 7.7 % 59.0 % 4EA aligned at enterprise, business unit and function levels 5.7 % 11.4 % 28.6 % 28.6 % 25.7 % 54.3 % 4
4-7 8-10 11-13 14-16 17-20 High 2
Aggregated enterprise alignment 1 0.0 % 7.7 % 17.9 % 51.3 % 23.1 % 74.4 % 151) "n" coded as 02) High = 4 to 5 (14 to 20, aggregated)
According to the survey, the companies have much higher aggregated enterprise alignment capabilities measure as compared to the previously presented aggregated IT value generation capabilities. In terms of percentage of the companies belonging to the top-half, the difference is 43.6% (74.4% against 30.8% of the companies). No companies reside at the lowest category level of aggregated enterprise alignment, and 23.1% of the companies have very high aggregated enterprise alignment capabilities.
Almost all companies (87.2%) have high awareness of IT’s impact on business continuity (Table 5-11). A majority of the companies (59.0%) think they have appropriate management of current risk levels. The IT control framework’s effectiveness is the lowest of the assessed IT-related risk mitigation capabilities; this is also indicated by the lowest mean value. The survey data shows that most companies have high aggregated IT-related risk mitigation capabilities.

132
Table 5-11 IT-related risk mitigation capabilities
1 2 3 4 5 High 1 MedianHigh awareness of IT's impact on business continuity 0.0 % 2.6 % 10.3 % 41.0 % 46.2 % 87.2 % 4Appropriate management of current risk levels 0.0 % 17.9 % 23.1 % 43.6 % 15.4 % 59.0 % 4Effective IT control framework 5.1 % 10.3 % 35.9 % 35.9 % 12.8 % 48.7 % 3
3-4 5-7 8-10 11-13 14-15 High 1
Aggregated IT-related risk mitigation 0.0 % 2.6 % 28.2 % 53.8 % 15.4 % 69.2 % 121) High = 4 to 5 (11 to 15, aggregated)
Table 5-12 presents the capabilities for business agility and enterprise flexibility in the companies surveyed.
Table 5-12 Business agility and enterprise flexibility
1 2 3 4 5 High 1 MedianCapacity to follow technology trends to enable IT-driven strategic business change 0.0 % 7.7 % 23.1 % 56.4 % 12.8 % 69.2 % 4IT services enable effective information and knowledge use 2.6 % 12.8 % 38.5 % 35.9 % 10.3 % 46.2 % 3Ability to have taken advantage of IT’s enabling capacity for new business models 5.1 % 17.9 % 38.5 % 35.9 % 2.6 % 38.5 % 3Agility to response to new and changing requirements from the business environment 2.6 % 20.5 % 48.7 % 25.6 % 2.6 % 28.2 % 3
4-7 8-10 11-13 14-16 17-20 High 1
Aggregated business agility and enterprise flexibility 2.6 % 5.1 % 46.2 % 38.5 % 7.7 % 46.2 % 131) High = 4 to 5 (14 to 20, aggregated)
Over two thirds of the companies (69.2%) agree to have a sufficient capacity to follow technology trends to enable IT-driven business change. In other aspects of agility and flexibility, the companies are not succeeding as well. Surprisingly, less than half of the companies agree to that their IT services enable effective information and knowledge use. According to the interviews, many companies gather large amounts of data and information. Yet they are not capable enough to present it in a way that would support its effective use. In addition, the companies are not very good in having the ability to take advantage of IT’s enabling capacity for new business models, only 38.5% of the companies agree with this statement. In addition, they have even lower capabilities of having the agility to respond to new and changing requirements from the business environment - only 28.2% agree to that

133
statement. Most companies (46.2%) have medium level capabilities of aggregated business agility and enterprise flexibility.
In addition to various IT governance mechanisms, the companies need organizational capabilities and learning abilities to create value from IT. Two thirds of the companies (64.1%) have succeeded in creating constructive relationships between business and IT and with external partners (Table 5-13). Most companies (53.8%) are quite satisfied with the engagement of senior management and board. However, less than half of the companies (46.2%) think they have widespread understanding and participation in IT governance at all levels of organization.
Table 5-13 Organizational IT capabilities and learning
1 2 3 4 5 High 1Median
Constructive relationships and effective communication between business and IT 0.0 % 2.6 % 33.3 % 53.8 % 10.3 % 64.1 % 4Engagement of senior management and board 5.1 % 17.9 % 23.1 % 43.6 % 10.3 % 53.8 % 4Widespread understanding and participation in IT governance at all levels of organization 0.0 % 15.4 % 38.5 % 38.5 % 7.7 % 46.2 % 3Ability to learn from implementations to make better and faster IT-related decisions 2.6 % 20.5 % 38.5 % 35.9 % 2.6 % 38.5 % 3Successful in implementing the required organizational changes 5.1 % 20.5 % 46.2 % 28.2 % 0.0 % 28.2 % 3
5-8 9-12 13-17 18-21 22-25 High 1
Aggregated organizational IT capabilities and learning 0.0 % 10.3 % 53.8 % 35.9 % 0.0 % 35.9 % 171) High = 4 to 5 (18 to 25, aggregated)
Only 38.5% of the companies agree to have the ability to learn from implementations to make better and faster IT-related decisions. The weakest attribute of organizational IT capabilities is the successful implementation of the organizational changes required to achieve the intended benefits from the IT investments. Although change management is often emphasized, no company considers itself highly successful in this respect and only 28.2% agree with being somewhat successful. Most companies (53.8%) have medium level aggregated organizational IT capabilities and abilities, thus no companies are clearly weak or very successful in this respect.
Figure 5-2 presents the companies’ aggregated IT governance capabilities (as percentage of companies belonging to the high category).

134
74.4 %
69.2 %
53.8 %
46.2 %
35.9 %
30.8 %
0.0 % 20.0 % 40.0 % 60.0 % 80.0 %
Enterprise alignment capabilities
IT related risk mitigation capabilities
IT project success
Business agility and enterprise f lexibility
Organizational IT capabilities and learning
IT value generation mechanism usage
Figure 5-2 Aggregated IT governance capabilities
According to the survey, most of the companies have high enterprise alignment capabilities and IT-related risk mitigation capabilities. The companies’ capabilities for business agility and enterprise flexibility and success of IT projects are average. However, the latter of these is based on average project success in the companies surveyed, which may explain the average value. Organizational IT capabilities and learning and the effective use of IT value generation mechanisms clearly are not the strengths of the companies surveyed; only one-third of the companies have high capabilities for these.
5.1.3 Enterprise architecture maturity
A key driver in any company’s operating model is its business strategy. Almost all responders (87.2%) view that their company has a clearly articulated business strategy driving their IT (Table 5-14). Also, IT’s role in executing the company's operating model and business strategy is clarified by the senior management in most companies (74.4%). A minority of the companies (41.0%) agreed to that they have a clearly articulated operating model driving IT use.

135
Table 5-14 Operation model clarity
n 1 2 3 4 5 High 2Median
Clearly articulated business strategy that drives IT 39 0.0 % 7.7 % 5.1 % 43.6 % 43.6 % 87.2 % 4IT's role in executing company's operating model and business strategy clarified 38 5.1 % 10.3 % 7.7 % 53.8 % 20.5 % 74.4 % 4Clearly articulated operating model driving IT use 39 0.0 % 10.3 % 48.7 % 25.6 % 15.4 % 41.0 % 3
3-4 5-7 8-10 11-13 14-15 High 2
Aggregated operating model clarity 1 39 0.0 % 5.1 % 30.8 % 46.2 % 17.9 % 64.1 % 111) "not used" coded as 02) High = 4 to 5 (11 to 15, aggregated)
The aggregated operating model clarity measure reflects how well the executive management has stated the goals for business and IT, and the means to achieve them. According to the survey, this measure is high for two thirds of the companies (64.1%); only five percent of the companies disagree with having such a clarified operating model.
SOA adoption and rejection rates in relation to a company’s operating model (according to Ross et al 2006) are presented in Figure 5-3.
Business Process Standardization Requirement
Bus
ines
s P
roce
ssIn
tegr
atio
nR
equi
rem
ent
CoordinationCoordination UnificationUnification
DiversificationDiversification ReplicationReplication
Low
Hig
h
Low High
1 0 105
1015202530
SOAadopt ed
SOA notadopt ed
All
1 2 3
05
1015202530
SOAadopt ed
SOA notadopt ed
All
2 3 5
05
1015202530
SOAadopt ed
SOA notadopt ed
All
2010
30
05
1015202530
SOAadopt ed
SOA notadopt ed
All
Figure 5-3 Operating models and SOA adoption

136
Ross, Weill and Robertson (2006) define a company’s operating model in terms of its business process standardization and integration needs (see section 3.5.4). The most common operating model found among the companies surveyed is unification. Thirty companies (76.9%) have high requirements for both business process standardization and integration and are using the unification model. The rate of SOA adoption among the companies using the unification model is 66.7%, which is somewhat higher than the overall SOA adoption rate (61.5%). Five companies (12.8%) have high business process integration needs but low business process standardization needs, thus they apply the coordination model. Two of these companies (40.0%) have adopted SOA. In the replication model, a company has high needs for business process standardization but no special needs for business process integration. Three companies apply this model and one of them (33.3%) has adopted SOA. A company operating with the diversification model has low requirements for both business process standardization and integration. Only one company was applying diversification as its operating model; it had not adopted SOA.
Figure 5-4 presents enterprise architecture (EA) adoption rate among the companies surveyed. Twenty companies have adopted enterprise architecture approach, thus EA adoption rate is 51.3 percent. EA is not as widely adopted as IT governance; all but one company had adopted IT governance, yet, only half of the companies have adopted EA.
EA not adopted, 48.7 %
EA adopted, 51.3 %
Figure 5-4 Enterprise architecture adoption
Table 5-15 presents the adoption years and rates for enterprise architecture. Although EA is gaining wider acceptance, most adoptions are quite recent. Only six companies (15.4%) had adopted enterprise architecture before 2005 (Table 5-15). IT governance adoption achieved the current EA adoption rate of fifty percent in 2003; at the time, only four companies (10.3%) had adopted EA.

137
Table 5-15 Year of EA adoption
Count (n=20)
% of EA adopters
Cumulative % of EA adopters
Cumulative % of all companies (n=39)
Before 2003 3 15.0 % 15.0 % 7.7 %2003 1 5.0 % 20.0 % 10.3 %2004 2 10.0 % 30.0 % 15.4 %2005 8 40.0 % 70.0 % 35.9 %2006 4 20.0 % 90.0 % 46.2 %2007 2 10.0 % 100.0 % 51.3 %
The enterprise architecture stage of the companies studied (see section 3.5.4) was determined by asking the two most important architecture development focus areas, that is, the areas they are most actively developing. Figure 5-5 presents the companies’ primary EA development focus area, which also used to determine their current enterprise architecture stage.
30.8 %28.2 %25.6 %
7.7 %7.7 %
0.0 %
5.0 %
10.0 %
15.0 %
20.0 %
25.0 %
30.0 %
35.0 %
1 Business silo 2 Standardizedtechnology
3 Optimized core 4 Businessmodularity
5 Dynamicventuring
Figure 5-5 The primary EA development focus area representing the current EA stage
Three companies (7.7%) selected a description of Business silo as their primary EA development focus area. They focus on the needs of our business units and functions. Eleven companies (28.2%) are at the Standardized technology stage; they focus on making IT an enterprise-wide asset by creating standardized IT infrastructure and shared services. The most common EA stage was Optimized core; twelve companies (30.8%) are focusing on creating enterprise-wide standard business processes and sharing of data and information. Ten companies are at the Business modularity stage; they focus on creating reusable application and business process components. The primary EA development focus area described in the questionnaire as “Our focus is in merging of our partner network's

138
processes to our own processes using standardized interfaces to create ROI with dynamic venturing”, was selected by three companies (7.7%). This describes the highest EA maturity stage Dynamic venturing.
The distribution of the companies’ EA maturity stage is normally distributed. Three most common primary architecture stages: standardized technology, optimized core and business modularity cover 84% of the companies.
Most companies are actively developing their enterprise architecture also in other areas than their current EA stage (primary development area). Only three companies stated that they do not have a secondary EA development area. Figure 5-6 presents the distribution of secondary EA development at different EA maturity stages.
0
2
4
6
8
10
12
14
1 Business silo 2 Standardizedtechnology
3 Optimized core 4 Businessmodularity
5 Dynamicventuring
Current EA stage
1 Business silo 2 Standardized technology 3 Optimized core
4 Business modularity 5 Dynamic venturing 6 None
Figure 5-6 Secondary EA development focus across EA maturity stages
Making IT an enterprise-wide asset, that is, creating a standardized IT infrastructure and shared services (standardized technology) is an important focus area for most companies. Eleven companies have standardized technology as their primary development focus area and fourteen companies state it as their secondary EA development area. Thus, twenty-five companies (64.1%) state it as an important EA development area. Creation of enterprise-wide standard business processes and sharing of data and information (optimized core) is the second most important development area; twenty companies (51.3%) state it as their primary or secondary EA development focus area. Business modularity - creation of reusable application and business process components – is an important development focus area for fifteen companies (38.4%). Twelve companies (30.8%) try to achieve merging of

139
partner network’s processes to their processes (dynamic venturing), and four companies (10.3%) focus on the needs of their business units and functions (business silo).
Table 5-16 presents the importance of enterprise architecture domains. According to the survey, information architecture is the most important EA domain. Application and business architectures are considered almost equally important as information architecture. Technology architecture is regarded less important. Interestingly, none of the companies regard application architecture as not important, while application and business architectures are not seen important by six - not necessarily the same - companies (15.4%).
Table 5-16 Importance of enterprise architecture domains
1 2 3 4 5 High MedianInformation architecture 0.0 % 5.1 % 25.6 % 43.6 % 25.6 % 69.2 % 4Application architecture 0.0 % 0.0 % 33.3 % 35.9 % 30.8 % 66.7 % 4Business architecture 2.6 % 12.8 % 23.1 % 30.8 % 30.8 % 61.5 % 4Technology architecture 2.6 % 12.8 % 38.5 % 33.3 % 12.8 % 46.2 % 3Scale from 1 (not important) to 5 (very important), High = 4 to 5
The maturity of enterprise architecture was assessed in two OMB EAAF capability areas (see section 3.5.4): completion and results. Table 5-17 presents the EA completion maturity of the companies surveyed. EA completion maturity is an assessment of the maturity of organization’s EA and EA products. The overall EA completion maturity is the minimum maturity level of any domain for a single company; to comply with a certain EA completion maturity level, each domain must comply with the requirements of that level. The following paragraphs describe the requirements for each EA completion maturity level and EA domain according to the questions in the questionnaire, which are based on the OMB EAAF (OBM 2005).
Table 5-17 Enterprise architecture completion maturity
0 1 2 3 4 5 High 1 MedianTechnology architecture 0.0 % 23.1 % 17.9 % 25.6 % 28.2 % 5.1 % 59.0 % 3Application architecture 2.6 % 15.4 % 25.6 % 23.1 % 25.6 % 7.7 % 56.4 % 3Transition strategy 10.3 % 12.8 % 28.2 % 23.1 % 25.6 % 0.0 % 48.7 % 2Information architecture 2.6 % 25.6 % 33.3 % 28.2 % 10.3 % 0.0 % 38.5 % 2Business architecture 0.0 % 15.4 % 48.7 % 17.9 % 15.4 % 2.6 % 35.9 % 2
Overall EA completition maturity level 15.4 % 35.9 % 33.3 % 12.8 % 3.0 % 0.0 % 15.8 % 11) High = 3 to 5

140
Technology architecture is the most mature EA domain, 59.0% of the companies have achieved level three or higher (definition of high percentage for EA completion maturity) and level three is median maturity level. No companies reside at level 0. At level 1 (23.1% of the companies), the company has identified its technology products base and defined standards for its current technology products. At level 2 (17.9% of the companies), interoperability standards for business units and functions have been added, and current technology products are linked to other EA domains i.e. to business processes, key information, applications and security processes. At level 3, (25.6% of the companies), the company defines its target technology products base and links it to other EA domains. At level 4, (28.2% of the companies), target technology products base is included in transformation strategy and drives IT decision-making. In addition, standardization and the reuse of technology components are enforced. At level 5, (5.1% of the companies), target technology architecture is regularly updated, and standardization and reuse is monitored and measured. In addition, a well-defined process for insertion of new technologies exists.
The completion maturity of application architecture is almost as high as that of technology architecture, it has the same median maturity level (level 3), and 56.4% of the companies have achieved level three or higher. One company (2.6% of the companies) was at the initial level 0. At level 1 (15.4% of the companies), a company has a comprehensive documented inventory of its current applications. At level 2 (25.6% of the companies), the company has linked its current applications to other EA domains. At level 3 (23.1% of the companies), target applications have been defined and linked to other EA domains. At level 4 (25.6% of the companies), target application architecture is included in transition strategy and drives transition planning and IT investment decision-making. In addition, standardization and the reuse of applications are enforced. At level 5 (7.7% of the companies), target application architecture is regularly updated, and standardization and reuse are monitored and measured.
Transition strategy is the next highest in EA completion maturity, yet 10.3% of the companies do not have a road map for the target state of enterprise architecture and reside at maturity level 0. At level 1 (12.8% of the companies), companies have appropriate processes of conducting a gap analysis and an alternatives analysis, and the management of IT projects. Level 2 (28.2% of the companies) is the most common level of transition strategy maturity. At level two, a company has performed a redundancy and gap analysis, and identified opportunities for consolidation and reuse, and the gaps between "as-is" and "to-be" architectures. At level 3 (23.1% of the companies), a company has defined programs and projects to implement a documented sequencing plan that describes the enterprise transition stages. At level 4 (25.6% of the companies), there is a clear linkage between the programs and projects in transition strategy and the company’s IT investment portfolio. At level 5, a company would use measurement to ensure its progress to target enterprise architecture; however, none of the companies has achieved this stage. Median maturity for transition

141
strategy is level two, and more than half of the companies (51.3% of the companies) reside at the lower half of maturity levels, thus completion maturity of transition strategy is at a lower level than technology and application architectures.
Business and information architectures are the two least mature EA domains in completion. Median maturity level for both is two and less than forty percent of the companies have reached maturity level three or higher (Table 5-16).
One company (2.6% of the companies) resides at the lowest information architecture completion level 0. At level 1 (25.6% of the companies), a company has identified and documented its key data and information. At level 2 (33.3% of the companies), a company has also identified and documented data exchange packages, data suppliers and consumers. At level 3 (28.2% of the companies), a company has defined a high-level target information architecture that provides improvements for consolidation and information sharing. Only 10.3% of the companies have achieved level 4; their information architecture provides mechanisms for information dissemination and security. None of the companies has achieved level 5, where a company would have appropriate procedures for information life-cycle management and uses standards when applicable.
At business architecture completion maturity level 1 (15.4% of the companies), a company has identified and documented its business processes. All companies had done so, thus no company resides at level 0. At level 2 (48.7% of the companies), business processes are linked to other EA domains: applications, key data and IT infrastructure as well as to key business elements such as stakeholders and organizations. At level 3 (17.9% of the companies), high-level target business processes and their related linkages have been defined. At level 4 (15.4% of the companies), a company has defined a road map describing the transformation from current to target business architecture. One company (2.6% of the companies) has achieved maturity level 5 and has its business architecture regularly monitored, measured and updated.
The overall EA completion maturity is low (Table 5-17, Figure 5-7). More than half of the companies (51.3%) are at the two lowest maturity levels. Only 15.8 percent of companies are in the top-half, that is, have achieved maturity level three or higher.

142
15.8 %
0.0 %3.0 %12.8 %
33.3 %35.9 %
15.4 %
0 %10 %20 %30 %40 %50 %60 %
0 1 2 3 4 5 High
Maturity level
Figure 5-7 Overall EA completion maturity
The other EA maturity capability area assessed was EA results maturity. Table 5-18 presents the EA results maturity of the companies surveyed. EA results maturity assesses EA’s effectiveness and value; how and what results EA achieves (see section 3.5.4). The overall EA results maturity is the minimum maturity level of any domain for a single company; to comply with a certain EA results maturity level, each domain must comply with the requirements of that level. The following describes the requirements for each EA results maturity level and EA domain according to the questions in the questionnaire, which are based on the OMB EAAF (OBM 2005).
Table 5-18 Enterprise architecture results maturity
0 1 2 3 4 5 High 1 MedianEA management's business-driveness 0.0 % 12.8 % 53.8 % 23.1 % 2.6 % 7.7 % 33.3 % 2Abilities for sharing and reuse 2.6 % 28.2 % 35.9 % 10.3 % 17.9 % 5.1 % 33.3 % 2IT implementation improvement as result of EA efforts 0.0 % 30.8 % 43.6 % 25.6 % 0.0 % 0.0 % 25.6 % 2Evaluation of business improvement as result of EA efforts 38.5 % 23.1 % 15.4 % 20.5 % 2.6 % 0.0 % 23.1 % 1Overall EA results maturity level 38.5 % 30.8 % 20.5 % 10.3 % 0.0 % 0.0 % 10.3 % 11) High = 3 to 5
No companies reside at level 0 of EA management’s business-driveness. At maturity level 1 (12.8% of the companies), EA development is informal, processes ensuring a business-driven EA are incomplete and inconsistent across business units. More than half (53.8%) of the companies reside at level 2, implying that they have identified business owners and key

143
stakeholders for each architecture and business domain. At level 3 (23.1% of the companies), the companies have also identified and documented business requirements for each architecture and business domain. At level 4 (2.6% of the companies), these requirements and needs are used to guide the development of EA artefacts and processes. At the highest maturity level, level 5, business improvement opportunities are continuously identified and progress towards meeting the needs is demonstrated. Three companies (7.7%) identified this as their EA business-driveness maturity level.
One company (2.6% of the companies) resides at the maturity level 0 of abilities for sharing and reuse. Thus, for it reuse is an ad hoc process at the implementation of IT project level. At level 1 (28.2% of the companies), reuse is an informal process at the business unit and function level. At the most common maturity level (35.9% of the companies), level 2, reuse is promoted and a catalogue of current assets is made available for all stakeholders. At level 3, an appropriate procedure for ensuring proper reuse and sharing, and a tool for measurement exist. Four companies (10.3%) reside at this level. At level 4 (17.9% of the companies), cost savings are demonstrated by reuse of components. At level 5 (5.1% of the companies), enterprise-wide reuse savings occur consistently and can include systems and technologies.
At the maturity level 0 for evaluation of business improvement as result of EA efforts, the companies have not evaluated the improvement of their business processes and services because of their EA efforts. This is the most common maturity level, as 38.5% of the companies reside at this level. At level 1 (23.1% of the companies), the companies have identified their key EA stakeholders and have conducted a satisfaction survey or a needs assessment for improving services. At level 2 (15.4% of the companies), the companies have identified measures and responsibilities for measuring improvements at each business domain. At level 3 (20.5% of the companies), these measures are used to track improvements. Only one company resides at level 4 and measures its EA’s effectiveness against the business process and service improvement criteria. At level 5, a company would optimize its use of stakeholder, customer and users business needs to inform decision-making and resource allocation. No companies reside at this level.
At the maturity level 0 for IT implementation improvement as result of EA efforts, a company does not use a formal procedure for making decisions and managing IT investments. No companies reside at this level. At level 1 (30.8% of the companies), a formal IT investment management procedure is used, but it is not related to enterprise architecture. At level 2, EA is integrated in IT investment decision-making and management. This is the most common maturity level as 43.6% of the companies reside at this level. At level 3 (25.6% of the companies), EA is used to drive IT investments and IT systems life cycle management. The definitions for the two highest levels show the OMB

144
EAAF’s orientation towards service-oriented architecture. At level 4, a company would have a documented plan for evolving service-oriented architectures to various business segments, and at the highest level, level 5, it would have implemented service-oriented architectures and realized its benefits. No companies reside at the two highest maturity levels.
30.8 %
20.5 %
10.3 %
0.0 % 0.0 %
10.3 %
38.5 %
0 %
10 %
20 %
30 %
40 %
50 %
60 %
0 1 2 3 4 5 High
Figure 5-8 Overall EA results maturity
The overall EA results maturity is low. Almost all companies (89.7%) reside at the three lowest maturity levels, and only four companies (10.3%) have achieved the top-half, the three highest maturity levels.
The companies’ aggregated EA maturity characteristics (as percentage of companies belonging to the high category) are presented in Figure 5-9.
64.1 %
51.3 %
15.8 %
10.3 %
33.0 %
0.0 % 20.0 % 40.0 % 60.0 % 80.0 %
Operating model clarity (4 to 5)
EA approach adopted
Current EA stage (4 to 5)
Overall EA completition maturity (3 to 5)
Overall EA results maturity (3 to 5)
Figure 5-9 Aggregated EA maturity characteristics

145
According to the survey, two-thirds of the companies have high operating model clarity. Half of the companies have adopted EA approach. About half of the companies have achieved the three highest maturity levels of overall EA completion maturity. Only about one third of the companies are residing at the two highest EA stages and at the three highest EA results maturity levels.
5.1.4 Perceived SOA characteristics
The responders’ opinions of the perceived relative advantages of SOA are presented in Table 5-19. Two thirds of the companies agree that SOA promotes standardization and commoditization of IT infrastructure and that SOA improves and integrates business processes. Most companies (59.0%) also agree that SOA makes more efficient use of current IT assets by allowing them to be SOA-enabled.
Table 5-19 Perceived relative advantage of SOA
No opinion 1 2 3 4 5 High 2 Median
Improves and integrates business processes 7.7 % 0.0 % 15.4 % 10.3 % 30.8 % 35.9 % 66.7 % 4Promotes standardization and commoditization of IT infrastructure 7.7 % 2.6 % 2.6 % 20.5 % 43.6 % 23.1 % 66.7 % 4
Leverage current IT assets by SOA-enablement 2.6 % 2.6 % 7.7 % 28.2 % 43.6 % 15.4 % 59.0 % 4Improves data and information life cycle management 7.7 % 2.6 % 15.4 % 25.6 % 33.3 % 15.4 % 48.7 % 4Shortens IT system development cycles 7.7 % 5.1 % 10.3 % 28.2 % 33.3 % 15.4 % 48.7 % 4Improves business by creating partner process networks 7.7 % 0.0 % 15.4 % 30.8 % 41.0 % 5.1 % 46.2 % 4Reduces products time to market 10.3 % 2.6 % 28.2 % 15.4 % 33.3 % 10.3 % 43.6 % 3Important tool to execute company's strategy 7.7 % 5.1 % 20.5 % 38.5 % 20.5 % 7.7 % 28.2 % 3Mandated in order to take part in our partners' process networks 10.3 % 7.7 % 33.3 % 23.1 % 17.9 % 7.7 % 25.6 % 3
0-9 9-18 19-27 28-36 37-45 High 2
5.1 % 7.7 % 30.8 % 48.7 % 7.7 % 56.4 % 29Aggregated relative SOA advantage 1
1) No opinion coded as 02) High = 4 to 5 (28 to 45, aggregated)

146
About half of the companies (48.7%) responded that SOA improves their data and information life cycle management and that SOA shortens IT system development cycles. However, many responders added that this would probably happen only at a later stage of SOA adoption. The same opinion applies to the statement that SOA improves business by creating partner process networks, which the respondents do not regard as one of the early benefits expected from SOA. Currently, SOA seems not to be an important tool in the execution of company’s strategy as only 28.2% of the companies agrees to such a statement. Likewise, only 25.6% of the companies see adopting SOA as mandated to take part in their partner’s process networks.
Most companies (56.4%) agree that SOA adoption has relative advantages (Table 5-19). The median aggregated relative advantage of SOA measure is 29 out of 45. Only three companies (7.7 %%) see high relative advantages attached to SOA, and currently five companies (12.8%) do not see advantages in adopting SOA.
Table 5-20 presents the additional SOA benefits that were mentioned by the respondents. As one of the key long-term benefits of SOA was mentioned that standards-based development enables the co-operation of information systems from different vendors - both inside a company as well as between the companies. Standards also make the development of COTS (commercial, off-the-shelf) software more controllable and the end products will be more compatible with each other. This enables the creation of interconnected, co-operating software ecosystems from different vendors such as IBM, Microsoft, Oracle and SAP. At the same time, this will decrease the complexity of IT. Service autonomy promotes better reliability; the implementation of a service can be changed without affecting its environment.
Table 5-20 Additional SOA benefits
Benefit CountBetter support for reuse at all levels 2Better engagement of user to IS development 1Global transparency, visibility and usability of data 1Standards based development makes it easier to use multiple IS providers 1Software vendorsare have better control for development of their products 1Enables creation, evolution and co-operation of different ecosystems (systems from different vendors) 1Decreasing IT complexity 1Better reliability achieved by having the ability to limit the scope that needs to be changed 1

147
The companies’ opinions of the perceived compatibility of SOA is presented in Table 5-21.
Table 5-21 Perceived compatibility of SOA
No opinion 1 2 3 4 5 High 2 Median
Current IT infrastructure supports SOA adoption well 2.6 % 2.6 % 2.6 % 30.8 % 53.8 % 7.7 % 61.5 % 4Current IT funding mechanisms fit well with adopting SOA 7.7 % 2.6 % 12.8 % 15.4 % 48.7 % 12.8 % 61.5 % 4SOA fits well to current business and IT needs 7.7 % 0.0 % 10.3 % 33.3 % 41.0 % 7.7 % 48.7 % 4current way of managing business and business processes 7.7 % 5.1 % 20.5 % 20.5 % 46.2 % 0.0 % 46.2 % 4SOA skills can easily be included in our current IT skillset 7.7 % 2.6 % 20.5 % 30.8 % 33.3 % 5.1 % 38.5 % 3Current applications can be SOA enabled 5.1 % 5.1 % 23.1 % 33.3 % 30.8 % 2.6 % 33.3 % 3Security policies and architecture can easily be adapted to include SOA 12.8 % 2.6 % 12.8 % 38.5 % 28.2 % 5.1 % 33.3 % 3SOA skills can easily be included in our current business skillset 12.8 % 10.3 % 35.9 % 25.6 % 12.8 % 2.6 % 15.4 % 2
0-8 9-16 17-24 25-32 33-40 High 2
5.1 % 7.7 % 30.8 % 51.3 % 5.1 % 56.4 % 251) No opinion coded as 0Aggregated SOA compatibility 1
2) High = 4 to 5 (25 to 40, aggregated)
SOA is best compatible with the companies’ current IT infrastructure and current IT funding mechanisms (61.5% percent of the companies agree). About half of the companies agree that SOA is well compatible with their current business and IT needs, and that SOA fits well to their current way of managing business and business processes.
Skills and competencies clearly create barriers for SOA adoption: only 15.4% of the companies think that SOA is compatible with their current business skills and competencies, and 38.5% of the companies agree that their current IT skills and competencies are compatible with SOA. SOA is also not very compatible with current security policies and architectures (33.3% agree with compatibility). However, the security of SOA is not well known, as 12.8% of the companies had no opinion of it. Another inhibitor of SOA is that only 33.3% of the companies agree that their current applications can be SOA enabled.

148
More than half of the companies (56.4%) consider themselves compatible with SOA (Table 5-21). The median for aggregated SOA compatibility measure is 25 out of 40. However, twelve companies (30.8%) are taking a neutral position and five companies (13.1%) think they are not compatible with SOA.
Table 5-22 presents the responders’ opinions of the perceptions of SOA complexity. According to the survey, 38.5 regard SOA as complex to understand. In the interviews, most responders stated that the concept of a service - the basic idea behind SOA - is not complex to understand. Yet, some responders stated that because they see SOA mainly as a design paradigm, it makes the construct of SOA and the effects of SOA more complex to understand. Similarly, less than half (43.6%) of the responders think SOA is complex to learn; many stated that they do not see SOA as significantly more complex to learn than the innovations they have previously adopted. However, the responders see that the complexity clearly increases when SOA is to be adopted, 64.1% of responders think that SOA is complex to adopt.
Table 5-22 Perceived complexity of SOA
1 2 3 4 5 High MedianComplex to learn 0.0 % 7.7 % 53.8 % 33.3 % 5.1 % 38.5 % 4Complex to understand 0.0 % 35.9 % 20.5 % 38.5 % 5.1 % 43.6 % 3Complex to adopt 0.0 % 7.7 % 28.2 % 48.7 % 15.4 % 64.1 % 4
0-3 4-6 7-9 10-12 13-15 High
Aggregated SOA complexity 0.0 % 0.0 % 35.9 % 56.4 % 7.7 % 64.1 % 10Scale 1 (not complex) to 5 (very complex), High = 4 to 5 (10 to 15, aggregated)
For two thirds of the companies (64.1%) the aggregated SOA complexity measure is high, that is, they perceive SOA as a complex innovation.
Table 5-23 presents companies opinions of other perceived SOA characteristics. About half of the companies (51.3%) see high initial investment costs attached to SOA. SOA is perceived as relatively easy to pilot (41.0% of companies agree). The opinions of whether SOA technologies are sufficiently mature split, 28.2% of the companies agree that SOA technologies are sufficiently mature for adoption and 28.2% percent of the companies think they are not.

149
Table 5-23 Other perceived SOA characteristics
SOA characteristicNo
opinion 1 2 3 4 5 High 1 MedianHigh initial investment costs 17.9 % 0.0 % 15.4 % 15.4 % 46.2 % 5.1 % 51.3 % 4Easy to pilot 7.7 % 0.0 % 12.8 % 38.5 % 25.6 % 15.4 % 41.0 % 3SOA technologies are sufficiently mature 7.7 % 2.6 % 25.6 % 35.9 % 25.6 % 2.6 % 28.2 % 3
SOA observability characteristic
No opinion 1 2 3 4 5 High 1 Median
Adoption is clearly visible to key stake-holders and partners 23.1 % 2.6 % 30.8 % 25.6 % 17.9 % 0.0 % 17.9 % 3Adoption is clearly visible to users 23.1 % 10.3 % 28.2 % 25.6 % 12.8 % 0.0 % 12.8 % 3
0-2 3-4 5-6 7-8 9-10 High 2
Aggregated SOA observability 2 25.6 % 17.9 % 43.6 % 12.8 % 0.0 % 12.8 % 51) High = 4 to 52) "No opinion coded as 0, High = 7 to 10
According to Rogers (2003), when the benefits of adoption are clearly visible to user and other key stakeholders, the probability of adoption increases. The aggregated observability of SOA adoption measure is low, because of low visibility both to users, and to key stakeholders and partners.
A summary of perceived SOA characteristics (high percentage) is presented in Figure 5-10.
64.1 %
56.4 %
56.4 %
51.3 %
41.0 %
28.2 %
12.8 %
0.0 % 20.0 % 40.0 % 60.0 % 80.0 %
Complexity
Relative advantage
Compatibiity
Cost
Trialability
Technological maturity
Observability
Figure 5-10 Aggregated perceived SOA characteristics

150
According to the survey, about two-thirds of the companies regard SOA as complex innovation. More than half of the companies see relative advantage in SOA, are compatible with SOA, and see high costs related to SOA adoption. Less than half of the companies think that SOA is easily trialable. Only 28.2% of the companies think that technological maturity of SOA is sufficient, and 12.8% think that adopting SOA is observable for the key stakeholders of IT.
5.1.5 Perceived organizational characteristics
Table 5-24 presents the respondents’ opinions of their organization’s Access to knowledge required for SOA adoption, and Industry related pressures for SOA adoption. Less than half of the companies think that they have access to sufficient knowledge and support for adoption. Pressures created by company’s industry are two-folded: for one-third (33.3%) of the companies, industry is creating pressures for SOA adoption, but for 38.5% of the companies it is not.
Table 5-24 Perceived organizational characterises related to SOA
No opinion 1 2 3 4 5 High 1 Median
Access to knowledge and support for adoption 10.3 % 0.0 % 23.1 % 25.6 % 35.9 % 5.1 % 41.0 % 3Industry creates pressures for adoption 12.8 % 10.3 % 28.2 % 15.4 % 25.6 % 7.7 % 33.3 % 31) "No opinion coded as 0, High = 4 to 5
The characteristics of the absorptive capacity for the companies that participated in the survey are presented in Table 5-25. Almost all companies (79.5%) are continuously seeking new tools and approaches to adopt. Most companies (64.1%) have a positive attitude to change and 61.5% of the companies consider themselves successful in selecting the right tools and approaches to adopt. However, only one-third (33.3%) of the companies agree that they are successful in adopting them. Similarly, only 25.6% of the companies agree that after the adoption they assess improvements as the result of the adoption. However, many companies consider themselves neither “successful” nor “not successful” in these two respects, which imply that the aggregated absorptive capacity measure is high for 71.8% of the companies.

151
Table 5-25 Organization’s absorptive capacity
No opinion 1 2 3 4 5 High 1 Median
Continous seeking of new tools and approaches 0.0 % 0.0 % 5.1 % 15.4 % 56.4 % 23.1 % 79.5 % 4Positive attitude to change 0.0 % 2.6 % 2.6 % 30.8 % 48.7 % 15.4 % 64.1 % 4
Success in selecting the right tools and approaches 0.0 % 2.6 % 5.1 % 30.8 % 59.0 % 2.6 % 61.5 % 4Success in adopting new tools and approaches 0.0 % 5.1 % 12.8 % 48.7 % 30.8 % 2.6 % 33.3 % 3Assessment of improvements as a result of adoption 5.1 % 7.7 % 17.9 % 43.6 % 25.6 % 0.0 % 25.6 % 3
0-5 6-10 11-15 16-20 21-25 High 2
0.0 % 0.0 % 28.2 % 64.1 % 7.7 % 71.8 % 17Aggregated absorptive capacity 2
2) No opinion coded as 0, High = 16 to 251) High = 4 to 5
This chapter presented the results of the survey following the structure of the questionnaire. The next chapter presents an analysis of the adoptions of IT governance, EA and SOA, and the differences in characteristics between SOA adopters and non-SOA adopters.
5.2. Analysis of the survey results
5.2.1 Adoptions of SOA, IT governance and EA
Figure 5-11 presents the current SOA diffusion stage according to the survey - the overall adoption stage and the five stages of Rogers’ model (see section 3.6.2).
7
5
3
5
7
12
0
2
4
6
8
10
12
14
Knowledge Persuation Decision Decision Implementation Confirmation
Not adopted Adopted
Figure 5-11 Service-oriented architecture’s diffusion stage in large Finnish companies

152
Fifteen companies had not adopted SOA; twelve of these were either gathering more knowledge of SOA in the knowledge stage or deciding on their perceptions about SOA in the persuasion stage. According to Rogers’ diffusion theory, the companies in the decision stage are in the process of making their decision about SOA adoption, which leads to adoption or rejection of the innovation (Rogers 2003, 177). Eight companies were in the decision stage. Five of them had just decided to adopt SOA and were included in the adopted category, while the other three companies, which had not yet made the decision, were included in the not adopted category. At the confirmation stage the adopter “seeks reinforcement for the innovation-decision already made, and may reverse this decision if exposed to conflicting messages about the innovation” (ibid, 189). Only two companies at the confirmation stage were already widely adopting SOA. Nine companies at the confirmation stage had implemented pilot projects and had decided of a wide-scale adoption of SOA. One of the companies included in the adopted category had rejected further expansion of its SOA adoption at the confirmation stage for reasons not related to their experiences and perceptions of SOA - the main reason was a recent merger.
According to Fichman and Kemerer (1999), any two assimilation events can be used to define an assimilation gap (see section 3.6.4). In this study, an assimilation gap was defined as the gap between the year of first SOA implementation and the year of the decision of wide scale SOA adoption. Figure 5-12 presents these two adoption rate curves, representing the SOA assimilation gap.
0 %
10 %
20 %
30 %
40 %
50 %
60 %
70 %
80 %
90 %
100 %
2001 2002 2003 2004 2005 2006 2007
Year of f irst SOA implementation project
Decision of w idescale adoption of SOA
Figure 5-12 Initial and wide scale adoption of SOA, the SOA assimilation gap

153
The rate of yearly SOA wide-scale adoptions has increased, which implies that the assimilation gap of SOA has ceased to widen. These findings suggest that the companies, which have initially adopted SOA, also continue to further assimilate it.
Figure 5-13 presents another type of view of the same issue. It shows the current state of SOA adopters in relation to their initial SOA adoption year. Two of the SOA adopters, which initially adopted SOA between 2002 and 2003, still consider themselves to reside in the initial SOA adoption stage. The two companies, which adopted SOA in 2004, are now widely using SOA. Similarly, many of the later SOA adopters have already decided of a wide-scale SOA adoption.
0
1
2
3
4
5
6
7
2002 2003 2004 2005 2006 2007
Year of initial SOA adoption
Wide-scale
Initial
Figure 5-13 Current state of SOA adopters by their initial SOA adoption year
The earlier adopters seem to have preferred a pilot-approach to test the feasibility of the technologies and deliver the early benefits. Many of the later SOA adopters have not implemented pilot projects to confirm themselves about SOA. This may be partly because the technologies have already been tested in other environments and accordingly, may have matured. However, another probable reason for this is that the later adopters use different type of procedure for inserting new technologies; that is, they prove the feasibility of a new technology in their environment with a feasibility-study rather than by pilot testing it.
The following applies Rogers’ categorization of adopters (see section 3.6.2) in the context of the top 50 Finnish companies. According to Rogers (2003), innovators and early adopters make up 16 percent of all adopters. According to Table 5-2, 15 percent of companies had adopted SOA in 2003 - the innovators and early adopters. Moore (2006) claims that there is a chasm between the early adopters and the early majority. Figure 5-12 suggests that this has been the case with SOA; the adoption rate seems to have decreased in 2004. When the

154
chasm is crossed and the critical mass is reached, the adoptions accelerate as shown by the S-curves in Figure 3-29 and in Figure 5-12.
The early majority makes up 34 percent of companies (Rogers 2003). According to the survey, the early majority started wide-scale SOA adoption in 2006 (Figure 5-12). The survey found the cumulative wide-scale SOA adoption rate to be 38 percent. Thus, in addition to innovators and early adopters, two-thirds (65%) of the early majority have made a decision of a wide-scale SOA adoption. About half of these companies have made this decision in 2007. The scope of these adoptions is probably still quite limited, yet, the year 2007 may be considered as a take-off year for SOA in the context of the top 50 Finnish companies.
The early majority of the top 50 Finnish companies probably belong to the early adopters category for all companies. According to AMR Research (Finley 2008), the early majority has begun to adopt SOA and the future SOA markets are now being shaped by the needs and requirements of the early majority. Finley predicts that this development will take the next three to five years. This prediction implies that an SOA whole product - a requirement for the late majority to adopt SOA - is now being developed and will be ready by 2011 to 2013.
The success of SOA projects was compared to the success of all IT projects in the seventeen companies that had completed SOA projects. Table 5-26 presents the success of SOA projects as compared to success of all IT projects in those companies. According to the survey, SOA projects have been more successful in all individual aspects, yet, no difference was found in the overall project success. Almost all SOA projects have successfully implemented all features and functions initially specified, the difference between SOA projects and all IT projects in this respect is statistically significant (Table 5-26). One explanation for better success of SOA projects could be that at the pilot stage, projects probably have been narrower in scope and smaller in size, thus they have been easier to manage than other IT projects.
Table 5-26 Differences between SOA projects and all IT projects
High percentage 1 of projects … SOA projects All IT projectsRaw
differenceImplemented with all features and functions initially specified 2 88.2 % 64.7 % 23.5 %Delivering the benefits and value expected 64.7 % 41.2 % 23.5 %Completed on time 47.1 % 29.4 % 17.6 %Completed on budget 52.9 % 35.3 % 17.6 %1) Companies at the two highest categories (4 to 5)2) Statistically significant (P-value=0.097, Χ²=2.751, df = 1)

155
Figure 5-14 presents the distribution of IT governance performance index of the large Finnish companies surveyed, and the results of two other studies. The index is calculated as described in section 3.5.3 from the questions 2a and 2b of the questionnaire’s section IT governance capabilities. An assessment of the companies’ IT governance performance was first made by MIT Sloan School Center for Information Systems Research (Weill et al 2004a), and is based on a study of 256 companies from the Americas, Europe and Asia Pacific. Capgemini (2005) studied IT governance in large Finnish and Swedish companies and public organizations, the study data is based on 77 interviews of CEOs and CIOs; Figure 5-14 presents IT governance performance of the 19 Finnish companies and organizations that participated in the study.
The survey found evidence of higher average IT governance performance:
1. A slightly higher average IT governance performance was measured. The average IT governance performance was 71 versus 69 for MIT’s study and 67 for Capgemini’s study
2. Distribution of IT governance performance is left-skewed, while the distributions of other studies are more normally distributed.
3. A larger share of the companies, 34 percent versus 24 percent reported in the Capgemini and MIT studies, achieved high IT governance performance, i.e., a score of 80 or more. Similarly, 59 percent of the companies achieved a score of 70 or more versus 41 percent reported in the Capgemini study.
0 %
5 %
10 %
15 %
20 %
25 %
30 %
35 %
40 %
20-29 30-39 40-49 50-59 60-69 70-79 80-89 90-100
Study (n=39) MIT (n=256) Capgemini (n=19)
Figure 5-14 IT governance performance

156
These findings suggest that more companies are achieving high IT governance performance. Some possible explanations to higher IT governance performance could be that 1) more companies have adopted IT governance; or that 2) the adopters have had more time to achieve excellence in their practises.
The other studies did not report the IT governance adoption rate. However, to study the latter possible explanation, Figure 5-15 presents the companies’ IT governance performance as a function of their year of IT governance adoption. Earlier adopters of IT governance have somewhat higher IT governance performance, yet the correlation is weak. In addition, some of the companies which adopted IT governance between 2004 and 2006 have achieved high IT governance performance. However, there is a possible source of error in this analysis - the companies may have made changes to their IT governance behavior, and given the year of last change to their practises as the year of IT governance adoption.
R2 = 0.050
20
30
40
50
60
70
80
90
100
1985 1990 1995 2000 2005 2010
Figure 5-15 IT governance performance in relation to year of adoption
The previous discussion implies that there appears to be no correlation between the time spent assimilating IT governance and the actual achieved IT governance performance. There are several possible explanations to this as discussed in section 3.1.5. IT governance is mainly an approach to improve organizational leadership and management, both of which many consider difficult to master.
The section IT governance capabilities of the questionnaire (see appendix A) was designed to enable a coarse assessment of a company’s IT investment maturity according to GAO’s IT investment maturity model (ITIM) (GAO 2004a, see section 3.5.3). A company’s IT investment maturity level is constructed from the questions (q) of this section as follows: At

157
Level 1 (Creating investment awareness), a company does not have a predefined selection method for IT investments, that is, it is not using business cases (q3c). At Level 2 (Building the investment foundation), a company must use a business case approach, that is, a formal procedure for selecting IT investments must exist (q3c). In addition, formal IT governance structures and processes for IT investment management are required (q1). At Level 3 (Developing a complete investment portfolio), both EA compliance checking (q3d) and the use of IT portfolio approach (q3e) are required. At Level 4 (Improving the investment portfolio), a company has institutionalized its IT portfolio approach, i.e. is effectively using it (q3e > 3) and uses post-implementation reviews (q3f) to improve its IT investment management processes. At the highest level, Level 5 (Leveraging IT for strategic outcomes), a company uses EA compliance checking effectively (q3d > 3) and is capable of successfully driving IT-enabled business change (q6c > 3). In addition, it must show evidence of using post-implementation reviews effectively (q3f > 3), and learn from each IT implementation (q7e > 3) to achieve excellence in IT investment management.
Figure 5-16 presents the distribution of the companies’ IT investment maturity (ITIM level). Median IT investment maturity level is three, and 35.9 percent of the companies reside at the two highest levels.
0 %
10 %
20 %
30 %
40 %
50 %
ITIM level 2.6 % 15.4 % 46.2 % 33.3 % 2.6 %
1 2 3 4 5
Figure 5-16 IT investment maturity according to ITIM maturity model
These findings indicate that the companies have achieved a relatively high IT investment maturity. Yet, the study suggest, that the two highest levels are significantly more difficult for most companies to achieve. The key to higher maturity is a disciplined approach to post-implementation reviews and other types of assessments of IT investment management. These are needed for continuous improvement of structures, processes and practises used in the management of IT investments. However, according to the study, usage of PIRs and learning from the implementations is a challenge for most of the companies.

158
The relation between IT governance and EA was discussed in section 3.3. According to the literature, the concurrent use of IT governance practises and those of EA affect a company’s capabilities to achieve more value from IT; this would be reflected in its IT governance performance index. The following analyses whether evidence of this is given by the results of the survey.
According to the survey, IT investment management maturity seems to contribute to high IT governance performance. Figure 5-17 presents the distribution of IT governance performance at different IT investment maturity levels. The width of a bubble denotes the number of companies at a specific maturity and IT governance performance level. The visual representation in Figure 5-17 suggests that IT investment maturity has a positive effect on IT governance performance.
20
30
40
50
60
70
80
90
100
0 1 2 3 4 5 6
IT investment maturity
Figure 5-17 IT governance performance in relation to IT investment maturity
The data in Figure 5-17 is presented as a two-way table in Table 5-27, which shows that there is a statistically significant difference in the share of companies having high IT governance performance between the companies with high and companies with low or average IT investment maturity. Thus, the results of the study indicate that IT investment maturity is positively related with IT governance performance.
Table 5-27 IT governance performance in relation to IT investment maturity
IT investment maturityLow to average
(20 to 69)High
(70 to 100) High % 1Raw
difference 2
High (4 to 5) 2 12 85.7 % 41.7 %Low (1 to 3) 14 11 44.0 %
IT governance performance
1) Percentage of companies having high IT governance performance2) Statistically significant (P-value=0.011, Χ²=6.454, df = 1)

159
The fact that IT investment maturity is positively related with IT governance performance is quite expected because IT services typically are products of IT investments. These either produce completely new business capabilities or successfully replace old capabilities when they reach the end of their usable life cycle. Higher IT investment maturity promotes higher success in implementing IT projects.
While the adoption rate for EA was found to be 51 percent, the earlier adopters (innovators, early adopters and early majority) have adopted EA (see section 3.6.2). According to Moore (2006), there is a gap between the early majority and late majority in the technology adoption life cycle because the later adopters require a whole product. This suggests that the adoption rate for EA may decrease unless EA is made easier to adopt for the later adopters.
No difference was found in the IT governance performance between EA adopters and non-EA adopters. Thus, the mere adoption of a formal EA approach has no effect on IT governance performance. In addition, the study found that the years of EA usage is weakly correlated with IT governance performance.
Table 5-28 presents the differences in EA characteristics between companies, which have high or low IT governance performance. Companies with high IT governance performance have higher EA completion maturity and operating model clarity, these differences are statistically significant (Table 5-28). They also have higher EA results maturity and consider EA domains more important than companies with low or average IT governance performance.
Table 5-28 Relation of IT governance performance to EA characteristics
High percentage of …High
(70-100)Low to average
(20-69) Raw differenceEA completion maturity 1, 2 65.2 % 25.0 % 40.2 %Operating model clarity 3, 4 78.3 % 43.8 % 34.5 %EA results maturity 1, 5 39.1 % 18.8 % 20.4 %Importance of EA domains 5, 6 78.3 % 62.5 % 15.8 %
3) Percentage of companies having aggregated sum 11 to 154) Statistically significant (P-value=0.027, Χ²=4.884, df = 1)
6) Percentage of companies having aggregated sum 14 to 20
1) Percentage of companies at maturity levels 2 to 52) Statistically significant (P-value=0.013, Χ²=6.109, df = 1)
5) Chi-square test not applicable (expected cell count assumption not met)
IT governance performance
Thus, the results of the study indicate that operating model clarity, importance of EA domains, EA completion maturity and EA results maturity are positively related with IT governance performance.

160
Finally, Table 5-29 presents a summary of the found relationships between the variables of IT governance capabilities and EA characteristics. The data presented in the table was calculated as follows: 1) a two-way table was generated for each combination of IT governance capability and EA characteristic; 2) the percentage of companies having high IT governance capability was calculated for the two groups having low or high value for the respective EA characteristic; 3) a difference greater than 15 percentage points was considered as an indication of a relationship between the IT governance capability and EA characteristic – this was marked in table with a ‘+’ or ‘-‘ depending on the type of the relationship. No negative relationships were found; a higher EA characteristic is positively related with the corresponding IT governance capability.
Table 5-29 Relationships between IT governance capabilities and EA characteristics
12 3
45
IT value generation capabilities 6 + + + + +Enterprise alignment capabilities 7 + +IT related risk mitigation capabilities 8 +Business agility and flexibility 9 + + +Organizational IT capabilities and learning + + + +1) aggregated sum >= 11 6) aggregated sum >= 212) average of primary and secondary focus area >=3.5 7) aggregated sum >= 143) aggregated sum >= 14 8) aggregated sum >= 114) EA completion maturity >= 2 9) aggregated sum >= 145) EA results maturity >= 2 10) aggregated sum >= 18
The data in Table 5-29 shows that many IT governance capabilities benefit from higher operating model clarity and EA completion maturity. In addition, all EA characteristics are positively related to IT value generation capabilities; this implies that companies, which see EA important and have improved their capabilities to manage it, have higher capabilities for achieving value from IT. The data also shows that EA may in fact be considered a tool for organizational learning; companies with higher EA maturity and organizational characteristics also have higher organizational capabilities of IT governance.
5.2.2 Comparison of SOA adopters and non-adopters
This section analyzes the differences in the characteristics of SOA adopters and non-adopters. The objective is to explore their IT governance capabilities, EA maturity, perceptions on SOA, and organizational characteristics to find possible factors behind the adoption of SOA.

161
SOA adopters have adopted IT governance earlier than non-SOA adopters (Table 5-30, Figure 5-18). In 2004, 75.0 percent of SOA adopters had adopted IT governance while only 38.5 percent of non-SOA adopters had adopted it. However, already in 2006, almost all companies had adopted IT governance.
Table 5-30 Year of IT governance adoption for SOA adopters and non-SOA adopters
Count % Cumulative % Count % Cumulative %Before 2002 5 20.8 % 20.8 % 3 23.1 % 23.1 %
2002 5 20.8 % 41.7 % 1 7.7 % 30.8 %2003 3 12.5 % 54.2 % 1 7.7 % 38.5 %2004 5 20.8 % 75.0 % 0 0.0 % 38.5 %2005 2 8.3 % 83.3 % 3 23.1 % 61.5 %2006 3 12.5 % 95.8 % 4 30.8 % 92.3 %2007 0 0.0 % 95.8 % 1 7.7 % 100.0 %
All 23 95.8 % 13 100.0 %1) Year of ITG adoption was not known in 2 companies
Year of IT governance adoptionSOA adopters (n=24) Non-SOA adopters (n=13) 1
0 %10 %20 %30 %40 %50 %60 %70 %80 %90 %
100 %
Before2002
2002 2003 2004 2005 2006 2007
SOA adopters Non-SOA adopters
Figure 5-18 IT governance adoption rate for SOA adopters and non-SOA adopters
According to the survey, there are differences in how SOA adopters and non-SOA adopters perceive IT governance outcome importance and how successful they are in producing those outcomes (Table 5-31). All raw differences of more than 15 percentage points are

162
considered and reported, and the statistical significance of differences was tested with chi-square statistic (see section 4.4.2).
Table 5-31 Differences in perceived importance and success of IT governance outcomes
High percentage 1 of … SOA adoptersNon-SOA adopters Raw difference
Success of effective use of IT for company’s growth 2 62.5 % 46.7 % 15.8 %Importance of effective use of IT for company’s growth 3 75.0 % 60.0 % 15.0 %Importance of cost-effective use of IT 3 79.2 % 100.0 % -20.8 %Success of effective use of IT for asset utilization 2 41.7 % 66.7 % -25.0 %
Differences in perceived importance and success of IT governance outcomes
1) Companies at the two highest categories (4 to 5)
3) Chi-square test not applicable (expected cell assumption not met)2) Not statistically significant (P-value < 0.1, df=1)
More SOA adopters consider effective use of IT for company’s growth important than non-SOA adopters. The statistical significance of this difference could not be tested with chi-square test because the assumption “all expected cell counts must be five or greater” could not be met. SOA adopters are more often successful in using IT for company growth than non-SOA adopters. However, the difference is not statistically significant.
All non-SOA adopters consider cost-effective use of IT, while 79.2 percent of SOA adopters do. In addition, SOA adopters are almost equally often successful in cost-effective use of IT. However, more non-SOA adopters are successful in effective use of IT for asset utilization; the difference is not statistically significant.
Business flexibility is often mentioned as a key driver for SOA, yet the study indicates that there is no significant difference in how SOA adopters and non-SOA adopters perceive its importance or how successful they are in fulfilling this outcome.
Almost half (46.7%) of non-SOA adopters have high IT governance performance (Table 5-32, Figure 5-19), while only 20.8% of SOA adopters do. According to chi-square test, the difference is statistically significant (for a 2x2 table in Table 5-32). In addition, two thirds of SOA adopters only have average level IT governance performance. This suggests that high IT governance performance is negatively related to adoption of SOA. One explanation to this could be that non-SOA adopters are more cost-driven than SOA adopters (Table 5-31). According to Table 5-7, cost effectiveness was the most successfully achieved IT governance outcome.

163
Table 5-32 Comparison of IT governance performance
High (80-100)
Average (60-79)
Low (40-59)
High percentage
Raw difference
SOA adopters 5 16 3 20.8 %Non-SOA adopters 7 5 3 46.7 % -25.8 % 1
High (80-100)
Low or average (40-79)
High percentage
Raw difference
SOA adopters 5 19 20.8 %Non-SOA adopters 7 8 46.7 % -25.8 % 2
2) Statistically significant (P-value =0.005, Χ²=7.800, df=1)1) Chi-square test not applicable (>20% of cells < 5)
5
7
16
5
3
3
0 % 20 % 40 % 60 % 80 % 100 %
SOA adopters
Non-SOA adopters
High (80-100) Average (60-79) Low (40-59)
Figure 5-19 Comparison of IT governance performance
Non-SOA adopters are more successful in keeping IT projects schedules and budgets. However, the differences are not statistically significant (Table 5-33). The aggregated IT project success of SOA adopters is not significantly different from that of non-SOA adopters. Yet, the survey found that 20 percent of non-SOA adopters belong to the highest category of aggregated IT project success (17 to 20), while none of the SOA adopters does. This finding is similar to the previous finding about IT governance performance, that is, SOA adopters tend to have average level aggregated IT project success, while some non-SOA adopters are very successful in this respect.

164
Table 5-33 Differences in IT project success
High percentage 1 of projects …SOA
adoptersNon-SOA adopters
Raw difference
Completed on time 2 29.2 % 53.3 % -24.2 %Completed on budget 2 33.3 % 53.3 % -20.0 %
2) Not statistically significant (P-value < 0.1, df=1)1) Companies at the two highest categories (4 to 5)
A larger share of SOA adopters uses EA compliance checking effectively, the difference is statistically significant (Table 5-34). Similarly, more SOA adopters have an effective business case procedure to evaluate their IT investments (statistically not significant). A company with an effective EA compliance checking procedure is more capable of assessing how a new technology fits in its current and target enterprise architecture, which affects positively on its decision-making capabilities. A higher capability for business case evaluation enables a company to create a more solid business case for an IT investment, such as SOA, to be used in the decision-making. Both of these capabilities also lower the uncertainties related to adoption, thus removing barriers for the adoption. While some SOA-adopters also mentioned “difficulties in creating a business case for SOA” as a key challenge (Table 5-5), it can be concluded that the abilities for efficient EA compliance checking and solid business case creation are key requirements for the adoption of SOA.
Table 5-34 Differences in IT value generation capabilities
High percentage 1 of … SOA adopters
Non-SOA adopters Raw difference
Effective procudure for EA compliance checking 2 62.5 % 33.3 % 29.2 %Effective procedure for business case evaluation 3 62.5 % 40.0 % 22.5 %Aggregated IT value generation capabilities 4 54.2 % 33.3 % 20.8 %1) Companies at the two highest categories (4 to 5, 20 to 30 aggregated)2) Statistically significant (P-value=0.076, Χ²=3.143, df = 1)3) Not statistically significant (P-value < 0.1, df=1)4) 'Not used' coded as 0, not statistically significant (P-value < 0.1, df=1)
More SOA adopters have high aggregated IT value generation capabilities. Although the difference is not statistically significant (Table 5-34) it suggests that high capabilities for ensuring value from IT are positively related with the adoption of SOA.
Although all IT value generation mechanisms are widely used, the aggregated IT value generation capabilities measure indicates that less than one third of the companies studied succeed to use all value generation mechanisms effectively (Table 5-9). In addition, not a single company is very effective in using all of them.

165
Most of the companies studied have difficulties in using post-implementation reviews (PIRs) effectively – SOA adopters are no different from non-SOA adopters in this respect. In addition, according to Table 5-13, only 38.5 percent of the companies agree that they are able to learn from IT implementations, which suggests that they may be repeating the same mistakes. When effectively used, post-implementation reviews lead to better learning capabilities, and to better and faster IT-related decisions. All maturity models emphasize assessment and learning as a method to achieve higher maturity. Previously, high IT investment maturity was found to be positively associated with high IT governance performance. The effective use of PIRs is a requirement for high IT investment maturity, thus, the companies should consider improving their practises and the ways of using them.
Effective use of IT performance measurement is another relative weakness for many of the companies studied. While post-implementation reviews can improve IT investment management, IT performance measurement is intended to assist in improving IT use in the company at strategic and operational levels. Many companies use Service Level Agreements (SLAs) and measure the agreed service levels. However, some respondents commented that these measurements do not measure the actual service level as perceived by the users of these services; the measurement often targets only a fragment of the value-chain needed to produce the service. IT scorecards or IT governance maturity models were rarely mentioned as tools used in the performance measurement.
Non-SOA adopters are more satisfied in how their IT governance structures, processes and mechanisms facilitate the implementation of their IT strategy (Table 5-35); the difference is not statistically significant. Yet, this is probably one of the factors explaining their higher IT governance performance. In other aspects of enterprise alignment, the survey found no differences between SOA adopters and non-SOA adopters. Most companies of both groups have high or very high aggregated enterprise alignment capabilities.
Table 5-35 Differences in enterprise alignment
High percentage 1 of … SOA adopters
Non-SOA adopters Raw difference
Appropriate IT governance mechanisms facilitating the implementation of IT strategy 2 58.3 % 73.3 % -15.0 %
2) Not statistically significant (P-value < 0.1, df=1)1) Companies at the two highest categories (4 to 5)
Almost all SOA adopters and non-SOA adopters have high alignment between IT strategy and business strategy. Somewhat fewer companies (59.0% according to Table 5-10) have their operational IT systems and services aligned with the needs and requirements of their businesses. Thus, according to the study, enterprise alignment at strategic level is one of the

166
strengths of the companies studied; yet, they are not as successful in the operationalization of their IT strategies.
As presented in Table 5-36, SOA adopters have higher awareness of the impact of information technology on business continuity; the difference of companies, which strongly agree to that statement is statistically significant. SOA adopters also have higher aggregated IT-related risk mitigation capabilities; also, this difference is statistically significant. SOA adopters and non-SOA adopters are also different in how effective their IT control framework is, although the difference is not statistically significant. These findings confirm Rogers’ (2003, 290) generalization: “earlier adopters are better able to cope with uncertainty and risk than later adopters.” Combined with the earlier findings it can be concluded that the higher IT value generation capabilities in addition to SOA adopters’ better IT risk mitigation capabilities may have considerably lowered their barriers for SOA adoption.
Table 5-36 Differences in IT risk mitigation capabilities
High percentage 1 of … SOA adoptersNon-SOA adopters
Raw difference
High awareness of IT's impact on business continuity 2 100.0 % 66.7 % 33.3 %Aggregated risk mitigation capabilities 3 62.5 % 33.3 % 29.2 %Effective IT control framework 4 58.3 % 33.3 % 25.0 %
3) Statistically significant (P-value=0.076, Χ²=3.143, df = 1)
1) Companies at the two highest categories (4 to 5, 12 to 15 aggregated)
4) Not statistically significant (P-value < 0.1, df=1)
2) Chi-square test not applicable (expected cell count assumption not met)
Table 5-37 presents a comparison of the business agility and enterprise flexibility capabilities between SOA adopters and non-SOA adopters.
Table 5-37 Differences in business agility and enterprise flexibility
High percentage 1 of … SOA adoptersNon-SOA adopters
Raw difference
Aggregated business agility and enterprise flexibility 2 37.5 % 60.0 % -22.5 %Agility to response to new and changing requirements from the business environment 3 20.8 % 40.0 % -19.2 %
3) Chi-square test not applicable (expected cell count assumption not met)
Differences in business agility and enterprise flexibility
1) Companies at the two highest categories (4 to 5, 14 to 20 aggregated)2) Not statistically significant (P-value < 0.1, df=1)

167
Surprisingly, non-SOA adopters consider that they are more agile to respond to changes in the business environment (Table 5-37). The statistical significance could not be checked with chi-square test even by changing the threshold of high category. According to the survey, non-SOA adopters also have higher aggregated business agility and enterprise flexibility capabilities, although the difference is not statistically significant (Table 5-37). An explanation to these findings could be that the business environment of non-SOA adopters is more static, thus, they may have lower requirements to change and adapt from the business environment. In addition, while agility and flexibility are often stated as key benefits of SOA, it is natural that companies, which do not consider themselves agile and flexible, adopt SOA - an innovation intended to improve their performance in this respect.
Less than ten percent of companies have low aggregated aggregated business agility and enterprise flexibility capabilities (Table 5-12), thus it seems that business agility and enterprise flexibility is probably not a big issue at the agenda of CIOs and senior management.
SOA adopters and non-SOA adopters are no different in their level of organizational IT capabilities and learning. That is, while the criteria for significant difference was set at fifteen percentage points, no differences in opinions about organizational IT capabilities and learning were found. The measure for aggregated organizational IT capabilities and learning is low for most of the companies studied (Table 5-13). In addition, the data in Table 5-13 indicates that majority of the companies studied is not able to successfully implement the required organizational changes to achieve the benefits from their IT investments. This can partly explain why the companies are highly aligned at strategic level, but not equally aligned at operational level. Most IT investments require changes to organizational structures and processes; yet, the survey confirms that these changes are difficult to implement.
Table 5-38 presents a comparison of aggregated IT governance capabilities between SOA adopters and non-SOA adopters.
Table 5-38 Comparison of aggregated IT governance capabilities
Capability SOA
adoptersNon-SOA adopters
Raw difference
IT related risk mitigation capabilities 1 62.5 % 33.3 % 29.2 %IT value generation capabilities 54.2 % 33.3 % 20.8 %Enterprise alignment 79.2 % 66.7 % 12.5 %Organizational IT capabilities and learning 33.3 % 40.0 % -6.7 %Business agility and enterprise flexibility 37.5 % 60.0 % -22.5 %1) Statistically significant (P-value=0.076, Χ²=3.143, df = 1)
High percentage

168
The study found different characteristics for SOA adopters and non-SOA adopters in IT value generation capabilities, IT-related risk mitigation capabilities and business agility and enterprise flexibility. The two groups of companies are not different in their capabilities for enterprise alignment and organizational IT capabilities and learning.
Table 5-39 present a comparison of the operating model clarity between SOA adopters and non-SOA adopters.
Table 5-39 Differences in operating model clarity
High percentage 1 of … SOA adoptersNon-SOA adopters Raw difference
Aggregated operating model clarity 2 58.3 % 73.3 % -15.0 %
2) Not statistically significant (P-value < 0.1, df=1)1) Companies having aggregated operating model clarity 11 to 15
Non-SOA adopters have higher aggregated operating model clarity (Table 5-39). However, the difference is not statistically significant. No significant differences in their opinions of the individual attributes of operating model clarity were found.
Two findings can be made from Table 5-14: 1) a key strength of the companies studied is that they have a clearly articulated business strategy driving their IT use; and 2) most companies have much to improve in how clearly their operating model is expressed.
Ross (2006) defines the operating model of a company by its business process integration and standardization requirements. The study found no significant differences in the selected operating model between the two groups. This is not surprising, because according to an earlier finding, most companies are using the unification operating model (Figure 5-3) and have high requirements for both business process integration and standardization.

169
According to the survey, there is a significant difference in EA approach adoption between SOA adopters and non-SOA adopters (Table 5-40). Two-thirds (66.7%) of SOA adopters have adopted formal EA approach, while only 26.7 percent of non-SOA adopters have done so. The difference is statistically significant. Even larger share (73.3%) of wide-scale SOA adopters has adopted EA. The difference to other companies – non-SOA adopters and SOA adopters at initial adoption stage – is statistically significant.
Table 5-40 Differences in EA adoption rate
SOA adoptersNon-SOA adopters Raw difference
EA approach adopted 1 66.7 % 26.7 % 40.0 %
Wide-scale SOA adopters
Other companies Raw difference
EA approach adopted 2 73.3 % 37.5 % 35.8 %
2) Statistically significant (P-value=0.029, Χ²=4.744, df = 1)1) Statistically significant (P-value=0.015, Χ²=5.912, df = 1)
This finding suggests that a company, which adopts and assimilates service-oriented architecture also needs to adopt enterprise architecture approach. The following discusses this further.
Of the sixteen companies that have adopted both EA and SOA, nine companies (56%) have adopted EA before or in the same year as SOA, while seven companies (44%) have adopted SOA before EA (Figure 5-20).
-1
0
1
2
3
4
5
6
-4 -2 0 2 4 6 8 10 12
Initial SOA adoption Wide-scale SOA adoption
Figure 5-20 Years between EA adoption and SOA adoption

170
Eleven out of the fifteen wide-scale SOA adopters (73.3%) have adopted EA. Only one of these companies has adopted SOA before EA (Figure 5-20). Ten EA adopters at the wide-scale SOA adoption stage have adopted EA before or in the same year that they have made a decision of wide-scale SOA adoption.
These different characteristics of EA adoption between all SOA adopters and wide-scale SOA adopters suggest that many SOA adopters have realized that they need to adopt EA before a wide-scale SOA adoption. These findings also suggest that while a company may adopt SOA initially without adopting EA, a wide-scale adoption - assimilation of SOA - requires adoption of EA. Thus, according to the study, enterprise architecture can be considered as a prerequisite of assimilation of SOA.
The requirement of adopting EA before a wide-scale SOA adoption can be explained as follows: Wide-scale SOA adoption means adoption of SOA at program or enterprise level. Enterprise architecture provides the necessary architectural landscape to determine how a wide-scale SOA adoption fits in the current and target EA. If a company uses SOA only as an integration or application development technology, a wide-scale adoption without EA adoption is possible. However, even in this case EA could provide a framework to assist in new technology insertion, and standardization of related development practises and infrastructure. When a company attempts to define a SOA strategy with a high-level goal to transform the enterprise into a service-oriented enterprise, it will need the information EA can provide about different domains of the current and target architecture. A company’s SOA strategy will then be an integral part of EA transition strategy. At the wide-scale adoption stage (the assimilation stage), a company will need EA: 1) to provide the description of current architecture to which SOA implementations are added; 2) to provide a reference of intended target architecture in which SOA is a key part; and 3) to keep track of how the architecture evolves towards a service-oriented enterprise. Thus, if the scope of SOA adoption is the whole enterprise, the role of EA becomes critical.
As one would expect, there is a significant difference in the distribution of current EA stage (the primary development focus area) between SOA adopters and non-SOA adopters (Figure 5-21). Forty percent of the companies of non-SOA adopters are focusing on standardizing their technology and creating shared applications. This finding is aligned with the previous finding that non-SOA adopters consider cost-effective use of IT more important than SOA adopters do (Table 5-31). In comparison, only 21% of SOA adopters still primarily focus on standardizing their technology. The most common current EA stage of SOA adopters is optimized core (33% of the companies), that is, they are standardizing their business processes and improving sharing of key data and information between these processes.

171
4.2 %0.0 %
12.5 %
40.0 %
20.8 %
33.3 %
26.7 %
20.0 %
29.2 %
13.3 %
0.0 %5.0 %
10.0 %15.0 %20.0 %25.0 %30.0 %35.0 %40.0 %45.0 %
SOA adopters Non-SOA adopters
1 Business silo 2 Standardized technology 3 Optimized core
4 Business modularity 5 Dynamic venturing
Figure 5-21 Enterprise architecture maturity stage relative to SOA adoption
Three SOA adopters (13%) stated local applications as their primary EA development focus area. This is in agreement with their selected operating model - diversification or coordination. Accordingly, their business process standardization requirements are low. These companies use SOA to integrate local applications or to build new functionality on them.
Although one third (33.3%) of the companies in both groups have higher EA maturity stages (business modularity and dynamic venturing) as their primary development focus area, they may use different technologies to address these goals. At these higher EA stages, service-oriented architecture would typically play a key role. This is quite probably the case with SOA adopters: they are creating reusable application and business process components, or focusing on merging of their partner network's processes to their processes using standardized interfaces. According to the interviews, the non-SOA adopter companies that selected dynamic venturing (merging of partners’ processes to their processes) as their primary focus area were trying to achieve this objective with traditional integration technologies instead of using SOA.
Differences in current EA stage imply that SOA adopters and non-SOA adopters have different types of previous conditions. According to Rogers, the previous adopted practises of an organization affect the adoption of an innovation significantly (see section 3.6.2). Figure 5-22 presents another type of visualization of the companies’ previous EA conditions. All three companies at EA stage 1 have adopted SOA to integrate their local applications. They had deliberately chosen a strategy where business unit needs were

172
driving their EA development. Above this EA stage, SOA adoption rate increases from stage 2 to 4 (45.5%, 66.7% and 70.0%). Only one SOA adopter had reached stage five, thus SOA adoption rate at this stage is the lowest across all stages.
3
5
87
12
3 3
6
1
3
1112
10
3
0
2
4
6
8
10
12
14
1 Business silo 2 Standardizedtechnology
3 Optimizedcore
4 Businessmodularity
5 Dynamicventuring
SOA adopters Wide-scale SOA adopters All
Figure 5-22 SOA adoptions across EA stages
The wide-scale adoption rate depends even more on a company’s current EA stage. The wide-scale SOA adoption rates at the “outlier” stages one and five (stages with few companies and quite distinct characteristics) are 66.7 percent and 33.3 percent respectively. However, the wide-scale adoption rates across stages two to four are 27.3 percent at stage two, 25.0 percent at stage three and 60.0 percent at stage four. Thus, the main focus of the companies at stages two to three clearly is elsewhere than on SOA, while the main focus of companies at stage four is on SOA – as it should by the definition of the stage.
The survey found only insignificant differences (raw differences less than fifteen percentage points) in the opinions of the importance of different EA domains between SOA adopters and non-SOA adopters.
Because median for both EA completion maturity and EA results maturity among the companies studied is one (Table 5-17, Table 5-18), the top-half (high percentage) for both of these was calculated as the percentage of companies having overall maturity stage above median i.e. companies that are at average or high maturity levels (2 to 5) .
Because the EA maturities of the studied companies are low (Table 5-17, Table 5-18), the high category for the comparison was defined as maturity levels from three to five. Similarly, the high category for the comparison of overall EA maturity was defined as

173
maturity levels from two to five. Table 5-41 presents the only found difference of EA completion maturity between SOA adopters and non-SOA adopters.
Table 5-41 Differences in EA completion maturity
High percentage 1 of … SOA adoptersNon-SOA adopters Raw difference
Overall EA completition maturity 2 58.3 % 33.3 % 25.0 %1) Companies at average or high overall maturity levels (2 to 5)2) Not statistically significant (P-value < 0.1, df=1)
According to the study, more SOA adopters have reached overall EA completion maturity stage two or higher than non-SOA adopters have, however the difference is not statistically significant. Yet, this finding suggest that SOA adopters develop enterprise architecture more consistently, which could be explained by the higher EA approach adoption rate. A company, which has not adopted EA, may have reasonably high completion maturity in some EA domains, but low maturity in others.
Surprisingly, non-SOA adopters have higher overall EA results maturity (Table 5-42). The difference is statistically significant. In addition, more of non-SOA adopters consider that they have high abilities for sharing and reuse; they at least have a tool for measuring sharing and reuse and measure the cost savings achieved at component, system and technology level. Similarly, a larger share of non-SOA adopters has better abilities to evaluate business improvement as result of EA efforts. These two differences are not statistically significant. One possible explanation to these surprising findings could be that while fewer non-SOA adopters have adopted EA, they may have interpreted these questions differently. Adopting EA brings more discipline to the issues addressed by EA results maturity. Thus, the criteria for evaluating the EA results maturity of the company may be differently interpreted depending on whether the company has adopted EA or not. However, the survey data does not provide a way to assess this.

174
Table 5-42 Differences in EA results maturity
High percentage 1 of …SOA
adoptersNon-SOA adopters
Raw difference
Overall EA results maturity 2 20.8 % 46.7 % -25.8 %Abilities for sharing and reuse 3 25.0 % 46.7 % -21.7 %Evaluation of business improvement as result of EA efforts 3 16.7 % 33.3 % -16.7 %1) Companies at maturity levels 3 to 5 (2 to 5 overall)2) Statistically significant (P-value=0.089, Χ²=2.892, df = 1)3) Not statistically significant (p-value < 0.1, df=1)
Table 5-43 summarizes the differences in aggregated EA maturity characteristics between SOA adopters and non-SOA adopters. SOA adopters have higher EA approach adoption rate and overall EA completion maturity, while non-SOA adopters have higher operating model clarity and overall EA results maturity.
Table 5-43 Comparison of aggregated EA maturity characteristics
SOA adopters
Non-SOA adopters
Raw difference
EA approach adoption rate 1 66.7 % 26.7 % 40.0 %Overall EA completition maturity 2, 3 58.3 % 33.3 % 25.0 %Operating model clarity 3 58.3 % 73.3 % -15.0 %Overall EA results maturity 2, 3 20.8 % 46.7 % -25.8 %
2) Average or high overall EA maturity level (2 to 5)3) Not statistically significant (P-value < 0.1 df=1)4) Statistically significant (P-value=0.089, Χ²=2.892, df = 1)
High percentage
1) Statistically significant (P-value=0.015, Χ²=5.912, df = 1)
Figure 5-23 presents a visualization of aggregated measures in terms of high percent of IT governance capabilities and enterprise architecture maturity for SOA adopters and non-SOA adopters.

175
0.0 %
20.0 %
40.0 %
60.0 %
80.0 %
100.0 %IT value generation
Enterprise alignment
IT related risk mitigation
Business agility and enterpriseflexibility
Organizational IT capabilities Operating model clarity
EA adoption rate
EA completition maturity
EA results maturity
SOA adopters Non SOA adopters
Figure 5-23 Characteristics of SOA adopters and non-SOA adopters
The highest aggregated measures for SOA adopters are enterprise alignment and IT-related risk mitigation (79.2%) and the lowest is business agility and enterprise flexibility (33.3%). Respectively, the highest aggregated measure for non-SOA adopters is operating model clarity (73.3%) and the lowest is IT value generation (6.7%).
According to Rogers (2003, 15), a greater perceived relative advantage leads to a more rapid adoption of the innovation. The survey confirms this statement as shown in Table 5-44. More SOA adopters see benefits in SOA, both at aggregated and individual attribute level; many of these differences are statistically significant as presented in Table 5-44.

176
Table 5-44 Differences in perceived SOA benefits
High percentage 1 of … SOA adoptersNon-SOA adopters
Raw difference
SOA is an important tool to execute the company's strategy 2 45.8 % 0.0 % 45.8 %SOA improves and integrates business processes 3 83.3 % 40.0 % 43.3 %SOA promotes standardization and commoditization of IT infrastructure 3 83.3 % 40.0 % 43.3 %SOA can leverage current IT assets by SOA-enablement 4 75.0 % 33.3 % 41.7 %Aggregated SOA benefits 5 70.8 % 33.3 % 37.5 %SOA shortens IT system development cycles 6 58.3 % 33.3 % 25.0 %SOA improves business by creating partner process networks 6 54.2 % 33.3 % 20.8 %Mandated in order to take part in our partners' process networks 6 33.3 % 13.3 % 20.0 %SOA reduces products time to market 6 50.0 % 33.3 % 16.7 %
2) Chi-square test not applicable (expected cell count assumption not met)3) Statistically significant (P-value=0.005, Χ²=7.800, df = 1)4) Statistically significant (P-value=0.010, Χ²=6.624, df = 1)5) Statistically significant (P-value=0.022, Χ²=5.279, df = 1)6) Not statistically significant (P-value < 0.1, df = 1)
1) Companies at the two highest categories (4 to 5, 28 to 45 aggregated)
One interesting finding from Table 5-44 is that 45.8% of SOA adopters consider SOA as an important tool to execute their strategy, while none of the non-SOA adopters shares that opinion. When the group of SOA adopters was further divided into two categories by the scope of their adoption, it was found that 11.1 percent of the companies at the initial SOA adoption stage and two-thirds (66.7%) of the companies at the wide-scale SOA adoption stage consider SOA as strategically important (Figure 5-24). Thus, companies, which have reached SOA assimilation stage and are thus committed to SOA, see more strategic value in SOA.

177
66.7 %
11.1 %
0.0 %0.0 %
10.0 %
20.0 %
30.0 %
40.0 %
50.0 %
60.0 %
70.0 %
Not adopted Initial SOAadoption stage
Wide-scale SOAadoption stage
Figure 5-24 Strategic position of SOA across SOA adoption stages
A clear majority of SOA adopters see value in how SOA can: improve and integrate business processes, promote standardization and commoditization of IT infrastructure, and leverage current IT assets by SOA-enablement. These three differences are statistically significant. Many respondents agreed that SOA shortens IT system development cycles. However, they also stated that this benefit would probably be realized in the future after a critical mass of services has been created. Only one third of SOA adopters and 13.3 percent of non-SOA adopters consider SOA as a mandated investment to take part in their partners’ process networks. Thus, companies are not widely implementing inter-organizational process networks with SOA.
According to the study (Table 5-45), SOA adopters are also more compatible with SOA than non-SOA adopters are. As SOA fits well to their current business and IT needs (62.5 percent agree); SOA adopters have had a good reason for SOA adoption. The difference to non-SOA adopters in this respect is statistically significant. Another factor that may have speeded up their adoption (in comparison to non-SOA adopters) is that 41.7 percent of SOA adopters see that their current applications can be SOA-enabled. However, this difference is not statistically significant. Yet, there is a statistically significant difference between the two groups at aggregated SOA compatibility level, 70.8 percent of SOA adopters think that they are compatible with SOA versus only 33.3 percent of non-SOA adopters share that opinion (Table 5-45).

178
Table 5-45 Differences in perceived SOA compatibility
High percentage 1 of … SOA adoptersNon-SOA adopters
Raw difference
Aggregated SOA compatibility 2 70.8 % 33.3 % 37.5 %SOA fits with our current business and IT needs well 3 62.5 % 26.7 % 35.8 %Current applications can be SOA enabled 4 41.7 % 20.0 % 21.7 %
2) Statistically significant (P-value=0.016, Χ²=8.297, df = 2)3) Statistically significant (P-value=0.029, Χ²=4.744, df = 1)4) Not statistically significant (P-value < 0.1, df = 1)
1) Companies at the two highest categories (4 to 5, 25 to 40 aggregated)
According to Attewell (1992), knowledge barriers create significant barriers for adoption of a complex innovation. The survey data indicates that knowledge barriers attached to SOA are significant. No more than 21 percent of SOA adopters and only 7 percent of non-SOA adopters think that SOA skills and competencies can easily be included in their current business skillsets. In addition, less that 50 percent of both groups agree to that SOA skills and competencies can be easily included in the skillset of their IT people.
The existence of knowledge barriers is also suggested by opinions of SOA complexity (Table 5-46). Non-SOA adopters consider SOA more complex SOA is to understand and more complex SOA is at aggregated level. While these differences are not statistically significant, SOA adopters seem to have overcome some of the knowledge barriers as less than 40 percent think that SOA is complex to understand.
Table 5-46 Differences in SOA complexity
High percentage 1 of …SOA
adoptersNon-SOA adopters
Raw difference
Aggregated SOA complexity 2 33.3 % 60.0 % -26.7 %Complex to understand 2 37.5 % 53.3 % -15.8 %
2) Not statistically significant (P-value < 0.1, df = 1)1) Companies at the two highest categories (4 to 5, 25 to 40 aggregated)
The differences in companies’ perceptions of other SOA-related characteristics are presented in Table 5-47. While 41.7 percent of SOA adopters are of the opinion that SOA technologies are sufficiently mature, only 6.7 percent of non-SOA adopters agree to that statement. The statistically significance of this difference could not be verified because all expected cell counts were not fiver or greater. Fifty percent of SOA adopters consider SOA as relatively easy to pilot while only 26.7 percent of non-SOA adopters do. In addition, SOA adopters probably have experienced high initial investment cost attached to SOA

179
adoption (58.3% agree), while less than half of non-SOA adopters (40.0%) consider so. Yet, these differences are not statistically significant.
Table 5-47 Differences in other perceived SOA characteristics
High percentage 1 of …SOA
adoptersNon-SOA adopters
Raw difference
SOA technologies are sufficiently mature 2 41.7 % 6.7 % 35.0 %SOA is relatively easy to pilot 3 50.0 % 26.7 % 23.3 %High initial investment costs 3 58.3 % 40.0 % 18.3 %
3) Not statistically significant (P-value < 0.1, df = 1)
1) Companies at the two highest categories (4 to 5)2) Chi-square test not applicable (expected cell count assumption not met)
According to Table 5-48, more than half of the SOA adopters consider that they have access to knowledge and support for adoption, while only 20.0 percent of non-SOA adopters think so. The difference is statistically significant (Table 5-48). While the study found knowledge barriers for SOA significant, access to knowledge and support is essential for SOA adoption. The study suggests that non-SOA adopters’ limited access to institutions lowering the knowledge barriers may have created barriers for SOA adoption.
Table 5-48 Differences in other perceived organizational characteristics
High percentage 1 of …SOA
adoptersNon-SOA adopters
Raw difference
Industry creates pressures for SOA adoption 2 54.2 % 0.0 % 54.2 %Access to knowledge and support for adoption 3 54.2 % 20.0 % 34.2 %
2) Statistically significant (P-value=0.007, Χ²=7.188, df = 1)3) Statistically significant (P-value=0.035, Χ²=4.454, df = 1)
1) Companies at the two highest categories (4 to 5)
According to the survey, industry seems to be a key factor affecting SOA adoption (Table 5-48). While 54.2% of SOA adopters think that their industry creates pressures for SOA adoption, none of the non-SOA adopters shares that opinion. The difference is statistically significant. Thus, some industries are more apt to adopt SOA than others.
The effect of industry for SOA adoption was further studied with the organizational data retrieved from the Talouselmä web site. As the number of participating companies in each industry was small, for confidenciality reasons, the SOA adoption rate for each industry cannot be reported. To study which industries have high pressures for SOA adoption, the companies were classified according to sectors of The European Classification of Economic Activities (NACE) (Eurostat 2008b), which is the “European reference framework for the

180
production and the dissemination of statistics related to economic activities” (Eurostat 2008a).
Two groups of the companies were created: the first group consists of industries having 50 percent or more companies agreeing to having industry pressures for SOA adoption, the second group consists of other industries. Table 5-49 confirms that industry is a key factor affecting SOA adoption; there are significant differences between the two groups.
Financial and insurance; information and communication; and logistics (transportation and storage) sectors see high industry pressures for SOA adoption. This group also sees more strategic value in SOA, and has significantly higher wide-scale SOA adoption rate. The other group consist of companies in electricity, gas, steam and air condition supply; construction; manufacture; wholesale and retail trade sectors. Very few of them are confronting industry pressures for SOA adoption or see strategic value in adopting SOA. Thus, their compound wide-scale SOA adoption rate is only 18.5 percent as compared to the other industry groups 83.3% percent. The statistical significance of these differences could not be verified with chi-square test because all expected cell counts were not five or greater.
Table 5-49 Differences of industry groups
High percentage 1 of …Group 1 2
(n=12)Group 2 3
(n=27)Raw
differenceIndustry creates pressures for SOA adoption (percent of companies agreeing to) 4 75.0 % 14.8 % 60.2 %SOA is an important tool to execute the company's strategy (percent of companies agreeing to) 4 66.7 % 11.1 % 55.6 %Wide-scale SOA adoption rate 4 83.3 % 18.5 % 64.8 %
4) Chi-square not applicable (expected cell count assumption not met)
2) Financial and insurance activities; information and communication; transportation and storage1) Companies at the two highest categories (4 to 5)
3) Electricity, gas, steam and air condition supply; construction; manufacture; wholesale and retail trade
Table 5-50 presents a comparison of the absorptive capacity of SOA-adopters and non-SOA.
Table 5-50 Differences in organizational absorptive capacity
High percentage 1 of …SOA
adoptersNon-SOA adopters
Raw difference
Assessment of improvements as a result of adoption 2 33.3 % 13.3 % 20.0 %
2) Not statistically significant (P-value < 0.1, df = 1)1) Companies at the two highest categories (4 to 5)

181
According to the survey, the only difference between SOA adopters and non-SOA adopters is that more SOA adopters assess the improvements achieved as a result of the adoption (Table 5-50). The difference is not statistically significant and only a few companies of both groups regularly assess the improvements that are achieved as a result of an adoption. Thus, the study suggests that organizational absorptive capacity does not explain SOA adoption.
Yet, the findings about an organizations’ absorptive capacity confirm some of the previous findings: many of the large companies studied are not conducting post-implementation reviews, are having difficulties in making the necessary organizational and operational changes to benefit from IT investments, and are not learning from IT implementations to make better IT-related decisions. Thus, organizational learning seems to be a key challenge for large companies.
Table 5-51 presents measures used to assess relation of organization size and profitability to SOA adoption; the statistical significance of these differences was tested with t-test (see section 4.4.2). SOA adopters are somewhat larger that other companies in turnover, they also have higher median value for personnel, yet, their average personnel size is smaller than that of non-SOA adopters. While these differences are not statistically significant, both groups seem to be sufficiently large for SOA adoption, that is, according to the study, organization size does not seem to affect SOA adoption.
However, SOA adopters have higher average EBIT (measured as percentage of turnover); the difference is statistically significant (Table 5-51). In addition, SOA adopters have higher average ROI and ROE; however, these differences are not statistically significant. Thus, the survey suggests that profitability measured as EBIT has a positive effect on an organization’s capability to adopt SOA.

182
Table 5-51 Comparison of organization size and profitability
SOA adopters
Non-SOA adopters
Raw difference
Turnover 1
mean 5,120 3,868 1,252 median 3,443 2,522 921 standard deviation 8,074 3,106Personnel 1
mean 11,572 12,027 -455 median 7,801 6,249 1,552 standard deviation 13,888 9,968EBIT (as percentage of turnover) 2
mean 7.3 % 3.3 % 4.0 % median 7.1 % 2.8 % 4.3 % standard deviation 7.9 % 3.3 %Return On Investment (ROI) 1
mean 12.6 % 9.2 % 3.4 % median 11.3 % 9.2 % 2.1 % standard deviation 13.6 % 10.5 %Return On Equity (ROE) 1
mean 12.2 % 6.8 % 5.4 % median 8.1 % 8.8 % -0.7 % standard deviation 13.8 % 13.2 %1) Statistically not significant (t-test p-value < 0.1, two-sided)2) Statistically significant (t=2.018, p-value=0.054, df=25)
This finding is in alignment with Rogers’ generalization that organizational slack, the degree of available uncommitted resources positively relates to the early adoption of an innovation. However, it should be noted that profitability is not a guarantee of having uncommitted resources available for the adoption, i.e. organizational slack. Yet, it quite probably increases the changes for it.
5.2.3 Reflection of results
The purpose of the study was to research the IT governance capabilities, EA maturity and SOA in large Finnish companies, and to find out what kind of relationship - if any - the adoptions of IT governance and EA have on the adoption of SOA. The following discusses how the study succeeded to answer its research questions.
Q1: How widely is SOA adopted by large Finnish companies?
SOA adoptions were found to be more common than expected. Over sixty percent (62%) of companies had adopted or had made a decision to adopt SOA; thirty-nine percent of companies were already assimilating SOA (at a wide-scale SOA adoption stage). According to a Butler Group survey (Butler Group 2007), only 30% of the companies surveyed were

183
deploying or trialling SOA. However, the adoption rate of that survey was significantly higher for large organizations than for smaller ones. According to the study, the year 2007 can be considered as a take-off year for SOA in the context of the top 50 Finnish companies.
The study describes the companies’ perceptions about SOA and presents the differences in the perceptions of SOA adopters and non-SOA adopters. While the study found significant differences in perceptions of SOA depending on whether the company had adopted SOA or not, these probably are key factors why some companies adopt SOA and others do not.
Q2: What is the level of the companies’ IT governance capabilities?
The diffusion of IT governance was already saturated among large Finnish companies, although many adoptions were quite recent. The study describes the companies’ IT governance capabilities in terms of IT value generation, enterprise alignment, IT-related risk mitigation, business agility and enterprise flexibility and organizational IT capabilities and learning.
According to a study by the IT Governance Institute (ITGI 2008), 52% of the 749 the companies that participated in the study were currently implementing or had implemented improved IT governance practises, which is significantly lower than the IT governance adoption rate of 97% found by this study. Large Finnish companies have also had a better fit between their IT strategy and business strategy (87% vs. 62% reported by ITGI study). Thus, by implementing their IT strategy these companies probably are able to provide significant value from IT to their businesses.
The companies IT governance performance was evaluated and a somewhat higher IT governance performance was found than by earlier studies. In addition, the IT investment maturity of the companies was assessed and a relatively high IT investment maturity was found. High IT investment maturity was found to be positively related with IT governance performance.
Q3: How mature is enterprise architecture in large Finnish companies?
The adoption rate of EA was found to be 51%. Thus, all earlier adopters have adopted EA and the late majority is starting to adopt it. Increasing SOA adoption rate may partly explain the relatively high adoption rate of EA. The research at the University of Jyväskylä may also have increased interest in EA; between 2001 and 2005 a major research project was conducted and several companies were involved in it.

184
Most companies had already standardized their technology and were at the optimized core or business modularity stage. The studied EA maturities (completion and results) were low levels; more than half of the companies were at the two lowest levels.
The U.S. government agencies have used EA for many years because it has been mandated for them since 1996. The Office of Management and Budgeting (OMB 2007) assessed 24 federal agencies using the OMB EAAF maturity framework; while the same framework was used as the basis for this study, the assessment can be used as a benchmark. Virhe. Viitteen lähdettä ei löytynyt. presents a comparison of the results of this study and the results of the OMB assessments.
3.3
4.0
2.52.9
3.6
2.1
0.00.51.01.52.02.53.03.54.04.55.0
OMB 2006 OMB 2007 Study 2007
EA completition maturity EA results maturity
Figure 5-25 EA maturity in U.S. government agencies and large Finnish companies
EA maturity in large Finnish companies is significantly lower than that of the U.S. agencies; this probably reflects the relatively recent adoptions of EA in the companies studied. However, while using EA has been mandated in the U.S. government since the late 1990s, Virhe. Viitteen lähdettä ei löytynyt. also shows a higher EA maturity can be reached if a disciplined approach to EA is used.
Q4: Does the study suggest a relationship between an organization’s IT governance capabilities, EA maturity and SOA adoption?
The study found that IT governance performance is positively related with EA maturity. In addition, higher EA characteristics were found to have a positive effect on many of the IT governance capabilities.
The differences in IT governance capabilities and EA maturity between SOA adopters and non-SOA adopters were analysed and significant differences were found. According to the

185
study, an initial SOA adoption does not require the adoption of EA because SOA can initially be adopted as a technology for application development or integration. However, all companies at EA assimilation stage had adopted IT governance, and three out of four of them had adopted EA. While almost all of these adoptions had been made before assimilation of SOA, the study suggests that IT Governance and EA can be considered as prerequisites for assimilation of SOA.
Three working hypotheses were made in section 2.3; the following discusses whether evidence was found to support them.
Hypothesis 1: Large Finnish companies have adopted formal IT governance approach
The study found this hypothesis true. The adoption rate of IT governance is 97%; all but one company had adopted formal IT governance approach. Some explanations for this are that 1) the studied are large and need governance of IT, 2) spend a significant percentage of their turnover in IT investments, and 3) have to comply with regulatory requirements, such as Sarbanes-Oxley.
Hypothesis 2: Large Finnish companies have adopted formal EA approach
No support for this hypothesis was found. Although it was expected that the large size of the companies implies that their business and IT architectures are too complex to manage without adopting a formal EA approach, almost half of the companies had not adopted a formal EA approach. However, despite the lack of a formal EA approach, according to the interviews these companies were concerned about EA.
Hypothesis 3: IT governance and EA are positively related to each other
The study found this hypothesis true. High IT governance performance was found to be positively related with high EA maturity. Thus, the study found supporting evidence for the proposition that the concurrent development of IT investment practices and EA significantly increases a company’s possibilities to make successful IT investments that fulfil their business needs.

186
6. INTEGRATION OF RESULTS
6.1. Key findings of the study
6.1.1 Service-oriented architecture adoption
Service-oriented architecture (SOA) is becoming a mainstream innovation for large Finnish companies, SOA adoption rate found was 62 percent. According to the study, 39 percent of the companies have entered to a wide-scale adoption stage, which implies that the companies belonging to the early majority of technology adoption life cycle have begun wide-scale usage of SOA.
According to the survey interviews, majority of SOA-adopters are using SOA for integration purposes inside the organizational boundaries. SOA appears to be replacing traditional integration tools; companies are beginning to use SOA to integrate applications, whether these applications are service-oriented or not.
Most SOA adopters are still in an early adoption phase: the majority of the companies are at the orchestration skill building stage (see section 3.4.5), that is, they are acquiring the skills needed in a wider-scale SOA adoption by implementing selected pilot projects. In most cases, wide-scale SOA adoption means using SOA increasingly for integration. However, according to the interviews, some companies have entered to the self-orchestration phase and are orchestrating their key business processes. Self-orchestration often takes place at program level; the companies build new capabilities with SOA, or replace applications that have reached the end of their usable life cycle with new service-oriented solutions. Only a few companies are deploying SOA for integration with their partners’ process networks; traditional technologies are more commonly used for partner integration.
SOA adopters spend, in average, 18% of their IT investment budgets on SOA-based investments. However, some companies reported having almost all of their IT investment based on SOA.
Most SOA projects have been successful, in some aspects of project success; they have been even more successful than IT projects on average in the companies, which have adopted SOA. The study found no evidence about project failures for reasons related to SOA. However, a large share of completed SOA projects has been small-scaled, or SOA has comprised only a part of a larger project.

187
The study suggests that the year 2007 was a take-off year for SOA in the context of the top 50 Finnish companies. The pace of wide-scale SOA adoptions is increasing; seven companies (18% of all companies) had made decision of wide-scale SOA adoption in 2007. Thus, the assimilation gap - the gap between the initial SOA adoption and a later wide-scale adoption of SOA - has ceased to widen. Recently, some companies had decided about wide-scale SOA adoption without implementing pilot projects. Instead, they had conducted a feasibility study to analyze the effects of SOA in their environment.
The early majority has begun to use SOA in wide-scale; this implies that a whole product for SOA is now being developed. The later adopters of SOA will need a product that is relatively easy to adopt. In addition, more knowledge and support for the adoption needs to be available and SOA technologies have to be made easier to adopt.
According to the survey interviews, some companies that use mainframe computers and applications have decided to adopt SOA in a wide-scale. They are enabling an extended life cycle for their mainframe applications and investments. SOA enables them to build new functionality without any reference to the current mainframe technology. This allows later replacement of the technology without major changes to the new SOA solutions. The same approach can be used to enable a merger of companies with high intensity of IT. A new logical layer is added to separate the enterprise functionality from the company-specific operational IT functionality. This allows more time for a transformation of operational systems and services; it may even make such transformation unnecessary.
Creating a solid business case for SOA has been a key challenge in SOA adoption. Adopting SOA typically involves the selection of tools or platform. This may cause delays for the first project implementing SOA. In addition, the additional investments needed are difficult to justify at individual project level; platform investments typically create long-term benefits instead of easily justified short-term benefits.
Another key challenge has been skills and competencies. While the history of SOA adoptions is short, vendors do not have a proven record of SOA implementation successes. Knowledge that is based on experience of how to build services that are reusable, scalable and fulfil the future needs without rework or redesign is limitedly available. In addition, SOA adopters have encountered resistance from their own developers.
6.1.2 IT governance capabilities and EA maturity
IT governance adoptions are relatively recent, yet IT governance diffusion has saturated among the companies studied. Practically taken all companies, i.e. 97 percent of the

188
companies had adopted IT governance, however, half of the adopters had adopted it after 2003.
More companies are achieving high IT governance performance than what was found in earlier studies. The survey found no evidence of a relation between IT governance performance and the years spent in its assimilation. This suggests that achieving excellence in IT governance needs commitment and a disciplined approach.
Cost-effective use of IT is the most important and successful IT governance outcome. Effective use of IT for business flexibility is challenging for most companies; not a single company considered itself very successful in this perspective. In addition, only 28 percent of the companies think that their IT is able quickly to respond to new and changing requirements from the business environment. Yet, the study suggests that adaptivity and flexibility is perhaps not a big issue in the senior management agenda, although it is often mentioned as a problem or an area that needs improvements.
Surprisingly, the study suggests that high IT governance performance is negatively related to SOA adoption. Most SOA adopters only have average IT governance performance and a larger share of non-SOA adopters have high IT governance performance. The companies surveyed traditionally use IT to achieve efficiency and effectiveness in their asset usage. Many non-SOA adopters represent mature industries, such as manufacturing, wholesale and retail, which have had time to achieve excellent performance in this respect. More SOA adopters have growth as a business strategy; the objective of effectively using IT for company growth appears to be significantly more difficult to achieve.
Only 31 percent of the companies have high aggregated capabilities in using mechanisms intended to ensure IT value generation.. Most companies use a variety of mechanisms to ensure IT value generation. However, the study suggests that none of the companies is using all studied mechanisms successfully. Two thirds of the companies find their use of Service Level Agreements (SLAs) effective. In addition, more than half of the companies find their use of business case evaluation procedure, IT portfolio approach and EA compliance checking effective. Post-implementation reviews (PIRs) are found ineffective; almost all companies have difficulties generating value from them. In addition, many companies seem to have opportunities to improve their IT performance measurement.
IT governance appears to be strongly strategy-based. Eighty-seven percent of the companies think that they have a clearly articulated business strategy, and that their IT strategy is aligned with their business strategy. Two thirds believe that their IT governance structures succeed in facilitating their IT strategy implementation.

189
Most of the companies could articulate and express their operating model more clearly. Only 41 percent of the companies agree to have a clearly articulated operating model that drives their IT use. This may be reflected in the fact that less than 60 percent of companies consider that their operational IT systems and services are aligned with the needs and requirements of their businesses. These findings suggest that while business and IT agree at the strategic level, without a clearly articulated operating model they may have difficulties in achieving the same amount of alignment at operational level. Other findings of the study suggest that the companies could improve the operationalization of their IT strategies with more effective use of EA.
Almost all companies have high awareness of information technology’s impact on business continuity. In addition, most companies have high aggregated risk mitigation capabilities.
Surprisingly, less than half of the companies think that their IT services enable effective information and knowledge use. Many respondents told that their company gathers large amounts of data and information, yet they are not capable enough to express the information in a way that would support its effective use. This finding is aligned with Pirttimäki’s finding that the top 50 Finnish companies “lack a systematic approach to information sharing and utilization and of a supportive company culture complicates the flows of information in a company (Pirttimäki 2007)”
The majority of the companies think they have the capacity to follow major technological trends and events; yet, less than 40 percent think they have the ability to take advantage of information technology’s enabling capacity for new business models. This suggests that IT is typically used for business process improvement and business process redesign. Rethinking of business processes and considering completely new ways of implementing them with new types of IT-enabled capabilities is still a rare phenomenon.
The top 50 companies have much to improve in their organizational IT capabilities and learning abilities. Only 39 percent of the companies think they have the ability to learn from implementations suggesting that they may be repeating the same mistakes. This finding is reinforced by the fact that only 19 percent of the companies found their use of PIRs effective. In addition, only 28 percent of the companies have the ability to successfully implement the organizational changes that are required to achieve the intended benefits from the IT investments. Typical explanations provided for poor learning capabilities in the interviews were: 1) lack of time and resources, 2) the fast pace of organizational changes and 3) individual career making, that is, people are moving forward to their next positions fast.

190
The difficulties the companies are having in effective use of post-implementation reviews is an example of inconsistencies between the espoused and actual theories (see section 3.6.1): the potential risks and appropriate project management practises are often well known, but the actual implementation of the project – the theory-in-use – is inconsistent with this knowledge. A post-implementation review may fail to expose the root-causes for the problems of a specific IT project, such as incomplete requirements and unrealistic expectations and schedules. If the root-causes stay hidden and are not analyzed, the mistakes cannot be corrected and probably will be repeated.
The companies surveyed have achieved relatively high IT investment maturity, median IT investment maturity level according to the ITIM maturity model is three and more companies (36 percent) reside at the two highest levels than at the two lowest levels (18 percent). However, to proceed from the median maturity level to the higher maturity levels, the companies have to improve their learning and assessment capabilities as well as their EA use.
EA is gaining wide acceptance, more than half of the companies have adopted a formal EA approach. Yet, almost all EA adoptions are quite recent, only 15 percent of the companies had adopted EA before 2005.
The three most common primary EA stages: standardized technology, optimized core and business modularity cover 84% of the companies. Standardizing IT infrastructure and shared services is still important for the companies, 28 percent have this as their primary development focus and for other companies it is the most common secondary focus area. Thirty-one percent of the companies are focusing on creating enterprise-wide standard business processes and sharing of their data and information to achieve business and operational efficiency. One third of the companies have their primary development focus on the two highest EA maturity stages; stages where SOA would be a natural key component.
The companies consider business, information and application architectures important; technology architecture considered is less important. Most companies have already standardized their technology, so this seems natural. However, SOA creates new challenges for technology architecture because new technologies and platforms have to be adopted. Thus, the importance of technology architecture may increase while more companies adopt SOA in wide-scale.
The overall EA completion maturity of the companies surveyed is low; the median maturity level is one. Technology and application architectures are reasonably mature (median for them is three). Thus, it appears that the companies are not using EA extensively and developing each EA domain synchronized with each other.

191
The previous finding also suggests that companies are using EA mostly for management of their technology and application architectures. This is also an indication that practitioners of IT - not business people still mostly use EA.
The survey found that the overall EA results maturity of the companies is low. Almost all companies (90 percent) reside at the three lowest maturity levels. Two findings explain some of this: 1) many companies do not assess how their business has improved as result of EA attempts, this implies that they reside at the lowest overall maturity level; and 2) by definition, the two highest maturity levels require commitment to SOA in the form a documented plan for evolving SOA to various business segments. Thus, the two highest levels are not within reach for the majority of the companies surveyed because 62 percent of the companies have not entered the wide-scale SOA adoption stage. In addition, high EA results maturity would indicate successful use of measurements and assessments of EA results. However, the findings of the study indicate that most companies could improve their performance in these two respects.
According to the study, there is a relationship between high IT investment maturity and high IT governance performance. This suggests that IT investments are driving the success of IT governance. The companies make IT investments to provide new capabilities that support and enhance the business; alternatively, the investments replace old capabilities when they become unusable. High IT investment maturity enables: stronger business cases for investment evaluation; a carefully balanced IT service portfolio that is aligned with the enterprise needs; and EA-driven IT investments that take the enterprise to its desired target stage.
The study also found a relationship between high IT governance performance and high EA maturity. EA completion maturity, EA results maturity and the clarity of the company’s operating model were found to have a positive effect on IT governance. In addition, companies, which consider EA important, tend to have higher IT governance performance than other companies do. These findings indicate that by adopting a formal EA approach and consistently improving EA capabilities an organization can also improve its IT governance performance.
Most IT governance capabilities that were studied benefit from higher EA maturity. Companies, which regard EA as important and have improved their capabilities to manage and govern it, have higher capabilities for achieving value from IT. In addition, EA completion maturity has a positive effect on most IT governance capabilities. IT governance needs a solid basis to work on; a clearly articulated operating model was found to have a positive effect on almost all aspects of IT governance.

192
The study suggests that EA may in fact be considered a tool for organizational learning; all considered EA characteristics were found to have a positive effect for organizational capabilities of IT governance.
6.1.3 Perceived SOA characteristics
Perceptions of SOA are significantly different among SOA adopters and non-SOA adopters. This is what one would expect them to be, because SOA adopters base their opinions on what they have learned by their SOA adoptions, while other companies have to rely on what they have heard, read and learned from others. The companies have different opinions of almost all statements about individual SOA benefits and their company’s SOA compatibility. SOA adopters clearly have a more positive opinion of SOA benefits and their company’s SOA compatibility than non-SOA adopters do.
Two out of three companies find that SOA improves and integrates business processes and that SOA promotes standardization and commoditization of IT infrastructure. Another generally agreed key benefit of SOA is that it enables leveraging of current investments by SOA-enabling them to participate in new service-oriented solutions (75 percent of SOA adopters and 33 percent of non-SOA adopters agree).
Two thirds of the companies at wide-scale adoption stage consider SOA an important tool in the company’s strategy execution, 46 percent of all SOA adopters do so; yet, none of non-SOA adopters considers SOA an important tool in company’s strategy execution. The strategic position of SOA thus depends on SOA adoption stage.
According to the interviews, respondents consider many SOA benefits important in the future. These findings reflect the early adoption phase of SOA and indicate that the companies see the value of SOA increasing as the adoption and assimilation rates increase. Benefits, such as shortening application development cycles, improving information life-cycle management, and the creation of partner process networks are not seen important now, but many companies think that they will be important in the future.
The study suggests that immaturity of SOA technologies and low SOA compatibility with security policies and architectures are probably significant inhibitors of SOA adoption. These factors seem to create barriers especially to a wide-scale SOA adoption, which requires appropriate mechanisms of SOA governance.
Although many companies think that SOA requires high initial investment, compatibility with their current IT funding mechanisms or their current IT infrastructure appears not to be a critical issue that would limit SOA adoption. These findings suggest that many

193
companies have appropriate practises to adopt and fund new platforms and that they have standardized their IT infrastructure with future needs in mind.
The lack of SOA related skills and competencies clearly creates significant barriers for SOA adoption: only 15 percent of the companies think SOA is compatible with their current business skills and competencies, and only 39 percent of the companies agree that their current IT skills and competencies are compatible with SOA.
The study confirms that SOA is a complex innovation. According to the responders, the basic idea of SOA is simple. Yet, it is difficult to understand what effects and opportunities SOA may have on the enterprise as a whole. However, SOA is not regarded harder to learn than previously adopted innovations.
6.1.4 Organizational characteristics
According to the study, industry is a key factor affecting SOA adoption. Three industry sectors: financial and insurance, information and communication, and transportation and storage see industry pressures for SOA adoption. They also see more strategic value in SOA, and have significantly higher wide-scale SOA adoption rate than the companies of other industry sectors do. The sectors that do not see their industry creating pressures for SOA adoption include electricity, gas, steam and air condition supply; construction; manufacture; and wholesale and retail trade sectors.
The study found no relationship between the company operating model, as defined business process integration and standardization needs, and SOA adoption. The main reason for this is that a most of the companies is using unification operating model, that is, they have high requirements both for business processes integration and standardization.
Although SOA adopters are slightly larger on average, organization size does not seem to explain SOA adoption. This is not surprising, because all studied companies are large as measured in turnover, many also in personnel.
The study suggests that profitability has a positive effect on the adoption of SOA. Especially, EBIT seems to affect the adoption; SOA adopters have considerably higher EBIT than non-SOA adopters.
The study found no significant differences in the organization’s absorptive capacity that would explain SOA adoption. Most companies studied have a positive attitude to chance. They are also continuously seeking new tools and approaches that could improve their operations. However, two important findings about organizational absorptive capacity were

194
made: While 62 percent of the companies think they are successful in selecting the right tools, only one third of the companies think they are able to adopt them successfully. In addition, only 26 percent of the companies evaluate their adoptions to find out how their operations have improved because of the adoption.
6.1.5 IT governance and EA as prerequisites for assimilation of SOA
The study suggests that IT governance and EA can be considered as prerequisites for assimilation of SOA.
All but one of the companies studied had adopted IT governance, which is strong evidence that all companies can benefit from defining and using appropriate structures, processes and mechanisms to govern their IT use. Fourteen out of fifteen companies (93%) at the wide-scale adoption stage – at the assimilation stage - of SOA had adopted IT governance. All of these fourteen companies had adopted IT governance before assimilation of SOA (Figure 6-1), however, one company had revised its IT governance practises afterwards because of a recent merger.
53 %
93 %87 %80 %
73 %
67 %
40 %
13 %
7 %
73 %73 %67 %
60 %
47 %
40 %
20 %
7 %
0 %
10 %
20 %
30 %
40 %
50 %
60 %
70 %
80 %
90 %
100 %
-5 0 5 10 15 20
Cou
nt o
f com
pani
es
Cumulative IT governance Cumulative EA
Figure 6-1 Adoption of IT governance and EA in relation to assimilation of SOA
Eleven out of fifteen companies (73%) at the assimilation stage had adopted EA, only one of these had adopted EA after it had entered the assimilation stage of SOA. In addition, seven companies had adopted EA after their initial SOA adoption. This is an indication that EA adoption can be considered as a prerequisite for assimilation of SOA.

195
The study also compared IT governance capabilities and enterprise architecture maturity of SOA adopters and non-SOA adopters. Summaries of the differences found are presented in Table 6-1 and Table 6-2.
Table 6-1 Differences in IT governance capability characteristics
SOA adopters Non-SOA adopters - are earlier adopters of IT governance - are more focused on effective use of IT
for company growth - are more successful in effective use of
IT for company growth - have mostly average IT governance
performance - have more effective procedure for
business case evaluation - have more effective procedure for
checking EA compliance of IT investments
- have higher aggregated IT value generation capabilities
- have higher awareness of IT's impact on business continuity
- have more effective IT control framework
- have higher aggregated IT-related risk mitigation capabilities
- are more focused on cost-effective use of IT
- are more successful in effective use of IT for asset utilization
- have higher IT governance performance
- are more successful in completing IT projects on schedule and budget
- are more satisfied in having appropriate IT governance mechanisms that facilitate the implementation of their IT strategy
- are more agile to adapt to new and changing requirements of the business environment
- have higher aggregated capabilities for business agility and enterprise flexibility
Table 6-2 Differences in EA maturity characteristics
SOA adopters Non-SOA adopters - have higher EA adoption rate - have typically adopted EA before
making a decision about wide-scale adoption of SOA
- are at a higher EA stage (have higher aggregated EA development focus area)
- have higher overall EA completion maturity
- have higher aggregated operating model clarity
- have higher overall EA results maturity - have better abilities for sharing and
reuse - have better abilities to measure
evaluation of business improvement as a result of EA efforts
6.2. Limitations of the study
The selection of survey population limits the generalization of the results. The population of the study consists of the 50 largest companies in Talouselämä 500 list of companies and a

196
census, i.e. a sample of all 50 companies was used. While the actual response rate of the survey is 78%, the results can be regarded as valid for the population. However, the type of selection used for the sample implies that one cannot generalize the results to other companies in Finland.
Litwin (1995, 8-31) gives three methods to assess survey reliability when the survey assesses respondents’ perceptions: test-retest reliability, alternate-form reliability, and internal-consistency reliability. The most commonly used method is test-retest, where the same set of respondents completes the questionnaire at two different points in time and the results are compared. In the alternate-form method the question wordings, order of choices or order of questions is changed, whereas internal-consistency measures how well the different items complement each other to form a single scale. Reliability is usually quantified by a correlation coefficient r and values ≥ 0.70 are generally considered good. Two respondents of the pilot group agreed to retest the survey, thus, test-retest was used as the method to evaluate how stable the responses were. The correlation of the responses to the questionnaire was 0.75. Although only two individuals performed a retest, the correlation is above 0.70 and indicates that the test-retest reliability of the survey may be considered good.
External validity assesses the generalizability of the findings. To evaluate the external validity of the results, the population was divided into smaller groups, and SOA adoption rate was calculated for these groups. Because the study found that industry was a key factor affecting SOA adoption, the share of companies belonging to industry groups in Table 5-49 was used to evaluate the validity of the calculated adoption rate. Figure 6-2 presents SOA adoption rates for tested groupings when the population is divided first into two groups (T1) and then into three groups (T2) using turnover (in decreased order) as the basis for the division. The share of companies belonging to “industry group two” among all responders is 67%, thus the test results show that it is reasonably constant for all test groups.

197
0 %
10 %
20 %
30 %
40 %
50 %
60 %
70 %
80 %
T1: Tw o groups T2: Three groups
T1: share of industry group 2 T2: share of industry group 2
Lin. (T1: Tw o groups) Lin. (T2: Three groups)
T1: Tw o groups 64 % 59 %
T2: Three groups 64 % 62 % 58 %
T1: share of industry group 2 68 % 65 %
T2: share of industry group 2 64 % 69 % 67 %
1 2 3
Figure 6-2 SOA adoption rate in subgroups of population
Both tests show gradually decreasing SOA adoption rates, thus one could assume, that a similar decreasing result is possible when the size of population is increased. Yet, when the population was divided into four groups, the mixture of industries in each group was significantly different. This lead to significant differences in SOA adoption rates (from 50% to 82%), which thus could be explained by similar differences in “industry group two” percentage (from 80% to 55%). This suggests, that should one have a specific need to make assumptions of a larger group of companies in Talouselämä 500 list of companies based on the results of this study, at least the mixture of the industry groups should be similar to the responders of the survey.
According to Moore (2000, 261), the behavior of respondents may cause response bias in results. Many reasons could cause this: the respondent may lie, that is, for reasons not known to the research the respondent may give more positive or negative view of the actual state of the property in question, the attitude of the interviewer may cause bias to the answers, or the respondent may not recall the events in the past.
To limit the influence of extreme opinions, the analyses are based on the percentage of the companies belonging to the top half, that is, the companies that agree to the presented statement. The problem that the responders may recall a specific year of a past event wrong was known in advance. Yet, in the analysis phase, the time of events appeared to be more

198
significant than what was though in advance. Thus, it would have been wise to ask additional questions about the sequence of the events.
Another factor that may have caused errors in the results is that only one person from each company was interviewed or responded otherwise. A single responder may not be as well informed of all topics the study was concerned, thus the limits of their knowledge may have caused errors in the results. Yet, while most respondents were CIOs, one would expect them to be well informed about information technology matters in the company. A more consistent opinion for each company would probably have required two or more responders, but that was beyond the resource limits of the study.
All responders were asked to give answers to questions about EA, whether they had adopted it or not. Increased knowledge often affects one’s opinions, thus the adopters of EA have probably perceived questions about EA completion and results maturity differently, which may have affected these results. Yet, the interviews gave an impression that some of the companies, which had not adopted a formal approach for EA, had used other types of approaches to develop their EA (such as TQM or BPM).
A simple survey is not an appropriate way to conduct a comprehensive assessment of EA or IT investment maturity. A thorough analysis would require an audit where further evidence for conclusions would be gathered. However, conducting such an audit for multiple companies in the context of one study is practically impossible. Thus, the results of the survey provide a sufficient approximation of EA and IT investment maturity for the purpose of this study.
6.3. Implications of the study
6.3.1 Implications for theory
The study reinforces and clarifies the previous theories about a relationship between IT governance and EA. The theoretical part of the study discusses the role of EA to IT governance; how it transforms from a supporting role to a key driver of IT governance when EA matures. When the role of EA changes as it matures, it also provides increased benefits for IT governance. This is supported by the empirical part of the study, which found indications about a relationship between high IT governance performance and high EA maturity.
The study suggests that IT governance and EA may be considered as prerequisites for assimilation of SOA. IT governance is required to make important decisions about IT use in

199
the company; according to the empirical part of the study, all but one company had adopted IT governance. All companies at the assimilation stage of SOA had adopted IT governance before assimilating SOA. The scope of SOA adoption widens as SOA is assimilated. Thus, a reference for the current and future stages of how IT is used in the company – of the company’s EA – is required to decide about how and to what purposes to assimilate SOA. Seventy-three percent of companies, which had assimilated SOA, had adopted EA. All but one of them had adopted EA before adopting SOA. Thus, these findings suggest that IT governance and EA can be considered as prerequisites of for assimilation of SOA.
6.3.2 Implications for the practitioners
The study suggests that companies can benefit from adopting IT governance and improving their IT governance capabilities. All but one of the companies studied had adopted IT governance; they also had high enterprise alignment, high IT-related risk mitigation capabilities and relatively high IT investment maturity. The study found a relationship between high IT investment maturity and high IT governance performance, thus improvements in the mechanisms for IT investment management are reflected in the performance of IT governance. In addition, many respondents commented that they had achieved significant improvements after recent developments in their IT governance practises. Thus, their previous performance had probably been much lower.
According to the study, companies can get more value from IT - improve their IT governance performance - by adopting and improving EA. A relationship was found between high IT governance performance and high EA maturity. Thus a company, which adopts EA and consistently improves its EA capabilities can achieve higher IT governance performance. Benefits from EA can be achieved at all EA stages: at the lower stages, the focus is on technology and application architectures; at these stages, checking EA compliance provides the key improvement. While a company’s EA matures, the focus shifts more to the business and information architectures, and towards a more holistic use of EA. EA gradually becomes a key driver for IT investment management and IT governance.
The role of a clearly articulated operating model was found important. The study found that the companies, which had clearly articulated business strategy and operating model, and had clarified the role of IT in executing them, had higher IT governance performance. In addition, operating model clarity was found to be positively related with most IT governance capabilities.
The study suggests that EA users are mostly IT people; they use it mainly for management of technology and application architectures. A key goal of EA is to achieve alignment of business and IT. However, it seems that this goal is not achieved as well as it could have

200
been. Thus, the study suggests that business people need to be more involved in EA and business architecture needs to be in the scope of EA efforts.
The study found indications of increasing wide-scale adoptions of SOA. Some companies are now deciding of a wide-scale SOA adoption without implementing pilot projects, this suggest that SOA technologies are maturing and thus need not be proofed in practise. Yet, a company attempting a wide-scale SOA adoption should prepare itself well for the adoption. This is made possible by sufficient amount of knowledge and support, which, according to the SOA adopters, are now available for those interested.
The study suggests that EA can be regarded as a prerequisite for assimilation of SOA. Thus, the companies considering SOA adoption, whether initial or wide-scale, should also consider adopting EA. While EA initially describes the current architecture, it can assist a company in defining a target architecture that builds on its current architecture by SOA-enabling its current applications. By analysing the gap between the target and current architectures, a roadmap for SOA adoption can be created.
A company, which considers SOA adoption, needs to have good capabilities for creating business cases. According to the study, one of the inhibitors for SOA adoption is the difficulty of creating a solid business case for its adoption. Companies, which have an appropriate method for evaluating the business case of a proposed IT investment, probably can easier “sell” SOA to business people. Similarly, the practises for checking EA compliance of a proposed IT investment can assist in deciding which type of SOA adoption strategy to take.
Skills and competencies create substantial barriers for SOA adoption. Skills and competencies are typically hard to acquire. The fastest way would be to hire them, especially IT-related SOA skills, yet resources of skilled SOA professionals are limited. In addition, critical resources for wide-scale SOA adoption are business people; the people who best know the business are in-house. Yet, according to the study, business people have the highest knowledge barriers for SOA. Therefore, while SOA will probably be important for all companies in the future, the companies should start building SOA skills and competencies, both for business and IT people.
The study suggests that companies are focusing mainly on using IT to optimize their current business models. While a company may have a capability to follow and understand the significant technological trends and events, it may not be able to act on this knowledge. Rethinking business models often creates new markets; SOA will probably enable new business models for many industries. A process such as that suggested by Wheeler (2002) can be used: choosing enabling and emerging technologies, matching them with economic

201
opportunities, executing business innovation for growth, and assessing the customer value achieved. This kind of process should be a key process in a company’s IT governance framework.
6.3.3 Suggestions for further research
Survey research always has limitations on depth of study. The relationship between IT governance, EA and different stages of SOA adoption could be further researched with a case study approach to learn more about issues such as:
- How is EA managed in companies that have not adopted formal EA approach?
- What has been the role of IT governance and EA in decisions about wide-scale SOA adoption in case companies?
- How SOA is incorporated to different EA domains?
- How SOA governance is incorporated to IT governance?
- What kind of changes the companies have made to their IT governance and EA because of SOA adoption? How do these changes depend on the type and scale of the adoption?
- What kind of problems may be encountered if IT governance and EA are not adopted before SOA adoption?
The case studies could target companies at different EA and SOA maturity stages and companies from different industries.
SOA is a new design paradigm, which requires a change in the mindset. Thus, people-issues are the main challenges for a wide-scale SOA adoption. Research could reveal what are the most critical challenges and how a company can overcome them. In addition, service-oriented thinking needs more research; we need to know how different stakeholders in a company can be promoted to think about capabilities as services. The types of stakeholders could include business managers, business analysts, CIOs, users and developers.
SOA creates new challenges for governance. When distributed resources across the organizational boundaries are orchestrated, many governance issues, such as security, service registries and common agreement of Service-Level Agreements need more research to provide reliable trusted solutions to practitioners.
While all companies studied had relatively low EA maturity, case studies could research, why it is so challenging to achieve higher EA maturity. The research could target companies at different EA maturity levels to find out the challenges at each level and EA domain.

202
Many responders told that they currently use or had previously used post-implementation reviews, but found them ineffective. Case study research could reveal what factors are contributing to these difficulties and how the situation could be improved.
6.4. Discussion
IT governance, EA and SOA are current topics, widely discussed in the professional publications of information technology. In addition, the results of the study show that most of the companies have been involved with the adoption of at least one of these innovations recently. Thus, the results of the study are expected to be interesting to the practitioners. IT governance and EA have been recently actively researched for example in Finland and Sweden. However, organized academic research on SOA is only just starting to take-off. An indication of this is that Kontogiannis et al (2008) recently presented SOA research taxonomy to focus academic research on SOA and to “provide a long-term consensus SOA research agenda”. Another indication of growing research interest from respected researchers is that in May 2008, the MIT CISR researcher Dr. Jeanne Ross was conducting a web survey about SOA adoption and value (Ross & Curran 2008). The survey conducted by Ross and Curran covered topics such as SOA metrics (e.g. number of services, year of adoption), SOA practises (e.g. service design, resources, tools and structures) and SOA value and results (e.g. improvements, cost savings and challenges). The theoretical part of this study is strongly based on the research made by the researchers of Centre for Information Systems Research at MIT Sloan School of Management.
The idea to study IT governance and EA originated from the literature review of both IT governance and EA; a thorough description of a relationship between the two was not found because most research had targeted only IT governance or EA. Recently, it has been acknowledged that EA has an important role in governance of IT. The IT governance framework of Weill and Ross (2004a) has IT architecture as its constituent. Similarly, IT governance Institute has included EA as a part of its CobiT IT governance framework (ITGI 2005). IT governance is driven by IT investments; new technologies and design approaches are typically adopted with such investments. SOA is both a technical architecture and a new design paradigm, thus, it provided a suitable case for researching IT governance and EA in relation to adoption of an another innovation, in this case SOA.
The primary constraint for the research was that most of it had to be conducted at the researcher’s spare time. This meant that the resources available for the study were limited and most time spent on the research had to be outside normal working-hours. This influenced many decision about the research process and strategy. Because the current adoption rates of ITG, EA and SOA were not known, case study approach could not be

203
selected. In addition, the data gathering had to be done in a short time frame. A full-time researcher could have made the research in phases: first, a limited survey could have been made to gather the information about the current adoption rates and to gather knowledge of what approaches each company is using. After analyzing the results, a reasonable number of suitable cases studies could have been selected and researched. With this kind of approach, it might have been possible to gather deeper knowledge about how the studied innovations are related and what effect they have on each other. In addition, it would have allowed a more close study of the characteristics of SOA adoption; a SOA maturity model, such as Sprott’s (2004) roadmap to SOA could have been used as a reference. However, it would have required more time to spend for the research project during working hours.
The theoretical part of the study presents a description of how EA is related to IT governance; it describes how the role of EA transforms from supporting IT governance to a key driver of IT governance while a company achieves higher EA maturity stages. The empirical part of the study provides evidence to support a hypothesis that a relationship between IT governance and EA exists; indications of a relationship between high IT governance performance and high EA maturity were found. Thus, the study contributes to the body of knowledge about IT governance and EA by the increased understanding of the relationship between the two. For practitioners this provides supporting evidence for creating a business case for the adoption of EA, or taking a more disciplined approach to the management and governance of EA.
Many western countries, such as Finland, need an increase in productivity because of the increasing retirement rates and the decreasing amount of labour. Watson (2001) states that “the goal of an IS is to improve organizational performance, which includes improving the performance of individuals or groups within the organization. There is no other rationale for building an IS.” Thus, there is a need for new information systems and adoption of innovations such as SOA. There has been a lot of hype around SOA and the expectations are high. SOA promises opportunities for increasing productivity and may play an important role in the future. However, platform innovations typically create high expectations that may prove to be hard to achieve. One reason for this is that platform innovations require rethinking rather than redesign. In the case of SOA, another reason is that it takes time to develop a critical mass of services provide the promised returns.
Many companies are currently considering the adoption of SOA. To support the decision-making process, many vendors, such as HP and IBM, have created methods for conducting a SOA self-assessment to evaluate an organization’s readiness for the adoption. The viewpoint of these assessments is more on the technological side than on the other aspects of readiness for the adoption. The questionnaire of this study assesses a company’s IT governance capabilities and EA maturity. It also assesses its perceptions about SOA and

204
compatibility with SOA. Thus, the questionnaire can be regarded - as one of the respondents stated - a method for assessing a company’s readiness for SOA adoption. While the perspective for assessing SOA adoption readiness with the questionnaire is different from that of the tools provided by the vendors, they complement each other.
A key result of the study is that the results suggest that IT governance and EA can be regarded as prerequisites for assimilation of SOA. This is a significant finding both for theory and for companies that consider adopting SOA in a wide-scale. SOA vendors do not emphasize the importance of EA, probably because many organizations do not use EA approach; adopting EA first would make the adoption of SOA slower. Yet, the assimilation of SOA is just in its early phases; SOA technologies are still maturing and it will take several years before a whole product for SOA is developed. This suggests that for many companies, there is plenty of time to improve their capabilities of EA.

205
7. REFERENCES
Allee, V. 2000. Reconfiguring the Value Network. Journal of Business Strategy, 21 (4), 36-39.
Appleton, D. 2004. Why Enterprise Architecture is an Oxymoron. Business Rules Journal, 5 (4), Available from: http://www.brcommunity.com/articles.php, Accessed 20.11.2005
Argyris C. 1991. Teaching smart people how to learn. Harvard Business Review, 69 (2), 99-109.
Attewell, P. 1992. Technology Diffusion and Organizational Learning: The Case of Business Computing. Organization Science, 3 (1), 1- 19.
Austvold, E. & Carter, K. 2005. Service-Oriented Architectures: Survey Findings on Deployment and Plans for the Future. AMR Research, Ltd, AMR-R- 18274.
Awad, E.M & Ghaziri, H. 2003. Knowledge Management. Upper Saddle River, New Jersey: Pearson Education, Inc.
Aziz, S. & Obitz, T. & Modi, R. & Sarkar, S. 2005. Enterprise Architecture: A Governance Framework. Part I Embedding Architecture into the Organization. Infosys. Available from: http://www.infosys.com/IT-services/architecture-services/enterprise- architecture/default.asp, Accessed 23.9.2007
Aziz, S. & Obitz, T. & Modi, R. & Sarkar, S. 2006. Enterprise Architecture: A Governance Framework. Part II Making Enterprise Architecture Work withing the Organization. Infosys. Available from: http://www.infosys.com/IT-services/architecture- services/enterprise-architecture/default.asp, Accessed 23.9.2007
Baker, D.C. & Janiszewski, M. 2005. 7 Essential Elements of EA. Enterprise Architect, 3 (2).
Barroso, L.A. & Dean, J. & Hölzle, U. 2003. Web Search for a Planet - The Google Cluster Architecture. IEEE Micro, March-April, 22-28.
Benbasat, I. & Zmud, R.W. 1999. Empirical Research in Information Systems: The Practise of Relevance. MIS Quarterly, 23 (1), 3-16.
Boh, W.F. & Yellin, D. & Dill, B. & Herbsleb, J.D. 2003. Effectively Managing Information Systems Architechture Standards: An Intra- Organization Perspective. In King, J.L. & Lyytinen, K. (eds.) Proceedings of the Workshop on Standard Making: A Critical Research Frontier for Information Systems, December 12-14, 2003. Seattle, WA, 171-187. Available from: http://www.si.umich.edu/misq- stds/proceedings, Accessed 30.12.2005
Bredemayer, D. & Malan, R. 2004. What It Takes to Be a Great Enterprise Architect. Cutter Consortium. Enterprise Architecture Advisory Service, Executive Report, 7 (8)

206
Broadbent, M. & Kitzis, E. 2005. Interweaving business-driven IT strategy and execution: Four Foundation Factors. Ivey Business Journal, 69 (3) 1-6.
Brown, A. 2004. The Value of Enterprise Architecture. Available from: http://www.zifa.com, Accessed 19.10.2005
Brown, A.E. & Grant, G.G. 2005. Framing The Frameworks: A Review of IT Governance Research. Communications of the Association for Information Systems, 15, 696-712.
Brown, A, W. & Delbaere, N. & Eeles , P. & Johnston, S. & Weaver, R. 2005. Realizing service-oriented solutions with the IBM rational software development platform. IBM Systems Journal. 44 (4) 727-752.
Brown, C.V. & Magill, S.L. 1994. Alignment of the IS functions with the enterprise: Toward a model of antecedents. MIS Quarterly, 18 (4), 371-404.
Brown, C. & Ross, J.W. 1999. The IT Organization of the 21st Century: Moving to a Process-Based Orientation. MIT Sloan School of Management, WP 4078
Brown, J.S. & Hagel, J. 2003. Does IT Matter? An HBR Debate: Letter from John Seely Brown and John Hagel III. Harvard Business Review, 81 (6), 2-4
Brown, J.S. & Hagel, J. 2003. Flexible IT, better strategy. The McKinsey Quarterly, (4), 51- 19.
Brown, J.S. & Hagel, J. 2005. From Push to Pull. The next frontier of innovation. The McKinsey Quarterly, (3), 82-91.
Burke, B. 2004. No firm has failed in EA because the technology wasn't right. SETLabs briefings. (2) 4, 17-22.
Butler Group. 2007. SOA Will Transform the Way IT and the Enterprise Interact by 2012, Says Butler Group. Tekrati. The Industry Analysis Reporter. Jan, 15. Available from: http://software.tekrati.com/research/news.asp?id=8348, Accessed 10.10.2007
Cabrera, L.F. & Copeland, G. & Johnson, J. & Langworthy, D. 2004.Coordinating Web Services Activities with WS- Coordination, WS- AtomicTransaction, and WS-BusinessActivity. Microsoft Corporation. Available from: http://msdn.microsoft.com/en- us/library/ms996526.aspx, Accessed 21.5.2008
Campbell, P.L. 2003. An Introduction to Information Control Models. Sandia National Laboratories, SAND2002-0131
Campbell, S. & Mohun, V. 2007. Mastering Enterprise SOA with SAP NetWeaver and mySAP ERP. Indianapolis, Indiana: Wiley Publishing, Inc.

207
Capgemini. 2005. The Value of IT. 2005: Study based upon the views of Nordic companies. Stockholm. Capgemini. Available from: http://www.fi.capgemini.com/ajankohtaista/julkaisut/?d=708B402F-8536- DB4D-0E81- 5AD6A3089840, Accessed 18.11.2007
Chan, Y.E. & Reich, B.H. 2007. IT alignment: what have we learned? Journal of Information Technology, 22, 297–315.
Channabasavaiah, K. & Holley, K. & Tuggle, E.M. Jr. 2004. Migrating to a service-oriented architecture. Somers, Ny: IBM Corporation Software Group. G224- 7298-00.
Charan, R. & Colvin, G. 1999. Why CEOs Fail. Fortune. 139 (12), 68-78.
Cherbakov, L. & Galambos, G. & Harishankar, R. & Kalyana,S. & Rackham, G. 2005. Impact of service orientation at the business level. IBM Systems Journal, 44 (4), 653-668.
Choudrie, J. & Dwivedi, Y.K. 2005. Investigating the Research Approaches for Examining Technology Adoption Issues. Journal of Research Practice. 1 (1) Available from: http://www.icaap.org
CIO Council. 1999. Federal Architechture Framework. Version 1.1. The Chief Information Officers Council. Available from: http://www.cio.gov/archive/fedarch1.pdf, Accessed 30.12.2005
CIPS. 2005. CIO Roundtable Event Proceedings: Aligning IT and Corporate Governance. Canadian Information Processing Society. Available from: http://www.cipstoronto.ca/CIO_Roundtable_Proceedings_FINAL.pdf, Accessed 27.6.2007
Clements, P. 2005. Comparing the SEI’s Views and Beyond Approach for Documenting Software Architectures with ANSI- IEEE 1471- 2000. Carnegie Mellon University, Software Engineering Institute, CMU/SEI- 2005-TN-017.
Crawford, C.H. & Bate, G.P. & Cherbakov, L. & Holley, K. & Tsocanos, C. 2005. Toward an on demand service-oriented architecture. IBM Systems Journal. 44 (1), 81-107.
Crosby, P.B. 1979. Quality Is Free: The Art of Making Quality Certain. New York: McGraw-Hill.
Dahlberg, T. & Kivijarvi, H. 2006. An Integrated Framework for IT Governance and the Development and Validation of an Assessment Instrument. In Proceedings of the 39th Annual Hawaii International Conference. (8) Jan, 194b-194b
Davenport, T.H., Eccles, R.G. & Prusak, L. 1992. Information Politics. Sloan Management Review, 34 (1), 53-65.

208
Davenport, T.H. & Prusak, L. 1998. Working knowledge: How organizations manage what they know. Boston, MA: Harvard Business School Press.
Debevoise, T. 2007. The Many Factors of Enterprise Maturity. BPMInstitute.org. Available from: http://www.bpminstitute.org/articles/article/article/the-many-factors-of- enterprise- maturity.html, Accessed 18.6.2007
Dillon, A. and Morris, M. 1996. User acceptance of new information technology: theories and models. In M. Williams (ed.) Annual Review of Information Science and Technology. 31, 3-32.
DoC. 2003. IT Architecture Capability Maturity Model. The U.S. Department of Commerce. Available from: http://ocio.os.doc.gov/groups/public/@doc/@os/@ocio/@oitpp/documents/content/prod01_002340.pdf, Accessed 19.5.2007
DoC. 2006. Department of Commerce Information Technology (IT) Planning and Investment Review Maturity Model. The U.S. Department of Commerce. Available from: http://www.ocio.os.doc.gov/ITPolicyandPrograms/Capital_Planning/DEV01_003726, Accessed 19.5.2007
DTI. 2003. Innovation Report: Competing in the global economy: the innovation challenge. Department of Trade and Industry. 7035/2k/12/03/NP. URN 03/1607.
Dvorak, R.E. & Holen, E. & Mark, D. & Meehan, W.F. 1997 Six principles of high- performance IT. The McKinsey Quarterly, (3), 164- 177.
Durvasula, S. & Guttmann, M. & Kumar, A. & Lamb, J. & Mitchell, T. & Oral, B. Pai, Y. & Sedlack, T. & Sharma, H. & Sundaresan, S. R. 2006a. SOA Practitioners’ Guide. Part 1, Why Services-Oriented Architecture? Available from: http://www.soablueprint.com/practitioners_guide, Accessed 21.5.2008.
EIPA. 2002. The Common Assessment Framework (CAF). Improving an organisation through self- assessment. Maastricht: European Institute of Public Administration.
Erl, Thomas. 2005. Service-Oriented Architecture: Concepts, Technology, and Design. Upper Saddle River: Prentice Hall PTR.
Eurostat. 2008a. NACE Rev. 2. Introductory Guidelines. The Statistical Office of the European Communities. Available from: http://circa.europa.eu/irc/dsis/nacecpacon/info/data/en/index.htm, Accessed 16.3.2008.
Eurostat. 2008b. NACE Rev. 2. Structure and explanatory notes. The Statistical Office of the European Communities. Available from: http://circa.europa.eu/irc/dsis/nacecpacon/info/data/en/index.htm, Accessed 16.3.2008.

209
Fichman, R.G. 1992. Information Technology Diffusion: A Review of Empirical Research. In Proceedings of the Thirteenth International Conference on Information Systems (ICIS). Dallas.
Fichman, R.G. & Kemerer, C.F. 1999. The Illusory Diffusion of Innovation: An Examination of Assimilation Gaps. Information Systems Research, 10 (3), 255-275.
Fichman, R.G. 2001. The Role of Aggregation in the Measurement of IT-Related Organizational Innovation. Management Information Systems Quarterly, 24 (4).
Fink, A. 2006. How To Conduct Surveys. A Step-by-Step Guide. 3rd edition. Thousand Oaks, California: Sage Publications, Inc.
Finley, I. 2008. The Future of the SOA Market: Early Majority Rules. AMR Research. Alert Article, February, 28. Available from: http://www.ebizq.net/topics/soa/features/9571.html, Accessed 22.5.2008
Fowler, F.J. Jr. & Mangione, T. W. 1990. Standardized Survey Inteviewing. Minimizing Interview- Related Error. Applied Social Research Methods Series Volume 18. Newbury Park, California: Sage Publications, Inc.
Fondstad, N.O. & Robertson, D. 2006. Transforming a Company, Project by Project: The IT Engagement Model. MIT Sloan School of Management. 4635-06.
Galliers, R.D. & Land, F.F. 1987. Choosing appropriate information systems research methodologies. Communications of ACM, 30 (11), 900-902.
GAO. 1998. Information Security Management - Learning from Leading Organizations. United States General Accounting Office. GAO/AIMD-98-68.
GAO. 2003a. A Framework for Assessing and Improving Enterprise Architechture Management. Version 1.1. United States General Accounting Office. GAO-03-584G.
GAO. 2003b. Executive Office for U.S. Attorneys Needs to Institutionalize Key IT Management Disciplines. United States General Accounting Office. GAO-03-751.
GAO. 2004a. Information Technology Investment Management. A Framework for Assessing and Improving Process Maturity. Version 1.1. United States General Accounting Office. GAO-04-394G.
GAO. 2004b. The Federal Enterprise Architecture and Agencies’ Enterprise Architectures Are Still Maturing. United States General Accounting Office. GAO-04-798T.
GAO. 2006. Enterprise Architecture: Leadership Remains Key to Establishing and Leveraging Architectures for Organizational Transformation. United States Government Accountability Office. GAO-06-831.

210
Gartner. 2002. Six IT Governance Rules to Boost IT and User Credibility. Gartner Research. COM-18-2237.
Gartner. 2006. Gartner Defines the Term 'Enterprise Architecture'. Gartner Research. G00141795.
Gilder, G. 1993. Metcalf's law and legacy. Forbes ASAP. September, 13. Available from: http://www.seas.upenn.edu/~gaj1/metgg.html, Accessed 4.3.2006
Gilder, G. 1996. The Gilder Paradigm. Wired Magazine. Issue 4.12 Available from: http://www.wired.com/wired/archive//4.12/gilder_pr.html, Accessed 4.3.2006.
Greenspan, A. 2002. Corporate Governance Improved following Enron. Speech given March, 26, at New York University. Available from: http://www.useu.be/Categories/RegulatoryReform/Mar2602GreenspanEnronGovernance.html, Accessed 12.11.2005.
Gummeson, E. 1993. Case Study Research in Management, Methods for Generating Qualitative Data. Preliminary Script. Stockholm University, Department of Business Administration.
Hagel, J. & Durchslag, S. & Brown, J.S. 2002. Orchestrating Loosely Coupled Business Processes: The Secret to Successful Collaboration. Available from: http://www.johnhagel.com/paper_orchestratingcollaboration.pdf, Accessed 3.5.2007
Hagel, J. 2004. Capturing the Real Value of Offshoring in Asia. Available from: http://www.edgeperspectives.com/paper_offshoring.pdf, Accessed 11.12.2005
Hagel, J. & Brown, J.S 2003. The Agile Dance of Architectures - Reframing IT Enabled Business Opportunities. Available from: http://www.johnhagel.com/paper_agiledance.pdf, Accessed 1.5.2007
Hagel, J. & Brown, J.S. 2005. From Push to Pull - Emerging Models for Mobilizing Resources. Available from: http://www.johnseelybrown.com/pushmepullyou4.72.pdf, Accessed 17.11.2005.
Haines. M.N. 2007. The impact of Service-oriented Application Development on Software Development Methodology. In Proceedings of the 40th Annual Hawaii International Conference on System Sciences (HICSS’07). IEEE, 172b-172b.
Hannula, M. & Pirttimäki, V. 2003. Business Intelligence Empirical Study on the top 50 Finnish companies. Journal of American Academy of Business, 2 (2), 593-599
Hauser, J.R. & Katz, G.M. 1998. Metrics: You Are What You Measure! European Management Journal, 16 (5), 516-528.
Harmon, P. 2003. Developing an Enterprise Architechture. Business Process Trends. Available from:

211
http://www.bptrends.com/publicationfiles/Enterprise%20Architecture%20Whitepaper%2D1%2D23%2D03%2Epdf, Accessed 28.10.2005
Henderson, J.C. & Venkatraman, N. 1993. Strategic alignment: Leveraging information technology for transforming organizations. IBM Systems Journal. 32 (1), 4-16.
Hirvonen, A. & Pulkkinen, M. 2004. A Practical Approach to EA Planning and Development: the EA Management Grid. In Abramowicz, W., BIS 2004. Proceedings of 7th International Conference on Business Information Systems. Poznan, Poland. 284-302.
Hirvonen, A. 2005. Enterprise Architecture Planning in Practise. The Perspectives of Information and Communication Technology Service Provided and End- User. University of Jyväskylä. Jyväskylä Studies in Compting, 48. ISBN 951-39-2018-6.
HP. 2005. Tapping into new business opportunities at Nokia. An interview with Mikko Kosonen, Nokia Corporation CIO and Senior Vice President, Business Infrastructure. HP Transformer. Hewlett-Packard GmbH EMEA. Spring, 8-9. Available from: http://www.hp.com, Accessed 28.11.2005
Humphrey, W.S. 1988. Characterizing the Software Process: A Maturity Framework. IEEE Software, 5 (2), 73-79.
Hurley, R.F. & Hult, T.M. 1998. Innovation, Market Orientation, and Organizational Learning: An Integration and Empirical Examination. Journal of Marketing. 62 (3), 42-54.
IBM. 2007. New To SOA and Web Services. IBM Corporation, developerWorks. Available from: http://www- 128.ibm.com/developerworks/webservices/newto/, Accessed 29.4.2007
IFAC. 2004. Enterprise Governance. Getting the Balance Right. New York: International Federation of Accountants, ISBN: 1-931949-24-7. Available from: http://www.ifac.org, Accessed 5.1.2006
IFEAD. 2006. Extended Enterprise Architecture Maturity Model Support Guide Version 2.0. Institute For Enterprise Architecture Developments. Available from: http://www.enterprise- architecture.info/Images/E2AF/Extended%20Enterprise%20Architecture%20Maturity%20Model%20Guide%20v2.pdf, Accessed 7.5.2006
Infosys. 2005. Infosys Enterprise Architechture Survey 2005. Executive Summary. Infosys. Available from: http://www.infosys.com/IT-services/architecture-services/ea-survey/ea-survey-executive-summary.pdf, Accessed 8.1.2006
Infosys. 2007. Enterprise Architecture is maturing. Infosys Enterprise Architecture Survey 2007. Infosys. Available from: http://www.infosys.com/IT-services/architecture- services/ea-survey/enterprise-architecture-survey-2007.asp, Accessed 21.5.2008

212
ISO. 2005. ISO/IEC 17799:2005. Code of Practice for Information Security Management. International Organisation for Standardisation. ISO/IEC 17799:2005.
ISO. 2007. ISO/IEC 42010:2007. Systems and software engineering — Recommended practice for architectural description of software-intensive systems. International Organisation for Standardisation. ISO/IEC 42010:2007, IEEE Std 1471-2000.
Israel, G.D. 1992. Determining Sample Size. Program Evaluation and Organizational Development. University of Florida, Institute of Food and Agricultural Sciences. PEOD6.
ITGI. 2000. CobiT. 3rd Edition. Rolling Meadows, IL: IT Governance Institute. ISBN 1- 893209-17-2.
ITGI. 2003. Board Briefing on IT Governance. 2nd Edition. Rolling Meadows, IL: IT Governance Institute, ISBN 1-893209-64-4.
ITGI 2004a. COBIT Mapping. Overview of International IT Guidance. Rolling Meadows, IL: IT Governance Institute. ISBN 1-893209-57-1.
ITGI. 2004b. IT Governance Global Status Report. IT Governance Institute. Rolling Meadows, IL: IT Governance Institute. ISBN 1-893209-32-6
ITGI 2005. CobiT 4.0. Control Objectives, Management Guidelines, Maturity Models. Rolling Meadows, IL: IT Governance Institute. ISBN 1-933284-37-4
ITGI. 2008. IT Governance Global Status Report 2008. IT Governance Institute, ISBN 978-1-60420-064-5.
ITMRA. 1996. Information Technology and Management Reform Act of 1996 (Clinger-Cohen Act). U.S.C. Availble from: http://irm.cit.nih.gov/itmra/itmra96.html, Accessed 3.12.2005
ITSMF. 2004. The IT Infrastructure Library. An Introductory Overview of ITIL. Version 1.0a. Earley, Reading: itSMF Ltd.
Jeyaraj, A & Rottman, J.W. & Lacity, M.C. 2006. A review of the predictors, linkages, and biases in IT innovation adoption research. Journal of Information Technology, 21, 1-23.
Jiang, J.J. & Klein, G. & Hwang, H-G. & Huang, J. & Hung, S-Y. 2004. An exploration of the relationship between software development process maturity and project performance. Information & Management, 41 (3), 279-288.
Johnson, J. 2006. Interview: Jim Johnson of the Standish Group. Interview by Deborah Hartmann, InfoQ, Aug, 25. Available from: http://www.infoq.com/articles/Interview- Johnson-Standish-CHAOS, Accessed 25.6.2007

213
JCS. 2003. Report of Investigation of Enron Corporationand Related Entities Regarding Federal Tax and Compensation Issues, and Policy Recommendations. Volume 1: Report. Washington: The Staff of Joint Commitee on Taxation, JCS-3-03.
Jenkins, A. M. 1985. Research Methodologies and MIS Research. In Mumford, E. et al. (eds), Research Methods in Information Systems, Amsterdam, North- Holland. 103-117.
Järvinen, P. 2004. Research Questions Guiding Selection of an Appropriate Research Method. University of Tampere. Department of Computer Sciences. D-2004-5.
Kaisler, S.H. & Armour, F. & Valivullah, M. 2005. Enterprise Architecting: Critical Problems. In Proceedings of the 38th Hawaii International Conference on System Sciences. IEEE, 0-7695-2268-8/05.
Kajko-Mattsson, M., Lewis, G. A. & Smith, D. B. 2007. A Framework for Roles for Development, Evolution and Maintenance of SOA- Based Systems. In Proceedings of the international Workshop on Systems Development in SOA Environments, (May 20-26). Washington, DC: ICSE. IEEE Computer Society
Kano, M. & Koide, A. & Liu, T.-K. & Ramachandran, B. 2005. Analysis and simulation of business solutions in a service-oriented architecture. IBM Systems Journal, 44 (4), 669-690.
Kaplan, R.S. & Norton, D.P. 1996. The Balanced Scorecard. Translating Strategy Into Action. Boston, Massachusetts: Hardvard Business School Press.
Kasanen, E. & Lukka, K. & Siitonen, A. 1991. Konstruktiivinen tutkimusote liiketaloustieteessä. Liiketaloustieteellinen Aikakauskirja, 3, 301-329
Kasunic, M. 2005. Designing an Effective Survey. Carnegie Mellon University/Software Engineering Institute. CMU/SEI-2005-HB-004.
Kelley, K. & Clark, B. & Brown, V. & Sitzia, J. 2003. Methodology Matters. Good practise in the conduct and reporting of survey research. International Journal for Quality in Health Care. 15 (3), 261-266.
Kontogiannis, K. & Lewis, G.A. & Smith, D.B. 2008. A research agenda for service-oriented architecture. In Proceedinds of the 2nd international workshop on Systems Development in SOA Environments, May 11, Leipzig, Germany. 1-6.
KPMG. 2004. KPMG IT governance survey. KPMG Press Release, ITWeb, September, 21. Available from: http://www.itweb.co.za/sections/quickprint/print.asp?StoryID=146430, Accessed 5.1.2006
KPMG. 2005. Global IT Project Management Survey. How committed are you? Hong Kong: KPMG International, NSW8941AAA.

214
KPMG. 2006. The Morning After. Driving for post deal success. KPMG International, 300-128.
Langenberg, K. & Wegmann, A. 2004. Enterprise Architechtures: What Aspects is Current Research Targeting? Ecole Polytechnique Fédérale de Lausanne. IC/2004/77.
Lee, G. & Xia, W. 2003. An Empirical Study on the Relationships between the Flexibility, Complexity and Performance of Information Systems Development Projects. University of Minnesota, MIS Research Center. WP 03-01 Available from: http://www.misrc.umn.edu/workingpapers/fullPapers/2003/0301_020103.pdf, Accessed 7.10.2007
Legner, C. & Heutschi, R. 2007. SOA Adoption in Practice - Findings from Early SOA Implementations. In Österle, H., Schelp, J, & Winter, R. (Eds.) Proceedings of the 15th European Conference on Information Systems (ECIS 2007), St. Gallen, 07.-09.06.2007. Available from: http://www.alexandria.unisg.ch/publications/35214, Accessed 29.3.2008
Litwin, M.S. 1995. How To measure Survey Reliability and Validity. Thousand Oaks, California: SAGE Publications, Inc.
Lucas, H. C. 1999. Information Technology and the Productivity Paradox: Assessing the Value of Investing in IT. New York: Oxford University Press.
Luftman, J.N. & Lewis, P. R. & Oldach S. H. 1993. Transforming the enterprise: The alignment of business and information technology strategies. IBM Systems Journal, 32 (1), 198-221.
Luftman, J. & Brier, T. 1999. Achieving and Sustaining Business-IT Alignment. California Management Review, 42 (1), 109-122.
Maier, R. 2002. Knowledge Management Systems. Heidelberg: Springer-Verlag.
Malan, R. & Bredemayer, D. 2002. Less is More with Minimalist Architecture. IEEE IT Pro, Septemper/October, 48, 46-47
Mattern, F. & Schönwälder, S. & Stein, W. 2003. Fighting complexity in IT. McKinsey Quarterly, (1)
Matzler, K. & Renzl, B. 2001. Patterns in Management Research: An Analysis of US American, European and German Approaches.
McNabb, D.E. 2004. Research Methods for Political Science. Quantitative and Qualitative Methods. Armonk, New York: M.E.Sharpe, Inc.
McMaster, T. 2000. The illusion of diffusion in information systems research. In L. Svensson, U. Snis, C. Sørensen, H. Fägerlind, T. Lindroth, M. Magnusson, C. Östlund (eds.), Proceedings of IRIS 23. Laboratorium for Interaction Technology, University of Trollhättan Uddevalla.

215
Meyer, N.D. 2006. The Truth About Steering Committees. CIO.com. Available from: http://www.cio.com/article/print/27019, Accessed 25.6.2007
Millman, G.J. 2004. What Did You Get from ERP, and What Can You Get? Financial Executive. May, 04. Available from: www.170systems.com/about/press_room/What_Did_You_Get_From_ERP_FEI_052004.pdf, Accessed 19.3.2006
Moore, G.E. 1965. Cramming more components onto integrated circuits. Electronics, 38 (8), 114-117.
Moore, G.R. 2006. Crossing the Chasm. Marketing and Selling Technology Products to Mainstream Customers. Second Edition. Padstow, Cornwall: Capstone Publishing Limited.
Moore, D.S. & McCabe, G.P. 1999. Introduction to the practice of statistics. Third edition. New York: W.H. Freeman and Company.
Moore, D.S. 2000. Statistics. Concepts and Controversies. Fifth Edition. New York: W.H. Freeman and Company.
Myers, M.D. 1997. Qualitative Research in Information Systems. MIS Quarterly, 21 (2), 241-242. MISQ Discovery, archival version, June 1997, Available from http://www.misq.org/discovery/MISQD_isworld/. MISQ Discovery, updated version, last modified: July 26, 2005, Accessed 7.1.2006
NASCIO. 2003. NASCIO Enterprise Architecture Maturity Model. Version 1.3. Lexington, KY: National Association of State Chief Information Officers (NASCIO). Available from: http://www.nascio.org/nascioCommittees/ea/EAMM.pdf, Accessed 7.5.2006
NASCIO. 2005. The States and Enterprise: How far have we come? Findings from the NASCIO 2005 EA Assessment. The National Association of Chief Information Officers (NASCIO). 2005 NASCIO EA Assessment. Available from: https://www.nascio.org/nascioCommittees/ea/eaAssessment.pdf, Accessed 18.12.2005
Nayak, P.R & Drazen, E. & Kastner, G. 1992. The High Performance Business: Accelerating Performance Improvement. Prism. Arthur D. Little's journal. Issue 1. Available from: http://www.adl.com/insights/prism/index.php?pYear=1992, Accessed 4.12.2005
Neilson, G. & Pasternack, B.A. & Mendes, D. 2003. The Four Bases of Organizational DNA. Strategy + Business. 33.
NSF. 2004. Information Technology Innovation Survey: Fall 2001. Arlington, VA: National Science Foundation, Division of Science Resources Statistics. NSF 04-305.
Nunamaker, J.F. & Chen, M. & Purdin, T.D.M. 1991. Systems development in information systems research. Journal of Management Information Systems, 7 (3), 89-106.

216
OASIS. 2006a. Reference Model for Service Oriented Architecture 1.0. OASIS Open, soa-rm-cs. Available from: http://www.oasis- open.org/committees/tc_home.php?wg_abbrev=soa-rm, Accessed 30.1.2007
OASIS. 2006b. Web Services Security Version 1.1. OASIS. Available from: http://www.oasis- open.org/specs/index.php#wssv1.1, Accessed 11.5.2008
OASIS. 2007a. Web Services Coordination (WS-Coordination) Version 1.1. OASIS, wstx-wscoor-1.1- spec-errata- os. Available from: http://docs.oasis- open.org/ws- tx/wstx-wscoor- 1.1-spec-errata-os.pdf, Accessed 11.5.2008
OASIS. 2007b. Web Services Atomic Transaction (WS-AtomicTransaction) Version 1.1. OASIS, wstx- wsat-1.1-spec-errata-os. Available from: http://docs.oasis-open.org/ws- tx/wstx-wsat-1.1-spec-errata- os.pdf, Accessed 11.5.2008
OASIS. 2007c. OASIS Web Services Business Activity Version 1.1. OASIS, wstx-wsba-1.1-spec-errata- os. Available from: http://docs.oasis-open.org/ws-tx/wstx-wsba-1.1-spec-errata-os.pdf, Accessed 11.5.2008
OASIS. 2007d. Web Services Business Process Execution Language Version 2.0. OASIS, wsbpel-v2.0- OS. Available from: http://docs.oasis-open.org/wsbpel/2.0/wsbpel-v2.0.pdf, Accessed 11.5.2008
OASIS. 2007e. Web Services Business Process Execution Language Version 2.0. Primer. OASIS, wsbpel-primer. Available from: http://docs.oasis- open.org/wsbpel/2.0/Primer/wsbpel-v2.0-Primer.pdf, Accessed 11.5.2008
OASIS. 2008. Web Services Reliable Messaging (WS-ReliableMessaging) Version 1.1. OASIS, wsrm-1.1-spec-os-01-e1. Available from: http://docs.oasis-open.org/ws-rx/wsrm/v1.1/wsrm.pdf, Accessed 11.5.2008
OECD. 2004. OECD Principles of Corporate Governance. Paris: OECD Publications, No. 53533 2004.
OMB. 2005. EA Assessment Framework 2.0. United States Office of Management and Budget, Federal Enterprise Architecture Program. Available from: http://www.whitehouse.gov/omb/egov/documents/OMB_EA_Assessment_Framework_2_FINAL.pdf, Accessed 18.12.2005
OMB. 2006. Standards and Guidelines for Statistical Surveys. Office of Management and Budget. Available from: www.whitehouse.gov/omb/inforeg/statpolicy/standards_stat_surveys.pdf, Accessed 7.10.2007
OMB. 2007. OMB 2007 EA Assessment Results. Results of FY 2007 Federal Enterprise Architecture Assessment. Office of Management and Budget. Available from: http://www.whitehouse.gov/omb/egov/documents/2007_EA_Assessment_Results_Summary.pdf, Accessed 25.3.2008

217
OMG. 2007. SOA Executive Insight Report. The Object Management Group, SOA Consortium. Available from: http://www.soa- consortium.org/Executive_Insight_whitepaper-2007.pdf, Accessed 28.9.2007
OMG. 2008. CORBA FAQ. Available from: http://www.omg.org/gettingstarted/corbafaq.htm, Accessed 10.5.2008
Olkkonen, T. 1993. Johdatus teollisuustalouden tutkimustyöhön. Helsinki University of Technology. Industrial Economics and Industrial Psychology. Report No. 152.
The Open Group. 2003a. TOGAF 8.1. (The Open Group Architechture Framework) Version 8.1. "Enterprise Edition". San Fransisco, CA: The Open Group. Available from: http://www.opengroup.org/architecture/togaf8/procs/x/togaf81.pdf, Accessed 30.5.2005
The Open Group. 2006. Definition of SOA. Version 1.1. The Open Group SOA Working Group. Available from: http://www.opengroup.org/projects/soa/doc.tpl?CALLER=admin_summary.tpl&gdid=10632, Accessed 30.4.2007
O'Rourke, C. & Fishman, N. & Selkow, W. 2003. Enterprise Architecture Using the Zachman Framework. Boston, Massachusettes: Thomson Course Technology.
Paulk, M.C. 2001. A History of the Capability Maturity Model for Software. A presentation for Association for Software Engineering Excellence. Available from: http://www.dfw- asee.org/archive/cmm-history.pdf, Accessed 7.4.2006
Paulk, M.C. & Curtis, B. & Chrissis, M.B. & Weber, C. 1993. Capability Maturity Model for Software, Version 1.1. Carnegie Mellon University, Software Engineering Institute. CMU/SEI-93-TR-24.
Palvia, P. & Mao, E. & Salam, A.F. 2003. Management Information Systems Research: What's There In a Methodology? Communications of the Assosiation for Information Systems, 11 (16), 289-309.
Peltz, C. 2003. Web services orchestration. A review of emerging technologies, tools, and standards. Hewlett Packard, Co. Available from: http://devresource.hp.com/drc/technical_white_papers/WSOrch/WSOrchestration.pdf, Accessed 26.5.2007
Peterson, R. 2003. Information Strategies and Tactics for Information Technology Governance. In, Van Grembergen, W. (ed) Strategies for Information Technology Governance. Hershey: Idea Group Publishing.
Pfeffer, J. & Sutton, R.I. 1999. The Knowing - Doing Gap: How Smart Companies Turn Knowledge Into Action. Boston: Harvard Business School Press.
Pienimäki, T. 2005. A business application framework in manufacturing industry. Tampere University of Technology. Publication 530.

218
Pinto, J. 2001. The 3 laws of technology. Available from: http://www.jimpinto.com/writings/3laws.html, Accessed 4.3.2006.
Pirttimäki, V. 2007, Comparative Study and Analysis of the Intelligence Activities of Large Finnish Companies. Journal of Competitive Intelligence and Management. 4 (1) 147-170.
Pirttimäki, V. 2007. Business Intelligence as a Managerial Tool in Large Finnish Companies. Tampere University of Technology. Publication 646.
Popper, C. 2000. Holistic Framework for IT Governance. Cambridge, MA: Harvard University. Program on Information Resources Policy publication. Available from: http::/www.pirp.hardvard.edu, Accessed 27.5.2005
Porter. M. 1996. What Is Strategy? Hardvard Business Review, 74 (4), 61- 78.
Powers, C.P. & Troubh, R.S & Winokur, H.S. 2002. Report of Investigation by the Special Investigative Commitee of the Board of Directors of Enron Corp. FindLaw. Available from: http://news.findlaw.com/wp/docs/enron/specinv020102rpt1.pdf, Accessed 12.11.2005
Pulkkinen, M. & Hirvonen, A. 2005. EA Planning, Development and Management Process for Agile Enterprise Development. In Proceedings of the 38th Hawaii International Conference on System Sciences (HICSS'05), January 3-6. 223c-223c.
Rigby, D. 2005. Management Tools 2005. The Management Tools Survey. Bain & Company. Available from: http://www.bain.com/management_tools/2005_tools_strategy_brief.pdf, Accessed 28.2.2006
Rissanen, O.P. 2005. Valtionhallinnon yhteiset IT-palvelut. Nykytilan analyysi, esimerkkejä yhteisistä palveluista ja hahmotelma yhteisten IT- palvelujen tuottamisen tavoitetilasta. Valtiovarainministeriö. VM101:03/2004.
Roberto, M.A. & Levesque, L. C. 2005. The Art of Making Change Initiatives Stick. MIT Sloan Managment Review, 36 (4), 53-60.
Rogers, E. M. 2003. Diffusion of Innovations. 5th ed. New York: Free Press.
Romano, J. & Kromrey, J.D. & Coraggio, J. & Skowronek, J. 2006. Appropriate statistics for ordinal level data : Should we really be using t-test and Cohen’s d for evaluating group differences on the NSSE and other surveys? Paper presented at the annual meeting of the Florida Association of Institutional Research. February, 1-3. Cocoa Beach, Florida.
Ross, J. 2003. Creating a Strategic IT Architecture Competency: Learning in Stages. MIS Quarterly Executive, 2 (1), 31-43.

219
Ross, J. 2006. Enterprise Architecture: Driving Business Benefits from IT. MIT Sloan School of Management. 4614-06.
Ross, J.W. & Weill, P. & Robertson, D.C. 2006. Enterprise Architecture as Strategy: Creating a Foundation for Business Execution. Boston, Massachusetts: Hardvard Business School Press.
Ross, J.W. & Curran, C. 2008. Service Oriented Architecture – Adoption and Value Survey. Available from: http://www.surveymonkey.com/s.aspx?sm=KHsqO4DqqQp_2bhFoB3DYjeA_3d_3d, accessed 13.5.2008
Salle, M. 2004. IT Service Management and IT Governance: Review, Comparative Analysis and their Impact on Utility Computing. HP Laboratories Palo Alto, HPL-2004-98.
Schekkerman, J. 2005. Trends in Enterprise Architecture 2005: How are Organizations Progressing? Institute For Enterprise Architecture Developments. Available from: http://www.enterprise- architecture.info/Images/EA%20Survey/Enterprise%20Architecture%20Survey%202005%20IFEAD%20v10.pdf, Accessed 5.1.2006
Schober, M.F. & Conrad, F.G. 1997. Does conversational interviewing improve survey data quality beyond the laboratory? In Proceedings of the Survey Research Methods Section, American Statistical Association: Papers Presented at the 52nd Annual Conference of the American Association for Public Opinion Research May15- 18. Norfolk, Virginia. 910-915. Available from: http://www.amstat.org/sections/SRMS/proceedings/, Accessed 28.3.2008
SEI. 2002a. Software Acquisition Capability Maturity Model (SA-CMM), Version 1.03. Cooper, J. & Fisher, M. (eds). Carnegie Mellon Unversity, Software Engineering Institute. CMU/SEI-2002-TR-010.
SEI. 2002b. CMMI for Systems Engineering and Software Engineering (CMMI-SE/SW, V1.1). Staged Representation. Carnegie Mellon Unversity, Software Engineering Institute. CMU/SEI-2002-TR-002.
Simonsson, M. & Johnson, P. 2008. The IT organization modeling and assessment tool: Correlating IT governance maturity with the effect of IT. In Proceedings of the Proceedings of the 41st Annual Hawaii international Conference on System Sciences (January 07-10, 2008). HICSS. IEEE Computer Society, Washington, DC, 431.
SONIC. 2004. BAA Selects Sonic Enterprise Service Bus for Standards-Based Integration at Heathrow's Terminal Five. News release, Nov., 16. Progress Software. Available from: http://newsroom.progress.com/phoenix.zhtml?c=202961&p=irol- newsArticle_print&ID=644694&highlight=, Accessed: 8.6.2008

220
Sprott, D. 2004. Service Oriented Architecture: An Introduction for Managers. CBDI Forum Limited. Available from: http://www-306.ibm.com/software/solutions/soa/library.html, Accessed 3.5.2007
The Standish Group. 2001. Extreme CHAOS 2001. The Standish Group International, Inc. Available from: http://www.standishgroup.com/sample_research/PDFpages/extreme_chaos.pdf, Accessed 29.5.2005
Suessbrick, A.L. & Schober, M.F. & Conrad, F.G. 2001.Different respondents interpret ordinary questions quite differently.In Proceedings of the American Statistical Association, Section on the Survey Research Methods.Alexandria. VA: American Statistical Association.
Symons, C. & Cecere, M. & Young, G.O. & Lambert, N. 2005. IT Governance Framework, Structures, Processes, And Communication. Cambridge, MA: Forrester Research Inc. 36563.
Sveiby. 1992. The Knowledge Company: Strategy formulation in knowledge-intensive industries. International Review of Strategic Management, 3.
Schwabsky, N. & Vigoda-Gadot, E. & Shoham, A. & Ruvio, A. 2004. Towards a performance orientation measurement grid: the impact of innovativeness and organizational learning on organizational performance in the public sector. The 2004 European Group of Public Administration (EGPA) meeting, Ljubljana, Slovenia. Available from: http://soc.kuleuven.be/io/egpa/qual/ljubljana/ljubljana.htm, Accessed 17.6.2007
Talouselämä. 2005. Talouselämä Top 500 listing of the companies in Finland. URL http://www.talouselama.fi/te500list_eng.te, Accessed, 4.12.2005
Teece, D.J. & Pisano, G. & Shuen, A. 1997. Dynamic Capabilities and Strategic Management. Strategic Management Journal, 18 (7), 509–533.
ter Doest, H. & Iacob, M-E. & Lankhorst, M. & van Leeuwen, D. & Slagter, R. 2004. Viewpoints Functionality and Examples. ArchiMate D3.4.1a v2.6. Telematica Instituut. TI/RS/2003/091. Available from: https://doc.telin.nl/dscgi/ds.py/Get/File-35434, Accessed 5.8.2007
Tether, B. S. 2003. What is innovation? Approaches to Distinguishing New Products and Processes from Existing Products and Processes. Manchester: The University of Manchester, Centre for Research on Innovation & Competition, CRIC WP 12, ISBN 1-84052-010-8
Tolvanen, K. 2007. The drivers' costs were increased because of problems in AKE's IS renowal project. Aamulehti, June, 11, A5.

221
Tidd, J. & Bessan, J. & Pavit, K.. 2005. Managing Innovation: Integrating technological, market and organizational change. 3rd edition. Chichester, West Sussex: John Wiley & Sons Ltd.
Treacy, M. & Wiersema, F. 1997. The Discipline of Market Leaders. Reading, Massachusetts: Addison-Wesley Publishing.
Van Grembergen, W. 2000. The Balanced Scorecard and IT Governance. Information Systems Control Journal, 2, 40-43.
Van Grembergen, W. & Saull, R. & De Haes, S. 2003. Linking the IT Balanced Scorecard to the Business Objectives at a Major Canadian Financial Group. Journal of Information Technology Cases and Applications, 5 (1)
Van Grembergen, W. & De Haes, S. 2004. IT Governance and its Mechanisms. Information Systems Control Journal. 1.
Venkatesh, V. & Morris, M. & Davis, G. & Davis, F. 2003. User acceptance of information technology: toward a unified view. MIS Quarterly, 27 (3), 425-478.
Venkatesh, V. & Davis, F.D. 1995. Measuring User Acceptance of Emerging Information Technologies: An Assessment of Possible Method Biases. HICSS, Proceedings of the 28th Hawaii International Conference on System Sciences. 729-736
W3C. 2000. Simple Object Access Protocol (SOAP) 1.1. W3C Note. Available from: http://www.w3.org/TR/2000/NOTE-SOAP- 20000508/, Accessed 27.5.2007
W3C. 2001. Web Services Description Language (WSDL) 1.1. W3C Note. Available from: http://www.w3.org/TR/wsdl, Accessed 27.5.2007
W3C. 2002a. XML-Signature Syntax and Processing. W3C Recommendation. Available from: http://www.w3.org/TR/xmldsig-core/, Accessed 11.5.2008
W3C. 2002b. XML Encryption Syntax and Processing. W3C Recommendation. Available from: http://www.w3.org/TR/xmldsig-core/, Accessed 11.5.2008
W3C. 2004a. Web Services Addressing (WS-Addressing). W3C Member Submission. Available from: http://www.w3.org/Submission/ws- addressing/, Accessed 11.5.2008
W3C. 2004b. WS Choreography Model Overview. W3C Working Draft. Available from: http://www.w3.org/TR/ws-chor-model/, Accessed 11.5.2008
W3C. 2005. Web Services Choreography Description Language Version 1.0. W3C Candidate Recommendation. Available from: http://www.w3.org/TR/ws- cdl- 10/, Accessed 27.5.2007

222
W3C. 2006a. Web Services Policy 1.2 - Framework (WS-Policy). W3C Member Submission. Available from: http://www.w3.org/Submission/WS- Policy/, Accessed 11.5.2008
W3C. 2006b. Web Services Choreography Description Language: Primer Version 1.0. Editors' copy. Available from http://www.w3.org/2002/ws/chor/edcopies/primer/primer.html, Accessed 27.5.2007
Watson, R. 2001. A Good Theory. In Lee, A.S. (ed.). Research in Information Systems: What We Haven't Learned, MIS Quarterly 25 (4)
Weill, P. 1992. The Relationship Between Investment inf Information Technology and Firm Performance: A Study of The Valve Manufactoring Sector. MIT Sloan School of Management. 3431.
Weill, P. & Woodham, R. 2002. Don't Just Lead, Govern: Implementing Effective IT Governance. MIT Sloan School of Management, WP No. 4237-02.
Weill, P. 2004. Don't Just Lead, Govern: How Top Performing Firms Govern IT. MIS Quarterly Executive, 3 (1), 1- 17.
Weill, P. & Ross, J.W. 2004a. IT Governance. How Top Performers Manage IT Decision Rights for Superior Results. Boston, Massachusetts: Hardvard Business School Press.
Weill, P. & Ross, J.W. 2004b. IT Governance on One Page. MIT Sloan School of Management, WP No. 4516-04.
Westfall, R.D. 1999. An IS Research Relevance Manifesto. Communications of the Assosiation for Information Systems, 2 (14).
Wheeler, B.C. 2002. NEBIC: A Dynamic Capabilities Theory for Assessing Net- Enablement. Information Systems Research, 13 (2), 125-146.
Williamson, O.E. 1999. Strategy Research: Governance and Competence Perspectives. Strategic Management Journal, 20 (12) 1087-1108.
Zachman, J.A. 1987. A Framework for Information Systems Architechture. IBM Systems Journal, 26 (3), 276-292.
Zachman, J.A. & Sowa, J.F. 1992. Extending and formalizing the framework for information systems architechture. IBM Systems Journal, 31 (3), 590- 616.
Zachman, J.A. 1997. Enterprise Architecture: The Issue of the Century. An edited version of an article in Database Programming and Design. Zachman Institute for Framework Advancement, Zifa06.doc. Available from: www.zifa.com, Accessed 1.11.2005.

223
Zachman, J.A. 1998 The Framework for Enterprise Architecture Cell Definitions. Zachman Institute for Framework Advancement, Zifa03.doc. Available from: www.zifa.com, Accessed 29.4.2007.
Zachman, J.A. 1999. Enterprise Architecture: The Past and the Future. DM Review Magazine. Available from: http://www.dmreview.com/article_sub.cfm?articleId=1702, Accessed 19.10.2005.
Zachman, J.A. 2004. The Zachman Framework and Observations on Methodologies. Business Rules Journal, 5 (11). Available from: http://www.brcommunity.com/articles.php, Accessed 20.11.2005.
Yamane, T. 1973. Statistics: an Introductory Analysis. 3rd Ed. New York, NY: Harper and Row. Harper International Edition.
Ylimäki, T. 2006. Potential Critical Success Factors for Enterprise Architecture. Journal of Enterprise Architecture, 2 (2), 29-40.

224
APPENDIX A: THE QUESTIONNAIRE IN ENGLISH
The study’s goal is to survey companies’ IT governance capabilities and enterprise architecture maturity, and their relation to service-oriented architecture adoption. In this study, information technology comprises of all applications, systems, infrastructure, services, people and other resources that an organization needs to use and manage its information.
Service-oriented architecture (SOA) is a design paradigm and an architectural style based on modeling an enterprise’s business processes and IT capabilities as services.
1. Which of the following is the best description of your organization's relation to SOA?
a) We are not aware of SOA
b) We are aware of SOA, but have not tried to learn more about it. Please, see an additional question below.
c) We are actively seeking knowledge of SOA what is, how it works and why it works
d) We have learned about SOA characteristics and are currently assessing SOA’s potential benefits for us
e) We are currently preparing for the decision of either adopting or rejecting SOA
f) We have just decided to adopt SOA
g) We have just decided to reject SOA adoption, at least for time being. Please, see an additional question below.
h) We are currently implementing SOA with one or more selected pilot projects
i) We have implemented one or more pilot projects and have decided to expand our adoption of SOA
j) We have implemented one or more pilot projects, but have decided not to expand our adoption of SOA. Please, see an additional question below.
k) We are already committed to SOA and are widely implementing it
If your answer to the previous question was b), then why have you not tried to learn more about SOA? If your answer to the previous question was g), then why have you decided to reject SOA? If your answer to the previous question was j), then why have you decided not to expand your adoption of SOA? 2. When was the first SOA implementation project started? Please indicate the exact year. __________ 3. When did you decide of a wide-scale SOA adoption? Please indicate the exact year. __________ 4. Approximately what percentage of your new IT implementations are based on SOA (money) ? ___ % 5. How successful have your SOA implementations been in the following aspects? Please indicate your opinion on a scale from 1 (not successful) to 5 (very successful)?
1 2 3 4 5
Completed on time?
Completed on budget?
Implemented with all features and functions initially specified?
Delivering the benefits and value expected?

225
6. What has been the most challenging issue in SOA adoption?
IT governance cababilities
IT governance is the process by which firms align IT actions with their performance goals and assign accountability for those actions and their outcomes. IT governance is the decision rights and accountability framework for encouraging desirable behaviors in the use of IT.
1. Has your company adopted IT governance approach ie. have you defined structures, processes and mechanisms for IT governance? ___ Yes ___ No If "yes", in which year was IT governance usage started: _________ 2. IT governance performance a) How important are the following outcomes of your IT governance, on a scale from 1 (not important) to 5 (very important)
1 2 3 4 5
Cost effective use of IT
Effective use of IT for company’s growth
Effective use of IT for asset utilization
Effective use of IT for business flexibility
b) How successful is your IT governance to produce the following outcomes, on a scale from 1 (not successful) to 5 (very successful)?
1 2 3 4 5
Cost effective use of IT
Effective use of IT for company’s growth
Effective use of IT for asset utilization
Effective use of IT for business flexibility
c) How successful are your IT projects in the following aspects? Please indicate your opinion on a scale from 1 (not successful) to 5 (very successful)?
1 2 3 4 5
Completed on time?
Completed on budget?
Implemented with all features and functions initially specified?
Delivering the benefits and value expected?

226
For the following statements, please select the choice that best represents your opinion. If not otherwise stated, please indicate your opinion on a scale from 1 (strongly disagree) to 5 (strongly agree). 3. IT value generation capabilities
Business case approach is used to assess proposed IT investments. A predefined evaluation criteria typically considers business needs and opportunities, costs, benefits and risks attached with the investment.
n 1 2 3 4 5
a) Our approach to IT performance measurement is an effective way to ensure that IT delivers against our strategy (n = IT performance measurement is not used in our company)
b) Our approach to Service Level Agreements (SLAs) is an effective way to ensure that IT services meet the requirements (n = Service Level Agreements are not used in our company)
c) Our business cases approach is an effective way to evaluate the proposed IT investments. (n = we do not use business case approach to evaluate IT investments)
d) We use an effective formal procedure to ensure that our IT investments comply with our enterprise architecture (n = we do not have a formal procedure to ensure IT investment’s architecure compliance)
IT portfolio management is an approach to manage IT investments and the life cycle of IT systems. IT investments and production IT systems are divided into appropriate portfolio categories such as transactional, informational and strategic applications, and IT infrastructure. High-level resource allocation decisions are made across the categories. Each of these IT portfolio categories is separately managed, funded and prioritized.
n 1 2 3 4 5
e) Our IT portfolio approach is an effective way to manage our IT investments and the life cycle of our IT systems. (n = we do not use an IT portfolio management approach)
Post-implementation reviews (PIRs) are typically conducted to evaluate the actual success of the IT investment project against the original business case ie. the targeted business needs and opportunities, costs, benefits and risks. The PIR information is compiled, and "lessons learned" from the project are disseminated to all relevant parties.
n 1 2 3 4 5
f) We have an effective formal procedure for post-implementation reviews that is used to evaluate the success of IT investment projects and to share the "lessons learned". (n = we do not use formal procedure for post-implementation reviews)

227
4. Enterprise alignment
Organizations use governance structures - such as IT strategy committee, IT steering committee, IT investment committee and architecture committee - to facilitate, guide and oversee the implementation of IT strategy and ensure enterprise’s business/IT alignment.
n 1 2 3 4 5
a) Our IT strategy is aligned with our business strategy (n = we do not have an explicit IT strategy)
b) We have appropriate IT governance structures and mechanisms that facilitate the implementation of our IT strategy (n = we do not have formal IT governance structures)
c) Our IT systems and services support our operating model and business processes successfully
d) Our enterprise architectures at business unit and function level are aligned with our enterprise level enterprise architectures (n = we do not have an explicitely documented enterprise architecture)
5. IT related risk mitigation
1 2 3 4 5
a) We have an effective IT control framework that achieves clear roles, responsibilities and accountabilities
b) We have a high awareness of IT's impact on business continuity
c) We have apporpriate management of IT-related risks: the risks are mitigated and monitored, the current risk levels are accepted by senior management
6. Business agility and enterprise flexibility
1 2 3 4 5
a) Our IT is capable of quickly adapting and responding to new and changing requirements from the business environment
b) Our IT services enable effective information and knowledge use
c) Our IT has capacity to follow and understand major technological events and trends to enable IT-driven strategic business change
d) We have successfully taken advantage of IT’s enabling capacity for new business models

228
7. Organizational IT capabilities and learning
1 2 3 4 5
a) Our senior management and board is engaged in IT related issues and decision making
b) We have a widespread understanding and participation in IT governance at all levels of organization
c) We have constructive relationships and effective communication between business and IT, and with external partners
d) We are successful in implementing the organizational changes that are required to benefit from the new opportunities created by an IT investment
e) We are able to learn from each IT implementation, which is clearly reflected in our capability to make better and faster IT related decisions
Enterprise Architecture Maturity
1. Operating model
A company’s operating model consists of its main organization structure, core processes, culture, management systems and information technology. The selected operating model defines a company's business process integration and standardization needs.
n 1 2 3 4 5
a) We have a clearly articulated operating model that drives IT use in our company (n = we do not have an explicit operating model)
b) We have a clearly articulated business strategy that drives our IT (n = we do not have explicit business strategies)
c) Our senior management has clarified IT's role in executing our operating model and business strategy (n = we do not have explicit statements about IT's role)
e) What is your company's operating model in terms of business process integration and standardization requirements? Our business processes' integration requirements are: ___ Low ___ High Our business processes' standardization requirements are: ___ Low ___ High
Enterprise architecture (EA) is an approach that identifies the main components of the organization including

229
information technology, and the ways in which these components work together in order to achieve defined business objectives, and the way in which the information systems support the enterprise's business processes. Enterprise architecture comprises of business architecture, which describes the company’s business processes, information architecture, which describes the key data and information, application architecture, which describes the applications used, and technology architecture, which describes the related technological components.
2. Has your company adopted enterprise architecture approach ie. have you explicitely defined structures, processes and mechanisms for enterprise architecture development, use and governance? ___ Yes ___ No If "yes", in which year enterprise architecture usage started: _________ 3. Which of the following are the best descriptions of the focus of your enterprise architecture development efforts? Please select at most two descriptions; mark your primary focus area with ‘1’ and your secondary focus area with ‘2’
Focus area Enterprise architecture focus area
a) We focus on the needs of our business units and functions, our enterprise architecture comprises mainly of these local applications and related infrastructure
b) We focus on making IT an enterprise-wide asset by creating standardized IT infrastructure and shared services. We try to generate IT cost savings and increased IT efficiency
c) We focus on creating enterprise-wide standard business processes and sharing of data and information to achieve business and operational efficiency.
d) Our focus is in creating reusable application and business process components to enable strategic business agility and better integration of business and IT.
e) Our focus is in merging of our partner network's processes to our processes using standardized interfaces. We are attempting to create ROI with dynamic venturing.
4. How your current enterprise architecture development efforts are spread across the different enterprise architecture domains? Please indicate your opinion on a scale 1 = not important to 5 = very important
1 2 3 4 5
Business architecture
Information architecture
Application architecture
Technology architecture
5. Enterprise architecture completetion
Business architecture is a description of the enterprises business ie. the business processes and related critical elements of the enterprise such as customers, stakeholders and organizations.
a) Which of the following is the best description of your business architecture maturity level?
0. We have not documented our business processes

230
1. We have identified and documented our business processes
2. We have identified and documented our current business processes and their linkage to applications, key data and IT infrastructure as well as to key business elements such as customers, stakeholders and organizations
3. We have identified and documented our high-level target business processes and their linkage to applications, key data and IT infrastructure as well as to key business elements such as customers, stakeholders and organizations
4. We have defined a road map (transition strategy) showing how the transformation from current to target business architecture is made
5. Our business architecture is regurlarly monitored, measured and updated
Information architecture defines the key data and information needed to support the business, and the ways how they are disseminated and managed
b) Which of the following is the best description of your information architecture maturity level?
0. We have not identified and documented our key data and information
1. Our key data and information is identified and documented
2. Our key data and information as well as the data exchange packages, data suppliers and consumers are identified and documented
3. We have defined a high-level target information architecture that provides consolidation and information sharing
4. Our information architecture provides mechanisms for information dissemination and security
5. We have appropriate prodecures for information life-cycle management and we use standards when applicable
Application architecture consists of the portfolio of applications and IT systems that support the organizational and business process needs
c) Which of the following is the best description of your application architecture maturity level?
0. We do not have a comprehensive documented inventory of our current applications
1. We have a comprehensive inventory of our current applications
2. We have documented our current applications’ linkage to our business processes, key information, IT infrastructure and security processes
3. We have defined our target applications, and their linkage to our target business processes, key information, IT infrastructure and security processes
4. Our target applications are included in our transformation road map and drive our transition planning and IT investment decision-making. Standardization and reuse are enforced.
5. Our application architecture is regurlarly updated. Standardization and reuse is monitored and measured.

231
Technology architecture contains the definitions of what supporting technology is in place to provide an environment for applications ie. IT infrastructure, security, management, networking and other capabilities required to support the organization and business processes.
d) Which of the following is the best description of your technology architecture maturity level?
0. We have not defined standards for our current technology products
1. We have identified technology products base and we have defined our current technology product standards
2. Our current technology products are linked to business processes, key information, applications and security processes. We have defined interoperability standards for business units and functions.
3. We have defined our target technology products base and it is linked to our target business processes, key information, applications and security processes. Interoperability standards are defined for business units and functions.
4. Our target technology products base is included in our transformation road map, and drives our IT investment decision-making. Standardization and reuse of technology components is enforced.
5. Our target technology products base is regurlarly updated, and standardization and reuse is monitored and measured. A well defined process for insertion of new technologies exists.
Transition strategy is a roadmap, a "master plan", of how the vision of the “to-be” state of the enterprise, can be achieved by going through a set of interim states. Development of the transition plan is based on a gap analysis of the target and current states.
e) Which of the following is the best description of your transition strategy maturity level?
0. We do not have a road map for the target state of enterprise architecture
1. We have appropriate processes of conducting gap analysis, alternatives analysis, and project management
2. We have performed a redundancy and gap analysis, and identified opportunities for consolidation and reuse, and the gaps between "as-is" and "to-be" architectures
3. We have defined programs and projects to implement a documented sequencing plan which integrates performance improvement, security planning, staffing and facilities plans, and documents the enterprise transition stages
4. We have a clear linkage between the programs and projects in our transition strategy and our IT investment portfolio
5. We use measurement to ensure our progress to our target enterprise architecture
6. Enterprise architecture effectiveness and value a) Which of the following is the best description of how business-driven your enterprise architecture management is?
0. Our EA efforts are mainly IT-driven, not business-driven
1. Our EA development is informal, processes ensuring a business-driven EA are incomplete and inconsistent across business units.

232
2. Business domains and stakeholders are identified for each architecture and business domain
3. The business needs and requirements to be answered by EA are identified and documented for each architecture and business domain
4. EA artifacts are designed and measured against the identified business needs and requirements
5. Business improvement opportunities are continuously identified and progress towards meeting the needs is demonstrated. Business questions and needs are driving EA development and usage
b) Which of the following is the best description of your abilities for sharing and reuse?
0. Reuse is an ad hoc process at the IT implementation project level
1. Reuse is an informal process at the business unit and function level
2. Applications and service, and key information reuse is promoted and a catalog of current applications and services is available for all stakeholders
3. An appropriate procedure for ensuring proper reuse and sharing, and a tool for measuring reuse cost savings exist
4. Cost savings are demonstrated by reuse of components
5. Enterprise wide reuse savings occur consistently and include systems and technologies.
c) Which of the following is the best description of how you evaluate the improvement of your business processes and services as a result of your EA efforts?
0. We have not evaluated the improvement of our business processes and services as a result of our EA efforts
1. We have identified our stakeholders, customers and users, and we have conducted a satisfaction survey or a needs assessment for improving services
2. We have identified and documented metrics for business process and service improvements, and linked them to our EA transition strategies and implementation plans. Roles and responsibilities for measuring improvements are assigned for each business domain
3. We track our progress towards meeting our projected process and service improvements
4. We measure our EA effectiveness against the business process and service improvement criteria
5. We use the needs of our stakeholders, customer and users to continuously inform EA decision-making and resource allocation
d) Which of the following is the best description of your IT implementation improvement as the result of your EA efforts
0. We do not use a formal procedure for making decisions and managing our IT investments
1. We have formal procedure for decision-making and management of our IT investments, but it does not rely on our enterprise architecture
2. Enterprise architecture is integrated in our IT investment decision-making and management. Our IT developers are aware of EA - including technical and interoperability standards and reuse strategy
3. We use enterprise architecture to drive our IT investments and IT systems life cycle management
4. We have a documented plan for evolving service-oriented architectures to various business segments

233
5. We have implemented service-oriented architectures and realized its benefits
Peceived SOA characteristics
For the following statements, please select the choice that best represents your opinion. If not otherwise stated, please indicate your opinion on a scale from 1 (strongly disagree) to 5 (strongly agree), n (no opinion) 1. Relative advantage
n 1 2 3 4 5
a) We see SOA as a method to promote standardization and commoditization of our IT infrastructure leading to reduced IT costs
b) We see SOA as an approach for better utilization of our current IT assets by SOA-enabling our applications to take part in new service-oriented solutions
c) We see SOA as an efficient way to improve our data and information life cycle management
d) We see SOA as an efficient tool to shorten our IT system development cycles
e) We see SOA as an effective approach to improve and integrate our business processes
f) We see SOA as an efficient tool to reduce our products time to market
g) We see SOA as an efficient and effective way of enhancing our business by connecting our own capabilities with the capabilities of our partner network
h) We see SOA as an important tool in executing our company's strategy
i) We see SOA as mandated in order to take part in our partners' process networks
j) Another important advantage of SOA, please specify?
2. Compatibility
n 1 2 3 4 5
a) SOA fits well with our current way of managing business and business processes
b) Our current applications can be SOA-enabled to participate in a service-oriented architecture
c) Our current IT infrastructure supports well SOA adoption
d) Our current security policies and architecture can easily be adapted to include SOA

234
e) Our current IT funding mechanisms fit well with adopting SOA
f) SOA related skills and competencies can easily be included in our current set of business skills and competencies
g) SOA related skills and competencies can easily be included in our current set of IT skills and competencies
h) Our current business and IT needs can well be solved with SOA, SOA fits well to our needs
3. Complexity Please assess the complexity of SOA on a scale from 1 (not complex) to 5 (very complex).
1 2 3 4 5
a) How complex SOA is to understand?
b) How complex SOA is to learn?
c) How complex SOA is to adopt?
4. Other SOA characteristics
n 1 2 3 4 5
a) We regard SOA as easily triable ie. selecting and implementing pilot projects is relatively easy
b) We think SOA technologies are sufficiently mature to be implemented
c) We think that knowledge and support for SOA adoption is easily available
d) We think that SOA has high initial investment costs
e) The results from adopting SOA are clearly visible to our users
f) The results from adopting SOA are clearly visible to our key stakeholders and partners
g) Our industry’s competitive environment creates pressures for adopting SOA

235
Other prior conditions
For the following questions, please consider your company as a whole.
n 1 2 3 4 5
a) We have a positive attitude to change
b) We are continously seeking new tools and approaches that could improve our operations
c) We are generally successful in selecting the tools and approaches that fit well for us
d) We are generally successful in adopting new tools and approaches
e) After adopting a new tool or approach we assess how our operations have improved by its adoption

236
APPENDIX B: THE QUESTIONNAIRE IN FINNISH
Tutkimuksen tarkoituksena on tarkastella yrityksen IT:n hallinnoinnin ja yritysarkkitehtuurin kypsyysasteen vaikutusta palvelusuuntautuneen arkkitehtuurin (SOA) käyttöönottoon.
Tässä tutkimuksessa informaatioteknologia (IT) käsitetään laajasti pitäen sisällään kaikki organisaation informaation käsittelyyn tarvitsemat sovellukset, järjestelmät, infrastruktuurin, palvelut, henkilöstön ja muut resurssit.
Palvelusuuntautunut arkkitehtuuri (Service-Oriented Architecture, SOA) on menetelmä, joka perustuu yrityksen liiketoiminnan ja IT:n mallintamiseen palveluina.
1. Mikä seuraavista vaihtoehdoista kuvaa parhaiten yrityksenne suhdetta SOA:aan? Valitkaa vain yksi vaihtoehto.
a) Emme ole tietoisia SOA:sta.
b) Olemme tietoisia SOA:sta, mutta emme ole hankkineet siitä lisää tietoa. Katso lisäkysymys alla.
c) Etsimme aktiivisesti tietoa SOA:sta: mitä se on, miten se toimii ja miksi se toimii.
d) Tunnemme SOA:n ominaisuudet, arvioimme parhaillaan mitä hyötyjä ja haittoja SOA:sta olisi yrityksellemme.
e) Teemme parhaillaan selvityksiä, jotta voimme päättää otammeko SOA:n käyttöön vai emme.
f) Olemme juuri päättäneet aloittaa SOA käyttöönoton.
g) Olemme juuri päättäneet hylätä SOA käyttöönoton, ainakin toistaiseksi. Katso lisäkysymys alla.
h) Toteutamme parhaillaan yhtä tai useampaa SOA pilottiprojektia.
i) Olemme toteuttaneet yhden tai useamman SOA-pilottiprojektin ja päättäneet laajentaa SOA-käyttöönottoa.
j) Olemme toteuttaneet yhden tai useamman pilottiprojektin, mutta olemme päättäneet olla laajentamatta SOA-käyttöönottoa. Katso lisäkysymys alla.
k) Olemme jo siirtyneet SOA:n laajamittaiseen käyttövaiheeseen.
Jos vastasitte edelliseen kysymykseen b) -vaihtoehdolla, niin miksi ette ole hankkineet SOA:sta lisää tietoa? Jos vastasitte edelliseen kysymykseen g) -vaihtoehdolla, niin miksi olette päättäneet hylätä SOA-käyttöönoton? Jos vastasitte edelliseen kysymykseen j) -vaihtoehdolla, niin miksi ette laajenna SOA-käyttöönottoa? 2. Minä vuonna ensimmäinen SOA toteutusprojekti aloitettiin? ________________ 3. Minä vuonna päätitte SOA:n laajamittaisesta käyttöönotosta? ________________ 4. Arviolta kuinka monta prosenttia euromääräisesti uusista IT investoinneistanne perustuu SOA:aan? _______ % 5. Miten onnistuneita SOA-projektinne ovat olleet seuraavissa näkökulmissa? Arviokaa käyttäen asteikkoa yhdestä viiteen: 1 = epäonnistunut, 5 = erittäin onnistunut?
1 2 3 4 5
Aikataulun pitävyys
Kustannusarvion pitävyys
Ennalta määritettyjen ominaisuuksien ja toiminnallisuuden toteuttaminen
Odotettujen hyötyjen ja lisäarvon tuottaminen

237
6. Mitkä ovat olleet keskeiset haasteet SOA:n käyttöönotossa?
IT governance kyvykkyydet
IT governance (hyvä tiedonhallintatapa) määrittää organisaatiorakenteet, prosessit ja mekanismit joilla IT:n käyttöä yrityksessä hallinnoidaan. Näiden päämääränä on yhdensuuntaistaa IT-toiminnot liiketoiminnan vaatimusten ja tavoitteiden kanssa sekä asettaa vastuut ja velvollisuudet näiden IT-toimintojen suorittamisesta ja haluttujen tulosten aikaansaamisesta.
1. Onko yrityksenne ottanut käyttöön IT governance menetelmän ts. onko yrityksenne määritellyt IT-päätöksentekoon ja -vastuisiin liittyvät hallinnoinnin rakenteet, prosessit ja mekanismit? ___ Kyllä ___ Ei Jos “kyllä”, niin minä vuonna toiminta on aloitettu : _________ 2. IT governance suorituskyky a) Miten tärkeitä seuraavat IT governance-menettelyjen avulla aikaansaadut tulokset ovat yrityksellenne asteikolla yhdestä viiteen: 1 = ei tärkeä, 5 = erittäin tärkeä?
1 2 3 4 5
Kustannustehokas IT:n käyttö
IT:n vaikuttava käyttö yrityksen kasvun mahdollistamiseksi
IT:n vaikuttava käyttö yrityksen resurssien tehokkaaksi hyödyntämiseksi
IT:n vaikuttava käyttö liiketoiminnan joustavuuden mahdollistamiseksi
b) Miten hyvin yrityksenne IT governance-menettelyt ovat onnistuneet aikaansaamaan seuraavat tulokset asteikolla yhdestä viiteen: 1 = epäonnistunut, 5 = erittäin onnistunut?
1 2 3 4 5
Kustannustehokas IT:n käyttö
IT:n vaikuttava käyttö yrityksen kasvun mahdollistamiseksi
IT:n vaikuttava käyttö yrityksen resurssien tehokkaaksi hyödyntämiseksi
IT:n vaikuttava käyttö liiketoiminnan joustavuuden mahdollistamiseksi
c) Miten onnistuneita IT-projektinne ovat seuraavista näkökulmista tarkasteltuna? Arviokaa käyttäen asteikkoa yhdestä viiteen: 1 = ei onnistunut, 5 = erittäin onnistunut?
1 2 3 4 5
Aikataulun pitävyys
Kustannusarvion pitävyys
Ennalta määritettyjen ominaisuuksien ja toiminnallisuuden toteuttaminen
Odotettujen hyötyjen ja lisäarvon tuottaminen

238
Valitkaa seuraavien väittämien vaihtoehdoista se, joka parhaiten vastaa mielipidettänne. Ellei toisin pyydetty, niin ilmaiskaa mielipiteenne asteikolla yhdestä viiteen: 1 = täysin eri mieltä, 5 = täysin samaa mieltä. 3. IT:n kyky tuottaa arvoa
Business case-menettelyllä arvioidaan investoinnin kannattavuutta. Business case-arviointikriteerit sisältävät tyypillisesti liiketoimintaprosessien tarpeiden ja uusien mahdollisuuksien arvioinnin, kustannus-ja hyötyanalyysin sekä investointiin liittyvien riskien arvioinnin.
e 1 2 3 4 5
a) Käyttämämme IT:n suorituskyvyn mittaus on vaikuttavuudeltaan hyvä tapa varmistaa, että IT täyttää strategiset tavoitteemme (e = Emme mittaa IT:n suorituskykyä)
b) Käyttämämme palvelutasosopimus-menettely (SLA) on vaikuttavuudeltaan hyvä tapa varmistaa IT-palvelujen vaatimuksenmukaisuus (e = Emme käytä palvelutasosopimuksia)
c) Käyttämämme business case-menettely on vaikuttavuudeltaan hyvä tapa arvioida IT investoinnin kannattavuutta (e = Emme käytä business case-lähestymistapaa IT investointiemme kanattavuuden arviointiin)
d) Yrityksellämme on käytössä vaikuttavuudeltaan hyvä vakioitu menettely, jolla varmistetaan, että IT investoinnit ovat arkkitehtuurimme mukaisia (e = Yrityksellämme ei ole vakioitua menettelyä, jolla varmistetaan IT investointien arkkitehtuurin mukaisuus)
IT portfolio- (IT salkunhallinta-) menetelmällä hallitaan IT investointeja ja IT-järjestelmien elinjaksoa. IT investoinnit sekä tuotantokäytössä olevat IT järjestelmät jaetaan tarkoituksenmukaisiin kategorioihin, kuten tapahtumakäsittelysovellukset, informatiiviset sovellukset, strategiset sovellukset ja IT infrastuktuuri. Ylätasolla päätetään resurssien kohdentamisesta kullekin näistä kategorioista. Jokaista kategoriaa hallitaan, rahoitetaan ja priorisoidaan erikseen.
e 1 2 3 4 5
e) Käyttämämme IT portfolio-menetelmä on vaikuttavuudeltaan hyvä tapa hallita IT-investointiprojekteja ja IT-järjestelmien elinjaksoa. (e = Emme käytä IT portfolio-menetelmää)
Jälkikatselmoinnilla (post-implementation review, PIR) arvioidaan IT investointiprojektin onnistumista alkuperäisiin tavoitteisiin verrattuna. Katselmoinnilla arvioidaan miten odotetut liiketoimintatarpeet ja mahdollisuudet on onnistuttu täyttämään ja hyödyntämään, miten kustannukset ja hyödyt on kyetty realisoimaan, ja miten riskit onnistuttiin välttämään. Katselmoinnissa havaituista ”opiksi otettavista” asioista laaditaan raportti (Lessons Learned), joka jaetaan kaikille asiaankuuluville sidosryhmille.

239
e 1 2 3 4 5
f) Yrityksellämme on käytössä vaikuttavuudeltaan hyvä vakioitu menettely IT-projektien jälkikatselmointiin ja niistä kerättyjen oppien jakamiseen (e = Emme käytä vakioitua menettelyä IT-projektien jälkikatselmointiin)
4. Yrityksen yhdensuuntaisuus
Organisaatiot käyttävät erilaisia IT hallinnoinnin rakenteita – esimerkiksi IT strategiaryhmä, IT ohjausryhmä, IT investointien ohjausryhmä tai arkkitehtuurin ohjausryhmä – edistämään, ohjaamaan ja valvomaan IT strategian toteuttamista sekä varmistamaan yrityksen liiketoiminnan ja IT:n yhdensuuntaisuus.
e 1 2 3 4 5
a) IT strategiamme on yhdensuuntainen liiketoimintastrategiamme kanssa (e = Yrityksellämme ei ole erikseen määriteltyä IT strategiaa)
b) Yrityksellämme on käytössä tarkoituksenmukaiset IT hallinnoinnin rakenteet ja prosessit, jotka aikaansaavat IT strategiamme toteutumisen (e = Yrityksellämme ei ole muodollisia IT-hallinnoinnin rakenteita)
c) IT järjestelmämme ja palvelumme tukevat onnstuneesti yrityksemme toimintamallia ja liiketoimintaprosesseja
d) Liiketoimintayksiköidemme ja funktioidemme yritysarkkitehtuurit ovat yhdensuuntaiset “konsernitason” yritysarkkitehtuurien kanssa (e = Yrityksellämme ei ole dokumentoitua yritysarkkitehtuuria)
5. IT riskien lieventäminen
1 2 3 4 5
a) Käytämme vaikuttavia IT tarkastus- ja valvontamenettelyjä, joilla aikaansaadaan selkeät roolit, vastuut ja raportointivelvollisuudet
b) Yrityksellämme on korkea tietoisuus IT:n vaikutuksista liiketoiminnan jatkuvuudelle
c) Yrityksellämme on tarkoituksenmukaiset tavat hallinta IT:hen liittyviä riskejä: riskejä lievennetään ja monitoroidaan, nykyinen IT-riskitaso on ylimmän johdon hyväksymä
6. Liiketoiminnan ketteryys ja yrityksen joustavuus
1 2 3 4 5
a) Yrityksemme IT kykenee nopeasti vastaamaan uusiin ja muuttuviin liiketoimintaympäristön vaatimuksiin

240
b) Yrityksemme IT palvelut mahdollistavat informaation ja tietämyksen vaikuttavan hyödyntämisen
c) Yrityksemme IT:llä on kyky seurata ja ymmärtää merkittävät teknologiset tapahtumat ja trendit IT-lähtöisten strategisten liiketoimintamuutosten toteuttamiseksi
d) Olemme onnistuneesti hyödyntäneet IT:n luomia kyvykkyyksiä uusien liiketoimintamallien käyttöönottamiseksi
7. Organisaation IT kyvykkyydet ja oppiminen
1 2 3 4 5
a) Yrityksemme ylin johto ja hallitus käyttää aikaa ja on sitoutunut IT asioiden käsittelyyn ja päätöksentekoon
b) Yrityksessämme on laaja-alainen ymmärrys ja osallistuminen IT:n hallinnointiin kaikilla organisaatiotasoilla
c) Yrityksessämme on rakentavat yhteistoimintasuhteet ja vaikuttavat keskinäiset viestintätavat liiketoiminnan ja IT:n sekä ulkoisten kumppaneiden kanssa
d) Kykenemme onnistuneesti toteuttamaan tarvittavat organisaatio- ja toimintatapamuutokset, jotta IT investoinnin luomat uudet mahdollisuudet saadaan hyödynnettyä
e) Kykenemme oppimaan jokaisesta IT toteutuksesta, mikä näkyy selvästi kyvyssämme tehdä parempia ja nopeampia IT-päätöksiä
Yritysarkkitehtuurin kypsyys
1. Yrityksen toimintamalli
Yrityksen toimintamalli muodostuu sen organisaatiorakenteesta, ydinprosesseista, toimintakulttuurista, johtamisjärjestelmistä ja informaatioteknologiasta. Yrityksen valitsema toimintamalli määrittää sen liiketoimintaprosessien integraatio- ja standardointivaatimukset.
e 1 2 3 4 5
a) Yrityksellämme on selkeästi ilmaistu toimintamalli, joka ohjaa yrityksemme IT:n käyttöä ja käyttötapoja (e = Yrityksellämme ei ole dokumentoitua toimintamallin määritystä)

241
c) Ylin johtomme on ilmaissut selkeästi IT:n roolin toimintamallimme ja liiketoimintastrategiamme toteuttamisessa (e = Yrityksellämme ei ole dokumentoitua määritelmää IT:n roolista)
e) Mikä on yrityksenne toimintamalli määritettynä liiketoimintaprosessien integraatio- ja standardisointivaatimuksilla? Vaatimus liiketoimintaprosessiemme integraatiolle: ___ Matala ___ Korkea
Vaatimus liiketoimintaprosessiemme standardisoinnille: ___ Matala ___ Korkea
Yritysarkkitehtuuri (Enterprise Architecture, EA) on menetelmä, joka tunnistaa ja kuvaa yrityksen pääkomponentit informaatioteknologia mukaan lukien. Yritysarkkitehtuuri tunnistaa ja kuvaa tavat, jolla nämä komponentit toimivat yhdessä saavuttaakseen asetetut liiketoiminnan tavoitteet sekä tavat, joilla tietojärjestelmät tukevat yrityksen liiketoimintaprosesseja. Yritysarkkitehtuuri koostuu tyypillisesti liiketoiminta-arkkitehtuurista joka kuvaa yrityksen liiketoimintaprosessit, informaatioarkkitehtuurista, joka kuvaa yrityksen tärkeimmät tiedot, sovellusarkkitehtuurista, joka kuvaa tiedon käsittelyyn käytettävät sovellukset, sekä teknologia-arkkitehtuurista, joka kuvaa edellisiin liittyvät teknologiakomponentit.
2. Onko yrityksenne ottanut käyttöön yritysarkkitehtuuri-lähestymistavan ts. onko yrityksenne määrittänyt organisaatiorakenteet, prosessit ja mekanismit yritysarkkitehtuurin kehittämiseksi, käyttämiseksi ja hallinnoimiseksi? ___ Kyllä ___ Ei Jos “kyllä”, niin minä vuonna toiminta on aloitettu : _________ 3. Mikä tai mitkä seuraavista kuvaa parhaiten tämänhetkisen yritysarkkitehtuurinne kehittämisen painopistettä? Valitkaa enintään kaksi vaihtoehtoa ja asettakaa ne tärkeysjärjestykseen.
Paino-pistealue Yritysarkkitehtuurin kehittämisen painopistealueet
a) Keskitymme liiketoimintayksiköidemme ja toimintojemme tarpeisiin, yritysarkkitehtuurimme koostuu pääasiassa näistä paikallisista sovelluksista ja niihin liittyvästä infrastruktuurista
b) Keskitymme luomaan IT:stä yrityksenlaajuisen resurssin luomalla standardisoidun IT infrastruktuurin ja yhteiset palvelut. Tavoittelemme IT kustannussäästöjä ja parempaa IT tehokkuutta.
c) Keskitymme luomaan sekä yrityksenlaajuiset standardoidut liiketoimintaprosessit että hyvät tavat tiedon jakamiseen parantaaksemme liiketoiminnan tehokkuutta.
d) Keskitymme luomaan uudelleenkäytettäviä sovellus- ja liiketoimintaprosessien komponentteja. Tavoittelemme strategista liiketoiminnan ketteryyttä ja parempaa liiketoiminnan ja IT integraatiota.
e) Keskitymme yhdistämään partneriverkkomme prosessit omiin liiketoimintaprosessehin käyttäen standardoituja rajapintoja. Tavoittelemme suorituskykyä uusilla hankkeilla ja yhteistyömalleilla.

242
4. Miten tämänhetkiset yritysarkkitehtuurin kehittämispanokset jakautuvat yritysarkkitehtuurin eri osa-alueille? Vastatkaa käyttäen asteikkoa yhdestä viiteen: 1 = ei tärkeä to 5 = erittäin tärkeä
1 2 3 4 5
Liiketoiminta-arkkitehtuuri
Informaatioarkkitehtuuri
Sovellusarkkitehtuuri
Teknologia-arkkitehtuuri
5. Yritysarkkitehtuurin kattavuus
Liiketoiminta-arkkitehtuuri on kuvaus yrityksen liiketoiminnasta toisin sanoen yrityksen liiketoimintaprosesseista ja niihin liittyvistä tärkeistä elementeistä, kuten organisaatio, asiakkaat ja sidosryhmät.
a) Mikä seuraavista on paras kuvaus yrityksenne liiketoiminta-arkkitehtuurin kypsyysasteesta?
0. Emme ole dokumentoineet liiketoimintaprosessejamme
1. Olemme tunnistaneet ja dokumentoineet liiketoimintaprosessimme
2. Olemme tunnistaneet ja dokumentoineet nykytilan liiketoimintaprosessimme ja niiden liitynnät sovelluksiin, keskeisiin tietoelementteihin ja IT-infrastruktuuriin sekä liiketoiminnan tärkeisiin elementteihin, kuten asiakkaat, sidosryhmät ja organisaatiot.
3. Olemme tunnistaneet ja dokumentoineet tavoitetilan ylätason liiketoimintaprosessit ja niiden liitynnät sovelluksiin, keskeisiin tietoelementteihin ja IT-infrastruktuuriin sekä liiketoiminnan tärkeisiin elementteihin, kuten asiakkaat, sidosryhmät ja organisaatiot.
4. Olemme laatineet tiekartan (siirtymästrategian), joka kertoo, miten yrityksemme muuntautuu nykyisestä liiketoiminta-arkkitehtuurista tavoitetilan liiketoiminta-arkkitehtuuriin
5. Liiketoiminta-arkkitehtuuriamme mitataan, seurataan ja päivitetään säännöllisesti.
Informaatioarkkitehtuuri määrittää yrityksen tärkeät tietoelementit ja informaation, jota tarvitaan liiketoiminnassa, sekä tavat, joilla tietoa jaetaan ja hallinnoidaan.
b) Mikä seuraavista on paras kuvaus yrityksenne informaatioarkkitehtuurin kypsyysasteesta?
0. Emme ole tunnistaneet ja dokumentoineet liiketoiminnan tärkeitä tietoelementtejä ja informaatiota
1. Olemme tunnistaneet ja dokumentoineet liiketoiminnan tärkeät tietoelementit ja tarvittavan informaation
2. Tärkeät tietoelementit ja informaatio sekä niiden tiedonvälityspaketit, tuottajat ja kuluttajat on tunnistettu ja dokumentoitu.
3. Olemme määrittäneet ylätason tavoitetilan informaatioarkkitehtuurin, joka mahdollistaa konsolidoinnin sekä tiedon jakamisen
4. Informaatioarkkitehtuurimme sisältää mekanismit tiedon levittämiseen ja turvallisuuteen
5. Yrityksellämme on tarkoituksenmukaiset informaation elinjakson hallinnan menettelyt ja käytämme standardeja aina kun se on mahdollista.

243
Sovellusarkkitehtuuri koostuu sovellusten ja IT-järjestestelmien muodostamasta kokonaisuudesta, IT portfoliosta, joka tukee organisaation ja liiketoimintaprosessien tarpeita
c) Mkä seuraavista on paras kuvaus yrityksenne sovellusarkkitehtuurin kypsyysasteesta?
0. Emme ole kattavasti luetteloineet ja dokumentoineet käytössä olevia sovelluksiamme
1. Olemme kattavasti luetteloineet ja dokumentoineet käytössä olevat sovelluksemme
2. Olemme dokumentoineet käytössä olevien sovelluksiemme liitynnät liiketoimintaprosesseihin, tärkeisiin tietoelementteihin, IT infrastruktuuriin ja turvallisuusprosesseihin
3. Olemme määrittäneet tavoitetilan sovellukset ja niiden liitynnät liiketoimintaprosesseihin, tärkeisiin tietoelementteihin, IT infrastruktuuriin ja turvallisuusprosesseihin
4. Tavoitetilan sovellusarkkitehtuuri sisältyy transformaation tiekarttaamme, ja toimii siirtymäsuunnittelun sekä IT investointien tärkeänä ajurina. Edellytämme sovelluksilta standardointia ja uudelleenkäytettävyyttä.
5. Päivitämme sovellusarkkitehtuuriamme säännöllisesti. Mittaamme ja seuraamme standardointia ja uudelleenkäyttöä.
Teknologia-arkkitehtuuri sisältää määrittelyt teknologiasta, jota käyttämällä luodaan sovelluksille toimintaympäristö ts. IT infrastruktuuri, turvallisuus, hallinnan työvälineet ja menettelyt sekä tietoliikenneverkot ja muut teknologiset kyvyt, joita tarvitaan organisaation ja liiketoiminnan tukemisessa.
d) Mikä seuraavista on paras kuvaus yrityksenne teknologia-arkkitehtuurin kypsyysasteesta?
0. Emme ole määrittäneet standardeja nykyisille teknologiatuotteillemme
1. Olemme tunnistaneet nykyiset teknologiatuotteemme ja olemme määrittäneent niille standardit.
2. Olemme linkittäneet nykyiset teknologiatuotteemme liiketoimintaprosesseihin, tärkeisiin tietoelementteihin, sovelluksiin sekä turvallisuusprosesseihin. Olemme määrittäneet yhteensopivuusvaatimukset liiketoimintayksiköillemme.
3. Olemme määrittäneet tavoitetilan teknologiatuotteemme ja linkittäneet sen liiketoimintaprosesseihin, tärkeisiin tietoelementteihin, sovelluksiin sekä turvallisuusprosesseihin. Olemme määrittäneet yhteensopivuusvaatimukset liiketoimintayksiköillemme.
4. Tavoitetilan teknologiatuotteet sisältyvät transformaation tiekarttaamme, ja toimivat IT investointiemme ajurina. Edellytämme sovelluksilta standardointia ja uudelleenkäytettävyyttä.
5. Tavoitetilan teknologiatuotteiden määritykset päivitetään säännöllisesti. Standardointia ja uudelleenkäyttöä mitataan ja seurataan. Yrityksellä on käytössään määritelty prosessi uuden teknologia sisällyttämiseksi teknologia-arkkitehtuuriin.
Siirtymästrategia (muutosstrategia, transformaation tiekartta) on kuvaus toimenpiteistä, joilla yrityksen visio, tavoitetila, saavutetaan siirtyen vaiheittain tilapäisten välitilojen kautta. Siirtymästrategia perustuu tavoitetilan arkkitehtuurin ja nykytilan arkkitehtuurin välisten puutteiden – kuilun – analyysiin.

244
e) Mikä seuraavista on paras kuvaus yrityksenne siirtymästrategian kypsyysasteesta?
0. Emme ole määrittäneet tiekarttaa yritysarkkitehtuurin tavoitetilan saavuttamiseksi.
1. Käytämme tarkoituksenmukaisia prosesseja puutteiden ja vaihtoehtojen analysointiin sekä projektien hallintaan
2. Olemme toteuttaneet päällekkäisyyksien ja puutteiden analyysin, tunnistaneet konsolidoinnin ja uudelleenkäytettävyyden mahdollisuudet, sekä puutteet nykyisen ja tavoitetilan yritysarkkitehtuurin välillä
3. Olemme määrittäneet ohjelmat ja projektit, joilla toimeenpanosuunnitelma toteutetaan. Dokumentoidulla toimeenpanosuunnitelmalla integroidaan suorituskyvyn paraneminen, turvallisuussuunnittelu, henkilöiden ja infrastruktuurin käyttö sekä tilapäisten siirtymätilojen kuvaukset.
4. IT investointisalkkumme perustuu selvästi siirtymästrategian määrittämiin ohjelmiin ja projekteihin.
5. Käytämme edistymisen mittaamista varmistamaan tavoitetilan yritysarkkitehtuurin saavuttamisen
6. Yritysarkkitehtuurin vaikuttavuus ja tuotettu lisäarvo a) Mikä seuraavista on paras kuvaus siitä, miten liiketoimintalähtöstä yritysarkkitehtuurinne hallinta on?
0. Yritysarkkitehtuurimme on pääosin IT-lähtöistä, ei liiketoimintalähtöistä
1. Yritysarkkitehtuurimme kehittäminen on jäsentymätöntä, liiketoimintalähtöisyyden varmistavat prosessit ovat puuttellisia ja erilaisia eri liiketoimintayksiköissä ja arkkitehtuurin osa-alueilla.
2. Liiketoiminta-alueet omistajineen on tunnistettu jokaiselle arkkitehtuurin ja liiketoiminnan osa-alueelle
3. Kaikkien liiketoiminta-alueiden tarpeet ja vaatimukset, joihin yritysarkkitehtuurin tulee vastata, on tunnistettu ja dokumentoitu
4. Yritysarkkitehtuurin tuottamat lopputuotteet on suunniteltu ja niitä mitataan tunnistettuja liiketoiminnan tarpeita ja vaatimuksia vasten
5. Liiketoiminnan kehittämismahdollisuuksia tunnistetaan jatkuvasti, edistymisessä tarpeiden täyttämisessä on selviä näyttöjä. Liiketoiminnan kysymykset ja tarpeet ohjaavat yritysarkkitehtuurin kehittämistä ja käyttöä.
b) Mikä seuraavista on paras kuvaus yrityksenne kyvystä jakamiseen ja uudelleen käyttöön?
0. Uudelleenkäyttö on ”ad hoc”-prosessi, joka tapahtuu IT kehitysprojektien tasolla
1. Uudelleenkäyttö on jäsentymätön ja tapahtuu pääasiassa liiketoimintayksiköiden ja funktioiden tasolla
2. Sovellusten ja palveluiden ja tärkeiden tietoelementtien ja informaation uudelleenkäytettävyyttä edistetään, luettelo käytettävissä olevista sovelluksista ja palveluista on kaikkien saatavilla
3. Uudelleenkäyttö ja jaettavuus varmistetaan tarkoituksenmukaisella menettelyllä, työväline uudelleenkäytöllä aikaansaatujen kustannussäästöjen mittaamiseksi on käytettävissä
4. Komponenttien uudelleenkäytöllä aikaansaaduista kustannussäästöistä on selviä näyttöjä.
5. Järjestelmien ja teknologioiden yrityksenlaajuisella uudelleenkäytöllä aikaansaadaan jatkuvia kustannussäästöjä.

245
c) Mikä seuraavista kuvaa parhaiten tapaa, jolla arvioitte liiketoimintanne sekä tuotteidenne ja palveluidenne kehittymistä yritysarkkitehtuurin panostusten tuloksena?
0. Emme arvioi liiketoimintamme sekä tuotteidemme ja palveluidemme kehittymistä yritysarkkitehtuuripanostusten tuloksena
1. Olemme tunnistaneet yritysarkkitehtuurin hallinnan tärkeät sidosryhmät, asiakkaat ja käyttäjät, ja olemme toteuttaneet heille asiakastyytyväisyyskyselyn tai tarvearvioinnin arkkitehtuurin palveluiden kehittämiseksi
2. Olemme tunnistaneet mittarit, joilla liiketoimintaprosessien sekä tuotteiden ja palveluiden kehittymistä seurataan, ja linkittäneet ne siirtymästrategian ja toteutussuunnitelmiin. Olemme määrittäneet roolit ja vastuut jokaiselle liiketoiminta-alueelle mittausten suorttamisesta ja kehittymisen seurannasta.
3. Seuraamme liiketoimintaprosessien sekä tuotteiden ja palveluiden ennustettua ja toteutunutta kehittymistä
4. Seuraamme yritysarkkitehtuurin vaikuttavuutta liiketoimintaprosessien sekä tuotteiden ja palveluiden kehittymiseen sidotulla arviointikriteeristöllä
5. Käytämme sidosryhmien, asiakkaiden ja käyttäjien tarpeita jatkuvasti yritysarkkitehtuurin hallinnan päätöksenteossa ja resurssien kohdentamisessa.
d) Mikä seuraavista on paras kuvaus IT-järjestelmien toteuttamisessa aikaansaadusta kehityksessä yritysarkkitehtuurin panostusten tuloksena?
0. Emme käytä muodollista menettelytapaa IT investointien päätöksentekoon ja hallintaan
1. Käytämme muodollista menettelytapaa IT investointien päätöksentekoon ja hallintaan, mutta sitä ei ole sidottu määriteltyyn yritysarkkitehtuuriin
2. Yritysarkkitehtuuri on integroitu IT investointien päätöksentekoon ja hallintaan. IT kehittäjämme ovat tietoisia yritysarkkitehtuurimme teknisistä ja yhteensopivuusvaatimuksista sekä uudelleenkäytön strategiasta.
3. Käytämme yritysarkkitehtuuria sekä IT investointien hallintaan että IT-järjestelmien elinjakson hallintaan
4. Olemme dokumentoineet suunnitelman palvelusuuntautuneen arkkitehtuurin kehittämiseksi useilla liiketoiminta-alueillamme
5. Olemme toteuttaneet palvelusuuntautunutta arkkitehtuuria ja saavuttaneet sen tuottamat hyödyt
Palvelusuuntautuneen arkkitehtuurin ominaisuudet
Valitkaa seuraavien väittämien vaihtoehdoista se, joka parhaiten vastaa mielipidettänne. Ellei toisin pyydetty, niin ilmaiskaa mielipiteenne asteikolla yhdestä viiteen: 1 = täysin eri mieltä, 5 = täysin samaa mieltä, e = en osaa sanoa 1. Hyödyt
e 1 2 3 4 5
a) Näemme SOA:n menetelmänä, joka edistää standardointia ja IT infrastruktuurimme muuntamista vakioiduiksi hyödykkeiksi, millä aikaansaadaan IT kustannussäästöjä
b) Näemme SOA:n hyvänä menetelmänä hyödyntää paremmin nykyisiä IT-ratkaisujamme mahdollistamalla niiden osallistumisen uusiin SOA-

246
perusteisiin ratkaisuihin
c) Näemme SOA:n tehokkaana tapana parantaa tiedon ja informaation elinjakson hallintaa
d) Näemme SOA:n tehokkaana välineenä nopeuttaa IT-ratkaisujen kehittämistä
e) Näemme SOA:n vaikuttavana menetelmänä liiketoimintaprosessiemme integroimiseksi ja parantamiseksi
f) Näemme SOA:n tehokkaana välineenä tuotteidemme ja palveluidemme markkinoille tuomisen nopeuttamiseksi
g) Näemme SOA:n tehokkaana ja vaikuttavana tapana kehittää liiketoimintaamme kytkemällä omat kyvykkyytemme partneriverkon kyvykkyysiin
h) Näemme SOA:n tärkeäksi työvälineeksi yrityksemme strategian toteuttamisessa
i) Näemme SOA:n välttämättömänä edellytyksenä osallistumiselle partneriemme liiketoimintaprosessien verkostoihin
j) Jokin muu SOA:n synnyttämä hyöty, määritelkää tarkemmin?
2. Yhteensopivuus
e 1 2 3 4 5
a) SOA sopii hyvin nykyiseen tapaamme hallita liiketoimintaa ja liiketoimintaprosesseja
b) Nykyiset sovelluksemme on muunnettavissa SOA-kelpoisiksi, jolloin ne voivat olla osa palvelulähtöistä arkkitehtuuriamme
c) Nykyinen IT infrastruktuurimme tukee hyvin SOA:n käyttöönottoa
d) SOA on helposti sisällytettävissä nykyisiin turvallisuuskäytäntöihin ja turvallisuusarkkitehtuuriimme
e) Nykyiset tapamme rahoittaa IT investoinnit ja käyttö sopii hyvin yhteen SOA-käyttöönoton kanssa
f) SOA:n edellyttämä tiedot ja taidot on helppo sisällyttää nykyiseen liiketoimintaosaamiseemme
g) SOA:n edellyttämä tiedot ja taidot on helppo sisällyttää nykyiseen IT-osaamiseemme
h) Nykyiset liiketoiminnan ja IT:n tarpeet on hyvin ratkaistavissa SOA:n avulla, SOA sopii hyvin tarpeisiimme

247
3. Monimutkaisuus Arvioikaa SOA:n monimutkaisuutta asteikolla yhdestä viiteen, 1 = ei lainkaan monimtkainen, 5 = erittäin monimutkainen.
1 2 3 4 5
a) Miten monimutkainen SOA on ymmärtää?
b) Miten monimutkainen SOA on oppia?
c) Miten monimutkainen SOA on ottaa käyttöön?
Valitkaa seuraavien väittämien vaihtoehdoista se, joka parhaiten vastaa mielipidettänne. Ellei toisin pyydetty, niin ilmaiskaa mielipiteenne asteikolla yhdestä viiteen: 1 = täysin eri mieltä, 5 = täysin samaa mieltä, e = en osaa sanoa 4. Muita SOA:n ominaisuuksia
e 1 2 3 4 5
a) Mielestämme SOA on helposti kokeiltavissa ts. pilot-projektien valitseminen ja toteuttaminen on melko helppoa
b) Mielestämme SOA teknologiat ovat riittävän kypsiä SOA-ratkaisujen toteuttamiseksi
c) Mielestämme tietoa ja tukea SOA-käyttöönottamiseksi on helposti saatavilla
d) Mielestämme SOA:n ensimmäisen investoinnin kustannukset ovat korkeat
e) SOA:n käyttöönoton tulokset ovat helposti käyttäjiemme havaittavissa
f) SOA:n käyttöönoton tulokset ovat helposti tärkeiden sidosryhmiemme ja partnereidemme havaittavissa
g) Yrityksemme toimialan kilpailutilanne luo paineita SOA:n käyttöönottoon

248
Muut tekijät
Arvioikaa tässä kohdassa yritystänne kokonaisuutena.
e 1 2 3 4 5
a) Yrityksessämme on positiivinen asenne muutokseen
b) Etsimme koko ajan aktiivisesti uusia työvälineitä ja menetelmiä parantaaksemme toimintaamme
c) Onnistumme yleensä hyvin valitsemaan juuri meille sopivat työvälineet ja menetelmät
d) Onnistumme yleensä hyvin uusien työvälineiden ja menetelmien käyttööotossa
e) Otettuamme käyttöön uuden työvälineen tai menetelmän arvioimme, miten toimintamme on parantunut sen ansiosta

Perko, Jukka. 2008. IT Governance and Enterprise Architecture as Prerequisites for Assimilation of Service-Oriented Architecture.
Page 1/2
Errata and omissions
19.12.2008 Jukka Perko
Pages ix, xi, 41, 43, 44, 45 and 46: Change all occurencies of Sofa to Sowa
Page 1, line 4: Change Brynjolffson & Young to Brynjolfsson & Yang
Page 5, line 20: Change 2003 to 2003a
Page 6, line 10: Change Pfeiffer to Pfeffer
Page 19, line 17: Change 2004 to 2004b
Page 40, last line: Change HP 2005b to HP 2005
Page 41, line 13: Change NASCIO 2004 to NASCIO 2005
Page 61, line 13: Change Brown and Hagel 2003 to Brown and Hagel 2003b
Page 63, line 20: Change 2006 to 2006a
Page 75, line 9: Change Van Gremergen to Van Grembergen
Page 76, line 17: Change 1987 to 1988
Page 100, line 2: Change 1997 to 1999
Page 103, line 3: Change 1998 to 1999
Page 106, line 26; Change Jiang et al (2003) to Jiang et al (2004)
Page 106, line 32; Change 2007 to 2007b
Page 106, line 33; Change 2007 to 2007a
Page 112, line 24: Change Grembergen to Van Grembergen
Page 113, line 23: Change 2004 to 2004a
Page 122, line 1: Change 1997 to 1999
Page 132, line 8: Change aspects of agility to aspects of business agility
Page 139, line 7: Change application and business to technology and business

Perko, Jukka. 2008. IT Governance and Enterprise Architecture as Prerequisites for Assimilation of Service-Oriented Architecture.
Page 2/2
Page 139, line 18: Change OBM to OMB
Page 142, line 10: Change OBM to OMB
Page 181, line 14: Change that to than
Page 184, line 18: Change higher EA characteristics to higher EA maturities
Page 188, line 11: Change adaptivity to business adaptivity
Page 189, line 18: Change 2007 to 2007b
Page 192, line 2: Change EA characteristics to EA maturities
Page 206:
Change Brown, J.S. & Hagel, J. 2003. Does IT Matter? to Brown, J.S. & Hagel, J. 2003a. Does IT Matter?
Change Brown, J.S. & Hagel, J. 2003. Flexible IT, better strategy to Brown, J.S. & Hagel, J. 2003b. Flexible IT, better strategy
Add reference: Brynjolfsson, E. & Yang, S. 1996. Information Technology and Productivity: A Review of the Literature. Advances in Computers, 43, 179-214.
Page 217: Change Olkkonen, T. 1993. to Olkkonen, T. 1994.
Page 218:
Change Pirttimäki, V. 2007, Comparative Study … to Pirttimäki, V. 2007a, Comparative Study …
Change Pirttimäki, V. 2007. Business Intelligence … to Pirttimäki, V. 2007b. Business Intelligence