Talk of the Nation: Science Friday Summative …...Talk of the Nation: Science Friday (SF) is a...
24
Report for Samanna Productions National Public Radio by Barbara N. Flagg, Ed.D. Director Research Report No. 06-015 November 7, 2006 This material is based on work supported by the National Science Foundation under Grant No. 0206324. Any opinions, findings, and conclusions or recommendations expressed in this material are those of the author and do not necessarily reflect the views of the National Science Foundation Talk of the Nation: Science Friday Summative Evaluation Study 2
Transcript of Talk of the Nation: Science Friday Summative …...Talk of the Nation: Science Friday (SF) is a...

Report forSamanna ProductionsNational Public Radio
byBarbara N. Flagg, Ed.D.
Director
Research Report No. 06-015November 7, 2006
This material is based on work supported by the National Science Foundation underGrant No. 0206324. Any opinions, findings, and conclusions or recommendationsexpressed in this material are those of the author and do not necessarily reflect theviews of the National Science Foundation
Talk of the Nation: Science FridaySummative Evaluation
Study 2

Multimedia Research Summative Evaluationii
EXECUTIVE SUMMARY OF SUMMATIVE EVALUATIONMULTIMEDIA RESEARCH
NOVEMBER 7, 2006
Talk of the Nation: Science Friday (SF) is a weekly two-hour listener call-in talk show devotedto the understanding of complex scientific topics and methods. The series is hosted by sciencecorrespondent Ira Flatow and broadcast on National Public Radio to 200 stations nationwide aswell as via satellite and the Internet. With support from the National Science Foundation, Mul-timedia Research presents the second study of a two-part summative evaluation on the impact ofScience Friday on public radio listeners, focusing on the series’ increased emphasis on publicunderstanding of basic research.
The evaluation assessed what demographic or background characteristics relate to whether or notone listens to SF and to frequency of listening; what effects the series has on listeners and whatkind of actions the series has prompted in listeners. A comparison was also made results of thisstudy and the first study carried out in 2003. Questionnaires were mailed to random namesdrawn from member subscriber lists of public radio stations serving the areas surrounding Den-ver, CO, San Antonio, TX and Boston, MA. Of the 1200 questionnaires that adult public radiomembers received, 641 or 53% were returned for analysis. Given that 2.1 million listeners con-tribute to public radio according to CPB revenue report data and that there are about 21 millionlisteners according to Arbitron estimates, our contributor lists represent about 10% of the listen-ing audience. Thus, we can generalize our results to all subscribers and to about 10% of the totalpublic radio audience.
Who are Listeners of Science Friday?Three-quarters of respondents report listening to Science Friday. Six of ten respondents tuneinto the series once per month or more often. Just 15% of respondents listen every week.
Our respondent sample is typical of a public radio member audience – more educated, better em-ployed, older with fewer minorities compared to the general U.S. adult population. No demo-graphic variable is significantly associated with listening behavior.
Compared with non-listeners, listeners of Science Friday rate themselves as significantly moreinterested in science generally and significantly more knowledgeable about science. In these dif-ferences, the effect size is moderate.
Major sources of science news include “radio” (55%), “magazines/journals” (44%) and “news-papers” (36%). Radio is chosen as a major source of science news by significantly more SF lis-teners (63%) than non-listeners (29%). This is a moderately strong association.
Beliefs About Science ResearchListeners agree significantly more than non-listeners with one of eight belief statements aboutscience research:
“It is important for me to understand the process of scientific discovery.”

Multimedia Research Summative Evaluationiii
Listening to Science Friday is not related to respondents’ thinking about the value of basic re-search. Explanations of the value or importance of basic research discuss basic research as thefoundation of science (29%), as leading to discoveries or applications (14%), as a requirementfor understanding our world (13%) and as enhancing knowledge (12%).
Listening to Science Friday is not related to respondents’ thinking about the barriers or obstaclesthat prevent scientists from doing basic research. Respondents focus mainly on the obstacles ofpolitics (20%), barriers of government policies (19%) and religion (14%), and the lack of rewardor recognition (11%).
Appeal of Science FridayListeners rate the series as highly appealing. Nine out of 10 listeners agree or strongly agree thatthey “enjoy listening to the series,” and 8 out of 10 agree or strongly agree that they “listen at-tentively” to the show. Those who report listening more frequently also report listening more at-tentively and enjoying the series more compared with those listening less frequently.
Seven out of 10 listeners agree or strongly agree with the statement that “Ira Flatow asks ques-tions of guest scientists that I would ask.” Six of ten listeners disagree or strongly disagree withthe observation that “call-in questions of guest scientists detract from the value of the program.”
Comprehension of Science FridayListeners rate the series as highly understandable. Nine of 10 listeners disagree or strongly dis-agree that the “information on Science Friday is too technical,” and 8 of 10 disagree that “theprocess of research as presented by guest scientists is confusing.” Eight of 10 listeners feel that“the series keeps them up to date about current science research,” and 7 of 10 agree the “serieshas reinforced their understanding of the process of research.” The series information is rated as“usually familiar” by a third of the listening audience, novel by less than a third and sometimesfamiliar and sometimes novel by slightly more than a third of listeners. Thus, the information onScience Friday is targeted at an appropriate level to reach effectively the mass public radiomember audience.
As listening frequency increases, agreement increases significantly for two statements: “the se-ries keeps me up to date about current science research;” and “the series has reinforced my un-derstanding of the process of research.”
Learning from Science FridayEight out of 10 listeners feel that Science Friday is successful or very successful at helping themunderstand “what research underpins significant new discoveries,” “how scientists go about do-ing their research,” and “how failures in research can be useful to achieve eventual success.”Seven of 10 listeners say the series is successful at helping them understand “what barriers mustbe overcome to carry out successful research” and “what length of time it takes to reach reliableconclusions.” More than 6 of 10 listeners feel the show is successful at presenting “what rolecorporations, private institutions and foundations play in research” and “what role research playsin government policy-making.”

Multimedia Research Summative Evaluationiv
Impact of Science FridayThe series has successfully prompted listeners to take further action. Almost all (90%) reportfollowing up their listening with at least one action, and more than half (56%) report carrying outthree or more actions as a result of the series. More frequent listening relates to a wider varietyof actions away from the radio. The most frequent activities are discussing topics with others(81%), reading related information (56%), searching for more information about a topic (48%)and accessing a web site (39%). Other prompted activities include purchasing a book or otheritem related to a show topic (30%), using content in teaching (12%), and writing to Science Fri-day, a scientist, politician or other (4%). The percent of listeners who discuss topics with otherswas significantly greater than those who did not discuss topics.
One-fifth of listeners report using the Science Friday website in the previous year, mostly to lis-ten to archived shows (61%) or search for books (48%). About one-fifth of website users readIra Flatow’s blog or download podcasts.
Comparison of 2006 and 2003 listenersThe two listener samples for 2006 and 2003 do not differ with respect to demographic or back-ground variables. The percent of listeners and distributions of listening frequency do not differnor do their appeal and comprehension ratings of the series. There are also no significant differ-ences in actions prompted by the show. The only statistically significant result is moderate im-provement from 2003 in the show’s success in communicating what role research plays in gov-ernment policy-making.
Conclusion
In conclusion, 75% of our public radio members listen to Science Friday and 61% tune in once amonth or more often. Radio is identified as a significant major source of science news by listen-ers of Science Friday as compared to non-listening public radio members. Listeners rate the se-ries as highly appealing and understandable. The majority of listeners feel that Science Fridaysuccessfully communicates about contemporary science research process. Additionally, the se-ries prompts listeners to carry out a variety of actions outside of the two-hour program.
Related to Science Friday’s NSF grant goal to emphasize public understanding of contemporaryresearch, the results indicate that more frequent listening relates to stronger agreement that theseries updates listeners about current science research and reinforces understanding of researchprocess. Comparing the 2006 listener sample to a similar sample of listeners in 2003 reveals onesignificant improvement related to communicating what role research plays in government pol-icy-making.

SUMMATIVE EVALUATION OF SCIENCE FRIDAY RADIO SERIESMULTIMEDIA RESEARCH • BELLPORT, NY
NOVEMBER, 2006
INTRODUCTION
Talk of the Nation: Science Friday (SF) is a weekly two-hour listener call-in talk show devotedto the understanding of complex scientific topics and methods. The series is hosted by sciencecorrespondent Ira Flatow and broadcast on National Public Radio to more than 200 stations na-tionwide as well as via satellite and the Internet.
With support of an NSF grant beginning in 2003, SF has increased its emphasis on public under-standing of contemporary research. SF’s goals under this NSF grant include the following:1
• Finding the research roots at the bottom of each story;
• Exploring the cooperation among corporations, private institutions and research foundations,when appropriate, illuminating how each one plays a role in the research process;
• Following the research “bumps” in the road to illustrate that research success depends uponfailures—not all research produces positive results;
• Illuminating the barriers to successful research;
• Helping listeners understand the thought process of researchers;
• Scaling the “ivory tower” by enabling listeners to question and talk directly with researchers;
• Helping listeners understand the role of basic research in policy-making.
This report presents the second study of a two-part summative evaluation on the impact of Sci-ence Friday on public radio listeners. The first study, similar to this one in design, was com-pleted in September, 2003.2
1 NSF Proposal Number 0206324, Award Abstract, National Public Radio’s “Talk of the Nation Science Friday.”2 Flagg, B. N. (Sept., 2003). “Talk of the Nation Science Friday” Summative Evaluation: Study 1. Multimedia Re-search Report 03-012).

Multimedia Research Summative Evaluation2
METHOD
Research Design
This study involved mailing a one-page double-sided questionnaire, return envelope and $1 in-centive to a random sample of people who are subscription members of their local public radiostation. Recipients were asked to fill out the questionnaire and mail it back to the researcher.The respondents were then divided for analysis into two groups -- those who listen to ScienceFriday and those who do not.The following specific research questions were addressed in the data analyses:
I. What percent of the radio member audience listens to SF and how frequently?
II. Do demographic characteristics including age, gender, education, and occupational statusrelate to whether a person listens to the program or how frequently a person listens?
III. Do self-reported background characteristics including interest in science, level of scienceknowledge, preferred science news sources and beliefs about science research relate tolistening to SF or frequency of listening?
IV. Does understanding the value of basic research and the barriers to doing basic researchrelate to whether a person listens to the program or how frequently a person listens?
V. How appealing is SF and do demographic or background variables relate to appeal?
VI. How understandable is Science Friday and do demographic or background variables re-late to comprehension?
VII. How successful is Science Friday in helping listeners understand research and do demo-graphic or background variables influence this understanding?
VIII. Has the series prompted listeners to take further action?
IX. Do listeners in 2006 differ from listeners in 2003?
Questionnaire
The questionnaire was comprised of several sections. All respondents answered sections 1 – 4.Only Science Friday listeners answered sections 5 – 6.1. Demographic questions established the sample's distribution of geographical location,
age, gender, ethnicity, occupational status, and highest level of education.
2. Rating questions assessed science-related background including general interest in sci-ence, perceived level of science knowledge, main sources of science news, and beliefsabout scientific research.
3. Open-ended questions explored understanding of the value or importance of basic re-search and what obstacles or barriers prevent scientists from doing basic research.

Multimedia Research Summative Evaluation3
4. Exposure questions determined whether a respondent had heard of or listened to ScienceFriday and the frequency of listening activity.
5. Appeal, comprehension and learning were addressed by 16 statements with which re-spondents agreed or disagreed on a five-point scale.
6. Actions taken as a result of listening to the series were assessed through a check-off listof probable activities.
Sample
In June, 2006, double-sided questionnaires with a $1 incentive were sent to a randomly generatedsubset of 400 members of each of three public radio areas:3
• Colorado Public Radio, broadcasting around Denver, CO;• Texas Public Radio, broadcasting around San Antonio, TX; and• Boston University Public Radio, broadcasting around Boston, MA and Providence, RI.
The 1200 questionnaires were anonymous and confidential. Recipients were asked to completethe questionnaire and mail it back. All questionnaires received within 16 weeks of mailing wereincluded in the study analyses. Demographics of the sample are included in the results section.
Analyses
Reported percentages are rounded off in text and tables. To explore possible significant relation-ships and differences, appropriate statistics were performed including chi-square analyses,Spearman rank-order correlations, t-tests, ANOVA, and effect size calculations. In recognitionof the large sample size, only statistically significant findings at p < .0001 are reported in the textalong with effect size. Effect size indicates the magnitude of an effect or the strength of a rela-tionship by factoring out sample size. Cramer’s V and phi φ coefficient are reported with chi-square analyses and Cohen’s d is used with a t-test on means. Only significant findings that haveat least “moderate” correlation (rs >.4) or “moderate” effect sizes (Cramer’s V or φ coefficient >.2; Cohen’s d > .3) are reported in the text.
Demographic variables examined include age, gender, educational level and occupational status(professional, skilled, unskilled). Because of the relatively small number of minorities in thissample, results related to ethnic/racial background were not explored. Background variables ex-amined include self-assessed interest in and knowledge of science, major sources of sciencenews, science beliefs, understanding of basic research, listening or not listening to Science Fri-day and frequency of listening.
3 Our thanks to the following public radio administrators for their cooperation and participation in this study: SeanNethery at KVOD, Joe Gwathmey at KSTX, and Corey Lewis at WBUR, Boston Public Radio.

Multimedia Research Summative Evaluation4
RESULTS
Return Rate
Of the 1200 surveys delivered, 641 were completed and returned within a 16-week period fol-lowing the mailing. This represents a very respectable 53% return rate. The returned question-naires include 37% from Texas radio members, 32% from Massachusetts area members and 31%from Colorado radio members.
Listeners and Non-Listeners
I. What percent of the radio member audience listens to the seriesand how frequently?
Three-quarters of respondents report listening to Science Friday. Sixof ten respondents tune into the series once per month or more often,whereas 15% of respondents listen every week.
Respondents were asked how often they listen to the public radio series, Talk of the Nation: Sci-ence Friday. Of the 641 respondents, 75% (n = 478) were listeners:• 15% of respondents heard the series “every week;”• 46% heard it “1-3 times per month;”• 14% heard it “less than once per month;”• 13% never heard it or did not hear it often enough to answer the feedback questions;• 13% were not aware of the series.
Demographic Information
II. Do demographic characteristics including age, gender,education and occupational status relate to whether a person listens to
the series or frequency of listening to the series?
Our respondent sample is typical of a public radio member audience –more educated, better employed, older with fewer minorities compared tothe general U.S. adult population. No demographic variable is signifi-cantly associated with listening behavior.
Table 1 presents demographic information for the whole sample as well as for the subgroups oflisteners and non-listeners. The respondent sample includes few minorities (9%) and morewomen (54%) than men (46%). The mean and median age for the respondents is 55 years, witha normal distribution from 21 to 93 years. Most respondents (70%) are employed, mostly at jobsconsidered to be in the high level of occupational status (67% executive and major professionals,

Multimedia Research Summative Evaluation5
managers and small business owners). The majority of respondents (66%) also report havingpost-college education. Thus, our respondents, drawn randomly from three stations’ membershiplists, are more educated, better employed, older and include fewer people of color than the gen-eral U.S. adult population. However, the sample is typical of a public radio member audience;this sample’s demographics are similar to random samples Multimedia Research has obtainedrecently from other public radio membership lists. Statistical analyses revealed no significantinfluence of gender, age, education and occupational status on whether or not respondents lis-tened to the show or listening frequency.
Table 1 Distribution of Demographic Variables (each cell = 100%)
All RespondentsN=641
Listenersn=478
(75% of sample)
Non-Listenersn=163
(25% of sample)State: CO
TXMA
31%37%32%
25%44%31%
49%15%36%
Gender: Male Female
46%54%
45%55%
50%50%
Age: Mean Median
Range
555521-93
545423-88
585821-93
Ethnic Status:WhiteMinority
91% 9%
91% 9%
92% 8%
Employment Status:Employed:
High Status4
Medium StatusLow Status
RetiredHomemakerUnemployedStudent
70% 67% 24% 9%24% 4% 1% 1%
72% 68% 23% 9%22% 4% 1%
< 1%
63% 63% 28% 9%31% 4%
< 1% 1%
Education:5
Graduated H.S.Some CollegeGraduated CollegePost-College
2%10%22%66%
< 1%10%20%69%
4%11%29%56%
4 "High" occupational status includes those with professional and managerial jobs; "medium" are technical or skilledjobs; and "low" are unskilled or menial labor.5 Because “graduated H.S.” has few respondents, the category is combined with “some college” for further statisticalanalysis.

Multimedia Research Summative Evaluation6
Science Interest, Knowledge, Sources and Beliefs
III. Do background characteristics including interest in science, levelof science knowledge, preferred science news sources and
beliefs about science research relate towhether a person listens to the series or frequency of listening?
Listeners of Science Friday rated themselves as statistically signifi-cantly more interested in science and significantly more knowledgeableabout science compared with non-listeners. In these differences, the effectsize is moderate.
Major sources of science news included “radio” (55%), “maga-zines/journals” (44%) and “newspapers” (36%). “Radio” was chosen as amajor source of science news by significantly more SF listeners (63%)than non-listeners (29%). This is a moderately strong association.
Listeners agreed significantly more than non-listeners with one ofeight belief statements about science research:
“It is important for me to understand the process of scientific discovery.”Background variables did not differ significantly for different levels of
listening frequency.
Science Interest
Respondents were asked how interested they are in science, generally speaking. They respondedusing a five-point scale from not at all interested (1) to very interested (5). Of the sample as awhole, 75% were either interested or very interested (4, 5) in science.The average rating (M) for the samplewas 4.1 with a standard deviation (SD)of .9. These results are equivalent toother recent studies of public radiomembers.
As shown in the chart to the right, lis-teners are more interested in sciencethan non-listeners. On average, listenersreport a significantly higher interest inscience (M = 4.2, SD = .8) than non-listeners (M = 3.8, SD = 1.0),6 yieldinga moderate effect (d = .38). Interest inscience does not differ for the three lev-els of listening frequency (every week,1-3 times per month, less than once permonth).
6 t (245)=4.08, p < .0001, Cohen’s d = .38, r2 = .036

Multimedia Research Summative Evaluation7
Science Knowledge
Respondents rated their level of science knowledge as a member of the general public, using afive-point scale from not at all knowledgeable (1) to very knowledgeable (5). Of the sample as awhole, 52% ranked themselves as knowledgeable or very knowledgeable (4, 5, see chart). Thisis similar to percentages obtained in other public radio member studies. The average rating forthe sample was 3.5 with a standarddeviation of 1.0.
As shown in the chart to the right,listeners feel more knowledgeableabout science than non-listeners. Onaverage, listeners report a signifi-cantly higher knowledge in science(M = 3.6, SD = .9) than non-listeners (M = 3.2, SD = 1.0).7 Thisis a moderate effect, as shown byCohen’s d = .37. Knowledge meanratings did not differ for the threelevels of listening frequency.
Science News Sources
Respondents were asked to indicate their primary and secondary source of science news, giveneight possible sources. The largest percentage of both listeners and non-listeners reported that“magazines/journals” were their primary source of science news: Listeners (29%); Non-Listeners(31%). This result is consistent with previous Multimedia Research studies of public radio audi-ences. Respondents also identified their secondary source of science information from the samelist. Listeners of Science Friday indicated “radio” as their most frequent secondary choice(38%), whereas the most frequent secondary choice for non-listeners was “television” (23%).
7 t (251)=3.96, p < .0001, Cohen’s d = .37, r2 = .033

Multimedia Research Summative Evaluation8
The chart below combines the votes for primary and secondary sources of science news andgives an overall picture of where the public radio members feel they obtain most of their sciencenews.
Combining primary and secondary responses, more than half of public radio members said theirprimary or secondary source of science news was “radio” (55%) and less than half said “maga-zines/journals” (44%). Newspapers were a major source of science news for 36% of all memberrespondents and television for 26%.
Listeners of Science Friday considered their major sources of science news to be “radio” (63%),“magazines/journals” (41%), “newspapers” (36%) and “television” (21%). Non-listeners indi-cated their major sources of science news as “magazines/journals” (52%), “newspapers” (37%),“television” (39%) and “radio” (29%). Listeners were significantly more likely than non-listeners to list “radio” as one of their two sources of science news.8 There is a moderately strongrelationship (φ = .3) between listening to SF and identifying radio as a major source of sciencenews. No relationship was found between listening frequency and preferred science newssources.
8 χ2 (1, N = 616) = 55.10, p < .0001, Phi coefficient = 0.3.
Multimedia Research Summative Evaluation9
Beliefs about Science Research
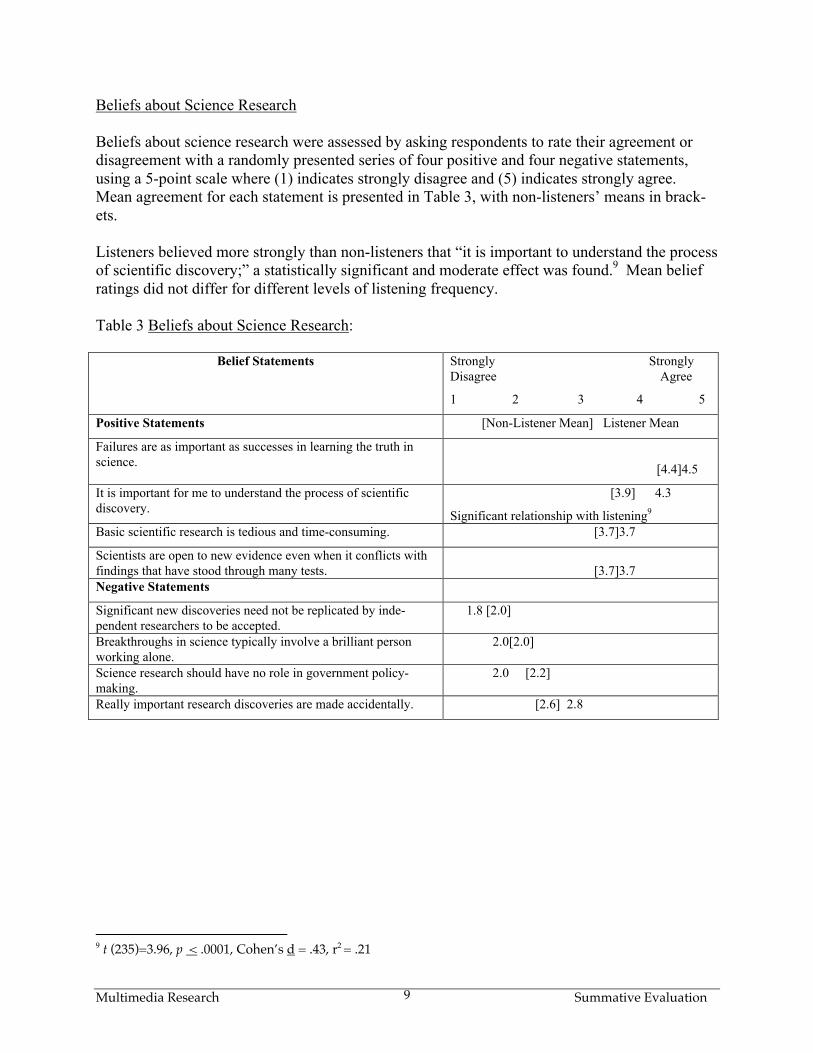
Beliefs about science research were assessed by asking respondents to rate their agreement ordisagreement with a randomly presented series of four positive and four negative statements,using a 5-point scale where (1) indicates strongly disagree and (5) indicates strongly agree.Mean agreement for each statement is presented in Table 3, with non-listeners’ means in brack-ets.
Listeners believed more strongly than non-listeners that “it is important to understand the processof scientific discovery;” a statistically significant and moderate effect was found.9 Mean beliefratings did not differ for different levels of listening frequency.
Table 3 Beliefs about Science Research:
Belief Statements Strongly StronglyDisagree Agree
1 2 3 4 5
Positive Statements [Non-Listener Mean] Listener Mean
Failures are as important as successes in learning the truth inscience. [4.4]4.5
It is important for me to understand the process of scientificdiscovery.
[3.9] 4.3
Significant relationship with listening9
Basic scientific research is tedious and time-consuming. [3.7]3.7
Scientists are open to new evidence even when it conflicts withfindings that have stood through many tests. [3.7]3.7Negative Statements
Significant new discoveries need not be replicated by inde-pendent researchers to be accepted.
1.8 [2.0]
Breakthroughs in science typically involve a brilliant personworking alone.
2.0[2.0]
Science research should have no role in government policy-making.
2.0 [2.2]
Really important research discoveries are made accidentally. [2.6] 2.8
9 t (235)=3.96, p < .0001, Cohen’s d = .43, r2 = .21

Multimedia Research Summative Evaluation10
Understanding of Basic Research
IV. Does understanding the value of and barriers to doing basicresearch relate to whether a person listens to the program?
Listening to Science Friday is not related to respondents’ thinkingabout the value of basic research. About one-quarter of the samplewas not able to explain the value or importance of basic research, butthose who could focused mainly on basic research as the foundation ofscience (29%), as leading to discoveries or applications (14%), as a re-quirement for understanding our world (13%) and as enhancingknowledge (12%).
Listening to Science Friday is not related to respondents’ thinkingabout the barriers or obstacles that prevent scientists from doing basicresearch. About one-fifth of the sample was not able to describe barri-ers to basic research, but those who did focused mainly on the obsta-cles of politics (20%), barriers of government policies (19%) and re-ligion (14%), and the lack of reward or recognition (11%).
Understanding the Value or Importance of Basic Research
The following open-ended question was presented to all respondents:Basic science research can be defined as research that has no immediate applied or commercial value. What, ifanything, do you see as the value or importance of basic research?
One-quarter (23%) of the sample did not provide an answer to this question. Demographic andbackground variables did not relate to whether or not an answer was provided.
Every answer was coded by keyword or keyphrase and combined into logical categories. Forexample, all answers mentioning foundation, fundamental, basis, building block, starting point orgroundwork were coded under the category of “foundation of science.” Categories receiving 5%or more of respondents’ interest are presented in Table 4 with example answers. Listeners didnot differ from non-listeners in the tallies for any category, nor did listening frequency relate tofrequency of response categories.
Basic research was valued mainly because it is the foundation of science (29%), leads to discov-eries or applications (14%), increases our understanding of the world (13%) or enhances knowl-edge (12%).

Multimedia Research Summative Evaluation11
Table 4. Distribution of Categories Coded for Value of Basic Research
CategoriesCode words and Phrases
Example answers of value or importance of basic research
AllN= 641
Listenersn=478
NonListeners
n=163Foundation of Science
Foundation, fundamental, basis, building block, starting point, ground-work
“Provides foundation for the applied sciences”“Fundamental to the creation of evidence-based practice.”“It is the basis of most ‘practical’ research.”“Used as building blocks towards something more valuable.”
29% 31% 25%
Leads to Discoveries or ApplicationsLeads to discoveries/breakthroughs/advancesLeads to applied research/applications/useful findings
“It leads to other discoveries.”“It may lead to other avenues of study and research.”“Basic research can lead to breakthroughs that are important.”“It can lead to applications.”
14% 13% 14%
Increases Understanding of the WorldIncreases/improves Understanding of the world/universe/us/natural proc-esses
“To increase our understanding of our world.”“To improve our understanding of nature and the universe.”“Understand processes of earth, universe, life.”
13% 13% 10%
Enhances KnowledgeEnhances/furthers/increases/expands/contributes Knowledge
“Expands knowledge pool.”“It furthers the whole magnum of scientific knowledge.”“Increases knowledge.”“Contributes to our bank of scientific knowledge”
12% 12% 10%
May have Application in the FutureMay have application/applied value/progress in the fu-ture/eventually/ultimately/long-term/later
“Knowledge that is discovered now may have use in the future.”“We may find the information learned may be applied later.”“Future applications.”“Eventually it improves quality of life.”
10% 9% 12%

Multimedia Research Summative Evaluation12
Understanding the Obstacles or Barriers that Prevent Basic Research
The following open-ended question was presented to all respondents:What obstacles or barriers, besides money, do you think prevent scientists from doing basic research?
One-fifth (20%) of the sample did not provide an answer to this question. Every answer wascoded by keyword or keyphrase and combined into logical categories. For example, all answersmentioning politics, politicians, political, public policy or lobbyists were coded under the cate-gory of “politics.” Categories receiving 5% or more of respondents’ interest are presented in Ta-ble 5 with example answers. Listeners did not differ from non-listeners in the tallies for anycategory. Barriers mentioned most frequently were politics (20%); government policies (19%),religion (14%) and lack of reward or recognition (11%).

Multimedia Research Summative Evaluation13
Table 5. Distribution of Categories Coded for Obstacles that Prevent Basic ResearchCategories
Code words and PhrasesExample answers of obstacles or barriers preventing scientists from doing basic
research
AllN= 641
Listenersn=478
NonListeners
n=163
PoliticsPolitics, politicians, political, public policy, lobbyists
“Political posturing and use of science for political gain.”“Politics, politics, politics!”“Lack of political support.”
20% 20% 20%
Government PolicyGovernment policy/restraints/restrictions/intervention/regulation
“Government interference such as restricting research on stem cell therapy,reproductive technology and climate change.”“Government regulations.”“Lack of inspiration and leadership by government leaders.”
19% 20% 16%
ReligionReligious groups/beliefs/views/ideology/customs/bias
“Opposition for religious reasons.”“Religious fundamentalism of all stripes.”“Religious belief systems get in the way, in my opinion.”
14% 15% 11%
Lack of Reward or RecognitionLack of reward/status/recognition/prestige/glamour
“It’s usually not very glamorous and often requires a large investment of timeand effort for what appear to be small returns.”“Little recognition for findings and hard work put into the research.”“Lack of positive reinforcement.”
11% 12% 14%
Lack of Immediate Value or ProfitLack of immediate value/benefits/reward/profit/payoff
“Basic research may be overlooked in favor of research with greater potentialfor immediate gratification.”“Emphasis on rapid results.”“Low forecasted benefits.”
8% 8% 7%
Public AttitudePublic lack of respect/appreciation/interest/support
“Lack of interest on the part of the public.”“Public apathy.”
8% 7% 10%
Lack of TimeLack of time, time constraints/consumption/pressure
“Time constraints.”“Time, research is very extensive and time consuming.”“It may take too much of their career.”
7% 7% 8%
Lack of EducationEducation, schools, training, qualified personnel
“Lack of early education to generate interest in basic science.”“Lack of knowledgeable and driven personnel.”“Weak science education in public schools.”
7% 7% 6%
Policies within Academics or CompaniesPolicies and politics of employers
“The tenure system within universities, publish or perish.”“Job pressures and priorities set by organizations by employers.”
7% 8% 5%
Lack of Public UnderstandingPublic misunderstanding/ignorance
“Lack of understanding by general public.”“Public ignorance.”
5% 5% 3%

Multimedia Research Summative Evaluation14
Appeal of Science Friday
V. How appealing is Science Friday and do demographic or back-ground variables relate to appeal?
Listeners rate the series as highly appealing. Nine out of 10 listen-ers agree or strongly agree that they “enjoy listening to the series,” and8 out of 10 agree or strongly agree that they “listen attentively” to theshow. Those who reported listening more frequently also reportedlistening more attentively and enjoying the series more compared withthose listening less frequently.
Seven out of 10 listeners agree or strongly agree with the statementthat “Ira Flatow asks questions of guest scientists that I would ask.”Six of ten listeners disagree or strongly disagree with the observationthat “call-in questions of listeners detract from the value of the pro-gram.”
Listeners responded to statements reflecting feelings about the series using a 5-point scale fromstrongly disagree (1) to strongly agree (5). Four statements relating to appeal appear in Table 6with their mean ratings. ANOVA and Spearman rank correlations were conducted on the ratingsof the appeal statements for the demographic and background variables.
Table 6. Agreement with Statements on Appeal of Science FridayMeans % who “agree” or
“strongly agree”Statements
4.4 94% I enjoy listening to the series, Science Friday
4.0 81% I listen attentively when I hear the series come on the radio.
3.8 74% Ira Flatow asks questions of guest scientists that I would ask.
% who “disagree” or“strongly disagree”
2.4 58% The call-in questions from listeners detract from the value of the program.
Almost all listeners (94%) agree or strongly agree that they “enjoy listening to the series, ScienceFriday.” A significant effect resulted for listening frequency.10 Those who listened more fre-quently rated their enjoyment higher (M(Every week) = 4.8; M(1-3 times/month) = 4.4; M(<1/mo) = 4.1). Eta-squared of .12 means that of all the variance that exists in the agreement rat-ings for this statement, 12% is associated with differences in listening frequency.
10 F(2, 474) = 11.490, p < .0001, η2 = .12.

Multimedia Research Summative Evaluation15
Eight of ten listeners (81%) say they “listen attentively” to the series. A significant effect re-sulted for listening frequency.11 Those who listened more frequently reported listening more at-tentively (M(Every week) = 4.5; M(1-3 times/month) = 4.0; M(< 1/mo) = 3.7). Of the variancein the agreement ratings for this statement, 10% is associated with differences in listening fre-quency.
Seven of ten listeners (74%) agree or strongly agree that the host asks questions that they wouldask of the guest scientists. Six of seven listeners (58%) disagree or strongly disagree that thecall-in questions detract from the series. Ratings did not relate significantly to demographic orbackground variables for these statements.
Comprehension of Science Friday
VI. How understandable is Science Friday and do demographicor background variables relate to comprehension?
Listeners rate the series as highly understandable. Nine of 10 listen-ers disagree or strongly disagree that the “information on Science Fridayis too technical,” and 8 of 10 disagree that “the process of research aspresented by guest scientists is confusing.” Eight of 10 listeners felt that“the series keeps them up to date about current science research,” and 7of 10 agreed the “series has reinforced their understanding of the processof research.” The series information was rated as “usually familiar” by athird of the listening audience, novel by less than a third and sometimesfamiliar and sometimes novel by slightly more than a third of listeners.Thus, the information on Science Friday is targeted at an appropriatelevel to reach effectively the mass public radio member audience.
As listening frequency increased, agreement increased significantlyfor two statements: “the series keeps me up to date about current scienceresearch;” and “the series has reinforced my understanding of the proc-ess of research.”
Listeners responded to statements reflecting comprehension of the series using a 5-point scalefrom strongly disagree (1) to strongly agree (5). Five statements relating to clarity and compre-hension appear in Table 7 with their mean ratings. ANOVA and Spearman rank correlationswere conducted on the ratings of the statements to assess influence of demographic and back-ground variables.
11 F(2, 474) = 27.155, p < .0001, η2 = .10.

Multimedia Research Summative Evaluation16
Table 7. Agreement with Statements on Comprehension of Science FridayMeans % who “agree” or
“strongly agree”Statements
4.0 82% The series keeps me up to date about current science research.
3.8 71% The series has reinforced my understanding of the process ofresearch.
3.1 34% I am usually familiar with most of the information given in the series.
% who “disagree” or“strongly disagree”
1.8 87% The information on Science Friday is too technical for me.
2.1 81% The process of research as presented by the guest scientists isconfusing.
Eight of ten listeners agreed or strongly agreed that “the series keeps me up to date about currentscience research.” A significant effect resulted for listening frequency.12 Those who listenedmore frequently agreed more with the statement (M(Every week) = 4.3; M(1-3 times/month) =4.0; M(< 1/mo) = 3.6). Eta-squared of .11 means that a relatively small portion (11%) of thevariance in the ratings is associated with differences in listening frequency.
Seven of ten listeners agreed or strongly agreed that “the series has reinforced their understand-ing of the process of research.” A significant effect resulted for listening frequency.13 Thosewho listened more frequently agreed more with the statement (M(Every week) = 4.2; M(1-3times/month) = 3.8; M(< 1/mo) = 3.5). Eta-squared of .10 indicates that 10% of the variance inthe ratings is associated with differences in listening frequency.
In response to the statement “I am usually familiar with most of the information given in theshow,” 34% of listeners agreed, 38% were neutral, and 29% disagreed. This distribution indi-cates that the series’ information is targeted at a level to reach the mass radio audience effec-tively – the information is usually familiar to a third, novel to less than a third and sometimesfamiliar and sometimes novel to the slightly more than a third of the audience.
Almost nine out of ten listeners disagreed or strongly disagreed with the statement that “the in-formation on Science Friday is too technical for me.”14 Eight of ten listeners disagreed orstrongly disagreed with the statement that “the process of research as presented by the guest sci-entists is confusing.”15
12 F(2, 466) = 12.514, p < .0001, η2 = .11.13 F(2, 469) = 25.173, p < .0001, η2 = .10.14 This statement may be reconsidered in the following way: 87% of listeners agree that the informationon Science Friday is not too technical for them.15 This negative statement may be reconsidered in the positive as follows: 81% of listeners agree that theprocess of research as presented by the guest scientists is clear.

Multimedia Research Summative Evaluation17
Learning from Science Friday
VII. How successful is Science Friday in helping listeners under-stand research and do demographic or background variables in-
fluence this understanding?
Eight out of 10 listeners felt that Science Friday is successful orvery successful at helping them understand “what research underpinssignificant new discoveries,” “how failures in research can be useful toachieve eventual success” and “how scientists go about doing their re-search.” Seven of 10 listeners felt the series is successful at helpingthem understand “what barriers must be overcome to carry out suc-cessful research” and “what length of time it takes to reach reliableconclusions.” More than 6 of 10 listeners felt the show is successful atpresenting “what role corporations, private institutions and foundationsplay in research” and “what role research plays in government policy-making.” Responses were not significantly or meaningfully related todemographic or background variables.
Using a 5-point scale from not at all successful (1) to very successful (5), listeners rated state-ments about the success of Science Friday in helping them understand a research story. Fivestatements relating to SF’s success at presenting a research story appear in Table 8 with respon-dents’ mean ratings. Responses were not significantly or meaningfully related to any demo-graphic or background variables.
Table 8. Agreement with Statements on Success of SF in presenting a research storyMeans % choosing
“successful” or“very successful”
Statements about SF’s success in helping listener understand the following abouta research story
3.98 82% what research underpins significant new discoveries
3.96 80% how failures in research can be useful to achieve eventual success
3.93 79% how scientists go about doing their research
3.87 75% what barriers must be overcome to carry out successful research
3.80 70% what length of time it takes to reach reliable conclusions
3.71 67% what role corporations, private institutions and foundations play in research
3.73 66% what role research plays in government policy-making

Multimedia Research Summative Evaluation18
Prompting to Action by Science Friday
VIII. Has the series prompted listeners to take further action?
The series has successfully prompted listeners to take further ac-tion. Almost all (90%) reported following up their listening with atleast one action, and more than half (56%) reported carrying out threeor more actions as a result of the series. The most frequent activitiesare discussing topics with others (81%), reading related information(56%), searching for more information about a topic (48%) and ac-cessing a web site (39%). The percent of listeners who discuss topicswith others was significantly greater than those who did not discusstopics.
Those who hear the show more frequently were more likely to re-port that the show had prompted them to a wider variety of actionscompared with less frequent listeners.
One-fifth of listeners reported using the Science Friday website inthe previous year, mostly to listen to archived shows or search forbooks.
Respondents were asked whether listening to Science Friday had ever prompted them to take anyof seven further actions, as shown in Table 9. A single sample chi-square test shows that thepercent of listeners who discuss topics with others (81%) was significantly greater than thosewho did not (19%).16
Table 9. Actions Prompted by Listening to Science FridayHas listening to Science Friday ever prompted you to . . . Listeners
(n = 478)
discuss the topics with others 81%
read related information in books, magazines, newspapers 56%
search for more information about a topic 48%
access an Internet web site, including Science Friday’s 39%
purchase a book or other item related to a show topic 30%
use content in teaching 12%
write to Science Friday, a scientist, politician or other 4%
Weekly listeners take significantly more actions on average (3.2) than those hearing the showless than once per month (1.9); this is a large effect, as indicated by d = -.84.17 Those listening 1-3 times per month also report significantly more actions on average (2.8) than those listening lessfrequently.18 This is a moderately large effect, as indicated by d = -.53.
16 χ2 (1, N = 478) = 185.78, p < .000117 t (180)=-5.67, p < .0001, Cohen’s d = -.84, r2 = .14818 t (149)=-4.43, p < .0001, Cohen’s d = -.53, r2 = .068

Multimedia Research Summative Evaluation19
Respondents were encouraged to describe other unlisted actions that have been prompted bytheir listening to Science Friday. A small but varied set of actions were elicited, including:
Called in with a question (2 respondents)Changed product use, purchased certain food typePurchased Sirius satellite radio to have access to the program
Of the listening sample, 20% report specifically using the Science Friday website in the last year.A single sample chi-square test shows that the user group was significantly smaller than the non-using group (80%).19 Use of the website is not related to any demographic or background vari-ables. Table 10 summarizes how respondents used the website features. The majority of userslisten to archived shows (61%) or search for books (48%), and another 20% read Ira Flatow’sblog.
Table 10. Features Used on Science Friday WebsiteHow have you used Science Friday’s website in the last year? % of Users
(n = 98)
Listen to archived shows 61%
Search for book(s) 48%
Read Ira’s blog 20%
Download podcast(s) 18%
Download teaching materials 7%
Visit lounge 3%
Comment on Ira’s blog 2%
Comparison of 2003 and 2006 Listening Samples
IX. Do listeners in 2006 differ from listeners in 2003?
The percent of listeners and distributions of listening frequency donot differ for the two years. The two listener samples do not differ withrespect to demographic or background variables nor in terms of theirappeal and comprehension ratings of the series. There were also nosignificant differences in actions prompted by the show. The only sta-tistically result is moderate improvement from 2003 in the show’s suc-cess in communicating what role research plays in government policy-making.
Findings for the studies of 2003 and 2006 were compared. The percent of listeners for the twoyears does not differ significantly nor do the distributions of listening frequency.
19 χ2 (1, N = 478) = 159.36, p < .0001

Multimedia Research Summative Evaluation20
The two listening samples do not differ with respect to demographic variables (gender, age, edu-cation, occupational status) or background variables (interest in science, knowledge of science,preferred science news sources, beliefs about science research).
There are no differences between the samples in terms of their appeal and comprehension ratingsof Science Friday. There were no significant differences in actions prompted by the series. Onesignificant difference appeared in ratings of the series’ success in helping listeners understandresearch. On a scale of one to five, respondents rated SF’s success in helping them to understand“what role research plays in government policy-making.” In 2003, the mean rating was 3.5,whereas in 2006 the mean rating was 3.7.20 This is a significant difference and moderate effect(d = .3), showing improvement over time in communication of this content by the radio series.
20 t (963)=4.54, p < .0001, Cohen’s d = .3, r2 = .02