Taking PLC’s to the Next Level
54
Taking PLC’s to the Next Level • Dr. Jadi Miller, Principal, Elliott Elementary • Mr. Scott Schwartz, Principal, West Lincoln Elementary • Mrs. Mona Manley, Principal, Belmont Elementary
description
Taking PLC’s to the Next Level. Dr. Jadi Miller, Principal, Elliott Elementary Mr. Scott Schwartz, Principal, West Lincoln Elementary Mrs. Mona Manley, Principal, Belmont Elementary. Where are your Professional Learning Community’s?. Successful Data/PLC Teams. Collaboration. - PowerPoint PPT Presentation
Transcript of Taking PLC’s to the Next Level
Taking PLC’s to the Next Level
• Dr. Jadi Miller, Principal, Elliott Elementary• Mr. Scott Schwartz, Principal, West Lincoln
Elementary• Mrs. Mona Manley, Principal, Belmont
Elementary
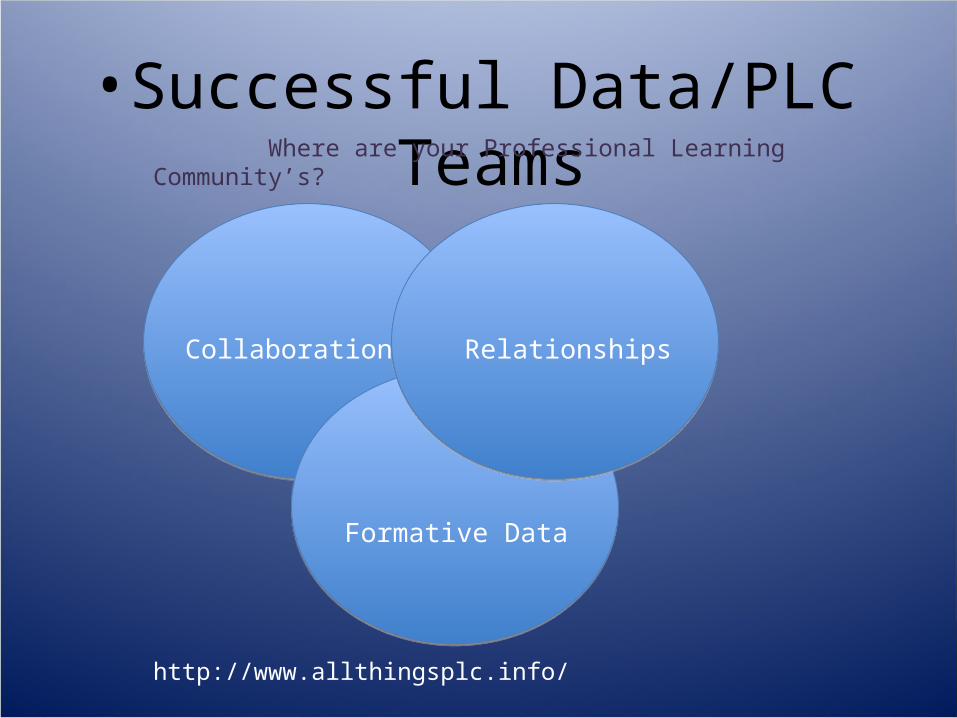
• Successful Data/PLC Teams
Collaboration Relationships
Formative Data
Where are your Professional Learning Community’s?
http://www.allthingsplc.info/
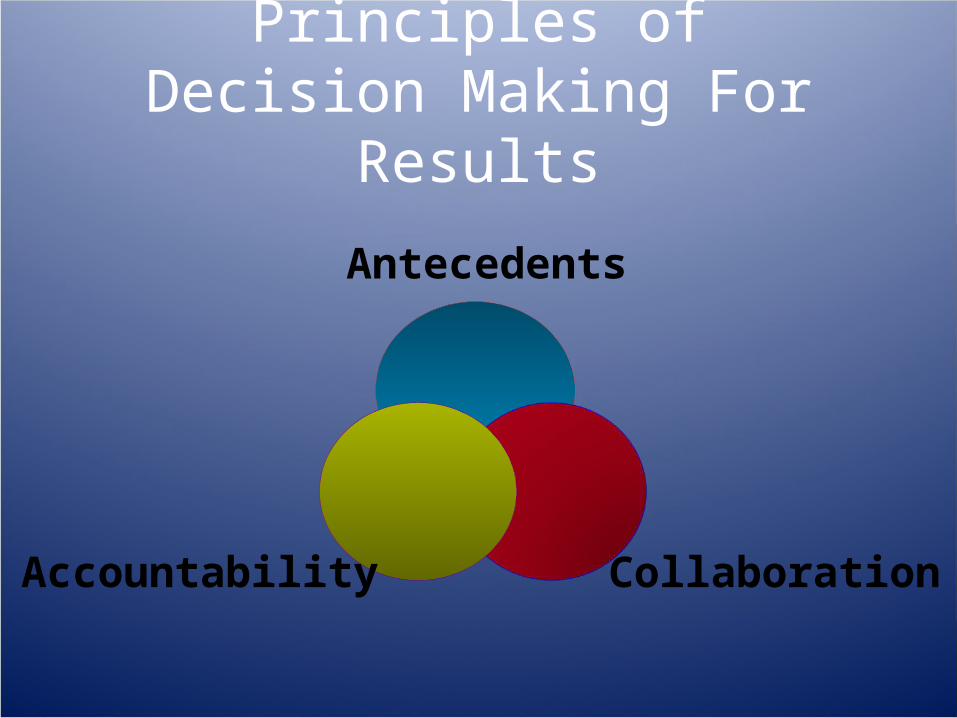
Principles ofDecision Making For Results
Antecedents
CollaborationAccountability
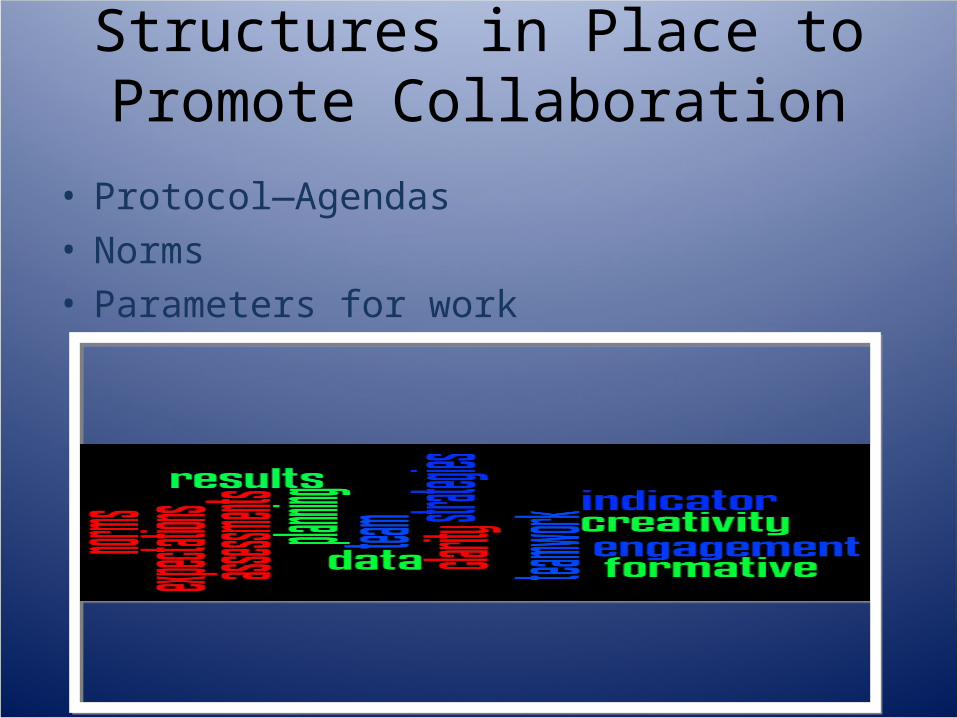
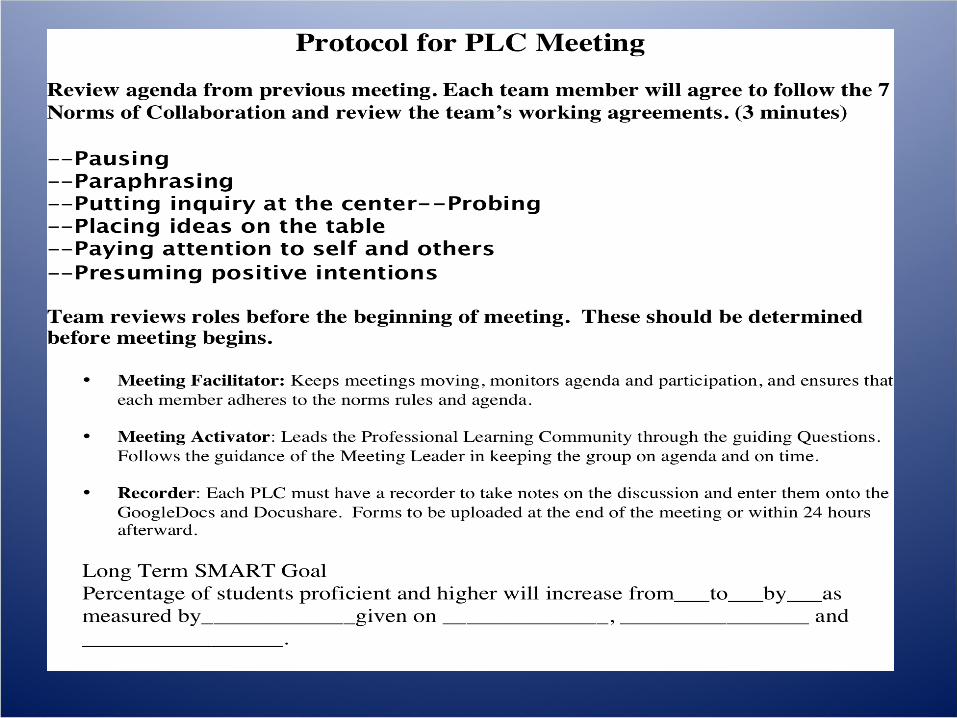
Structures in Place to Promote Collaboration
• Protocol—Agendas• Norms• Parameters for work
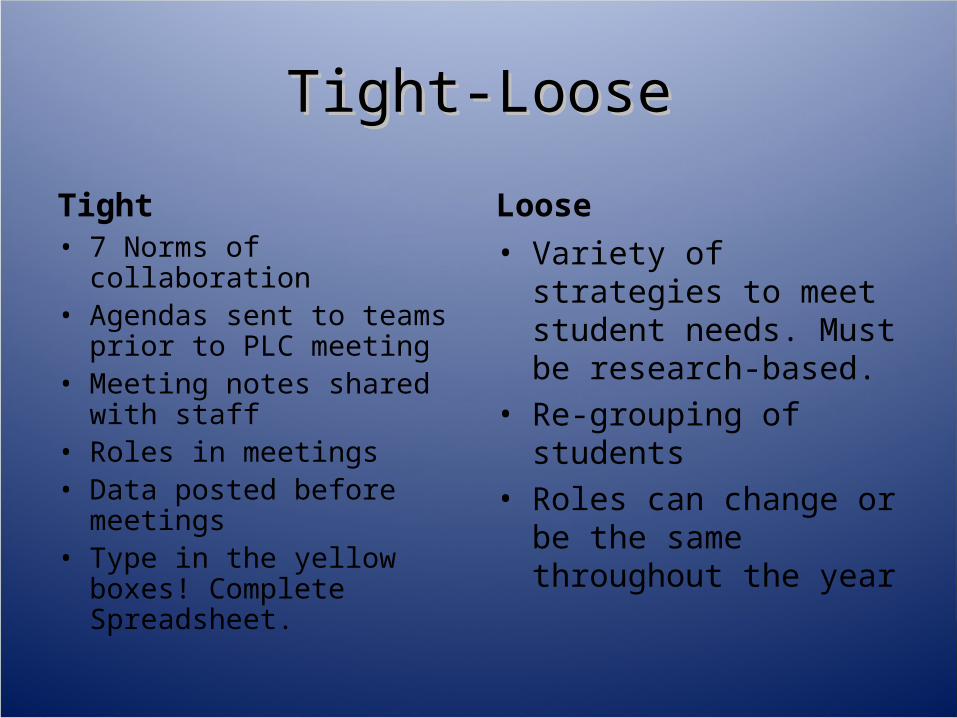
Tight-LooseTight-Loose
Tight• 7 Norms of collaboration• Agendas sent to teams prior
to PLC meeting• Meeting notes shared with
staff• Roles in meetings• Data posted before
meetings• Type in the yellow boxes!
Complete Spreadsheet.
Loose• Variety of strategies to
meet student needs. Must be research-based.
• Re-grouping of students• Roles can change or be the
same throughout the year
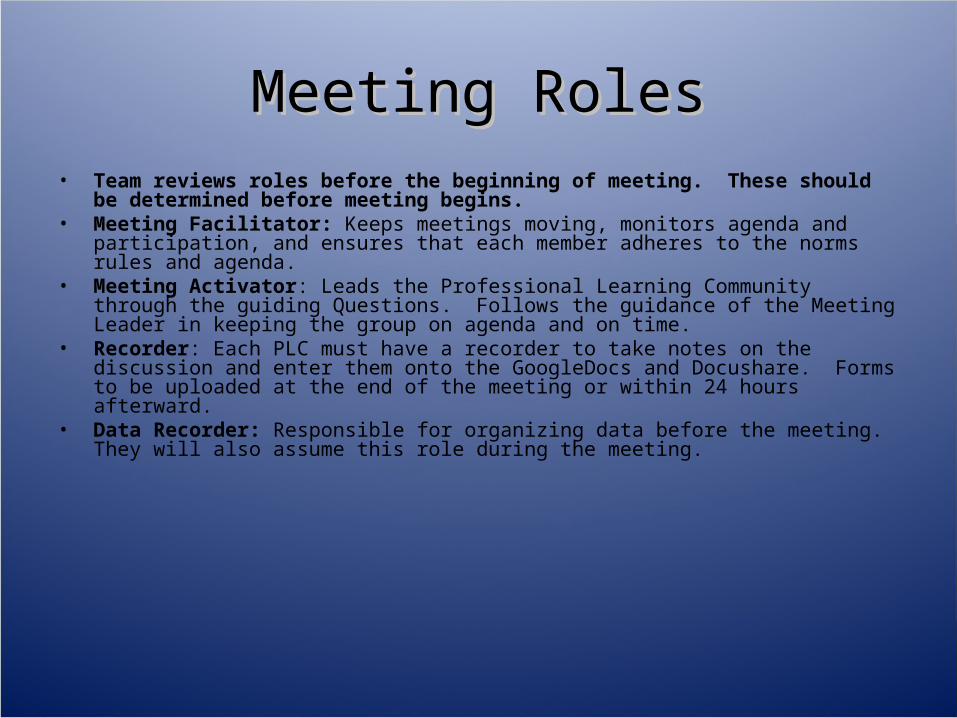
Meeting RolesMeeting Roles• Team reviews roles before the beginning of meeting. These should be determined before
meeting begins. • Meeting Facilitator: Keeps meetings moving, monitors agenda and participation, and ensures that
each member adheres to the norms rules and agenda.• Meeting Activator: Leads the Professional Learning Community through the guiding Questions.
Follows the guidance of the Meeting Leader in keeping the group on agenda and on time.• Recorder: Each PLC must have a recorder to take notes on the discussion and enter them onto the
GoogleDocs and Docushare. Forms to be uploaded at the end of the meeting or within 24 hours afterward.
• Data Recorder: Responsible for organizing data before the meeting. They will also assume this role during the meeting.
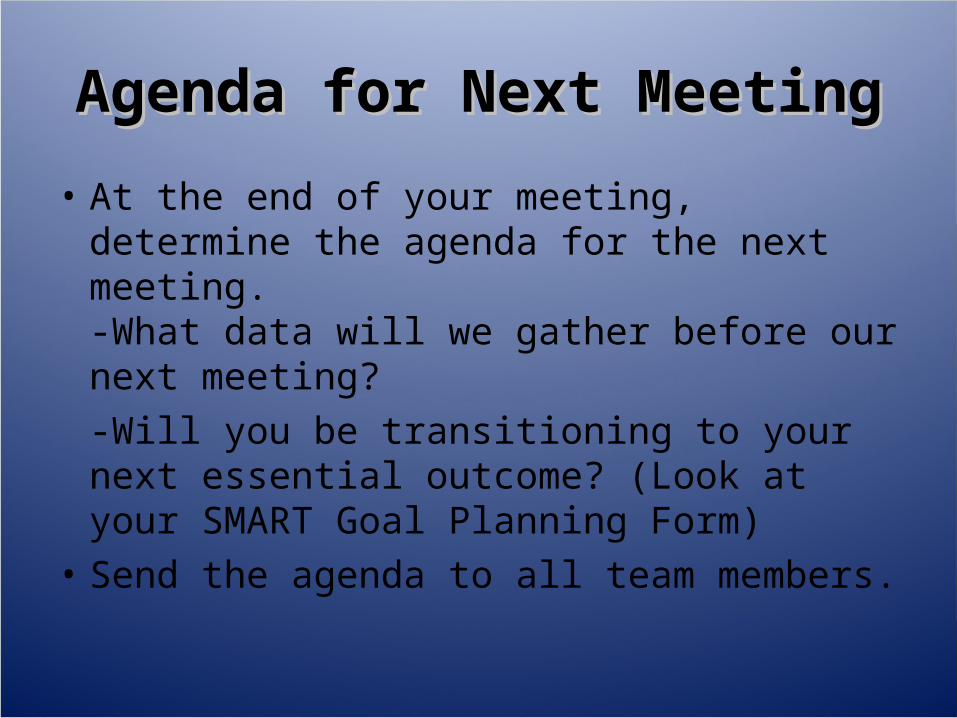
Agenda for Next MeetingAgenda for Next Meeting
• At the end of your meeting, determine the agenda for the next meeting.-What data will we gather before our next meeting?-Will you be transitioning to your next essential outcome? (Look at your SMART Goal Planning Form)
• Send the agenda to all team members.
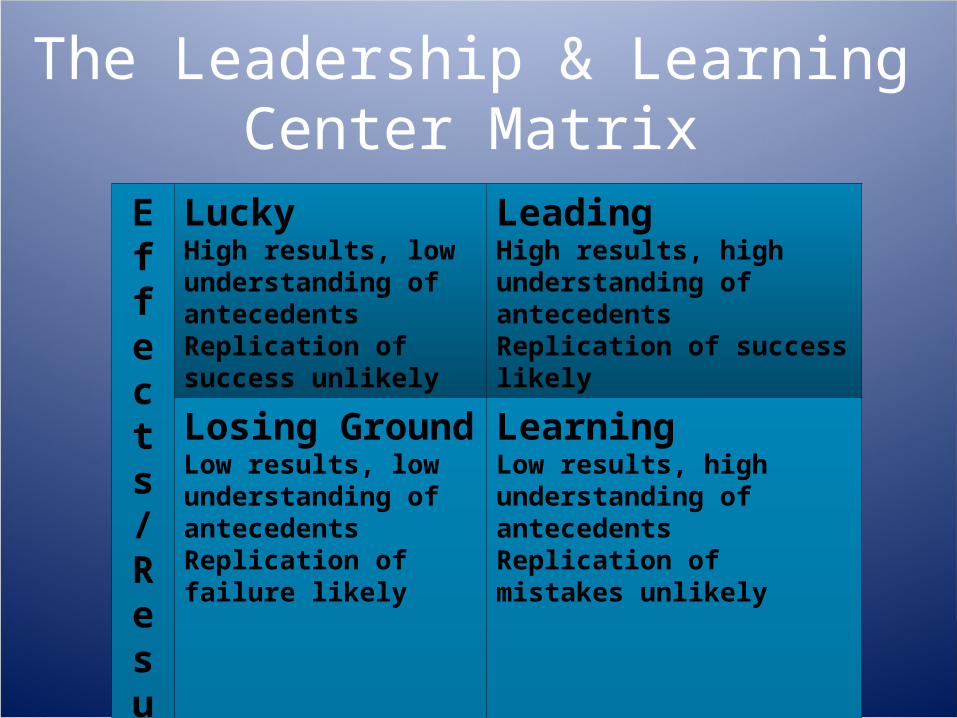
The Leadership & Learning Center Matrix
Effects/Results (stud.out.)
LuckyHigh results, low understanding of antecedentsReplication of success unlikely
LeadingHigh results, high understanding of antecedentsReplication of success likely
Losing GroundLow results, low understanding of antecedentsReplication of failure likely
LearningLow results, high understanding of antecedentsReplication of mistakes unlikely
Antecedents/Cause Data (Adult Actions)
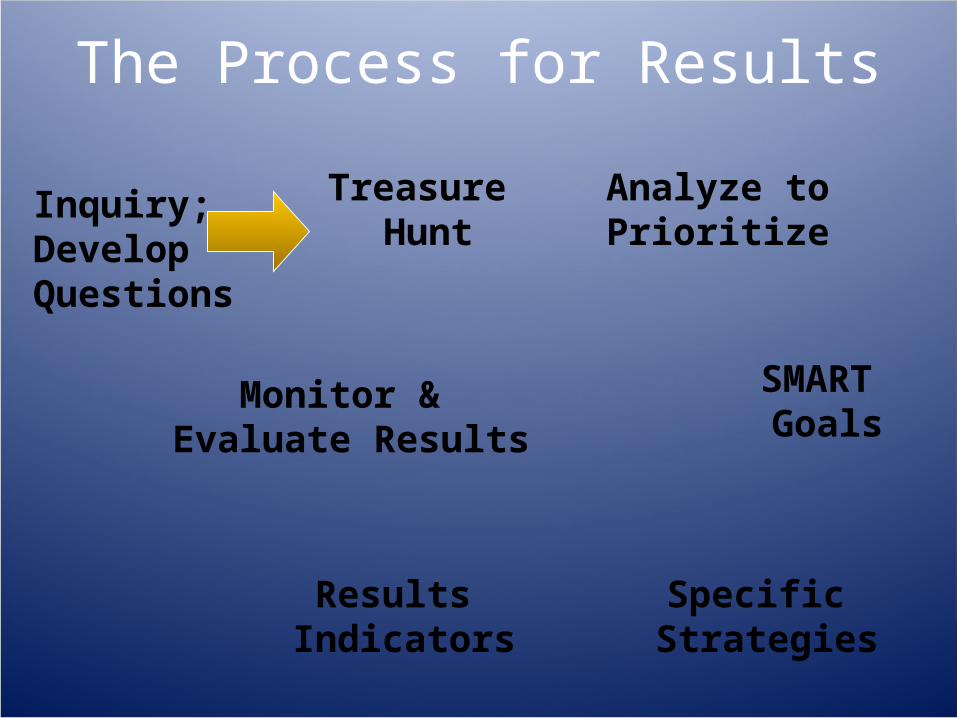
The Process for Results
Analyze toPrioritize
Monitor & Evaluate Results
Treasure Hunt
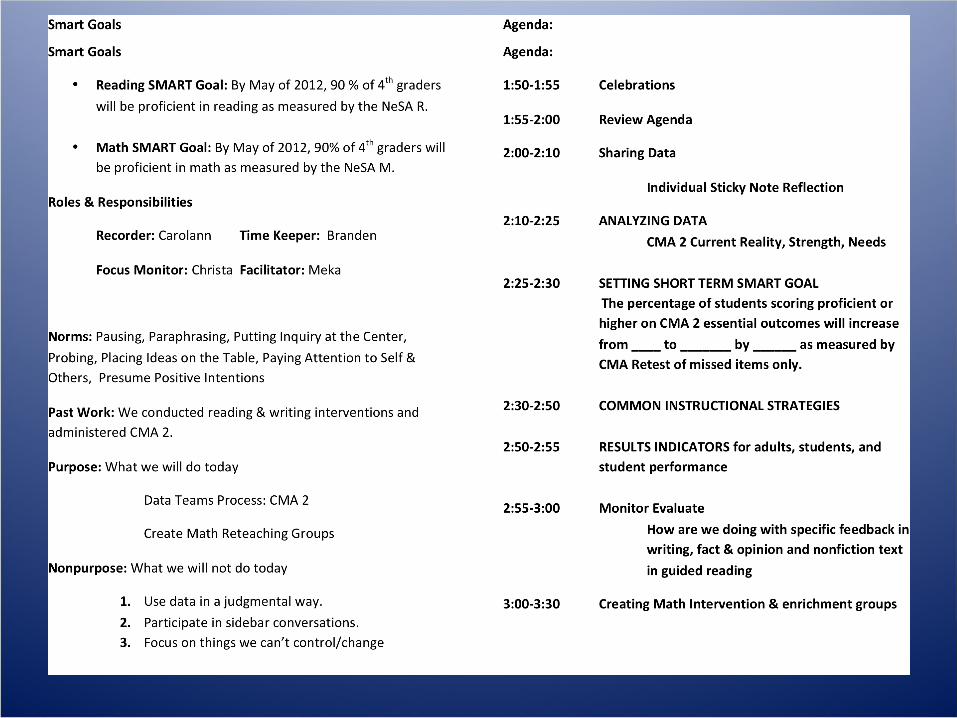
SMART Goals
Specific Strategies
Results Indicators
Inquiry;Develop Questions
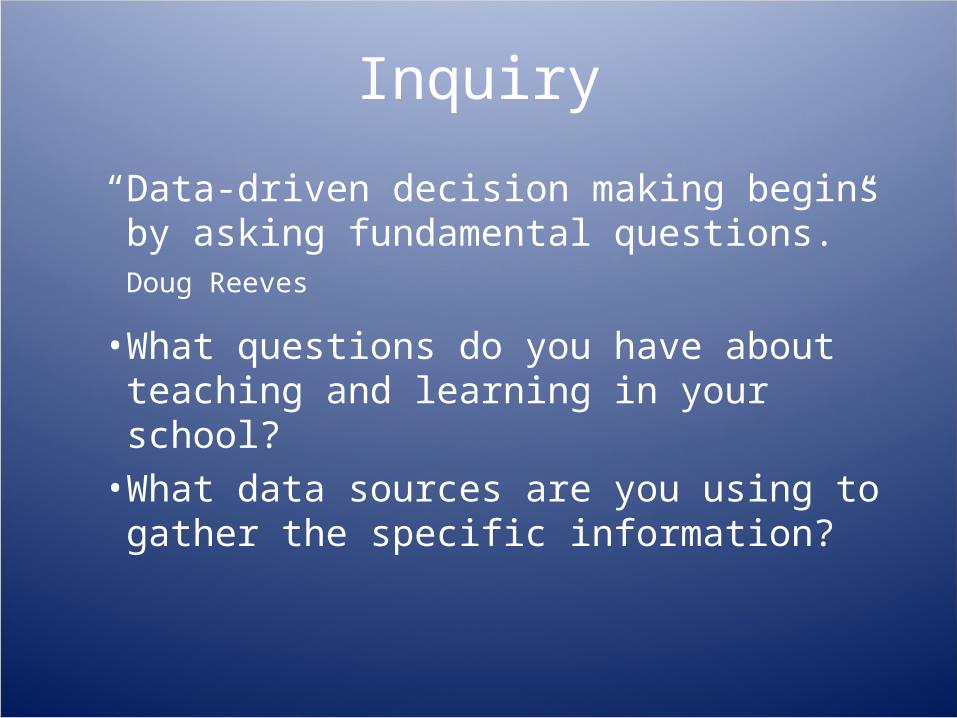
Inquiry
“Data-driven decision making begins by asking fundamental questions.”
Doug Reeves
• What questions do you have about teaching and learning in your school?
• What data sources are you using to gather the specific information?
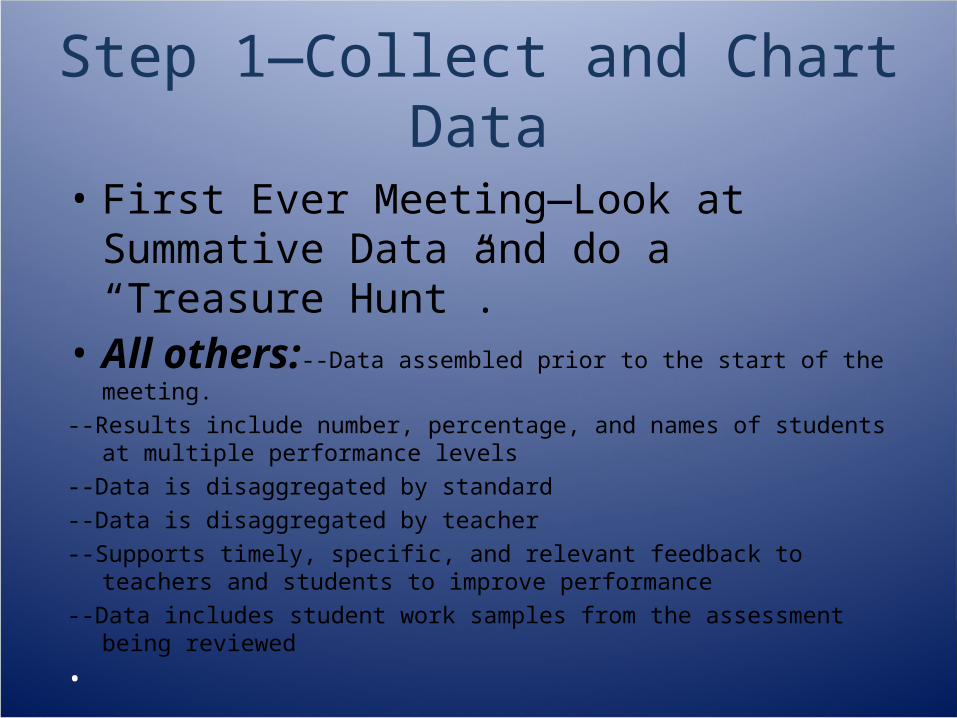
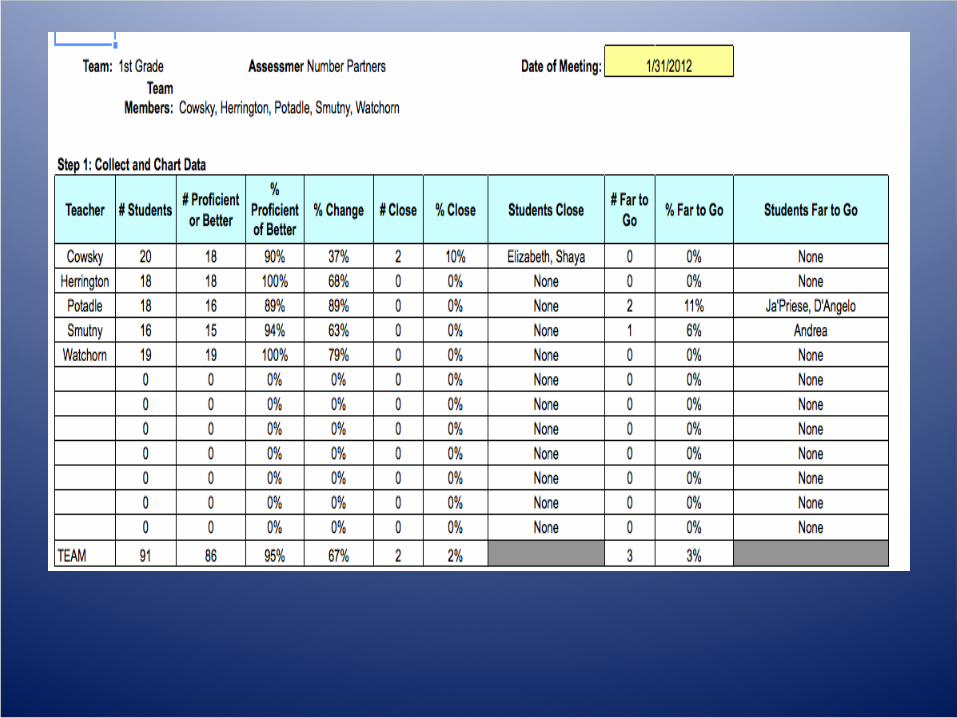
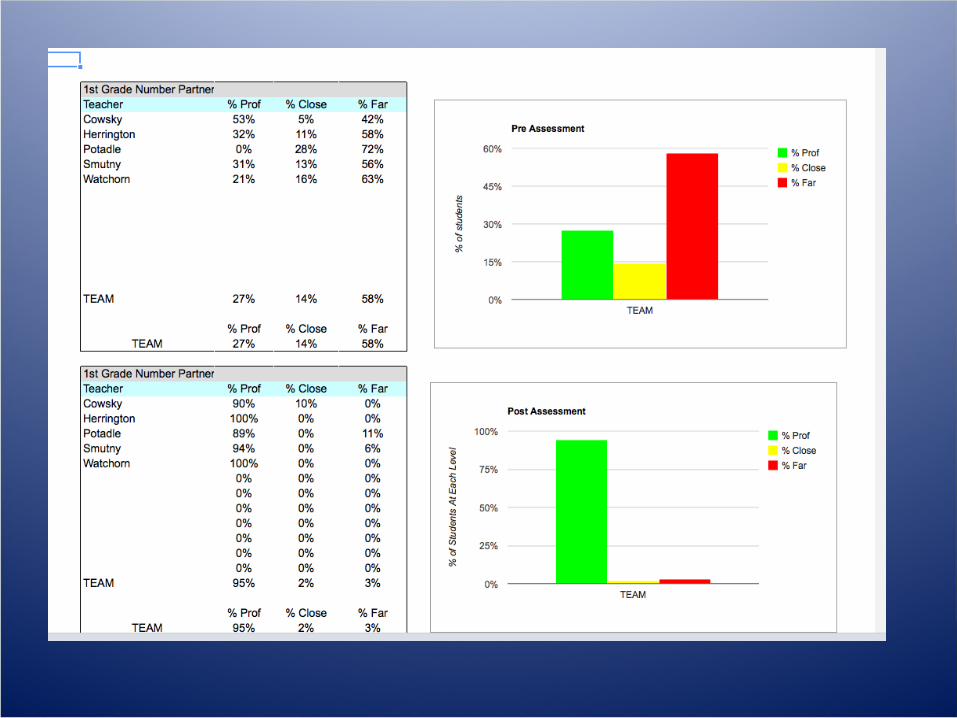
Step 1—Collect and Chart Data
• First Ever Meeting—Look at Summative Data and do a “Treasure Hunt”.
• All others:--Data assembled prior to the start of the meeting.
--Results include number, percentage, and names of students at multiple performance levels
--Data is disaggregated by standard--Data is disaggregated by teacher--Supports timely, specific, and relevant feedback to teachers and students to
improve performance--Data includes student work samples from the assessment being reviewed
•
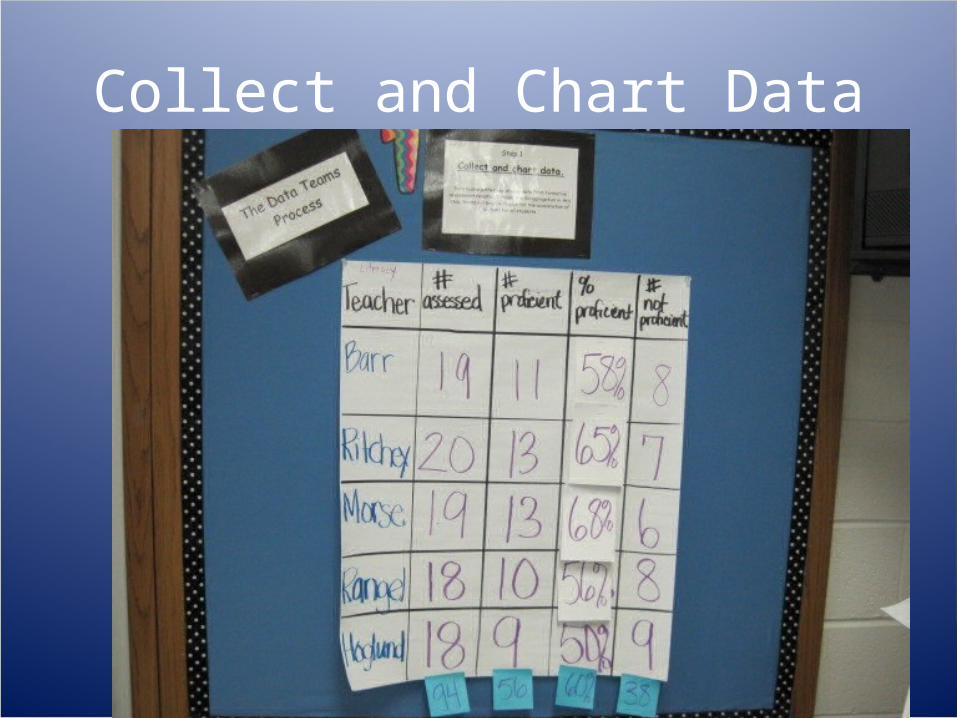
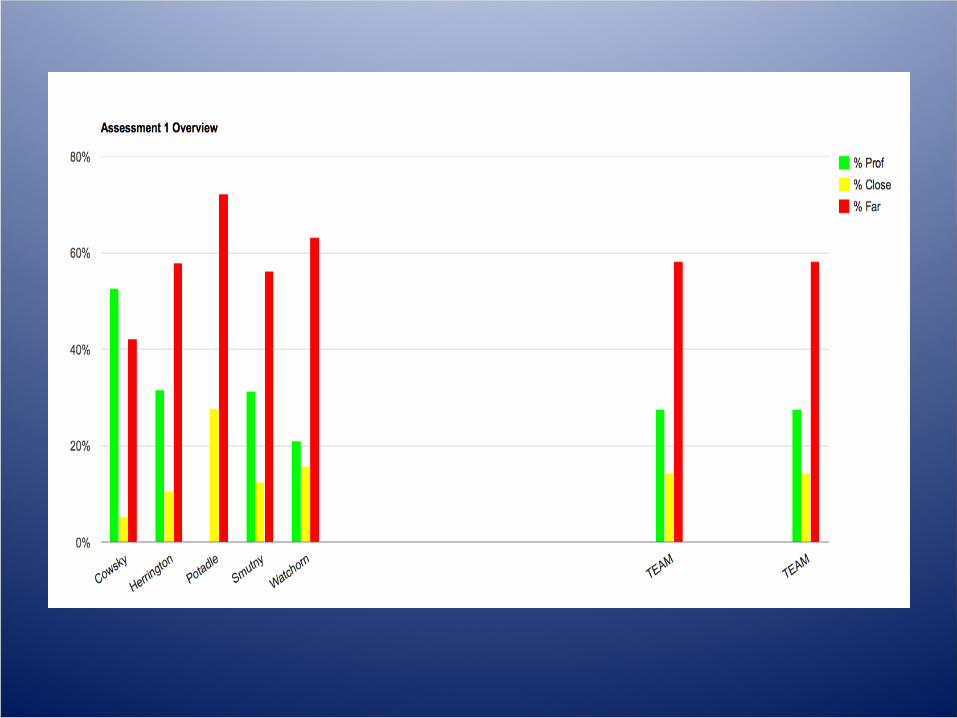
Collect and Chart Data
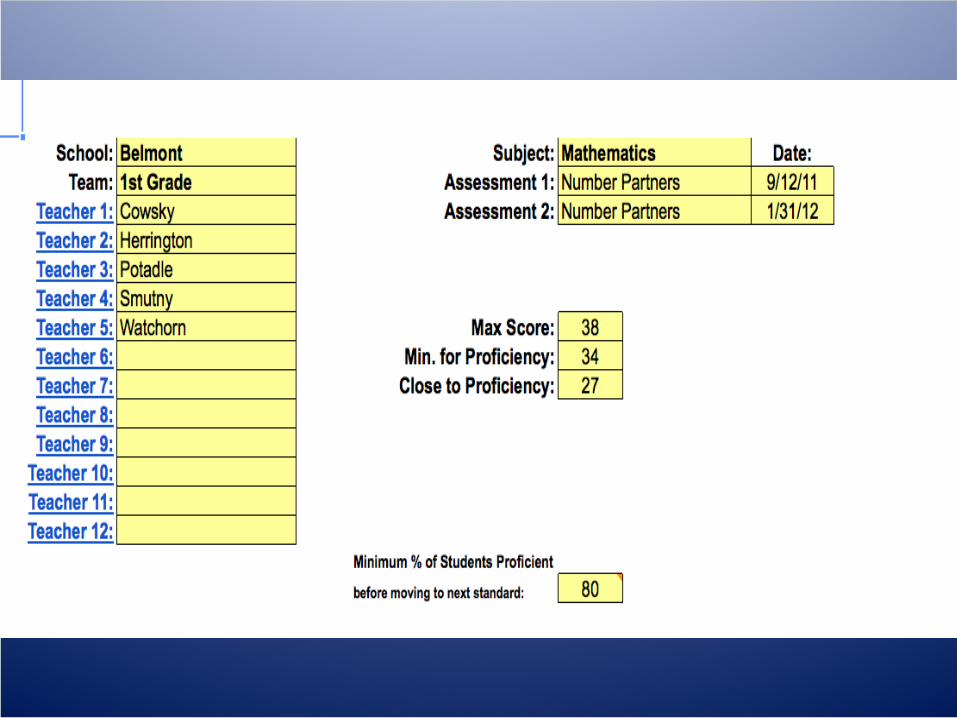
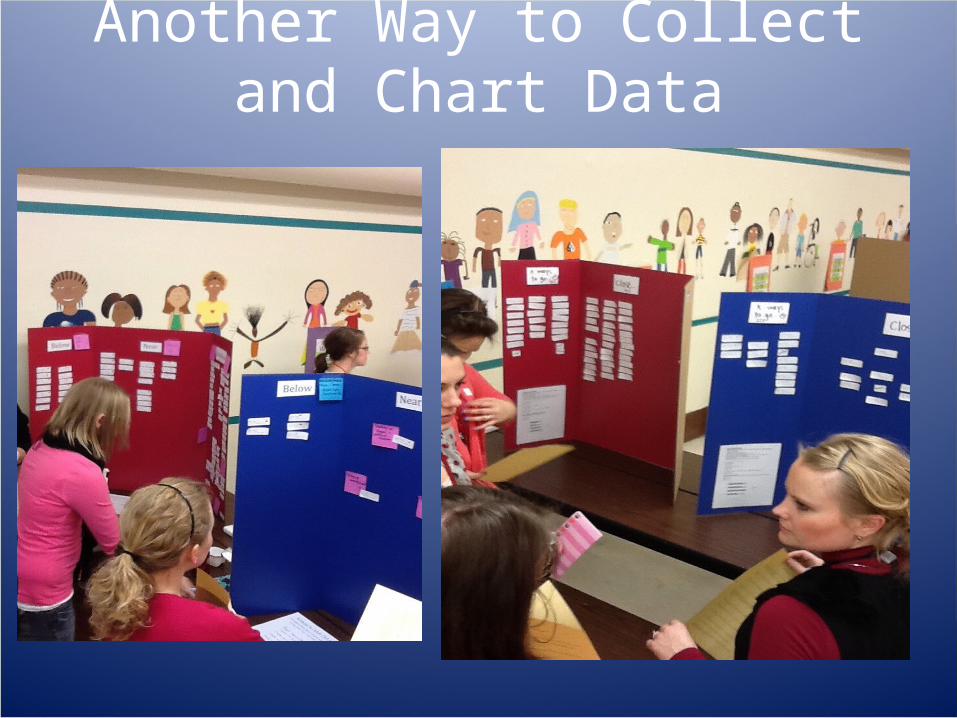
Another Way to Collect and Chart Data
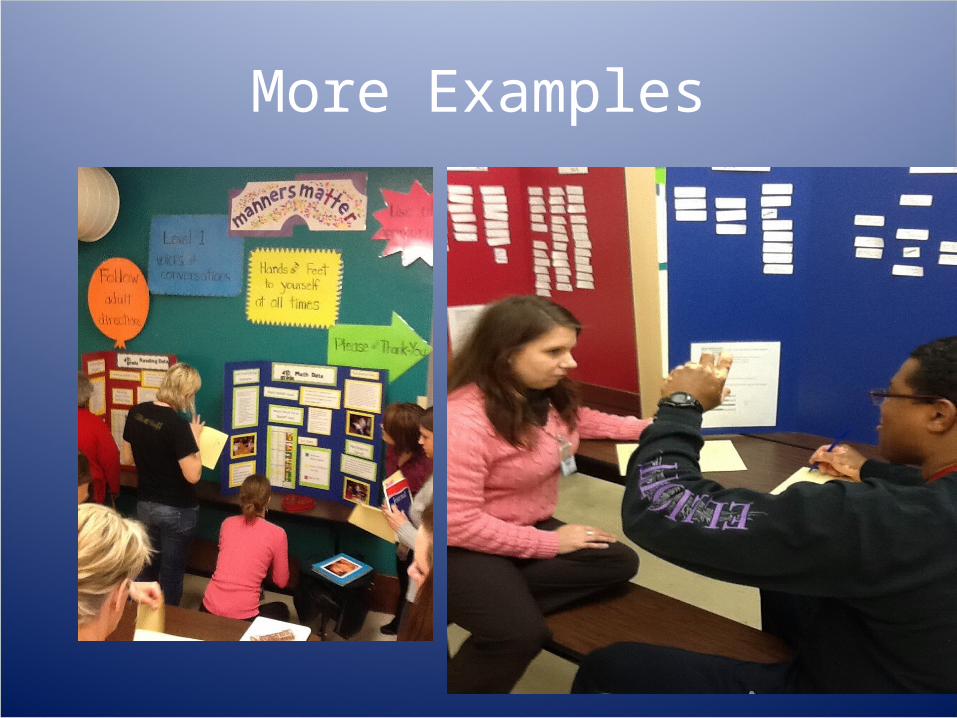
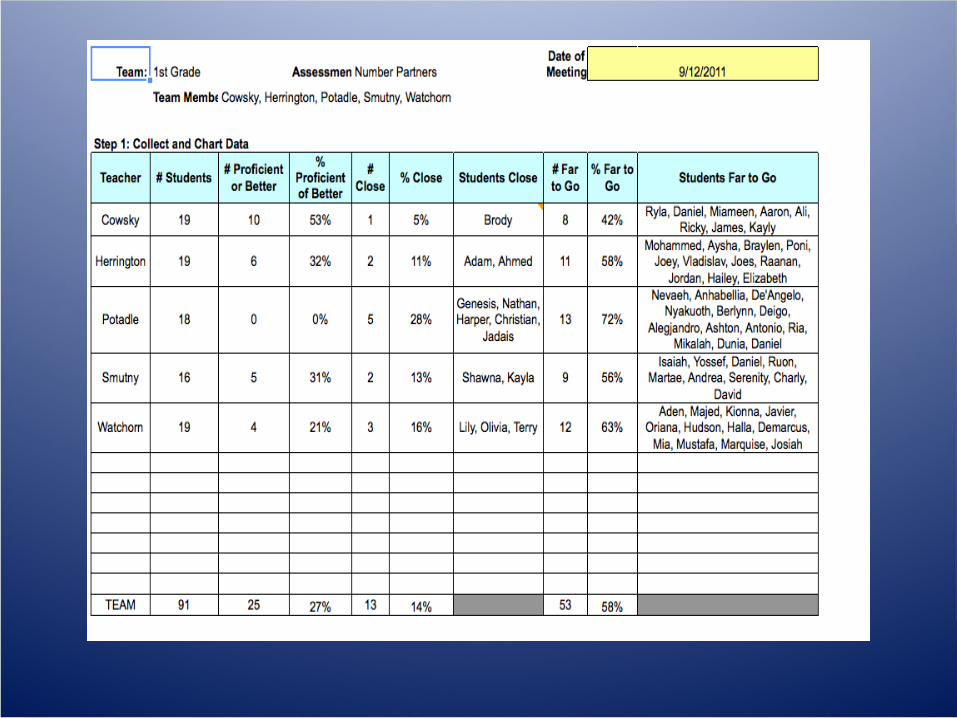
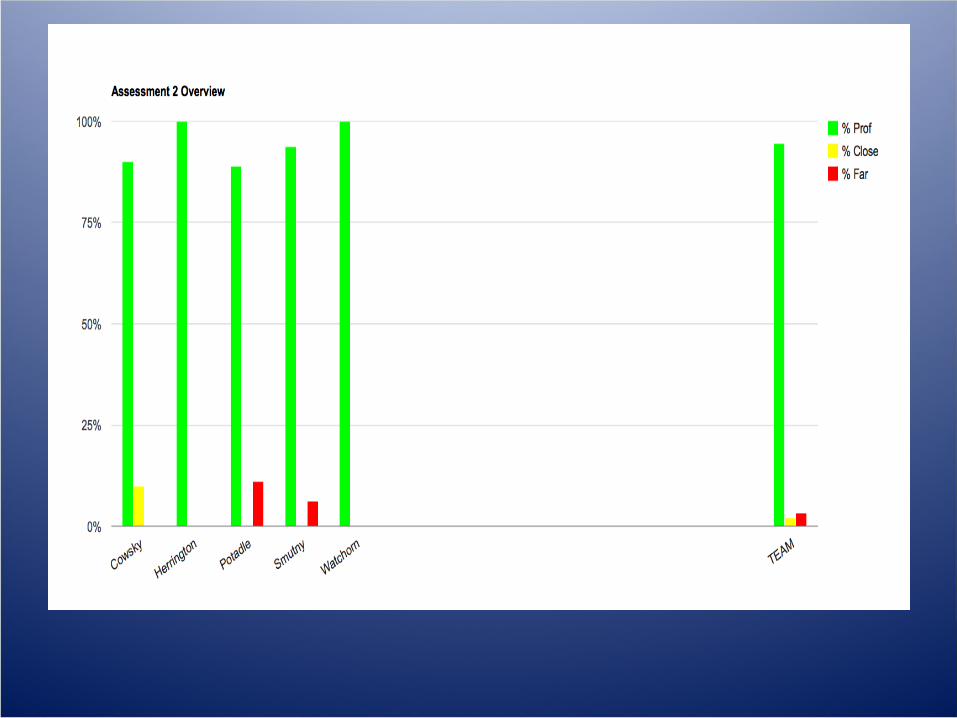
More Examples
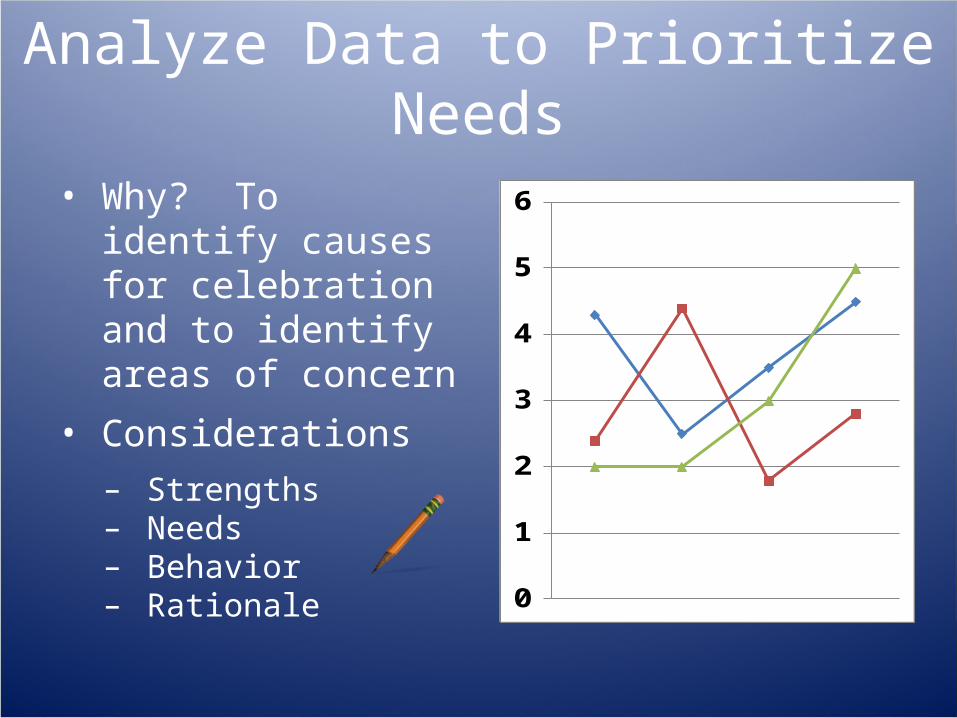
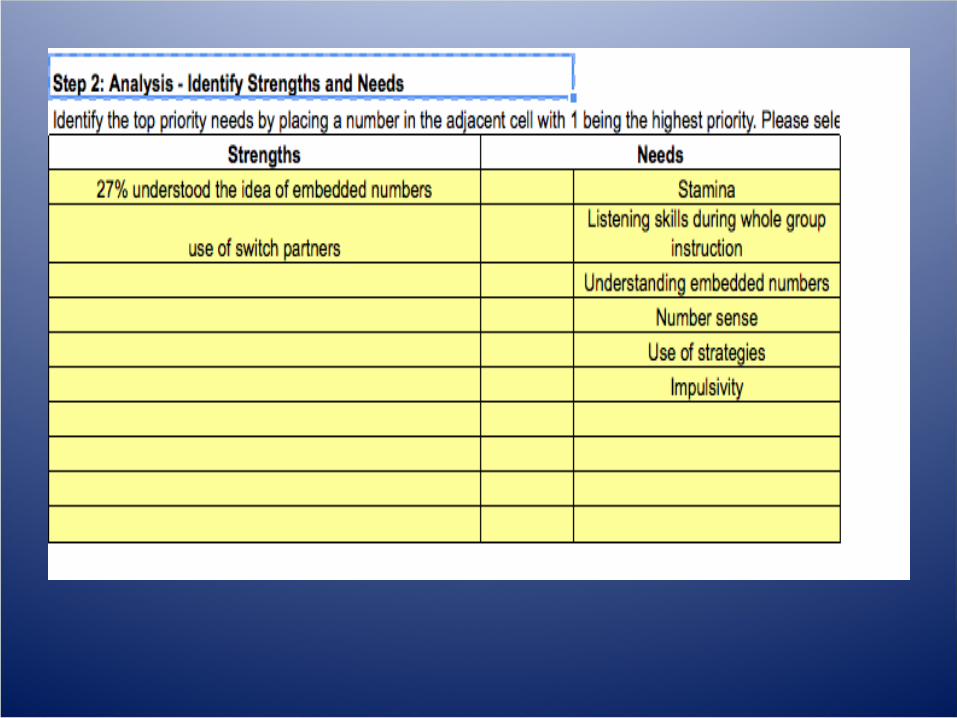
Analyze Data to Prioritize Needs
• Why? To identify causes for celebration and to identify areas of concern
• Considerations– Strengths– Needs– Behavior– Rationale 0
1
2
3
4
5
6
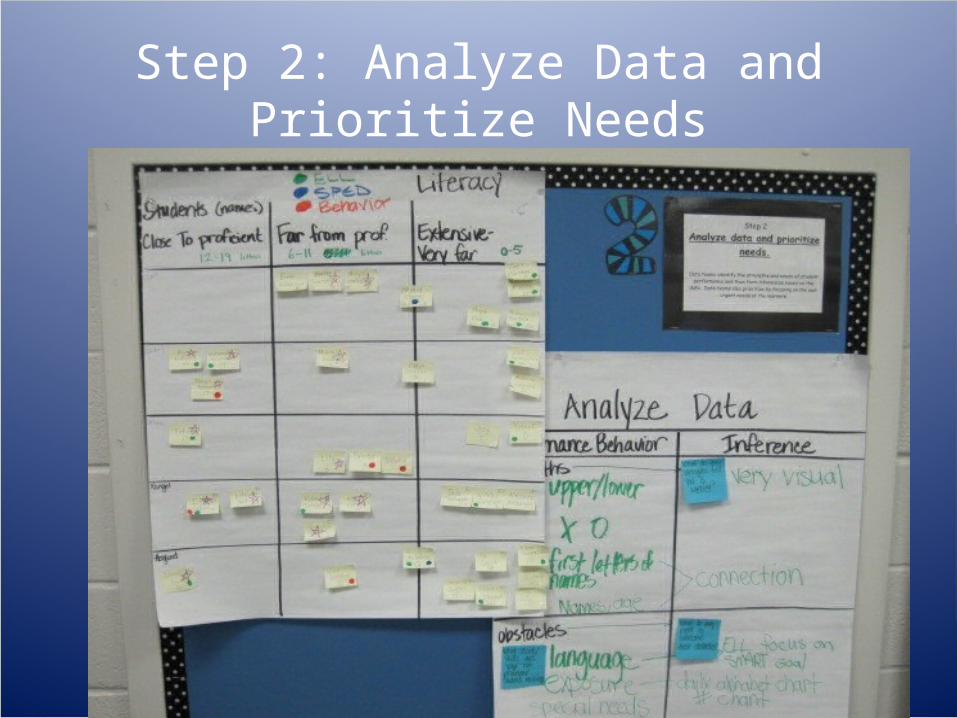
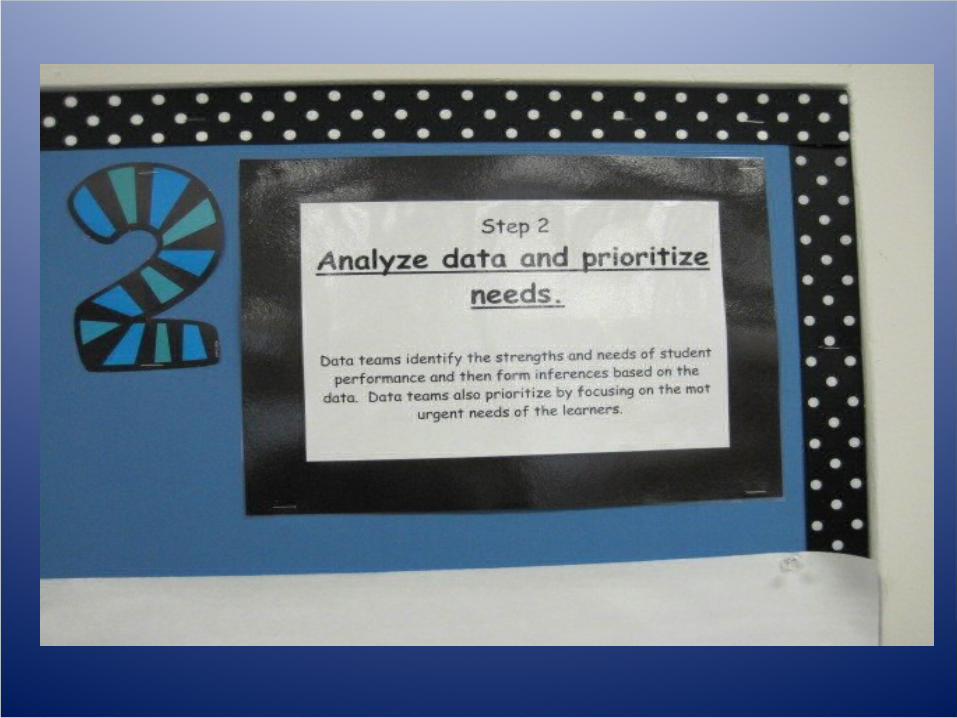
Step 2: Analyze Data and Prioritize Needs
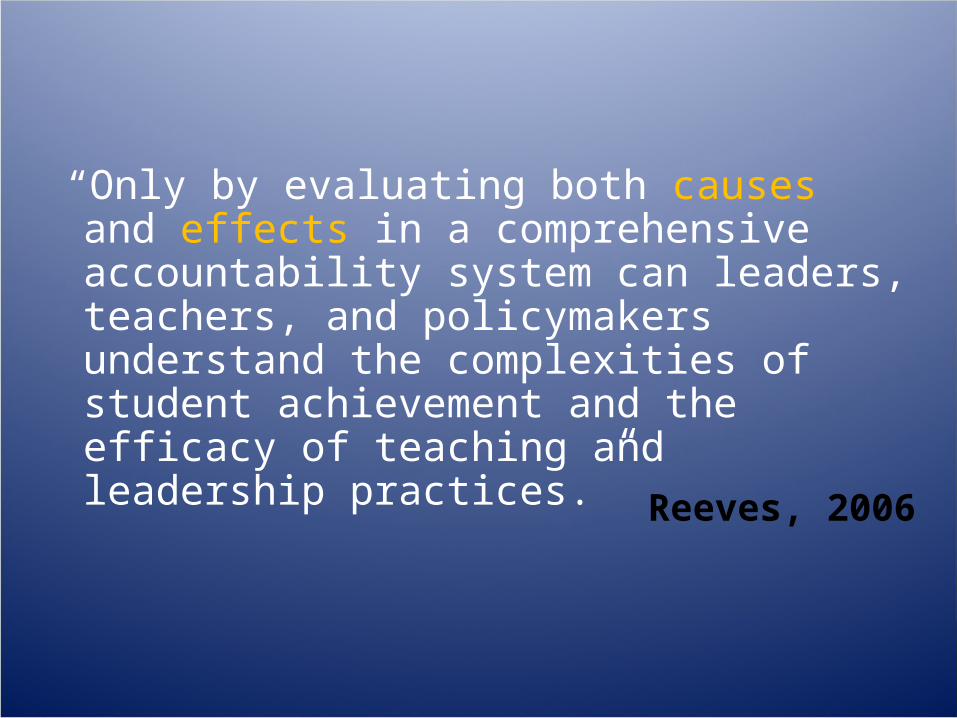
“Only by evaluating both causes and effects in a comprehensive accountability system can leaders, teachers, and policymakers understand the complexities of student achievement and the efficacy of teaching and leadership practices.”
Reeves, 2006
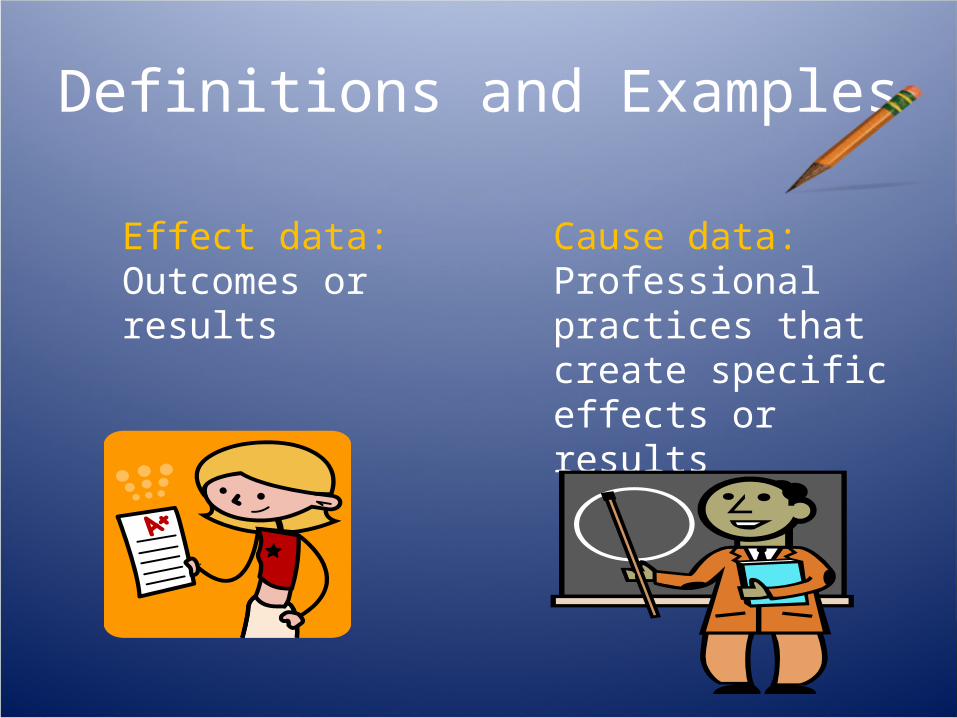
Definitions and Examples
Effect data: Outcomes or results
Cause data: Professional practices that create specific effects or results
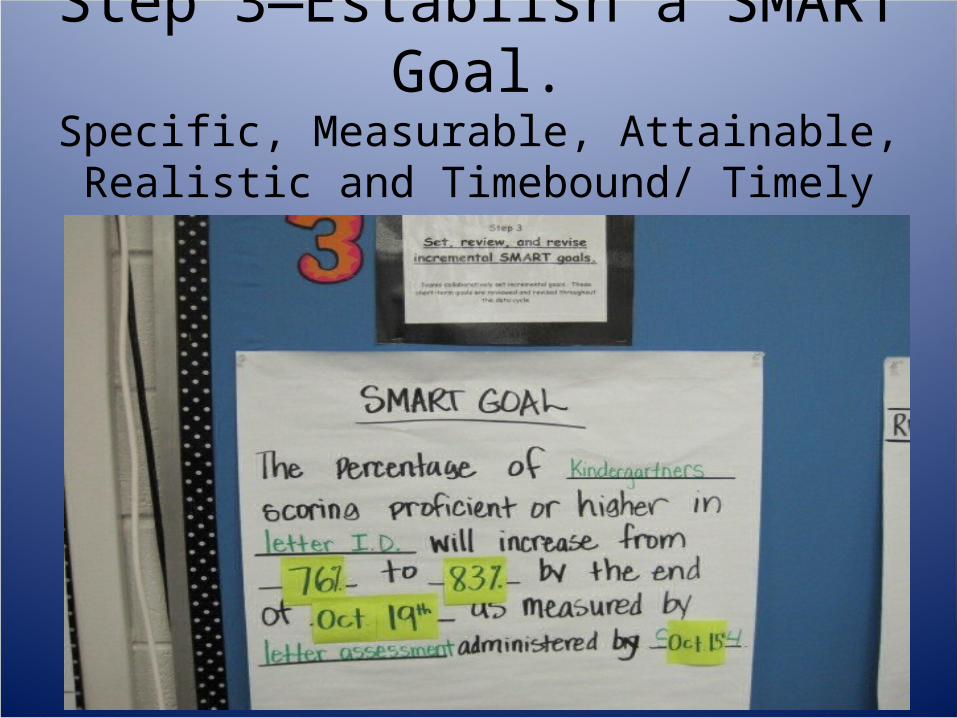
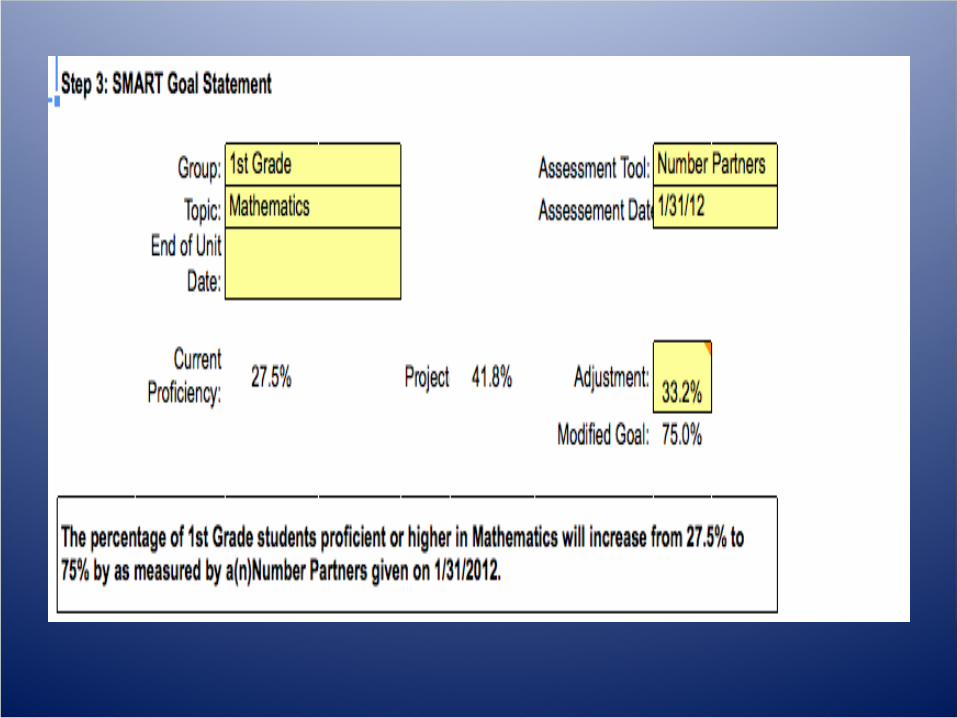
Step 3—Establish a SMART Goal.Specific, Measurable, Attainable, Realistic and
Timebound/ Timely
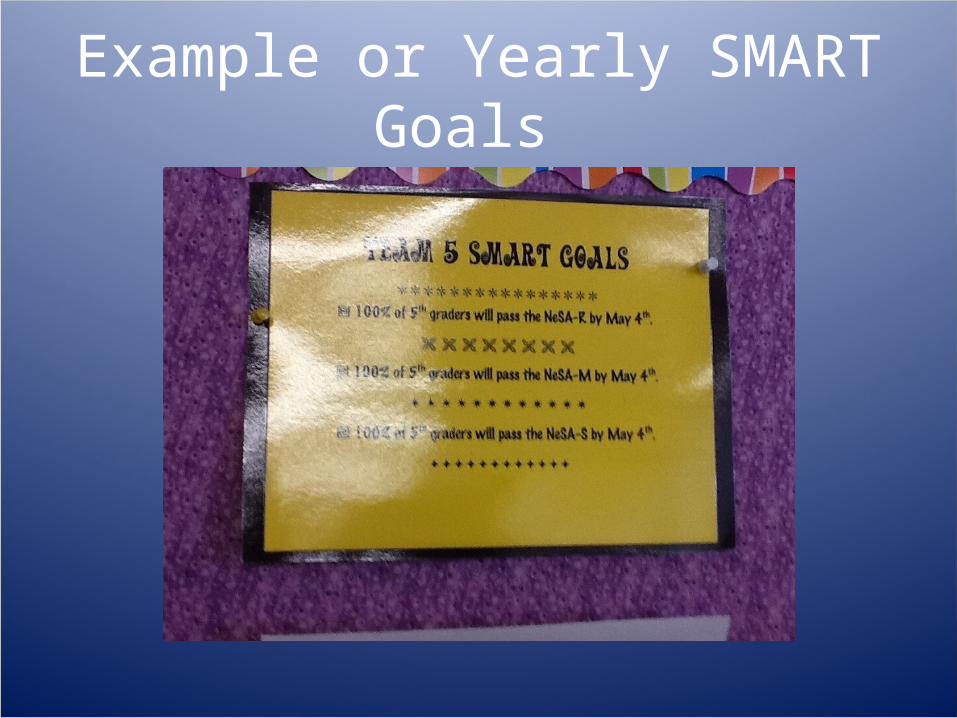
Example or Yearly SMART Goals
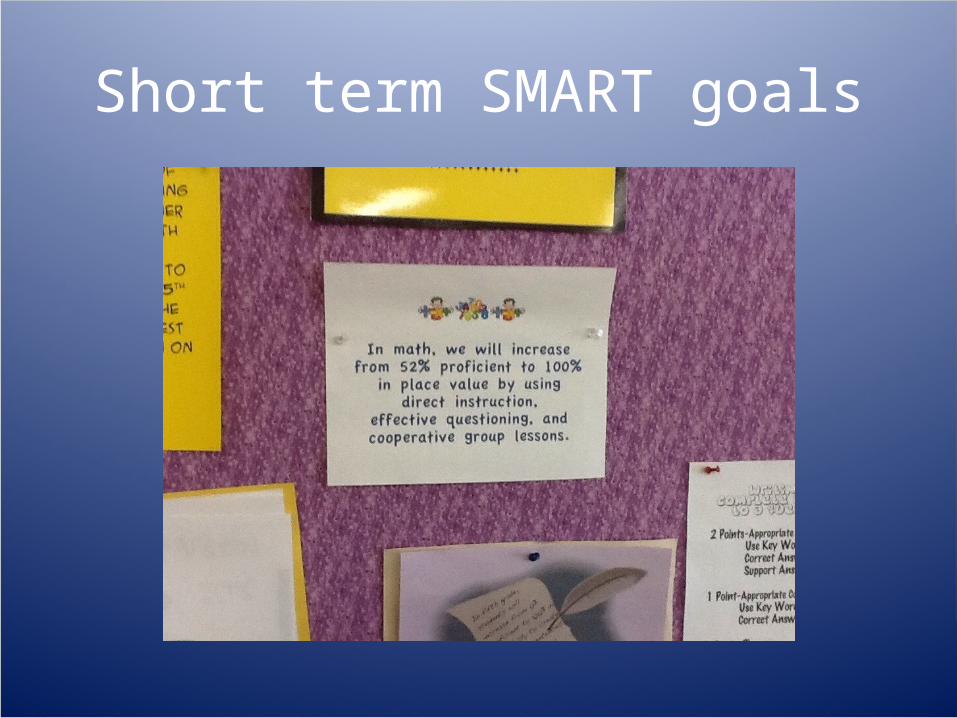
Short term SMART goals
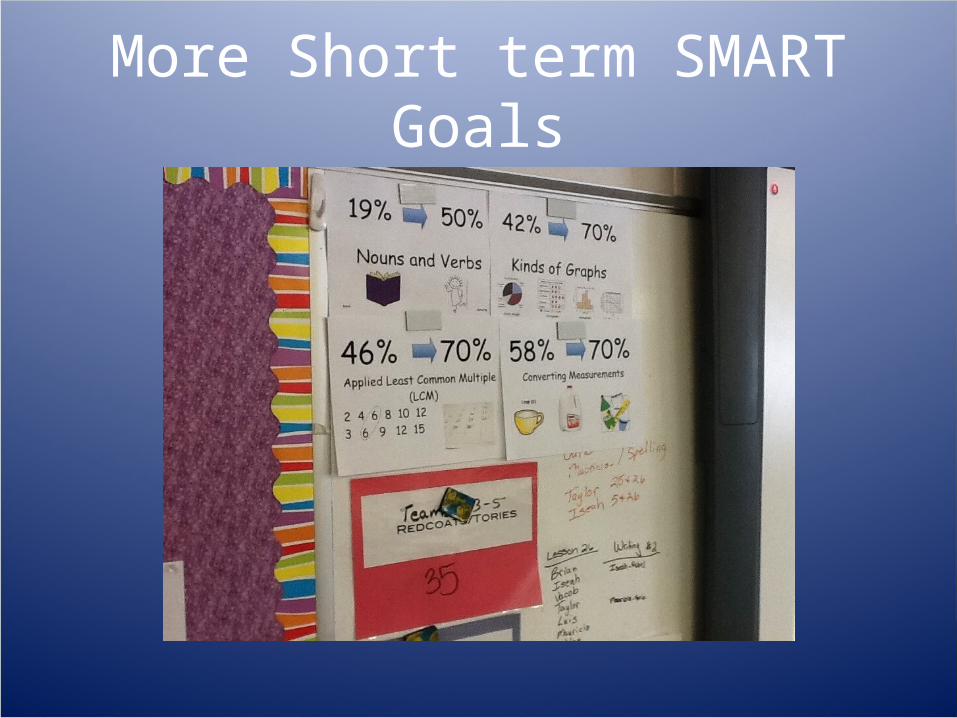
More Short term SMART Goals
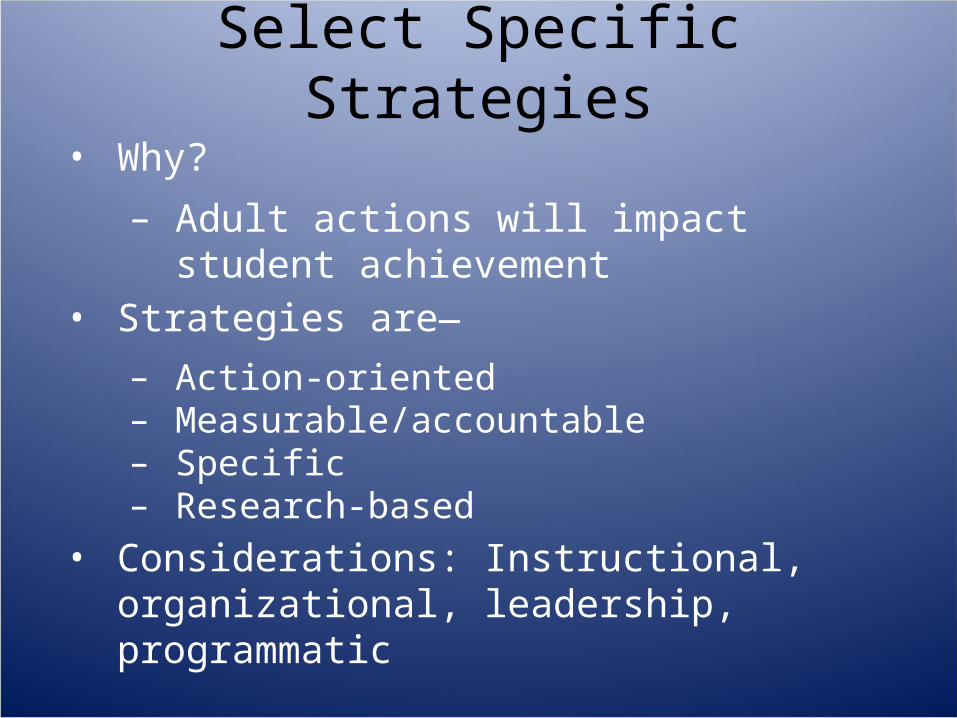
Select Specific Strategies• Why?
– Adult actions will impact student achievement
• Strategies are—
– Action-oriented– Measurable/accountable– Specific– Research-based
• Considerations: Instructional, organizational, leadership, programmatic
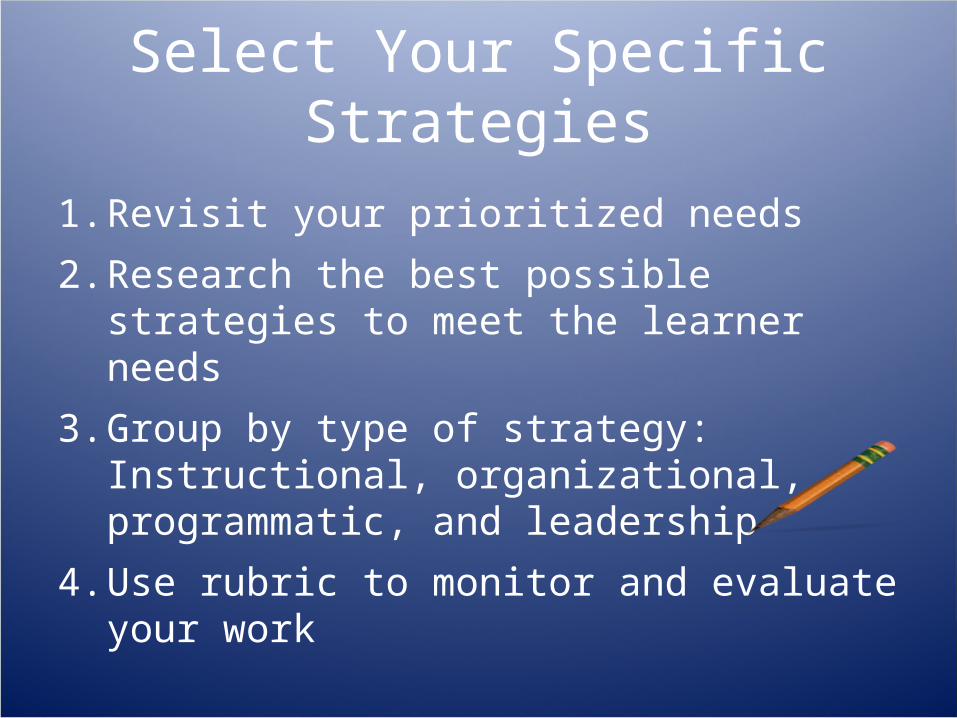
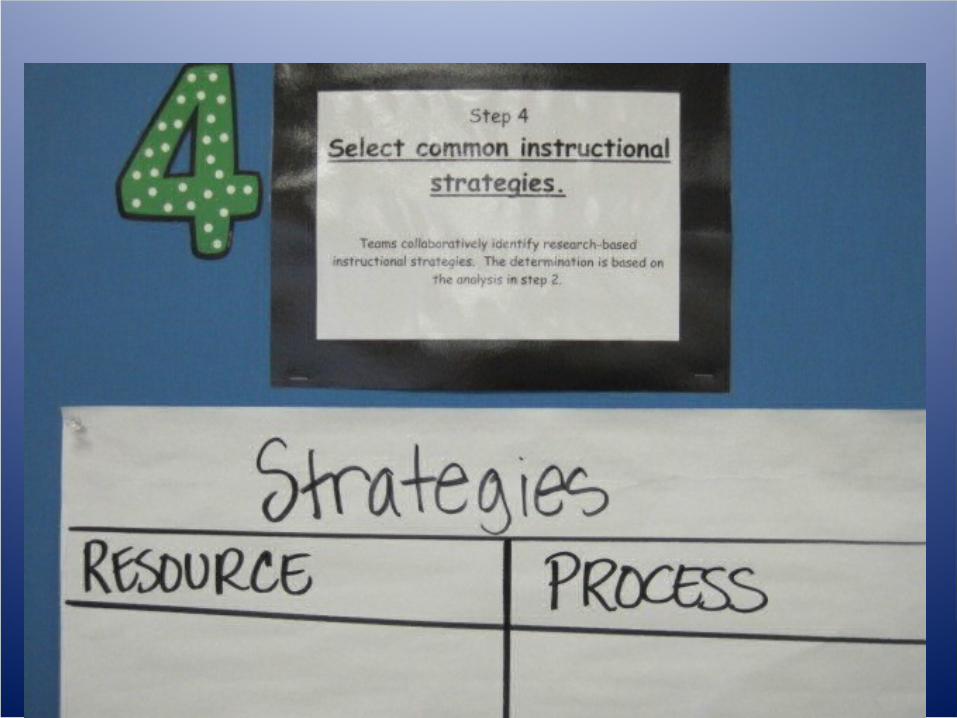
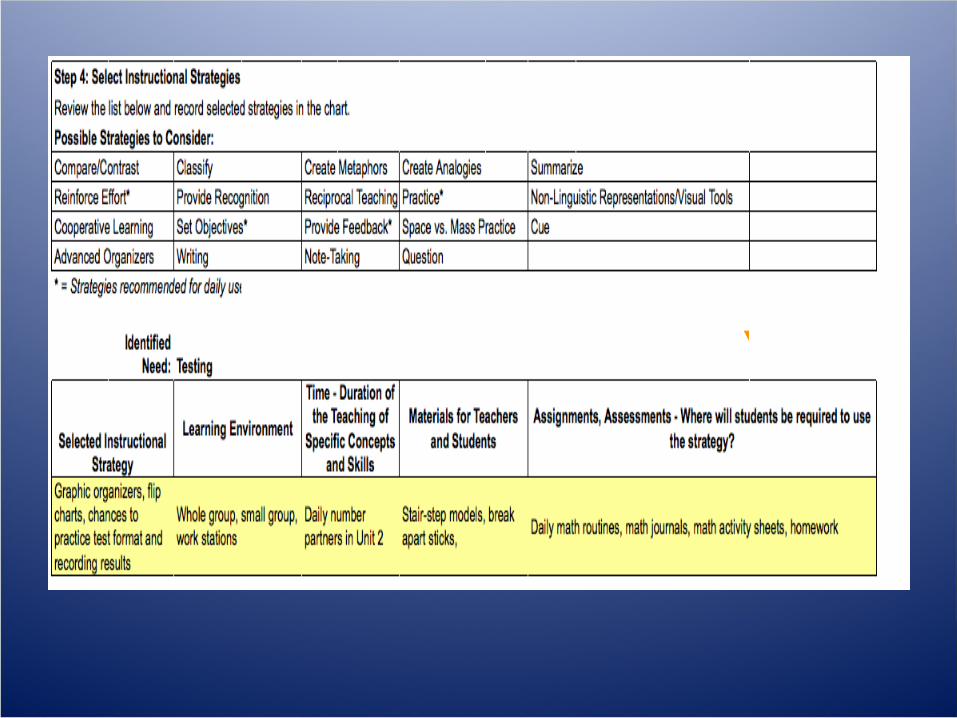
Select Your Specific Strategies
1. Revisit your prioritized needs
2. Research the best possible strategies to meet the learner needs
3. Group by type of strategy: Instructional, organizational, programmatic, and leadership
4. Use rubric to monitor and evaluate your work
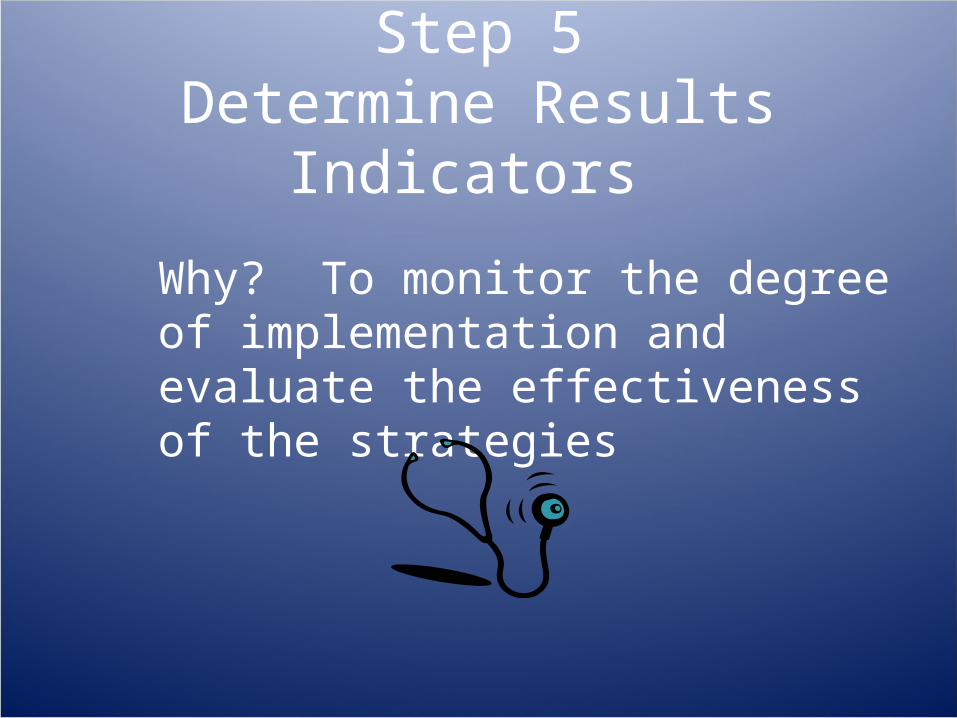
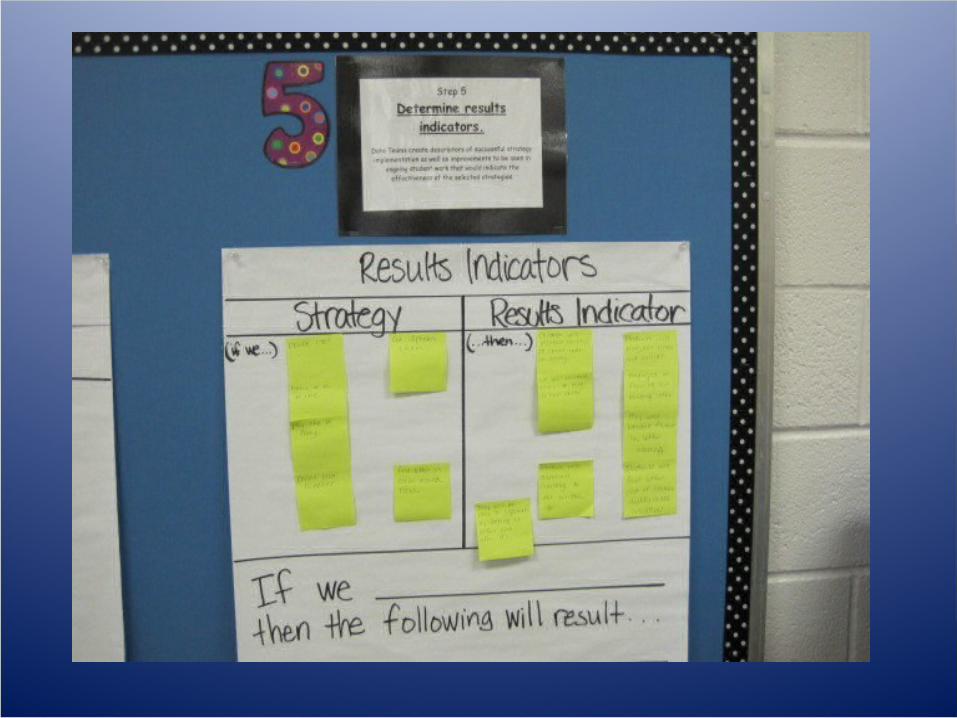
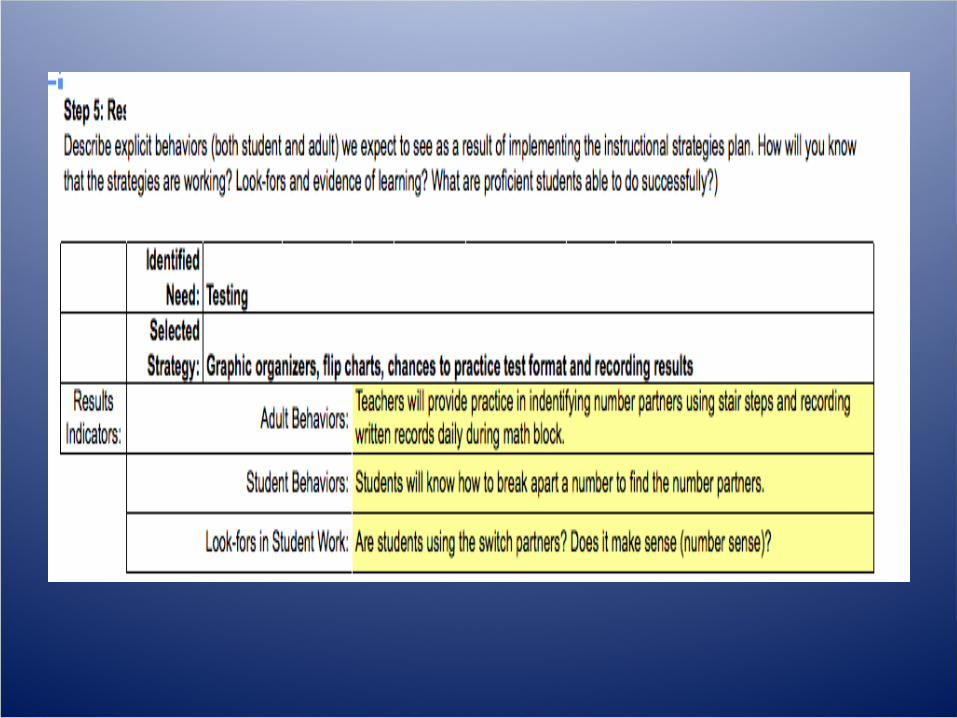
Step 5Determine Results Indicators
Why? To monitor the degree of implementation and evaluate the effectiveness of the strategies
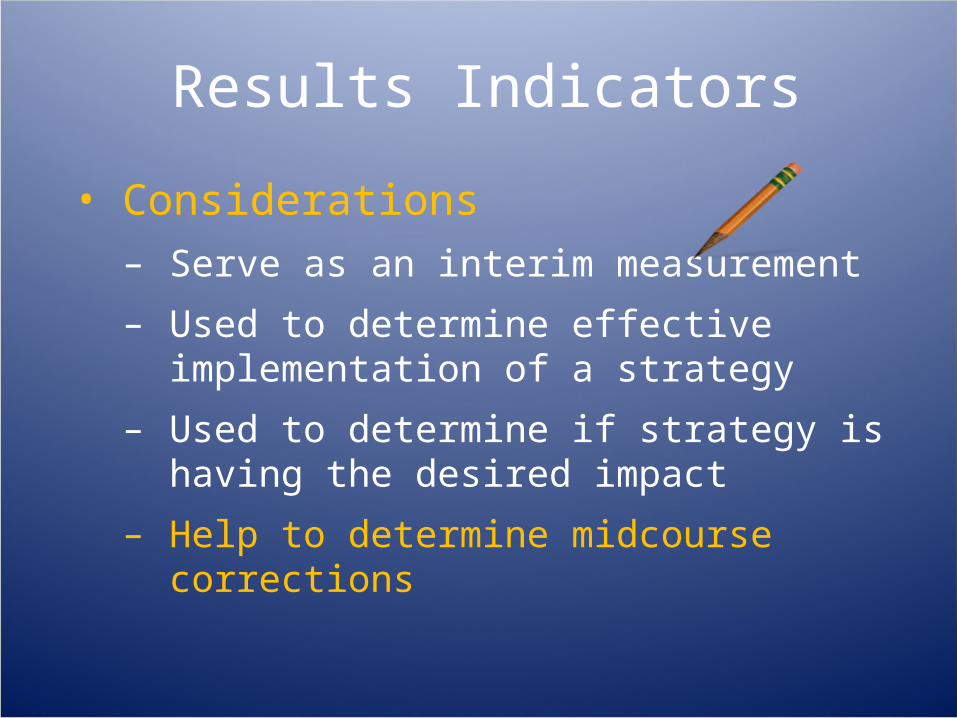
Results Indicators
• Considerations– Serve as an interim measurement
– Used to determine effective implementation of a strategy
– Used to determine if strategy is having the desired impact
– Help to determine midcourse corrections
Step 6Monitor and Evaluate Results
Why? To engage in a continuous improvement cycle that—– Identifies midcourse corrections where needed
– Adjusts strategies to assure fidelity of implementation
Step 6: Monitor and Evaluate Results
• Monitoring allows educators to reflect on their professional practice.
• Monitoring allows teams to make mid-course corrections.
• Monitoring allows teams to celebrate on a continuous basis.
• Monitoring is a critical component of a continuous improvement cycle.
• Based on your monitoring, you moved back to Steps 1 and 2 of the process.

Share Your Findings with Colleagues
• Discuss with an elbow partner what you have learned and will take with you based on the 6 Steps of the Data Teams Process.
• Highlight one celebration from a colleague
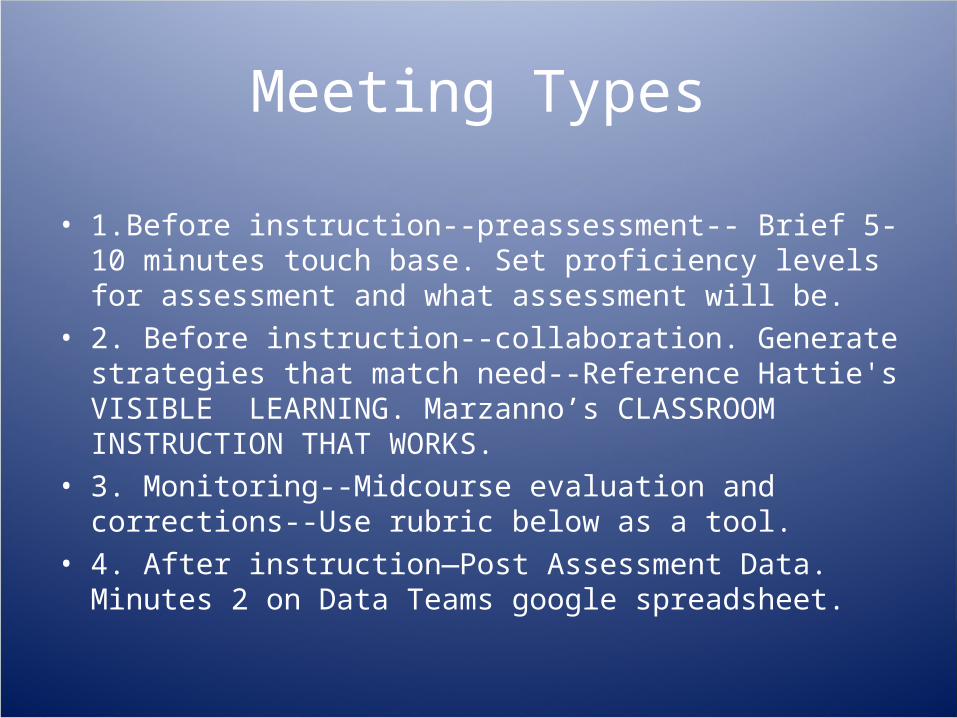
Meeting Types
• 1.Before instruction--preassessment-- Brief 5-10 minutes touch base. Set proficiency levels for assessment and what assessment will be.
• 2. Before instruction--collaboration. Generate strategies that match need--Reference Hattie's VISIBLE LEARNING. Marzanno’s CLASSROOM INSTRUCTION THAT WORKS.
• 3. Monitoring--Midcourse evaluation and corrections--Use rubric below as a tool.
• 4. After instruction—Post Assessment Data. Minutes 2 on Data Teams google spreadsheet.
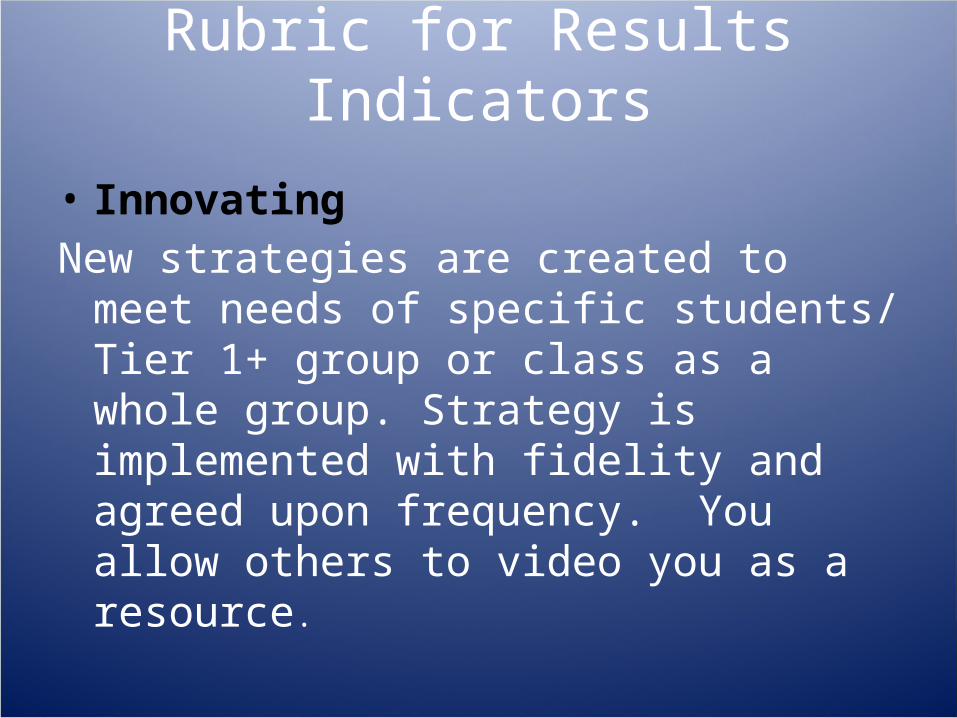
Rubric for Results Indicators
• InnovatingNew strategies are created to meet needs of
specific students/ Tier 1+ group or class as a whole group. Strategy is implemented with fidelity and agreed upon frequency. You allow others to video you as a resource.
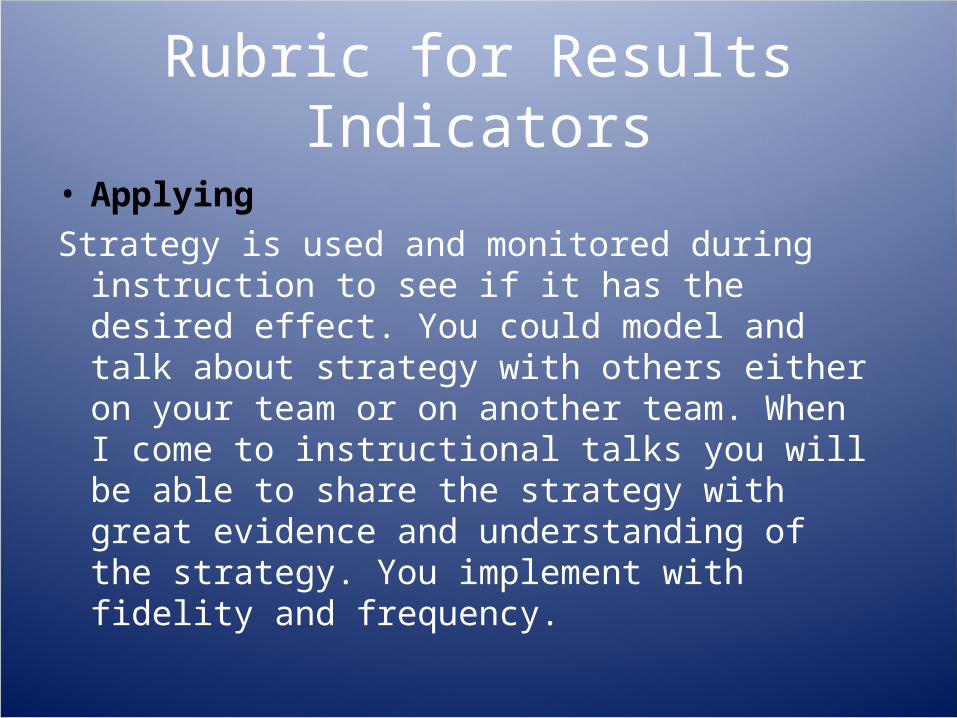
Rubric for Results Indicators
• ApplyingStrategy is used and monitored during instruction to
see if it has the desired effect. You could model and talk about strategy with others either on your team or on another team. When I come to instructional talks you will be able to share the strategy with great evidence and understanding of the strategy. You implement with fidelity and frequency.
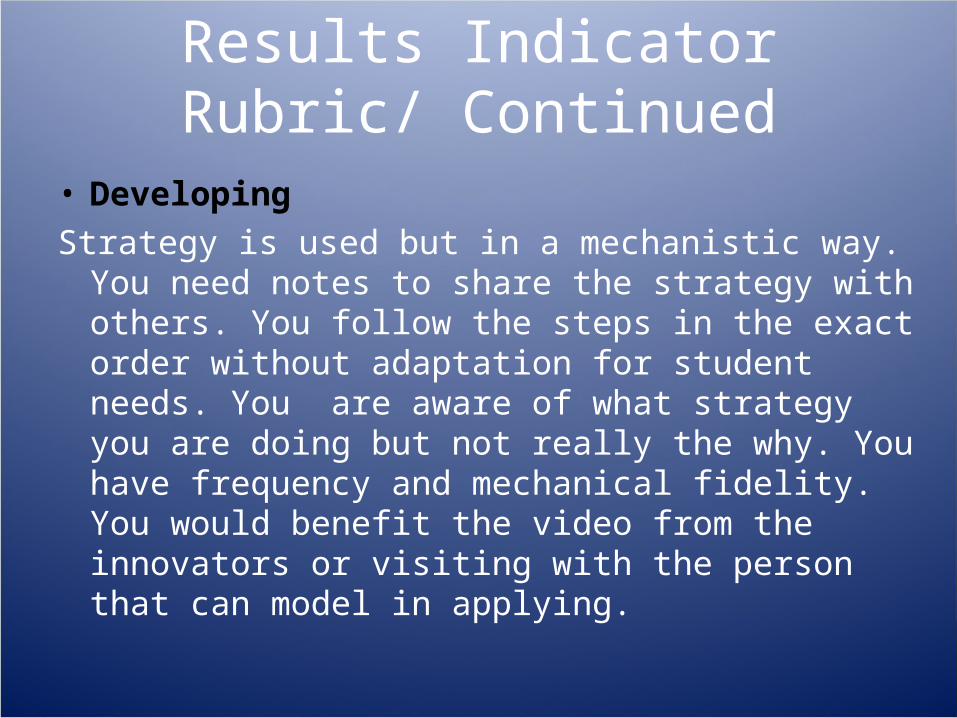
Results Indicator Rubric/ Continued
• DevelopingStrategy is used but in a mechanistic way. You need
notes to share the strategy with others. You follow the steps in the exact order without adaptation for student needs. You are aware of what strategy you are doing but not really the why. You have frequency and mechanical fidelity. You would benefit the video from the innovators or visiting with the person that can model in applying.
Results Indicator Rubric/ Continued
• BeginningStrategy is used but pieces are missing. Frequency is
there but fidelity is low. You would benefit from working with others in the 2 highest levels of the rubric. You hold yourself accountable to get the information you need to move up the levels of the rubric. Your student success is low.
Results Indicator Rubric/ Continued
• Not usingStrategy is called for, but not used. There is
a lack of fidelity and no frequency. You have good intentions but are not acting on them.
Video from a PLC/ Data Team Member
Examples and Nonexamples• Data Teams are not: A time for professional development. A time to
plan the week’s lessons or field trips. Easy.
• Data Teams are:A proactive way to monitor essential outcomes
and SMART goals. Hard Work. Data Teams require constant feedback and monitoring and accountability checks for the leaders.
Questions?
• Thank you for attending!!