TAIWAN - content.knightfrank.com · TAIWAN CITY OFFICE & RESIDENTIAL MARKET IN TAIPEI CITY AND...
12
RESEARCH TAIWAN CITY OFFICE & RESIDENTIAL MARKET IN TAIPEI CITY AND INVESTMENT MARKET IN TAIWAN Q3 2016 NEIHU TECHNOLOGY PARK COMMERCIAL REAL ESTATE INVESTMENT OFFICE MARKET IN TAIPEI CITY RESIDENTIAL MARKET IN TAIPEI CITY
Transcript of TAIWAN - content.knightfrank.com · TAIWAN CITY OFFICE & RESIDENTIAL MARKET IN TAIPEI CITY AND...
RESEARCH
TAIWAN CITY OFFICE & RESIDENTIAL MARKET IN TAIPEI CITY AND INVESTMENT MARKET IN TAIWAN Q3 2016
NEIHU TECHNOLOGY
PARK
COMMERCIAL REAL ESTATE INVESTMENT
OFFICE MARKET IN TAIPEI CITY
RESIDENTIAL MARKET IN TAIPEI CITY

2
The Directorate General of Budget,
Accounting and Statistics of Executive
Yuan estimated that the GDP growth in
2016 would be 1.22% (Table 1). National
Development Council announced that
domestic economy became stable in
September 2016 (Table 2). This shows that
the economy is recovering.
Economic growth is lower than pre-financial
crisis level, which means that the world
economy is growing at a slow pace. In the
USA, despite its economy is gradually
recovering, investment sentiment remains
low. In Japan, the economy remains
sluggish, while emerging economies see
stable growth. Mainland China has
experienced moderate uptick, and Q3
economic performance was supported
mainly by the service sector and
manufacturing sector. To stimulate
domestic growth, the Central Bank of
Taiwan ceased to lower interest rates after
four consecutive quarters, and announced
in September that the discount rate, the
secured financing interest rate and the
short-term interest rate remained
unchanged at 1.375%, 1.75% and 3.625%
respectively.
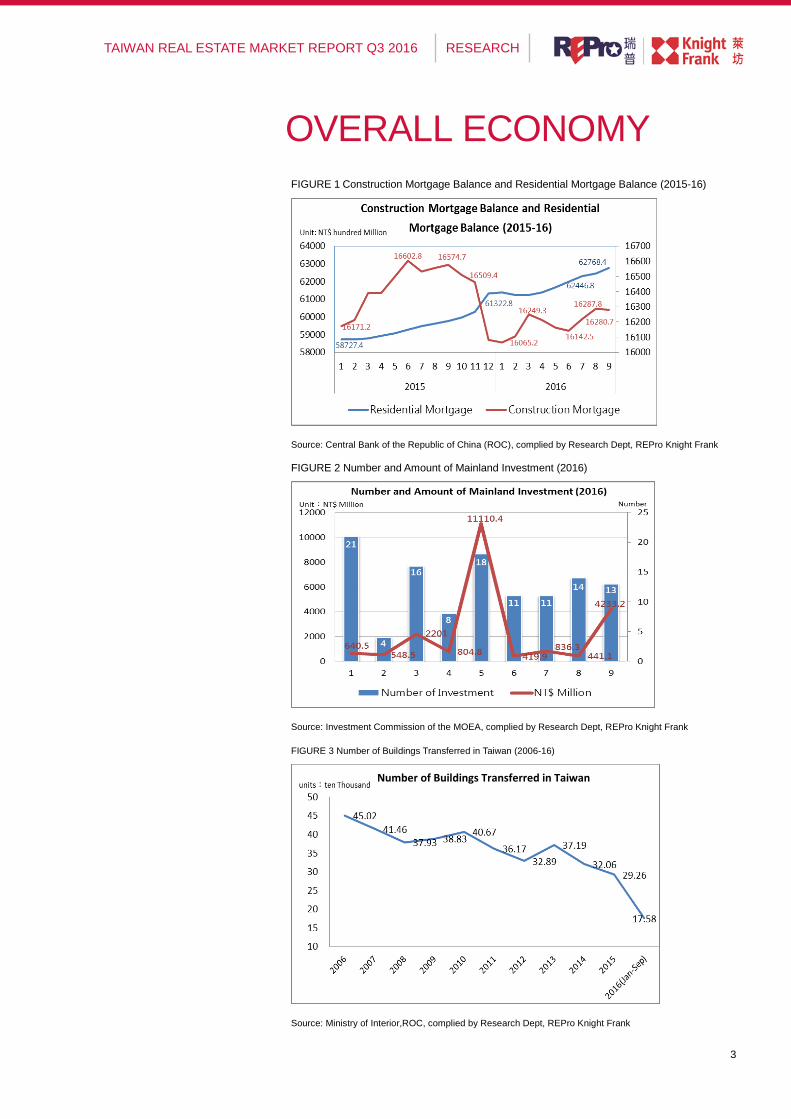
Construction mortgage balance was down
by US$22 million to US$51.9 billion, down
1.7% year on year, representing a decline
for 10 consecutive months. Residential
mortgage balance, on the other hand,
surged US$1 billion to a record high of
US$200 billion. This is mainly supported by
the mortgage scheme for first time home
buyers (undertaken by eight
state-owned/partially state-owned banks),
representing 8.5% of total mortgage
balance.
116 mainland investments in Taiwan were
approved from January to September in
2016, up 5.45% year on year. Investment
(increased investment) went up by
112.29% to US$212 million.
TABLE 1
Latest Economic Indicators
Indicators 2016 2015 2014 2013
GDP Growth 1.22% 2.32% 3.74% 2.23%
Unemployment 4.08% (Aug) 3.78% 3.79% 4.08%
Annual Change of CPI 0.33% (Sept) 0.14% 0.60% 0.33%
Construction Permits Issued
(m2)
19.67 million
(Jan-Sept) 32.60 million 38.63 million 39.76 million
Number of Buildings Transferred
175.8K
(Jan-Sept) 292.6K 320.6K 371.9K
Exchange Rate
(US$1=) $31.37(9/30) $33.07 (12/31) $31.72 (12/31) $29.95 (12/31)
Source: DGBAS of the Executive Yuan, Construction and Planning of the Ministry of the Interior and Central Bank of the Republic of China (Taiwan)
TABLE 2
Monitoring Indicators
2016Q3 2016Q2 2016Q1 2015Q4
Monitoring Scores 23 (Sept) 20 (Jun) 15 (Mar) 14 (Dec)
Remarks: Scores 9-16 – sluggish; 17-22 – transitional; 23-31 – stable; 32-37 – transitional; and 38-45 – booming Source: National Development Council
KEY FINDINGS
In Q3 2016, monitoring scores
went up by 3 to 23, signaling
economic recovery in Taiwan.
The Central Bank of Taiwan
announced that the discount rate,
the secured financing interest rate
and the short-term interest rate
remained unchanged at 1.375%,
1.75% and 3.625% respectively.
ECONOMY
3
RESEARCH TAIWAN REAL ESTATE MARKET REPORT Q3 2016
OVERALL ECONOMY FIGURE 1 Construction Mortgage Balance and Residential Mortgage Balance (2015-16)
Source: Central Bank of the Republic of China (ROC), complied by Research Dept, REPro Knight Frank
FIGURE 2 Number and Amount of Mainland Investment (2016)
Source: Investment Commission of the MOEA, complied by Research Dept, REPro Knight Frank
FIGURE 3 Number of Buildings Transferred in Taiwan (2006-16)
Source: Ministry of Interior,ROC, complied by Research Dept, REPro Knight Frank
Number of Buildings Transferred in Taiwan
4
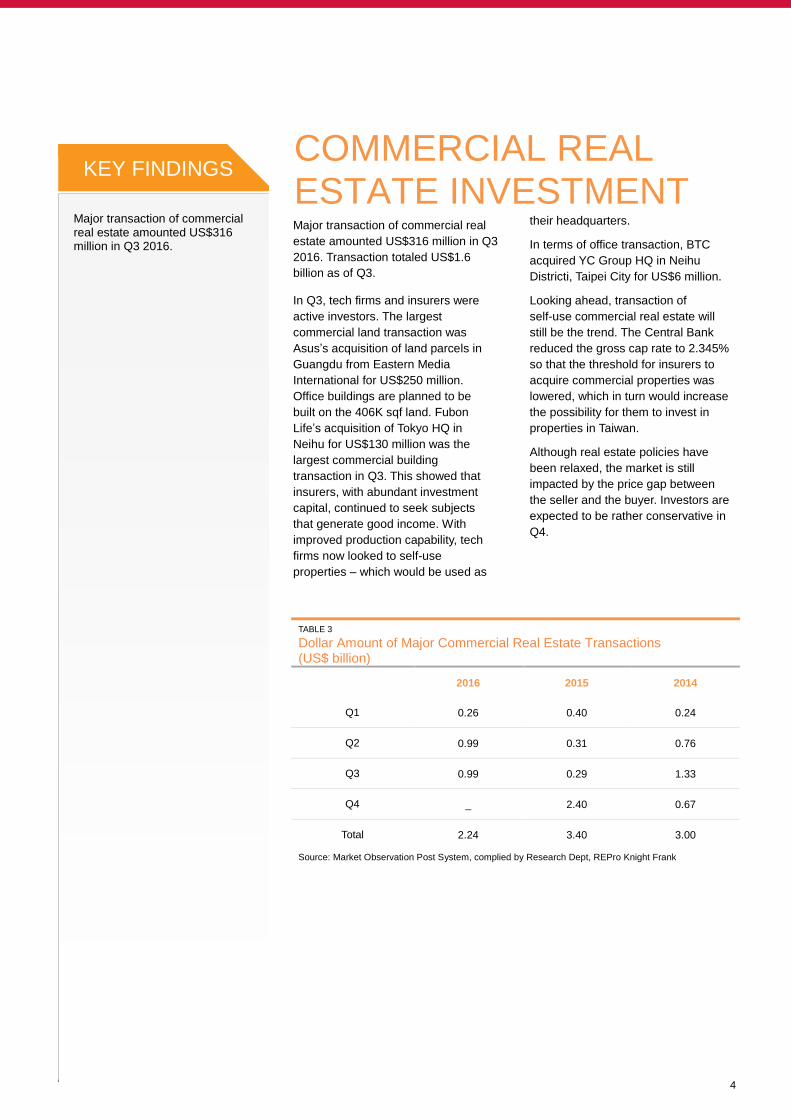
Major transaction of commercial real
estate amounted US$316 million in Q3
2016. Transaction totaled US$1.6
billion as of Q3.
In Q3, tech firms and insurers were
active investors. The largest
commercial land transaction was
Asus’s acquisition of land parcels in
Guangdu from Eastern Media
International for US$250 million.
Office buildings are planned to be
built on the 406K sqf land. Fubon
Life’s acquisition of Tokyo HQ in
Neihu for US$130 million was the
largest commercial building
transaction in Q3. This showed that
insurers, with abundant investment
capital, continued to seek subjects
that generate good income. With
improved production capability, tech
firms now looked to self-use
properties – which would be used as
their headquarters.
In terms of office transaction, BTC
acquired YC Group HQ in Neihu
Districti, Taipei City for US$6 million.
Looking ahead, transaction of
self-use commercial real estate will
still be the trend. The Central Bank
reduced the gross cap rate to 2.345%
so that the threshold for insurers to
acquire commercial properties was
lowered, which in turn would increase
the possibility for them to invest in
properties in Taiwan.
Although real estate policies have
been relaxed, the market is still
impacted by the price gap between
the seller and the buyer. Investors are
expected to be rather conservative in
Q4.
KEY FINDINGS
Major transaction of commercial real estate amounted US$316 million in Q3 2016.
COMMERCIAL REAL ESTATE INVESTMENT
TABLE 3
Dollar Amount of Major Commercial Real Estate Transactions (US$ billion)
2016 2015 2014
Q1 0.26 0.40 0.24
Q2 0.99 0.31 0.76
Q3 0.99 0.29 1.33
Q4 _ 2.40 0.67
Total 2.24 3.40 3.00
Source: Market Observation Post System, complied by Research Dept, REPro Knight Frank
5
RESEARCH TAIWAN REAL ESTATE MARKET REPORT Q3 2016
商用不動產買賣
土地買賣
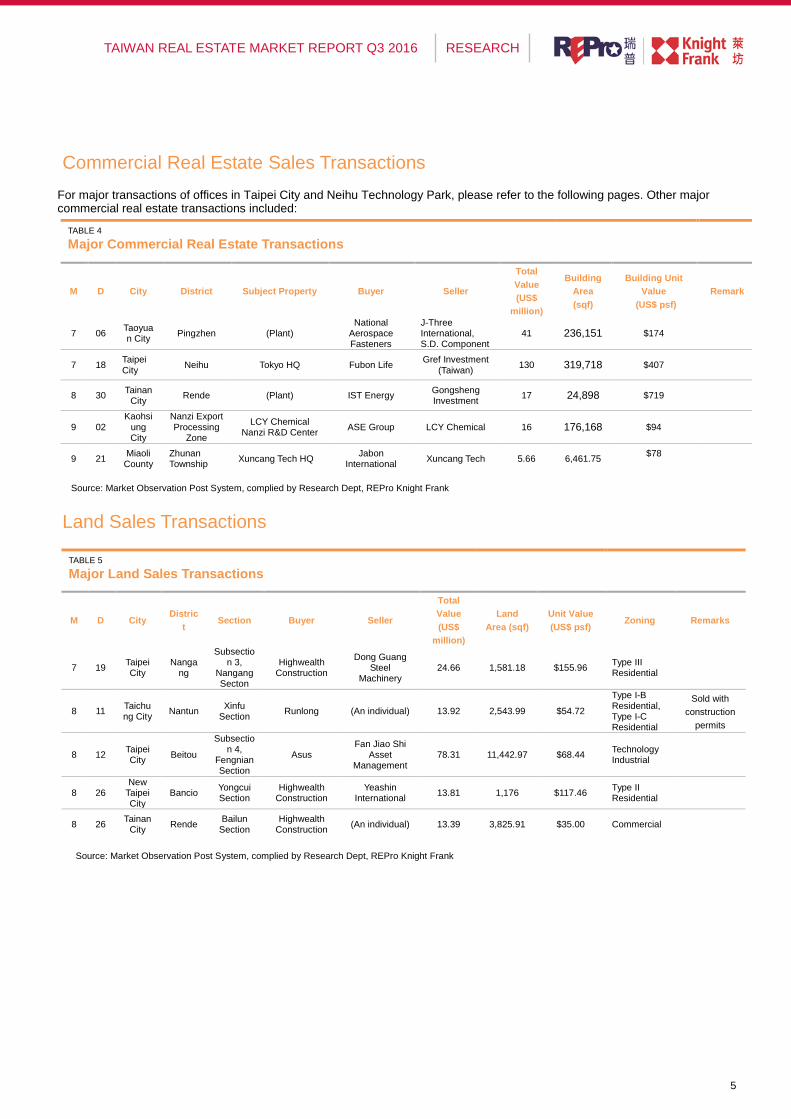
TABLE 4
Major Commercial Real Estate Transactions
M D City District Subject Property Buyer Seller
Total
Value
(US$
million)
Building
Area
(sqf)
Building Unit
Value
(US$ psf)
Remark
7 06 Taoyuan City
Pingzhen (Plant) National
Aerospace Fasteners
J-Three International, S.D. Component
41 236,151 $174
7 18 Taipei City
Neihu Tokyo HQ Fubon Life Gref Investment
(Taiwan) 130 319,718 $407
8 30 Tainan
City Rende (Plant) IST Energy
Gongsheng Investment
17 24,898 $719
9 02 Kaohsi
ung City
Nanzi Export Processing
Zone
LCY Chemical Nanzi R&D Center
ASE Group LCY Chemical 16 176,168 $94
9 21 Miaoli County
Zhunan Township
Xuncang Tech HQ Jabon
International Xuncang Tech 5.66 6,461.75
$78
資料來源:公開資訊觀測站、瑞普萊坊市場研究部
TABLE 5
Major Land Sales Transactions
M D City Distric
t Section Buyer Seller
Total
Value
(US$
million)
Land
Area (sqf)
Unit Value
(US$ psf) Zoning Remarks
7 19 Taipei City
Nangang
Subsection 3,
Nangang Secton
Highwealth Construction
Dong Guang Steel
Machinery 24.66 1,581.18 $155.96
Type III Residential
8 11 Taichung City
Nantun Xinfu
Section Runlong (An individual) 13.92 2,543.99 $54.72
Type I-B Residential, Type I-C Residential
Sold with
construction
permits
8 12 Taipei City
Beitou
Subsection 4,
Fengnian Section
Asus Fan Jiao Shi
Asset Management
78.31 11,442.97 $68.44 Technology Industrial
8 26 New
Taipei City
Bancio Yongcui Section
Highwealth Construction
Yeashin International
13.81 1,176 $117.46 Type II Residential
8 26 Tainan
City Rende
Bailun Section
Highwealth Construction
(An individual) 13.39 3,825.91 $35.00 Commercial
For major transactions of offices in Taipei City and Neihu Technology Park, please refer to the following pages. Other major commercial real estate transactions included:
資料來源:公開資訊觀測站、瑞普萊坊市場研究部
Commercial Real Estate Sales Transactions
Source: Market Observation Post System, complied by Research Dept, REPro Knight Frank
Source: Market Observation Post System, complied by Research Dept, REPro Knight Frank
Land Sales Transactions

6
Leasing Market In Q3 2016, Grade-A office rental averaged US$27.93 psf per month, declining by 0.1%. With a vacancy rate of 9.26%, Grade-A offices were well-absorbed, and the vacancy rate dropped by about 0.9%.
Xinyi District saw the best absorption among Grade-A offices in Taipei City. The vacancy rate declined to 9.28%, representing a 2.94% decrease in a single quarter. With steady demand and a lack of new supply, vacancy rate of Grade-A offices continued to decrease. There will be new supply next year, which will slightly drive down the market rental and thus lure the tenants to stay in this district.
In Q3, Cathay Landmark Plaza saw the most rapid absorption – Amore Pacific and Adecco Taiwan leased a total of 24,906 sqf.
Takeda Pharmaceuticals Taiwan leased about 21,384 sqf in Farglory Financial Center.
In Q3, rental levels of Grade-B offices averaged US$18.54 psf per month, with a vacancy rate of 4.29%, up 0.03 quarter on quarter. Small and medium enterprises favor Grade-B offices. Given that there will be a lack of new supply, vacancy rate will remain low.
Investment Market Major sales transaction in Taipei City included:
August 19: BTC acquired the eighth floor of HQ of YC Group and parking spaces for about US$6.4 million. The building area is about 14,623 sqf and the land area is about 2,920 sqf.
KEY FINDINGS
Vacancy rate of Grade-A offices in Taipei City averaged 9.26%, representing a 0.9% decrease in a single quarter.
Xinyi District saw the best absorption among Grade-A offices in Taipei City.
OFFICE MARKET IN TAIPEI CITY
FIGURE 4 Map of Major Office Districts in Taipei City

7
RESEARCH TAIWAN REAL ESTATE MARKET REPORT Q3 2016
RENTAL LEVELS IN TAIPEI CITY TABLE 6
Office Rental Levels in Taipei City, Q3 2016
Grade A Grade B
Market Rental (US$/sf/yr) 27.93 18.54
Net Effective Rental (US$/sf/yr)
39.38 23.93
Asking Rental (US$/sf/yr) 31.20 20.38
Vacancy Rate 9.26% 4.29%
Remarks: Net effective rental takes into account rent-free periods based on the actual usable area.
Source: Research Dept, REPro Knight Frank
TABLE 7
Rentals of Major Office Districts in Taipei City, Q3 2016
District Asking Rental
(US$/sf/yr) Market Rental
(US$/sf/yr)
Change in
Market Rental
(QoQ)
Change in
Market Rental
(YoY)
Vacancy Rate
(%)
Change in
Vacancy
Rate (QoQ)
Minsheng/ Dunhua N
20.62 26.62 0.00% 1.72% 9.06%
Dunhua S 21.47 28.11 0.40% -0.99% 4.66%
Xinyi 27.82 38.64 -0.31% 1.01% 4.03%
West 19.32 25.66 0.34% 0.17% 5.29%
Nanjing- Songjiang
18.52 23.59 0.64% 2.13% 6.48% --
Nanjing- Fuxing
18.44 23.80 0.00% 1.06% 4.45%
Sec 4&5,
Nanjing E Road
15.31 19.76 0.07% 0.78% 4.08%
Weighted Average
21.60 28.29 0.00% 0.60% 6.24%
Source: Research Dept, REPro Knight Frank
TABLE 8
Office Leasing Transactions in Taipei City
District Building Tenant Area Leased
(sf)
Xinyi Farglory Financial Center Takeda Pharmaceuticals
Taiwan 21,384
Xinyi Cathay Landmark Plaza Amore Pacific 12,453
Xinyi Cathay Landmark Plaza Adecco Taiwan 11,919
Xinyi Uni-President International Hanse International Business
Centre 11,955
Source: Research Dept, REPro Knight Frank
Source: Research Dept, REPro Knight Frank
Source: Research Dept, REPro Knight Frank
1,000
1,500
2,000
2,500
3,000
07
Q1
07
Q2
07
Q3
07
Q4
08
Q1
08
Q2
08
Q3
08
Q4
09
Q1
09
Q2
09
Q3
09
Q4
10
Q1
10
Q2
10
Q3
10
Q4
11
Q1
11
Q2
11
Q3
11
Q4
12
Q1
12
Q2
12
Q3
12
Q4
13
Q1
13
Q2
13
Q3
13
Q4
14
Q1
14
Q2
14
Q3
14
Q4
15
Q1
15
Q2
15
Q3
15
Q4
16
Q1
16
Q2
16
Q3
元/坪/月
(新台幣)
A級 B級
FIGURE 5
Office Rental Levels in Taipei City
FIGURE 6
Office Vacancy Rates in Taipei City
0%
5%
10%
15%
20%
07
Q1
07
Q2
07
Q3
07
Q4
08
Q1
08
Q2
08
Q3
08
Q4
09
Q1
09
Q2
09
Q3
09
Q4
10
Q1
10
Q2
10
Q3
10
Q4
11
Q1
11
Q2
11
Q3
11
Q4
12
Q1
12
Q2
12
Q3
12
Q4
13
Q1
13
Q2
13
Q3
13
Q4
14
Q1
14
Q2
14
Q3
14
Q4
15
Q1
15
Q2
15
Q3
15
Q4
16
Q1
16
Q2
16
Q3
A級 B級
NT$/ping/m
Grade A Grade B
Grade A Grade B
8
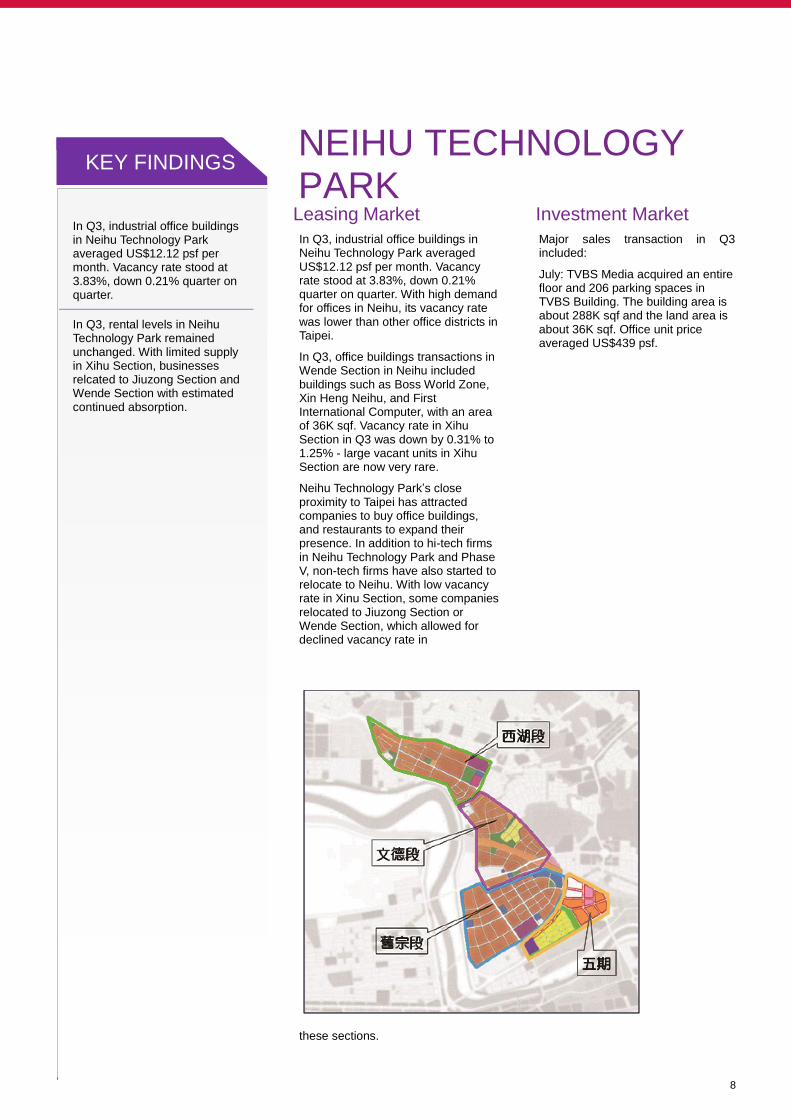
In Q3, industrial office buildings in Neihu Technology Park averaged US$12.12 psf per month. Vacancy rate stood at 3.83%, down 0.21% quarter on quarter.
In Q3, rental levels in Neihu Technology Park remained unchanged. With limited supply in Xihu Section, businesses relcated to Jiuzong Section and Wende Section with estimated continued absorption.
Leasing Market In Q3, industrial office buildings in Neihu Technology Park averaged US$12.12 psf per month. Vacancy rate stood at 3.83%, down 0.21% quarter on quarter. With high demand for offices in Neihu, its vacancy rate was lower than other office districts in Taipei.
In Q3, office buildings transactions in Wende Section in Neihu included buildings such as Boss World Zone, Xin Heng Neihu, and First International Computer, with an area of 36K sqf. Vacancy rate in Xihu Section in Q3 was down by 0.31% to 1.25% - large vacant units in Xihu Section are now very rare.
Neihu Technology Park’s close proximity to Taipei has attracted companies to buy office buildings, and restaurants to expand their presence. In addition to hi-tech firms in Neihu Technology Park and Phase V, non-tech firms have also started to relocate to Neihu. With low vacancy rate in Xinu Section, some companies relocated to Jiuzong Section or Wende Section, which allowed for declined vacancy rate in
these sections.
Investment Market
Major sales transaction in Q3 included:
July: TVBS Media acquired an entire floor and 206 parking spaces in TVBS Building. The building area is about 288K sqf and the land area is about 36K sqf. Office unit price averaged US$439 psf.
KEY FINDINGS NEIHU TECHNOLOGY PARK
FIGURE 7 Map of Major Office Districts in Taipei City

9
RESEARCH TAIWAN REAL ESTATE MARKET REPORT Q3 2016
RENTAL LEVELS IN NEIHU TECHNOLOGY PARK TABLE 9
Rentals of Industrial Offices in Neihu Technology Park, Q3 2016
Section Market Rental
(US$/sf/yr)
Net Effective
Rental
(US$/sf/yr)
Vacancy Rate
(%)
Change in
Vacancy Rate
(QoQ)
Xihu 13.32 20.38 1.25% -0.31%
Wende 11.05 16.72 6.64% -0.12%
Jiuzong 9.38 15.12 8.65% 0.00%
Weighted Average
12.12 18.79 3.83% -0.21%
Source: Research Dept, REPro Knight Frank
TABLE 10
Leasing Transactions of Industrial Offices in Neihu Technology Park, Q3 2016
Section Building Tenant Area Leased
(sf)
Wende Boss World Zone Li Guang Cable TV 13,165
Wende Xin Heng Neihu Style Group 12,987
Wende First International
Computer Kuka Robotics 9,962
Source: Research Dept, REPro Knight Frank
10
Since the new administration assumed office, cross-strait relations have been opaque. With an overhaul of the housing tax, and gift and inheritance taxes, investment sentiment has been low. The UK’s vote to leave the EU in Q3 also played a part. Because of these, residential market in Taiwan has shown signs of rebound, i.e. transaction volume in six major cities was down a mere 1.2% quarter on quarter, up 1.1% year on year. Price of medium-priced residential units decreased from US$525 psf to US$520 psf.
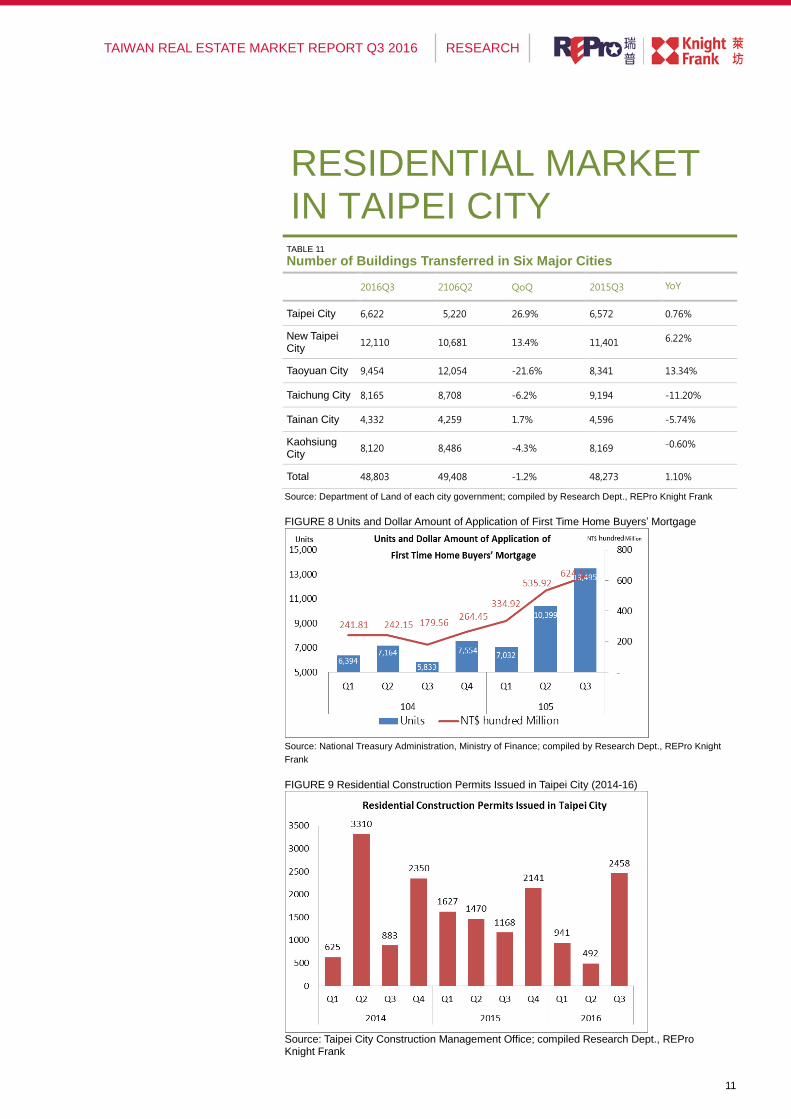
After the Integrated Housing and Land Tax and Tax on Housing Speculators took effect, there has been inelastic demand in the market. According to the National Treasury Administration of the Ministry of Finance, 13,495 applications (about NT$62.45 billion) for first time home-owner’s mortgage were received in Q3, up 29.8% (16.5%) quarter on quarter, and 131.4% (247.8%) year on year. This showed the emergence of first time home buyers amid low buying sentiment.
Medium and low-priced housing units are estimated to be the main products in the residential market, and would remain so. On the sellers’ side, mortgage rate is at a record low, and room for discount stands firmly within 10%; thus, prices are unlikely to be significantly adjusted. Buyers, on the other hand, often request a 20-30% off on the asking price. This means a huge gap between the buyer and the seller, and results in a stalemate where transaction shrinks and price remains flat.
The economy was weak, and there has been increased taxation on luxury residential units. The Central Bank had no signs of relieving mortgage restrictions on luxury residential units. All of these contributed to a decline in transaction volume in Q3 – price was down by 1.3% quarter on quarter, and 8.9% year on year. Given that Tax on Housing Speculators was implemented, and Gift and Inheritance Tax has more than doubled, owner-occupiers would become the largest type of buyers of luxury residential units. The momentum on transaction would be low and it would take longer to absorb new residential projects.
For now, sellers are mainly owners who acquired properties long ago, or those who are impacted by the recent increased taxation scheme. Buyers’ offering prices are more than 10% lower than the transaction prices. Prices of luxury residential units are expected to decrease by about 10%. Instead of selling, owners would lease their properties. The gross cap rate, however, would remain low at 1.6%. Rental levels of downtown residential units are around US$269 psf, and US$179 psf in the suburbs.
KEY FINDINGS
In Q3, transaction volume in six
major cities was down 1.2%
quarter on quarter, but up 1.1%
year on year.
Transaction returned to inelastic demand due to increased taxation. Applications and volume for first time home-owner’s mortgage increased. This showed the emergence of first time home buyers. Medium and low-priced housing units are estimated to be the main products in the residential market. There is a huge price gap between the buyer and the seller. Mortgage on luxury residential units is restricted, and the price is estimated to be adjusted by 10%.
RESIDENTIAL MARKET IN TAIPEI CITY
11
RESEARCH TAIWAN REAL ESTATE MARKET REPORT Q3 2016
RESIDENTIAL MARKET IN TAIPEI CITY
TABLE 11
Number of Buildings Transferred in Six Major Cities
2016Q3 2106Q2 QoQ 2015Q3 YoY
Taipei City 6,622 5,220 26.9% 6,572 0.76%
New Taipei City
12,110 10,681 13.4% 11,401 6.22%
Taoyuan City 9,454 12,054 -21.6% 8,341 13.34%
Taichung City 8,165 8,708 -6.2% 9,194 -11.20%
Tainan City 4,332 4,259 1.7% 4,596 -5.74%
Kaohsiung City
8,120 8,486 -4.3% 8,169 -0.60%
Total 48,803 49,408 -1.2% 48,273 1.10%
Source: Department of Land of each city government; compiled by Research Dept., REPro Knight Frank
FIGURE 8 Units and Dollar Amount of Application of First Time Home Buyers’ Mortgage
Source: National Treasury Administration, Ministry of Finance; compiled by Research Dept., REPro Knight
Frank
FIGURE 9 Residential Construction Permits Issued in Taipei City (2014-16)
Source: Taipei City Construction Management Office; compiled Research Dept., REPro Knight Frank

12
瑞普萊坊
REPro Knight Frank
曾東茂 Michael Tseng CCIM FRICS
董事長 Executive Chairman
+886 2 8729 8799 REPro.KnightFrank.com.tw
市場研究部
Research
蘇銳強 Cliff So MRICS MHKIS
副總經理 Executive Director
+886 2 8729 8770
黃舒衛 Andy Huang
副總監 Associate Director
+886 2 8729 8798
商業物業代理部暨投資部
Commercial Agency & Capital Markets
劉美華 Jenny Liou CCIM
總經理 Managing Director
+886 2 8729 8790
工業暨零售物業代理部
Industrial & Retail Agency
李誠慶 Jeff Lee CCIM
總監 Director
+886 2 8729 8780
住宅部
Residential Agency
周達人 Edison Chou
副總監 Associate Director
+886 2 8729 8792
估價暨顧問服務
Valuation & Consulting Services
吳紘緒 Jackie Wu CCIM MRICS
副所長 Executive Director
+886 2 8729 8710
瑞普萊坊研究團隊向眾多商業和住宅物業客戶,包括發展商、投資者、金融機構和企業機構提供策
略性建議、市場預測和顧問服務。客戶均認為我們按其特定需要提供的專業和獨立意見能切合他們
的需要。REPro Knight Frank Research provides strategic advice, consultancy services and
forecasting to a wide range of clients worldwide including developers, investors, funding organisations, corporate institutions and the public sector. All our clients recognise the need for expert independent advice customised to their specific needs.
近期市場研究報告
RECENT MARKET-LEADING RESEARCH PUBLICATIONS
The Wealth Report - 2016
Prime Global Cities Index - Q2 2016
Prime Global Rental Index – Q2 2016
全球城市 2017 年報告
瀏覽萊坊的全球研究報告,請登入KnightFrank.com/Research
Knight Frank Research Reports are available at KnightFrank.com/Research
© REPro Knight Frank 瑞普萊坊 2016
免責聲明
本文件及其內容只提供一般資料,可能隨時變更而不作另行通知。所有圖片只供展示用途。本文件並不表示、意圖或暗示任何性質的
代表或擔保。因使用此資料而直接或間接引致的損失或損毀,萊坊恕不負責。客戶應自行確保資料或內容的完整和準確性。
版權
本文件及其內容屬萊坊所有,使用者知悉其中的觀點、概念及建議均屬萊坊的知識產權所有,並受版權保護。除了對上述文件作出評
估外,若非已與萊坊達成協議,任何人不得以任何原因使用這些內容或其部分。本文件在保密的情況下提供予使用者,除參與評估此
文件的人員外,恕不得向任何人透露。
Important Notice This report is published for general information only and not to be relied upon in any way. Although high standards have been used in the preparation of the information, analysis, views and projections presented in this report, no responsibility or liability whatsoever can be accepted by Knight Frank LLP for any loss or damage resultant from any use of, reliance on or reference to the contents of this document. As a general report, this material does not necessarily represent the view of Knight Frank LLP in relation to particular properties or projects. Reproduction of this report in whole or in part is not allowed without prior written approval of Knight Frank LLP to the form and content within which it appears. Knight Frank LLP is a limited liability partnership registered in England with registered number OC305934. Our registered office is 55 Baker Street, London, W1U 8AN, where you may look at a list of members’ names.