TAEF08 Lecture Notes 7-8 Erosion - uni-goettingen.de
44
Tropical Agroecosystem Function, Kühne, SS 08 U6-8 Erosion by water and wind p. 1 U 6 Erosion OUTLINE EROSION AND SEDIMENTATION 1 Introduction ................................................................................................................................................................ 1 1.1 Agents, factors, causes and types of erosion ....................................................................................................... 1 1.2 EXCURSUS (erosion and sedimentation as a phenomenon in geology)............................................................. 3 1.3 Natural vs. accelerated process ........................................................................................................................... 5 1.3.1 Soil erosion as a form of land degradation ................................................................................................... 5 1.3.2 Geological erosion ....................................................................................................................................... 5 1.3.3 Pedological erosion ...................................................................................................................................... 6 1.3.4 Manmade or accelerated erosion .................................................................................................................. 6 1.4 Effects of erosion on field and watershed ........................................................................................................... 6 1.5 Tolerable soil loss ............................................................................................................................................... 7 2 Soil erosion by water ................................................................................................................................................ 10 2.1 Erosivity vs. erodibility ..................................................................................................................................... 10 2.2 Fundamental erosion processes ......................................................................................................................... 12 2.3 Measurement / assessment methods) ................................................................................................................. 17 2.4 Control of water erosion.................................................................................................................................... 20 2.4.1 Principles.................................................................................................................................................... 20 2.4.2 Reducing raindrop impact .......................................................................................................................... 20 2.4.3 Increasing shearing resistance of soil ......................................................................................................... 21 2.4.4 Decreasing shear strength of overland flow through slope management .................................................... 22 2.4.5 Alternative (cheap, simple or labour saving) practices to form terraces .................................................... 26 2.4.6 Water disposal (cut-off drain, waterways).................................................................................................. 27 2.5 Modeling (water-erosion) .................................................................................................................................. 29 2.5.1 Excursus Model Considerations - Example WEPP, USA .......................................................................... 29 2.5.2 Excursus General requirements - Example WEPP, USA) .......................................................................... 30 2.5.3 Excursus Structure - Example WEPP, USA............................................................................................... 31 2.5.4 The Universal Soil Loss Equation (USLE) ................................................................................................ 34 3 Soil erosion by wind................................................................................................................................................. 36 3.1 Geological erosion ............................................................................................................................................ 37 3.2 Accelerated soil erosion by wind - processes .................................................................................................... 38 3.2.1 Wind erosion prediction ............................................................................................................................. 40 3.2.2 Excursus - Wind Erosion Simulation Models ............................................................................................ 41 3.2.3 Measuring Wind Erosion ........................................................................................................................... 41 3.3 Control of wind erosion..................................................................................................................................... 41 3.3.1 Principles.................................................................................................................................................... 41 3.3.2 Measures to control soil erosion by wind ................................................................................................... 42 3.3.3 Special aspect – Soil conditioner ............................................................................................................... 43 3.3.4 Windbreaks and shelterbelts....................................................................................................................... 43 1 Introduction 1.1 Agents, factors, causes and types of erosion Soil as a primary resource is renewable only in geological time spans. What is soil erosion -or better erosion and sedimentation? Soil erosion implies the physical removal of topsoil by various agents: falling raindrops, water flowing over and through the soil profile, wind and gravitational pull (Fig 1). Erosion and sedimentation: Process of detachment, transportation, and deposition of sediment by the erosive and transport agents. A wide range of terms are used to describe soil erosion: erosion soil loss, sediment yield, denudation. These terms are based on the different techniques and scales of measurements, small area, field plot, agricultural watershed, large river basin. Soil erosion is the result of perturbations (natural or caused by humans) in the land-vegetation-climate equilibrium. The phenomena are grouped into agents , factors , and causes of erosion. • Agents are the carriers / transport system in soil movement (Fig 1). • Factors are natural or artificial parameters that determine the magnitude of perturbation (climate, topography, soil, vegetation, management; Fig 2). • Causes of erosion enhance the effects of agents and factors and accelerate the processes: human activities such as farming practices (seedbed preparation, deforestation, cropping systems, etc.).
Transcript of TAEF08 Lecture Notes 7-8 Erosion - uni-goettingen.de

Tropical Agroecosystem Function, Kühne, SS 08 U6-8 Erosion by water and wind p. 1
U 6 Erosion OUTLINE EROSION AND SEDIMENTATION
1 Introduction................................................................................................................................................................ 1 1.1 Agents, factors, causes and types of erosion ....................................................................................................... 1 1.2 EXCURSUS (erosion and sedimentation as a phenomenon in geology)............................................................. 3 1.3 Natural vs. accelerated process ........................................................................................................................... 5
1.3.1 Soil erosion as a form of land degradation................................................................................................... 5 1.3.2 Geological erosion ....................................................................................................................................... 5 1.3.3 Pedological erosion...................................................................................................................................... 6 1.3.4 Manmade or accelerated erosion.................................................................................................................. 6
1.4 Effects of erosion on field and watershed ........................................................................................................... 6 1.5 Tolerable soil loss ............................................................................................................................................... 7
2 Soil erosion by water................................................................................................................................................ 10 2.1 Erosivity vs. erodibility ..................................................................................................................................... 10 2.2 Fundamental erosion processes ......................................................................................................................... 12 2.3 Measurement / assessment methods)................................................................................................................. 17 2.4 Control of water erosion.................................................................................................................................... 20
2.4.1 Principles.................................................................................................................................................... 20 2.4.2 Reducing raindrop impact .......................................................................................................................... 20 2.4.3 Increasing shearing resistance of soil ......................................................................................................... 21 2.4.4 Decreasing shear strength of overland flow through slope management.................................................... 22 2.4.5 Alternative (cheap, simple or labour saving) practices to form terraces .................................................... 26 2.4.6 Water disposal (cut-off drain, waterways).................................................................................................. 27
2.5 Modeling (water-erosion).................................................................................................................................. 29 2.5.1 Excursus Model Considerations - Example WEPP, USA.......................................................................... 29 2.5.2 Excursus General requirements - Example WEPP, USA).......................................................................... 30 2.5.3 Excursus Structure - Example WEPP, USA............................................................................................... 31 2.5.4 The Universal Soil Loss Equation (USLE) ................................................................................................ 34
3 Soil erosion by wind................................................................................................................................................. 36 3.1 Geological erosion ............................................................................................................................................ 37 3.2 Accelerated soil erosion by wind - processes.................................................................................................... 38
3.2.1 Wind erosion prediction............................................................................................................................. 40 3.2.2 Excursus - Wind Erosion Simulation Models ............................................................................................ 41 3.2.3 Measuring Wind Erosion ........................................................................................................................... 41
3.3 Control of wind erosion..................................................................................................................................... 41 3.3.1 Principles.................................................................................................................................................... 41 3.3.2 Measures to control soil erosion by wind................................................................................................... 42 3.3.3 Special aspect – Soil conditioner ............................................................................................................... 43 3.3.4 Windbreaks and shelterbelts....................................................................................................................... 43
1 Introduction
1.1 Agents, factors, causes and types of erosion Soil as a primary resource is renewable only in geological time spans. What is soil erosion -or better erosion and
sedimentation? Soil erosion implies the physical removal of topsoil by various agents: falling raindrops, water flowing over and through the soil profile, wind and gravitational pull (Fig 1). Erosion and sedimentation: Process of detachment, transportation, and deposition of sediment by the erosive and transport agents. A wide range of terms are used to describe soil erosion: erosion soil loss, sediment yield, denudation. These terms are based on the different techniques and scales of measurements, small area, field plot, agricultural watershed, large river basin.
Soil erosion is the result of perturbations (natural or caused by humans) in the land-vegetation-climate equilibrium. The phenomena are grouped into agents, factors, and causes of erosion. • Agents are the carriers / transport system in soil movement (Fig 1). • Factors are natural or artificial parameters that determine the magnitude of perturbation (climate, topography,
soil, vegetation, management; Fig 2). • Causes of erosion enhance the effects of agents and factors and accelerate the processes: human activities such as
farming practices (seedbed preparation, deforestation, cropping systems, etc.).

Tropical Agroecosystem Function, Kühne, SS 08 U6-8 Erosion by water and wind p. 2
Erosion and sedimentation are complementary geological processes (see excursus). Erosion wears away rock materials, removing them from one area of the Earth's surface, while sedimentation deposits them in another. Before being deposited, the eroded material is usually transported for some time and distance, often by the erosional force, usually wind or water (Fig 3). Human practices have caused massive soil erosion over historical time.
Types of erosion
Wind erosion
Caused by wind
Splash erosion
Rain
Rill erosion Gully erosion Stream bankerosion
Surface flow
Pipe ortunnel erosion
Subsurface flow
Flowing water
Coastal erosion
Ocean
Water Glaciatederosion
Caused by fluids
Falls Slides
Debris flow Creep
Mass movement
Caused by gravity
Agent
Fig 1. Agents and types of soil erosion; adapted from Lal (1990)
Factors of soil erosion
Land use
Active (people)
Wind velocity
Evapotraspiration
Rain
Climate
Mineralogical
Chemical
Physical
Soil properties
Flow velocity
Types of flow
Hydrology
Aspect
Shape
Length
Gradient
Landform / slope
Passive
Factors
Fig 2. Factors of soil erosion; adapted from Lal (1990)
CLASSIFICATION OF EROSION FORMS (Fig 3) The visible results of water erosion on the ground take different forms, depending on local conditions. A common feature is the formation of rills and gullies. Another common feature is the loss of a thin layer of soil over a wide area, usually classified as „sheet“ erosion. Landslides can be initiated by intense rainstorms in mountain areas, which eventually, develop into mud flows. The term slumping is often used to describe the collapse of steep gully sides, and the collapse of river banks and coastlines due to undercutting.

Tropical Agroecosystem Function, Kühne, SS 08 U6-8 Erosion by water and wind p. 3
Fig 3.Classification of erosion forms: top left rain splash, top right sheet erosion, bottom left rill erosion, bottom right gully erosion.
1.2 EXCURSUS (erosion and sedimentation as a phenomenon in geology) MODES AND AGENTS OF EROSION
Subaerial erosion includes all erosion that occurs on land exposed to the atmosphere. Exposed rock materials are often altered by chemical or mechanical processes (weathering) and then transported by various means. The main agents of subaerial erosion are gravity, running water, ice (mainly in glaciers), wind, and near-shore ocean waves (Fig. 1).
Gravity erosion is often called mass wasting. It occurs where land-surface irregularities such as hillslopes allow gravity to transport the rock debris produced by weathering. Slopes originate in many ways, the most common being crustal movements, or diastrophism, and valley cutting by streams. Unless accelerated by the lubricating effect of running water, the downhill movement (creep) of rock debris ordinarily occurs so slowly as to be imperceptible.
Fig 4. Steep land erosion
Running-water, or fluvial, erosion includes erosion caused by the solvent action of water, by the force of moving water, and by the abrasive effects of rock particles in moving water. In humid, vegetated lands, the solvent action occurs beneath the mat of vegetal cover and along watercourses that develop to drain surplus water. The force of running water in humid lands is greatest along stream channels where flow is rapid and perennial. Some sediment is acquired by direct corrosion of channel bottoms and sides, but more is supplied by mass wasting on hillslopes that extend to channel margins. In established stream systems, most erosion occurs during periods of especially high water discharge. Stream banks are undercut by the moving water, particularly along the outsides of bends, and channel floors are scoured and abraded by fragments

Tropical Agroecosystem Function, Kühne, SS 08 U6-8 Erosion by water and wind p. 4
moving along in the bouncing and rolling mode known as saltation. The solid sediment fragments themselves tend to change in shape from angular to rounded.
In deserts, where vegetation is sparse, fluvial erosion is virtually unrestricted. Water is rapidly lost by evaporation and infiltration, so there is less solvent action, but there is an almost limitless supply of rock debris. Running-water erosion in deserts mainly occurs during and shortly after violent local rainstorms. Water in sheetwash and or a flash flood quickly picks up large amounts of solid sediment (see video ‘Soil Fertility Management in the Sahel’). Later, runoff volume losses may convert stream runoff into mudflows , which eventually solidify and cease to move. Mudflows do not seem to be significant agents of erosion.
Glacial meltwater erodes rock debris and carries it away from the margins of moving ice masses, or glaciers. Meltwater streams, which are usually heavily loaded with rock debris, are not powerful enough to perform significant erosion in downstream reaches.
Ice erosion, or glaciation, is mainly accomplished by the movement of glaciers. Glacial ice freezes to rock fragments and literally plucks them loose. The fragments within the glacier themselves become erosive agents, rubbing and scraping against bedrock in a rasping action that abrades and polishes. In mountainous areas, where glacial ice is confined to elongate depressions, the erosive plucking action combines with abrasion to excavate U-shaped valleys. These valleys often extend upslope to ice-eroded bowls called cirques. Glacial erosion by continental ice sheets tends to be more broadly expressed on the land and produces plains of glacial scour, dotted in many places by lakes, drumlins, and moraines.
Wave erosion, which occurs along beaches and coasts, is caused by the impact of breaking waves and the abrasion of wave-transported sediment. It is responsible for shaping the bedrock in headlands along ocean shores to form sea cliffs.
Subaqueous erosion results from the action of water currents on the bottoms of bodies of standing water. It can occur where strong currents develop because of lunar tides or differences in water density. PROCESSES OF SEDIMENTATION
Sedimentation, the process of sediment accumulation, occurs when a transporting agent is forced to deposit its load of sediment. Deposition may occur for physical reasons, as when a sediment mass moving downhill by gravity reaches the base of the slope, when a current of air or water slows down, or when the ice of a glacier melts; it may occur for chemical reasons, as when materials dissolved in water are precipitated; or it may occur for biological or biochemical reasons, as when organisms act to entrap or induce sediment accumulation.
Gravity deposition of sediment almost always occurs at the bases of hills or cliffs where slopes are too low to permit further downward movement. Deposits include soil and rock mixed by downslope creep (colluvium), fragmental rock (TALUS), and chaotic mixtures of soil, rock debris, and plant material (LANDSLIDE deposits).
Running-water, or fluvial, deposition of solid sediment occurs when currents slacken. In humid areas this occurs in deep, quiet pools, on the inner margins of stream bends, in slack water areas after overflow, and at stream mouths, where flow enters the standing water of seas, lakes, or swamps. In a swamp, some sedimentation occurs by vegetal entrapment. Desiccation causes sedimentation in deserts.
Chemical and biochemical deposition occur when water containing dissolved solids becomes subject to conditions that reduce solubility. Cooling reduces the solubility of water flowing from hot springs, causing deposition of sinter. Agitation at falls and stream rapids may drive off dissolved carbon dioxide gas and cause calcium carbonate to precipitate, forming limestone. Similar processes may occur in bodies of standing water. Evaporation in caves may induce deposition of limestone; in seas it may cause deposition of salt and gypsum. Many organisms extract dissolved material from water to use in building their skeletons. Fragments of these skeletons may in turn accumulate to form a special type of clastic rock called bioclastic.
Glacial deposition of sediment mainly results from the melting and other forms of wastage of immobilised ice masses. Rock debris accumulated in this way is unsorted (drift; till) and not layered, in contrast to sediment deposited by air or water, which tends to be divided into fractions of distinct sizes (sorted) and is also often layered. Sediment deposited by glacier meltwater closely resembles that formed by other streams and rivers.
Standing-water deposition occurs in oceans, lakes, and seas when gravity causes particles of solid sediment to settle out and form layers on the bottom. In oceans, the most common particles include shells of micro-organisms that live near the surface (plankton); airborne dust from deserts, burning meteors, and volcanic eruptions; and fine-grained sediment introduced by rivers and turbidity currents.(see lecture Vlek on global cycles) LANDSLIDE AND AVALANCHE
Landslides and avalanches are massive downward and outward movements of slope-forming materials; these masses may range from the size of cars to entire mountainsides. The term landslide is restricted to movement of rock and soil and includes a broad range of velocities, even slow movements that, although rarely a direct hazard to life, can destroy buildings or break buried utility lines. The term avalanche includes movement of snow and ice as well as rock and soil materials and applies only to movements rapid enough to threaten life. Landslides
A landslide occurs when a portion of hillslope becomes too weak to support its own weight. The weakness is generally initiated when rainfall or some other source of water increases the water content of the slope, reducing the shear strength of the materials. Other causes of landslides include earthquakes and loud sounds. Landslides are abundant where erosion is most actively wearing away the terrain, as along some streams and seacoasts, but they also occur well away from areas of active downcutting. Many types of landslides move seasonally or sporadically and may lie dormant for years. Slow-moving landslides are distinguished from creep by having distinct boundaries with adjacent stable ground.
Ground that is stable in its natural state may slide after human alteration. Grading for roads or buildings on hillsides facilitates landsliding, both by cutting into the slope--removing support from materials higher up the slope--and by overloading the slope below with the excavated materials. Many damaging landslides occur where development alters natural slopes or groundwater conditions, especially within dormant landslide masses that are barely stable in their natural state.
Landslides are generally classified into slides, falls, and flows (Fig. 1). Slides move as largely coherent bodies by slippage along one or more failure surfaces. Slumps are those slides which move largely by rotation along cylindrical slip surfaces. The resulting backward rotation of the slide mass commonly produces hillside flats in otherwise sloping terrain. Block glides, in contrast, slide along inclined planar slip surfaces. Slumps and block glides move up to 2 m/day, though commonly much slower, and may involve the movement of enormous volumes of material. Debris slides and rockslides move slowly to rapidly down steep slopes. Falls of rock or soil originate on cliffs or steep slopes. Large rockfalls can be catastrophic events. An earthquake off the coast of Peru in 1970 started a rockfall from the north-west peak of Huascaran. The descending mass, which incorporated material as it accelerated to more than 280 km/h, buried more than 18,000 people.
Flows are landslides that behave like fluids. Many varieties are recognised. Mudflows involve wet mud and debris. Earthflows involve wet clayey material. Slow earthflows are tongues of material up to hundreds of meters long that commonly move less than several meters a year. They are abundant on clayey hillslopes. Rapid earthflows, in contrast, occur on very gentle slopes in sensitive silts and clays. Solifluction is the slow downslope flow of soil that occurs on arctic and alpine hillsides when thawed ice or snow saturates the soil cover. Dry flows occur where great kinetic energy, as from earthquake or fall from steep slopes, permits dry materials to flow unexpectedly long distances very rapidly. A

Tropical Agroecosystem Function, Kühne, SS 08 U6-8 Erosion by water and wind p. 5
large, rapid flow of dry loess (wind-deposited silt) accompanying an earthquake (1920) in Gansu Province, China, killed 100,000 people. A rockfall avalanche is a form of dry flow in which enormous rockfalls flow rapidly for kilometres across gentle slopes. Prevention and Damage Limitation
A number of methods are employed to prevent landslides, such as the capture and drainage of water before it reaches the potential slide area; the pumping of water from wells in the slide area; and the filling in of cracks that could be pervaded by precipitation or surface water. Damage to buildings and other structures is limited through geologic exploration of construction sites and through the design and construction of earthworks. The avalanche danger of unstable slope accumulations is reduced or prevented through detonation, from either the tossing of grenadelike explosives or the shooting of bazookalike shells into the slope. Structural damage is limited by the construction of various types of fencing and of splitting wedges, V-shaped masonry walls that split an avalanche around a structure located behind the walls.
1.3 Natural vs. accelerated process 1.3.1 Soil erosion as a form of land degradation The fundamentals of erosion are simple to describe (Fig 5. The cycle of materials ). The rocks of a newly exposed surface are fractured by diurnal and seasonal temperature changes. The fractured material is subject to further change by oxidation and hydrolysis. Some part of the comminuted material is washed off the higher parts of the land and deposited on the lower parts or in the surrounding seas, carrying with it some plant and soil remains.
w e a t h e r in g
s o i l
s e d im e n t
e r o s io n
s e d im e n t a t io n
t r a n s p o r t e ds o i lm a t e r ia l
p a r e n tm a t e r ia l
w e a t h e r e dm a t e r ia l
u p h e a v a l
c o n t in e n t a lr o c k
s o i lf o r m a t io n
r o c kf o r m a t io n
Fig 5. The cycle of materials
It seems reasonable to postulate that the depth of the soil profile is the result of a balance between the rate at which soil is formed by the breakdown of rock at the base of the profile and the rate at which soil is being lost from the surface, by transport either by wind or water, or by gravity, in the process of erosion. An account of erosion over the surface skin of the Earth must be an account of the processes involved, and the factors (agents and catalysts). Erosion can be interpreted as physical soil degradation. Processes of soil degradation include chemical, physical and biological actions and interactions that affect a soil’s capacity for self-regulation and its productivity. Factors of soil degradation are natural and man-induced agents and catalysts that set in motion those processes that lead to changes in a soil properties and its life-support attributes. Factors responsible for physical degradation are: deforestation, intensive row-cropping, excessive wheeled traffic, ploughing and physical soil manipulation.
Tab 1. Classification of the types of erosion with some characteristics
Type of erosion Average Intensity (mm/year) Examples Normal erosion 0.001 - 0.1 Slope development Accelerated geological erosion Landslides; erosion after forest fires
or volcanic eruptions Normal pedological erosion 0.01-0.1 Catena forming Normal manmade erosion 1-10 Erosion caused by extensive grazing
and shifting cultivation with short rotation time
Accelerated manmade erosion 10- > 100 Erosion due to injudicious land use
1.3.2 Geological erosion The earth’s surface is subject to constant change as a result of endogenic and exogenic processes. Endogenic
processes, such as volcanism and tectonics, change the earth’s crust from within the earth. Exogenic processes of the atmosphere, hydrosphere and biosphere constitute the outside influences. Exogenic processes both destroy and

Tropical Agroecosystem Function, Kühne, SS 08 U6-8 Erosion by water and wind p. 6
create. The formation of mountains and hills on a continent, caused by upheavals of the earth’s surface, also marks the beginning of a degradation process, in the course of which the surface is affected by weathering, and detached, reduced material is transported.
In the area where the earth’s crust has sunk, the degradation products of the same exogenic processes will fill up the depression. In this way erosion landscapes and sediment plains are created: geomorphologic forms of relief that are in line. Geomorphologic maps depict reliefs that were created by processes of geological erosion in the past. These landforms are in a sense physical units which encompass specific ecosystems. Looking back in time, it seems as if high mountains were ground off and deep basins were filled. But this process of geological erosion actually took a long period of time and was very slow with an average intensity of 1 to 10 mm per century (Tab 1). Note that geological erosion can also occur more rapidly, e.g. during mass movements (landslides), after major changes of the base level of erosion (tectonics) or when material with less cohesion or stability reaches the surface.
1.3.3 Pedological erosion The influence of the atmosphere, hydrosphere and biosphere on rocks results in physical and chemical
weathering. This is a degradation process during which the rocks are reduced in size to such extent that the final material can be easily transported. In geology soil is a differential phenomenon within a weathered layer, which manifests itself in the creation of soil horizons. Note that not all weathered material is necessarily subject of soil formation, as early transportation of the weathered material prevents the forming of soil. The process of soil formation is mainly governed by the vertical circulation of water, during which solutes are carried along and precipitated at various depths. (B-horizons, see U 3).
On slopes the process is strongly influenced by the transportation of material by water running off the surface. There’s a dynamic quasi-balance between the soil formation in the profile and the transportation of soil material from the topsoil: weathering and soil formation keep pace with erosion. All processes are in balance with each other and with the environment: a stable, natural ecosystem. Although there does exist some net degradation (negative soil balance, which explains the adjective ‘quasi’), the structure and constitution of the soil profile do not change much, provided that the progressive weathering process does not reach a matrix of a different make-up. This type of erosion may be called pedological erosion. It may looked upon as an enlargement of the process of geological erosion and is an essential part of the ‘cycle of materials’ (Fig 5. The cycle of materials
1.3.4 Manmade or accelerated erosion
Among all the external factors that can disturb this quasi-balance, Man occupies a special place. Destruction of natural vegetation and tillage of soil make that there is no natural soil protection, so that wind and rain can easily carry off soil particles, and erosion - on land sensitive to it - is artificially accelerated.
As the process of soil formation is not accelerated, a gradual decrease in the available amount of soil material occurs (see section tolerable soil loss). This decrease may be slow, as in the case with shifting cultivation that has a long rotation time ( e.g. 20-50 years), but may also be fast, as with those types of permanent agriculture that leave the soil uncovered over a short period of time (e.g. at the start of the growing season or after harvest) or over a longer period (bare fallow periods), or that leave large parts of the soil bare during the whole year (row cropping, clean weeding around fruit trees).
On a large and small scale, natural ecosystems all over the world are now severely disturbed by human activities: fires, deforestation, agriculture, excessive grazing, but also mechanisation, mining, urban development and acts of war contribute to the degradation and loss of the natural resources soil and water.
1.4 Effects of erosion on field and watershed Land degradation because of erosion results from the loss of soil more rapidly than it is formed through natural
processes. The several centimetres of soil that can be lost in one or a few wind or rainstorms probably represents nature’s work for a few hundred or few thousand years (Bennett 1939). Associated with the soil losses per se are losses of the soil’s organic matter (or humus), fertility and water-holding capacity. These losses can be overcome, up to point, through more intense management, increased applications of fertilisers, and more frequent irrigation on irrigated lands.
When continued erosion cannot be compensated for by increased inputs, production decreases because of lower soil fertility, lower water-holding capacity, and eventual deterioration and complete destruction of the land resource base due to removal of topsoil (and subsoil in extreme cases) and development of gullies. If erosion has reduced the soil’s water-holding capacity, the rooting depth available to the plant, or the water infiltration rate, adding fertilisers may not offset the yield-reducing effects.
Studies indicate, for example, that erosion can lower yields on many soils. Erosion is part of the system erosion-transportation-sedimentation, over short and long distances. Thus it becomes understandable that erosion has its effects on the site of detachment as well as on the site of sedimentation/deposition of the material. Erosion has influence on or changes the (top)soil and thus the water balance and availability of nutrients. The effects can be considered on field level and a bigger area/watershed level and are related to social and economic aspects. On field level: damage to crops (exposure of roots, choking in sediment, scouring), slaking, reduced infiltration and water

Tropical Agroecosystem Function, Kühne, SS 08 U6-8 Erosion by water and wind p. 7
storage capacity, removal of fine particles, related reduction of water and nutrient availability, harder to cultivate are but some effects a farmer has to deal with.
Box 1: Erosion has its effects on the site of detachment as well as on the site of sedimentation/deposition of the material, on field level and bigger area/watershed level. The effects are related to social and economic aspects:
• damage to crops (exposure of roots, choking in sediment, scouring) • removal of fine particles • loss of nutrients • reduced infiltration and water-holding capacity -> reduced water availability • harder to cultivate • accumulation of soil at depressions • removal of topsoil (and subsoil in extreme cases) • reduction of rooting depth • reduced accessibility (gullies) • eventual deterioration and complete destruction of the land resource base • lowering of groundwater level • landslides and mudflows (destruction of settlements, infrastructure) • water pollution and eutrophication: soil particles in water runoff carry along fertiliser residues, pesticides,
dissolved minerals (such as salts) and animal wastes (with associated bacteria) • silting of irrigation canals and natural water courses • decreasing the capacity of water reservoirs
Erosion also affects air and water quality. Agriculture is considered the main source for that part of the water pollution that comes from diffuse (nonpoint) sources. Soil particles in water runoff carry along fertiliser residues, pesticides, dissolved minerals (such as salts), and animal wastes (with associated bacteria).
For wind erosion the term watershed is not very relevant, but also with wind erosion the effects on field scale and on whole area can be different. Moving dunes, overblown roads, dust storms are some examples that have their effects on a large area.
On watershed level sedimentation in waterways, accessibility (gullies), changes in hydrological balance (higher and faster stormflow, reduced baseflow) are simple examples. Especially sediment and related aspects are important.
On field level the interest of the farmer are the most important, but on watershed/area level several interests, also those not directly related to persons, play a role. This has consequences for the measures to control erosion, especially their implementation.
1.5 Tolerable soil loss Soil erosion affects crop production principally because it affects (1) soil nutrients, (2) infiltration of water and
air into the soil, (3) the soil water holding capacity, (4) the soil tilth, and (5) the surface configuration of the soil. The extreme, but not uncommon, example on a world scale where erosion results in barren rock is as obvious as to require no documentation. However, even with the best soil conservation practices applied, soil erosion rates cannot be reduced to zero rates of soil loss. Therefore, the question arises of how much soil loss can be tolerated. The term ‘soil loss tolerance’ (T value) is vaguely defined as the maximum rate of annual soil erosion that will permit a high level of crop productivity to be obtained economically and indefinitely (McCormack &Young, 1981). T values are used as a basis for land use planning in conjunction with soil erosion models such as the USLE or EPIC. The T value range of 2 to 11 t/ha valid for the USA (USDA-SCS, 1973; Tab 2) is based on the assumption that long-term (potential) productivity under conditions of high input technology depends on maintaining the thickness of the A-horizon and a favourable rooting depth.
Tab 2. Guidelines for assigning soil loss tolerance values to soils having different rooting depths (USDA-SCS, 1973)
Soil loss tolerance values Rooting depth Renewable soila Nonrenewable soilb cm t/ha <25 2.2 2.2 25-51 4.5 2.2 51-102 6.7 4.5 102-152 9.0 6.7 >152 11.2 11.2 a Soils that have a favourable substratum and can be renewed by tillage, fertiliser, organic matter, and other
management practices.

Tropical Agroecosystem Function, Kühne, SS 08 U6-8 Erosion by water and wind p. 8
b Soils that have an unfavourable substratum, such as rock, and cannot be renewed economically. The reason for selecting an upper value of 11 t/ha was the estimation, from sketchy data, that an A horizon can
develop in permeable, medium-textured material in well-managed cropland at about this rate1 (McCormack et al., 1982). However, soil formation rates on unconsolidated parent rock is much slower - about 1.1 t / (ha yr) and it is difficult (technically, economically) to reduce soil erosion to this low rate. Furthermore, this approach ignores the edadophological aspects of plant nutrient availability and the importance of organic matter and the clay fraction in plant growth. If the erosion rate exceeds that rate of soil formation or renewal, the sub-surface horizons or subsoil layers must be evaluated to determine if they will provide a suitable medium for root growth. The horizons underlying the A are important because they differ from the A with respect to characteristics such as organic matter, available K and P levels, available water-holding capacity, bulk density, and presence of toxic material (Al) and other features which can limit root growth(Tab 3).
Erosion rates are usually reported as height (mm/ha year) or weight (t/ ha yr) of lost soil but not as amount of lost plant nutrients. Ignoring the off-side pollution effect on water resources, nutrients can be replenished by applying mineral fertilisers. However, many farmers in the tropics have no or only limited access to mineral fertilisers. These farmers must rely on native soil fertility and fallowing practices to replenish it. In this case, loss of nutrients by erosion results in reduced crop yields. Lal (1984) has shown that the higher concentrations of organic matter and nutrients in selectively eroded, fine particle-size fractions result in a loss of nutrients per tonne of eroded sediment that is greater than the nutrients in an equivalent mass of the original soil2. Based on these reasoning, Lal (1985) derived T-values for a toposequence in western Nigeria ranging from as low as 0.05 t/(ha yr) for shallow soils to a maximum of 2 t/(ha yr) for soils with relatively deep, effective rooting depths (see
Fig 6).
1 This estimate is based on data from Bennet (1939). A-horizon formation rate: 2.5 cm in 30 years = 0.0833 cm per year. This rate assuming a bulk density of 1.34 equals 11.2 t/(ha year); 0.0833 cm/year * 1.34 g/cm³ * 10000 * 10000 cm²) / (1000 * 1000) = 0.0833 * 1.34 *100 = 11.2 t/ha 2 If soil loss is 10 t/ha and the P enrichment ratio of the sediment is 3, then the P-loss is equivalent to a loss of 30 t/ha of topsoil.

Tropical Agroecosystem Function, Kühne, SS 08 U6-8 Erosion by water and wind p. 9
The rate at which soil productivity declines with continued erosion varies considerably among soils. Soils that are already severely eroded, or that are shallow to bedrock or to some other undesirable substratum, decline in productivity more rapidly than soils that are thicker or whose substrata do not greatly restrict the development of A horizon characteristics. Although improved over earlier methods, current criteria for determining soil loss tolerance are still imperfect, especially in the tropics. Much is still unknown about the rates at which favourable root zone forms and about the effects of erosion on soil productivity/soil quality.
Tab 3. Diagnostic horizons that can limit root growth (adapted from Hall et al., 1985)
Horizon Location Properties Argillic Subsurface High clay content, low porosity and
permeability Natric Subsurface High clay content, low porosity and
permeability, exchange Na Spodic Subsurface High in amorphous organic matter,
Al and/or Fe, low porosity and permeability
Oxic Subsurface Low CEC, absence of weatherable minerals, high iron oxide content
Duripan Subsurface Cemented by silica, nearly impermeable
Fragipan Subsurface Weak cementation, low porosity and permeability
Albic Surface or subsurface Low nutrient supply Calcic Subsurface Secondary carbonate enrichment Petrocalcic Surface or subsurface Cemented by carbonates, nearly
impermeable Lithic contacta depending on type and fracture
pattern of the bedrock a An interface rather than a horizon

Tropical Agroecosystem Function, Kühne, SS 08 U6-8 Erosion by water and wind p. 10
Fig 6. Range of soil loss tolerance in relation to profile characteristics and characteristics and crop response to
management (a) many Alfisols in West Africa with shallow gravel layer (b) some Oxisols and soils derived from volcanic ashes.
2 Soil erosion by water
2.1 Erosivity vs. erodibility CLIMATIC EROSIVITY Climatic erosivity, or the ability of the climate to cause erosion, is an integrated effect of all climatic variables that contribute to the driving force that causes erosion: kinetic energy. The primary source of kinetic energy is falling raindrops. Raindrop energy is affected by the size, fall velocity, and wind velocity in the case of wind-driven rain. The energy of falling raindrops is directly related to rainfall intensity or amount of rainfall. However, no single formula can explain the relation between drop size and intensity for different geographic regions. Tropical rains are often more intense than temperate rains. SOIL ERODIBILITY Because of differences in their inherent properties, soils exhibit different degrees of susceptibility (soil erodibility) (up to 30-fold, Olson & Wischmeier, 1963) to the forces generated by erosion agents. Different soils respond differently to the identical kinetic energy of raindrops or the shear stress exerted by moving fluid. Susceptibility of soil to erosion is complex. It is influenced by many soil properties (Tab 4) such as texture, structure, permeability, organic matter content, oxides of iron and aluminium, and predominant clay minerals and their interactions with climate and managements systems and affected by severity of temperature and moisture regimes and topography (degree and length of slope, slope shape, and slope aspect. According to Lal and other researchers are the processes

Tropical Agroecosystem Function, Kühne, SS 08 U6-8 Erosion by water and wind p. 11
governing soil erodibility not well understood, so that more research is required to understand the principles influencing it.
Tab 4. Important soil properties affecting soil erodibility
I. Measurements on disturbed soil samples (sieved and/or ground) A. Time invariant properties
1. Primary clay, silt, and sand content 2. Coarse fragments 3. Carbon (organic matter) 4. Total nitrogen 5. Iron 6. Aluminum 7. Silicon 8. Extractable bases 9. Soluble cations 10. Cation exchange capacity 11. Carbonates 12. Acidity 13. Soil consistency (Aterburg units)
B. aggregate properties 1. Dry aggregate size 2. Aggregate stability indices
C. Mineralogical and morphological properties 1. Description and relative abundance of clay minerals 2. Description and relative abundance of amorphous materials 3. Morphology of coarse silt and sand primary particles 4. Morphology of coarse slit and sand-sized aggregates 5. Qualitative description of aggregation mechanics (e.g. abundance of fine root hairs, fungal hyphae)
D. Properties of remolded cores 1. Infiltration related properties a. Moisture-tension relationship b. Saturated hydraulic conductivity c. Unsaturated hydraulic conductivity d. Hydrophobic and hydrophillic conditions e. Rock fragments 2. Erosion related properties a. Cohesion and friction angle b. Detachment by impact of single drop c. Shear strength by fall cone d. Shear strength by direct shear e. Penetration resistance II. In-situ soil measurements associated with field erodibility testing A. Interrill erodibility tests 1. Depth of Ap horizon 2. Bulk density 3. Microrelief 4. Shear strength a. Fall cone b. Penetration resistance 5. Crust characteristics a. Thickness b. Rupture resistance 6. antecedent soil moisture B. Rill erodibility tests 1. Depth of Ap horizon 2. Bulk density 3. Shear strength a. Fall cone b. Torvane

Tropical Agroecosystem Function, Kühne, SS 08 U6-8 Erosion by water and wind p. 12
c. Penetration resistance
2.2 Fundamental erosion processes The erosivity of rainfall is the capacity of rain to detach and to transport soil particles (in short: to erode). It was
only in 1940 that western scientists began to appreciate that splash erosion (raindrop impact) is the critical starting point of the erosion process by studies using high-speed photography. For erosion to take place, energy must be available. The actual process of erosion by water is activated by the force of the rain and also by run-off arising from it. The impact of raindrops and flow of run-off over the surface of the land causes detachment of soil particles and their transportation downslope and downstream. The action of a single raindrop falling on bare soil resembles the action of a bomb (see Fig, Action of a single raindrop falling on wet bare soil.) The energy released by thousands of relatively large raindrops at high velocity during an intense tropical storm can be imagined. A good demonstration has been provided by Hudson (Tab 5, Tab 6).
Tab 5. Kinetic energy of rain and run-off (adapted from Hudson, 1981)
Rain Run-off Mass Assume mass of falling rain = R Assuming 25 % of rain = run-off
mass of run-off = R/4 Velocity Assume terminal velocity = 8 m/sec Assume speed of surface flow = 1
m/sec Kinetic energy ½ x R x (8)² = 32 R ½ x R/4 x (1)² = R/8
Rain thus has 256 times more kinetic energy than the surface run-off.
Tab 6. The importance of cover - soil loss from bare and covered (mosquito wire gauze) soil (adapted from Hudson, 1981)
Year Plot covered by gauze (t/ha) Bare plot (t/ha) 1953/54 Nil 146.2 1954/55 2.0 204.5 1955/56 4.5 135.6 1956/57 0.2 132.4 1957/58 0.2 49.5 1958/59 2.5 202.0 1959/60 Nil 7.4 1960/61 Nil 121.4 1961/62 Nil 138.5 1962/63 Nil 128.2 10 year totals 9.4 1265.7
1.5 * 27.5 m plots of bare soil; weeding and digging;
Interrill erosion Impacting raindrops are the most important erosive agent on interrill areas. Raindrops range in size from about
0.2 to 6.0 mm, and impact at about 9 m/s. Raindrops of all sizes occur in most storms, but median drop diameter varies with the 0.2 power of intensity. Intensive rainstorms are characterised by large raindrops.
Kinetic energy of raindrops, the product of drop mass and the square of impact velocity, is frequently used as an indicator of rainfall erosivity. Energy per unit depth of rainfall varies approximately with the 0.14 power of rainfall intensity (Wischmeier and Smith, 1978). Another frequently used indicator of rainfall erosivity is maximum 30-min intensity. It is multiplied with E to obtain storm EI, the erosivity index in the universal soil loss equation (USLE). Because kinetic energy cannot be routinely measured, many empirical relationships have been established relating kinetic energy and rainfall intensity. One example is the equation proposed by Wischmeier and Smith (1958)
E = 210.3 + 89 log I E kinetic energy (tonnes per ha per cm of rain) I rainfall intensity in cm/h; equation is valid for I values up to 76 mm/h.
Erosivity is the sum total of the energy of falling raindrops and is determined by the distribution of drop size and the speed of fall. The distribution of drop size is related to the rain intensity and type of shower. The relation between quantity and duration of rainfall is rain intensity (mm/h). Great differences exist between the types of rainfall of several climatic zones, as characterised by their rain intensities. High rain intensities are more frequent in tropical zones than in temperate zones. The kinetic energy of rainfall is determined by drop size distribution, speed of fall and rain quantity. The kinetic energy (E) of a raindrop is calculated as:

Tropical Agroecosystem Function, Kühne, SS 08 U6-8 Erosion by water and wind p. 13
E = 0.5 m*v^2 E = kinetic energy (J), m= mass (kg), v = speed of fall (m/s) But for natural rain the energy estimations are complex, as the composition of a rainshower cannot be expressed in a formula. To characterise the erosive force of rainfall at a specific site, one will have to calculate the kinetic energy of the rain over a number of years, by extracting pluviogrammes. The composition of the continuing rain under forest vegetation is noticeably different from that of rainfall in open air: the drops are considerably bigger and therefore have a high speed, also when falling from a relatively small height. The kinetic energy of the continuing rain can, in certain circumstances, be more than that of rainfall in open air.

Tropical Agroecosystem Function, Kühne, SS 08 U6-8 Erosion by water and wind p. 14
Fig 7. Top: Soil splash is caused by the raindrop impact. Bottom: Schematic of erosion processes on hillslope –Detachment (A, B) by splash, Transport (B, C) by splash and overland flow and Sedimentation (D).

Tropical Agroecosystem Function, Kühne, SS 08 U6-8 Erosion by water and wind p. 15
Fig 8. Factors affecting erosion by soil splash (raindrop impact) and overland flow; adapted from Lal, 1990
Soil properties Landform Rainfall characteristics
Overland flow Vegetation cover
• Soil moisture • Slope steepness • Mass, size, shape and impact velocity of raindrop
• Depth • Canopy cover
• Texture • Slope shape and aspect
• Kinetic energy and momentum
• Type of flow (laminar, turbulent)
• Foliage distribution
• Structure • Slope length • Intensity • Wind velocity
r a i n
a m o u n t i n t e n s i t y
k i n e t i c e n e r g y i m p a c t
r a i n e r o s i v i t y
p o r e p h a s e s o l i d p h a s e
s o i ll a n d
s l o p e - s l o p e l e n g t h
r e l i e f e n e r g y
c o m p a c t i o ni n f i l t r a t i o n r a t er u n o f f
r u n o f f e r o s i v i t y
o v e r l a n d f l o w
r i l l f l o w
s a l t a t i o n
e r o s i o n r a t e
r i l l & i n t e r r i l l e r o s i o n
p a r t i c l e t r a n s p o r t
p a r t i c l e d e t a c h m e n t
d e t a c h a b i l i t y
r i l l a b i l i t y
t r a n s p o r t a b i l i t y
ER
OD
IBIL
ITY
Fig 9. Interaction between rainfall, overland flow, and terrain on splash and sediment transport, adapted from Chisci, 1981).
This release of energy causes dispersion of soil particles and destruction of aggregates (rain splash, Fig 7). The very small particles thus dispersed (mostly clay) seal up pores in the soil surface. Thus as the pores fill up, the absorptive capacity decreases (permeability, infiltration, hydraulic conductivity) and the surplus water moves down-slope, carrying the smaller splashed particles with it. The general pattern of events is a net loss of soil in uplands and a net accumulation of fertile soil in deltas. As erosion continues, run-off collects in small rills or channels where its erosive and transporting powers are enormously increased. The rills become gullies and the gullies become progressively deeper and wider. If the process is allowed to continue all the top soil may be removed. The sediment transported this way may enter natural or man-made lakes where it will settle out due to a reduction in the velocity of the water flow, resulting in loss of storage capacity in the reservoir.
Soil erosion is a function of two opposing forces, i.e. the driving force of the erosion agent and the resisting force of the soil. The processes include detachment, transport, and deposition of soil particles by raindrops and surface flow (Fig 7). Detachment
Detachment is the dislodging of soil particles from the soil mass. Many soils are cohesive in that primary soil particles are bound together by physical and chemical bonding forces (example: clay as a bonding agent, contrast pure sand: non-cohesive, loose, and already detached; only gravity and friction hold these particles in place). The force required to dislodge particles from a cohesive soil is greater than the force required to move the same particles lying loose on the soil surface. Transport
Transport is the movement of soil particles over the soil surface. Raindrops striking bare soil detach and splash soil particles in all directions. The particles can land on nearby vegetation, eventually washed back to the soil surface. Some particles are splashed directly into surface runoff that can transport them long distances before they

Tropical Agroecosystem Function, Kühne, SS 08 U6-8 Erosion by water and wind p. 16
are deposited. After deposition, these particles may remain in place until runoff increases later, moves them further downslope.
Transport capacity is the capacity of the erosive agents to transport sediment. Sediment load is the actual transport rate and may be either greater or less than the transport capacity. If sediment load exceeds transport capacity, deposition occurs at a rate proportional to the difference between transport capacity and sediment load. Deposition reduces the sediment load, and sediment accumulates on the soil surface. Conversely, if sediment load is less than transport capacity, detachment by overland flow may occur.
Runoff and Overland flow Runoff (Fig 11) can be divided into various components. A simple division of total runoff is into the components surface, subsurface and ground water (Tab 7, Fig 10). Surface runoff is that travelling over the ground and in stream channels, creating a rapid response of streamflow to a rainfall event (hydrograph). Direct precipitation on to water surfaces will only be a small percentage of the total volume of streamflow unless the watershed has a large number of lakes or swamps. However, it may be important in terms of saturated overland flow. High runoff volumes may be the effect of: • excess of water caused by frequent saturation (Dunne type) of the soil by high seasonal rainfall, lateral imports
or high water table; • excess of water caused by low permeability (Horton type) of dense layers or abrupt textural changes in the
profile or by limited infiltration on the soil surface due to surface sealing (crust). Excess rainfall over infiltration is first used to fill in surface depressions (capacity: 2.5 cm for smooth-surface
clay to 5 cm for sandy soils). When full, these depressions begin to overflow. This flow tends to concentrate in numerous small channels, called rills (traditional defined as small channels that can be obliterated, removed by tillage) and verges in a few major channels before leaving field-sized areas. Flow on areas between the rills tends to be lateral toward the rills (interrill flow). When concentrated flow erodes channels deeper than can be crossed with farm equipment, the eroded channels are called gullies.
In the upper soil layers water which has infiltrated may move laterally (through-flow or inter-flow). Although considerable volumes of water may be involved, in general movement is less rapid than that of overland flow. Water percolating to deeper layers contributes ground water runoff or base flow, which is delayed as referred to the rainfall event due to the slow lateral movement of groundwater.
Fig 10. Types of flow and runoff generation in watersheds

Tropical Agroecosystem Function, Kühne, SS 08 U6-8 Erosion by water and wind p. 17
Tab 7. Types of flow in watersheds (adapted from Lal, 1990)
Type of flow Character Location Surface - Quick flow (Horton-) Overland flow Surface flow of water because rainfall intensity
exceeds infiltration rate. Semiarid areas where rainfall intensities are high and vegetation cover is sparse (video Niger). In humid areas may occur adjacent to stream channels or in topographic depressions where water converges.
(Dunne-) Saturated overland flow
Surface flow of water because soil profile is saturated and infiltration capacity has not been exceeded
Locations usually close to stream channels or depressions where water table rises rapidly to surface during storm event.
Subsurface (return) flow Through-flow Movement of water downslope in soil profile
usually under unsaturated conditions. Slopes with well-drained soils often encouraged by discontinuities in soil profile. Lateral flow will occur in soil if the flow meets less resistance than vertical percolation of water.
Saturated through-flow Lateral flow in soil under saturated conditions During storms a saturated wedge will extend upslope in soil profile, and saturated through-flow occurs immediately above.
Translatory (‘piston’) flow Lateral flow in soil occuring by displacing stored water due to addition of ‘new’ water
Slope of soil of saturated zone
Inter-flow May be used synonymously with through-flow. Some authors describe lateral flow above water table but below soils as inter-flow which could thus be through un-saturated rock or regolith.
Slopes having permanent water table at depth and any lithological discontinuities may encourage lateral flow of water as inter-flow.
Saturated inter-flow Inter-flow occurring under saturated conditions.
Affected by extension of saturated wedge beneath surface in upslope direction.
Pipe flow Flow through subsurface net-work of interconnected anasto-mosing pipes or tubes, larger than other soil voids and may be up to 1 m in diameter.
Variety of areas including steep slopes, where erodible layer lies above less permeable layer, or on flood plainsmarginal to channel banks.
Delayed flow Groundwater flow Water that has infiltrated into ground, has
reached groundwater, and is discharged to surface from spring or seepage at rate determined by hydraulic head.
Areas where groundwater storage is possible due to character of subsurface materials.
Fig 11. Run off
Infiltration, surface detention, overland flow, and subsurface flow are important soil erosion components of the hydrologic cycle (Fig 9). Both rill and interrill erosion are caused by overland flow. Although soil detachment by splash precedes transport by sheet flow or overland flow, both processes may occur simultaneously during a natural rain event.
2.3 Measurement / assessment methods) The technique used to estimate the erosion rate depends on the type of erosion, scale of measurement, and the objectives (Tab 8).

Tropical Agroecosystem Function, Kühne, SS 08 U6-8 Erosion by water and wind p. 18
Tab 8. Objectives of measurements of soil erosion rates for different scales (adapted from Lal 1990)
Macroscale (river basin) Mesoscale (agricultural watersheds) Microscale (small field plot) 1. Evaluate the effects of climate, parent
rocks, and land use on sediment transport.
1. Evaluate the effects of agricultural practices, topography, and slope length on sediment origin.
1. Evaluate processes of soil erosion in relation to soil type, rainfall characteristics, and overland flow.
2. Assess erosion potential in different regions.
2. Determine relative importance of rill vs. interrill erosion
2. Study soil-raindrop and soil-rill flow interaction.
3. Plan regional or national conservation program.
3. Assess pollution of natural waters by movement of chemicals from agricultural watersheds.
3. Determine soil erodibility and factors affecting it.
4. Evaluate soil and water resources of a region and plan regional development activities.
4. Study soil erosion-crop productivity relationship.
4. Assess effects of slope type and aspect of sediment origin.
5. Develop and validate predictive models of sediment transport through river systems.
5. Analyze predominant factors and processes of soil degradation.
5. Evaluate relative effectiveness of cultural practices and cropping systems in controlling runoff and erosion.
6. Units of measurement: mm/(km² yr), m³/(km² yr), t/(km² yr)
6. Units of measurement: kg/(ha yr) t/(ha yr)
6. Units of measurement: g/(m² yr) kg/(m² yr), t/(ha yr)
Macroscale A) Sediment and solute yield of stream, rivers, and large drainage basins. Basic principle: monitoring sediment transport rates past a point in the river channel at the watershed outlet by measurement of runoff and sediment concentration. Example: The world’ average yield of sediment and solutes by rivers is equivalent to a lowering of the earth’s surface by 3 cm every 1000 years or 42 t/(km² yr). B) Soil survey and rating systems (qualitatively estimate of erosion hazard over large aereas) Indicators are percentage of bare soil, canopy density, and density of ground cover, and presence of different patterns of sheet and rill erosion. An example is depicted in Tab 9.
Tab 9. Classes of erosion (USDA Soil Survey Staff, 1951)
Class Description 1 No apparent, or slight erosion 2 Moderate erosion: moderate loss of topsoil generally and/or some dissection by runoff channels or
gullies 3 Severe erosion: severe loss of topsoil generally and/or marked dissection by runoff channels or
gullies 4 Very severe erosion: complete truncation of soil profile and exposure of subsoil (B horizon) and/or
deep and intricate dissection by runoff channels or gullies. C) Regression models, empirical models to relate sediment yield to rainfall data and characteristics of runoff and watershed. Mesoscale (farmland and agricultural watersheds) • Hydrologic measurements of surface runoff and sediment concentrations at the watershed outlets (weirs) • Radioisotopes 137Cs (fall out of nuclear explosions) and other tracer methods. Eroded soils have lower
concentrations of 137Cs because 137Cs is concentrated in surface layers of undisturbed soils. • Changes in soil level as estimated by tree root exposure – problematic, some trees grow with their roots exposed
even on undisturbed soils, remnants of original soil surface, pedestals formed by stone covers (Fig 12). Microscale (few to few hundred square meters) Field studies: Splash measurement (splash cups) Rill and interrill erosion • - painted soil particles as tracers • - buried nails and stakes (repeated measurements of ground height) • - volume of rills • - trapping the soil removed * trapping troughs * field runoff plots Laboratory measurements (rainfall simulator) Conclusions: Most of these techniques are subjective and scale dependent.

Tropical Agroecosystem Function, Kühne, SS 08 U6-8 Erosion by water and wind p. 19
Fig 12. Schematic of measurement techniques for soil erosion. Top: Runoff plot; centre: nail technique a) installation, b) measurement; bottom: a) remnants of former soil surface in grassland and b) exposure of tree roots.

Tropical Agroecosystem Function, Kühne, SS 08 U6-8 Erosion by water and wind p. 20
2.4 Control of water erosion 2.4.1 Principles Interrill and rill erosion are caused by the impact of raindrops, shear strength of overland and channelled flow, and interaction between the two factors. As indicated in Fig 13 the basic principles are: reducing the impact of the raindrop, increasing the shear resistance of the soil, and decreasing the shear strength of erosive fluids.
Practices:
Soilmanagement
Cropmanagement
by ground coverby mulching
Reducing raindrop impact
Improvingsoil structure
and its stability
Increasing randomroughness
by mulchingby soil conditioners
by conservation tillage
Increasing soil's shear resistance
Increasing resistanceto flow
Decreasing flowvelocity
by agronomicby engineering
techniques
Decreasing shear strength of overland flow
Principles ofErosion Control
Fig 13. Principles of erosion control (adapted from Lal 1990).
Best Management Practices BMPs are a combination of management, cultural, and structural ( = conservation works, engineering) practices that the agricultural scientists, the government, or some other planning agency decides upon to be the most effective and economical way of controlling erosion problems without disturbing the quality of the environment. Minimizing raindrop impact on the soil and reducing runoff and runoff velocities are three main objectives that are taken into consideration when saving endangered fields or land. When reducing the velocity of the runoff, crop residues, plants, rough soil surfaces, and smaller slopes help spread the flow of water over a greater area into a thin layer. 2.4.2 Reducing raindrop impact Ground cover Raindrop impact on soil can be reduced by maintaining an effective – complete, close to the ground surface (< 50 cm) – ground cover. Different types of ground cover on agricultural land are depicted in Fig 14. Effectiveness of cover decreases with increasing height above the ground. Coalescing drops falling from tree canopy 10 to 20 m above are big, attain terminal velocity, and have high impact.
Fig 14. Factors affecting the efficiency of ground cover on agricultural land
Height Density Canopy structure
Stories Continuity Nature
• High (trees) • High canopy cover
• Close canopy
• Multistory (tropical rain forest)
• Continuous over time
• Organic (live and dead)
• Intermediate (shrubs)
• Low canopy cover
• Open canopy
• Single story • Discontinuous
• Inorganic
• Low (crops) Mulching Ground cover can be provided by mulching. Mulch is a uniform layer of a dissimilar material placed between the soil surface and the atmosphere. Mulching has been used to enhance soil fertility through addition of plant nutrients and organic matter, regulation of soil temperature and moisture regimes, and improvement of soil tilth by enhancing activity of soil fauna (e.g. termites and earthworms). Mulch dampens the influence of the environment on soil. The magnitude of this buffering effect depends on the quantity, quality, and durability of mulch. Different types of mulch materials and ways to procure them are shown in Fig 15.

Tropical Agroecosystem Function, Kühne, SS 08 U6-8 Erosion by water and wind p. 21
Cover crops
Sodseeding
Livemulch
No-till
Alley cropping Contourmanagement
Agrofroestry
In situ
Animalwaste
Plantresidue
Organic
Water Soilconditioner
Liquid
Plastic Gravel
Solid
Inorganic/synthetic
Brought-in
Origin
Fig 15. Types of mulch materials any ways to procure them (adapted from Lal 1990)
Mulch applied at the rate of 4 to 6 t/ha is an effective erosion control measure in a wide range of ecologies. However, such large amounts required is a severe constraint for many arid and semiarid regions. In-situ mulch Mulch is produced in place by growing a cover crop (Fig 16), a strip of grass, or a hedge of perennial shrubs and trees that can be regularly pruned. Prunings are used as mulch. Problems arise from competition with food crops and labour demand (see Agroforestry section). Crop residue (from the previous crop) mulch is often applied in no-till or minimum tillage systems. Availability for soil conservation is limited due to competing uses as fodder, source of fuel and for fencing, construction (roofing) and other purposes. Furthermore, phytosanitary (e.g. stem borer infestations etc.) reasons imply sometimes the burning of crop residues.
Fig 16. In Honduras, hillside farmers have adopted a rotation of corn with mucuna (Stizolobium deeringiana) which is a fast-growing legume cover crop. Mucuna is planted about 50 days after corn and covers the entire field once corn is harvested. Additional benefits include biological N fixation and weed suppression.
Brought-in mulch The mulch material may be grown (high-yielding grass, perennial shrub) in an adjacent area, cut and brought in as needed. Other materials brought in are farmyard manure, compost, and by-products of agro-based industries such as sawdust and rice husk. Problems involved are the high cost of transport and distribution, and possible nutritional disorders in some crops (notably by N-immobilisation, high C/N ratio in the mulch material). Special mulch A wide range of inorganic materials (gravel, flood water in rice) and synthetic products (polythene sheets, soil conditioners) are being used as mulch for erosion control with mixed results. Reduction of raindrop impact is often counterbalanced by increased runoff generation (plastic and gravel mulch), unless special measures are used such as perforated (seep holes) plastic sheets. 2.4.3 Increasing shearing resistance of soil The magnitude of the effects of applying organic mulch to improving soil structure varies depending on soil, mulch material and crop management practices. They are often transient and easily eliminated by an intensive land use. Soil conditioners such as synthetic polymers improve structural stability of soil by coating of single particles or bonding
Tropical Agroecosystem Function, Kühne, SS 08 U6-8 Erosion by water and wind p. 22
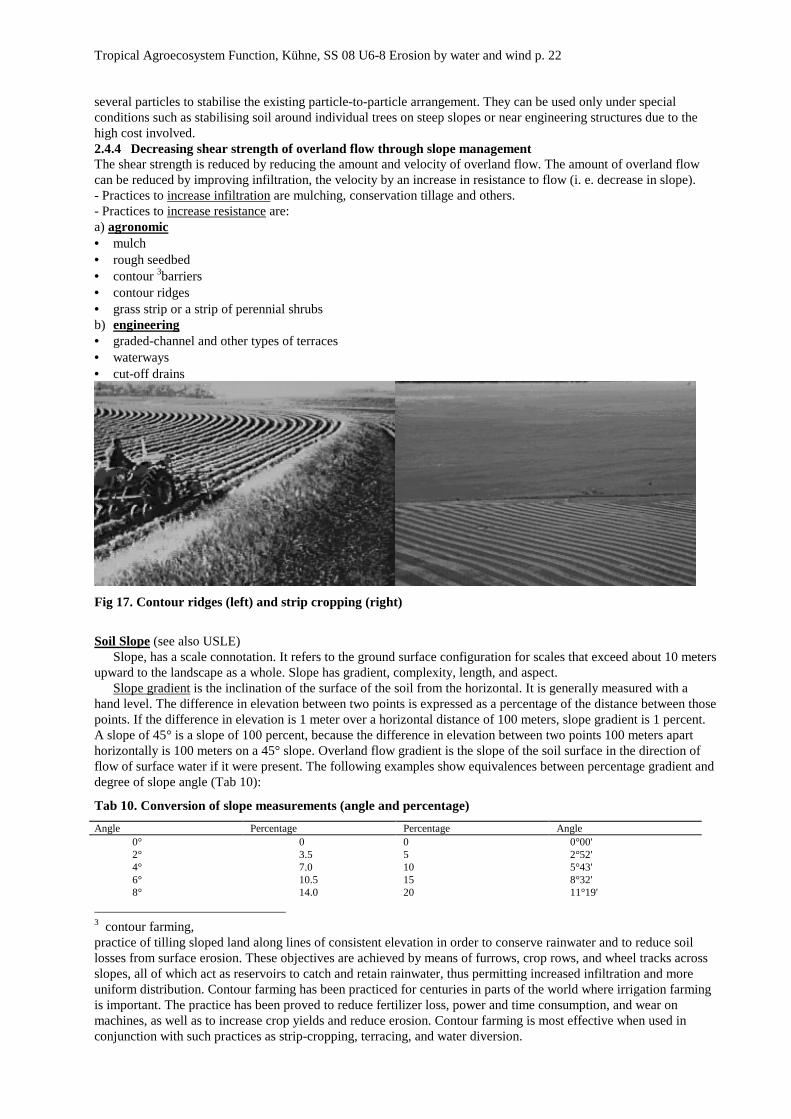
several particles to stabilise the existing particle-to-particle arrangement. They can be used only under special conditions such as stabilising soil around individual trees on steep slopes or near engineering structures due to the high cost involved. 2.4.4 Decreasing shear strength of overland flow through slope management The shear strength is reduced by reducing the amount and velocity of overland flow. The amount of overland flow can be reduced by improving infiltration, the velocity by an increase in resistance to flow (i. e. decrease in slope). - Practices to increase infiltration are mulching, conservation tillage and others. - Practices to increase resistance are: a) agronomic • mulch • rough seedbed • contour 3barriers • contour ridges • grass strip or a strip of perennial shrubs b) engineering • graded-channel and other types of terraces • waterways • cut-off drains
Fig 17. Contour ridges (left) and strip cropping (right)
Soil Slope (see also USLE)
Slope, has a scale connotation. It refers to the ground surface configuration for scales that exceed about 10 meters upward to the landscape as a whole. Slope has gradient, complexity, length, and aspect.
Slope gradient is the inclination of the surface of the soil from the horizontal. It is generally measured with a hand level. The difference in elevation between two points is expressed as a percentage of the distance between those points. If the difference in elevation is 1 meter over a horizontal distance of 100 meters, slope gradient is 1 percent. A slope of 45° is a slope of 100 percent, because the difference in elevation between two points 100 meters apart horizontally is 100 meters on a 45° slope. Overland flow gradient is the slope of the soil surface in the direction of flow of surface water if it were present. The following examples show equivalences between percentage gradient and degree of slope angle (Tab 10):
Tab 10. Conversion of slope measurements (angle and percentage)
Angle Percentage Percentage Angle 0° 0 0 0°00' 2° 3.5 5 2°52' 4° 7.0 10 5°43' 6° 10.5 15 8°32' 8° 14.0 20 11°19'
3 contour farming, practice of tilling sloped land along lines of consistent elevation in order to conserve rainwater and to reduce soil losses from surface erosion. These objectives are achieved by means of furrows, crop rows, and wheel tracks across slopes, all of which act as reservoirs to catch and retain rainwater, thus permitting increased infiltration and more uniform distribution. Contour farming has been practiced for centuries in parts of the world where irrigation farming is important. The practice has been proved to reduce fertilizer loss, power and time consumption, and wear on machines, as well as to increase crop yields and reduce erosion. Contour farming is most effective when used in conjunction with such practices as strip-cropping, terracing, and water diversion.
Tropical Agroecosystem Function, Kühne, SS 08 U6-8 Erosion by water and wind p. 23
10° 17.6 25 14°02' 12° 21.2 30 16°42' 15° 26.8 35 19°17' 20° 36.4 40 21°48' 25° 46.6 50 26°34' 30° 57.7 60 30°58' 35° 70.0 70 34°59' 40° 83.9 80 38°39' 45° 100.0 90 41°59' 50° 119.2 100 45°00'
Slope complexity refers to surface form on the scale of a mapping unit delineation. In many places internal soil properties are more closely related to the slope complexity than to the gradient. Slope complexity has an important influence on the amount and rate of runoff and on sedimentation associated with runoff. Complex slopes are groups of slopes that have definite breaks in several different directions and in most cases markedly different slope gradients within the areas delineated.
Slope length has considerable control over runoff and potential accelerated water erosion. Terms such as "long" or "short" can be used to describe slope lengths that are typical of certain kinds of soils. If such terms are used, they are defined locally. For observations at a particular point, it may be useful to record the length of the slope that contributes water to the point in addition to the total length of the slope. The former is called point runoff slope length. The sediment transport slope length is the distance from the expected or observed initiation upslope of runoff to the highest where deposition of sediment would be expected to occur. This distance may be less than or more than the point runoff slope length.
Slope aspect is the direction toward which the surface of the soil faces. The direction is expressed as an angle between 0° and 360° (measured clockwise from true north) or as a compass point such as east or north-northwest. Where slope aspect is a principal variable, it may affect soil temperature, evapotranspiration, and winds received.
Tab 11. Classification of conservation works according to their purpose (adapted from Hudson, 1992)
Main objective Function Type of terrace or barrier Soil management To modify soil slope Bench terraces To slowly reduce soil slope Progressive terracing To contain erosion with low inputs Ladder terraces Trash lines To contain erosion with minimal earth-moving on
steep slopes Step terraces
Hillside ditches Intermittent terraces Water management To multiply effective rainfall Conservation bench terraces Run-on level terraces To catch and hold all the run-off Absorption ridges To absorb some run-off with emergency overflow Contour furrows, Contour bund To control unavoidable run-off Graded channel terraces To control reduced run-off Ridging, Tied-ridging To reduce the velocity of run-off and promote
infiltration Strip cropping Grass strips Permeable barriers
Crop management To provide level areas on steep slopes, or to ease cultivation according to whether by hand, ox or machine
Step terraces Hillside ditches Orchard terraces Platforms
To ease harvesting according to whether the crop is heavy, damageable, harvested regularly or seasonally
Footpaths and farm tracks associated with orchard terraces or hillside ditches
Drainage for crops which suffer from ‘wet feet’ Ridges on 2 % grade for tobacco Up and downslope beds for yams Small open drains up to 15 % for
teff Selected aspects of terracing and farming practices for steep land (Tab 11Tab 12Tab 13).

Tropical Agroecosystem Function, Kühne, SS 08 U6-8 Erosion by water and wind p. 24
Fig 18. Types of terraces for different slopes (Hudson 1992, p153)
Fig 19. (Rice) Terraces in steep land
Fig 20. Cross sections of terraces.

Tropical Agroecosystem Function, Kühne, SS 08 U6-8 Erosion by water and wind p. 25

Tropical Agroecosystem Function, Kühne, SS 08 U6-8 Erosion by water and wind p. 26
Hudson (1992) uses the term ‘cross-slope barriers’ to embrace the whole range of terraces, ditches, drains, and banks used to manage run-off or soil loss on sloping land with the main purpose to reduce slope (Fig 17, Fig 18, Fig 19, Fig 20, Fehler! Verweisquelle konnte nicht gefunden werden., Fig 22). Any form of cross-slope barrier will have some terracing effect by holding up the downslope movement of soil and water. The movement of soil as a result of cultivation is often more important than by erosion in forming terraces. Forms of terracing: Bench terraces and their variations have been used for generations on every continent (see Fig 19, Fig 20, Fehler! Verweisquelle konnte nicht gefunden werden.). A short account on size and spacing of bench terraces follows as an example for design factors. Width of terrace: For ease of cultivation the desirable width will depend on the degree of mechanization In general, cultivation will be easier as the width of terraces increases. However, the depth of soil limits how deeply the terrace can be cut into the hillside without exposing unfertile subsoil: For a given slope, a greater depth of soil allows wider terraces. Furthermore, the width for a given depth of cut is also related to the slope steepness: For a given soil depth, a gentler slope allows wider terraces (Tab 12). Protection of the riser vs. loss of land:
Provided that it were possible to have vertical risers (e.g. stone walls, but labour intensive) and cultivation to the edge of the terrace there would be no loss of land by terracing. But few soils are sufficiently stable to allow for unsupported vertical risers. A sloping riser means that their is some loss of cultivated land area, unless the riser is protected by a useful crop (fodder grass, fruit trees or fodder bushes planted on the edge of the terrace. Earth moving a) Wider terraces mean more earth moving. The volume is proportional to (width/2)² b) Outward-sloping terraces mean less earth-moving than with a horizontal bench. However, outward sloping bench
terraces are more likely to spill over the terrace edge than level terraces. c) Intermittent terracing: For some form of land use ( larger tree crops: oil palm, rubber, etc.) it may be sufficient to
construct terraces at intervals down the slope while retaining the original slope between terraces (orchard terraces). Anther form of intermittent terraces is hillside ditches. They may be on grade to lead off excess run-off, or level to encourage infiltration, or with cross-bars in the ditch to further increase the retention (called lock-and-spill drains).
Gradient of terraces Bench terraces are most commonly level both across the width and along the contour. If there is a danger of downhill slides on unstable soils the surface run-off can be increased by giving a gentle grade along the terrace, and a slight backslope so that each terrace acts as a shallow channel. The water has to be safely discharged at the end of the terrace (difficult on steep slopes !).
Tab 12 Guide to design and construction of bench terraces with 1 m vertical interval (FAO 1979)
Ground slope (%) 5 10 15 20 25 30 35 Width of benches 18.5 8.5 5.2 3.5 2.5 1.8 1.4 Total width of bench terraces (m) 20 10 6.7 5 4 3.3 2.9 Number of benches per 100 m of slope 5 10 15 20 25 30 35 Area of benchesa per ha (%) 92 85 77 70 62 55 47 Slope area of riser per ha (m²) 919 1838 2758 3667 4596 5515 6434 Maximum depth of cut (cm) 47 45 42 40 37 35 32 Volume of cut per ha of bench terraces (m³) 1175 1135 1077 1020 963 903 847 a available for cultivation
2.4.5 Alternative (cheap, simple or labour saving) practices to form terraces Simple less effective erosion control measures are limited to gentle slopes since erosion hazard increases with slope (Tab 13). a) Ladder terraces (traditional, Tanzania) Terraces are made by weeds and crop residues laid in rows approximately on the contour and covered by soil drawn down from the upper side. The high organic matter content, free-draining of the soil, and changed profile of the slope are effective in controlling erosion. b) Stopwash lines or trash lines (Ethiopia, east and southern Africa) Similar to ladder terraces. Stopwash lines include loose stones collected from nearby. Trash lines consist only of lines of weeds and crop residues without being earthed over. A and b will be washed away by heavy run-off generated on steep slopes.

Tropical Agroecosystem Function, Kühne, SS 08 U6-8 Erosion by water and wind p. 27
Tab 13. Comparitive effects of stone lines and buffer strip cropping on runoff and erosion from a soil at Allokoto, Niger (Delwaulle, 1973)
Treatment Runoff, % of rainfall Erosion, t / (ha*yr) Control (traditional hoe) 17.6 9.5 Buffer strips (contour plowing, ridging, weeding) 5.2 1.1 Stone lines (contour plowing, ridging, weeding) 3.8 0.5 Earth dykes with stones (contour plowing, ridging, weeding) 0.9 0.2 Strip cropping
This means dividing the land into alternate strips of closely grown erosion-resistant vegetation (grass, grass-legume mixtures, small grains or natural vegetation) with strips of crops, which are economically important but which do not control erosion (maize, sorghum, cotton and root crops). Strip cropping is generally applied in combination with tillage and soil conditioning practices. Strip cropping can be applied in various ways such as. A) Rotation field strip cropping. This involves alternate strips of equal width which are planted or are left as natural
grassland. After one or two years the strips are rotated in land use. Suitable land should have slopes that are not too steep (up to about 5%); and the strips should be about 10-20 m wide. Rotational field strip cropping is simple and inexpensive to apply and can be done with animal traction or by tractor.
B) Buffer strip cropping. The grass strips between the arable strips are permanent. The grass strips can be fairly narrow (up to 3 m) whereas the arable strips will have a wider width (10-20 m depending on land conditions). Both a layout of the grass strips along the contours and an incorporation of these strips in terracing works are advised. Planting strips of grass (famous example: Napier grass Pennisetum pupureum) on the contour can reduce erosion on any slope. Narrow strips at close intervals down the slope are more effective than broader strips spaced more widely, but competition with crops increases by the former technique. Requirements: vigorous growth, easy propagation, good quantity of palatable fodder, but not invasive into the crop area. Alternatives to producing fodder : plants yielding essentials oils such as vetiver, citronella, and lavender to produce income (not browsed by cattle fed on harvest residues -> reduced risk of damage to the strips).
C) Contour strip cropping (Fig 17) This is characterized by • The cropping is done as nearly as possible on the contour. • Tillage and planting are also done on the contour • Crop rotation is done on the strips. Skilled personnel and farmers are necessary to realise the layout and cultivation. Alley cropping, contour hedgerows: Alternate strips of crops with woody shrubs or trees are effective at reducing erosion on steep slopes in the Philippines by forming ‘induced or natural terraces’ ( Fehler! Verweisquelle konnte nicht gefunden werden.). 2.4.6 Water disposal (cut-off drain, waterways) Methods for erosion control are affected by the problems of safe disposal of surface run-off. On steep slopes water runs downhill faster (velocity is proportional to the square root of the slope), the flow concentrates quickly into channels and rills (further increase in velocity!), and the flow is turbulent. Therefore, the capacity of the water to erode (erosive power is proportional to the velocity squared) soil and transport it increases (quantity of a given size which can be carried by a water flow is proportional to the fifth power of its velocity, the maximum size of particle which can be pushed or rolled is proportional to the sixth power of velocity). Thus, water flowing down steep slopes can be very destructive and it may be necessary to intercept it in a well designed and maintained cut-off drain (stormwater drain). It still has to be discharged somewhere via well designed and maintained waterways (Fig 21) (grassed waterways, reinforced - by geotextiles, stone-linings, and concrete reinforcement products - waterways, drop structures to reduce channel gradient).
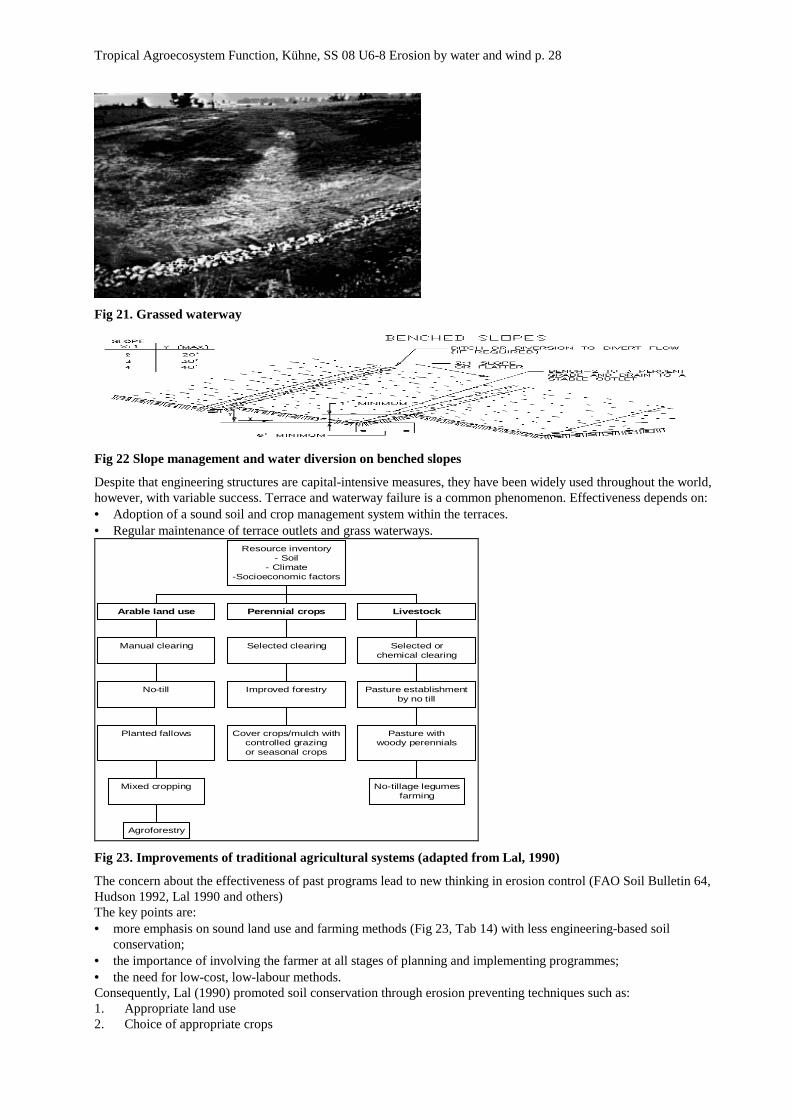
Tropical Agroecosystem Function, Kühne, SS 08 U6-8 Erosion by water and wind p. 28
Fig 21. Grassed waterway
Fig 22 Slope management and water diversion on benched slopes
Despite that engineering structures are capital-intensive measures, they have been widely used throughout the world, however, with variable success. Terrace and waterway failure is a common phenomenon. Effectiveness depends on: • Adoption of a sound soil and crop management system within the terraces. • Regular maintenance of terrace outlets and grass waterways.
Agroforestry
Mixed cropping
Planted fallows
No-till
Manual clearing
Arable land use
Cover crops/mulch withcontrolled grazingor seasonal crops
Improved forestry
Selected clearing
Perennial crops
No-tillage legumesfarming
Pasture withwoody perennials
Pasture establishmentby no till
Selected orchemical clearing
Livestock
Resource inventory- Soil
- Climate-Socioeconomic factors
Fig 23. Improvements of traditional agricultural systems (adapted from Lal, 1990)
The concern about the effectiveness of past programs lead to new thinking in erosion control (FAO Soil Bulletin 64, Hudson 1992, Lal 1990 and others) The key points are: • more emphasis on sound land use and farming methods (Fig 23, Tab 14) with less engineering-based soil
conservation; • the importance of involving the farmer at all stages of planning and implementing programmes; • the need for low-cost, low-labour methods. Consequently, Lal (1990) promoted soil conservation through erosion preventing techniques such as: 1. Appropriate land use 2. Choice of appropriate crops

Tropical Agroecosystem Function, Kühne, SS 08 U6-8 Erosion by water and wind p. 29
3. Early planting (early plant cover) 4. Suitable variety (canopy characteristics) 5. Good crop stand and an optimum plant population (plant cover) 6. Balanced fertiliser application 7. Adequate weed control 8. Control of insects and diseases (6-8 vigorous growth, good cover) 9. Crop-harvesting methods (to avoid compaction, crusting) 10. Crop rotations and cropping systems 11. Crop residue and management in short: good farming
Tab 14. Reported rates of erosion in tropical forest and tree crop systems (Wiersum, 1984)
Land use systems Erosion [t/(ha yr)] Minimum Median Maximum Multistory tree gardens 0.01 0.06 0.14 Natural rain forest 0.03 0.30 6.16 Shifting cultivation, fallow period 0.05 0.15 7.40 Forest plantations, undisturbed 0.02 0.58 6.20 Tree crops with cover crop or mulch 0.10 0.75 5.60 Shifting cultivation, cropping period 0.40 2.78 70.05 Taungya, cultivation period 0.63 5.23 17.37 Tree crops, clean weeded 1.20 47.60 182.90 Forest plantations, burned or litter removed 5.92 53.40 104.80
Fig 24. Crop residue
2.5 Modeling (water-erosion) 2.5.1 Excursus Model Considerations - Example WEPP, USA (Example WEPP, for extension personnel in the USA. Information extracted from http://soils.ecn.purdue.edu:20002/~wepp/weppfaq/weppfaq.html).
The primary application of erosion prediction technology will be by field personnel who will be using the procedure as a tool to assist land managers in making soil conservation decisions. Major factors important to these users are: (A) computational time, (B) ease of use, (C) applicability to the broad range of conditions typically encountered in field programs, (D) robustness, (E) validity, and (F) ease of explanation to client. (A) Computational time
Developers of the procedure are to strive for computational efficiency and to have the procedure operate as quickly as possible. The procedure is to compute the frequency distribution of annual soil loss values for the profile version at the rate of one management practice per minute and one practice per two minutes for the watershed version running a single overland flow profile and a single concentrated flow channel. The rate can be proportionally slower for more complex systems. Also, not more than 30 minutes per farm of actual user time (computer time can be longer) is to be required in the office to prepare and assemble needed information before going to the field. Once in the field, no more time can be used to collect and assemble input information than would be required for the USLE when the profile version is used. The criteria to be used by the developers for judging the acceptability of an internal simplification in the procedure are: (a) does the planning or assessment decision change -- if not, use the

Tropical Agroecosystem Function, Kühne, SS 08 U6-8 Erosion by water and wind p. 30
procedure that requires the least resources -- and do computed values for the primary output variable change more than 10 percent -- if they do, is the change of consequence? (B) Ease of Use
The procedure shall be easy to use, especially for the infrequent user, by accepting simple inputs that are commonly available and understood by personnel in the local field office. It should require little structured training or support. Also, it shall be flexible and accept inputs on increasing detailed and complex levels if the user determines that more detail is needed or that default values need changing. The user shall not have to directly manipulate any mathematical equations to use the procedure; all mathematical manipulations shall be done by a computer program. The procedure is to be designed so that a maximum amount of computations can be made once-and-for-all and stored for repeated use. Likewise, the procedure shall be constructed so that data files specific to a given local area can be prepared and stored locally so that the field office user only has to search and retrieve minimal data with each application. In so far as possible, the procedure shall use data and data files used in other applications, and it should be compatible with Geographic Information Systems (GIS). The output should display in an easily understood form the consequence of alternative management options. (C) Applicable to Broad Range of Conditions
The procedure, within the limits defined by this document, must apply to all sheet-rill erosion problems that local field office personnel encounter. In particular, it must apply to all conditions covered by the USLE plus additional ones. Similarly, this requirement also applies to all concentrated flow erosion situations, but the procedure is not for hydraulic design of waterways. (D) Robustness
The procedure must tolerate out-of-range input data and combinations of inputs that might cause problems. The procedure should use asymptotic, "well behaved" functions to avoid extremely incorrect values and the procedure unexpectedly "blowing up". However, the procedure must alert the user to these excesses, alert for loss of accuracy when inputs are over simplified such as for slope shape, and check for incorrect data entries. The procedure should alert the user to the possibility of obtaining "additional" information with more detailed inputs. (E) Validity
The procedure must be sufficiently accurate to lead to the planning and assessment decision that would be made in the large majority of cases when full information is available. However, more than accuracy is to be considered in establishing the validity of the procedure. The procedure is to be validated, and the validation process and its results are to be documented. The prediction procedure is expected to be composed of a number of modules. Each major module is to be individually validated, and the procedure is to be validated as a package. Validation is to be based on the procedure meeting all of the following criteria. (a) The model is valid if it serves its intended purpose as defined by these specific User Requirements. (b) The model is based on scientific principles and represents a reasonable expression of current scientific understanding of erosion processes that can be used in an applied procedure. (c) The procedure gives expected responses that appear reasonable. For example, the output varies qualitatively with ground cover (or any variable or combination of variables) in the way that is commonly accepted by erosion experts. (d) The model gives results that are more useful for agency program objectives than those given by the USLE and applies to situations not appropriate for the USLE. These situations include deposition in furrows, especially as influenced by plant residue in the furrows; nonuniform distribution of cover between ridges and furrows; the acceleration of rill erosion above a critical steepness; the variation in slope length, slope steepness, ground cover, and contouring relationships with climate, soil, topography, and land use; erosion by surface irrigation; deposition on concave slopes; and concentrated flow erosion. (e) The model provides a reasonable representation of data covering the range of conditions of the "key" situations described above. (f) Judgements on the "goodness of fit" of the estimates from the procedure to observed data are to be based on the data sets as a whole and not on a few specific and isolated data sets. Quantitative measures of the "goodness of fits" will be calculated and presented, but a specific quantitative level of accuracy figure is not being required because of the great variation in the experimental data that will be used in validation. However, the results are to be at least as good with respect to observed data and known relationships as those from the USLE. (g) The model is able to "stand up" in public hearings of management plans and assessments. (F) Ease of explanation The procedure is to be based on a set of principles and concepts that can be explained by local field personnel to the client. The procedure is to be developed so that the user can easily demonstrate how the major factors of climate, soil, topography, and land use affect erosion.
2.5.2 Excursus General requirements - Example WEPP, USA) The general requirements are: A) Size area B) Required erosion, deposition, and sediment yield estimates C) Major factors D) Applicability E) Other general requirements
Tropical Agroecosystem Function, Kühne, SS 08 U6-8 Erosion by water and wind p. 31
A)Size area The erosion prediction procedure from this project is to apply to "field-sized" areas or conservation treatment
units. Although the size of a particular field to which the procedure applies will vary with degree of complexity within a field, the maximum size "field" is about a section (640 acres). However, the procedure will not apply to agricultural fields or watersheds having incised, permanent channels such as classical gullies and stream channels. The channels that the procedure is to include are those farmed over and known as concentrated flow or "cropland ephemeral gullies". Also, the procedure is to apply to constructed waterways like terrace channels and grassed waterways. In rangeland and forest applications, "fields" can include gullies up to the size of typical concentrated flow gullies in 640 acre cropland fields. These channels are on the order of about 3 to 6 ft in width by about 3 ft deep. The procedure is not expected to apply to headcut erosion, sloughing of gully sidewalls, or the effects of seepage on erosion in concentrated flow channels. B) Required erosion, deposition, and sediment yield estimates
The procedure is to compute: (a) sheet-rill erosion and deposition by overland flow along selected landscape profiles or over an entire field, (b) concentrated flow (ephemeral gully) erosion along selected channels or over the entire channel network within a field, and (c) sediment yield and its sediment characteristics from selected watersheds within the field or at all outlet points from the field. To meet these requirements, the procedure is expected to include three basic versions: (a) a representative landscape profile version, (b) a watershed version, and (c) a grid version that covers the entire field. In these User Requirements, "fineness" refers to sediment characteristics. In general, fineness can be an enrichment ratio based on specific surface area. However, at the request of the user, the procedure is to compute erosion, deposition, and transport for a minimum of five sediment particle classes that can vary by diameter, density, and composition by primary particles and organic matter. Estimates from the water erosion prediction procedure should be in a form with respect to space and time that will allow their combination with estimates from wind erosion prediction procedures to support evaluations of the combined effects of wind and water erosion. This requirement can be met by computing average annual erosion rates at any point in the field. C) Major factors
The procedure is to describe the influence on erosion, deposition, and sediment yield of the major factors: (a) climate, (b) soil, (c) topography, (d) cropping-management, and (e) supporting practices. The last two factors describe land use. D) Applicability
Ultimately the procedure is to apply to all U.S. locations including Alaska, Hawaii, and Puerto Rico. Furthermore, the procedure should be developed with the goal that it will apply worldwide. The procedure is to be process based to meet this broad range of applicability. In particular, the effects of cropping and management will be described by a component structure based on canopy, ground cover, roughness, soil consolidation, and similar components. This project will provide the basic relationships to meet this requirement, but field application of the procedure will depend on the availability of parameter values. This project will determine parameter values for a set of "key" soils, crops, management, tillage, and supporting practices specified in a later section. E) Other general requirements
The prediction technology must be easy to use with easily understood guidelines. Also, it must use minimal and easily obtained inputs, which are specified in a later section. When applied to conservation planning, the procedure must be portable for use in the office, truck, field, or client's house. The procedure when implemented on a computer should be accessible by telephone if the user desires special features or data not available in a "standard" field version. 2.5.3 Excursus Structure - Example WEPP, USA The model is to be based on the fundamental erosion processes of: (a) interrill erosion (principally detachment by raindrop impact and lateral transport by thin flow), (b) rill and concentrated flow erosion (detachment by flow), (c) sediment transport by flow, (d)deposition by flow, (e) deposition in depressions, and concentrated flow hydraulics. The model is expected to include major modules for: (a) climate generation; (b) snow accumulation, (c) snowmelt, (d) infiltration, (e) runoff, (f) soil temperature, (g) erosion, (h) soil moisture, (i) crop growth, (j) plant residue, and (k) tillage. Implicit in all of these modules except for the climate module is the central role of soil and soil properties. Although the model will include these modules, it is NOT intended to be used specifically as a model for crop yield, water quality, soil moisture, runoff, stochastic (random) climate variables, wind erosion, or erosion and sediment yield from classical gullies, stream channels, or large complex watersheds. Hydrologic Elements
Hydrologically, the model is to apply to conditions where overland flow is significant, and runoff and erosion is not dominated by "partial area" hydrology. The model will consider lateral subsurface flow and baseflow using a simple travel time approach that takes position on the landscape into account. It will consider vertical water movement in the root zone and tile drainage only to the extent needed to compute surface runoff sufficiently accurate for erosion computations. The hydrologic elements will be: (a) overland flow (broad sheet flow and concentrated flow in "furrows"), (b) concentrated flow in major natural and constructed waterways (ephemeral gullies plowed

Tropical Agroecosystem Function, Kühne, SS 08 U6-8 Erosion by water and wind p. 32
over within the crop rotation, terrace and diversion channels, grassed waterways, and rangeland gullies comparable to within-field concentrated flow channels), (c) small impoundments (underground tile outlet terrace impoundments, level terraces without outlets, water and sediment control basins, within-field natural impoundments, farm ponds, and other similar within-field structures and features), (d) simple return, lateral, and base flow, and (e) simple tile drainage. Similarities with Other Models WEPP as compared to other modeling approaches: source: http://soils.ecn.purdue.edu/~wepphtml/wepp/wepptut/jhtml/advdisb.html I. USLE (Universal Soil Loss Equation) A. Principal application 1. Compute soil loss in conservation planning and inventories 2. Compute soil loss to use to estimate yield for off-site sedimentation and water quality evaluations B. Major similarities 1. Computes sheet - rill erosion from rainfall 2. Computes average annual soil loss from eroding portions of the landscape 3. Planning and assessment tool for use by field, state, and national office agency personnel 4. Similar inputs C. Major differences 1. Model structure a. USLE empirical and lumped b. WEPP process based c. WEPP computes by storm 2. Additional computational features of WEPP a. Deposition in furrows, on concave slopes, at edges of a landuse change, and in concentrated flow channels b. Concentrated flow erosion c. Grid version of WEPP allows computations over a field II. CREAMS (A field scale model for Chemicals, Runoff, and Erosion from Agricultural Management Systems) A. Principal application 1. Water quality analyses for field sized areas B. Major similarities 1. Model structure similar but CREAMS more detailed 2. Provide similar hydrologic and erosion estimates 3. Both operate on individual storms 4. WEPP profile and watershed versions and CREAMS model field representations are the same C. Major differences 1. User environment a. CREAMS is not intended for day-to-day field operations 2. WEPP does not compute chemical movement 3. CREAMS algorithms are more detailed and thus more powerful 4. CREAMS uses older technology including SCS curve number runoff prediction method and USLE factors (Note: CREAMS is structured so that components can be and are being changed) 5. CREAMS is primarily intended to operate as a continuous simulation model 6. CREAMS is limited to a single crop in a "field" 7. CREAMS has no comparable "grid" model III. EPIC (Erosion/Productivity Impact Calculator) A. Principal applications 1. Calculate the loss of crop yield from erosion B. Major similarities 1. Model components are similar but EPIC much more detailed except for erosion component 2. Operate on individual storms C. Major differences 1. Thrusts of models a. EPIC emphasizes the impact of erosion on change in soil and its impact on productivity b. Main thrust of WEPP is in its erosion estimates as affected in detail by climate, soil, topography and land use 2. EPIC is not intended for day-to-day field operations 3. EPIC is a continuous simulation model 4. EPIC requires more detailed inputs

Tropical Agroecosystem Function, Kühne, SS 08 U6-8 Erosion by water and wind p. 33
5. EPIC applies to a point on the landscape and thus does not consider sediment transport, deposition or concentrated flow erosion IV. SWRRB (Simulator for Water Resources in Rural Basins) A. Principal applications 1. Efficient computation of sediment yield from small to large, complex watersheds B. Major similarities 1. Model structure of both estimate sediment yield when SWRRB is applied to WEPP sized areas 2. Both operate on individual storms 3. Both require similar inputs C. Major differences 1. Model thrusts a. SWRRB mainly is to deal with sediment yield from large, complex watersheds b. WEPP deals in detail with erosion and deposition within a field 2. Erosion relationships in WEPP are more process based: SWRRB hydrology and erosion relationships are from the SCS curve number method and the USLE 3. WEPP has very limited routing capability 4. WEPP is aimed to a field user V. SPUR (Simulation of Production and Utilization of Rangelands) A. Principal application 1. Evaluation of impact of alternative range management practices B. Major similarities 1. Model Structure 2. Both estimate sediment yield 3. Both operate on single storms C. Major differences 1. Model thrusts a. SPUR has an elaborate plant growth model that considers species interaction and response to environment but is limited to rangeland b. SPUR has an animal and economics component c. SPUR is more elaborate and has a complex watershed version 2. Erosion relationships in WEPP are more process based 3. WEPP is aimed to a field user VI. ANSWERS (Areal Nonpoint Source Watershed Environment Response Simulation) A. Principal application 1. Watershed planning for erosion and sediment yield control on complex watersheds 2. Water quality analysis associated with sediment associated chemicals B. Major similarities 1. Process based 2. Event based 3. Grid topography representation C. Major differences 1. ANSWERS is primarily limited to single storm 2. ANSWERS has limited capability for concentrated flow erosion 3. ANSWERS is a fully dynamic model VII. AGNPS - field scale version (Agricultural Nonpoint Source Pollution Model) A. Principal application 1. Analysis of nonpoint source pollution from agricultural fields B. Major similarities 1. Grid based topographic representation 2. Process and hydrologically driven 3. Considers multiple particle classes C. Major differences 1. AGNPS relies on older hydrologic and erosion prediction technology 2. AGNPS has limited capabilities for estimating concentrated flow erosion VIII. SEDIMOT II (SEdimentology by DIstributed MOdel Treatment)
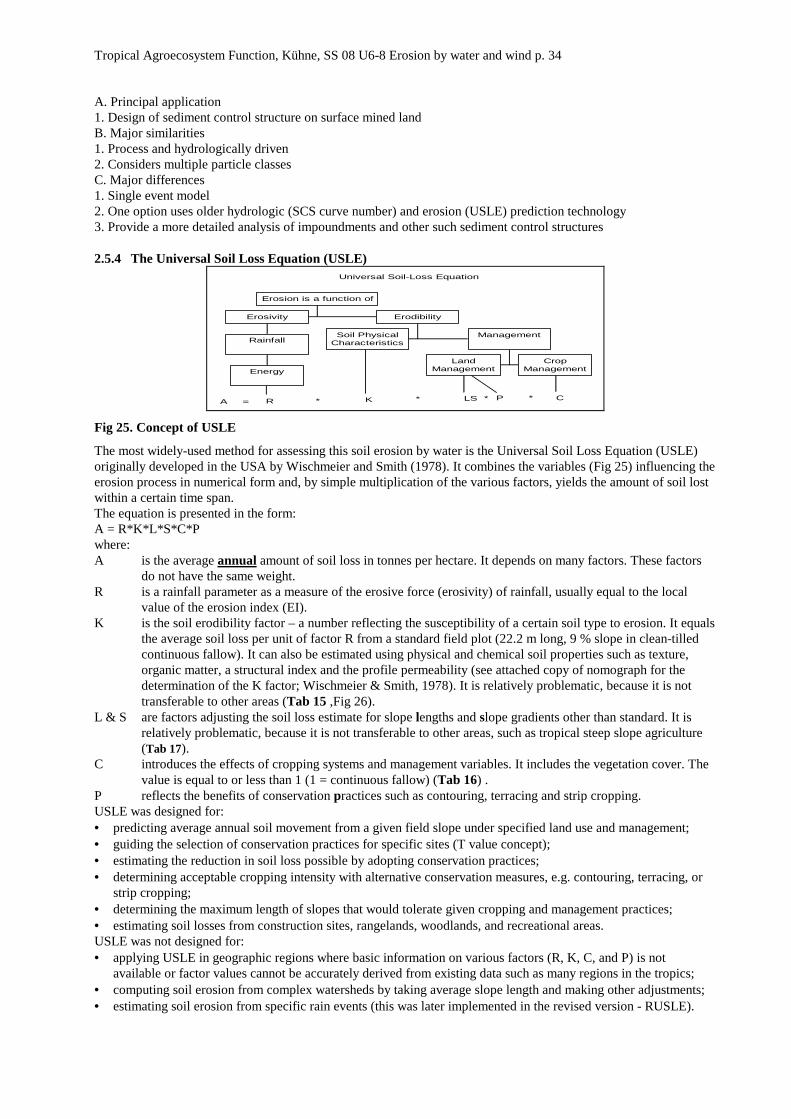
Tropical Agroecosystem Function, Kühne, SS 08 U6-8 Erosion by water and wind p. 34
A. Principal application 1. Design of sediment control structure on surface mined land B. Major similarities 1. Process and hydrologically driven 2. Considers multiple particle classes C. Major differences 1. Single event model 2. One option uses older hydrologic (SCS curve number) and erosion (USLE) prediction technology 3. Provide a more detailed analysis of impoundments and other such sediment control structures
2.5.4 The Universal Soil Loss Equation (USLE) Universal Soil-Loss Equation
R * K * LS P* C*A =
Energy
Rainfall
Erosivity
Soil PhysicalCharacteristics
LandManagement
CropManagement
Management
Erodibility
Erosion is a function of
Fig 25. Concept of USLE
The most widely-used method for assessing this soil erosion by water is the Universal Soil Loss Equation (USLE) originally developed in the USA by Wischmeier and Smith (1978). It combines the variables (Fig 25) influencing the erosion process in numerical form and, by simple multiplication of the various factors, yields the amount of soil lost within a certain time span. The equation is presented in the form: A = R*K*L*S*C*P where: A is the average annual amount of soil loss in tonnes per hectare. It depends on many factors. These factors
do not have the same weight. R is a rainfall parameter as a measure of the erosive force (erosivity) of rainfall, usually equal to the local
value of the erosion index (EI). K is the soil erodibility factor – a number reflecting the susceptibility of a certain soil type to erosion. It equals
the average soil loss per unit of factor R from a standard field plot (22.2 m long, 9 % slope in clean-tilled continuous fallow). It can also be estimated using physical and chemical soil properties such as texture, organic matter, a structural index and the profile permeability (see attached copy of nomograph for the determination of the K factor; Wischmeier & Smith, 1978). It is relatively problematic, because it is not transferable to other areas (Tab 15 ,Fig 26).
L & S are factors adjusting the soil loss estimate for slope lengths and slope gradients other than standard. It is relatively problematic, because it is not transferable to other areas, such as tropical steep slope agriculture (Tab 17).
C introduces the effects of cropping systems and management variables. It includes the vegetation cover. The value is equal to or less than 1 (1 = continuous fallow) (Tab 16) .
P reflects the benefits of conservation practices such as contouring, terracing and strip cropping. USLE was designed for: • predicting average annual soil movement from a given field slope under specified land use and management; • guiding the selection of conservation practices for specific sites (T value concept); • estimating the reduction in soil loss possible by adopting conservation practices; • determining acceptable cropping intensity with alternative conservation measures, e.g. contouring, terracing, or
strip cropping; • determining the maximum length of slopes that would tolerate given cropping and management practices; • estimating soil losses from construction sites, rangelands, woodlands, and recreational areas. USLE was not designed for: • applying USLE in geographic regions where basic information on various factors (R, K, C, and P) is not
available or factor values cannot be accurately derived from existing data such as many regions in the tropics; • computing soil erosion from complex watersheds by taking average slope length and making other adjustments; • estimating soil erosion from specific rain events (this was later implemented in the revised version - RUSLE).

Tropical Agroecosystem Function, Kühne, SS 08 U6-8 Erosion by water and wind p. 35
Comments: The USLE has been used and tested on single fields, not in watersheds. It is important to understand, that the USLE is an empirical multivariate regression equation, which means that the various factors have been found by relating soil loss taking place in the field to rainfall, slopes, land use etc.
Tab 15. Measured index of erodibility K in West Africa (Roose, 1977)
Location Soil types (a, b) Measured K a) strongly weathered
b) less weathered Max. Min. Value
used No. measures
Adiopodoume (Côte d’Ivoire)
(a) Low-base, saturated ferralic on argillic-sandy tertiary material
0.17 0.05 0.10 24
Agonkamey (Benin)
(a) Medium-based, saturated ferralic on argillic-sandy tertiary material
0.11 0.03 0.10 4
Bouake (Côte d’Ivoire)
(a) Eroded, reworked ferralic on granite 0.16 0.02 0.12 4
Korhogo (Côte d’Ivoire)
(a) Impoverished, reworked ferralic on granite 0.02 0.01 0.02 6
Gampela (Burkina Faso)
(b) Tropical ferruginous on lateritic pan at 20 cm 0.32 0.05 0.25 5
Saria (Burkina Faso)
(b) Tropical ferruginous on lateritic pan at 50 cm 0.28 0.06 0.25 3
Sefa (Senegal)
(b) Leached tropical ferruginous with stains and concretions
0.17 0.05 0.25 2
Tab 16. Vegetal cover factor (C factor of USLE) and cultural techniques in West Africa.
Cultural techniques Annual average C factor Bare continuously fallowed 1 Forest or dense shrub, high mulch crops 0.001 Savanna, prairie in good condition 0.01 Overgrazed savanna or prairie 0.1 Crop cover of slow development or late planting-first year 0.3 - 0.8 Cover crop of rapid development or early planting-first year 0.01 - 0.1 Crop cover of slow development or late planting-second year 0.01 - 0.1 Corn, sorghum, millet (as a function of yield( 0.4 - 0.9 Rice (intensive fertilisation) 0.1 - 0.2 Cotton, tobacco (second cycle) 0.5 - 0.7 Peanuts (as a function of yield and date of planting) 0.4 - 0.8 First year cassava and yam (as a function of date of planting) 0.2 - 0.8 Palm tree, coffee, cocoa with crop cover 0.1 - 0.3 Pineapple on contour (as a function of slope) • (burned residue) 0.2 - 0.5 • (buried residue) 0.1 - 0.3 • (surface residue) 0.01 Pineapple and tied ridging (slope 7%) 0.1
Tab 17. Values of topographic factor LS of USLE for specific combinations of slope length and steepness (Wischmeier & Smith, 1978)
Slope % Slope length (ft)
25 50 75 100 150 200 300 400 500 600 800 1000 0.2 0.060 0.069 0.075 0.080 0.086 0.092 0.099 0.105 0.110 0.114 0.121 0.126 0.5 0.073 0.083 0.090 0.096 0.104 0.110 0.119 0.126 0.132 0.137 0.145 0.152 0.8 0.086 0.098 0.107 0.113 0.123 0.130 0.141 0.149 0.156 0.162 0.171 0.179 2 0.133 0.163 0.185 0.201 0.227 0.148 0.280 0.305 0.326 0.344 0.376 0.402 3 0.190 0.233 0.264 0.287 0.325 0.354 0.400 0.437 0.466 0.492 0.536 0.573 4 0.230 0.303 0.357 0.400 0.471 0.528 0.621 0.697 0.762 0.820 0.920 1.01 5 0.268 0.379 0.464 0.536 0.656 0.758 0.928 1.07 1.20 1.31 1.52 1.69 6 0.336 0.476 0.583 0.673 0.824 0.952 1.17 1.35 1.50 1.65 1.90 2.13 8 0.496 0.701 0.859 0.992 1.21 1.41 1.72 1.98 2.22 2.43 2.81 3.14 10 0.685 0.968 1.19 1.37 1.68 1.94 2.37 2.74 3.06 3.36 3.87 4.33 12 0.903 1.28 1.56 1.80 2.21 2.55 3.13 3.61 4.04 4.42 5.11 5.71 14 1.15 1.62 1.99 2.30 2.81 3.25 3.98 4.59 5.13 5.62 6.49 7.26 16 1.42 2.01 2.46 2.84 3.48 4.01 4.92 5.68 6.35 6.95 8.03 8.98 18 1.72 2.43 2.97 3.43 4.21 3.86 5.95 6.87 7.68 8.41 9.71 10.9 20 2.04 2.88 3.53 4.08 5.00 5.77 7.07 8.16 9.12 10.0 11.5 12.9

Tropical Agroecosystem Function, Kühne, SS 08 U6-8 Erosion by water and wind p. 36
Fig 26 Nomogram to estimate soil erodibility factor K from soil properties
3 Soil erosion by wind Wind erosion means soil detachment and its transport by forces generated by wind (Lal 1990).
Fig 27. Duststorms (left) and sandstorms are a common problem in the Sahel (West-Africa), and can threaten the survival of crops which can be buried in the sand (right)

Tropical Agroecosystem Function, Kühne, SS 08 U6-8 Erosion by water and wind p. 37
Fig 28. Wind erosion on crop land
3.1 Geological erosion Wind action is one of several of the Earth's major erosive forces and produces a variety of erosional and
depositional landforms. Except for arid regions, wind action ranks below mass wasting, running water, waves, and ice in terms of the mass of material transported.
The ability of wind to erode, carry, and deposit sediment is similar to that of water, but air is much less dense than water, which limits its ability to move large particles. Also, the transport energy of wind is generally not confined (as in a river channel), which limits its force through dissipation. Wind action, therefore, is significant only in areas experiencing an arid climatic regime, where fine-grained sediments are not held firmly in place by moisture (cohesion) or vegetation. Erosion by wind action occurs mostly on beaches and in deserts, where there is no continuous groundcover of vegetation. Except for rare high-velocity tornadic winds, air currents can readily move only rock particles less than 2 mm in diameter. Most sand in desert dunes and on beaches is smaller than this, as are the finer silt and clay that blow out of deserts during dust storms (Fig 27). Most desert sand originates in dry watercourses, although some is freed each time fine-grained fractions of soils blow away following climatic changes from humid to arid. Wind can pick up rock particles by the process known as deflation and may thereby create depressions on the land surface. Where winds are strong, particles bounced and rolled along the surface (Fig 29) may abrade and erode rock surfaces as well as polish them. On the dry surfaces of planets such as Mars, and in a few places on Earth, extremely strong winds have carved entire landscapes of elongate, streamlined hills and depressions.
Wind deposits particles of different sizes in different ways. Sand (1/16-2 mm in diameter) forms sand dunes in deserts and on beaches. Silt (1/256-1/16 mm) blows out of deserts and is trapped by vegetation in humid lands or bodies of water immediately downwind. Clay-size sediment (less than 1/256 mm) moves readily and settles out of quiet air, often over distant lands and seas.
The erosive force of wind is described by the terms deflation, the ground or air movement of particles, and abrasion, the wearing effect of transported particles on exposed rock or soil surfaces. Dust storms (deflative phenomena) arise during the dry season in plains areas, where the surface cover of vegetation has been stripped away, or in arid climates. Arable lands are damaged both by the removal of topsoil from the source area (Fig 28) and by the smothering effect of the deposited load (Fig 27). Ancient depositional remnants of successive dust storms are called loess. Sandstorms (abrasive phenomena) occur in deserts and are characterised by a low (5 cm to 1.8 m) cloud of moving sand particles. The amount of sand the wind can carry increases roughly with the cube of the wind velocity.
As wind blows, surface drag causes a logarithmic decrease in its velocity with increasing closeness to the ground (Fig 30). If wind velocity is sufficient -- approximately 5 m/sec at 5 to 10 m high -- surface drag will cause a selective rolling motion of sand grains. Stronger winds cause sand to bounce (saltation), kicking particles up into the airstream, where they are accelerated by higher-velocity winds. Upon striking the surface, the dispersive pressure of these grains further transfers the wind's momentum into the sand bed, leading to a general forward creep of the surface.
Because saltation affects smaller particles more quickly and surface creep of larger particles moves more slowly, wind will often sort the material. In time, dunes may form and move in the direction of the prevailing wind, leaving behind a pebbly surface that often becomes closely packed together, establishing a desert pavement. Recent research suggest that dust deposition may play a significant role for the generation of surface crusting phenomena on sandy soils in the Sahel. Furthermore, long-range transport and deposition of dust is a significant source of nutrients and contributes to the build-up of nutrient rich top soils during fallow phases in semi-arid and subhumid Westafrica.

Tropical Agroecosystem Function, Kühne, SS 08 U6-8 Erosion by water and wind p. 38
3.2 Accelerated soil erosion by wind - processes Similar to water erosion, wind erosion is accelerated by human perturbations, e.g. intensive farming, clean cultivation, excessive and/or unsuited tillage, overgrazing, excessive burning. Marginal farmlands developed in semiarid areas where drought years are common are especially vulnerable. The catastrophe known as the dust bowl occurred in the early 1930s, when a series of dry years coincided with the extension of agriculture to unsuitable lands, and when poor agricultural practices had caused grossly deteriorated conditions on vast areas of midwestern and western farm lands in the USA (Texas, Oklahoma, Colorado, and New Mexico). Dry and denuded lands simply blew away, and the clouds of dust reached as far east as Washington, D.C., dramatising the severity of the crisis. Dust storms result in considerable loss of agricultural topsoil. A combination of drought and dust storms destroyed the top soil and the economy of large areas. Twenty years later, under almost identical conditions, dust storms severely damaged the newly developed wheatlands of Kazakhstan, then in the former USSR.
Tab 18. Processes and factors: erosivity and erodibility (Wilson & Cooke 1980)
Factors of erosivity Factors of erodibility Wind Single particle
velocity diameter turbulence density
Roughness shape vegetation Soil windbreaks texture (micro-) topographie aggregation/crusting non erodible elements (stones etc.) soil moisture
salt content cementing agents (e.g. CaCO3) Wind erosion is affected by four factors: wind, meterological factors, soil surface and land use and is the resultant of six forces. Three forces in entraiment are lift, shear (drag), and ballistic impact (colliding particles). Three forces opposing soil particle movement are gravity, friction and cohesion. The major source of energy needed to perform the work involved in wind erosion is the wind velocity. The wind velocity profile is greatly altered by soil surface conditions and especially vegetation cover. Forces generated by wind are greatly altered by soil surface. Wind erosion can be a problem in all dry and semi-arid areas, and also in areas of seasonal rainfall. Unlike water, which needs a slope to enable it to flow and move soil, wind can remove soil from flat land just as well as from sloping land; it can also transport the particles through the atmosphere and deposit them up to thousands of kilometres from the original location (example: dust load of „Harmattan“ in West Africa). Different soils erode at different rates because of their inherent characteristics (erodibility) (Tab 18). Soil texture and cloddiness are the primary properties. The conditions which allow wind erosion to take place are dry loose soil with little or no vegetative cover, a relatively smooth surface, and a wind of sufficient velocity. Even an apparently smooth surface contains soil particles of different size and resistance to the force of the wind. The resistance is known as the boundary friction, which needs a given force of wind to overcome it; but once overcome the body will continue to move. This movement then takes place in three different ways, again according to the size of the particles (Fig 29. Modes of movement).
movement particle form diameter (mm) suspension < 0.1 saltation 0.05 – 0.5 creep 0.5 – 2.0
Lift
grain
wind
Fig 29. Modes of movement

Tropical Agroecosystem Function, Kühne, SS 08 U6-8 Erosion by water and wind p. 39
Wind speed
Sm
ooth
Eddies
Height
Rough surface
Eddies
Sm
ooth
Height Wind speed
Smooth surface
Z0
DZ0
Fig 30. Wind speed gradients over a smooth and rough surface
Wind initiates the movement of soil particles from the surface of the ground by turbulence (eddies), which arises from a change in wind velocity in relation to height above the surface, the thickness of which varies according to the roughness of the ground. In other words, the greater the average height of the roughness, the greater the height of zero velocity (Z0). This roughness might consist of impediments such as stones, vegetation, vegetative residues or clods. The smaller, erodible particles in between are in the area of zero velocity and thus remain undisturbed (Fig 30). Particles less than 0.1 mm in diameter are less susceptible to wind erosion because they tend to adhere to one another, retain moisture, and form a smooth surface. Sand grains larger than 0.5 mm in diameter are so heavy that wind velocity is rarely great enough to move them. Wind velocities of at least 16 km/hr (Fig 31) are generally required to move sand. Wind-tunnel and field experiments show that sand moves in three ways: in suspension as clouds rising as high as 2,500 m ; by saltation--a bouncing or leaping motion that accounts for most sand movement; and by creep or surface rolling, which involves only the larger grains (Fig 29). Once movement begins (and if the wind persists), dunes may form wherever the smooth flow of wind and sand is interrupted, such as at shallow dips or small irregularities. The dune, once started, tends to continue to grow. Observations in the central Saharan erg4 suggest that 40 years are needed to form a dune 3 m high and 100 m long. Once formed, a dune may advance at rates ranging from 15 to 45 m per year (threat to oasis agriculture). Soil grains within the range of 0.05 to 0.5 mm in diameter move in saltation, which is a bouncing action over the surface of the ground. Particles which are too heavy to be lifted by the wind in the range of 0.5 to 2 mm in diameter - creep or roll along the surface, mainly by the impact of other bodies in saltation rather than by the direct force of the wind. The smaller (less than 0.1 mm in diameter) , very light particles are also bounced up by the impact of grains in saltation and are then lifted by eddy currents and carried away in suspension by the main airstream to form duststorms. These duststorms usually contain the most fertile fractions of the soil.
Fig 31 Threshold velocities of grains as affected by grain size
4 erg (Arabic): „sand sea“, major dune field.

Tropical Agroecosystem Function, Kühne, SS 08 U6-8 Erosion by water and wind p. 40
The coarser, less fertile soil particles pile up against obstacles such as fences, roads, or buildings. These coarser fractions also cause abrasion - i.e. they break down clods into smaller erodible sizes; they damage growing vegetation while the wind removes residues, leaving more soils vulnerable to erosion. Thus, the whole erosion process is accelerated. Although the angle of slope is not a major significance in relation to the danger of wind erosion, the length of a field or open ground is of the greatest importance. By the process of saltation increasing numbers of particles are set in motion in the direction of the wind. Thus, the amount of soil moved increases with distance until the wind can carry it no farther, where it settles out or piles up in drifts or dunes.
Factors affecting wind erosion (adapted from Lal 1990)
Viscosity
Density
Velocity
Wind
Rel. humdidity
Rainfall amount and distribution
Air & soil temperature
Aridity
Meteorological
Organic matter content
Moisture regime
Texture
Structure
Soil
Length
Topography
Obstructions
Cover
Roughness
Land use
Factors
Fig 32. Factors affecting wind erosion
3.2.1 Wind erosion prediction
Wind erosion is a serious problem on agricultural lands throughout the world. The ability to accurately predict soil loss by wind is essential for, among other things, conservation planning, natural resource inventories, and reducing air pollution from wind blown sources. Wind erosion equation (WEQ)
Although many of the principles of wind erosion were known before the 1930's, the foundations of modern wind erosion prediction technology largely began with the publication in 1941 of Ralph Bagnold's classic book titled "The Physics of Blown Sand and Desert Dunes". Further research using wind tunnels and field studies in the USA was needed for application to agricultural fields, which are generally more complicated than sand dunes. The complications include properties that change over time such as soil aggregate size and stability, crusts, random and oriented roughness, field size, and vegetative cover. Woodruff and Siddoway (1965) proposed an empiric, parametric equation to predict wind erosion or to determine the condition of any of the variables needed to control wind erosion. E = f (I’, K’, C’, L’, V) where E is the potential average annual erosion, I’ is the soil erodibility index, K’ is the soil-ridge roughness factor, C’ is the climatic factor, L’ is the median unsheltered travel distance across a field, and V is the equivalent quantity of vegetative cover. I’ is defined as the potential soil loss per acre per annum from a wide, unsheltered, isolated field with a bare, smooth, noncrusted surface.
Unlike USLE, this equation has not been applied widely in the tropics. However, FAO (1979) used a modified version of the wind erosion equation to estimate the wind erosion hazard of Africa north of the equator and of the Middle East. Advanced models
Because field erodibility varies with field conditions, a procedure to solve WEQ for periods of less than one year was devised in the USA. In this procedure –Revised Wind Erosion Equation (RWEQ), a series of factor values5 are selected to describe successive management periods in which both management factors and vegetative covers are nearly constant. Erosive wind energy distribution is used to derive a weighted soil loss for each period. Soil loss for the management periods over a year are added to estimate annual erosion. Soil loss from the periods also can be added for a multi-year rotation, and the loss divided by the number of years to obtain an average, annual estimate.
Recent advances (see excursus) in wind erosion prediction were achieved by developing wind erosion models –WERM, WEPS (Wind Erosion Prediction System), modified versions of EPIC– based on basic principles. This kind of simulation models describe wind erosion in a field by using many submodels such as weather, crop growth, crop residue decomposition, soil water balance, hydrology, and management (tillage etc.). The output of the submodels is used to assess the dynamic soil and vegetative cover variables that control soil erodibility in reponse to inputs
5 Average soil loss = Wind factor * Soil factors * Crop factors

Tropical Agroecosystem Function, Kühne, SS 08 U6-8 Erosion by water and wind p. 41
generated by the weather submodel. The erosion submodel is used to compute soil loss or deposition in relation to wind speed.
3.2.2 Excursus - Wind Erosion Simulation Models Introduction
When WEQ was developed approximately 40 years ago, it was necessary to make it a simple mathematical expression, readily solvable with the computational tools available. However, WEQ has fundamental weaknesses because of its equation structures and its empirical representation of erosion processes. Since its inception, there have been a number of efforts to improve the accuracy, ease of application, and range of WEQ. Despite efforts to make such improvements, the structure of WEQ precludes adaptation to many problems.
Unlike WEQ (and RWEQ), WEPS is a process-based, continuous, daily time-step model that simulates weather, field conditions, and erosion. It is a user friendly program that has the capability of simulating spatial and temporal variability of field conditions and soil loss/deposition within a field. WEPS can also simulate complex field shapes, barriers not on the field boundaries, and complex topographies. The saltation, creep, and suspension components of eroding materials can also be reported separately by direction in WEPS. WEPS is designed to be used under a wide range of conditions in the U.S. and easily adapted to other parts of the world.
Soil erosion by wind is initiated when wind speed exceeds the saltation threshold velocity for a given field condition. After initiation, the duration and severity of an erosion event depends on the wind speed distribution and the evolution of the surface condition. Because WEPS is a continuous, daily, time-step model, it simulates not only the basic wind erosion processes, but also the processes that modify a soil's susceptibility to wind erosion.
The structure of WEPS is modular and consists of a user-interface, a MAIN (supervisory) routine, seven submodels, and four databases. Most of the submodels within WEPS use daily weather (from the WEATHER submodel) as the natural driving force for the physical processes that change field conditions. The HYDROLOGY submodel accounts for changes in temperature and water status of the soil. Changes in the soil properties between management events are simulated in the SOIL submodel. The growth of crop plants is simulated in the CROP submodel, and their decomposition is accounted for in the DECOMPOSITION submodel. Step changes in the soil and biomass conditions generated from typical management practices such as tillage, planting, harvesting, and irrigation are modeled within the MANAGEMENT submodel of WEPS. Finally, the power of the wind on a subhourly basis is used to drive the EROSION submodel. Further information can be found on the Internet at http://www.weru.ksu.edu/weps.html
3.2.3 Measuring Wind Erosion Indirect methods (erosion potential or hazard) • based on the properties of soil and climate (wind resistance of soil aggregates, macro and microrelief, estimating
ground cover, wind velocity, climatic aridity etc. either direct or by statistical techniques) to assess the factors related to wind erosion;
• empirical formulas; • comparing soil properties of eroded and uneroded profiles such as texture (clay, gravel) and indicator element
contents (organic matter, N, P, radioactive isotopes (fall out of atmospheric A-bomb testing); • surveys and satellite imagery; • wind tunnels (wind resistance of soil aggregates etc.). Direct methods are based on measurement of drift (amount of soil blown away); a) measurements of lost profile depth • using exposed roots of trees (rough estimate, over very long time) or • rods or markers embedded in soil (equivalent to water erosion research, over long time) (Fig 12); b) sand deposited along fence lines, shelterbelts, ridges and other obstructions (problems: estimation of source area,
measurement interferes with process); c) trapping the solid particles entrained by different mechanisms – suspension, saltation, rolling and measuring by air
density or by collecting and weighing the sediments (most direct method).
3.3 Control of wind erosion
3.3.1 Principles There are a number of things to control wind erosion but basically they all point to accomplishing one or more of the following objectives and principles: I. creating soil surface conditions that resist wind action; II. protecting the soil from the wind with cover or barriers

Tropical Agroecosystem Function, Kühne, SS 08 U6-8 Erosion by water and wind p. 42
5 BASIC PRINCIPLES 1. Produce STABLE CLODS or AGGREGATES on the surface (increasing the size of aggregates means that
it takes a stronger wind to move the soil) 2. ROUGHEN the soil surface to reduce wind velocity and trap drifting material 3. REDUCE FETCH along the prevailing wind direction with barriers or crop strips to reduce wind velocity and
trap particles 4. LEVEL OR BENCH land to reduce field widths or to reduce erosion rates on slopes 5. Establish and maintain vegetative or nonvegetative COVER to protect the surface Principles applied by the use • of permanent and continuing practices • or with temporary and emergency measures to keep annual soil losses below some selected acceptable level.
3.3.2 Measures to control soil erosion by wind
A) VEGETATIVE COVER AND BARRIERS A1) Integration of trees in arable land: Examples for semi-arid Africa: Neem (Azadirachta indica), Eucalyptus spp.,
Acacia albida, Acacia tortilis, Prosopis juliflora, Albizzia lebbek, Cassia (Senna) siamea etc. A2) Planting windbreaks or shelterbelts with living trees and shrubs (s. A1) perpendicular to the prevailing erosive
winds. A3) Strip cropping of erosion-susceptible and erosion-resistant crops (such as grass and small-grain crops (wheat
etc.), rapid soil cover). A4) Planting of dry-season cover crops.
B) CONSERVATION TILLAGE B1) No-till system and crop residue mulch. B2) If ploughed, then rough cloddy seedbed (reduces saltation and creep). B3) Ploughing perpendicular to the erosive wind direction. B4) Emergency tillage: ripping of rough strips at right angles to the wind direction (rough surface and ridges slows
the intensity of saltation and surface creep, sandfighter, Fig 33). B5) Ridge-furrow seedbed, sowing in furrows, ridges protect the seedling from sandblast B6) Stubble mulch tillage (chisel ploughs). B7) Weeding without disturbing the surface mulch (subsurface tillage: duck-foot cultivator, rod weeder; Hudson
1981, p.274).
C) IMPROVE SOIL STRUCTURE (soil amendments) C1) Increase soil organic matter content C2) Mulching C3) Natural and synthetic soil conditioners a) Sealing the soil surface with a soil-polymer crusts through application of synthetic resin emulsions polymers
(K-4, K-9, PAM, bitumen emulsion, „uresol“ (80-100 kg/ha !!) -> Initial phase of dune stabilisation to facilitate revegetation)
b) Improvement of soil aggregation (> 0,84 mm) - natural and synthetic polymers
D) CONSERVING SOIL MOISTURE Moist soil can not be blown away by wind! Promoting practices: mulching with harvest residues, planting wind
breaks and cover crops (competition, difficult to establish in dry regions) Recommendations (good husbandry) developed under mechanized conditions:
Tropical Agroecosystem Function, Kühne, SS 08 U6-8 Erosion by water and wind p. 43
Increase size of soil aggregates. This is accomplished by using crop rotations that include grasses and legumes, by growing high-residue crops and returning crop residues to the soil, and by emergency tillage, which creates clods on the soil surface. Soil erodibility can be altered by growing different crops. Some crops, such as grass in ley-farming, will normally help increase the size of soil aggregates more than crops whereas tillage operations break down the aggregates. The bigger an aggregate is, the less chance of blowing. Some types of tillage equipment, such as the disc, reduce aggregate size more than other types, such as the chisel. Growing crops that produce a large amount of crop residues and using conservation tillage can result in larger soil aggregates than when conventional practices are followed.
Producing a crop in a ridged field will reduce wind erosion. The ratio of ridge height to distance between the ridges is very important. The most effective ratio of height of ridge to distance between rows is 1:4. The ridge is usually formed with a tillage tool before planting or during cultivation of the crop in the growing season.
The unsheltered distance across a field or strip along the prevailing wind erosion direction is an important factor; a factor that can be changed by man. Soil flow across a field is directly related to the width of the unprotected area. Soil flow or erosion increases with distance until the wind becomes saturated or is carrying its maximum load. The more erodible the soil surface, the shorter the distance at which maximum flow occurs and the narrower the fields must be to keep the soil loss at a tolerable level. Therefore, an effective means of wind erosion control is to reduce field width (strip cropping). It is also important to work fields as close to perpendicular to the prevailing wind erosion direction as possible.
Residue or growing vegetation on the soil surface reduces wind velocity at the ground surface. As the quantity of residue on the surface increases, the wind velocity decreases. Residues with a stem of a smaller diameter (large surface area per unit of weight) result in more surface area of residue and therefore produce more friction. The greater the friction, the greater the reduction in wind velocity. Standing residues reduce wind velocity more than those lying flat. Even though the above mentioned technolgy was shown to control wind erosion on-station, constraints such as termites, bushfires, competing uses for crop residues, lacking mechanization, and harsh environment, among many others, limit the adoption of this technology by smallholders in the semi-arid tropics (example: video Niger).
3.3.3 Special aspect – Soil conditioner A soil conditioner is defined as any synthetic organic chemical or chemically- modified natural substance that stabilises soil aggregates, and/or favourably modifies the soils’ structural or physical properties6. Even though soil conditioners were shown to improve the physical conditions of soils, they failed in the market place because of excessive cost, difficulty in use, and inconsistent results7. Further problems are toxicity and environmental fate. Examples for polymers
Early research8 focused on natural polymers, e.g. polyuronic acids, alginic acids, polysaccharides, and humus. Problems encountered were: microbial attack and biodegradation, short time effectivity. In the 1950’s, therefore, research on synthetic polymers as soil conditioners was initiated, e.g. hydrolysed polyacrylonitrile9 and polyacrylamide (PAM). Properties: • Stabilisation of the soil structure derived from aggregate formation (indirectly associated with properties such as
porosity, ability of water penetration, rhizosphere aeration, etc.). • Increase in water-holding capacity of the soil as a result of the addition of swellable hydrophilic polymers. • Prevention of erosion. Examples of application: Synthetic resin emulsion crust: contribution of dune stabilisation to facilitate revegetation.
3.3.4 Windbreaks and shelterbelts Installing effective vegetative windbreaks requires careful design because they should be as nearly perpendicular
to the prevailing erosive winds as possible. The most effective windbreaks are the wide, permeable belts of multipurpose trees. A belt of trees and shrubs constitutes an effective protection against strong winds. Windbreaks reduce wind velocity within a certain area in the leeward side and also alter the microclimate such as relative humidity, soil and air temperature, and soil moisture (see fig.) The change in airflow by the wind barrier depends on the velocity, direction, and degree of turbulence of the wind as well as the length, height, thickness, and porosity of the barrier. All barriers provide maximum reductions in wind velocity at leeward locations close to them with a gradual increase downwind. Some reduction also occurs for a short distance upwind from the barrier. Because of the generally improved microclimate in the leeward side of the shelterbelt, crop growth and yield are often better with than without shelterbelt. Crop yields in close vicinity of the tree rows, however, are often reduced due to competition for water, light, and nutrients with actively growing trees (Fig 34).
6 De Boodt, M. 1975 Use of soil conditioners around the world, pp. 1-12. In Soil conditioners. SSSA. Special Publication No. 7. Soil Science Society of America, Madison. 7 Wallace, A. & Wallace, G.A. 1990 Soil and crop improvement with water-soluble polymers. Soil Techn. 3: 1-8. 8 Early 1940’s to stabilising temporary roads and runways constructed during wartime 9 HPAN „Krilium“, Monsanto Chemical Company

Tropical Agroecosystem Function, Kühne, SS 08 U6-8 Erosion by water and wind p. 44
Wind barriers have definite limitations as a general method for complete control, especially in dry areas. The reasons are (FAO, 1960): 1. area of downwind influence is limited => very narrow spacings of not more than ten times the barrier height
would be required in most erosion areas; 2. during establishment and growth of vegetative belts protection is limited for many years (dry areas !) =>
combination with other control practices is necessary; 3. growth of the belt is limited by the lack of moisture.
Fig 33 Sandfighters (left) break the surface, trap windblown sand, and reduce crop damage by sand blasting and burial. Sandfighters also break surface crusts (right), improve infiltration and reduce runoff.
Fig 34. Left: Extent of wind protection as affected by height and permeability of windbreaks. Right: Effects of windbreaks on micro-meteorological and crop growth related parameters (h = height of windbreak).