GlobalFood Discussion Papers - uni-goettingen.de
28
RTG 1666 GlobalFood ⋅ Heinrich Düker Weg 12 ⋅ 37073 Göttingen ⋅ Germany www.uni-goettingen.de/globalfood ISSN (2192-3248) www.uni-goettingen.de/globalfood RTG 1666 GlobalFood Transformation of Global Agri-Food Systems: Trends, Driving Forces, and Implications for Developing Countries University of Goettingen GlobalFood Discussion Papers No. 147 Meat Consumption, Dietary Structure and Nutrition Transition in China Hengrong Luo Xiaohua Yu September 2020
Transcript of GlobalFood Discussion Papers - uni-goettingen.de

RTG 1666 GlobalFood ⋅ Heinrich Düker Weg 12 ⋅ 37073 Göttingen ⋅ Germany www.uni-goettingen.de/globalfood
ISSN (2192-3248)
www.uni-goettingen.de/globalfood
RTG 1666 GlobalFood
Transformation of Global Agri-Food Systems:
Trends, Driving Forces, and Implications for Developing Countries
University of Goettingen
GlobalFood Discussion Papers
No. 147
Meat Consumption, Dietary Structure and Nutrition Transition in China
Hengrong Luo
Xiaohua Yu
September 2020

Suggested Citation:
Luo, H., X. Yu (2020). Meat Consumption, Dietary Structure and Nutrition Transition in China.
GlobalFood Discussion Paper 147, University of Goettingen. http://www.uni-
goettingen.de/de/213486.html.

1
Meat Consumption, Dietary Structure and Nutrition Transition in
China
Hengrong Luo
Research Associate
RTG 1666: "GlobalFood"
Transformation of Global Agri-Food Systems
University of Goettingen
Heinrich-Düker-Weg 12
37073 Göttingen, Germany
Email: [email protected]
Xiaohua Yu (Corresponding)
Professor
Department of Agricultural Economics and Rural Development
University of Goettingen
10.121. Platz der Goettinger Sieben 5,
37073 Göttingen, Germany
Tel: 0049-551-3919574
Email:[email protected]
September, 2020
Acknowledgment
This research was funded by the German Research Foundation (DFG), grant numbers RTG 1666 (GlobalFood). This research used data from China Health and Nutrition Survey (CHNS). We
thank the National Institute of Nutrition and Food Safety, China Center for Disease Control and
Prevention, Carolina Population Center, the University of North Carolina at Chapel Hill, the NIH (R01-HD30880, DK056350, and R01-HD38700) and the Fogarty International Center, NIH for
financial support for the CHNS data collection and analysis files from 1989 to 2006 and both parties
plus the China-Japan Friendship Hospital, Ministry of Health for support for CHNS 2009 and future
surveys.

2
Meat Consumption, Dietary Structure and Nutrition Transition in China
Abstract:
Nutrition transition is driven by quantity increase and structural change in food
consumption. Particularly, meat consumption plays an important role. This study proposes
a simple but innovative method to empirically decompose the total income effect on
nutrition improvement into direct income effect and structural change effect, mediated by
meat consumption share. With the use of the China Health and Nutrition Survey (CHNS)
data, we find that a 1% increment in income will boost per capita calorie consumption by
0.02% within a family. The calories elasticity with respect to income is very small.
However, 16 to 21% of the increase is due to dietary structural change, while the rest part
is attributed to the conditional income effect. In addition, the dietary structural change
effect is more prominent in the rural region, which implies a rural-urban gap in the diet.
Key Words: Meat consumption, Nutrition transition, Dietary structural change, Seemingly
unrelated regression model, Income effect, China
JEL: Q10
1. Introduction
Increasing specific nutrients intake and calorie consumption, in coincidence with
rapid economic growth and fierce social change, occurs in developing and emerging
economies. (Guo et al., 2000; Du et al., 2002; Popkin et al., 2002; Jensen & Miller, 2010;
Tian and Yu, 2015). Early studies (Popkin, 1999; Subramanian & Deaton, 1996) focus on
the relationship between income and energy intake, under a static framework, especially
for the income elasticity of calorie intake. Lifestyle change that induces a reduction in
physical activity levels, people’s preference towards processed food and sugar-sweetened
beverages, and food patterns change like the popularity of having food away from home
also contributes to the prevalence of obesity and obesity-related non-communicable disease
in emerging and developing countries. (Popkin et al., 2012). A general finding is that

3
nutrition consumption first increases drastically, and then slows down until reaching a
saturate point with income growth (Zhou and Yu 2015; Tian and Yu, 2015; Shimokawa,
2010). Consequently, the income elasticity of nutrition would keep declining, and this is
confirmed by a meta-analysis of Zhou and Yu (2015) and Min et al. (2020).
Income does not only increase the food quantity but also food quality (Yu and Abler
2009). Food quality is measured by dietary structure. Some recent researchers start to shed
light on dietary structural change in the nutrition transition. Jensen and Miller (2010) use
the share of calories from staple food as an index to measure the level of undernutrition, as
it first maintains at a high level and then decreases drastically when income reaches a
certain level. Min et al. (2020) find that the effect of dietary knowledge is heterogeneous
for food and calorie loss with household features and income.
Tian and Yu (2015) used semi-parametric methods and demonstrated that dietary
structure changes over income in China. A typical phenomenon is that traditional diets
dominated by fiber and staples are being replaced by meat consumption in recent decades
(Yu & Abler, 2009 & 2014; Tian & Yu,2013; Zhou et al., 2015). This is confirmed by a
large volume of literature on food demand analysis in China. Chen et al. (2016) and Zhou
et al. (2017) conducted meta-analyses for the demand elasticities in China. As income still
grows, meat consumption is expected to increase in a mid-term. Zhou et al. (2017)
projected that meat consumption will increase by about 50% from 2015 to 2030.
In addition to income, many other factors have been taken into account in the literature
of nutrition analysis, such as household structure, gender, and other socioeconomic
variables (Tian and Yu, 2015). For instance, intrahousehold calorie allocation responds
asymmetrically to expected declines and increases in household food availability in China

4
(Shimokawa, 2010). However, the linkage between dietary structural change and nutrition
improvement has not been thoroughly examined quantitatively. Low level of overall
economic development other than low income could be the main cause of insufficient
calorie consumption in development countries (Dawson, 2007). Meat itself as a food
category has some unique attributes such as the high environmental and ecological burdens,
compared with cereals, fruits, and vegetables (Shimokawa, 2015; Yu, 2015). Democracy
levels of countries could also correlate with meat consumption as a democratic government
has incentives to reach food security and ensure sufficient meat supply (Hasiner and Yu,
2016). Other than nutrient intake, cooking style, and food patterns in China have changed
drastically as the snacking and fried food are limited in traditional Chinese daily meals
(Wang et al., 2008).
In order to fill in the research gap, this paper will propose a simple but innovative
framework to decompose the total income effect on nutrition improvement into direct
income effect and structural effect. Specifically, the dietary structure is measured by meat
consumption.
The rest of this paper is organized as follows: Section 2 and 3 describe the theoretical
framework and the empirical model. Section 4 introduces the data source and descriptive
statistics. Section 5 discusses the empirical results, followed by Section 6 of the conclusion.
2. Theoretical Framework
We assume nutrition consumption 𝐶 (e.g. Calories) is a function of income (𝑋) and
dietary structure (𝑆). Following Jensen & Miller (2010) and Tian & Yu (2015), the dietary

5
structure can be measured by the calories share of meat products (𝑆𝑐), or the expenditure
on meat expenditure in total food expenditure𝑆𝑒 .
𝐶 = 𝐹(𝑋, 𝑆) (1)
However, if we assume income is exogenous, food structure can be driven by income
growth, as is observed in the literature. That is, 𝑆 is also a function of 𝑋. That is,
𝐶 = 𝐹[𝑋, 𝑆(𝑋)] (2)
The relationship between income, food structural change, and nutrition transition can
be demonstrated in Figure 1. That is, income has two channels to impact nutrition
consumption: expansion of food consumption and change of food structure. Taking total
differentiation for (2) with respect to 𝑋, we have
𝑑𝑙𝑛𝐶
𝑑𝑙𝑛𝑋=
𝜕𝑙𝑛𝐶
𝜕𝑙𝑛𝑋|𝐶𝑜𝑛𝑠𝑡𝑎𝑛𝑡 𝑆 +
𝜕𝑙𝑛𝐶
𝜕𝑆
𝜕𝑆
𝜕𝑙𝑛𝑋 (3)
where 𝑑𝑙𝑛𝐶
𝑑𝑙𝑛𝑋 is the unconditional income elasticity of calorie consumption, measuring
the total income effect. That is equation (3) decomposes the total income effect into two
terms : 𝜕𝑙𝑛𝐶
𝜕𝑙𝑛𝑋 and
𝜕𝑙𝑛𝐶
𝜕𝑆
𝜕𝑙𝑛𝑆
𝜕𝑙𝑛𝑋 .
𝜕𝑙𝑛𝐶
𝜕𝑙𝑛𝑋 is the direct income effect after controlling for the dietary structure. From an
economic perspective, this term measures the direct income effect, mainly driven by the
food quantity expansion with the assumption of fixed food structural change. While the
second term 𝜕𝑙𝑛𝐶
𝜕𝑆
𝜕𝑙𝑛𝑆
𝜕𝑙𝑛𝑋 measures the effect of dietary change on total calorie consumption.

6
If we use the calories share of meat or expenditure share of meat as the measure of
dietary structure, we have a hypothesis that 𝜕𝑙𝑛𝐶
𝜕𝑆> 0 and
𝜕𝑆
𝜕𝑙𝑛𝑋> 0, as income increases
meat consumption generally in developing and emerging economies. Hence, we have
𝑑𝑙𝑛𝐶
𝑑𝑙𝑛𝑋>
𝜕𝑙𝑛𝐶
𝜕𝑙𝑛𝑋|Constant S.
It implies that the direct (conditional) income effect on nutrition consumption is often
lower than the total effect. It is our common wisdom that dietary quality increase also could
enhance nutrition consumption. However, to what extent the dietary structural change
affect nutrition improvement is an empirical problem. This will be studied in the next
section.
The channel for the impact of income growth on nutrition improvement is summarized
below in Figure 1.
Figure 1: Theoretical framework
3. Empirical Model
Following the intuition of the above theoretical framework, we assume equation (1)
is a set of two linear functions, and have the following specifications:
𝑙𝑛𝐶𝑖 = 𝛼0 + 𝛼1 ∗ 𝑙𝑛𝑋𝑖 + 𝛼2 ∗ 𝑆𝑖 + 𝑧𝑖𝛼3 + 𝑒𝑖 (4)
𝑆𝑖 = 𝜃0 + 𝜃1 ∗ 𝑙𝑛𝑋𝑖 + 𝑧𝑖𝜃2 + 𝜀𝑖 (5)

7
Where 𝛼𝑟 (r=0,1,2,3) and 𝜃𝑡(t=0,1) are parameters to be estimated. 𝑧𝑖is a vector of
control variables. 𝑒𝑖 and 𝜀𝑖 are error terms following normal distribution N(0, 𝜎𝑒2) and N(0,
𝜎𝜀2) respectively.
However, the current literature often has the following conventional model without
considering dietary structural change,
𝑙𝑛𝐶𝑖 = �̃�0 + �̃�1 ∗ 𝑙𝑛𝑋𝑖 + 𝑧𝑖�̃�2 + �̃�𝑖 (6)
Where similarly, �̃�0, �̃�1, �̃�3 are parameters to be estimated, while �̃�𝑖 is the error term.
Compare equation (6) with equations (4) and (5), we could easily obtain,
�̃�1 =𝑑𝑙𝑛𝐶
𝑑𝑙𝑛𝑋
=𝜕𝑙𝑛𝐶
𝜕𝑙𝑛𝑋|𝑆 𝑖𝑠 𝑐𝑜𝑛𝑡𝑟𝑜𝑙𝑙𝑒𝑑+
𝜕𝑙𝑛𝐶
𝜕𝑆
𝜕𝑆
𝜕𝑙𝑛𝑋
= 𝛼1 + 𝛼2 ∗ 𝜃1 (7)
Equation (7) empirically decompose the total income effect into a conditional income
effect and a structural change effect, consistent with the Equation (3) in the theoretical
framework section.
Compared with the conventional model, our model can easily decompose the
confounding mixed total income effect (�̃�1) into two part: the direct (conditional) income
effect or the intensive margin of calorie consumption (𝛼1) and the dietary structural change
effect or the extensive margin of calorie consumption (𝛼2 ∗ 𝜃1). The structural change
effect (𝛼2 ∗ 𝜃1) can be also regarded as an indirect effect of income. This is consistent with
the Equation (3) of the theoretical framework section.

8
Here comes to the proxy variables for dietary structure. Following Jensen & Miller
(2010) and Tian & Yu (2015), we propose two measures for dietary structure: the calories
share of meat products (𝑐𝑎𝑙𝑠𝑚𝑒𝑎𝑡𝑖), and the ratio of expenditure on meat to total food
expenditure (𝑒𝑠𝑚𝑒𝑎𝑡𝑖).
4. Data source and descriptive statistics
We use China Health and Nutrition Survey (CHNS) dataset for this study. CHNS is a
widely recognized long-lasting survey specifically shedding light on nutrition and health
issues for Chinese people. It is supported by three institutes: Carolina Population Center of
the University of North Carolina at Chapel Hill, the Chinese Center for Disease Control
and Prevention, and the National Institute of Nutrition and Food Safety. The current project
covers more than 7000 households.
The survey starts initially in 1989, but the early surveys cover limited information on
the prices of food. As a result, we only make use of data in 2004, 2006, and 2009, since the
price information is reported in those three rounds.
The calculation of expenditure share of meat consumption which is an indicator of
food structure requires the prices of individual food items. which are reported in the
community survey. Then we estimate total food expenditure as well as expenditures for
specific food categories. In this way, we finally calculate the expenditure share of meat
consumption.
As we have the information each food category consumed by the samples, the
calculation of calorie share of meat consumption can be easily realized by multiplying the
food consumption quantity by calories contents for each food category. The calories

9
contents can be easily obtained from China Food Composition Table 2002 and 2004 (which
are released by Chinese Center for Disease Control and Prevention).
The definition of the variables of our interests is reported in Table 1.
Table 1: Summary of descriptions of variables
Category Variable name Unit Description
Dependent
Variable lncalint kcal
The natural logarithm of calorie intake
Mediator Variables esmeat % Share of food expenditure spend on meat
calsmeat % Share of calorie absorbed from meat
Independent
Variable lnincome CNY
The natural logarithm of income, inflated to the 2004 price
level facility counts Number of nearby food facilities
hhage year Age of household head
hhagesqr year^2 Squared term of household head's age
hhedu year Years of household head's education
hhmale dummy The gender of household head, if male, it equals 1, or else 0
share_child % Share of kids younger than or equal to 5 years old
share_old % Share of family members older than 60
share_madult % Share of male members aged between 19 and 60
As Table 1 shows, we follow the common social-economical factors to construct the
covariates. We compute food consumption data for each category and each specific food
item by calculating the inventory change plus the food away from home. Afterward, we
estimate the calorie consumption per capita per day for each member of each family. But
it is noticeable that the accuracy of calorie consumption per capita we calculated here may
suffer from food waste and the differences in the household size of the survey and real food
consumption size of households (Yu and Abler, 2016).

10
Table 2: Descriptive statistics
Category/mean Variable Whole
sample
Rural
sample
Urban
sample
Dependent variable lncalint 7.639 7.649 7.618
Mediator variables esmeat 0.236 0.213 0.282
calsmeat 0.107 0.093 0.137
Independent variable lnincome 8.497 8.326 8.853
Covariates facility 47.895 42.888 58.268
hhage 54.222 53.548 55.619
hhagesqr 3112.48 3036.211 3270.475
hhedu 7.515 7.066 8.444
hhmale 0.836 0.871 0.763
share_child 0.028 0.031 0.022
share_old 0.199 0.175 0.25
share_madult 0.311 0.317 0.298
Number of observations 11678 7876 3802
Notice: the sample mean of lncalint is 7.639, while e^7.639=2077.67. The sample mean of household daily calorie
intake per capita is about 2000 to 2100 kcal.
Table 2 above shows the descriptive statistics of all the variables. After dropping the
observations with missing values or outliers, we have 11678 observations staying in the
sample. Meat belongs to a high-quality food category and accounts for 24% of total food
expenditure, but only 11% of the whole calorie consumption. More than 80% of household
heads are males, and the average age of the household head is 54 years old. Meanwhile,
around two-thirds of participation families come from rural regions.
We particularly exploit the expenditure share and calorie share for meat products as
the indicators of dietary structural change. Yu and Tian (2013) describe that the dietary
change in China is represented by the fast preference transformation from the grain intense
food to the meat intense food. An increase in meat consumption is a general trend in
nutrition transition observed in developing and transition countries.
Besides the variables listed above, we add the county level dummies in regression to
control for unobserved regional disparity and the food price differences.

11
Notice: The dashed line shows the fitted local polynomial smooth values, while the solid line shows the local
polynomial smooth of the sample. The vertical line represents the mean income of the sample, 8385.063 CNY per
capita per year.
Figure 2 straightforwardly shows the relationship between income and household per
capita calorie consumption. As we can observe, calorie consumption and income are
positively correlated except for very low and very high-income people. Very poor people
may tend to be engaged in labor-intensive work so that they need to consume more calories
to support their activities. Similarly, we find that very rich people tend to consume slightly
less energy. We argue that rich people can easily obtain enough energy, so they pay more
attention to the dietary quality and diversity of food.

12
Notice: The dashed line shows the fitted local polynomial smooth values, while the solid line shows the local
polynomial smooth of the sample. The vertical line represents the mean income of the sample, 8385.063 CNY per
capita per year.
Figure 3 shows the relationship between food structure change and income growth
without controlling for other factors. Generally speaking, the upward shape of the fitted
curve implies that Chinese consumers tend to spend more expenditure on meat when they
can afford to, and the percentage of calories obtained from meat also increases with income
growth.
5. Empirical Results
⚫ Conditional income effect and dietary structural change
As error terms in equation (4) and (5) might be correlated, the seemingly unrelated
regression (SUR) with bootstrapped standard errors could serve the purpose better and
obtain a more efficient estimator (Preacher and Hayes, 2008).
0.1
.2.3
pe
rcen
tage
)
0 5 10 15lnincome
Panel A: expenditure share
0.1
.2.3
pe
rcen
tage
0 5 10 15lnincome
Panel B: calorie intake share
Figure 3: Meat consumption and income growth

13
Table 3: Empirical results
Variables Estimation Method SUR with Bootstrapped SE
lncalint Expenditure share Calorie share
Mediation Variables esmeat 0.197***
(0.024)
calsmeat 0.282***
(0.051)
Independent Variable lnincome 0.016*** 0.017***
(0.004) (0.004)
Control Variables facility -0.000*** -0.000***
(0.000) (0.000)
hhage 0.011*** 0.011***
(0.002) (0.002)
hhagesqr -0.000*** -0.000***
(0.000) (0.000)
hhedu -0.003** -0.002*
(0.001) (0.001)
hhmale 0.042*** 0.042***
(0.011) (0.012)
share_child -0.404*** -0.404***
(0.045) (0.045)
share_old -0.039 -0.040*
(0.025) (0.024)
share_madult 0.047 0.048
(0.029) (0.030)
constant 7.032*** 7.038***
(0.070) (0.070)
County Fixed Effect Yes Yes
Mediation Variables Expenditure share Calorie share
Independent Variable lnincome 0.021*** 0.011***
(0.002) (0.001)
constant 0.078*** 0.033**
(0.028) (0.016)
Control Variables Yes Yes
County fixed effect Yes Yes
N 11678 11678
Note: Standard Errors are reported in brackets. and ***, **, * denote significant at 1%, 5% and 10% respectively. All
the other results estimated share the same group of control variables, so we do not list them one by one in other tables.

14
In Table 3, the first column reports the results using the expenditure share of meat
consumption (𝑒𝑠𝑚𝑒𝑎𝑡𝑖) as an indicator for dietary structural change; while the second
column reports the results using the calories share of meat (𝑐𝑎𝑙𝑠𝑚𝑒𝑎𝑡𝑖). For both measures
of food structure, all the coefficients of interests, including the parameters of 𝑙𝑖𝑛𝑐𝑜𝑚𝑒𝑖,
𝑒𝑠𝑚𝑒𝑎𝑡𝑖 and 𝑐𝑎𝑙𝑠𝑚𝑒𝑎𝑡𝑖, are positive and statistically significant. It is consistent with our
expectations.
Using equation (7), with the estimated coefficients in the first and the second column
in hand, the estimated unconditional income elasticity of calorie consumption is
0.017+0.282*0.011=0.020 with meat expenditure share as the measure for the dietary
structure which is 0.016+0.197*0.021= 0.020. The unconditional income elasticities are
very close even we have different food structure measures.
Consistent with the literature, almost all control variables are statistically significant,
such as household head gender, household head age, and household head education, local
food facilities, etc. It evidences that the model fits the data very well.
⚫ Staple food ratio as the mediator
An alternative measure for changes in food structure induced by nutrition transition
in the developing and emerging economy is the expenditure and calorie share of staple
food. As we listed in Table 4, the results are highly significant and not surprising: when
the household becomes rich, the family members tend to consume more food and have
higher calorie intake. Meanwhile, they tend to decrease the expenditure and calorie ratio
devoted to staple food.
15
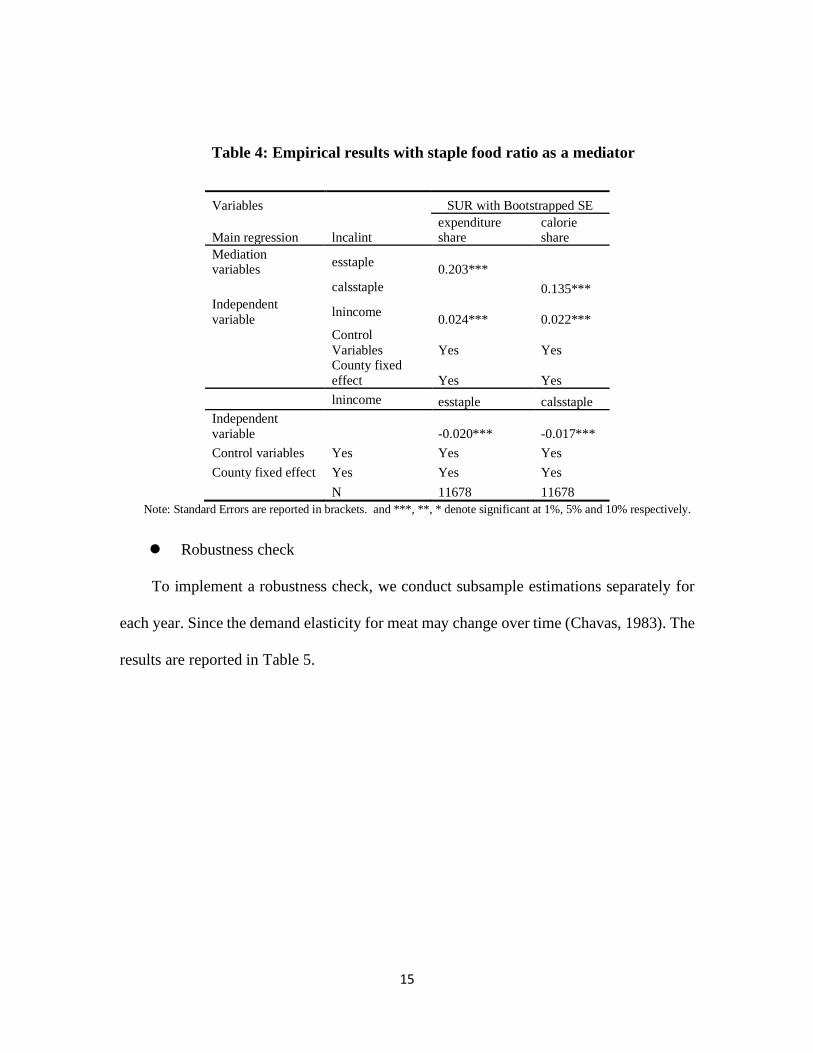
Table 4: Empirical results with staple food ratio as a mediator
Variables SUR with Bootstrapped SE
Main regression lncalint expenditure share
calorie share
Mediation variables
esstaple 0.203***
calsstaple 0.135***
Independent
variable lnincome
0.024*** 0.022***
Control
Variables Yes Yes
County fixed
effect Yes Yes
lnincome esstaple calsstaple
Independent
variable -0.020*** -0.017***
Control variables Yes Yes Yes
County fixed effect Yes Yes Yes
N 11678 11678
Note: Standard Errors are reported in brackets. and ***, **, * denote significant at 1%, 5% and 10% respectively.
⚫ Robustness check
To implement a robustness check, we conduct subsample estimations separately for
each year. Since the demand elasticity for meat may change over time (Chavas, 1983). The
results are reported in Table 5.

16
Table 5: SUR results for each year
lncalint Expenditure share Calorie share
Year 2004 2006 2009 2004 2006 2009
esmeat 0.149*** 0.261*** 0.183***
(0.038) (0.044) (0.047)
calsmeat 0.175* 0.460*** 0.296***
(0.089) (0.088) (0.093)
lnincome 0.022*** 0.020*** 0.026*** 0.024*** 0.021*** 0.026***
(0.007) (0.006) (0.007) (0.007) (0.006) (0.007)
facility -0.000 -0.000*
-
0.001*** -0.000 -0.000*
-
0.001***
(0.000) (0.000) (0.000) (0.000) (0.000) (0.000)
hhage 0.009** 0.012*** 0.013** 0.009** 0.011*** 0.013**
(0.004) (0.004) (0.005) (0.004) (0.004) (0.005)
hhagesqr -0.000**
-
0.000***
-
0.000*** -0.000**
-
0.000***
-
0.000***
(0.000) (0.000) (0.000) (0.000) (0.000) (0.000)
hhedu -0.001
-
0.007*** 0.000 -0.001
-
0.007*** 0.001
(0.002) (0.002) (0.002) (0.002) (0.002) (0.002)
hhmale 0.030 0.081*** 0.019 0.030 0.080*** 0.019
(0.020) (0.018) (0.021) (0.020) (0.016) (0.021)
share_child
-
0.428***
-
0.322***
-
0.414***
-
0.429***
-
0.332***
-
0.407***
(0.078) (0.074) (0.082) (0.078) (0.074) (0.082)
share_old -0.105**
-
0.105*** 0.043
-
0.108***
-
0.103*** 0.042
(0.041) (0.038) (0.042) (0.041) (0.039) (0.044)
share_madult 0.037 -0.010 0.101* 0.035 -0.004 0.099
(0.052) (0.038) (0.061) (0.050) (0.038) (0.061)
constant 7.134*** 6.943*** 6.800*** 7.139*** 6.941*** 6.801***
(0.123) (0.117) (0.147) (0.122) (0.123) (0.148)
County Fixed Effect Yes Yes Yes Yes Yes Yes
Year 2004 2006 2009 2004 2006 2009
lnincome 0.028*** 0.019*** 0.013*** 0.013*** 0.008*** 0.007***
(0.003) (0.003) (0.003) (0.002) (0.002) (0.002)
_cons 0.028 0.070 0.143*** -0.006 0.043* 0.087***
(0.052) (0.043) (0.049) (0.026) (0.026) (0.028)
Control Variables Yes Yes Yes Yes Yes Yes
County fixed effect Yes Yes Yes Yes Yes Yes
N 3754 3896 4028 3754 3896 4028
Note: Standard Errors are reported in brackets. and ***, **, * denote significant at 1%, 5% and 10% respectively.

17
While the conditional income elasticity stays between 0.020 and 0.026, slightly larger
than the counterpart elasticity in the primary results, the importance of the structural change
effect varies as well. The signs of coefficients in the year-specific regression are consistent
with the primary setting.

18
Table 6: Rural-urban Gap
lncalint Expenditure share Calorie share
Regions Rural Urban Rural Urban
esmeat 0.223*** 0.145***
(0.030) (0.040)
calsmeat 0.362*** 0.162**
(0.067) (0.077)
lnincome 0.014*** 0.021*** 0.015*** 0.022***
(0.005) (0.006) (0.005) (0.006)
facility
-
0.000*** -0.000
-
0.000*** -0.000
(0.000) (0.000) (0.000) (0.000)
hhage 0.016*** 0.004 0.016*** 0.003
(0.003) (0.003) (0.003) (0.003)
hhagesqr
-
0.000*** -0.000**
-
0.000*** -0.000**
(0.000) (0.000) (0.000) (0.000)
hhedu -0.002 -0.004** -0.001 -0.004**
(0.002) (0.002) (0.002) (0.002)
hhmale 0.046*** 0.036** 0.046*** 0.035**
(0.016) (0.017) (0.017) (0.016)
share_child
-
0.469*** -0.206**
-
0.469*** -0.201**
(0.052) (0.080) (0.049) (0.087)
share_old -0.039 -0.029 -0.040 -0.030
(0.033) (0.033) (0.033) (0.033)
share_madult 0.021 0.091** 0.023 0.090**
(0.039) (0.045) (0.040) (0.044)
constant 6.914*** 7.455*** 6.915*** 7.476***
(0.089) (0.096) (0.087) (0.099)
County Fixed Effect Yes Yes Yes Yes
Regions Rural Urban Rural Urban
lnincome 0.023*** 0.018*** 0.012*** 0.010***
(0.002) (0.003) (0.001) (0.002)
_cons 0.057* 0.231*** 0.033* 0.074***
(0.033) (0.051) (0.017) (0.027)
Control Variables Yes Yes Yes Yes
County fixed effect Yes Yes Yes Yes
N 7876 3802 7876 3802
Note: Standard Errors are reported in brackets. and ***, **, * denote significant at 1%, 5% and 10% respectively.

19
Some researchers may concern the rural-urban gap on the dietary change dynamics in
China (e.g. Shimokawa 2010; Tian and Yu 2015). Our results in Table 6 show that rural
consumers have a higher marginal effect of food structure on calorie consumption, but the
condition income elasticities are very close: both are very small. It implies that different
nutrition transition processes between rural and urban in China rests on food structure.
Particularly, rural households demand more for dietary quality and food diversity.
⚫ Decomposition
Table 7: The decomposition of nutrition improvement
Expenditure share Calorie share
Sample Whole
sample
Rural
Region
Urban
Region
Whole
sample
Rural
Region
Urban
Region
Indirect
effect 0.004*** 0.005*** 0.003*** 0.003*** 0.004*** 0.002*
(0.001) (0.001) (0.001) (0.001) (0.001) (0.001)
Direct effect 0.016*** 0.014*** 0.021*** 0.017*** 0.015*** 0.022***
(0.004) (0.005) (0.007) (0.004) (0.005) (0.006)
Total effect 0.020*** 0.019*** 0.023*** 0.020*** 0.019*** 0.023***
(0.004) (0.005) (0.006) (0.004) (0.005) (0.006)
Indirect ratio 0.210*** 0.266*** 0.112 0.155*** 0.216** 0.069
(0.058) (0.099) (0.299) (0.047) (0.091) (0.058)
Direct ratio 0.790*** 0.734*** 0.888*** 0.845*** 0.784*** 0.931***
(0.058) (0.099) (0.299) (0.047) (0.091) (0.058)
N 11678 7876 3802 11678 7876 3802
Note: Standard Errors are reported in brackets. and ***, **, * denote significant at 1%, 5% and 10% respectively.

20
Table 7 reports the decomposition of unconditional income effect into a direct
(conditional) income effect and structural change effect. We already calculated that the
unconditional income elasticity of calorie consumption is 0.016. It means that a 1%
improvement in income will increase per capita calorie consumption by 0.02%. This shows
that the marginal effect income on calorie consumption is a trivial number, as most of the
Chinese residences are released from hunger. However, given such a small income
elasticity, the contribution rates of dietary structural change (indirect effect of income) are
estimated at around 20%, the rest 80% is still attributed to the food quantity expansion
driven by direct income growth.
Meanwhile, the rural-urban gap should not be ignored. Early study shows that high
income correlates with obesity and high in fat food patterns especially in urban China.
(Popkin et al., 1993). In our case, more than 20% of the total income effect can be attributed
to a dietary structural change in rural China, while only 7% to 11% can be attributed to a
dietary structural change in urban China. One possible explanation is that consumers in
rural China still have more room to improve their dietary quality and food diversity, while
the food demand for urban consumers is much closer to a saturation point.
To deal with the endogeneity issue of income, we further use a mediation analysis with a
single instrument approach proposed by Pinto et al. (2019) and elaborated by Dippel, Ferrara &
Heblich (2019). The advantage of this approach compared with traditional two-step least squares
(2SLS) is that the former allows the disentangling of the direct effect (or conditional effect) from
the indirect effect while the latter does not. Figure 4 shows the intuition of the Pinto et al. (2019)
method explicitly.

21
Figure 4: Extended framework
As for the choice of instrumental variable, we follow Nie and Sousa-Poza (2014) and use the
number of durable assets of the household as the instrumental variable for household income. In
detail, the number of durable assets is the summation of numbers of air conditioning, camera, fan,
personal computer, refrigerator, sewing machine, telephone, TV, VCR, and wash machine owned
by the household.
Based on the single instrument mediation analysis, we report the result in Table 8.
Notice that the result is hard to be explained since the indirect effect becomes even negative
when we add durable assets as an instrument variable. In this case, after controlling for the
endogeneity, the income growth leads to both the negative effect for meat consumption via
dietary structure and the positive meat consumption growth effect assuming the dietary
structure unchanged.
Table 8: The decomposition in the extended framework
Meat
expenditure share
Meat calorie
share
Staple
expenditure share
Staple calorie share
Indirect effect
-0.004 -0.004 -0.004 -0.004
0.018 0.019 0.019 0.019
Direct effect
0.020 0.020 0.021 0.021
0.005 0.005 0.005 0.005
Total effect 0.016 0.016 0.016 0.016
0.016 0.016 0.016 0.016
Indirect
ratio -24.872% -25.315% -25.944% -25.838%
Direct ratio 124.872% 125.315% 125.944% 125.838%

22
N 11678 11678 11678 11678
6. Conclusion
Nutrition transition has been widely studied in the literature. Food structure is known
to play important roles in nutrition improvements, but its effect has not been quantitatively
examined. To fill in the research gap in the literature, this study proposes a simple but
innovative method to empirically decompose the total income effect on nutrition
improvement into direct (conditional) income effect and dietary structural change effect.
With the use of the China Health and Nutrition Survey (CHNS) data, we find that
unconditional income elasticity of calorie consumption is 0.02: a 1% increment in income
will boost per capita calorie consumption by 0.02% within a family. It is evident that
Chinese consumers have been released from the hunger stage so that the total marginal
effect of income on calorie consumption is very small.
By decomposition, we find that about 16% to 21% of the calorie consumption uprising
is driven by the dietary structural change, while the remaining part is attributed to the direct
income effect. This implies that dietary structural change plays an important role in
nutrition improvement.
The importance of dietary structure is found to be different between rural and urban
areas. Specifically, the dietary structural change effect is more prominent in the rural region,
which implies a rural-urban gap in the diet. 22% to 27% of the total income effect can be
attributed to a dietary structural change in rural China, while only 7% to 11% in urban
China. More meat consumption is expected in rural China. One policy implication is that
global demand for meat is expected to be driven by the high demand for animal source

23
products as households’ increasing demand in rural China. It is wise to make predictions
and bridge the gap in advance to avoid unnecessary market frictions and deal with the food
security issue. Given China's enormous population, this is not only a local food security
issue, but a challenge for global meat producers and the environment as the high carbon
emission of meat compared with other categories of food.
24
References:
Chavas, Jean-Paul (1983), "Structural change in the demand for meat", American Journal of
Agricultural Economics. 65, no. 1: 148-153.
Chen D., D. Abler, D. Zhou, X. Yu, and W. Thompson (2016), "A Meta-Analysis of Food
Demand Elasticities for China", Applied Economics Perspective and Policy. Vol. 38(1):50-72.
Dawson, Philip J.(1997), "The demand for calories in developing countries", Oxford
Development Studies.25, no. 3: 361-369.
Du, S., Lu, B., Zhai, F., & Popkin, B. M. (2002), "A new stage of the nutrition transition in
China", Public Health Nutrition, 5(1a), 169-174.
Hasiner E. and X. Yu (2016), "Meat Consumption and Democratic Governance: A Cross
National Analysis", China Economic Review, Vol. 59: 100950
Jensen, Robert T., and Nolan H. Miller (2010), "A revealed preference approach to measuring
hunger and undernutrition", No. w16555. National Bureau of Economic Research
Popkin, Barry M., Bing Lu, and Fengying Zhai (2002), "Understanding the nutrition transition:
measuring rapid dietary changes in transitional countries", Public Health Nutrition. 5, no. 6a: 947-
953.
Popkin, B. M., Keyou, G., Zhai, F., Guo, X., Ma, H., & Zohoori, N. (1993), "The nutrition
transition in China: a cross-sectional analysis", European Journal of Clinical Nutrition, 47(5), 333-
346.
Popkin, Barry M., Linda S. Adair, and Shu Wen Ng (2012), "Global nutrition transition and
the pandemic of obesity in developing countries." Nutrition Reviews, 70, no. 1: 3-21.

25
Preacher, Kristopher J., and Andrew F. Hayes (2008), "Asymptotic and resampling strategies
for assessing and comparing indirect effects in multiple mediator models."Behavior Research
Methods. 40, no. 3: 879-891.
Shimokawa, Satoru (2010), "Asymmetric Intrahousehold Allocation of Calories in
China", American Journal of Agricultural Economics, 92, no. 3: 873-888.
Shimokawa, Satoru (2015), “Sustainable Food Consumption in China”, Journal of Integrative
Agriculture, 14(6): 1023-1032.
Subramanian, Shankar, and Angus Deaton (1996), "The demand for food and
calories", Journal of Political Economy 104, no. 1: 133-162.
Tian, Xu, and Xiaohua Yu (2013), "The demand for nutrients in China", Frontiers of
Economics in China, 8.2: 186-206.
Tian, Xu, and Xiaohua Yu (2015), "Using semiparametric models to study nutrition
improvement and dietary change with different indices: The case of China", Food Policy 53 (2015):
67-81.
X. Wang, X. Wang (2020), "Does dietary knowledge affect household food waste in the
developing economy of China?", Forthcoming in Food Policy.
https://doi.org/10.1016/j.foodpol.2020.101896
Wang, Zhi-Hong, Feng-Ying Zhai, Shu-Fa Du, and Barry Popkin (2008), "Dynamic shifts in
Chinese eating behaviors", Asia Pacific Journal of Clinical Nutrition 17, no. 1 (2008): 123-130.
Yu X. (2015), "Meat consumption in China and its impact on international food security:
Status quo, trends, and policies", Journal of Integrative Agriculture, Vol. 14(6):989-994.
Yu X. and D. Abler (2016), "Matching Food with Mouths: A Statistical Explanation to the
Abnormal Decline of Per Capita Food Consumption in Rural China", Food Policy, Vol.63:36-43.

26
Yu, Xiaohua, and David Abler (2009), "The demand for food quality in rural China",
American Journal of Agricultural Economics, 91, no. 1 (2009): 57-69.
Zhou D., X. Yu and T. Herzfeld (2015), "Dynamic Food Demand in Urban China", China
Agricultural Economic Review, Vol.7(1):27-44.
Zhou, De, and Xiaohua Yu (2015), "Calorie elasticities with income dynamics: evidence from
the literature", Applied Economic Perspectives and Policy.37, no. 4 (2015): 575-601.
De Zhou, Xiaohua Yu, David Abler, Danhong Chen (2017), "Projecting Meat and Cereals
Demand for China Based on a Meta-Analysis of Income Elasticities", China Economic Review,
101135