Tableau Lab 8 Replacing of DataSource
13
www.bispsolutions.com www.bisptrainigs.com www.hyperionguru.com Page 1 Getting Started with Tableau Lab#8 Replacing a Data Source Description: BISP is committed to provide BEST learning material to the beginners and advance learners. In the same series, we have prepared a complete end-to end Hands-on Beginner’s Guide for Tableau. The document focuses on replacing data source runtime. Join our professional training program and learn from experts. History: Version Description Change Author Publish Date 0.1 Initial Draft Surbhi Sahu 21 st Aug 2013 0.1 Review#1 Amit Sharma 29 th Aug 2013
-
Upload
amit-sharma -
Category
Documents
-
view
239 -
download
0
Transcript of Tableau Lab 8 Replacing of DataSource

www.bispsolutions.com www.bisptrainigs.com www.hyperionguru.com Page 1
Getting Started with Tableau
Lab#8 Replacing a Data Source
Description:
BISP is committed to provide BEST learning material to the beginners and advance learners. In the same series, we have prepared a complete end-to end Hands-on Beginner’s Guide for Tableau. The document focuses on replacing data source runtime. Join our professional training program
and learn from experts.
History:
Version Description Change Author Publish Date
0.1 Initial Draft Surbhi Sahu 21st Aug 2013
0.1 Review#1 Amit Sharma 29th Aug 2013

www.bispsolutions.com www.bisptrainigs.com www.hyperionguru.com Page 2
Replacing a Data Source Replacing the data source used in a Tableau workbook allows you to point your workbook to a new data source and re-compute all your results using the new data. This method, however, works only if the new data source shares the same format as the original data source. If the format of the new data source is different than the current data source, you may see changes to custom sets, groups, and calculated fields that depend on the fields in the original data source.
For the clarification we can take a example. Here we the data model in which the SalesTax till year 2000 is charged different and after year 2000 the sales tax Increased. We are going to prepare the common report for both the data because almost we have to do the same calculations so, what will be the sense of making same report twice . For this type of purposes tableau gives the facility to replace a data source.
Step 1)Import the excel sheet product_Till2000 from the excel data source.
Step 2)Now all the fields will get imported in the worksheet.

www.bispsolutions.com www.bisptrainigs.com www.hyperionguru.com Page 3
Step 3) Then drag and drop the productname and introductiondate from measures to rows shelf.
Step 4)Now we have to calculate the selling price of the product which
will be calculated by including sales tax charged on each product
individually.
Step 5)Add the expression as given below
(sum(productioncost)+(sum(salestax)*sum(productioncost))/100) this will calculate the selling price and an separate field as named Selling price.

www.bispsolutions.com www.bisptrainigs.com www.hyperionguru.com Page 4
Step 6)In order to add this calculated field in
the sheet, add right click on the SellingPrice
and choose the option add to sheet.
Step 7)This will add the calculation of sellingprice in the sheet.
The same procedure will done with the production cost. Click right on the productioncost and choose the option add to sheet.
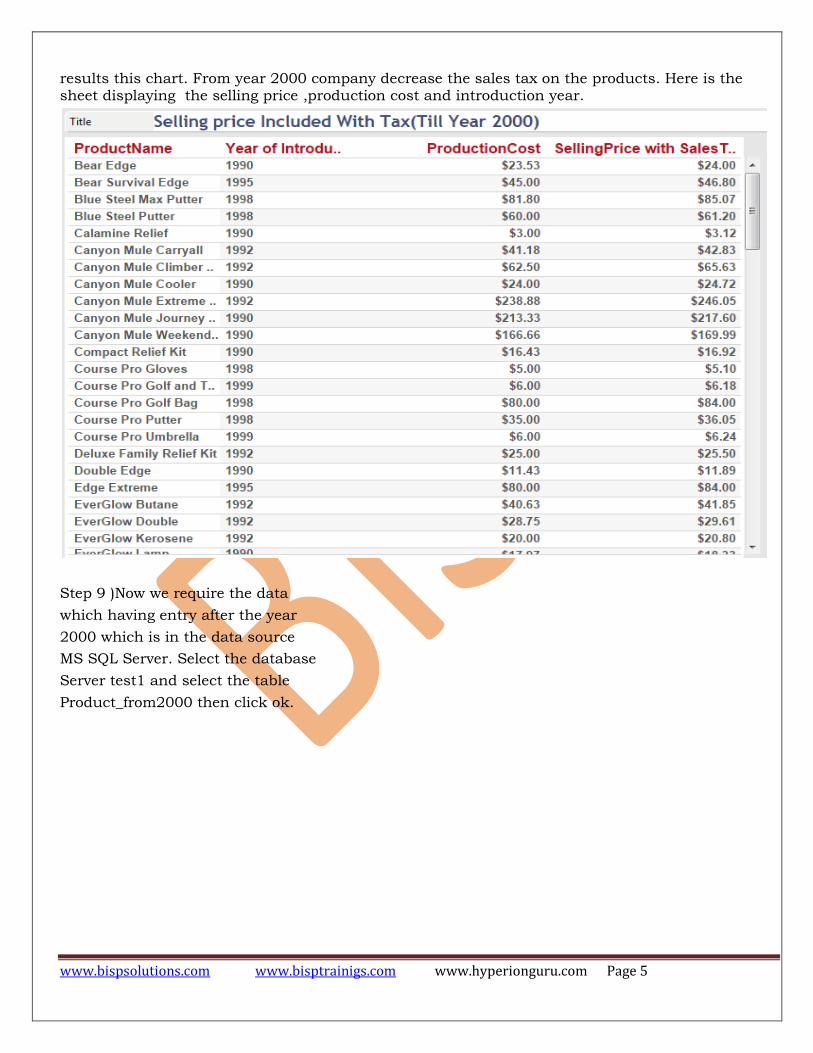
Step 8)Now the table will be created which including the Productname, introductiondate, Production cost and sellingprice. Till year 2000 the company charging the sale tax on product
www.bispsolutions.com www.bisptrainigs.com www.hyperionguru.com Page 5
results this chart. From year 2000 company decrease the sales tax on the products. Here is the sheet displaying the selling price ,production cost and introduction year.
Step 9 )Now we require the data
which having entry after the year
2000 which is in the data source
MS SQL Server. Select the database
Server test1 and select the table
Product_from2000 then click ok.

www.bispsolutions.com www.bisptrainigs.com www.hyperionguru.com Page 6
Step 10) Now choose the option connect live.

www.bispsolutions.com www.bisptrainigs.com www.hyperionguru.com Page 7
Step 11)This is the data till 2000, now we have
to replace this data source from the Sql Server
data source containing the data from the year
2000. We use the data replacing feature
of the tableau.F or replacing the data source
go to the data and choose the option Replace Data Source.
Step 12) In the option, current sheet on which we
had made the report of sales tax will be replaced
with the report containing the data from the year 2000.
This will only replace the data all the
design will be similar.
Then press ok.
Step 13)Now see the chart the sellingprice and year
of introduction varied. This sheet is displaying the
selling price with the increasing salesprice.

www.bispsolutions.com www.bisptrainigs.com www.hyperionguru.com Page 8
Step 14) If we want to see the change the variation on the selling price of the both data till year 2000 and from year 2000 you can draw a graph for both in a single sheet.
Step 15) For this firstly we have to create the
Relation between the both data sources’s
Data.

www.bispsolutions.com www.bisptrainigs.com www.hyperionguru.com Page 9
Step 16) This will explore a window which ask for primary and secondary data source. Here Product_Till2000 will be our primary data source and Product_from2000 will be our secondary datasource. The join will be created using the productname which is same in both tables.
Step 17) Now the join will
Created here between the two places.
www.bispsolutions.com www.bisptrainigs.com www.hyperionguru.com Page 10
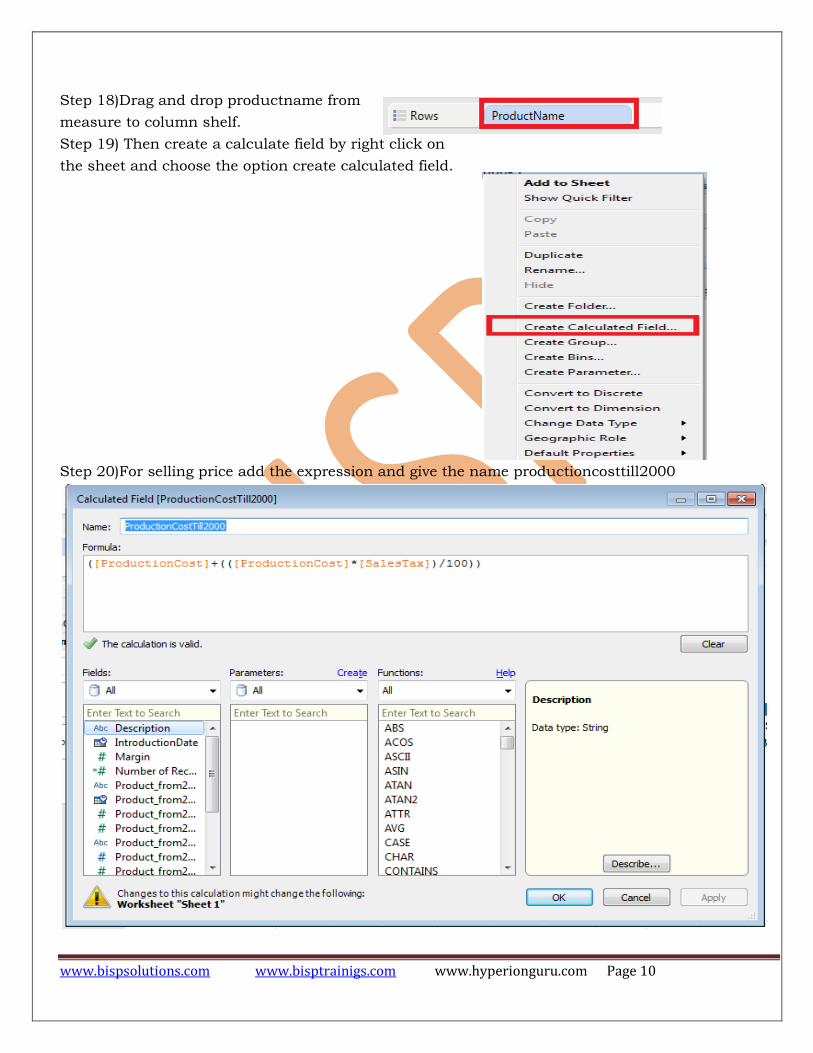
Step 18)Drag and drop productname from
measure to column shelf.
Step 19) Then create a calculate field by right click on
the sheet and choose the option create calculated field.
Step 20)For selling price add the expression and give the name productioncosttill2000

www.bispsolutions.com www.bisptrainigs.com www.hyperionguru.com Page 11
(sum(productioncost)+(sum(salestax)*sum(productioncost))/100) this will calculate the selling price and an separate field as named Selling price.then apply and then ok.
Step 21) Do the same procedure with the field salestax of the product from 2000.
Step 22)The both calculated fields are created here.
Step 23) By pressing cntrl key select both and right click on the measure shelf and choose the
option add to sheet.

www.bispsolutions.com www.bisptrainigs.com www.hyperionguru.com Page 12
Step 24)Now select bar chart from the show me toolbar.

www.bispsolutions.com www.bisptrainigs.com www.hyperionguru.com Page 13
Step 25)The below chats shows data taken from Excel and SQL Server, Selling price revised due to increase in Sales Tax.