Table of Contents - VMwaredocs.hol.vmware.com/HOL-2014/hol-prt-1470_pdf_en.pdf · Table of Contents...
66
Table of Contents Lab Overview - HOL-PRT-1470 - HP OneView & StoreFront Analytics for vCenter Operations Manager ......................................................................................................... 2 Lab Guidance .......................................................................................................... 3 Module 1 - HP OneView - Deploy VSA (30 Min) ................................................................. 4 Overview ................................................................................................................. 5 Access the vCenter Web Client ............................................................................... 7 HP OneView vCenter Plugin - Simple local storage to HA SAN datastore ................ 9 Module 2 - Troubleshoot a VM & Storage performance problem (30 Min) ....................... 28 Overview ............................................................................................................... 29 Access vCenter Operations Manager vSphere UI .................................................. 30 Identification of Storage System and Health through dashboards and widgets .... 32 Examine Storage Array capacity using HP Storage Monitoring Dashboard ........... 34 Troubleshooting dependencies: HP Storage Troubleshooting Dashboard .............. 38 HP Storage Performance Dashboard ..................................................................... 46 Module 3 - Use Super Metrics to see what's important to you! (30 Min) ......................... 50 Overview ............................................................................................................... 51 Creating Super Metrics .......................................................................................... 52 Viewing your Super Metrics ................................................................................... 59 HOL-PRT-1470 Page 1 HOL-PRT-1470
Transcript of Table of Contents - VMwaredocs.hol.vmware.com/HOL-2014/hol-prt-1470_pdf_en.pdf · Table of Contents...
Table of ContentsLab Overview - HOL-PRT-1470 - HP OneView & StoreFront Analytics for vCenterOperations Manager ......................................................................................................... 2
Lab Guidance .......................................................................................................... 3Module 1 - HP OneView - Deploy VSA (30 Min) ................................................................. 4
Overview................................................................................................................. 5Access the vCenter Web Client ............................................................................... 7HP OneView vCenter Plugin - Simple local storage to HA SAN datastore ................9
Module 2 - Troubleshoot a VM & Storage performance problem (30 Min) .......................28Overview............................................................................................................... 29Access vCenter Operations Manager vSphere UI .................................................. 30Identification of Storage System and Health through dashboards and widgets ....32Examine Storage Array capacity using HP Storage Monitoring Dashboard ...........34Troubleshooting dependencies: HP Storage Troubleshooting Dashboard ..............38HP Storage Performance Dashboard ..................................................................... 46
Module 3 - Use Super Metrics to see what's important to you! (30 Min).........................50Overview............................................................................................................... 51Creating Super Metrics.......................................................................................... 52Viewing your Super Metrics................................................................................... 59
HOL-PRT-1470
Page 1HOL-PRT-1470
Lab Overview - HOL-PRT-1470 - HP OneView &StoreFront Analytics for
vCenter OperationsManager
HOL-PRT-1470
Page 2HOL-PRT-1470
Lab GuidanceWelcome to the HP Hands-On-Lab, HOL-PRT-1470.
In this Lab, we hope that you will enjoy using HP OneView for VMware vCenter andVMware vSphere with Operations Management (Advanced) to run through aperformance troubleshooting scenario using HP StoreFront Analytics.
If you have ANY questions or feedback, HP experts who created the environment thatyou’re using are proctoring the Hands-On-Lab and would love to come and help, answerany questions, or receive any tips about something that could be done better. All youhave to do is click the HELP button above, and someone will come to see you! We hopeyou enjoy the lab!
Thank you very much for your time and the opportunity to be of service.
HOL-PRT-1470
Page 3HOL-PRT-1470
Module 1 - HP OneView -Deploy VSA (30 Min)
HOL-PRT-1470
Page 4HOL-PRT-1470
OverviewHP OneView for VMware vCenter seamlessly integrates the manageability features of HPOneView, HP ProLiant servers, HP BladeSystem, HP Networking, and HP Storage into theVMware vCenter console. The integration of HP OneView with VMware vCenter enablesyou to take the next step toward the Software Defined Data Center (SDDC) by allowingvirtualization administrators to automate control of HP compute, storage, andnetworking resources without detailed knowledge of each device. Today, HP OneView forVMware vCenter is the only platform that can provision, monitor, update, and scaleresources without having to leave the vCenter console.
This lab will focus on the virtualized storage capabilities.
But wait, you might say to yourself... "Don't I need HP Storage to enable thesefeatures?" The HP StoreVirtual VSA Software turns localized storage from ESXi serversinto a pool of highly available virtualized SAN storage, simply managed, simply scalableand simply enterprise. The HP StoreVirtual VSA enables SAN features of the hypervisorwithout the need for any specialized hardware. In fact, as a VMware Certified Appliance,ANY VMware supported storage, local or SAN, may be utilized. The automated VSAdeployment within HP OneView today recognizes only the local storage to ensure highlyavailable simplicity.
We will step thru the tasks that VMware vCenter administrators can use with the samefamiliar VMware management tool to provision, monitor, update, and scale withouthaving to leave the vCenter console. This integration simplifies everyday managementtasks. For this lab, HP and VMware will show that separate storage configurationapplications are no longer required for configuration and deployment. Furthersimplifying VMware vCenter Storage configuration management tasks with HP OneViewvCenter integration wizards, OneView and vCenter make the delivery and maintenanceof IT services fast, cost-effective and reliable in any VMware datacenter.
Imagine a highly available datastore created from local storage on ESXi servers from afew clicks... all fully automated. By utilizing the free HP OneView storage module in aSoftware Defined Data Center (SDDC), we will step thru the automated deployment ofthe HP StoreVirtual VSA Software as a Virtual Storage Appliance that provides completearray functionality of HP StoreVirtual 4000 Storage on top of VMware vSphereenvironments without external array hardware. In this magnificent VMware SoftwareDefined Data Center leveraging vCloud Director, the HP StoreVirtual VSA enablesvirtualized local storage to become a highly avaible SAN, further extending and enablinghypervisor features without sacrificing enterprise SAN features whether based uponphysical HP StoreVirtual hardware platforms or software platforms based uponbaremetal hypervisors or nested within vCloud Director vPODs.
The HP OneView Storage module provides the benefits of:
HOL-PRT-1470
Page 5HOL-PRT-1470
* Monitoring health, configuration and capacity of HP Sorage in VMware vCenter* Visualizing the relationship between the VMware virtual machines, ESXi servers
and HP Storage arrays* Create, expand or delete data stores on HP arrays* Build a virtual machine from a template on HP arrays* Include vSphere Storage application interfaces (APIs) for Storage Awareness
(VASA) for HP arrays.
In this portion of the lab, we will deploy a highly available clustered SAN from thelocalized virtual space on three (3) virtualized ESXi servers within your private vPOD.With a simple selection of which ESXi servers, specifying the amount of storage toutilize, and a couple specific data entries, a highly available datastore is created.
Don't worry if even if this explanation sounds complicated to you... it is really quitesimple...
So let's get started...
HOL-PRT-1470
Page 6HOL-PRT-1470
Access the vCenter Web ClientThe first module of this lab will depend upon access to the VMware vSphere Web Clientaccess to vCenter.
Environment access login has been automated with Internet Explorer or alternativelymanually selected from FireFox, Chrome or IE.
HOL-PRT-1470
Page 7HOL-PRT-1470
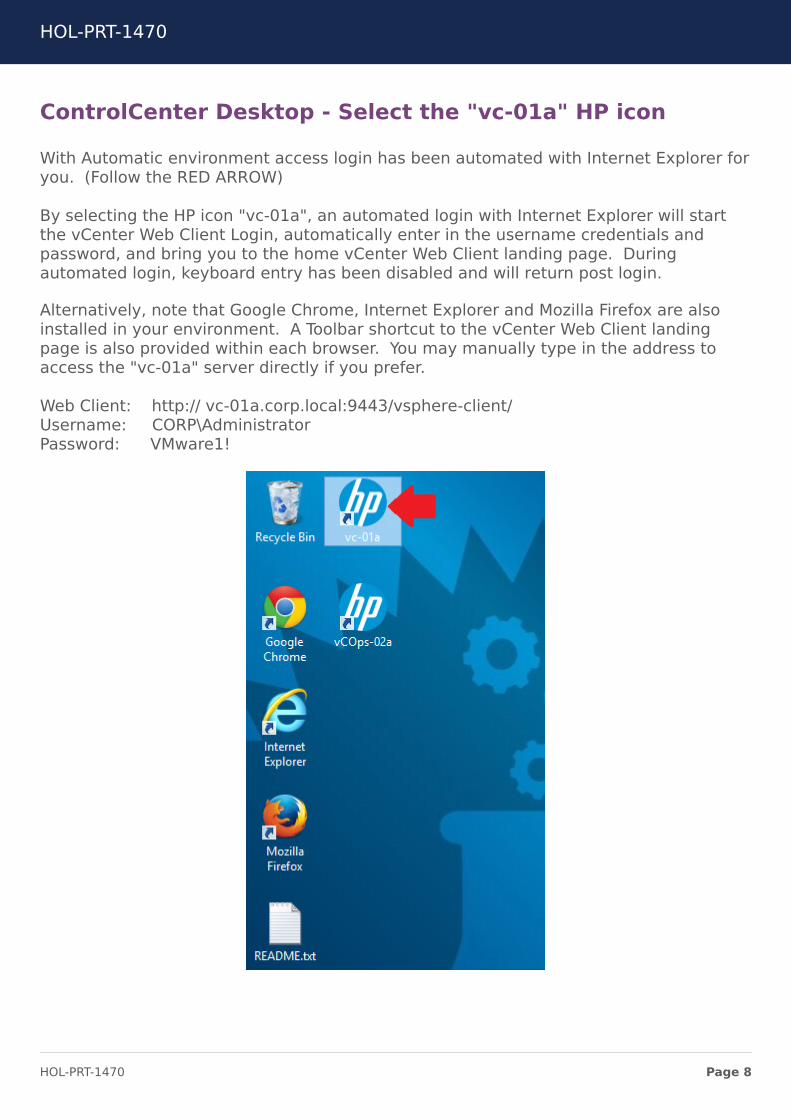
ControlCenter Desktop - Select the "vc-01a" HP icon
With Automatic environment access login has been automated with Internet Explorer foryou. (Follow the RED ARROW)
By selecting the HP icon "vc-01a", an automated login with Internet Explorer will startthe vCenter Web Client Login, automatically enter in the username credentials andpassword, and bring you to the home vCenter Web Client landing page. Duringautomated login, keyboard entry has been disabled and will return post login.
Alternatively, note that Google Chrome, Internet Explorer and Mozilla Firefox are alsoinstalled in your environment. A Toolbar shortcut to the vCenter Web Client landingpage is also provided within each browser. You may manually type in the address toaccess the "vc-01a" server directly if you prefer.
Web Client: http:// vc-01a.corp.local:9443/vsphere-client/Username: CORP\AdministratorPassword: VMware1!
HOL-PRT-1470
Page 8HOL-PRT-1470
HP OneView vCenter Plugin - Simplelocal storage to HA SAN datastoreIn this module, we will leverage the HP OneView vCenter plugin to automatically deploythe HP StoreVirtual VSA software to three ESXi hosts, configure a highly available pool ofclustered storage, and prepare the volume as a datastore, ready to be used by themanaged vSphere clustered pool of hosts. All of this is optimally automated withminimum configuration environment requirements with best practice designs.
HOL-PRT-1470
Page 9HOL-PRT-1470
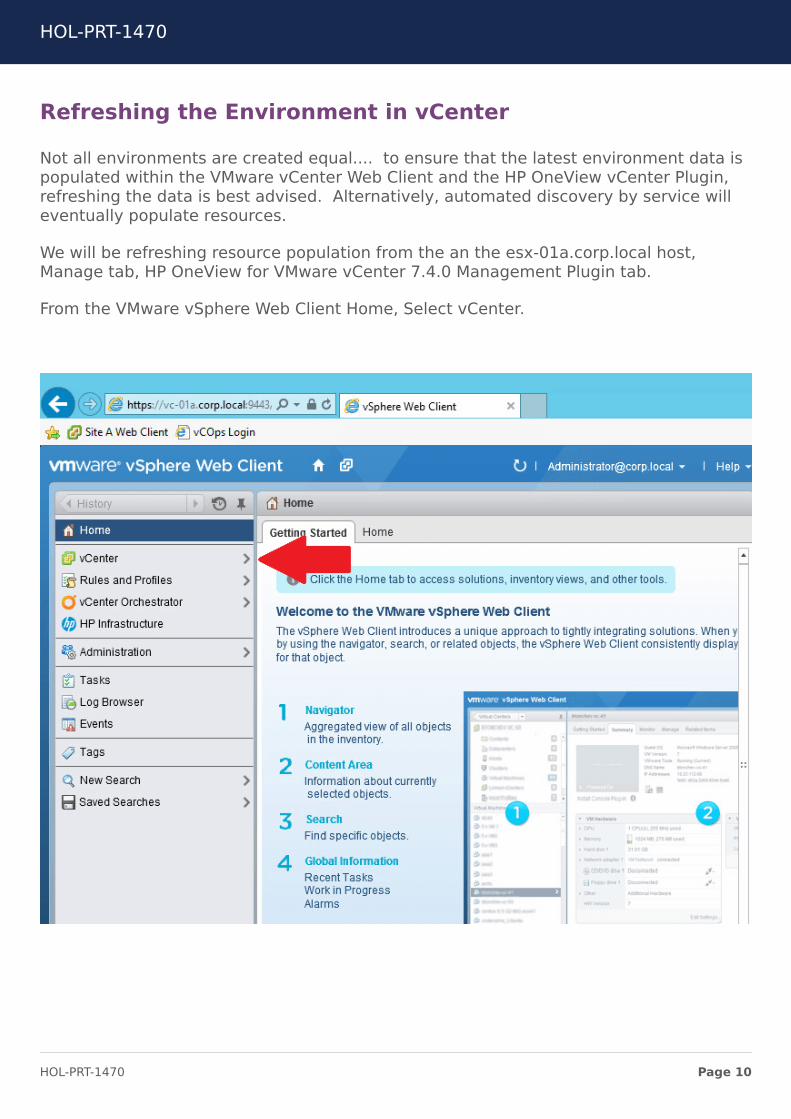
Refreshing the Environment in vCenter
Not all environments are created equal.... to ensure that the latest environment data ispopulated within the VMware vCenter Web Client and the HP OneView vCenter Plugin,refreshing the data is best advised. Alternatively, automated discovery by service willeventually populate resources.
We will be refreshing resource population from the an the esx-01a.corp.local host,Manage tab, HP OneView for VMware vCenter 7.4.0 Management Plugin tab.
From the VMware vSphere Web Client Home, Select vCenter.
HOL-PRT-1470
Page 10HOL-PRT-1470
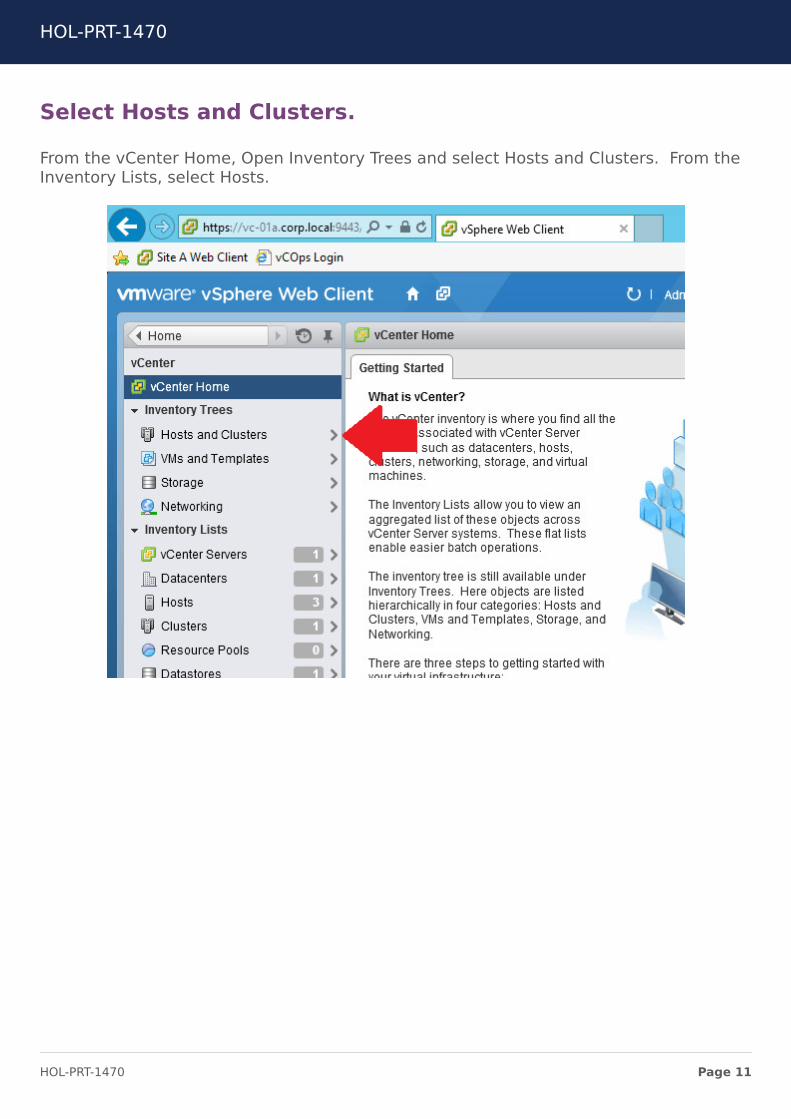
Select Hosts and Clusters.
From the vCenter Home, Open Inventory Trees and select Hosts and Clusters. From theInventory Lists, select Hosts.
HOL-PRT-1470
Page 11HOL-PRT-1470
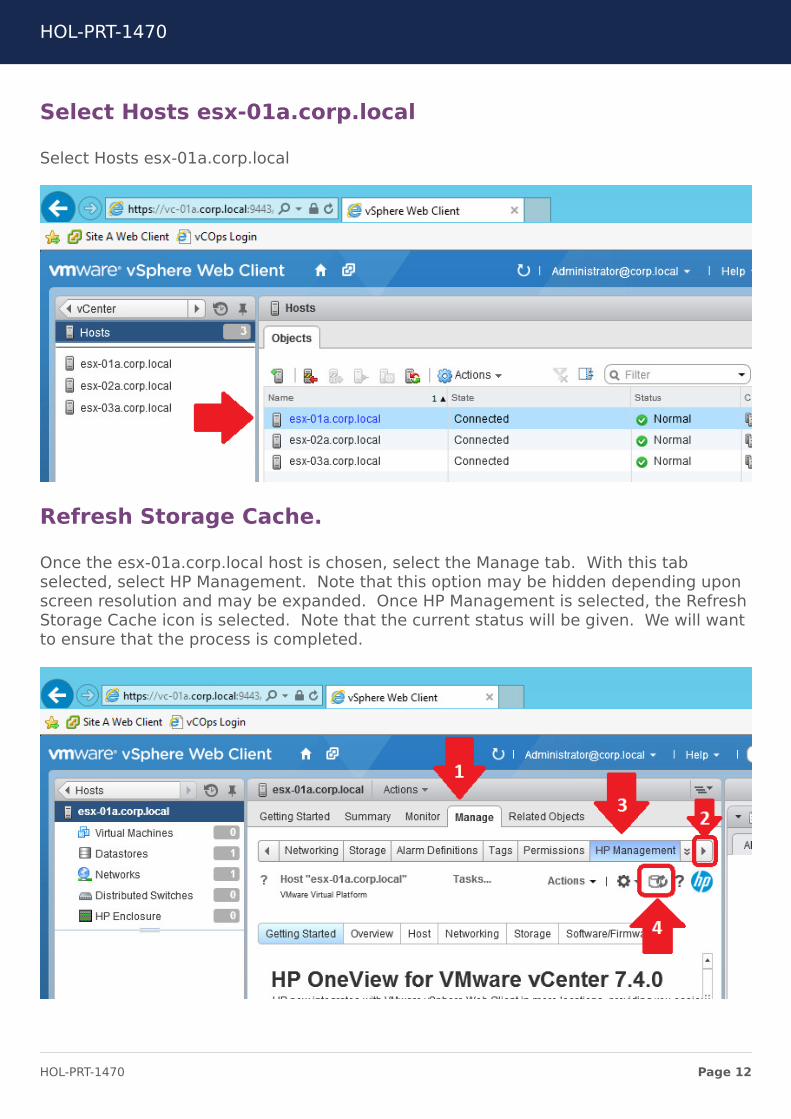
Select Hosts esx-01a.corp.local
Select Hosts esx-01a.corp.local
Refresh Storage Cache.
Once the esx-01a.corp.local host is chosen, select the Manage tab. With this tabselected, select HP Management. Note that this option may be hidden depending uponscreen resolution and may be expanded. Once HP Management is selected, the RefreshStorage Cache icon is selected. Note that the current status will be given. We will wantto ensure that the process is completed.
HOL-PRT-1470
Page 12HOL-PRT-1470
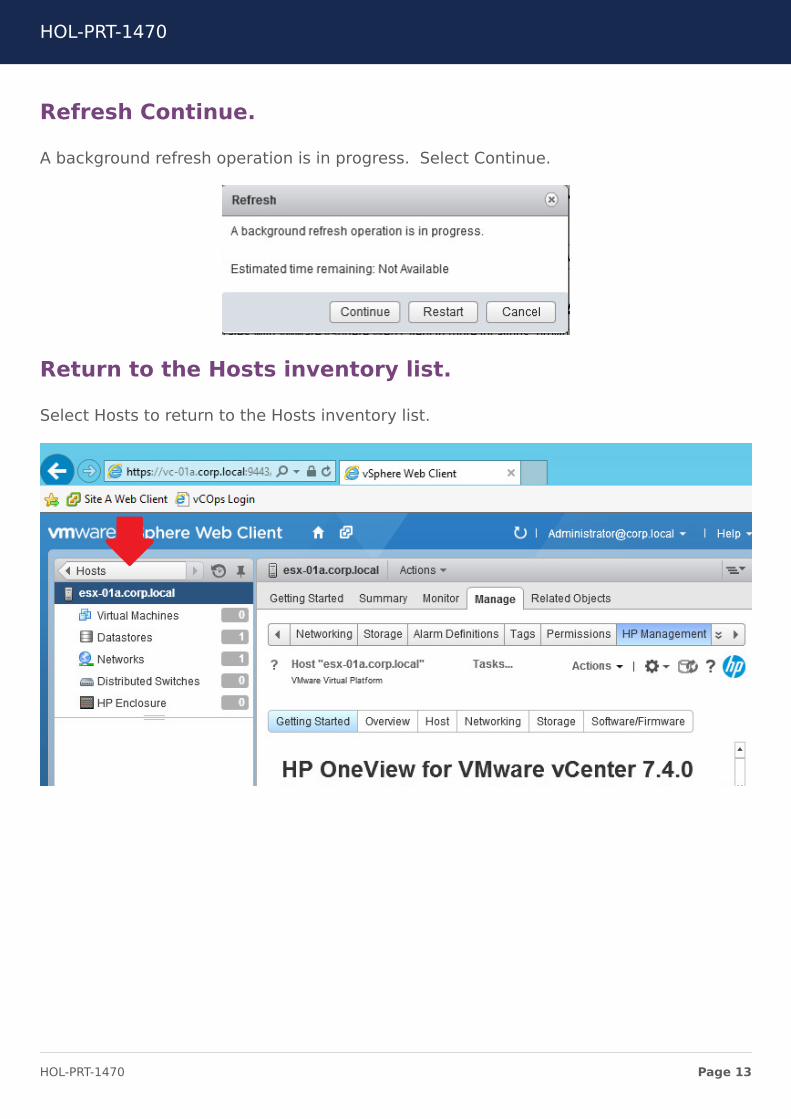
Refresh Continue.
A background refresh operation is in progress. Select Continue.
Return to the Hosts inventory list.
Select Hosts to return to the Hosts inventory list.
HOL-PRT-1470
Page 13HOL-PRT-1470
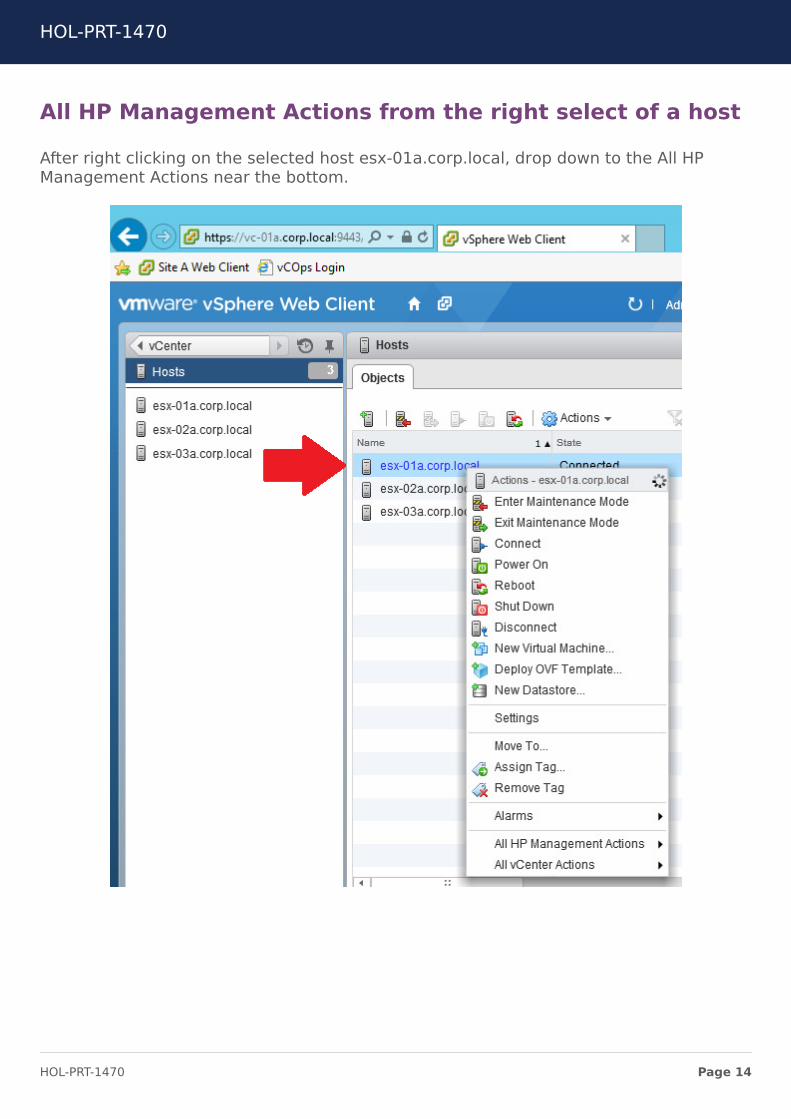
All HP Management Actions from the right select of a host
After right clicking on the selected host esx-01a.corp.local, drop down to the All HPManagement Actions near the bottom.
HOL-PRT-1470
Page 14HOL-PRT-1470

Select Deploy HP VSA...
By selecting the All HP Management Actions option, the Deploy HP VSA... may beselected.
HOL-PRT-1470
Page 15HOL-PRT-1470
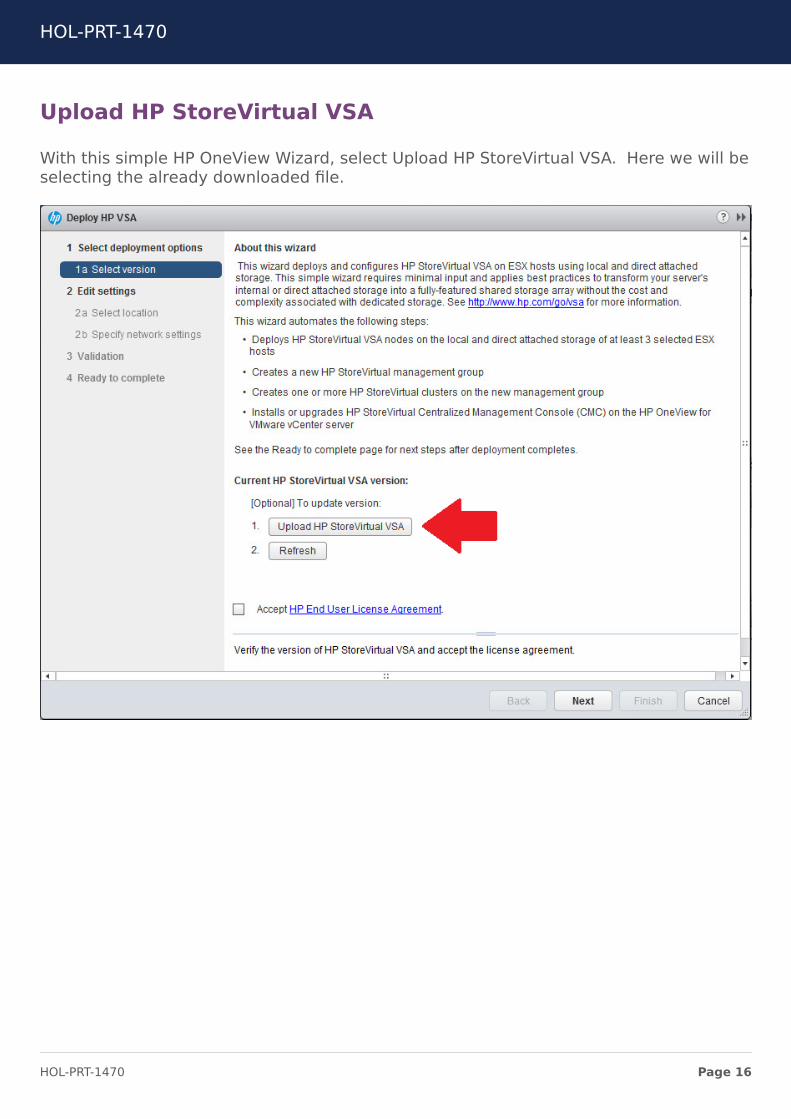
Upload HP StoreVirtual VSA
With this simple HP OneView Wizard, select Upload HP StoreVirtual VSA. Here we will beselecting the already downloaded file.
HOL-PRT-1470
Page 16HOL-PRT-1470
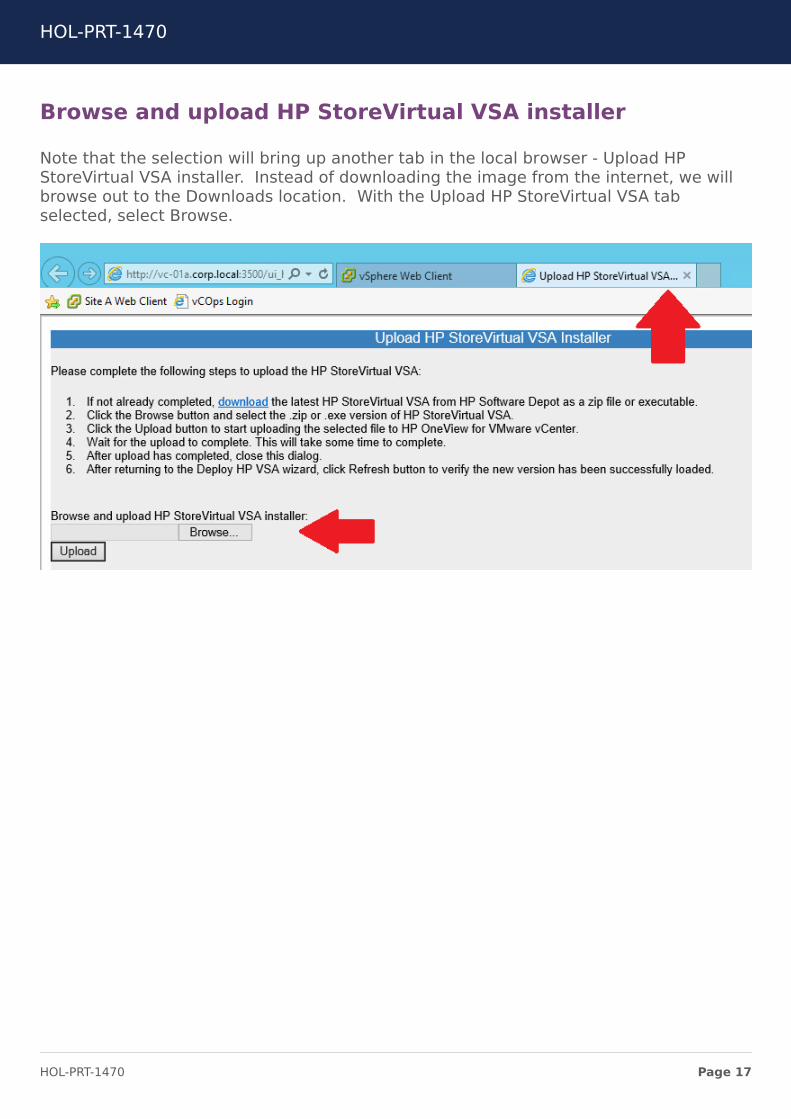
Browse and upload HP StoreVirtual VSA installer
Note that the selection will bring up another tab in the local browser - Upload HPStoreVirtual VSA installer. Instead of downloading the image from the internet, we willbrowse out to the Downloads location. With the Upload HP StoreVirtual VSA tabselected, select Browse.
HOL-PRT-1470
Page 17HOL-PRT-1470
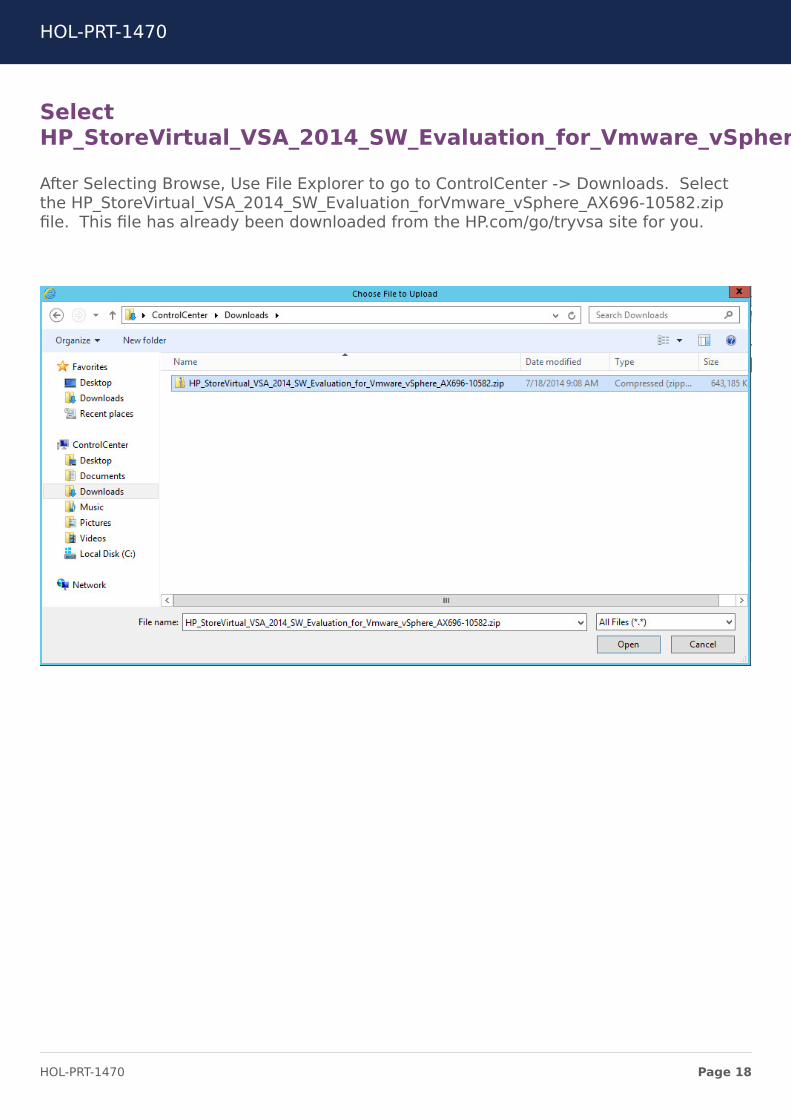
SelectHP_StoreVirtual_VSA_2014_SW_Evaluation_for_Vmware_vSphere_AX696-10582.zip
After Selecting Browse, Use File Explorer to go to ControlCenter -> Downloads. Selectthe HP_StoreVirtual_VSA_2014_SW_Evaluation_forVmware_vSphere_AX696-10582.zipfile. This file has already been downloaded from the HP.com/go/tryvsa site for you.
HOL-PRT-1470
Page 18HOL-PRT-1470
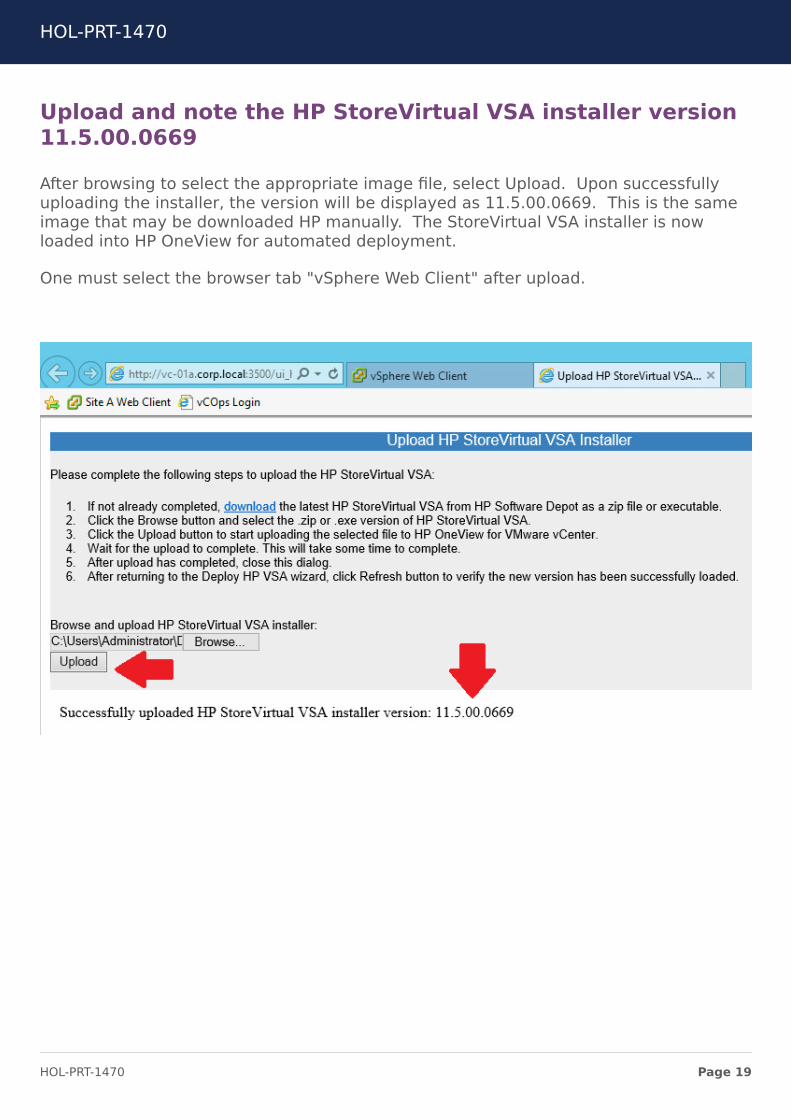
Upload and note the HP StoreVirtual VSA installer version11.5.00.0669
After browsing to select the appropriate image file, select Upload. Upon successfullyuploading the installer, the version will be displayed as 11.5.00.0669. This is the sameimage that may be downloaded HP manually. The StoreVirtual VSA installer is nowloaded into HP OneView for automated deployment.
One must select the browser tab "vSphere Web Client" after upload.
HOL-PRT-1470
Page 19HOL-PRT-1470
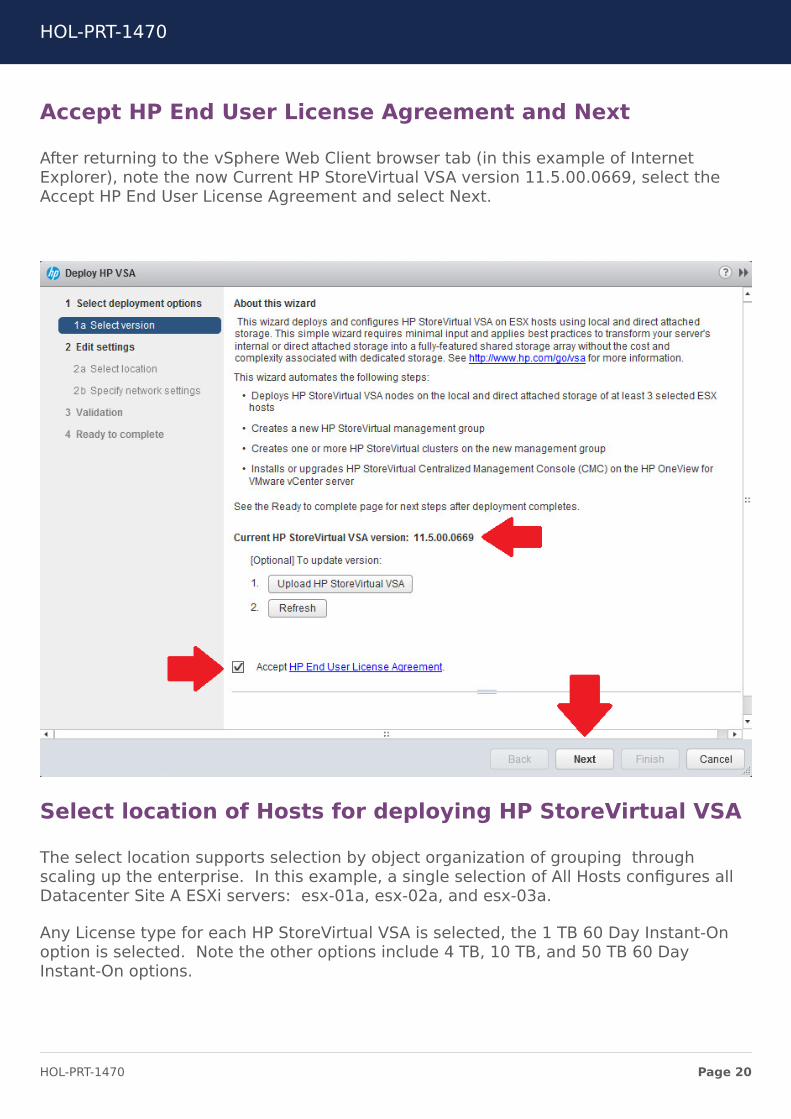
Accept HP End User License Agreement and Next
After returning to the vSphere Web Client browser tab (in this example of InternetExplorer), note the now Current HP StoreVirtual VSA version 11.5.00.0669, select theAccept HP End User License Agreement and select Next.
Select location of Hosts for deploying HP StoreVirtual VSA
The select location supports selection by object organization of grouping throughscaling up the enterprise. In this example, a single selection of All Hosts configures allDatacenter Site A ESXi servers: esx-01a, esx-02a, and esx-03a.
Any License type for each HP StoreVirtual VSA is selected, the 1 TB 60 Day Instant-Onoption is selected. Note the other options include 4 TB, 10 TB, and 50 TB 60 DayInstant-On options.
HOL-PRT-1470
Page 20HOL-PRT-1470
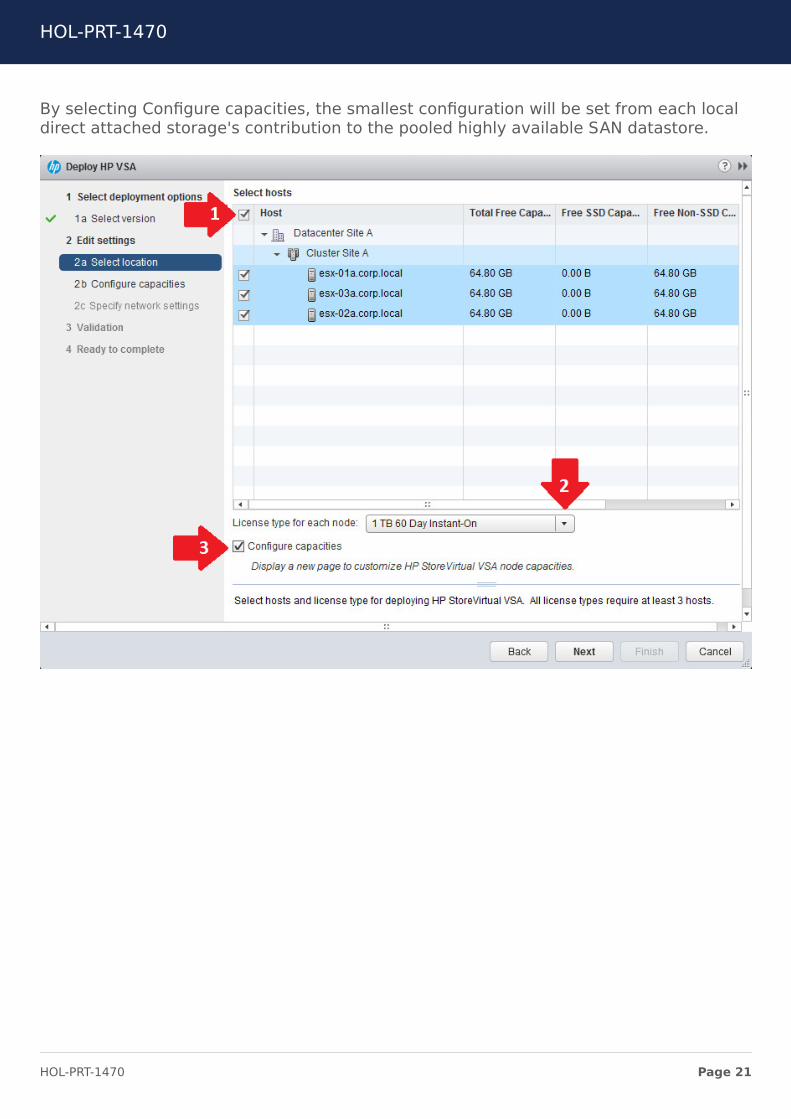
By selecting Configure capacities, the smallest configuration will be set from each localdirect attached storage's contribution to the pooled highly available SAN datastore.
HOL-PRT-1470
Page 21HOL-PRT-1470
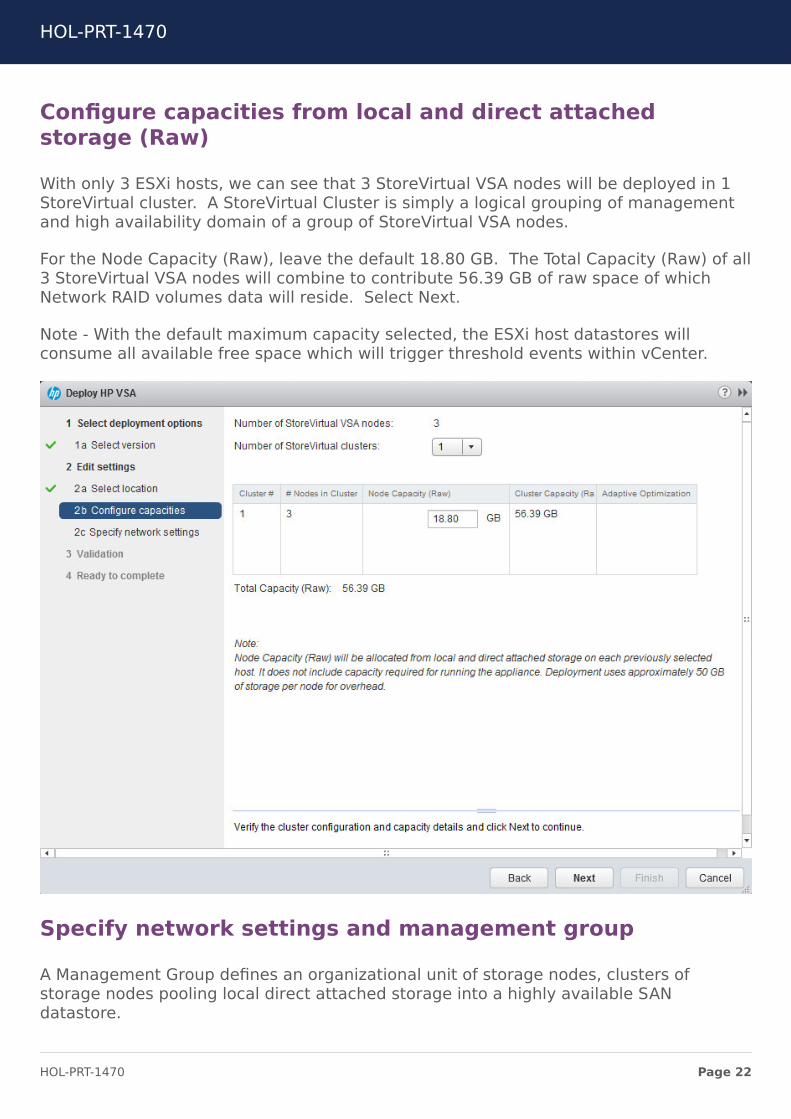
Configure capacities from local and direct attachedstorage (Raw)
With only 3 ESXi hosts, we can see that 3 StoreVirtual VSA nodes will be deployed in 1StoreVirtual cluster. A StoreVirtual Cluster is simply a logical grouping of managementand high availability domain of a group of StoreVirtual VSA nodes.
For the Node Capacity (Raw), leave the default 18.80 GB. The Total Capacity (Raw) of all3 StoreVirtual VSA nodes will combine to contribute 56.39 GB of raw space of whichNetwork RAID volumes data will reside. Select Next.
Note - With the default maximum capacity selected, the ESXi host datastores willconsume all available free space which will trigger threshold events within vCenter.
Specify network settings and management group
A Management Group defines an organizational unit of storage nodes, clusters ofstorage nodes pooling local direct attached storage into a highly available SANdatastore.
HOL-PRT-1470
Page 22HOL-PRT-1470
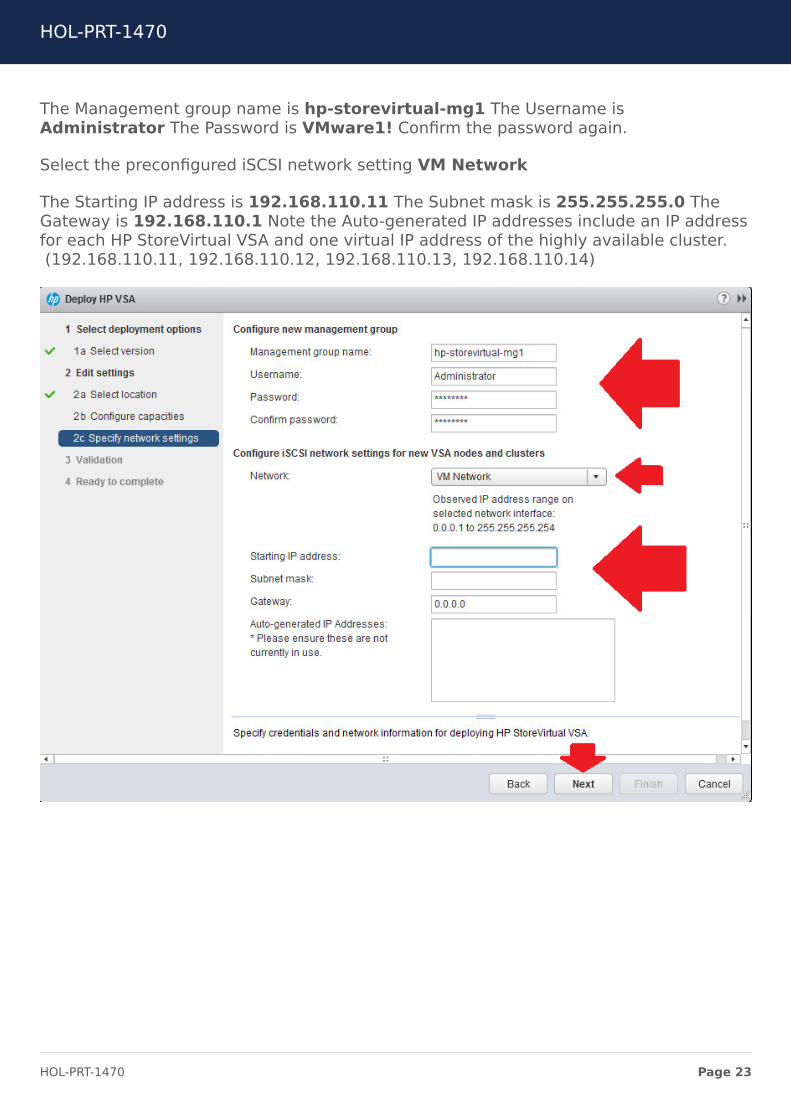
The Management group name is hp-storevirtual-mg1 The Username isAdministrator The Password is VMware1! Confirm the password again.
Select the preconfigured iSCSI network setting VM Network
The Starting IP address is 192.168.110.11 The Subnet mask is 255.255.255.0 TheGateway is 192.168.110.1 Note the Auto-generated IP addresses include an IP addressfor each HP StoreVirtual VSA and one virtual IP address of the highly available cluster.(192.168.110.11, 192.168.110.12, 192.168.110.13, 192.168.110.14)
HOL-PRT-1470
Page 23HOL-PRT-1470
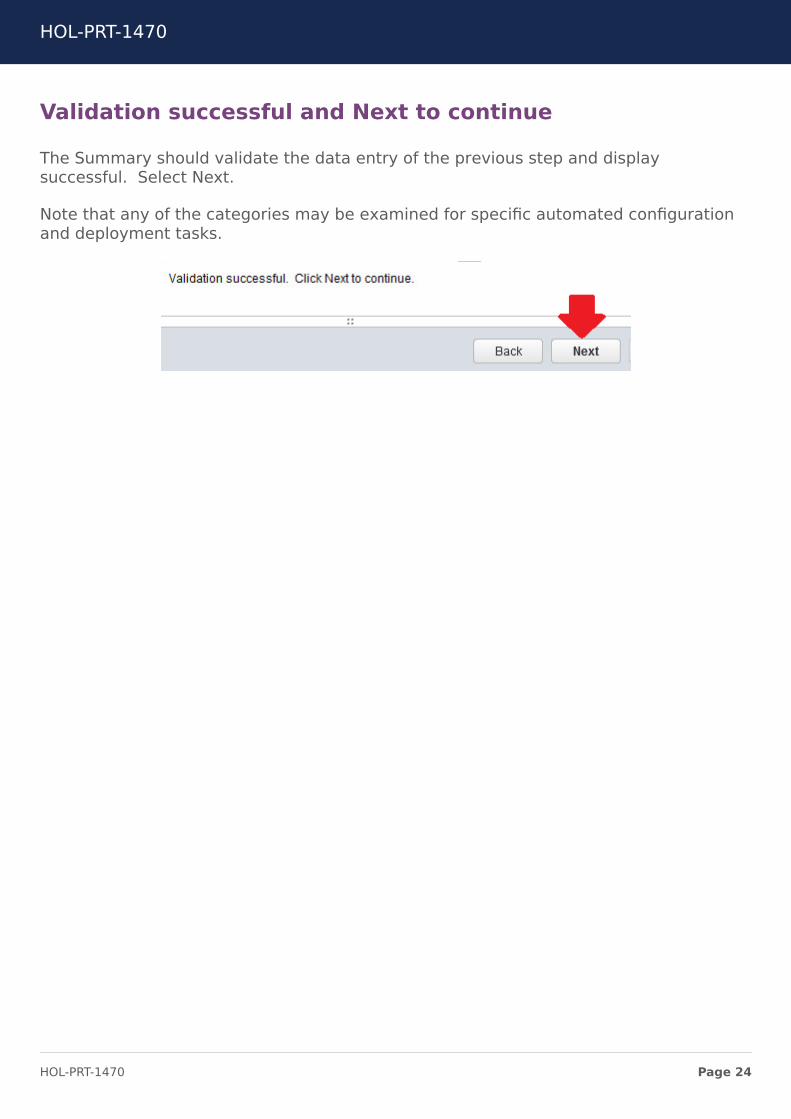
Validation successful and Next to continue
The Summary should validate the data entry of the previous step and displaysuccessful. Select Next.
Note that any of the categories may be examined for specific automated configurationand deployment tasks.
HOL-PRT-1470
Page 24HOL-PRT-1470
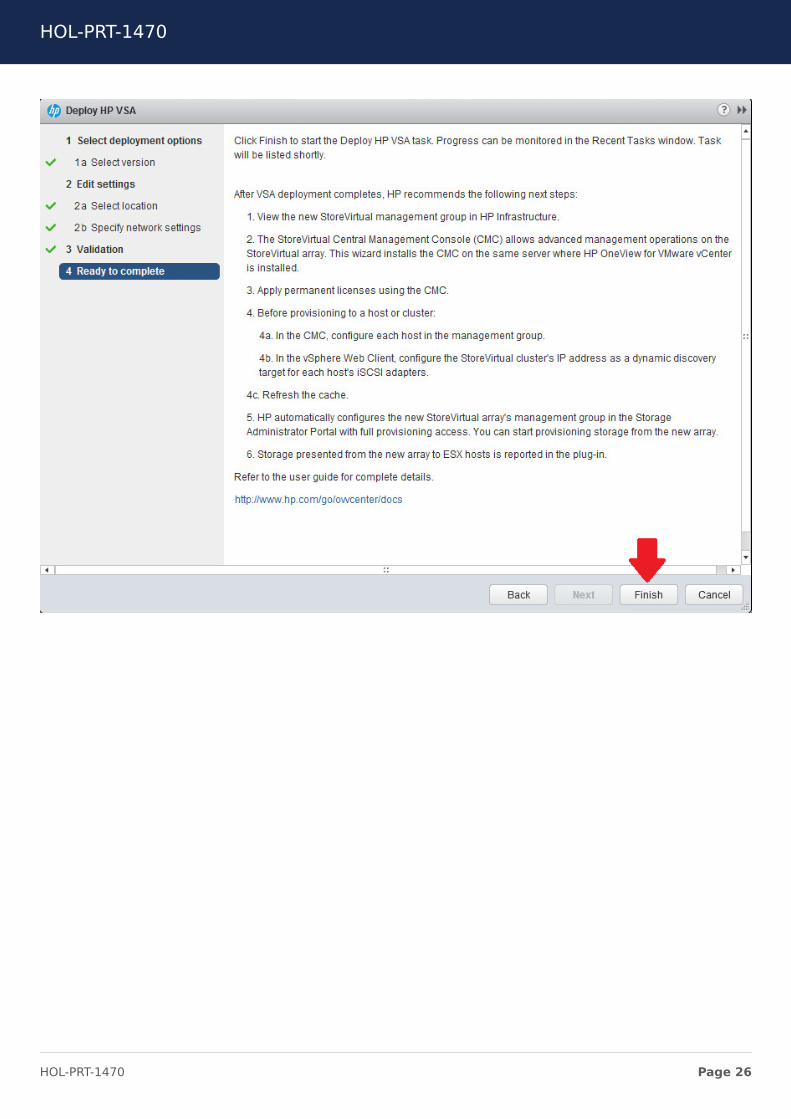
Finish Deploy HP VSA
By selecting Finish, everything will be configured and deployed as defined according tobest practices. Keep in mind that this storage is software defined highly available SANstorage not only enabling hypervisor feature sets, but also providing datastore highavailability through HP StoreVirtual Network RAID on a per volume basis, configured anddeployed within VMware vCenter Web Client integration - and only the smallest exampleof Converged Infrastructure Management from physical servers, networking and storageto virtual machines to software defined appliances such as the HP StoreVirtual VSA, alltightly integrated with VMware vSphere.
We have noted that deployment times, configuration and deployment were at best 45minutes. It is recommended to proceed with the next module which is completelyindependent of this progress.
By selecting Cancel, you will be kind in the land of virtual allocated resources to yourHOL virtual resource sharing neighbor... Either way, Thank YOU for your time andexploration with just how easy HP OneView integrates into vSphere, provides EnterpriseManagement administrative value and Expert Deployment Wizards for highly scalabledeployment, in this Software Defined Storage Storage example of the HP StoreVirtualVSA.
At the end of this Deploy VSA module, one may start the vCOps module by eitherminimizing or closing all open windows and returning to the Control Center desktop.
HOL-PRT-1470
Page 25HOL-PRT-1470
HOL-PRT-1470
Page 26HOL-PRT-1470
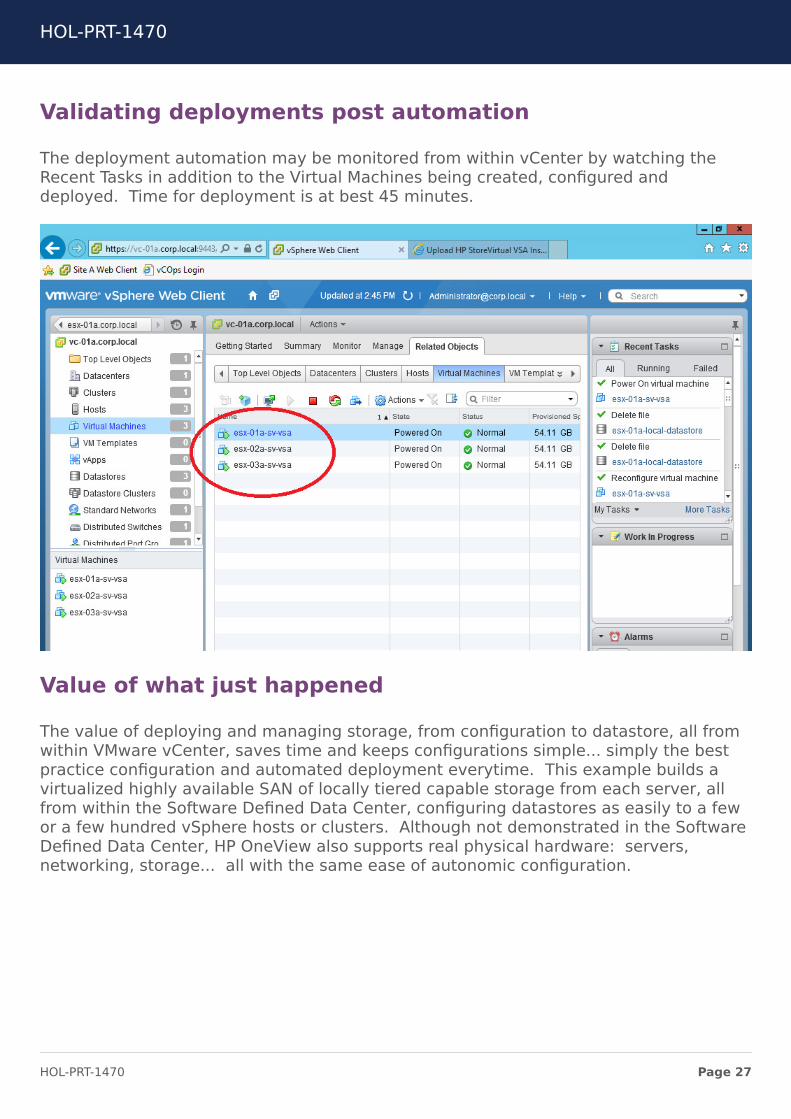
Validating deployments post automation
The deployment automation may be monitored from within vCenter by watching theRecent Tasks in addition to the Virtual Machines being created, configured anddeployed. Time for deployment is at best 45 minutes.
Value of what just happened
The value of deploying and managing storage, from configuration to datastore, all fromwithin VMware vCenter, saves time and keeps configurations simple... simply the bestpractice configuration and automated deployment everytime. This example builds avirtualized highly available SAN of locally tiered capable storage from each server, allfrom within the Software Defined Data Center, configuring datastores as easily to a fewor a few hundred vSphere hosts or clusters. Although not demonstrated in the SoftwareDefined Data Center, HP OneView also supports real physical hardware: servers,networking, storage... all with the same ease of autonomic configuration.
HOL-PRT-1470
Page 27HOL-PRT-1470
Module 2 - Troubleshoot aVM & Storage
performance problem (30Min)
HOL-PRT-1470
Page 28HOL-PRT-1470
OverviewThis module of the lab outlines a typical task of a vSphere admin: Troubleshooting aperformance problem in a vSphere environment with HP 3PAR StoreServ as theunderlying storage, as well as looking at storage capacity. There is of course many wayshow someone can do this, however in this lab we show you a simple, quick and easyway of achieving this by using VMware vCOPS and HP StoreFront Analytics.
We will look at the 3 HP StoreFront Analytics Dashboards, how they can help you andhow to drill down into specific areas to look at information which matters to the aboveuse cases.
This lab has the HP StoreFront Analytics for VMware vCenter Operations ManagerSoftware already installed. With that comes a data collector for HP 3PAR StoreServ and 3dashboards which are being integrated into vCOPS.
All you need to do is to log on to vCOPS using the custom UI.
Our Story for this portion of the lab is that "Victor" or you in this case, the vSphereadministrator, has been asked to do 2 things:
1 ) Create a new VM for the upcoming sales project. Victors challenge is to determine onwhich datastore he should place the vmdk file. Once Victor has that information it iseasy to create and instantiate the VM.
2) Our second request in this story is to determine why the application RAFELD on theRafeld-VM is slow in responding. The challenge is to find the root cause, consideringthere are many virtual and physical layers which could cause performance problems.
HOL-PRT-1470
Page 29HOL-PRT-1470
Access vCenter Operations ManagervSphere UIThe second module of this lab will depend upon access to the VMware vCenterOperations Manager vSphere UI to deliver powerful analytics and deepertroubleshooting tools to administrators.
Environment access login has been automated with Internet Explorer for you. (Followthe RED ARROW)
By selecting the HP icon "vCOps-02a", an automated login with Internet Explorer willstart the vCenter Operations Manager vSphere UI Web Client Login, automatically enterin the username credentials and password, and bring you to the home vCenterOperations Manager World Dashboard Web Client landing page. During automatedlogin, keyboard entry has been disabled and will return post login.
Alternatively, note that Google Chrome, Internet Explorer and Mozilla Firefox are alsoinstalled in your environment. A Toolbar shortcut to the vCenter Operations ManagervSphere UI Web Client landing page is also provided within each browser. You maymanually type in the address to access the "vcops-02a" server directly if you prefer.
Web Client: https://vcops-02a/vcops-custom/
Username: admin
Password: VMware1!
HOL-PRT-1470
Page 30HOL-PRT-1470
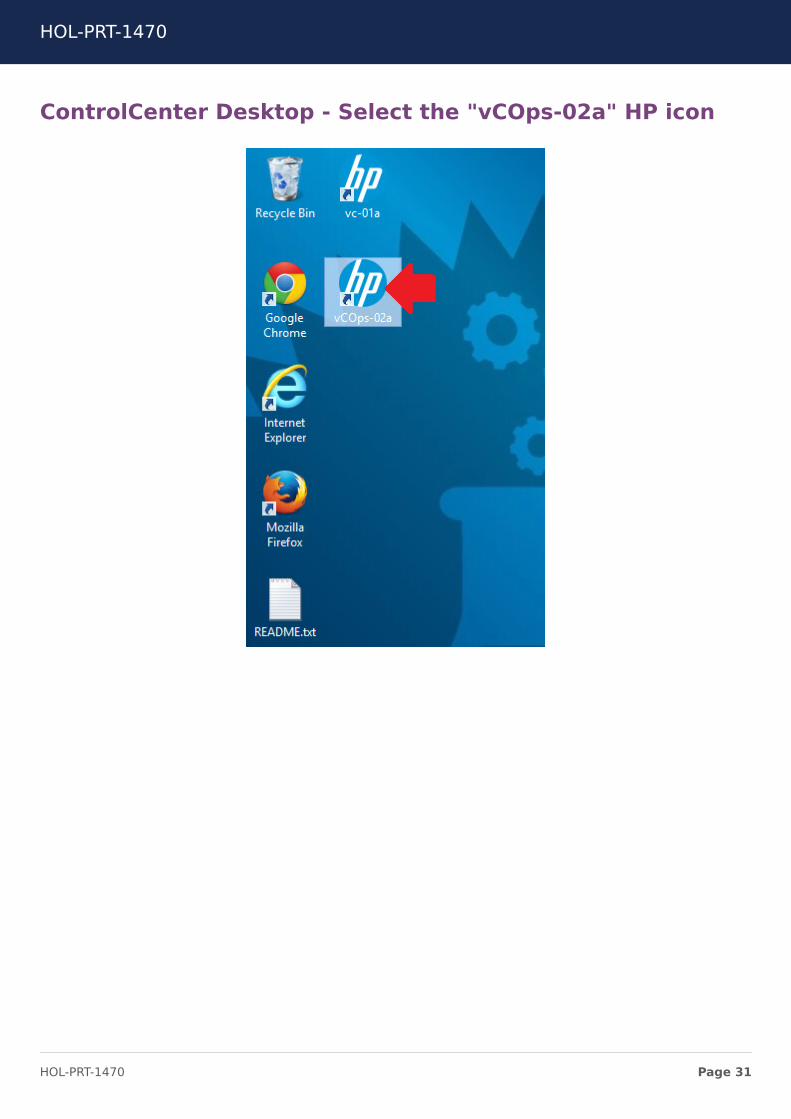
ControlCenter Desktop - Select the "vCOps-02a" HP icon
HOL-PRT-1470
Page 31HOL-PRT-1470
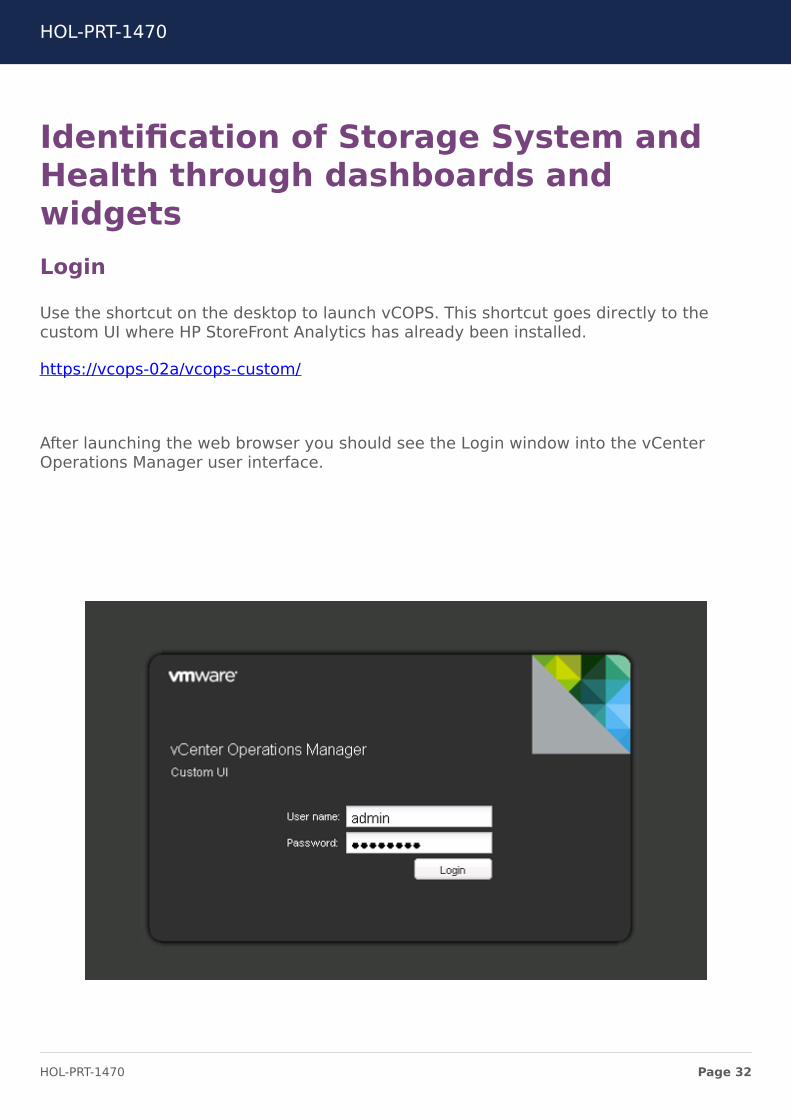
Identification of Storage System andHealth through dashboards andwidgetsLogin
Use the shortcut on the desktop to launch vCOPS. This shortcut goes directly to thecustom UI where HP StoreFront Analytics has already been installed.
https://vcops-02a/vcops-custom/
After launching the web browser you should see the Login window into the vCenterOperations Manager user interface.
HOL-PRT-1470
Page 32HOL-PRT-1470
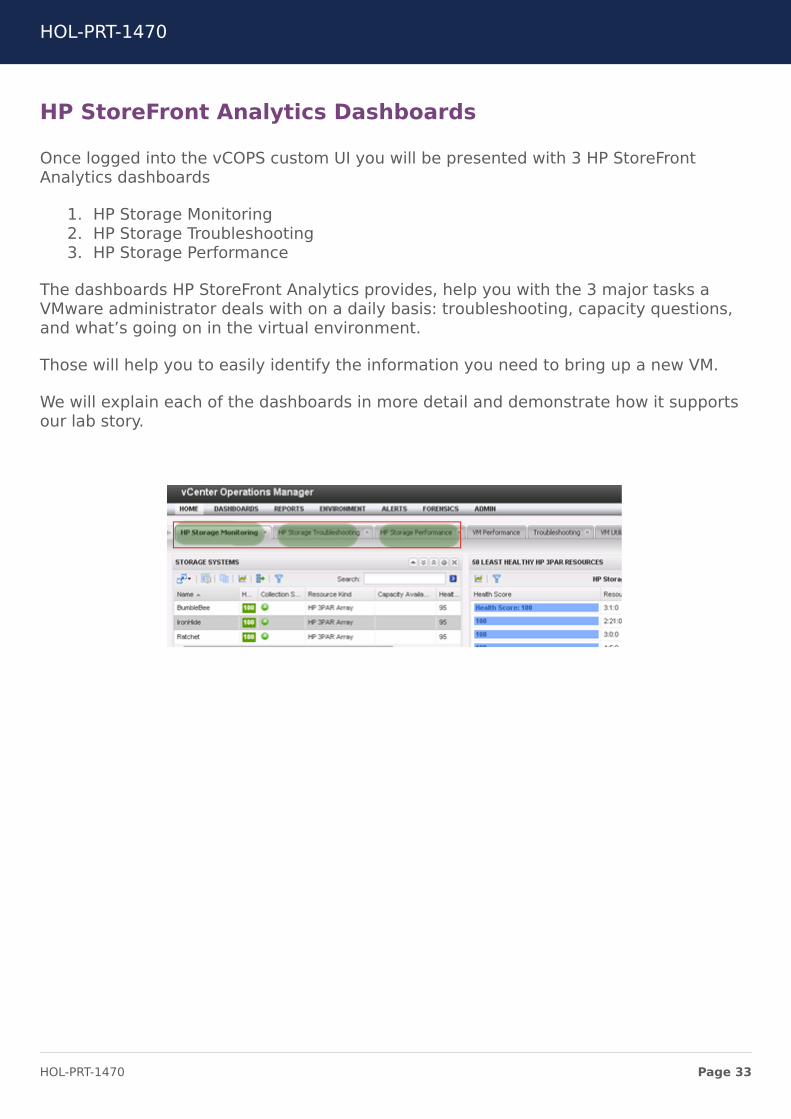
HP StoreFront Analytics Dashboards
Once logged into the vCOPS custom UI you will be presented with 3 HP StoreFrontAnalytics dashboards
1. HP Storage Monitoring2. HP Storage Troubleshooting3. HP Storage Performance
The dashboards HP StoreFront Analytics provides, help you with the 3 major tasks aVMware administrator deals with on a daily basis: troubleshooting, capacity questions,and what’s going on in the virtual environment.
Those will help you to easily identify the information you need to bring up a new VM.
We will explain each of the dashboards in more detail and demonstrate how it supportsour lab story.
HOL-PRT-1470
Page 33HOL-PRT-1470
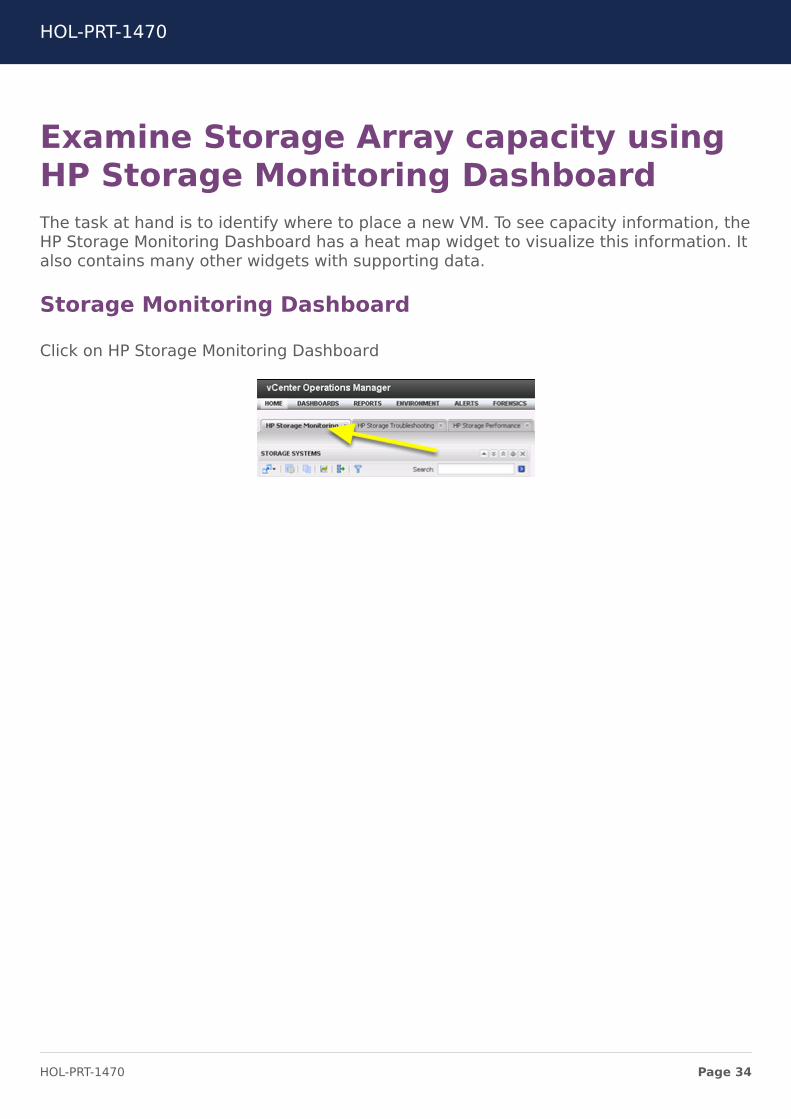
Examine Storage Array capacity usingHP Storage Monitoring DashboardThe task at hand is to identify where to place a new VM. To see capacity information, theHP Storage Monitoring Dashboard has a heat map widget to visualize this information. Italso contains many other widgets with supporting data.
Storage Monitoring Dashboard
Click on HP Storage Monitoring Dashboard
HOL-PRT-1470
Page 34HOL-PRT-1470
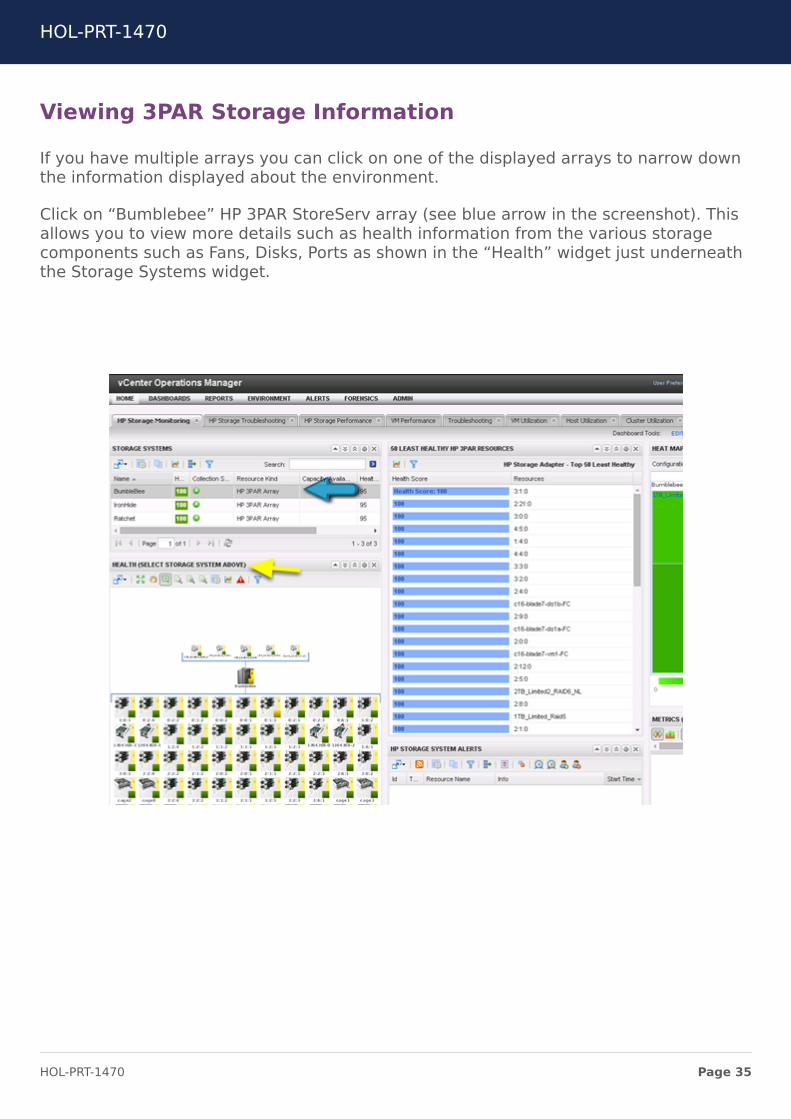
Viewing 3PAR Storage Information
If you have multiple arrays you can click on one of the displayed arrays to narrow downthe information displayed about the environment.
Click on “Bumblebee” HP 3PAR StoreServ array (see blue arrow in the screenshot). Thisallows you to view more details such as health information from the various storagecomponents such as Fans, Disks, Ports as shown in the “Health” widget just underneaththe Storage Systems widget.
HOL-PRT-1470
Page 35HOL-PRT-1470
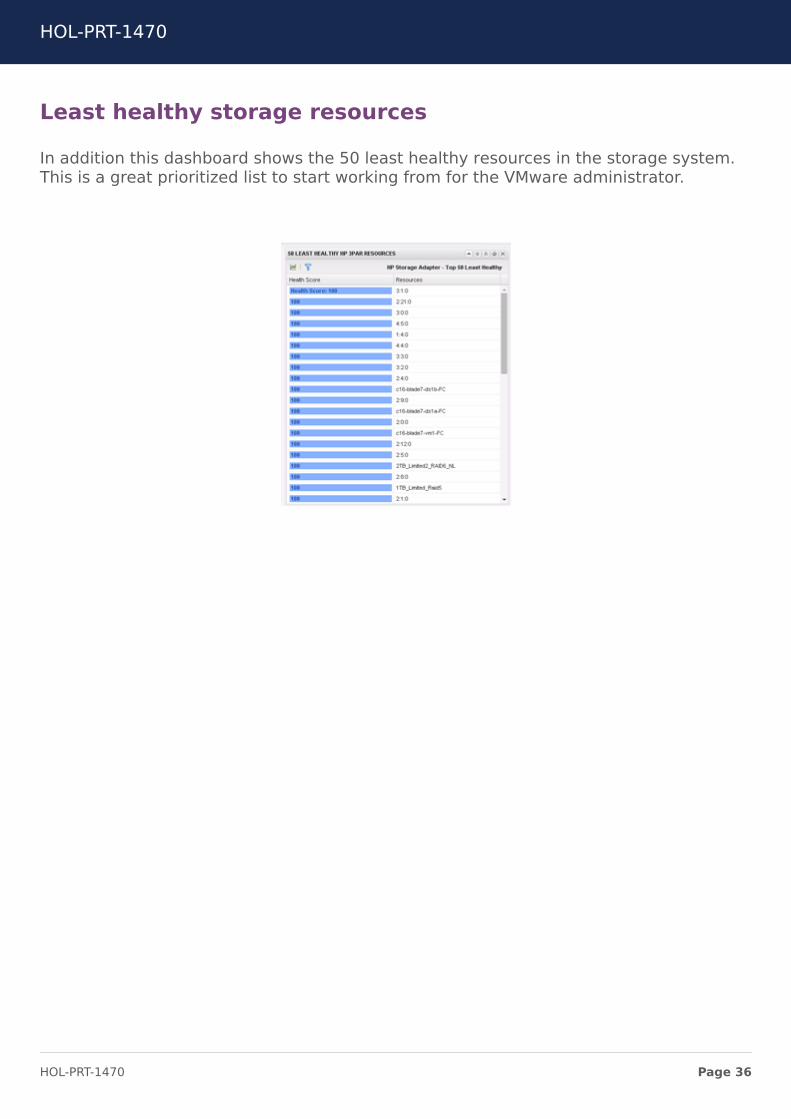
Least healthy storage resources
In addition this dashboard shows the 50 least healthy resources in the storage system.This is a great prioritized list to start working from for the VMware administrator.
HOL-PRT-1470
Page 36HOL-PRT-1470
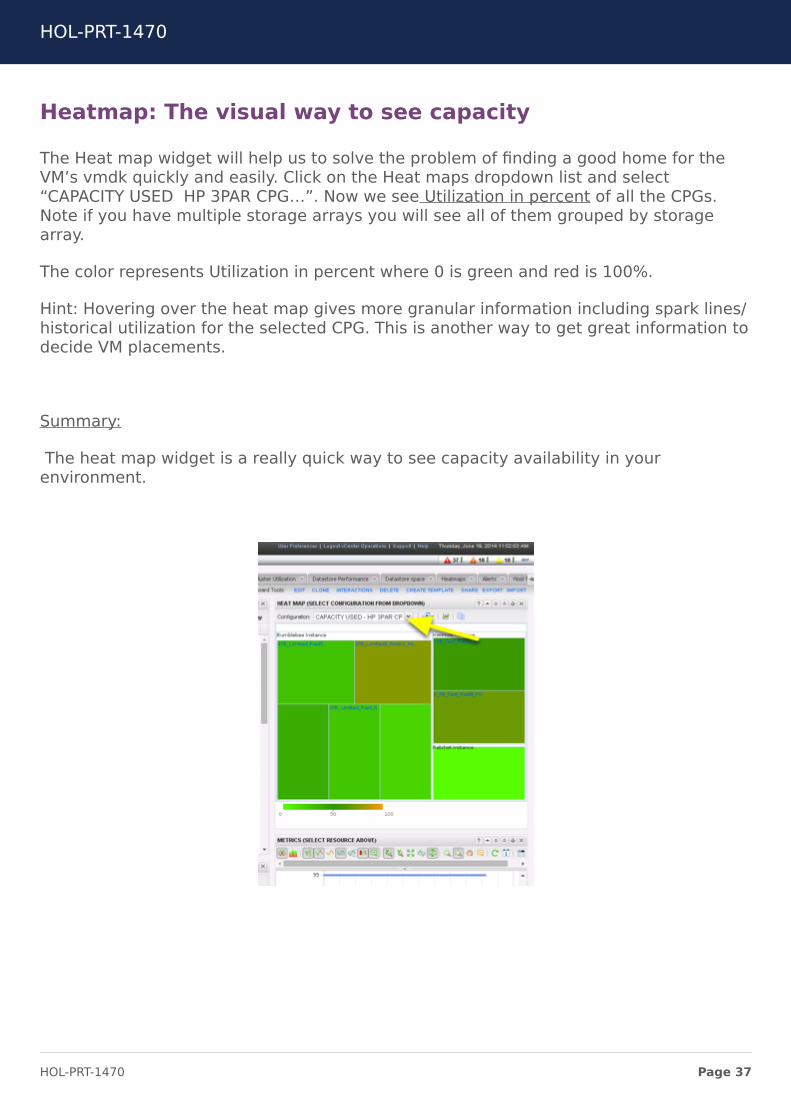
Heatmap: The visual way to see capacity
The Heat map widget will help us to solve the problem of finding a good home for theVM’s vmdk quickly and easily. Click on the Heat maps dropdown list and select“CAPACITY USED HP 3PAR CPG…”. Now we see Utilization in percent of all the CPGs.Note if you have multiple storage arrays you will see all of them grouped by storagearray.
The color represents Utilization in percent where 0 is green and red is 100%.
Hint: Hovering over the heat map gives more granular information including spark lines/historical utilization for the selected CPG. This is another way to get great information todecide VM placements.
Summary:
The heat map widget is a really quick way to see capacity availability in yourenvironment.
HOL-PRT-1470
Page 37HOL-PRT-1470
Troubleshooting dependencies: HPStorage Troubleshooting DashboardVictor also received the request to examine what is going on with their RAFELDapplication. For the purpose of this story: RAFELD is their homegrown application.
The HP Storage Troubleshooting Dashboard can help with it's relevant information tolook at all the potential areas in a virtualized environment which could affect anapplication.
HOL-PRT-1470
Page 38HOL-PRT-1470
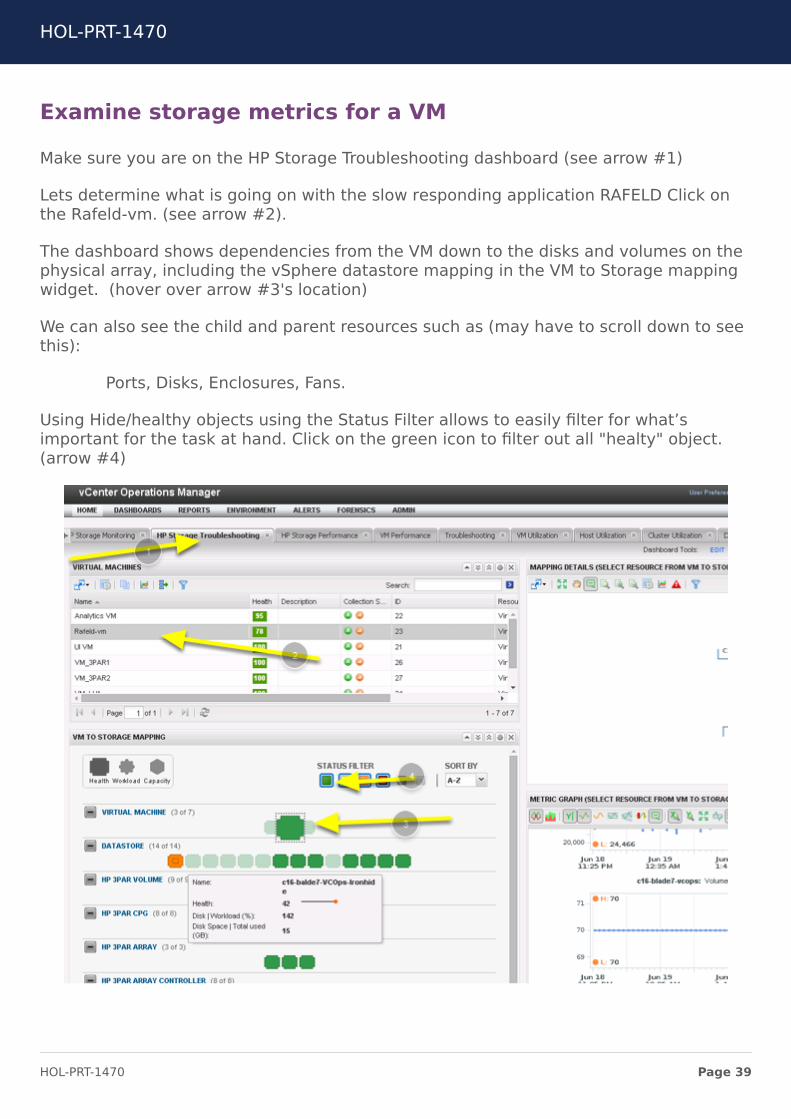
Examine storage metrics for a VM
Make sure you are on the HP Storage Troubleshooting dashboard (see arrow #1)
Lets determine what is going on with the slow responding application RAFELD Click onthe Rafeld-vm. (see arrow #2).
The dashboard shows dependencies from the VM down to the disks and volumes on thephysical array, including the vSphere datastore mapping in the VM to Storage mappingwidget. (hover over arrow #3's location)
We can also see the child and parent resources such as (may have to scroll down to seethis):
Ports, Disks, Enclosures, Fans.
Using Hide/healthy objects using the Status Filter allows to easily filter for what’simportant for the task at hand. Click on the green icon to filter out all "healty" object.(arrow #4)
HOL-PRT-1470
Page 39HOL-PRT-1470
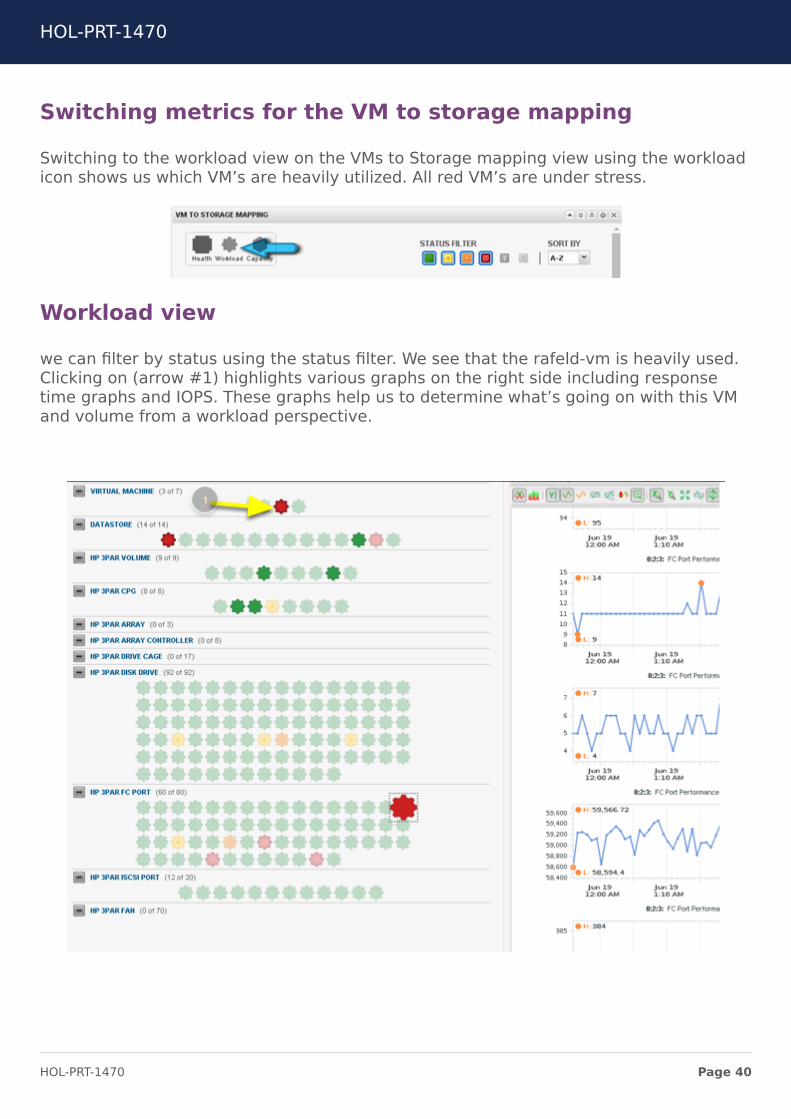
Switching metrics for the VM to storage mapping
Switching to the workload view on the VMs to Storage mapping view using the workloadicon shows us which VM’s are heavily utilized. All red VM’s are under stress.
Workload view
we can filter by status using the status filter. We see that the rafeld-vm is heavily used.Clicking on (arrow #1) highlights various graphs on the right side including responsetime graphs and IOPS. These graphs help us to determine what’s going on with this VMand volume from a workload perspective.
HOL-PRT-1470
Page 40HOL-PRT-1470
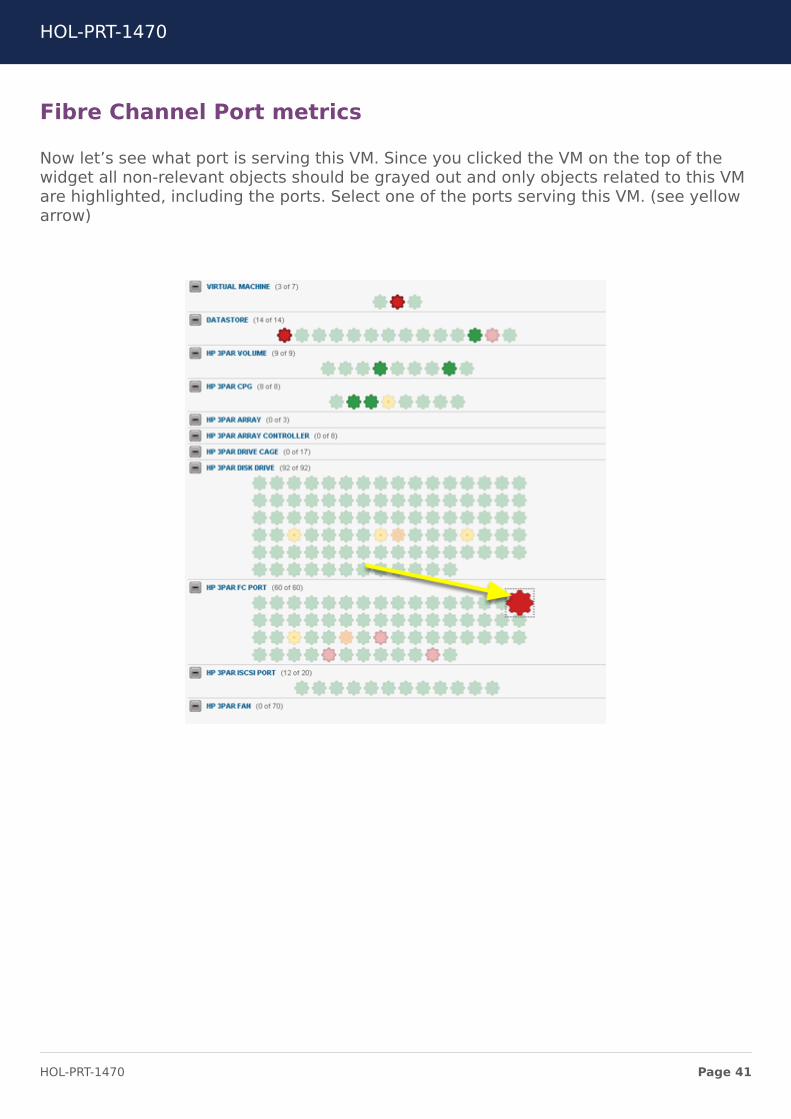
Fibre Channel Port metrics
Now let’s see what port is serving this VM. Since you clicked the VM on the top of thewidget all non-relevant objects should be grayed out and only objects related to this VMare highlighted, including the ports. Select one of the ports serving this VM. (see yellowarrow)
HOL-PRT-1470
Page 41HOL-PRT-1470
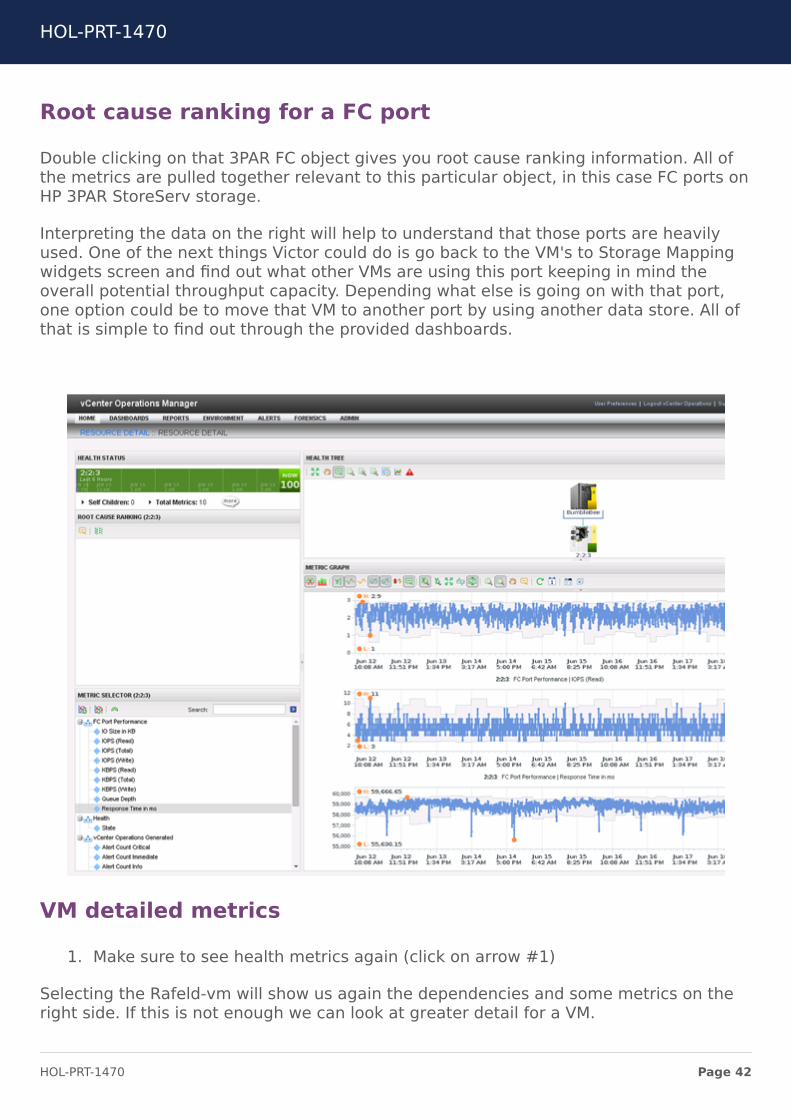
Root cause ranking for a FC port
Double clicking on that 3PAR FC object gives you root cause ranking information. All ofthe metrics are pulled together relevant to this particular object, in this case FC ports onHP 3PAR StoreServ storage.
Interpreting the data on the right will help to understand that those ports are heavilyused. One of the next things Victor could do is go back to the VM's to Storage Mappingwidgets screen and find out what other VMs are using this port keeping in mind theoverall potential throughput capacity. Depending what else is going on with that port,one option could be to move that VM to another port by using another data store. All ofthat is simple to find out through the provided dashboards.
VM detailed metrics
1. Make sure to see health metrics again (click on arrow #1)
Selecting the Rafeld-vm will show us again the dependencies and some metrics on theright side. If this is not enough we can look at greater detail for a VM.
HOL-PRT-1470
Page 42HOL-PRT-1470
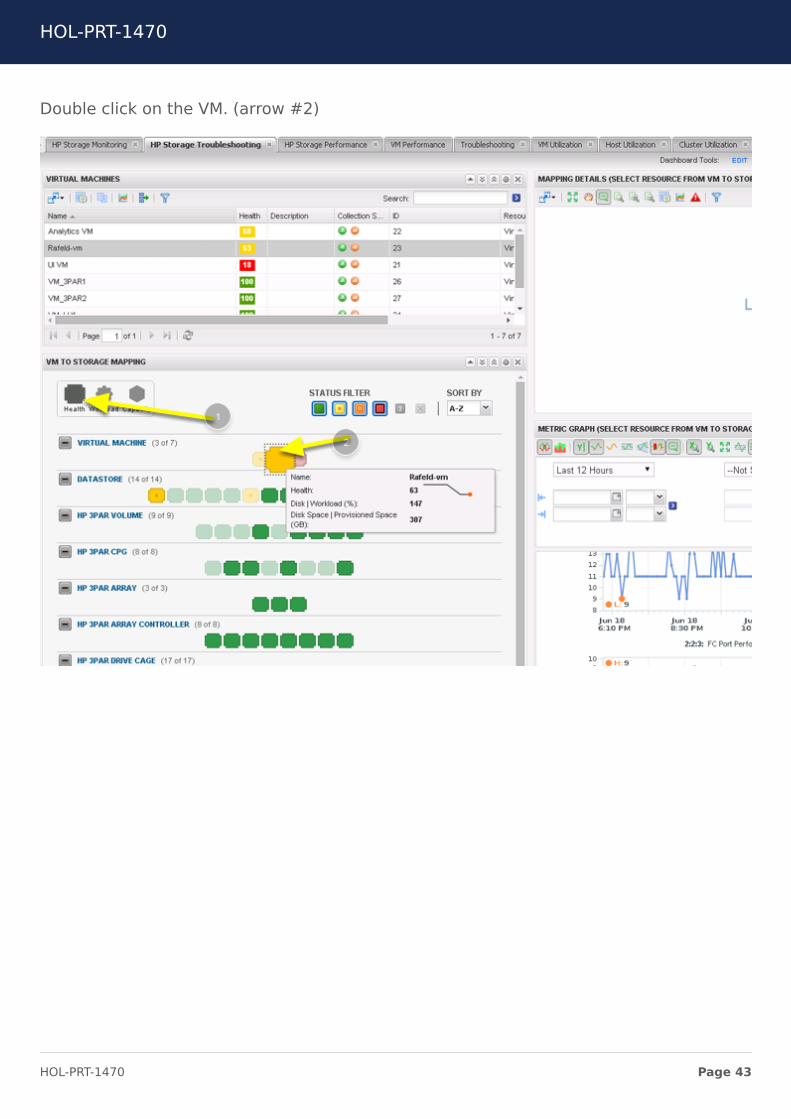
Double click on the VM. (arrow #2)
HOL-PRT-1470
Page 43HOL-PRT-1470
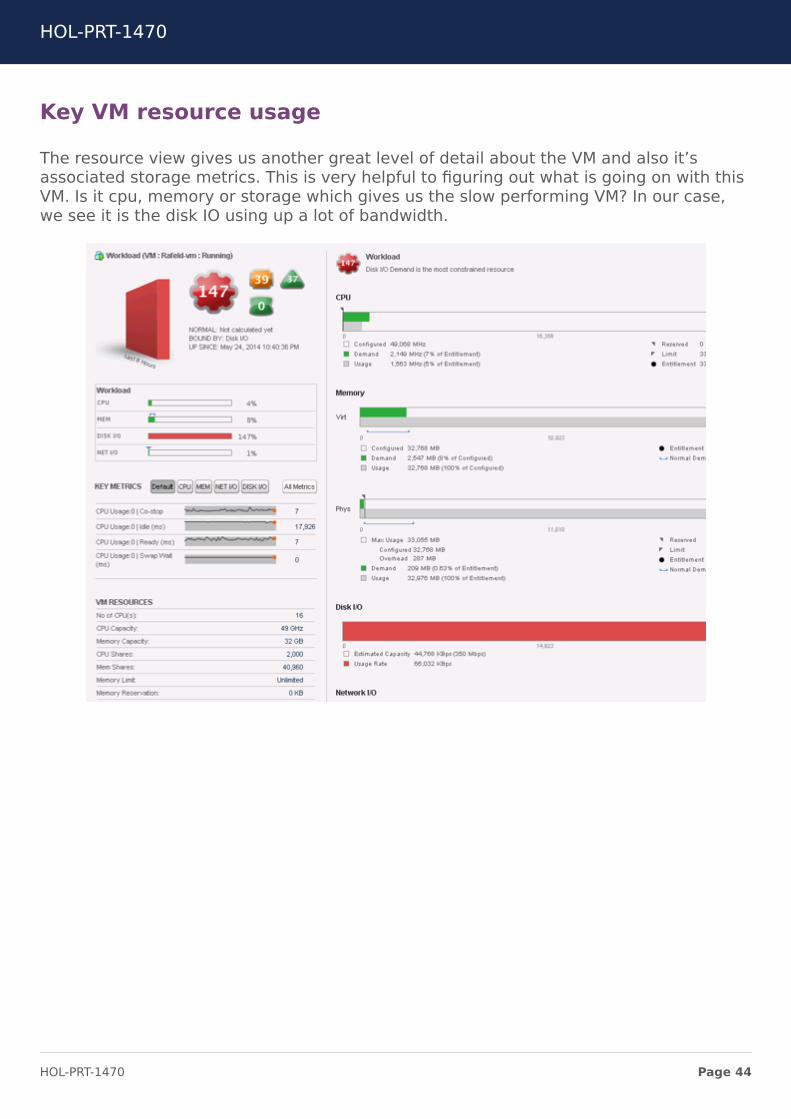
Key VM resource usage
The resource view gives us another great level of detail about the VM and also it’sassociated storage metrics. This is very helpful to figuring out what is going on with thisVM. Is it cpu, memory or storage which gives us the slow performing VM? In our case,we see it is the disk IO using up a lot of bandwidth.
HOL-PRT-1470
Page 44HOL-PRT-1470
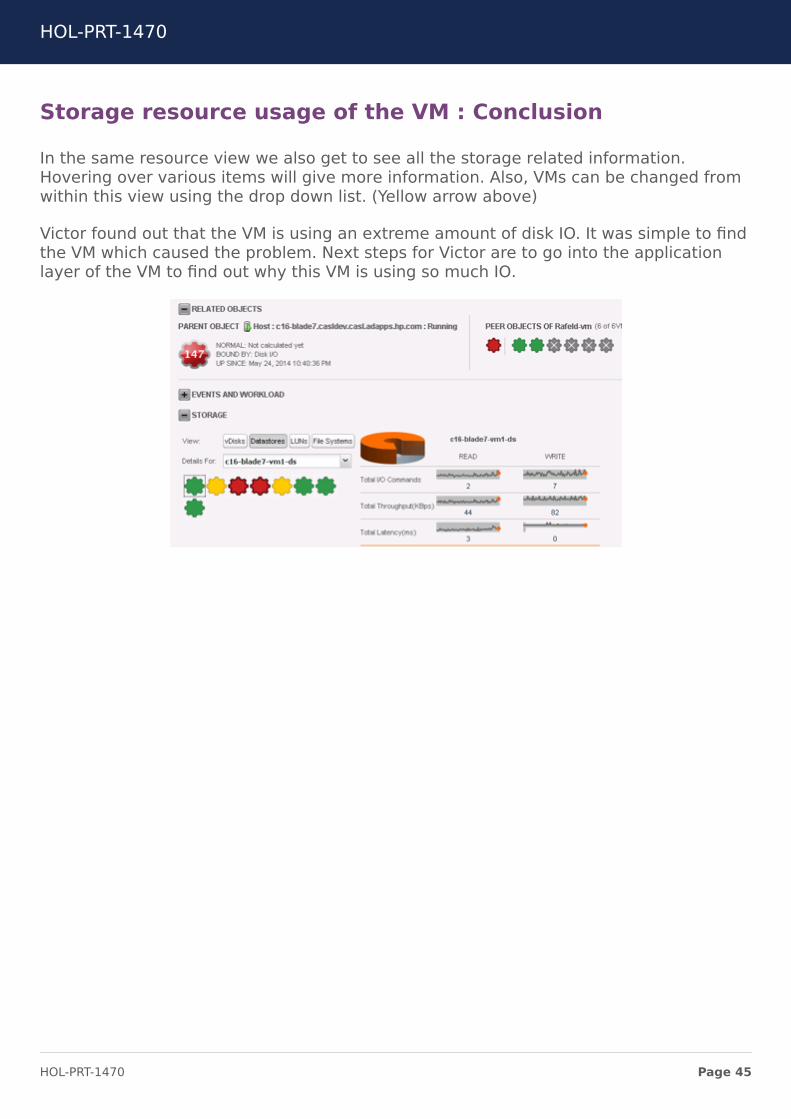
Storage resource usage of the VM : Conclusion
In the same resource view we also get to see all the storage related information.Hovering over various items will give more information. Also, VMs can be changed fromwithin this view using the drop down list. (Yellow arrow above)
Victor found out that the VM is using an extreme amount of disk IO. It was simple to findthe VM which caused the problem. Next steps for Victor are to go into the applicationlayer of the VM to find out why this VM is using so much IO.
HOL-PRT-1470
Page 45HOL-PRT-1470
HP Storage Performance DashboardFor the daily typical tasks we recommend looking at the Performance Dashboard.
( Select Home and then select HP Storage Performance tab. (yellow arrow below)
This lets us see what is going on in the whole environment. All the top 5 utilizedresources are shown from a HP 3PAR StoreServ perspective such as metrics for volumes,disks and ports.
Lets walk quickly through a usecase: Victor needs to get more information about aparticular volume on the storage array because that volume is being used by the slowperforming Rafeld-vm / application. Also this allows him to identify whether moreapplications / VMs might be affected. That is a great way to be proactive.
HOL-PRT-1470
Page 46HOL-PRT-1470
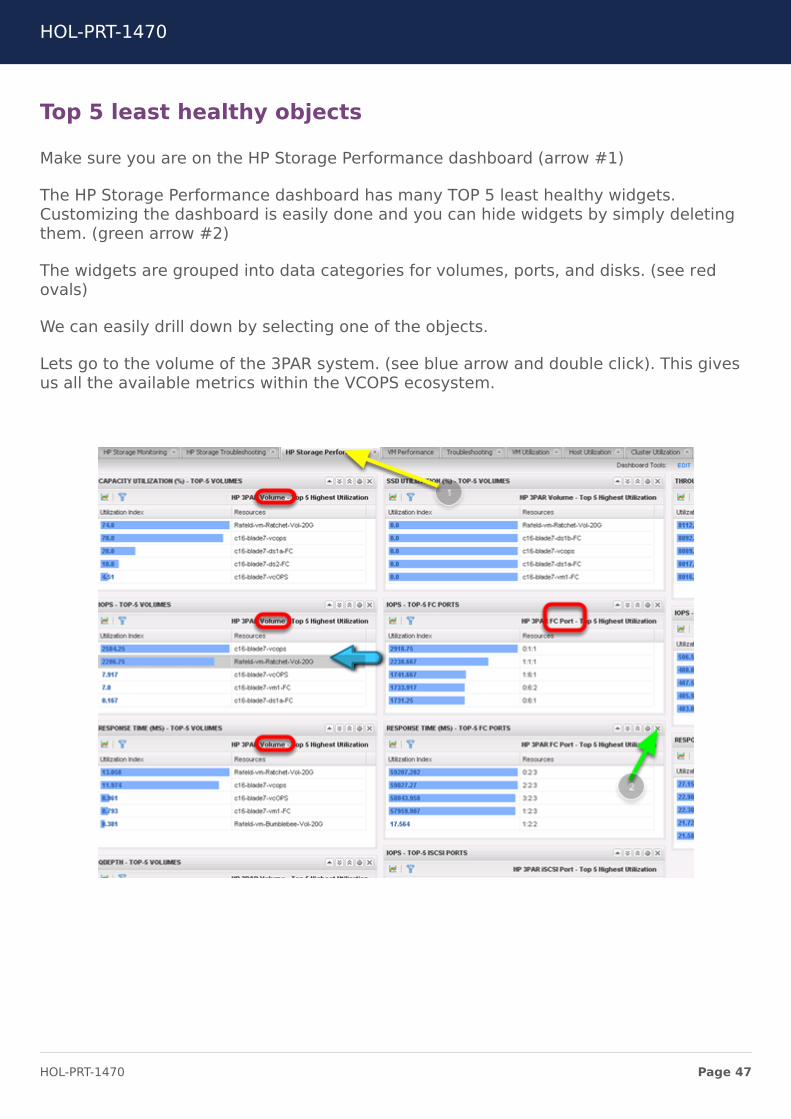
Top 5 least healthy objects
Make sure you are on the HP Storage Performance dashboard (arrow #1)
The HP Storage Performance dashboard has many TOP 5 least healthy widgets.Customizing the dashboard is easily done and you can hide widgets by simply deletingthem. (green arrow #2)
The widgets are grouped into data categories for volumes, ports, and disks. (see redovals)
We can easily drill down by selecting one of the objects.
Lets go to the volume of the 3PAR system. (see blue arrow and double click). This givesus all the available metrics within the VCOPS ecosystem.
HOL-PRT-1470
Page 47HOL-PRT-1470
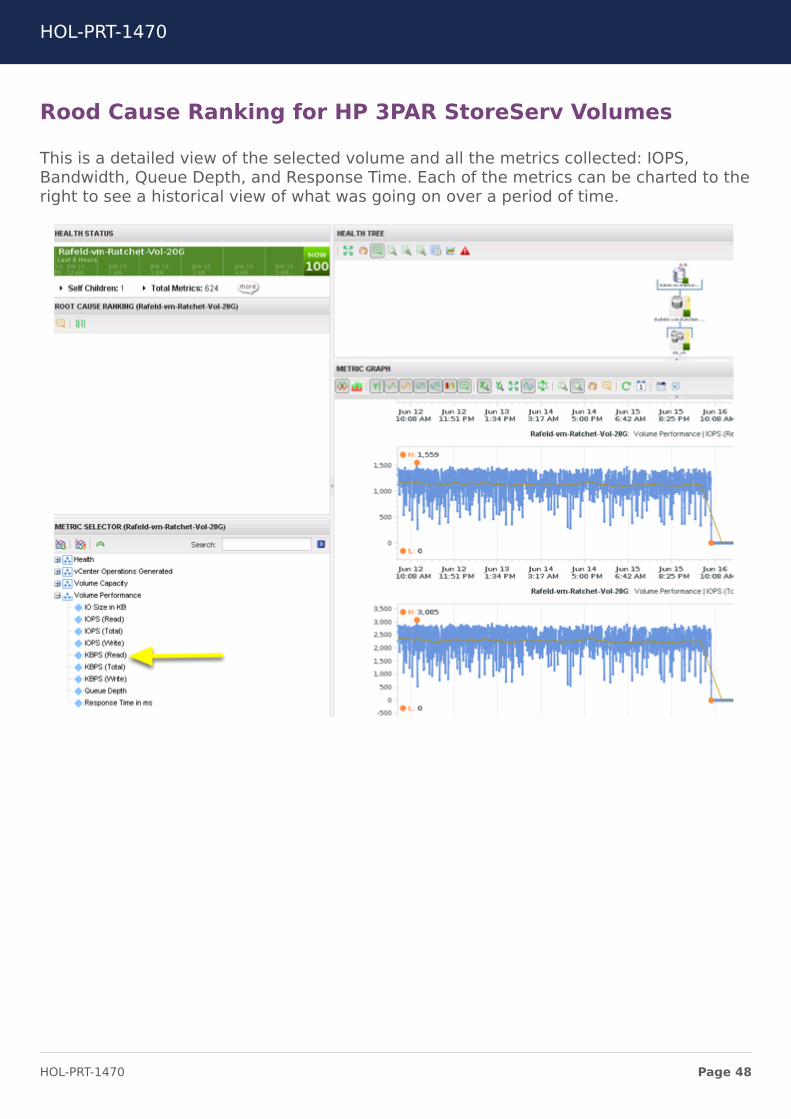
Rood Cause Ranking for HP 3PAR StoreServ Volumes
This is a detailed view of the selected volume and all the metrics collected: IOPS,Bandwidth, Queue Depth, and Response Time. Each of the metrics can be charted to theright to see a historical view of what was going on over a period of time.
HOL-PRT-1470
Page 48HOL-PRT-1470
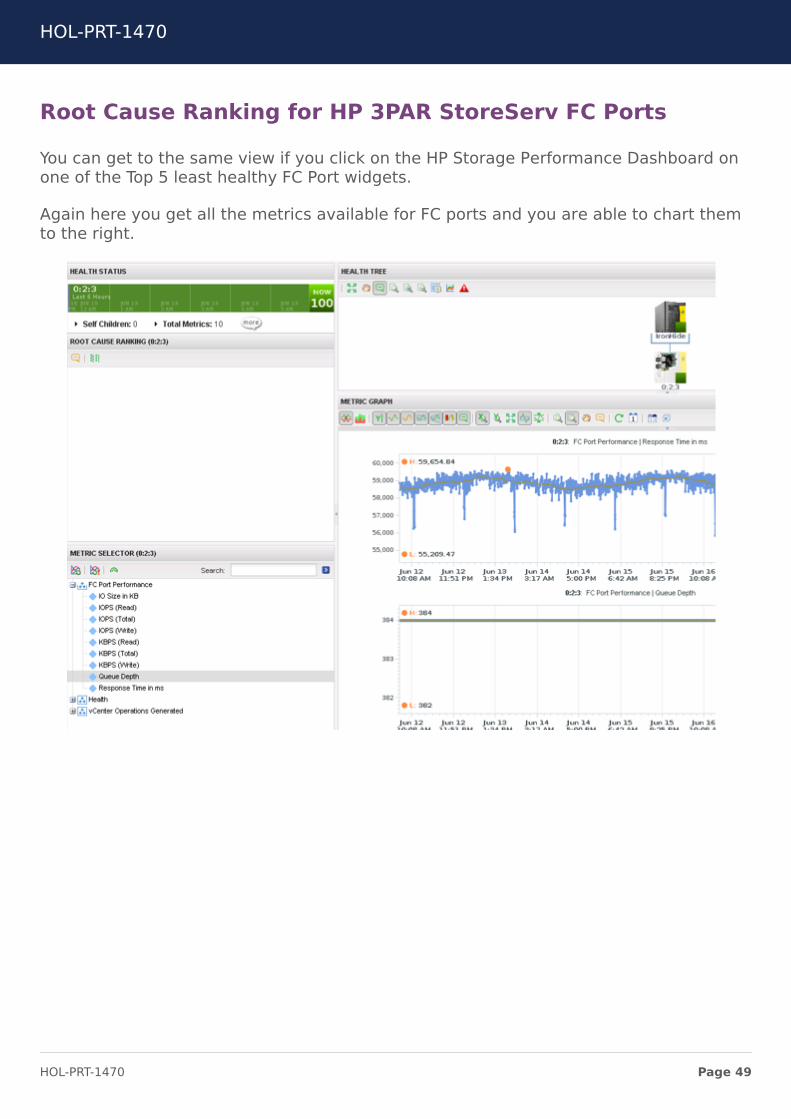
Root Cause Ranking for HP 3PAR StoreServ FC Ports
You can get to the same view if you click on the HP Storage Performance Dashboard onone of the Top 5 least healthy FC Port widgets.
Again here you get all the metrics available for FC ports and you are able to chart themto the right.
HOL-PRT-1470
Page 49HOL-PRT-1470

Module 3 - Use SuperMetrics to see what'simportant to you! (30
Min)
HOL-PRT-1470
Page 50HOL-PRT-1470

OverviewThis lab shows you how to build your own Super Metrics to highlight what is important toyou.
In this lab we will take a series of steps and build our own Super Metrics. We build aSuper Metric to show the average IOPS of all the 3PAR FC ports. We can easily adjust theaverage numbers so that we see when ports get saturated.
HOL-PRT-1470
Page 51HOL-PRT-1470
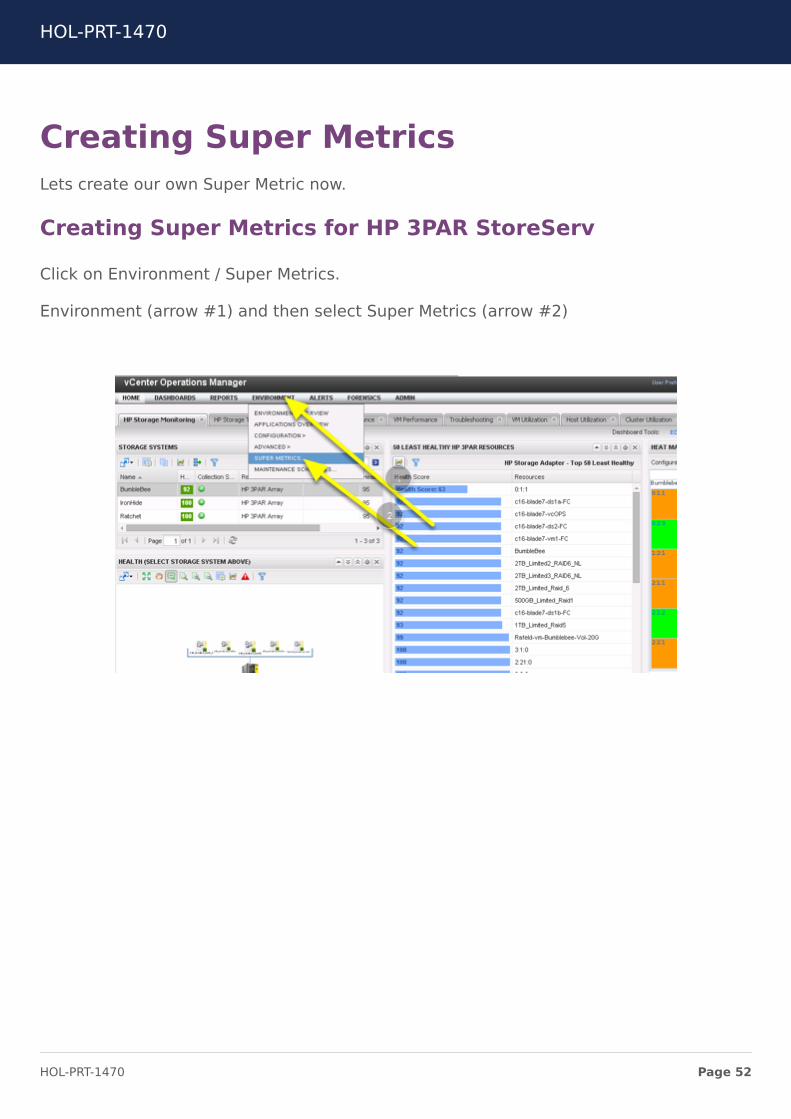
Creating Super MetricsLets create our own Super Metric now.
Creating Super Metrics for HP 3PAR StoreServ
Click on Environment / Super Metrics.
Environment (arrow #1) and then select Super Metrics (arrow #2)
HOL-PRT-1470
Page 52HOL-PRT-1470
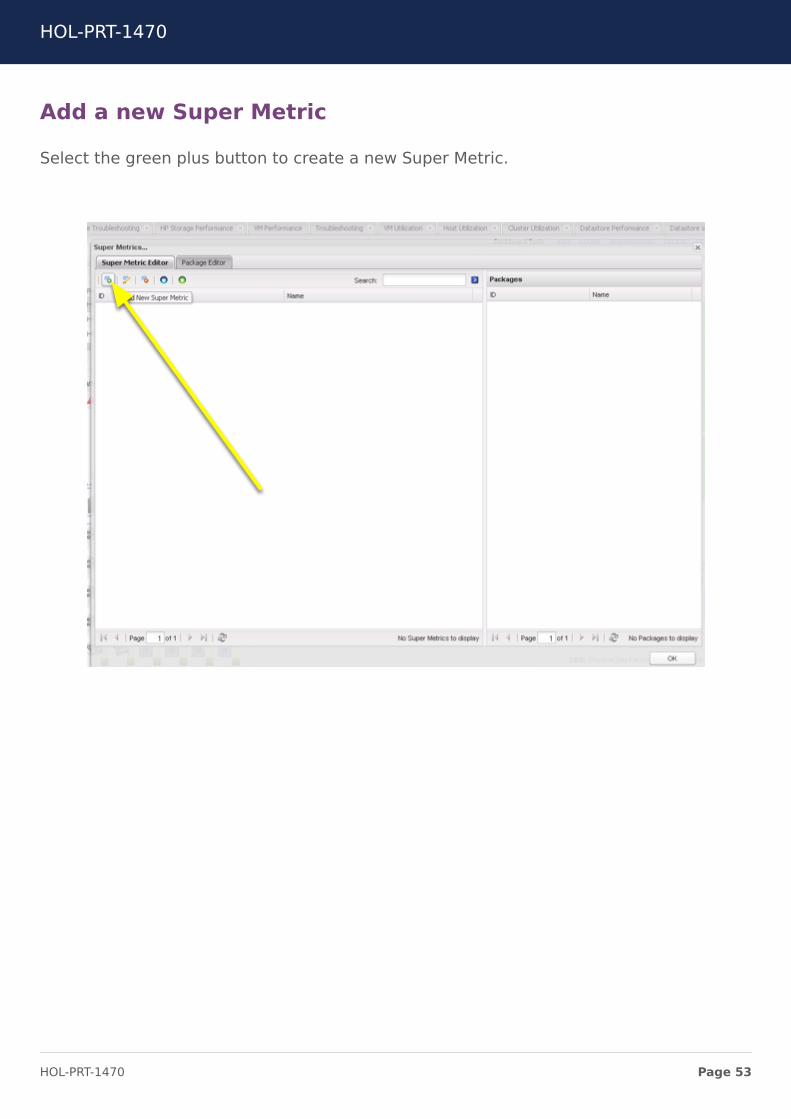
Add a new Super Metric
Select the green plus button to create a new Super Metric.
HOL-PRT-1470
Page 53HOL-PRT-1470
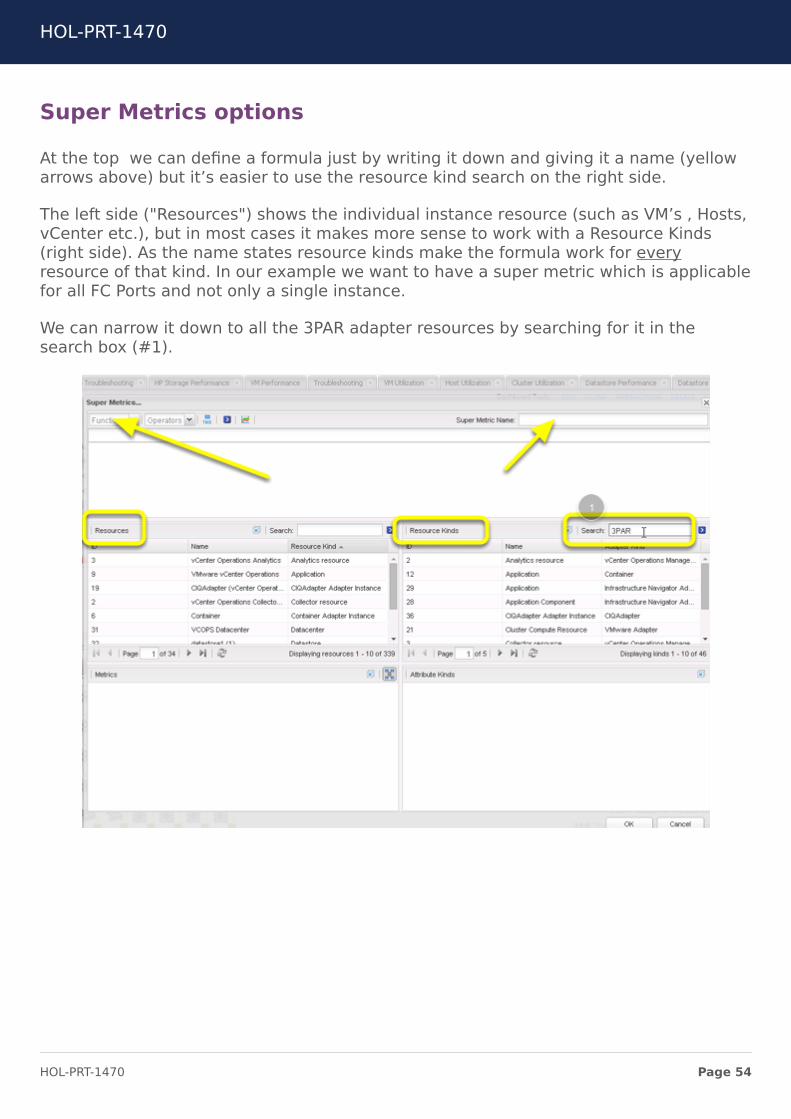
Super Metrics options
At the top we can define a formula just by writing it down and giving it a name (yellowarrows above) but it’s easier to use the resource kind search on the right side.
The left side ("Resources") shows the individual instance resource (such as VM’s , Hosts,vCenter etc.), but in most cases it makes more sense to work with a Resource Kinds(right side). As the name states resource kinds make the formula work for everyresource of that kind. In our example we want to have a super metric which is applicablefor all FC Ports and not only a single instance.
We can narrow it down to all the 3PAR adapter resources by searching for it in thesearch box (#1).
HOL-PRT-1470
Page 54HOL-PRT-1470
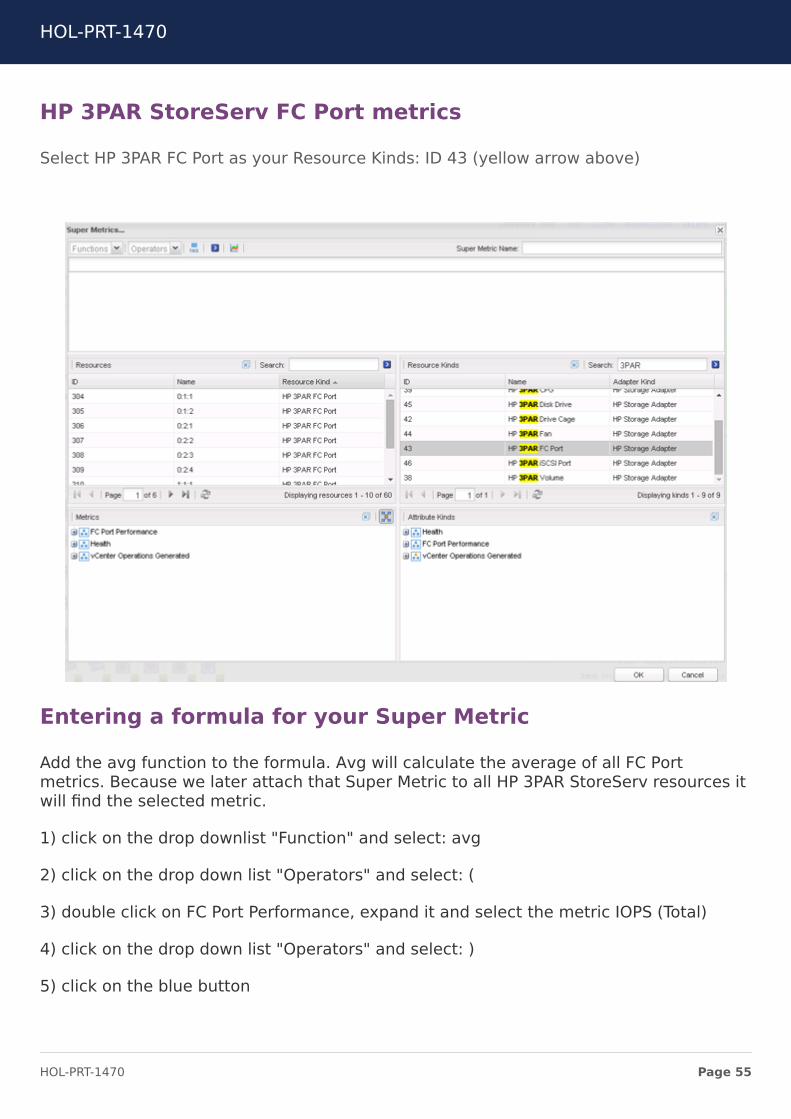
HP 3PAR StoreServ FC Port metrics
Select HP 3PAR FC Port as your Resource Kinds: ID 43 (yellow arrow above)
Entering a formula for your Super Metric
Add the avg function to the formula. Avg will calculate the average of all FC Portmetrics. Because we later attach that Super Metric to all HP 3PAR StoreServ resources itwill find the selected metric.
1) click on the drop downlist "Function" and select: avg
2) click on the drop down list "Operators" and select: (
3) double click on FC Port Performance, expand it and select the metric IOPS (Total)
4) click on the drop down list "Operators" and select: )
5) click on the blue button
HOL-PRT-1470
Page 55HOL-PRT-1470
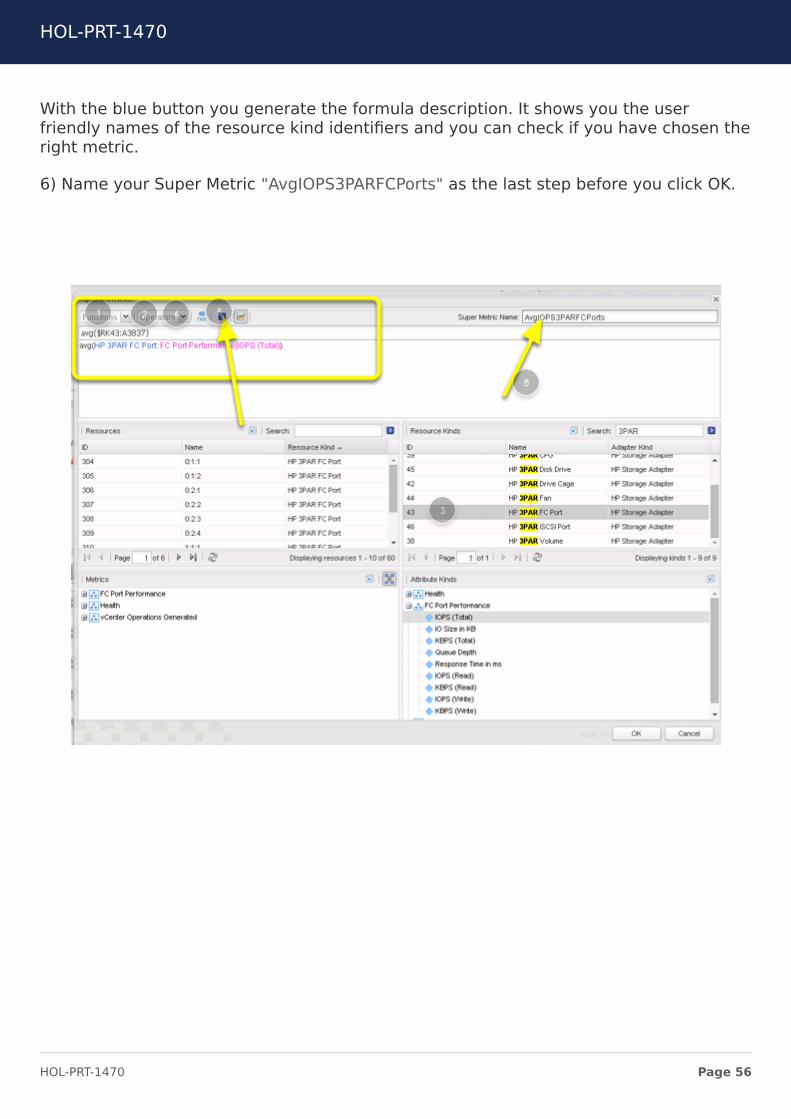
With the blue button you generate the formula description. It shows you the userfriendly names of the resource kind identifiers and you can check if you have chosen theright metric.
6) Name your Super Metric "AvgIOPS3PARFCPorts" as the last step before you click OK.
HOL-PRT-1470
Page 56HOL-PRT-1470
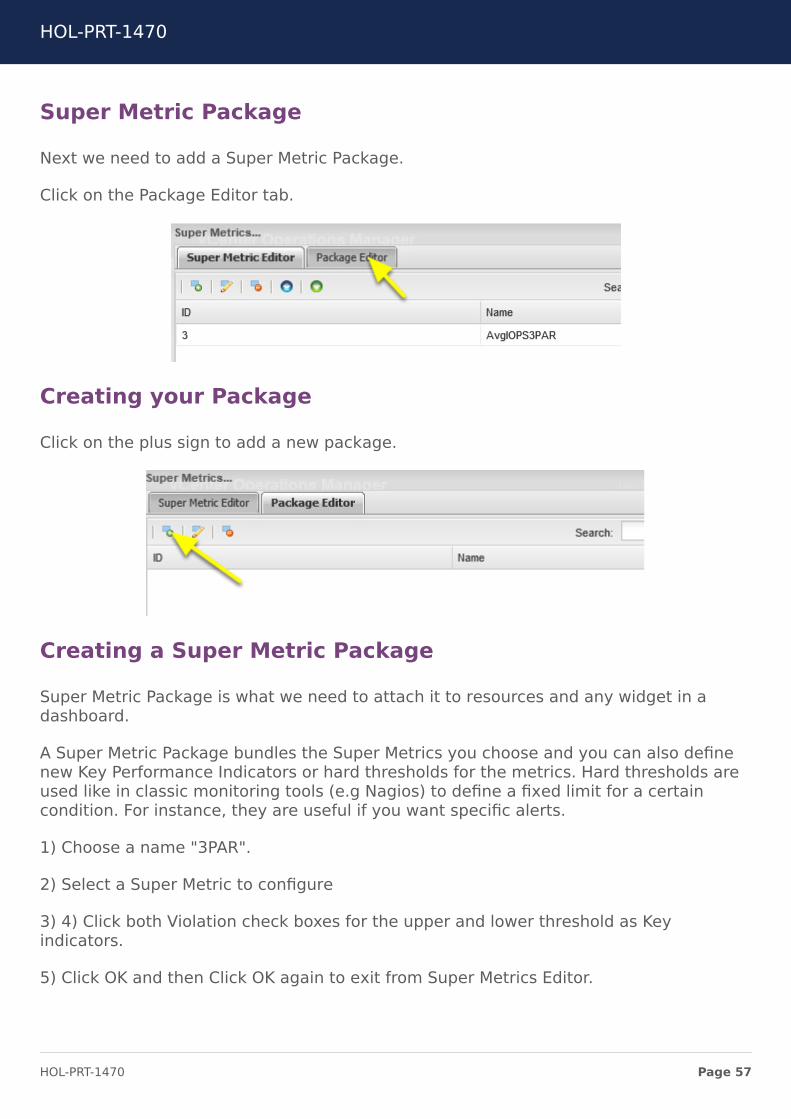
Super Metric Package
Next we need to add a Super Metric Package.
Click on the Package Editor tab.
Creating your Package
Click on the plus sign to add a new package.
Creating a Super Metric Package
Super Metric Package is what we need to attach it to resources and any widget in adashboard.
A Super Metric Package bundles the Super Metrics you choose and you can also definenew Key Performance Indicators or hard thresholds for the metrics. Hard thresholds areused like in classic monitoring tools (e.g Nagios) to define a fixed limit for a certaincondition. For instance, they are useful if you want specific alerts.
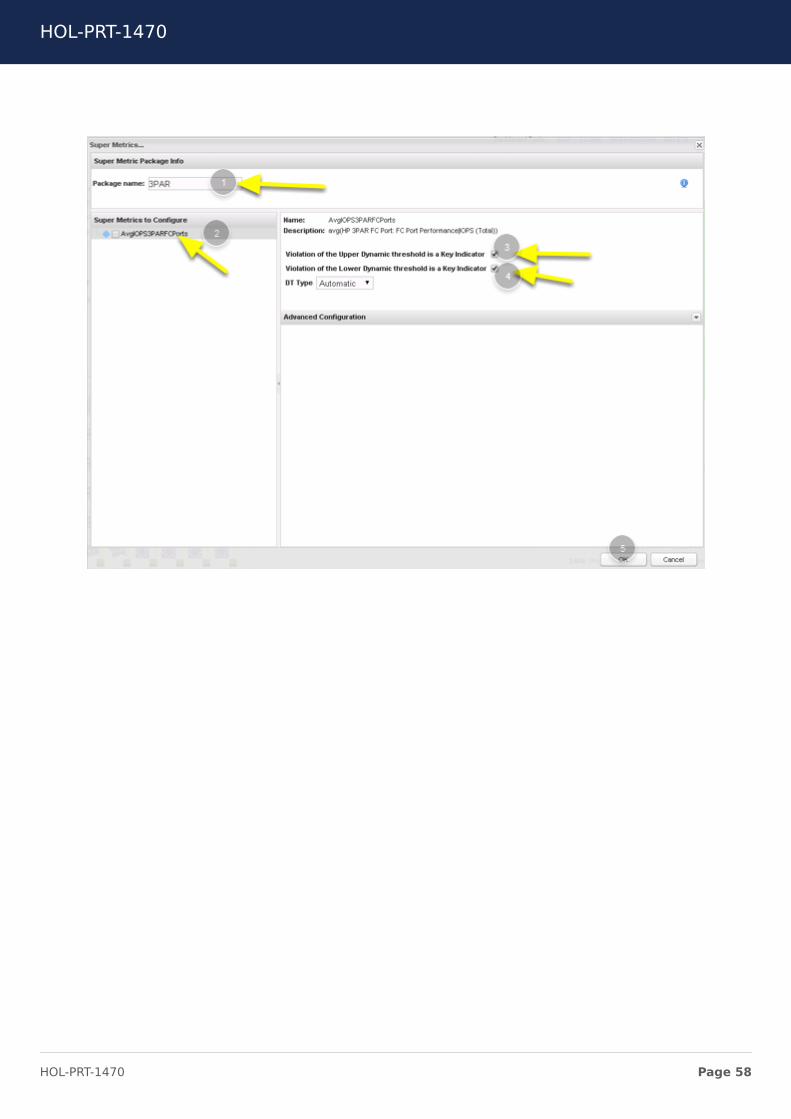
1) Choose a name "3PAR".
2) Select a Super Metric to configure
3) 4) Click both Violation check boxes for the upper and lower threshold as Keyindicators.
5) Click OK and then Click OK again to exit from Super Metrics Editor.
HOL-PRT-1470
Page 57HOL-PRT-1470
HOL-PRT-1470
Page 58HOL-PRT-1470
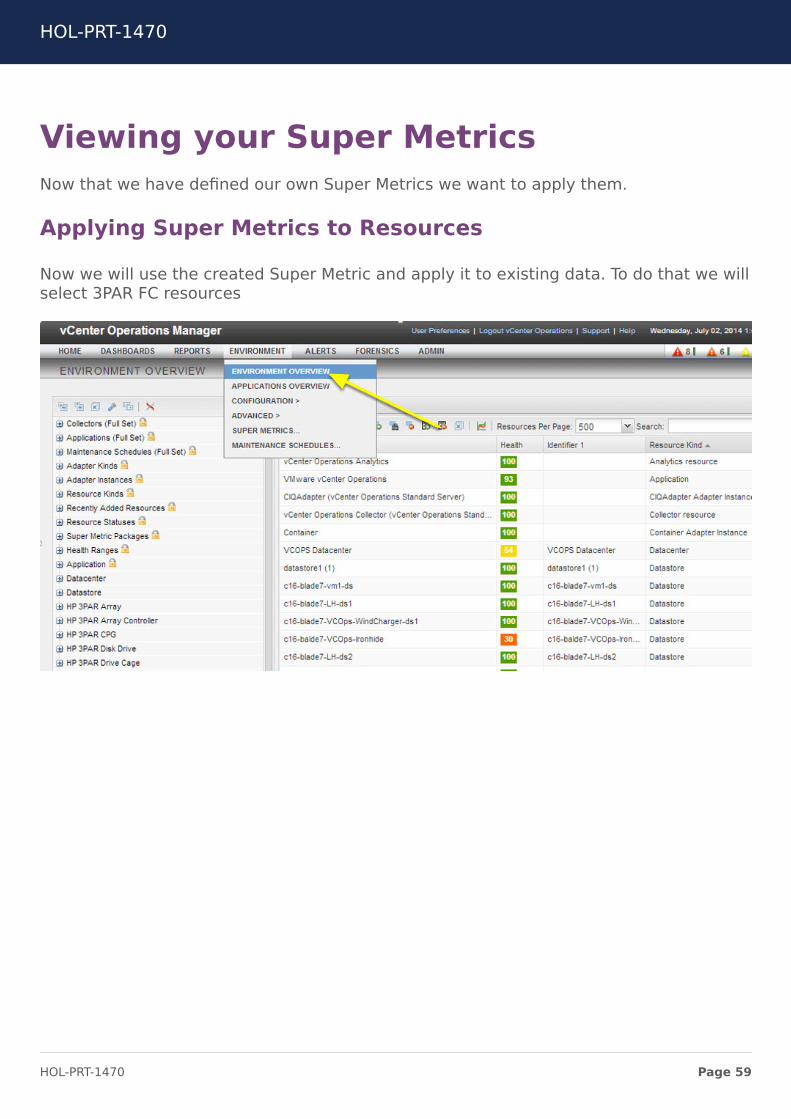
Viewing your Super MetricsNow that we have defined our own Super Metrics we want to apply them.
Applying Super Metrics to Resources
Now we will use the created Super Metric and apply it to existing data. To do that we willselect 3PAR FC resources
HOL-PRT-1470
Page 59HOL-PRT-1470
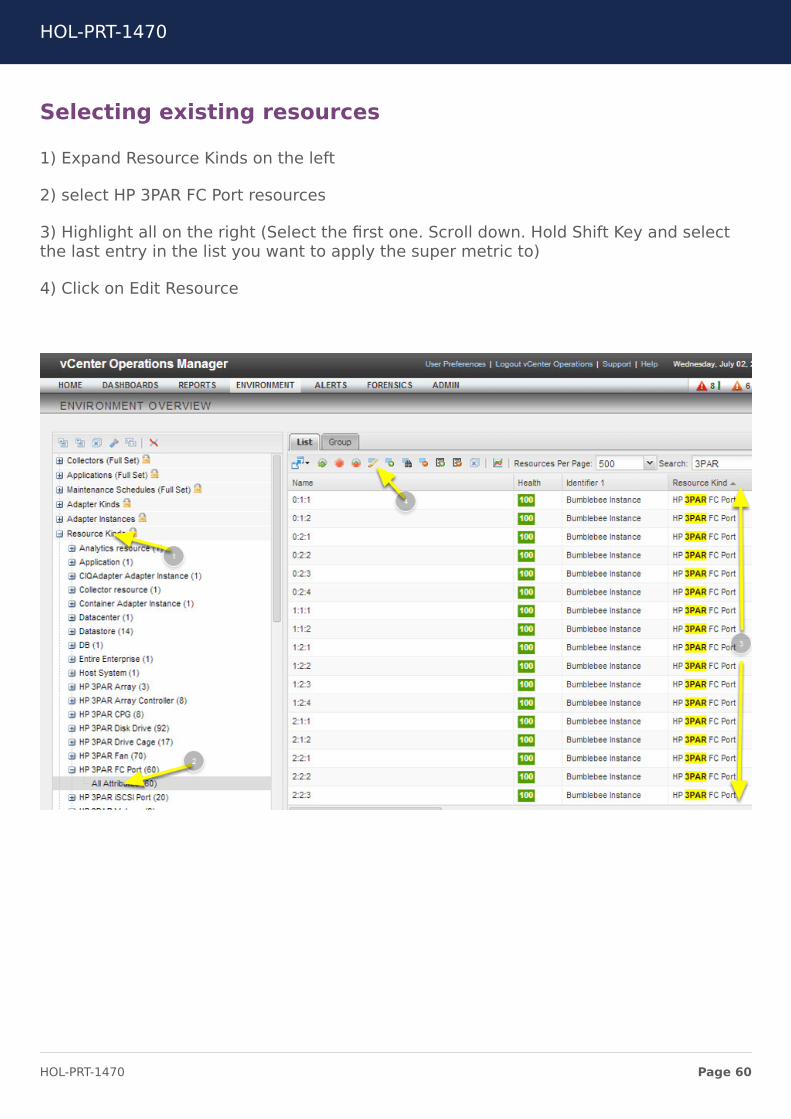
Selecting existing resources
1) Expand Resource Kinds on the left
2) select HP 3PAR FC Port resources
3) Highlight all on the right (Select the first one. Scroll down. Hold Shift Key and selectthe last entry in the list you want to apply the super metric to)
4) Click on Edit Resource
HOL-PRT-1470
Page 60HOL-PRT-1470
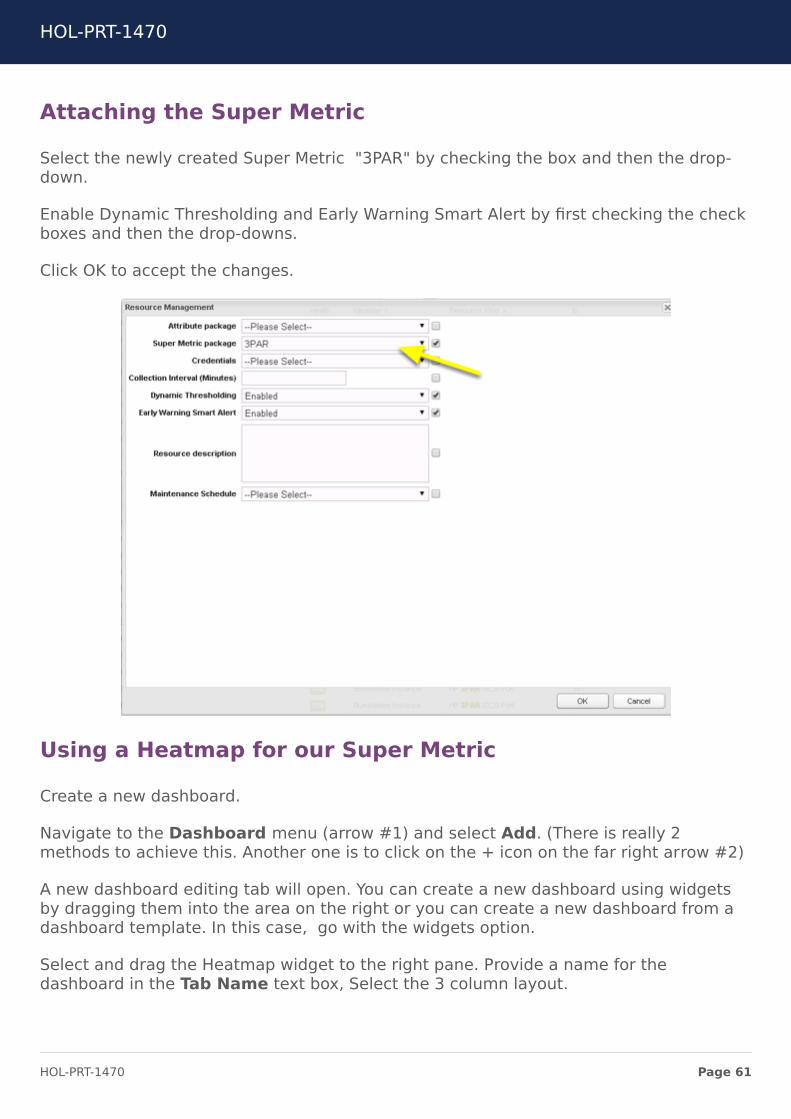
Attaching the Super Metric
Select the newly created Super Metric "3PAR" by checking the box and then the drop-down.
Enable Dynamic Thresholding and Early Warning Smart Alert by first checking the checkboxes and then the drop-downs.
Click OK to accept the changes.
Using a Heatmap for our Super Metric
Create a new dashboard.
Navigate to the Dashboard menu (arrow #1) and select Add. (There is really 2methods to achieve this. Another one is to click on the + icon on the far right arrow #2)
A new dashboard editing tab will open. You can create a new dashboard using widgetsby dragging them into the area on the right or you can create a new dashboard from adashboard template. In this case, go with the widgets option.
Select and drag the Heatmap widget to the right pane. Provide a name for thedashboard in the Tab Name text box, Select the 3 column layout.
HOL-PRT-1470
Page 61HOL-PRT-1470
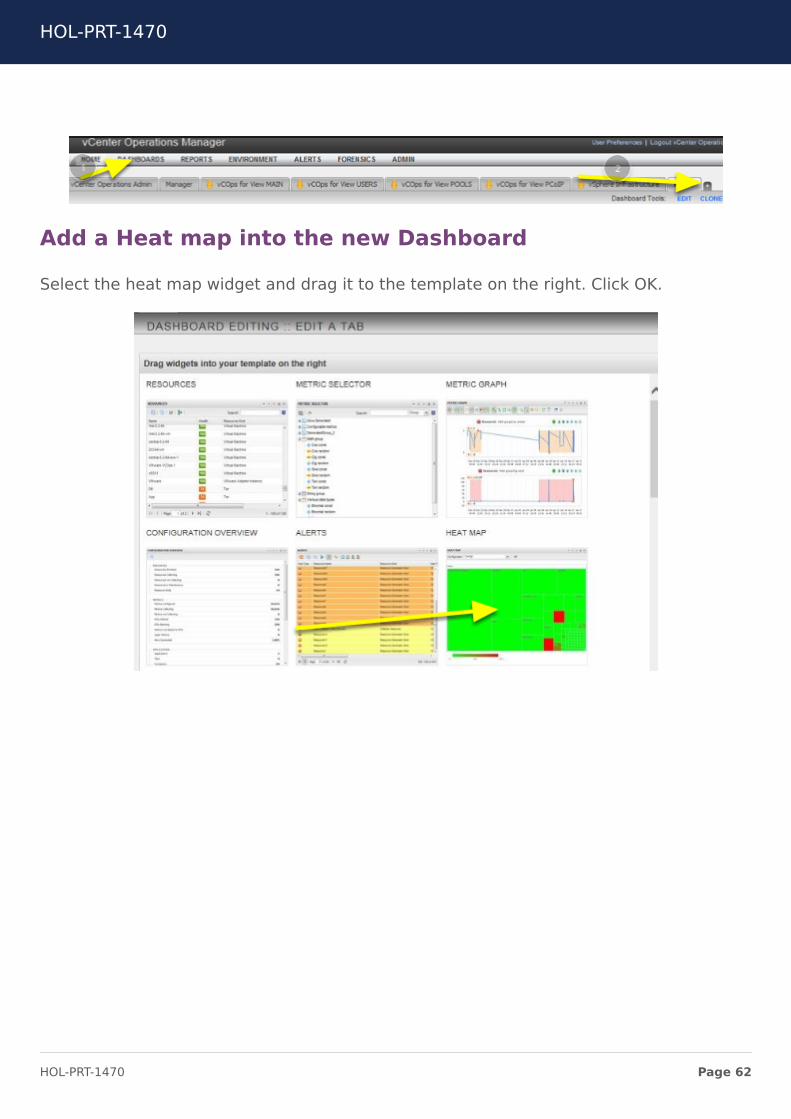
Add a Heat map into the new Dashboard
Select the heat map widget and drag it to the template on the right. Click OK.
HOL-PRT-1470
Page 62HOL-PRT-1470
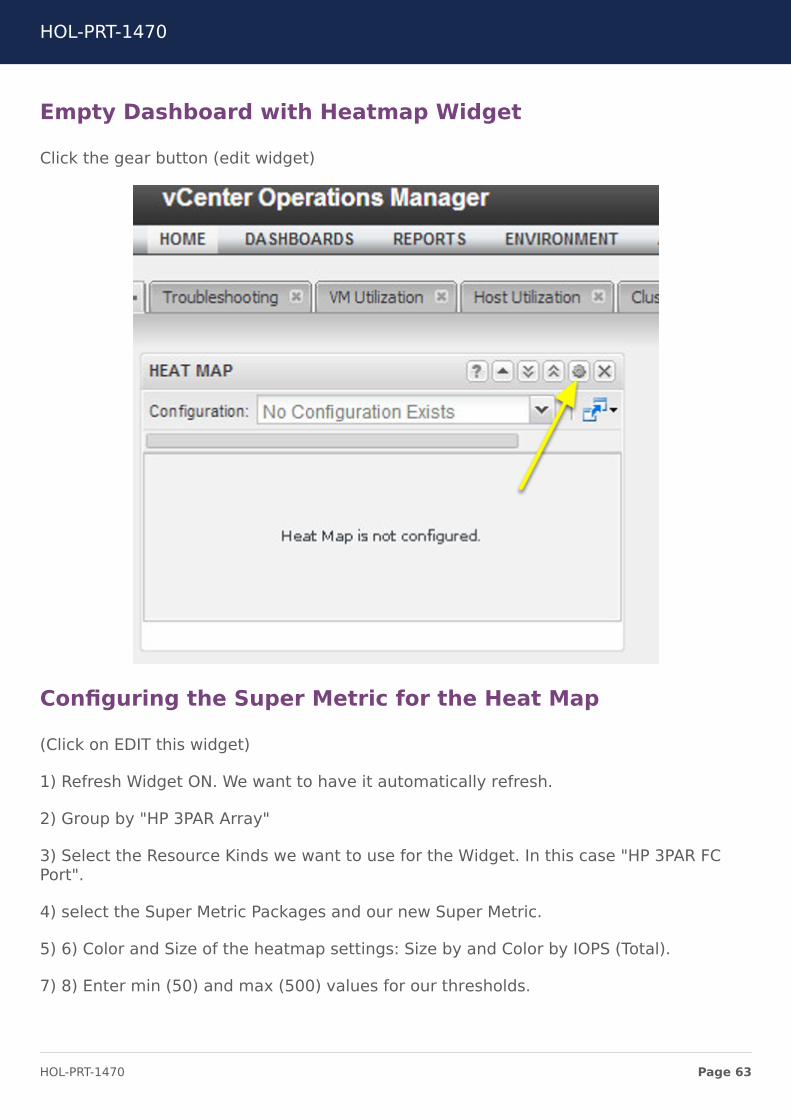
Empty Dashboard with Heatmap Widget
Click the gear button (edit widget)
Configuring the Super Metric for the Heat Map
(Click on EDIT this widget)
1) Refresh Widget ON. We want to have it automatically refresh.
2) Group by "HP 3PAR Array"
3) Select the Resource Kinds we want to use for the Widget. In this case "HP 3PAR FCPort".
4) select the Super Metric Packages and our new Super Metric.
5) 6) Color and Size of the heatmap settings: Size by and Color by IOPS (Total).
7) 8) Enter min (50) and max (500) values for our thresholds.
HOL-PRT-1470
Page 63HOL-PRT-1470

9) Add a NEW configuration by selecting the plus sign and in this case name the newconfiguration "3PAR FC Avg".
Click OK
HOL-PRT-1470
Page 64HOL-PRT-1470
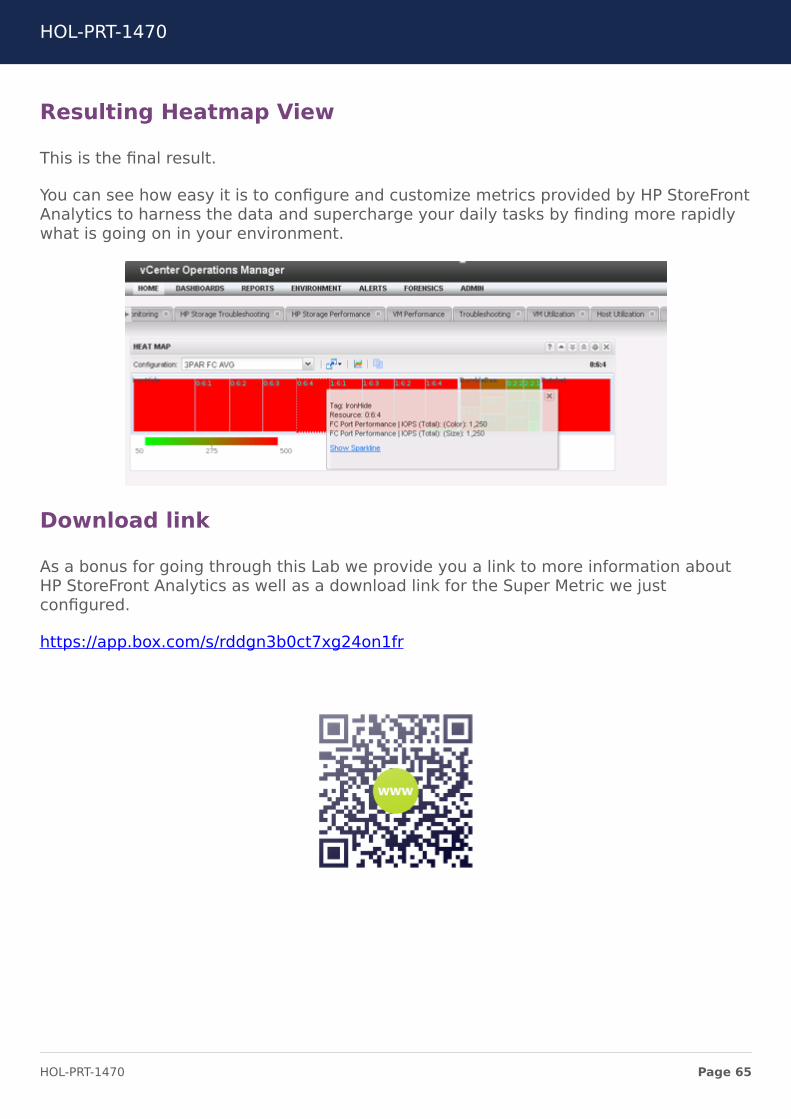
Resulting Heatmap View
This is the final result.
You can see how easy it is to configure and customize metrics provided by HP StoreFrontAnalytics to harness the data and supercharge your daily tasks by finding more rapidlywhat is going on in your environment.
Download link
As a bonus for going through this Lab we provide you a link to more information aboutHP StoreFront Analytics as well as a download link for the Super Metric we justconfigured.
https://app.box.com/s/rddgn3b0ct7xg24on1fr
HOL-PRT-1470
Page 65HOL-PRT-1470

ConclusionThank you for participating in the VMware Hands-on Labs. Be sure to visithttp://hol.vmware.com/ to continue your lab experience online.
Lab SKU: HOL-PRT-1470
Version: 20150226-113814
HOL-PRT-1470
Page 66HOL-PRT-1470