
Table of Contents - ChemistryTable of Contents Introduction 2 LabWorks™ Contents: 1.0 Thermistor...
34
Table of Contents Introduction 2 LabWorks™ Contents: 1.0 Thermistor Calibration 3 2.0 Thermodynamics Background 7 3.0 The Gas Laws 9 4.0 Examples of How Boyle’s and Charles’ Laws Are Used in Everyday Life 14 5.0 Thermodynamic Experiments 16 Experiment 1 19 Experiment 2 22 Experiments 3, 4, and 5 26 6.0 Gas Law Experiments 27 Experiment 6 28 Experiment 7 31 Experiments 8 and 9 34 Chem 343 Physical Chemistry Laboratory Manual Spring 2014 – ADH 1/10/14 By Audrey Dell Hammerich, Luke Hanley, and Preston Snee with contributions from Yoshitaka Ishii, Sanja Tepavcevic, and Ben Stokes 1
Transcript of Table of Contents - ChemistryTable of Contents Introduction 2 LabWorks™ Contents: 1.0 Thermistor...
Table of Contents
Introduction 2 LabWorkstrade Contents 10 Thermistor Calibration 3 20 Thermodynamics Background 7 30 The Gas Laws 9 40 Examples of How Boylersquos and Charlesrsquo Laws Are Used in Everyday Life 14 50 Thermodynamic Experiments 16
Experiment 1 19 Experiment 2 22 Experiments 3 4 and 5 26
60 Gas Law Experiments 27 Experiment 6 28 Experiment 7 31 Experiments 8 and 9 34
Chem 343 Physical Chemistry Laboratory Manual Spring 2014 ndash ADH 11014 By Audrey Dell Hammerich Luke Hanley and Preston Snee with contributions from Yoshitaka Ishii Sanja Tepavcevic and Ben Stokes
1
2
Thermistor Calibration
10 Introduction This tutorial explains how to do temperature measurements using the DataMate program in Time Graph mode on a TI graphing calculator connected to a LabPro interface with a temperature probe The LabPro interface reads signals from a variety of sensors and transmits those signals electrically to a calculator or computer Sensors can be divided into two basic typesmdashanalog and digital Examples of analog sensors are temperature probes pH sensors force sensors oxygen gas sensors etc Up to four analog sensors can be connected to LabPro Four jacks for the analog sensors (CH 1 ndash CH 4) are located on the same side as the AC adapter port The analog ports accept British Telecom-style plugs with a right-hand connector Examples of digital sensors are motion detectors radiation monitors photogates and rotary motion sensors Up to two digital sensors can be connected to LabPro The digital ports (DIGSONIC) which accept British Telecom-style plugs with a left-hand connector are located on the same side as the serial and USB computer connections Materials and Equipment 1 LabPro interface (see next page for drawing thereof) 2 TI graphing calculator (TI-84 Plus provided by us but others will work) 3 Temperature probe (Vernier) 4 DataMate program 5 Silver graphing link cable (to connect LabPro Interface to computer) 6 Computer with Logger Pro 33 software LabPro Interface The LabPro interface has three buttons three LEDs four analog channels (CH 1 CH 2 CH 3 and CH 4) two digital channels (DIGSONIC 1 and DIGSONIC 2) a serial computer connection a USB computer connection a piezo speaker and a calculator IO port
3
Procedure 1 Plug the link cable into the link port of the TI graphing calculator and LabPro You will collect data on TI graphing calculator and use LabPro only as an interface (IO port) 2 Plug the stainless-steel temperature probe into Channel 1 Connect the sensor to the appropriate port (Channel 1 for temperature probe) An important feature of LabPro is its ability to detect auto-ID sensors and automatically set up an experiment Remember that the temperature probe does not need calibration so skip any instructions asking you to calibrate the sensor 3 Provide power to LabPro (AC adapter) To use LabPro with the AC power supply plug the round plug on the 6-volt power supply into the side of the interface Shortly after plugging the power supply into the outlet the interface will run through a self-test You will hear a series of beeps and blinking lights (red yellow then green) indicating a successful power up If the self-test is not successful unplug everything and plug it in again You cannot proceed until you hear the beeps 4 Start the DataMate program on TI-84 Plus graphing calculator Use the following steps to start the DataMate program on your calculator
1 Turn the calculator ON 2 Press APPS (Applications) 3 Press number under DataMate program 4 This temporary screen will appear
4
After the program begins the calculator will try to communicate with the interface and check for auto-ID sensors If this communication is successful the main screen (shown below) will appear
In this example a temperature probe was connected and DataMate automatically identified and displayed the channel it was connected to giving the current temperature reading DataMate also sets up a default time graph experiment for auto-ID sensors In this example an experiment was set up to collect data for 180 seconds To change time settings
1 Press 1 (for Setup in Main Menu) 2 Select Mode and press Enter 3 In Select Mode menu press number 2 (Time graph) 4 Select Options and then Change time settings 5 Pick time interval between the points and total time of the experiment (should be the
same for all three experiments) 6 You are now ready to collect data
5 Collect data with DataMate on a TI graphing calculator Use the following steps to collect data on the DataMate program Note that the TI calculator can only hold a maximum of three sets of data from a single auto-ID sensor such as a temperature or pressure probe
1 Press 2 (for Start in Main Menu) 2 When experiment is done (graph will automatically appear) press Enter (to go back to
Main Menu) If you want to stop experiment run earlier click STOgt 3 Press 5 (for Tools in Main Menu) 4 Press Store Last Run 5 Repeat it for the second set of data 6 At the end of the third set of the data there is no need for Store Last Run step instead
press 6 (for Quit in Main Menu) (last measurement will be stored automatically)
5
6 Transmit data to computer
Use the following steps to retrieve data from the TI calculator by the computer 1 All computers have Logger Pro 33 software on them 2 Connect the calculator and the computer IO (calculator) - USB (computer) silver
graphing cable 3 Start Logger Pro 33 program by double-clicking on the icon 4 Click on the little calculator icon in the top line on the program menu (Import from TI
device should appear when you put mouse on little calculator icon) 5 Pick the TI-GRAPH LINKtrade-USB from the Port pull down menu Skip step 6 if TI-
GRAPH LINKtrade-USB is already present 6 Click on Scan for device 7 From Choose data to import highlight L1 (time) and L2 L3 and L4 lines
(Temperature) by holding Ctrl button 8 Click OK
9 You can make
a Single graph (for example only L2 vs L1) b All three measurements appear on the screen at the same time by clicking on the
temperature axes (y-axes) choose option More and then check the three columns to be displayed (L2 L3 L4)
c Click OK
10 To save graph in format that you can later use with Excel Origin or MATLAB go to a File b Export as c Text
11 Save that text file ( txt) on your flash drive
a Click No for ldquoDo you want to save changes you made to Untitledcmblrdquo
12 Repeat another set of three measurements if needed
13 With Excel a Open the Excel program b Under the File pick Open mark the text file click OK c Importing text file click Finished
14 With MATLAB
a Open the MATLAB program b At the gt prompt type load filename c The variable with the data is now in memory with the name lsquofilenamersquo
6
20 Thermodynamics Background
21 Examples of How Heat Loss and Heat Gain Are Used in Everyday Life
21 Combustion of Natural Gas in a Water Heater or Furnace The combustion of natural gas in a water heater furnace or modern power plant is a common heat-producing (exothermic) reaction Natural gas is mostly methane CH4 The combustion of methane results in the following reaction
According to the reaction 2128 kcal (or 212800 calories) of heat are produced by the oxidation of 16 grams (one gram-molecular weight or one mole) of methane (natural gas) 22 Energy for Living Organisms Not all oxidation reactions proceed rapidly and vigorously by combustion In living organisms oxidation reactions proceed much more slowly and are controlled by enzymes Some of the energy liberated by these reactions is used to raise the body temperature in warm-blooded animals and some of it is used for other vital processes such as muscle contraction
Almost all chemical reactions either absorb or release heat These experiments are designed to introduce you to three concepts of thermodynamics
1) The measurement of heat energy 2) In a closed system the heat gained by one object must equal the heat lost by another 3) Energy is liberated or absorbed (as heat) during physical and chemical changes
Heat and temperature are not the same When heat is added to a substance the temperature rises but the amount of temperature rise depends on the type and quantity of substance Temperature depends on heat but is not directly or simply a measure of the amount of heat You feel that something is hot or cold because either it transfers heat to you or you to it Temperature is a measure (in degrees) of the average rate of motion of molecules in a substance Heat energy is often measured in calories The calorie is the amount of heat required to raise the temperature of exactly 1 gram of water from 145degC to 155degC For all practical purposes the calorie is simply defined as the amount of heat required to raise the temperature of 1g of water 1degC The amount of heat required to raise 1 g of a substance 1degC in temperature is called the specific heat of the substance Specific heat is a characteristic property just like density or boiling point
7
transmission of nerve impulses and synthesis of essential compounds For example when
glucose (a type of sugar) is used in metabolism the following oxidation reaction occurs
We often refer to the number of calories in a given portion of food Accordingly we would say there are 688 kcal of energy in 180 g (one mole) of glucose meaning that when this amount of glucose is oxidized in metabolism there are 688 kcal of energy liberated The minimum daily requirement for an adult human is between 1800 to 3000 kcal depending on the individualrsquos size and activity level If our diet provides more energy than our bodies can use the surplus may be stored as lipids (fats) resulting in excess body weight Approximately 3500 kcal equals one pound of body weight If our diet does not provide us with enough energy we must either use some stored fat or suffer a lack of energy
8
30 The Gas Laws
31 Background Of the three states of matter (solid liquid and gas) gases are the most affected by the surrounding environment Most solids undergo very little or no variation in shape and volume due to changes in temperature pressure or the type of container etc Although liquids assume the shape of their container they tend to maintain a constant volume While thermal expansion contraction is noticeable in the case of both solids and liquids it is relatively insignificant External pressures do not affect matter in either of these states appreciably However a given amount of gas placed in an empty (evacuated) container of any shape will immediately expand to fill the container completely and uniformly If pressure is exerted on a sealed flexible container filled with gas the gas will become compressed until the pressure exerted by the gas on the walls of its container equals the outside pressure applied If the gas is heated it will either apply more pressure on its container or expand to a greater volume 32 Boylersquos Law Robert Boyle a British chemist was one of the first scientists to study gases quantitatively In one set of experiments Boyle established a relationship between the pressure and volume of a gas at constant temperature In order to arrive at a physically significant law Boyle simplified the problem by doing his experiments under controlled conditions He kept the mass m of gas constant (ie no leaks in the container) and he kept the temperature constant Under such circumstances the relationship between pressure and volume is known as Boylersquos Law At a constant temperature the volume (V) occupied by a finite mass of gas is inversely proportional to the applied pressure (P) Mathematically this relationship can be stated as follows
(1) PV 1prop
Where the symbol represents proportionality Another way of stating Boylersquos Law is for a given amount of gas at a constant temperature the product of the pressure and the volume is a constant Thus by replacing the proportionality constant in the previous equation with a constant k we will have another form of Boylersquos Law
prop
(2) ( )PkV 1sdot=
(3) kVP =sdot When using two sets of pressurevolume conditions (1 and 2) Boylersquos Law can be expressed (4) 2211 VPVP = where the subscript 1 refers to the initial state and the subscript 2 refers to the final state Inthe Boylersquos Law experiment you will examine the relationship between pressure and volume
9
for a gas Graphing this relationship for an ideal gas shown in Fig 1 results in a hyperbola
As we increase the pressure passing from state 1 to state 2 the product PV is constant
33 The Effect of Mass The value of the constant k in Boylersquos Law depends on several factors First imagine that the quantity of gas changes while the temperature and volume remain constant Pressure is caused by the impact of molecules as they strike the walls of the container Therefore doubling the mass (ie doubling the number of gas molecules) at a constant temperature will cause the number of impacts per second to double and the pressure will be doubled Experimental verification shows that the product PV is proportional to the mass of gas
(5) 2
22
1
11m
VPmVP
= (at constant temperature)
In other words if m is increased then so is PV and PVm remains the same In general when dealing with different kinds of gases such as hydrogen and oxygen it is important to use equal number of molecules rather than equal masses For instance there are actually more molecules in 8 g of H2 (whose molecular weight is 20) than in 80 g of O2(whose molecular weight is 32) For H2 8 g times 1 mol 2 g = 4 moles therefore it has 4 times 602 times 1023 molecules Similarly 80 g of O2 is only 8032 = 25 moles and contains only 25 times 602 times 1023 molecules All things being equal we expect that the pressure exerted by hydrogen would be greater by a ratio of 4 to 25 Thus the following equation applies
(6) =nVP 11
constant (at constant temperature)
where n is the number of moles of gas present 34 Charlesrsquo Law Around 1800 French scientist and balloonist Jacques Charles began studying the effect of increasing temperature on gases He observed that the rate of thermal expansion is constant
10
and is the same for all gases as long as the pressure is constant Charles examined the effects of temperature upon the pressure exerted by a confined gas with volume and mass remaining constant Fig 2 shows that the pressure increases uniformly as the temperature increases Thus the graph of pressure vs temperature is a straight line
In 1848 Lord Kelvin a British physicist noted that by extending different temperaturevolume lines (for gases at various but constant pressures) back to zero volume he always found the same intercept The intercept on the temperature axis is -27315degC Kelvin named this temperature absolute zero The Kelvin absolute temperature scale in which K = degC + 27315 is named in his honor The volumetemperature relationship for gases using the absolute temperature scale is known as Charlesrsquo Law At a constant pressure the volume of a finite amount (mass) of gas is directly proportional to the temperature of the gas Mathematically Charlesrsquo Law can be stated as follows (using the absolute temperature scale) (7) TV prop (8) TkV sdot= This relationship leads to
(9) 2
2
1
1TV
TV
=
Note that in Figure 2 the graph of P vs T is shown as a dashed line below a certain temperature This is to indicate that the pressure would become zero at some temperature if it continued to decrease at the same rate as it does near room temperature Any ideal gas is assumed to behave this way but in actual practice before the gas pressure becomes zero the gas will liquefy at some temperature and then of course it will no longer even be a gas As the temperature of the gas decreases the pressure deviates somewhat from the straight-line relationship We expect such a behavior on the basis of what we know about molecules The slower-moving molecules are more affected by mutual cohesive forces and the pressure exerted by them will drop off a little Finally when the temperature is low enough and the
11
molecules slow enough the cohesive forces causes the molecules to stick together as a liquid The mathematical equation of the straight line in Fig 2 can be written as (10) ( )TbPPT sdot+sdot= 10 Therefore using the assumption that gases are nearly ideal we can rework equation (10) into a form that makes calculations very simple Using the numerical value of 000366 degC for b (11) ( )TPPT sdot+sdot= 00366010 At what temperature would the pressure be zero if the straight line continued to be a true description of the course of events From equation (11) it is evident to make PT = 0 we must have (1 + 000366T) = 0 That is the required temperature is
(12) CT
degminus=
0036601
= -273degC
Where PT is the pressure at temperature T P0 is the pressure at 0degC and b is the pressure coefficient for the gas Experimental data shows that the constant b is practically the same for all gases and is about 000366 degC for those gases such as hydrogen which are nearly ldquoidealrdquo The pressure coefficients for helium and oxygen are 000367 degC Such differences are minor and show that no gas is totally ideal Thus it can be seen that the temperature at which the pressure would become zero is the same for all ideal gases if the gas remained an ideal gas all the way down to zero pressure Again we call this temperature absolute zero In the laboratory we can measure the pressure of a gas at different temperatures and extrapolate the graph down to zero pressure see Fig 3 Precise experiments have given -27315degC as the value of this important constant but we can usually round the value to -273degC In the Charlesrsquo Law experiment you will examine the effect of temperature on the volume of a gas You will also extrapolate the temperaturevolume relationship to obtain a temperature value for absolute zero 35 Ideal Gas Equation From Charlesrsquo Law we know that volume varies proportionally with absolute temperature From Boylersquos Law we know that volume varies with an inverse proportionality with pressure Combining the two laws we obtain
(13) ⎟⎠⎞
⎜⎝⎛sdot=
PTkV
or PV = T k
where the constant represents the number of gas molecules present We can replace k k
12
with n and R to denote the number of gas molecules and the gas constant
(14) = nR k Combining equations (13) and (14) we get (15) PV = nRT which is referred to as the ideal gas equation of state where R = 8314 dm3 kPa mol K Additionally the number of moles n is equal to the mass m divided by the molecular mass M and can be inserted into equation (15) to yield
(16) PVmRTM =
MmRTPV = or
36 Daltonrsquos Law of Partial Pressure As we have already discussed gases exert pressure on their enclosures Mixtures of gases exert pressure on their enclosures as well but each component of the gas mixture is responsible for only a fraction of the total exertion John Dalton was the first scientist to form a hypothesis about how much each component of a mixture of gases contributes to the overall pressure exerted We call the pressure exerted by a single type of gas a partial pressure Daltonrsquos hypothesis states that the total pressure in a container is the sum of the partial pressures of the gases in the container The contribution by a single gas to the overall pressure exerted on a container depends largely on the amount of gas present For equal volumes of gases in a container there are different numbers of molecules present for each gas Since each gas is at the same temperature in a mixture the pressure due to a single gas is due to the number of molecules of the gas in relation to the overall number of molecules
13
40 Examples of How Boylersquos and Charlesrsquo Laws Are Used in Everyday Life The measurement and effects of temperature and pressure are very important to our everyday
life Let us first discuss the significance of atmospheric pressure to the forecasting of weather creation of winds the measurement of altitude for aircraft and the cause of atmospheric circulation 41 Significance of Atmospheric Pressure The average pressure exerted by the atmosphere is approximately 147 pounds per square inch at sea level (also known as 1 atmosphere) This means that a column of air of one inch square extending from sea level to the top of the atmosphere would weigh about 147 pounds The actual pressure at a given place and time however depends upon several factors including altitude temperature and the density of the air 42 Measurement of Atmospheric Pressure A barometer generally consists of a column of mercury in a glass tube It is sealed at one end and calibrated in inches of mercury An increase in pressure forces the mercury higher in the tube a decrease allows some of the mercury to drain out reducing the height of the column In this way changes of pressure are registered in inches of mercury The standard sea-level pressure expressed in these terms is 2992 inches at a standard temperature of 15degC (59degF) If all weather stations were at sea level the barometer readings would give a correct record of the distribution of atmospheric pressure at a common level To achieve a common level each station translates its barometer reading in terms of sea level pressure A change of 1000 feet of elevation makes a change of about one inch on the barometer reading Thus if a station located 5000 feet above sea level found the mercury to be 25 inches high in the barometer tube it would translate and report this reading as 30 inches Because the rate of decrease in the atmospheric pressure is fairly constant in the lower layers of the atmosphere the approximate altitude can be determined by finding the difference between pressure at sea level and the pressure at the given atmospheric level In fact the aircraft altimeter is an aneroid barometer with its scale in unites of altitude instead of pressure 43 Effects of Altitude on Atmospheric Pressure We can conclude that atmospheric pressure decreases as altitude increases and that the pressure at a given point is a measure of the weight of the column of air above that point As altitude increases pressure decreases along with the weight of the air column This decrease in pressure has a pronounced effect on aircraft takeoffs rates of climb and landings An airplane that requires a 1000 foot runway for takeoff at a sea level airport will require a runway almost twice as long to takeoff at an airport 5000 feet above sea level The purpose of the takeoff run is to gain enough speed to generate lift from the passage of air over the wings When the air is less dense more speed is required to obtain enough lift for takeoff hence a longer ground run is necessary It is also true that the engine is less efficient in thin air and the thrust of the propeller is less effective Generally atmospheric pressure drops by half every 5 km increase in altitude
14
44 Effects of Differences in Air Density Differences in air density caused by temperature changes result in pressure changes This in turn creates motion in the atmosphere both vertically and horizontally (currents and winds) This action when mixed with moisture produces clouds and precipitation In fact these are all the phenomena called weather In general a marked fall of the barometer indicates the approach of bad weather and marked rise indicates the clearing of the weather 45 The Cause of Atmospheric Circulation Pressure and temperature changes produce two kinds of motion in the atmosphere vertical movement of ascending and descending currents and horizontal flow called wind The atmosphere tries to maintain an equal pressure over the entire earth just as the ocean tends to maintain a constant level When the equilibrium is disturbed air begins to flow from areas of higher pressure to areas of lower pressure The factor that upsets the normal equilibrium is the uneven heating of the earth by the sun
15
50 Thermodynamic Experiments
51 Background Heat can best be visualized in terms of what it does When water is heated what is happening to the water molecules The warmer molecules are moving at a greater velocity and are colliding with their neighboring molecules Energy is being transferred from the heat source to the water molecules causing them to move faster and collide with other water molecules more frequently The rate of evaporation of the water molecules increases as a sample warms and the vapor pressure of the sample (determined by the number of water molecules in gaseous form above the liquid) also increases Therefore visualizing the effects of heat at the molecular level makes it easier to comprehend Since frozen and liquid water have different physical properties their models must be different to Water molecules in the liquid form can be visualized as being extremely small V-shaped objects that are packed closely together These molecules are moving extremely rapidly in all directions and are colliding with great frequency In changing from a liquid to a solid (as in freezing) much of the moleculersquos energy is lost as heat is removed causing the movement and frequency of collisions to diminish In ice the intermolecular forces (forces between molecules) of attraction are strong enough to hold the water molecules relativelyimmobile The motion of molecules should cease if the temperature of the ice were reduced to a temperature known as absolute zero (-27315degC or 0 K) When heat is applied to ice part of the heat goes toward breaking the bonds that hold the water molecules together as a solid The heat of fusion which is the amount of energy required to melt one gram of solid is another identifying characteristic value for each compound The objective of the second portion of this module is to determine the amount ofheat required to melt one gram of ice Density and specific heat are also frequently used to identify unknown liquids and solids As mentioned previously the specific heat of a substance is the amount of heat (calories) required to raise 1 g of the substance by 1degC in temperature Density is a measure of the mass per unit volume for a substance or object (measured in gcm3 for instance) A Note on Energy Units The calorie is a fundamental and easily understood unit However there are many other units of heat and you will need to be able to convert to and use these other units in laboratory and classroom discussions The unit of heat most commonly used is the joule which is equal to 02390 calories This is more commonly stated and remembered with the equation
1000 cal = 4184 joules A joule and a calorie are both measures of heat energy The only difference between the two is the measurement system you are using (ie metric or British) The Joule is a unit in the International System (or metric system)
16
52 Safety Precautions
A chemistry laboratory is a safe place to work if you follow appropriate safety procedures The most important piece of safety equipment is eye protection The following safety items are mandated
bull Wear eye protection at all times bull DO NOT eat drink chew or smoke in the lab bull DO NOT wear shorts or short skirts in the lab bull DO NOT wear open-toe sandals or high heels in the lab bull Clean up spills and accidents immediately and correctly If yoursquore not sure how askbull NEVER pipet anything by mouth use a rubber bulb bull Read the label on the reagent bottles each time before you use them bull Dispose of waste in proper containers when in doubt ask bull Assume all chemicals are toxic and possibly corrosive Read the label on reagent
bottles and on experimental containers each time before you use them (afterward may be too late) Some chemicals are toxic some are corrosive some are flammable If you donrsquot know anything about a compoundrsquos properties its best to assume it might be all three
bull Know where the safety shower fire extinguisher and emergency eye wash stations are and how to use them
bull Flush acids and bases from the skin with lots of water Be your brotherrsquos keeper Watch out for othersrsquo safety as well as your own Point test tubes being heated away from yourself and your neighbors Wait until your glassware is cool before you ask anyone to pick it up If you see anything that happens to be unsafe report the situation to the TA Bunsen Burner - It is sometimes difficult to see at a glance whether or not your Bunsen burner is operating Always exercise caution when working around a Bunsen burner by making sure your cloths hair and papers are clear from the flame area
17
53 Materials Required
Experiment 1 Equipment Styrofoam cup or insulated plastic mug Metal Cup Ring Stand Clay Triangle Candle Bunsen Burner or hot plate Ice Thermometer ( for thermistor Thermistor calibration) Experiment 2 Equipment Two Styrofoam cups or insulated plastic mugs Pasteur pipet with bulb Ice Plastic gloves Thermistor Thermometer (for thermistor calibration) Reagents Antifreeze (or ethylene glycol) t-Butanol (tert-butyl alcohol)
18
In this experiment you will determine the heat of combustion for candle wax This combustion results in a chemical change During the experiment some wax will melt as well as combust To avoid losing the mass of wax drops it is a good idea to weigh the candle with a paper towel Put the paper towel under the candle while it is burning to catch any drips At the end of the experiment weigh the candle and the towel In this way you account for the mass of any unburned wax that has dripped from the candle Step 1 - Set up a ring stand with a clay triangle to hold the aluminum can The can will serve
as a water container Heat transfer from the flame to the can is facilitated by the use of a clay triangle as opposed to a wire mesh (see figure below)
Step 2 - Clean as much carbon off the metal can as possible then find its mass using a
balance Place ~100 mL of cold water in the can and determine the mass of the metal can with the water The temperature of the water need not be any particular value but the temperature should be correctly measured
Step 3 - Use a balance to accurately determine the mass of the candle (if you choose to use a
paper towel include its mass in the measurement) By means of a clamp position the candle with the wick about 1 inch below the cup
Step 4 - Connect the thermistor to the LabWorkstrade interface Calibrate the thermistor if it has
not been calibrated already Step 5 - Start your program for measuring temperature or start a pre-written program
(THERM2 for instance) Step 6 - Record the initial temperature of the water
Step 7 - Light the candle Stir the water gently with the thermistor until a 20degC temperature
rise is noted
Step 8 - Blow out the candle Allow the molten wax to solidify so that drops are not lost when removing the candle from its holder
Step 9 - Record the final temperature of the water Step 10 - Find the mass of the candle and towel to determine the grams of candle burned
You may also need to remove any wax drippings from the candle holder and include them when measuring the mass
Step 11 - Data Analysis - Perform the following calculations on your Data Summary Sheet
Experiment 1 Heat Associated with Chemical Change
19
a) The specific heat of water is 100 calgdegC The equation which allows you to
calculate the amount of heat absorbed by water is
q = s times g times ΔT where q is the number of calories absorbed by water s is the specific heat (for water sis 100 calgdegC g is the mass of the water and ΔT is the change in temperature (eg20degC) Calculate the amount of heat q absorbed by the water in your experiment Report this value on your Data Summary Sheet
b) The value of q also represents the amount of heat given off by the combustion of the candle assuming all the heat given off was absorbed by the cup of water Actually there would be some heat loss to the atmosphere clamp etc The amount is relatively small and may be disregarded in this experiment
c) The amount of heat liberated per gram of candle burned (H) can be calculated by the following expression
H = q G
Where G refers to the grams of candle burned H is a measure of the heating ability of the candle and is also a measure of the energy change involved in a chemical change (the reaction of the candle wax with oxygen from the air) Calculate H for your candle Report this value on you Data Summary Sheet Experimental Setup
20
Mass of can and water _______g Mass of empty can _______g Mass of water _______g Temperature before heating _______degC Temperature after heating _______degC Temperature change _______degC Mass of candle before burning _______g Mass of candle after burning _______g Mass of candle burned _______g Calculate calories of heat absorbed by water Calculate the calories of heat produced per gram of candle burned
Name_____________________ Date______________________ Lab Section________________
Experiment 1 Data Summary Sheet
21
The objective of this experiment is to determine the freezing points of both t-butanol and a solution of automobile antifreeze in t-butanol In addition you will determine the densities of both the solution and the pure solvent using the LabWorkstrade Interface system Most of you know that in northern climates you cannot simply put water in your carrsquos radiator- it will freeze in the winter and damage or destroy the engine Antifreeze must be mixed with the water to prevent this from happening If you look at the ingredients list on any antifreeze container you will see that it is more than 95 ethylene glycol The fluid in your radiator is therefore a homogeneous liquid mixture it is ldquohomogeneousrdquo because it looks the same (even under a microscope) and a ldquomixturerdquo because it contains two components which can be separated (if you boil the mixture the water will evaporate leaving the ethylene glycol behind) This kind of mixture is very important in chemistry it is called a solution In a solution there are always two or more components one of which there is a lot of and very little of the other Think of the ocean it has some salt but mostly water Cola drinks are a mixture of several different components with water yet they are still mostly water The major component is called the solvent and the minor one the solute There are several ways of describing the composition of such a mixture In this experiment we will use composition as the measure Composition is defined as
100Solution of Weight Total
Component ofWeight on Compositi times=
For example if we take 500 g ethylene glycol and mix it with 9500 g water this gives a total weight of 500 g + 9500 g = 10000 g and a percent composition of glycol
00510010000g
500g=times
To make such calculations in this experiment we will use densities and make some assumptions about how big the drops of antifreeze are The solution in your car radiator freezes at much lower temperature than pure water does This is a general property of solutions any solution freezes at a lower temperature than the pure solvent It would be nice if we could do this experiment with water but to do so we would need access to temperatures down to -30degC As we do not have the equipment to do this we will use t-butanol in its place as it has a higher freezing point
Experiment 2 Chemistry of Antifreeze Density and Freezing Point
22
You will begin by determining the freezing point of t-butanol Then each group will be
assigned a specific mixture of ethylene glycol and t-butanol for measuring the change in the freezing point You will mix this solution and determine the density and freezing point At the end of the class period the density and freezing point data will be collected and correlated for the whole class It is important to work slowly and carefully sloppy work usually shows when all the class results are compared Part 1 Density and Freezing Point of Pure tert-Butanol Step 1 - Connect the thermistor to the LabWorkstrade interface with one lead on ldquoDAC1rdquo and
the other lead on ldquoI1rdquo Step 2 - Calibrate the thermistor if needed You may use ice water and warm tap water (about
40-50degC) The thermistor should either be calibrated or checked prior to use to ensure accurate readings
Step 3 - Put on a pair of plastic gloves and pour about 10 mL of t-butanol from the stock
bottle into a small beaker Use plastic gloves whenever you handle t-butanol or the ethylene glycol Spills on the skin are usually harmless but you may have an allergic reaction
Step 4 - Check to see that your 10 mL graduated cylinder is clean and dry If it is not wash it
out with soap and water and dry it carefully with a wipe Now carry out the following sequence of operations to determine the density of your solution recording the raw data in your notebook
a Weigh the empty graduated cylinder and record its mass b Transfer about 15 mL of t-butanol from the beaker to the graduated cylinder and
record the volume (read the bottom of the meniscus accurately to within two decimal places)
c Weigh the graduated cylinder and its contents and record the mass d Repeat steps b and c at least 4 more times The volume and the mass should
increase in each step at the end of the process you should have ~10 mL in the graduated cylinder
This whole operation should take no more than ~5 minutes Do it at the balance but
be careful not to spill any t-butanol If you do have a spill clean it up immediately with a wipe Leave the t-butanol in the graduated cylinder and take it back to your station Keep the extra t-butanol you have in the beaker as it is needed in the next step
Step 5 - Fill a clean dry 10 cm disposable test tube half full with t-butanol from the graduated
cylinder Dry your thermistor off carefully with a wipe place it into the liquid in the test tube and put the test tube into a beaker of hot water to warm it well above the freezing point Fill the second beaker with ice and add just enough water to make themixture slushy
23
Step 6 - Now you are ready to start your LabWorkstrade Interface program (BUTANOLEXP is a pre-written program for this experiment) You can call the output file BUTANOL1DAT for example) Once you can see the graph plotting (T should be 40 degC or higher) insert the test tube and its contents into the ice bath You are collecting data for a cooling curve and you are also sending it to a spreadsheet so you can have a permanent copy
This experiment is very sensitive to external influences and the t-butanol needs to be stirred vigorously as the cooling proceeds Hold the test tube with one hand and use the thermistor to stir the liquid with a circular motion as the cooling curve is plotted Continue to stir and watch both the liquid and the graph until you are down to about 10degC Be careful to keep all of the liquid submerged in the ice bath and do not let the thermistor tip rest on the bottom of the test tube The temperature will drop but there will be some parts that are not smooth Notice what the curve does when you see crystals beginning to form in the test tube be prepared to describe what you see
Part 2 Density and Freezing Point Determination for a Solution of Ethylene Glycol in t-Butanol Step 7 - You are now ready to determine the freezing point of a solution in t-butanol Pour 10
mL of t-butanol into the beaker (if you need to melt the sample you just used in step 6 in warm water) Put a few mL of ethylene glycol from the stock bottle into another clean and dry test tube Your TA will assign you a specific number of drops (between 5 and 30) to add for your measurement of the change in the freezing point
The amount of ethylene glycol added will vary across the class so you can see what
happens to the freezing point over a range of densities Just 1 or 2 mL will be plenty Measure out your assigned number of drops using a Pasteur pipet (everyone needs to use the same kind of dropper so that the results can be compared) Add the ethylene glycol to the t-butanol and mix thoroughly with a stirring rod
Step 8 - Now repeat steps 4-6 to find the density and freezing point of your solution (be sure to
name your output data file differently than before) You will find that your solution freezes at a lower temperature than pure t-butanol how much lower and how this relates to the density are the questions that we need to answer When you have determined the freezing point and the density of your assigned solution write your results in a table A copy of this table will need to be included in your laboratory write-up
Step 9 - Before performing the data analysis you should investigate the sensitivity of the
experiment Follow steps 4-6 to obtain two more cooling curves with pure t-butanol one in which you stir the solution by moving the thermistor gently up and down while the cooling curve is collected and one in which you do not stir with the thermistor at all You can use the same program (BUTANOLEXP) to collect these curves Be sure you give the data files different names so that you can refer to all of the data when writing your report
24
Data Analysis
Step 10 - You should now have four cooling curve data files on disk one each for pure t-butanol the solution with vigorous stirring moderate stirring and no stirring at all Make graphs of your cooling curves using any software available to you You need to determine the freezing point temperature to within 01degC this may be difficult from the raw graph To increase the readability of the graph scale the data to within 1degC above and below what you think is the freezing point which should make it possible to read your freezing point to within plusmn 01degC
Step 11 - Repeat step 10 to determine your freezing point for the curves for the vigorously stirred solvent and solution These should have a recognizable feature which you can use to measure the freezing temperature accurately Then compare the vigorously stirred pure t-butanol with the others that were not so vigorously stirred Describe the differences between them in a short paragraph in your report The explanation for these differences is not very complex Suggest some possibilities yourself
Step 12 - The calculation of the density requires the use of a spreadsheet Using your program of choice label two columns MASS and VOLUME Now enter your measurements of mass and volume for each of the additions of liquid from step 4
Step 13 - The entries in the MASS column should be the mass of both the solvent and the mass of the graduated cylinder (see step 4 if you forgot about this) To obtain the mass of the solvent the mass of the graduated cylinder needs to be subtracted from each measurement To do this you can simply add to each cell ldquo-rdquo where is the mass of the empty dry graduated cylinder
Step 14 - To get the ldquobestrdquo value for the density of pure t-butanol graph the volume on the x-axis and the mass (calculated in step 13) on the y-axis Now calculate the best fit line to the data if yoursquore using a spreadsheet you can graph the data while choosing ldquolinear regressionrdquo as the type of graph to obtain these data The parameters of the best fit line will be in the form of y = mx + b further you should calculate the correlation coefficient or ldquogoodness of the fitrdquo (sometimes referred to as R2) A correlation coefficient of 10 represents a perfect fit Which of the parameters in the regression is the density that you should report
Step 15 - Save this file to a flash drive give it a name such as ldquoPURErdquo
Step 16 - Repeat steps 12-15 for the t-butanol and ethylene glycol solutions
Step 17 - Cleanup The TA will tell you where to dispose all the chemicals
At the end of the lab period your data will be put together and used to discuss precision and accuracy in the laboratory measurements Prepare a table which includes the densities and freezing points for both pure t-butanol and for the solution These will be compared across the whole section
25
Each of the following projects defines a problem Your assignment for each problem is to design an experiment (or several experiments) that might be useful in solving the problem or explaining the phenomenon Select a project that interests you the most Experiment 3 Boiling-Point Elevation by Dissolved Substances When solutes are dissolved
in solvents the boiling point of the resultant mixture is different than the pure solvent Use pentane and diethyl ether as solvents to investigate this phenomenon Use camphor (moth repellant) as the solute and be careful not to expose yourself to fumes
Experiment 4 Factors Affecting Freezing-Point Depression in Water You looked at the
effect of antifreeze on the freezing point of t-butanol in Experiment 2 Use water as the solvent this time and explore the effects of antifreeze sugar and salt Use a mixture of ice and salt as your cooling bath
Experiment 5 Molar Heats of Reaction for Hydrochloric Acid (HCl) and Sodium Hydroxide
(NaOH) Measure the heat of reaction with 1 mole of aqueous HCl with one mole of aqueous NaOH Find out if the heat you measure is concentration dependent Note you do not need to react one full mole of each substance to calculate their molar heats of reaction
Individual Report Requirements Reports should be submitted on letter sized paper and must be typed You and your lab partner will submit separate reports although we know that the data will be identical As part of this project you and your lab partner will be required to give a 5-10 minute presentation to your section You and your lab partner may divide the tasks any way you wish but there must be a clear level of equal participation Include the following sections in your report Grammar spelling and presentation all count A Introduction Purpose ndash Objectivesbackground briefly given in your own words B Experimental Measurements and Data ndash Principles of experiment apparatus all data you used in calculations discussions and conclusions Large amounts of related data should be presented in tabular form Include labeled graphs and notes made on the experiment C Data Analysis Calculations ndash Explain how data was analyzed including all formulasand calculations you used Discuss relation of analysis to theory and experiment If a calculation was repeated several times the multiple results should be shown in tabular formwith a single example of the calculation shown once Include an error analysis D Discussion Conclusions - Briefly and clearly state your interpretations of the results and mention any problems you had in doing the experiment If you didnrsquot reach any conclusions from the experiment you should state why and support your explanation with data E References - Document any outside primary references (not the internet) you used in preparing your report You should use text books and perhaps journals as references You do not need to cite your lab partner or others in your lab (including your TA) as references
Experiments 3 4 and 5 Projects for Further Investigation
26
60 Gas Law Experiments
61 Background In several of these experiments you will not need the LabWorkstrade interface While the interface can be used to monitor the temperature and pressure it cannot be used to directly monitor volume 62 Safety Precautions A chemistry laboratory is a safe place to work if you follow appropriate safety procedures The most important piece of safety equipment is eye protection The following safety items are mandated
bull Wear eye protection at all times bull DO NOT eat drink chew or smoke in the lab bull DO NOT wear shorts or short skirts in the lab bull DO NOT wear open-toe sandals or high heels in the lab
63 Materials Required Experiment 6 Equipment 400 mL beaker crucible tongs
125 mL Erlenmeyr flask with Bunsen burner or hot plate rubber stopper thermistor large beaker or battery jar thermometer (for thermistor 100 mL graduated cylinder calibration) ice
Experiment 7 Equipment TI Graphing Calculator
Vernier Gas Pressure Sensor with 20 mL syringe LabPro Interface DataMate program
27
In this experiment you will explore the effect of temperature on a gas which remains at constant pressure You will not use the LabWorkstrade interface to make measurements for this experiment The dependence of the volume of a gas on its temperature was first described by Jacques Charles in 1787 He was among the first people in history to fly in a hot air balloon and was therefore interested in the relationship between the volume of a gas and its temperature The relationship is that the ratio of volume to the absolute temperature is a constant if the pressure remains unchanged Mathematically this is generally expressed as
(1) kTV
=
or
(2) 2
2
1
1TV
TV
=
Procedure Step 1 - Place about 200 mL of water in a 400 mL beaker Place the beaker on a hot plate or
over a Bunsen burner and heat it to the boiling point Step 2 - While the water is heating prepare a cold water bath by putting cold water in a heavy
container (eg battery jar or a large beaker) and adding ice The water level for the cold water bath should be within about 3 cm of the rim
Step 3 - Thoroughly dry a 125 mL Erlenmeyer flask and fit it with a rubber stopper with a
single hole in it Step 4 - Using crucible tongs immerse the flask in the boiling water up to its neck Keep the
hole in the stopper open to the atmosphere and do not allow water to enter the flask during the heating process Hold the flask in the boiling water for at least six minutes
Step 5 - Record the temperature of the boiling water with a thermometer Step 6 - Using the tongs quickly invert the flask and insert it into the cold water bath Keep
the stoppered end pointed downward and immerse the flask as completely as possible for five minutes Water will be drawn into the flask
Experiment 6 Charlesrsquo Law
28
Step 7 - When the flask is cool adjust its position (still upside down) so the level of the water inside the flask is the same as that in the cold water bath While the flask is in this position place your finger over the hole in the stopper and remove the flask placing it upright on the lab table
Step 8 - Record the temperature of the cold water bath using the thermistor or thermometer Step 9 - Pour the water from the flask into a 100 mL graduated cylinder and determine the
volume of the water that was drawn into the flask while it was under water Step 10 - Determine the volume of the full flask with the stopper in place Fill the flask with
water insert the stopper as it was initially and pour the water into the graduated cylinder to determine the amount of water in the full flask
Calculations We know that the volume decreases with decreasing temperature We would like to quantify this relationship Step 11 - Determine the ratio of the volume of the air to its absolute (Kelvin) temperature
when it was hot The volume is the same as that of the full flask and the temperature is the same as the hot water temperature
Step 12 - Determine the ratio of the volume of the air to its absolute (Kelvin) temperature
when it was cold The volume of the cold air is the volume of the full flask minus the volume of the water that was drawn in when the flask was upside down and the temperature is the same as the cold water temperature
Is there a relationship between these two ratios What does this tell you about the dependence of the volume on its absolute temperature
29
Temperature of the hot water bath _______degC Volume of water in the flask after cooling _______mL Temperature of the cold water bath _______degC Volume of the full flask _______mL Absolute temperature of the hot water bath _______K Absolute temperature of the cold water bath _______K Volume of cold air _______mL Volume temperature ratio for hot air _______mLK Volume temperature ratio for cold air _______mLK 1 What is the mathematical expression for Charlesrsquo Law 2 A sample of gas had a volume of 265 mL when its temperature was 298 K If the pressure remains constant what will be its volume when the temperature decreases to 225 K 3 A sample of argon had a volume of 1978 L at 25degC At what temperature would its volume be 240 L (Assume constant pressure)
Name_____________________ Date______________________ Lab Section________________
Experiment 6 Data Summary Sheet
30
The LabPro interface has an ldquoEvents with Entryrdquo mode which collects one data point each time you press [ENTER] and then asks you to enter a corresponding value for that point This tutorial will guide you through the setup procedure of an experiment using the Events with Entry to investigate the relationship between the pressure and volume of a gas Procedure Step 1 - Prepare the Gas Pressure Sensor and an air sample for data collection
a) Plug the Gas Pressure Sensor into Channel 1 of the LabPro Use the link cable to connect the TI graphing calculator to the interface Firmly press in the cable ends
b) With the 20 mL syringe disconnected from the Gas Pressure Sensor move the piston of the syringe until the front edge of the inside black ring (indicated by the arrow) is positioned at the 10 mL mark
c) Attach the 20 mL syringe to the valve of the Gas Pressure Sensor The Vernier Gas Pressure Sensor has a white stem protruding from the end of the sensor box - attach the syringe directly to the white stem with a gentle half-turn
Step 2 - Turn on the calculator and start the DataMate program Notice how the program
automatically identified the Pressure Sensor (an auto-ID sensor) It displays the channel it is connected to and the current reading Press [CLEAR] to reset the program
Step 3 - To collect pressure vs volume data for Boylersquos law you need to collect the data in
the Events with Entry mode The current mode is time graph so select SETUP
Experiment 7 Boylersquos Law
31
Step 4 - Below is the Setup screen Here you can change the data collection mode To select MODE
press up once and press [ENTER]
Step 5 - A list of modes will appear in the SELECT MODE screen Press the number
preceding EVENTS WITH ENTRY You will be returned to the Setup screen Then select OK to return to the setup screen
Step 6 - Select OK to return to the Main screen You are now ready to collect pressure and
volume data It is best for one person to take care of the gas syringe and for another to operate the calculator
Step 7 - Select START Notice that a graph is not initially displayed instead it is going to
wait for you to collect at least two data points Step 8 - Move the piston so the front edge of the inside black ring is positioned at the 5 mL
line on the syringe Hold the piston firmly in this position until the pressure value displayed on the calculator screen stabilizes (in this example the number to the right 19432 kPa) The number to the left indicates the sample number
32
Step 9 - Press [ENTER] which tells the DataMate to record the pressure Type in ldquo5rdquo the
gas volume (in mL) on the calculator Press [ENTER] to store this pressure-volume data pair To collect another data pair move the syringe to 75 mL When the pressure reading stabilizes press [ENTER] and enter ldquo75rdquo as the volume Repeat the above procedure for volumes of 100 125 150 175 and 200
As you work your way through the experiment you get to view the data being collected Notice the sample number (5) the value given (689 kPa) and the graph in progress
Step 10 - When you are done press [STO] to end data collection Step 11 - Move the cursor right or left (using the arrow keys) to examine the data pairs on the
displayed graph
Step 12 - Press [ENTER] to return to the Main menu then select QUIT to quit the program
33
Experiments 8 and 9 Projects for Further Investigation
Each of the following projects defines a problem Your assignment for each problem is to design an experiment (or several experiments) that might be useful in solving the problem or explaining the phenomenon Select a project that interests you the most Experiment 8 Adiabatic Gas Expansion When compressed gases expand they must perform
work to overcome the attractive forces between molecules Design and test an experimental setup to determine the amount of work (as heat) developed by such an expansion
Experiment 9 Boiling Point Elevation Due to Pressure When a liquid boils its vapor
pressure has reached the pressure of the atmosphere By increasing the pressure surrounding the liquid the temperature required to reach boiling increases Design and test an experimental setup which allows you to determine the boiling point for water at several pressures and compare these values to a phase diagram
Individual Report Requirements Reports should be submitted on letter sized paper and must be typed You and your lab partner will submit separate reports although we know that the data will be identical As part of this project you and your lab partner will be required to give a 5-10 minute presentation to your section You and your lab partner may divide the tasks any way you wish but there must be a clear level of equal participation Include the following sections in your report Grammar spelling and presentation all count A Introduction Purpose ndash Objectivesbackground briefly given in your own words B Experimental Measurements and Data ndash Principles of experiment apparatus all data you used in calculations discussions and conclusions Large amounts of related data should be presented in tabular form Include labeled graphs and notes made on the experiment C Data Analysis Calculations ndash Explain how data was analyzed including all formulasand calculations you used Discuss relation of analysis to theory and experiment If a calculation was repeated several times the multiple results should be shown in tabular formwith a single example of the calculation shown once Include an error analysis D Discussion Conclusions - Briefly and clearly state your interpretations of the results and mention any problems you had in doing the experiment If you didnrsquot reach any conclusions from the experiment you should state why and support your explanation with data E References - Document any outside primary references (not the internet) you used in preparing your report You should use text books and perhaps journals as references You do not need to cite your lab partner or others in your lab (including your TA) as references
34

2
Thermistor Calibration
10 Introduction This tutorial explains how to do temperature measurements using the DataMate program in Time Graph mode on a TI graphing calculator connected to a LabPro interface with a temperature probe The LabPro interface reads signals from a variety of sensors and transmits those signals electrically to a calculator or computer Sensors can be divided into two basic typesmdashanalog and digital Examples of analog sensors are temperature probes pH sensors force sensors oxygen gas sensors etc Up to four analog sensors can be connected to LabPro Four jacks for the analog sensors (CH 1 ndash CH 4) are located on the same side as the AC adapter port The analog ports accept British Telecom-style plugs with a right-hand connector Examples of digital sensors are motion detectors radiation monitors photogates and rotary motion sensors Up to two digital sensors can be connected to LabPro The digital ports (DIGSONIC) which accept British Telecom-style plugs with a left-hand connector are located on the same side as the serial and USB computer connections Materials and Equipment 1 LabPro interface (see next page for drawing thereof) 2 TI graphing calculator (TI-84 Plus provided by us but others will work) 3 Temperature probe (Vernier) 4 DataMate program 5 Silver graphing link cable (to connect LabPro Interface to computer) 6 Computer with Logger Pro 33 software LabPro Interface The LabPro interface has three buttons three LEDs four analog channels (CH 1 CH 2 CH 3 and CH 4) two digital channels (DIGSONIC 1 and DIGSONIC 2) a serial computer connection a USB computer connection a piezo speaker and a calculator IO port
3
Procedure 1 Plug the link cable into the link port of the TI graphing calculator and LabPro You will collect data on TI graphing calculator and use LabPro only as an interface (IO port) 2 Plug the stainless-steel temperature probe into Channel 1 Connect the sensor to the appropriate port (Channel 1 for temperature probe) An important feature of LabPro is its ability to detect auto-ID sensors and automatically set up an experiment Remember that the temperature probe does not need calibration so skip any instructions asking you to calibrate the sensor 3 Provide power to LabPro (AC adapter) To use LabPro with the AC power supply plug the round plug on the 6-volt power supply into the side of the interface Shortly after plugging the power supply into the outlet the interface will run through a self-test You will hear a series of beeps and blinking lights (red yellow then green) indicating a successful power up If the self-test is not successful unplug everything and plug it in again You cannot proceed until you hear the beeps 4 Start the DataMate program on TI-84 Plus graphing calculator Use the following steps to start the DataMate program on your calculator
1 Turn the calculator ON 2 Press APPS (Applications) 3 Press number under DataMate program 4 This temporary screen will appear
4
After the program begins the calculator will try to communicate with the interface and check for auto-ID sensors If this communication is successful the main screen (shown below) will appear
In this example a temperature probe was connected and DataMate automatically identified and displayed the channel it was connected to giving the current temperature reading DataMate also sets up a default time graph experiment for auto-ID sensors In this example an experiment was set up to collect data for 180 seconds To change time settings
1 Press 1 (for Setup in Main Menu) 2 Select Mode and press Enter 3 In Select Mode menu press number 2 (Time graph) 4 Select Options and then Change time settings 5 Pick time interval between the points and total time of the experiment (should be the
same for all three experiments) 6 You are now ready to collect data
5 Collect data with DataMate on a TI graphing calculator Use the following steps to collect data on the DataMate program Note that the TI calculator can only hold a maximum of three sets of data from a single auto-ID sensor such as a temperature or pressure probe
1 Press 2 (for Start in Main Menu) 2 When experiment is done (graph will automatically appear) press Enter (to go back to
Main Menu) If you want to stop experiment run earlier click STOgt 3 Press 5 (for Tools in Main Menu) 4 Press Store Last Run 5 Repeat it for the second set of data 6 At the end of the third set of the data there is no need for Store Last Run step instead
press 6 (for Quit in Main Menu) (last measurement will be stored automatically)
5
6 Transmit data to computer
Use the following steps to retrieve data from the TI calculator by the computer 1 All computers have Logger Pro 33 software on them 2 Connect the calculator and the computer IO (calculator) - USB (computer) silver
graphing cable 3 Start Logger Pro 33 program by double-clicking on the icon 4 Click on the little calculator icon in the top line on the program menu (Import from TI
device should appear when you put mouse on little calculator icon) 5 Pick the TI-GRAPH LINKtrade-USB from the Port pull down menu Skip step 6 if TI-
GRAPH LINKtrade-USB is already present 6 Click on Scan for device 7 From Choose data to import highlight L1 (time) and L2 L3 and L4 lines
(Temperature) by holding Ctrl button 8 Click OK
9 You can make
a Single graph (for example only L2 vs L1) b All three measurements appear on the screen at the same time by clicking on the
temperature axes (y-axes) choose option More and then check the three columns to be displayed (L2 L3 L4)
c Click OK
10 To save graph in format that you can later use with Excel Origin or MATLAB go to a File b Export as c Text
11 Save that text file ( txt) on your flash drive
a Click No for ldquoDo you want to save changes you made to Untitledcmblrdquo
12 Repeat another set of three measurements if needed
13 With Excel a Open the Excel program b Under the File pick Open mark the text file click OK c Importing text file click Finished
14 With MATLAB
a Open the MATLAB program b At the gt prompt type load filename c The variable with the data is now in memory with the name lsquofilenamersquo
6
20 Thermodynamics Background
21 Examples of How Heat Loss and Heat Gain Are Used in Everyday Life
21 Combustion of Natural Gas in a Water Heater or Furnace The combustion of natural gas in a water heater furnace or modern power plant is a common heat-producing (exothermic) reaction Natural gas is mostly methane CH4 The combustion of methane results in the following reaction
According to the reaction 2128 kcal (or 212800 calories) of heat are produced by the oxidation of 16 grams (one gram-molecular weight or one mole) of methane (natural gas) 22 Energy for Living Organisms Not all oxidation reactions proceed rapidly and vigorously by combustion In living organisms oxidation reactions proceed much more slowly and are controlled by enzymes Some of the energy liberated by these reactions is used to raise the body temperature in warm-blooded animals and some of it is used for other vital processes such as muscle contraction
Almost all chemical reactions either absorb or release heat These experiments are designed to introduce you to three concepts of thermodynamics
1) The measurement of heat energy 2) In a closed system the heat gained by one object must equal the heat lost by another 3) Energy is liberated or absorbed (as heat) during physical and chemical changes
Heat and temperature are not the same When heat is added to a substance the temperature rises but the amount of temperature rise depends on the type and quantity of substance Temperature depends on heat but is not directly or simply a measure of the amount of heat You feel that something is hot or cold because either it transfers heat to you or you to it Temperature is a measure (in degrees) of the average rate of motion of molecules in a substance Heat energy is often measured in calories The calorie is the amount of heat required to raise the temperature of exactly 1 gram of water from 145degC to 155degC For all practical purposes the calorie is simply defined as the amount of heat required to raise the temperature of 1g of water 1degC The amount of heat required to raise 1 g of a substance 1degC in temperature is called the specific heat of the substance Specific heat is a characteristic property just like density or boiling point
7
transmission of nerve impulses and synthesis of essential compounds For example when
glucose (a type of sugar) is used in metabolism the following oxidation reaction occurs
We often refer to the number of calories in a given portion of food Accordingly we would say there are 688 kcal of energy in 180 g (one mole) of glucose meaning that when this amount of glucose is oxidized in metabolism there are 688 kcal of energy liberated The minimum daily requirement for an adult human is between 1800 to 3000 kcal depending on the individualrsquos size and activity level If our diet provides more energy than our bodies can use the surplus may be stored as lipids (fats) resulting in excess body weight Approximately 3500 kcal equals one pound of body weight If our diet does not provide us with enough energy we must either use some stored fat or suffer a lack of energy
8
30 The Gas Laws
31 Background Of the three states of matter (solid liquid and gas) gases are the most affected by the surrounding environment Most solids undergo very little or no variation in shape and volume due to changes in temperature pressure or the type of container etc Although liquids assume the shape of their container they tend to maintain a constant volume While thermal expansion contraction is noticeable in the case of both solids and liquids it is relatively insignificant External pressures do not affect matter in either of these states appreciably However a given amount of gas placed in an empty (evacuated) container of any shape will immediately expand to fill the container completely and uniformly If pressure is exerted on a sealed flexible container filled with gas the gas will become compressed until the pressure exerted by the gas on the walls of its container equals the outside pressure applied If the gas is heated it will either apply more pressure on its container or expand to a greater volume 32 Boylersquos Law Robert Boyle a British chemist was one of the first scientists to study gases quantitatively In one set of experiments Boyle established a relationship between the pressure and volume of a gas at constant temperature In order to arrive at a physically significant law Boyle simplified the problem by doing his experiments under controlled conditions He kept the mass m of gas constant (ie no leaks in the container) and he kept the temperature constant Under such circumstances the relationship between pressure and volume is known as Boylersquos Law At a constant temperature the volume (V) occupied by a finite mass of gas is inversely proportional to the applied pressure (P) Mathematically this relationship can be stated as follows
(1) PV 1prop
Where the symbol represents proportionality Another way of stating Boylersquos Law is for a given amount of gas at a constant temperature the product of the pressure and the volume is a constant Thus by replacing the proportionality constant in the previous equation with a constant k we will have another form of Boylersquos Law
prop
(2) ( )PkV 1sdot=
(3) kVP =sdot When using two sets of pressurevolume conditions (1 and 2) Boylersquos Law can be expressed (4) 2211 VPVP = where the subscript 1 refers to the initial state and the subscript 2 refers to the final state Inthe Boylersquos Law experiment you will examine the relationship between pressure and volume
9
for a gas Graphing this relationship for an ideal gas shown in Fig 1 results in a hyperbola
As we increase the pressure passing from state 1 to state 2 the product PV is constant
33 The Effect of Mass The value of the constant k in Boylersquos Law depends on several factors First imagine that the quantity of gas changes while the temperature and volume remain constant Pressure is caused by the impact of molecules as they strike the walls of the container Therefore doubling the mass (ie doubling the number of gas molecules) at a constant temperature will cause the number of impacts per second to double and the pressure will be doubled Experimental verification shows that the product PV is proportional to the mass of gas
(5) 2
22
1
11m
VPmVP
= (at constant temperature)
In other words if m is increased then so is PV and PVm remains the same In general when dealing with different kinds of gases such as hydrogen and oxygen it is important to use equal number of molecules rather than equal masses For instance there are actually more molecules in 8 g of H2 (whose molecular weight is 20) than in 80 g of O2(whose molecular weight is 32) For H2 8 g times 1 mol 2 g = 4 moles therefore it has 4 times 602 times 1023 molecules Similarly 80 g of O2 is only 8032 = 25 moles and contains only 25 times 602 times 1023 molecules All things being equal we expect that the pressure exerted by hydrogen would be greater by a ratio of 4 to 25 Thus the following equation applies
(6) =nVP 11
constant (at constant temperature)
where n is the number of moles of gas present 34 Charlesrsquo Law Around 1800 French scientist and balloonist Jacques Charles began studying the effect of increasing temperature on gases He observed that the rate of thermal expansion is constant
10
and is the same for all gases as long as the pressure is constant Charles examined the effects of temperature upon the pressure exerted by a confined gas with volume and mass remaining constant Fig 2 shows that the pressure increases uniformly as the temperature increases Thus the graph of pressure vs temperature is a straight line
In 1848 Lord Kelvin a British physicist noted that by extending different temperaturevolume lines (for gases at various but constant pressures) back to zero volume he always found the same intercept The intercept on the temperature axis is -27315degC Kelvin named this temperature absolute zero The Kelvin absolute temperature scale in which K = degC + 27315 is named in his honor The volumetemperature relationship for gases using the absolute temperature scale is known as Charlesrsquo Law At a constant pressure the volume of a finite amount (mass) of gas is directly proportional to the temperature of the gas Mathematically Charlesrsquo Law can be stated as follows (using the absolute temperature scale) (7) TV prop (8) TkV sdot= This relationship leads to
(9) 2
2
1
1TV
TV
=
Note that in Figure 2 the graph of P vs T is shown as a dashed line below a certain temperature This is to indicate that the pressure would become zero at some temperature if it continued to decrease at the same rate as it does near room temperature Any ideal gas is assumed to behave this way but in actual practice before the gas pressure becomes zero the gas will liquefy at some temperature and then of course it will no longer even be a gas As the temperature of the gas decreases the pressure deviates somewhat from the straight-line relationship We expect such a behavior on the basis of what we know about molecules The slower-moving molecules are more affected by mutual cohesive forces and the pressure exerted by them will drop off a little Finally when the temperature is low enough and the
11
molecules slow enough the cohesive forces causes the molecules to stick together as a liquid The mathematical equation of the straight line in Fig 2 can be written as (10) ( )TbPPT sdot+sdot= 10 Therefore using the assumption that gases are nearly ideal we can rework equation (10) into a form that makes calculations very simple Using the numerical value of 000366 degC for b (11) ( )TPPT sdot+sdot= 00366010 At what temperature would the pressure be zero if the straight line continued to be a true description of the course of events From equation (11) it is evident to make PT = 0 we must have (1 + 000366T) = 0 That is the required temperature is
(12) CT
degminus=
0036601
= -273degC
Where PT is the pressure at temperature T P0 is the pressure at 0degC and b is the pressure coefficient for the gas Experimental data shows that the constant b is practically the same for all gases and is about 000366 degC for those gases such as hydrogen which are nearly ldquoidealrdquo The pressure coefficients for helium and oxygen are 000367 degC Such differences are minor and show that no gas is totally ideal Thus it can be seen that the temperature at which the pressure would become zero is the same for all ideal gases if the gas remained an ideal gas all the way down to zero pressure Again we call this temperature absolute zero In the laboratory we can measure the pressure of a gas at different temperatures and extrapolate the graph down to zero pressure see Fig 3 Precise experiments have given -27315degC as the value of this important constant but we can usually round the value to -273degC In the Charlesrsquo Law experiment you will examine the effect of temperature on the volume of a gas You will also extrapolate the temperaturevolume relationship to obtain a temperature value for absolute zero 35 Ideal Gas Equation From Charlesrsquo Law we know that volume varies proportionally with absolute temperature From Boylersquos Law we know that volume varies with an inverse proportionality with pressure Combining the two laws we obtain
(13) ⎟⎠⎞
⎜⎝⎛sdot=
PTkV
or PV = T k
where the constant represents the number of gas molecules present We can replace k k
12
with n and R to denote the number of gas molecules and the gas constant
(14) = nR k Combining equations (13) and (14) we get (15) PV = nRT which is referred to as the ideal gas equation of state where R = 8314 dm3 kPa mol K Additionally the number of moles n is equal to the mass m divided by the molecular mass M and can be inserted into equation (15) to yield
(16) PVmRTM =
MmRTPV = or
36 Daltonrsquos Law of Partial Pressure As we have already discussed gases exert pressure on their enclosures Mixtures of gases exert pressure on their enclosures as well but each component of the gas mixture is responsible for only a fraction of the total exertion John Dalton was the first scientist to form a hypothesis about how much each component of a mixture of gases contributes to the overall pressure exerted We call the pressure exerted by a single type of gas a partial pressure Daltonrsquos hypothesis states that the total pressure in a container is the sum of the partial pressures of the gases in the container The contribution by a single gas to the overall pressure exerted on a container depends largely on the amount of gas present For equal volumes of gases in a container there are different numbers of molecules present for each gas Since each gas is at the same temperature in a mixture the pressure due to a single gas is due to the number of molecules of the gas in relation to the overall number of molecules
13
40 Examples of How Boylersquos and Charlesrsquo Laws Are Used in Everyday Life The measurement and effects of temperature and pressure are very important to our everyday
life Let us first discuss the significance of atmospheric pressure to the forecasting of weather creation of winds the measurement of altitude for aircraft and the cause of atmospheric circulation 41 Significance of Atmospheric Pressure The average pressure exerted by the atmosphere is approximately 147 pounds per square inch at sea level (also known as 1 atmosphere) This means that a column of air of one inch square extending from sea level to the top of the atmosphere would weigh about 147 pounds The actual pressure at a given place and time however depends upon several factors including altitude temperature and the density of the air 42 Measurement of Atmospheric Pressure A barometer generally consists of a column of mercury in a glass tube It is sealed at one end and calibrated in inches of mercury An increase in pressure forces the mercury higher in the tube a decrease allows some of the mercury to drain out reducing the height of the column In this way changes of pressure are registered in inches of mercury The standard sea-level pressure expressed in these terms is 2992 inches at a standard temperature of 15degC (59degF) If all weather stations were at sea level the barometer readings would give a correct record of the distribution of atmospheric pressure at a common level To achieve a common level each station translates its barometer reading in terms of sea level pressure A change of 1000 feet of elevation makes a change of about one inch on the barometer reading Thus if a station located 5000 feet above sea level found the mercury to be 25 inches high in the barometer tube it would translate and report this reading as 30 inches Because the rate of decrease in the atmospheric pressure is fairly constant in the lower layers of the atmosphere the approximate altitude can be determined by finding the difference between pressure at sea level and the pressure at the given atmospheric level In fact the aircraft altimeter is an aneroid barometer with its scale in unites of altitude instead of pressure 43 Effects of Altitude on Atmospheric Pressure We can conclude that atmospheric pressure decreases as altitude increases and that the pressure at a given point is a measure of the weight of the column of air above that point As altitude increases pressure decreases along with the weight of the air column This decrease in pressure has a pronounced effect on aircraft takeoffs rates of climb and landings An airplane that requires a 1000 foot runway for takeoff at a sea level airport will require a runway almost twice as long to takeoff at an airport 5000 feet above sea level The purpose of the takeoff run is to gain enough speed to generate lift from the passage of air over the wings When the air is less dense more speed is required to obtain enough lift for takeoff hence a longer ground run is necessary It is also true that the engine is less efficient in thin air and the thrust of the propeller is less effective Generally atmospheric pressure drops by half every 5 km increase in altitude
14
44 Effects of Differences in Air Density Differences in air density caused by temperature changes result in pressure changes This in turn creates motion in the atmosphere both vertically and horizontally (currents and winds) This action when mixed with moisture produces clouds and precipitation In fact these are all the phenomena called weather In general a marked fall of the barometer indicates the approach of bad weather and marked rise indicates the clearing of the weather 45 The Cause of Atmospheric Circulation Pressure and temperature changes produce two kinds of motion in the atmosphere vertical movement of ascending and descending currents and horizontal flow called wind The atmosphere tries to maintain an equal pressure over the entire earth just as the ocean tends to maintain a constant level When the equilibrium is disturbed air begins to flow from areas of higher pressure to areas of lower pressure The factor that upsets the normal equilibrium is the uneven heating of the earth by the sun
15
50 Thermodynamic Experiments
51 Background Heat can best be visualized in terms of what it does When water is heated what is happening to the water molecules The warmer molecules are moving at a greater velocity and are colliding with their neighboring molecules Energy is being transferred from the heat source to the water molecules causing them to move faster and collide with other water molecules more frequently The rate of evaporation of the water molecules increases as a sample warms and the vapor pressure of the sample (determined by the number of water molecules in gaseous form above the liquid) also increases Therefore visualizing the effects of heat at the molecular level makes it easier to comprehend Since frozen and liquid water have different physical properties their models must be different to Water molecules in the liquid form can be visualized as being extremely small V-shaped objects that are packed closely together These molecules are moving extremely rapidly in all directions and are colliding with great frequency In changing from a liquid to a solid (as in freezing) much of the moleculersquos energy is lost as heat is removed causing the movement and frequency of collisions to diminish In ice the intermolecular forces (forces between molecules) of attraction are strong enough to hold the water molecules relativelyimmobile The motion of molecules should cease if the temperature of the ice were reduced to a temperature known as absolute zero (-27315degC or 0 K) When heat is applied to ice part of the heat goes toward breaking the bonds that hold the water molecules together as a solid The heat of fusion which is the amount of energy required to melt one gram of solid is another identifying characteristic value for each compound The objective of the second portion of this module is to determine the amount ofheat required to melt one gram of ice Density and specific heat are also frequently used to identify unknown liquids and solids As mentioned previously the specific heat of a substance is the amount of heat (calories) required to raise 1 g of the substance by 1degC in temperature Density is a measure of the mass per unit volume for a substance or object (measured in gcm3 for instance) A Note on Energy Units The calorie is a fundamental and easily understood unit However there are many other units of heat and you will need to be able to convert to and use these other units in laboratory and classroom discussions The unit of heat most commonly used is the joule which is equal to 02390 calories This is more commonly stated and remembered with the equation
1000 cal = 4184 joules A joule and a calorie are both measures of heat energy The only difference between the two is the measurement system you are using (ie metric or British) The Joule is a unit in the International System (or metric system)
16
52 Safety Precautions
A chemistry laboratory is a safe place to work if you follow appropriate safety procedures The most important piece of safety equipment is eye protection The following safety items are mandated
bull Wear eye protection at all times bull DO NOT eat drink chew or smoke in the lab bull DO NOT wear shorts or short skirts in the lab bull DO NOT wear open-toe sandals or high heels in the lab bull Clean up spills and accidents immediately and correctly If yoursquore not sure how askbull NEVER pipet anything by mouth use a rubber bulb bull Read the label on the reagent bottles each time before you use them bull Dispose of waste in proper containers when in doubt ask bull Assume all chemicals are toxic and possibly corrosive Read the label on reagent
bottles and on experimental containers each time before you use them (afterward may be too late) Some chemicals are toxic some are corrosive some are flammable If you donrsquot know anything about a compoundrsquos properties its best to assume it might be all three
bull Know where the safety shower fire extinguisher and emergency eye wash stations are and how to use them
bull Flush acids and bases from the skin with lots of water Be your brotherrsquos keeper Watch out for othersrsquo safety as well as your own Point test tubes being heated away from yourself and your neighbors Wait until your glassware is cool before you ask anyone to pick it up If you see anything that happens to be unsafe report the situation to the TA Bunsen Burner - It is sometimes difficult to see at a glance whether or not your Bunsen burner is operating Always exercise caution when working around a Bunsen burner by making sure your cloths hair and papers are clear from the flame area
17
53 Materials Required
Experiment 1 Equipment Styrofoam cup or insulated plastic mug Metal Cup Ring Stand Clay Triangle Candle Bunsen Burner or hot plate Ice Thermometer ( for thermistor Thermistor calibration) Experiment 2 Equipment Two Styrofoam cups or insulated plastic mugs Pasteur pipet with bulb Ice Plastic gloves Thermistor Thermometer (for thermistor calibration) Reagents Antifreeze (or ethylene glycol) t-Butanol (tert-butyl alcohol)
18
In this experiment you will determine the heat of combustion for candle wax This combustion results in a chemical change During the experiment some wax will melt as well as combust To avoid losing the mass of wax drops it is a good idea to weigh the candle with a paper towel Put the paper towel under the candle while it is burning to catch any drips At the end of the experiment weigh the candle and the towel In this way you account for the mass of any unburned wax that has dripped from the candle Step 1 - Set up a ring stand with a clay triangle to hold the aluminum can The can will serve
as a water container Heat transfer from the flame to the can is facilitated by the use of a clay triangle as opposed to a wire mesh (see figure below)
Step 2 - Clean as much carbon off the metal can as possible then find its mass using a
balance Place ~100 mL of cold water in the can and determine the mass of the metal can with the water The temperature of the water need not be any particular value but the temperature should be correctly measured
Step 3 - Use a balance to accurately determine the mass of the candle (if you choose to use a
paper towel include its mass in the measurement) By means of a clamp position the candle with the wick about 1 inch below the cup
Step 4 - Connect the thermistor to the LabWorkstrade interface Calibrate the thermistor if it has
not been calibrated already Step 5 - Start your program for measuring temperature or start a pre-written program
(THERM2 for instance) Step 6 - Record the initial temperature of the water
Step 7 - Light the candle Stir the water gently with the thermistor until a 20degC temperature
rise is noted
Step 8 - Blow out the candle Allow the molten wax to solidify so that drops are not lost when removing the candle from its holder
Step 9 - Record the final temperature of the water Step 10 - Find the mass of the candle and towel to determine the grams of candle burned
You may also need to remove any wax drippings from the candle holder and include them when measuring the mass
Step 11 - Data Analysis - Perform the following calculations on your Data Summary Sheet
Experiment 1 Heat Associated with Chemical Change
19
a) The specific heat of water is 100 calgdegC The equation which allows you to
calculate the amount of heat absorbed by water is
q = s times g times ΔT where q is the number of calories absorbed by water s is the specific heat (for water sis 100 calgdegC g is the mass of the water and ΔT is the change in temperature (eg20degC) Calculate the amount of heat q absorbed by the water in your experiment Report this value on your Data Summary Sheet
b) The value of q also represents the amount of heat given off by the combustion of the candle assuming all the heat given off was absorbed by the cup of water Actually there would be some heat loss to the atmosphere clamp etc The amount is relatively small and may be disregarded in this experiment
c) The amount of heat liberated per gram of candle burned (H) can be calculated by the following expression
H = q G
Where G refers to the grams of candle burned H is a measure of the heating ability of the candle and is also a measure of the energy change involved in a chemical change (the reaction of the candle wax with oxygen from the air) Calculate H for your candle Report this value on you Data Summary Sheet Experimental Setup
20
Mass of can and water _______g Mass of empty can _______g Mass of water _______g Temperature before heating _______degC Temperature after heating _______degC Temperature change _______degC Mass of candle before burning _______g Mass of candle after burning _______g Mass of candle burned _______g Calculate calories of heat absorbed by water Calculate the calories of heat produced per gram of candle burned
Name_____________________ Date______________________ Lab Section________________
Experiment 1 Data Summary Sheet
21
The objective of this experiment is to determine the freezing points of both t-butanol and a solution of automobile antifreeze in t-butanol In addition you will determine the densities of both the solution and the pure solvent using the LabWorkstrade Interface system Most of you know that in northern climates you cannot simply put water in your carrsquos radiator- it will freeze in the winter and damage or destroy the engine Antifreeze must be mixed with the water to prevent this from happening If you look at the ingredients list on any antifreeze container you will see that it is more than 95 ethylene glycol The fluid in your radiator is therefore a homogeneous liquid mixture it is ldquohomogeneousrdquo because it looks the same (even under a microscope) and a ldquomixturerdquo because it contains two components which can be separated (if you boil the mixture the water will evaporate leaving the ethylene glycol behind) This kind of mixture is very important in chemistry it is called a solution In a solution there are always two or more components one of which there is a lot of and very little of the other Think of the ocean it has some salt but mostly water Cola drinks are a mixture of several different components with water yet they are still mostly water The major component is called the solvent and the minor one the solute There are several ways of describing the composition of such a mixture In this experiment we will use composition as the measure Composition is defined as
100Solution of Weight Total
Component ofWeight on Compositi times=
For example if we take 500 g ethylene glycol and mix it with 9500 g water this gives a total weight of 500 g + 9500 g = 10000 g and a percent composition of glycol
00510010000g
500g=times
To make such calculations in this experiment we will use densities and make some assumptions about how big the drops of antifreeze are The solution in your car radiator freezes at much lower temperature than pure water does This is a general property of solutions any solution freezes at a lower temperature than the pure solvent It would be nice if we could do this experiment with water but to do so we would need access to temperatures down to -30degC As we do not have the equipment to do this we will use t-butanol in its place as it has a higher freezing point
Experiment 2 Chemistry of Antifreeze Density and Freezing Point
22
You will begin by determining the freezing point of t-butanol Then each group will be
assigned a specific mixture of ethylene glycol and t-butanol for measuring the change in the freezing point You will mix this solution and determine the density and freezing point At the end of the class period the density and freezing point data will be collected and correlated for the whole class It is important to work slowly and carefully sloppy work usually shows when all the class results are compared Part 1 Density and Freezing Point of Pure tert-Butanol Step 1 - Connect the thermistor to the LabWorkstrade interface with one lead on ldquoDAC1rdquo and
the other lead on ldquoI1rdquo Step 2 - Calibrate the thermistor if needed You may use ice water and warm tap water (about
40-50degC) The thermistor should either be calibrated or checked prior to use to ensure accurate readings
Step 3 - Put on a pair of plastic gloves and pour about 10 mL of t-butanol from the stock
bottle into a small beaker Use plastic gloves whenever you handle t-butanol or the ethylene glycol Spills on the skin are usually harmless but you may have an allergic reaction
Step 4 - Check to see that your 10 mL graduated cylinder is clean and dry If it is not wash it
out with soap and water and dry it carefully with a wipe Now carry out the following sequence of operations to determine the density of your solution recording the raw data in your notebook
a Weigh the empty graduated cylinder and record its mass b Transfer about 15 mL of t-butanol from the beaker to the graduated cylinder and
record the volume (read the bottom of the meniscus accurately to within two decimal places)
c Weigh the graduated cylinder and its contents and record the mass d Repeat steps b and c at least 4 more times The volume and the mass should
increase in each step at the end of the process you should have ~10 mL in the graduated cylinder
This whole operation should take no more than ~5 minutes Do it at the balance but
be careful not to spill any t-butanol If you do have a spill clean it up immediately with a wipe Leave the t-butanol in the graduated cylinder and take it back to your station Keep the extra t-butanol you have in the beaker as it is needed in the next step
Step 5 - Fill a clean dry 10 cm disposable test tube half full with t-butanol from the graduated
cylinder Dry your thermistor off carefully with a wipe place it into the liquid in the test tube and put the test tube into a beaker of hot water to warm it well above the freezing point Fill the second beaker with ice and add just enough water to make themixture slushy
23
Step 6 - Now you are ready to start your LabWorkstrade Interface program (BUTANOLEXP is a pre-written program for this experiment) You can call the output file BUTANOL1DAT for example) Once you can see the graph plotting (T should be 40 degC or higher) insert the test tube and its contents into the ice bath You are collecting data for a cooling curve and you are also sending it to a spreadsheet so you can have a permanent copy
This experiment is very sensitive to external influences and the t-butanol needs to be stirred vigorously as the cooling proceeds Hold the test tube with one hand and use the thermistor to stir the liquid with a circular motion as the cooling curve is plotted Continue to stir and watch both the liquid and the graph until you are down to about 10degC Be careful to keep all of the liquid submerged in the ice bath and do not let the thermistor tip rest on the bottom of the test tube The temperature will drop but there will be some parts that are not smooth Notice what the curve does when you see crystals beginning to form in the test tube be prepared to describe what you see
Part 2 Density and Freezing Point Determination for a Solution of Ethylene Glycol in t-Butanol Step 7 - You are now ready to determine the freezing point of a solution in t-butanol Pour 10
mL of t-butanol into the beaker (if you need to melt the sample you just used in step 6 in warm water) Put a few mL of ethylene glycol from the stock bottle into another clean and dry test tube Your TA will assign you a specific number of drops (between 5 and 30) to add for your measurement of the change in the freezing point
The amount of ethylene glycol added will vary across the class so you can see what
happens to the freezing point over a range of densities Just 1 or 2 mL will be plenty Measure out your assigned number of drops using a Pasteur pipet (everyone needs to use the same kind of dropper so that the results can be compared) Add the ethylene glycol to the t-butanol and mix thoroughly with a stirring rod
Step 8 - Now repeat steps 4-6 to find the density and freezing point of your solution (be sure to
name your output data file differently than before) You will find that your solution freezes at a lower temperature than pure t-butanol how much lower and how this relates to the density are the questions that we need to answer When you have determined the freezing point and the density of your assigned solution write your results in a table A copy of this table will need to be included in your laboratory write-up
Step 9 - Before performing the data analysis you should investigate the sensitivity of the
experiment Follow steps 4-6 to obtain two more cooling curves with pure t-butanol one in which you stir the solution by moving the thermistor gently up and down while the cooling curve is collected and one in which you do not stir with the thermistor at all You can use the same program (BUTANOLEXP) to collect these curves Be sure you give the data files different names so that you can refer to all of the data when writing your report
24
Data Analysis
Step 10 - You should now have four cooling curve data files on disk one each for pure t-butanol the solution with vigorous stirring moderate stirring and no stirring at all Make graphs of your cooling curves using any software available to you You need to determine the freezing point temperature to within 01degC this may be difficult from the raw graph To increase the readability of the graph scale the data to within 1degC above and below what you think is the freezing point which should make it possible to read your freezing point to within plusmn 01degC
Step 11 - Repeat step 10 to determine your freezing point for the curves for the vigorously stirred solvent and solution These should have a recognizable feature which you can use to measure the freezing temperature accurately Then compare the vigorously stirred pure t-butanol with the others that were not so vigorously stirred Describe the differences between them in a short paragraph in your report The explanation for these differences is not very complex Suggest some possibilities yourself
Step 12 - The calculation of the density requires the use of a spreadsheet Using your program of choice label two columns MASS and VOLUME Now enter your measurements of mass and volume for each of the additions of liquid from step 4
Step 13 - The entries in the MASS column should be the mass of both the solvent and the mass of the graduated cylinder (see step 4 if you forgot about this) To obtain the mass of the solvent the mass of the graduated cylinder needs to be subtracted from each measurement To do this you can simply add to each cell ldquo-rdquo where is the mass of the empty dry graduated cylinder
Step 14 - To get the ldquobestrdquo value for the density of pure t-butanol graph the volume on the x-axis and the mass (calculated in step 13) on the y-axis Now calculate the best fit line to the data if yoursquore using a spreadsheet you can graph the data while choosing ldquolinear regressionrdquo as the type of graph to obtain these data The parameters of the best fit line will be in the form of y = mx + b further you should calculate the correlation coefficient or ldquogoodness of the fitrdquo (sometimes referred to as R2) A correlation coefficient of 10 represents a perfect fit Which of the parameters in the regression is the density that you should report
Step 15 - Save this file to a flash drive give it a name such as ldquoPURErdquo
Step 16 - Repeat steps 12-15 for the t-butanol and ethylene glycol solutions
Step 17 - Cleanup The TA will tell you where to dispose all the chemicals
At the end of the lab period your data will be put together and used to discuss precision and accuracy in the laboratory measurements Prepare a table which includes the densities and freezing points for both pure t-butanol and for the solution These will be compared across the whole section
25
Each of the following projects defines a problem Your assignment for each problem is to design an experiment (or several experiments) that might be useful in solving the problem or explaining the phenomenon Select a project that interests you the most Experiment 3 Boiling-Point Elevation by Dissolved Substances When solutes are dissolved
in solvents the boiling point of the resultant mixture is different than the pure solvent Use pentane and diethyl ether as solvents to investigate this phenomenon Use camphor (moth repellant) as the solute and be careful not to expose yourself to fumes
Experiment 4 Factors Affecting Freezing-Point Depression in Water You looked at the
effect of antifreeze on the freezing point of t-butanol in Experiment 2 Use water as the solvent this time and explore the effects of antifreeze sugar and salt Use a mixture of ice and salt as your cooling bath
Experiment 5 Molar Heats of Reaction for Hydrochloric Acid (HCl) and Sodium Hydroxide
(NaOH) Measure the heat of reaction with 1 mole of aqueous HCl with one mole of aqueous NaOH Find out if the heat you measure is concentration dependent Note you do not need to react one full mole of each substance to calculate their molar heats of reaction
Individual Report Requirements Reports should be submitted on letter sized paper and must be typed You and your lab partner will submit separate reports although we know that the data will be identical As part of this project you and your lab partner will be required to give a 5-10 minute presentation to your section You and your lab partner may divide the tasks any way you wish but there must be a clear level of equal participation Include the following sections in your report Grammar spelling and presentation all count A Introduction Purpose ndash Objectivesbackground briefly given in your own words B Experimental Measurements and Data ndash Principles of experiment apparatus all data you used in calculations discussions and conclusions Large amounts of related data should be presented in tabular form Include labeled graphs and notes made on the experiment C Data Analysis Calculations ndash Explain how data was analyzed including all formulasand calculations you used Discuss relation of analysis to theory and experiment If a calculation was repeated several times the multiple results should be shown in tabular formwith a single example of the calculation shown once Include an error analysis D Discussion Conclusions - Briefly and clearly state your interpretations of the results and mention any problems you had in doing the experiment If you didnrsquot reach any conclusions from the experiment you should state why and support your explanation with data E References - Document any outside primary references (not the internet) you used in preparing your report You should use text books and perhaps journals as references You do not need to cite your lab partner or others in your lab (including your TA) as references
Experiments 3 4 and 5 Projects for Further Investigation
26
60 Gas Law Experiments
61 Background In several of these experiments you will not need the LabWorkstrade interface While the interface can be used to monitor the temperature and pressure it cannot be used to directly monitor volume 62 Safety Precautions A chemistry laboratory is a safe place to work if you follow appropriate safety procedures The most important piece of safety equipment is eye protection The following safety items are mandated
bull Wear eye protection at all times bull DO NOT eat drink chew or smoke in the lab bull DO NOT wear shorts or short skirts in the lab bull DO NOT wear open-toe sandals or high heels in the lab
63 Materials Required Experiment 6 Equipment 400 mL beaker crucible tongs
125 mL Erlenmeyr flask with Bunsen burner or hot plate rubber stopper thermistor large beaker or battery jar thermometer (for thermistor 100 mL graduated cylinder calibration) ice
Experiment 7 Equipment TI Graphing Calculator
Vernier Gas Pressure Sensor with 20 mL syringe LabPro Interface DataMate program
27
In this experiment you will explore the effect of temperature on a gas which remains at constant pressure You will not use the LabWorkstrade interface to make measurements for this experiment The dependence of the volume of a gas on its temperature was first described by Jacques Charles in 1787 He was among the first people in history to fly in a hot air balloon and was therefore interested in the relationship between the volume of a gas and its temperature The relationship is that the ratio of volume to the absolute temperature is a constant if the pressure remains unchanged Mathematically this is generally expressed as
(1) kTV
=
or
(2) 2
2
1
1TV
TV
=
Procedure Step 1 - Place about 200 mL of water in a 400 mL beaker Place the beaker on a hot plate or
over a Bunsen burner and heat it to the boiling point Step 2 - While the water is heating prepare a cold water bath by putting cold water in a heavy
container (eg battery jar or a large beaker) and adding ice The water level for the cold water bath should be within about 3 cm of the rim
Step 3 - Thoroughly dry a 125 mL Erlenmeyer flask and fit it with a rubber stopper with a
single hole in it Step 4 - Using crucible tongs immerse the flask in the boiling water up to its neck Keep the
hole in the stopper open to the atmosphere and do not allow water to enter the flask during the heating process Hold the flask in the boiling water for at least six minutes
Step 5 - Record the temperature of the boiling water with a thermometer Step 6 - Using the tongs quickly invert the flask and insert it into the cold water bath Keep
the stoppered end pointed downward and immerse the flask as completely as possible for five minutes Water will be drawn into the flask
Experiment 6 Charlesrsquo Law
28
Step 7 - When the flask is cool adjust its position (still upside down) so the level of the water inside the flask is the same as that in the cold water bath While the flask is in this position place your finger over the hole in the stopper and remove the flask placing it upright on the lab table
Step 8 - Record the temperature of the cold water bath using the thermistor or thermometer Step 9 - Pour the water from the flask into a 100 mL graduated cylinder and determine the
volume of the water that was drawn into the flask while it was under water Step 10 - Determine the volume of the full flask with the stopper in place Fill the flask with
water insert the stopper as it was initially and pour the water into the graduated cylinder to determine the amount of water in the full flask
Calculations We know that the volume decreases with decreasing temperature We would like to quantify this relationship Step 11 - Determine the ratio of the volume of the air to its absolute (Kelvin) temperature
when it was hot The volume is the same as that of the full flask and the temperature is the same as the hot water temperature
Step 12 - Determine the ratio of the volume of the air to its absolute (Kelvin) temperature
when it was cold The volume of the cold air is the volume of the full flask minus the volume of the water that was drawn in when the flask was upside down and the temperature is the same as the cold water temperature
Is there a relationship between these two ratios What does this tell you about the dependence of the volume on its absolute temperature
29
Temperature of the hot water bath _______degC Volume of water in the flask after cooling _______mL Temperature of the cold water bath _______degC Volume of the full flask _______mL Absolute temperature of the hot water bath _______K Absolute temperature of the cold water bath _______K Volume of cold air _______mL Volume temperature ratio for hot air _______mLK Volume temperature ratio for cold air _______mLK 1 What is the mathematical expression for Charlesrsquo Law 2 A sample of gas had a volume of 265 mL when its temperature was 298 K If the pressure remains constant what will be its volume when the temperature decreases to 225 K 3 A sample of argon had a volume of 1978 L at 25degC At what temperature would its volume be 240 L (Assume constant pressure)
Name_____________________ Date______________________ Lab Section________________
Experiment 6 Data Summary Sheet
30
The LabPro interface has an ldquoEvents with Entryrdquo mode which collects one data point each time you press [ENTER] and then asks you to enter a corresponding value for that point This tutorial will guide you through the setup procedure of an experiment using the Events with Entry to investigate the relationship between the pressure and volume of a gas Procedure Step 1 - Prepare the Gas Pressure Sensor and an air sample for data collection
a) Plug the Gas Pressure Sensor into Channel 1 of the LabPro Use the link cable to connect the TI graphing calculator to the interface Firmly press in the cable ends
b) With the 20 mL syringe disconnected from the Gas Pressure Sensor move the piston of the syringe until the front edge of the inside black ring (indicated by the arrow) is positioned at the 10 mL mark
c) Attach the 20 mL syringe to the valve of the Gas Pressure Sensor The Vernier Gas Pressure Sensor has a white stem protruding from the end of the sensor box - attach the syringe directly to the white stem with a gentle half-turn
Step 2 - Turn on the calculator and start the DataMate program Notice how the program
automatically identified the Pressure Sensor (an auto-ID sensor) It displays the channel it is connected to and the current reading Press [CLEAR] to reset the program
Step 3 - To collect pressure vs volume data for Boylersquos law you need to collect the data in
the Events with Entry mode The current mode is time graph so select SETUP
Experiment 7 Boylersquos Law
31
Step 4 - Below is the Setup screen Here you can change the data collection mode To select MODE
press up once and press [ENTER]
Step 5 - A list of modes will appear in the SELECT MODE screen Press the number
preceding EVENTS WITH ENTRY You will be returned to the Setup screen Then select OK to return to the setup screen
Step 6 - Select OK to return to the Main screen You are now ready to collect pressure and
volume data It is best for one person to take care of the gas syringe and for another to operate the calculator
Step 7 - Select START Notice that a graph is not initially displayed instead it is going to
wait for you to collect at least two data points Step 8 - Move the piston so the front edge of the inside black ring is positioned at the 5 mL
line on the syringe Hold the piston firmly in this position until the pressure value displayed on the calculator screen stabilizes (in this example the number to the right 19432 kPa) The number to the left indicates the sample number
32
Step 9 - Press [ENTER] which tells the DataMate to record the pressure Type in ldquo5rdquo the
gas volume (in mL) on the calculator Press [ENTER] to store this pressure-volume data pair To collect another data pair move the syringe to 75 mL When the pressure reading stabilizes press [ENTER] and enter ldquo75rdquo as the volume Repeat the above procedure for volumes of 100 125 150 175 and 200
As you work your way through the experiment you get to view the data being collected Notice the sample number (5) the value given (689 kPa) and the graph in progress
Step 10 - When you are done press [STO] to end data collection Step 11 - Move the cursor right or left (using the arrow keys) to examine the data pairs on the
displayed graph
Step 12 - Press [ENTER] to return to the Main menu then select QUIT to quit the program
33
Experiments 8 and 9 Projects for Further Investigation
Each of the following projects defines a problem Your assignment for each problem is to design an experiment (or several experiments) that might be useful in solving the problem or explaining the phenomenon Select a project that interests you the most Experiment 8 Adiabatic Gas Expansion When compressed gases expand they must perform
work to overcome the attractive forces between molecules Design and test an experimental setup to determine the amount of work (as heat) developed by such an expansion
Experiment 9 Boiling Point Elevation Due to Pressure When a liquid boils its vapor
pressure has reached the pressure of the atmosphere By increasing the pressure surrounding the liquid the temperature required to reach boiling increases Design and test an experimental setup which allows you to determine the boiling point for water at several pressures and compare these values to a phase diagram
Individual Report Requirements Reports should be submitted on letter sized paper and must be typed You and your lab partner will submit separate reports although we know that the data will be identical As part of this project you and your lab partner will be required to give a 5-10 minute presentation to your section You and your lab partner may divide the tasks any way you wish but there must be a clear level of equal participation Include the following sections in your report Grammar spelling and presentation all count A Introduction Purpose ndash Objectivesbackground briefly given in your own words B Experimental Measurements and Data ndash Principles of experiment apparatus all data you used in calculations discussions and conclusions Large amounts of related data should be presented in tabular form Include labeled graphs and notes made on the experiment C Data Analysis Calculations ndash Explain how data was analyzed including all formulasand calculations you used Discuss relation of analysis to theory and experiment If a calculation was repeated several times the multiple results should be shown in tabular formwith a single example of the calculation shown once Include an error analysis D Discussion Conclusions - Briefly and clearly state your interpretations of the results and mention any problems you had in doing the experiment If you didnrsquot reach any conclusions from the experiment you should state why and support your explanation with data E References - Document any outside primary references (not the internet) you used in preparing your report You should use text books and perhaps journals as references You do not need to cite your lab partner or others in your lab (including your TA) as references
34
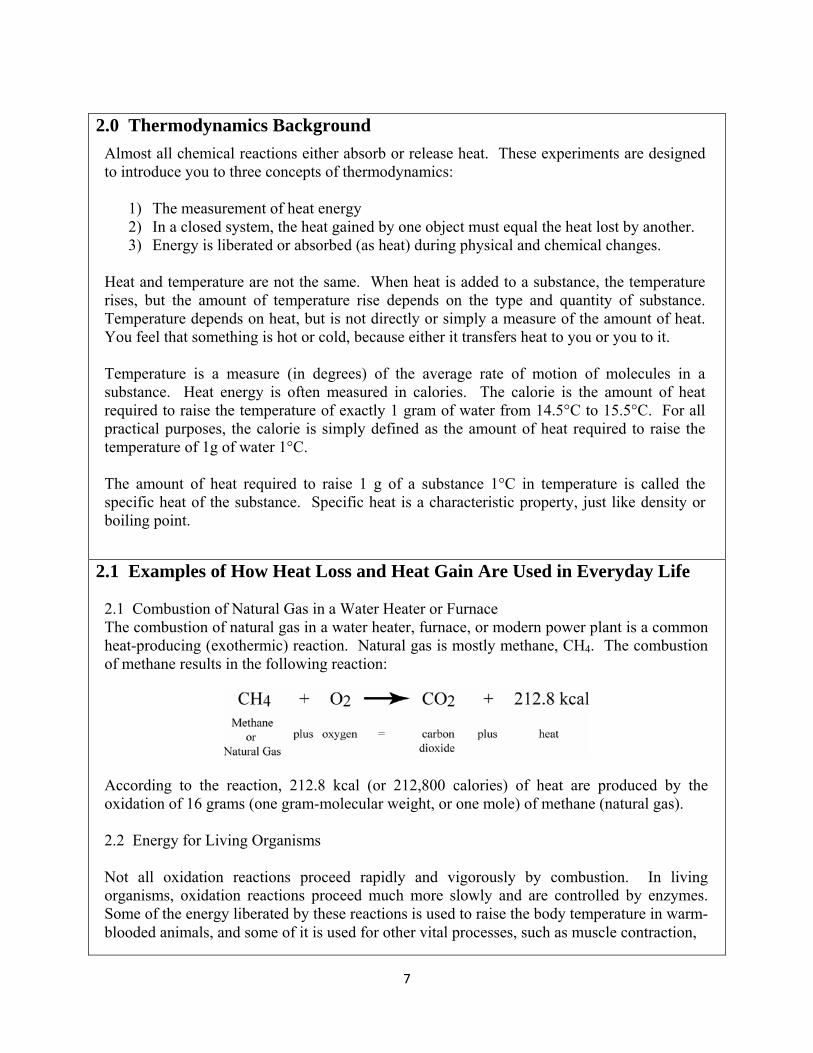
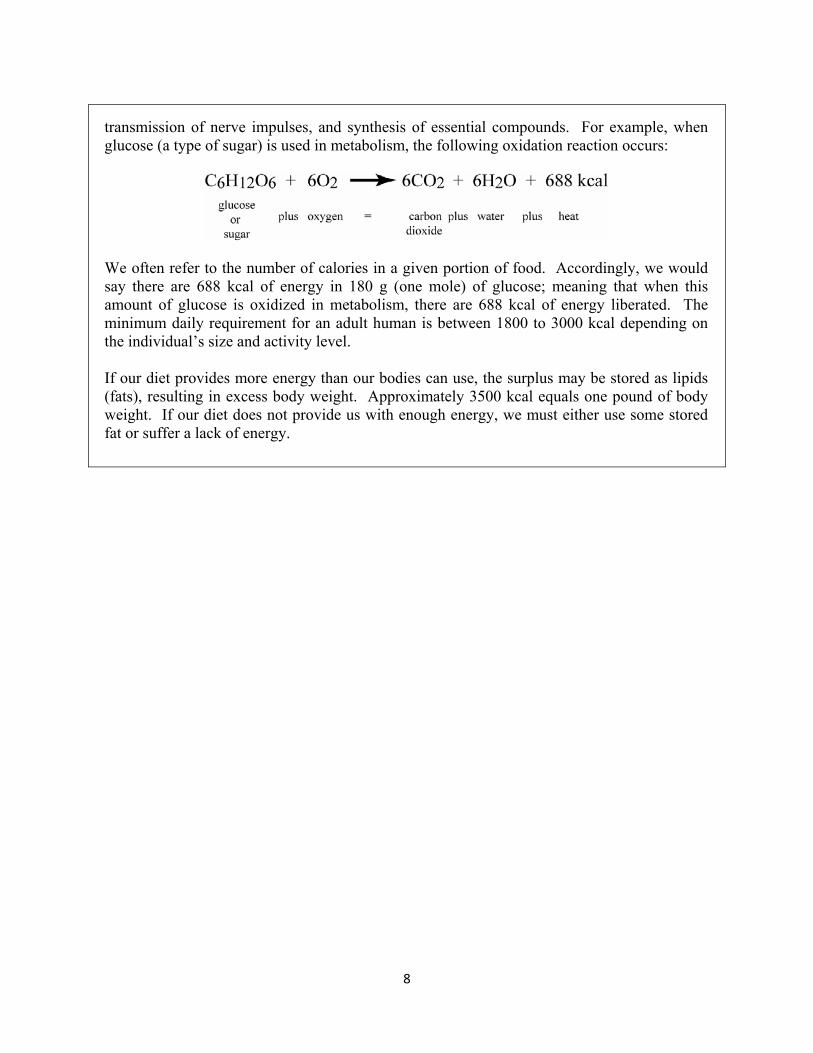
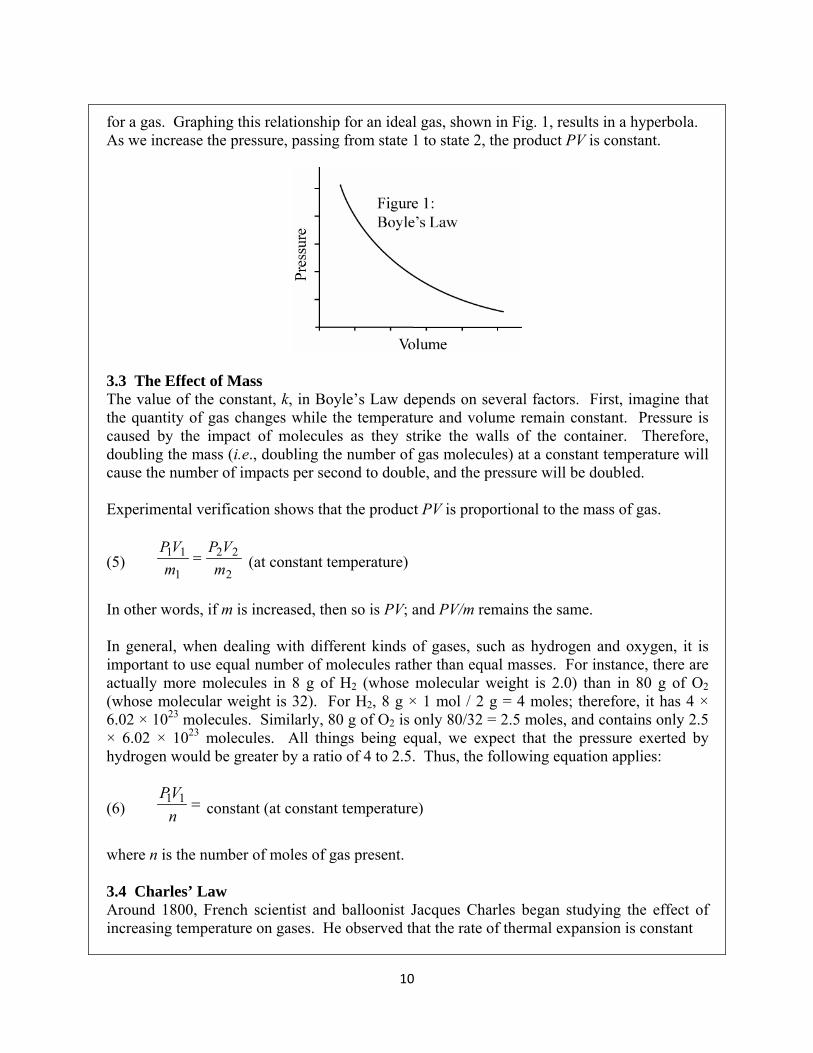
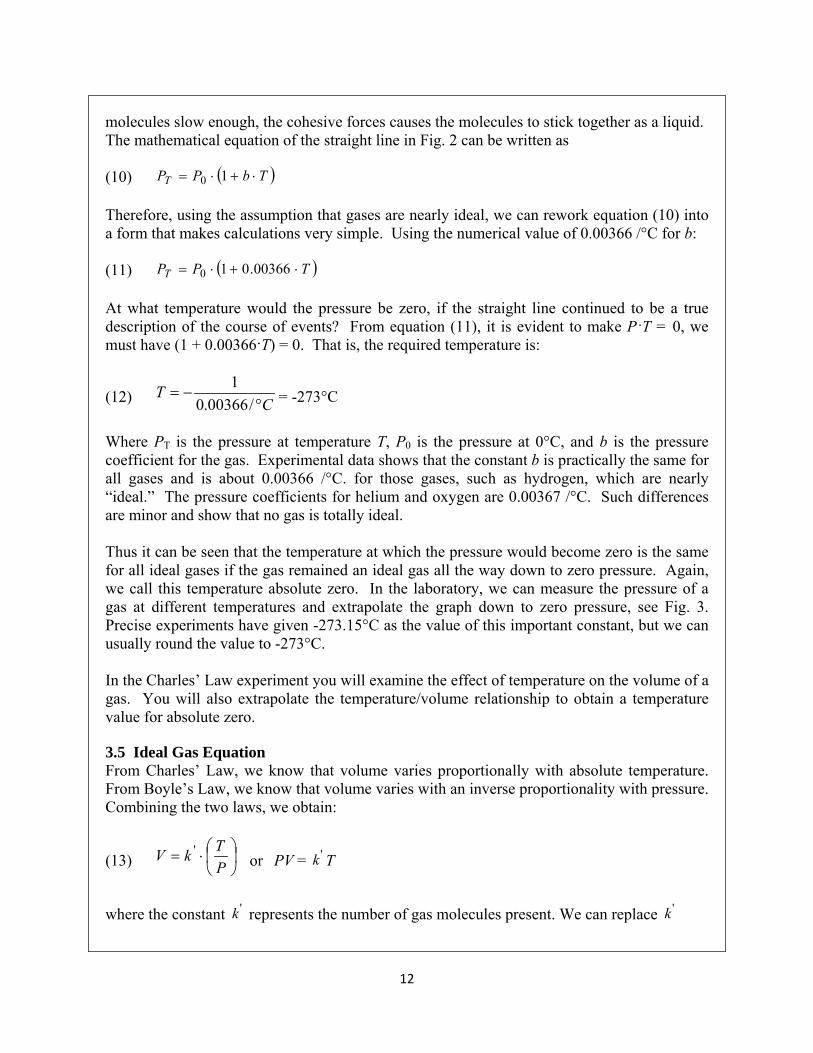
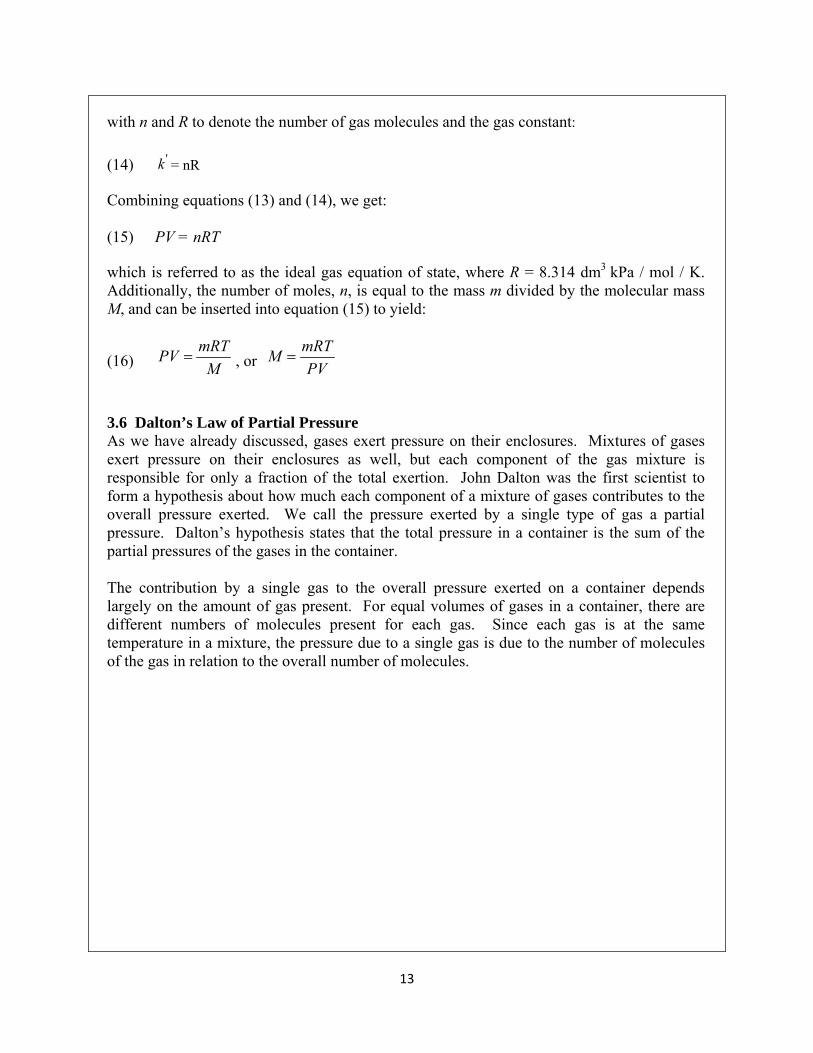
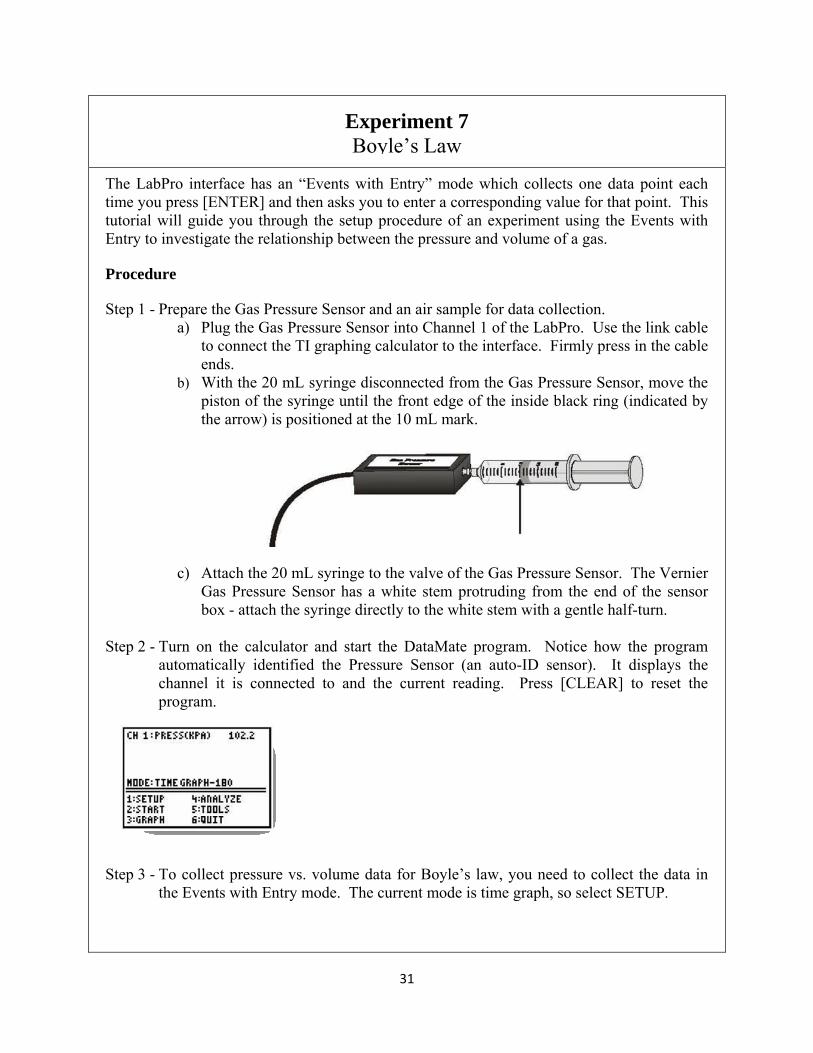
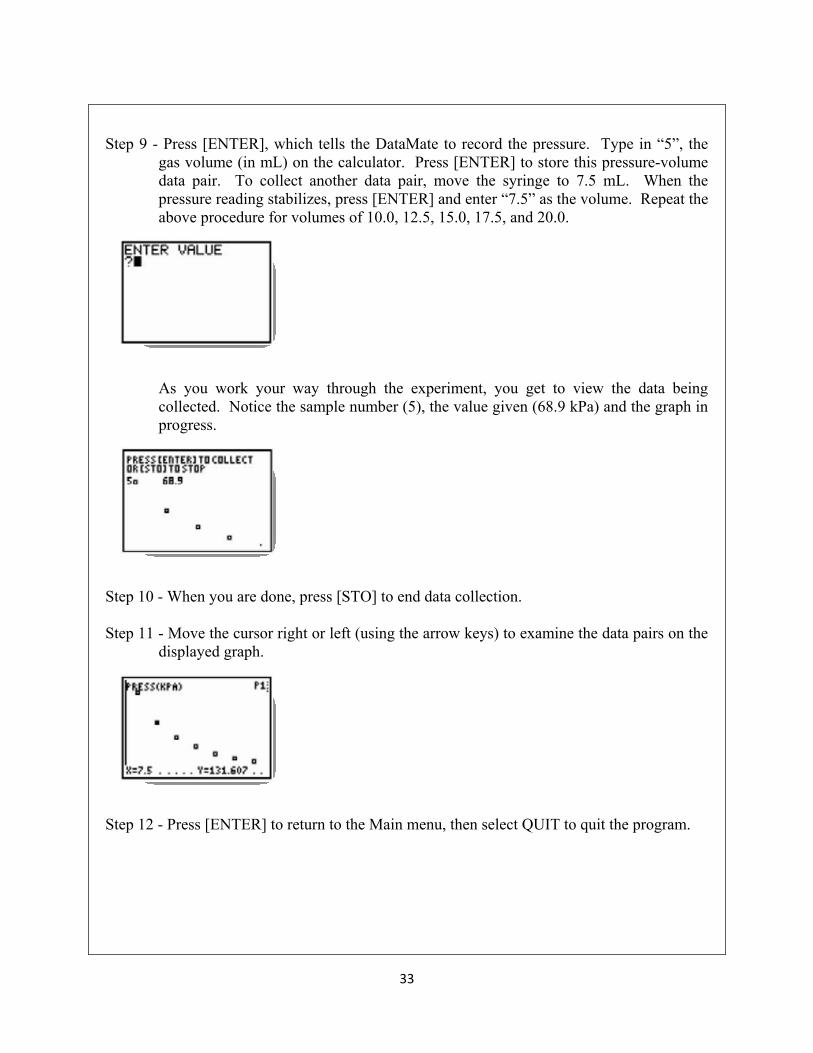