Table of Contents - TINDageconsearch.tind.io/record/32662/files/wp050078.pdf · Table of Contents...
90
Transcript of Table of Contents - TINDageconsearch.tind.io/record/32662/files/wp050078.pdf · Table of Contents...

v
Table of Contents
Page List of Tables ........................................................................................................................... vii List of Figures ......................................................................................................................... ix Foreword .................................................................................................................................. xi Acknowledgements ................................................................................................................. xiii Executive Summary ................................................................................................................ xv 1. Introduction 1.1 Background ....................................................................................................... 1 1.2 Objectives .......................................................................................................... 4 1.3 Scope of the study............................................................................................... 4 1.4 Organization of the report .................................................................................. 4 2. Research Methodology 2.1 Conceptual framework ....................................................................................... 7
2.1.1 Definitions ........................................................................................... 7 2.1.2 Analytical framework .......................................................................... 7
2.1.2.1 Supply and demand of feed crops ......................................... 7 2.2 Model formulation ............................................................................................. 8
2.2.1 Domestic production ........................................................................... 8 2.2.1.1 Area response ........................................................................ 8 2.2.1.2 Yield response ....................................................................... 8
2.2.2 Total demand ....................................................................................... 9 2.2.2.1 Demand for food ................................................................... 9 2.2.2.2 Demand for feed .................................................................... 10 2.2.2.3 Demand for other uses .......................................................... 10
2.2.3 Trade equation ..................................................................................... 10 2.2.4 Equilibrium .......................................................................................... 11 2.2.5 Future trends in production and consumption ..................................... 11
2.3 SWOT analysis .................................................................................................. 11 2.4 Sources and coverage of data ............................................................................. 12 2.5 Limitations of the study ..................................................................................... 12 3. Profiles of the Local Livestock, Aquaculture, Feed Crops and Feed Milling Sectors 3.1 Livestock production and consumption ............................................................. 13 3.2 Aquaculture sector ............................................................................................. 15 3.3 Feed crops .......................................................................................................... 17
3.3.1 Corn/maize .......................................................................................... 17 3.3.2 Palay/rice ............................................................................................. 18 3.3.3 Soybean ............................................................................................... 20
3.4 The feed milling sector ...................................................................................... 21 3.4.1 Production capacity ............................................................................. 21 3.4.2 Local feed ingredient production ......................................................... 22 3.4.3 Mixed feed production ........................................................................ 23 3.4.4 Problems confronting the feed milling sector ...................................... 24
3.5 Policies affecting the agro-industrial and feedstuff processing industries ......... 25
vi
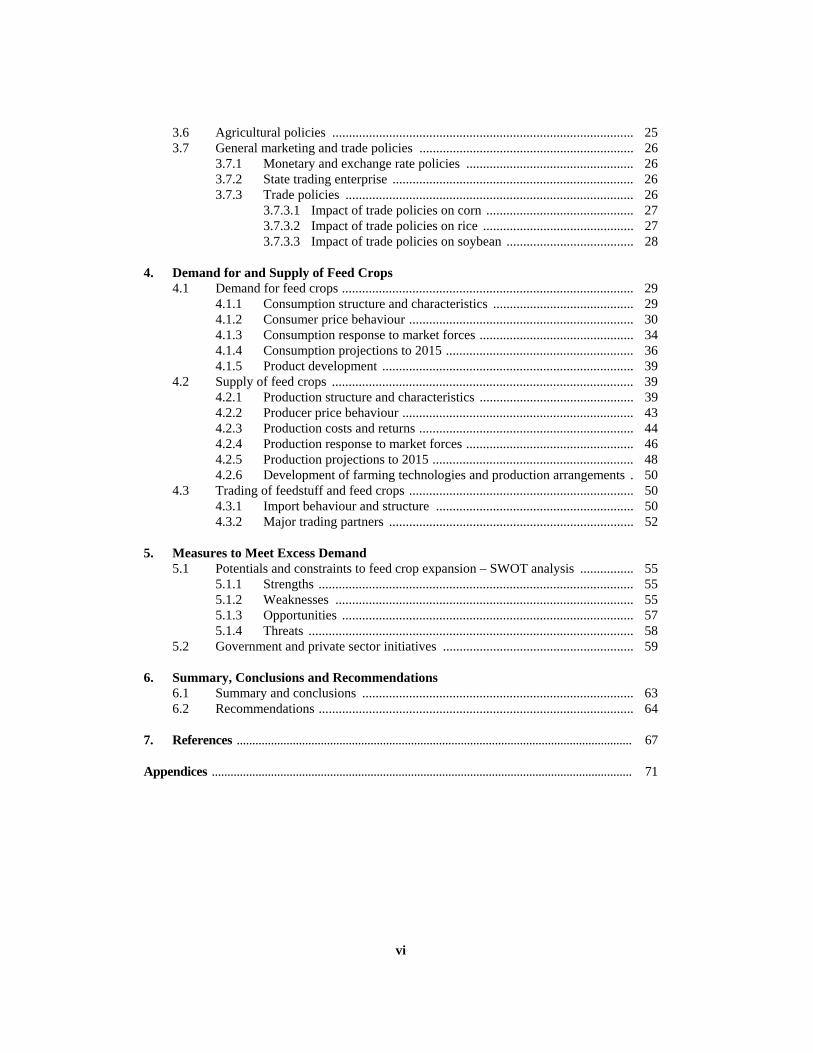
3.6 Agricultural policies .......................................................................................... 25 3.7 General marketing and trade policies ................................................................ 26
3.7.1 Monetary and exchange rate policies .................................................. 26 3.7.2 State trading enterprise ........................................................................ 26 3.7.3 Trade policies ...................................................................................... 26
3.7.3.1 Impact of trade policies on corn ............................................ 27 3.7.3.2 Impact of trade policies on rice ............................................. 27 3.7.3.3 Impact of trade policies on soybean ...................................... 28
4. Demand for and Supply of Feed Crops 4.1 Demand for feed crops ....................................................................................... 29
4.1.1 Consumption structure and characteristics .......................................... 29 4.1.2 Consumer price behaviour ................................................................... 30 4.1.3 Consumption response to market forces .............................................. 34 4.1.4 Consumption projections to 2015 ........................................................ 36 4.1.5 Product development ........................................................................... 39
4.2 Supply of feed crops .......................................................................................... 39 4.2.1 Production structure and characteristics .............................................. 39 4.2.2 Producer price behaviour ..................................................................... 43 4.2.3 Production costs and returns ................................................................ 44 4.2.4 Production response to market forces .................................................. 46 4.2.5 Production projections to 2015 ............................................................ 48 4.2.6 Development of farming technologies and production arrangements . 50
4.3 Trading of feedstuff and feed crops ................................................................... 50 4.3.1 Import behaviour and structure ........................................................... 50 4.3.2 Major trading partners ......................................................................... 52
5. Measures to Meet Excess Demand 5.1 Potentials and constraints to feed crop expansion – SWOT analysis ................ 55
5.1.1 Strengths .............................................................................................. 55 5.1.2 Weaknesses ......................................................................................... 55 5.1.3 Opportunities ....................................................................................... 57 5.1.4 Threats ................................................................................................. 58
5.2 Government and private sector initiatives ......................................................... 59 6. Summary, Conclusions and Recommendations 6.1 Summary and conclusions ................................................................................. 63 6.2 Recommendations .............................................................................................. 64 7. References ............................................................................................................................... 67 Appendices ....................................................................................................................................... 71

vii
List of Tables
Page Chapter 1 Table 1.1 Gross value added in agriculture, fisheries and forestry (in million pesos: at constant 1985 prices), Philippines, 1988-2002 .............................................. 1 Table 1.2 Population, Philippines, 1988-2015 ................................................................... 2 Table 1.3 Median annual income, median annual expenditures and savings at current prices (pesos), Philippines, 1988-2000 .............................................................. 2 Table 1.4 Comparison of mean one-day per capita food consumption (raw, “as purchased”), Philippines, 1978-1993 ................................................................. 3 Chapter 3 Table 3.1 Inventory of livestock and poultry, Philippines, 1988-2002 .............................. 13 Table 3.2 Production of livestock and poultry (carcass weight), Philippines, 1988-2002 . 15 Table 3.3 Chicken and duck eggs, and milk production, Philippines, 1988-2002 ............. 15 Table 3.4 Production of aquaculture, commercial and municipal fishing, Philippines, 1988-2002 .......................................................................................................... 16 Table 3.5 Trends in production of selected aquaculture, Philippines, 1988-2002 ............. 16 Table 3.6 Corn harvested area, production and yield, Philippines, 1988-2002 ................. 17 Table 3.7 Corn yield (mt/ha) among benchmark countries and the Philippines, 1988-2002 .......................................................................................................... 18 Table 3.8 Corn supply and utilization accounts, Philippines, 1988-2002 .......................... 18 Table 3.9 Rice harvested area, production and yield, Philippines, 1988-2002 .................. 19 Table 3.10 Palay yield (mt/ha) among benchmark countries and the Philippines, 1988-2002 .......................................................................................................... 19 Table 3.11 Rice supply and utilization accounts, Philippines, 1988-2002 .......................... 19 Table 3.12 Soybean harvested area, production and yield, Philippines, 1988-2002 ........... 20 Table 3.13 Soybean yield (mt/ha) among benchmark countries and the Philippines, 1988-2002 .......................................................................................................... 20 Table 3.14 Soybean supply and utilization accounts, Philippines, 1988-2002 .................... 21 Table 3.15 Registered feed establishments, Philippines, 2002 ............................................ 22 Table 3.16 Number of commercial feed mills by size, Philippines, 1990-2002 .................. 22 Table 3.17 Geographical distribution of commercial feed mills, rated capacities and corn
production by region, 2002 ................................................................................ 22 Table 3.18 Local feed ingredient production (in mt), Philippines, 1988-2001 .................... 23 Table 3.19 Commercial mixed feed production, Philippines, 1988-2002 ........................... 23 Table 3.20 Commercial feed production by type of feed, Philippines, 1988-2002 ............. 24 Chapter 4 Table 4.1a Wholesale domestic and export parity prices of selected feed crops, Philippines, 1982-2002 ...................................................................................... 32 Table 4.1b Wholesale domestic and import parity prices of selected feed crops, Philippines, 1982-2002 ...................................................................................... 33 Table 4.2 Demand projections using demand regression results, 2003-2015 .................... 38 Table 4.3 Projected demand for mixed feeds, corn, rice bran and soybean meal, Philippines, 2003-2015 ...................................................................................... 38

viii
Table 4.4 White and yellow corn harvested area, production and yield, Philippines, 1988-2002 .......................................................................................................... 39 Table 4.5 Corn area, production and yield, by region, Philippines, 2002 .......................... 41 Table 4.6 Average area harvested by type and variety of corn, Philippines, 1999-2001 ... 41 Table 4.7 Palay yield (mt/ha) by region and by type of environment, Philippines, 2002 .. 42 Table 4.8 Volume of production of palay by region, Philippines, 2002 ............................ 43 Table 4.9 Soybean volume, area and yield, Philippines, 1997 .......................................... 43 Table 4.10 Nominal farm gate prices of selected feed crops, Philippines, 1982-2002 ........ 44 Table 4.11 Average selling price (P/kg) of selected feed ingredients, Philippines, 1996-2002 .......................................................................................................... 44 Table 4.12 Average production costs and returns (pesos/ha) of yellow corn, Philippines, 1991-2002 .......................................................................................................... 44 Table 4.13 Average production costs and returns (pesos/ha) of irrigated and non-irrigated
palay, Philippines, 1991-2002 ........................................................................... 45 Table 4.14 Production costs and returns (pesos/ha) of soybean, Philippines, 2002 ............ 46 Table 4.15 Supply projections using area and yield response model, 2003-2015 ............... 49 Table 4.16 Projected import level (metric tons) of corn, rice and soybean, Philippines, 2003-2015 .......................................................................................................... 49 Table 4.17 Corn and soybean imports, 1988-2002 .............................................................. 51 Table 4.18 Philippine corn and soybean imports by country of origin, 2002 ...................... 53 Table 4.19 Total value of exports and imports of feeding stuff for animals, 2002 .............. 53 Table 4.20 Trading in feedstuff for animals by country (f.o.b. million US$), 2002 ............ 53

ix
List of Figures
Page Chapter 2 Figure 2.1 Supply of and demand for feed crops ................................................................ 7 Chapter 3 Figure 3.1 Cross trend of swine and poultry inventories with corn, rice and soybean feed
consumption, Philippines, 1988-2002 ............................................................... 14 Figure 3.2 Commercial feed production by type, Philippines, 2002 ................................... 24 Chapter 4 Figure 4.1 Trends in wholesale prices (nominal) of selected feed crops, Philippines, 1982-2002 .......................................................................................................... 30 Figure 4.2 Trends in retail prices (nominal) of selected feed crops, Philippines, 1982-2002 .......................................................................................................... 30 Figure 4.3 Palay harvested area by environment, Philippines, 2002 ................................... 42 Figure 4.4 Distribution of imported feed crops and feeding stuff for animals, 2002 .......... 51 Figure 4.5 World prices (f.o.b.) of yellow corn, rice and soybean, Philippines, 1982-2002 52

x
xi
Foreword
During the last few decades a rapid increase has occurred in the demand for meat, milk and eggs throughout the world. This increase is attributed not only to increases in population but to a large increase in per capita consumption connected to changes in lifestyles and to economic growth.
By 2002, in general, the increasing demand for livestock products will equal or exceed
the demand for food from direct plant origin (cereals, vegetables and pulses). This process is known as “the Livestock Revolution”.
Coarse grains, pulses, roots and tuber crops are very important components of farming
systems in Asia and the Pacific. Feed is one of the important end products of CGPRT crops. Responding to this need, UNESCAP-CAPSA implemented a research project “Prospects
of Feed Crops in Southeast Asian Countries (FEEDSEA)” in collaboration with partners from four Southeast Asian countries namely: Indonesia, Malaysia, the Philippines and Thailand. It is a continuation of the research project “Prospects of Feed Crops in South Asia (FEED)” conducted from 2001 to 2003 with the participation of four countries in South Asia, namely: India, Nepal, Pakistan and Sri Lanka.
It is my pleasure that the first output of this project Status and Prospects of Feed
Crops in the Philippines is now available to the public. This volume covers topics such as investigating and identifying opportunities for improvements in rural income through new and different utilization of CGPRT crops in the feed industry in the Philippines.
I thank Dr. Danilo C. Cardenas and his team for their earnest and fruitful work.
Dr. Budiman Hutabarat, Senior Researcher, Indonesian Center for Agricultural Socio Economic Research and Development (ICASERD), and Dr. Erna Maria Lokollo provided useful comments and guidance at various stages of the study as the regional advisor and programme leader respectively. I also thank Mr. Matthew L. Burrows for his editing services throughout the publication of the report, and Ms. Agustina Mardyanti for typing and formatting the final document. I would like to express my highest appreciation to the Government of Japan for funding the project.
J.W. Taco Bottema Director
UNESCAP-CAPSA

xii

xiii
Acknowledgements
This study was made possible through the active support and cooperation of numerous institutions and individual who in one way or another helped in the preparation and completion of this report. Our deepest gratitude and appreciation goes to the following:
• Dr. William Medrano of DA-BAR for recommending one of us to be the country expert for the Philippine feed crop project component;
• Dr. Nobuyoshi Maeno, former Director, CAPSA for providing the funds under which this work has been attempted;
• Dr. Budiman Hutabarat and Dr. Erna Lokollo, Regional Advisor and Project Leader respectively of the FEEDSEA project who were instrumental in coordinating the conduct of this project.
To the numerous authors cited in the literature review from whose earlier work this report freely lifted many ideas and information:
• Dr. Danilo Baldos, DA-BAR, Senior Technical Advisor; • Dr. Narciso Deomampo, PCARRD, National Team Leader on Agriculture and
Resource Economics; • Dr. Artemio Salazar, Da Programme Leader on GMA Corn; and Dr. Edwin Villar,
PCARRD, Livestock Research Division Director for sharing their expertise and experience with great diligence and patience in providing valuable comments and suggestions in improving the paper by serving as the panel of reviewers for this report:
• Mr. Geny Lapina of the German Technical Cooperation (GTZ) for his technical assistance in the formulation of the country report; and
• Mr. Richard Daite of the PCARRD, Socio-Economics Research Division for his excellent editorial work.
Danilo C. Cardenas Lara Marie M. de Villa Fezoil Luz C. Decena

xiv

xv
Executive Summary
The study focused on the status and prospects of three major Philippine feed crops, i.e. corn, palay (rice) and soybean, as they functionally relate to the livestock sector. A detailed discussion on local livestock, poultry, aquaculture, and feed milling industry sub-sectors, as well as the three feed crops is presented to examine the current status of these industries. The study analyzed the trends and projections of supply and demand of feed crops from 1988-2015 and evaluated the strengths, weaknesses, opportunities and threats in developing the feed crop sector in the Philippines. From these analyses, relevant policy recommendations on promoting the sustainable development of feed crop farming were formulated.
Results of the study revealed that demand for corn, rice and soybean is to expand in the coming decade. Growth in the demand for feed crops is hinged on the rise in meat, poultry, eggs and their products’ production. This trend could be attributed to the increasing consumption of meat, poultry, eggs, and dairy products which was brought about by rapid urbanization, rising income and changes in consumer tastes and preferences.
The estimated supply and demand projections from 2003 to 2015 indicate that given the current status of demand and domestic production, there will be large deficits by 2015 for corn, rice and soybean. These deficits have to be met either by raising imports or improving the efficiency of production (e.g. improvement in yield, strengthening extension and R&D activities, etc.). The latter appears to be the best option to be pursued since other Southeast Asian countries are expected to have high feed demand as well, which could possibly contribute to volatility in world feed crop prices.
The general objective of the study was to take a closer look at the status and prospects of the domestic feed crop sector in the Philippines as they functionally relate with the expected growth of the local livestock industry. More specifically, the aims were to:
1. Analyze the current status and future trends of the demand and supply of feed crops; 2. Evaluate the strengths, weaknesses, opportunities and constraints for expanding feed
crop farming in the Philippines; and 3. Formulate relevant policy recommendations to promote the sustainable development of
feed crop farming in the Philippines. In determining the prospects of the feed crop sector in the Philippines, the impacts of
non-market and market forces on the production and consumption of feed crops are vital. This is to establish the inter-related effects and relationship of factors such as technological change, population and income, among others, to the supply and demand of feed crops. In addition, it was crucial to assess and evaluate whether the programmes of the feed crop sector are feasible from a managerial point of view. Hence, an analytical framework was developed based on the standard economic theory of supply and demand complemented by the management planning tool known as SWOT.
Improving efficiency in domestic production to bridge the supply-demand gap requires the government to address production, post-harvest, infrastructure, credit, research, development and extension constraints. The specific recommendations in developing the feed crop sector (i.e. to raise local production and to make it more efficient) outlined in this study are identified as follows:
1. On the production side, there is a need to improve the access of farmers to quality seeds or new seed technologies such as transgenic crops. Access to transgenic crops, however, would entail the government to attend to concerns levied against its use;
2. Provision of a well-managed credit system to support the use of productivity enhancing technologies;

xvi
3. The public sector should also help provide farmers good storage facilities to reduce aflatoxin contamination and spoilage. When these are reduced, farmers are also able to realize higher returns from their produce;
4. With regard to infrastructure problems, farm-to-market road issues need to be conscientiously addressed. Increasing irrigation facilities would also help farmers raise their levels of production and their incomes;
5. A strengthened research and extension system should be established, as this plays a major role in developing the feed crop sector;
6. The government should make sincere efforts in resolving the peace and order situation in Mindanao;
7. The government’s linkage with the private sector, especially transnational corporations, could be exploited and strengthened to take advantage of the opportunities these companies can provide in developing the feed crop industry; and
8. The government should seriously pursue the implementation of programmes aimed at sustaining the development of the feed crop sector (e.g. National Corn and Rice Programs and the Grains Highway Program).
The study focused on the top three feed crops used in the livestock sector, however,
there exists no time series data for traditional feeds such as roughages, pasture or forages and therefore, these feeds were omitted from the analysis. Other coarse grains, pulses, roots and tubers (secondary or CGPRT crops) are primarily consumed as food items and typical inclusion of these feeds is low, thus, these were likewise not included in the analysis but could give researchers greater scope in any future research study.
UNESCAP-CAPSA The Centre for Alleviation of Poverty through Secondary Crops’ Development in Asia and the Pacific (CAPSA) is a subsidiary body of UNESCAP. It was established as the Regional Co-ordination Centre for Research and Development of Coarse Grains, Pulses, Roots and Tuber Crops in the Humid Tropics of Asia and the Pacific (CGPRT Centre) in 1981 and was renamed CAPSA in 2004. Objectives CAPSA promotes a more supportive policy environment in member countries to enhance the living conditions of rural poor populations in disadvantaged areas, particularly those who rely on secondary crop agriculture for their livelihood, and to promote research and development related to agriculture to alleviate poverty in the Asian and Pacific region Functions 1. Coordination of socio-economic and policy research on secondary crops. 2. Networking and partnership with other international organizations and key
stakeholders. 3. Research and analysis of trends and opportunities with regard to improving the
economic status of rural populations. 4. Production, packaging and dissemination of information and successful practices on
poverty reduction. 5. Dissemination of information and good practices on poverty reduction measures. 6. Training of national personnel, particularly national scientists and policy analysts. CAPSA Working Papers currently available: Working Paper No. 77 Integrated Report of the Project “Stabilization of Upland Agriculture and Rural
Development in El Nino Vulnerable Countries” by Shigeki Yokoyama Working Paper No. 76 A Preliminary Assessment of the Potential Role of Information and
Communication Technology in Support of Poverty Alleviation Policies for Rural Populations – AGRI-ICT Project Report
by Robin Bourgeois Working Paper No. 75 Multilevel Impact Assessment and Coping Strategies against El Nino:
Case of Food Crops in Indonesia Indigenous Drought Coping Strategies and Risk Management
by Bambang Irawan Working Paper No. 74 Indigenous Drought Coping Strategies and Risk Management
against El Nino in Papua New Guinea by Sergie K. Bang and Kud Sitango Working Paper No. 73 Stabilization of Upland Agriculture under El Nino-induced Climatic Risk: Impact Assessment and Mitigation Measures in Papua New Guinea by Sergie K. Bang, Spencer Poloma and Bryant Allen (Continued on inside back cover)

Status and Prospects of Feed Crops in the Philippines
“UNESCAP-CAPSA: Centre for Alleviation of Poverty through Secondary Crops’ Development in Asia and the Pacific”

The designations employed and the presentation of material in this publication do not imply the expression of any opinion whatsoever on the part of the Secretariat of the United Nations concerning the legal status of any country, territory, city or area of its authorities, or concerning the delimitation of its frontiers or boundaries. The opinions expressed in signed articles are those of the authors and do not necessarily represent the opinion of the United Nations.

WORKING PAPER 78
Status and Prospects of Feed Crops in the Philippines
Danilo C. Cardenas Lara Marie M. De Villa
Fezoil Luz C. Decena
UNESCAP-CAPSA Centre for Alleviation of Poverty through Secondary Crops’ Development in Asia and the Pacific


1
1. Introduction
1.1 Background
Traditionally, the local livestock sector has always played a key role in the growth of Philippine agriculture. Its contribution to the gross value-added (GVA) in agriculture, fishery and forestry has been, on average, 21 per cent from 1988-2002 (Table 1.1). During the same period, animal inventory has likewise expanded at an average rate of 6 per cent. This trend is expected to continually increase in the coming years despite the constraints posed by an under-developed feed crop sub-sector. This could be attributed to the increasing consumption of meat, poultry, eggs as well as milk and other dairy products brought about by a rapidly growing population, urbanization, rising income and changes in consumer food tastes and preferences. Unfortunately, these changes have continued to put undue pressure on the Philippines’ already shrinking agricultural resource base and ultimately, limiting the country’s ability to achieve higher economic growth.
Table 1.1 Gross value added in agriculture, fisheries and forestry (in million pesos: at constant 1985 prices), Philippines, 1988-2002
Industry 1988 1990 1992 1994 1996 1998 2000 2002 Average Agricultural crops 84,067 85,870 8,662 9,775 96,418 87,422 99,887 104,150 93,022
Palay 23,138 24,873 24,412 28,182 30,175 22,877 33,134 35,493 28,210 Corn 10,466 10,950 11,009 10,769 9,893 9,111 10,750 10,292 10,523 Coconut 9,008 7,084 6,815 6,831 6,890 6,414 6,520 6,916 6,950 Sugarcane 2,997 3,652 4,871 5,326 4,810 3,938 4,908 5,320 4,567 Banana 2,940 2,698 2,789 2,836 3,011 3,602 4,157 4,435 3,278 Other crops 35,518 36,613 37,766 38,831 41,639 41,480 40,418 41,694 39,494
Livestock and poultry
24,522 29,069 331,194 34,113 39,009 42,233 45,258 50,017 36,921
Agri-related activities and services
6,858 7,692 8,154 8,336 7,838 7,676 8,006 8,749 7,863
Fishery 28,581 30,783 32,375 33,195 34,288 34,498 36,168 40,821 33,825 Forestry 11,264 7,320 4,186 2,971 1,898 1,372 1,372 996 3,640 GVA in agriculture, fishery and forestry
155,292 160,734 163,571 171,390 179,451 173,201 190,691 204,733 175,271
Source: Adapted from the Philippine Statistical Yearbook, 2002. Note: Livestock sector includes swine, poultry, cattle, carabao, goats and sheep. Agri-related activities and services include producers of
farm machinery and input providers (seeds and fertilizers). In the Philippines, as in many developing countries, rapid population growth makes it
extremely difficult for agricultural production to keep pace with demand. With an average population growth rate of 2.3 per cent, the present population of 79.5 million Filipinos is projected to reach 99 million by 2015 (Table 1.2). Ensuring food security has therefore become a critical national concern as these demographic changes are anticipated to affect both food demand and supply patterns.
In the last three years or so, the share of food to total personal consumption expenses has represented about 53-54 per cent, at constant prices (Catelo, 2004). In terms of family expenditure, food consumed at home declined to 38 per cent while food consumed outside the home increased slightly to 5 per cent in 2000 (NSO, 2000). This can be expected to widen further in the near future considering several developments.
Firstly, as of 2000, urban dwellers comprised 59 per cent of the country’s total population. As such, the growth in both urban areas and urban population has resulted in a busy lifestyle, with office work taking much time away from household chores. This has shifted consumption from traditional foods to a fast-food diet to cope up with the fast-paced lifestyles.
Chapter 1
2
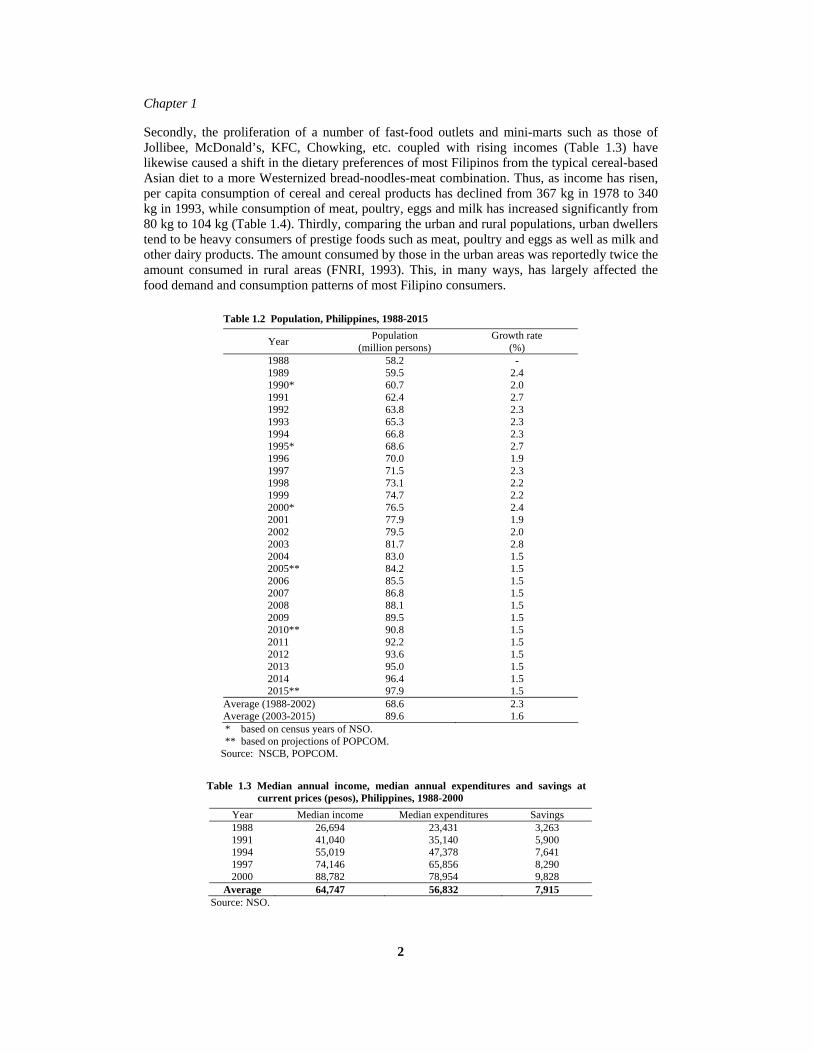
Secondly, the proliferation of a number of fast-food outlets and mini-marts such as those of Jollibee, McDonald’s, KFC, Chowking, etc. coupled with rising incomes (Table 1.3) have likewise caused a shift in the dietary preferences of most Filipinos from the typical cereal-based Asian diet to a more Westernized bread-noodles-meat combination. Thus, as income has risen, per capita consumption of cereal and cereal products has declined from 367 kg in 1978 to 340 kg in 1993, while consumption of meat, poultry, eggs and milk has increased significantly from 80 kg to 104 kg (Table 1.4). Thirdly, comparing the urban and rural populations, urban dwellers tend to be heavy consumers of prestige foods such as meat, poultry and eggs as well as milk and other dairy products. The amount consumed by those in the urban areas was reportedly twice the amount consumed in rural areas (FNRI, 1993). This, in many ways, has largely affected the food demand and consumption patterns of most Filipino consumers.
Table 1.2 Population, Philippines, 1988-2015
Year Population (million persons)
Growth rate (%)
1988 58.2 - 1989 59.5 2.4
1990* 60.7 2.0 1991 62.4 2.7 1992 63.8 2.3 1993 65.3 2.3 1994 66.8 2.3
1995* 68.6 2.7 1996 70.0 1.9 1997 71.5 2.3 1998 73.1 2.2 1999 74.7 2.2
2000* 76.5 2.4 2001 77.9 1.9 2002 79.5 2.0 2003 81.7 2.8 2004 83.0 1.5
2005** 84.2 1.5 2006 85.5 1.5 2007 86.8 1.5 2008 88.1 1.5 2009 89.5 1.5
2010** 90.8 1.5 2011 92.2 1.5 2012 93.6 1.5 2013 95.0 1.5 2014 96.4 1.5
2015** 97.9 1.5 Average (1988-2002) 68.6 2.3 Average (2003-2015) 89.6 1.6 * based on census years of NSO. ** based on projections of POPCOM.
Source: NSCB, POPCOM.
Table 1.3 Median annual income, median annual expenditures and savings at current prices (pesos), Philippines, 1988-2000
Year Median income Median expenditures Savings 1988 26,694 23,431 3,263 1991 41,040 35,140 5,900 1994 55,019 47,378 7,641 1997 74,146 65,856 8,290 2000 88,782 78,954 9,828
Average 64,747 56,832 7,915 Source: NSO.

Introduction
3
Table 1.4 Comparison of mean one-day per capita food consumption (raw, “as purchased”), Philippines, 1978-1993
Consumption Average Per capita intake (grams) Food group/subgroup
1978 1982 1987 1993Intake
(grams) Growth rate
(%) Cereals and cereal products 367.00 356.00 345.00 340.00 352.00 (2.51)
Rice and rice products 308.00 304.00 303.00 282.00 299.25 (2.85) Corn and corn products 38.00 34.00 24.00 36.00 33.00 3.35 Other cereals and their products 21.00 18.00 18.00 22.00 19.75 2.65
Starchy roots and tubers 37.00 42.00 22.00 17.00 29.50 (18.94) Sugars and syrups 19.00 22.00 24.00 19.00 21.00 1.35 Fats and oils 13.00 14.00 14.00 12.00 13.25 (2.20) Fish and fish products 102.00 113.00 111.00 99.00 106.25 (0.60) Meat, poultry, eggs and milk products 80.00 95.00 99.00 104.00 94.50 9.34
Meat products 23.00 32.00 37.00 34.00 31.50 15.55 Poultry products 7.00 10.00 9.00 14.00 10.00 29.47 Eggs and egg products 8.00 9.00 10.00 12.00 9.75 14.54 Milk and milk products 42.00 44.00 43.00 44.00 43.25 1.60
Dried beans, nuts and seeds 8.00 10.00 10.00 10.00 9.50 8.33 Vegetables 145.00 130.00 111.00 106.00 123.00 (9.82) Fruits 104.00 102.00 107.00 77.00 97.50 (8.35) Miscellaneous 21.00 32.00 26.00 19.00 24.50 2.24 All foods 897.00 915.00 869.00 803.00 871.00 (3.54) Source: Adapted from FNRI.
In terms of food supply, the uninhibited population growth may also be unintentionally
causing a deterioration in food sufficiency and worsen food availability. For instance, the agricultural population, aside from aging, has also declined over the years from 42 per cent of the total population in 1995 to just 39 per cent in 1999. This may partly be attributed to the massive conversion of agricultural lands into residential and other built-up areas (BAS, 1999). If this trend continues the years to come will result in land and agricultural retirement for the old, with fewer and older people taking over whatever residual agricultural lands remain that have not yet been converted and/or urbanized. These trends have negative implications for agriculture and food supply in the Philippines. Considering the existing patterns of land conversion, agricultural lands have not only decreased but agricultural produce has also been affected. Aside from the direct loss of productive capacity, the successive land conversions that have already taken place have also negatively influenced whatever little agriculture remained (Cardenas, 1997). These externalities have generally taken several forms which have imposed additional burdens on existing farming conditions.
Firstly, the migration of a large proportion of the non-farming population has generally reduced the overall profitability of farming by restricting certain farming operations. Secondly, the reduction in farmlands has caused a decline in supporting businesses and forced some farms to remain inefficiently small. At first glance, these effects may lead to a reduction in farm net income, rather than gross output, by seriously degrading existing farming conditions. Added to these problems are the uncertain conditions under which the remaining farmers live in fear of seeing their future obscured by urban expansion. Consequently, some of them have ceased operating their farms on a full-time basis. Moreover, land conversion has also brought about a basic change in the composition and structure of land ownership, with an increasing proportion being primarily non-farmers. Sociologically, this would imply that more and more of the limited agricultural land resources are continually being acquired by people who have little personal ties to the land. On the other hand, as the would-be urban land prices rise sharply to attract more supply, the new prevailing higher prices make it extremely difficult for landless farmers to acquire their own landholdings. As a result, the property being sold often has to be subdivided into smaller parcels and the size of the average landholding would, thus, continue to shrink.
Chapter 1
4
Hence, the remaining farmers cannot be readily expected to just simply expand their level of agricultural operations to meet increasing demand, while economic development activity steadily raises the threshold of viability.
Furthermore, with the increasing population, there is also further decline in productivity arising from the expansion of agriculture towards the uplands leading to the wider use of marginal lands as well as the overuse of other prime agricultural lands, both of which results in early land degradation in some areas. Thus, as farmers try to achieve higher yields from their heavily used farmlands, soil erosion worsens, water becomes more scarce, and pollution increases. The Food and Agriculture Organization (FAO) estimated that for every person added to the population, about 0.05 hectares of land is taken away from agricultural use to meet the land-use requirement for settlements, roads, power, recreation, commercial and industrial, and other purposes (as cited by Cabrido, 1994). This implies that the country’s capacity to expand agricultural production may be shrinking and not expanding after all.
Thus, the twin problems of hunger and food insecurity are likely to persist and could even worsen unless urgent, determined and concerted action is taken. To help avert this grim outlook, a research project on the status and prospects of selected feed crops in Southeast Asia was commissioned by the Centre for Alleviation of Poverty through Secondary Crops’ Development in Asia and the Pacific (CAPSA) to assess their development potentials, strengths, opportunities and constraints so that appropriate strategies and policy options can be formulated and implemented for their sustained development.
1.2 Objectives
The general objective of the study is to take a closer look at the status and prospects of the domestic feed crops’ sector in the Philippines as they functionally relate with the expected growth of the local livestock industry. More specifically, the aims are to:
1. Analyze the current status and future trends of the demand and supply of feed crops; 2. Evaluate the strengths, weaknesses, opportunities and constraints for expanding feed
crop farming in the Philippines; and 3. Formulate relevant policy recommendations to promote the sustainable development of
feed crop farming in the Philippines
1.3 Scope of the study
In the Philippines, palay (in the form of rice bran), corn and soybean are the main locally-grown ingredients widely used in the animal feed milling industry. Their demands are likely to increase sharply in the near future, given the livestock industry’s potential for growth. Other coarse grains such as pulses, roots and tubers, although grown locally, are primarily consumed as food and the likelihood of them being included as feed ingredients is quite low. Hence, the succeeding discussions will dwell largely on the historical dynamics and potentials of these three feed crops.
1.4 Organization of the report
This report is presented in 6 major chapters excluding the literature citation and appendix sections:
1. Introduction – Briefly discusses the project rationale, objectives, scope and commodity coverage of the study, and organization of the report.
2. Research methodology– Contains the conceptual framework of the study, model formulation, sources and coverage of data, and limitations of the study.

Introduction
5
3. Profiles of the local livestock, aquaculture, feed crops and feed milling sectors – Presents an overview of the performance of the livestock and poultry, aquaculture, feed crops and feed milling sectors during the past 15 years, as well as the policies affecting these sectors.
4. Demand for and supply of feed crops – Shows an analysis of the current demand for and supply of selected feed crops, the factors determining them, and projections up to 2015. It also includes an analysis of the existing trade patterns and import estimations of the selected feed crops.
5. Measures to meet excess demand – Identifies and describes measures to ensure the adequate supply of feed crops and meet quality standards set by domestic users as well as international suppliers. It specifically discusses government and private sector initiatives. Likewise, it also highlights the potentials and constraints of the sector.
6. Summary, conclusions and recommendations – Summarizes the key findings of the study and presents policy recommendations for the sustainable development of the local feed crop sector.

Chapter 1
6
7
2. Research Methodology
2.1 Conceptual framework
2.1.1 Definitions ‘Feed crops’ generally refers to plants utilized and processed for feeding animals. Feeds
are the range of food or feedstuffs provided to animals. These include fresh and conserved forages, concentrates and succulent feeds. Feedstuffs can be further classified as conventional and non-conventional feeds. Conventional feedstuffs are those which have traditionally been used, are abundant and primarily cultivated to support the livestock and fisheries sectors. These include corn, soybean, and palay (rice bran), among others. In contrast, non-conventional feedstuffs are by-products derived from processing the main products and feeds which have not been traditionally used in animal feeding or are not commercially produced rations for livestock. Concentrates are low-fiber, high-energy feeds with blended nutrients to increase the nutritional adequacy of feed supplements.
2.1.2 Analytical framework In determining the prospects of the feed crop sector in the Philippines, the impacts of
non-market and market forces on the production and consumption of feed crops are vital. This is to establish the inter-related effects and relationship of factors such as technological change, population, and income among others, to the supply and demand of feed crops. Using the theoretical relationship of the supply and demand functions, future projections on production to foresee an expected deficit or surplus from the sector were calculated. In addition, it has been crucial to assess and evaluate whether the programs of the feed crop sector are feasible from a managerial point of view. Hence, an analytical framework was developed based on the standard economic theory of supply and demand complemented by a management planning tool known as SWOT analysis.
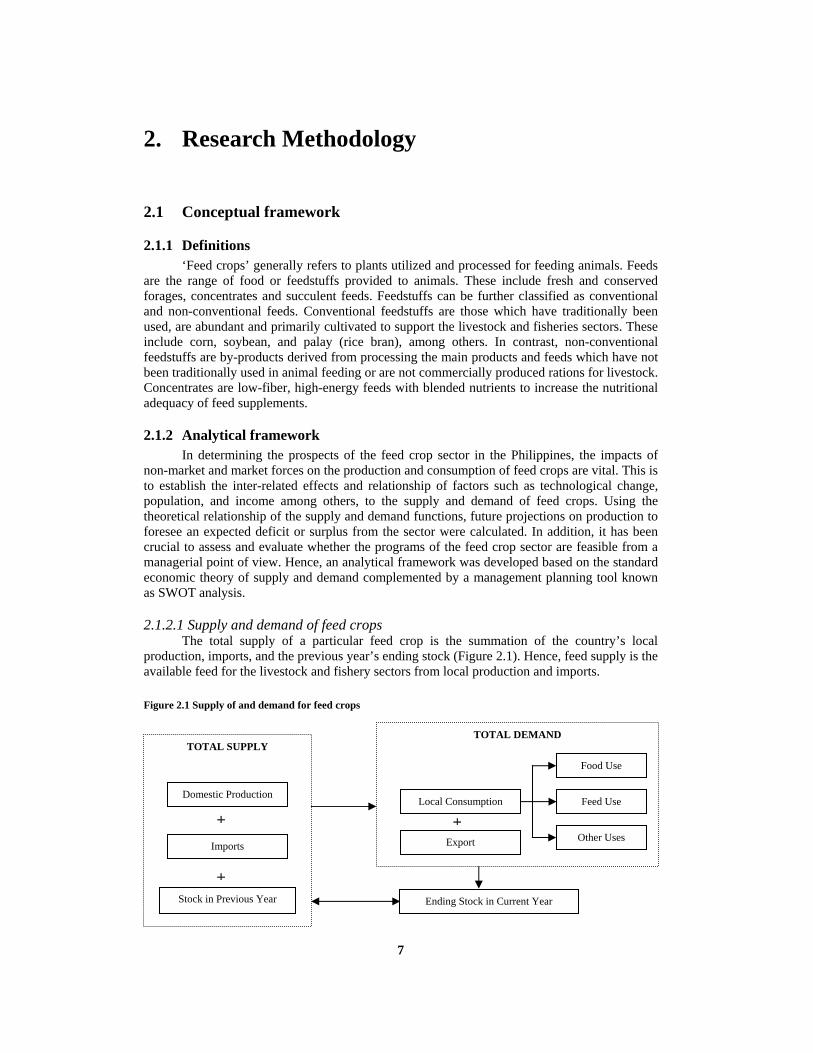
2.1.2.1 Supply and demand of feed crops The total supply of a particular feed crop is the summation of the country’s local
production, imports, and the previous year’s ending stock (Figure 2.1). Hence, feed supply is the available feed for the livestock and fishery sectors from local production and imports.
Figure 2.1 Supply of and demand for feed crops
TOTAL DEMAND
Local Consumption
Export
Food Use
Feed Use
Other Uses +
Ending Stock in Current Year
TOTAL SUPPLY
Domestic Production
Imports
Stock in Previous Year
+
+
Chapter 2
8
On the other hand, demand for feed crops consists of local demand and international demand or exports. Local consumption can further be classified as demand for food, feed and other uses. Feed crops unutilized at the end of the year serve as the ending stock of the period.
2.2 Model formulation
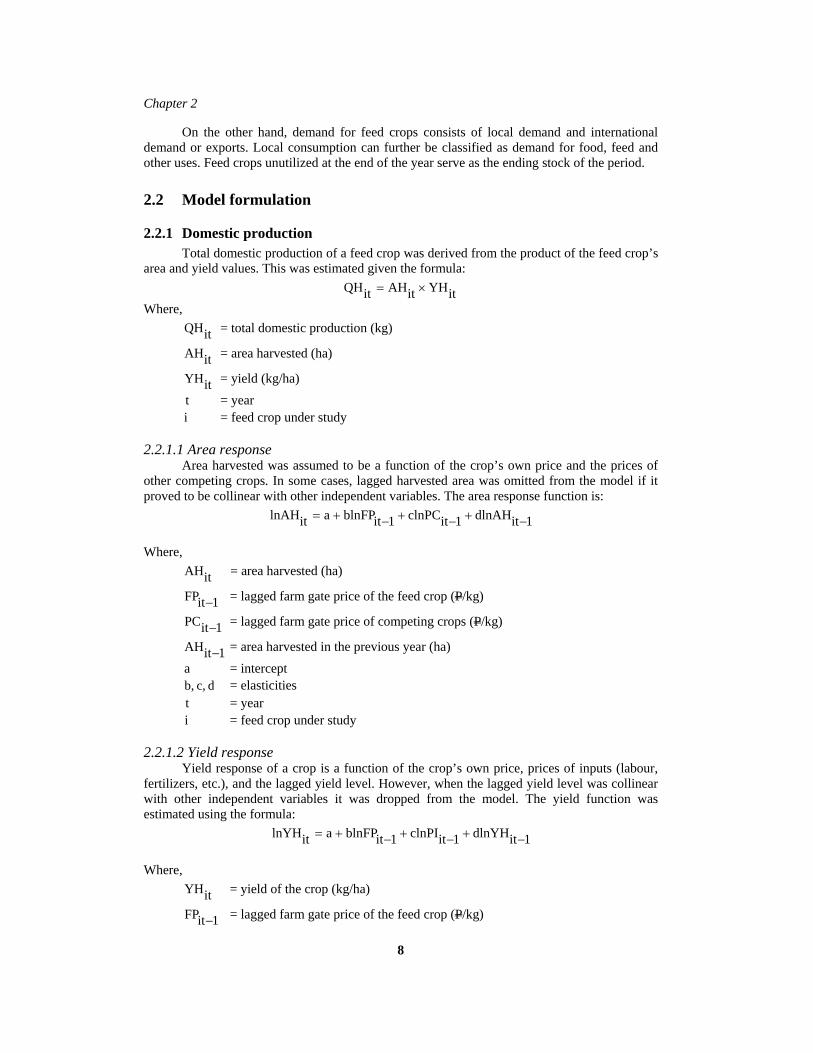
2.2.1 Domestic production Total domestic production of a feed crop was derived from the product of the feed crop’s
area and yield values. This was estimated given the formula:
itYHitAHitQH ×= Where,
itQH = total domestic production (kg)
itAH = area harvested (ha)
itYH = yield (kg/ha) t = year i = feed crop under study
2.2.1.1 Area response Area harvested was assumed to be a function of the crop’s own price and the prices of
other competing crops. In some cases, lagged harvested area was omitted from the model if it proved to be collinear with other independent variables. The area response function is:
1itdlnAH1itclnPC1itblnFPaitlnAH −+−+−+=
Where,
itAH = area harvested (ha)
1itFP − = lagged farm gate price of the feed crop (P/kg)
1itPC − = lagged farm gate price of competing crops (P/kg)
1itAH − = area harvested in the previous year (ha) a = intercept
d c, b, = elasticities t = year i = feed crop under study
2.2.1.2 Yield response Yield response of a crop is a function of the crop’s own price, prices of inputs (labour,
fertilizers, etc.), and the lagged yield level. However, when the lagged yield level was collinear with other independent variables it was dropped from the model. The yield function was estimated using the formula:
1itdlnYH1itclnPI1itblnFPaitlnYH −+−+−+= Where,
itYH = yield of the crop (kg/ha)
1itFP − = lagged farm gate price of the feed crop (P/kg)
Research Methodology
9
1itPI − = lagged price of inputs (P/kg)
1itYH − = yield in the previous year (kg/ha) a = intercept
d c, b, = elasticities t = year i = feed crop under study
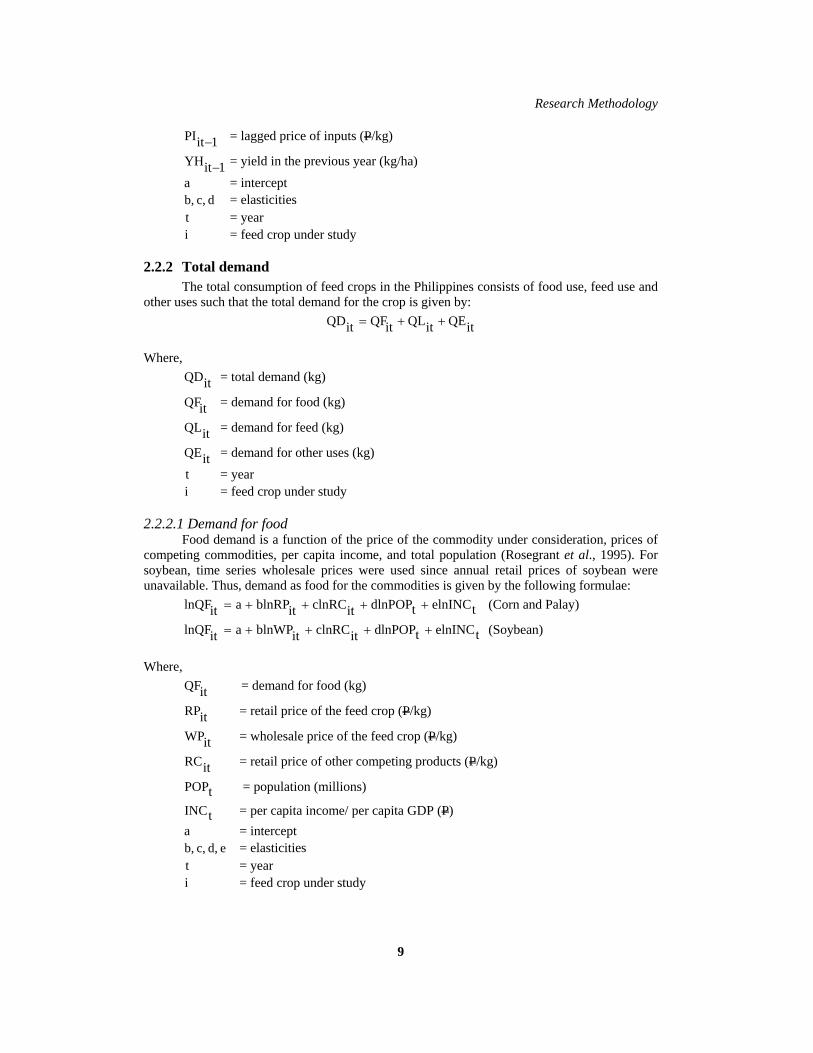
2.2.2 Total demand The total consumption of feed crops in the Philippines consists of food use, feed use and
other uses such that the total demand for the crop is given by:
itQEitQLitQFitQD ++= Where, itQD = total demand (kg)
itQF = demand for food (kg)
itQL = demand for feed (kg)
itQE = demand for other uses (kg) t = year i = feed crop under study
2.2.2.1 Demand for food Food demand is a function of the price of the commodity under consideration, prices of
competing commodities, per capita income, and total population (Rosegrant et al., 1995). For soybean, time series wholesale prices were used since annual retail prices of soybean were unavailable. Thus, demand as food for the commodities is given by the following formulae:
telnINCtdlnPOPitclnRCitblnRPaitlnQF ++++= (Corn and Palay)
telnINCtdlnPOPitclnRCitblnWPaitlnQF ++++= (Soybean) Where,
itQF = demand for food (kg)
itRP = retail price of the feed crop (P/kg)
itWP = wholesale price of the feed crop (P/kg)
itRC = retail price of other competing products (P/kg)
tPOP = population (millions)
tINC = per capita income/ per capita GDP (P) a = intercept
e d, c, b, = elasticities t = year i = feed crop under study

Chapter 2
10
2.2.2.2 Demand for feed Demand for feed is a derived demand determined by changes in livestock production
(Rosegrant et al.), particularly pork, poultry, and eggs, primarily because a major part of corn production is utilized as feeds for the swine and poultry industries. Hence, the demand function for feeds is given by:
telnEGGtdlnPOULtclnPORKitblnWPaitlnQL ++++=
Where, itQL = demand for feed (kg)
itWP = wholesale price of the feed crop (P/kg)
tPORK = pork production (kg)
tPOUL = poultry production (kg)
tEGG = egg production (kg) a = intercept
e d, c, b, = elasticities t = year i = feed crop under study
2.2.2.3 Demand for other uses The demand for other uses, primarily for the processing of feed crops, is a function of the
demand for food and feed demand changes: ( ) itclnQHitQLitQFblnaitlnQE +++=
Where, itQE = demand for other uses (kg)
itQF = demand for food (kg)
itQL = demand for feed (kg)
itQH = quantity produced (kg) a = intercept
c b, = elasticities t = year i = feed crop under study
2.2.3 Trade equation The Philippines is a net importer of agricultural commodities, including cereals and feed
crops such as corn, palay, and soybean. The widening supply deficits caused by the increasing demand for food, feed and other industrial uses of the selected feed crops is increasing the country’s reliance on imports. As such, imports are necessary to meet the increasing demand in the domestic market, such that:
Research Methodology
11
itQHitQCitM −=
Where, itM = import volume (kg)
itQC = total demand (kg)
itQH = domestic production (kg) t = year i = feed crop under study
2.2.4 Equilibrium The general status of the feed industry can be analyzed in terms of equilibrium in
demand for and supply of feed crops. At equilibrium: Total Supply = Total Demand
itMitQH + = itQC Where, itM = import volume (kg)
itQC = total demand (kg)
itQH = domestic production (kg) t = year i = feed crop under study
This was simplified with the exclusion of export volume from the model since the
Philippines is not an exporter of feed crops.
2.2.5 Future trends in production and consumption The elasticity estimates from the supply and demand models were used to project future production and consumption levels. The average growth rates and elasticities of the variables were used to forecast future trends as illustrated in the equation:
ndXnε...2dX2ε1dX1εdY +++=
Where, ...n1ε = elasticity estimates of the explanatory variables
dY = growth rates of the dependent variables dX = growth rates of the explanatory variables
2.3 SWOT analysis
SWOT analysis was used to identify and analyze the strengths and weaknesses of the sector, as well as its opportunities and threats. SWOT intends to develop a plan that takes into consideration the various internal and external factors, and maximizes the potential of the strengths and opportunities while minimizing the impact of the weaknesses and threats.

Chapter 2
12
The SWOT framework also aided in further evaluating the supply and demand scenario of feed crops in the Philippines. Likewise, this management tool was a great help in assessing the prospects of developing the local feed crop industry.
2.4 Sources and coverage of data
Secondary data on the profile and status of livestock, poultry, fisheries, feed crops, and feed milling industries was gathered from the Bureau of Agricultural Statistics (BAS), the Bureau of Animal Industry – Animal Feeds Standard Division (BAI-AFSD) and the Livestock Development Council (LDC) all under the Philippine Department of Agriculture (DA).
The socio-economic and trade data were sourced principally from the National Statistical Coordination Board (NSCB), the National Statistics Office (NSO) and the Philippine Institute for Development Studies (PIDS).
Most of the data used covered the period 1988-2002 with the exemption of some data that is unavailable annually (i.e. income –the NSO survey is conducted every three years, etc.).
2.5 Limitations of the study
The study focused on the top three feed crops used in the livestock sector. There exists no time series data for traditional feeds such as roughages, pasture and forages and therefore, these feeds were omitted from the analysis. Moreover, other coarse grains, pulses, roots and tubers are primarily consumed as food items and typical inclusion of these in feeds is low, thus, these were likewise excluded from the analysis.

13
3. Profiles of the Local Livestock, Aquaculture, Feed Crops and Feed Milling Sectors
3.1 Livestock production and consumption
The Philippine livestock sector consists of swine, poultry, cattle, carabao, goat and duck. With the exception of poultry, most of these animals are backyard raised. In 1988, the livestock inventory stood at 88.5 million animals, steadily rising until 1998 but declining slightly in 1999 and picking up again in 2000 (Table 3.1). The bulk of the inventory comes from poultry (80 per cent). In terms of growth rates, poultry, duck, goat and swine posted the highest increases in the number of animals raised ranging from 3.16 per cent to 5.81 per cent. This was because of better market orientation and production efficiency as well as growing consumer demand for the said commodities (NABCOR & SEARCA, 1999).
The increasing trends in inventories, especially of swine and poultry, imply a corresponding increasing demand for feed crops, as illustrated in Figure 3.1 where the total livestock inventory from 1988-2002 was observed to be increasing with the consumption of the three major feed crops.
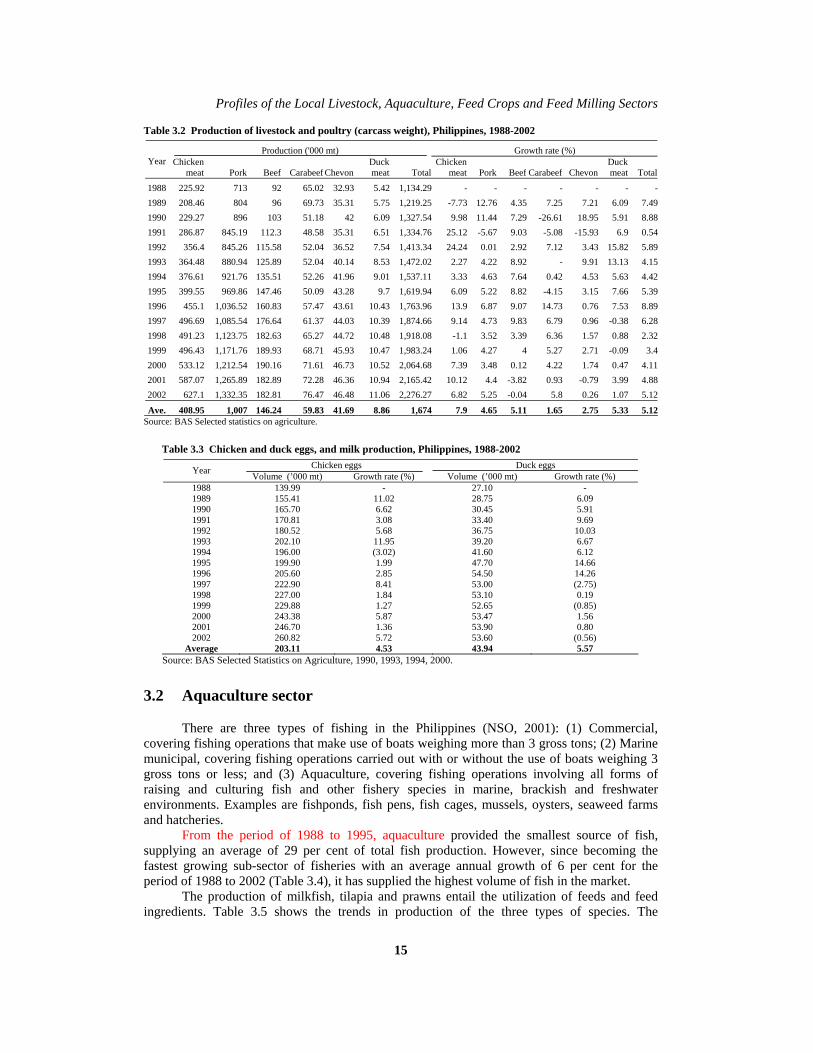
Pork dominated the meat market capturing an average 60 per cent share of total meat production from 1988-2002, followed by chicken meat with 24 per cent (Table 3.2). The supply of pork from 1988 to 2002 expanded by 87 per cent while chicken meat grew by 178 per cent. Although fluctuating in terms of growth rates, the volume of meat production is generally increasing for all types of meat. The rise in poultry production in the late 1990s up to the present has been due to increased importation of day old chicks for broilers (BAS, 2002).
Chicken egg and duck egg production increased over the said period, with chicken egg production increasing annually by 5 per cent (Table 3.3). As of 2002, domestic production of chicken eggs was 261,000 mt, an increase of 86 per cent from 1988. This increase was also stimulated by increasing primary stock layer importation.
Table 3.1 Inventory of livestock and poultry, Philippines, 1988-2002 Poultry Swine Cattle Carabao Goat Duck Total
Year No. of heads (’000)
Growth rate (%)
No. of heads (’000)
Growth rate (%)
No. of heads (’000)
Growth rate (%)
No. of heads (’000)
Growth rate (%)
No. of heads (’000)
Growth rate (%)
No. of heads ('000)
Growth rate (%)
No. of heads (’000)
Growth rate (%)
1988 60,321 - 7,580 - 1,700 - 2,890 - 2,120 - 5,838 - 80,449 -1989 70,016 16.07 7,908 4.33 1,682 (1.06) 2,842 (1.66) 2,212 4.34 6,500 11.34 91,160 13.311990 81,303 16.12 8,000 1.16 1,630 (3.09) 2,765 (2.71) 2,204 (0.36) 7,356 13.17 103,258 13.271991 78,240 (3.77) 8,079 0.99 1,677 2.88 2,647 (4.27) 2,141 (2.86) 8,268 12.40 101,052 (2.14)1992 81,525 4.20 8,022 (0.71) 1,731 3.22 2,577 (2.64) 2,306 7.71 8,348 0.97 104,509 3.421993 87,158 6.91 7,954 (0.85) 1,915 10.63 2,576 (0.04) 2,562 11.10 8,707 4.30 110,872 6.091994 93,201 6.93 8,226 3.42 1,936 1.10 2,560 (0.62) 2,633 2.77 8,187 (5.97) 116,743 5.301995 96,216 3.23 8,941 8.69 2,021 4.39 2,708 5.78 2,828 7.41 9,072 10.81 121,786 4.321996 115,782 20.34 9,026 0.95 2,128 5.29 2,841 4.91 2,982 5.45 9,470 4.39 142,229 16.791997 134,963 16.57 9,752 8.04 2,266 6.48 2,988 5.17 3,025 1.44 8,923 (5.78) 161,917 13.841998 138,521 2.64 10,210 4.70 2,389 5.45 3,013 0.84 3,085 1.98 9,047 1.39 166,265 2.691999 113,789 (17.85) 10,397 1.83 2,432 1.77 3,006 (0.23) 3,051 (1.10) 8,614 (4.79) 141,289 (15.02)2000 115,186 1.23 10,761 3.50 2,477 1.85 3,024 0.60 3,151 3.28 9,243 7.30 143,842 1.812001 115,610 0.37 11,063 2.81 2,500 0.92 3,083 1.96 3,223 2.29 10,064 8.88 145,543 1.182002 125,250 8.34 11,653 5.33 2,547 1.92 3,120 1.19 3,290 2.07 9,910 (1.53) 155,770 7.03
Average 100,472 5.81 9,171 3.16 2,069 2.98 2,843 0.59 2,721 3.25 8,503 4.06 125,779 5.13Source: BAS.

Chapter 3
14
Figure 3.1 Cross trend of swine and poultry inventories with corn, rice and soybean feed consumption, Philippines, 1988-2002
020,00040,00060,00080,000
100,000120,000140,000160,000
1988
1989
1990
1991
1992
1993
1994
1995
1996
1997
1998
1999
2000
2001
2002
Year
Inve
ntor
y (m
illio
n he
ads)
0
1000
2000
3000
4000
5000
Vol
ume
('000
mt)
Swine and poultry inventory Corn feed consumption
020,00040,00060,00080,000
100,000120,000140,000160,000
1988
1989
1990
1991
1992
1993
1994
1995
1996
1997
1998
1999
2000
2001
2002
Year
Inve
ntor
y (m
illio
n he
ads)
0
100
200
300
400
500
600
Vol
ume
('000
mt)
Swine and poultry inventory Rice feed consumption
020,00040,00060,00080,000
100,000120,000140,000160,000
1988
1989
1990
1991
1992
1993
1994
1995
1996
1997
1998
1999
2000
2001
2002
Year
Inve
ntor
y (m
illio
n he
ads)
02004006008001,0001,2001,4001,6001,800
Vol
ume
(mt)
Swine and poultry inventory Soybean feed consumption
Source: BAS.
Profiles of the Local Livestock, Aquaculture, Feed Crops and Feed Milling Sectors
15
Table 3.2 Production of livestock and poultry (carcass weight), Philippines, 1988-2002
Production ('000 mt) Growth rate (%) Year
Chicken
meat Pork Beef Carabeef ChevonDuck meat Total
Chicken meat Pork Beef Carabeef Chevon
Duck meat Total
1988 225.92 713 92 65.02 32.93 5.42 1,134.29 - - - - - - -1989 208.46 804 96 69.73 35.31 5.75 1,219.25 -7.73 12.76 4.35 7.25 7.21 6.09 7.491990 229.27 896 103 51.18 42 6.09 1,327.54 9.98 11.44 7.29 -26.61 18.95 5.91 8.881991 286.87 845.19 112.3 48.58 35.31 6.51 1,334.76 25.12 -5.67 9.03 -5.08 -15.93 6.9 0.541992 356.4 845.26 115.58 52.04 36.52 7.54 1,413.34 24.24 0.01 2.92 7.12 3.43 15.82 5.891993 364.48 880.94 125.89 52.04 40.14 8.53 1,472.02 2.27 4.22 8.92 - 9.91 13.13 4.151994 376.61 921.76 135.51 52.26 41.96 9.01 1,537.11 3.33 4.63 7.64 0.42 4.53 5.63 4.421995 399.55 969.86 147.46 50.09 43.28 9.7 1,619.94 6.09 5.22 8.82 -4.15 3.15 7.66 5.391996 455.1 1,036.52 160.83 57.47 43.61 10.43 1,763.96 13.9 6.87 9.07 14.73 0.76 7.53 8.891997 496.69 1,085.54 176.64 61.37 44.03 10.39 1,874.66 9.14 4.73 9.83 6.79 0.96 -0.38 6.281998 491.23 1,123.75 182.63 65.27 44.72 10.48 1,918.08 -1.1 3.52 3.39 6.36 1.57 0.88 2.321999 496.43 1,171.76 189.93 68.71 45.93 10.47 1,983.24 1.06 4.27 4 5.27 2.71 -0.09 3.42000 533.12 1,212.54 190.16 71.61 46.73 10.52 2,064.68 7.39 3.48 0.12 4.22 1.74 0.47 4.112001 587.07 1,265.89 182.89 72.28 46.36 10.94 2,165.42 10.12 4.4 -3.82 0.93 -0.79 3.99 4.882002 627.1 1,332.35 182.81 76.47 46.48 11.06 2,276.27 6.82 5.25 -0.04 5.8 0.26 1.07 5.12
Ave. 408.95 1,007 146.24 59.83 41.69 8.86 1,674 7.9 4.65 5.11 1.65 2.75 5.33 5.12Source: BAS Selected statistics on agriculture.
Table 3.3 Chicken and duck eggs, and milk production, Philippines, 1988-2002 Chicken eggs Duck eggs Year Volume (’000 mt) Growth rate (%) Volume (’000 mt) Growth rate (%)
1988 139.99 - 27.10 - 1989 155.41 11.02 28.75 6.09 1990 165.70 6.62 30.45 5.91 1991 170.81 3.08 33.40 9.69 1992 180.52 5.68 36.75 10.03 1993 202.10 11.95 39.20 6.67 1994 196.00 (3.02) 41.60 6.12 1995 199.90 1.99 47.70 14.66 1996 205.60 2.85 54.50 14.26 1997 222.90 8.41 53.00 (2.75) 1998 227.00 1.84 53.10 0.19 1999 229.88 1.27 52.65 (0.85) 2000 243.38 5.87 53.47 1.56 2001 246.70 1.36 53.90 0.80 2002 260.82 5.72 53.60 (0.56)
Average 203.11 4.53 43.94 5.57 Source: BAS Selected Statistics on Agriculture, 1990, 1993, 1994, 2000.
3.2 Aquaculture sector
There are three types of fishing in the Philippines (NSO, 2001): (1) Commercial, covering fishing operations that make use of boats weighing more than 3 gross tons; (2) Marine municipal, covering fishing operations carried out with or without the use of boats weighing 3 gross tons or less; and (3) Aquaculture, covering fishing operations involving all forms of raising and culturing fish and other fishery species in marine, brackish and freshwater environments. Examples are fishponds, fish pens, fish cages, mussels, oysters, seaweed farms and hatcheries.
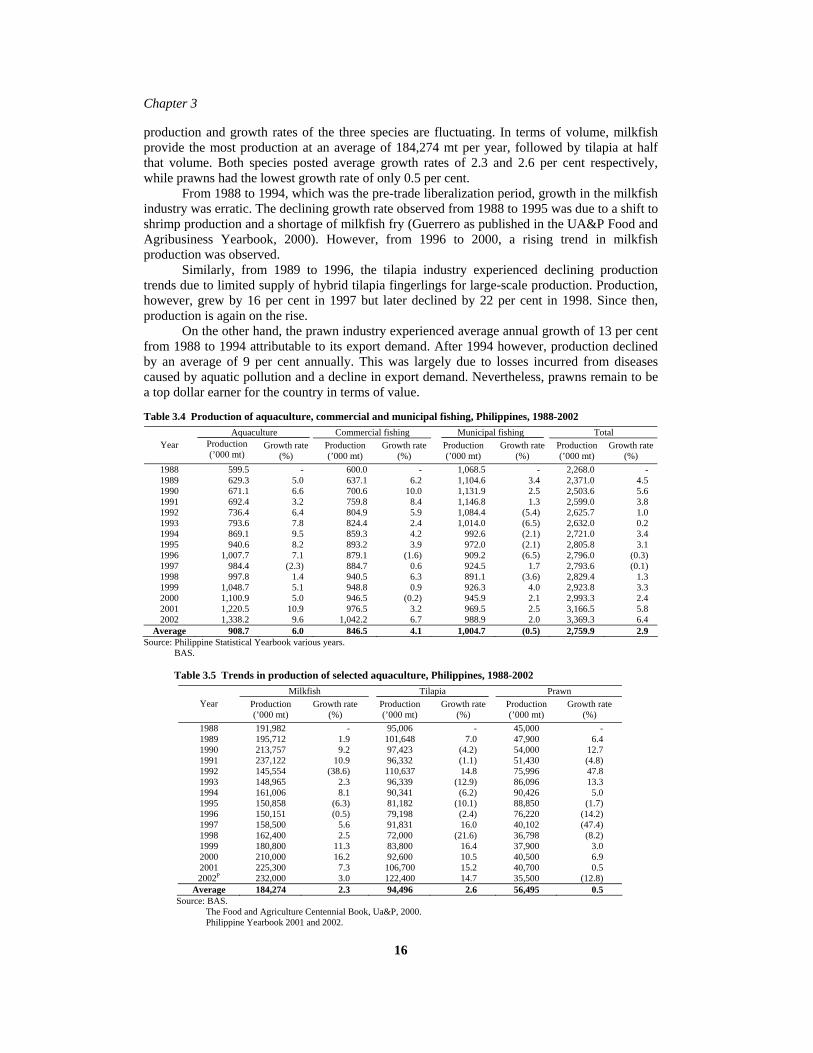
From the period of 1988 to 1995, aquaculture provided the smallest source of fish, supplying an average of 29 per cent of total fish production. However, since becoming the fastest growing sub-sector of fisheries with an average annual growth of 6 per cent for the period of 1988 to 2002 (Table 3.4), it has supplied the highest volume of fish in the market.
The production of milkfish, tilapia and prawns entail the utilization of feeds and feed ingredients. Table 3.5 shows the trends in production of the three types of species. The
Chapter 3
16
production and growth rates of the three species are fluctuating. In terms of volume, milkfish provide the most production at an average of 184,274 mt per year, followed by tilapia at half that volume. Both species posted average growth rates of 2.3 and 2.6 per cent respectively, while prawns had the lowest growth rate of only 0.5 per cent.
From 1988 to 1994, which was the pre-trade liberalization period, growth in the milkfish industry was erratic. The declining growth rate observed from 1988 to 1995 was due to a shift to shrimp production and a shortage of milkfish fry (Guerrero as published in the UA&P Food and Agribusiness Yearbook, 2000). However, from 1996 to 2000, a rising trend in milkfish production was observed.
Similarly, from 1989 to 1996, the tilapia industry experienced declining production trends due to limited supply of hybrid tilapia fingerlings for large-scale production. Production, however, grew by 16 per cent in 1997 but later declined by 22 per cent in 1998. Since then, production is again on the rise.
On the other hand, the prawn industry experienced average annual growth of 13 per cent from 1988 to 1994 attributable to its export demand. After 1994 however, production declined by an average of 9 per cent annually. This was largely due to losses incurred from diseases caused by aquatic pollution and a decline in export demand. Nevertheless, prawns remain to be a top dollar earner for the country in terms of value.
Table 3.4 Production of aquaculture, commercial and municipal fishing, Philippines, 1988-2002 Aquaculture Commercial fishing Municipal fishing Total
Year Production (’000 mt)
Growth rate (%)
Production (’000 mt)
Growth rate (%)
Production (’000 mt)
Growth rate (%)
Production (’000 mt)
Growth rate (%)
1988 599.5 - 600.0 - 1,068.5 - 2,268.0 - 1989 629.3 5.0 637.1 6.2 1,104.6 3.4 2,371.0 4.5 1990 671.1 6.6 700.6 10.0 1,131.9 2.5 2,503.6 5.6 1991 692.4 3.2 759.8 8.4 1,146.8 1.3 2,599.0 3.8 1992 736.4 6.4 804.9 5.9 1,084.4 (5.4) 2,625.7 1.0 1993 793.6 7.8 824.4 2.4 1,014.0 (6.5) 2,632.0 0.2 1994 869.1 9.5 859.3 4.2 992.6 (2.1) 2,721.0 3.4 1995 940.6 8.2 893.2 3.9 972.0 (2.1) 2,805.8 3.1 1996 1,007.7 7.1 879.1 (1.6) 909.2 (6.5) 2,796.0 (0.3) 1997 984.4 (2.3) 884.7 0.6 924.5 1.7 2,793.6 (0.1) 1998 997.8 1.4 940.5 6.3 891.1 (3.6) 2,829.4 1.3 1999 1,048.7 5.1 948.8 0.9 926.3 4.0 2,923.8 3.3 2000 1,100.9 5.0 946.5 (0.2) 945.9 2.1 2,993.3 2.4 2001 1,220.5 10.9 976.5 3.2 969.5 2.5 3,166.5 5.8 2002 1,338.2 9.6 1,042.2 6.7 988.9 2.0 3,369.3 6.4
Average 908.7 6.0 846.5 4.1 1,004.7 (0.5) 2,759.9 2.9 Source: Philippine Statistical Yearbook various years.
BAS.
Table 3.5 Trends in production of selected aquaculture, Philippines, 1988-2002 Milkfish Tilapia Prawn
Year Production (’000 mt)
Growth rate (%)
Production (’000 mt)
Growth rate (%)
Production (’000 mt)
Growth rate (%)
1988 191,982 - 95,006 - 45,000 - 1989 195,712 1.9 101,648 7.0 47,900 6.4 1990 213,757 9.2 97,423 (4.2) 54,000 12.7 1991 237,122 10.9 96,332 (1.1) 51,430 (4.8) 1992 145,554 (38.6) 110,637 14.8 75,996 47.8 1993 148,965 2.3 96,339 (12.9) 86,096 13.3 1994 161,006 8.1 90,341 (6.2) 90,426 5.0 1995 150,858 (6.3) 81,182 (10.1) 88,850 (1.7) 1996 150,151 (0.5) 79,198 (2.4) 76,220 (14.2) 1997 158,500 5.6 91,831 16.0 40,102 (47.4) 1998 162,400 2.5 72,000 (21.6) 36,798 (8.2) 1999 180,800 11.3 83,800 16.4 37,900 3.0 2000 210,000 16.2 92,600 10.5 40,500 6.9 2001 225,300 7.3 106,700 15.2 40,700 0.5 2002P 232,000 3.0 122,400 14.7 35,500 (12.8)
Average 184,274 2.3 94,496 2.6 56,495 0.5 Source: BAS.
The Food and Agriculture Centennial Book, Ua&P, 2000. Philippine Yearbook 2001 and 2002.
Profiles of the Local Livestock, Aquaculture, Feed Crops and Feed Milling Sectors
17
3.3 Feed crops
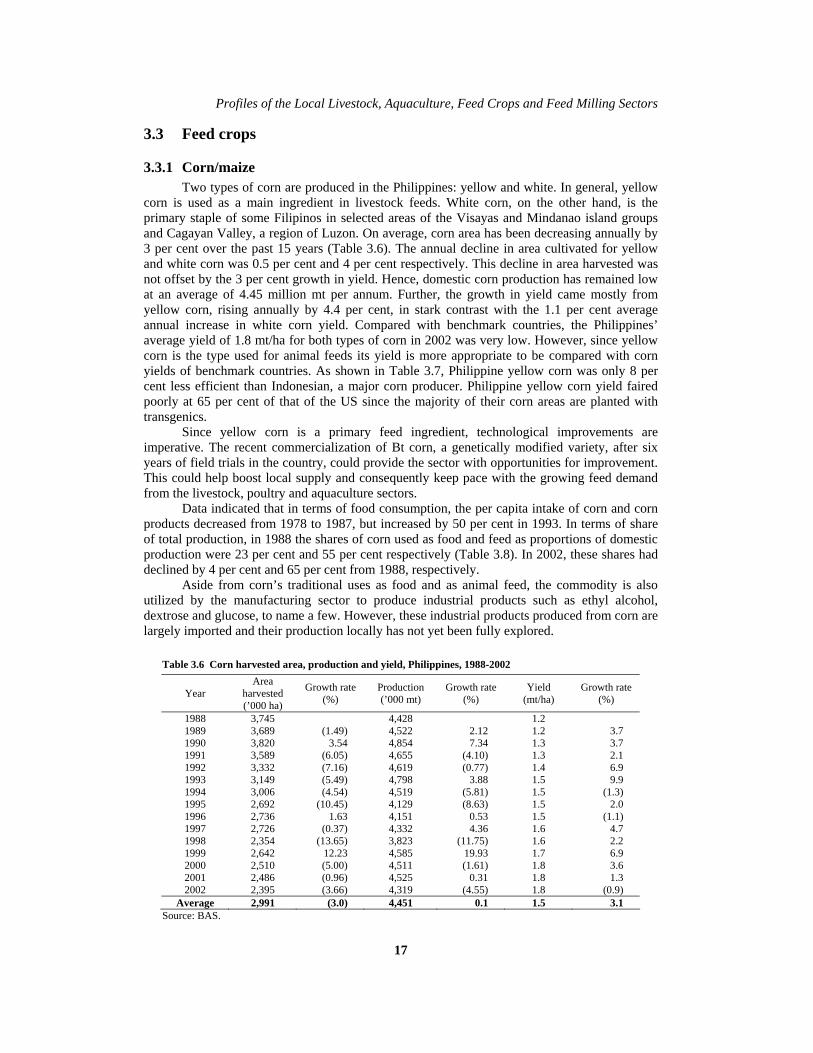
3.3.1 Corn/maize Two types of corn are produced in the Philippines: yellow and white. In general, yellow
corn is used as a main ingredient in livestock feeds. White corn, on the other hand, is the primary staple of some Filipinos in selected areas of the Visayas and Mindanao island groups and Cagayan Valley, a region of Luzon. On average, corn area has been decreasing annually by 3 per cent over the past 15 years (Table 3.6). The annual decline in area cultivated for yellow and white corn was 0.5 per cent and 4 per cent respectively. This decline in area harvested was not offset by the 3 per cent growth in yield. Hence, domestic corn production has remained low at an average of 4.45 million mt per annum. Further, the growth in yield came mostly from yellow corn, rising annually by 4.4 per cent, in stark contrast with the 1.1 per cent average annual increase in white corn yield. Compared with benchmark countries, the Philippines’ average yield of 1.8 mt/ha for both types of corn in 2002 was very low. However, since yellow corn is the type used for animal feeds its yield is more appropriate to be compared with corn yields of benchmark countries. As shown in Table 3.7, Philippine yellow corn was only 8 per cent less efficient than Indonesian, a major corn producer. Philippine yellow corn yield faired poorly at 65 per cent of that of the US since the majority of their corn areas are planted with transgenics.
Since yellow corn is a primary feed ingredient, technological improvements are imperative. The recent commercialization of Bt corn, a genetically modified variety, after six years of field trials in the country, could provide the sector with opportunities for improvement. This could help boost local supply and consequently keep pace with the growing feed demand from the livestock, poultry and aquaculture sectors.
Data indicated that in terms of food consumption, the per capita intake of corn and corn products decreased from 1978 to 1987, but increased by 50 per cent in 1993. In terms of share of total production, in 1988 the shares of corn used as food and feed as proportions of domestic production were 23 per cent and 55 per cent respectively (Table 3.8). In 2002, these shares had declined by 4 per cent and 65 per cent from 1988, respectively.
Aside from corn’s traditional uses as food and as animal feed, the commodity is also utilized by the manufacturing sector to produce industrial products such as ethyl alcohol, dextrose and glucose, to name a few. However, these industrial products produced from corn are largely imported and their production locally has not yet been fully explored.
Table 3.6 Corn harvested area, production and yield, Philippines, 1988-2002
Year Area
harvested (’000 ha)
Growth rate (%)
Production (’000 mt)
Growth rate (%)
Yield (mt/ha)
Growth rate (%)
1988 3,745 4,428 1.2 1989 3,689 (1.49) 4,522 2.12 1.2 3.7 1990 3,820 3.54 4,854 7.34 1.3 3.7 1991 3,589 (6.05) 4,655 (4.10) 1.3 2.1 1992 3,332 (7.16) 4,619 (0.77) 1.4 6.9 1993 3,149 (5.49) 4,798 3.88 1.5 9.9 1994 3,006 (4.54) 4,519 (5.81) 1.5 (1.3) 1995 2,692 (10.45) 4,129 (8.63) 1.5 2.0 1996 2,736 1.63 4,151 0.53 1.5 (1.1) 1997 2,726 (0.37) 4,332 4.36 1.6 4.7 1998 2,354 (13.65) 3,823 (11.75) 1.6 2.2 1999 2,642 12.23 4,585 19.93 1.7 6.9 2000 2,510 (5.00) 4,511 (1.61) 1.8 3.6 2001 2,486 (0.96) 4,525 0.31 1.8 1.3 2002 2,395 (3.66) 4,319 (4.55) 1.8 (0.9)
Average 2,991 (3.0) 4,451 0.1 1.5 3.1 Source: BAS.

Chapter 3
18
Table 3.7 Corn yield (mt/ha) among benchmark countries and the Philippines, 1988-2002 Country 1988 1991 1994 1997 2000 2002 Average
Philippines 1.18 1.30 1.50 1.59 1.80 1.80 1.53 Yellow corn 1.57 1.74 2.13 2.39 2.80 2.83 2.24 White corn 1.04 1.12 1.12 1.11 1.20 1.20 1.13 Major country player USA 5.31 6.82 8.70 7.95 8.59 8.16 7.59 China 3.93 4.58 4.70 4.39 4.60 4.93 4.52 Southeast Asian counterparts Indonesia 1.95 2.15 2.21 2.61 2.76 3.09 2.46 Thailand 2.62 2.71 2.93 3.20 3.69 3.68 3.14 Sources: BAS and FAO.
Table 3.8 Corn supply and utilization accounts, Philippines, 1988-2002 Supply (’000 mt) Utilization (’000 mt)
Year Beginning stock
Production Imports
Total supply Exports Seed Waste and
processing Feed Food Per capita (kg)
Total use
Ending stock
1988 230 4,428 25.0 4,683 0.1 75 1,165 2,428 1,027 17.7 4,695 293 1989 293 4,522 173.0 4,988 0.1 74 1,146 2,513 1,130 19.0 4,863 138 1990 138 4,854 345.5 5,338 0.1 76 1,213 2,601 845 13.9 4,735 602 1991 602 4,655 0.3 5,257 20.1 72 1,164 2,677 864 13.9 4,797 459 1992 462 4,619 0.6 5,082 - 67 1,155 2,828 970 15.2 5,020 237 1993 235 4,798 0.7 5,034 0.0 63 1,200 2,954 1,009 15.4 5,226 204 1994 208 4,519 0.9 4,728 0.0 60 1,092 3,044 958 14.3 5,154 217 1995 217 4,129 208.0 4,554 0.1 54 963 3,254 735 10.7 5,006 190 1996 190 4,151 405.4 4,746 0.0 55 934 3,457 731 10.5 5,177 260 1997 260 4,332 307.6 4,900 0.0 55 939 3,631 756 10.6 5,381 323 1998 323 3,823 462.1 4,608 0.2 49 797 3,681 834 11.4 5,361 471 1999 471 4,585 149.5 5,205 0.1 53 917 3,480 885 11.8 5,335 238 2000 238 4,511 446.4 5,195 0.3 50 902 3,650 907 11.9 5,509 190 2001 190 4,525 171.8 4,886 0.2 50 905 3,725 943 12.1 5,623 177 2002 177 4,319 278.2 4,775 0.4 48 912 3,906 965 12.1 5,831 233
Average 282 4,451 198 4,932 1 60 1,027 3,189 904 13 5,181 249 Source: DA Corn Program.
3.3.2 Palay/rice Rice (milled rice) is the most important cereal in the country being the staple food of
Filipinos. Its by-product i.e. rice bran is considered a major feed ingredient and is estimated to be 10 per cent of the total palay or paddy weight (unmilled rice).
In 2002, rice dominated the total Philippine area planted to crops. The total harvested area of rice amounted to 3.6 million ha which was 31.5 per cent of the total area planted to crops (Table 3.9). For the 15-year period 1988-2002, the national rice yield average of 2.89 mt/ha translated to an average annual production of 10.5 million mt. A significant decline in production by 24 per cent, however, was observed in 1998 due to El Niño. Nevertheless, improvements in yield have been generally observed throughout the 15-year period, with the 2002 yield level registering 3.28 mt/ha; mainly due to the introduction of hybrid rice and to the increase in cropping intensity (e.g. increase in irrigated areas, fertilization, and intensified cropping, among others). Compared with benchmark countries, i.e. major exporting and producing countries of rice, the improvements in Philippine rice yield have brought the Philippines close to Viet Nam and overtaken Thailand and India (Table 3.10).
Rice is consumed mainly as food. Other secondary uses such as for processing and feeds comprise only 5 per cent of the total rice supply (Table 3.11). Although the country exported rice during its self-sufficient years of 1991, 1992 and 1994, the Philippines remains a net importer since local production has not yet been augmented to meet domestic demand. Mangabat (1998) noted that the “deficiency years were associated with the occurrence of severe droughts, typhoons and floods. Conversely, the surplus years coincided with periods of relatively good weather.” This shows how the performance of domestic feed crop production has been very vulnerable to changing weather conditions.

Profiles of the Local Livestock, Aquaculture, Feed Crops and Feed Milling Sectors
19
Table 3.9 Rice harvested area, production and yield, Philippines, 1988-2002
Year Area harvested (’000 ha)
Growth rate (%)
Production (’000 mt)
Growth rate (%)
Yield (mt/ha)
Growth rate (%)
1988 3,393 - 8,971 - 2.64 - 1989 3,497 3.1 9,459 5.4 2.70 2.3 1990 3,319 (5.1) 9,319 (1.5) 2.81 3.8 1991 3,425 3.2 9,673 3.8 2.82 0.6 1992 3,198 (6.6) 9,129 (5.6) 2.85 1.1 1993 3,282 2.6 9,434 3.3 2.87 0.7 1994 3,652 11.2 10,538 11.7 2.89 0.4 1995 3,759 2.9 10,541 0.0 2.80 (2.8) 1996 3,951 5.1 11,284 7.0 2.86 1.8 1997 3,842 (2.8) 11,269 (0.1) 2.93 2.7 1998 3,170 (17.5) 8,555 (24.1) 2.70 (8.0) 1999 4,000 26.2 11,787 37.8 2.95 9.2 2000 4,038 1.0 12,389 5.1 3.07 4.1 2001 4,065 0.7 12,955 4.6 3.19 3.9 2002 4,046 (0.5) 13,271 2.4 3.28 2.9
Average 3,642 1.7 10,572 3.6 2.89 1.6 Source: BAS.
Table 3.10 Palay yield (mt/ha) among benchmark countries and the Philippines, 1988-2002 Country 1988 1991 1994 1997 2000 2002 Average Philippines 2.64 2.82 2.89 2.93 3.07 3.28 2.94 Major country players USA 6.18 6.42 6.69 6.61 7.04 7.37 6.72 China 5.28 5.62 5.83 6.31 6.26 6.19 5.92 India 2.55 2.63 2.86 2.85 2.85 2.69 2.74 Southeast Asian counterparts Viet Nam 2.96 3.11 3.57 3.88 4.24 4.55 3.72 Thailand 2.15 2.25 2.35 2.35 2.62 2.60 2.39 Sources: BAS and FAO.
Table 3.11 Rice supply and utilization accounts, Philippines, 1988-2002 Supply (’000 mt) Utilization (’000 mt)
Year Beginning stock Production Imports
Total supply Exports Seed
Feed and
waste Processing Food
Per capita (kg)
Total use
Ending stock
1988 1,575 5,867 181 7,623 - 166 381 5,558 95.5 6,105 1,518 1989 1,518 6,186 196 7,900 16.0 172 402 5,637 94.7 6,227 1,690 1990 1,690 6,095 606 8,390 - 163 396 5,932 97.7 6,491 1,899 1991 1,899 6,326 0 8,225 10.0 168 411 5,519 88.5 6,108 2,120 1992 2,120 5,970 1 8,091 35.1 157 388 239 5,579 87.4 6,397 1,673 1993 1,673 6,170 202 8,045 - 161 401 247 5,813 89.0 6,622 1,444 1994 1,444 6,892 0 8,336 - 179 448 276 5,932 88.7 6,834 1,498 1995 1,498 6,894 264 8,656 - 184 448 276 6,326 92.2 7,235 1,422 1996 1,422 7,379 867 9,669 - 194 480 295 6,907 98.7 7,876 1,793 1997 1,793 7,370 722 9,885 - 189 479 295 6,949 97.1 7,911 1,979 1998 1,979 5,595 2,171 9,745 - 156 364 224 6,715 91.8 7,458 2,279 1999 2,279 7,708 834 10,822 0.3 196 501 308 7,466 99.9 8,471 2,365 2000 2,365 8,103 639 11,106 0.2 198 527 324 7,891 103.1 8,940 2,166 2001 2,166 8,472 808 11,447 - 199 551 339 8,073 103.6 9,162 2,285 2002 2,285 8,679 1,196 12,160 - 199 564 347 8,441 106.2 9,551 2,609 Ave. 1,847 6,914 579 9,340 4.1 179 449 288 6,582 95.6 7,426 1,956
Source: BAS.
Further, based on surveys conducted by FNRI during 1978 to 1993, per capita consumption for rice and rice products declined by an average of 3 per cent. This situation proved that although production was increasing it was not enough to offset the supply deficit problem of the country since other non-food uses of rice were also picking up. “To some extent, deficiencies in the domestic supply of rice were absorbed by the food sector” (Mangabat, 1998) as proven by the dropping per capita rice consumption during the deficit years. These deficit

Chapter 3
20
years were associated with limited imports. Conversely, succeeding years after this period show a rising trend of per capita intake of rice.
3.3.3 Soybean Soybean is a minor crop in the country, cultivated mainly on small-scale and multi-crop
farms. For the past 15 years, the average annual area planted to soybean has been only 2,032 ha with an annual production of 2,224 mt (Table 3.12). Both area and production decreased beginning in the mid-1990’s. Productivity was low mainly because of the high costs of inputs and the low levels of technology adoption (low input use) by the farmers. This, in turn, translated into low yield growth. The Philippine soybean yield, however, was comparable with some major producing and exporting countries like Viet Nam and Indonesia (Table 3.13). In contrast, the country’s soybean yield fairs poorly against USA and Argentina - the major sources of the country’s soybean imports.
On average, local soybean production accounts for only 2 per cent of the total supply. Imports perennially supply the domestic needs of the country (Table 3.14). Soybean is primarily used as an ingredient in the processing of sauces, curds, snack foods, milk and edible oils. The processing sector uses 73 per cent of total soybean supply. Soybean used as food and feed comprises 26 per cent and 1 per cent of the total supply, respectively. The imported soybean meal which constitutes the bulk of the country’s agricultural imports, however, was not incorporated in the supply and utilization accounts. Hence, the amount of soybean actually used as feed was greater than the amount reflected in Table 3.14.
Table 3.12 Soybean harvested area, production and yield, Philippines, 1988-2002
Year Area harvested (ha)
Growth rate (%)
Production (mt)
Growth rate (%)
Yield (kg/ha)
Growth rate (%)
1988 5,154 - 6,000 - 1,164 - 1989 4,753 (7.8) 3,939 (34.4) 829 (28.8) 1990 4,050 (14.8) 3,499 (11.2) 864 4.2 1991 2,116 (47.8) 2,284 (34.7) 1,079 24.9 1992 1,652 (21.9) 1,809 (20.8) 1,095 1.4 1993 1,772 7.3 2,133 17.9 1,204 9.9 1994 1,888 6.5 2,361 10.7 1,251 3.9 1995 2,292 21.4 2,983 26.3 1,301 4.1 1996 1,547 (32.5) 1,818 (39.1) 1,175 (9.7) 1997 1,245 (19.5) 1,615 (11.2) 1,297 10.4 1998 869 (30.2) 1,048 (35.1) 1,206 (7.0) 1999 856 (1.5) 1,041 (0.7) 1,216 0.8 2000 774 (9.6) 953 (8.5) 1,231 1.2 2001 737 (4.8) 897 (5.9) 1,217 (1.2) 2002P 776 5.3 985 9.8 1,269 4.3
Average 2,032 (10.7) 2,224 (9.8) 1,160 1.3 Source: CGPRT Crops in the Philippines: A Statistical profile, 2001.
BAS. FAO.
Table 3.13 Soybean yield (mt/ha) among benchmark countries and the Philippines, 1988-2002 Country 1988 1991 1994 1997 2000 2002 Average Philippines 1.16 1.08 1.25 1.30 1.23 1.27 1.22 Major country players USA 1.82 2.30 2.78 2.62 2.56 2.54 2.44 Argentina 2.26 2.28 2.04 1.72 2.34 2.64 2.21 Southeast Asian counterparts Indonesia 1.08 1.14 1.11 1.21 1.23 1.24 1.17 Viet Nam 0.83 0.79 0.94 1.06 1.20 1.27 1.02 Thailand 1.32 1.37 1.33 1.43 1.38 1.42 1.37 Sources: BAS and FAO.

Profiles of the Local Livestock, Aquaculture, Feed Crops and Feed Milling Sectors
21
Table 3.14 Soybean supply and utilization accounts, Philippines, 1988-2002 Supply (mt) Utilization (mt)
Year Production Imports Total
supply Exports Seed Feed and waste Processing Food Per capita
(kg) Total use
1988 6,000 24,000 30,000 1,000 - 145 21,170 7,684 0.13 29,999 1989 3,939 28,758 32,697 46 - 163 23,835 8,639 0.15 32,683 1990 3,499 24,036 27,535 41 13 137 20,071 7,272 0.12 27,535 1991 2,284 63,247 65,531 - 10 328 47,838 17,356 0.28 65,532 1992 1,809 51,893 53,702 - 7 269 39,202 14,224 0.22 53,701 1993 2,133 61,567 63,700 - 8 319 46,501 16,873 0.26 63,700 1994 2,361 135,523 137,884 - 8 689 100,655 36,531 0.55 137,883 1995 2,983 86,877 89,860 - 10 449 65,598 23,803 0.35 89,860 1996 1,818 137,785 139,603 - 7 698 101,910 36,988 0.53 139,603 1997 1,615 111,052 112,667 - 6 563 82,247 29,851 0.42 112,668 1998 1,048 148,241 149,289 - 4 746 108,981 39,558 0.54 149,289 1999 1,041 262,594 263,635 - 4 1,318 192,454 69,859 0.93 263,635 2000 953 249,185 250,138 - 3 1,251 182,601 66,283 0.87 250,138 2001 897 315,165 316,062 - 3 1,580 230,725 83,753 1.07 316,061 2002 985 257,101 258,086 - 3 1,290 188,403 68,389 0.86 258,085
Average 2,224 130,468 132,693 72 6 663 96,813 35,137 0.48 32,691 Source: BAS.
3.4 The feed milling sector
3.4.1 Production capacity As of 2002, there were 425 registered feed mills in the country, 300 of which were
classified as commercial mills (Table 3.15) while the rest consisted of non-commercial manufacturers (home mixers and integrators). The number of participating feed-related establishments (mixed feed and feedstuff manufacturers, importers, suppliers, distributors, and retailers) in the feed milling industry totaled to 4,560 in the same year. Of these, 76 per cent were feed distributors and retailers.
In terms of the number of commercial feed mills by scale, the majority (48 per cent) belonged to the group with production capacity less than 20 mt (Table 3.16). This was followed by large commercial feed mills with 28 per cent and medium-scale feed mills (20 to 50 mt production capacity) with 24 per cent of total registered commercial feed mills. Although large-scale commercial feed mills constituted only 28 per cent of the total number of feed manufacturers, they accounted for approximately 82 per cent of the total Philippine registered rated capacity of 20,363 mt per eight hour shift in 2002.
For the period of 1990-1993, the number of commercial feed mills increased. In 1994, this number declined by 10 per cent because of the Foot and Mouth Disease (FMD) outbreak in swine, which caused unstable demand for feed. Since 1995, the number of feed mills has increased, except for a 9 per cent decline in 2001 attributed to a significant depreciation of the peso (AFSD, BAI, 2002). This was because the industry relies heavily on imported feed ingredients such as soybean and soybean by-products, feed wheat, and corn meal. According to BAI (2002), feed millers have to form associations in order to achieve certain economies of scale and effect some cost savings. In fact, the top ten feed producers are members of the Philippine Association of Feed Millers.
In 2002, the majority (66 per cent) of the commercial feed mills were located on the large island of Luzon, most particularly in Central Luzon (30 per cent), Southern Tagalog (22 per cent), and the National Capital Region (14 per cent) in Table 3.17. The feed mills located in these regions provided 73 per cent of the total feed mill capacity in the Philippines as 197 of the 300 firms were situated there. Ironically, the major island of Mindanao only accounted for 6 per cent of the total feed production capacity in the country although it produced approximately 60 per cent of total corn produced in 2002. Though Mindanao produced a large volume of corn, feed millers opted to locate their plants in Luzon since most of the commercial livestock raisers are in that area. The millers therefore incur higher transport costs on inputs but are able to save

Chapter 3
22
on distribution costs. Further, the peace and order situation in Mindanao also contributed to this decision.
Table 3.15 Registered feed establishments, Philippines, 2002 Establishment 2002 Commercial (mixed) manufacturer 300 Non-commercial manufacturer 125 Feed ingredient manufacturer 69 Importer 369 Supplier 220 Distributor 1,027 Retailer 2,450
Total 4,560 Source: AFSD, BAI.
Table 3.16 Number of commercial feed mills by size, Philippines, 1990-2002 Rated capacity per 8-hr shift 1990 1991 1992 1993 1994 1995 1996 1997 1998 1999 2000 2001 2002
20 and below 124 118 146 171 141 138 106 131 132 132 162 136 14320.1 - 50 33 43 47 53 55 59 64 68 69 69 74 73 7250.1 and above 23 28 24 28 31 52 52 69 73 79 83 80 85Total 180 189 217 252 227 249 222 268 274 280 319 289 300Source: AFSD, BAI.
Table 3.17 Geographical distribution of commercial feed mills, rated capacities and corn production by region, 2002
Commercial Rated Corn Region No. % capacity/8hr
Distribution (%) production*
shift (’000 mt) NCR 41 13.67 4,555.00 22.37 0.00 I. Ilocos 8 2.67 1,542.00 7.57 182.27 II. Cagayan Valley 6 2.00 500.00 2.46 832.33 III. Central Luzon 89 29.67 7,009.16 34.42 122.67 IV. Southern Tagalog 67 22.33 3,307.50 16.24 103.66 V. Bicol 10 3.33 332.00 1.63 73.86 VI. Western Visayas 12 4.00 466.00 2.29 87.25 VII. Central Visayas 24 8.00 1,311.05 6.44 167.16 VIII. Eastern Visayas 3 1.00 100.50 0.49 49.67 IX. Zamboanga Peninsula 4 1.33 57.50 0.28 135.19 X. Northern Mindanao 8 2.67 228.00 1.12 701.02 XI. Davao Region 17 5.67 775.60 3.81 181.84 XII. Soccsksargen 10 3.33 177.00 0.87 885.02 XIII. Caraga 1 0.33 2.00 0.01 68.24 Total 300 100 20,363.31 100 3,590.18
Source: AFSD, BAI and BAS. * Total corn production does not add up to BAS corn production data of 4.3 M mt of corn (2002).
The reason for this is that the regions of ARMM and CAR are not included because they focus more on white corn production.
3.4.2 Local feed ingredient production A shift in the production of ingredients for feeds in favour of zeolite was observed from
1988 to 2001 (Table 3.18). While local bone meal production as a feed ingredient remained stable, the production of copra meal, corn and corn by-products and minerals substantially decreased. Likewise, the manufacture of fish meal and feed supplements/additives/premixes declined in 1988 to 1992 but rose significantly from 1997 to 2001.
Despite the general decline in the domestic production of feed ingredients, the swine and poultry sectors have been able to register robust growth over the past decade, relying on feed substitutes and increasing imports of major feed ingredients. Even wheat for food, which was

Profiles of the Local Livestock, Aquaculture, Feed Crops and Feed Milling Sectors
23
levied lower tariffs, started to be used. The inclusion of imported feed wheat in livestock feed formulations, as estimated by analysts ranged from 0.8 to 1.2 million mt. This may be reflected as lost potential revenue for corn farmers (AgriSource, 2001).
Table 3.18 Local feed ingredient production (in mt), Philippines, 1988-2001 Feedstuff 1988 1992 1997 2001p Feed supplement/additives/premixes 4,514.00 1,962.20 1,822.38 3,879.42 Bone meal - 783.40 412.50 679.22 Copra meal 30,521.85 14,031.87 446.00 699.44 Corn and corn products 17,225.00 15,764.21 8,312.96 8,221.42 Fish meal 3,823.03 3,636.45 1,504.05 2,792.40 Ipil ipil 435.00 490.91 - - Minerals 16,653.18 3,231.00 6,665.47 7,299.47 Yeast 14.00 1,948.06 - - Zeolite - 1,884.00 5,407.69 4,007.21 Source: AFSD, BAI.
3.4.3 Mixed feed production In keeping with the growth of the livestock and poultry sectors, the production of
commercial mixed feed also steadily grew, by 15 per cent from 1988-1999 (Table 3.19). Highest growth was registered in 1997, when a 48 per cent increase from the previous year’s production was observed. This coincided with an increase of 21 per cent in the number of feed mills during the same period. However, in 2000, a decline of 51 per cent from 1999’s production level was observed because of the downsizing of the poultry industry and a slump in yellow corn production. From 2000 to 2002, the mixed feed sector posted an average increase of 29 per cent annually. In 2002, of the total mixed feed production of 2.9 million mt, swine feeds dominated (49 per cent), followed by poultry feeds (35 per cent) and aquaculture feeds (8 per cent) in Figure 3.2. Specialty feeds for cattle, carabao (water buffalo), duck, and quail, among others accounted for 8 per cent of the total mixed feed produced.
Further, it was revealed that from 2000 to 2002, most types of feeds registered higher annual increases than their yearly growth from 1988 to1992 (Table 3.20). This is proof of the robust growth of the swine, poultry and aquaculture sectors.
Table 3.19 Commercial mixed feed production, Philippines, 1988-2002 Year Production (mt) Growth rate (%) 1988 940,220 - 1989 962,467 2.37 1990 1,061,079 10.25 1991 1,178,960 11.11 1992 1,362,856 15.60 1993 1,468,545 7.76 1994 1,546,263 5.29 1995 1,637,982 5.93 1996 1,837,162 12.16 1997 2,714,476 47.75 1998 2,854,915 5.17 1999 3,644,433 27.65 2000 1,768,604 (51.47) 2001 2,081,050 17.67 2002 2,925,522 40.58
Average 1,865,149 11.3 Source: AFSD, BAI.

Chapter 3
24
Figure 3.2 Commercial feed production by type, Philippines, 2002
Poultry 34.98%
Swine48.65%
Aqua 8.44%
Others7.93%
Source: Author’s own calculation.
Table 3.20 Commercial feed production by type of feed, Philippines, 1988-2002 Poultry Swine Aqua Others Total
Year Volume (mt)
Growth (%)
Volume (mt)
Growth (%)
Volume (mt)
Growth (%)
Volume (mt)
Growth (%)
Volume (mt)
Growth (%)
1988 457,754 387,759 28,057 66,649 940,220 1989 442,780 (3.27) 436,905 12.67 27,910 (0.52) 54,872 (17.67) 962,467 2.37 1990 431,483 (2.55) 502,040 14.91 42,658 52.84 84,898 54.72 1,061,079 10.25 1991 503,308 16.65 499,843 (0.44) 57,497 34.79 118,312 39.36 1,178,960 11.11 1992 548,090 8.90 614,149 22.87 54,074 (5.95) 146,542 23.86 1,362,856 15.60 2000 617,708 12.70 952,239 55.05 69,934 29.33 128,723 (12.16) 1,768,604 29.77 2001 812,905 31.60 1,000,011 5.02 140,224 100.51 127,909 (0.63) 2,081,050 17.67 2002 1,023,344 25.89 1,423,126 42.31 246,999 76.15 232,053 81.42 2,925,522 40.58
Average (1988-1992) 476,683 4.93 488,139 12.50 42,039 20.29 94,255 25.07 1,101,116 9.83
(2000-2002) 817,986 23.40 1,125,125 34.13 152,385 68.66 162,895 22.88 2,258,392 29.34
Source: AFSD, BAI. Note: For the years 1993-1996: inconsistent data.
For the years 1997-1999: lost data/unavailable.
3.4.4 Problems confronting the feed milling sector The Livestock Development Council (LDC) sums up the major problem of the feed
milling industry into two aspects: shortages or supply constraints of raw materials and the problems associated with the procurement of these raw materials.
Shortages of raw materials such as corn is the central problem of the feed milling industry. This problem widens the gap between supply and demand for feeds, which results in an increase in feed crop prices. The situation is further aggravated by the lack of storage facilities of the feed milling companies. Further, the uncertainty in the supply of major feed raw materials from domestic sources has caused the underutilization of most feed mills.
Regarding the procurement of inputs, it is the small-scale feed millers who have difficulty procuring raw materials. Although the NFA is supposed to ensure availability to all, it is usually the big feed milling firms that benefit from the government’s procurement system for grains. Other procurement-related problems cited by the LDC include: 1) volatility of prices due to seasonal supply and the perishability of stock; 2) tight or limited access to credit giving companies and very little elbow room for adjustments in financial allocations; 3) late deliveries, affecting the operations of companies and causing additional expenses as some companies opt to collect the supplies themeselves; 4) adulteration such that low protein fish meal is added to high protein content fish meal, starch to amino acids and vitamin-mineral premixes, and sand, soil, and wires are combined with raw materials to increase the mixed feed weight and receive higher returns; and 5) aflatoxin, disease and mold contamination of raw materials.

Profiles of the Local Livestock, Aquaculture, Feed Crops and Feed Milling Sectors
25
3.5 Policies affecting the agro-industrial and feedstuff processing industries
Like other countries, the feed control programme of the Philippines has three components: laws, regulations and administrative procedures. These components are closely tied together and are used to safeguard feed users and ultimately public consumers (PCARRD, 2004). In the Philippines, the major provisions of the feed law are: 1) registration and guarantees; 2) labeling; 3) creation of the Animal Feed Control Division (currently called the Animal Feeds Standard Division by virtue of Executive Order no. II-6 promulgated in 1986) and Animal Feed Control Advisory Committee (now the Animal Feed Standardization Committee) in the Bureau of Animal Industry (BAI); 4) inspection and sampling; 5) laboratory analysis and the publication of results; 6) quality control services; and 7) penalties and other enforcement procedures.
The BAI is mandated to implement these laws and regulations that affect the agro-
industrial and commercial feed industries. These are: 1. R.A. 1556, known as the “Livestock and Poultry Feeds Act,” and its implementing
rules and regulations (Animal Industry Administrative Order Nos. 35, 35A and 40; and General Memorandum Order No. 1);
2. R.A. 3720, as amended by Executive Order No. 175, otherwise known as the “Food, Drugs and Devices and Cosmetics Act,” and its implementing rules and regulations; and
3. R.A. 6675, more known as the “Generic Acts of 1998.” These laws and regulations are administered and implemented by the Secretary of
Agriculture through the Director of the BAI. On the other hand, the Animal Feeds Standards Division (AFSD) of BAI, oversees the manufacture, importation, distribution, advertisement and sale of livestock, poultry, aqua and specialty feeds, veterinary drugs, and chemical feed additives.
3.6 Agricultural policies
Republic Act 8435 or the Agriculture and Fisheries Modernization Act (AFMA) is the main law that aims to strengthen the agricultural and fisheries sectors through modernization, greater participation of stakeholders, food security, private sector participation, and people empowerment (DA, 2001).
The Ginintuang Masaganang Ani (GMA) is the banner programme of the Department of Agriculture of the Philippines in order to actualize AFMA. It has several programme components, which include: 1) production support services; 2) research and development; 3) infrastructure support; 4) rural finance; 5) marketing support services; 6) training extension; and 7) programme organization and management. Also, the GMA programme has commodity specific programmes like GMA-Corn, GMA-Livestock, and GMA-Rice, among others. Ultimately, this programme aims to achieve modernized and productive agricultural and fisheries sectors - ones that are able to provide food at affordable prices to all (DA, 2001). However, budgetary constraints hamper the implementation of most sub-programme components.
The GMA-Corn and the GMA-Rice programmes ultimately aim to “increase the productivity and production of quality corn and rice and to improve farmers’ income and quality of life” (DA, 2005) to attain the food security agenda of the government. One strategy of this programme to attain its major objective is through the Hybrid Corn and Rice Area Expansion Program.

Chapter 3
26
Specifically, the GMA Corn and Rice programmes intend to: 1) increase farm productivity through the promotion of cost-effective technologies and the conservation and management of natural resources; 2) stabilize prices at levels reasonable to farmers, consumers and other end users; 3) improve profitability of rice and corn farming; 4) provide a favourable policy conducive to increased agricultural investments and global competitiveness; and 5) improve and institutionalize linkages between the DA, LGUs, non-government organizations (NGOs), state colleges and universities (SCUs), and the private sector.
A recent assessment of the GMA-Rice programme revealed that the programme benefited rice farmers to such an extent that the rice yields of farmers who were programme beneficiaries were 1.10 mt higher than non-programme beneficiaries (DA, 2005). The study also showed that a large number of programme farmers availed of seed and fertilizer subsidies.
3.7 General marketing and trade policies
3.7.1 Monetary and exchange rate policies During the 1970s and the early 1980s, the government adopted a fixed exchange rate
policy in order to promote the growth of the industrial sector which was import-dependent for its inputs. This industry-biased policy negatively affected the growth of the agricultural sector. Thus, in the late 1980s and 1990s the government started to implement liberalization policies. At present, the country maintains a managed exchange rate float and an inflation rate targeting policy to reduce the Philippine economy’s vulnerability to external shocks.
A detailed analysis of the impact of these macroeconomic policies on patterns of agricultural growth and development is limited. However, as Costales (1997) stated, “as long as agriculture still contributes a relatively significant portion to national output and employment, changes in macroeconomic policies will have real and discernible effects on primary agricultural activities and on the income of households directly and indirectly involved in them.”
3.7.2 State trading enterprise The sole state enterprise responsible for the procurement and distribution governing the
grains sub-sector is the National Food Authority (NFA). It is also the only body with a strong price policy mandate specifically on rice. Their mandate involves actual procurement from small farmers to farmer organizations with a government support price. Likewise, this institution is tasked with monitoring and enforcing other rules and regulations for the grains business. In general, the NFA is the government body mandated to: 1) ensure stable prices of grains that will be beneficial to both consumers and producers; and 2) provide accessible and available food to all Filipinos.
However, an assessment made by the Congressional Planning and Budget Department (CPBD) revealed that “the present rice policy and NFA rice price interventions have been costly to Philippine society; productivity losses, consumer welfare losses and financial losses to the government total about P 26 B (US$ 464 million) per year (1996-1998).” Hence, the government has been looking into the “possibility of restructuring, streamlining or privatizing certain activities of the NFA” (NFA, 2005).
3.7.3 Trade policies Three major trade agreements that are crucial to the agricultural sector are the ASEAN
Free Trade Area (AFTA), the Asia Pacific Economic Cooperation (APEC), and the General Agreement on Tariffs and Trade-Uruguay Round (GATT-UR). However, GATT implementation is currently encountering some problems due to the contentious issue between

Profiles of the Local Livestock, Aquaculture, Feed Crops and Feed Milling Sectors
27
developed and less developed countries regarding the subsidies of developed nations on their agricultural sectors.
In general, the Philippines has been complying with its external commitments to the trade agreements. These include provisions on market access and sanitary and phytosanitary measures (SPS). However, the country is lagging behind its domestic commitments, especially on infrastructure support and safety nets to the agricultural sector due to financial constraints.
3.7.3.1 Impact of trade policies on corn Corn was protected through QRs before the trade liberalization policies of the
government. Due to the importance of corn as a primary feed ingredient, it had strong lobbyists (especially livestock and poultry producers) for the acceleration of liberalization within this sector. Corn farmers, on the other hand, argue their right to unfair competition and for government protection and support.
Unlike rice, corn import liberalization policy used minimum access volume (MAV) tariff bindings with in-quota and out-quota tariffs. Corn MAV for 2004 was 216,940 mt with a 35 per cent tariff. Although corn imports have been liberalized, NFA still functions as the main importer of corn to be utilized as feed.
Corn farmers are also uncompetitive under a liberalized trading regime. The problem is related to a lack of production and marketing support services crucial to the development of the sector. AgriSource (2001) conducted a study to determine the potential benefits and losses from liberalizing corn. Results indicate that the gains from liberalizing corn trade far outweigh the losses. The gains are mainly due to the potential livestock and poultry expansion as a result of cheaper corn prices. However, “tariff reductions will displace several thousand corn producers, particularly those with yields of less than 2.5 mt per hectare” (AgriSource, 2001). What is crucial is properly attending to the losses of farmers to avoid any destabilizing effects on the economy.
3.7.3.2 Impact of trade policies on rice Before the GATT-UR, AFTA-Common Effective Preferential Tariff (CEPT), and APEC,
the Philippine government imposed non-tariff or quantitative restrictions (QRs) on rice importation to protect domestic producers. These QRs were put in place through Presidential Decree (PD) No. 4 and were “reinforced by the Magna Carta for Small Farmers in 1992 (Mangabat, 1998). Mangabat (1998) also cites Department of Agriculture Administrative Order No. 23 issued in 1993 imposing QRs on products directly competing with local produce which include rice and rice products. The rice industry is very much a protected industry. It’s tariffication under the WTO was delayed and the Philippines invoked Annex 5 of the WTO agreement, which allows a member country to defer tariffication of QRs for politically sensitive staple foods. On the other hand, high import tariff rates were requested under the AFTA-CEPT. Rice QRs are scheduled to be removed and replaced with tariffs in 2004 in compliance with GATT-UR commitments. Under the AFTA-CEPT, no final tariff schedule has been agreed. The DA though recommends a beginning tariff rate of 100 per cent in 2005 and an ending tariff rate of 50 per cent by 2010 (Mangabat, 1998).
Reviewing data on domestic and world rice prices showed that in 2002, the domestic price of rice was 108 per cent higher than world prices (BAS). Given this trend, rice farmers cannot be expected to compete even at high tariffs. A criticism leveled against the government is the lack of proper safety nets intended to give farmers a chance to compete under an open trade regime. Therefore, a few academicians, policy experts, and vocal NGOs expect a huge loss on the part of the farmers if safety net concerns are not addressed. Trade liberalization policies would certainly be disadvantageous to the welfare of rice-based farmers in the country. The observation was reinforced by Brown, et al. (2003), “policy simulation results of trade liberalization indicated a significant reduction in farm wealth, which would further impoverish poor farmers.” On the other hand, prolonging the protection of rice puts consumers at a
Chapter 3
28
disadvantage because of the higher price of rice. Thus, the role of the government in balancing policies is crucial. Policy directives of the government should aim to lessen the negative impact of trade liberalization on farmers while at the same time consider the interests of the consumers.
3.7.3.3 Impact of trade policies on soybean At present, there are only a few soybean farmers, therefore no serious adverse impact is
foreseen on the soybean sector. The challenge would be more on how to develop a prosperous domestic soybean industry. Given that soybean is fairly liberalized and is a major feed raw material, raising import tariffs to encourage domestic production may have more disadvantages than advantages. It is thus important for the government to thoroughly review first the benefits and costs in trying to develop a local soybean industry.

29
4. Demand for and Supply of Feed Crops
4.1 Demand for feed crops
4.1.1 Consumption structure and characteristics This section focuses on the consumption structure of primary feed crops in the
Philippines. Corn. Sixty to 70 per cent of corn supply (both local and imported), particularly yellow
corn, is consumed as feeds for the livestock and poultry industries. On the other hand, about 15 to 25 per cent is consumed as food in the form of white corn. Corn is also utilized in the manufacturing or processing industry as starch, gluten, alcohol, cooking oil and snack foods.
In recent years, consumption of corn as feeds has been increasing while consumption as food has been decreasing. This was primarily because corn is a secondary staple in the country and considered as an inferior good (Bouis, 1991 as cited by Costales, 1995). Thus, as long as food demand for corn is limited to being a staple, as in the case of white corn, no other sources of expansion in demand, aside from population growth, would seem to raise demand for corn as food (Costales, 1995).
The main source of variation in demand for white corn has been the changes in the market of yellow corn (Costales, 1995). In times when there were surges in demand and imports were not allowed to systematically respond to this, local feed millers resorted to white corn to fill their requirements in place of yellow corn, thus, driving up the demand and prices of white corn (Costales, 1995).
On the contrary, due to the fact that yellow corn is a major component in livestock and poultry feeds, resources, efforts and policy directives were focused on improving production efficiency. Given the increasing demand for poultry, pork and egg products there would be a rise in demand for yellow corn and the other feed crops.
Rice. Rice is primarily consumed as food and remains the staple food of approximately 80 per cent of Filipinos (PCARRD, 2002). It accounts for about 35-65 per cent of the total calorie intake of households in the country (David and Balisacan, 1995 as cited by PCARRD, 2002).
Although rice production has been increasing by 3.6 per cent annually, it was still unable to keep pace with the demand of the rapidly growing population which has been increasing by 2.3 per cent annually. Other contributory factors pressuring the sector include trade liberalization, conversion of rice lands for industrial and urban uses (PCARRD, 2002), and minimal annual increases in per capita consumption. This has made the country dependent on imports to fill the supply deficits.
On the other hand, rice consumed as feeds is limited to brown rice, rough rice and its by-products i.e., rice bran, rice middling, and rice polishing. Rice bran, at 10 per cent of paddy weight (Cruz, 1997), is the most common and abundantly utilized rice by-product in mixed feed formulations for the livestock industry. However, no data was available pertaining to rice bran consumption in the country.
Soybean. Soybean demand is almost entirely derived from the demand for its processed products. The bulk of the demand for soybean comes from the processors, who crush the beans into oil and meal. In the Philippines, however, imported soybean which makes up the bulk of local supply was mainly used as a raw material in manufacturing mixed feed and feed ingredients (BPRE, 2004). As of 2002, soybean meal constituted 83 per cent of the total imported soybean and soybean products. This is equivalent to 1,273 million mt of soybean meal.

Chapter 4
30
The major demanders of soybean meal are the swine and poultry industries. This feed ingredient satisfies 90 per cent of the basic protein and amino acid requirements of the poultry, swine, and dairy cattle sub-sectors (Soybean Market Overview, 2004).
Soybean oil is also highly imported and predominantly used as an input to the processed food industry. Margarine, shortening, salad oils, and cooking oils usually contain some soybean oil in the form of edible oils (Soybean Market Overview, 2004).
Aside from being processed as oil, demand for soybean as food may be described as follows but is not limited to: “an ingredient in the preparation of a variety of fresh, fermented and dried food products like milk, tofu, tempeh, miso yuba, soya sauce, ice cream, bean curd and bean sprouts” (BPRE, 2004). Moreover, it is also the main raw material in processing “taho” or soy curd - a popular snack food in the country. Hence, local soybean production is almost entirely devoted to meeting the needs of the food manufacturing sector.
4.1.2 Consumer price behaviour Trends in wholesale and retail prices of corn, rice and soybean are illustrated in Figures
4.1 and 4.2.
Figure 4.1 Trends in wholesale prices (nominal) of selected feed crops, Philippines, 1982-2002
0.005.00
10.0015.0020.0025.00
1982
1984
1986
1988
1990
1992
1994
1996
1998
2000
2002
Year
Who
lesa
le p
rice
(P/k
g)
Corn Rice Soybean
Source: Author’s own calculation.
Figure 4.2 Trends in retail prices (nominal) of selected feed crops, Philippines, 1982-2002
0.00
5.00
10.00
15.00
20.00
25.00
1982
1984
1986
1988
1990
1992
1994
1996
1998
2000
2002
Year
Ret
ail p
rice
(P/k
g)
Corn Rice Soybean
Source: Author’s own calculation.

Demand for and Supply of Feed Crops
31
Corn. Wholesale price of corn increased by 10 per cent per annum from 1982 to 2002. In contrast, world prices of yellow corn quoted at US (f.o.b.) Gulf port, declined by 20 per cent over the same period (Table 4.1a). On average, wholesale domestic prices of yellow corn were double that of export parity prices (i.e. export f.o.b. prices multiplied by the official exchange rate of the year). This reflected the high corn price protection in the country and the evident price uncompetitiveness of corn (Gonzales, 2000).
On the other hand, estimated import parity prices of yellow corn indicate that in order for the sector to be competitive locally, the Philippines must impose at least a 36 per cent tariff level on imported corn (Table 4.1b). This estimate approximates the level of competitiveness of Philippine corn as illustrated by the University of Asia and the Pacific (UA&P, 1999). The study revealed that with a 35 per cent tariff on imported corn, Philippine corn is competitive on the domestic market. However, given its high cost of production and high prices compared with major corn-producing countries, Philippine corn has always been highly uncompetitive on the global market.
Domestic retail prices of corn exhibited a similar trend to wholesale prices, rising at 10 per cent annually. Compared with white corn retail prices, yellow corn’s retail prices have been 5 per cent higher, on average for the last two decades.
Rice. The domestic wholesale and retail prices of rice have been increasing annually by 11 per cent for the last two decades. It was interesting to note that the 2002 nominal wholesale price was 560 per cent higher than the 1982 level. This was in contrast to the 31 per cent decrease in export prices (f.o.b.) quoted in Thailand. Thus, a large gap between local and world price is evident. From 1982 to 2002, the wholesale price of locally produced rice on average was 73 per cent higher than world prices since there has been a general decline in global cereal prices (Table 4.1a). On the contrary, in order for Philippine rice prices to be competitive on the domestic market, import prices of rice in the Philippines (c.i.f. Manila) should be imposed with at least a 47 per cent tariff rate (Table 4.1b).
The price competitiveness of rice was also illustrated in the study conducted by UA&P (1999). It was revealed that under the import substitution scenario and at an exchange rate of P40/1$ and 50 per cent tariff, domestic rice was competitive with imports. In contrast, under the export promotion scenario it was highly uncompetitive.
Soybean. In general, the domestic wholesale price of soybean increased by 9 per cent per year. Trends revealed that domestic wholesale prices in 2002 had increased by as much as 354 per cent from the 1982 level. This was opposite to the decline in world prices (f.o.b.) quoted at US Gulf port. Much like corn and rice, the country is not competitive in producing soybean as shown in the price ratio of domestic wholesale and world price of soybean. On average, domestic wholesale prices were higher by 72 per cent than world prices.
Similarly, the domestic retail price of soybean followed the trend of the wholesale price. Although the data available for retail prices only covered the years 1982-1991, it was observed that the retail price was increasing by 8 per cent annually during the 10-year period.

Chapter 4
32
Table 4.1a Wholesale domestic and export parity prices of selected feed crops, Philippines, 1982-2002
Wholesale price (P/mt) Export price ($/mt) Economic export parity price (P/mt) Ratio
(A) (B) (D) (A/D) Year Yellow
corn Rice Soybean Yellow Corna Riceb Soybeanc
Official exchange rate (P/$)
(C) Yellow corn Rice Soybean Yellow
corn Rice Soybean
1982 1,590 2,760 4,450 113 247 265 8.54 965 2,109 265 1.65 1.31 1.97 1983 1,780 2,990 4,510 140 243 264 11.11 1,555 2,700 264 1.14 1.11 1.54 1984 2,920 4,810 8,070 140 233 263 16.70 2,338 3,891 263 1.25 1.24 1.84 1985 3,540 6,510 10,190 116 198 262 18.61 2,159 3,709 262 1.64 1.76 2.09 1986 3,480 5,790 9,240 95 178 261 20.39 1,928 3,613 261 1.80 1.60 1.74 1987 3,660 5,840 7,150 90 203 259 20.57 1,850 4,174 259 1.98 1.40 1.34 1988 3,940 6,520 6,710 108 272 258 21.09 2,278 5,736 258 1.73 1.14 1.23 1989 4,470 7,820 7,660 112 290 257 21.74 2,438 6,313 257 1.83 1.24 1.37 1990 4,800 8,770 8,210 109 249 256 24.31 2,649 6,053 256 1.81 1.45 1.32 1991 4,400 9,100 9,400 107 228 255 27.48 2,940 6,265 255 1.50 1.45 1.34 1992 5,990 9,480 8,460 104 229 254 25.51 2,654 5,842 254 2.26 1.62 1.31 1993 5,600 10,780 9,400 101 191 253 27.12 2,736 5,191 253 2.05 2.08 1.37 1994 6,200 12,130 11,730 108 219 214 26.42 2,847 5,772 214 2.18 2.10 2.07 1995 7,400 15,040 10,720 124 290 219 25.71 3,176 7,462 219 2.33 2.02 1.90 1996 7,710 17,390 12,810 166 276 226 26.22 4,346 7,224 226 1.77 2.41 2.16 1997 7,630 16,880 15,800 117 247 224 29.47 3,451 7,273 224 2.21 2.32 2.39 1998 8,320 17,400 17,191 102 250 223 40.89 4,171 10,211 223 1.99 1.70 1.89 1999 8,470 17,460 18,170 75 252 225 39.09 2,945 9,858 225 2.88 1.77 2.07 2000 9,200 17,770 18,785 70 180 229 44.19 3,094 7,955 229 2.97 2.23 1.86 2001 9,430 17,610 19,754 70 150 234 50.99 3,569 7,649 234 2.64 2.30 1.66 2002 8,910 18,210 20,184 90 170 240 51.60 4,644 8,773 240 1.92 2.08 1.63
Average 1.98 1.73 1.72 Sources: Selected Statistics on Agriculture various issues, BAS.
World Bank. af.o.b. Gulf prices. b f.o.b. Bangkok prices. c f.o.b. Gulf prices.

Demand for and Supply of Feed Crops
33
Table 4.1b Wholesale domestic and import parity prices of selected feed crops, Philippines, 1982-2002 Wholesale price (P/mt) Import price ($/mt) Import parity price (P/mt) Ratio
(A) (B) (D) (A/D) Year Yellow
corn Rice Soybean Yellow corna Riceb Soybeanc
Official exchange rate (P/$)
(C) Yellow
corn Rice Soybean Yellow corn Rice Soybean
1982 1,590 2,760 4,450 123 255 245 8.54 1,054 2,181 2,092 1.51 1.27 2.13 1983 1,780 2,990 4,510 153 253 282 11.11 1,698 2,815 3,133 1.05 1.06 1.44 1984 2,920 4,810 8,070 159 248 282 16.7 2,653 4,145 4,709 1.10 1.16 1.71 1985 3,540 6,510 10,190 139 217 224 18.61 2,593 4,034 4,169 1.37 1.61 2.44 1986 3,480 5,790 9,240 118 197 208 20.39 2,410 4,011 4,241 1.44 1.44 2.18 1987 3,660 5,840 7,150 114 222 215 20.57 2,343 4,572 4,423 1.56 1.28 1.62 1988 3,940 6,520 6,710 134 293 304 21.09 2,827 6,179 6,411 1.39 1.06 1.05 1989 4,470 7,820 7,660 141 313 275 21.74 3,060 6,809 5,979 1.46 1.15 1.28 1990 4,800 8,770 8,210 142 275 247 24.31 3,448 6,697 6,005 1.39 1.31 1.37 1991 4,400 9,100 9,400 146 259 234 27.48 4,010 7,127 6,430 1.10 1.28 1.46 1992 5,990 9,480 8,460 146 263 221 25.51 3,730 6,710 5,638 1.61 1.41 1.50 1993 5,600 10,780 9,400 146 228 245 27.12 3,964 6,178 6,644 1.41 1.74 1.41 1994 6,200 12,130 11,730 157 258 229 26.42 4,136 6,815 6,050 1.50 1.78 1.94 1995 7,400 15,040 10,720 176 333 218 25.71 4,534 8,556 5,605 1.63 1.76 1.91 1996 7,710 17,390 12,810 223 322 267 26.22 5,859 8,445 7,001 1.32 2.06 1.83 1997 7,630 16,880 15,800 178 296 274 29.47 5,249 8,723 8,075 1.45 1.94 1.96 1998 8,320 17,400 17,191 169 304 243 40.89 6,910 12,418 9,936 1.20 1.40 1.73 1999 8,470 17,460 18,170 147 310 112 39.09 5,738 12,110 4,378 1.48 1.44 4.15 2000 9,200 17,770 18,785 145 240 114 44.19 6,387 10,609 5,038 1.44 1.68 3.73 2001 9,430 17,610 19,754 149 214 127 50.99 7,602 10,899 6,476 1.24 1.62 3.05 2002 8,910 18,210 20,184 172 236 213 51.60 8,851 12,163 10,991 1.01 1.50 1.84
Average 1.36 1.47 1.99 Source of basic data: PIDS, BAS, and World Bank. ac.i.f. Manila. b c.i.f. Manila. c c.i.f. Rotterdam prices. Note: Import prices of yellow corn and rice are estimated (FOB price + freight and insurance costs).

Chapter 4
34
4.1.3 Consumption response to market forces This section discusses the demand responses for food, feed, and other uses of corn, rice
and soybean to market forces for the years 1982-2002. Appendix Table 1 show the summary of the demand runs for this study. Three separate functions were used to analyze total demand for each crop: demand for food, demand for feed, and demand for other uses.
The data used for the analysis of demand was based on the supply and utilization accounts generated by the BAS. Corn data included the consolidated demand for both yellow and white corn since separate data series for both types were not available. Rice consumed as feeds, on the other hand, did not represent rice bran since the available supply and utilization accounts for rice were only for milled rice. Further, soybean used as feed did not include soybean meal imports.
Corn Corn food demand:
0.47lnINCpalay0.81lnRPcorn0.31lnRP27.73foodlnQ −−−=
The explanatory variables included in the corn food demand model were retail prices of
corn and rice (in real terms), and per capita GDP. These variables explained 65 per cent of the variability in the demand for corn as food. Population was omitted from the model because of its linear relationship with the rest of the explanatory variables.
Based on the results, demand for corn as food was significantly affected by its own price. Results indicated that a 1 per cent increase in corn retail price would lead to a 0.31 per cent decrease in demand for corn as food. This own price elasticity estimate of corn showed that it was price inelastic. Further, corn was shown to be a complement of palay (eCR = -0.81). It was also observed that corn as food was an inferior good, as manifested by the negative income elasticity of 0.47 per cent.
The result of the own price elasticity estimate of corn was relatively similar to that of the estimates based on other studies. Ferrer-Guldager (1977) as cited by Estrada and Bantilan (1991) estimated corn demand elasticity to be -0.36. Likewise, IAPMP (1981) as cited by Costales (1990) derived a -0.40 own price elasticity estimate of corn food demand. The own price estimates derived in this study and past studies are consistent with a priori economic expectations. Corn, being a staple crop in the Philippines, tends to be less responsive to its own price over time (Estrada and Bantilan, 1991).
Corn feed demand:
pork0.47lnPRODpoul0.22lnPRODcorn0.08lnWP7.52feedlnQ ++−=
The feed demand model with respect to corn wholesale price, poultry, and pork
production explained 96 per cent of the variations in corn feed demand. The major demand shifter was pork production which enjoys the highest consumption of total feed produced in the Philippines. Results of the regression showed that an increase by 1 per cent of pork production would raise corn feed demand by 0.47 per cent. Likewise, poultry production also positively affected demand for corn as feeds. The negative sign of corn wholesale price, on the other hand, was consistent with a priori expectations but was insignificant.
Corn demand for other uses:
( ) corn0.48lnAHfeedQfoodQ0.45ln23.67othuseslnQ ++−=

Demand for and Supply of Feed Crops
35
Corn demand for other uses (processing and seeds) was greatly influenced by the level of corn used as feed and food and corn harvested area. These explanatory variables determined approximately 92 per cent of the variation in the dependent variable.
As for the effect of combined corn food and feed use, there exists a negative relationship between food and feed use, and corn for other uses. This was consistent with the theoretical hypothesis that as corn feed and food use increases, corn for other uses would decrease given a supply constraint.
Corn harvested area and corn for other uses were directly linked. This means that an increase in the corn area harvested would likewise raise the demand for other uses of the commodity. This variable was also found to significantly affect the demand for other uses of corn.
Rice Rice demand as food:
0.36lnINC1.36lnPOPcorn0.44lnRPrice0.09lnRP6.06foodlnQ +++−−=
The model explained 96 per cent of the variations in rice food demand. Results also showed that the main factor influencing demand for rice was population. A one per cent increase in the population would lead to a 1.36 per cent growth in rice demanded as food.
Rice demanded as food was also found to be positively affected by corn retail prices. The coefficient for corn retail price showed that as the corn retail price increases by 1 per cent, the corresponding growth in rice food demand is 0.44 per cent. This highlighted that the two commodities are substitutes. Likewise, a positive relationship was observed between food demand for rice and per capita GDP/income and was statistically significant.
Results of the regression also indicated that rice food consumption declined with an increase in its own retail price. However, this variable was not statistically significant.
Rice demand as feed:
( ) pork0.46lnPRODpoul1.12lnPRODegg1.57lnPROD1trice0.31lnWP18.37feedlnQ ++−−−=
Based on the results of the model, egg, poultry and pork production significantly affected
demand for rice as feed. It was observed that a 1 per cent increase in pork and poultry production respectively, brought about a 0.46 per cent and a 1.12 per cent increase in demand for rice as feed. Hence, rice used as feed was more responsive to poultry production, whereas, demand for rice as feed was inversely related with egg production because of the collinear effect of the explanatory variables on one another, specifically the production of eggs, poultry and pork.
Rice demand for other uses:
( ) rice0.26lnAHfeedQfoodQ2.54ln41.88othuseslnQ +++−=
Demand for other uses of rice included utilization for processing and seeds. Rice used for feed and food was positively related with rice for other uses because of the strong demand for processed rice products such as rice flour used in noodles and native delicacies, among others. The dependent variable was also observed to be positively affected by rice harvested area, although the coefficient was not significant.

Chapter 4
36
Soybean Soybean demand as food:
4.83lnINC5.30lnPOPsoyln0.34WP122.82foodlnQ ++−−=
Population and per capita income were the major factors influencing demand for soybean
as food. Elasticities show a positive relationship between population and per capita income, and soybean demanded as food.
Soybean wholesale price, on the contrary, was inversely related to demand for rice as food but was found to be insignificant.
Soybean demand as feed:
poul2.78lnPRODsoy0.12lnWP44.09feedlnQ ++−=
Including livestock and poultry production in the model resulted in incorrect signs of the
coefficients. The explanatory variables were likewise insignificant. A likely explanation for this was the existence of multicollinearity between these variables. Thus, only soybean wholesale price and poultry production were included in the regression run.
Results show that poultry production significantly affected demand for soybean as feed. Own wholesale price had a positive coefficient sign but was not significant. Soybean demand for other uses:
( )feedQfoodQ1.0ln1.0othuseslnQ ++=
The demand for other uses of soybean was primarily for processing. As shown in the model, 100 per cent of the variation in soybean demand for other uses was caused by soybean food and feed consumption. The soybean harvested area variable was omitted from the model because it was linearly related to food and feed consumption and made the other variables insignificant.
The model revealed that a 1 per cent increase in the aggregate demand for food and feed would also lead to a 1 per cent increase in soybean demand for other uses. There was a strong demand for other uses which was primarily processing the imported soybean into soybean meal used for feeds, and soybean oil, sauces, among others as food.
4.1.4 Consumption projections to 2015 Annual growth rates of the demand for food, feed and other uses were estimated for
corn, rice and soybean using elasticity estimates from the demand functions. Consumption projections were then made from 2003 to 2015 using these growth rates. These projections are presented in Table 4.2. In summary, total demand was estimated to reach 8 million mt for corn, 15 million mt for rice, and 3 million mt for soybean by 2015. These were 1.4 and 1.5 times higher than the 2003 level of demand for corn and rice, respectively, while for soybean, this was a nine-fold increase.
Neither, international demand nor exports were projected due in part to the limited exports the country has made. Exporting corn, rice and soybean are primarily undertaken by the Philippines to comply with trade commitments. Thus, years with export data do not necessarily imply that there were domestic production surpluses. The export level scenario also depicts that exports were minimal and established no trend. This was the primary reason why the export function specified by CAPSA was not estimated in this report.
Projected demand for food. The estimated annual increase in demand for corn, rice, and soybean as food were 0.71 per cent, 3 per cent, and 14 per cent respectively. For corn, the estimated demand for food in 2003 was close to 0.97 million mt and projected to reach 1.06

Demand for and Supply of Feed Crops
37
million mt by 2015. Demand for rice as food was estimated to be 8.7 million mt in 2003 and projected to reach 12.25 million mt by 2015. On the other hand, soybean food demand was estimated to be 78,176 mt in 2003 and projected to increase five-fold by 2015.
Projected demand for feed. Rice and corn demanded as feed were projected to increase by 3 per cent and 4 per cent annually, respectively. In 2003, the estimated demand for corn feed was 4 million mt and projected to increase by 50 per cent in 2015. For rice, the demand for feed was 0.58 million mt in 2003 and estimated to reach 0.86 million mt in 2015. In contrast, soybean demand as feed was calculated to increase by as much as 14 per cent annually. Demand for soybean as feed was projected to reach 7,036 mt, a five-fold increase from 2003.
Projected demand for other uses. Based on the regression model of this study, the demand for other uses of corn, rice and soybean were likely to increase by 2 per cent, 8 per cent and 22 per cent respectively. Soybean showed the highest potential growth rate in demand for other uses. This is possible, since it has many more diverse uses compared to corn and rice. By 2015, the projected demand for other uses was 0.72 million mt for corn, 1.6 million mt for rice, and 2.4 million mt for soybean.
Comparison of projection results with other methods/projections. Comparing the projections of demand for the three feed crops with the projections of feed demand from growth rates of the poultry and swine industries, their feed conversion ratios (FCRs), and the usage of corn, rice bran and soybean meal in feed rations (Table 4.3), it was observed that: (1) the generated model for corn feed demand was comparable with the estimated demand for corn based on the FCR generated corn feed demand, such that the feed demand model was only lower by 7 per cent; (2) there exist limitations in projecting rice and soybean feed demand since the data on supply and utilization, available from BAS, used in the models does not include imports of soybean meal and actual rice bran utilization. Hence, projections of rice and soybean as feeds from the model may be underestimated.
As compared with the study conducted by David and Balisacan (1995), for the period 2005 to 2010, on average, total corn demand projected in this study was 20 per cent lower than their baseline estimate for corn demand. On the other hand, David and Balisacan’s estimate for the demand for rice was more conservative than the models used in this study. However, if compared with actual data, David and Balisacan’s projections in 2000 for rice were lower by 16 per cent while corn was overestimated by 13 per cent. Further, using actual data from the past (1989-2002) versus the derived / projected data from the model in this study, it was revealed that models generated for food, feed, and other uses of corn and rice were conservative, meaning a deviation from actual total demand by only 0.05 - 4 per cent. These comparisons with past projections and other methods could attest to the robustness of the projections generated by the demand models.

Chapter 4
38
Table 4.2 Demand projections using demand regression results, 2003-2015 Food (mt) Feed (mt) Other uses (mt) Total demand (mt) Year
Corn Rice Soybean Corn Rice Soybean Corn Rice Soybean Corn Rice Soybean 2003 971,803 8,686,279 78,176 4,049,975 582,760 1,470 924,360 610,342 229,102 5,946,138 9,879,381 308,747 2004 978,654 8,938,442 89,363 4,199,257 601,974 1,675 905,129 660,305 278,588 6,083,040 10,200,720 369,625 2005 985,554 9,197,925 102,150 4,354,042 621,821 1,908 886,298 714,357 338,763 6,225,893 10,534,103 442,821 2006 992,502 9,464,940 116,768 4,514,532 642,322 2,174 867,858 772,835 411,935 6,374,892 10,880,097 530,878 2007 999,499 9,739,708 133,478 4,680,937 663,500 2,477 849,802 836,099 500,913 6,530,239 11,239,306 636,869 2008 1,006,546 10,022,451 152,579 4,853,477 685,375 2,822 832,122 904,542 609,111 6,692,145 11,612,369 764,512 2009 1,013,642 10,313,403 174,413 5,032,376 707,972 3,216 814,810 978,588 740,679 6,860,828 11,999,963 918,307 2010 1,020,788 10,612,801 199,372 5,217,869 731,314 3,664 797,858 1,058,695 900,665 7,036,515 12,402,810 1,103,701 2011 1,027,985 10,920,891 227,902 5,410,200 755,426 4,175 781,258 1,145,360 1,095,209 7,219,443 12,821,676 1,327,286 2012 1,035,232 11,237,924 260,515 5,609,620 780,332 4,757 765,004 1,239,119 1,331,774 7,409,856 13,257,375 1,597,046 2013 1,042,530 11,564,161 297,795 5,816,391 806,059 5,420 749,088 1,340,553 1,619,437 7,608,009 13,710,774 1,922,652 2014 1,049,880 11,899,869 340,410 6,030,783 832,635 6,175 733,504 1,450,291 1,969,235 7,814,166 14,182,795 2,315,821 2015 1,057,282 12,245,322 389,123 6,253,077 860,087 7,036 718,243 1,569,011 2,394,590 8,028,602 14,674,421 2,790,750
Source: Author’s own calculation.
Table 4.3 Projected demand for mixed feeds, corn, rice bran and soybean meal, Philippines, 2003-2015 Estimated demand for mixed feed (mt) Estimated demand for feed crops (mt) Year Eggs Poultry Hogs Corn Rice bran Soybean meal
2003 600,162 2,576,434 6,123,300 3,719,958 1,394,984 1,523,806 2004 619,273 2,702,554 6,441,719 3,905,418 1,464,532 1,599,659 2005 638,993 2,834,847 6,776,695 4,100,214 1,537,580 1,679,323 2006 659,341 2,973,616 7,129,090 4,304,819 1,614,307 1,762,988 2007 680,337 3,119,179 7,499,810 4,519,730 1,694,899 1,850,858 2008 702,001 3,271,866 7,889,808 4,745,470 1,779,551 1,943,145 2009 724,356 3,432,028 8,300,087 4,982,588 1,868,471 2,040,072 2010 747,422 3,600,030 8,731,700 5,231,661 1,961,873 2,141,874 2011 771,222 3,776,256 9,185,758 5,493,295 2,059,985 2,248,798 2012 795,781 3,961,109 9,663,427 5,768,127 2,163,047 2,361,103 2013 821,122 4,155,010 10,165,935 6,056,827 2,271,310 2,479,061 2014 847,269 4,358,403 10,694,574 6,360,099 2,385,037 2,602,957 2015 874,249 4,571,752 11,250,704 6,678,682 2,504,506 2,733,093
* using FCRs 1:1.85 for eggs, 1:2 for poultry and farm efficiency of hogs at 1:2.49. Estimations: Corn : 40 per cent of total mixed feed demand (BAI).
Rice bran : 15 per cent of total mixed feed demand. Soybean : 15 per cent of egg and hog feed demand. 20 per cent of poultry feed demand.
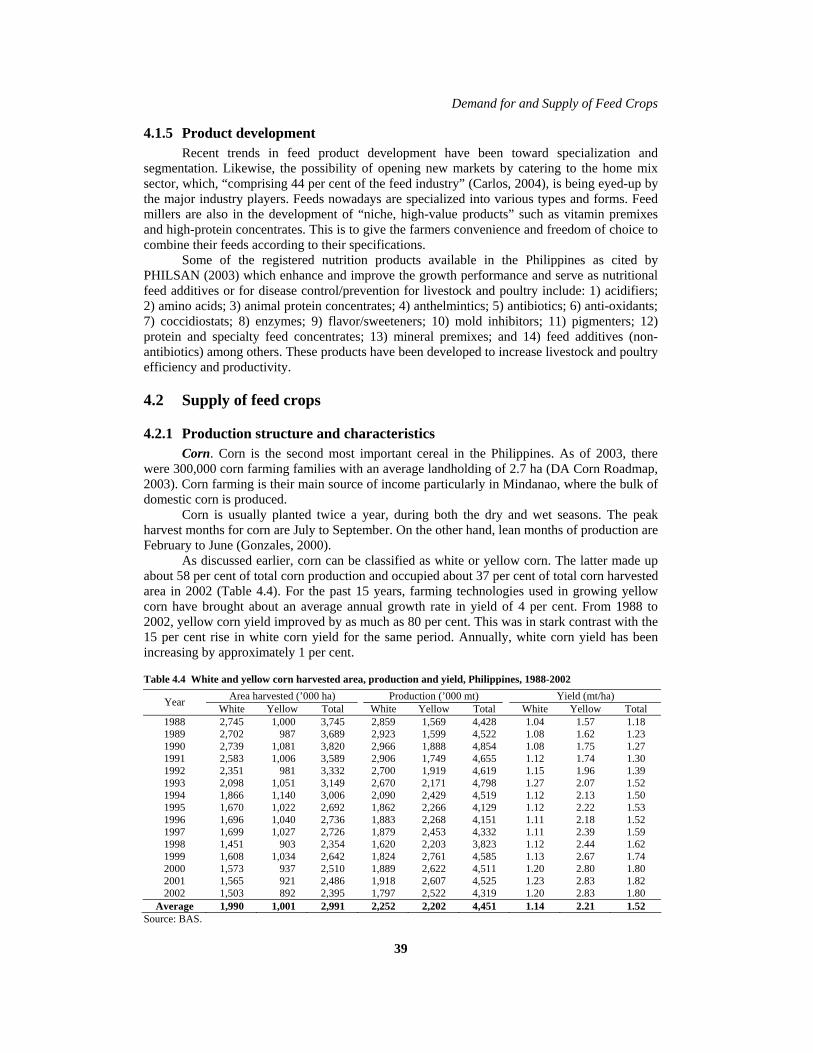
Demand for and Supply of Feed Crops
39
4.1.5 Product development Recent trends in feed product development have been toward specialization and
segmentation. Likewise, the possibility of opening new markets by catering to the home mix sector, which, “comprising 44 per cent of the feed industry” (Carlos, 2004), is being eyed-up by the major industry players. Feeds nowadays are specialized into various types and forms. Feed millers are also in the development of “niche, high-value products” such as vitamin premixes and high-protein concentrates. This is to give the farmers convenience and freedom of choice to combine their feeds according to their specifications.
Some of the registered nutrition products available in the Philippines as cited by PHILSAN (2003) which enhance and improve the growth performance and serve as nutritional feed additives or for disease control/prevention for livestock and poultry include: 1) acidifiers; 2) amino acids; 3) animal protein concentrates; 4) anthelmintics; 5) antibiotics; 6) anti-oxidants; 7) coccidiostats; 8) enzymes; 9) flavor/sweeteners; 10) mold inhibitors; 11) pigmenters; 12) protein and specialty feed concentrates; 13) mineral premixes; and 14) feed additives (non-antibiotics) among others. These products have been developed to increase livestock and poultry efficiency and productivity.
4.2 Supply of feed crops
4.2.1 Production structure and characteristics Corn. Corn is the second most important cereal in the Philippines. As of 2003, there
were 300,000 corn farming families with an average landholding of 2.7 ha (DA Corn Roadmap, 2003). Corn farming is their main source of income particularly in Mindanao, where the bulk of domestic corn is produced.
Corn is usually planted twice a year, during both the dry and wet seasons. The peak harvest months for corn are July to September. On the other hand, lean months of production are February to June (Gonzales, 2000).
As discussed earlier, corn can be classified as white or yellow corn. The latter made up about 58 per cent of total corn production and occupied about 37 per cent of total corn harvested area in 2002 (Table 4.4). For the past 15 years, farming technologies used in growing yellow corn have brought about an average annual growth rate in yield of 4 per cent. From 1988 to 2002, yellow corn yield improved by as much as 80 per cent. This was in stark contrast with the 15 per cent rise in white corn yield for the same period. Annually, white corn yield has been increasing by approximately 1 per cent.
Table 4.4 White and yellow corn harvested area, production and yield, Philippines, 1988-2002 Area harvested (’000 ha) Production (’000 mt) Yield (mt/ha) Year White Yellow Total White Yellow Total White Yellow Total
1988 2,745 1,000 3,745 2,859 1,569 4,428 1.04 1.57 1.18 1989 2,702 987 3,689 2,923 1,599 4,522 1.08 1.62 1.23 1990 2,739 1,081 3,820 2,966 1,888 4,854 1.08 1.75 1.27 1991 2,583 1,006 3,589 2,906 1,749 4,655 1.12 1.74 1.30 1992 2,351 981 3,332 2,700 1,919 4,619 1.15 1.96 1.39 1993 2,098 1,051 3,149 2,670 2,171 4,798 1.27 2.07 1.52 1994 1,866 1,140 3,006 2,090 2,429 4,519 1.12 2.13 1.50 1995 1,670 1,022 2,692 1,862 2,266 4,129 1.12 2.22 1.53 1996 1,696 1,040 2,736 1,883 2,268 4,151 1.11 2.18 1.52 1997 1,699 1,027 2,726 1,879 2,453 4,332 1.11 2.39 1.59 1998 1,451 903 2,354 1,620 2,203 3,823 1.12 2.44 1.62 1999 1,608 1,034 2,642 1,824 2,761 4,585 1.13 2.67 1.74 2000 1,573 937 2,510 1,889 2,622 4,511 1.20 2.80 1.80 2001 1,565 921 2,486 1,918 2,607 4,525 1.23 2.83 1.82 2002 1,503 892 2,395 1,797 2,522 4,319 1.20 2.83 1.80
Average 1,990 1,001 2,991 2,252 2,202 4,451 1.14 2.21 1.52 Source: BAS.

Chapter 4
40
Of the three major island groups of the Philippines, Mindanao dominates corn production with a 60 per cent share (2,591,580 mt) of the total corn produced in 2002. Luzon, on the other hand, registered a 33 per cent share with Cagayan Valley as its major producing region.
Yellow corn, as the major feed ingredient in swine and poultry feed formulations, was largely grown in Cagayan Valley from Luzon, Northern Mindanao, Soccsksargen and ARMM from Mindanao. These major producing regions have average yield levels 11 per cent higher than the national yield average of 2.83 mt (Table 4.5).
For the period of 1999 to 2001 the average harvested area of low yielding traditional varieties of Philippine white corn was 76 per cent (DA Corn Roadmap, 2003). In contrast, 83 per cent of the area planted to yellow corn was dominated by hybrid varieties with a potential yield of 7 mt/ha. However, this potential yield level has never been realized primarily due to production-related limitations such as infestations of corn borers, weather (drought), and inefficient production among others. Table 4.6 shows the extent of area harvested to yellow and white corn of traditional, OPV and hybrid corn varieties.
Rice. Over the last decade and a half, production of rice has been increasing at an average rate of 3.6 per cent annually, partially due to the expanding irrigated area and rising intensity of cropping. Irrigated rice fields account for 67 per cent of the total area devoted to rice production while 30 per cent is rainfed (Figure 4.3). The rest was for upland rice farming.
The yield level of irrigated rice fields is 45 per cent higher than rainfed fields. On average, irrigated rice fields are able to yield 3.68 mt/ha. IR64 is the most widely planted rice variety on irrigated rice farms and has a potential yield level of 7.5 mt/ha. Currently, however, the yield per hectare of irrigated rice farms falls short by about 50 per cent of this potential yield level. This is due to a lack of technical skills to use the technology and a lack of access to necessary inputs such as fertilizers and good quality seeds. Table 4.7 shows the yield levels of rice by type of planting environment.
Luzon dominates rice production in the Philippines (Table 4.8), accounting for 56 per cent of total rice output in the country. The two major producing regions located on Luzon Island are Central Luzon, often called the “rice bowl” of the country, and Cagayan Valley.
As of 2002, the area planted to certified and hybrid rice seeds had a 61 per cent share of total land devoted to rice production (DA Rice Roadmap, 2003).

Demand for and Supply of Feed Crops
41
Table 4.5 Corn area, production and yield, by region, Philippines, 2002 Area (ha) Production (mt) Yield (mt/ha) Region White Yellow Total White Yellow Total White Yellow Total
Luzon 126,606 421,668 548,274 149,641 1,258,265 1,407,906 1.18 2.98 2.57 CAR 12,979 19,975 32,954 21,650 71,961 93,611 1.67 3.60 2.84 Ilocos 17,382 35,487 52,869 41,296 140,765 182,061 2.38 3.97 3.44 Cagayan Valley 26,896 246,666 273,562 42,000 790,411 832,411 1.56 3.20 3.04 Central Luzon 8,196 25,543 33,739 10,767 111,779 122,546 1.31 4.38 3.63 Southern Tagalog 11,752 54,969 66,721 11,480 91,834 103,314 0.98 1.67 1.55 Bicol 49,401 39,028 88,429 22,448 51,515 73,963 0.45 1.32 0.84
Visayas 326,294 50,394 376,688 236,976 66,700 303,676 0.73 1.32 0.81 Western Visayas 40,038 37,402 77,440 34,588 52,477 87,065 0.86 1.40 1.12 Central Visayas 230,827 11,006 241,833 154,887 12,073 166,960 0.67 1.10 0.69 Eastern Visayas 55,429 1,986 57,415 47,501 2,150 49,651 0.86 1.08 0.86
Mindanao 1,050,218 420,276 1,470,494 1,410,312 1,197,368 2,607,680 1.34 2.85 1.77 Zamboanga Pen. 173,954 2,201 176,155 131,671 3,401 135,072 0.76 1.55 0.77 Northern Mindanao 228,063 111,644 339,707 343,931 357,280 701,211 1.51 3.20 2.06 Davao region 176,786 12,796 189,582 155,229 26,718 181,947 0.88 2.09 0.96 Soccsksargen 211,883 221,496 433,379 338,403 546,652 885,055 1.60 2.47 2.04 ARMM 211,250 69,064 280,314 382,780 253,572 636,352 1.81 3.67 2.27 Caraga 48,282 3,075 51,357 58,298 9,745 68,043 1.21 3.17 1.32
Philippines 1,503,118 892,338 2,395,456 1,796,929 2,522,333 4,319,262 1.20 2.83 1.80 Source: BAS. Note: Data on Philippine average production and corn area may not be equivalent to previous tables due to rounding-off.
Table 4.6 Average area harvested by type and variety of corn, Philippines, 1999-2001 Traditional OPV Hybrid All Varieties
Type Area (ha)
Share (%)
Area (ha)
Share (%)
Area (ha)
Share (%)
Area (ha)
Share (%)
Yellow 119,379 9.03 41,791 15.64 803,118 83.89 964,288 37.87 White 1,202,344 90.97 225,485 84.36 154,263 16.11 1,582,092 62.13 Total 1,321,723 100 267,276 100 957,381 100 2,546,380 100
Source: DA Corn Roadmap, 2003.

Chapter 4
42
Figure 4.3 Palay harvested area by environment, Philippines, 2002
Irrigated67%
Rainfed30%
Upland3%
Total area harvested = 4.05 million ha
Source: Author’s own calculation.
Table 4.7 Palay yield (mt/ha) by region and by type of environment, Philippines, 2002 Region Irrigated Rainfed Upland Average Luzon 3.77 2.73 1.65 3.49
CAR 3.32 2.19 2.09 3.16 Ilocos 3.67 3.03 2.58 3.45 Cagayan Valley 3.96 2.15 - 3.70 Central Luzon 4.12 3.61 - 4.04 Southern Tagalog 3.48 2.68 1.41 3.12 Bicol 3.14 2.14 - 2.74
Visayas 3.41 2.29 1.54 2.83 Western Visayas 3.37 2.56 1.60 2.96 Central Visayas 3.10 1.62 1.75 2.27 Eastern Visayas 3.67 1.96 1.48 2.73
Mindanao 3.62 2.72 1.57 3.24 Zamboanga Peninsula 3.63 3.01 1.15 3.33 Northern Mindanao 3.80 3.14 2.32 3.67 Davao 4.27 3.18 1.48 3.94 Soccsksargen 3.55 2.93 1.71 3.37 ARMM 3.25 2.46 1.46 2.43 Caraga 2.99 2.31 1.26 2.77
Philippines 3.68 2.56 1.58 3.28 Source: BAS as cited by PIDS.
Soybean. In 2002, the country produced only 985 mt of soybean which was primarily
consumed as food. This only accounted for 0.4 per cent of the total supply with the rest coming from imports. The low production level caused by an undeveloped soybean industry was a consequence of the following: 1) existence of only a limited number of experienced farmers; 2) small amount of available seeds of local varieties; 3) not considered as a high value crop; 4) farmers’ unfamiliarity with farm and household utilization; and 5) uncertainty of the soybean market (Draft Roadmap for Soybean, 2003).
In the early 1970s and 1980s, various government institutions and private firms attempted to entice farmers to propagate soybean but failed in their effort (Baconawa, 1990 as cited by Cruz, 1997). Although vast tracts of lands are ideal for producing soybean in the Philippines, high production and marketing costs discourage local farmers from planting the crop (Cruz, 1997). However, this crop has remained a priority crop in the Key Commercial Crop Development Program of the Medium-Term Agricultural Development Plan (MTADP).
Mindanao is still the major producer of soybean in the country with an 80 per cent share of total production in 1997 (Table 4.9). This was attributed to the Caraga region, where 46 per cent of total domestic soybean is produced.

Demand for and Supply of Feed Crops
43
Table 4.8 Volume of production of palay by region, Philippines, 2002 Region Production (’000 mt) Share (%) Luzon 7,458 56.20
CAR 304 2.29 Ilocos 1,200 9.04 Cagayan Valley 1,708 12.87 Central Luzon 2,240 16.88 Southern Tagalog 1,250 9.42 Bicol 757 5.70
Visayas 2,571 19.37 Western Visayas 1,730 13.04 Central Visayas 219 1.65 Eastern Visayas 622 4.69
Mindanao 3,288 24.78 Zamboanga Peninsula 505 3.81 Northern Mindanao 533 4.01 Davao 440 3.32 Soccsksargen 1,061 7.99 ARMM 423 3.18 Caraga 327 2.46
Philippines 13,271 100 Source: BAS as cited by PIDS.
Table 4.9 Soybean volume, area and yield, Philippines, 1997 Region Volume (mt) Share (%) Area (ha) Share (%) Yield (mt/ha) Luzon 174 10.77 129 10.36 1.35
Cagayan Valley 174 10.77 129 10.36 1.35 Visayas 145 8.98 270 21.69 0.54
Western Visayas 6 0.37 8 0.64 0.75 Central Visayas 125 7.74 250 20.08 0.50 Eastern Visayas 14 0.87 12 0.96 1.17
Mindanao 1,296 80.25 846 67.95 1.53 Zamboanga Peninsula 2 0.12 3 0.24 0.67
Northern Mindanao 62 3.84 53 4.26 1.17 Davao 389 24.09 211 16.95 1.84 Soccsksargen 60 3.72 50 4.02 1.20 ARMM 36 2.23 56 4.50 0.64 Caraga 747 46.25 473 37.99 1.58
Philippines 1,615 100.00 1,245 100.00 1.30 Source: CGPRT.
4.2.2 Producer price behaviour Feed crop prices. Trends in nominal farm gate prices of corn, rice and soybean are
shown in Table 4.10. Domestic nominal farm gate prices for corn have been rising by 10 per cent annually for the last two decades. In the same way, nominal domestic prices of rice and soybean have also been increasing; by 11 per cent and 8 per cent annually.
Product prices. The average selling prices of yellow corn and soybean meal are shown in Table 4.11. Generally, prices of yellow corn and soybean meal have increased by 2 per cent and 3 per cent respectively. The decline in the price of yellow corn in 1999 can annually be attributed to the increase in production brought about by expansion of the area harvested with yellow corn and the sudden decline in world prices. On the other hand, the decline in price of imported soybean meal may be attributed to the appreciation of the Philippine peso.

Chapter 4
44
Table 4.10 Nominal farm gate prices of selected feed crops, Philippines, 1982-2002 Corn Rice Soybean
Year Price (P/kg) Growth rate (%) Price (P/kg) Growth rate
(%) Price (P/kg) Growth rate (%)
1982 1.30 1.37 3.51 1988 2.85 -1.90 3.17 8.56 7.22 44.69 1993 4.63 -3.04 5.40 12.27 9.92 8.06 1997 6.07 -6.18 7.92 -2.58 12.48 7.68 2002 6.73 0.82 8.82 7.96 11.67 -25.62
Average 4.45 10.14 5.34 10.78 9.05 7.71 Source: BAS.
Table 4.11 Average selling price (P/kg) of selected feed ingredients, Philippines, 1996-2002 Year Yellow corn Soybean meal 1996 7.77 11.13 1997 7.93 12.87 1998 7.60 12.08 1999 6.84 8.48 2000 8.02 11.22 2001 8.87 13.04 2002P 8.30 12.00
Average 7.90 11.55 Source: MDD, BAI as cited by Molina, 2003. P- partial as of June 2002.
4.2.3 Production costs and returns Yellow corn. The production costs and returns for yellow corn from 1991 to 2002 are
shown in Table 4.12. During the 12-year period, average production costs increased at an ever-decreasing rate. Gross returns’ positive growth, on the other hand, was primarily due to increases in yield and farm gate prices (except in 1999 due to the occurrence of El Niño). Table 4.12 Average production costs and returns (pesos/ha) of yellow corn, Philippines, 1991-2002
Item 1991 1995 1999 2002P Cash costs 2,798 3,939 4,458 4,927
Seeds/planting materials 354 581 535 594 Fertilizer 1,154 1,299 1,216 1,537 Pesticides 144 144 135 171 Hired labour 762 1,425 1,975 1,951 Irrigation fee 1 1 1 1 Land tax 107 111 115 118 Rentals 62 112 124 128 Fuel and oil 68 83 110 138 Interest payment on crop loan 6 10 16 20 Food expense 90 122 159 171 Transport expense 50 51 72 98
Non-cash costs 725 1,324 1,622 1,816 Seeds/planting materials 59 92 89 99 Landlord’s share 182 288 383 425 Sheller’s share 47 95 110 129 Harvester’s share 292 591 687 807 Hired labour paid in-kind 116 213 295 292 Lease rental 27 43 56 62 Fuel and oil 1 2 2 2
Imputed costs 2,180 3,211 4,326 4,599 Operator/family labour 1,312 1,930 2,675 2,643 Exchange labour 66 109 151 149 Depreciation 313 458 670 892 Interest on operating capital 386 552 618 680 Rental value of owned land 102 162 212 235
All costs 5,703 8,474 10,406 11,342 Gross returns 7,087 14,363 15,454 18,149 Net returns 1,385 5,889 5,048 6,807 Net profit-cost ratio 0.24 0.69 0.49 0.60 Cost per kilogram (P) 3.28 3.82 3.90 4.01 Yield per hectare (kg) 1,740 2,220 2,669 2,827 Farm gate price (peso/kg) 4.07 6.47 5.79 6.42
Source: BAS. P- Preliminary estimates using the 2002 first semester average wage rate.

Demand for and Supply of Feed Crops
45
Table 4.13 Average production costs and returns (pesos/ha) of irrigated and non-irrigated palay, Philippines, 1991-2002 Irrigated Non-irrigated Both types Item 1991 1995 1999 2002 1991 1995 1999 2002 1991 1995 1999 2002
Cash costs 4,413 8,036 9,838 11,044 2,552 2,688 5,999 6,685 3,858 7,023 8,671 9,721 Seeds/planting materials 236 360 391 438 124 188 205 229 200 305 331 371 Fertilizer 1,237 1,441 1,349 1,705 663 757 709 895 1,053 1,222 1,144 1,446 Pesticides 576 577 539 680 330 338 309 390 498 501 465 587 Hired labour 1,446 4,395 5,922 6,359 970 779 3,942 4,232 1,294 3,878 5,288 5,678 Irrigation fee 121 183 203 228 76 80 84 87 121 183 203 228 Land tax 79 82 86 89 94 145 190 207 78 81 85 88 Rentals 199 297 371 406 48 58 78 98 167 248 312 342 Fuel and oil 144 176 234 295 68 114 180 206 113 138 184 232 Interest payment on crop loan 114 193 305 347 140 190 248 268 99 168 265 302 Food expense 199 270 351 379 39 39 54 73 180 244 318 343 Transport expense 62 62 87 118 55 55 76 104
Non-cash costs 3,798 5,829 6,549 7,634 1,144 1,830 2,034 2,423 2,997 4,617 5,183 6,056 Seeds/planting materials 476 728 808 905 211 323 351 394 392 598 662 741 Landlord’s share 930 1,395 1,588 1,779 273 418 459 514 720 1,082 1,227 1,374 Harvester’s share 951 1,427 1,589 1,957 319 486 551 713 749 1,126 1,257 1,559 Thresher’s share 691 1,036 1,153 1,419 192 293 330 426 531 798 890 1,101 Hired labour paid in kind 64 220 247 265 42 146 164 176 57 196 220 237 Lease rental 538 807 919 1,030 107 164 179 200 400 601 682 764 Irrigation fee 123 185 205 229 123 185 205 230 Fuel and oil 25 31 40 50 25 31 40 50
Imputed costs 2,815 5,273 6,982 7,981 1,572 3,934 5,806 6,724 2,419 4,947 6,605 7,579 Operator/family labour 845 2,078 2,917 3,132 590 2,743 3,851 4,408 764 2,291 3,216 3,540 Exchange labour 60 107 150 161 122 75 105 113 80 97 136 146 Depreciation 670 981 1,437 1,913 299 438 641 854 552 807 1,182 1,574 Interest on operating capital 559 1,084 1,312 1,469 334 330 826 919 487 945 1,156 1,293 Rental value of owned land 681 1,023 1,166 1,306 227 348 383 430 536 807 915 1,026
All cost 11,026 19,138 23,369 26,659 5,268 8,452 13,839 15,832 9,274 16,587 20459.5 23,356 Gross returns 13,493 23,602 26,341 32,422 9,047 14,987 16,905 21,865 12,070 20,845 23,321 29,044 Net returns 2,467 4,464 2,972 5,763 3,779 6,535 3,066 6,033 2,796 4,258 2,862 5,688 Net profit cost ratio 0.22 0.23 0.13 0.22 0.72 0.77 0.22 0.38 0.30 0.26 0.14 0.24 Cost per kilogram (P) 3 5.87 6.98 7.25 2.58 4.08 6.44 6.39 3.31 5.76 6.90 7.09 Yield per hectare (kg) 3,160 3,260 3,347 3,676 2,040 2,070 2,148 2,479 2,800 2,879 2,963 3,293 Farm gate price (peso/kg) 4.75 7.24 7.87 8.82 4.75 7.24 7.87 8.82 4.75 7.24 7.87 8.82
Source: BAS.

Chapter 4
46
Based on the production costs and returns of yellow corn, net returns from yellow corn production have been increasing. The highest growth in net income was attained in 1995 when the net income from a hectare of corn increased from P 1,385 to P 5,889. It was also observed that the high production costs of yellow corn can be attributed to two factors of production; mainly labour (includes hired labour, family labour, exchange labour, shellers’ and harvesters’ share) and fertilizer. On average, labour costs account for 55 per cent of the total production costs while fertilizer costs account for 15 per cent.
Rice. Table 4.13 shows the production costs and returns for rice production for the period of 1991 to 2002. The main driver of the increase in rice production costs was labour. The increase in gross returns could be attributed to yield growth and increases in farm gate prices. Likewise, the net returns for irrigated and non-irrigated rice farms were observed to be generally increasing, except in 1999 due to the occurrence of El Niño.
On average, labour costs account for 47 per cent of total production costs for irrigated rice fields to 56 per cent for rainfed or non-irrigated farm lands. Labour costs’ share of total farm costs has also risen overtime due to wage increases. Fertilizer costs, on the other hand, only account for 8 per cent of total production costs but were observed to have a decreasing share.
Soybean. Table 4.14 shows the costs and returns of soybean production with various yield levels. As of 2002, hired labour was the main cost driver of soybean production accounting for 63 per cent of total production costs. Increases in production costs due to productivity improvements such as increases in yield were compensated by higher net returns.
Table 4.14 Production costs and returns (pesos/ha) of soybean, Philippines, 2002
Seed yield Item 1.5 mt/ha 2.0 mt/ha
Seeds/planting materials 1,600 1,600 Fertilizer 2,000 2,000 Pesticides 500 500 Others 150 200 Hired labour 8,895 9,680 Interest payments 986 1,049
All costs 14,131 15,029 Gross returns 16,500 22,000 Net returns 2,369 6,971 Cost per kilogram (P) 9.42 7.51 Farm gate price (peso/kg.) 11 11
Source: Draft Soybean Roadmap, 2003.
4.2.4 Production response to market forces This section deals with the functions and coefficients generated on the yield and supply
responses for corn, palay and soybean using data from 1982-2002. Appendix Table 2 shows the results of the regression analyses.
Corn Corn area:
( ) ( ) ( )1tsoy0.23lnFP1tpalay0.45lnFP1tcorn0.81lnFP13.84cornlnAH −+−−−+=
Estimates of the coefficients revealed that corn farm gate price positively affected corn
harvested area. Conversely, palay farm gate price was inversely related to corn harvested area. These two crops presumably compete for the same land, particularly during the dry season.

Demand for and Supply of Feed Crops
47
Corn yield:
( ) ( ) ( )1twage0.69lnPl1turea0.18lnPl1tcorn0.25lnFP4.87cornlnYH −+−−−−=
The explanatory variables in the yield function included real corn producer price, price
of urea and agricultural wages. These explanatory variables explained approximately 91 per cent of the variations in the dependent variable.
Based on the results, corn farm gate price, urea price and wages significantly affect corn yield. For corn producer price, an increase of one per cent leads to a 0.25 per cent decline in the yield of corn. Urea price was observed to be negatively related to yield. This implies that corn growers opt to use minimal fertilizer in order to minimize their costs when fertilizer prices are high. Wage from the previous year, on the other hand, was positively related to yield.
Rice Rice area :
( ) ( ) ( ) ( )1trice0.21lnAH1tsoy0.26lnFP1trice0.09lnFP1tcorn0.15lnFP12.63ricelnAH −+−−−+−−=
The signs for farm gate prices (corn, palay, soybean) were consistent with economic
theory. However, corn and rice farm gate prices were insignificant determinants of palay area harvested. The lagged area was included in the supply response function to reflect partial adjustment towards a desired area, the partial adjustment being attributed to the inability to make short-run changes to fixed input levels (Griffiths et al., 1999).
Rice yield:
( ) ( ) ( ) ( )1trice0.77lnYH1twage0.03lnPI1turea0.02lnPI1trice0.09lnFP1.85ricelnYH −+−+−−−−=
Regression results showed that 78 per cent of the variations in the rice yield were due to
the explanatory variables included in the model. However, only the lagged rice yield was found to be significant. This variable was included in the model to represent the hypothesis that after a poor year of harvest farmers tend to plant more rice thereby increasing productivity in the subsequent year.
Soybean Soybean area:
( ) ( ) ( ) ( )1tsoy0.95lnAH1tsoy0.35lnFP1tpalay1.94lnFP1tcorn0.41lnFP2.24soylnAH −+−+−−−+=
The major determinants of soybean harvested area are the palay producer price and
lagged harvested area of soybean. These variables explained 97 per cent of the changes in the soybean area.
Lagged soybean area was highly significant. This variable reflected that the area planted with soybean for the current year would most likely be influenced by area planted with it from the previous year. This could be attributed to the inability of farmers to make short-run changes to a fixed input.
Soybean yield:
( ) ( ) ( )1twage0.44lnPI1turea0.11lnPI1tsoy0.49lnFP5.97soylnYH −+−+−−=

Chapter 4
48
In the soybean yield function, agricultural wages and soybean farm gate price were variables found to significantly affect soybean yield. Based on the model generated, the explanatory variables explained 68 per cent of the variations in soybean yield.
4.2.5 Production projections to 2015 Using the area and yield response models of this study, projections for production from
2003 to 2015 were calculated for corn, palay and soybean. These production projections are summarized in Table 4.15.
Projected area harvested. Results of the projections for corn area showed a declining trend. This is partially explained by the projected increasing area for rice. Given that land is a limited natural resource, these projected trends are not far from reality. In fact, these two crops do compete for the same land. From 1993 to 2002, the decline in the harvested area of corn was matched by an increase in the area harvested for rice (BAS, 2002). The exception was in 1998, when both crops experienced decline in area harvested due to the El Niño phenomenon. Similarly to corn, the harvested area of soybean is also declining.
It was observed that the area harvested for both corn and soybean declined while rice increased. Rice is a staple food in the Philippines and given the high rate of population growth, pressure to increase rice production by increasing the harvested area is likely to continue into the next decade.
Projected yield levels. Using the yield response model, growth rates in yield of 1.4 per cent for corn and rice and 1.7 per cent for soybean were estimated. This is quite low in order to meet the high demand for these feed crops. On top of the low growth rates in yield, the present yield levels of corn, rice, and soybean are low anyway.
From 2003, the average yield levels were 1.8 mt/ha for both types of corn, 3.3 mt/ha for rice, and 1.3 mt/ha for soybean. These are projected to reach 2.2, 3.9, and 1.6 mt/ha in 2015, respectively.
Projected production levels and surplus/deficits. Based on the area and yield projections, the production levels were calculated. Results of the projection showed that corn production would decrease from 4.32 million mt to 4.27 million mt. This was largely due to the declining area devoted to corn. Although the projected yield per hectare will increase, this is insufficient to offset the decline in harvested area. A similar trend for soybean can be observed. From 903 mt in 2003, soybean production is projected to decline to 319 mt in 2015. Rice is the only crop that showed an increase in production. It was projected to reach 18.5 million mt by 2015.
Using the projected consumption levels discussed in an earlier part of the chapter, the results indicate huge production deficits for all three crops. This supply deficit was assumed as the projected importation of the crops.
Based on Table 4.16, imports of the identified feed crops and rice were projected to increase until 2015. Corn imports were projected to increase by 7 per cent annually. In terms of the import share of the supply of corn; this would reach 47 per cent in 2015. This scenario implies that the country will import almost half of the domestic corn requirement by 2015. Also, by 2015 the country is estimated to be only 53 per cent self-sufficient in corn. The high dependence of the country on corn imports could be lessened if yield levels per hectare were improved. This would necessitate more productivity enhancing technologies such as the use of Bt corn, as well as the adoption of best farm practices.
On the other hand, it was projected that the country would import almost 100 per cent of its local soybean requirement by 2015. Projections indicated that soybean imports would rapidly rise annually at a rate of 20 per cent. In contrast, the 18 per cent share of imported rice to total local supply in 2015 will curtail the production of rice bran, being the by-product of palay. Imports of rice would also rise by 8 per cent per annum.
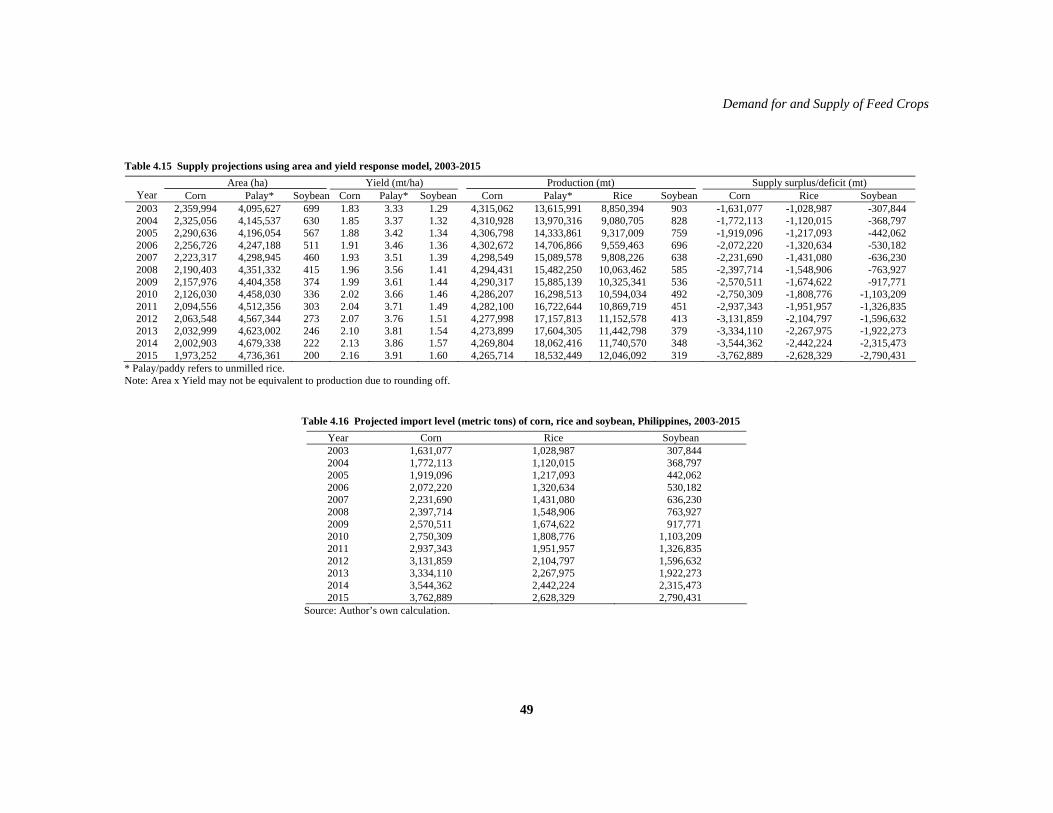
Demand for and Supply of Feed Crops
49
Table 4.15 Supply projections using area and yield response model, 2003-2015 Area (ha) Yield (mt/ha) Production (mt) Supply surplus/deficit (mt)
Year Corn Palay* Soybean Corn Palay* Soybean Corn Palay* Rice Soybean Corn Rice Soybean 2003 2,359,994 4,095,627 699 1.83 3.33 1.29 4,315,062 13,615,991 8,850,394 903 -1,631,077 -1,028,987 -307,844 2004 2,325,056 4,145,537 630 1.85 3.37 1.32 4,310,928 13,970,316 9,080,705 828 -1,772,113 -1,120,015 -368,797 2005 2,290,636 4,196,054 567 1.88 3.42 1.34 4,306,798 14,333,861 9,317,009 759 -1,919,096 -1,217,093 -442,062 2006 2,256,726 4,247,188 511 1.91 3.46 1.36 4,302,672 14,706,866 9,559,463 696 -2,072,220 -1,320,634 -530,182 2007 2,223,317 4,298,945 460 1.93 3.51 1.39 4,298,549 15,089,578 9,808,226 638 -2,231,690 -1,431,080 -636,230 2008 2,190,403 4,351,332 415 1.96 3.56 1.41 4,294,431 15,482,250 10,063,462 585 -2,397,714 -1,548,906 -763,927 2009 2,157,976 4,404,358 374 1.99 3.61 1.44 4,290,317 15,885,139 10,325,341 536 -2,570,511 -1,674,622 -917,771 2010 2,126,030 4,458,030 336 2.02 3.66 1.46 4,286,207 16,298,513 10,594,034 492 -2,750,309 -1,808,776 -1,103,209 2011 2,094,556 4,512,356 303 2.04 3.71 1.49 4,282,100 16,722,644 10,869,719 451 -2,937,343 -1,951,957 -1,326,835 2012 2,063,548 4,567,344 273 2.07 3.76 1.51 4,277,998 17,157,813 11,152,578 413 -3,131,859 -2,104,797 -1,596,632 2013 2,032,999 4,623,002 246 2.10 3.81 1.54 4,273,899 17,604,305 11,442,798 379 -3,334,110 -2,267,975 -1,922,273 2014 2,002,903 4,679,338 222 2.13 3.86 1.57 4,269,804 18,062,416 11,740,570 348 -3,544,362 -2,442,224 -2,315,473 2015 1,973,252 4,736,361 200 2.16 3.91 1.60 4,265,714 18,532,449 12,046,092 319 -3,762,889 -2,628,329 -2,790,431
* Palay/paddy refers to unmilled rice. Note: Area x Yield may not be equivalent to production due to rounding off.
Table 4.16 Projected import level (metric tons) of corn, rice and soybean, Philippines, 2003-2015 Year Corn Rice Soybean 2003 1,631,077 1,028,987 307,844 2004 1,772,113 1,120,015 368,797 2005 1,919,096 1,217,093 442,062 2006 2,072,220 1,320,634 530,182 2007 2,231,690 1,431,080 636,230 2008 2,397,714 1,548,906 763,927 2009 2,570,511 1,674,622 917,771 2010 2,750,309 1,808,776 1,103,209 2011 2,937,343 1,951,957 1,326,835 2012 3,131,859 2,104,797 1,596,632 2013 3,334,110 2,267,975 1,922,273 2014 3,544,362 2,442,224 2,315,473 2015 3,762,889 2,628,329 2,790,431
Source: Author’s own calculation.
Chapter 4
50
Comparing projections with actual data/targets. Using actual yearly data from the past (1989-2002), production projections for the feed crops were evaluated. It was revealed that: (1) projections for corn and rice were generally comparable with the actual data such that deviations only ranged from 1 per cent to 3 per cent; and (2) local soybean production may be overestimated primarily due to data inconsistencies (i.e. the rapid decline in the harvested area of soybean during 1990-2002).
In terms of a comparison of the target area cultivated, production and yield of rice in 2003 to 2004 of the DA GMA-Rice Program, it was revealed that: 1) average area projections for the 2-year period were only 1 per cent higher than the DA targets; and 2) production and yield projections were less than 5 per cent and 8 per cent of the DA targets, respectively for 2003 to 2004.
4.2.6 Development of farming technologies and production arrangements The farming technologies available to farmers cover three aspects. These are improving
yield levels, reducing pest infestations (at the growth stage and storage of crops), and farming practices to make feed crop production more efficient.
The companies providing corn seed technologies are BIOSEED Philippines Inc., Pioneer Hi-Breed Agricultural Technology Inc., Syngenta Philippines Inc. and Asian Hybrid Seed Technologies Inc. These companies provide yellow hybrid seeds and transgenic corn, which is the most controversial new seed technology. The major objective of these technologies is directed towards addressing corn borer infestations – a major pest for Philippine corn production. The potential yield levels of the varieties sold by these firms range from 6.56 to 7.84 mt/ha (PCARRD, 2002). Open-pollinated and white corn varieties that would be suitable for specific areas in the Philippines (e.g. Luzon, Visayas, Mindanao) are also provided by government institutions.
For palay, there are many farming practices and seed technologies that are aimed at reducing pest infestations such as the “Golden Kuhol” or snails, rodents, and stem borers. The major providers of these technologies are PhilRice, the International Rice Research Institute, and the University of the Philippines at Los Baños. Rice seed technologies are also available for various agro-ecological environments such us uplands, lowlands, rainfed and irrigated areas.
Unlike corn and palay, technologies for soybean are not as abundantly explored. However, the most important development for soybean is the recent arrangement between Quedancor and the San Miguel Corporation. They intend to establish a PhP 2 billion soybean plantation in Surigao del Sur and plan to give each participating farmer 1.5 ha of land and access to a PhP 50,000 collateral-free minimum loan. This arrangement would not only give the development of a soybean industry a boost but foreign exchange would be saved from the reduction in soybean imports.
4.3 Trading of feedstuff and feed crops
4.3.1 Import behaviour and structure The Philippines is a net importer of feed crops like corn and soybean as well as other
feedstuffs for animals. Imported feeding stuffs for animals include soybean oil cake/meal, cereal bran, fodder roots, flour, feed additives, and solid food residues among others. The few Philippines feedstuff exports include sugarcane tops, corn cobs/stalks/leaves, waste fruits (peels), wheat bran and other residues, copra oil cake and other solid residues.
Before the accession of the country to the GATT-WTO, corn imports were low. This was the time when import restrictions were in place for corn. Imports then dramatically increased in 1995 when the Philippines started to liberalize the corn sector by removing QRs as required by the WTO trade agreement. Average imports of corn from 1995 to 2002 were 304,000 mt (Table 4.17). Soybean imports, on the other hand, increased at an average annual rate of 29 per
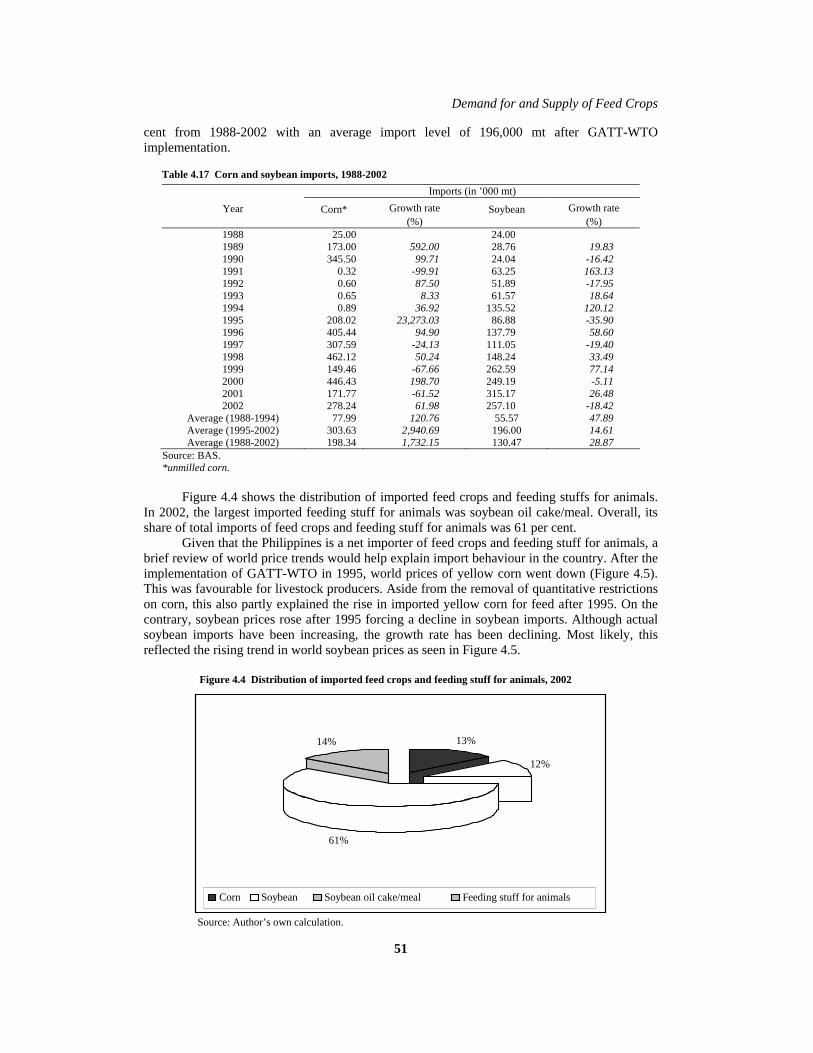
Demand for and Supply of Feed Crops
51
cent from 1988-2002 with an average import level of 196,000 mt after GATT-WTO implementation.
Table 4.17 Corn and soybean imports, 1988-2002 Imports (in ’000 mt)
Growth rate Growth rate Year
Corn* (%)
Soybean (%)
1988 25.00 24.00 1989 173.00 592.00 28.76 19.83 1990 345.50 99.71 24.04 -16.42 1991 0.32 -99.91 63.25 163.13 1992 0.60 87.50 51.89 -17.95 1993 0.65 8.33 61.57 18.64 1994 0.89 36.92 135.52 120.12 1995 208.02 23,273.03 86.88 -35.90 1996 405.44 94.90 137.79 58.60 1997 307.59 -24.13 111.05 -19.40 1998 462.12 50.24 148.24 33.49 1999 149.46 -67.66 262.59 77.14 2000 446.43 198.70 249.19 -5.11 2001 171.77 -61.52 315.17 26.48 2002 278.24 61.98 257.10 -18.42
Average (1988-1994) 77.99 120.76 55.57 47.89 Average (1995-2002) 303.63 2,940.69 196.00 14.61 Average (1988-2002) 198.34 1,732.15 130.47 28.87
Source: BAS. *unmilled corn.
Figure 4.4 shows the distribution of imported feed crops and feeding stuffs for animals.
In 2002, the largest imported feeding stuff for animals was soybean oil cake/meal. Overall, its share of total imports of feed crops and feeding stuff for animals was 61 per cent.
Given that the Philippines is a net importer of feed crops and feeding stuff for animals, a brief review of world price trends would help explain import behaviour in the country. After the implementation of GATT-WTO in 1995, world prices of yellow corn went down (Figure 4.5). This was favourable for livestock producers. Aside from the removal of quantitative restrictions on corn, this also partly explained the rise in imported yellow corn for feed after 1995. On the contrary, soybean prices rose after 1995 forcing a decline in soybean imports. Although actual soybean imports have been increasing, the growth rate has been declining. Most likely, this reflected the rising trend in world soybean prices as seen in Figure 4.5.
Figure 4.4 Distribution of imported feed crops and feeding stuff for animals, 2002
13%
12%
61%
14%
Corn Soybean Soybean oil cake/meal Feeding stuff for animals
Source: Author’s own calculation.

Chapter 4
52
Figure 4.5 World prices (f.o.b.) of yellow corn, rice and soybean, Philippines, 1982-2002
Source: Author’s own calculation.
4.3.2 Major trading partners The U.S. is the major source of imports for corn and soybean. In 2002, 58 per cent of
total imported corn was from the U.S (Table 4.18). Other major sources of Philippine corn imports were China (39 per cent), India (1.77 per cent) and Thailand (1.20 per cent). The value of corn imports in 2002 reached a total of 49 million US$ (f.o.b.). Similarly, soybean imports were mainly sourced from the U.S. which comprised approximately 65 per cent of total soybean imports in 2002 (Table 4.18). To some extent, imports of soybean also came from Argentina (21 per cent) and Canada (12 per cent) to close the supply deficit. In 2002, soybean imports reached a total of 257,000 mt.
Table 4.19 presents the total value of exports and imports in 2002 of feeding stuff for animals by regional trading block. It was only with Japan that the Philippines had a positive trade balance. With respect to ASEAN, the U.S., the European Union and other trade partners, the Philippines has a negative trade balance. Further disaggregating the trading of feedstuffs for animals in these international trading blocks revealed that the Philippines had a negative trade balance of US$ 321 million (f.o.b.) Most of the imported feeding stuff for animals came from the U.S. In terms of value, the share of the U.S. of the total value of imports was 36 per cent. This was followed by Thailand (4 per cent), Singapore (2 per cent), the Netherlands (2 per cent), United Kingdom (1 per cent), and Belgium (1 per cent). Other European and ASEAN countries shared less than 1 per cent (Table 4.20). On the other hand, the country’s major contributors to the export value of domestic feeding stuff for animals were the Netherlands, Japan and Singapore. These countries had a share of 18 per cent, 15 per cent and 7 per cent of total export value respectively.
0 50
100 150 200 250 300 350
1982
1984
1986
1988
1990
1992
1994
1996
1998
2000
2002
Year
Pric
e ($
/mt)
Yellow corn Rice Soybean

Demand for and Supply of Feed Crops
53
Table 4.18 Philippine corn and soybean imports by country of origin, 2002 Corn* Soybean
Country of origin Quantity
Share (%) Value
Share (%) Quantity
Share (%) Value
Share (%)
USA 160.63 57.73 24.29 49.34 166.3 64.68 49.92 57.97 Argentina 0 0 0 0.00 52.9 20.58 23.31 27.07 Brazil 0 0 0 0.00 2.5 0.97 1.4 1.63 Canada 0 0 0 0.00 30.74 11.96 10.3 11.96 China 108.32 38.93 14.04 28.52 2.03 0.79 0.62 0.72 Thailand 3.35 1.20 4.98 10.12 0 0.00 0 0.00 India 4.93 1.77 4.56 9.26 0 0.00 0 0.00 Indonesia 0.87 0.31 1.31 2.66 0 0.00 0 0.00 Others 0.14 0.05 0.05 0.10 2.63 1.02 0.56 0.65 Total 278.24 100 49.23 100 257.1 100 86.11 100
Source: BAS. * unmilled corn, not including sweet corn. Note: Quantity in ’000 metric tons; Value is f.o.b. value in million US$. Share in per cent is with respect to total quantity and value by commodity.
Table 4.19 Total value of exports and imports of feeding stuff for animals, 2002 Feeding stuff for animals* Trade Regional trading block Exports (X) Imports (M) balance (X-M)
ASEAN 2.37 26.05 -23.68 Japan 4.79 0.1732 4.62 USA 0 125.08 -125.08 European Union 7.24 20.96 -13.72 Others 16.59 179.77 -163.18 Total 30.99 352.04 -321.05 Source: BAS. * excluding unmilled cereals. Note: Values are in million f.o.b. US$.
Table 4.20 Trading in feedstuff for animals by country (f.o.b. million US$), 2002
Country Exports Share (%) Imports Share
(%) Total trade
Balance of trade
Belgium 0.003 0.01 3.510 1.00 3.51 -3.51 Brunei 0 0 0 0 0 0 Denmark 0 0 0.821 0.23 0.82 -0.82 France 0 0 2.035 0.58 2.04 -2.04 Germany 0.365 1.18 2.491 0.71 2.86 -2.13 Greece 0.000 0 0.030 0.01 0.03 -0.03 Indonesia 0.007 0.02 3.246 0.92 3.25 -3.24 Ireland 0.000 0 0.053 0.02 0.05 -0.05 Italy 0.591 1.91 0.271 0.08 0.86 0.32 Japan 4.790 15.46 0.173 0.05 4.96 4.62 Luxembourg 0 0 0 0 0 0 Malaysia 0.030 0.10 1.874 0.53 1.90 -1.84 Netherlands 5.628 18.16 6.077 1.73 11.71 -0.45 Portugal 0.000 0 0.005 0.001 0.00 0.00 Singapore 2.285 7.37 7.606 2.16 9.89 -5.32 Spain 0.000 0 1.706 0.48 1.71 -1.71 Thailand 0.044 0.14 13.320 3.78 13.36 -13.28 UK and Northern Ireland 0.657 2.12 3.965 1.13 4.62 -3.31 USA 0.000 0 125.084 35.53 125.08 -125.08 Others 16.59 54 179.770 51.07 196.36 -163.18 Total 30.99 100.00 352.04 100.00 383.03 (321.05)
Source: BAS.

Chapter 4
54
55
5. Measures to Meet Excess Demand
5.1 Potentials and constraints to feed crop expansion – SWOT analysis
An analysis of the strengths, weaknesses, opportunities and threats (SWOT) for the three feed crops under study provides an overview of the problems confronting the feed crop sector. It also shows the strengths and opportunities from where greater development of the sector may arise. Since many of the factors affecting the sector are similar for corn, rice and soybean, the SWOT analyses for the three crops are integrated, detailing similarities and differences as they arise.
5.1.1 Strengths 1. One of the main factors that the feed crop sector may depend upon for its development
is the high demand and consumption of pork and poultry products, as well as fish. This, coupled with the increasing population translates into a high derived demand for corn, rice and soybean for feeds. During the last decade, the pork and poultry sectors have demonstrated that they are indeed bright spots of Philippine agriculture, posting positive growth despite the financial crisis in 1997 and the El Niño phenomenon in 1988. As previously stated, pork and poultry products use feeds that have 65-75 per cent corn as a primary ingredient. As such, a higher demand for livestock, poultry and fishery products will always translate into high demand for corn as feeds. On the other hand, rice is widely available because it is the staple food of Filipinos. Hence, there will always be readily available by-products such as rice bran, rice hulls and broken rice for the livestock sector.
2. The existence of a national programme for corn and rice. A national corn programme is
crucial because it provides the necessary support for the corn sector. Concerns for production, post-harvest and marketing are highlighted and strategies are put in place. The rice sector is fortunate to have an extensive rice programme due to the relatively high budget allocation for its R&D programme. There are two rice R&D institutions in the Philippines, PhilRice and IRRI. In addition, a strong rice R&D network exists. The country has a pool of experts and scientists capable of implementing a rice R&D programme. Like rice, there also exists a corn programme that includes strategies to address the problems and challenges faced by the sector.
3. The known ability of soybean to improve soil productivity. Given the soil degradation
trends in the Philippines, soybean is a good alternative crop because of its known ability to contribute positively to soil amelioration measures.
5.1.2 Weaknesses 1. Lack of infrastructure such as farm-to-market roads, irrigation, post-harvest facilities,
and trading centres lead to high transport and marketing costs and force farmers to sell their produce raw and unprocessed at prices dictated by traders (PCARRD, 2002). The importance of infrastructure in feed crop expansion cannot be overemphasized. A lack of rural infrastructure works against the farmer in two ways: one, farmers don’t have access to cheap inputs and two, their produce cannot make it to the market on time or in good condition. A lack of irrigation facilities, on the other hand, also inhibits production. In the end, farmers suffer because they are unable to produce quality crops,

Chapter 5
56
hence, they receive lower prices for their produce. It is the lack of infrastructure that makes the domestic price of corn uncompetitive. For rice, insufficient irrigation facilities result in farmers planting only during the rainy season when water is available. Farmers are also unable to diversify to other crops, thereby denying the farmers the chance to maximize the use of their lands. The inadequate transport and post-harvest facilities lead to low palay procurement during the wet season. The lack of post-harvest facilities also results in high post-production losses. A moisture content of at least 18 per cent is required for palay to fetch premium prices. This is necessary for quality-milled rice. Without proper post-harvest facilities, farmer’s produce is either not bought or commands low prices. Poor farm-to-market roads negatively affect rice growers since they increase the cost of marketing and the prices of inputs. For soybean, the lack of drying and other post-harvest handling facilities, especially during the wet season, leads to deterioration in the quality of the produce. Due to this, farmers are discouraged from planting soybean. Low quality commands low prices, thus, net farm income from soybean is low.
2. Low level of supply for domestic consumption due to low yield, high cost of
production, unavailability of hybrid seeds and post-harvest contamination. Low yield performance is the main reason why domestic corn production is low. While the livestock and poultry producers rapidly expand their production to meet demand, the corn sub-sector is unable to cope with the demand for corn as feed.
For soybean, there is low productivity among farms due to insufficient or non-application of fertilizers (Mangabat, 1998). Part of the reason for this is the lack of technical expertise on the part of the farmers. Soybean cannot be expected to achieve higher yields without the proper use of complementary inputs such as fertilizers.
The high cost of production due to the high cost of seeds and other inputs is another problem being faced by rice and corn farmers. Quality seeds such as hybrid seeds are necessary to raise production. To achieve their yield potential, hybrid seeds require complementary inputs. The high cost of the seeds and the inputs hinder farmers from fully realizing the potential of hybrid seeds. In addition, the lack of availability of hybrid and certified seeds in some regions poses a problem for farmers, forfeiting their chance to raise yield levels. The government has targeted a harvested area of 1 million ha for certified seeds and 0.8 million ha for hybrid seeds but a limited budget prevents the government from achieving these targets. Domestic rice production costs in the Philippines are generally higher compared to other Asian countries such as Viet Nam, Thailand, Indonesia and China. Consumers are on the losing side because these high costs translate to higher consumer prices. Lower production costs for rice must be pursued in order for the sector to be able to compete in a liberalized economy. Some of the factors that contribute to high production costs are poor farmer access to technology and inputs, and a lack of infrastructure support. Inputs are the key to the efficient production of soybean. If farmers don’t have access to cheaper inputs (seeds and fertilizers) the soybean industry will remain not viable because other measures (such as raising tariffs on imported soybean) are no longer possible.

Measures to Meet Excess Demand
57
The low marketable yield of corn is compounded by the problem of aflatoxin contamination, considerably reducing the quality and price of corn. It is estimated that 70 per cent of corn production is contaminated by aflatoxin.
3. Reducing the area planted with corn and soybean. The area planted with corn, on average, declined by 2.9 per cent from 1988-2002. Since land is fixed and cannot be expanded, sources of growth for corn production can only come from the use of new technologies like Bt corn. For soybean, the declining harvested area and falling domestic production are due to the lack of incentives for farmers to continue planting soybean. Ensuring a market for their produce could help counteract this weakness.
4. Dependence of farmers on government subsidies such as hybrid rice seed procurement.
Rice farmers received generous government subsidies during the Marcos regime (late 1970s to 1980s) up to the Aquino regime (late 1980s). At present, they still receive support but not in the form of subsidies because this is no longer allowed under the GATT-WTO. Too many subsidies, which were supposed to be an incentive, became a disincentive for farmers to do their share of improving their farm operations. Ultimately, once these subsidies were removed and liberalization was introduced, rice farmers had great difficulty coping and competing.
5. Lack of market outlets and good prices for soybean, and few agencies disseminating
technical knowledge on the production and utilization of soybean. Lack of sure markets where good prices are guaranteed discourages farmers from planting soybean. A market is available for soybean amongst the livestock, poultry and aquaculture sectors. However, no transactions occur because there are no means of facilitating the exchange.
Soybean farmers do not receive much support from the public sector. Only a few agencies disseminate technical knowledge on the production and utilization of this crop. Thus, there are also a limited number of soybean farmers. Ultimately, a soybean industry is unable to prosper from its present status.
5.1.3 Opportunities 1. Mechanization of production, processing and handling through the proposed
establishment of the Grains Highway Program (DA Roadmap, 2003). Through this programme, grain quality will be enhanced and logistic costs will also be lessened. Mechanization of production and improving processing and handling through the proposed programme will improve efficiency both in the production and marketing of corn and other commodities by lowering costs.
2. The presence of high yielding and improved varieties of rice and corn and the
conversion with lands planted to traditional varieties to OPV areas, and OPV areas to hybrid areas. Converting traditional seed users to OPV, and OPV to hybrid and improved varieties will greatly increase corn production, thereby increasing the overall supply from domestic production. The conversion of OPV to hybrids will, on average, double the present OPV yield of 3 mt/ha.
The commercialization of Bt corn is a major opportunity for the sector. The Asiatic Corn Borer (ACB) is a major pest in the Philippines. It reduces yield by 4-31 per cent (Teng, Fernandez, and Hofer (1992) and Logroño (1998)). Field trials by Monsanto in 1999 demonstrated that Bt corn not only reduced this pest damage but returned higher yields compared with other varieties (James, 2003). Thus, the potential for Bt corn to

Chapter 5
58
increase farmers’ yield levels would ultimately help increase their income. Therefore, Bt corn is a technology option for farmers. However, since the technology is controversial, proper analysis of the benefits and costs should be conducted, including environmental safety and the ethical concerns of using this new technology. For rice, technologies packaged by R&D institutions like PhilRice and IRRI are readily available. How these technologies could reach farmers for their rapid are large-scale adoption is an important consideration.
3. Increasing demand for soybean and the presence of a contract growing scheme for an
assured market for soybean. A contract growing scheme will assure farmers of a stable source of income. With this scheme, the necessary inputs are readily provided to farmers because the demand side requires quality produce. A major contract grower of soybean in the country is Nestle in the Cagayan province. This scheme would greatly help the sector in terms of soybean as feed due to the increasing population of livestock, as well as food (milk, sauces, tofu, taho, etc.) due to the promotion of soybean as a food supplement. Soybean is also used as feed and as raw materials in the food manufacturing sector. Hence, the potential for an expanded and diverse market is available to farmers.
5.1.4 Threats 1. Feed wheat is increasing in acceptance as a substitute for corn in feed formulations.
Corn has a 35-37 per cent tariff compared to feed wheat’s 7 per cent, making the latter cheaper to import. Inconsistencies in the tariff structure leads to negative effects for corn, such that livestock producers are shifting to wheat instead of corn in their feed formulations. This translates to income losses for local corn farmers.
2. Peace and order problems in Mindanao where the bulk of corn is produced. Mindanao,
referred to as the “land of promise, a land of milk and honey” is undoubtedly resource-rich. The potential growth for Mindanao will remain unrealized so long as the peace and order problem persists.
3. Vulnerability of local production to changing weather patterns (occurrence of floods –
La Niña -and severe drought - El Niño). According to the BAS (2003), 85 per cent of corn losses were due to typhoons and floods. In 2003, 53 per cent of palay crop losses were due to the prolonged dry spell and 41 per cent were due to typhoons and floods. The government should provide alternative livelihood programmes, crop insurance systems and other coping mechanisms to mitigate farmer’s losses during unfavourable weather conditions.
4. Livestock and poultry diseases (e.g. bird flu, FMD, etc.) Demand for feeds is a derived
demand from livestock and poultry. Anything that negatively affects the livestock industry will also negatively impact the feed crop sector. As such, lower demand for feed crops could likewise be expected when livestock and poultry are negatively affected by factors such as bird flu, FMD, and others.
5. Availability of cheap imported rice, soybean and soybean products from other
countries. Rice is cheaper in other Asian countries. In fact, some policy experts advocate for the Philippines to just be a feed crop importer since the country is not in a position to compete due to high production costs. In addition, rice smuggling is also rampant.

Measures to Meet Excess Demand
59
For soybean, the domestic prices on average were above international prices by 53 per cent from 1994 to 1997 (Mangabat, 1998). This makes it difficult for a domestic soybean industry to develop. Raising tariffs on imported soybean is not a viable option. To counteract this problem, the government may resort to training farmers to plant soybean, improving access to cheaper inputs (seeds and fertilizers), and providing infrastructure support.
5.2 Government and private sector initiatives
In order to achieve great strides in feed crop development, a public and private sector partnership is important to ease the supply-demand gap for feed crops. In the Philippines, this partnership is in the form of credit, production technology, infrastructure development, and R&D.
Credit. Credit provides farmers the means to buy quality seeds, fertilizers and other inputs necessary to raise the level of production. Participation of the private sector in the provision of credit to farmers has been to the advantage of the industry. The private sector provides credit arrangements similar to those of the government financial institutions (GFIs) such as the Land Bank of the Philippines and QUEDANCOR. The provincial LGUs as conduits for farmers and farmer organizations using the Internal Revenue Allocations (IRAs) as collateral are being sought as suggested by the DA roadmap for feed crops.
Production Technology. Technologies used in the production of feed crops determine their level of productivity. For corn, seed multiplication is undertaken mainly by private multinational companies such as Monsanto, Cargill and Pioneer. Private in nature, these companies are perceived to be purely profit-driven and have little or no concern for the environment or for farmers’ welfare. The government makes sure that the supply of seeds is accessible to farmers while encouraging the private sector to balance their profit-driven seed technology generation with the environment and farmer’s welfare. The government, however, does not fully rely on private sector R&D. It also continues to invest in seed production technology research. For rice, the Philippine Rice Research Institute (PhilRice) takes the lead in technology generation, technology distribution and extension. The government has to take full advantage of the presence of the International Rice Research Institute (IRRI), through the access of technologies and other services it offers.
The government also promotes the use of high quality seeds through its extension programmes and field demonstrations. In addition to the extension programmes of PhilRice, DA, and other government SCUs, the local government units, the main units tasked with extension need to ensure that farmers have access to high quality seeds and provide the necessary information on the technology.
Infrastructure development. A vital area that needs the government’s attention is infrastructure development, such as farm-to-market roads, irrigation and post-harvest facilities. Improving infrastructure, especially in rural areas, will go a long way in helping local feed crop farmers achieve development and eventually compete under a liberalized economy. The roll-on roll-off (Ro-Ro) system bannered by the Arroyo administration is a step in the right direction to improve transportation from the various islands, especially from Mindanao. Ro-Ro is a transportation system that enables the movement of vehicles across islands. There has been no assessment of this system yet, especially as to its impact on transportation costs, the flow of goods including agricultural goods, and the effect on corn farmers in Mindanao.
Private sector participation is also being sought by the government to provide infrastructure support. Specifically, the government hopes that the private sector can invest in shallow tube wells and mechanical dryers.
Research and development. In the Philippines, agricultural R&D in general receives little budgetary support. The government spends only about 0.4 per cent of GVA in contrast to the World Bank recommended level of 1 per cent for developing countries. For corn and

Chapter 5
60
soybean, budgetary support is low even though these are major feed crops and necessary to boost the local livestock industry. David, et al. (1999) suggested that some of the R&D budget for rice be transferred to corn to correct this. There is no doubt that there are high returns in investing in R&D. Private sector R&D, on the other hand, focuses only on varietal development (e.g. hybrid and Bt seeds). Other areas of collaboration with the private sector include R&D on irrigation, mechanical dryers and marketing management.
Feed crop farming. The government aims to improve farmers’ technical skills (i.e. proper use of quality seeds, optimal use of fertilizers, and farm management skills) for feed crop farming. For corn, the government hopes to elevate yield levels by improving seed technologies used in production. These include improving OPV yield levels, encouraging the use of hybrid seeds, and providing access to Bt corn. Concerning the use of Bt corn, the government needs to properly monitor the use of the technology, address environmental and consumer concerns raised by some sectors in society, train farmers, and present its benefits and costs. Only with substantial training and information can farmers make good farming decisions. At present, only a draft soybean road map is in place. In order to encourage farmers to plant soybean, the government needs to provide information on cultural management and production practices, in addition to ensuring its market.
Response to market development. A market is what drives farmers to produce. Information asymmetry discourages farmers to produce. Lack of infrastructure such as roads and post-harvest facilities leading to waste is yet another area that affects marketing. For corn, the demand centres where most feed mills are located are in Luzon, while the bulk of production is in Mindanao. Feedmillers opt not to locate in Mindanao due to the peace and order situation and the high cost of transporting their feeds to Luzon where the majority of the livestock producers are located.
In order to address these problems, two key areas need to be pursued. To address the problem of farmer’s access to information, market matching can be done. In this way, a guaranteed market is given to farmers at the same time ensuring them premium prices for their produce. The peace and order problem in Mindanao is complex as it involves economic, political and socio-cultural issues. Suffice to say that addressing the economic issues is tantamount to providing economic opportunities for the Filipinos in Mindanao. A genuine peace deal with the muslim separatists in Mindanao must be brokered to achieve national unity to achieve development.
Response to manufacturing development. Although corn and soybean are primarily used as feed crops, they are also used as raw materials in the food and cosmetic manufacturing sectors. Corn is increasingly being utilized as processed snacks such as chips, as well as used in cosmetic products and adhesives. Soybean is also used as soy milk, tofu, and soy sauce, among others. These alternative uses for corn and soybean increase their demand and are therefore positive for the farmers because they increase the farm gate prices. Developing these products, however, competes with feed production. The government should therefore work harder to ensure increased production of corn and soybean.
Trade cooperation and liberalization. The Philippines is signatory to three major agreements that aim to liberalize trade, thereby, opening the economy to foreign competition: GATT-WTO, AFTA, and APEC. Benefits obtained by the country from these agreements include access to cheaper inputs like seeds and fertilizers for feed crop production, and access to new technologies for feed crop production improvement (e.g. biotechnology, farm mechanization technologies etc.). It is thus important that the government provide the necessary support to the feed crop sector consistent with the rules of these trade agreements.
Liberalized trade means that the country has to focus on commodities with competitive advantage since the Philippines is a net importer of agricultural products. However, trade liberalization and a dependence on imports implies exposing the country’s smallholder livestock production systems to international competition. Since agriculture in general and livestock in particular are not globally competitive, safety nets and shields have to be set up in terms of
Measures to Meet Excess Demand
61
technological breakthroughs to increase and sustain productivity, as well as capacity building. Trade liberalization may help food security, but the implications on the net economic gains have to be carefully analyzed, particularly the small producers.
Given that livestock is a labour intensive venture and feed crop production is land intensive, it is possible that in the long run, the Philippines will shift to livestock production since the country has a large labour force. The challenge, however, is determining whether the growth in these sectors will offset the losses from feed crop farmers, especially corn farmers that are likely to be displaced by trade liberalization. Habito (2002) cites this scenario in a few East Asian countries that concentrated on developing their livestock and poultry sectors rather than producing feed crops.

Chapter 5
62

63
6. Summary, Conclusions and Recommendations
The study was conducted to take a closer look at the status and prospects of the domestic feed crop sector in the Philippines as they functionally relate with the expected growth of the local livestock industry. In this study, the Philippine domestic feed crop sector is composed of the livestock and aquaculture sectors on the demand side and the corn, palay (rice) and soybean sectors as well as the feed milling industry on the supply side. The study analyzed the current status and future trends of the supply and demand of feed crops; evaluated the strengths, weaknesses, opportunities and threats for expanding feed crop farming in the Philippines; and formulated relevant policy recommendations to promote the sustainable development of feed crop farming in the Philippines.
6.1 Summary and conclusions
Results of the study revealed that demand for corn, palay and soybean is expected to increase in coming years. This was attributed to the increasing demand for feeds due to the rising demand for swine and poultry products, an increasing population, and increasing demand from the industrial and manufacturing sectors. The growth in corn and rice production over the past 15 years will be unable to keep up with the high demand. Thus, huge supply deficits are anticipated. Ultimately, import volumes are expected to increase to fill these deficits unless something can be done to increase domestic output.
Livestock production trends, especially swine and poultry exhibited positive growth (5-8 per cent) over the last 15 years. Likewise, the aquaculture sector registered 6 per cent expansion during the period. Thus, there is room for the feed crop sector to expand and this is crucial to meet the volume and quality demanded, especially corn and soybean. Imports of these feed crops, however, are inevitable.
The feed crop sector is closely linked with the swine and poultry sectors, where as much as 60 per cent of the sector’s production costs are accounted for by feeds. Many commercial swine and poultry firms that are vertically integrated into feed milling enterprises have reduced their feed costs, allowing them to be more price competitive (Habito, 2002). In the Philippines, however, commercial firms produce only a small percentage of total animal inventories since 77 per cent of swine and 99 per cent of cattle and carabao are backyard raised. This implies that improving the competitiveness of the livestock and poultry sectors means providing access to cheap and quality feed crops and livestock production arrangements that would consolidate backyard farmers. Consolidated backyard farmers could also follow commercial firms and vertically integrate with feed milling enterprises. Also, being consolidated as a group provides them with bargaining power that would allow them to have access to inputs at lower prices.
Trends in harvested areas and production for corn, palay and soybean were reviewed. For corn and soybean, a decline in harvested area by 3 per cent and 11 per cent per annum, respectively, were observed from 1988 to 2002. Corn production, on the other hand, rose annually due to its annual yield increase of 3 per cent. In the case of soybean, the decline in planted area and minimal yield growth brought about an annual decrease in production of 10 per cent. This was evidenced by the 0.4 per cent contribution of local soybean farmers to total supply in 2002. On the contrary, rice experienced a positive annual production growth of 4 per cent and yield improvement of 3 per cent per annum. The declining planted area and minimal yield improvements contributed to the supply deficits for these feed crops.
Human consumption trends were likewise presented for the three feed crops as well as other foods (e.g. meat and cereals). Based on FNRI surveys, there was a declining trend in per

Chapter 6
64
capita consumption of cereals and cereal products by 2.51 per cent from 1978-1993. This was mainly due to the decline in the consumption of rice, corn and their products. On the other hand, meat, and poultry, and their products had increasing consumption trends - 15.6 per cent and 29.5 per cent respectively. The rise in consumption of meat and poultry signals a future increase in the demand for corn, rice and soybean as feed in the next decade.
Based on FCRs from past studies, feed crop production, consumption of livestock, and economic data from 1988-2002, a preliminary projection for the demand of corn, rice bran and soybean meal from the livestock sector was made. Results indicate that the demand for corn as feed could range from 6.3 to 6.7 million mt by 2015, while demand for rice bran would be 2.5 million mt, rice as feed 0.9 million mt, and approximately 2.7 million mt for soybean meal. However, projections on production, given current harvested area and yield growth rates, indicate that domestic supply would not be able to meet this high demand. Assuming that local production will only be channeled to feed utilization, only 65 per cent of corn feed and 75 per cent of rice bran demand could be met by local production. Soybean demand would almost entirely be met by imports.
These sufficiency levels could still be raised. Firstly, most farmers have not achieved the potential yield levels for corn and rice and soybean farmers are very few in number because of the lack of technical skills required for soybean production and the uncertainty of the market. Secondly, in the short-term, relying solely on imports is not necessarily the best option because of the predicted increase in demand for meat and poultry products from other Southeast Asian countries. This means an increase in the derived demand for these feed crops within other countries and hence, volatility in world market prices could be expected.
6.2 Recommendations
Given the variety of issues and problems raised, the study puts forth the following recommendations to address the weaknesses and threats, and to take advantage of the strengths and opportunities of the feed crop sector as illustrated by the SWOT analysis:
1. The government needs to pursue the implementation of programmes aimed at helping the feed crop sector, such as the National Program for Corn and Rice as well as the Grains Highway Program. These programmes address the production, post-harvest and marketing needs of the sector, including providing technical assistance, hybrid seeds, certified seeds, access to inputs, credit, etc.
2. Given the new world trade order, the government should implement the promised
safety net measures in order for the country to deal with competition from other countries. These provisions for safety nets were enunciated by the government as a promise to the agricultural sector when it became a signatory to GATT-WTO. Most crucial are the safety nets relating to infrastructure and support services.
The lack of good farm-to-market roads has been a persistent problem in the development of the agricultural sector in general. There is a need to improve the road infrastructure in rural areas. Competitiveness in feed crop production cannot be achieved under a liberalized trading regime without proper farm-to-market infrastructure. The development and rehabilitation of irrigation facilities is equally important. Irrigation facilities allow farmers to increase their number of croppings per year, thereby increasing overall production. Irrigation should be present not only for rice but for other commodities as well.

Summary, Conclusions and Recommendations
65
Likewise, post-harvest facilities are important. In particular, the lack of proper storage facilities has caused large losses due to aflatoxin contamination and spoilage in corn. For soybean, the lack of drying facilities deteriorates the quality of the produce. Livestock and poultry producers are also disadvantaged because reductions in supply cause volatility in domestic prices. The government should provide loans to farmer organizations or cooperatives to erect storage facilities. The farm-cluster approach used by the government is a good approach to be used in developing post-harvest facilities for a group of farmers.
3. Farmers should be provided access to new technologies through a well supported extension system as well as a well managed credit system to support the use of the said technologies.
4. The study indicated that there is low yield performance in the country for corn, rice and
soybean compared to other countries. This is mainly due to insufficient input application brought about by high costs of production and low technical knowledge level, particularly for soybean production. Aside from reaching out to the farmers on a programme basis as recommended in point (1), the government should actively engage in the dissemination of technologies, such as HYVs and improved varieties, through an extensive, long-term and sustainable extension programme designed to capacitate the extension workers at the local government units. The link between the research institutes, including the DA and the LGUs should be strengthened and sustained.
It is widely believed that the use of HYVs can offset the effect of a declining area planted with agricultural commodities. While the use of Bt corn has so far demonstrated positive gains, the study recommends that the government should actively monitor and evaluate the long-term effects of the new technology on the environment, the farmers and the consumers.
5. A solution to the peace and order problem in Mindanao will benefit not only the feed
crop sector but also the country as a whole. The government should be sincere in its effort to resolve this issue so that this long-term problem can be addressed.
6. On the issue of credit and access to capital, production arrangements like the recent P2
billion collaborative project of the San Miguel Corporation and Quedancor for a soybean plantation in Surigaro del Sur is a model to observe. The project involves developing a 400 ha soybean plantation. If this is successful, similar arrangements for corn can also be made, consolidating farmers’ land into one big plantation and providing them with farming support. The advantage of this model is that farmers can access quality seeds, new farming technologies, as well as a sure market. For corn, the possible partners are the livestock and poultry growers. Market tie-ups could be pursued and these livestock and poultry producers could provide credit and quality seeds. This would also help ensure that they receive quality feed crops.
7. Markets have always played a role in agriculture. Today, large supermarkets have
tremendous influence on the taste and preferences of consumers. Supermarkets also provide a feedback mechanism for consumers to the producers of goods. They impose quality and safety standards and their procurement systems are shifting towards contract markets. Hence, supermarkets will, in the future, be major players in agricultural marketing. In livestock and aquaculture, supermarkets can influence prices by serving as a link between feed crop producers and millers and the livestock integrators. Supermarkets can use their influence on livestock producers to enter into

Chapter 6
66
contract schemes with feed crop farmers. This will ensure supply for the livestock producers and a ready market for the farmers.
8. Transnational corporations can also help the feed crop sector in the country.
Agricultural transnational corporations can help the development of the sector in improving the present agribusiness systems, as well as in providing skills to the manpower or labour working within the sector. Although it is widely perceived that these corporations are profit-oriented, the opportunity for technology transfer from these corporations to the public sector through a number of schemes such as contract farming is present. These corporations have very strong R&D and have perfected vertical and horizontal integration across the production processes and across countries. They will remain as major players in the industry and dealing with them is inevitable. The country might as well take advantage of the opportunities they provide by signing contracts with these corporations.

67
7. References
AgriSource Co. Ltd., 2001. Philippine Feedgrains Import Tariffs Policy Study. A report submitted to the US Grains Council, Bangkok, Thailand.
Aquino, A.P. et al., 2002. Policy Brief: Food Security, Global Competitiveness, Technological Innovation, and Philippine Rice, Some Insights from Existing Literature, Los Banos, Laguna, Philippines: PCARRD.
Animal Feeds Standard Division, Bureau of Animal Industry, data series for various years on feeds.
Argañosa, V.G., et al., 2004. 2003 Swine Production Performance in the Philippines. Philippine Swine Industry Research and Development Foundation, Inc. and Philippine Council for Agriculture, Forestry and Natural Resources Research and Development.
Balisacan, A. and Hill, H. (eds.), 2003. The Philippine Economy: Development, Policies, and Challenges, Quezon City: ADMU Press.
Brown, E.O., Daite, R.B. and Cardenas D.C., 2003. Simulating the Effects of Trade Liberalization Policies on Philippine Agriculture, Los Banos, Laguna, Philippines.
Bureau of Agricultural Statistics, data series for various years on agriculture. (http://www.bas.gov.ph).
Bureau of Postharvest Research and Extension, 2004. (http://www.bpre.gov.ph/phindustry/ soybean.htm).
Cardenas, D.C., 1996. Socio-economic Impact of Agricultural Land Conversion in Cavite, Philippines. Journal of Agricultural Economics and Development 24(1 & 2).
Cardenas, V.R., 2003. Synthesis of Agricultural Extension in the Philippines: Strategies for Effective Technology Promotion. A synthesis of the paper presented by T.E. Contado during the 1st Annual Philippine Corn Symposium and Planning Workshop at the Montevista Resort, Calamba City, Laguna, Philippines, January 15, 2003.
Carlos, C.A., 2004. Livestock and Meat Business: Local Feedmillers See Growth Amid Changes. Madrid Digest 1(1).
Catelo, S.P., 2003. The Philippines. Pacific Food System Outlook 2003-2004. Congressional Planning and Budget Department, House of Representatives. Sectoral budget
analyses (A supplement to the analysis of the President’s Budget for FY 2003), Manila, Philippines.
Contado, T.E., 2003. Agricultural Extension in the Philippines: Strategies for Effective Technology Promotion. A paper presented during the 1st Annual Philippine Corn Symposium and Planning Workshop at the Montevista Resort, Calamba City, Laguna, Philippines, January 15, 2003.
Corn R&D Commodity Team, 2003. R&D Status and Directions (2000 and beyond): Corn, Los Baños, Laguna: PCARRD-DOST.
Costales, A.C., 1995. Industrial Uses of Corn and its Potentials in the Philippines. Final report. Philippines: Agribusiness Systems Assistance Program.
Costales, A.C., 1990. Integrating the Philippine Corn and Livestock Markets: A Derived Demand Model. Unpublished dissertation paper PhD Agricultural Economics. University of Philippines Los Baños.
Costales, A.C., 1997. The New World Trade Environment and the Primary Sector: Adjustments of Corn Industry at the Regional and Provincial Levels, Quezon City: Center for Integrative Development Studies (CIDS), University of the Philippines Diliman.
Cruz, P.S., 1997. Aquaculture Feed and Fertilizer Resource Atlas of the Philippines, Rome, Italy: FAO Fisheries Technical Paper No.366.
Chapter 7
68
David, C.C., Ponce, E.R., Halos, S.C. and Lamug, C.B., 1999. Philippine National Agricultural and Natural Resources Research System: Resource Allocation Issues and Directions for Reform. PIDS Discussion Paper Series No. 99-33, Makati City, Philippines: Philippine Institute for Development Studies.
David, C.C and Balisacan, A., 1995. Philippine Rice Supply Demand: Prospects and Policy Implications. PIDS Discussion Paper Series no. 95-28, Makati City, Philippines: Philippine Institute for Development Studies.
Department of Agriculture Corn and Rice Roadmaps, 2003. Diliman, Quezon City, Philippines. Estrada, J.U. and Bantilan, M.C.S., 1991. Supply and Demand Elasticities for Major
Agricultural Commodities in the Philippines: National and Regional Estimates, Australia: Australian Centre for International Agricultural Research. Netherlands: International Service for National Agricultural Research.
Food and Nutrition Research Institute, data on nutritional status of Filipinos in various years. (www.fnri.dost.gov.ph).
Friginal, A.T., 2003. The Feed Milling Industry, the Little Industry that Could. Madrid Digest 14(11).
Gonzales, L.A., 2000. Breaking New Ground, Los Baños, Laguna: STRIVE Foundation. Griffiths, W. and Thomson, G., 1999. Predicting Output from Seemingly Unrelated Area and
Yield Equations. (http://www.une.edu.au/feb1 /econstud/wps). Habito, C.F., 2002. Annex IV: Impact of International Market Forces, Trade Policies, and
Sectoral Liberalization Policies on the Philippines Hogs and Poultry Sector. (http://www. fao.org/WAIRDOCS/LEAD/X6371E/x6371e0e.htm).
James, C., 2003. Global Review of Commercialized Transgenic Crops: 2002, Feature: Bt Maize. ISAAA Briefs No. 29, Ithaca, NY: ISAAA.
Karunatilake, K.E., 2003. Prospects of Feed Crops in Sri Lanka: the Role of CGPRT Crops. CGPRT Centre Working Paper No. 67, Bogor, Indonesia: CGPRT Centre.
Lapiña, G.F., 2004. Factors Affecting the Willingness of Corn Farmers to Buy Bt Corn. Unpublished research paper for completion of degree in Masters in Development Economics, Quezon City: University of the Philippines Dilliman.
Logroño, M., 1998. Yield Damage Analysis of Asiatic Corn Borer Infestation in the Philippines, General Santos City: Cargill, Philippines Inc.
Maharjan, B. Lal., 2003. Prospects of Feed Crops in Nepal: the Role of CGPRT Crops. CGPRT Centre Working Paper No. 65, Bogor, Indonesia: CGPRT Centre.
Mangabat, M.C., 1998. Effects of Trade Liberalization on Agriculture in the Philippines: Institutional and Structural Aspects. Working Paper No.37, Bogor, Indonesia: CGPRT Centre.
Mateo, J.M., 2003. Status and Prospect of the Philippine Feed Industry. A powerpoint presentation discussed during the 1st Annual Philippine Corn Symposium and Planning Workshop at the Montevista Resort, Calamba City, Laguna, Philippines, January 15, 2003.
Molina, J.Q., 2003. Feed Industry Status and Prospects. A paper presented during the 1st Annual Philippine Corn Symposium and Planning Workshop at the Montevista Resort, Calamba City, Laguna, Philippines, January 15, 2003.
National Agribusiness Corporation (NABCOR) and the SEAMEO Regional Center for Graduate Study and Research in Agriculture (SEARCA), 1999. The Effects of Trade Liberalization on the Philippine Livestock Industry, Los Baños, Laguna, Philippines.
National Food Authority, 2005. (http://www.nfa.gov.ph/about.html). National Statistics Coordination Board. Philippine Statistical Yearbook, various years.
(http://www.nscb.gov.ph). National Statistics Office, data series on trade, economic indices, etc. http://www.census.gov.ph. Pathak, P.S., 2003. Prospects of Feed Crops in India: the Role of CGPRT Crops. Working Paper
No. 64, Bogor: Indonesia: CGPRT Centre.

References
69
Philippine Institute for Development Studies, data series on agriculture, etc. (http://www. pids.gov.ph).
PHILSAN, 2003. Feed Reference Standards, Philippines: Philippine Society of Animal Nutritionists (3rd edition).
Rice R&D Commodity Team 2001, 2002. R&D Status and Directions (2000 and beyond): Rice, Los Baños, Laguna: PCARRD-DOST.
Rosegrant, M.W., et al., 1995. Global Food Projections to 2020: Implications for Investment. Discussion Paper 5, Washington, D.C.: International Food Policy Research Institute.
Soybean Market Overview. 2004. (http://www.wheatlandbrokerage.com/soybean-futures-overview.htm).
Teng, P.S.P.G., Fernandez and Hofer, J., 1992. Pest and Loss Assessment on Field Corn in Three Philippine islands. Proceedings of the Third International Conference on Plant Protection in the Tropics, Genting Islands, Malaysia, March 20-22, 1990 (Vol. V), Kuala Lumpur: Malaysian Plant Protection Society.
University of Asia and the Pacific, 1999. Global Competitiveness Strategies for Philippine Agribusiness: Competitive Analysis and Benchmarking Study. Manila, Philippines: UA&P.
University of Asia and the Pacific, 2000. Food and Agribusiness Yearbook: Millennium Edition. Philippines.

Chapter 7
70

71
Appendices
Appendix Table 1 Results of the demand analysis of the feed crops, Philippines, 1982-2002 Food Feed Other uses Independent variable Corna Palay Soybean Corna Palay Soybean Corna Palay Soybean
Constant 27.73*** -6.06*** -122.82*** 7.52*** 18.37*** -44.09*** 23.67*** -41.88*** 1.0*** (11.472) (-2.599) (-7.555) (5.873) (6.808) (-6.517) (6.628) (-3.752) (435.920)Corn retail price -0.31* 0.44** (-1.673) (2.377)Palay retail price -0.81*** -0.09ns
(-3.737) (-0.586)Soybean wholesale price -0.34ns 0.12ns (-0.681) (0.283) Population 1.36*** 5.30*** (12.299) (5.432) Per capita GDP/income -0.47** 0.36** 4.83*** (-1.993) (2.453) (3.398) Corn wholesale price -0.08ns (-0.545) Palay wholesale price (t-1) -0.31ns (-1.353) Egg production -1.57*** (-3.309) Poultry production 0.22* 1.12*** 2.78*** (1.862) (2.895) (9.409) Pork production 0.47*** 0.46* (3.904) (1.828) Corn feed and food use -0.45*** (-4.736)Palay feed and food use 2.54*** (3.342)Soy feed and food use 1.00*** (7304.34)Corn Area 0.48*** (4.353)Palay Area 0.26ns
(0.185)R2 (%) 65.4 95.9 89.2 96.3 82.6 89.3 92.2 71.1 100Significance of model *** *** *** *** *** *** *** *** ***Source: Author’s own calculation.

Appendices
72
Appendix Table 2 Results of the supply analysis for corn, palay and soybean, Philippines, 1982-2002 Dependent variable
Area Yield Independent variable Corn Palay Soybean Corn Palay Soybean
Constant 13.84*** 12.63*** 2.24** 4.87*** 1.85ns 5.97*** (24.243) (3.661) (2.372) (4.843) (1.012) (4.655)Corn farm gate price(t-1) 0.81*** -0.15ns 0.41ns -0.25** (2.805) (-0.823) (0.703) (-2.093)Palay farm gate price(t-1) -0.45ns 0.09ns -1.94*** -0.09ns
(-1.061) (0.343) (-2.725) (-0.782)Soybean farm gate price(t-1) 0.23ns -0.26** 0.35ns -0.49*** (1.367) (-2.128) (1.067) (-3.027)Palay area harvested(t-1) 0.21ns
(0.955)Soybean area harvested(t-1) 0.95*** (10.728)Urea price(t-1) -0.18** -0.02ns 0.11ns
(-2.341) (-0.275) (0.906)Wages(t-1) 0.69*** 0.03ns 0.44* (3.835) (0.272) (1.929)Palay yield(t-1) 0.77*** (3.316)R2 (%) 64.3 60.4 96.9 90.7 77.7 68.4Significance of model *** *** *** *** *** ***Source: Author’s own calculation. Notes: *,**,*** - significant at 10 per cent, 5 per cent, and 1per cent levels, respectively. ns - not significant. a Data used is from the GMA-Corn Program because it approximates feed use in corn. Data was also estimated for feed
use (1982-1989). values in parentheses are t-values. (t-1) lagged values by 1 year.