TABLE OF CONTENTS · 2019-06-01 · TABLE OF CONTENTS. CHAPTER 1: EXECUTIVE SUMMARY 8 . 1.1...
304
2
Transcript of TABLE OF CONTENTS · 2019-06-01 · TABLE OF CONTENTS. CHAPTER 1: EXECUTIVE SUMMARY 8 . 1.1...
2

TABLE OF CONTENTS
CHAPTER 1: EXECUTIVE SUMMARY 8 1.1 National circumstances relevant to Greenhouse Gas emissions and removals 9 1.2 Greenhouse Gas Inventory Information 9 1.3 Policies and Measures 10 1.4 Projections and the total effects of policies and measures 11 1.5 Adapting to Climate Change 11 1.6 Financial Resources 13 1.7 Research and Systematic Observation 14 1.8 Education, Training and Public Awareness 15
CHAPTER 2: NATIONAL CIRCUMSTANCES RELEVANT TO GREENHOUSE GAS
EMISSIONS AND REMOVALS 16
2.1 Government Structure 17 2.2 Geographic and Climate Profile 17 2.3 Population 18 2.4 Economic Profile 19 2.5 Industrial Profile 19 2.6 Energy 20 2.7 Transport 25 2.8 Waste 26 2.9 Building Stock and Urban Structure 29 2.10 Land-use 31
2.10.1 Agriculture 31 2.10.2 Forestry 32 2.10.3 Peatlands 33
CHAPTER 3: GREENHOUSE GAS INVENTORY INFORMATION 34 3.1 Introduction 35
3.1.1 Overview of national emissions 35 3.2 National Inventory system 37
3.2.1 Inventory system – Institutional and Procedural arrangements 37 3.2.2 Inventory planning 38 3.2.3 Overview of Inventory preparation and management 39 3.2.4 Inventory preparation 39 3.2.5 Data collection and storage 41 3.2.6 Methodologies and emission factors 42
3.2.6.1 Carbon Dioxide C02 45 3.2.6.2 Methane CH4 45 3.2.6.3 Nitrous Oxide N20 45
3.2.7 Overview of key categories 45 3.2.7.1 Key categories at IPCC Level 2 46 3.2.7.2 Disaggregated key categories 47
3.2.8 Process for the recalculation of previously submitted Inventory data 49
2

3.2.9 Uncertainty assessment 49 3.2.10 Quality assurance and quality control 51 3.2.11 Procedures for consideration and approval of the Inventory 52
3.3 Emissions by Greenhouse Gas 52 3.3.1 Carbon Dioxide 53 3.3.2 Methane 54 3.3.3 Nitrous Oxide 54 3.3.4 HFCS, PFCS and SF6 54
3.4 National Registry 55 ANNEX I to Chapter 3 64 ANNEX II to Chapter 3 65 ANNEX III to Chapter 3 93
CHAPTER 4: POLICIES AND MEASURES 94 4.1 Introduction 95 4.2 Policy making process 95 4.3 Policies and measures at the National level 96 4.4 Cross sectoral policies and measures 97
4.4.1 EU Emissions Trading Scheme 97 4.4.2 Effort Sharing Decision 98 4.4.3 Flexible mechanisms of the Kyoto Protocol 98 4.4.4 Carbon Tax 99 4.4.5 Accelerated Capital Allowances 99
4.5 Built Environment 100 4.5.1 New buildings 100 4.5.2 Existing buildings 102
4.6 Transport 106 4.6.1 Encouraging lower emissions cars in the national fleet 106 4.6.2 Biofuels obligation scheme 107 4.6.3 Modal shift measures 107 4.6.4 Energy Efficiency Measures 108 4.6.5 Spatial Policy 109
4.7 Industry Sector 112 4.8 Renewable Energy – Electricity Generation & Heat 113 4.9 Agriculture 115
4.9.1 European Common Agricultural Policy 116 4.9.2 Methane and Nitrous Oxide Emissions 117 4.9.3 Animal Husbandry 119 4.9.4 Research 121 4.9.5 Manure Management and Agricultural Soils 121
4.10 Waste 122 4.11 Forestry 124 4.12 Policies and Measures No Longer In Place 126
4.12.1 Time limited schemes 126 4.12.2 Superseded Policies and Measures 127 4.12.3 Other Policies and Measures no longer in place 127
3
CHAPTER 5: PROJECTIONS AND THE TOTAL EFFECTS OF POLICIES AND MEASURES 135
5.1 Introduction 136 5.2 Projections of Greenhouse Gas Emissions 136 5.3 Projections by sector 137
5.3.1 Projections by sector (‘with measures’ scenario) 137 5.3.2 Projections by sector (‘with additional measures’ scenario) 138
5.4 Projections by gas 138 5.4.1 Projections by gas (‘with measures’ scenario) 138
5.5. Methodological approach 139 5.6 Sectoral analysis and total effects of policies and measures 142
5.6.1 Energy industries 142 5.6.2 Manufacturing industries and construction 143 5.6.3 Transport 143 5.6.4 Residential 144 5.6.5 Commercial / Institutional services 145 5.6.6 Industrial process 146 5.6.7 Solvents and other product use 147 5.6.8 Agriculture 147 5.6.9 Waste 147
5.7 Memo Items 148 5.8 Forestry 148 5.9 Sensitivity Analysis 148 5.10 Supplementarity 149 5.11 Emission projections to 2030 150 ANNEX I to Chapter 5 152
CHAPTER 6: ADAPTING TO CLIMATE CHANGE 154 6.1 Introduction 155
6.1.1 National Climate Change Adaptation Framework 156 6.1.2 Research Support 157
6.2 Adapting to climate change in Ireland – Expected Impacts 159 6.2.1 Introduction 159 6.2.2 Climate Change Impacts for Ireland 160 6.2.3 Dissemination and Capacity Building 162
6.3 Vulnerability assessment 162 6.3.1 Introduction 162 6.3.2 National vulnerability assessment 163 6.3.3 Future research support 163
6.4 Flood Risk 163 6.5 Integrated Coastal Zone Management 164 6.6 Ireland’s contribution to EU work on Adaptation 166 6.7 International cooperation on Adaptation 167
CHAPTER 7: FINANCIAL RESOURCES 171 7.1 Introduction 172
4

7.2 Fast Start Finance 2010-2012 172 7.3 Bilateral Activities 172 7.4 Multilateral Activities 173 7.5 Climate Finance – The Future 174 7.6 Carbon funds and other Investments 175 7.7 Contributions to the Global Environment Facility 176 7.8 Contributions to Multilateral Institutions and Programmes 178 7.9 Bilateral and Regional financial contributions to the implementation of the Convention 180
CHAPTER 8: RESEARCH AND SYSTEMATIC OBSERVATION 187 8.1 Introduction 188 8.2 General Policy on funding of Research and Systematic Observations 188 8.3 Exchange of data and information 190 8.4 Climate Change Research 190
8.4.1 Climate Process and Climate Systems Studies including Paleoclimate 190 8.4.2 GHG Emissions and Sinks 190 8.4.3 Peatlands 191 8.4.4 Top down analysis of GHG emissions and sinks 192
8.5 Modelling and Prediction, Impacts and Adaptation 193 8.5.1 Observations and Indicators of Climate Change 193 8.5.2 Projections of Climate Change 193 8.5.3 Analysis of Impacts, Risk, Vulnerability and costed adaptation options 194 8.5.4 Paleoclimateology 194 8.5.5 Information systems and supports for policy and decision making 195
8.6 Socio-Economic Analysis and Technologies 195 8.6.1 Socio-economic analysis 195 8.6.2 Mitigation Technologies 195 8.6.3 Model Development 196
8.7 Cross cutting Issues 196 8.7.1 Aerosol Radiative Impacts 196
8.8 International Participation 196 8.9 Systematic Observation 197
8.9.1 Atmospheric Observations 199 8.9.2 Oceanic Observations 200 8.9.3 Terrestrial Observations 202
ANNEX I to Chapter 8 203
CHAPTER 9: EDUCATION, TRAINING AND PUBLIC AWARENESS 205
9.1 Introduction 206 9.2 Education 207 9.3 Public Awareness 209 ANNEX A Summary Tables on Emission Trends 213 ANNEX B Summary of reporting of supplementary information under Article 7, Paragraph 2 of the KP 237 ANNEX C Ireland’s first biennial report 243
5

ACRONYMS
AMETS: Atlantic Marine Energy Test Site BCF: World Bank Bio Carbon Fund BE: Bus Éireann BER: Building Energy Rating BnM: Bórd na Móna BR: Biennial Reporting CAP: Common Agricultural Policy CCC: Royal Irish Academy Committee on Climate Change CCRP: Climate Change Research Programme CER: Commission for Energy Regulation CERs: Certified Emissions Reductions CFE: World Bank Carbon Fund for Europe CFRAM: Catchment Flood Risk Assessment and Management CHP: Combined Heat and Power CoFoRD: Council for Forest Research & Development CRF: Common Reporting Format CRRP: Climate Resource and Research Programme CSEUR: Consolidated System of EU Registries CSO: Central Statistics Office CWR: Crop Wild Relatives DAFM: Department of Agriculture, Food & the Marine DAHG: Department of Arts, Heritage & the Gaeltacht DB: Dublin Bus DCENR: Department of Communications, Energy and Natural Resources DECLG: Department of the Environment, Community & Local Government DES: Department of Education & Skills DFIN: Department of Finance DJEI: Department of Jobs, Enterprise and Innovation DRR: Disaster Risk Reduction DTTAS: Department of Transport, Tourism and Sport EBRD: European Bank for Reconstruction and Development EC: European Commission ECOFIN: Economic and Financial Affairs Council ECVs: Essentials Climate Variables EIB: European Investment Bank EPA: Environmental Protection Agency ESRI: Economic and Social Research Institute ETU: Emissions Trading Unit EU: European Union EU ETS: European Union Emissions Trading Scheme EVs: Electric Vehicles FAO: Food and Agriculture Organisation of the UN FEE: Foundation for Environmental Education FRM: Flood Risk Management FRMPs: Flood Risk Management Plans FSF: Fast-Start Finance GCCA: Global Climate Change Alliance GEF: Global Environment Facility GEO: Intergovernmental Group on Earth Observations
6

Gg: Gigagrams GHG: Greenhouse Gas HEA: Higher Education Authority IAA: Irish Aviation Authority ICIP: Irish Climate Information Platform ICOS: Integrated Carbon Observing System IEN: Irish Environmental Network IIED: International Institute for Environment and Development IPCC: Intergovernmental Panel on Climate Change IR: Irish Rail ITL: Independent Transaction Log JPIs: Joint Programming Initiatives KP: Kyoto Protocol LDCF: Least Developed Countries Fund LEG: Least Developed Countries Expert Group LULUCF: Land-Use, Land-Use Change & Forestry MCCF: Multilateral Carbon Credit Fund MI: Marine Institute MOU: Memoranda of Understanding MS: Member States NCCAF: National Climate Change Adaptation Framework NDP: National Development Plan NEEAP: National Energy Efficiency Action Plan NESC: National, Economic & Social Council NGOs: Non-Governmental Organisations NIR: National Inventory Report NMVOCs: Non-Methane Volatile Organic Compounds NREAP: National Renewable Energy Action Plan NTMA: National Treasury Management Agency NUIG: National University of Ireland, Galway NWPP: National Waste Prevention Programme OCLR: Office of Climate, Licensing & Resource Use ODA: Official Development Assistance OEDU: The Ocean Energy Development Unit OPW: Office of Public Works PRI: Producer Responsibility Initiative PSNP: Productive Safety Nets Programme QA/QC: Quality Assurance / Quality Control RC: Revenue Commissioners SEA: Strategic Environmental Assessment SEAI: Sustainable Energy Authority of Ireland SFI: Science Foundation Ireland SFW: Stop Food Waste Programme SMEs: Small and Medium Enterprises UK NATS: UK National Air Traffic Services VRT: Vehicle Registration Tax WEEE: Waste, Electrical & Electronic Equipment WMO: World Meteorological Organisation
7

CHAPTER 1: EXECUTIVE SUMMARY 1.1 National circumstances relevant to Greenhouse Gas emissions and removals 1.2 Greenhouse Gas Inventory Information 1.3 Policies and Measures 1.4 Projections and the total effects of policies and measures 1.5 Adapting to Climate Change 1.6 Financial Resources 1.7 Research and Systematic Observation 1.8 Education, Training and Public Awareness
8

1.1 National circumstances relevant to Greenhouse Gas emissions and removals Ireland is situated off the north-west coast of the continent of Europe between longitude 5.5o and 10.5o West and latitude 51.5o and 55.5o North. The country enjoys a relatively mild temperate oceanic climate, influenced by the relatively warm waters of the Gulf Stream and the prevailing south-westerly winds from the Atlantic. Ireland is a parliamentary democracy with two houses of Parliament. Climate Policy is directed by Government via a Cabinet Committee on Climate Change and the Green Economy which is chaired by the Taoiseach and includes all relevant Ministers including the Minister for the Environment, Community & Local Government who is responsible for Ireland’s policy on climate change. According to Census 20111 Ireland’s population has continued to grow strongly and, compared with the rest of Europe, Ireland has a markedly younger population profile - over one-third of people are aged under 25. Population density of 60 persons per square kilometre remains relatively low compared to other countries in Europe, however, almost 40% of the population is concentrated in Dublin and the Eastern Region. Outside this region, the State has a highly dispersed and low-density population. The Irish economy is a small, globalised economy that experienced an unprecedented level of growth during the decade to 2007. Activity as measured by GDP shrank by about 10 per cent between 2007 and 2011 with employment falling by 15 per cent due in large part to a large decline in construction activity, while the poor performance of the global economy over the period impacted Ireland through the trade channel. The Irish economy returned to growth in 2011, led by exports, and is set to record its third successive year of annual growth in 2013. 1.2 Greenhouse Gas Inventory Information The EPA has overall responsibility for the national greenhouse gas inventory in Ireland’s national system, which was established in 2007 under Article 5 of the Kyoto Protocol. The EPA’s OCLR performs the role of inventory agency in Ireland and undertakes all aspects of inventory preparation and management as well as the reporting of Ireland’s submissions annually in accordance with the requirements of Decision 280/2004/EC and the UNFCCC. The inventory is compiled on an annual basis and submitted by year-end in draft form to the European Commission to facilitate EU reporting, and in final form to the Secretariat by the April 15th deadline. The 2013 NIR2 which contains the inventory data in the CRF along with full documentation of the assumptions underpinning the inventory has been submitted to the UNFCCC secretariat for the years 1990 to 2011. Ireland’s commitment on greenhouse gases under the Kyoto Protocol, as determined by Decision 2005/166/EC, is to limit the increase in emissions in the 2008-2012 commitment period to 13 per cent above base year emissions. The baseline emissions total for Ireland is calculated as the sum of CO2, CH4 and N2O emissions in 1990 and the contribution from fluorinated gases in 1995. The baseline value was established at 55.607 Mt CO2eq and results in total allowable emissions of 314.184272 Mt CO2eq in the commitment period, which equates to an average of 62.837 Mt CO2eq per annum. This value remains fixed for the commitment period even though methodological improvements may change the estimates of emissions in the base year. Compliance with the Kyoto Protocol limit is achieved by ensuring that Ireland’s total emissions in the period 2008-2012, adjusted for any offsets from activities under Article 3.3 and the surrender of any purchased Kyoto Protocol credits, are below 314.184272 Mt CO2eq at the end of the five-year period. In 2011, total emissions of greenhouse gases (excluding the land use, land-use change and forestry LULUCF sector) in Ireland were 57,514.53 Gg CO2 equivalent, which is 4.1 per cent higher than emissions in 1990.
1 http://www.cso.ie/en/census/census2011reports/
2 Ireland National Inventory Report 2013 http://erc.epa.ie/ghg/nirdownloads.php
9

The total for 2011 is 18.0 per cent lower than the peak of 70,171.39 Gg CO2 equivalent in 2001 when emissions reached a maximum following a period of unprecedented economic growth. The Energy sector accounted for 64.2 per cent of total emissions in 2011, Agriculture contributed 30.8 per cent while a further 3.1 per cent emanated from Industrial Processes, 1.8 per cent was due to Waste and 0.1 per cent was due to Solvents. Emissions of CO2 accounted for 65.5 per cent of the national total in 2011, with CH4 and N2O contributing 20.2 per cent and 13.2 per cent, respectively. The combined emissions of HFC, PFC and SF6 accounted for 1.0 per cent of total emissions in 2011. Ireland has reported net greenhouse gas removals amounting to 13,691.08 Gg CO2 eq. for 2008 to 2011 under Article 3.3 of the Kyoto Protocol in respect of 279.63 kha of lands subject to afforestation since 1990 while there were net emissions of 110.41 Gg CO2 for a deforested area of 8.24 kha for the same 4 year period. Ireland has elected not to account for any of the activities under Article 3.4 of the Kyoto Protocol in the first commitment period. Fuel combustion in the Energy sector is the principal source of emissions in Ireland and major increases in fuel use have driven the increase in emissions up to 2011. The largest increase took place in transport with an increase of 126.8 per cent on 1990 levels, while there were increases of 17.8 per cent and 14.8 per cent in the emissions from electricity production and the industrial sectors, respectively. The emissions from agriculture, the other main source category, increased during the 1990s but have decreased to 8.8 per cent below 1990 levels in 2011. As the emissions from energy increased, the contribution of agriculture to total national emissions decreased from 35.6 per cent in 1990 to 30.8 per cent in 2011. This is primarily as a result of falling livestock numbers since 1998 due to reform of the CAP. National policies on agricultural research and technology transfer in conjunction with the successful uptake of payment for environmental services schemes have made a significant contribution to reducing agricultural greenhouse gas emissions and increasing the levels of carbon sequestration. An important caveat in this observation is that further improvements in production efficiency will be incrementally more challenging to obtain. As a result, this historic decoupling of livestock numbers and GHG emissions cannot and should not be symmetrically projected into future scenarios. 1.3 Policies and Measures Ireland’s policy response to climate change mitigation is broad and cuts across many sectors of the economy and society. The EU and its 2008 Climate and Energy Package is central in this regard by way of providing a legislative backdrop for actions across a range of sectors but in particular as regards Energy Efficiency and Renewables policy development. Improvements in building standards for new buildings, alongside schemes to incentivise the retrofitting of existing buildings are particularly relevant in the area of energy efficiency. In the renewables area, the EU has set appropriate national overall targets for 2020 alongside a specific EU wide target for renewables in transport. This leaves scope for each MS to design its own policy response. In Ireland a guaranteed price for renewable electricity has greatly increased the penetration of clean technologies in this sector.
Whilst these tools have objectives focussed on energy supply and demand, the EU ETS is a quantity based tool focussed particularly on emissions reductions in power generation and energy intensity industry. There are over 100 Irish installations covered by the scheme, collectively responsible for about 28% of Irish emissions, who must incorporate the emissions constraint into all their business decisions. EU Agriculture policy also plays an important role in ensuring that food production and animal management practices take place in a way that is respectful to their potential impact on the environment. A large range of initiatives are in place on the ground which thereby limit the potential growth of emissions in this area. Other European legislation in areas such as Waste and F-gases is also particularly relevant.
10

Some policy initiatives also take place outside these legal frameworks and the implementation of the carbon tax in 2009 and the re-orientation of taxation of private motor cars are particularly relevant in this regard. Nonetheless Ireland still needs to identify further policies and measures in order to ensure compliance with its commitments in the second commitment period of the Kyoto Protocol and work continues in order to identify the most cost efficient additional measures in this regard. 1.4 Projections and the total effects of policies and measures The projections presented indicate that the distance to target for the Kyoto Protocol will be 0.2 – 0.7 Mt CO2 equivalent. Ireland is, therefore, on track to meet its commitment under the Kyoto Protocol, and it is likely that there will be a very low requirement for the use of credits to ensure compliance with the agreed limit. These emission estimates include the impact of forest sinks as allowed for under Article 3.3 of the Kyoto Protocol and the impact of the EU ETS. Under the ‘With Measures’ scenario, total national emissions (excluding LULUCF) are projected to increase by 9.3 per cent by 2020. The largest drivers of this increase are increases in the Agriculture and Road Transport sectors. Under the ‘With Additional Measures’ scenario total national emissions (excluding LULUCF) are projected to increase only by 0.8 per cent by 2020. Under this scenario, increases in the agricultural and road transport sectors are somewhat offset by reductions (as a result of additional polices and measures) in the Manufacturing Industries and Construction and Commercial/Institutional and Residential sectors. Emissions of CO2 accounted for 65.4 per cent of national total (excluding LULUCF) emissions in 2011, with CH4 and N2O contributing 20.2 per cent and 13.2 per cent, respectively. The combined emissions of HFC, PFC and SF6 accounted for approximately 1.0 per cent of total emissions in 2011. NMVOCs account for the remaining 0.1%. By 2020 emissions of CO2 are projected to account for 65.8 per cent of national total emissions, with CH4 and N2O accounting for 19.5 per cent and 13.5 per cent respectively. The contribution of fluorinated gases and NMVOCs remaining unchanged from 2011 levels. The single largest source of emissions in 2011 was the agriculture sector which contributed 32 per cent of total national emissions (excluding LULUCF). By 2020 its share is projected to increase slightly to 32.7 per cent under the ‘with measures’ scenario and 35.5 per cent under the ‘with additional measures’ scenario. The second largest source of emissions in 2011 is the Energy Industries sector accounting for 20.8 per cent of total national emissions. In 2020 it is projected to account for 21.1 per cent under the ‘with measures’ scenario and 20.8 per cent under the ‘with additional measures’ scenario. The Transport sector is the third largest source of emissions in 2011 accounting for 19.6 per cent of emissions in 2011. By 2020 its sectoral share is projected to increase to 21.8 per cent under the ‘with measures’ scenario and 19.6 under the ‘with additional measures’ scenario. Policies and measures aimed at increasing the penetration of renewables in the Public Electricity and heat Production, and Transport sectors are shown to have a substantial mitigation potential. Measures aimed at improving insulation in residential buildings are also forecasted to have a significant effect. 1.5 Adapting to Climate Change The NCCAF3 provides a strategic policy focus to ensure adaptation measures are taken across different sectors and levels of Government to reduce Ireland’s vulnerability to the negative impacts of climate change. It is envisaged that a general scheme for national climate change legislation will be introduced by Easter 2014 providing a legislative basis for action on climate change. The first phase of the NCCAF focused on identifying national vulnerability to climate change, based on potential impacts relative to current adaptive capacity. The National Adaptive Capacity Assessment
3 http://www.environ.ie/en/Publications/Environment/ClimateChange/FileDownLoad,32076,en.pdf
11

4(Desmond and Shine, 2012) found that sufficient high quality data and information already exists to begin the adaptation planning process. The second phase involves the development and implementation of sectoral and local adaptation plans which will form part of the comprehensive national response to the impacts of climate change. It is envisaged that draft sectoral plans will be published by mid-2014 and, following approval, they should be reviewed at least every 5 years. However, where a sectoral mitigation plan is required under the forthcoming primary legislation on climate change, both mitigation and adaptation plans should be prepared and reviewed in tandem to ensure full coherence of analysis and actions. Progress under phase one of the NCCAF has been heavily dependent on scientific data and outputs provided primarily by the EPA CCRP, and others such as Met Éireann, Marine institute, DAFM, CoFoRD, OPW and national Universities. Research support will continue to be an essential element for delivery of Phase two of the NCCAF. The EPA CCRP is based on four thematic research areas and a coordination structure hosted by the EPA. Under a sub theme of Future Climate in Ireland, Impacts and Adaptation, research is progressed with a view to providing information on observations and analysis, future climate change, impacts, risk and vulnerability in order to support actions on adaptation and risk management. Key recent outputs include: National Adaptive Capacity Assessment (2012); National Vulnerability Assessment (2013); and Phase one of the ICIP completed. Ireland’s Climate: the road ahead 5(Met Éireann, 2013), presents a synthesis of knowledge on observed and expected impacts for Ireland. Depending on the global GHG emission scenarios, the projected changes in the Irish climate and related impacts include:
continued warming, particularly in the winter and summer seasons;
more extreme weather conditions including storms and rainfall events;
an increased likelihood of river and coastal flooding;
wetter winters and drier summers, the latter possibly leading to water shortages; and
changes in types and distribution of species. In 2012, a National Climate Change Vulnerability Scoping study was undertaken by researchers at the National University of Ireland Maynooth to identify first generation vulnerabilities for Ireland based on a sensitivity analysis across the key sectors. The analysis identified a clustering of impacts and their importance in relation to an assessment of likely resilience by sector. The priority sectors identified for further investigation are: biodiversity and fisheries; Water resources and the built coastal environment; and Forestry and agriculture. Environment Council conclusions on the EU Adaptation Strategy6 were adopted by EU Environment Ministers in June 2013 under the Irish EU Presidency (1 January 2013 – 30 June 2013). EU Finance Ministers also adopted conclusions on the EU Adaptation Strategy at an ECOFIN Council in June 2013. The objective of the EU Strategy is to contribute to a more climate resilient Europe. The Strategy has three main themes: Promoting action by MS; Better informed decision making; and Climate Proofing EU action.
4 https://www.epa.ie/pubs/reports/research/climate/CCRP_17_web.pdf
5 http://www.met.ie/publications/IrelandsWeather-13092013.pdf
6 http://eur-lex.europa.eu/LexUriServ/LexUriServ.do?uri=CELEX:DKEY=725522:EN:NOT
12

Ireland’s international development assistance programme has been focused on the Least Developed Countries, particularly those in sub-Saharan Africa. Since the 5th National Communication, Ireland has had bilateral development programmes with ten Partner Countries. Despite constraints on public finances in the context of the global financial crisis, Ireland has made a strong contribution to addressing climate change through its overseas development programme. The majority of Ireland’s assistance to developing countries is administered by the Department of Foreign Affairs and Trade (Irish Aid) on the basis of untied grant funding. 1.6 Financial Resources One of the key benefits of providing climate finance to developing countries is to assist such countries to mitigate and adapt to the impacts of climate change. In some instances climate finance can help to deliver reductions in GHG emissions in developing countries, while also up-skilling such countries with the means and expertise to develop and implement their own emission mitigation plans. Over the FSF period (2010-2012), Ireland met and exceeded its voluntary commitment made in Copenhagen in 2009 to provide up to €100m in public climate finance by reporting a FSF contribution of approximately €110m. Note that Ireland has not counted any of its contributions to the GEF towards its FSF figures. Some key features of climate finance from Ireland over the FSF period were:
Ireland’s FSF contributions were entirely in grant-form;
Over 90% of Ireland’s FSF contributions went to sub-Saharan Africa;
Over 95% of Ireland’s FSF contributions went to support climate change adaptation.
Ireland’s reported climate finance contributions for the FSF period were directed through a variety of channels: (i) Bilateral – Ireland has worked bilaterally with a number of Key Partner Countries as well as
International Institutions to decrease vulnerability to the adverse effects of climate changes through a range of modalities.
(ii) Multilateral – Ireland has worked to decrease vulnerability to climate change through various multilateral channels. In this regard, Ireland has provided support to multilateral trust funds as well as International organisations with a strong focus on climate change (e.g. LEG; LDCF; GCCA).
(iii) Other climate-relevant funding channels: such as funding of climate-relevant projects through the FAO.
Ireland recognises the need to plan for the fiscal and budgetary implications flowing from the commitment made in 2009 to contribute to International climate finance goals agreed under the UNFCCC processes. In this regard Ireland made an important contribution during its term as EU Presidency (1 January 2013 – 30 June 2013) by helping to develop the EU submission to the UNFCCC on Strategies and Approaches for mobilising scaled-up finance towards the US $100bn 2020 goal. Ireland will continue to work constructively with its fellow EU Member States and other developed country Parties to the UNFCCC in this regard while taking account of current economic realities. Carbon Funds and other investments As outlined in Chapter 4, Ireland has had some involvement in a number of funds managed by multilateral development banks with a view to achieving compliance with its obligations for the first commitment period of the Kyoto Protocol. The Carbon Fund Act 20077 designated the NTMA as the national authority
7 http://www.irishstatutebook.ie/2007/en/act/pub/0012/index.html
13

for taking actions in the carbon market but even before this Ireland had made commitments to funds managed by the World Bank and the EBRD. 1.7 Research and Systematic Observation In Ireland funding for climate change research, systematic observations and related activities is provided through a number of state agencies and organisations. The budgetary allocations are provided via relevant Government Departments. Since 2007 research funding at a national level has been provided through the NDP 2007-2013. However, the level of funding has been significantly reduced since 2008 due to the economic crisis. Investment in the development of climate change research was also made under earlier programmes. Climate related systematic observations are funded as a component of the operational activities of a number of state bodies as outlined in Table 8.1. Observations carried out by research institutions are funded through research programmes. Direct funding for environmental research is the responsibility of DECLG who have mandated the EPA to undertake the task of management of this research allocation. The NDP 2007-2013 also included some additional funding for climate change research. This allowed for the development of a structured CCRP with improved co-ordination and communication processes. However, while the additional NDP funding ceased in 2009, the structure was retained. This was reported in the 5th National Communication, since then ownership of activities within the programme has been more diverse with specialist agencies and bodies advancing research in key areas for Ireland e.g., the agriculture sector. There has also been a growing engagement with pan European research work through the JPIs and the development of wider international links. The overall objective of the CCRP remains to advance research on a cross sectoral basis through enhanced coordination, avoiding duplication and increasing the overall use and value of research. This includes research funded by the EPA and through other Government Departments who have similarly devolved responsibility for research funding. Topic and areas covered include; energy research funded by Sustainable Energy Ireland; agriculture research and soil carbon analysis funded through the DAFM and Teagasc8 (www.teagasc.ie); forest research funded by DAFM under the CoFoRD programme (www.agriculture.gov.ie); research funded by the Marine Institute (www.marine.ie); and socio-economic and enterprise orientated research being advanced by Forfás9 (www.forfas.ie) and Enterprise Ireland (www.enterprise-ireland.com). Climate change related studies are also supported by investments made by other bodies such as SFI (www.sfi.ie) and the HEA (www.hea.ie) which provides funding for university and other educational institutions. The research priorities identified in the Forfás research prioritisation process10 and adopted at government level also contribute to advancing areas of climate change research. For example, Sustainable Food Production and Processing, Marine Renewable energy and Smart Grids and Smart Cities. The national meteorological service, Met Éireann, operates a climate analysis and modelling section from within its own budget and has primary responsibility for systematic observations of meteorological parameters. Individual NGOs have also been engaged in research initiatives. As the national contact point for EU energy research programmes, the SEAI provides information and mentoring support to prospective Irish proposers. Following the call for proposals under the EU
8 Agriculture and food development authority in Ireland
9 Ireland’s policy advisory board for Enterprise and Science
10 http://www.forfas.ie/media/ffs20120301-Research_Prioritisation_Exercise_Report.pdf
14

Framework Programme for Research, funding offers totalling €5m were issued to successful Irish proposers. This brings total funding secured over the seven-year term of the programme to €25m. 1.8 Education, Training and Public Awareness A range of teaching resources have been developed by the DECLG and Ireland’s EPA. Eco Detectives is a teacher resource pack comprising of environmental and climate change investigations for primary schools. It was produced by DECLG in conjunction with the Centre for Human Rights and Citizenship at St. Patrick’s Teaching College, Dublin. The resource, which formed part of the CHANGE Campaign (Ireland’s Climate Change Awareness Campaign) was distributed to all primary schools in the state in 2011 and is also available on the environmental information site www.enfo.ie. The resource incorporates creative ways to teach about climate change and environmental issues, primarily through geography and science. The EPA developed and launched a second level resource: 2020 VISION: A Closer Look at Ireland’s Environment. This multimedia resource (resource pack and accompanying website), supports teachers and students in exploring the Irish environment, in the context of the second level curriculum. The EPA also launched its SFW funded under the EPA’s NWPP to promote food waste prevention and home composting. Ireland demonstrated its commitment to the environment by the continuation of funding to a wide range of environmental awareness raising programmes and initiatives, alongside funding of environmental NGOs through an umbrella organisation, IEN. Ireland continues to fund FEE Programmes such as the Green-Schools Programme which fosters a sense of leadership amongst students that spreads beyond the classroom and into their homes and the wider community. Further developments in this Programme in Ireland were the introduction of the Green-Campus Programme which follows the principles of Green Schools but is tailored for Third Level Institutions; University College Cork (UCC) being the first university in the world to be awarded the status of a Green Campus in 2010. The Green-Schools Website (www.greenschoolsireland.org ) was redesigned and re-launched in 2012. The DES is currently creating a National Strategy on Education for Sustainable Development (ESD), in keeping with the commitment in Our Sustainable Future- A Framework for Sustainable Development in Ireland11 which was published in 2012. Public consultation has taken place and the strategy is expected to be completed in the first half of 2014. The SEAI successfully completed the National Smart Metering Trial and associated assessments in 2011 and the National Smart Metering Programme has been developing its plans for the national rollout of smart meters.
11
http://www.environ.ie/en/Publications/Environment/Miscellaneous/FileDownLoad,30452,en.pdf
15

CHAPTER 2: NATIONAL CIRCUMSTANCES RELEVANT TO GREENHOUSE GAS EMISSIONS AND REMOVALS
2.1 Government Structure 2.2 Geographic and Climate Profile 2.3 Population 2.4 Economic Profile 2.5 Industrial Profile 2.6 Energy 2.7 Transport 2.8 Waste 2.9 Building Stock and Urban Structure 2.10 Land-use
2.10.1 Agriculture 2.10.2 Forestry 2.10.3 Peatlands
16

2.1 Government Structure Ireland is a parliamentary democracy. The national parliament is called the Oireachtas and consists of the President and two houses - the Dáil (the lower house), and the Seanad (the upper house). Bunreacht na hÉireann, the written Constitution of Ireland, sets out the administrative structure of the Government and defines the structure and principles of legal and social policy to guide the Oireachtas. The rights of every citizen are also enshrined in the Constitution. The power of the two houses of the Oireachtas derives from Bunreacht na hÉireann and law. The Dáil is the primary House and the Government is answerable to the Dáil only. The Irish Government consists of not less than seven and not more than fifteen members. The Head of the Government is the Taoiseach, who is appointed by the President on the nomination of the Dáil. Departments of State are assigned to members of the Government, with a Minister occasionally being responsible for more than one Department. The Irish Government, in exercising the executive powers of the State and delivery of its policy, retains overall responsibility for ensuring delivery of Ireland’s obligations under the UNFCCC and the Kyoto Protocol. DECLG is responsible for Ireland’s policy on climate change and has an overarching role in the delivery of this policy. A Cabinet Committee on Climate Change and the Green Economy is chaired by the Taoiseach and includes the Ministers for Environment, Community & Local Government; Energy, Communications and Natural Resources; Agriculture, Food and the Marine; and Jobs, Enterprise and Innovation amongst others. The committee is supported by a Senior Officials Group. 2.2 Geographic and Climate Profile Ireland is situated off the north-west coast of the continent of Europe between longitude 5.5o and 10.5o West and latitude 51.5o and 55.5o North. The total area of the island of Ireland is 84,421 square kilometres. The Republic of Ireland comprises 70,282 square kilometres. The greatest length of the island from the north to the south is 486 kilometres and the greatest width, from east to west, is 275 kilometres. There are 3,172 kilometres of coastline. The island comprises a large central lowland of limestone with a relief of hills and a number of coastal mountains, the highest of which, Carrantouhill, is 1,040m. The Shannon, at 340km, is Ireland’s longest river. Ireland’s National Parks are home to some of the most unique and spectacular scenery in the country while wild boglands occur in mountain and lowland areas and are among the most distinctive natural habitats in the country. The bio-diversity of wildlife is comparatively low due to Ireland's isolation from mainland Europe with many species present on the continent being absent. Many other common animals and plants have, in fact, been introduced by human settlers. The country enjoys a relatively mild temperate oceanic climate, influenced by the relatively warm waters of the Gulf Stream and the prevailing south-westerly winds from the Atlantic. The coldest months are January and February, with mean daily air temperatures of between 4oC and 7oC while the warmest are July and August, with mean temperatures of between 14oC and 16oC. May and June are the sunniest, averaging 5 to 7 hours sunshine per day. Rainfall is well distributed throughout the year. In low-lying areas average annual rainfall is mostly between 800 and 1200 millimetres but ranges from less than 750mm in some eastern areas to 1500mm in parts of the west. In mountainous areas annual rainfall may exceed 2000mm. The Status of Ireland’s Climate, 2012 The annual average surface air temperature in Ireland has increased by approximately 0.8oC over the last 110 years. In the 2012 study “The Status of Ireland’s Climate”12, 2012 by Dr. Ned Dwyer, Coastal and Marine Research Centre (CMRC), information on over 40 variables across the atmospheric, oceanic and terrestrial domains, was compiled, detailing trends in everything from rainfall amount to ocean temperature to changes in land cover.
12
http://www.met.ie/UserMediaUpl/file/CCRP_26.pdf
17

Some of the key findings documented in the report are: Mean annual surface air temperature has increased by approximately 0.8oC over the last 110 years.
The number of annual frost days has decreased whilst the number of warm days has increased. Average annual national rainfall has increased by approximately 60 mm or 5% in the 30-year period
1981 to 2010, compared to the period 1961 to 1990: however, clear changes in spatial patterns of rainfall across the country cannot be determined with a high level of confidence.
Mean annual sea surface temperature, as measured at Malin Head, Co. Donegal, is now more than 1.0°C higher than the long-term average calculated for the period 1961–1990.
Global surface ocean acidity has increased by over 30% since the Industrial Revolution. Observations in sub-surface and deep offshore waters around Ireland between 1991 and 2010 show significant increases in acidity are in agreement with this global trend.
Observations of the timing of bud-burst for a number of tree species indicate that the beginning of the growing season (BGS) is now occurring more than a week earlier than in the 1970s, leading to an extension of the growing season. Such changes have been linked to a rise in average spring air temperature.
2.3 Population Census 2011 results show that Ireland’s population has continued to grow strongly since the previous Census in 2006, increasing by 348,404 persons to 4,588,252 persons. This represents an increase of 8.2 per cent over the 5 year period, an annual average increase of 1.6 per cent. Looking back over 20 years Ireland’s population has increased by over one million persons, or 30.1 per cent. TABLE 2.1
Year (* Census year)
1990 1991* 1996* 2002* 2006* 2011*
Population (000)
3,505.8 3,525.7 3,626.1 3,917.2 4,239.8 4,588.3
Source: CSO
Population growth was driven by strong natural increase with births strongly outnumbering deaths. Until 2009 new inward migration contributed strongly to the increase as well. Compared with the rest of Europe, Ireland has a markedly younger population profile with a high proportion of the population concentrated in the younger age-groups - over one-third of people are aged under 25. Population density of 60 persons per square kilometre remains relatively low compared to other countries in Europe. However, almost 40% of the population is concentrated in Dublin and the Eastern Region. Outside this region, the State has a highly dispersed and low-density population. Our Sustainable Future, a Framework for Sustainable Development for Ireland (published in June 2012) sets out a medium to long-term framework for advancing sustainable development and the green economy in Ireland. In terms of sustainable residential development in the document, Government commits to working towards the effective implementation of the 2002 National Spatial Strategy13 and the Planning and Development (Amendment) Act 201014 which will support balanced regional development, proper planning and sustainable development, including sustainable communities.
13
http://www.irishspatialstrategy.ie/pdfs/Completea.pdf 14
http://www.environ.ie/en/Legislation/DevelopmentandHousing/Planning/FileDownLoad,25759,en.pdf
18

2.4 Economic Profile
Figure 2.1 GNP & GDP from 1990 to 2012
The Irish economy is a small, globalised economy that experienced an unprecedented level of growth during the decade to 2007. Activity as measured by GDP shrank by about 10 per cent between 2007 and 2011 with employment falling by 14 per cent. The main cause for the contraction was the large decline in construction activity, while the poor performance of the global economy over the period impacted Ireland through the trade channel. The Irish economy returned to growth in 2011, led by exports, and is estimated to have achieved a third successive year of annual growth in 2013. In 2012, the total labour force was over 2.1 million, representing about 60 per cent of all persons aged 15 or over, with 1.8m in employment. Participation in recent years has fallen in response to a decline in demand, with many younger people returning to education, and unemployment increasing from a pre-crisis level of about 4 per cent to over 15 per cent in early 2012, although this has been on a downward trajectory in recent quarters. 2.5 Industrial Profile In keeping with current world economic trends in developed economies, Ireland has experienced a decrease in the share of manufacturing as a share of output as the services sector continues to grow in importance. Manufacturing continues to be an integral component to the Irish economy however, comprising 27% of GDP in 2012 (32% in 1998). Much of Irish industrial output is accounted for by the foreign-owned multinational sector, as a result of long-standing policy of attracting Foreign Direct Investment (FDI). Areas of specialisation include pharma-chem, medical devices and agri-food products. The primary agriculture sector accounts for just under 2 per cent of economic activity as measured by gross value added, due in part to the large element of intermediate consumption in final output. The services sector accounts for three-quarters of economic output in Ireland. Trade in services is particularly well-developed, with service exports now measuring over 50 per cent of GDP, with specialisation in business and financial services, operational leasing and IT services. The report Energy in Ireland 1990-201115, published by SEAI in 2012 outlines recent developments in the industrial and commercial sectors. Ireland’s industrial firms have continued to show a positive energy efficiency trend, with an overall increase of over 4% in energy productivity in 2011. This reflected the focus
15
http://www.seai.ie/Publications/Statistics_Publications/Energy_in_Ireland/Energy_in_Ireland_1990_-_2011.pdf
19

by the sector on improving its competitiveness through strong energy management and continuous performance improvement. In terms of sectoral highlights, the report states that:
Industrial energy use fell by 1.4% in 2011 while economic output from industry grew by 3.1%;
Energy use in the services sector fell by 9.7% (a 1.1% increase when corrected for weather) in 2011 and represented 12% of final energy demand.
In terms of trends since 2007, industrial energy demand in 2011 was 2.3Mtoe. This was 17% lower than 2007 levels even though industrial economic activity was only 2.8% lower. Energy demand in industry was down to approximately 1999 levels in 2011.
2.6 ENERGY16 Key trends:
Overall (primary) energy use in 2011 fell by 6.4% to 14 Mtoe (similar to 2000 levels) and final energy demand decreased by 6.7% to 11 Mtoe.
Ireland’s economy grew by 1.4% to €159 billion in 2011, while energy-related CO2 emissions (excluding international aviation) fell by 7.2% to 37 Mt (23% above 1990 levels).
Ireland’s import dependency was 88% in 2011, down from a peak of 90% in 2006. The cost of all energy imports to Ireland was approximately €6 billion. Wind generated electricity grew by 56% in 2011 to 4.4 TWh and avoided 2.1 Mt CO2. In 2011 displacement of fossil fuel for electricity generation by renewable energy resulted in an avoidance of almost €300 million in natural gas imports.
The average annual energy-related CO2 emissions in the period 2008 – 2011 were 40 Mt, or 34% above 1990 levels.
Energy Production 1990-2011 Domestic production accounted for 32% of Ireland’s energy requirements in 1990. However, since the mid-1990s import dependency has grown significantly, due to the increase in energy use together with the decline in indigenous natural gas production at Kinsale since 1995 and decreasing peat production. Imported oil and gas accounted for 77% of TPER in 2011, compared with 50% in the early 1990s. Ireland’s overall import dependency reached 90% in 2006 but has decreased to 88% in 2011. This trend reflects the fact that Ireland is not endowed with significant indigenous fossil fuel resources and has only in recent years begun to harness significant quantities of renewable resources. Production of indigenous gas decreased by 85% over the period since 1990 to 285 ktoe, and peat by 46% to 760 ktoe. Renewable energy in contrast increased by 343% to 742 ktoe. Indigenous production peaked in 1995 at 4,105 ktoe and there has been a 48% reduction since then to 1,801 ktoe. The share of total indigenous fuels contribution from native gas was 16% in 2011, compared with 54% in 1990. The share of peat increased from 41% in 1990 to 42% in 2011 but in absolute terms peat production declined by 46%. Renewable energy accounted for 41% of indigenous produced fuels in 2011. Although peat production fell in 2011 by 23%, peat consumption fell by just 3.8%, with significant stock changes accounting for this difference. Developments are likely to impact on this trend including the plans to extract and utilise gas at the Corrib Gas Field and the targets for increasing the deployment of renewable energy. Energy Consumption - Trends 2007-2011 A number of trends are identified since 2007 (to 2011), namely that Ireland’s economy has contracted by 6.8%, reaching close to 2006 levels in 2011. Energy demand has fallen by 16% to 2001 levels and associated CO2 emissions have fallen by 17% to 1998 levels. Transport energy demand in 2011 was 4.4 Mtoe, representing a 23% reduction on 2007 levels, including a 42% reduction in energy use for freight transport. Industrial energy demand in 2011 was 2.3 Mtoe. This was 17% lower than 2007 levels even though
16
The GDP figures used in the charts, graphs and text on Energy were taken from the National Accounts of 2012.
20

industrial economic activity was only 2.8% lower. Energy demand in industry was down to approximately 1999 levels in 2011. Energy use in buildings has fallen by 7.4% since 2007 to 4.2 Mtoe. Demand fell by 14% in 2011 following a 2.7% growth in 2010, which demonstrates the impact of weather on energy demand. Energy use per household fell by 16% since 2007 when corrected for weather. Figure 2.2 shows the relative decoupling of total primary energy requirement (TPER) from economic growth since 1992. This is a result of changes in the structure of the economy and improvements in energy efficiency. To a lesser extent, the decoupling of CO2 emissions from energy use is also evident, particularly since 1993, and this is due to changes in the fuel mix.
The economy declined in both 2008 and 2010 while energy and energy-related CO2 rose slightly, due to colder weather in those years. In contrast, in 2011 energy demand and related CO2 emissions fell even though there was some growth in the economy. In 2008 when the economy entered recession, GDP fell by 2.1% compared with 2007, while primary energy use grew by 0.6% and energy related CO2 emissions grew by 0.7%. In 2009, the downturn in the economy deepened with GDP falling by 5.5% and energy and related CO2 emissions falling by 10% and 11% respectively. With energy use falling at a faster rate than GDP and emissions falling faster than energy use, there continues to be decoupling of energy use from economic activity and emissions from energy use. In 2010 the rate of decline of the economy slowed to 0.8% while overall energy use grew by 0.3% and emissions fell by 0.2%. In 2011, Ireland’s economy grew by 1.4% to €159 billion but in contrast to what happened in 2008, the overall use of energy fell by 6.4% to 13,869 kilo tonnes of oil equivalent (ktoe). There was also a large increase (56%) in wind generation which reduced the primary energy requirements for electricity generation and there were also continued improvements in the energy performance of households arising from changes to the building regulations and the retrofit grant schemes. Table 2.2 tabulates the growth rates for the economy (GDP), primary energy (TPER) and energy-related CO2 emissions for the period 1990 – 2011. It highlights the high GDP growth rates compared with those for energy and CO2 prior to 2008 and the continued decreases in primary energy and energy-related CO2 in 2011. Under the EU Effort Sharing Decision, Ireland’s GHG emissions in non-ETS sectors (i.e. in transport, agriculture, heating in buildings, waste and small industry) are required to be 20% below 2005 levels by
Figure 2.2 Total primary energy requirement (TPER) and economic growth (constant prices 2010) since 1990
21
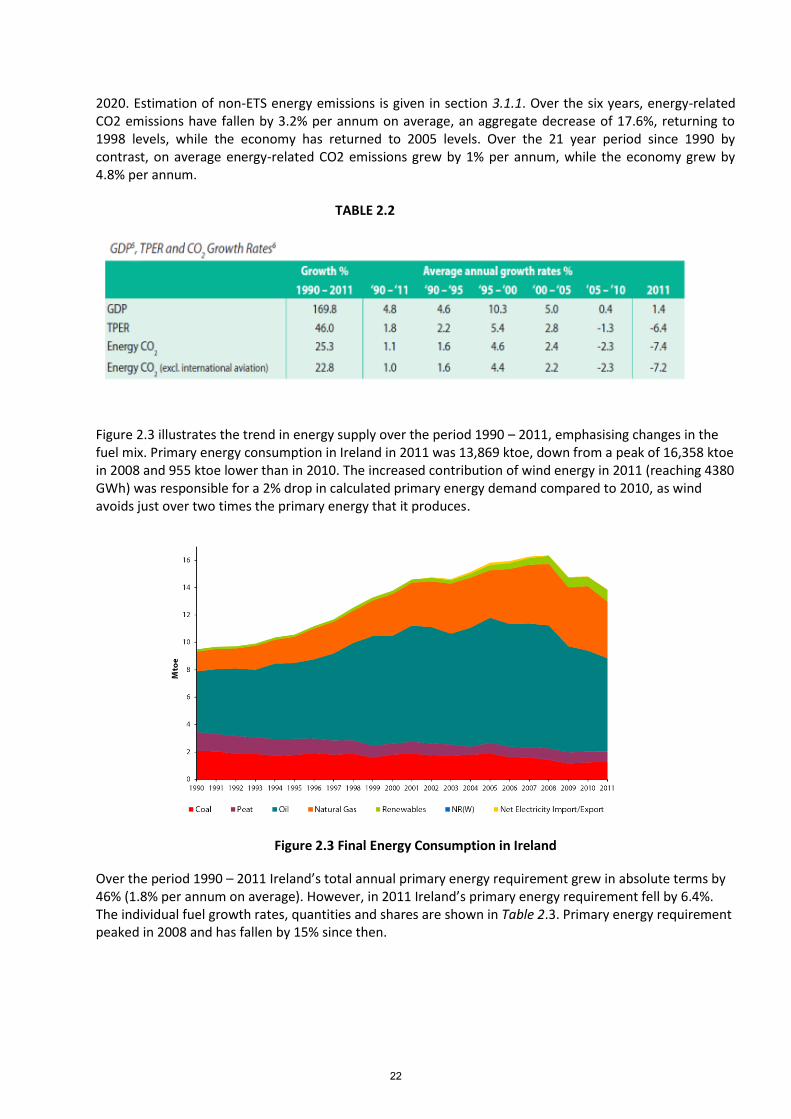
2020. Estimation of non-ETS energy emissions is given in section 3.1.1. Over the six years, energy-related CO2 emissions have fallen by 3.2% per annum on average, an aggregate decrease of 17.6%, returning to 1998 levels, while the economy has returned to 2005 levels. Over the 21 year period since 1990 by contrast, on average energy-related CO2 emissions grew by 1% per annum, while the economy grew by 4.8% per annum. TABLE 2.2
Figure 2.3 illustrates the trend in energy supply over the period 1990 – 2011, emphasising changes in the fuel mix. Primary energy consumption in Ireland in 2011 was 13,869 ktoe, down from a peak of 16,358 ktoe in 2008 and 955 ktoe lower than in 2010. The increased contribution of wind energy in 2011 (reaching 4380 GWh) was responsible for a 2% drop in calculated primary energy demand compared to 2010, as wind avoids just over two times the primary energy that it produces.
Figure 2.3 Final Energy Consumption in Ireland Over the period 1990 – 2011 Ireland’s total annual primary energy requirement grew in absolute terms by 46% (1.8% per annum on average). However, in 2011 Ireland’s primary energy requirement fell by 6.4%. The individual fuel growth rates, quantities and shares are shown in Table 2.3. Primary energy requirement peaked in 2008 and has fallen by 15% since then.
22

TABLE 2.3
Fuel Consumption trends
All fuels, with the exception of coal and renewables, experienced reductions in consumption in 2011. Renewables in aggregate increased by 23% to 831 ktoe and coal use increased by 1.9% to 1,264 ktoe.
Fossil Fuel Trends
Fossil fuels accounted for 94% of all energy used in Ireland in 2011, excluding the embodied fossil fuel content of imported electricity. Demand for fossil fuels fell by 7.9% in 2011 to 12,982 ktoe and has fallen 15% since 2005.
Oil continues to be the dominant energy source, increasing from a share of 47% in 1990 to a peak of 60% in 1999, but falling to 49% in 2011. Consumption of oil, in absolute terms, fell by 7.4% in 2011 to 6,820 ktoe. Over the six years 2005 – 2011, oil demand fell by 25% (4.27% per annum).
Natural gas use fell in 2011 by 12% to 4,138 ktoe and its share of TPER was 30%. The increase in 2010 was 9.2%, mainly due to the severe winter conditions and increased use in electricity generation. Over the six years 2005 – 2011, natural gas use has increased by 19% (2.9% per annum).
In absolute terms over the period 1990 – 2011 coal declined by 39% to 1,264 ktoe. In 2011 the use of coal increased by 1.9%. Increased use in electricity generation accounted for all of this increase as coal use in final consumption in both industry and the residential sector fell in 2011. Over the five years 2005 – 2010, coal demand fell by 34% (8% per annum).
Peat use fell by 3.8% in 2011 to 761 ktoe and over the period 1990 – 2011 its use declined by 45% resulting in its share in primary energy falling from 14% to 5.5%. The decrease in use of peat in 2011 occurred both in electricity generation (-2.1%) and the residential sector (-4.8%).
Renewable Energy Trends
Total renewable energy increased by 23% during 2011 to 831 ktoe. On average in the period 2005 – 2011, renewable energy demand increased by 14% per annum. Since 1990 renewable energy has grown by 395% (7.9% per annum on average) in absolute terms.
23
Wind energy experienced a fall in 2010 of 4.8% but grew by 56% in 2011 to 4,380 GWh (377 ktoe), due to a 13% growth in installed capacity and (3% - 4%) higher than average wind speeds and particularly low wind speeds in 2010. The share of wind in overall energy use in 2011 was 2.7%.
The Hydro resource recovered in 2011 to average levels (707 GWh or 61 ktoe) resulting in an 18% increase in hydro generated electricity relative to 2010.
Electricity imports
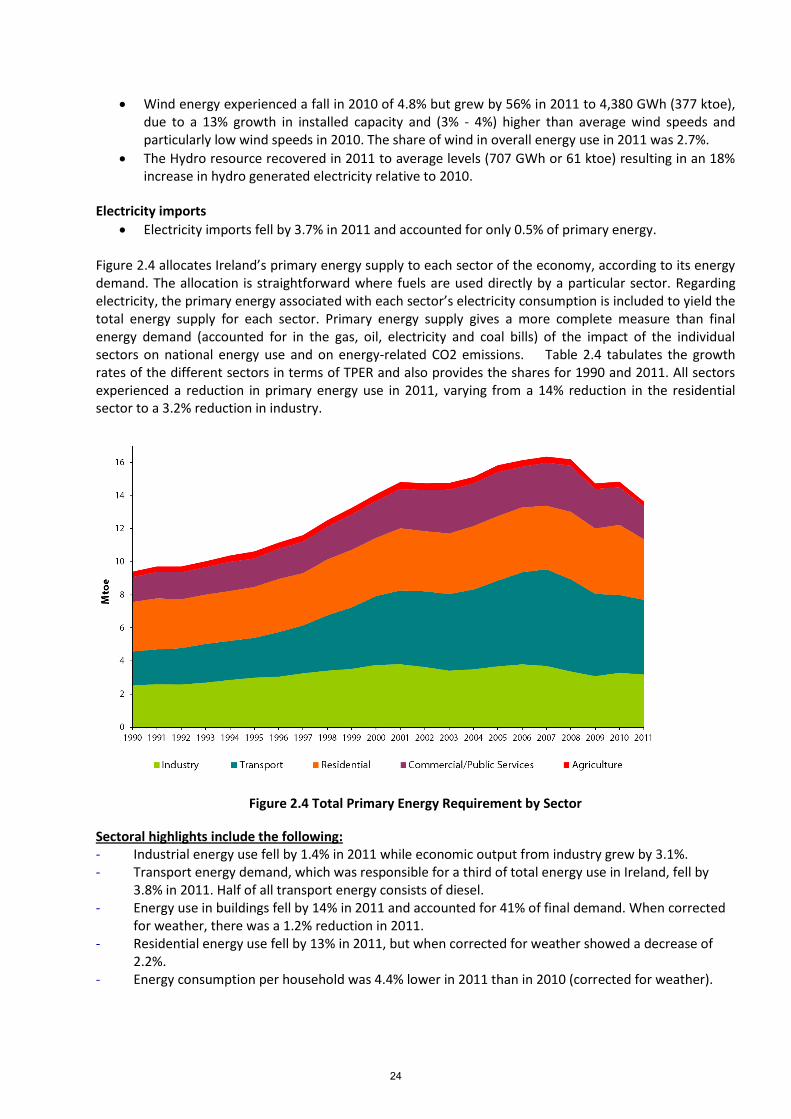
Electricity imports fell by 3.7% in 2011 and accounted for only 0.5% of primary energy. Figure 2.4 allocates Ireland’s primary energy supply to each sector of the economy, according to its energy demand. The allocation is straightforward where fuels are used directly by a particular sector. Regarding electricity, the primary energy associated with each sector’s electricity consumption is included to yield the total energy supply for each sector. Primary energy supply gives a more complete measure than final energy demand (accounted for in the gas, oil, electricity and coal bills) of the impact of the individual sectors on national energy use and on energy-related CO2 emissions. Table 2.4 tabulates the growth rates of the different sectors in terms of TPER and also provides the shares for 1990 and 2011. All sectors experienced a reduction in primary energy use in 2011, varying from a 14% reduction in the residential sector to a 3.2% reduction in industry.
Figure 2.4 Total Primary Energy Requirement by Sector Sectoral highlights include the following: - Industrial energy use fell by 1.4% in 2011 while economic output from industry grew by 3.1%. - Transport energy demand, which was responsible for a third of total energy use in Ireland, fell by
3.8% in 2011. Half of all transport energy consists of diesel. - Energy use in buildings fell by 14% in 2011 and accounted for 41% of final demand. When corrected
for weather, there was a 1.2% reduction in 2011. - Residential energy use fell by 13% in 2011, but when corrected for weather showed a decrease of
2.2%. - Energy consumption per household was 4.4% lower in 2011 than in 2010 (corrected for weather).
24

- The average dwelling was responsible for emitting 6.4 tonnes of energy-related CO2 emissions in 2011. This was a 24% reduction on 2005 levels. This includes the upstream emissions associated with the use of electricity generation in households. Direct emissions from the use of fuel in households was 3.9 tonnes of CO2 per household in 2011.
- Energy use in the services sector fell by 9.7% (1.1% increase when corrected for weather) in 2011 and represented 12% of final energy demand.
TABLE 2.4
Table 2.4 Growth rates and shares of TPER by sector 2.7 TRANSPORT In Ireland, roads are the dominant mode of internal transport. This is perhaps reflective of dispersed spatial patterns where the provision of rail based modes is largely restricted to small shares of national demand. Road based modes account for over 95% of passenger km travelled and road based freight makes up almost 99% of total land freight demand. Effective and efficient road based transport is vital for future economic and social development at both national and local level. In line with this demand share, road transport contributes the vast majority of emissions from the transport sector in Ireland, accounting for around 95% of the sector’s CO2 emissions. Car ownership in Ireland grew dramatically in the period to 2008 before stabilising over more recent years. In 1990, there were approximately 800,000 private cars licensed in Ireland, increasing to 1.92 million in 2008. This represents growth in ownership of 140% over the period. Since 2008 ownership levels have been relatively stable – with 2012 figures showing ownership levels at 1.88 million. Goods vehicles have seen similar trends, although with more marked decreases in ownership since 2008. The number of licensed goods vehicles increased from 143,000 in 1990, to 351,000 in 2008, before declining to 320,000 in 2012. Given the rapid growth in vehicle numbers from 1990-2008, car density levels reached 430 per 1000 people in 2008. Since then they have declined marginally to around 413 cars per 1000 people. Given these ownership levels, there is still capacity for further growth compared to other EU countries – suggesting recent declines are most likely the direct result of reduced economic outputs and income levels, and that future demand growth is likely to occur with returned economic growth. Vehicle kilometre data is very much in line with the above trends of rapid growth in demand until 2008, followed by a period of modest declines in demand to 2012. On the basis of National Car Test Data, it is estimated that the total car kilometres travelled in Ireland increased from 23.1 billion kilometres in 2000, to 32.6 billion in 2008, declining slightly to 31.6 billion in 2011. Goods vehicle kilometre trends show growth from 4.7 billion kilometres in 2000 to a peak of 8 billion kilometres in 2008, followed by a decline to 6.6 billion kilometres in 2011. This shows that goods vehicle demand has been impacted more strongly by the reduction in economic output.
25
Over the last decade the transport sector in Ireland has undergone large-scale development and investment, which has led to more efficiencies in, and demand for, the movement of goods and people. Ensuring that such growth is environmentally sustainable is a significant challenge. There have been a number of positive developments in this regard such as enhancements to public transport provision in Dublin. For example, the LUAS tram system, which opened in mid-2004 and has been extended since then, accounted for 27.5 million passenger trips in 2008 rising to 29.6 million trips in 2012. However, it should be noted that, in general, public transport demand has been adversely affected by the contraction in activity in Ireland – with declines in demand of around 20% on some services. In terms of pricing, transport fuel prices in Ireland have risen substantially in recent years, reflecting increased fuel excise levels and the introduction of the Carbon Tax in 2010. The Central Statistics Office consumer price index shows current fuel prices approximately 20% higher than 2008 levels. Coupled with reduced income levels, it is likely these price signals have and will continue to impact on demand – however, it is also important that access to transport is not restricted, given Ireland’s dispersed settlement patterns. 2.8 WASTE
Please refer to Figure 1 on page 16 of the EPA National Waste Report for 2011, ‘Trends in municipal waste generation and GNP, 2006-2011’.17 Municipal solid waste generation in Ireland has decreased by 17% in 2011 compared to 2007. A decrease in personal consumption as a result of the economic recession and the impact of this on household waste generation has been the main key contributor to the declining trend, despite an increase in population. The percentage of municipal solid waste recovered is showing steady annual increases, and the recycling rate for municipal waste is now equivalent to the EU27 norm (40%). The increased production of combustible waste from municipal waste streams for use as a fuel is contributing to increased recovery rates, as is the introduction of the first municipal waste incinerator to the country’s infrastructure in late 2011. Increases in the landfill levy are also assisting in diverting waste from disposal to recovery options. It should be noted that the bulk of municipal waste recovered is exported for recovery. In recent years most local authorities have exited the waste collection market and thus are largely providers of civic amenity sites, landfills and other infrastructure, together with their on-going regulatory role in relation to the sector. Please refer to Figure 5 on page 19 of the EPA National Waste report for 2011, ‘Management of Irish Municipal Waste for 2011 in comparison with EU 27 municipal waste’. The report noted that the quantity of biodegradable municipal waste disposed at landfill was 771,551 tonnes, a 10% decrease on the previous year. Although 161kt in excess of the July 2013 EU Landfill Directive target, preliminary 2012 data indicates that Ireland is on track to meet the 2013 target of less than 610kt of BMW disposed to landfill .
17
http://www.epa.ie/pubs/reports/waste/stats/National%20Waste%202011_web.pdf
26

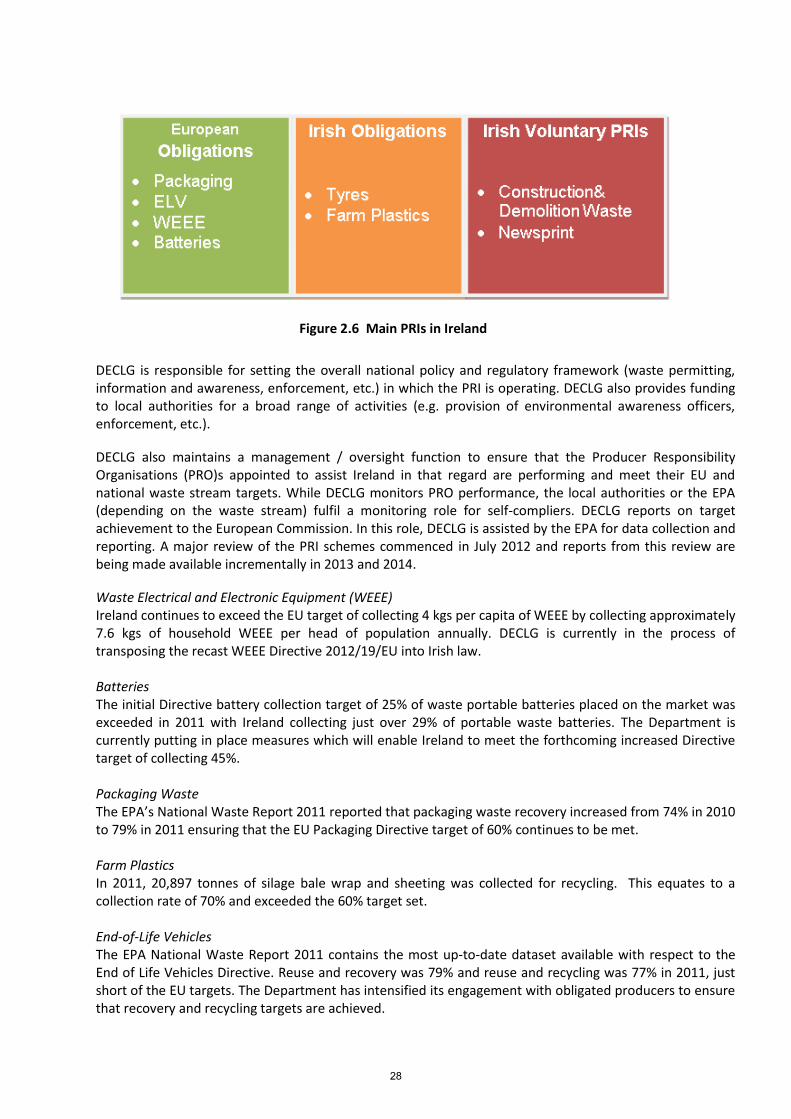
Among the measures to reduce the overall level of disposal of waste to landfill has been a substantial increase in the landfill levy, the latest of which increased the rate from €65 to €75 per tonne from 1 July, 2013. In addition, regulations designed to promote the segregation and recovery of household bio and food waste were introduced in April 2013 requiring waste collectors to have a separate collection service for household bio/food waste and requiring households to segregate bio/food waste for collection. Producer Responsibility in Ireland The Waste Management Act, 199618 established a legislative basis for producer responsibility and the first PRI in Ireland was rolled out with the implementation of the Packaging Directive in 1997. The principal PRIs are in the areas of WEEE, batteries, packaging, end-of-life vehicles, tyres and farm plastics. PRIs allow producers to devise schemes that have the capacity to fulfill the basic objectives of waste management legislation without resort to a ”command and control” approach. For some waste streams, producers in Ireland have developed a compliance scheme approach to meet general objectives which would otherwise be imposed by detailed regulatory requirements. These compliance schemes enable business to use its expertise to devise workable, effective and least cost arrangements that are sensitive both to commercial and environmental requirements. They also have the advantage of promoting a pro-active attitude by business and facilitate an accelerated and smoother achievement of objectives. The most wide-ranging compliance schemes in Ireland are for packaging waste, WEEE, and batteries – in these cases, the compliance scheme operates under an approval granted by the Minister for the Environment, Community and Local Government. These producer responsibility agreements are underpinned by legal obligations so that individual businesses which may opt out of a compliance scheme must then self-comply, as they cannot opt out of their obligations, or the costs associated with those obligations. As shown in Figure 2.6, most of the PRIs in Ireland were established in the framework of regulatory obligations. There are some cases, however, of purely voluntary PRIs adopted by producers (e.g. construction and demolition waste, newsprint).
18
http://www.irishstatutebook.ie/1996/en/act/pub/0010/print.html
Figure 2.5 Tonnage of MSW and BMW landfilled per quarter in 2011 versus Landfill Directive Targets
27
DECLG is responsible for setting the overall national policy and regulatory framework (waste permitting, information and awareness, enforcement, etc.) in which the PRI is operating. DECLG also provides funding to local authorities for a broad range of activities (e.g. provision of environmental awareness officers, enforcement, etc.). DECLG also maintains a management / oversight function to ensure that the Producer Responsibility Organisations (PRO)s appointed to assist Ireland in that regard are performing and meet their EU and national waste stream targets. While DECLG monitors PRO performance, the local authorities or the EPA (depending on the waste stream) fulfil a monitoring role for self-compliers. DECLG reports on target achievement to the European Commission. In this role, DECLG is assisted by the EPA for data collection and reporting. A major review of the PRI schemes commenced in July 2012 and reports from this review are being made available incrementally in 2013 and 2014. Waste Electrical and Electronic Equipment (WEEE) Ireland continues to exceed the EU target of collecting 4 kgs per capita of WEEE by collecting approximately 7.6 kgs of household WEEE per head of population annually. DECLG is currently in the process of transposing the recast WEEE Directive 2012/19/EU into Irish law. Batteries The initial Directive battery collection target of 25% of waste portable batteries placed on the market was exceeded in 2011 with Ireland collecting just over 29% of portable waste batteries. The Department is currently putting in place measures which will enable Ireland to meet the forthcoming increased Directive target of collecting 45%. Packaging Waste The EPA’s National Waste Report 2011 reported that packaging waste recovery increased from 74% in 2010 to 79% in 2011 ensuring that the EU Packaging Directive target of 60% continues to be met. Farm Plastics In 2011, 20,897 tonnes of silage bale wrap and sheeting was collected for recycling. This equates to a collection rate of 70% and exceeded the 60% target set. End-of-Life Vehicles The EPA National Waste Report 2011 contains the most up-to-date dataset available with respect to the End of Life Vehicles Directive. Reuse and recovery was 79% and reuse and recycling was 77% in 2011, just short of the EU targets. The Department has intensified its engagement with obligated producers to ensure that recovery and recycling targets are achieved.
Figure 2.6 Main PRIs in Ireland
28

Waste Tyres A number of issues were highlighted regarding the illegal disposal of waste tyres in 2010. The Department has since engaged with the tyre industry stakeholders to review the situation. The recommendations of the PRI Review will determine the future development of the tyres sector in Ireland in terms of how waste tyres are managed and information on their use is captured. Further information on waste sources and management practices is available in the National Waste Report 2011. 2.9 Building Stock and Urban Structure Results from the 2011 Census show that 64% of private households reside in urban areas. While detached houses dominate in rural areas, semi-detached houses are the most common property type in urban areas. Apartment living has increased in significance in the housing market in recent years. Around 55% of apartments which were occupied in 2011 have been built in 2001 or later. The growth in the number of apartments built is outpacing the growth in the number of terraced houses being built. The data available on non-residential buildings is limited and is mainly based on new planning permissions and BER certificates issued. As part of the requirements for the Energy Efficiency Directive this data is being analysed with a view of creating a model for the non-residential stock. Energy in the Residential Sector The residential sector accounted for just over a quarter (27%) of all energy used in Ireland in 2011 and after transport it was the second largest energy using sector. It was responsible for 27% (10,479 kt CO2) of energy-related CO2 emissions in 2011. The principal sources of energy supply to the sector are oil, electricity and natural gas, respectively accounting for 36%, 25% and 20% of energy end use in 2011. Energy use in the sector includes energy for heating, hot water, cooking, cleaning, washing, drying, lighting, cooling and entertainment. The sector has experienced rapid growth in the past two decades, with the number of occupied dwellings increasing by 64% (2.4% per annum) over the period 1990 to 2011 to reach 1.65 million19. The average dwelling was responsible for emitting 6.4 tonnes of energy-related CO2 emissions in 2011. Of this, 3.9 tonnes CO2 (61%) came from direct fuel use and the remaining 2.5 tonnes arose indirectly from electricity use. International Comparison Ireland was historically well above the EU and UK averages for energy consumption, electricity consumption and CO2 emissions per dwelling. This is the result of a number of factors:
Larger average dwelling size in Ireland – the average dwelling size in Ireland is 39% above the average for the EU 27 and 31% above the average for the UK (in 2010).
District heating – other EU countries have significant district heating networks, for example, the share of total heating supplied by district heating is 60% in the Czech Republic, 59% in Sweden, 58% in Denmark (www.euroheat.org ). Losses and CO2 emissions in district heating are accounted for in the transformation sector, whereas in Ireland losses and CO2 emissions for direct fuel use are attributed directly to the residential sector.
19
SEAI report Energy in the Residential Sector 2013 (http://www.seai.ie/Publications/Statistics_Publications/EPSSU_Publications/Energy-in-the-Residential-Sector-2013.pdf).
29

Differences in the fuel mix – for example, there is a higher proportion of solid fossil fuel use in Ireland than in most other EU member states.
As a result of energy efficiency improvements in the Irish housing stock, particularly since 2006, the average energy consumption per household has moved closer to the UK and EU average. In 2010, Ireland was just 5% above the UK and 26% above the EU-27 (compared to 36% above in 2006). Ireland’s on average larger dwelling size than the UK and EU has a large influence on this. A different picture emerges when the comparison is based on the average energy use per square metre. In 2010 Ireland was 20% below the average for the UK and 9% below the EU-27 average. Trends 2006 to 2011 In the five year period from 2006 to 2011, the number of permanently occupied dwellings grew by 13%. However, over the same period, overall residential sector energy consumption fell by 4.4% (0.9% per annum) and, when adjusted for weather effects, fell by almost twice that amount (7.8%, or 1.6% per annum). Average weather corrected energy use per household fell by 18% since 2006. Residential sector CO2 emissions fell by 11% (2.3% per annum) between 2006 and 2011, significantly faster than the fall in energy consumption. When adjusted for weather effects, CO2 emissions fell by 14% (3% per annum). Average weather corrected energy-related CO2 emissions per dwelling fell by 24% since 2006. Trends 1990 to 2011 The number of permanently occupied dwellings grew by 64% between 1990 and 2011 to reach 1.65 million. The average floor area per dwelling grew by 19% over the same period. Notwithstanding this growth, energy consumption in the sector only grew by 26%. Moreover, the Sector’s energy-related CO2 emissions fell by 2.7%, highlighting the effect of the changing fuel mix on energy related emissions. Direct (combustible) fuel usage in the sector grew by only 10% and associated CO2 emissions fell by 8.8% over the period. While electricity consumption in the sector doubled over the same period, associated CO2 emissions grew by just 9%. This reflects the significant fall in CO2 intensity of electricity. Energy Efficiency and Intensity The average energy efficiency in Irish housing improved by 34% over the period 1995 to 2011 (2.5% per annum). The average annual rate of improvement grew from 1.4% between 1995 and 2006 to 4.9% between 2006 and 2011. At least 12% of the 2011 housing stock had energy efficiency upgrades carried out since 2006, including through grant support schemes. It is estimated that such schemes saved over 900 GWh in year 2011, equating to annual cost savings of over €55 million. Intensity in the residential sector can be measured by relating energy to, amongst other things, population and the number of dwellings. Most of the improvement in climate corrected energy use per dwelling occurred during the early 1990s and again from 2006 onwards, with the increasing penetration of new housing stock and improved energy performance of these new houses. Some of the improvements are also due to improvements in the existing housing stock resulting from a number of grant schemes including the Greener Homes Scheme, the Home Energy Saving Scheme and the Warmer Homes Scheme. Factors influencing total residential energy consumption include the impact of:
improved new build standards arising from revised building regulations;
retrofit upgrading to existing dwellings (both grant-aided and other measures);
improved awareness and information among consumers;
energy prices (including Carbon Taxes);
30

reduced incomes on energy use. 2.10 Land-use 2.10.1 Agriculture Agricultural Profile The land area of Ireland is 6.9 million hectares20, of which 4.5 million hectares21, or about 65% of total land area, is used for agriculture and 731,65222 hectares, or about 10.5% of total land area, for forestry. Some 81% of the agricultural land is devoted to grass (silage, hay and pasture), 11% to rough grazing (0.45 million hectares) and 8% to crops fruit and horticulture production (0.38 million hectares)23. Beef and milk production currently account for 67% of agricultural output at producer prices (excluding forage)24. The average farm size is now around 32.7 hectares25. Primary agriculture, forestry and fisheries production accounts for some 2. 4% of Gross Value Added at Factor Cost26, 5.5% of employment27 and 7.3% of goods exports28. Ireland’s livestock numbers in June 2012 included 6.76 million cattle, 5.174 million sheep and 1.57 million pigs29.
FIGURE 2.7 AGRICULTURAL EMISSIONS Methane (CH4) Methane emissions from Enteric Fermentation and Manure Management are due to the type and number of livestock present on farms and in Ireland’s case, the amounts are largely determined by a large cattle
20
World Bank 2010 21
Central Statistics Office (CSO) - June 2012 Crops & Livestock Survey 22
Department of Agriculture, Food and the Marine 23
All data apart from forest cover is from CSO - June 2012 Crops & Livestock Survey. Forest cover is from National Forestry Inventory 2013. The Second National Forestry Inventory, Republic of Ireland, Main Findings. Forest Service, DAFM. 24
CSO - Output, Input & Income 2012 Final Estimate 25
CSO - Census of Agriculture 2010 26
DAFM estimate based on CSO National Income & Expenditure data 27
Derived from CSO Quarterly National Household Survey data 28
DAFM estimate based on CSO trade data 29
All from CSO - June 2012 Crops & Livestock Survey
31

population. The combined total of emissions of CH4 from enteric fermentation and manure management expressed in CO2 equivalents was 11,927.75 Gg in 1990. This increased by 7.4 per cent to reach 12,806.51 Gg CO2 equivalents in 1998 and subsequently decreased by 17.5 per cent to 10,571.44 Gg CO2 equivalent in 2011. Cattle account for 88.7 per cent of CH4 emissions in Irish agriculture in 2011. Nitrous Oxide N2O. The emissions of N2O from the Agriculture sector follow similar trends to those of CH4 because cattle also largely determine the amount of nitrogen inputs to agricultural soils from synthetic fertiliser and animal manures, which produce the bulk of N2O emissions (93.9 per cent of the sector N2O emissions in 2011). Nitrous oxide emissions in the sector increased from 7,706.33 Gg CO2 equivalent in 1990 by 13.0 per cent in the period 1990-1998 with emissions in 1998 totalling 8,706.67 Gg CO2 equivalent. Nitrous oxide emissions totalling 7,121.76 CO2 equivalent in 2011 represented a reduction of 18.2 per cent on the 1998 level and 7.6 per cent on the 1990 level. Crops are a minor source of N2O emissions in Ireland. 2.10.2 Forestry Forest sector profile Since the 1920s, when forest cover in Ireland had fallen to 1%, national afforestation programmes have resulted in an increase in forest to 10.5% of the land area of the country (or 731,652 ha).Despite these efforts, forest cover is still quite low when compared with the rest of Europe, where the average is 43%. Most of the current forest comprises commercial plantations, while it is estimated that there are 85,000 ha of native woodland remaining (Cross 2012), a considerable portion of which is now in national parks. The acceleration of the afforestation programme over the last quarter century, coupled with high levels of reforestation, has resulted in three quarters of the national estate being less than 30 years old. Roundwood harvest has been steadily increasing over the past decade. In 2012 it reached 2.8 million cubic metres. The main uses are fuelwood, and feedstock for sawnwood and panel products. Most of the sawnwood and panel-board output is exported; Ireland is now a net exporter of both product categories. Usage of wood fuels is also increasing due to renewable energy polices and as young plantations enter the production stage. Fuel use ultimately accounted for over one third of harvest in 2012 and contributed to avoiding an estimated half a million tonnes of CO2 emissions30. Roundwood production is forecast to more than double, to 6.4 million cubic metres, by 202831. Use of an expanded harvest in wood products and as a renewable fuel will extend the contribution of the forest sector to climate change mitigation. Sustaining harvest levels and climate change mitigation will require the continued expansion of forest cover to mid-Century and possibly beyond. There is a close liaison between the Forest Service and environmental and planning agencies in the regulation of afforestation and other forestry practices. A review of national forest policy is due for completion in early 2014. It addresses the role of forests and forest products in climate change mitigation. Climate change mitigation and the forest sector The afforestation programme plays an important role in mitigating climate change, as a land based sink for carbon dioxide, and as a source of renewable raw materials for fuel and wood products. Given the levels of afforestation that have occurred since 1990, it is estimated that between 2008 and 2012 the average rate of sequestration in qualifying forests (under Article 3.3) over the first commitment period of the Kyoto Protocol will be 2.58 Mt CO2 per annum. This revised forecast is based on approaches and methodologies
30
http://www.coford.ie/media/coford/content/publications/projectreports/cofordconnects/Woodflow20122ndrevisionSeptember2013.pdf 31
http://www.coford.ie/media/coford/content/publications/projectreports/forecast_31Jan11.pdf
32
for accounting of sequestration agreed to by Kyoto Protocol parties, particularly in the Marrakech Accords, the Good Practice Guidance of the IPCC, and on research and modelling of carbon sequestration in Irish forests undertaken as part of the CoFoRD national forest research programme. Current afforestation will have little effect on levels of sequestration during the first commitment period 2008-2012, because forests grow relatively slowly as they establish themselves over the first five years or so. However, in the post 2012 period, these forests will make a substantial contribution to climate change mitigation. The total carbon stock in forest biomass (excluding soil carbon) is estimated to be circa 210.3 Mt of CO2 in 201232. Forest soils represent a very significant carbon pool; current estimates are that the total carbon stock in forest soils is in the region of 1188.1 million tonnes of CO2. 2.10.3 Peatlands Approximately 17-20% of lands in Ireland are peatlands. It is estimated that these lands contain between 53-62% of the total soil carbon stock33. GHG emissions and sinks associated with human intervention of peatlands are reported under the UNFCCC under three IPCC land use categories: Wetlands, Forest land and Grassland34, and identified through analysis of land cover and the specific land declared by land managers. Peatland under forest and grass are assumed to be subject to artificial drainage and carbon losses are estimated using IPCC default methodologies. Peatlands within the Wetlands category are dominated the area of degraded and pristine peatland ecosystems. It is estimated that at least 74% of these lands exist in a degraded condition, with some estimates of greater than 90%35, which is a legacy of traditional methods of peat extraction which peaked during the 1920s and 1940s. These degraded peatlands have largely reverted to ecosystem classes which resemble pristine peatlands but with disturbed patterns of biodiversity, a much reduced resilience and carbon sequestration potential. In recent years traditional practices have been replaced by mechanised methods of extraction, nevertheless use of peat for residential heating has declined steadily since 1990. Commercial industrial peat extraction occurs on approximately 80kha of land. The semi-state company, BnM dominates activity in this sector. BnM completed its acquisition of lands in the early 1980s, at which time it began its operational drainage of lands intended for peat extraction. BnM will cease commercial extraction on its lands over the next two decades and is currently developing a long term strategy for environmentally sensitive management of its resources. Ireland will consider the recently accepted 2013 Supplement to the IPCC 2006 guidance for inventories in the context of on-going research into GHG emissions and sinks, country specific conditions, the development of inventory methodologies and potential reporting under Article 3.4 activity Wetlands Drainage and Rewetting.
32
National Forestry Inventory 2013. The Second National Forestry Inventory, Republic of Ireland, Main Findings. Forest Service, DAFM. 33
Tomlinson (2005,2006), Kiely (2008) and Connolly (2009) 34
2013 NIR 35
Bogland (Renou, 2009) and Connolly (2013)
33

CHAPTER 3: GREENHOUSE GAS INVENTORY INFORMATION 3.1 Introduction
3.1.1 Overview of national emissions 3.2 National Inventory system
3.2.1 Inventory system – Institutional and Procedural arrangements 3.2.2 Inventory planning 3.2.3 Overview of Inventory preparation and management 3.2.4 Inventory preparation 3.2.5 Data collection and storage 3.2.6 Methodologies and emission factors
3.2.6.1 Carbon Dioxide C02 3.2.6.2 Methane CH4 3.2.6.3 Nitrous Oxide N20
3.2.7 Overview of key categories 3.2.7.1 Key categories at IPCC Level 2 3.2.7.2 Disaggregated key categories
3.2.8 Process for the recalculation of previously submitted Inventory data
3.2.9 Uncertainty assessment 3.2.10 Quality assurance and quality control 3.2.11 Procedures for consideration and approval of the Inventory
3.3 Emissions by Greenhouse Gas 3.3.1 Carbon Dioxide 3.3.2 Methane 3.3.3 Nitrous Oxide 3.3.4 HFCS, PFCS and SF6
3.4 National Registry ANNEX I to Chapter 3 ANNEX II to Chapter 3 ANNEX III to Chapter 3
34
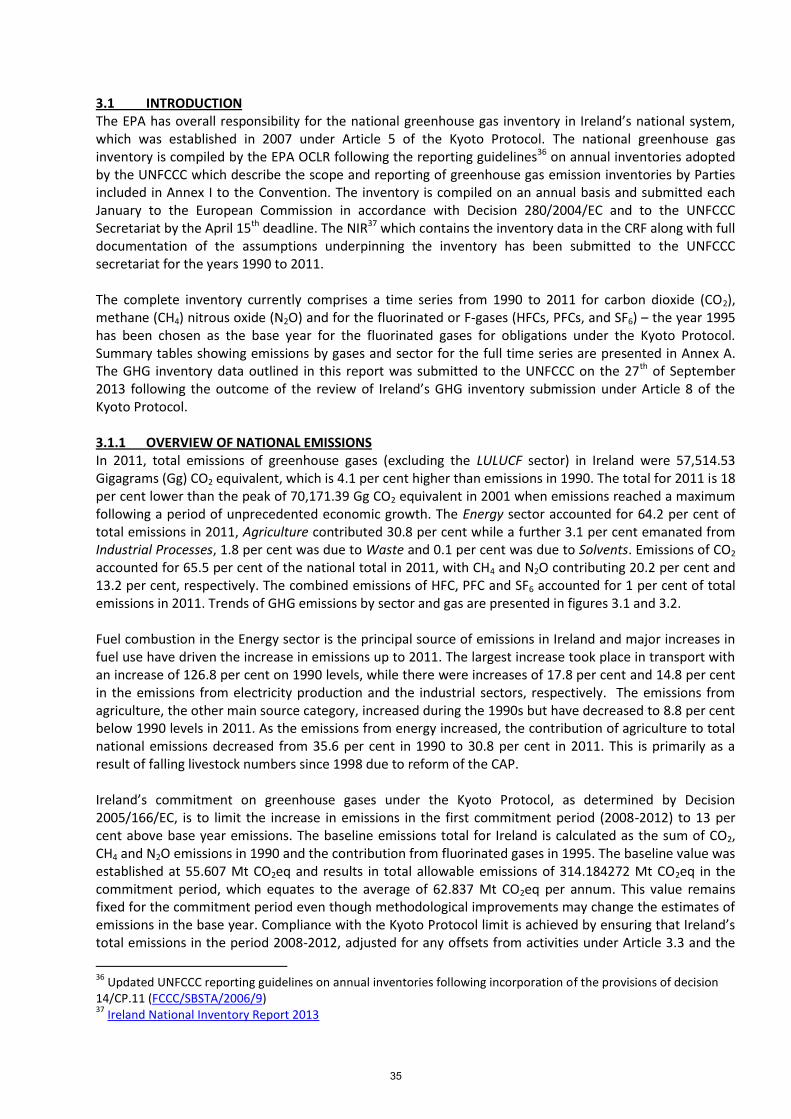
3.1 INTRODUCTION The EPA has overall responsibility for the national greenhouse gas inventory in Ireland’s national system, which was established in 2007 under Article 5 of the Kyoto Protocol. The national greenhouse gas inventory is compiled by the EPA OCLR following the reporting guidelines36 on annual inventories adopted by the UNFCCC which describe the scope and reporting of greenhouse gas emission inventories by Parties included in Annex I to the Convention. The inventory is compiled on an annual basis and submitted each January to the European Commission in accordance with Decision 280/2004/EC and to the UNFCCC Secretariat by the April 15th deadline. The NIR37 which contains the inventory data in the CRF along with full documentation of the assumptions underpinning the inventory has been submitted to the UNFCCC secretariat for the years 1990 to 2011. The complete inventory currently comprises a time series from 1990 to 2011 for carbon dioxide (CO2), methane (CH4) nitrous oxide (N2O) and for the fluorinated or F-gases (HFCs, PFCs, and SF6) – the year 1995 has been chosen as the base year for the fluorinated gases for obligations under the Kyoto Protocol. Summary tables showing emissions by gases and sector for the full time series are presented in Annex A. The GHG inventory data outlined in this report was submitted to the UNFCCC on the 27th of September 2013 following the outcome of the review of Ireland’s GHG inventory submission under Article 8 of the Kyoto Protocol. 3.1.1 OVERVIEW OF NATIONAL EMISSIONS In 2011, total emissions of greenhouse gases (excluding the LULUCF sector) in Ireland were 57,514.53 Gigagrams (Gg) CO2 equivalent, which is 4.1 per cent higher than emissions in 1990. The total for 2011 is 18 per cent lower than the peak of 70,171.39 Gg CO2 equivalent in 2001 when emissions reached a maximum following a period of unprecedented economic growth. The Energy sector accounted for 64.2 per cent of total emissions in 2011, Agriculture contributed 30.8 per cent while a further 3.1 per cent emanated from Industrial Processes, 1.8 per cent was due to Waste and 0.1 per cent was due to Solvents. Emissions of CO2 accounted for 65.5 per cent of the national total in 2011, with CH4 and N2O contributing 20.2 per cent and 13.2 per cent, respectively. The combined emissions of HFC, PFC and SF6 accounted for 1 per cent of total emissions in 2011. Trends of GHG emissions by sector and gas are presented in figures 3.1 and 3.2. Fuel combustion in the Energy sector is the principal source of emissions in Ireland and major increases in fuel use have driven the increase in emissions up to 2011. The largest increase took place in transport with an increase of 126.8 per cent on 1990 levels, while there were increases of 17.8 per cent and 14.8 per cent in the emissions from electricity production and the industrial sectors, respectively. The emissions from agriculture, the other main source category, increased during the 1990s but have decreased to 8.8 per cent below 1990 levels in 2011. As the emissions from energy increased, the contribution of agriculture to total national emissions decreased from 35.6 per cent in 1990 to 30.8 per cent in 2011. This is primarily as a result of falling livestock numbers since 1998 due to reform of the CAP. Ireland’s commitment on greenhouse gases under the Kyoto Protocol, as determined by Decision 2005/166/EC, is to limit the increase in emissions in the first commitment period (2008-2012) to 13 per cent above base year emissions. The baseline emissions total for Ireland is calculated as the sum of CO2, CH4 and N2O emissions in 1990 and the contribution from fluorinated gases in 1995. The baseline value was established at 55.607 Mt CO2eq and results in total allowable emissions of 314.184272 Mt CO2eq in the commitment period, which equates to the average of 62.837 Mt CO2eq per annum. This value remains fixed for the commitment period even though methodological improvements may change the estimates of emissions in the base year. Compliance with the Kyoto Protocol limit is achieved by ensuring that Ireland’s total emissions in the period 2008-2012, adjusted for any offsets from activities under Article 3.3 and the
36
Updated UNFCCC reporting guidelines on annual inventories following incorporation of the provisions of decision 14/CP.11 (FCCC/SBSTA/2006/9) 37
Ireland National Inventory Report 2013
35

surrender of any purchased Kyoto Protocol credits, are below 314.184272 Mt CO2eq at the end of the five-year period.
Figure 3.1 Trend in Greenhouse Gas emissions by Sector (excluding LULUCF) 1990-2011
0
10,000
20,000
30,000
40,000
50,000
60,000
70,000
80,000
1990 1991 1992 1993 1994 1995 1996 1997 1998 1999 2000 2001 2002 2003 2004 2005 2006 2007 2008 2009 2010 2011
Gg
CO
2 e
qu
ival
en
t
Energy Industrial Processes Solvent and Other Product Use Agriculture Waste
36
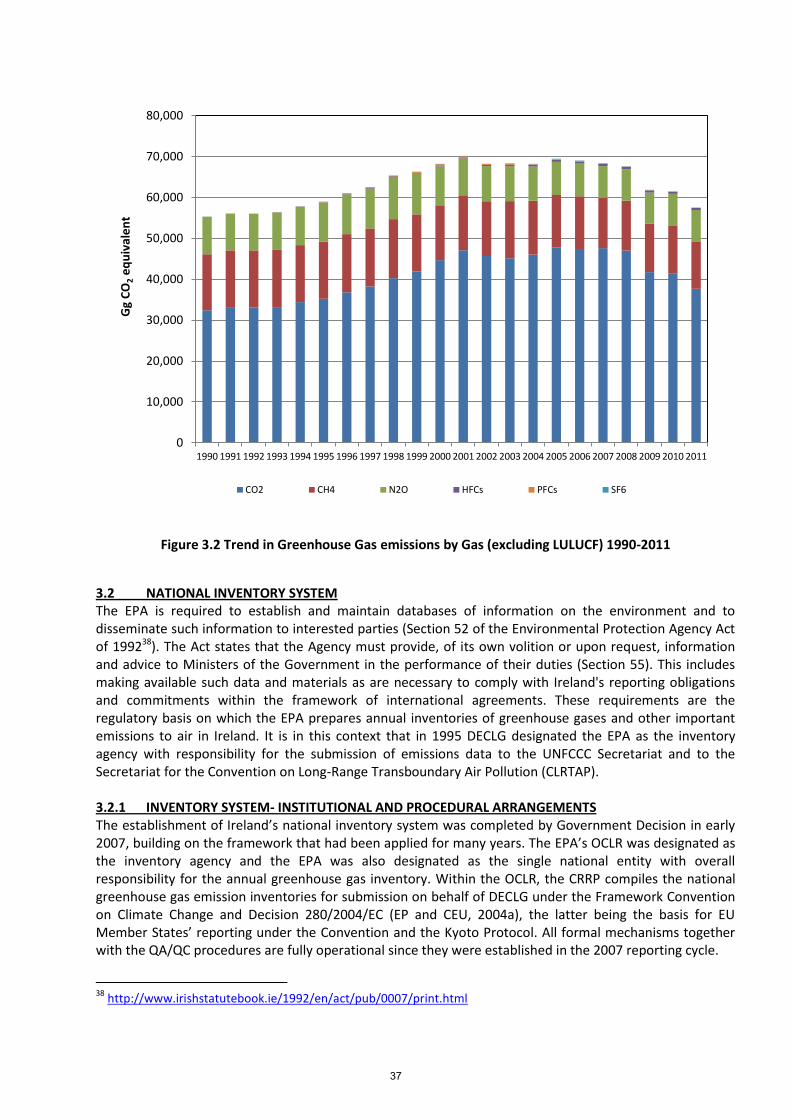
Figure 3.2 Trend in Greenhouse Gas emissions by Gas (excluding LULUCF) 1990-2011
3.2 NATIONAL INVENTORY SYSTEM The EPA is required to establish and maintain databases of information on the environment and to disseminate such information to interested parties (Section 52 of the Environmental Protection Agency Act of 199238). The Act states that the Agency must provide, of its own volition or upon request, information and advice to Ministers of the Government in the performance of their duties (Section 55). This includes making available such data and materials as are necessary to comply with Ireland's reporting obligations and commitments within the framework of international agreements. These requirements are the regulatory basis on which the EPA prepares annual inventories of greenhouse gases and other important emissions to air in Ireland. It is in this context that in 1995 DECLG designated the EPA as the inventory agency with responsibility for the submission of emissions data to the UNFCCC Secretariat and to the Secretariat for the Convention on Long-Range Transboundary Air Pollution (CLRTAP). 3.2.1 INVENTORY SYSTEM- INSTITUTIONAL AND PROCEDURAL ARRANGEMENTS The establishment of Ireland’s national inventory system was completed by Government Decision in early 2007, building on the framework that had been applied for many years. The EPA’s OCLR was designated as the inventory agency and the EPA was also designated as the single national entity with overall responsibility for the annual greenhouse gas inventory. Within the OCLR, the CRRP compiles the national greenhouse gas emission inventories for submission on behalf of DECLG under the Framework Convention on Climate Change and Decision 280/2004/EC (EP and CEU, 2004a), the latter being the basis for EU Member States’ reporting under the Convention and the Kyoto Protocol. All formal mechanisms together with the QA/QC procedures are fully operational since they were established in the 2007 reporting cycle.
38
http://www.irishstatutebook.ie/1992/en/act/pub/0007/print.html
0
10,000
20,000
30,000
40,000
50,000
60,000
70,000
80,000
1990 1991 1992 1993 1994 1995 1996 1997 1998 1999 2000 2001 2002 2003 2004 2005 2006 2007 2008 2009 2010 2011
Gg
CO
2 e
qu
ival
en
t
CO2 CH4 N2O HFCs PFCs SF6
37

Following establishment of the national system, institutional arrangements directed towards national inventory reporting that involve the EPA, DECLG and other stakeholders were reorganised, extended and legally consolidated across all participating institutions to strengthen inventory capacity within the EPA. This ensured that more formal and comprehensive mechanisms of data collection and processing were established and maintained for long term implementation. In particular, the system puts in place formal procedures for the planning, preparation and management of the national atmospheric inventory and identifies the roles and responsibilities of all the organisations involved in its compilation. This was achieved through extensive discussions with all key data providers leading to the adoption of MOU between the key data providers and the inventory agency. These MOUs stipulate the scope, timing and quality of the inputs necessary for inventory compilation in accordance with the guidelines for national systems. Secondary MOUs are, in turn, used by some key data providers to formalise the receipt of data from their own particular sources. Table 3.1 lists the key data providers and indicates the range of data covered by MOU in the national system. A QA/QC plan is an integral part of the national system. This plan is set out in Annex A.2. Annex A.3 provides a schematic overview of the institutions, procedures and information flows involved in the national system. In addition to the primary data received from the key data providers, the inventory team draws on various other data streams available within the EPA, such as the National Waste Database, reports on wastewater treatment, Annual Environmental Reports from companies subject to Integrated Pollution Prevention Control and submissions prepared under the European Pollutant Release and Transfer Register and also obtains information from other diverse sources to prepare the inventories for fluorinated gases and solvent use. The inventory team also draws on national research related to greenhouse gas emissions and special studies undertaken from time to time to acquire the information needed to improve the estimates for particular categories and gases. The ETU, also within the Climate Resource and Research Programme of the OCLR, is a key component of the national system. The ETU are responsible for administering the EU ETS, under Directive 2003/87/EC (EP and CEU, 2003), in Ireland and, as such, provide annual verified emissions data to the inventory team. The estimates of emissions and removals for forest lands under the Convention, as well as those in respect of Article 3.3 activities under the Kyoto Protocol, are prepared by consultants contracted to DAFM. These are delivered to the inventory agency under a Memorandum of Understanding between DAFM and OCLR. Research fellows contracted directly to OCLR are responsible for completion of the annual inventory for all other land categories in LULUCF for the annual inventory under the Convention. The deliverables received by OCLR from DAFM and the research fellows include the completed CRF tables and draft NIR sections for their respective areas of responsibility. The national system is also exploited for the purpose of parallel inventory preparation and reporting under the LRTAP Convention ensuring efficiency and consistency in the compilation of emission inventories for a wide range of substances using common datasets and inputs. 3.2.2 INVENTORY PLANNING The inventory agency plans for preparation of the annual inventory as soon as possible after completion of the annual reporting cycle in April following submission to the UNFCCC secretariat. Planning largely involves the identification of improvements to be undertaken by way of revised methodologies and updated activity data or emission factors as well as addressing the issues and recommendations in the review of the previous inventory submission. Planning also considers the further development of inventory reporting for the LULUCF sector and for activities under Article 3.3 as new data becomes available through national research and development of
38

the national forest inventory. In addition, any changes required by the outcome of review activities conducted among the Member States of the European Union, or by the need to report in a manner consistent with other Member States for the purposes of Decision 280/2004/EC, are taken into account in inventory planning. 3.2.3 OVERVIEW OF INVENTORY PREPARATION AND MANAGEMENT The first version of the latest annual inventory, produced in autumn of the following year, and a short National Inventory Report are used to comply with the subsequent 15th of January deadline prescribed by Decision 280/2004/EC, which governs the reporting of greenhouse gases and implementation of the Kyoto Protocol by the European Union and its Member States. The inventory preparation and management process thereafter involves making any revisions subsequent to the receipt of updated or outstanding information nationally. In addition, any observations or amendments following initial assessment at EU level of the 15th of January submission by Member States to the European Commission are incorporated into the inventory between 15th of January and 15th of March. The complete and final inventory submission, including the National Inventory Report, is submitted to the European Commission by 15th of March as required under Decision 280/2004/EC. This version of the latest inventory is fixed and retained for submission to the UNFCCC secretariat by 15th of April to complete the reporting cycle. Ireland’s national system is operating very successfully and the timeliness of inventory preparation has benefited from the implementation of more formal arrangements and enhanced engagement among the various institutions and contributors. 3.2.4 INVENTORY PREPARATION An emissions inventory database normally contains information on measured emission quantities, activity statistics (populations, fuel consumption, vehicle/kilometres of travel, industrial production and land areas), emission factors and the associated emission estimates for a specified list of source categories. In practice, very few measured data are available for greenhouse gases and, consequently, the emissions from most activities are estimated by applying emission factors for each source/gas combination to appropriate activity data for the activity concerned. Virtually all emissions and removals estimates may be ultimately derived on the basis of such simple product of activity data and emission factor. However, a certain amount of data analysis and preparatory calculations are generally needed in order to make available suitable combinations of activity data and emission factors at the level of disaggregation that gives the best estimates of emissions and removals. In the case of some source/gas combinations, such as methane emissions from solid waste landfills and CO2 sequestration by forest biomass, it may be necessary to apply sophisticated models to generate the activity data, the emission factors or the emissions. The methods recommended by the Revised 1996 IPCC Guidelines (IPCC, 1997), IPCC Good Practice Guidance (IPCC, 2000) and IPCC Good Practice Guidance on LULUCF (IPCC, 2003) use a tier system to take account of these issues and other factors, such as data availability, technical expertise, inventory capacity and other circumstances, which may vary considerably across countries.
39

Table 3.1 Key Data Providers and Information covered by MOU
Key Data Provider Data Supplied Deadline Sector in which data are used
Sustainable Energy Authority of Ireland
National Energy Balance; Detailed national energy consumption disaggregated by economic sector and fuel
30 September Energy, Waste
Department of Agriculture, Food and Marine Department of Agriculture, Food and Marine (Forest Sector Development Division)
Table 1.1-1.4 Statistical data for cattle compiled under the Animal Identification and Movement (AIM) scheme Fertiliser and lime statistics Poultry statistics Sheep statistics Table 2.1 GHG emission/removal estimates from all pools for forest lands under the Convention Statistical data on Afforestation, Reforestation, Deforestation and harvesting for forest land lands under Article 3.3 of KP GHG emission/removal estimates from all biomass pools for KP Article 3.3
30 September Agriculture
30 September LULUCF and Article 3.3 of the Kyoto Protocol
Central Statistics Office Annual population, livestock populations, crop statistics, housing survey data
30 September Agriculture, Industrial Processes, Waste
Bord Gais Analysis results for indigenous and imported natural gas
30 September Energy
Marine Institute Annual Report on Discharges, Spills and Emissions from Offshore Gas Production Installations
30 October Energy
Emissions Trading Unit Verified CO2 estimates and related fuel and production data for installations covered by the EU ETS1
30 April Energy, Industrial Processes
*Department of Communications, Energy and Natural Resources
National Oil Balance (as a component of the energy balance)
30 September Energy
*Road Safety Authority Road transport statistics from the National Car Test (NCT)
30 April Energy
**Forest Service
(i) GIS data base on premiums and grants afforestation areas (iFORIS) with associated attributes (II) NFI database
30 September 2007, 2012
LULUCF and Article 3.3 activities
**Coillte
GIS data base of intersected of NFI permanent sample plot points (Coillte-NFI plots) with sub-compartment and management unit data.
30 September LULUCF and Article 3.3 activities
1ETS – Emissions Trading Scheme
*These bodies have MOUs with SEAI rather than with OCLR **These bodies have MOUs with the Department of Agriculture, Food and Marine rather than with OCLR
40
3.2.5 DATA COLLECTION AND STORAGE Preparation for the annual GHG inventory takes place in an Excel spread sheet system where activity data stored in Source Data files are linked to calculation sheets in Data Processing files that produce the emissions estimates at the lowest possible level of disaggregation. These are combined and allocated according to IPCC requirements for direct transmission into the CRF Reporter utility for the generation of the CRF tables. These results are stored in Outputs files while supporting QA/QC sheets, extracted from Data Processing files, are held in summary QA/QC record files. The Data Processing files hold the emission factors and they are structured on a time-series basis, which facilitates efficient recalculation and output to the CRF Reporter. This procedure applies to all IPCC sectors of the GHG inventory for which the calculations are made by the inventory team and the full set of files applicable to each year under the four headings is stored using appropriate version control on the OCLR servers. Table 3.1 lists the principal data suppliers and the information that they are required to deliver to the inventory agency annually under MOU for the preparation of the GHG inventory. In some cases, e.g. the national energy balance, the input file received from the data supplier may be linked directly to the Data Processing files, but generally some degree of preparation and pre-processing is needed before the activity data are used in inventory preparation. In collating and compiling the activity data, the inventory team collects data from the various data streams e.g. Annual Environmental Report and submissions under the European Pollutant Release and Transfer Register. A national model called CARBWARE is used to derive the estimates of emissions and removals for forest lands, which are incorporated in the overall scheme for LULUCF reporting under the Convention following the procedure outlined above. A variety of databases related to land cover, soil type and forest areas are applied for the LULUCF inventory under the Convention. These include the National Forest Inventory (NFI), the Forest Inventory and Planning System (FIPS), the Land Parcels Information System (LPIS), CORINE Land Cover Maps and the General Soil Map of Ireland. These are supported by statistical information from Bord na Móna and the National Roads Authority. The static national model, CARBWARE has been extensively developed to a dynamic version to provide the necessary estimates for Article 3.3 activities under the Kyoto Protocol. This work was undertaken by FERs Ltd, the consultants working to DAFM, who supply the Article 3.3 results to OCLR under an agreed MOU (Table 3.1). Secondary MOUs between DAFM and its data suppliers formalise annual data collection for this area of the inventory. The model contains a multitude of component modules needed to produce estimates of the carbon stock changes for the various carbon pools under afforestation and deforestation areas and for reporting any relevant emissions of CH4 and N2O. The model processes detailed spatially explicit data on forest species and soil type obtained from the NFI, FIPS, soils maps, supported by the Grants and Premiums Administration System (GPAS), and felling license records. The model uses complex pre-processing functions, growth models, allometric equations and pool allocation and transfers to produce the results required for Article 3.3 activities. The annual ETS compilation serves as an important source of activity-specific and company-specific data on CO2 emissions, fuel use and emission factors for major combustion sources and industrial processes. The emissions trading scheme covers approximately 100 installations in Ireland with combined CO2 emissions of 15,770 Gg in 2011, accounting for 27.4 per cent of total greenhouse gas emissions (57,514.53 Gg CO2 equivalent). Guidance provided under the associated Decision 2004/156/EC (EP and CEU, 2004) on methodologies for estimating and reporting greenhouse gas emissions to support Directive 2003/87/EC, together with monitoring and verification mechanisms administered by the ETU, consolidates and improves the information in relation to a substantial proportion of CO2 emissions for the purposes of reporting national GHG inventories under the Convention and the Protocol.
41
All of the data used in the compilation of the national GHG inventory submission is stored on an EPA data server located in the Monaghan Regional Inspectorate of the EPA where key staff involved in inventory compilation is located. All background data for recent years are available in electronic format, with a transparent file structure. All data (emission estimates, AD, inventory submissions, references, QA/QC) on the data server are backed up daily. 3.2.6 METHODOLOGIES AND EMISSION FACTORS Table 3.2 and Table 3.3 present summaries of the methodologies and emission factors used by Ireland to estimate GHG emissions reported for the years 1990-2011. More than 80 per cent of the total emissions (excluding LULUCF) are covered by Tier 2 methods or higher in Ireland’s GHG inventory under the Convention and a Tier 3 model is applied for carbon stock changes for Article 3.3 activities under the Kyoto Protocol.
42

Table 3.2 Summary of Methods IPCC SOURCE AND SINK CATEGORIES CO2 CH4 N2O HFC PFC SF6
1. Energy
A. Fuel Combustion (Sectoral Approach)
1. Energy Industries T1, T3 T1, T2 T1, T2 NA NA NA
2. Manufacturing Industries and Construction T1, T3 T1 T1 NA NA NA
3. Transport T1, T2 T1, T2, T3 T1, T2, T3 NA NA NA
4. Other Sectors T1 T1 T1 NA NA NA
5. Other NA NA NA NA NA NA
B. Fugitive Emissions from Fuels
1. Solid Fuels NA NA NA NA NA NA
2. Oil and Natural Gas NA CS, T1 NA NA NA NA
2. Industrial Processes
A. Mineral Products T2 NA NA NA NA NA
B. Chemical Industry T1 NA T1 NA NA NA
C. Metal Production NA NA NA NA NA NA
D. Other Production NA NA NA NA NA NA
E. Production of Halocarbons and SF6 NA NA NA NA NA NA
F. Consumption of Halocarbons and SF6 NA NA NA T1, T2, T3 T1a T1, T1a
G. Other NA NA NA NA NA NA
3. Solvent and Other Product Use CR, CS NA NA NA NA NA
4. Agriculture
A. Enteric Fermentation NA CS, T1, T2 NA NA NA NA
B. Manure Management NA T1, T2 T1 NA NA NA
C. Rice Cultivation NA NA NA NA NA NA
D. Agricultural Soils NA NA T1a, T1b NA NA NA
E. Prescribed Burning of Savannas NA NA NA NA NA NA
F. Field Burning of Agricultural Residues NA NA NA NA NA NA
G. Other NA NA NA NA NA NA
5. Land-Use Land-Use Change Change and Forestry
A. Forest Land D, T1, T3 D, T1 D, T1 NA NA NA
B. Cropland T1 NA D, T1 NA NA NA
C. Grassland T1, T3 NA NA NA NA NA
D. Wetlands CS, T1 NA D, T1 NA NA NA
E. Settlements T1, T2 NA NA NA NA NA
F. Other Land D, T1, T2 NA NA NA NA NA
G. Other NA NA NA NA NA NA
6. Waste
A. Solid Waste Disposal on Land NA T2 NA NA NA NA
B. Wastewater Handling NA T1 T1 NA NA NA
C. Waste Incineration T1 T1 T1 NA NA NA
D. Other NA NA NA NA NA NA
7. Other NA NA NA NA NA NA
Article 3.3 Afforestation and Deforestation Tier 3 Tier 1 Tier 1 NA NA NA
International Bunkers
Aviation Tier 1 D D NA NA NA
Marine Tier 1 D D NA NA NA
Multilateral Operations NA NA NA NA NA NA
CO2 Emissions from Biomass Tier 1 Tier 1 Tier 1 NA NA NA
T1: IPCC Tier 1 or equivalent CS: Country specific T2: IPCC Tier 2 or equivalent CR: CORINAIR T3: IPCC Tier 3 or equivalent D: IPCC Default
43
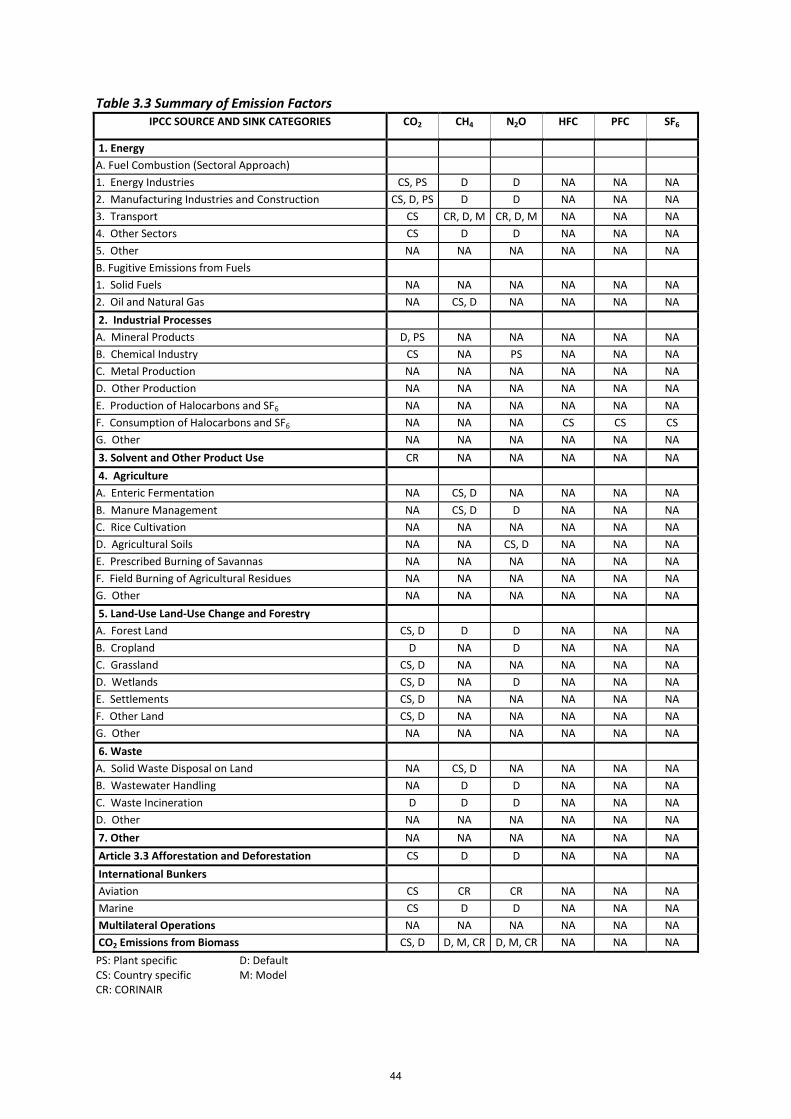
Table 3.3 Summary of Emission Factors IPCC SOURCE AND SINK CATEGORIES CO2 CH4 N2O HFC PFC SF6
1. Energy
A. Fuel Combustion (Sectoral Approach)
1. Energy Industries CS, PS D D NA NA NA
2. Manufacturing Industries and Construction CS, D, PS D D NA NA NA
3. Transport CS CR, D, M CR, D, M NA NA NA
4. Other Sectors CS D D NA NA NA
5. Other NA NA NA NA NA NA
B. Fugitive Emissions from Fuels
1. Solid Fuels NA NA NA NA NA NA
2. Oil and Natural Gas NA CS, D NA NA NA NA
2. Industrial Processes
A. Mineral Products D, PS NA NA NA NA NA
B. Chemical Industry CS NA PS NA NA NA
C. Metal Production NA NA NA NA NA NA
D. Other Production NA NA NA NA NA NA
E. Production of Halocarbons and SF6 NA NA NA NA NA NA
F. Consumption of Halocarbons and SF6 NA NA NA CS CS CS
G. Other NA NA NA NA NA NA
3. Solvent and Other Product Use CR NA NA NA NA NA
4. Agriculture
A. Enteric Fermentation NA CS, D NA NA NA NA
B. Manure Management NA CS, D D NA NA NA
C. Rice Cultivation NA NA NA NA NA NA
D. Agricultural Soils NA NA CS, D NA NA NA
E. Prescribed Burning of Savannas NA NA NA NA NA NA
F. Field Burning of Agricultural Residues NA NA NA NA NA NA
G. Other NA NA NA NA NA NA
5. Land-Use Land-Use Change and Forestry
A. Forest Land CS, D D D NA NA NA
B. Cropland D NA D NA NA NA
C. Grassland CS, D NA NA NA NA NA
D. Wetlands CS, D NA D NA NA NA
E. Settlements CS, D NA NA NA NA NA
F. Other Land CS, D NA NA NA NA NA
G. Other NA NA NA NA NA NA
6. Waste
A. Solid Waste Disposal on Land NA CS, D NA NA NA NA
B. Wastewater Handling NA D D NA NA NA
C. Waste Incineration D D D NA NA NA
D. Other NA NA NA NA NA NA
7. Other NA NA NA NA NA NA
Article 3.3 Afforestation and Deforestation CS D D NA NA NA
International Bunkers
Aviation CS CR CR NA NA NA
Marine CS D D NA NA NA
Multilateral Operations NA NA NA NA NA NA
CO2 Emissions from Biomass CS, D D, M, CR D, M, CR NA NA NA
PS: Plant specific D: Default CS: Country specific M: Model CR: CORINAIR
44
3.2.6.1 Carbon Dioxide CO2 Tier 2 or Tier 3 methods are used for the majority of CO2 combustion source categories and country-specific emission factors are used for all fuels. Even for those combustion categories where data limitations dictate the use of Tier 1 methods, such as 1.A.2 (Manufacturing Industries and Construction) and 1.A.4 (Other Sectors), the CO2 emissions obtained using the energy balance fuel data and country-specific emission factors are reliable. Tier 2 methods also apply to important process sources of CO2 emissions, such as cement and lime production, where country-specific circumstances are again taken fully into account. The national model used to estimate carbon stock change in the various carbon pools for forest lands in respect of both Convention reporting and Article 3.3 activities is a Tier 3 methodology. The methods for CO2 in other LULUCF categories and for relevant CH4 and N2O emissions in this sector are invariably Tier 1. 3.2.6.2 Methane CH4
Ireland’s national circumstances are well captured in the Tier 2 methods applied for the major sources of CH4 in the inventory, which are enteric fermentation and manure management associated with cattle and the CH4 emissions from solid waste disposal sites. Tier 2 and Tier 3 methods are used for CH4 emissions from 1.A.1 (Energy Industries) and 1.A.3.b (Road Transport), respectively, while Tier 1 methods and IPCC default emission factors are used for other CH4 emissions. 3.2.6.3 Nitrous Oxide N2O Ireland relies on the simplified IPCC Tier 1 methodologies and default emission factors to estimate all N2O emissions in agriculture, which is the main source of N2O in the inventory. Tier 2 and Tier 3 methods are used for N2O emissions from 1.A.1 (Energy Industries) and 1.A.3.b (Road Transport), respectively, while Tier 1 methods and IPCC default emission factors are used for other N2O emissions.
3.2.7 OVERVIEW OF KEY CATEGORIES As inventories of CO2, CH4 and N2O were developed in Ireland during the 1990s, it was quickly established that CO2 emissions from fuel combustion was by far the largest contributor to the combined national total for these three primary greenhouse gases. It was also evident that CH4 emissions produced by large cattle herds and the N2O emissions from agricultural soils, associated with intensive farming practices and large inputs of nitrogen to agricultural soils, were also major sources, even if the estimates were more uncertain than those for CO2. A preliminary estimate of key categories is therefore provided by considering the emissions aggregated at the IPCC Level 2 source category classification, which clearly indicates the importance of CO2 emissions from fuel combustion and CH4 and N2O emissions from agriculture. The results at the IPCC Level 2 source category classification may be readily drawn from the CRF Summary 2. Those for 1990 and 2011 are shown in Table 1.2 and Table 1.3, respectively. It can be seen that there are six highly significant key categories of emissions in Ireland in the 1990-2011 trend. They are the CO2 combustion sources in 1.A.1 Energy Industries, 1.A.3 Transport, 1.A.4 Other Sectors and 1.A.2 Manufacturing Industries and Construction, along with the CH4 emissions from category 4.A Enteric Fermentation and N2O emissions from 4.D Agricultural Soils. These six categories accounted for 85.1 per cent and 89.5 per cent of total emissions in 1990 and 2011, respectively. In the case of 2011 emissions, three additional Level 2 source categories are needed to reach the
45

cumulative 95 per cent threshold that defines a key category: 4.B Manure Management with CH4 emissions, 2.A.1 Cement Production with CO2 emissions and 6.A Solid Waste Disposal on land with CH4 emissions. The increase in the contribution of CO2 emissions from category 1.A.3 Transport from 9.1 per cent in 1990 to 19.4 per cent in 2011 is notable, along with the corresponding reductions in the contributions from the two categories (4.A and 4.D) in Agriculture. This simple analysis of key categories continues to prove useful to the formulation of abatement strategies and for prioritising work on inventories in Ireland. When LULUCF is accounted for in the Level 2 analysis, CO2 emissions in 2.A.1 Cement production and 5.A Forest land become a key category in 1990, and CO2 emissions in 5.A Forest land become a key category in 2011. 3.2.7.1 KEY CATEGORIES AT IPCC LEVEL 2 As inventories of CO2, CH4 and N2O were developed in Ireland during the 1990s, it was quickly established that CO2 emissions from fuel combustion was by far the largest contributor to the combined national total for these three primary greenhouse gases. It was also evident that CH4 emissions produced by large cattle herds and the N2O emissions from agricultural soils, associated with intensive farming practices and large inputs of nitrogen to agricultural soils, were also major sources, even if the estimates were more uncertain than those for CO2. A preliminary estimate of key categories is therefore provided by considering the emissions aggregated at the IPCC Level 2 source category classification, which clearly indicates the importance of CO2 emissions from fuel combustion and CH4 and N2O emissions from agriculture. The results at the IPCC Level 2 source category classification may be readily drawn from the CRF Summary 2. Those for 1990 and 2011 are shown in Table 3.4 and Table 3.5, respectively. It can be seen that there are six highly significant key categories of emissions in Ireland in the 1990-2011 trend. They are the CO2 combustion sources in 1.A.1 Energy Industries, 1.A.3 Transport, 1.A.4 Other Sectors and 1.A.2 Manufacturing Industries and Construction, along with the CH4 emissions from category 4.A Enteric Fermentation and N2O emissions from 4.D Agricultural Soils. These six categories accounted for 85.1 per cent and 89.5 per cent of total emissions in 1990 and 2011, respectively. In the case of 2011 emissions, three additional Level 2 source categories are needed to reach the cumulative 95 per cent threshold that defines a key category: 4.B Manure Management with CH4 emissions, 2.A.1 Cement Production with CO2 emissions and 6.A Solid Waste Disposal on land with CH4 emissions. The increase in the contribution of CO2 emissions from category 1.A.3 Transport from 9.1 per cent in 1990 to 19.4 per cent in 2011 is notable, along with the corresponding reductions in the contributions from the two categories (4.A and 4.D) in Agriculture. This simple analysis of key categories continues to prove useful to the formulation of abatement strategies and for prioritising work on inventories in Ireland. When LULUCF is accounted for in the Level 2 analysis, CO2 emissions in 2.A.1 Cement production and 5.A Forest land become a key category in 1990, and CO2 emissions in 5.A Forest land become a key category in 2011.
46
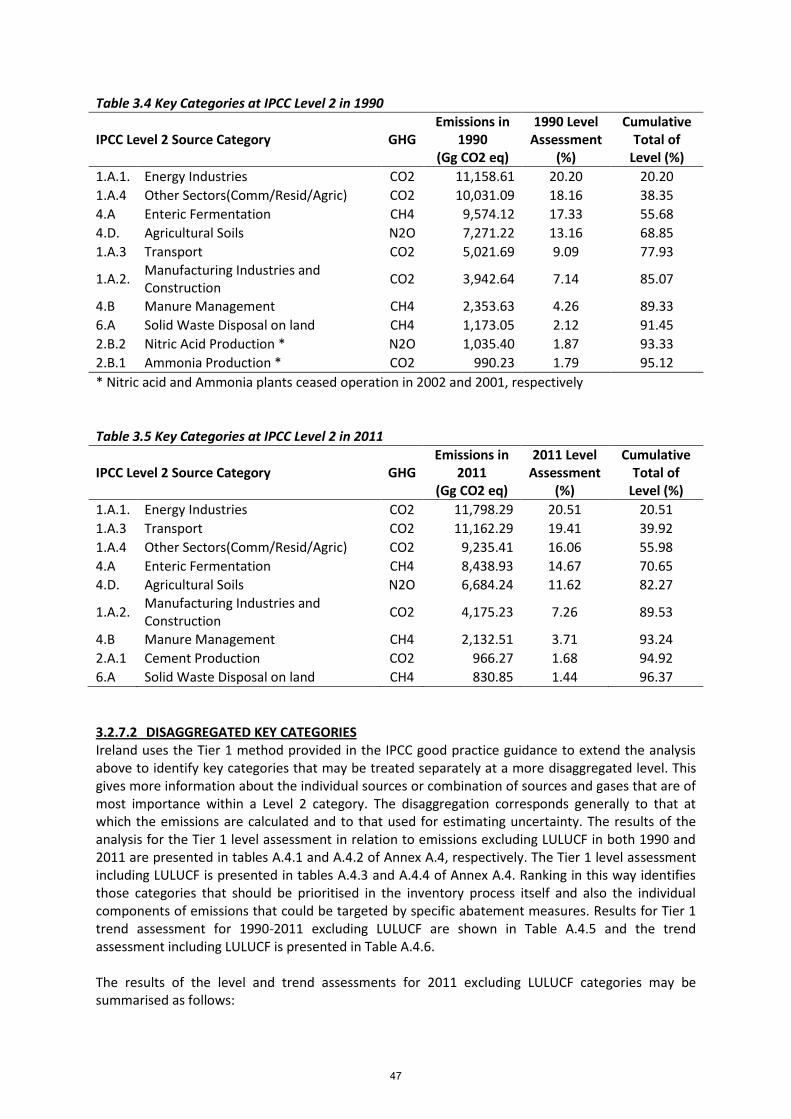
Table 3.4 Key Categories at IPCC Level 2 in 1990
IPCC Level 2 Source Category GHG Emissions in
1990 (Gg CO2 eq)
1990 Level Assessment
(%)
Cumulative Total of
Level (%)
1.A.1. Energy Industries CO2 11,158.61 20.20 20.20
1.A.4 Other Sectors(Comm/Resid/Agric) CO2 10,031.09 18.16 38.35
4.A Enteric Fermentation CH4 9,574.12 17.33 55.68
4.D. Agricultural Soils N2O 7,271.22 13.16 68.85
1.A.3 Transport CO2 5,021.69 9.09 77.93
1.A.2. Manufacturing Industries and Construction
CO2 3,942.64 7.14 85.07
4.B Manure Management CH4 2,353.63 4.26 89.33
6.A Solid Waste Disposal on land CH4 1,173.05 2.12 91.45
2.B.2 Nitric Acid Production * N2O 1,035.40 1.87 93.33
2.B.1 Ammonia Production * CO2 990.23 1.79 95.12
* Nitric acid and Ammonia plants ceased operation in 2002 and 2001, respectively Table 3.5 Key Categories at IPCC Level 2 in 2011
IPCC Level 2 Source Category GHG Emissions in
2011 (Gg CO2 eq)
2011 Level Assessment
(%)
Cumulative Total of
Level (%)
1.A.1. Energy Industries CO2 11,798.29 20.51 20.51
1.A.3 Transport CO2 11,162.29 19.41 39.92
1.A.4 Other Sectors(Comm/Resid/Agric) CO2 9,235.41 16.06 55.98
4.A Enteric Fermentation CH4 8,438.93 14.67 70.65
4.D. Agricultural Soils N2O 6,684.24 11.62 82.27
1.A.2. Manufacturing Industries and Construction
CO2 4,175.23 7.26 89.53
4.B Manure Management CH4 2,132.51 3.71 93.24
2.A.1 Cement Production CO2 966.27 1.68 94.92
6.A Solid Waste Disposal on land CH4 830.85 1.44 96.37
3.2.7.2 DISAGGREGATED KEY CATEGORIES Ireland uses the Tier 1 method provided in the IPCC good practice guidance to extend the analysis above to identify key categories that may be treated separately at a more disaggregated level. This gives more information about the individual sources or combination of sources and gases that are of most importance within a Level 2 category. The disaggregation corresponds generally to that at which the emissions are calculated and to that used for estimating uncertainty. The results of the analysis for the Tier 1 level assessment in relation to emissions excluding LULUCF in both 1990 and 2011 are presented in tables A.4.1 and A.4.2 of Annex A.4, respectively. The Tier 1 level assessment including LULUCF is presented in tables A.4.3 and A.4.4 of Annex A.4. Ranking in this way identifies those categories that should be prioritised in the inventory process itself and also the individual components of emissions that could be targeted by specific abatement measures. Results for Tier 1 trend assessment for 1990-2011 excluding LULUCF are shown in Table A.4.5 and the trend assessment including LULUCF is presented in Table A.4.6. The results of the level and trend assessments for 2011 excluding LULUCF categories may be summarised as follows:
47

(i) level assessment identifies 24 key categories, all of which but five (CO2 emissions in both 2.A.1. and 1.A.4.c. for liquid fuels, plus CH4 emissions in 4.B.1. and 4.B.8. and N2O emissions in 4.D.3.) are also key categories by trend assessment;
(ii) there are 13 key categories of CO2 in level assessment, accounting for 63.4 per cent of total emissions;
(iii) there are 7 key categories of CH4, three key categories of N2O and one category of HFC in level assessment, which account for 19.5 per cent, 11.6 per cent and 0.9 per cent, respectively, of total emissions;
(iv) Energy accounts for 12 key categories, Agriculture for 9, while Industrial Processes contributes two and Waste contributes one;
(v) trend assessment identifies 21 key categories, all of which but two (solid fuels CH4 emissions in 1.A.4.b. and solid fuels CO2 emissions in 1.A.2.) are key categories for 2011 level assessment;
(vi) there are 12 key categories of CO2 in trend assessment, accounting for 82.5 per cent of the total trend;
(vii) there are 6 key categories of CH4, two key categories of N2O and one key category of HFC in trend assessment, which account for 8.6 per cent, 2.7 per cent and 1.9 per cent, respectively, of the total trend.
The results of the level and trend assessment for 2011 including LULUCF categories may be summarised as follows: (i) the level assessment identifies 29 key categories, 17 of these are sources of CO2 emissions,
accounting for 65.8 per cent of total emissions; (ii) there are 5 additional categories that are not present in the assessment excluding LULUCF, of
which 3 are LULUCF and the remaining 2 are CO2 emissions from 1.A.2 (solid fuels) and N2O emissions from 4.B.13 (solid storage);
(iii) the three additional LULUCF categories are CO2 emissions from 5.A.2 – land converted to forest land (6.0 per cent of total emissions), 5.C.1 – grassland remaining grassland (0.9 per cent), and 5.A.1 – forest land remaining forest land (0.7 per cent).
(iv) there are 7 key categories from sources of CH4, 4 key categories from N2O and 1 category of HFC, which account for 17.7 per cent, 11.2 per cent and 0.9 per cent, respectively, of total emissions;
(v) Energy accounts for 13 key categories, Agriculture for 10, LULUCF for 3, while Industrial Processes contributes 2 and Waste contributes 1;
(vi) the trend assessment identifies 26 key categories, three of which were not identified as key categories in the level assessment: CO2 emissions from 5.E.2 – land converted to settlements, 5.C.2 – land converted to grassland and 5.B.2 – land converted to cropland;
(vii) there are 18 key categories of CO2 in the trend assessment, accounting for 84.1 per cent of the total trend;
(viii) there are 5 key categories of CH4, 2 key categories of CH4 and one key category of HFC in the trend assessment, which account for 7,4 per cent, 2.3 per cent and 1.4 per cent, respectively, of the total trend.
The list of key categories given by level assessment in 2011 is very similar to that for 1990. However, the higher ranking of the main CO2 sources in Energy, at the expense of CH4 and N2O sources in Agriculture, is notable in 2011. The top ten key categories (excluding LULUCF) were in a different order but identical apart from two (1.A.4.a and 1.A.2. with CO2 emissions both from liquid fuels in 1990 were replaced by 1.A.4.b. with CO2 emissions from liquid fuels and 1.A.2. CO2 emissions from gaseous fuels) and contributed 70.1 and 73.6 per cent, of total emissions in 1990 and 2011, respectively. The emissions of CO2 from the use of petrol and diesel by road traffic (1.A.3.b) and
48

from fuel combustion in 1.A.1 Energy Industries were the largest source categories of greenhouse gas emissions in Ireland in 2011, accounting for 18.6 and 20.5 per cent of the total, respectively. The CO2 removals in category 5.A.2 Land Converted to Forest Land, CO2 emissions in 5.C.1 Grassland Remaining Grassland and CO2 removals in 5.A.1 Forest Land Remaining Forest Land are key categories in level assessment when the LULUCF sector is included in the detailed analysis. Similarly, CO2 removals in category KP A.1 Afforestation (which are determined largely by 5.A.1 Forest Land Remaining Forest Land under LULUCF) is a key category in 2011 when Article 3.3 activities are included in the analysis. 3.2.8 PROCESS FOR THE RECALCULATION OF PREVIOUSLY SUBMITTED INVENTORY DATA Ongoing demands for more complete and more accurate estimates of greenhouse gas emissions means that the methodologies being used are subject to regular revision and refinement as inventory capacity is increased and better data become available. The general improvement in inventories over time may therefore introduce inconsistencies between the emissions estimates for recent years and those for years much earlier in the time-series. Recalculated estimates are often needed to eliminate these inconsistencies and to ensure that the inventories for all years in a time-series are directly comparable with respect to the sources and gases covered and that the methods, activity data and emission factors are applied in a transparent and consistent manner. In this way, the results can be used with greater confidence in identifying trends and in monitoring progress towards the commitments that have been defined with reference to emissions in the base year. The UNFCCC reporting guidelines provide for the reporting of recalculations as part of the annual submissions from Annex I Parties. Justification for the recalculations should be provided, as well as explanations of the changes that have been made and the numerical values of the original and revised estimates must be compared to show the impact of the changes. Recalculations are systematically planned and undertaken annually by Ireland as part of the normal inventory reporting cycle. The recalculations reflect the inventory agency’s own inventory development and improvement process and Ireland’s response to the UNFCCC inventory review process. Each sectoral chapter of Ireland’s NIR 2013 describes recalculations and improvements for the individual Level 1 source sectors of the inventory undertaken for the annual submission and they present the corresponding quantitative changes in emissions and removals within the individual sectors. Chapter 10 of the NIR 2013 records the major changes with regard to methodologies, activity data and emission factors and summarises the recalculations and assesses their effect in relation to total national emissions to record the updates and the most recent emissions estimates as they appear in the latest submission CRF tables. The original and revised numerical values of the emissions estimates for the years 1990-2010, along with the changes related to methods, activity data and emission factors are detailed in the respective CRF Tables 8(a) and 8(b) in the 2013 GHG inventory submission.
3.2.9 UNCERTAINTY ASSESSMENT The Tier 1 method provided by the IPCC good practice guidance has been used to make an assessment of uncertainty in the emissions inventory data for 2011. This method estimates uncertainties for the entire inventory in a particular year and the uncertainty in the trend over time by combining the uncertainties in activity data and emission factors for each source category. The analysis for 2011 data is presented in Table A.5.1 (excluding LULUCF) and Table A.5.2 of Annex A.5 (including LULUCF), using emissions on a GWP basis and a level of source category disaggregation that corresponds closely to the level used for emissions calculation and for key category analysis. This disaggregation level limits the likely dependency and correlation between source categories. The input values of uncertainty for activity data and emission factors in the GHG inventory have been assigned largely on the basis of general information related to the methodological descriptions
49
in the IPCC good practice guidance, supported by opinions elicited from the principal data suppliers, such as statistical offices, energy agencies, Government Departments and individual experts who contributed to certain parts of the inventory. Where high tier methods are used for combustion sources, such as those covered by ETS and road transport, the activity data uncertainty estimates are those indicated for the tier concerned. Accordingly, low estimates of uncertainty apply to the activity data for categories such as 1.A.1 (Energy Industries) and 1.A.3 (Transport), as shown on Table 1.12. Slightly higher uncertainty levels are used for energy activity data in sub-categories under 1.A.2 (Manufacturing Industries and Construction) and 1.A.4 (Other Sectors), where the end use of fuels is not as well quantified in the top-down methods used. Low activity data uncertainties are justified in respect of CO2 emissions sources in Industrial Processes, for which bottom-up data are applied in most cases and the major sources of emissions are covered by ETS. Country-specific CO2 emission factors are used for all combustion sources, which gives a basis for assigning the uncertainties for emission factors while again taking into account the applicable tiers. Uncertainties in the emission factors for CH4 and N2O released from combustion sources are high and not well established quantitatively. For CH4 and N2O emission factors for combustion categories, the most up-to-date IPCC publications are used and an indicative uncertainty of 50 per cent is used for both gases. The Agriculture sector is the second most important sector in Ireland’s GHG inventory and has a major influence on overall uncertainty due to its large contribution in terms of CH4 and N2O emissions. Ireland has long-established and robust statistical data collection procedures in place for agriculture in general, which guides the selection of 1 per cent as the activity data uncertainty for all agriculture sub-categories. The IPCC good practice guidance indicates that the emission factor estimates for the Tier 2 approach to determine CH4 emissions from enteric fermentation in cattle are likely to have an uncertainty of 20 per cent. Following the opinion of national agriculture experts, a value of 15 per cent has been adopted for these emissions to take into account Ireland’s detailed Tier 2 method and use of reliable data. In some of the other important emissions sources in Agriculture (such as manure management and agricultural soils) the activity data or emission factors ultimately used are determined by several specific component inputs, which are individually subject to varying degrees of uncertainty. The uncertainty estimates used for emission factors for these sources have been derived by assigning uncertainties to the key component parameters and combining them at the level of activity data or emission factors, as appropriate, using equation 6.4 in section 6.3 of the IPCC good practice guidance for each activity to obtain the input to the Tier 1 uncertainty assessment. The footnotes to Table 1.12 show how some of these uncertainty inputs are obtained. Category 6.A Solid Waste is the principal source of CH4 emissions outside Agriculture. The component uncertainties for both activity data and emission factor for CH4 generation are derived using equation 6.4 of the IPCC good practice guidance and as shown in the footnotes to Table 1.12. These are combined with uncertainties of 30 per cent and 10 per cent for flaring and utilisation respectively to obtain the overall uncertainty using equation 6.3 of the IPCC good practice guidance. Equations 6.3 and 6.4 are both applied as appropriate in a hierarchical approach to derive uncertainty for LULUCF under both the Convention inventory and Article 3.3 activities. This is achieved by developing uncertainties for carbon pools, which are combined to give the values for the individual land-use categories, which are then combined with uncertainties for other reported activities to give the totals for LULUCF and Article 3.3 separately. The uncertainty estimates for F-gases are those developed by the consultants who produced the F-gas inventories for Ireland in 2005 as the data sources and methodologies remain unchanged.
50

The Tier 1 uncertainty analysis (excluding LULUCF) for Ireland’s 2011 inventory under the Convention gives an overall uncertainty of 7.09 per cent in total emissions and a trend uncertainty of 2.3 per cent for the period 1990 to 2011 similar to the values reported in 2012 of 6.83 and 2.63 per cent respectively. These relatively low estimates are determined largely by the low uncertainties in the estimate of CO2 emissions, which accounts for 65.5 per cent of total Irish emissions in 2011 and which are estimated to have a level uncertainty of 1.16 per cent (excluding LULUCF). When CH4 is included, bringing the proportion of total emissions up to 86 per cent, the total uncertainty estimate is 2.04 per cent (excluding LULUCF), even though there are large uncertainties assigned to the CH4 emission factors in some source categories. However, it is the influence of N2O that leads to a substantial uncertainty in total emissions. This influence is not as large in the case of the trend, due to the modest change in emissions of N2O from 1990 to 2011 and the relatively small share of this gas in total emissions. The impact of HFC, PFC and SF6 on inventory uncertainty remains negligible because these gases account for only 1 per cent of total emissions in Ireland. The Tier 1 uncertainty analysis (including LULUCF) for Ireland’s 2011 inventory under the Convention (Table A.5.2) gives an overall uncertainty of 12.51 per cent in total emissions and a trend uncertainty of 6.62 per cent for the period 1990 to 2011. The overall uncertainly (including LULUCF) of the inventory in 2011 is estimated at 12.51 per cent which is showing an increase since the last submission. The corresponding value in 2010 was 7.15 per cent. The reason for the increase from 2010 to 2011 is due to revised estimates from the LULUCF sector and the effect on national total emissions and the revision to the activity data and emission factor uncertainty values used in this year’s analysis. The overall trend uncertainty increased in 2011 when compared to 2010 to a value of 6.62 per cent compared to 2.72 per cent. The overall uncertainty estimate for Article 3.3 activities in 2011 is 16.7 per cent, which is determined largely by an uncertainty of 16.79 per cent calculated for CO2 removals in the category 5(KP-I)A.1.1. 3.2.10 QUALITY ASSURANCE AND QUALITY CONTROL In early 2005, the inventory agency in Ireland commissioned a project with UK consultants NETCEN to establish formal QA/QC procedures that would meet the needs of the UNFCCC reporting requirements. The project developed a QA/QC system including a documented QA/QC plan and procedures along with a QA/QC manual. The manual provides a general overview of the QA/QC system. In addition, the manual provides guidance and templates for appropriate quality checking, documentation and traceability. The selection of source data, calculation methodologies, peer and expert review of inventory data and the annual requirements for continuous improvement for the inventory are also outlined in the manual. The QA/QC plan (Annex A.2) identifies the specific data quality objectives related to the principles of transparency, consistency, completeness, comparability and accuracy required for Ireland's national inventory and provides specific guidance and documentation forms and templates for the practical implementation of QA/QC procedures. The QA/QC procedures cover such elements as data selection and acquisition, data processing and reporting. The inventory agency initiated a new approach to QA/QC in the 2006 reporting cycle. Its application was completed and consolidated in delivering the submissions up to 2013. This involved the allocation of responsibilities linked to the national system mentioned in section 3.2 and the use of a
51

template spreadsheet system to record the establishment and maintenance of general inventory checking and management activities covering the overall compilation process, as well as the undertaking of specific annual activities and any necessary periodic activities in response to specific events or outcomes in inventory reporting and review. The system facilitates record keeping related to the chain of activities from data capture, through emissions calculations and checking, to archiving and the identification of improvements. Ireland’s calculation spreadsheets in all sectors are structured and organised to facilitate the QA/QC process and more efficient time-series analysis and also to ensure ease of transfer of the outputs to the CRF Reporter Tool. This facilitates rapid year-on-year extension of the time-series, rapid inter-annual comparisons and efficient updating and recalculation, where appropriate, in the annual reporting cycle. Internal aggregation to various levels corresponding to the CRF tables provides immediate and complete checks on the results. External reviews of the agriculture sector and of the entire ETS results for 2005 were conducted as important new components of quality assurance at the beginning of 2007. The review for the agriculture sector was performed by a Technical Inspector in DAFM. This review used the new calculation files to assess the consistency of the time series which had been subject to considerable improvement and recalculation in the 2006 reporting cycle. These improvements and recalculations were part of a move to higher tier methods for enteric fermentation in cattle as well as advice from the Department on various aspects of input data and calculation parameters. The detailed external review has not been repeated as there have not been any further changes to the methodologies in the agriculture sector. However, the inventory agency continues to work closely with DAFM and seeks advice and guidance from experts in Teagasc, an Agency of DAFM. The ETS returns to the ETU provide for the complete coverage of CO2 estimates in a number of sub-categories under 1.A.1 (Energy Industries) and 2.A. (Mineral Products). When the allocation to these categories from the ETS raw data is completed, the output is returned to the ETS administrator in OCLR for final checking against the source data. This ensures the efficient and consistent transfer of the verified ETS emissions estimates into the national inventory. Inventory development continues to benefit from the internal review procedures that are on-going with regard to the EU and its Member States. The most recent work in this forum focused on harmonising the reporting relating to sub-categories under 2.A (Mineral Products) across the EU Member States. The inventory agency contracted an external service provider, Aether, to assist in aspects of inventory compilation in 2012. The transparency, robustness and accessibility of the inventory data within the electronic filing structures were assessed by Aether, who concluded that the system is very well organised. 3.2.11 PROCEDURES FOR CONSIDERATION AND APPROVAL OF THE INVENTORY The approval of the completed annual inventory involves sign-off by the QA/QC manager and the inventory manager before it is transmitted to the Board of the EPA via the Programme Manager of the Climate Resource and Research Programme in OCLR (Annex A.3). Any issues arising from the Board’s examination of the estimates are communicated to the inventory experts for resolution before final adoption of the inventory. The results for the inventory year are normally released at national level in autumn of the following year. This is in advance of their official submission to the European Commission in accordance with Decision 280/2004/EC in January of the reporting year and subsequently to the UNFCCC secretariat. 3.3 EMISSIONS BY GREENHOUSE GAS The trends in emissions of the six greenhouse gases in Ireland over the period 1990-2011 are shown in Annex A.1.1 to Annex A.1.5. The trends in the principal emission components, shown as CO2
52

equivalents, within the six IPCC sectors are shown in Figures 3.1 and 3.2. Total emissions of the six greenhouse gases in Ireland (excluding net emissions from LULUCF) increased steadily from 55,247.17 Gg CO2 eq in 1990 to 70,171.39 Gg CO2 eq in 2001 and then decreased slightly to 68,209.17 Gg CO2 eq in 2004. Total emissions increased again in 2005 to 69,452.43 Gg CO2 eq and then decreased for six consecutive years. The largest annual change occurred from 2008 to 2009 when emissions decreased by 5,783.13 Gg CO2 eq from 67,609.96 to 61,826.84 Gg CO2 equivalent, a reduction of 8.6 per cent. Total emissions in 2011 were 4.1 per cent lower than in 1990 and 18.0 per cent lower than the peak level in 2001. The estimated total for 2011 is 57,514.53 Gg CO2 eq, equating to 3,980.04 Gg CO2 eq or 6.5 per cent lower than that for 2010. Inter annual changes to national total emission estimates are shown in Figure 3.3. Emissions of CO2 accounted for 65.5 per cent of the total (excluding LULUCF) of 57,514.53 Gg CO2 equivalent in 2011, with CH4 and N2O contributing 20.2 per cent and 13.3 per cent, respectively. The combined emissions of HFC, PFC and SF6 accounted for approximately 1 per cent of total emissions in 2011. In 1990 emissions of CO2, CH4, N2O and the combined emissions of HFCs, PFCs and SF6 accounted for 58.7, 24.8, 16.5 and less than 0.01 per cent, respectively of total emissions of 55,247.17 Gg CO2 equivalent.
Figure 3.3 Inter annual changes to national total GHG emissions 1990-2011
3.3.1 CARBON DIOXIDE CO2 CO2 is the most significant contributor to the greenhouse gas emissions with 1.A.1 Energy Industries responsible for 31.3 per cent of total CO2 emissions in 2011. 1.A.3 Transport represents a share of 29.6 per cent, 1.A.4 Other Sectors has a share of 24.5 per cent, 1.A.2 Manufacturing Industries and Construction has an 11.1 per cent share and the remainder of CO2 emissions (3.4 per cent share) fall into other sectors. Emissions of CO2 increased from 32,423.99 Gg in 1990 to 37,664.48 Gg in 2011, which equates to an increase of 16.2 per cent. The main driver behind this increase in emissions is primarily fuel combustion in Transport followed by Energy Industries. Over the period 1990-2011, emissions of CO2 from transport, predominantly road traffic in Ireland, increased by 122.3 per cent. This trend is exaggerated somewhat in later years by so-called fuel-tourism. In 2011 it is estimated that approximately 9 per cent of automotive fuel sold in Ireland is used in vehicles in the UK and other countries. Over the time-series, emissions of CO2 from 1.A.1 Energy Industries increased by 5.7 per cent, further adding to the increase in CO2 emissions over the 1990-2011 period. In addition,
0.78
-0.01
0.37
1.46 1.14
2.07 1.51
2.80
0.93
1.91 1.97
-1.91
0.07
-0.12
1.24
-0.43 -0.62 -0.80
-5.78
-0.33
-3.98
-7.00
-6.00
-5.00
-4.00
-3.00
-2.00
-1.00
0.00
1.00
2.00
3.00
4.00
1990 1991 1992 1993 1994 1995 1996 1997 1998 1999 2000 2001 2002 2003 2004 2005 2006 2007 2008 2009 2010 2011
Mt
CO
2 e
q.
Inter annual change
53
even though Ireland has only a small number of energy intensive industries, CO2 emissions from combustion in the industrial sector 1.A.2 Manufacturing Industries and Construction increased by 5.9 per cent between 1990 and 2011. 3.3.2 METHANE CH4
Methane is the second most significant contributor to greenhouse gas emissions in Ireland which is due to the large population of cattle. In 2011 emissions of CH4 were 11,628.82 Gg CO2 equivalent, indicating a decrease of 15 per cent on the 1990 level of 13,674.13 Gg CO2 equivalent. Emissions of CH4 increased progressively from 1990, reaching a peak in 1998 of 14,418.62 Gg CO2 equivalent, which reflects an increase in livestock numbers and therefore increased emissions from source categories 4.A Enteric Fermentation and 4.B Manure Management. Between 1998 and 2011 CH4 emissions decreased as a result of falling livestock numbers due to reform of the CAP. However, total CH4 emissions in the period 2001-2011 fluctuated to some extent on a yearly basis. This trend is a direct result of fluctuating CH4 emissions from 1.A.4 Other Sectors and 1.B.Fugitive Emissions from Fuels. The main contributor to the CH4 trend has been Agriculture and in 2011 the sector accounted for 90.9 per cent of the total methane emissions (compared to 87.2 per cent share in 1990 when emissions from Waste had a larger share in the methane trend). Nevertheless, the sectoral emissions from Agriculture decreased by 12.8 per cent between 1990 (11,927.75 Gg CO2 equivalent) and 2011 (10,571.44 Gg CO2 equivalent). Another significant source of methane emissions is the Waste sector, especially from landfill gas in category 6.A Solid Waste Disposal on Land. CH4 emissions from Waste decreased from 8.7 per cent share of total methane emissions (1,173.05 Gg CO2 equivalent) in 1990 to 7.3 per cent share (847.17 Gg CO2 equivalent) in 2011. This decrease is a result of improved management of landfill facilities, including increased recovery of landfill gas utilised for electricity generation and flaring. 3.3.3 NITROUS OXIDE N2O Emissions of N2O decreased by 16.4 per cent from their 1990 level of 9,112.13 Gg CO2 equivalent in 1990 to 7,621.12 Gg CO2 equivalent in 2011. Similar to CH4, emissions of N2O increased during the 1990s to reach a peak level of 10,303.17 Gg CO2 equivalent in 1998 reflecting increased use of synthetic fertilisers and increased amounts of animal manures associated with increasing animal numbers over that period. Emissions of N2O subsequently show a clear downward trend following reductions in synthetic fertiliser use and organic nitrogen applications on land as a result of the effect of CAP reform on animal numbers as well as the closure of Ireland’s only nitric acid plant in 2002. The biggest contributor to the trend is the Agriculture sector with a 93.4 per cent share of the total N2O emissions (7,121.76 Gg CO2 equivalent) in 2011. This reflects an increase from the 84.6 per cent share (7,706.33 Gg CO2 equivalent) in 1990 despite being a lower absolute number. Emissions from processes in the chemical industry used to be the second largest contributor to the trend contributing 11.4 per cent to total N2O emissions in 1990 and an average of 8.6 per cent share to the trend between 1990 and 2000, before falling to 3.4 per cent share in 2002 – the year of the nitric acid plant closure. Energy and Waste sectors contribute 4.6 per cent and 1.4 per cent respectively to the rest of the N2O trend. 3.3.4 HFCS, PFCS AND SF6
Emissions of the F-gases (HFCs, PFCs and SF6) were 600.10 Gg CO2 equivalent in 2011 compared to 36.91 Gg CO2 equivalent in 1990, a 16 fold increase over the time series. However F-gas emissions only account for approximately one per cent of the national total. F-gases include a wide range of substances that are used in a diverse range of products and manufacturing processes. Therefore it can be difficult to identify the factors contributing to actual trends in emissions over time. However it is possible to establish the main contributory sub-categories underlying these trends. The main causative factor of the increase in F-gas emissions has been the growth in HFC emissions from 2.F.1 Refrigeration and Air Conditioning through their use as replacement refrigerants across
54
virtually all refrigeration sub-categories since 1991. Increased use of HFCs in 2.F.2 Foam Blowing is also an important component of the trend. Emissions from HFCs increased from 1.31 Gg CO2 equivalent in 1990 reaching 548.66 Gg CO2 equivalent in 2006 and has remained at this level for the remainder of the time series (538.61 Gg CO2 in 2011). Emissions of PFCs show an increasing trend from 0.09 Gg CO2 equivalent in 1990 up to 130.82 Gg CO2 equivalent in 1997 through their use in the semiconductor manufacturing process in 2.F.7 Semiconductor Manufacture. Emissions subsequently decreased, only to significantly increase to reach 305.41 Gg CO2 equivalent in 2000. Semiconductor manufacturers continue to investigate various reduction initiatives through gas substitution and new process technologies which is reflected in the downward trend in PFC emissions between 2000 and 2011 (13.20 Gg CO2 equivalent in 2011). SF6 is used in a diverse number or products and processes and is therefore included in a number of IPCC source sub-categories including 2.F.7 Semiconductor Manufacture, 2.F.8 Electrical Equipment and 2.F.9 Other. Emissions of SF6 were 35.51 Gg CO2 equivalent and 48.29 Gg CO2 equivalent in 1990 and 2011, respectively. However, emissions of SF6 peaked in 1997 at 132.20 Gg CO2 equivalent following a steady increase in emissions from 1990. The increase over the period 1990-1997 was largely due to increased use of the gas in 2.F.7 Semiconductor Manufacture and 2.F.8 Electrical Equipment. Similar to PFCs, semiconductor manufacturers have undertaken to reduce the use of SF6 through gas substitution and new process technologies. In 2.F.8 Electrical Equipment, where SF6 is used for electrical insulation, arc quenching and current interruption, a leak reduction programme has been in place since 1997.
3.4 NATIONAL REGISTRY Statutory Basis The operation of the EU ETS and national registries is governed by Directive 2003/87/EC establishing a scheme for greenhouse gas emission allowance trading, as amended by Directive 2004/101/EC in respect of the Kyoto Protocol’s project mechanisms and Directive 2009/29/EC in respect of improving and extending the greenhouse gas emission allowance trading scheme of the Community. In Ireland, these Directives were transposed into national law through the European Communities (Greenhouse Gas Emission Trading) Regulations 2004 to 2005 (S.I. 437 of 200439 and S.I. 706 of 200540), and the Kyoto Protocol Flexible Mechanisms Regulation (S.I. 244 of 200641). The European Commission has set out specific legislation42 for a standardised and secured system of registries based on UN data exchange standards to track the issue, holding, transfer and cancellation of allowances. Directive 2009/29/EC adopted in 2009, provides for the centralization of the EU ETS operations into a single European Union Registry operated by the European Commission as well as for the inclusion of the aviation sector.
39
http://www.environ.ie/en/Legislation/Environment/Atmosphere/FileDownLoad,1301,en.pdf 40
http://www.environ.ie/en/Environment/Atmosphere/ClimateChange/RHLegislation/FileDownLoad,1300,en.pdf 41
http://www.environ.ie/en/Environment/Atmosphere/ClimateChange/RHLegislation/FileDownLoad,1299,en.pdf 42
Commission Regulation No. 920/2010 and Commission Regulation No. 1193/2011
55
http://www.environ.ie/en/Environment/Atmosphere/ClimateChange/RHLegislation/FileDownLoad,1300,en.pdf
http://www.environ.ie/en/Environment/Atmosphere/ClimateChange/RHLegislation/FileDownLoad,1300,en.pdf

At the same time, and with a view to increasing efficiency in the operations of their respective national registries, the EU Member States who are also Parties to the Kyoto Protocol (25) plus Iceland, Liechtenstein and Norway decided to operate their registries in a consolidated manner in accordance with all relevant decisions applicable to the establishment of Party registries - in particular Decision 13/CMP.1 and Decision 24/CP.8. The consolidated platform which implements the national registries in a consolidated manner (including the registry of EU) is called the CSEUR and was developed together with the new EU Registry. The single Union Registry has replaced all EU ETS registries hosted in the Member States since June 2012. (a) The name and contact information of the registry administrator designated by the Party to
maintain the national registry; Ireland’s EPA is responsible for establishing and maintaining the National Registry in Ireland. TABLE 3.6
Party Entity
IRELAND Environmental Protection Agency
PO Box 3000 Johnstown Castle Estate Co Wexford IRELAND. T: +353 53 9160600 F: +353 53 9160699
National Administrator Primary Contact Dr Eimear COTTER EPA Regional Inspectorate McCumiskey House Richview Clonskeagh Dublin 14 IRELAND T: +353 1 2680100 F: +353 1 2680199 E: [email protected] E: [email protected]
Alternate Contact Ms. Jacinta PONZI Environmental Protection Agency PO Box 3000 Johnstown Castle Estate Co Wexford IRELAND. T: +353 53 9160600 F: +353 53 9160699 E: [email protected] E: [email protected]
56
(b) The names of the other Parties with which the Party cooperates by maintaining their
national registries in a consolidated system; The EU Member States who are also Parties to the Kyoto Protocol (25) plus Iceland, Liechtenstein and Norway have decided to operate their registries in a consolidated manner. The CSEUR was certified on 1 June 2012 and went into production on 20 June 2012. The consolidated platform which implements the national registries in a consolidated manner (including the registry of EU) is called the CSEUR and was developed together with the new EU registry on the basis of the following modalities: (1) Each Party retains its organisation designated as its registry administrator to maintain the
national registry of that Party and remains responsible for all the obligations of Parties that are to be fulfilled through registries;
(2) Each Kyoto unit issued by the Parties in such a consolidated system is issued by one of the
constituent Parties and continues to carry the Party of origin identifier in its unique serial number;
(3) Each Party retains its own set of national accounts as required by paragraph 21 of the Annex
to Decision 15/CMP.1. Each account within a national registry keeps a unique account number comprising the identifier of the Party and a unique number within the Party where the account is maintained;
(4) Kyoto transactions continue to be forwarded to and checked by the UNFCCC ITL, which
remains responsible for verifying the accuracy and validity of those transactions; (5) The transaction log and registries continue to reconcile their data with each other in order to
ensure data consistency and facilitate the automated checks of the ITL; (6) The requirements of paragraphs 44 to 48 of the Annex to Decision 13/CMP.1 concerning
making non-confidential information accessible to the public would be fulfilled by each Party individually;
(7) All registries reside on a consolidated IT platform sharing the same infrastructure
technologies. The chosen architecture implements modalities to ensure that the consolidated national registries are uniquely identifiable, protected and distinguishable from each other, notably:
(a) With regards to the data exchange, each national registry connects to the ITL directly
and establishes a distinct and secure communication link through a consolidated communication channel (VPN tunnel);
(b) The ITL remains responsible for authenticating the national registries and takes the full
and final record of all transactions involving Kyoto units and other administrative processes such that those actions cannot be disputed or repudiated;
(c) With regards to the data storage, the consolidated platform continues to guarantee that
data is kept confidential and protected against unauthorized manipulation;
57

(d) The data storage architecture also ensures that the data pertaining to a national registry are distinguishable and uniquely identifiable from the data pertaining to other consolidated national registries;
(e) In addition, each consolidated national registry keeps a distinct user access entry point
(URL) and a distinct set of authorisation and configuration rules.
A complete description of the consolidated registry was provided in the common readiness documentation and specific readiness documentation for the national registry of EU and all consolidating national registries. This description includes: • Readiness Questionnaire • Application Logging • Change Management Procedure • Disaster Recovery • Manual Intervention • Operational Plan • Roles and Responsibilities • Security Plan • Time Validation Plan • Version Change Management This readiness documentation was referenced in Chapter 14 of the National Inventory Report 2013 and was provided in the electronic Appendix 1 SIAR Supplementary Information to the NIR. Following the successful implementation of the CSEUR platform, the 28 national registries concerned were re-certified in June 2012 and switched over to their new national registry on 20 June 2012. During the go-live process, all relevant transaction and holdings data were migrated to the CSEUR platform and the individual connections to and from the ITL were re-established for each Party. A new central service desk was also set up to support the Registry Administrators of the consolidated system. The new service desk acts as 2nd level of support to the local support provided by the Parties. It also plays a key communication role with the ITL Service Desk with particular regard to connectivity or reconciliation issues. (a) A description of the database structure and capacity of the national registry; A complete description of the consolidated registry was provided in the common readiness documentation and specific readiness documentation for the national registry of EU and all consolidating national registries. This readiness documentation was referenced in Chapter 14 of the National Inventory Report 2013 and was provided in the electronic Appendix 1 SIAR Supplementary Information to the NIR. During certification, the consolidated registry was subject to connectivity testing, connectivity reliability testing, distinctness testing and interoperability testing to demonstrate capacity and conformance to the Data Exchange Standard (DES). All tests were executed successfully and resulted in successful certification on 1 June 2012. Since the successful certification of the Registry on 1 June 2012, there has been no change in the capacity of the Registry or change of its infrastructure.
58

Since the successful certification of the Registry on 1 June 2012, Iteration 4 of the Registry, introduced in October 2012, did add a limited number of new entities. However, none of these related to DES entities. Iteration 4 was only a minor iteration and changes were limited to EU ETS functionality and had no impact on Kyoto Protocol functions in the Registry. The relevant test script (V 4 Site Acceptance Test Report) was referenced in Chapter 14 of the National Inventory Report 2013 and was provided in the electronic Appendix 1 SIAR Supplementary Information to the NIR. A data model is attached (see ANNEX I to this Chapter) which more clearly shows the relevant entities "RECONCILIATIONS", "NOTIFICATIONS", "RESPONSES"," INTERNAL AUDIT LOG" and "MESSAGE LOG." As specified in the DES (Section VII. Data Logging Specifications/E. Message Archive), a copy of messages sent and received is stored in standalone files in one of two managed servers in the hosting environment. For that reason, the Message Archive is not shown in the data model. The "MESSAGE LOG" object holds the location of the entire message, for each Message_ID. However, each major release of the registry is subject to both regression testing and tests related to new functionality. These tests include thorough testing against the DES and are successfully carried out prior to the relevant major release of the version to Production (see ANNEX II to this Chapter). (a) A description of how the national registry conforms to the DES between registry systems for
the purpose of ensuring the accurate, transparent and efficient exchange of data between national registries, the clean development mechanism registry and the transaction log (decision 19/CP.7, para 1);
The Consolidated System of EU Registries (CSEUR) successfully completed a full certification procedure in June 2012. Notably, this procedure included connectivity testing, connectivity reliability testing, distinctness testing and interoperability testing to demonstrate capacity and conformance to the Data Exchange Standard (DES). This included a full Annex H test. All tests were executed successfully and led to successful certification on 1 June 2012. The recertification certificate confirming that the National Registry of Ireland successfully passed all recertification tests pursuant to the release of the change of the consolidation of European national registries is attached in ANNEX III to this Chapter. Since the successful certification of the Registry on 1 June 2012, there has been no change in the capacity of the Registry or change of its infrastructure. (a) A description of the procedures employed in the national registry to minimize discrepancies
in the issuance, transfer, acquisition, cancellation and retirement of emission reduction units (ERUs), certified emission reductions (CERs), temporary certified emissions reductions (tCERs), long-term certified emission reductions (lCERs), assigned amount units (AAUs) and/or removal units (RMUs), and replacement of tCERS and lCERs, and of the steps taken to terminate transactions where a discrepancy is notified and to correct problems in the event of a failure to terminate the transactions;
59

The overall change to a Consolidated System of EU Registries also triggered changes to discrepancies procedures, as reflected in the updated Manual Intervention Document and the Operational Plan. The complete description of the consolidated registry was provided in the common readiness documentation and specific readiness documentation for the national registry of EU and all consolidating national registries. This readiness documentation was referenced in Chapter 14 of the National Inventory Report 2013 and was provided in the electronic Appendix 1 SIAR Supplementary Information to the NIR. For 2012, Ireland also submitted a Standard Electronic Format (SEF) that was consistent with the ITL records and no discrepancies were noted as having occurred. (a) An overview of security measures employed in the national registry to prevent unauthorized
manipulations and to prevent operator error and of how these measures are kept up to date;
The overall change to a Consolidated System of EU Registries also triggered changes to security, as reflected in the updated Security Plan. The complete description of the consolidated registry was provided in the common readiness documentation and specific readiness documentation for the national registry of EU and all consolidating national registries. This readiness documentation was referenced in Chapter 14 of the National Inventory Report 2013 and was provided in the electronic Appendix 1 SIAR Supplementary Information to the NIR. Moreover, prior to migration to the CSEUR in June 2012, Ireland engaged external auditors during February/March 2012 to carry out a network and application security test to identify possible security issues and vulnerabilities in the hosted environment for the Irish National Emission Trading Registry. The auditors found that Ireland’s National Emission Trading Registry was configured securely. No high risk misconfigurations or security issues were identified. The application performed well in all phases of testing, with consistent security measures applied across the environment. An active helpdesk is maintained by Ireland’s National Administrators for assistance to accountholders. A yearly compliance seminar is also provided to Operators which serves to, inter alia, remind Operators of the importance of Registry security; changes to Registry functionality and their compliance obligations. (a) A list of the information publicly accessible by means of the user interface to the national
registry; The following information is publicly accessible and is available via the homepage of Ireland’s domain on the Union Registry – https://ets-registry.webgate.ec.europa.eu/euregistry/IE/index.xhtml Users are then directed to the publicly accessible information on the website of Ireland’s Environmental Protection Agency (EPA). In accordance with the requirements of Annex E to Decision 13/CMP.1, all required information for a Party with an active Kyoto registry is provided with the exceptions as outlined below.
60

Account Information (Paragraph 45) and Account holders authorised to hold Kyoto units in their account (Paragraph 48)
For security reasons and in accordance with Article 75.9 of the Commission Regulation No 920/2010, it is considered that the representative identification information (required by paragraph 45) is held as confidential. For similar security reasons, it is considered that the legal entity contact information (required by paragraph 48) is held as confidential. Accordingly, this information is not included in the Account Information Report. The most up-to-date account information may be accessed from the EUTL public website: http://ec.europa.eu/environment/ets/
JI projects in Ireland (Paragraph 46) Note that no Article 6 (Joint Implementation) project is reported as conversion to an ERU under an Article 6 project, as this did not occur in the specified period. In line with the Ireland’s National Climate Change Strategy 2007-201243, Ireland does not host JI projects.
Holding and transaction information of units (Paragraph 47) Holding and transaction information is provided on a holding type level, due to more detailed information being declared confidential by EU Regulation. Article 75.1 of the Commission Regulation No 920/2010, as amended, provides that ‘Information, including the holdings of all accounts, all transactions made, the unique unit identification code of the allowances and the unique numeric value of the unit serial number of the Kyoto units held or affected by the transaction, held in the EUTL, the Union registry and every other KP registry shall be considered confidential except as otherwise required by Union law, or by provisions of national law that pursue a legitimate objective compatible with this Regulation and are proportionate’. This information may also be accessed from the EUROPA website: http://ec.europa.eu/dgs/clima/mission/index_en.htm
Paragraph 47c Ireland does not host JI projects in line with the National Climate Change Strategy.
Paragraph 47e Ireland does not perform LULUCF activities and therefore does not issue RMUs
Paragraph 47g No ERUs, CERs, AAUs and RMUs have been cancelled on the basis of activities under Article 3, paragraphs 3 and 4 to date.
Paragraph 47h No ERUs, CERs, AAUs and RMUs have been cancelled following determination by the Compliance Committee that the Party is not in compliance with its commitment under Article 3, paragraph 1 to date.
43
http://www.environ.ie/en/Environment/Atmosphere/ClimateChange/NationalClimateChangeStrategy/PublicationsDocuments/FileDownLoad,1861,en.pdf
61

Paragraph 47j No ERUs, CERs, AAUs and RMUs have been retired to date
Paragraph 47k There is no previous commitment period to carry ERUs, CERs, and AAUs over from. (a) The Internet address of the interface to its national registry; Further to the move to the CSEUR in June 2012, the internet address of the IRELAND domain on the Union Registry is: https://ets-registry.webgate.ec.europa.eu/euregistry/IE/index.xhtml (a) A description of measures taken to safeguard, maintain and recover data in order to ensure
the integrity of data storage and the recovery of registry services in the event of a disaster;
The overall change to a Consolidated System of EU Registries also triggered changes to data integrity measures, as reflected in the updated Disaster Recovery Plan. The complete description of the consolidated registry was provided in the common readiness documentation and specific readiness documentation for the national registry of EU and all consolidating national registries.
This readiness documentation was referenced in Chapter 14 of the National Inventory Report 2013 and was provided in the electronic Appendix 1 SIAR Supplementary Information to the NIR.
(a) The results of any test procedures that might be available or developed with the aim of
testing the performance, procedures and security measures of the national registry undertaken pursuant to the provisions of decision 19/CP.7 relating to the technical
standards for data exchange between registry systems. The Consolidated EU system of Registries successfully completed a full certification procedure in June 2012. Notably, this procedure includes connectivity testing, connectivity reliability testing, distinctness testing and interoperability testing to demonstrate capacity and conformance to the Data Exchange Standard (DES). This included a full Annex H test. All tests were executed successfully and led to successful certification on 1 June 2012. The recertification certificate confirming that the National Registry of Ireland successfully passed all recertification tests pursuant to the release of the change of the consolidation of European national registries is attached in ANNEX III to this Chapter. Since the successful certification of the Registry on 1 June 2012, Iteration 4 of the Registry, introduced in October 2012, did add a limited number of new entities. However, none of these related to DES entities. Iteration 4 was only a minor iteration and changes were limited to EU ETS functionality and had no impact on Kyoto Protocol functions in the Registry. The V4.0 functionalities included auctioning of Phase 3 and aviation allowances; a new EU ETS account type (trading account) and a new security feature of a Trusted Account List which prevents any transfer from a holding account to an account that is not trusted. The relevant test script (V 4 Site Acceptance Test Report) was referenced in Chapter 14 of the National Inventory Report 2013 and was provided in the electronic Appendix 1 SIAR Supplementary Information to the NIR.
62

A data model is attached (see ANNEX I to this Chapter) which more clearly shows the relevant entities "RECONCILIATIONS", "NOTIFICATIONS", "RESPONSES"," INTERNAL AUDIT LOG" and "MESSAGE LOG." As specified in the DES (Section VII. Data Logging Specifications/E. Message Archive), a copy of messages sent and received is stored in standalone files in one of two managed servers in the hosting environment. For that reason, the Message Archive is not shown in the data model. The "MESSAGE LOG" object holds the location of the entire message, for each Message_ID. However, each major release of the registry is subject to both regression testing and tests related to new functionality. These tests include thorough testing against the DES and are successfully carried out prior to the relevant major release of the version to Production (see ANNEX II to this Chapter).
63

ANNEX I to Chapter 3
64

ANNEX II to Chapter 3 CRCR2012IT5.1 SAT and REGRESSION REPORT Status information
Current version number: V1.0 Date of first issue :
13/12/2012
Prepared by: E. Muteba, G. Micheli & D. Craeye
Date: 11/12/2012
Verified by: E. Luctkens
Date: 13/12/2012
SPEC FUNCTIONA
LITY USE CASES TEST CASES
PRIORITY
DESIGN STATUS
FAT version 5.1-
SNAPSHOT#1176
EXECUTION STATUS
Browser
Date
SAT RELEASE
5.1 EXECUTI
ON STATUS
Remarks
UCS.01
BASIC FUNCTIONALITY
UC_BF_02:OPEN ANOTHER REGISTRY UC_BF_02_TC_01:OPEN
ANOTHER REGISTRY MEDIU
M DESIGNED
PASSED 12/12/20
12 PASSED
UCS.01
UC_BF_01:SWITCH REGISTRY
PASSED PASSED
UCS.01
UC_BF_005:DISPLAY MENU
UC_BF_05_TC_01:DISPLAY MENU ACCORDING TO USER ROLE
MEDIUM
DESIGNED PASSED ie 12/12/20
12 PASSED
UCS.01
UC_BF_005:DISPLAY MENU
UC_BF_05_TC_02:SEARCH AND EXPORT TABLES
MEDIUM
DESIGNED PASSED ie 12/12/20
12 PASSED
65
UCS.02
USERS
UC_UA_01:LOGIN
UC_UA_01_TC_01:USER LOGIN
HIGH DESIGNED PASSED IE 07/12/20
12 PASSED
UCS.02
UC_UA_01_TC_02:FIRST TIME USER
HIGH DESIGNED PASSED IE 07/12/20
12 PASSED
UCS.02
UC_UA_01_TC_03:USER LOGIN - REGISTERED/ ENROLLED USER
HIGH DESIGNED PASSED IE 07/12/20
12 PASSED
UCS.02
UC_UA_01_TC_04:UNSUCCESSFUL LOGIN
MEDIUM
DESIGNED PASSED ia 12/12/20
12 PASSED
UCS.02
UC_UA_01_TC_05:UNSUCCESSFUL LOGIN - ECAS MOBILE IS DIFFERENT THAN THE USER'S MOBILE IN PERSONAL DETAILS DATA
HIGH DESIGNED PASSED IE 07/12/20
12 PASSED
UCS.02
UC_UA_01_TC_06:UNSUCCESSFUL LOGIN -UPDATE MOBILE NUMBER
HIGH DESIGNED PASSED IE 07/12/20
12 PASSED
UCS.02
UC_UA_050:VIEW USER DETAILS
UC_UA_050_TC_01:VIEW USERS DETAILS/ PERSONAL DETAILS
MEDIUM
DESIGNED PASSED 12/12/20
12 PASSED
UCS.03
ROLE MANAGEMENT
UC_RM_03:MANAGE ROLE PERMISSIONS
UC_RM_03_TC_01:MANAGE ROLE PERMISSIONS
HIGH DESIGN
ED PASSED
IE,MOZILLA
10/12/2012
PASSED
66

UCS.05
WORKFLOW MANAGEMENT
UC_WF_010:MANAGE TASK LIST
UC_WF_010_TC_01:MANAGE/ FILTER TASK LIST
MEDIUM
DESIGNED PASSED IE,MOZIL
LA 12/12/20
12 PASSED
UCS.05
UC_WF_010_TC_02:TASK REQUESTER THAT BELONGS TO APPROVAL ASSIGNEE GROUP CAN REJECT THE TASK
HIGH DESIGNED PASSED IE,MOZIL
LA 10/12/20
12 PASSED
UCS.05
UC_WF_010_TC_03:TASK APPROVER ECAS SIGNATURE MOBILE SHOULD BE DIFFERENT THAN REQUESTER SIGNATURE MOBILE
HIGH DESIGNED PASSED IE,MOZIL
LA 10/12/20
12 PASSED
UCS.05
UC_WC_020_TC_01:MANAGE/ FILTER HISTORY LIST
LOW DESIGNED
PASSED 13/12/20
12 PASSED
UCS.05
UC_WF_020:MANAGE HISTORY LIST
PASSED PASSED
UCS.05
UC_WF_012:ASSIGN TASK
UC_WF_012_TC_01:ASSIGN TASK
MEDIUM
DESIGNED PASSED IE,MOZIL
LA 12/12/20
12 PASSED
67

UCS.05
UC_WF_013:CLAIM TASK
UC_WF_013_TC_01:CLAIM TASK
MEDIUM
DESIGNED PASSED IE,MOZIL
LA 12/12/20
12 PASSED
UCS.05
UC_WF_014:UN-CLAIM TASK
UC_WF_014_TC_01:UN-CLAIM TASK
MEDIUM
DESIGNED PASSED IE,MOZIL
LA 12/12/20
12 PASSED
UCS.05
UC_WF_015:COMPLETE TASK
UC_WF_015_TC_01:COMPLETE TASK
HIGH DESIGNED PASSED IE,MOZIL
LA 10/12/20
12 PASSED
UCS.04
ACCOUNT MANAGEMENT
UC_AM_10:REQUEST ACCOUNT OPENING
UC_AM_10_TC_05:OPEN ACCOUNT REQUEST-AIRCRAFT OPERATOR ACCOUNT
HIGH DESIGNED PASSED IE,MOZIL
LA 10/12/20
12 PASSED
UCS.04
UC_AM_70:APPROVE OR REJECT A SPECIFIC ACCOUNT OPENING REQUEST
UC_AM_70_TC_01:APPROVE ACCOUNT OPENING REQUEST
HIGH DESIGNED PASSED IE,MOZIL
LA 10/12/20
12 PASSED
UCS.04
UC_AM_70_TC_02:APPROVE ACCOUNT OPENING/ ACCOUNT REPRESENTATIVE ENROLMENT
HIGH DESIGNED PASSED IE,MOZIL
LA 10/12/20
12 PASSED
UCS.04 UC_AM_70_TC_03:REJECT
ACCOUNT OPENING REQUEST
HIGH DESIGNED
PASSED IE,MOZIL
LA 10/12/20
12 PASSED
UCS.04
PASSED PASSED
68
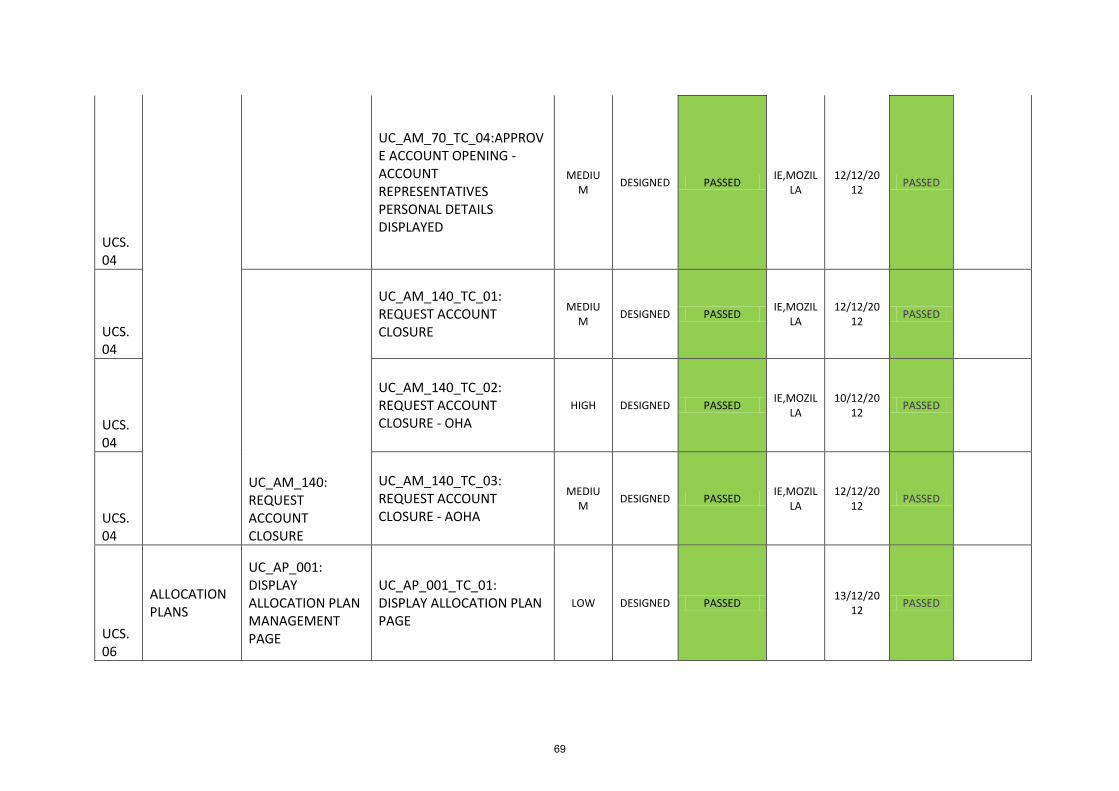
UCS.04
UC_AM_70_TC_04:APPROVE ACCOUNT OPENING - ACCOUNT REPRESENTATIVES PERSONAL DETAILS DISPLAYED
MEDIUM
DESIGNED PASSED IE,MOZIL
LA 12/12/20
12 PASSED
UCS.04
UC_AM_140: REQUEST ACCOUNT CLOSURE
UC_AM_140_TC_01: REQUEST ACCOUNT CLOSURE
MEDIUM
DESIGNED PASSED IE,MOZIL
LA 12/12/20
12 PASSED
UCS.04
UC_AM_140_TC_02: REQUEST ACCOUNT CLOSURE - OHA
HIGH DESIGNED PASSED IE,MOZIL
LA 10/12/20
12 PASSED
UCS.04
UC_AM_140_TC_03: REQUEST ACCOUNT CLOSURE - AOHA
MEDIUM
DESIGNED PASSED IE,MOZIL
LA 12/12/20
12 PASSED
UCS.06
ALLOCATION PLANS
UC_AP_001: DISPLAY ALLOCATION PLAN MANAGEMENT PAGE
UC_AP_001_TC_01: DISPLAY ALLOCATION PLAN PAGE
LOW DESIGNED PASSED 13/12/20
12 PASSED
69

UCS.06
UC_AP_005: VIEW ALLOCATION PLAN
UC_AP_005_TC_01: VIEW NATIONAL ALLOCATION PLAN (NAP)
MEDIUM
DESIGNED PASSED IE,MOZIL
LA 12/12/20
12 PASSED
UCS.06
UC_AP_005_TC_02: VIEW AVIATION ALLOCATION PLAN (CAAT)
MEDIUM
DESIGNED PASSED IE,MOZIL
LA 12/12/20
12 PASSED
UCS.06
UC_AP_006: FILTER LIST
UC_AP_006_TC_01: SEARCH NAP
LOW DESIGNED PASSED 13/12/20
12 PASSED
UCS.06
UC_AP_006_TC_02: SEARCH CAAT
LOW DESIGNED PASSED 13/12/20
12 PASSED
UCS.06
UC_AP_010: IMPORT ALLOCATION PLAN
UC_AP_010_TC_01: IMPORT NAP- TOTAL QUANTITY OF ALLOWANCES IS NOT DECREASED
HIGH DESIGNED PASSED IE,MOZIL
LA 11/12/20
12 PASSED
70

UCS.06
UC_AP_010_TC_02: IMPORT NAP- TOTAL QUANTITY OF ALLOWANCES IS DECREASED
HIGH DESIGNED PASSED IE,MOZIL
LA 11/12/20
12 PASSED
UCS.06
UC_AP_010_TC_03: IMPORT CAAT-TOTAL QUANTITY OF ALLOWANCES IS NOT DECREASED
HIGH DESIGNED PASSED IE,MOZIL
LA 11/12/20
12 PASSED
UCS.06
UC_AP_040:CONFIRM ALLOCATION PLAN CHANGES
UC_AP_010_TC_04: IMPORT INVALID ALLOCATION PLAN
LOW DESIGNED PASSED 12/12/20
12 PASSED
WHEN IMPORTING A wrong xml file the system detects it
UCS.06 UC_AP_022:
DELETE ALLOCATION PLAN ENTRY
UC_AP_022_TC_01: DELETE NAP ENTRY
MEDIUM
DESIGNED PASSED IE,MOZIL
LA 12/12/20
12 PASSED
UCS.06
UC_AP_022_TC_02: DELETE NAP ENTRIES
LOW DESIGNED PASSED 13/12/20
12 PASSED
71

UCS.06
UC_AP_022_TC_03: DELETE NAP ENTRY WITH ALLOCATED UNITS
MEDIUM
DESIGNED PASSED IE,MOZIL
LA 12/12/20
12 PASSED
UCS.06
UC_AP_022_TC_04: DELETE NAP ENTRY- MERGE RESULT TO AN EXISTING ACCOUNT
MEDIUM
DESIGNED PASSED IE,MOZIL
LA 12/12201
2 PASSED
UCS.06
UC_AP_022_TC_05: DELETE NAP ENTRY- MERGE RESULT TO AN EXISTING ACCOUNT WITH ALLOCATED UNITS
MEDIUM
DESIGNED PASSED IE,MOZIL
LA 12/12/20
12 PASSED
UCS.06
UC_AP_022_TC_07: DELETE CAAT ENTRY
MEDIUM
DESIGNED PASSED IE,MOZIL
LA 12/12/20
12 PASSED
72

UCS.06
UC_AP_022_TC_08: DELETE CAAT ENTRIES
LOW DESIGNED PASSED 13/12/20
12 PASSED
UCS.06
UC_AP_022_TC_09: DELETE CAAT ENTRY WITH ALLOCATED UNITS
MEDIUM
DESIGNED PASSED IE,MOZIL
LA 12/12/20
12 PASSED
UCS.06
UC_AP_022_TC_10: DELETE CAAT ENTRY- MERGE RESULT TO AN EXISTING ACCOUNT OF THE SAME REGISTRY
MEDIUM
DESIGNED PASSED IE,MOZIL
LA 12/12/20
12 PASSED
UCS.06
UC_AP_022_TC_11: DELETE CAAT ENTRY- MERGE RESULT TO AN EXISTING ACCOUNT WITH ALLOCATED UNITS FROM THE SAME REGISTRY
MEDIUM
DESIGNED PASSED IE,MOZIL
LA 12/12/20
12 PASSED
73

UCS.06
UC_AP_022_TC_13: DELETE CAAT ENTRY- MERGE RESULT TO AN EXISTING ACCOUNT FROM DIFFERENT REGISTRY
MEDIUM
DESIGNED PASSED IE,MOZIL
LA 12/12/20
12 PASSED
UCS.06
UC_AP_022_TC_14: DELETE CAAT ENTRY- MERGE RESULT TO AN EXISTING ACCOUNT WITH ALLOCATED UNITS FROM DIFFERENT REGISTRY
MEDIUM
DESIGNED PASSED IE,MOZIL
LA 12/12/20
12 PASSED
UCS.06
UC_AP_025: REPLENISH RESERVE
UC_AP_025_TC_01: REPLENISH THE RESERVE OF A NAP
MEDIUM
DESIGNED PASSED IE,MOZIL
LA 12/12/20
12 PASSED
UCS.06
UC_AP_025_TC_02: REPLENISH RESERVE OF A NAP-DATA VALIDATION-NEGATIVE TESTING
LOW DESIGNED PASSED PASSED
74
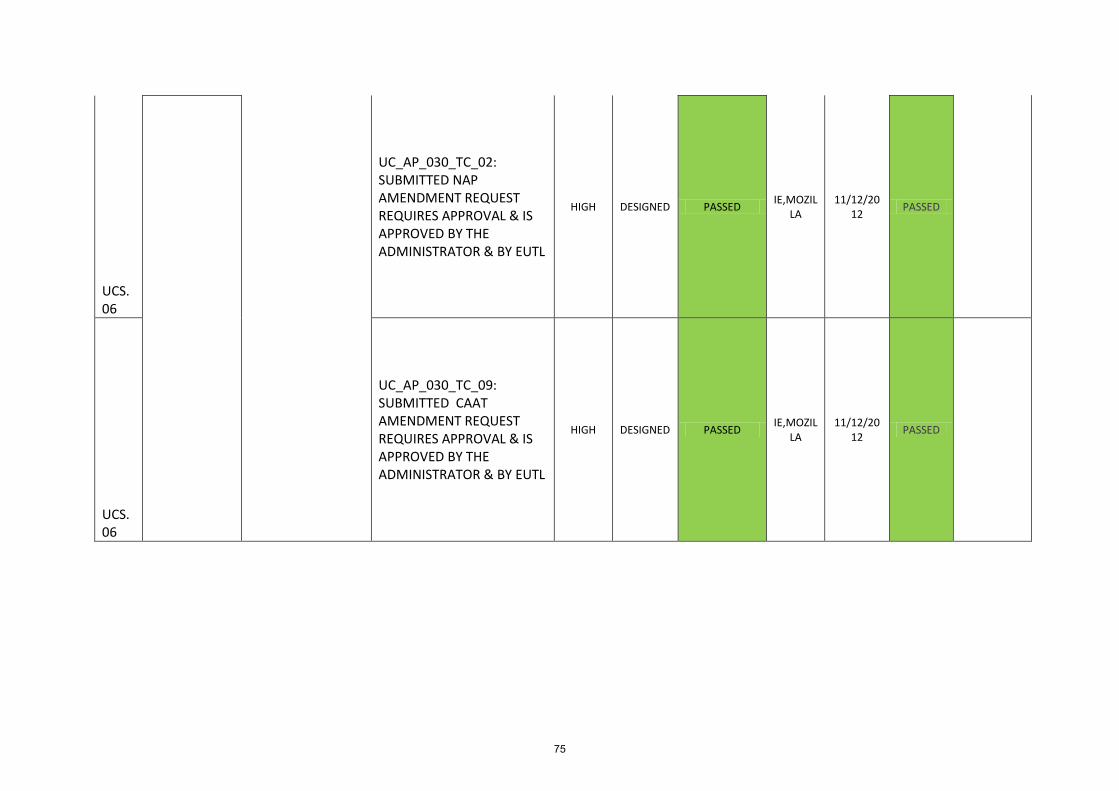
UCS.06
UC_AP_030_TC_02: SUBMITTED NAP AMENDMENT REQUEST REQUIRES APPROVAL & IS APPROVED BY THE ADMINISTRATOR & BY EUTL
HIGH DESIGNED PASSED IE,MOZIL
LA 11/12/20
12 PASSED
UCS.06
UC_AP_030_TC_09: SUBMITTED CAAT AMENDMENT REQUEST REQUIRES APPROVAL & IS APPROVED BY THE ADMINISTRATOR & BY EUTL
HIGH DESIGNED PASSED IE,MOZIL
LA 11/12/20
12 PASSED
75

UCS.06
UC_AP_030_TC_13: SUBMITTED CAAT MERGE AMENDMENT REQUEST REQUIRES APPROVAL & ISAPPROVED BY THE ADMINISTRATOR, APPROVED BY THE REGISTRY SPECIFIED BY THE MERGE AND APPROVED BY EUTL
HIGH DESIGNED PASSED IE,MOZIL
LA 11/12/20
12 PASSED
UCS.06
UC_AP_060: VIEW HISTORY
UC_AP_060_TC_01: VIEW NAP HISTORY
MEDIUM
DESIGNED PASSED IE,MOZIL
LA 12/12/20
12 PASSED
UCS.06
UC_AP_060_TC_02: VIEW CAAT HISTORY
MEDIUM
DESIGNED PASSED IE,MOZIL
LA 12/12/20
12 PASSED
76

UCS.06
UC_AP_060_TC_03: VIEW REVISION DETAILS HISTORY
MEDIUM
DESIGNED PASSED IE,MOZIL
LA 12/12/20
12 PASSED
UCS.06
UC_AP_101: DISPLAY PHASE 3 ALLOCATION PLAN MANAGEMENT PAGE
UC_AP_101_TC_01: DISPLAY PHASE 3 ALLOCATION PLAN MANAGEMENT PAGE
LOW DESIGNED PASSED PASSED
UCS.06
UC_AP_101_TC_02: DISPLAY PHASE 3 ALLOCATION PLAN MANAGEMENT PAGE – NEGATIVE TESTING
LOW DESIGNED PASSED PASSED
UCS.06
UC_AP_105: VIEW PHASE 3 ALLOCATION PLAN
UC_AP_105_TC_01: VIEW NATIONAL ALLOCATION TABLE – PHASE 3 (NAP)
MEDIUM
DESIGNED PASSED IE,MOZIL
LA 12/12/20
12 PASSED
77

UCS.06
UC_AP_105_TC_02: VIEW NATIONAL AVIATION ALLOCATION TABLE – PHASE 3 (NAAT)
MEDIUM
DESIGNED PASSED IE,MOZIL
LA 12/12/20
12 PASSED
UCS.06
UC_AP_105_TC_03: VIEW ALLOCATION PLANS PHASE 3 – UPDATE WORKFLOW IS PENDING-NEGATIVE TESTING
LOW DESIGNED PASSED PASSED
UCS.06
UC_AP_105_TC_05: VIEW ALLOCATION PLANS PHASE 3 AND ACCOUNT DETAILS
LOW DESIGNED PASSED PASSED
UCS.06
UC_AP_107: VIEW PHASE 3 ALLOCATION PLAN ENTRY DETAILS
UC_AP_107_TC_01: VIEW PHASE 3 ALLOCATION PLAN ENTRY DETAILS
MEDIUM
DESIGNED PASSED IE,MOZIL
LA 12/12/20
12 PASSED
UCS.06
UC_AP_110: IMPORT PHASE 3 ALLOCATION PLAN
UC_AP_110_TC_01: IMPORT NAP FOR PHASE 3
HIGH DESIGNED PASSED IE,MOZIL
LA PASSED
UCS.06
UC_AP_110_TC_02: IMPORT NAAT FOR PHASE 3
HIGH DESIGNED PASSED IE,MOZIL
LA 11/12/20
12 PASSED
UCS.06
UC_AP_110_TC_03: IMPORT INVALID ALLOCATION PLAN FOR PHASE 3
MEDIUM
DESIGNED PASSED IE,MOZIL
LA 12/12/20
12 PASSED
78
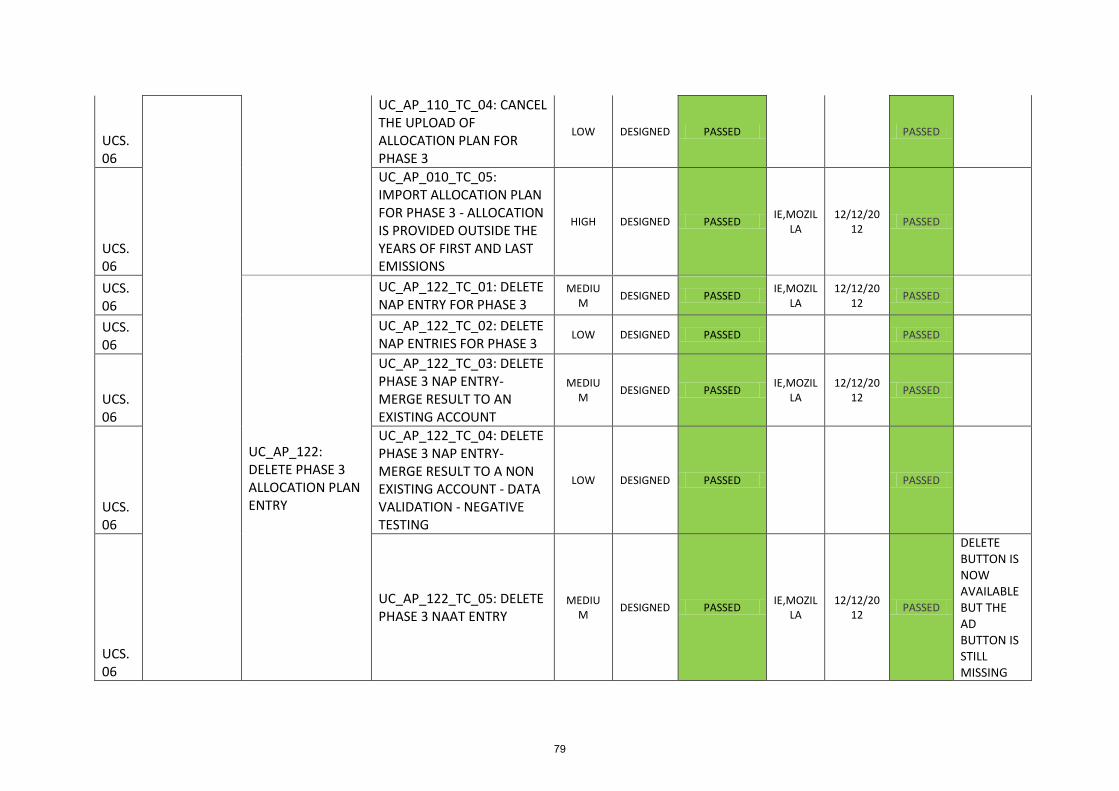
UCS.06
UC_AP_110_TC_04: CANCEL THE UPLOAD OF ALLOCATION PLAN FOR PHASE 3
LOW DESIGNED PASSED PASSED
UCS.06
UC_AP_010_TC_05: IMPORT ALLOCATION PLAN FOR PHASE 3 - ALLOCATION IS PROVIDED OUTSIDE THE YEARS OF FIRST AND LAST EMISSIONS
HIGH DESIGNED PASSED IE,MOZIL
LA 12/12/20
12 PASSED
UCS.06
UC_AP_122: DELETE PHASE 3 ALLOCATION PLAN ENTRY
UC_AP_122_TC_01: DELETE NAP ENTRY FOR PHASE 3
MEDIUM
DESIGNED PASSED IE,MOZIL
LA 12/12/20
12 PASSED
UCS.06
UC_AP_122_TC_02: DELETE NAP ENTRIES FOR PHASE 3
LOW DESIGNED PASSED PASSED
UCS.06
UC_AP_122_TC_03: DELETE PHASE 3 NAP ENTRY- MERGE RESULT TO AN EXISTING ACCOUNT
MEDIUM
DESIGNED PASSED IE,MOZIL
LA 12/12/20
12 PASSED
UCS.06
UC_AP_122_TC_04: DELETE PHASE 3 NAP ENTRY- MERGE RESULT TO A NON EXISTING ACCOUNT - DATA VALIDATION - NEGATIVE TESTING
LOW DESIGNED PASSED PASSED
UCS.06
UC_AP_122_TC_05: DELETE PHASE 3 NAAT ENTRY
MEDIUM
DESIGNED PASSED IE,MOZIL
LA 12/12/20
12 PASSED
DELETE BUTTON IS NOW AVAILABLE BUT THE AD BUTTON IS STILL MISSING
79

UCS.06
UC_AP_122_TC_06: DELETE PHASE 3 NAAT ENTRIES
LOW DESIGNED PASSED PASSED
UCS.06
UC_AP_122_TC_07: DELETE PHASE 3 NAAT ENTRY WITH ALLOCATED UNITS
MEDIUM
DESIGNED PASSED IE,MOZIL
LA 12/12/20
12 PASSED
add AND delete button not available in allocation plan screen FOR NAAT
UCS.06
UC_AP_122_TC_08: DELETE PHASE 3 NAAT ENTRY- MERGE RESULT TO AN EXISTING ACCOUNT OF THE SAME REGISTRY
MEDIUM
DESIGNED PASSED IE,MOZIL
LA 12/12/20
12 PASSED
UCS.06
UC_AP_122_TC_09: DELETE PHASE 3 NAAT ENTRY- MERGE RESULT TO A NON EXISTING ACCOUNT FROM THE SAME REGISTRY - DATA VALIDATION - NEGATIVE TESTING
LOW DESIGNED PASSED PASSED
UCS.06
UC_AP_122_TC_10: DELETE PHASE 3 NAAT ENTRY- MERGE RESULT TO AN EXISTING ACCOUNT FROM DIFFERENT REGISTRY
MEDIUM
DESIGNED PASSED IE,MOZIL
LA 12/12/20
12 PASSED
add AND delete button not available in allocation plan screen
UCS.06
UC_AP_122_TC_11: DELETE PHASE 3 NAAT ENTRY- MERGE RESULT TO A NON EXISTING ACCOUNT FROM DIFFERENT REGISTRY - DATA VALIDATION - NEGATIVE TESTING
LOW DESIGNED PASSED PASSED
80
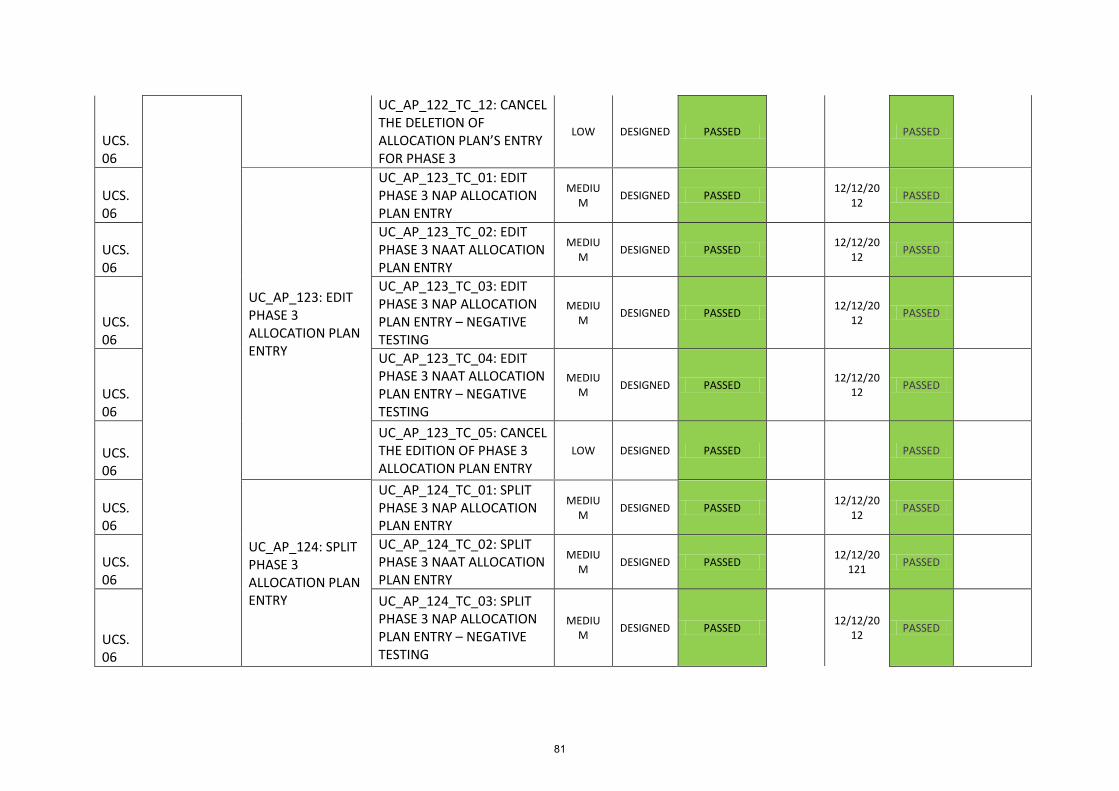
UCS.06
UC_AP_122_TC_12: CANCEL THE DELETION OF ALLOCATION PLAN’S ENTRY FOR PHASE 3
LOW DESIGNED PASSED PASSED
UCS.06
UC_AP_123: EDIT PHASE 3 ALLOCATION PLAN ENTRY
UC_AP_123_TC_01: EDIT PHASE 3 NAP ALLOCATION PLAN ENTRY
MEDIUM
DESIGNED PASSED 12/12/20
12 PASSED
UCS.06
UC_AP_123_TC_02: EDIT PHASE 3 NAAT ALLOCATION PLAN ENTRY
MEDIUM
DESIGNED PASSED 12/12/20
12 PASSED
UCS.06
UC_AP_123_TC_03: EDIT PHASE 3 NAP ALLOCATION PLAN ENTRY – NEGATIVE TESTING
MEDIUM
DESIGNED PASSED 12/12/20
12 PASSED
UCS.06
UC_AP_123_TC_04: EDIT PHASE 3 NAAT ALLOCATION PLAN ENTRY – NEGATIVE TESTING
MEDIUM
DESIGNED PASSED 12/12/20
12 PASSED
UCS.06
UC_AP_123_TC_05: CANCEL THE EDITION OF PHASE 3 ALLOCATION PLAN ENTRY
LOW DESIGNED PASSED PASSED
UCS.06
UC_AP_124: SPLIT PHASE 3 ALLOCATION PLAN ENTRY
UC_AP_124_TC_01: SPLIT PHASE 3 NAP ALLOCATION PLAN ENTRY
MEDIUM
DESIGNED PASSED 12/12/20
12 PASSED
UCS.06
UC_AP_124_TC_02: SPLIT PHASE 3 NAAT ALLOCATION PLAN ENTRY
MEDIUM
DESIGNED PASSED 12/12/20
121 PASSED
UCS.06
UC_AP_124_TC_03: SPLIT PHASE 3 NAP ALLOCATION PLAN ENTRY – NEGATIVE TESTING
MEDIUM
DESIGNED PASSED 12/12/20
12 PASSED
81

UCS.06
UC_AP_124_TC_04: SPLIT PHASE 3 NAAT ALLOCATION PLAN ENTRY – NEGATIVE TESTING
MEDIUM
DESIGNED PASSED 12/12/20
12 PASSED
UCS.06
UC_AP_124_TC_05: CANCEL THE SPLIT OF PHASE 3 ALLOCATION PLAN ENTRY
LOW DESIGNED PASSED PASSED
UCS.06
UC_AP_160: VIEW PHASE 3 HISTORY
UC_AP_160_TC_01: VIEW PHASE 3 NAP HISTORY
MEDIUM
DESIGNED PASSED 12/12/20
12 PASSED
UCS.06
UC_AP_160_TC_02: VIEW PHASE 3 NAAT HISTORY
MEDIUM
DESIGNED PASSED 12/12/20
12 PASSED
UCS.06
UC_AP_160_TC_03: VIEW REVISION DETAILS IN PHASE 3 HISTORY
MEDIUM
DESIGNED PASSED 12/12/20
12 PASSED
UCS.09
ISSUANCE UC_IS_001: VIEW AND MANAGE ISSUANCES
UC_IS_001_TC_04: VERIFY THE QUANTITIES IN THE ISSUANCE PAGE - CHAPTER III/ CHAPTER II ALLOWANCES
HIGH DESIGNED PASSED IE,MOZIL
LA 11/12/20
12 PASSED
UCS.09
UC_IS_001_TC_05: VERIFY THE QUANTITIES IN THE ISSUANCE PAGE - CHAPTER III ALLOWANCES - REPLENISHMENT HAS BEEN EXECUTED
HIGH DESIGNED PASSED IE,MOZIL
LA 11/12/20
12 PASSED
UCS.09
UC_IS_001_TC_06: VERIFY THE QUANTITIES IN THE ISSUANCE PAGE - AAU
HIGH DESIGNED PASSED IE,MOZIL
LA 11/12/20
12 PASSED
UCS.09
UC_IS_001_TC_08: ISSUE CHAPTER III/ CHAPTER II ALLOWANCES - KP REGISTRY
HIGH DESIGNED PASSED IE,MOZIL
LA 11/12/20
12 PASSED
82

UCS.09
UC_IS_001_TC_09: ISSUE CHAPTER III/ CHAPTER II ALLOWANCES - NON KP REGISTRY
MEDIUM
DESIGNED PASSED IE,MOZIL
LA 12/12/20
12 PASSED
UCS.09
UC_IS_001_TC_10: VERIFY SUCCESFUL COMPLETION OF ISSUANCE TRANSACTION - CHAPTER III/ CHAPTER II ALLOWANCES
HIGH DESIGNED PASSED IE,MOZIL
LA 11/12/20
12 PASSED
UCS.09
UC_IS_001_TC_04: VERIFY THE QUANTITIES IN THE ISSUANCE PAGE - CHAPTER III/ CHAPTER II ALLOWANCES
HIGH DESIGNED PASSED PASSED
UCS.09
UC_IS_001_TC_06: VERIFY THE QUANTITIES IN THE ISSUANCE PAGE - AAU
HIGH DESIGNED PASSED PASSED
UCS.09
UC_IS_001_TC_08: ISSUE CHAPTER III/ CHAPTER II ALLOWANCES - KP REGISTRY
HIGH DESIGNED PASSED PASSED
UCS.09
UC_IS_001_TC_15: ISSUE AAU
HIGH PASSED PASSED
UCS.09
UC_IS_001_TC_20: ISSUE RMU ACTIVITIES
HIGH PASSED PASSED
UCS.11 ALLOCATIONS
UC_AL_001: DISPLAY ALLOCATION MANAGEMENT PAGE
UC_AL_001_TC_01: DISPLAY THE ALLOCATION MANAGEMENT PAGE - CHAPTER III ALLOWANCES
LOW DESIGNED PASSED PASSED
UCS.11
UC_AL_001_TC_02: DISPLAY THE ALLOCATION MANAGEMENT PAGE -
LOW DESIGNED PASSED PASSED
83

CHAPTER II ALLOWANCES
UCS.11
UC_AL_001_TC_03: DISPLAY ALLOCATION PAGE –ALLOCATIONS INCREASED BY THE NAP FOR AN INSTALLATION – NEGATIVE TESTING
MEDIUM
DESIGNED PASSED 12/12/20
12 PASSED
UCS.11
UC_AL_001_TC_04: DISPLAY ALLOCATION PAGE –ALLOCATIONS INCREASED BY THE CAAT FOR AN AIRCRAFT OPERATOR – NEGATIVE TESTING
MEDIUM
DESIGNED PASSED 12/12/20
12 PASSED
UCS.11
UC_AL_001_TC_05: DISPLAY ALLOCATION PAGE –ALLOCATIONS DELETED BY THE NAP FOR AN INSTALLATION – NEGATIVE TESTING
MEDIUM
DESIGNED PASSED 12/12/20
12
The dropdown list of Naha is not available in the link allocation phase 3
UCS.11
UC_AL_001_TC_06: DISPLAY ALLOCATION PAGE –ALLOCATIONS DELETED BY THE CAAT FOR AN AIRCRAFT OPERATOR – NEGATIVE TESTING
MEDIUM
DESIGNED PASSED 12/12/20
12
NOT possible to test it as no naha is available to do the transaction
84

UCS.11
UC_AL_010: ALLOCATE ALLOWANCES
UC_AL_010_TC_01: ALLOCATE CHAPTER III ALLOWANCES
HIGH DESIGNED PASSED IE,MOZIL
LA 11/12/20
12
NOT possible to test it as no naha is available to do the transaction
UCS.11
UC_AL_010_TC_03: VERIFY SUCCESSFUL COMPLETION OF ALLOCATION - CHAPTER III ALLOWANCES
HIGH DESIGNED PASSED IE,MOZIL
LA 11/12/20
12
AS WE ARE NOT ABLE TO PERFORM THE ALLOCATION WE CANNOT CHECK ITS COMPLETION
UCS.11
UC_AL_010_TC_07: ALLOCATE CHAPTER II ALLOWANCES
HIGH DESIGNED PASSED IE,MOZIL
LA 11/12/20
12 PASSED
UCS.11
UC_AL_010_TC_09: VERIFY SUCCESSFUL COMPLETION OF ALLOCATION - CHAPTER II ALLOWANCES
HIGH DESIGNED PASSED IE,MOZIL
LA 11/12/20
12 PASSED
UCS.10
TRANSACTIONS
UC_TR_005: APPROVE TRANSACTION REQUEST
UC_TR_005_TC_01: APPROVE TRANSACTION REQUEST - SIGNATURE IS REQUIRED - REDIRECTION TO ECAS
HIGH DESIGNED PASSED IE,MOZIL
LA 10/12/20
12 PASSED
85

UCS.10
UC_TR_020: LAUNCH TRANSACTION PROCESS
UC_TR_020_TC_01: TRANSACTION SUBMISSION REQUIRES USER SIGNATURE - REDIRECTION TO ECAS
HIGH DESIGNED PASSED IE,MOZIL
LA 10/12/20
12 PASSED
UCS.10
UC_TR_020_TC_02: VERIFY TRANSACITON DELAY PROCESS
HIGH DESIGNED PASSED IE,MOZIL
LA 11/12/20
12 PASSED
we were able to launch this and cancel it
UCS.10
UC_TR_020_TC_04: VERIFY TRANSACITON DELAY PROCESS – TRANSACTION APPROVAL COMPLETED
HIGH DESIGNED PASSED IE,MOZIL
LA 11/12/20
12 PASSED
UCS.10
UC_TR_055: CANCEL DELAYED TRANSACTION
UC_TR_055_TC_01: CANCEL A TRANSACTION IN DEALYED STATUS
HIGH DESIGNED PASSED IE,MOZIL
LA 11/12/20
12 PASSED
UCS.10
UC_TR_030: SEARCH TRANSACTIONS
UC_TR_030_TC_01: DISPLAY THE LIST OF TRANSACTIONS
LOW DESIGNED PASSED PASSED
UCS.10
UC_TR_030_TC_02: DISPLAY THE LIST OF TRANSACTIONS - USER ROLE RESTRICTIONS
MEDIUM
DESIGNED PASSED IE,MOZIL
LA 12/12/20
12 PASSED
UCS.10
UC_TR_030_TC_03: DISPLAY THE LIST OF TRANSACTIONS - ACCOUNT TRANSFERRED
MEDIUM
DESIGNED PASSED IE,MOZIL
LA 12/12/20
12 PASSED
UCS.10
UC_TR_030_TC_04: DISPLAY THE LIST OF TRANSACTIONS - VIEW
LOW DESIGNED PASSED PASSED
86

ACCOUNT DETAILS
UCS.10
UC_TR_040: VIEW TRANSACTION DETAILS
UC_TR_040_TC_01: VIEW TRANSACTION DETAILS - SUMMARY PAGE
LOW DESIGNED PASSED PASSED
UCS.10
UC_TR_040_TC_01: VIEW TRANSACTION DETAILS - STATUS HISTORY PAGE
LOW DESIGNED PASSED PASSED
UCS.10
UC_TR_040_TC_01: VIEW TRANSACTION DETAILS - RESPONSE CODES PAGE
LOW DESIGNED PASSED PASSED
UCS.10
UC_TR_040_TC_01: VIEW TRANSACTION DETAILS - UNIT BLOCKS PAGE
LOW DESIGNED PASSED PASSED
UCS.07
SURRENDER
UC_SR_030_TC_25: SUCCESSFUL COMPLETION OF SURRENDER ALLOWANCES TRANSACTION FROM OHA
HIGH DESIGNED PASSED IE,MOZIL
LA 11/12/20
12 PASSED
UCS.07
UC_SR_030_TC_26: SUCCESSFUL COMPLETION OF SURRENDER ALLOWANCES TRANSACTION FROM OHA APPROVED BY AAR
HIGH DESIGNED PASSED IE,MOZIL
LA 11/12/20
12 PASSED
UCS.07
UC_SR_030_TC_27: SUCCESSFUL COMPLETION OF SURRENDER CHAPTER II & CHAPTER III ALLOWANCES TRANSACTION FROM AOHA
MEDIUM
DESIGNED PASSED IE,MOZIL
LA 12/12/20
12 PASSED
87
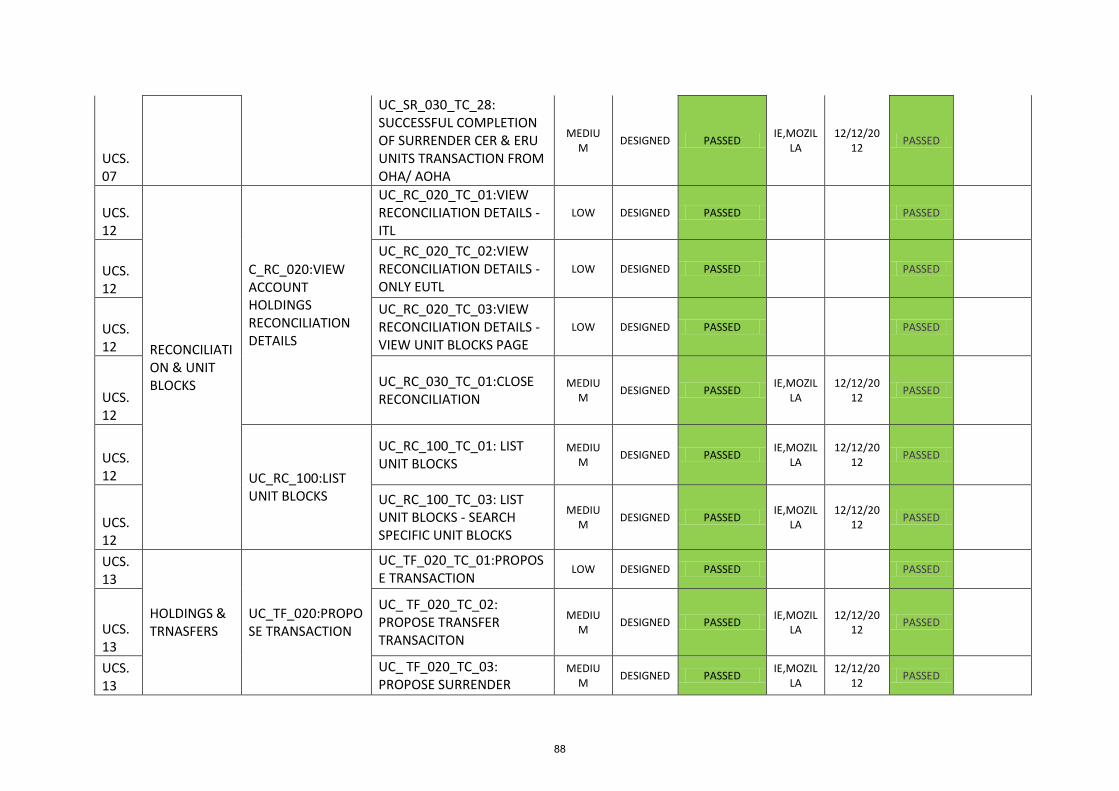
UCS.07
UC_SR_030_TC_28: SUCCESSFUL COMPLETION OF SURRENDER CER & ERU UNITS TRANSACTION FROM OHA/ AOHA
MEDIUM
DESIGNED PASSED IE,MOZIL
LA 12/12/20
12 PASSED
UCS.12
RECONCILIATION & UNIT BLOCKS
C_RC_020:VIEW ACCOUNT HOLDINGS RECONCILIATION DETAILS
UC_RC_020_TC_01:VIEW RECONCILIATION DETAILS - ITL
LOW DESIGNED PASSED PASSED
UCS.12
UC_RC_020_TC_02:VIEW RECONCILIATION DETAILS - ONLY EUTL
LOW DESIGNED PASSED PASSED
UCS.12
UC_RC_020_TC_03:VIEW RECONCILIATION DETAILS - VIEW UNIT BLOCKS PAGE
LOW DESIGNED PASSED PASSED
UCS.12
UC_RC_030_TC_01:CLOSE RECONCILIATION
MEDIUM
DESIGNED PASSED IE,MOZIL
LA 12/12/20
12 PASSED
UCS.12 UC_RC_100:LIST
UNIT BLOCKS
UC_RC_100_TC_01: LIST UNIT BLOCKS
MEDIUM
DESIGNED PASSED IE,MOZIL
LA 12/12/20
12 PASSED
UCS.12
UC_RC_100_TC_03: LIST UNIT BLOCKS - SEARCH SPECIFIC UNIT BLOCKS
MEDIUM
DESIGNED PASSED IE,MOZIL
LA 12/12/20
12 PASSED
UCS.13
HOLDINGS & TRNASFERS
UC_TF_020:PROPOSE TRANSACTION
UC_TF_020_TC_01:PROPOSE TRANSACTION
LOW DESIGNED PASSED PASSED
UCS.13
UC_ TF_020_TC_02: PROPOSE TRANSFER TRANSACITON
MEDIUM
DESIGNED PASSED IE,MOZIL
LA 12/12/20
12 PASSED
UCS.13
UC_ TF_020_TC_03: PROPOSE SURRENDER
MEDIUM
DESIGNED PASSED IE,MOZIL
LA 12/12/20
12 PASSED
88

TRANSACTION
UCS.13
UC_TF_020_TC_04:PROPOSE TRANSACTION - NON KP REGISTRY
MEDIUM
DESIGNED PASSED IE,MOZIL
LA 12/12/20
12 PASSED
UCS.13
UC_TF_020_TC_05:PROPOSE TRANSACTION - ACCOUNT STATUS NOT ELIGIBLE - NEGATIVE TESTING
MEDIUM
DESIGNED PASSED IE,MOZIL
LA 12/12/20
12 PASSED
UCS.13
UC_TF_020_TC_06:CANCEL THE PROPOSAL OF TRANSACTION
LOW DESIGNED PASSED PASSED
UCS.13
UC_TF_030:TRANSFER ALLOWANCES
UC_TF_030_TC_04: TRANSFER CHAPTER II & CHAPTER III FROM ONE HOLDING ACCOUNT TO ANOTHER HOLDING ACCOUNT-NO AAR
HIGH DESIGNED PASSED IE,MOZIL
LA 11/12/20
12 PASSED
UCS.13
UC_TF_030_TC_12: SUCCESSFUL COMPLETION OF TRANSFER ALLOWANCES TRANSACTION (EUTL/ITL)
HIGH DESIGNED PASSED IE,MOZIL
LA 11/12/20
12 PASSED
UCS.13
UC_TF_030_TC_13: SUCCESSFUL COMPLETION OF TRANSFER ALLOWANCES TRANSACTION TO ANOTHER REGISTRY (EUTL/ITL)
HIGH DESIGNED PASSED IE,MOZIL
LA 11/12/20
12 PASSED
UCS.13
UC_TF_040:TRANSFER KYOTO UNITS
UC_TF_040_TC_08: TRANSFER CER & ERU BETWEEN SAME ACCOUNT TYPES HOSTED BY THE SAME REGISTRY - INTERNAL
HIGH DESIGNED PASSED IE,MOZIL
LA 11/12/20
12 PASSED
89

TRANSACTION
UCS.13
UC_TF_040_TC_09: TRANSFER CER & ERU BETWEEN DIFFERENT ACCOUNT TYPES HOSTED BY THE SAME REGISTRY - INTERNAL TRANSACTION
MEDIUM
DESIGNED PASSED IE,MOZIL
LA 12/12/20
12 PASSED
UCS.13
UC_TF_040_TC_10: TRANSFER CER & ERU BETWEEN SAME ACCOUNT TYPES HOSTED BY DIFFERENT REGISTRIES - EXTERNAL TRANSACTION
MEDIUM
DESIGNED PASSED IE,MOZIL
LA 12/12/20
12 PASSED
UCS.13
UC_TF_040_TC_11: TRANSFER CER & ERU BETWEEN DIFFERENT ACCOUNT TYPES HOSTED BY THE DIFFERENT REGISTRIES - EXTERNAL TRANSACTION
MEDIUM
DESIGNED PASSED IE,MOZIL
LA 12/12/20
12 PASSED
UCS.13
UC_TF_040_TC_12: TRANSFER CER & ERU FROM CR REGISTRY TO NON-CR REGISTRY
MEDIUM
DESIGNED PASSED IE,MOZIL
LA 12/12/20
12 PASSED
UCS.13
UC_TF_040_TC_15: SUCCESSFUL COMPLETION OF INTERNAL TRANSFER KYOTO UNITS
LOW DESIGNED PASSED PASSED
90

TRANSACTION (EUTL)
UCS.13
UC_TF_040_TC_16: SUCCESSFUL COMPLETION OF EXTERNAL TRANSFER OF KYOTO UNITS TRANSACTION IN THE SAME REGISTRY (ITL)
HIGH DESIGNED PASSED IE,MOZIL
LA 11/12/20
12 PASSED
UCS.13
UC_TF_040_TC_17: SUCCESSFUL COMPLETION OF EXTERNAL TRANSFER OF KYOTO UNITS TRANSACTION BETWEEN DIFFERENT REGISTRIES (ITL)
HIGH DESIGNED PASSED IE,MOZIL
LA 11/12/20
12 PASSED
UCS.13
UC_TF_040_TC_18: SUCCESSFUL COMPLETION OF EXTERNAL TRANSFER OF KYOTO UNITS TRANSACTION BETWEEN CR REGISTRY AND NON CR REGISTRTY (ITL)
HIGH DESIGNED PASSED ie,mozill
a 12/12/20
13 PASSED
UCS.15
JI PROJECTS AND
CONVERSIONS
UC_CV_040: CONVERT UNITS
TO ERUS
UC_CV_030_TC_01:SUBMIT TRANSACTION TO CONVERT AAU TO ERU
HIGH PASSED PASSED
UCS.15
UC_CV_030_TC_02:SUBMIT TRANSACTION TO CONVERT RMU TO ERU
HIGH PASSED PASSED
91

UCS.15
UC_CV_030_TC_03:SUBMIT TRANSACTION CONVERSION FOR PROJECT WITH TRACK_2 (AUTHORISED QUANTITY)
HIGH PASSED PASSED
UCS.15
UC_CV_030_TC_04:NATIONAL ADMINISTRATOR REJECTS THE CONVERSION TRANSACTION
HIGH PASSED PASSED
UCS.19
TRUSTED ACCOUNT LIST
UC_TA_020: ADD ACCCOUNT TO TRUSTED ACCOUNT LIST
UC_TA_020_TC_01: ADD ACCOUNT TO TRUSTED LIST
HIGH DESIGNED PASSED IE,MOZIL
LA 10/12/20
12 PASSED
TOTAL 163 159
TOTAL
PERCENTAGE
PASSED
159 98%
TOTAL 163 100%
92

ANNEX III to Chapter 3
93

CHAPTER 4: POLICIES AND MEASURES 4.1 Introduction 4.2 Policy making process 4.3 Policies and measures at the National level 4.4 Cross sectoral policies and measures
4.4.1 EU Emissions Trading Scheme 4.4.2 Effort Sharing Decision 4.4.3 Flexible mechanisms of the Kyoto Protocol 4.4.4 Carbon Tax 4.4.5 Accelerated Capital Allowances
4.5 Built Environment 4.5.1 New buildings 4.5.2 Existing buildings
4.6 Transport 4.6.1 Encouraging lower emissions cars in the national fleet 4.6.2 Biofuels obligation scheme 4.6.3 Modal shift measures 4.6.4 Energy Efficiency Measures 4.6.5 Spatial Policy
4.7 Industry Sector 4.8 Renewable Energy – Electricity Generation & Heat 4.9 Agriculture
4.9.1 European Common Agricultural Policy 4.9.2 Methane and Nitrous Oxide Emissions 4.9.3 Animal Husbandry 4.9.4 Research 4.9.5 Manure Management and Agricultural Soils
4.10 Waste 4.11 Forestry 4.12 Policies and Measures No Longer In Place
4.12.1 Time limited schemes 4.12.2 Superseded Policies and Measures 4.12.3 Other Policies and Measures no longer in place
94

4.1 Introduction The policy making process in the area of mitigation is evolving as the danger posed by climate change becomes more apparent and widely accepted, and the need for urgent action is ever more exposed. What was once considered unorthodox or unwelcome is becoming the norm across many developed and developing countries. The following sections outline the evolution taking place in Ireland in this regard which will ultimately lead to much more ambitious actions taking place, along with an overview of those policies and measures, both within and across sectors, already in place. 4.2 Policy Making Process The Cancun Agreements calling on developed country parties to “develop low carbon development strategies or plans” and the subsequent passing into law of a Mechanism for Monitoring and Reporting Regulation in the European Union form the international backdrop to a shift of emphasis in mitigation policy. The current Programme for Government44 envisaged the passing of climate legislation during this term which would “provide certainty surrounding Government policy and provide a clear pathway for emissions reductions, in line with negotiated EU2020 targets”. The initial steps in this process included the publication of a Review of National Climate Policy45 in late 2011, followed by an extensive consultation exercise which was carried out by electronic questionnaire and received in excess of 600 responses from a range of interested bodies and individuals. (Full results of the survey along with breakdowns by affiliation are available on the Department’s website46) The publication in early 2013 of a study by the Secretariat of NESC entitled “Ireland and the Climate Change Challenge – Connecting How much with How to47”, was an important landmark in this process. The NESC Secretariat were asked to look at the longer term agenda, focussing on the development of a basis for a socio-economic vision to underpin effective national transition to a low-carbon future by 2050, and their report sets out a number of strategic building blocks which could help achieve this vision alongside substantive consideration of institutional and guiding principles which should form the backbone of a new approach. Ireland is currently developing its first National Low Carbon Roadmap which will map out the scale of the challenge for Ireland in a transition to a low carbon economy. The legal basis to design, develop and ultimately update such a National Low Carbon Roadmap will be derived from the enactment of the Climate Action and Low Carbon Development Bill48. The Joint Oireachtas Committee on the Environment, Culture and the Gaeltacht49 recently considered the draft legislation and submitted a report on its findings to the Minister for the Environment, Community and Local Government50. In response, final heads of the Bill will be issued/published by Easter 2014. Amongst the actions potentially foreseen by this legislation is the creation of a national expert advisory body on climate change to advise Government on the transition process, and to place responsibilities on various Ministers to participate in the Roadmapping process by contributing draft Sectoral Plans and reporting against progress in due course. As the legislation has not yet been enacted it would be premature to speculate about its precise implications.
44
http://www.taoiseach.gov.ie/eng/Work_Of_The_Department/Programme_for_Government/Programme_for_Government_2011-2016.pdf 45
http://www.environ.ie/en/Publications/Environment/ClimateChange/FileDownLoad,28328,en.pdf 46
http://www.environ.ie/en/Environment/Atmosphere/ClimateChange/NationalClimatePolicy/ 47
http://www.environ.ie/en/Environment/Atmosphere/ClimateChange/PublicationsDocuments/FileDownLoad,32467,en.pdf 48
http://www.environ.ie/en/Environment/Atmosphere/ClimateChange/PublicationsDocuments/FileDownLoad,32468,en.pdf 49
Gaeltacht areas are those that are officially designated as Irish speaking 50
http://www.oireachtas.ie/parliament/media/committees/environmenttransportcultureandthegaeltacht/Report-on-the-Outline-Heads-of-the-Climate-Action-and-Low-Carbon-Development-Bill-2013.pdf
95
At a more granular level, once a policy or measure has been identified as being possibly of benefit it should be subject to oversight from within the Government system to ensure that it is well designed and can meet its primary objectives cost effectively. Any policy with Exchequer expenditure implications over €20m (whether capital or current), or any “innovative” policy with exchequer implications over €5m should be subject to cost benefit analysis or cost effectiveness analysis which is assessed by the Central Expenditure Evaluation Unit of the Department of Public Expenditure and Reform. This assessment relates to the robustness of the analysis underpinning the policy as distinct from the merits of the policy measure itself. Taxation measures are considered by a Tax Strategy Group in advance of each annual budget. Any proposal requiring legislation should be subject to Regulatory Impact Analysis which is submitted in tandem with explanatory memoranda when the proposals are being considered by Government. Any of those which require primary legislation would then be subject to scrutiny by the Houses of the Oireachtas before being enacted. As Ireland is a full and active member of the European Union, some policies and measures emanate from legislative proposals which originate from the European Commission, and then need agreement of the European Parliament and the Council. At the highest level this includes legislation such as the Effort Sharing Decision which was designed in such a way as to ensure compliance with any new commitment period of the Kyoto Protocol. The European Union is also heavily involved in more sectoral issues also such as designing emissions standards for motor vehicles or setting targets for the removal of f-gases. In all cases, the Government has a major role to play in determining the shape of finally agreed proposals and in the case of Directives (such as Emissions Trading Directive) national transposition is required. All such proposals are subject to Impact Assessments which should be published in tandem with the proposals. Under Article 29.551 of the Constitution it is required that internationally agreed treaties such as the amendment to the Kyoto Protocol are debated and approved in the Oireachtas before ratification. 4.3 Policies and Measures at the National Level Given the small population, and limited role of regional or local government in determining energy or environmental policy per se, almost all policy is determined on a national basis. The most important drivers of policies and measures are legal requirements resulting from initiatives at European level, although Ireland has taken initiative in various areas, particularly in the area of taxation of fossil fuels and motor vehicles. DCENR plays a vital role in the areas of energy efficiency and renewable energy. Energy policy in Ireland is guided by the Government White Paper on energy published in 2007. That document, which will be replaced by a new green paper in 2014, sets out a series of guiding principles, policies and actions to be implemented in the energy sector by 2020. Since the publication of the White Paper energy policy has been further enhanced by a series of policy documents published by DCENR targeting energy efficiency and renewable energy in particular. The International Energy Agency (IEA) 2012 Review of Ireland’s energy policy framework has also informed developments in the area. In the renewable energy sector, Ireland is required to achieve a target of 16% of gross final energy consumption from renewable sources by 2020 under EU Directive 2009/28/EC. That Directive was given force in Irish law by Statutory Instruments 147 & 148 of 2011. To contribute to the national target, Ireland has an ambition to achieve 40% renewable electricity penetration by 2020 with further targets of 12% renewable consumption in the heat sector and 10% renewable consumption in the transport sector. The IEA in its recent review of Irish energy policy labelled the renewable electricity target as one of the most ambitious targets in the world. Energy efficiency policy is largely driven through the Energy Efficiency Directive (2012/27/EU) and its precursor, the Energy Services Directive (2006/32/EC). Ireland has set a challenging target of
51
http://www.constitution.org/cons/ireland/constitution_ireland-en.htm
96

delivering 20% energy efficiency savings by 2020, with a 33% target for the public sector. This is estimated to reduce our CO2 emissions by approximately 5.7 million tonnes, saving an estimated €1.6 billion per annum in avoided energy costs. The National Energy Efficiency Action Plan52 sets out the actions that will be taken to achieve this goal. Later sections of this chapter outline the actions in these two critical areas of mitigation in greater detail. Whilst Chapter 5 captures all of the impact of these policies and measures as estimated during the emissions projections process including indirect reductions from energy efficiency policy, this chapter focuses more on a description of the key policies and measures as identified by each sector. As such the measures described in this chapter are not a perfect match with those in the table accompanying this chapter, which is consistent with the data supplied in chapter 5.
4.4 Cross Sectoral Policies and Measures The main policies and measures that operate across sectors relate to market based mechanisms and the carbon tax. 4.4.1 EU Emissions Trading Scheme The EU ETS was established in 2003 by Directive 2003/87/EC and is the largest emissions trading system in the world. In the Irish context the system covers over 100 large point source installations, responsible for approximately 28% of carbon dioxide emissions. It is the main policy tool in respect of emissions from Power Generation and Industry. The EU ETS is central to the EU fight against climate change in that it delivers abatement where it is most cost effective. The scheme has been in operation since 2005 and its implementing rules have evolved over that time. The second phase of the EU ETS ran in tandem with the first commitment period of the Kyoto Protocol. Irish emissions of carbon dioxide from power generation and industry intensive sectors such as cement were regulated by the scheme during that period. Approximately 72% of Irish EU ETS emissions in Phase II related to power generation, a further 13% to cement and other building material manufacture, and the remainder across a variety of sectors. Since 2012 the aviation sector is also reporting its emissions to the scheme. The National Allocation Plan53 agreed with the European Commission in 2008 sets out the basis for the allocation of European Union Allowances (EUAs) to the scheme’s participants. In Phase II the default case for allocation was free allocation based on grandfathered emissions. The plan envisaged the allocation of in excess of 111 Mt CO2e of allowances and split the scheme into three installation types. These were Power Generation, Cement and General. 91% of allowances were allocated to these sectors whilst 9.2% were reserved to cover the costs of the implementing body (0.5%), for new CHP Plants (0.7%) and for other new entrants (8.0%). In the event some 6.55 Mt CO2e of these allowances were not allocated and the associated AAUs have returned to the national account. Regarding those EUAs which were allocated, most of these units have been surrendered by installations in line with their verified emissions. As is the case across the EU and as a result of the economic downturn allocations have exceeded verified emissions for many installations. On average verified emissions represented 84% of allocations for Phase II. Installations are also entitled to surrender CERs and ERUs for compliance but not without limit. CERs and ERUs representing 7.5% of total verified emissions were surrendered during Phase II.
52
http://www.dcenr.gov.ie/NR/rdonlyres/FC3D76AF-7FF1-483F-81CD-52DCB0C73097/0/NEEAP_full_launch_report.pdf 53
http://www.epa.ie/pubs/reports/air/etu/irelandsnationalallocationplanforemissiontrading2008-2012-4march2008.html
97

Phase III of the EU ETS which began in January 2013 will mark a major change in the management of the scheme, and the main changes are set out in the Revised Directive 2009/29/EC. An important change is the move towards centralisation of allocation decision making and the creation of a single overall cap which should result in a 21% reduction in emissions by 2020 relative to 2005. During this phase the degree to which EUAs will be allocated for free is substantially reduced. In Ireland and most EU Member States Power Generation installations will be expected to source their EUAs through auctions and the open market. This also applies to installations in industry sectors not deemed to be subject to carbon leakage. Auctions of EUAs take place regularly and the Revised Directive sets out the manner by which the rules for these auctions including how revenues of such auctions are shared amongst Member States. Further important changes include the inclusion of the Aviation Sector since 2012, and much tighter restrictions on the use of international credits for compliance both in quantitative and qualitative terms. The economic crisis has resulted in a large surplus of allowances in the market place and a package of back-loading of auctioned allowances will soon be implemented. To reinforce the impacts of this move the European Commission made proposals for an associated structural reform package early in 2014, although this initiative may take some time to bring to fruition. Notwithstanding these issues it is clear that the EU ETS continues to play a central role in reducing emissions in Europe by way of the pricing of emissions and it will remain pivotal in that regard for the foreseeable future. 4.4.2 Effort Sharing Decision Emissions not controlled by the ETS are legislated for under the Effort Sharing Decision (ESD) 406/2009/EC54. Emissions dealt with under this legislation, sometimes collectively referred to as the non-traded sector, include Agriculture, Transport, Waste, low carbon intensity industry and the built environment. Collectively these emissions should fall by 10% from 2005 to 2020 for the EU in aggregate. The EU Climate Energy Package agreed at the end of 2008, sets out each Member State’s share of that effort. In the non-traded sector, Ireland’s emission reduction for 2020 will be 20% on 2005 emission levels. An emissions target is also set for each year between 2013 and 2019. In 2013 emissions should be no higher than the average of emissions controlled by the ESD in the years 2008 to 2010. Annual targets between 2013 and 2020 are set on a linear pathway between the two targets. Whilst there are targets for each individual year there is some inter-temporal flexibility allowed for in the ESD, at least up 2020. There is no limit on banking between years (ie., carrying forward) but only limited borrowing from future periods is allowed. In terms of the use of the flexible mechanisms of the Kyoto Protocol, Member States are allowed to use CERs and ERUs up to a maximum of 3% of their 2005 emissions on an annual basis for compliance purposes. Twelve Member States of the EU including Ireland are allowed to extend this limit to 4% per annum so long as one quarter of the credits are sourced from LDCs. Member States will also be able to trade the emissions rights assigned under the Decision with each other and also the right to buy flexible mechanisms for compliance purposes. 4.4.3 Flexible Mechanisms of the Kyoto Protocol At the time of the publication of the National Climate Change Strategy in 2007 it was anticipated that Ireland would struggle to meet its target for the first commitment period of the Kyoto Protocol in the absence of use of its flexible mechanisms. As a result the then Government legislated to assign various responsibilities and activities through the Carbon Fund Act 2007. This legislation designated the National Treasury Management Agency as the Government’s purchasing agent and €280m was
54
http://eur-lex.europa.eu/LexUriServ/LexUriServ.do?uri=OJ:L:2009:140:0136:0148:EN:PDF
98

set aside in the National Development Plan of the same year in order to fund the purchase of required units. Ireland also became involved in three investment funds created by the World Bank and European Bank for Reconstruction and Development which directly generate Kyoto Protocol units such as tCERs and ERUs through projects around the world (See section 7.6 for more details). Over the course of the economic crisis which followed it became increasingly clear that the requirement would be much smaller. The EPA published provisional inventory data for the years 1990-2012 in October 2013 which gives the first indications of the actual requirement for use of the units purchased through the open market and through investment in dedicated funds. At this point it seems likely that compliance with the terms of the first commitment period of the Kyoto Protocol can be reached without substantial recourse to these units. Until the end of 2011 a Government Offsetting scheme was in place to offset the emissions implications of travel by Government Ministers and Officials. At the time that aviation emissions became subject to the Emissions Trading Scheme this scheme was terminated. During the period 2011-2013 a total of 62,362 units were purchased and cancelled in this regard. (See section 7.6 for further details) 4.4.4 Carbon Tax A carbon tax of €15 per tonne was introduced in December 2009, initially solely on liquid based fuels for transport. The following May the tax was extended to liquid fuels for space and water heating in buildings. The rate at which the tax is set was increased to €20 per tonne in December 2011 for transport fuels and May 2012 in regards liquid fuels for space and water heating. In order to minimise cross border trading with Northern Ireland, where different standards apply in regards solid fuels, the tax was only introduced on coal and peat at a lower rate of €10 per tonne from May of 2013. It is anticipated that the full tax will apply to all fuels by May 201455. As ETS installations already face a carbon price for their emissions, these installations were excluded from the impact of the new tax. Diesel use in the Agriculture sector is effectively exempt from any increases in the tax beyond €15 per tonne by way of tax reliefs available to farmers. Given the relatively limited time period since the introduction of the carbon tax, the proliferation of other sectoral policies and measures in the same sectors, and the fact that its introduction has been sequential rather than immediate it is difficult at this stage to specifically quantify its impact. Ex ante analysis by the Economic and Social Research Institute found that the impact of the tax on emissions and other key variables would be strongly subject to the use of the revenues generated. A €20 per tonne tax would likely result in drops in emissions of the order of 1.5% and could have a positive impact on aggregate demand if the revenues were used to reduce employment taxes. In the event, the introduction coincided with the onset of a series of austerity budgets and no specific hypothecation of the revenues occurred. Nonetheless revenues reached €344m in 2012, representing about 1% of the total tax take, despite the fact that the tax was not fully implemented at that time. 4.4.5 Accelerated Capital Allowances The Accelerated Capital Allowance (ACA) scheme introduced in the Finance Act 2008 provides for a system of accelerated capital allowances for the purchase of energy efficient capital assets. This scheme enables businesses to write off the entire cost of a specified set of energy efficient products in the first year of purchase. Normally depreciation or wear and tear of assets can only be written off against profits gradually over eight years. The Minister for Communications Energy and Natural
55
http://budget.gov.ie/Budgets/2013/Documents/Summary%20of%202013%20Budget%20Measures%20Policy%20Changes.pdf
99

Resources, with the consent of the Minister for Finance designates equipment as allowable under this scheme. Initially this scheme was intended to run until 2011 but it was recently extended to run until 31st December 2014. The coverage of asset type extends across motor vehicles (including EVs), hotel and catering equipment, refrigeration and cooling systems, ICT and other sectors. The full list of allowable investments is maintained on the website of the Sustainable Energy Authority of Ireland56. The mitigation impact of this scheme is thought to be quite small, of the order of 8kt CO2e by 2020. The TripleE register, a database of products eligible for the Accelerated Capital Allowance (ACA) tax incentive, aims to increase awareness and improve access to energy-efficient equipment, leading to increased market penetration. Combined with increased interest from the private sector, a particular driver for this activity is the European Union Energy Efficient Public Procurement Regulations 201157 which requires public bodies to only procure equipment or vehicles that are listed on the register. The number of products registered rose to over 9,000 from over 200 suppliers across 52 technology categories, by the end of 2012.
4.5 Built Environment 4.5.1 New Buildings More Energy Efficient Buildings Regulations Part L (Conservation and Fuel Energy) of the Building Regulations sets statutory minimum energy performance requirements for new buildings. In the case of dwellings, an ambitious programme for upgrading the regulations is advanced with the standards that pertained in 2005 being used as a benchmark for further improvements. The regulations were thus upgraded in 2007 to achieve a 40% improvement in energy efficiency and a 40% reduction in associated carbon emissions relative to 2005 standards. These standards were further upgraded in 2011 to achieve a 60% improvement in energy efficiency and a 60% reduction in associated carbon emissions relative to 2005 standards. The upgraded standards relating to a 60% improvement became fully operational (on the expiry of transitional planning related exemptions) from 1 December 2013 and include provisions for:-
- specified values for calculated Primary Energy and Carbon Dioxide Performance Coefficients to be met for each dwelling to achieve a 60% improvement relative to the 2005 benchmark;
- the mandatory use of Renewable Energy Sources - a minimum of 10 kilowatt hours per square metre per annum
This upgrade in performance standards is a significant milestone in the roadmap towards Nearly Zero Energy Buildings and sets the performance of a typical dwelling at approximately 60kWh/m2/yr. The ultimate aim is to achieve a Nearly Zero Energy Building (NZEB) Framework for Dwellings by 2015. A comparable programme of change for buildings other than dwellings is currently being developed. A minimum of 40% improvement in performance standards is scheduled for 2014 with a view to
56
http://www.seai.ie/Your_Business/Accelerated_Capital_Allowance/ACA_Categories_and_Criteria/ 57
EU (Energy Efficient Public Procurement) Regulations 2011, S.I. No. 151 of 2011
100

achieving a Nearly Zero Energy Building framework for such buildings by 2018 which can be adopted by the Public Sector. The Recast Energy Performance of Buildings Directive study to identify suitable cost optimal performance levels58 for various categories of buildings (e.g. public buildings, hotels, offices, retail outlets, etc.) and to define Nearly Zero Energy Building targets59 was completed in 2013. This cost optimal study is now being used to define performance standards for Buildings other than Dwellings and Nearly Zero Energy Buildings. A definition of Nearly Zero Energy Buildings has also been submitted to the European Commission as a requirement of the Recast EPBD. EU Recast Energy Performance of Buildings Directive (EPBD) The Building Energy Rating (BER) scheme was established under the European Communities (Energy Performance of Buildings) Regulations 2006. A BER is an indication of the energy performance of a house on a scale of A (most efficient) and G (least efficient). SEAI has been designated as the issuing authority with responsibility for registering BER assessors, logging BER assessments and managing the BER scheme. The BER was introduced for new dwellings in January 2007 and for all buildings from 1st Jan 2009. As the issuing authority, SEAI is responsible for registering assessors and providing the tools and systems which allow for publication of BERs. A total of 66,700 residential BERs were published in 2012, bringing the total number of homes with a BER to 334,270. One in six homes now has a BER, as do over 10,700 non-domestic buildings. The Recast EPBD has been fully transposed and implemented in Ireland in the form of the European Union (Energy Performance of Buildings Regulations) 201260 which requires:
- a valid BER to be obtained whenever a building is commissioned or is offered for sale or rent;
- the quoting of building energy ratings in advertisements for buildings offered for sale or letting;
- the setting of statutory minimum energy performance requirements for buildings and building elements to be informed by the cost optimal framework methodology to be developed by the EU Commission;
- the application of minimum energy performance requirements to existing buildings undergoing a major renovation;
- the development of plans for increasing the numbers of low or zero energy buildings with the public sector showing leadership by investing in such buildings;
- the display of energy performance certificates in all large buildings which are frequently visited by the public.
As at the end of November 2013 some 817 BER assessors for dwellings are registered with the SEAI and some 415,362 BER certificates for individual dwellings are in place. For buildings other than dwellings the corresponding numbers are 180 assessors and 18,000 BERs. Following the recasting of the Energy Performance of Buildings Directive, SEAI published guidelines for the mandatory inclusion of a BER in all property advertisements from January 2013.
58
http://ec.europa.eu/energy/efficiency/buildings/implementation_en.htm 59
http://ec.europa.eu/energy/efficiency/buildings/doc/ms_nzeb_national_plans.zip 60
http://www.environ.ie/en/Legislation/DevelopmentandHousing/BuildingStandards/FileDownLoad,31049,en.pdf
101

Design of Large Buildings The European Communities (Energy Performance of Buildings) Regulations 2006–2008 require that the economic and technical feasibility of alternative/renewable energy systems be assessed during the design of large buildings over 1,000 m2. This requirement has been operative since 1 January 2007. The recast EPBD now further requires that such feasibility studies will apply to all buildings (the size threshold of 1000m2 no longer applies). A renewable energy technology component has been mandatory for dwellings since 1 July 2009. For buildings other than dwellings, the general position regarding alternative/renewable energy systems will be considered as part of the upcoming review of Part L requirements for such buildings. Preliminary work in relation to this review has commenced in 2013 and will be completed in 2014. Design Guidelines for Social Housing In recent years significant efforts have been made to ensure that all new construction projects, including the delivery of social housing stock, are designed and built to high energy efficiency and sustainable development standards. To that end, Part L of the current Building Regulations requires that all new housing, including social housing:
- has 60% lower heat energy demand than previous buildings standards;
- requires the installation and replacement (where practicable) of oil and gas boilers with not less than 90% energy efficiency (condensing boilers);
- requires the mandatory use of renewable energy sources (a minimum of 10 kilowatt hours per square metre per annum).
The guidelines, Quality Housing for Sustainable Communities61 published in 2007, outline the essential requirements for the design of good quality sustainable housing developments which should be energy efficient. 4.5.2 Existing Buildings Building Regulations and standards in relation to existing buildings Minimum energy performance requirements for works to an existing building which involve an extension, a change of use or material alterations (i.e. major refurbishments that have implications for structure or fire safety) are specified under Part L of the Building Regulations. Future reviews of Part L will involve the identification of cost-optimal minimum energy performance requirements for buildings and building elements subject to major renovations as required in accordance with the recast EPBD. In addition to Building Regulations DECLG, DCENR, SEAI and NSAI are to publish a National Retrofit Code of Practice early in 2014. This will inform and assure quality standards in the retrofit of buildings. Better Energy Homes The Better Energy Homes scheme provides grants to homeowners to upgrade their homes with energy efficiency measures, thus reducing energy use, costs and greenhouse gas emissions. Better Energy Homes supported 26,400 home energy upgrades in 2012. Grants of €29m were paid out, matched with just over €70m of private funding. This scheme and its predecessor, the Home Energy
61
http://www.environ.ie/en/Publications/DevelopmentandHousing/Housing/FileDownLoad,1979,en.pdf
102

Saving scheme, have so far resulted in €48.5m in annual energy savings. At the end of 2012 approximately 1,750 contractors are registered with the scheme, offering energy efficiency upgrades to homeowners. In 2012, SEAI undertook additional contractor training and skills improvement workshops and established a contractor technical help desk, emphasising the importance of quality service. Better Energy Warmer Homes The Better Energy Warmer Homes scheme (BEWH), administered by SEAI, funds energy efficiency improvements in the homes of the elderly and vulnerable, making the homes more comfortable, healthier and more cost effective to run. SEAI has established a programme in 2013 to support targeted geographic or area-based projects that are of high quality, competitively priced and deliver improvements in energy efficiency to energy poor households. The focus will be on funding a comprehensive suite of projects which deliver energy savings to vulnerable homeowners and communities, through projects which encourage a partnership approach and are thus cost effective. Better Energy Warmer Homes improved the energy efficiency and comfort conditions of more than 12,000 vulnerable homes in 2012. This resulted in €1.8m in annual energy savings and more than 6,000 tonnes of CO2 emissions reductions. To date nearly 94,000 homes have been upgraded free of charge by a combination of SEAI-appointed community-based organisations and private contractors. In 2012, the scheme supported 380 direct jobs and 190 indirect jobs. In 2012 SEAI undertook an area-based pilot scheme to support high-quality, geographically targeted projects completing energy efficiency retrofits in energy-poor households. The pilot funded 27 partnerships which delivered substantial cost and comfort improvements to 1,933 homes. The total value of grants disbursed was €4.1m, resulting in approximately 3,000 tonnes of CO2 emission reductions. Better Energy Workplaces The objective of Better Energy Workplaces in 2012 was to showcase innovative delivery models, including contractual and procurement mechanisms using the principles of energy performance contracting to inform longer-term approaches to activating retrofit investment. Better Energy Workplaces supported 103 projects in the public, commercial, industrial and community sectors in 2012, to the value of €11.3m. These energy projects, which used a further €38m in own funds, are set to achieve energy savings of over €12m in one year, yielding a one-year payback on the State’s investment, repeating the success of 2011. Public Sector Programme 32 Public sector organisations across the public sector, with an annual energy spend of €340m; have signed up to SEAI’s Public Sector Energy Partnership Programme which commits them to implement the highest level of energy management. Energy in Education, a new web portal, was launched in October 2012 following pilot testing earlier in the year. The resources available include an extensive range of support materials, guides, advice and best-practice videos for teachers, principals, boards of management, and designers/contractors. Over 150 schools completed the more intensive support activities on offer, including training combined with energy assessment specifically designed for schools. The average savings identified per school following the course and assessment are 21%, of which 7% is saved within the first three months. In late 2012, SEAI began preparing standard forms of contract, procurement guidance and tools/templates, in support of efforts by DCENR to develop a National Energy Services Framework. The objective of this framework is to create the processes and the contractual and financing arrangements to increase the scale, number and impacts of energy-saving projects in the public sector. National Regeneration Programme The National Regeneration Programme targets the country’s most disadvantaged communities; those defined by the most extreme social exclusion, unemployment and anti-social behaviour.
103

DECLG currently supports an ambitious programme of regeneration projects, including large scale projects in areas such Limerick, the former PPP projects in Dublin City, the wind-down of the Ballymun regeneration project and smaller scale projects at particular locations around the country, which seek to address the causes of disadvantage in these estates through a holistic programme of physical, social and economic regeneration with the involvement of a wide range of public, community, and private sector stakeholders. Substantial capital funding continues to be invested into the National Regeneration Programme. In 2012, over €100m was recouped to local authorities for regeneration purposes while the 2013 provision in this regard is €80m. In 2014, €70m will be invested in the national regeneration programme. Among the priorities for the programme in 2014 are:
- New focus on construction and refurbishment in Limerick regeneration;
- Final phase of housing construction / refurbishment in Tralee and Ballymun;
- Refurbishment, demolition and construction at former Dublin PPP projects, notably Dolphin House and St. Teresa’s Gardens.
Local Authority Housing Improvement Programme As the social housing programme reorients itself to more flexible delivery mechanisms more in keeping with the life cycle approach of the Statement on National Housing Policy ‘Delivering Homes, Sustaining Communities’62, there is an increasing emphasis on ensuring that the existing stock of local authority owned dwellings is maintained and improved to the highest standard possible. In 2010 and 2011 the focus of the Improvement Works Programme was re-oriented towards casual and long term vacancies in order to bring vacant stock into productive use. A special measure with funding of up to €35,000 per unit was introduced for the specific purpose of refurbishing seriously deficient properties and making these available for re-letting. Funding was also provided for casual vacancies to improve the energy rating to a C1 BER with grants of up to €15,000 per unit depending on the energy improvements achieved. An additional grant of €3,000 was available towards the costs of works for re-letting repairs if these were required. DECLG is conscious of the importance – particularly in the context of a tightening fiscal position and rising demands being placed on social housing support programmes – of ensuring that the existing stock is deployed to the greatest effect possible. Since introducing the initial Energy Efficiency retrofitting Programme in 2009 funding of almost €100 million has been provided to local authorities for the retrofitting of older and substandard housing stock. Over that period, some 7,760 dwellings have been improved. Over the past two years DECLG provided around €52.5 million to refurbish the increasing numbers of vacant properties that became un-lettable due to their poor condition and were causing difficulties based around dereliction and anti-social behaviour. Over 4,770 houses and apartments were improved in these two years. While the programme for 2011 and 2012 focussed on large-scale works on vacant houses, the programme for 2013 had a greater focus on a straightforward suite of works to improve basic
62
http://www.environ.ie/en/Publications/DevelopmentandHousing/Housing/FileDownLoad,2091,en.pdf
104

insulation and draught-proofing of tenant occupied properties in order to improve comfort levels and address issues around fuel poverty. The original 2013 allocation for this energy efficiency retrofitting was €10 million. Following the announcement of the Energy Efficiency Stimulus Measure (see the relevant section) in mid-2013 a further €10m was provided for this programme. These programmes bring immediate as well as long term benefits for the community as a whole in terms of sustaining and creating jobs, and delivering a greener Ireland for the future. It resulted in warmer homes and lower energy bills for thousands of families and hundreds of jobs were established and/or sustained. These were distributed between construction workers, installers, BER assessors, retailers/manufacturers and administrators. It will also make a significant contribution to Irelands carbon emissions reduction targets and energy reduction targets for 2020. In addition to creating these “green” jobs it served to address the stress on the exchequer due to rising energy costs for social tenants who may be suffering from fuel poverty and on a National basis and helps preparations for two of the biggest challenges of this Century; security of energy supply and climate change with its challenging, legally binding, emissions reduction targets. Over 12,000 dwellings were retrofitted under these programmes in 2013. These Programmes were aided by the Local Authorities engaging in partnerships with “participating energy suppliers” under an SEAI incentive for “obligated parties” to collect KWhr credits. It resulted in local authorities gaining assistance and valuable experience in modern retrofitting methods, free pre-works inspections and post-works BERs for their upgraded stock. Additional benefits were gained by local authorities directing some of this capital under the fabric upgrade programme to part-fund deeper retrofitting measures under a co-funded SEAI Warmer Homes Area Based Programme. The 2014 allocation for retrofitting is €30 million, €25 million of which is for the Energy Efficiency Stimulus Measure. Funding in the region of €15 million will be available in 2014 to recommence the programme of retrofitting of insulation and other energy efficiency measures in vacant properties, both casual and planned, across the local authority housing stock. Energy Efficiency Stimulus Measure €50 million has been allocated for the Energy Efficiency Stimulus Measure for the period 2013-2015, with €10 million of this available in 2013, €25 million during 2014 and the remaining €15 million in 2015. It is hoped that most local authorities will complete Phase 1 of this programme (300mm insulation to attics, cavity wall insulation, draught-proofing and BER certification) in 2014 and progress to Phase 2 which will include replacing old single glazed windows and doors and external insulation to pre-1980 buildings of solid wall or cavity block construction which have very low energy ratings. The countrywide completion of Phase 2 will be an important milestone for local authorities. The fabric of every local authority dwelling will be insulated to a high standard and the concentration can be targeted to upgrading less efficient heating systems and controls based on information gained through the BER database.
105

Remedial Works Scheme The Remedial Works Scheme was introduced in 1985 to assist local authorities in undertaking major structural works to their defective and pre-1940 houses. Subsequently, the Scheme was extended to include the general improvement of run-down and disadvantaged estates, as well as inner city flat complexes. In 2013 funding (€18.9m) was allocated in respect of projects which are currently underway in 16 local authorities with a view to finalising as many of the projects as soon as possible. It is expected that with the finalisation of these legacy projects, allocations in 2014 will be based on the level and profile of local authority stock, an audit of which is currently underway. Future proposals for large scale refurbishment works or other estate wide works will fall to be funded from within the local authorities’ annual allocations for improving social housing stock. DECLG will continue to support some 16 remedial works projects in 11 local authorities which are primarily concentrated in the larger urban estates in Dublin, Meath and Kildare and also some smaller legacy projects around the country. In 2014 funding of €13.5 million will be available in order to meet commitments on projects which are currently underway with a view to finalising as many of the projects as soon as possible during that year. No new projects can be considered at this time.
4.6 Transport The key measures that have resulted in emissions reductions relative to the baseline are; (i) encouraging lower CO2 emission cars in the national fleet through rebalanced taxation rates (ii) the biofuels obligation scheme and (iii) the introduction of a carbon tax (see earlier text in this Chapter). A range of other measures aimed at promoting more sustainable transport and planning, but with savings that are not robustly quantifiable, are also noted. 4.6.1 Encouraging lower emissions cars in the national fleet Over the period 2000-2007, there was a trend of vehicle technology improvements being off-set by the purchase of larger cars. The result was that the energy efficiency of the national car fleet remained static over the period 2000-2007 despite technology improvements. The aim of rebalancing Vehicle Registration Tax and Motor Taxation rates which came into effect from 1 July 2008, combined with better visibility of voluntary emission labelling, was specifically to incentivise the purchase of lower CO2 emission cars. Prior to the change in taxation rates, the average new car purchased had vehicle emissions in the region of 164g/km. This had fluctuated around a level of 165-168g/km since the year 2000, up until the rebalancing took place in July 2008. For 2009, the first full year for which figures are available, the average emissions of a new car entering the national fleet reduced to around 145g/km. This has fallen each year since then, and for 2012 the average emissions of a new car entering the fleet was 126g/km. This means that the average new car entering the fleet is approximately 23% more energy efficient than the average new car entering the fleet before 2008. It is clear that the goal of incentivising the purchase of new cars within the lower emissions bands has been achieved. This is due to both the relative savings on the purchase price (due to lower Vehicle Registration Tax), and also the reduced annual cost of motor taxation (relative to a higher emissions car). Whilst this measure was originally implemented in 2008, its implementation offers annual savings as the lower emissions cars remain in the fleet, and as new cars enter the fleet each year. Recent changes to the bands and taxation levels continue to incentivise the purchase of lower CO2 emission cars and therefore future savings will accrue from this policy. From January 2013, a
106

revised banding structure was introduced for VRT and motor tax, splitting the lowest CO2 Bands A (1- 120g/km) into four and Band B (121 – 140g/km) into two. A zero emissions band for EVs was also introduced for motor tax only. The revised banding recognises that ever more fuel efficient cars are becoming available and allows for the further differentiation of the environmental incentive for what is an increasing proportion of the national car fleet. The changes ensure a strong environmental incentive remains in place for purchasers of new cars to buy the clean option, and for the motor trade to place the cleanest options on the market in Ireland. This package of policies is working to ensure that the EU driven technology improvements are impacting on the composition of the national car fleet much more quickly than it would for a taxation system which does not operate on the basis of CO2 emissions. The net effect is to speed up the lowering of CO2 emissions within the national fleet, compared to EU measures alone, and offer significant fuel savings over the lifetime of each vehicle. It is estimated that for 2012 annual GHG emissions savings of 190ktonnes have been achieved through this measure – with estimated cumulative savings of 360ktonnes for the period 2008-2012 compared to business as usual. In addition to this measure, a number of taxation incentives are in place with regard to alternative fuel vehicles. The grant scheme is administered by the Sustainable Energy Authority of Ireland, with input from the Revenue Commissioners. For example, grant aid of up to €5,000 is available when purchasing an EV. Additionally, EVs are currently eligible for vehicle registration tax relief up to a maximum of €5,000 and plug in hybrids are eligible for relief up to €2,500. By virtue of their lower emissions, these vehicles pay the lowest rate of motor tax. However, it should be noted that uptake of such vehicles remains slow. 4.6.2 Biofuels obligation scheme The biofuels obligation scheme commenced on 1 July 2010, and is administered by the National Oil Reserves Agency. The initial rate of the obligation was 4% by volume. This rate increased to 6% by volume from 1 January 2013. This obligation scheme will be a key component to achieving a 10% penetration of renewable energy in transport by 2020 – to which the Government has committed under the 2008 EU Climate and Energy Package. This type of regulatory mechanism is increasingly being adopted across the EU and generally supplants earlier and more direct means of supporting biofuels, such as excise tax relief schemes. The biofuel obligation scheme should allow for a gradual uptake of these new fuel supplies and adopts sustainability criteria set out in the EU Renewable Energy Directive. While other forms of renewable energy will play an important role in transport by 2020, it is expected that biofuels will retain a substantial role, and that successively higher obligations rates will be required to deliver that overarching 10% target. 4.6.3 Modal Shift measures A range of other supportive measures, particularly in relation to promoting modal shift, are in place with regard to reducing CO2 emissions in the transport sector in Ireland. Public transport investment: Investment in public transport took place in the period to 2008, including the provision of two tram lines (LUAS) in Dublin and investment in both intercity and urban rail, and improvement to the public bus offering. Since 2008, the public transport offering has also been improved through the development of integrated ticketing and real time passenger information. Currently a project is commencing to link the two LUAS lines which will further increase patronage on the system.
107
Specific tax relief schemes: The TaxSaver Commuter Ticket Scheme was initiated in 1999, and can be availed of by any employer or employee. Under the scheme, employers and employees may receive tax relief on the cost of annual or monthly bus, Luas or rail tickets. The incentive is a positive way to encourage more people to choose public transport for their journeys. A tax incentive for the purchase of bicycles for commuting (up to a maximum expenditure of €1000) was also introduced in 2009. This exempted from income tax the benefit in kind arising from the provision of a bicycle and/or bicycle safety equipment by an employer to an employee or director where the bicycle is used for commuting. Cycling Investment Ireland’s first National Cycle Policy framework (NCPF) was launched in April 2009, and significant investment in support of both cycling and walking has taken place since then. Over the period 2009-12, more than €15 million has been invested by the DTTAS to support infrastructure delivery for both walking and cycling. The National Transport Authority (NTA) also invests within the Greater Dublin Area (GDA), with a total of €13.4m allocated for sustainable transport projects within the GDA in 2012. This forms part of a multi annual budget that will deliver similar annual investment levels up to 2016. DTTAS will also be allocating €6.5 million to the development of cycle greenways over the period 2014 to 2016. In Dublin, the provision of the “Dublin Bikes” scheme has been a major success with over 5 million bike rentals since its launch in 2009. Dublin City Council has reported a 40% increase in numbers cycling in the city over the years 2009 to 2011. Dublin City Council and the NTA are currently finalising plans for the expansion of the scheme in Dublin, to increase the number of stations and number of bikes available for hire. A similar scheme is also being rolled out in the regional cities of Cork, Galway and Limerick. Recent Census data for 2011 shows that the number of people cycling to work in Ireland increased from 2006 to 2011 for the first time in 25 years. Mobility management: DTTAS continues to support mobility management programmes through the NTA. The NTA administers the Green Schools Travel Programme (run by An Taisce), which engages the country’s school children with regard to sustainable transport – and has been rolled out to over 220,000 pupils in the period 2008 to 2012. Their involvement in the various actions, which promote walking, cycling, carpooling and use of public transport in turn engages parents and the wider community, raising awareness of the environmental impacts of our transport choices. Based on results from the programme between 2008-2012, on average 13,060,855 fewer kilometres were driven every year resulting in an average of 966,500 litres of fuel and 1,941 tonnes CO2 saved per annum. Smarter Travel schemes have also been rolled out in workplaces for large employers and third level institutions. As of October 2013, 114 employers and third level institutions comprising over 282,690 employees and students were engaged. Interim results show an average 19% reduction in single occupant car use in 21 Partner organisations with mature mobility management plans. There have also been significant increases in cycling, with an average 135% increase in 26 Partner organisations. 4.6.4 Energy Efficiency Measures The National Car Test (NCT) The NCT is conducted every 2 years for vehicles less than 10 years old, and annually for vehicles 10 years and older. This regular testing of cars improves road safety and, through ensuring vehicles and engines are appropriately maintained reduces the fuel consumption and environmental impact of vehicles. Eco-driving has been promoted through the inclusion of an efficient driving module in the
108

national driving test, and through targeted projects within commercial fleets through Sustainable Energy Authority of Ireland projects. Improvements in the energy efficiency of bus and rail services Since 2009, a range of programmes aimed at improving energy efficiency have taken place in both Dublin Bus and Bus Éireann. Eco-driving initiatives and fleet replacements are yielding ongoing fuel savings as the new vehicles are approximately 10% more efficient than the vehicles being replaced and are compliant with the latest Euro engine standards. The greatest improvements are in relation to reduced maintenance (and hence improved reliability) and reduced emissions compared with the older vehicles being replaced. Alternative fuels are also being considered with Bus Eireann currently trialling Ireland’s first gas fuelled bus in Cork. Hybrid vehicles also have the potential to deliver fuel savings of up to 30% and Dublin Bus expect to trial a double deck Hybrid bus for a six month period in 2014. Rail services are also delivering fuel efficiencies by changing from locomotive hauled trains with 1 large diesel engine to Diesel Multiple Units with each carriage having its own 14 litre diesel engine. This allows for matching the size of the train to the passenger number and having the exact engine capacity for the train size. Iarnrod Eireann also plan to retrofit new fuel-efficient engines to locomotives, which will incorporate Automatic Engine Start Stop (AESS) systems. 4.6.5 Spatial Policy National Spatial Strategy The National Spatial Strategy, published in 2002 and covering the period 2002 - 2020, aims to achieve a better balance of social, economic and physical development across Ireland. The Strategy provides a framework for planning at national, regional and local level. Balanced regional development requires that the full potential of each region be developed on a sustainable economic, social and environmental basis to contribute to the overall performance of the State. Good spatial planning has the potential to deliver beneficial environmental impacts in areas such as transport and a general holistic approach to continued spatial development. The National Spatial Strategy will therefore contribute to preparing Ireland for more stringent CO2 emission reduction requirements in the future, in particular through reducing the dependence on private car-based transport arising from more sustainable spatial planning. As previously referred to, substantial progress is being made at national level in implementing the NSS, which is having an increasing influence on policies and programmes across a range of Government Departments and agencies. At regional level, a key policy bridge between national development priorities and local planning has been put in place with the adoption of Regional Planning Guidelines. These provide a strategic framework for local planning. The NSS, the RPGs and the implementation of the Core Strategy provisions of the 2010 Planning and Development (Amendment) Act 2010 are creating a more effective policy framework designed to support economic renewal and continue the promotion of sustainable national and regional development by ensuring that all levels of the planning system work together in supporting targeted investment on infrastructure under capital programmes and by further modernising land zoning. This will encourage co-ordinated and consolidated development close to necessary social and physical infrastructure. Development Plan Guidelines Guidelines for Planning Authorities on the preparation of County and City Development Plans63 were published in 2007. The Guidelines emphasise the importance within such plans of creating a clear strategic framework for the proper planning and sustainable development of the relevant area
63
http://www.environ.ie/en/Publications/DevelopmentandHousing/Planning/FileDownLoad,14468,en.pdf
109
consistent with the longer-term aims set out in the NSS, national policies and regional planning guidelines. Development plans have a lifetime of six years. In particular, the Planning and Development Act 200064 provides that a development plan may include objectives for promoting design in structures for the purposes of flexible and sustainable use, including conservation of energy and resources. The Planning and Development (Amendment) Act 2010 contains provisions for the inclusion of measures to reduce greenhouse gas emissions in development plans. In further support of the broader climate change agenda, development plans must now contain mandatory objectives for the promotion of sustainable settlement and transportation strategies in urban and rural areas, including appropriate measures to reduce greenhouse gas emissions. Regional Planning Guidelines Regional Planning Guidelines (RPGs) are a key implementation mechanism of the National Spatial Strategy and are now an established feature of the legislative and policy framework for forward planning in Ireland. The RPGs 2010 to 2022 set a strategic planning framework for development plans. The process of reviewing and updating regional planning guidelines will continue to work within the overall policy frameworks established by the NSS while working to maximise buy-in from the key government departments and state agencies. In particular, the RPGs, prepared and adopted by Regional Authorities, identify a range of measures - some of them collaborative between regions - aimed at activating the potential for sustainable economic development, harnessing green infrastructure such as sources of renewable energy, identifying opportunities for diversification of the rural economy and conservation of unique natural heritage attributes. Implementation of RPGs through the statutory planning functions of local authorities will make a substantial contribution to furthering regional development aims and implementing the NSS. Furthermore, the RPGs 2010-2022 promote the effective integration and co-ordination of development plans within an overall regional vision for development, supported by an enhanced and clear legislative requirement for consistency between plans at different levels, specifically, the Planning and Development (Amendment) Act 2010. The RPGs 2010-2022 are also supported by effective regional level implementation structures that work and report regularly, within an overall NSS reporting framework, on progress made within the region in achieving regionally balanced and sustainable development. Planning and Development (Amendment) Act 2010 A comprehensive review of planning legislation and national-regional-local co-ordination culminated in the Planning and Development (Amendment) Act 2010, which introduced a number of reforms to the development plan process to provide for greater consistency of plans at regional, city/county and local area levels, to require a core strategy to be incorporated into development plans and to reinforce the practice of developing evidence-based policy objectives into future development plans including zoning objectives. The role of Regional Authorities in ensuring alignment of plans at national, regional and local levels and the progress made in preparing and adopting Core Strategies, is a major achievement for planning in Ireland.
64
http://www.irishstatutebook.ie/2000/en/act/pub/0030/print.html
110

The central aim of the core strategies, now required for each development plan, is to align defined population and housing targets with an appropriate quantum of zoned land, having regard to other considerations such as appropriate densities, sequential development, existing and planned infrastructural provision and defined settlement hierarchies. Alignment of planning policy between the Region and County/City levels has resulted in a significant revision to the amount of land zoned, or potential number of housing units to be made available for future residential housing under the plan-led approach to development. This evidence-based core strategy will ensure that development plans contain relevant information to show that the development plan and the housing strategy are consistent with RPGs and the National Spatial Strategy 2002-2020. The core strategy will take account of any policy of the Minister in relation to national and regional population targets and shall strengthen further the development plan as the fundamental link with national, regional, county/city and local policies. Within the new requirement of the core strategy, the development plan of a city or a town council will have to provide details of the availability of public transport within the catchment of residential or commercial development in their area. Cork Area Strategic Plan The Cork Area Strategic Plan 2001-202065 (CASP) provides an excellent example of successful land-use planning, with appropriate use of rail, bus and cycle solutions. DTTAS, through the National Transport Authority, has committed substantial investment to the implementation of the CASP including past investment in rail infrastructure (€90m) to enable sustainable and compact urban development along a strategic corridor to the North and East of the City coupled with a 5 year rolling investment strategy in bus priority, walking and cycling facilities through the city. This investment is underpinning the implementation of a new city centre movement strategy. While the economic downturn has somewhat delayed the build-out of new development along new public transport corridors, it is anticipated that, as the Irish economy recovers, these strategic locations will be priority locations for new housing and employment related development as it arises. The City and County Councils in Cork remain strong supporters of CASP as evidenced by their participation, along with a range of economic, infrastructural, innovation and public sector stakeholders, in the CASP Steering Group that continually monitors implementation and adjusts course accordingly to take account of changing conditions.
65
http://www.corkcoco.ie/co/pdf/578674150.pdf
111

4.7 Industry Sector Energy in Business Programme The Energy in Business programme provides a number of services that promote structured energy management and supports the efforts of all business sectors to improve energy efficiency and competitiveness. The programme aids the development of the Irish market for energy-efficiency advice and services. SEAI, through the Energy Agreements Programme (EAP) and the Large Industry Energy Network (LIEN), supports larger industrial sites, with a combined energy spend of up to €1Bn, that are ready to commit to strong energy management. Competitiveness is high on the business community’s agenda and the SEAI’s focus continues to be on promoting energy efficiency and associated cost-reduction programmes throughout small and large business sectors. Over 200 SMEs participated in a wide range of activities, including energy assessments, small-business training, EnergyMap training and networking events. A total of 140 registrations to the Advice Mentoring and Assessments (AMA) programme in 2012 were recorded; projected savings are just over €2m. Annual savings of over 10% are being generated by the participating businesses year on year. Membership of the LIEN – major energy users committed to managing energy use in a strategic and systematic way – stands at 162, accounting for over 15% of Ireland’s primary energy requirement. Of these, 80 also participate in the Energy Agreements Programme, which supports their pursuit of an aggressive programme of energy management and investment, and ultimately implementation of the ISO 50001 energy management standard. Consistent annual savings across the network average 2–3%, accounting typically for a saving of up to €20m each year. Promotion of ecodesign for energy related products Promotion and implementation of the Ecodesign Directive is well underway since the transposition of the Directive in 2011. The aim of the Directive is to improve the environmental performance of energy-related products by setting minimum criteria which manufacturers must meet in order to place their product on the EU market. Implementing measures are adopted as Commission Regulations to set the specific requirements for each product category. In principle the Directive covers all energy-related products sold in the domestic, commercial and industrial EU markets. Currently implementing measures are in place covering 18 product groups and voluntary agreements are in place for an additional two categories. A further 7 measures are expected to be adopted in late 2013 / early 2014 under the current work plan. The Ecodesign Directive is complemented by the Energy Labelling Directive which aims to provide consumers with comparable information about the energy and environmental performance of products at the point of sale. The combination of these directives is considered an effective policy tool for improving the performance of energy-related products – ecodesign by progressively removing the least efficient products from the market and energy labelling by guiding consumers to the more efficient products thus encouraging manufacturers to develop improved products. DJEI coordinate the national position on ecodesign proposals which involves close consultation with industry, DCENR and other relevant stakeholders. DJEI represent Ireland on the EU Ecodesign Regulatory Committee which vote on proposed implementing measures. DCENR is the appointed Market Surveillance Authority and have responsibility for enforcement of the regulations.
112

Regulation of F-gases Regulation (EC) No 842/2006 on certain fluorinated greenhouse gases (or F-Gas Regulation) regulates the use of F-gases in EU Member States, contributing to the commitment the EU made under the Kyoto Protocol to reduce its greenhouse gas emissions by 8% between 2008 and 2012. The current F-Gas Regulation has two main aims-
- Avoiding F-Gases in some applications in which more environmentally superior alternatives were already cost-effective. Measures include use and marketing restrictions.
- Improving leak-tightness of equipment containing F-Gases. Measures comprise: labelling of equipment containing F-gases, training and certification of personnel and companies handling this type of gases, containment and proper recovery.
The new legislative proposal which will come into force on the 1st January 2015 is more ambitious and builds on the current legislation. It contains the following key elements:
- Extended containment provisions to include refrigerated units of trucks and trailers, switchgear with some derogations, organic rankine cycles. Furthermore the thresholds for leak checks will be expressed in CO2 equivalents to better reflect the environmental impact to be reduced.
- Service and maintenance ban using high GWP refrigerants but the use of recycled and reclaimed gases will be allowed until 2030
- Pre-charged equipment can only be placed on the market if it is accounted for in the quota system
- Placing on the market bans on HFCs of certain products and equipment
- Phase down of HFCs
The existing regulation was mainly based around containment provisions so the new proposal with its wider bans and phase down of HFCs represents a significant step forward. 4.8 Renewable Energy – Electricity Generation & Heat The target for Ireland in the European Renewable Energy Directive (2009/28/EC) is a 16% share of renewable energy in gross final consumption by 2020. Ireland anticipates that it will achieve this through 40% in electricity, 12% in heat and 10% in transport coming from renewable sources (see section on Transport for details). Figure 4.1 shows the contribution as per the Directive methodology from 1990 to 2011. The contribution from renewables in 1990 was 2.3%, rising to 7.1% in 2012. This comprised of 19.6% in electricity, 5.2% in heat and 3.8% in transport. Gross Final Consumption (GFC) in the Directive is different from Total Final Consumption (TFC) as conventionally defined in the energy balance. The Directive specifies gross final consumption of energy as the energy commodities delivered for energy purposes to manufacturing industry, transport, households, services, agriculture, forestry and fisheries, including the consumption of electricity and heat by the energy branch for electricity and heat production and including losses of electricity and heat in distribution. TFC is usually calculated as the total primary energy less the quantities of energy required to transform primary energy. Hydro and wind electricity generation are normalised as per the Directive in order to smooth out variations in climate.
113

Figure 4.1: Renewable Energy (%) Contribution to Gross Final Consumption (Directive 2009/28/EC)
In order to achieve the 16% target, Ireland has put in place a suite of supports for renewable energy. Renewable Electricity The primary support mechanisms for renewable electricity are the AER (Alternative Energy Requirement Programme) and REFIT (Renewable Energy Feed-in Tariff) schemes which were introduced to incentivise the development of renewable electricity generation capacity necessary to allow Ireland to meet its target of meeting 40% of electricity demand from renewable generation by 2020. The AER was a series of 6 competitive tender schemes to support new renewable generation that were run to the mid-2000s. AER was subsequently replaced by the feed-in tariff scheme known as REFIT. REFIT was designed to provide certainty to renewable electricity generators by providing them with a guaranteed price for each unit of electricity exported to the grid over a 15 year period. This certainty afforded by a guaranteed minimum price allows developers to access finance for renewable developments. The REFIT schemes are funded by the Public Service Obligation (PSO) which is paid for by all electricity consumers. The REFIT schemes have been designed to incentivise the development of renewable electricity generation in order to ensure Ireland meets our goal of 40% of electricity coming from renewable sources by 2020. The original REFIT scheme was open for applications until 31/12/09. Under the terms of the REFIT 1 scheme, plants were to be operational by end 2010. The technologies covered are small wind (< 5MW), large wind (>5MW), Hydroelectricity and Biomass/Landfill gas. Due to delays in grid roll-out for REFIT 1 projects, earlier this year the Minister announced that EU State Aid approval would be sought for the extension of the backstop date of REFIT 1 by two years to 2027. State Aid approval was later granted and the terms and conditions of the scheme have now been amended accordingly.
114

REFIT 2, which succeeds REFIT1, opened in March 2012 and provides for up to 4,000MW of renewable generation. The technologies covered are small wind (< 5MW), large wind (>5MW), Hydroelectricity and Biomass/Landfill gas. To date, wind energy has been the largest driver of growth in renewable electricity, contributing most towards the achievement of the 2020 target. REFIT3, which opened in February 2012, is the first REFIT scheme dedicated solely to biomass technologies. It aims to support the addition of 310MW of bioenergy from anaerobic digestion, biomass cogeneration (which will also contribute to renewable heat) and co-firing of biomass with peat. In 2012 19.6% of electricity was from renewable sources and as of the third quarter of 2013 there was 2,100MW of renewable electricity connected to the grid. It is estimated that 4,000MW will be needed in the context of achieving our renewables target. Accommodating this level of connections requires a strategic approach and in 2008 the energy regulator published a direction to electricity system operators which set out the list of projects to receive grid connection offers and enabling them to be connected in “batches”. Currently, approximately 3,000 MW of renewable generation has taken up connection offers and are awaiting connection. Bioenergy Although wind will be the largest source of our renewable electricity, bioenergy is expected to contribute one half of our renewable energy target, principally in the heat band transport sectors. The Biofuel Obligation Scheme (see Transport chapter) and REFIT 3 are the principal energy-from-biomass policies currently in place. A bioenergy strategy is currently being finalised with a view to optimising the contribution that biomass can play in achieving renewable energy objectives including the identification of additional policies focussed primarily in the heat sector. Ocean Energy Wave and tidal energy technology is still at the Research, Development and Demonstration stage globally. A number of reports all identify Ireland’s potential to become an international leader in research, development and innovation for ocean energy. In order to take forward the ocean energy strategy, an OEDU was established within the SEAI in 2009. A range of supports have been deployed since 2009 in support of wave and tidal development at each point in its value chain. The OEDU has been taking forward the development of the sector through administration of a Prototype Development Fund of grants for industry. This scheme is aimed at supporting industry-led development and deployment of ocean energy devices and systems. One of the priorities to be pursued by SEAI is the further development of the AMETS at Annagh Head in Mayo. An Offshore Renewable Energy Development Plan (ORDEP) is to be published in early 2014 and will identify how best to link action across the environmental, energy and economic development sectors to best facilitate the commercial development of Ireland’s abundant offshore energy potential – using both existing wind and emerging ocean and tidal technologies. 4.9 Agriculture National policies on agricultural research and technology transfer in conjunction with the successful uptake of payment for environmental services schemes have made a significant contribution to reducing agricultural greenhouse gas emissions and increasing the levels of carbon sequestration. An
115

important caveat in this observation is that further improvements in production efficiency will be incrementally more challenging to obtain. As a result, this historic decoupling of livestock numbers and GHG emissions cannot and should not be symmetrically projected into future scenarios. The link between the production of agricultural output and public goods such as the rural landscape; cultural or heritage features; biodiversity and greenhouse gas absorption is reflected in what has been termed the European Model of Agriculture. This idea stresses the multifunctional character of European agriculture and provides a justification for Government’s role in support of agriculture and its provision of public good outputs. The public good provided by agriculture also reinforces the role that agriculture will play in sustainable rural development. The development of tourism in Irish rural areas will be contingent on the continued environmental health of rural Ireland to which agriculture makes, and will continue to make, an important contribution. A critical consideration in national climate change policy is to balance the environmental objective of greenhouse gas emissions reductions with the economic and social objective of promoting the sustainable development of a rural economy, which maintains the maximum number of farm families and rural households. Not all the mitigation measures related to agriculture outlined in the following paragraphs are included individually in the projections (Chapter 5), due to the complexity of the interactions between different measures and greenhouse gases (N20, CH4 and CO2). However when each and all of them are combined they exert a downward pressure on agricultural GHG emissions. Many of the mitigation measures listed below also have a positive effect on building agriculture’s resilience and adaptive capacity. In addition to those listed below, some specific agricultural adaptive measures are described in an Example box in Chapter 6. 4.9.1 European Common Agricultural Policy The CAP has made an increasingly significant contribution to the environmental sustainability of the European agri-food sector in recent years, in particular through the various requirements that farmers have had to comply with under cross compliance and Good Agricultural and Environmental Condition (GAEC) provisions, and the agri-environmental measures contained in Member States’ Rural Development Programmes. This contribution will be further enhanced following the recent agreement on the reform of the CAP for the period 2014-2020, which ensures the policy’s coherence with the Europe 2020 strategy and its support for the achievement of the twin goals of competitiveness and sustainability. The CAP’s green credentials will be strengthened through the linkage of 30% of the annual national ceiling for direct payments to the delivery of agricultural practices beneficial for the climate and the environment. This is the first time that a minimum level of environmental protection has been enshrined in direct payments under Pillar 1. Farmers will have to comply with 3 compulsory green measures, namely, the retention of permanent grassland, crop diversification and the establishment of ecological focus areas. As an alternative to these criteria, farmers can qualify for greening by participating in agri-environment or national certification schemes that are deemed by the Commission to be at least equivalent in terms of benefit to the environment. Environmental measures will also continue to be a strong feature of Member States’ Rural Development Programmes under Pillar 2. One of the three key objectives to be achieved by Pillar 2 funding is the sustainable management of natural resources, and climate action. This must be pursued through Union priorities that include the restoration, preservation and enhancement of agriculture and forest ecosystems, the promotion of resource efficiency, and support for the shift
116

towards a lower carbon economy. A minimum spend of 30% of total funding on agri-environment measures is required, and Member States’ Rural Development Programmes must include a measure aimed at preserving and promoting the changes necessary in agricultural practices that make a positive contribution to the environment and climate. Other measures available include support for conversion to, or maintenance of, organic farming, and support to cover the costs associated with the implementation of Natura 2000 and the Water Framework Directive. 4.9.2 Methane and Nitrous Oxide Emissions A number of measures have been taken to reduce stocking densities on land, encouraging less intensive farming methods and lower CH4 and N2O emissions. The Single Payment Scheme and Cross-Compliance Since 1 January, 2005 direct payments to farmers under the CAP have been fully decoupled from production, i.e. the level of CAP direct payments to farmers is now independent of the level of production of agricultural products. Applicants under the various Direct Payments Schemes are required to comply with the requirements of cross compliance as detailed in EU governing regulations. Cross compliance involves two elements:
- A requirement for farmers to comply with 18 statutory management requirements (SMRs) set down in EU legislation on the environment, (including the Nitrates Directive) food safety, animal health, welfare, and plant health, and
- A requirement to maintain the farm in good agricultural and environmental condition. If an applicant is found to be non-compliant with any element of these requirements, sanctions as provided for in the governing EU regulations, which will be applied to all of an applicant’s area based payments under the Direct Payments regime. Rural Environmental Protection Scheme (REPS) REPS is a voluntary scheme designed to compensate and reward farmers for delivering environmental benefits. There are currently 29,200 farmers participating in REPS each implementing a nutrient management plan. This is providing a more sustainable farming environment, improving the management of organic manures and chemical fertilisers and reducing nitrous oxide emissions. Nutrient Management Planning, a cornerstone of REPS, establishes farming practices that lead to greater efficiency in the use of nitrogenous fertiliser. This is achieved by minimising nutrient losses from agriculture and making better use of the nutrients in animal manures. Although applications for the REPS scheme closed in 2009, DAFM launched a new scheme known as the Agri-Environment Options Scheme (AEOS) in 2010 as described below. An analysis of the 2012 National Farm Survey (NFS) revealed that (on the 315 REPS/AEOS farms) chemical nitrogen use on REPS/AEOS farms was 76.3 kg/ha; the average for the 607 non-REPS/AEOS farms being 85.9kg/ha. Use of organic nitrogen on REPS/AEOS farms was 106.0kg/ha, more than non-REPS/AEOS farms, which had an average of 101.2 kg/ha.
Agri-environment Options Scheme AEOS replaced REPS in 2010. The Scheme builds on the principle of respect for and protection of the environment which started with the first REPS scheme in 1994. Under the Scheme 20,000 farmers are paid to undertake actions which specifically target three environmental challenges namely those of:
- Halting the loss of Biodiversity
- Contributing to the improvement of Water Quality
117

- Combating Climate Change. Unlike REPS, AEOS is not based on a whole farm approach with farmers having the option of choosing to implement those measures which are best suited to their individual circumstances. Primary actions addressing Climate Change promote the reduced and most efficient use of fertilisers, thus reducing the nitrous oxide emissions and also supporting measures to protect and enhance soil carbon levels. These actions include the following:
- Arable margins
- Green Cover Establishment from a Sown Crop
- Minimum Tillage
- Use of new technologies for slurry spreading. Other actions such as tree and hedgerow planting contribute to the overall objective of climate change through carbon sequestration, and in general actions within the Scheme involve less fertiliser use. Organic Farming Organic agriculture, in general, requires less fossil fuel per hectare and per kg of produce due to the avoidance of synthetic fertilisers and aims at improving soil fertility and nitrogen supply by using leguminous crops, crop residues and cover crops. The enhanced soil fertility leads to a stabilisation of soil organic matter and in many cases to a sequestration of carbon dioxide into the soils. This in turn increases the soil’s water retention capacity, thus contributing to better adaptation of organic agriculture under unpredictable climatic conditions with higher temperatures and uncertain precipitation levels. Organic production methods emphasising soil carbon retention are most likely to withstand climatic challenges particularly in those countries most vulnerable to increased climate change. Organic systems are highly adaptive to climate change due to the application of traditional skills and farmers’ knowledge, soil fertility-building techniques and a high degree of diversity. At present, there are 1,661 organic operators in Ireland with 52,783 hectares of land under organic production methods. This equates to just over 1% of our agricultural land. The national target of 5% of Utilisable Agricultural Area under organic production is reaffirmed in the Food Harvest 202066 report. Disadvantaged Areas Compensatory Allowance Scheme (DAS) Up to 2000, headage grants were paid on cattle, sheep, goats and horses in designated areas. Scheme payments altered from being based on the number of animals to an area-based payment system in 2001. Farmers are now paid a flat rate per hectare, removing the incentive to maximise stocking densities in order to maximise payments. The minimum stocking density requirement is 0.15 livestock units per forage hectare Grassland Sheep Scheme (GSS): The GSS is paid on a per hectare basis, based on the number of eligible hectares declared, or area deemed eligible for payment, whichever is the lower, using the following stocking densities:
- 2.5 ewes per hectare for Mountain type grazing.
- 7 ewes per hectare for all other DAS land.
66
http://www.agriculture.gov.ie/media/migration/agri-foodindustry/foodharvest2020/2020FoodHarvestEng240810.pdf
118
- Payment is limited to 210 ewes, equivalent to 84 hectares of Mountain type land or 30 hectares of Lowland.
- There are defined penalties for over-declaration of land and over-declaration of sheep.
The objective of the scheme is to ensure that permanent grasslands are retained in good condition; therefore the carbon pool of the soil is retained.
Lower Age at Slaughter Younger animals produce less CH4 emissions, and measures have been taken to reduce the age of cattle slaughtered. To encourage efficient traceable production practices, Bord Bia in conjunction with the beef industry introduced a quality payment scheme. This scheme provides for higher prices at slaughter to be paid for cattle under 30 months. As a consequence this leads to a reduction in the number of cattle retained for slaughter over 30 months and thereby reducing CH4 emissions per kilo of beef produced. Commonage Framework Plans Interim Commonage Framework plans introduced in 1998 reduced stock numbers by 30% on commonages in six western counties. Permanent destocking arrangements were put in place for commonages in the final Commonage Framework Plans introduced in 2002 and continues to be in place. 4.9.3 Animal Husbandry One of the factors that influence methane emissions from the dairy herd is longevity of the cows, which is influenced by the health and fertility of the cows. As yields per cow increase there is a tendency for fertility to reduce, thereby leading to an increase in the number of replacements kept on farms. Teagasc has an ongoing research programme aimed at improving fertility levels in the dairy herd. Part of the animal breeding programme focuses on other important genetic parameters – increasing yield by cow, improving milk composition, etc. They are also focused on improving grazing techniques and pasture management (including increasing the use of clover) and manure management in both dairying and beef systems with a view to identifying the best and most environmentally sustainable management systems that facilitate increased productivity, improving output per unit of input. A further part of the research programme aims to reduce nitrous oxide emissions by using nitrification inhibitors. In addition, an important part of the Teagasc advisory programme focuses on improving the uptake of various technologies at farm level that will have the effect of increasing outputs and reducing inputs including transfer of information. Improvements in efficiencies, which flow from this work, are leading to reductions in GHG emissions per unit of output for both milk and meat production. Over recent years a number of livestock improvement schemes have been introduced with the aim of improving husbandry and breeding efficiencies in the livestock sectors. These were as follows Animal Welfare, Recording and Breeding Scheme for Suckler Herds (2008 – present) The objectives of the Scheme are:
- Enhance welfare standards for animals produced from the suckler cow herd
- Improve husbandry standards at weaning time leading to reduced illness and mortality and enhanced health of the National herd.
- Provide education and knowledge building among farmers on best practice in suckler herd health and welfare.
- Improve the genetic quality of the National suckler herd.
119
- Improve the competitiveness of the Irish beef industry and the quality of the beef produced.
Dairy Efficiency Programme (2009 – 2012) A three-year Dairy Efficiency Programme operated from 2009 - 2012. The objective of this programme was to encourage significant efficiency gains on Irish dairy farms. The funding will support the establishment of dairy discussion groups to speed up the transfer of technology, knowledge and best practice. These groups will place particular emphasis on the adoption of best practice in relation to grassland management, breeding and financial management. Participants in the programme will have their progress monitored by their Teagasc trained facilitator and they will be required to meet standards in relation to attendance and project completion. In return they will receive a payment at the end of each year, with the level of payment determined by their participation rate in the Programme.
Table 4.1 Participation in the Dairy Efficiency Program (DEP)
Year Participants
2010 5916
2011 5584
2012 5405
Beef Technology Adoption Programme (BTAP) Under Food Harvest 2020, ambitious targets were set for the development of the beef sector. To help assist with achieving these, a Beef Technology Adoption Programme was established to encourage the adoption and uptake of best management practice on beef farms. The scheme revolves around participants attending a number of discussion groups throughout the year, and the completion of specific tasks designed to help increase the long term viability of the holding. The scheme will focus on making improvements in a number of areas; financial management, grassland management, herd health, animal breeding, producing animals to market requirements. Participation rate in BTAP is currently approximately 5,400 farmers. Sheep Technology Adoption Programme (STAP) This programme was mirrored on the successful BTAP. It is a facilitator led programme, designed to improve technology transfer on sheep farms, aiming for improvements made on the BETTER farms to be copied on a wider scale on commercial farms across the country. The focus is to improve lamb output per ewe and improve efficiency and profitability. Compulsory usage of a ram that meets a minimum genetic evaluation will allow for accelerated genetic improvement across these farms. The scheme in year one has also been very successful in helping address a major animal health issue on Irish sheep farms- resistance to routinely used anthelmintics used to control parasites. Participation rate in STAP is currently approximately 6,500 farmers. Beef Genomics Scheme This will provide suckler farmers with an incentive to take samples from stock bulls and a selection of suckler cows (4/5 cows with best genetic linkages) for genotyping. This will help to accelerate the kind of genetic improvement that will drive efficiency and increase profitability at farm level. ICBF is a world leader in the area of Genomics, and Ireland was the second country to introduce Genomic selection in dairy animals. Genetic gain in the Beef herd lags that in the Dairy herd, mainly due to poor use of genomic selection. This needs to be addressed by collecting Genomic data on stock & AI bulls, and the genetically best connected females in herds around the country. Improving beef efficiency at farm level will help to reduce dependence on direct payments and increase the contribution of the beef sector to job creation and the wider economy.
120

4.9.4 Research Animal Diet Research Research is ongoing to evaluate a range of measures that could be used to reduce CH4 emissions per animal. Examples of such measures include increasing the level of oil in the diet, to study the impact on emissions and to establish the resultant changes in rumen microflora composition – this is important work in the context of developing the best animal feeding strategies to reduce emissions. Field scale research with beef cattle has shown that reductions of circa 20% in daily enteric methane output are possible when coconut oil is added to the diet at a rate of 250 grammes per day. However this practice is likely to be feasible only in part of an animal’s life (i.e. the finishing winter when concentrates are being fed which allow delivery of the oil), and thus the reduction in lifetime emissions would be 5-6%. Coconut oil is expensive and the measure will likely have some cost of implementation at farm level, depending on the relative costs of oil, other feedstuffs and the value of beef or milk output. The feasibility of using other cheaper oils e.g. soya oil is being explored. A range of commonly used concentrates are being examined to determine if one is more suitable than another in terms of reducing methane emissions. Soil research The ‘Gaseous Emissions and Land Use Network – GHG Ireland’, is a Network that aims to bring together all principal investigators working in the field of agricultural climate change research during a 4 year initiative. The main focus of this network is to improve our understanding of carbon stock changes in agricultural soils in order to contribute to the development of a more robust inventory and underpin future accounting for these categories. Ongoing research will continue to contribute to further options to reduce emissions from agriculture. DAFM has committed almost €20m to climate change research projects since 2005 under the Research Stimulus Fund and continues to monitor ongoing research both nationally and internationally.
4.9.5 Manure Management and Agricultural Soils Environmental Legislation Agricultural activities in certain areas are already subject to local by-laws implemented by local authorities. In some instances, by-laws may include a requirement for nutrient management planning. Nutrient management planning is a compulsory feature of IPPC licensing. IPPC licensing is implemented by the EPA, and applies to intensive pig and poultry units. Environmental Impact Assessment Regulations The European Communities (Environmental Impact Assessment) (Agriculture) Regulations (Statutory Instrument 456 of 2011)67 came into force on 8 September 2011. The Regulations apply to three different types of activities;
- Restructuring of rural land holdings
- Commencing to use uncultivated land or semi-natural areas for intensive agriculture.
- Land drainage works on lands used for agriculture.
67
http://www.irishstatutebook.ie/pdf/2011/en.si.2011.0456.pdf
121

Where it is intended to undertake any of these activities and the proposed works exceed the size thresholds set out in the Regulations an application must be made to DAFM for screening, or consent as appropriate, giving details of the proposed works. Even if the proposed activity does not exceed the size threshold but if it is within, or may affect a European site (e.g. SAC, SPA), or a NHA, or pNHA, then it may also be necessary to receive approval under the above Regulations. In all cases any activity, irrespective of size, that may have a significant effect on the environment must be approved under the Regulations. The Regulations do not, however, apply to reclamation, infill or drainage of wetlands, which activities are subject to planning permission under the Planning and Development (Amendment) (No. 2) Regulations 201168 and the European Communities (Amendment to Planning and Development) Regulations 201169. The objective of the Regulations is to ensure that the activities outlined in the legislation are assessed, where appropriate, by the Regulatory Authority (DAFM) in accordance with the criteria set out in the EIA Directive. EU Nitrates Directive Regulations placing limits on the amount of livestock manure that may be applied to land to further implement the EU Nitrates Directive were made by the Minister for the Environment, Heritage and Local Government in 2005. Amending Regulations were made in 2006, 2009 and reviewed in 2010 and apply to all farmers within the state. These regulations set down legal maximum limits for fertiliser applications (organic and chemical) based on stocking rate, crop requirements and crop rotation. The objective of the Regulations is to protect water quality from pollution or potential pollution through more efficient use of nitrogenous fertiliser. Anaerobic Digestion There is potential to supply energy through the use of animal manures as feedstock in anaerobic digestors. DAFM is committed to supporting the development of on-farm anaerobic digestion facilities and, under the Scheme of Investment Aid for Demonstration On-Farm Waste Processing Facilities, grant-aid of €4 million was made available to ten such projects in 2007. The environmental benefits of the technology will be assessed under the scheme including a full analysis of the potential of the technology to abate greenhouse gas emissions. 4.10 Waste National waste policy is predicated on the waste hierarchy, as set out in the Waste Framework Directive 2008/98/EC, whereby prevention, preparation for reuse, recycling and other recovery are favoured over the disposal of waste. Published in July 2012, the Government’s waste policy, A Resource Opportunity - Waste Management Policy in Ireland70, sets out the actions through which Ireland will make the further progress necessary to become a recycling society, with a clear focus on
- resource efficiency
- the virtual elimination of landfilling of municipal waste, and 68
http://www.environ.ie/en/Legislation/DevelopmentandHousing/Planning/FileDownLoad,27884,en.pdf 69
http://www.irishstatutebook.ie/pdf/2011/en.si.2011.0464.pdf 70
http://www.environ.ie/en/Environment/Waste/PublicationsDocuments/FileDownLoad,30729,en.pdf
122

- the prevention of waste generation by de-coupling it from economic growth.
The policy also encompasses measures covering the full spectrum of waste management planning, compliance and enforcement and provides a solid basis for the achievement of a more sustainable approach to waste management in Ireland. A central objective of the waste policy is to exploit the potential of waste as a resource which can contribute not only to key environmental goals, but also to economic recovery, job creation and sustainability. Running to 2020, with a midlife review in 2016 to assess performance, the policy seeks to integrate its aims with other strategic priorities such as national sustainable development, developing the green economy, and green public procurement. Ireland’s waste policy contributes to emission reductions via three routes: reductions in methane emissions from landfill in line with targets set out under the EU landfill Directive; emission reductions from waste prevention, re-use and recycling; and, via energy recovery from waste, which offsets fossil energy generation elsewhere in the economy. Preliminary 2012 data indicates that Ireland is on track to meet the 2013 target of less than 610kt of BMW disposed to landfill according to our EU Landfill Directive target. Waste Policy Measures: Waste Management Planning The reduction in the number of waste management planning regions from 10 to 3 is a key measure in the policy to enable the provision of effective and efficient waste management planning. The rationalisation has been undertaken to ensure enhanced and homogenous regional waste management planning by allowing the regions to pool and concentrate their specialist resources, while at the same time freeing up additional resources for other priority areas such as implementation and enforcement. New draft waste management plans will be published for consultation in 2014. The finalised plans will be informed by the consultation process and reflect national and EU waste policy and will set out how they will be implemented during the lifetime of the plans. Regulation of Household Waste Collection National waste policy provides that the household waste collection permitting regime will be strengthened to ensure that:
- waste is managed in accordance with the waste hierarchy;
- mandated service levels are provided to householders and
- pricing structures are put in place to incentivise environmentally efficient and sustainable behaviour.
The policy further provides that households will be obliged to demonstrate that they are availing of authorised waste collection services or are otherwise managing their waste in an environmentally acceptable manner. Legislation to give effect to the new permitting regime will be developed in 2014 and informed by an extensive consultation process. Enforcement
123
A review of the role of the EPA and local authorities is being carried out to optimise the enforcement of waste legislation. Enforcement action will be taken to ensure that specific waste streams under the Producer Responsibility Model are managed in a manner that ensures that Ireland’s obligations are delivered. Prevention / Reuse Notwithstanding the fact that Ireland has an internationally recognised and successful National Waste Prevention Programme, managed by the EPA, the drive to prevent waste is on-going, as is evidenced through the renewal of that Programme. A new National Waste Prevention Programme will be finalised in 2014. It will include a focus on resource efficiency and promoting more sustainable production and consumption behaviours. Recycling / Recovery The waste policy delivered much needed policy certainty to the waste sector, facilitating planning and investment decisions required to underpin the continued development of our recycling and energy recovery infrastructure, which is essential if Ireland is to reduce further our over-reliance on landfill. Regulations to promote the segregation and recovery of household bio and food waste were introduced in April 2013. The legislation requires waste collectors to have a separate collection service for household bio/food waste and requires households to segregate bio/food waste for collection. The legislation will drive household bio/food waste away from landfill to more productive uses, such as composting. Disposal Among the measures to reduce the disposal of waste to landfill set out in the policy has been a substantial increase in the landfill levy, the latest of which increased the rate from €65 to €75 per tonne from 1 July, 2013. 4.11 Forestry Restoring forest cover and the afforestation programme One of the aims of Ireland’s forest policy is to encourage planting by private landowners in order to achieve a forest cover of 17% by 2030. This is achieved by providing grants to cover the cost of afforestation, and an annual forest premium to land owners to compensate for income foregone as a result of converting farm land to forest. Ireland has had, on a per capita basis, one of the most intensive afforestation programmes in the developed world since 1990, funded by the Government (and in the past jointly with the EU) under successive accompanying measures to CAP reform. Since 1990, 299,735 ha have been afforested. Despite this rate of planting, however, Ireland remains one of the least forested countries in the EU. At the end of 2012, the national forest estate stood at 731,652 ha, which represents about 10.5 % of the area of the country, compared to an average of 33% for the European Union. First-thinning of broadleaf plantations also qualifies for grant aid. This measure has resulted in substantial mobilisation of firewood, principally for domestic use. A new afforestation programme and associated measures for the period 2014-2020 is currently being prepared. The current Forestry Act places a legal obligation on the land owner to replant after felling, unless an exemption is provided by the Minister. A new Forestry Bill is currently before the Oireachtas (House of Parliament); it retains the replanting obligation. Deforestation is estimated to have averaged
124

1,200 ha per year over the period 2008-2012, based on latest estimates from the second phase of the National Forest Inventory and data to be submitted to the UNFCCC for inventory year 2012. Forest Infrastructure The construction of forest roads is supported through grant-aid available under the Forest Roads Scheme of the Forest Service. This measure aids in the mobilisation of forest-based biomass. A dedicated web site, woodenergy.ie, is run by DAFM and provides advice on wood fuel specification and use, as well as on supply chain technologies and costs. Bioenergy and Use of forest-based biomass and related measures DAFM launched an Exchequer funded Bioenergy Scheme on a pilot basis from 2007 to 2009 to provide farmers with establishment grants to plant the energy crops willow and miscanthus (biomass crops) for use as a renewable fuel. This was followed since 2010 by an EU co-funded Bioenergy Scheme. The grant payable under the scheme covers 50% of crop establishment costs up to a maximum of €1,300 per hectare. By the end of 2013, over 3,300 hectares of energy crops will have been grant aided under the Bioenergy Scheme. Biomass crops can deliver meaningful CO2 reductions associated with fossil fuel use and act as a carbon sink similar to afforestation. Analysis by Teagasc estimates the energy content of dry willow wood chip is approximately 19MJ per kg. One hectare of SRC willow produces the equivalent energy of 3,000-5,700 litres of light heating oil and an average medium sized house will use around 3,000 litres of oil per year, which releases 8.02 tonnes of CO2. SRC willow is treated as a carbon neutral fuel in national accounts and therefore switching will result in a reduction of accounted greenhouse gas emissions. The energy content of miscanthus is similar to willow, however willow is harvested every second of third year compared to miscanthus, which will be harvested each year. Policies aimed at promoting renewable energy (in the form of heat and electricity) from biomass will create a market for thinnings and residues (both in-forest and from sawmilling). DAFM funds research on the wood energy supply chain and related topics under the national forest research programme. Teagasc, the farm advisory service, provides advice and information on the harvesting and processing of forest-based biomass. DAFM also supports a wood fuel quality assurance scheme in partnership with the Irish Bioenergy Association, and an advisory service on wood fuels at woodenergy.ie. The measures outlined complement a number of demand side measures. REFIT 3 is a feed-in tariff scheme which is designed to stimulate the installation of biomass electricity, including CHP and co-firing of biomass with peat. Furthermore, the carbon tax (details in Section 4.4) does not apply to biomass products.
In 2012, the output of the forest-based biomass energy sector grew by 4.4% over 2011 (Table 4.2). Some 225,000 m3 of firewood was used in the Republic of Ireland, to a value of €33million, showing that it is providing a steady and a growing market for first thinning’s from forest plantations. In 2012, 35.6% of the round wood harvested was used for energy generation, mainly within the forest products sector.
125

Table 4.2 Use of forest-based biomass and as a proportion of total round wood harvest (2010-2012).
2010 2011 2012
000 m3 OB RWE
Forest-based biomass use by Edenderry Power 79 85 152
Forest-based biomass used for energy production and process drying in sawmills and wood-based panel mills 475 487 459
Roundwood chipped for primary energy use 39 41 30
Domestic firewood use 199 214 225
Short rotation coppice 1 5 5
Wood pellets and briquettes 121 129 144
Charcoal 2 5 2
TOTAL 916 966 1,017
Roundwood harvest Roundwood available for processing 2,708 2,740 2,594 Firewood harvest 199 214 225
TOTAL 2,907 2,954 2,819 Forest-based biomass as a % of total roundwood harvest 31.5 32.6 36.0
Since 2006, the use of wood biomass energy has resulted in an estimated GHG emission saving of 3.12 million tonnes of CO2. 4.12 Policies and Measures No Longer In Place There are a number of schemes which are no longer in place or directly yielding new and additional mitigation reductions. In this respect one would distinguish between measures which were time limited by design, those that have been superseded and some which have been halted for other reasons. 4.12.1 Time limited schemes Some policies and measures are designed to give an initial impetus to some kind of change of behaviour. The idea being that one would subsidise early movers in a transition towards energy efficient solutions and thereby help to create supply chains for these goods and services. In some cases these apply to goods and services where changes would be cost negative and as such it does not make sense to subsidise them beyond a short introductory period. The following policies and measures either have terminated (or will soon do so)
- Greener Homes Scheme (subsidy for domestic renewable heating systems) 2011
- SEEP and EERF –support scheme for demonstration projects 2011
- Accelerated Capital Allowances – (tax expenditure for energy efficient equipment purchases) 2014
- Public Sector Building Programme – support for market development for retrofit in public buildings 2009
- CHP (Public & Private Sector support schemes) 2011
- Directive 2000/25/EC (limit values for emissions from Agricultural machinery – related to targets for 2010)
126

4.12.2 Superseded Policies and Measures Other policies and measures typically in the area of standard setting or implementation targets are subsequently superseded by more onerous or ambitious standards or targets. Nonetheless these policies and measures have played an important role in beginning the process of decarbonisation of the Irish economy. The following is a list of such policies which have since been superseded.
- 24 % Renewables target for Total Final Consumption in Electricity
- 2002 Residential Building Regulations
- 2008 Residential Building Regulations
- 2011 Residential Building Regulations
- 2005 Non-residential Building Regulations 4.12.3 Other Policies and Measures no longer in place A final category would be made up of those policies and measures which expire and are replaced by similar schemes but with different design. The following list includes such policies and measures.
- Warmer Homes Scheme (aimed at retrofitting measures for those of low incomes)
- Home Energy Saving Scheme (subsidy for retrofitting improvements)
- ReHeat – supports for energy efficiency retrofits in public and commercial buildings
Each of these schemes is now covered by a single retrofitting scheme known as the Better Energy Scheme.
127

TABLE 4.3 List of existing and planned policies and measures
Descriptive Data Carbon Savings (Gg CO2 eq)
Sector Name of Policy or
Measure
Existing
Measure?
Objective and/or activity affected GHG affected Type of
Instrument
Status Implementing
Entity or Entities
Impact
2015
Impact 2020
Energy Supply Electricity generation efficiency improvements
* Achieve 20% improvement in energy efficiency by 2020 in line with commitments made in the Energy White Paper (2007) and the EU Energy Efficiency Action Plan. In addition, meet the requirements of the Energy End-Use Efficiency and Energy Services Directive ie acheive energy efficiency savings of 9% by 2016.
CO2, CH4, N2O Fiscal Implemented DCENR 684.5 966.1
Energy Supply 24% renewables by 2020 (RES-E)
* Renewable energy will contribute 23% of gross electricty consumption (total electricty generated plus net imports) in 2020
CO2, CH4, N2O Economic Implemented DCENR, CER 1511 1487
Energy Supply Reduced electricity demand from energy efficiency measures
Electricity savings from measures in Industry, Services, Residential, Transport
CO2, CH4, N2O Economic, Fiscal, Regulatory
Planned DCENR, SEAI 225.6 451.1
Energy Supply 40% renewable by 2020 (RES-E)
Renewable energy will contribute 40% of gross electricty consumption (total electricty generated plus net imports) in 2020
CO2, CH4, N2O Economic Planned DCENR, CER 41.4 785.1
Transport Electric vehicle deployment
* Electric vehicles to make up 10% of the transport fleet (private passenger cars)by 2020.
CO2, CH4, N2O Fiscal Adopted DCENR 90.1 180.4
Transport VRT and Motor Tax changes
* Motor tax (annual circulation tax) and VRT for new passenger cars linked to CO2 emissions
CO2, CH4, N2O Fiscal Implemented DFIN 110.2 172.4
Transport Improved fuel economy of private cars
* Increasing efficiency of the vehicle fleet through the ACEA Agreement
CO2, CH4, N2O Voluntary agreement
Implemented EC 419.5 790.3
128

Transport Aviation efficiency * Increase the efficiency of fuel use in aviation. IATA airlines have adopted a voluntary fuel efficiency goal. This is to reduce fuel consumption and CO2 emissions (per revenue tonne kilometer) by at least 25% by 2020, compared to 2005 levels
CO2, CH4, N2O Voluntary agreement
Implemented IAA, UK NATS 66.2 66.3
Transport Public transport
efficiency
improvements
To radically improve the level, accessibility and
quality of rail and bus services throughout the
country and in urban transport services both by
bus, light rail, suburban rail and metro.
CO2, CH4, N2O Voluntary agreement
planned IR, DB, BE 32.5 41.4
Transport More efficient traffic
movements
Enable more fuel-effcient, inter-urban freight and
private car movements through improved road
infrastructure.
CO2, CH4, N2O Information, Education
planned DECLG, DTTAS 93.3 186.8
Transport Renewables in
Transport Target (RES-
T)
Renewables penetration to increase from 3% in
2020 under WEM to 10% under WAM by 2020
CO2, CH4, N2O Regulatory planned DCENR 257.8 797.5
Residential 2002 Building
Regulations
* To improve the energy performance of residential
buildings
CO2, CH4, N2O Regulatory implemented DECLG 303.7 303.7
Residential 2008 Building
Regulations
* 40% improvement on energy performance of
residential buildings relative to current building
regulations
CO2, CH4, N2O Regulatory implemented DECLG 173.5 322.4
Residential Efficient Boiler
Standard
* To improve th efficiency of residential boilers. CO2, CH4, N2O Regulatory implemented DECLG 166.3 285.1
Residential Greener Homes Scheme * The Greener Homes Scheme provides assistance to
homeowners who intend to purchase a new
renewable energy heating system for existing
homes
CO2, CH4, N2O Economic implemented SEAI 24.9 24.9
Residential Warmer Homes
Scheme
* The purpose of the Low Income Housing
Programme is to assist with the establishment of a
national plan of action to address fuel poverty in
low-income households
CO2, CH4, N2O Voluntary agreement
implemented SEAI 31.2 31.2
129
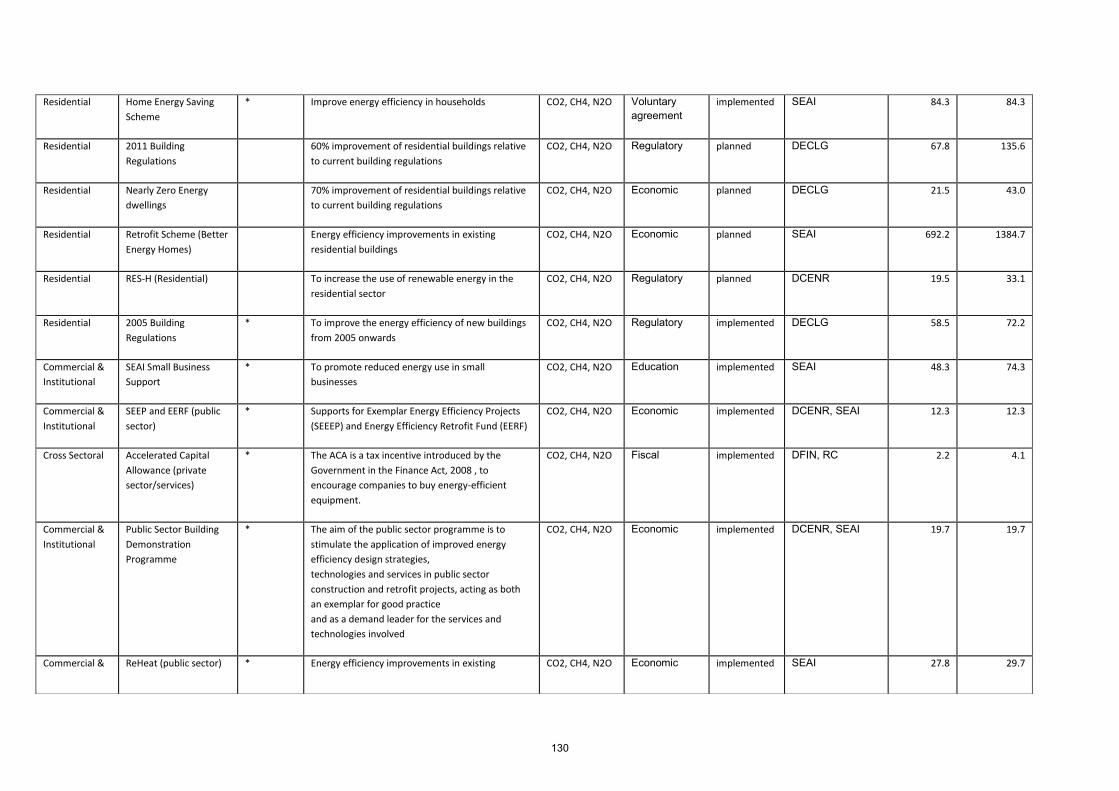
Residential Home Energy Saving
Scheme
* Improve energy efficiency in households CO2, CH4, N2O Voluntary agreement
implemented SEAI 84.3 84.3
Residential 2011 Building
Regulations
60% improvement of residential buildings relative
to current building regulations
CO2, CH4, N2O Regulatory planned DECLG 67.8 135.6
Residential Nearly Zero Energy
dwellings
70% improvement of residential buildings relative
to current building regulations
CO2, CH4, N2O Economic planned DECLG 21.5 43.0
Residential Retrofit Scheme (Better
Energy Homes)
Energy efficiency improvements in existing
residential buildings
CO2, CH4, N2O Economic planned SEAI 692.2 1384.7
Residential RES-H (Residential) To increase the use of renewable energy in the
residential sector
CO2, CH4, N2O Regulatory planned DCENR 19.5 33.1
Residential 2005 Building
Regulations
* To improve the energy efficiency of new buildings
from 2005 onwards
CO2, CH4, N2O Regulatory implemented DECLG 58.5 72.2
Commercial &
Institutional
SEAI Small Business
Support
* To promote reduced energy use in small
businesses
CO2, CH4, N2O Education implemented SEAI 48.3 74.3
Commercial &
Institutional
SEEP and EERF (public
sector)
* Supports for Exemplar Energy Efficiency Projects
(SEEEP) and Energy Efficiency Retrofit Fund (EERF)
CO2, CH4, N2O Economic implemented DCENR, SEAI 12.3 12.3
Cross Sectoral Accelerated Capital
Allowance (private
sector/services)
* The ACA is a tax incentive introduced by the
Government in the Finance Act, 2008 , to
encourage companies to buy energy-efficient
equipment.
CO2, CH4, N2O Fiscal implemented DFIN, RC 2.2 4.1
Commercial &
Institutional
Public Sector Building
Demonstration
Programme
* The aim of the public sector programme is to
stimulate the application of improved energy
efficiency design strategies,
technologies and services in public sector
construction and retrofit projects, acting as both
an exemplar for good practice
and as a demand leader for the services and
technologies involved
CO2, CH4, N2O Economic implemented DCENR, SEAI 19.7 19.7
Commercial & ReHeat (public sector) * Energy efficiency improvements in existing CO2, CH4, N2O Economic implemented SEAI 27.8 29.7
130

Institutional buildings and facilities
Commercial &
Institutional
Green Public
Procurement (via ACA)
* Promote green public procurement, to 'move the
market'
CO2, CH4, N2O Economic, Education
implemented DFIN, RC 1.9 3.5
Commercial &
Institutional
CHP (public sector) * Promote CHP CO2, CH4, N2O Economic implemented SEAI 36.5 44.1
Commercial &
Institutional
SEEP and EERF (private
sector)
* Supports for Exemplar Energy Efficiency Projects
(SEEEP) and Energy Efficiency Retrofit Fund (EERF)
CO2, CH4, N2O Economic implemented DCENR, SEAI 24.9 24.9
Commercial &
Institutional
2012 Building
Regulations
To improve the energy efficiency of new buildings
from 2010 onwards
CO2, CH4, N2O Regulatory planned DECLG 66.3 132.5
Commercial &
Institutional
Better Energy
(Retrofit)(public sector)
deliver a major increase in the pace, scale and
depth of sustainable energy investments in
upgrading existing buildings and facilities
CO2, CH4, N2O Economic planned SEAI 63.6 127.2
Commercial &
Institutional
Better Energy
(Retrofit)(commecial
sector)
Improving insulation of existing housing stock and
more efficient heating systems
CO2, CH4, N2O Economic planned SEAI 31.8 63.6
Commercial &
Institutional
Public Sector energy
efficiency target (Public
Sector Programme)
Public sector contribution to national energy
efficiecny target
CO2, CH4, N2O Regulatory planned DCENR, SEAI 88.8 177.5
Commercial &
Institutional
RES-H (Services) To increase the use of renewable energy in the
services sector
CO2, CH4, N2O Regulatory planned DCENR 49.5 82.5
Industry SEAI Large Industry
Programme
* Develop and maintain robust energy management
in industry
CO2, CH4, N2O Voluntary agreement
implemented SEAI 327.2 412.9
Energy Supply CHP efficiency * Promote CHP CO2, CH4, N2O Economic implemented SEAI 85.5 103.4
Cross Sectoral Accelerated Capital
Allowance (industry)
* The ACA is a tax incentive introduced by the
Government in the Finance Act, 2008 , to
encourage companies to buy energy-efficient
equipment.
CO2, CH4, N2O Fiscal implemented DFIN, RC 2.2 4.2
131

Commercial &
Institutional
ReHeat * Energy efficiency improvements in existing
buildings and facilities
CO2, CH4, N2O Economic implemented SEAI 78.6 69.6
Built
Environment
Retrofit (Better Energy
Scheme)
Deliver a major increase in the pace, scale and
depth of sustainable energy investments in
upgrading existing buildings and facilities
CO2, CH4, N2O Economic planned SEAI 31.9 63.7
Industry RES-H (Industry) To increase the use of renewable energy in the
industrial sector
CO2, CH4, N2O Regulatory planned DCENR 129.2 311.0
Transport Gas transport and
distribution
Savings attributed to reduced fugitive emissions
from gas transport and distribution between WEM
and WAM
CO2, CH4, N2O Other planned N/A 7.6 15.1
Industry Lime Production Account for differing quantities of lime used for air
pollutant abatement at coal fired electricity
generation plant
CO2 Other planned N/A 0.6 3.8
Residential Domestic lighting * Increase the efficiency of domestic lighting CO2, CH4, N2O Economic implemented DEJI 48.8 122.0
Industry MAC Directive * Control the leakage of specific fluorinated gases in
air-conditioning systems fitted to vehicles and to
prhibit air-conditioing systems designed to contain
fluorinated greenhouse gases with a global
warming potential higher than 150
HFC Regulatory implemented EC 12.1 73.5
Industry F-Gas Regulations * The objective of this Regulation is to reduce the
emissions of fluorinated greenhouse gases
PFC Regulatory implemented DECLG 30.0 30.0
Waste Landfill Directive * The objective of this directive is to reduce the
environmental of landfills
CH4 Regulatory implemented DECLG 168.2 190.7
Agriculture Water Framework
Directive
* The objective of the Water Framework Directive is
to improve the water environment
N2O Regulatory adopted DECLG, EPA NE NE
Agriculture Common Agricultural
Policy (CAP) related
regulations
* The Common Agricultural Policy (CAP) is the
agricultural policy of the European Union. Its main
objectives are to ensure a fair standard of living for
farmers and to provide a stable and safe food
CH4, N2O Regulatory adopted DAFM NE NE
132

supply at affordable prices for consumers.
Agriculture Directive 2000/25/EC * The objective of Directive 2000/25/EC is to impose
limit values for emissions of gaseous and
particulate pollutants in engines intended to
power agricultural or forestry tractors
CO2, CH4, N2O Regulatory expired DAFM NE NE
Residential Energy Labelling of
Household appliances
* This PAM includes the remaining energy
consumption Directives not already identified. The
aims of which are to promote energy effciency and
more responsible use of energy by consumers.
CO2, CH4, N2O Regulatory adopted DCENR NE NE
Energy Supply Carbon Capture and
Storage
The objective of the the CCS Directive
(2009/31/EC) is to establish a legal framework for
the environmentally safe geological storage of
CO2.
CO2 Regulatory adopted DCENR NE NE
Energy Supply Internal electricity
market
* Directive 2009/72/EC establishes common rules
for the generation, transmission, distribution and
supply of electrcity, together with consumer
protection provisions, with a view to improving
and integrating competitive electrcity markets in
the Community.
CO2, CH4, N2O Regulatory adopted DCENR, CER NE NE
Energy Supply Internal market in
natural gas
* Directive 98/30/EC establishes common rules for
the transmission, distribution, supply and storage
of natural gas.
CO2, CH4, N2O Regulatory adopted DCENR, CER NE NE
Transport Eurovignette * The objective of Directive 2006/38/EC is to provide
a harmonised framework for the charging of tolls
and user charges on heavy goods vehicles on
certain European motorways.
CO2, CH4, N2O Regulatory adopted DTTAS NE NE
Transport Rail related Directives * This PAM includes Directives 2007/58/EC and
2008/57/EC
CO2, CH4, N2O Regulatory adopted DTTAS, IR NE NE
133

Waste WEEE * The objective of the WEEE Directive (2002/95/EC)
is to approximate the laws of memebr states on
the restrictions of the use of hazardous substances
in electrical and electronic equipment and to
contribute to the protection of human health and
the environmentally sound recovery and disposal
of waste electrical and electronic equipment
CH4 Regulatory implemented DECLG, EPA NE NE
Waste Packaging and
packaging waste
* The objectives of Directives 94/62/EC, 2004/12/EC
and 2005/20/EC are to harmonise national targets
for the recycling of packaging waste.
CH4 Regulatory implemented DECLG, EPA NE NE
Waste Waste Incineration
Directive
* The aim of Directive 2000/76/EC is to prevent or to
limit as far as practicable negative effects on the
environment, in particular pollution by emissions
to air, soil, surface water and ground water, and
the resulting risks to human health, from the
incineration and co-incineration of waste.
CO2, CH4, N2O Regulatory implemented DECLG, EPA NE NE
Transport CO2 from vans Regulation 510/2011 establishes CO2 emissions
performance requirements for new light
commercial vehicles.
CO2, CH4, N2O Regulatory planned DTTAS, DECLG NE NE
Industry Solvents Directive * To limit the total content of VOCs in certain paints
and varnishes and vehicle refinishing products.
CO2 Regulatory adopted DECLG, EPA NE NE
Forestry Afforestation * Plant 14,700 Ha per annum of new forestry on
marginal agricultural land
CO2, CH4, N2O Economic Adopted DAFM 3,959.6 4,638.6
Cross Sectoral Emissions Trading
Scheme
* Reducing emissions in power generation and
energy intensive industry by way of a market
based mechanism that controls supply
CO2, CH4, N2O Economic Adopted EC NE NE
Cross Sectoral Carbon Tax * Reducing emissions from fossil fuel use by point
sources not included in EU ETS
CO2, CH4, N2O Fiscal Adopted DFIN, RC NE NE
134

CHAPTER 5: PROJECTIONS AND THE TOTAL EFFECTS OF POLICIES AND MEASURES
5.1 Introduction 5.2 Projections of Greenhouse Gas Emissions 5.3 Projections by sector
5.3.1 Projections by sector (‘with measures’ scenario) 5.3.2 Projections by sector (‘with additional measures’ scenario)
5.4 Projections by gas 5.4.1 Projections by gas (‘with measures’ scenario)
5.5. Methodological approach 5.6 Sectoral analysis and total effects of policies and measures
5.6.1 Energy industries 5.6.2 Manufacturing industries and construction 5.6.3 Transport 5.6.4 Residential 5.6.5 Commercial / Institutional services 5.6.6 Industrial process 5.6.7 Solvents and other product use 5.6.8 Agriculture 5.6.9 Waste
5.7 Memo Items 5.8 Forestry 5.9 Sensitivity Analysis 5.10 Supplementarity 5.11 Emission projections to 2030 ANNEX I to Chapter 5
135

5.1 INTRODUCTION On foot of a commitment in the 2007-2012 National Climate Change Strategy, national greenhouse gas emission projections are now published on an annual basis. The most recently published set of projections to 2020 (April 2013)71 were based on two scenarios. As is standard and required under EU Decision 280/2004/EC, ‘With Measures’ and ‘With Additional Measures’ scenarios were developed. A ‘Without Measures’ scenario, which is optional under Decision 280/2004/EC was not produced in the most recently published projections. A sensitivity analysis is also presented (as required under EU Decision 280/2004/EC) which examines the effect of varied input variables on projected emission levels under the ‘with measures’ scenario. 5.2 PROJECTIONS OF GREENHOUSE GAS EMISSIONS The projections presented indicate that the distance to target for the Kyoto Protocol will be 0.2 – 0.7 Mt CO2 equivalent. Ireland is, therefore, on track to meet its commitment under the Kyoto Protocol, and it is likely that there will be a very low requirement for the use of credits to ensure compliance with the agreed limit. These emission estimates include the impact of forest sinks as allowed for under Article 3.3 of the Kyoto Protocol and the impact of the EU ETS. Figure 5.1 shows emissions for the period 1990 to 2012 for both a ‘With Measures’ scenario and a ‘With Additional Measures’ scenario and compares with the Kyoto Protocol limit for the 2008 – 2012 period. Under the ‘With Measures’ scenario, total national emissions (excluding LULUCF) are projected to increase by 9.3 per cent by 2020 (Figure 5.2). The largest drivers of this increase are increases in the Agriculture and Road Transport sectors. Under the ‘With Additional Measures’ scenario total national emissions (excluding LULUCF) are projected to only increase by 0.8 per cent by 2020. Under this scenario, increases in the agricultural and road transport sectors are somewhat offset by reductions (as a result of additional polices and measures) in the Manufacturing Industries and Construction and Commercial/Institutional and Residential sectors.
Figure 5.1 Historical and projected greenhouse gas emissions (including forest sinks) for the 2008 –
2012 period for each scenario and the Kyoto Protocol target
71
http://www.epa.ie/pubs/reports/air/airemissions/irelandsgreenhousegasemissionsprojections2012-2030.html
-10.0
0.0
10.0
20.0
30.0
40.0
50.0
60.0
70.0
1990 1995 2000 2005 2006 2007 2008 2009 2010 2011 2012
CO
2e, M
ton
ne
s
Forest Sinks Projections - With MeasuresProjections - With Additional Measures EU-ETS EmissionsHistorical Emissions Kyoto Target
136

Figure 5.2 Historical and projected greenhouse gas emissions for the ‘With Measures’ and ‘With
Additional Measures’ scenarios
5.3 PROJECTIONS BY SECTOR 5.3.1 PROJECTIONS BY SECTOR (‘WITH MEASURES’ SCENARIO) The single largest source of emissions in 2011 was the agriculture sector which contributed to 32 per cent of total national emissions (excluding LULUCF). By 2020 its share is projected to increase slightly to 32.7 per cent. The second largest source of emissions in 2011 is the Energy Industries sector accounting for 20.8 per cent of total national emissions. In 2020 it is projected to account for 21.1 per cent. The Transport sector is the third largest source of emissions in 2011 accounting for 19.6 per cent of emissions. By 2020 its sectoral share is projected to increase to 21.8 per cent. Collectively the Industry and Commercial sectors were responsible for 14.3 per cent of national total emissions in 2011 and are projected to account for 12.5 per cent of national total emissions in 2020. The share of national total emissions which the Residential sector is responsible for falls from 11.5 per cent in 2011 to 10.5 per cent in 2020. In 2011 the waste sector accounted for 1.8 per cent of national total emissions, and is projected to account for 1.2 per cent in 2020. In 2011 the ETS accounted for 27.5 per cent of national total emissions and in 2020 is projected to account for 31.4 per cent. Sectoral shares for the ‘With Measures’ scenario are presented in Table 5.1 for historical and projected years. Table 5.1 Sectoral share (‘With Measures’ scenario)
1990 1995 2000 2005 2011 2015 2020
Energy Industries 20.6% 22.9% 23.8% 22.8% 20.8% 20.9% 21.1%
Residential 13.5% 10.9% 9.4% 10.4% 11.5% 11.3% 10.5%
Industry & Commercial 17.3% 16.6% 18.2% 17.3% 14.3% 12.9% 12.5%
Agriculture 36.9% 36.2% 30.6% 28.5% 32.0% 32.6% 32.8%
Transport 9.3% 10.7% 15.8% 18.9% 19.6% 20.6% 21.9%
Waste 2.5% 2.8% 2.2% 2.1% 1.8% 1.6% 1.2%
54
58
62
66
70
74
1990 1995 2000 2005 2010 2015 2020
CO
2e M
ton
ne
s
With Measures Scenario Historical emissions With Additional Measures Scenario
137
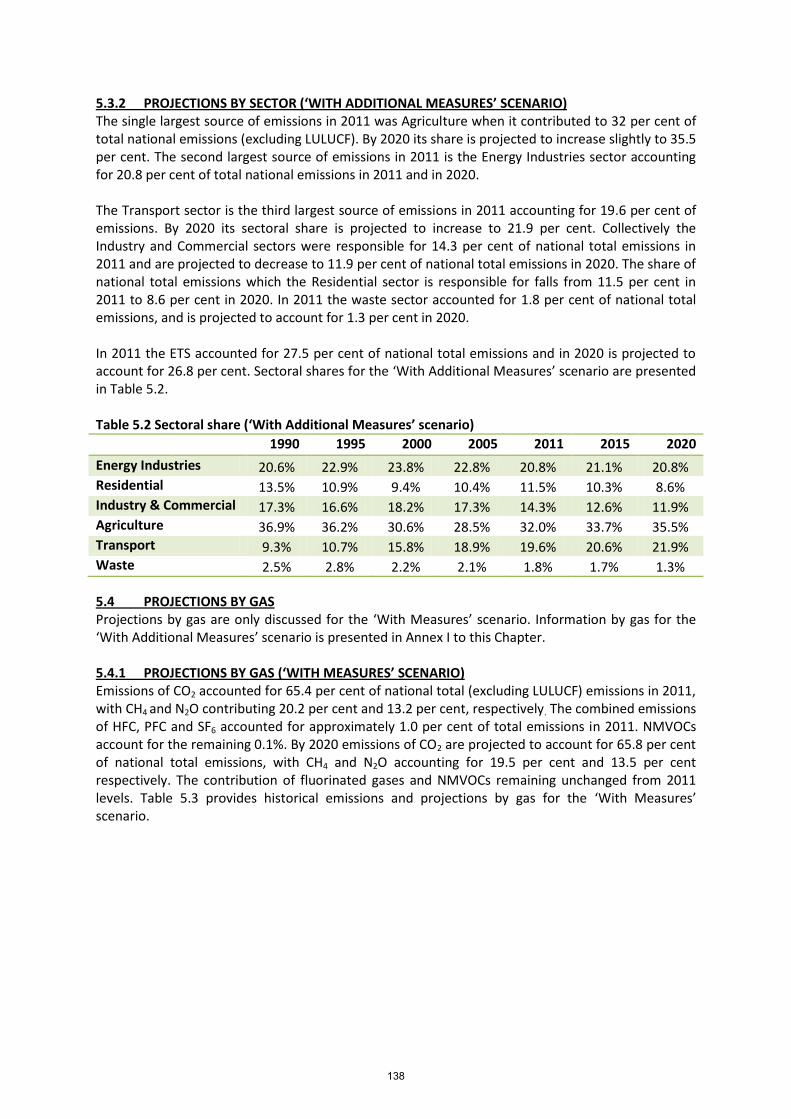
5.3.2 PROJECTIONS BY SECTOR (‘WITH ADDITIONAL MEASURES’ SCENARIO) The single largest source of emissions in 2011 was Agriculture when it contributed to 32 per cent of total national emissions (excluding LULUCF). By 2020 its share is projected to increase slightly to 35.5 per cent. The second largest source of emissions in 2011 is the Energy Industries sector accounting for 20.8 per cent of total national emissions in 2011 and in 2020. The Transport sector is the third largest source of emissions in 2011 accounting for 19.6 per cent of emissions. By 2020 its sectoral share is projected to increase to 21.9 per cent. Collectively the Industry and Commercial sectors were responsible for 14.3 per cent of national total emissions in 2011 and are projected to decrease to 11.9 per cent of national total emissions in 2020. The share of national total emissions which the Residential sector is responsible for falls from 11.5 per cent in 2011 to 8.6 per cent in 2020. In 2011 the waste sector accounted for 1.8 per cent of national total emissions, and is projected to account for 1.3 per cent in 2020. In 2011 the ETS accounted for 27.5 per cent of national total emissions and in 2020 is projected to account for 26.8 per cent. Sectoral shares for the ‘With Additional Measures’ scenario are presented in Table 5.2. Table 5.2 Sectoral share (‘With Additional Measures’ scenario)
1990 1995 2000 2005 2011 2015 2020
Energy Industries 20.6% 22.9% 23.8% 22.8% 20.8% 21.1% 20.8% Residential 13.5% 10.9% 9.4% 10.4% 11.5% 10.3% 8.6% Industry & Commercial 17.3% 16.6% 18.2% 17.3% 14.3% 12.6% 11.9% Agriculture 36.9% 36.2% 30.6% 28.5% 32.0% 33.7% 35.5% Transport 9.3% 10.7% 15.8% 18.9% 19.6% 20.6% 21.9% Waste 2.5% 2.8% 2.2% 2.1% 1.8% 1.7% 1.3%
5.4 PROJECTIONS BY GAS Projections by gas are only discussed for the ‘With Measures’ scenario. Information by gas for the ‘With Additional Measures’ scenario is presented in Annex I to this Chapter. 5.4.1 PROJECTIONS BY GAS (‘WITH MEASURES’ SCENARIO) Emissions of CO2 accounted for 65.4 per cent of national total (excluding LULUCF) emissions in 2011, with CH4 and N2O contributing 20.2 per cent and 13.2 per cent, respectively. The combined emissions of HFC, PFC and SF6 accounted for approximately 1.0 per cent of total emissions in 2011. NMVOCs account for the remaining 0.1%. By 2020 emissions of CO2 are projected to account for 65.8 per cent of national total emissions, with CH4 and N2O accounting for 19.5 per cent and 13.5 per cent respectively. The contribution of fluorinated gases and NMVOCs remaining unchanged from 2011 levels. Table 5.3 provides historical emissions and projections by gas for the ‘With Measures’ scenario.
138

Table 5.3 Historical emissions and projections by gas for the ‘With Measures’ scenario (Gg CO2eq)
1990 1995 2000 2005 2011 2015 2020
Carbon Dioxide (CO2) 32344.0 35147.1 44610.2 47705.2 37592.0 39120.3 41410.3
Methane (CO2eq) 13674.1 13919.7 13412.2 12809.6 11628.8 11886.9 12241.7
Nitrous Oxide (CO2eq) 9112.0 9620.6 9482.0 8116.0 7619.1 8132.5 8508.4
NMVOCs (CO2eq) 80.0 85.4 79.0 74.1 72.5 73.5 75.4
F-gases (CO2eq) 36.9 212.9 619.6 745.8 600.1 626.8 681.3 In 2011 the largest source to CO2 emissions was Energy Industries accounting for 31.4 per cent. However by 2020 the largest contributor to CO2 emissions is Transport at 32.9 per cent (29.7 per cent in 2011). The second most significant contributor to greenhouse gas emissions in Ireland is CH4 accounting for 20.2 per cent of emissions in 2011 and 19.5 per cent of emissions in 2020. The main driver behind CH4 emissions in Ireland is CH4 emissions from cattle from enteric fermentation and manure management. The contribution of the agriculture sector to total CH4 emissions is projected to increase from 90.9 per cent in 2011 to 94.5 per cent in 2020. Emissions from the agriculture sector are projected to increase as a result of industry lead expansion plans72. Similar to emissions of CH4, the agriculture sector is the largest source of N2O emissions in Ireland reflecting the significant quantities of nitrogen from animal manures and synthetic fertilizers applied to agricultural soils. Nitrous oxide emissions accounted for 13.2 per cent of national total emissions in 2011 and are projected to account for 13.5 per cent in 2020. Emissions of the F-gases (HFCs, PFCs and SF6) were 600.1 Gg CO2 equivalent in 2011. F-gas emissions only account for approximately one per cent of the national total and are projected to increase to 681.3 Gg CO2 equivalent in 2020. Table 5.4 provides historical and projected emissions of F-gas and NMVOC emissions in the With Measures scenario.
Table 5.4 Historical emissions and projections of F-gases and NMVOCs in the ‘With Measures’ scenario (Gg CO2eq)
1990 1995 2000 2005 2011 2015 2020
HFCs (Gg CO2eq) 1.3 54.6 259.8 475.8 538.6 566.6 612.2
PFCs (Gg CO2eq) 0.1 75.4 305.4 168.3 13.2 14.5 16.9
SF6 (Gg CO2eq) 35.5 82.9 54.4 101.6 48.3 45.7 52.2
NMVOC (Gg CO2eq) 80.0 85.4 79.0 74.1 72.5 73.5 75.4
5.5 METHODOLOGICAL APPROACH SEAI publishes annual national energy forecasts showing future energy trends. These energy forecasts, most recently compiled in 201373, form the basis for almost all energy-related emission projections discussed. SEAI compile a number of energy forecasts scenarios, two of which are used in national emission projections to 2020: Baseline and NEEAP74/NREAP75.
72
http://www.agriculture.gov.ie/agri-foodindustry/foodharvest2020/ 73
http://www.seai.ie/Publications/Statistics_Publications/Energy_Forecasts_for_Ireland/ 74
http://www.dcenr.gov.ie/NR/rdonlyres/FC3D76AF-7FF1-483F-81CD-52DCB0C73097/0/NEEAP_full_launch_report.pdf and
139

The Baseline energy forecast projects forward Ireland’s energy demand, incorporating the expected impacts of policies and measures that were in place (legislatively provided for) by the end of 2011. It represents a hypothetical future scenario in which no further policy actions or measures have been taken. It excludes policies that are committed to but which do not yet have measures in place to deliver them.
The NEEAP/NREAP energy forecast presents an alternative view of future energy demand that accounts for both the NREAP, submitted to the EU Commission in July 2010, and the NEEAP. Therefore this forecast includes existing and planned policies and measures.
The Baseline energy forecast underpins the ‘With Measures’ emission projection and the NEEAP/NREAP energy forecast underpins the ‘With Additional Measures’ projection. The Baseline energy forecast compiled by SEAI provides future energy demand to 2030. The NEEAP/NREAP energy forecast provides future energy demand to 2020 accounting for Irelands NEEAP and NREAP. The Baseline energy forecast is produced by the ESRI using the HERMES model to project domestic economic activity which in turn depends on international factors captured in the NiGEM76 model. The forecast includes sectoral output figures and other relevant key variables such as price, economic growth, population, household growth and occupancy. To produce the finalised Baseline energy forecast, SEAI amends the output of the HERMES energy demand model to take account of the expected impact of energy efficiency measures put in place before the end of 2011 but which are considered too recent to be detectable in any time-series analysis. The NEEAP/NREAP energy forecast builds on the Baseline forecast with adjustments made to account for additional policies and measures outlined in the NEEAP and NREAP. A detailed description is presented in a number of SEAI reports77 and a detailed description of the HERMES model and associated energy demand model is provided in an ESRI Working Paper78. The energy forecasts that underpin the energy-related emissions projections are based on a set of macroeconomic projections produced by the ESRI in Autumn 2012. This set of macroeconomic projections is a medium-term scenario which captures known information about the world, the EU and Irish economies at the beginning of September 2012. It assumes that the EU returns to a more normal growth profile over the coming decade and that the Irish economy will follow in a broadly consistent manner. Table 5.5 shows the key parameters underlying the macroeconomic outlook and therefore the ‘With Measures’ and ‘With Additional Measures’ emission projections scenarios. The forecasts are based on international fuel import oil prices and ETS carbon prices as circulated by the EU Commission in October 2012. Carbon dioxide price assumptions in the non-ETS sectors are based in the medium term on the Finance Act 201079 which saw the introduction of a carbon tax of €15 per tonne CO2 (subsequently changed to €20 per tonne in 2012). In the longer term the carbon price is assumed to follow the EU ETS carbon price.
http://www.seai.ie/Publications/Energy_Efficiency_Policy_Publications/National_Energy_Efficiency_Action_plan.pdf 75
http://www.dcenr.gov.ie/NR/rdonlyres/03DBA6CF-AD04-4ED3-B443-B9F63DF7FC07/0/IrelandNREAPv11Oct2010.pdf 76
National Institute Global Econometric Model 77
http://www.seai.ie/Publications/Statistics_Publications/Energy_Forecasts_for_Ireland/ 78
ESRI Working Paper 146: http://www.esri.ie/__uuid/5c3b7efe-a8a2-4ac7-936b-8a3c550bc4b2/view/view/index.xml?id=74 79
http://www.irishstatutebook.ie/pdf/2010/en.act.2010.0005.pdf
140
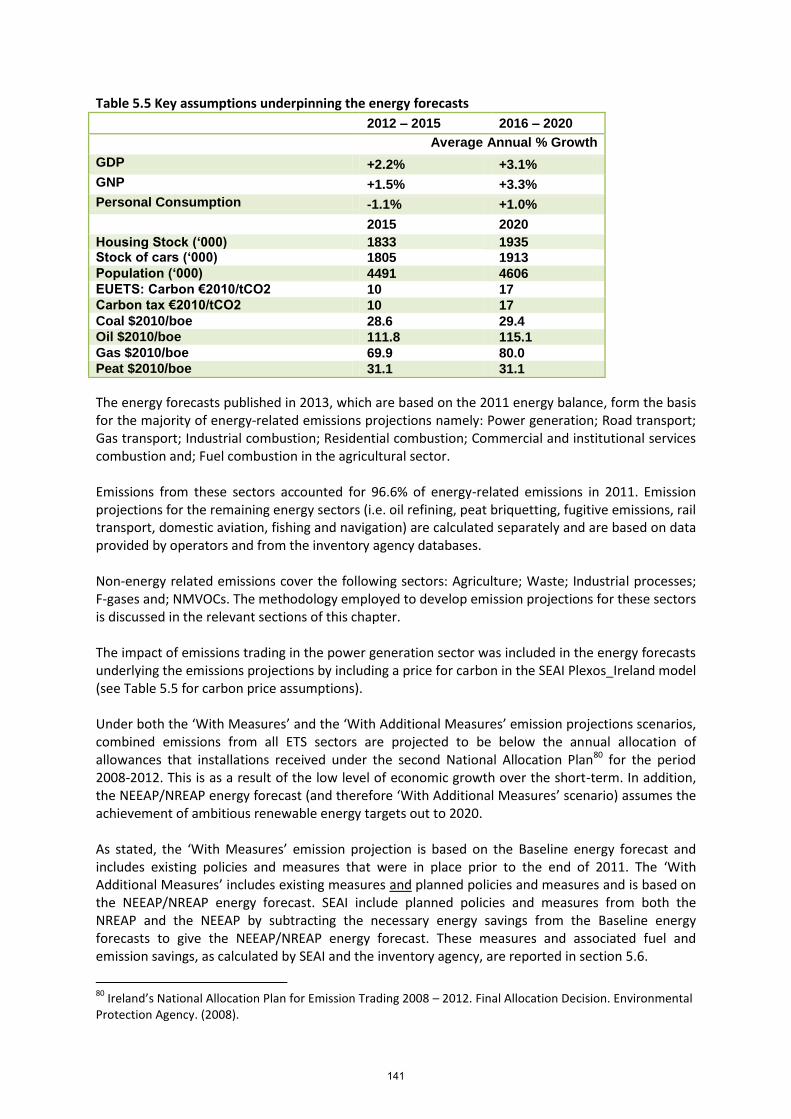
Table 5.5 Key assumptions underpinning the energy forecasts 2012 – 2015 2016 – 2020
Average Annual % Growth
GDP +2.2% +3.1%
GNP +1.5% +3.3%
Personal Consumption -1.1% +1.0%
2015 2020
Housing Stock (‘000) 1833 1935 Stock of cars (‘000) 1805 1913
Population (‘000) 4491 4606
EUETS: Carbon €2010/tCO2 10 17
Carbon tax €2010/tCO2 10 17
Coal $2010/boe 28.6 29.4 Oil $2010/boe 111.8 115.1
Gas $2010/boe 69.9 80.0 Peat $2010/boe 31.1 31.1
The energy forecasts published in 2013, which are based on the 2011 energy balance, form the basis for the majority of energy-related emissions projections namely: Power generation; Road transport; Gas transport; Industrial combustion; Residential combustion; Commercial and institutional services combustion and; Fuel combustion in the agricultural sector. Emissions from these sectors accounted for 96.6% of energy-related emissions in 2011. Emission projections for the remaining energy sectors (i.e. oil refining, peat briquetting, fugitive emissions, rail transport, domestic aviation, fishing and navigation) are calculated separately and are based on data provided by operators and from the inventory agency databases. Non-energy related emissions cover the following sectors: Agriculture; Waste; Industrial processes; F-gases and; NMVOCs. The methodology employed to develop emission projections for these sectors is discussed in the relevant sections of this chapter. The impact of emissions trading in the power generation sector was included in the energy forecasts underlying the emissions projections by including a price for carbon in the SEAI Plexos_Ireland model (see Table 5.5 for carbon price assumptions). Under both the ‘With Measures’ and the ‘With Additional Measures’ emission projections scenarios, combined emissions from all ETS sectors are projected to be below the annual allocation of allowances that installations received under the second National Allocation Plan80 for the period 2008-2012. This is as a result of the low level of economic growth over the short-term. In addition, the NEEAP/NREAP energy forecast (and therefore ‘With Additional Measures’ scenario) assumes the achievement of ambitious renewable energy targets out to 2020. As stated, the ‘With Measures’ emission projection is based on the Baseline energy forecast and includes existing policies and measures that were in place prior to the end of 2011. The ‘With Additional Measures’ includes existing measures and planned policies and measures and is based on the NEEAP/NREAP energy forecast. SEAI include planned policies and measures from both the NREAP and the NEEAP by subtracting the necessary energy savings from the Baseline energy forecasts to give the NEEAP/NREAP energy forecast. These measures and associated fuel and emission savings, as calculated by SEAI and the inventory agency, are reported in section 5.6.
80
Ireland’s National Allocation Plan for Emission Trading 2008 – 2012. Final Allocation Decision. Environmental Protection Agency. (2008).
141

5.6 SECTORAL ANALYSIS AND TOTAL EFFECTS OF POLICIES AND MEASURES 5.6.1 ENERGY INDUSTRIES Since 1990 the share of high carbon content fuels such as coal and peat used for electricity generation in Public Electricity and Heat Production has reduced and been replaced with relatively low carbon natural gas or zero carbon renewables, predominately wind and hydro. This fuel switching has been reinforced by a substantial improvement in generation efficiency due to the commissioning of new CCGT plant. This has resulted in a decoupling of CO2 emissions from electricity generation. In the ‘With Measures’ scenario renewable electricity contributes 5.1% of the overall 16% Renewable Energy Share (RES) in 2020, due to a 46.1% increase in renewable fuels for electricity generation over the period 2011 to 2020. The renewable energy generated shows Ireland reaching 24% of electricity consumption from renewable energy by 2020. In the ‘With Additional Measures’ scenario it is assumed that for 2020 there is a 40% share of renewable energy in electricity generation as a result of an expansion of biomass electricity generating capacity through the implementation of biomass capacities published in the NREAP, construction of two waste to energy units, and the continued development of landfill gas electricity generation and small-scale biomass CHP. Additionally there is construction of at least 25 MW of wave energy and the rollout of transmission network upgrade plans. The largest contribution is from wind which at 760 ktoe in 2020 is 47.6% above that proposed in the ‘With Measures’ Scenario. The impact of existing and planned policies and measures that will impact the Public Electricity and Heat Production sector are listed in Table 5.6 with the anticipated emissions savings. Table 5.6 Emissions savings due to policies and measures included in the ‘With Measures’ and ‘With Additional Measures’ scenarios for Public Electricity and Heat Production sector Policy and Measure 2010 2015 2020
With Measures (Gg CO2eq)
Electricity Generation efficiency improvements 404.5 684.5 966.1 23% renewables by 2020 97.9 1,510.9 1,487.3 Domestic Lighting 39.1 136.8 234.5 Total 541.5 2,332.2 2,687.9
With Additional Measures (Gg CO2eq)
Reduced electricity demand from energy efficiency measures
225.6 451.1
40% renewables by 2020 41.4 785.2 Total 267.0 1,236.3
Projections for oil refining and solid fuel manufacture are based on data provided by the relevant operators. Under the ‘With Measures’ scenario, total energy industries emissions are projected to increase by 11% over the period 2011 – 2020 to 13 Mt of CO2 equivalent. The increase in emissions is caused by a projected increase in the use of coal and reduction in the use of gas as a fuel for electricity generation. This is as a result of the current and projected low coal price (relative to gas). Under the ‘With Additional Measures’ scenario, total energy industries emissions are projected to increase by 1% over the period 2011 – 2020 to 12 Mt of CO2 equivalent taking into account the additional polices and measures identified in Table 5.6.
142
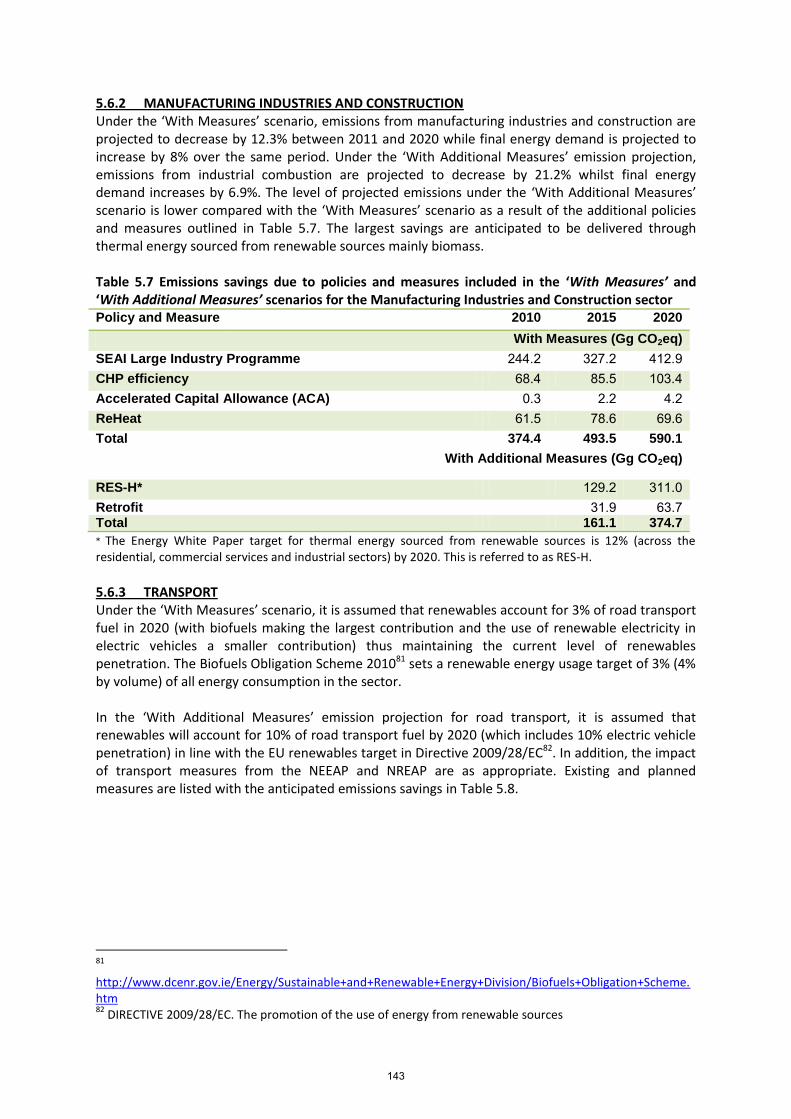
5.6.2 MANUFACTURING INDUSTRIES AND CONSTRUCTION Under the ‘With Measures’ scenario, emissions from manufacturing industries and construction are projected to decrease by 12.3% between 2011 and 2020 while final energy demand is projected to increase by 8% over the same period. Under the ‘With Additional Measures’ emission projection, emissions from industrial combustion are projected to decrease by 21.2% whilst final energy demand increases by 6.9%. The level of projected emissions under the ‘With Additional Measures’ scenario is lower compared with the ‘With Measures’ scenario as a result of the additional policies and measures outlined in Table 5.7. The largest savings are anticipated to be delivered through thermal energy sourced from renewable sources mainly biomass. Table 5.7 Emissions savings due to policies and measures included in the ‘With Measures’ and ‘With Additional Measures’ scenarios for the Manufacturing Industries and Construction sector Policy and Measure 2010 2015 2020
With Measures (Gg CO2eq)
SEAI Large Industry Programme 244.2 327.2 412.9 CHP efficiency 68.4 85.5 103.4 Accelerated Capital Allowance (ACA) 0.3 2.2 4.2 ReHeat 61.5 78.6 69.6 Total 374.4 493.5 590.1
With Additional Measures (Gg CO2eq)
RES-H* 129.2 311.0 Retrofit 31.9 63.7 Total 161.1 374.7
* The Energy White Paper target for thermal energy sourced from renewable sources is 12% (across the residential, commercial services and industrial sectors) by 2020. This is referred to as RES-H.
5.6.3 TRANSPORT Under the ‘With Measures’ scenario, it is assumed that renewables account for 3% of road transport fuel in 2020 (with biofuels making the largest contribution and the use of renewable electricity in electric vehicles a smaller contribution) thus maintaining the current level of renewables penetration. The Biofuels Obligation Scheme 201081 sets a renewable energy usage target of 3% (4% by volume) of all energy consumption in the sector. In the ‘With Additional Measures’ emission projection for road transport, it is assumed that renewables will account for 10% of road transport fuel by 2020 (which includes 10% electric vehicle penetration) in line with the EU renewables target in Directive 2009/28/EC82. In addition, the impact of transport measures from the NEEAP and NREAP are as appropriate. Existing and planned measures are listed with the anticipated emissions savings in Table 5.8.
81
http://www.dcenr.gov.ie/Energy/Sustainable+and+Renewable+Energy+Division/Biofuels+Obligation+Scheme.htm 82
DIRECTIVE 2009/28/EC. The promotion of the use of energy from renewable sources
143
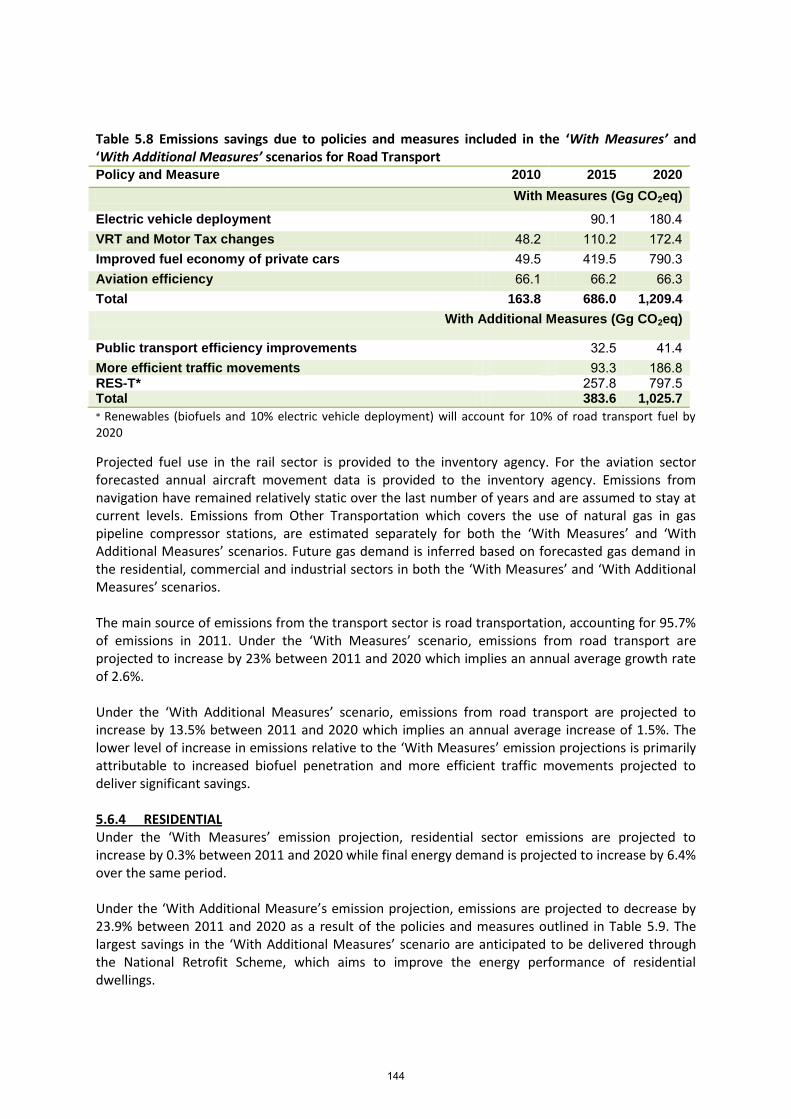
Table 5.8 Emissions savings due to policies and measures included in the ‘With Measures’ and ‘With Additional Measures’ scenarios for Road Transport Policy and Measure 2010 2015 2020
With Measures (Gg CO2eq)
Electric vehicle deployment 90.1 180.4 VRT and Motor Tax changes 48.2 110.2 172.4 Improved fuel economy of private cars 49.5 419.5 790.3 Aviation efficiency 66.1 66.2 66.3 Total 163.8 686.0 1,209.4
With Additional Measures (Gg CO2eq)
Public transport efficiency improvements 32.5 41.4 More efficient traffic movements 93.3 186.8 RES-T* 257.8 797.5 Total 383.6 1,025.7
* Renewables (biofuels and 10% electric vehicle deployment) will account for 10% of road transport fuel by 2020
Projected fuel use in the rail sector is provided to the inventory agency. For the aviation sector forecasted annual aircraft movement data is provided to the inventory agency. Emissions from navigation have remained relatively static over the last number of years and are assumed to stay at current levels. Emissions from Other Transportation which covers the use of natural gas in gas pipeline compressor stations, are estimated separately for both the ‘With Measures’ and ‘With Additional Measures’ scenarios. Future gas demand is inferred based on forecasted gas demand in the residential, commercial and industrial sectors in both the ‘With Measures’ and ‘With Additional Measures’ scenarios. The main source of emissions from the transport sector is road transportation, accounting for 95.7% of emissions in 2011. Under the ‘With Measures’ scenario, emissions from road transport are projected to increase by 23% between 2011 and 2020 which implies an annual average growth rate of 2.6%. Under the ‘With Additional Measures’ scenario, emissions from road transport are projected to increase by 13.5% between 2011 and 2020 which implies an annual average increase of 1.5%. The lower level of increase in emissions relative to the ‘With Measures’ emission projections is primarily attributable to increased biofuel penetration and more efficient traffic movements projected to deliver significant savings. 5.6.4 RESIDENTIAL Under the ‘With Measures’ emission projection, residential sector emissions are projected to increase by 0.3% between 2011 and 2020 while final energy demand is projected to increase by 6.4% over the same period. Under the ‘With Additional Measure’s emission projection, emissions are projected to decrease by 23.9% between 2011 and 2020 as a result of the policies and measures outlined in Table 5.9. The largest savings in the ‘With Additional Measures’ scenario are anticipated to be delivered through the National Retrofit Scheme, which aims to improve the energy performance of residential dwellings.
144

Table 5.9 Emissions savings due to policies and measures included in the ‘With Measures’ and ‘With Additional Measures’ scenarios for the Residential sector Policy and Measure 2010 2015 2020
With Measures (Gg CO2eq)
2002 Building Regulations 304.6 303.7 303.7 2008 Building Regulations 24.7 173.5 322.4
Efficient Boiler Standard 47.6 166.3 285.1 Greener Homes Scheme 25.0 24.9 24.9 Warmer Homes Scheme 31.2 31.2 31.2 Home Energy Savings Scheme 84.5 84.3 84.3 Total 517.6 783.9 1,051.6
With Additional Measures (Gg CO2eq)
2011 Buidling regulations 67.8 135.6 Nearly zero energy dwellings 21.5 43.0 Retrofit scheme 692.2 1,384.7 RES-H* 19.5 33.1 Total 801.0 1,596.4
* The Energy White Paper target for thermal energy sourced from renewable sources is 12% (across the residential, commercial services and industrial sectors) by 2020. This is referred to as RES-H.
5.6.5 COMMERICIAL/INSTITUTIONAL SERVICES Under the ‘With Measures’ scenario, emissions from the commercial/institutional services are projected to decrease by 19.2% between 2011 and 2020 while final energy demand is projected to decrease by 4.4% over the same period. Under the ‘With Additional Measures’ emission projection, emissions are projected to decrease by 52.2% as a result of the policies and measures outlined in Table 5.10. Significant savings are projected to be delivered through the public sector energy efficiency target, the public and commercial sector components of the National Retrofit Scheme, the 2012 Building Regulations and through the penetration of renewable energy in thermal heat production.
145

Table 5.10 Emissions savings due to policies and measures included in the ‘With Measures’ and ‘With Additional Measures’ scenarios for the Commercial/Institutional sector Policy and Measure 2010 2015 2020
With Measures (Gg CO2eq)
2005 Building Regulations 44.9 58.5 72.2 SEAI Small Business Support 22.3 48.3 74.3 SEEP and EERF 37.4 37.3 37.3 Accelerated Capital Allowance (ACA) 0.6 4.1 7.6 CHP efficiency 28.9 36.5 44.1 Public Sector Building Demonstration Programme 19.8 19.7 19.7 ReHeat 26.0 27.8 29.7 Total 179.9 232.2 284.9
With Additional Measures (Gg CO2eq)
2012 Building regulations 66.3 132.5 Retrofit 95.4 190.8 Public Sector energy efficiency target 88.8 177.5 RES-H* 49.5 82.5 Total 300.0 583.3
* The Energy White Paper target for thermal energy sourced from renewable sources is 12% (across the residential, commercial services and industrial sectors) by 2020. This is referred to as RES-H.
5.6.6 INDUSTRIAL PROCESSES Process emission projections were developed for the cement and lime industries. For the cement industry, it was assumed that clinker output stabilizes in 2012, and grows by 5% in 2013. Previously a decrease in volume output in the construction sector for 2012 and 2013 was forecast, however it is now assumed that the export of cement products counteracts this decline. After 2013, clinker production is assumed to grow back to 1999/2000 levels by 2020. There are currently three lime production sites in Ireland and each installation is treated separately based on known information about each of the three sites. Process emissions are projected to increase by 42% from 1.2 Mt of CO2 equivalent in 2011 to 1.7 Mt of CO2 equivalent in 2020 under both the ‘With Measures’ scenario, and ‘With Additional Measures’ scenarios. Fluorinated gases accounted for 1% of Ireland’s total national greenhouse gas emissions in 2011. The only relevant source of F-gas emissions in Ireland is production, use and disposal of equipment containing these fluids (e.g. refrigerators, mobile air conditioning systems and electrical switch-gear). Projections were developed for three fluorinated gases: HFC, PFC and SF6. In 2011, HFCs accounted for 89.8% of total F-gas emissions with the majority of these emissions estimated to come from stationary refrigeration and air conditioning systems in vehicles. PFCs, from semi-conductor manufacturing, accounted for 2.2% of total F-gas emissions in 2011 while SF6 accounted for 8% with the majority of emissions coming from semi-conductor manufacturing and electrical equipment. In the ‘With Measures’ and ‘With Additional Measures’ emission projection, the impact of Directive 2006/40/EC83 relating to emissions from air-conditioning systems in motor vehicles is assumed implicit in emission estimates as a result of SI No. 127 of 200984 coming into effect in April 2009. The
83
Directive 2006/40/EC. Relating to emissions from air-conditioning systems in motor vehicles and amending Council Directive 70/15/EEC 84
Statutory Instruments. S.I. No 127. European Communities (Motor Vehicles Type Approval) Regulations 2009
146
savings associated with the impact of Directive 2006/40/EC are included in the ‘With Measures’ and ‘With Additional Measures’ scenarios. It is estimated that there will be a saving of 12.1 Gg CO2 equivalent in 2015 and 73.5 Gg CO2 equivalent in 2020 from Directive 2006/40/EC. Under the ‘With Measures’ and ‘With Additional Measures’ emission projections, F-gas emissions are projected to increase by 13.5% between 2010 and 2020. 5.6.7 SOLVENTS AND OTHER PRODUCT USE With respect to emissions from Solvents and Other Product Use, clear trends are evident in per capita emissions from historical data. In estimating future emissions from this diverse sector into the future, per capita emission rates are held constant at 2011 levels for each projected year. Therefore emissions from solvent use are driven by population growth. Only one scenario was developed and emissions are projected to increase by 4% between 2011 and 2020.
5.6.8 AGRICULTURE Emissions projections for CH4 and N2O were developed for the agricultural sector. The agricultural activities of particular importance in Ireland are: (i) enteric fermentation (ii) manure management and (iii) agricultural soils. The methodology used to develop emissions projections for both CH4 and N2O are consistent with those employed in compiling the national greenhouse gas inventory. The key sources of CH4 emissions in the agricultural sector are enteric fermentation and manure management. The key sources of N2O emissions are manure management and agricultural soils. Estimates of historical N2O emissions from these sources are determined using a Tier 1 or default approach in the inventory. The same methodology is used in developing emission projections. Only one scenario was developed for agricultural emission projections. The projected activity data for agricultural emission projections were produced by the FAPRI-Ireland partnership85 and provided to the inventory agency. The FAPRI-Ireland model is linked to the FAPRI world modelling system and so takes account of and contributes to, the projections for prices obtained and quantities traded on the world markets. The activity data assumes that there is an expansion in the value of Irish agriculture over the period to 2020 to meet the targets set out in “Food Harvest 2020” published by the Department of Agriculture, Fisheries and Food in 2010. The main targets set out in this document are as follows: • Increasing the value of primary output in the agriculture, fisheries and forestry sector by €1.5
billion by 2020. This represents a 33% increase compared to the 2007-2009 average. • Increasing the value-added in the agri-food, fisheries and wood products sector by €3 billion
by 2020. This represents a 40% increase compared to 2008. • Achieving an export target of €12 billion for the sector by 2020. This represents a 42% increase
compared to the 2007-2009 average. Total emissions from the agricultural sector are projected to increase by 12% between 2011 and 2020 as a result of the targets set out in Food Harvest 2020. This is predominantly driven by a projected increase in dairy cow numbers of 19.1% between 2015 and 2020 following the abolition of milk quotas in 2015, a projected increase in the sheep population of one third between 2011 and 2020 and a projected increase in the pig population of 24.2% between 2011 and 2020. Fertilizer nitrogen use is projected to increase by approximately 16% by 2020.
5.6.9 WASTE Emission projections for the waste sector are developed for CO2, CH4 and N2O. Solid waste disposal to landfill is currently the main source of emissions from the waste sector. Methane emissions arise
85
The research partners are Teagasc – The Irish Agriculture and Food Development Authority, and five Irish Universities, namely, NUI Cork, NUI Dublin, NUI Galway, NUI Maynooth and Trinity College Dublin
147
from (i) solid waste disposal in landfill sites and (ii) wastewater and sludge treatment, whilst N2O emissions also arise from the production of human sewage. In addition, CO2, CH4 and N2O emissions arise from the incineration of hazardous wastes (solvents) in the pharmaceutical industry and the mechanical and biological treatment of waste are also estimated. The emissions associated with the incineration of municipal solid waste for electricity generation (WtE) are included in emissions estimates for Public Electricity and Heat Production as discussed earlier. At present only one such plant is in operation in Ireland, however a further larger incinerator is planned. It is assumed that this plant comes into operation in 2015. In these emission projections it is assumed that Ireland meets its Landfill Directive (1999/31/EC)86 targets progressively in 2013 and 2016 as it has for 2010. As only one projected outlook is undertaken for the waste sector, both ‘With Measures’ scenario and the ‘With Additional Measures’ scenario are the same. Emissions are projected to decrease by 28.2% between 2011 and 2020 to 608.8 Gg CO2 equivalent.
5.7 MEMO ITEMS Projected emissions from international maritime transport and international aviation are estimated. Emissions from international aviation are estimated based on forecasted landing and takeoff forecasts supplied to the inventory agency. Emissions from international maritime transport are assumed to equal 2011 levels for each projected year. 5.8 FORESTRY Projections of sequestration from sinks relate only to sequestration activities under Article 3.3 of the Kyoto Protocol. Based on the national plantation rate to date and a projected afforestation rate of 8,000 hectares per annum up to 2020, the projected net estimate for carbon sequestration over the Kyoto commitment period is 3.31 Mt CO2 per year and sequestration in 2020 is expected to be 4.64 Mt CO2. The estimates have been provided by CoFoRD which is based in DAFM. The data provided in this section is officially submitted data from March 2013. Based on new projections from DAFM derived using latest roundwood harvest forecast data, the projected net estimate for carbon sequestration over the second Kyoto commitment period is 4.96 Mt CO2 per year and sequestration in 2020 is expected to be 5.19 Mt CO2. The data submitted for forest sink projections in March 2013 for the second commitment period were on average 11% lower, when compared to the new projections. This is primarily due to the inclusion of HWP emission / reductions in the projected time series as required under the Annex to Decision UNFCCC/2/CMP.7. 5.9 SENSITIVITY ANALYSIS In conjunction with SEAI, ESRI undertook a sensitivity analysis of SEAI’s Baseline energy forecast (which underpins the ‘With Measures’ emission projection). Three scenarios were investigated by ESRI using the HERMES and NiGem models, namely the effect of increased economic growth, the effect of a high oil price and the effect of a high carbon price on energy demand to 2020. The scenarios are (i) Increased Economic Growth (ii) High Oil Price (iii) High Carbon Price Under the Increased Economic Growth scenario, the economy grows at a faster rate than that provided in Table 2. Value added which is one of the main drivers of fuel consumption increases from an annual change value of 2.31% for the period 2011-2015 to 2.59% and for the period 2016-2020 from 3.3% to 4.05%.
86
Council Directive 1999/31/EC on the landfill of waste
148

Under the High Oil Price scenario, it is assumed that there will be a $25/boe increase in real oil prices in 2015 and a $50/boe increase in real oil price by 2020. Under the High Carbon Price scenario an increase in the Carbon Tax of €20 per tonne CO2 is applied87 in the non-ETS sectors. Table 5.11 Comparison of the sensitivity analysis scenarios with the ‘With Measures’ scenario for 2015 and 2020.
2015
Increased Economic Growth + 0.4%
High Oil Price -1.8%
High Carbon price -1.0%
2020
Increased Economic Growth + 0.7%
High Oil Price + 1.6%
High Carbon price -1.0%
Under the Increased Economic Growth scenario, emissions are shown to increase by 0.4% in 2015 and 0.7% in 2020. Overall the economy grows but not by a large amount. The increase in emissions is small, as a result of limited changes in energy consumption variables. Under the High Oil Price scenario emissions in 2020 are projected to be 1.6% higher compared with the ‘With Measures’ scenario. However emissions are projected to be 1.8% lower in 2015. The largest effect under this scenario can be seen in the power generation sector where there is a significant reduction in the use of gas for electricity generation (as gas price tracks oil price), with a subsequent increase in coal and renewable fuels particularly wind which offsets increased emissions from the combustion of coal in 2015. The changes in the fuel matrix seen up to 2015 stabilise out to 2020. However, for 2020 the inclusion of peat powered generation in the merit order at an increased level (34% above the ‘With Measures’ scenario) results in emissions 1.6% higher in 2020 than in the ‘With Measures’ scenario. Under the High Carbon Price scenario emissions in 2015 and 2020 are projected to be 1% higher than in the ‘With Measures’ scenario. The carbon tax is only applied to fuels combusted in the non-ETS sector therefore resultant power generation emissions do not change under this scenario. An increased carbon tax has a direct effect on the price of energy in Ireland. Under this scenario it is projected that the manufacturing industries and construction and residential sectors see an increase in the price of energy inputs of 17% and 3.3%, respectively. Resultant emissions in the manufacturing industries and construction and residential sectors are 1% and 4% lower in 2020 under this scenario than the ‘With Measures’ scenario.
5.10 SUPPLEMENTARITY Use of flexibilities of the Kyoto Protocol should be supplemental to domestic actions on climate change. The following table aggregates the total impact of all policies and measures in the different sectors across the two scenarios modelled. It is worth reiterating that some sectors are only modelled using one scenario so implicitly there are other reductions not captured in this table (Agricultural emissions are particularly relevant in this regard). The scale of these reductions should be compared against the quantity of flexible mechanisms actually cancelled by Ireland in due course as distinct from the numbers of units actually in hand, and as such a precise assessment of this obligation under the Protocol is neither possible (nor adequately defined) at this time. 87 Follows the approach of Conefrey et al (2013) DOI:10.1080/09640568.2012.709467
149

Table 5.12 Aggregate effect of Policies and Measures by Scenario 2015 2020
(Gg
CO2eq)
(Gg
CO2eq)
With Measures Projection 4,650.2 6,005.3
With Additional Measures Projection 1,920.6 4,835.5
Sub-total 6,570.8 10,840.7
Article 3.3 Forestry 3,706.8 4,638.6
Aggregate including Art 3.3 10,277.6 11,209.4
An estimate of the potential use of the flexible mechanisms of the Kyoto Protocol can be extracted by reference to the distance to target in relation to the Effort Sharing Decision under the two different scenarios. Whilst the Effort Sharing Decision has individual and declining annual targets one can look at the average value and the value in the last year of the 2013-2020 period to assess the possible scale of requirements. Under the ‘With Measures’ Scenario the average distance to target is 3Mt CO2eq, and the distance to target in 2020 is 8.3Mt CO2eq. Under the ‘With Additional Measures’ Scenario the average distance to target is 0.9Mt CO2eq, and the distance to target in 2020 is 5Mt. On average the level of domestic effort in the period 2013-2020 should outweigh the need for the use of the flexible mechanisms. Whilst a similar exercise presents more difficulty when looking back towards the first commitment period of the Kyoto Protocol one can usefully assess the degree to which Ireland may need to use flexible mechanisms under a set of assumptions regarding the use of RMUs acquired through Article 3.3. That being that assuming all of those units are retired for compliance by Ireland after issuance that there would be no residual requirement to use any of the units in the national account for compliance. This is based on the provisional inventory data for 1990-2012 published in October by the EPA. A more definitive position on such assumptions and their implications will be possible at or around the true up period once all historical data is fixed. Installations whose emissions are regulated by the Emissions Trading Scheme retired 6.56 Mt CO2e of Kyoto Protocol flexible mechanisms in achieving compliance with that scheme during its second phase, 2008 -2012, representing approximately 7.5% of verified emissions by those installations over the period.
5.11 EMISSION PROJECTIONS TO 2030 The preceding sections of this chapter (sections 5.2 to 5.9) provide an in depth analysis of emission projections to 2020. Ireland produced emission projections to 2030 for the first time in 2013 based on energy forecasts supplied by the SEAI. These forecasts assumed that the level of effort required to meet Ireland’s NEEAP and NREAP under the ‘with additional measures’ scenario are maintained post 2020. As no long term policies and measures currently exist (post 2020), the effect of known policies and measures are only provided up to and including 2020. Energy forecasts and thus emissions projections post 2020 (out to 2030) are aimed at providing a point of discussion and are not based on any particular policy setting. Emission projections to 2030 are provided in Table 5.13.
150

Table 5.13 Projections by sector to 2030 for the ‘With Measures’ and ‘With Additional Measures’ scenarios (Gg CO2eq)
2020 2025 2030 2020 2025 2030
With Measures With Additional Measures Energy Industries 13,288.04 10,355.43 12,026.11 12,051.74 6,059.05 8,078.53 Residential 6,610.83 6,747.37 6,899.56 5,014.49 4,230.31 3,446.14 Industry & Commercial 7,857.06 8,077.24 8,160.28 6,895.05 6,729.07 6,578.51 Agriculture 20,598.85 20,705.35 20,865.53 20,598.85 20,705.35 20,865.53 Transport 13,729.48 15,795.05 18,498.12 12,688.64 14,640.44 16,592.23 Waste 748.59 660.86 608.83 748.59 660.86 608.83
151

ANNEX I to Chapter 5 Summary of Greenhouse Gas Emissions by sector for the ‘With Measures’ Scenario 1990-2020 (Gg CO2 equivalent) 1990 1995 2000 2005 2006 2007 2008 2009 2010 2011 2012 2013 2014 2015 2016 2017 2018 2019 2020 Energy 12,103.0 14,527.5 17,138.9 16,784.2 15,992.4 15,465.7 15,646.2 13,912.0 14,133.4 12,692.6 13,996.2 13,650.5 13,469.7 13,496.6 14,083.5 14,432.2 14,468.0 14,318.1 14,453.6 Residential 7,454.2 6,407.5 6,431.3 7,208.9 7,115.4 6,887.1 7,479.1 7,438.0 7,811.1 6,593.5 6,669.3 6,848.2 6,797.6 6,760.9 6,724.9 6,690.6 6,660.4 6,631.4 6,610.8 Industry & Commercial 9,551.1 9,774.3 12,419.7 12,001.5 11,729.4 12,069.6 11,485.5 9,045.1 8,984.8 8,202.2 8,079.1 7,925.5 7,777.7 7,730.2 7,758.7 7,772.7 7,790.1 7,800.5 7,857.1 Agriculture 19,634.1 20,314.4 19,970.2 18,857.5 18,723.7 18,284.3 18,147.0 17,932.5 17,996.9 17,693.2 17,707.4 18,659.9 18,403.3 18,456.0 18,666.5 18,916.1 19,140.8 19,300.5 19,433.3 Transport 5,121.4 6,304.4 10,770.4 13,110.4 13,892.1 14,481.8 13,744.5 12,524.6 11,602.8 11,290.4 11,745.4 12,179.8 12,247.6 12,308.6 12,516.0 12,785.0 13,105.9 13,371.4 13,729.5 Waste 1,383.3 1,657.7 1,473.3 1,489.9 1,574.3 1,219.4 1,107.7 974.6 965.7 1,042.6 1,091.4 1,057.1 1,022.7 982.6 947.5 914.7 885.0 855.9 748.6
Article 3.3 sinks -3204.4 -3395.0 -3415.2 -3566.1 -2983.0 -3241.2 -3449.4 -3706.8 -3959.6 -4130.9 -4350.7 -4438.1 -4638.6
Total (without Article 3.3 sinks)
55,247.2 58,985.8 68,203.7 69,452.4 69,027.4 68,407.8 67,610.0 61,826.8 61,494.6 57,514.5 59,288.7 60,321.0 59,718.6 59,734.8 60,697.2 61,511.3 62,050.2 62,277.9 62,832.8
Total (with Article 3.3 sinks)
55,247.2 58,985.8 68,203.7 69,452.4 69,027.4 68,407.8 64,405.6 58,431.8 58,079.4 53,948.4 56,305.7 57,079.8 56,269.2 56,028.0 56,737.6 57,380.4 57,699.6 57,839.8 58,194.2
Memo Items International Aviation 1080.9 1163.0 1829.3 2527.7 2910.9 3084.0 2867.5 2263.5 2338.7 2095.5 2257.7 2423.8 2475.1 2484.2 2493.3 2526.5 2589.9 2641.3 2695.6 International Maritime Transport
57.4 373.2 482.8 333.7 408.3 360.5 223.0 306.6 434.4 337.2 337.2 337.2 337.2 337.2 337.2 337.2 337.2 337.2 337.2
Summary of Greenhouse Gas Emissions by sector for the ‘With Additional Measures’ Scenario 1990-2020 (Gg CO2 equivalent) 1990 1995 2000 2005 2006 2007 2008 2009 2010 2011 2012 2013 2014 2015 2016 2017 2018 2019 2020 Energy 12,103.0 14,527.5 17,138.9 16,784.2 15,992.4 15,465.7 15,646.2 13,912.0 14,133.4 12,692.6 13,997.7 13,373.4 13,136.0 13,229.6 13,292.0 13,547.2 13,409.7 13,143.2 13,217.3 Residential
7,454.2
6,407.5 6,431.3 7,208.9 7,115.4 6,887.1 7,479.1 7,438.0 7,811.1 6,593.5 6,352.6 6,369.8 6,159.4 5,959.9 5,766.5 5,576.9 5,384.1 5,199.1 5,014.5 Industry & Commercial
9,551.1
9,774.3 12,419.7 12,001.5 11,729.4 12,069.6 11,485.5 9,045.1 8,984.8 8,202.2 7,954.4 7,683.3 7,422.1 7,268.7 7,189.7 7,103.8 7,020.6 6,936.7 6,895.0 Agriculture
19,634.1
20,314.4 19,970.2 18,857.5 18,723.7 18,284.3 18,147.0 17,932.5 17,996.9 17,693.2 17,707.4 18,659.9 18,403.3 18,456.0 18,666.5 18,916.1 19,140.8 19,300.5 19,433.3 Transport
5,121.4
6,304.4 10,770.4 13,110.4 13,892.1 14,481.8 13,744.5 12,524.6 11,602.8 11,290.4 11,711.7 12,021.7 11,975.5 11,917.4 12,000.7 12,144.5 12,335.2 12,470.1 12,688.6 Waste
1,383.3
1,657.7 1,473.3 1,489.9 1,574.3 1,219.4 1,107.7 974.6 965.7 1,042.6 1,091.4 1,057.1 1,022.7 982.6 947.5 914.7 885.0 855.9 748.6
Article 3.3 sinks -3204.4 -3395.0 -3415.2 -3566.1 -2983.0 -3241.2 -3449.4 -3706.8 -3959.6 -4130.9 -4350.7 -4438.1 -4638.6 Total (without Article 3.3 sinks) 55247.2 58985.8 68203.7 69452.4 69027.4 68407.8 67610.0 61826.8 61494.6 57514.5 58815.2 59165.3 58118.9 57814.2 57863.0 58203.3 58175.4 57905.5 57997.4
Total (with Article 3.3 sinks) 55247.2 58985.8 68203.7 69452.4 69027.4 68407.8 64405.6 58431.8 58079.4 53948.4 55832.1 55924.1 54669.5 54107.4 53903.4 54072.3 53824.7 53467.4 53358.7
Memo Items
International Aviation 1080.9 1163.0 1829.3 2527.7 2910.9 3084.0 2867.5 2263.5 2338.7 2095.5 2257.7 2423.8 2475.1 2484.2 2493.3 2526.5 2589.9 2641.3 2695.6 International Maritime Transport 57.4 373.2 482.8 333.7 408.3 360.5 223.0 306.6 434.4 337.2 337.2 337.2 337.2 337.2 337.2 337.2 337.2 337.2 337.2
152

Summary of Greenhouse Gas Emissions by gas for the ‘With Measures’ Scenario 1990-2020 (Gg CO2 equivalent) 1990 1995 2000 2005 2006 2007 2008 2009 2010 2011 2012 2013 2014 2015 2016 2017 2018 2019 2020 Carbon Dioxide 32344 35417.1 44610.2 47705.2 47323.4 47503.2 46944.3 41654.6 41270.0 37592.0 39355.0 39465.4 39127.9 39120.3 39873.6 40464.2 40810.0 40911.9 41410.3 Methane 651.1 662.8 638.7 610.0 613.5 588.5 582.3 568.1 557.0 553.8 567.1 583.7 572.1 566.0 567.8 573.7 579.9 584.1 582.9 Nitrous Oxide 29.4 31.0 30.6 26.2 25.8 25.0 24.6 24.3 25.2 24.6 23.7 26.3 25.9 26.2 26.4 26.8 27.1 27.3 27.4 NMVOC 80.0 85.4 79.0 74.1 75.1 75.7 74.3 71.9 71.7 72.5 72.7 73.0 73.3 73.5 73.8 74.2 74.5 75.0 75.4 F-gases 36.9 212.9 79.0 745.8 759.9 731.8 729.5 627.1 630.8 600.1 621.6 622.1 625.7 626.8 654.6 656.5 656.2 653.4 681.3
Carbon sinks -3204.4 -3395.0 -3415.2 -3566.1 -2983.0 -3241.2 -3449.4 -3706.8 -3959.6 -4130.9 -4350.7 -4438.1 -4638.6
Total (without carbon sinks) 55247.2 58985.8 68203.7 69452.4 69027.4 68407.8 67610.0 61826.8 61494.6 57514.5 59301.0 60577.5 59879.1 59839.9 60718.3 61541.3 62111.8 62366.1 62917.1
Total (with carbon sinks) 55247.2 58985.8 68203.7 69452.4 69027.4 68407.8 64405.6 58431.8 58079.4 53948.4 56318.0 57336.3 56429.6 56133.1 56758.7 57410.4 57761.1 57928.0 58278.4
Memo Items
International Aviation 1080.9 1163.0 1829.3 2527.7 2910.9 3084.0 2867.5 2263.5 2338.7 2095.5 2257.7 2423.8 2475.1 2484.2 2493.3 2526.5 2589.9 2641.3 2695.6 International Maritime Transport 57.4 373.2 482.8 333.7 408.3 360.5 223.0 306.6 434.4 337.2 337.2 337.2 337.2 337.2 337.2 337.2 337.2 337.2 337.2
Summary of Greenhouse Gas Emissions by gas for the ‘With Additional Measures’ Scenario 1990-2020 (Gg CO2 equivalent) 1990 1995 2000 2005 2006 2007 2008 2009 2010 2011 2012 2013 2014 2015 2016 2017 2018 2019 2020 Carbon Dioxide 32344 35417.1 44610.2 47705.2 47323.4 47503.2 46944.3 41654.6 41270.0 37592.0 38882.2 38310.1 37528.7 37199.1 37044.1 37161.3 36941.1 36546.0 36579.4 Methane 651.1 662.8 638.7 610.0 613.5 588.5 582.3 568.1 557.0 553.8 567.0 583.6 572.0 565.9 567.6 573.5 579.6 583.8 582.6 Nitrous Oxide 29.4 31.0 30.6 26.2 25.8 25.0 24.6 24.3 25.2 24.6 23.7 26.3 25.9 26.2 26.4 26.7 27.1 27.3 27.4 NMVOC 80.0 85.4 79.0 74.1 75.1 75.7 74.3 71.9 71.7 72.5 72.7 73.0 73.3 73.5 73.8 74.2 74.5 75.0 75.4 F-gases 36.9 212.9 79.0 745.8 759.9 731.8 729.5 627.1 630.8 600.1 618.4 618.5 621.7 622.2 649.4 650.7 649.6 645.9 672.9
Carbon sinks -3204.4 -3395.0 -3415.2 -3566.1 -2983.0 -3241.2 -3449.4 -3706.8 -3959.6 -4130.9 -4350.7 -4438.1 -4638.6
Total (without carbon sinks) 55247.2 58985.8 68203.7 69452.4 69027.4 68407.8 67610.0 61826.8 61494.6 57514.5 58815.2 59165.3 58118.9 57814.2 57863.0 58203.3 58175.4 57905.5 57997.4
Total (with carbon sinks) 55247.2 58985.8 68203.7 69452.4 69027.4 68407.8 64405.6 58431.8 58079.4 53948.4 55832.1 55924.1 54669.5 54107.4 53903.4 54072.3 53824.7 53467.4 53358.7
Memo Items
International Aviation 1080.9 1163.0 1829.3 2527.7 2910.9 3084.0 2867.5 2263.5 2338.7 2095.5 2257.7 2423.8 2475.1 2484.2 2493.3 2526.5 2589.9 2641.3 2695.6 International Maritime Transport 57.4 373.2 482.8 333.7 408.3 360.5 223.0 306.6 434.4 337.2 337.2 337.2 337.2 337.2 337.2 337.2 337.2 337.2 337.2
153

CHAPTER 6: ADAPTING TO CLIMATE CHANGE 6.1 Introduction
6.1.1 National Climate Change Adaptation Framework 6.1.2 Research Support
6.2 Adapting to climate change in Ireland – Expected Impacts 6.2.1 Introduction 6.2.2 Climate Change Impacts for Ireland 6.2.3 Dissemination and Capacity Building
6.3 Vulnerability assessment 6.3.1 Introduction 6.3.2 National vulnerability assessment 6.3.3 Future research support
6.4 Flood Risk 6.5 Integrated Coastal Zone Management 6.6 Ireland’s contribution to EU work on Adaptation 6.7 International cooperation on Adaptation
154
KEY DEVELOPMENTS
The NCCAF was published in 2012. The EU White Paper on Adaptation88 helped to guide our national approach. The governance structure provides for climate change adaptation to be addressed at both national and local level. Sectoral and local adaptation plans will form part of the comprehensive national response to the impacts of climate change.
The research and development of the knowledge base has also been further improved through the EPA’s CCRP. Key recent outputs include:
National Adaptive Capacity Assessment (2012); National Vulnerability Assessment (2013); Phase one of the ICIP completed.
It is envisaged that a general scheme for national climate change legislation will be introduced by Easter 2014 providing a basis for action on climate change. The legislation will take into account the views of stakeholders, the report of an Oireachtas (i.e. Parliamentary) Joint Committee and analysis by the NESC. It’s envisaged that sectoral plans required under this legislation will intertwine with sectoral adaptation plans required under the NCCAF.
6.1 INTRODUCTION Warming of the climate system is now unequivocal and observations indicate that global surface temperatures have increased by on average 0.85˚C since 1850 (IPCC, 2013). In order to reduce the long-term impacts of climate change, mitigation actions are being taken which aim to limit warming through the reduction of greenhouse gas emissions and by increasing the capacities of carbon sinks. However, even if actions to mitigate greenhouse gas emissions are successful, due to latencies in the response of the global climate system, many of the impacts of climate change are ‘locked-in’ for some decades to come and are expected to continue and intensify in the short to medium term (IPCC, 2013). Ireland’s climate is changing. This is consistent with regional and global trends. These changes are projected to continue and increase over the coming decades. Adaptation actions will be required to minimise the adverse impacts of these changes for the environment, the economy and society and to take advantage of opportunities that may arise. Ireland recognises the need for on-going climatic observations and modelling to understand future climate conditions. Such analysis will be used to further assess impacts, identify vulnerability and risk, and adaptive capacity. A suite of adaptation measures will be needed to address and cost the adverse impacts of climate change and to minimise, where possible, the associated risks. The provision of information on future climate conditions, potential impacts and adaptive responses is crucial to the development and implementation of adaptation actions and measures. This is an ongoing process involving analysis, information provision and dissemination, and the development of capacity. Such an approach must be underpinned by a system of governance which allows for horizontal and vertical coordination mechanisms. 88
http://eur-lex.europa.eu/LexUriServ/LexUriServ.do?uri=CELEX:52009DC0147:EN:NOT
155
6.1.1 NATIONAL CLIMATE CHANGE ADAPTATION FRAMEWORK The Framework is the first step in developing a comprehensive national policy position to address the anticipated impacts of climate change through a structured programme of action on adaptation. The NCCAF provides a strategic policy focus to ensure adaptation measures are taken across different sectors and levels of Government to reduce Ireland’s vulnerability to the negative impacts of climate change. The aim of the Framework is to ensure that an effective role is played by all stakeholders in putting in place an active and enduring adaptation policy regime. The first phase focused on identifying national vulnerability to climate change, based on potential impacts relative to current adaptive capacity. The National Adaptive Capacity Assessment (Desmond and Shine, 2012) found that sufficient high quality data and information already exists to begin the adaptation planning process. The development of phase one of the NCCAF was underpinned by a series of research findings in relation to observations and monitoring (Dwyer, 2012), modelling and projections (McElwain and Sweeney, 2007; McGrath et al., 2008; Desmond et al, 2009; Nolan et al, 2010, Gleeson et al. 2013), risk and vulnerability (Murphy, 2103; Donnelly et al, 2013; Coll and Sweeney, 2013) and adaptation responses (Sweeney et al, 2013; Falaleeva et al, 2013). The dissemination of adaptation information will be supported by the ICIP, with a view to informing all levels of adaptation decision making. The second phase involves the development and implementation of sectoral and local adaptation plans which will form part of the comprehensive national response to the impacts of climate change. It is envisaged that draft sectoral plans will be published by mid-2014 and, following approval, they should be reviewed at least every 5 years. SECTORAL PLANS A summary of actions to be undertaken is as follows:
Each relevant Government Department (or State Agency, where appropriate) will prepare adaptation plans for their sectors;
Draft sectoral plans, based on sectoral risk assessments, and following consultation with relevant stakeholders, are to be published by mid-2014 and adopted as quickly as possible thereafter;
In drawing up sectoral plans, three basic steps must be reflected;
A clear understanding of the consequences of a changing climate for each sector;
Actions to equip decision makers with skills and tools; and
The integration of adaptation into policy and administration at sectoral level in Ireland. The lead Departments and Agencies for Sectoral Adaptation Plans are outlined in the table below.
156

TABLE 6.1
SECTOR LEVEL LEAD DEPARTMENT OR AGENCY
Water DECLG
Emergency Planning DECLG
Marine DAFM
Agriculture DAFM
Forestry DAFM
Biodiversity DAHG
Heritage DAHG
Transport DTTAS
Energy DCENR
Communications DCENR
Flood Defence OPW
Health Department of Health
LOCAL PLANS A summary of actions to be undertaken is as follows:
In supporting local communities, local authorities will consider the issue of climate adaptation in the delivery of its services and infrastructure;
As local authorities review their City and County development plans, they will integrate climate change adaptation (as well as mitigation) considerations into their statutory plans;
Local authorities will aim to have the review process of their development plans underway by mid-2014 (if necessary through amendment and variation procedures) to include climate change adaptation, if this is not already adequately addressed. As part of this process, local authorities will continue to collect evidence, raise awareness and create the necessary relationships and actions needed to deliver purposeful adaptation measures;
Local adaptation strategies are required in order to develop and express a vision for a well-adapted local community that is resilient to the impacts of climate change, through:
determining an area’s vulnerability to climate risks;
identifying, prioritising and costing adaptation actions;
developing and implementing a comprehensive action plan; and
ensuring that climate change impacts and risks are embedded into all decision making. 6.1.2 RESEARCH SUPPORT Research is the primary source of information on climate change for Ireland. A large body of research has been undertaken by various agencies and sectors within Ireland with the specific objective of informing policy and decision making on mitigation of GHG emissions and options for adaptation to climate change. Progress under phase one of the NCCAF has been heavily dependent on scientific data and outputs provided primarily by the EPA’s CCRP, and others such as Met Éireann, Marine institute, DAFM, CoFoRD, OPW and national Universities. Research will continue to be an essential element for delivery of Phase two of the NCCAF.
157
The EPA’s CCRP is based on four thematic research areas and a coordination structure hosted by the EPA. Under a sub theme of Future Climate in Ireland, Impacts and Adaptation, research is progressed with a view to providing information on observations and analysis, future climate change, impacts risk and vulnerability in order to support actions on adaptation and risk management. Research under this theme is being progressed under the following headings: (a) Observations, monitoring and analysis; (b) Modelling of future climate; (c) Impacts, risk and vulnerability assessment; and (d) Adaptation information and responses. Observations, monitoring and analysis Dwyer (2012) sets out the Status of Ireland’s Climate based on observational data for over 40 climate variables and highlights trends and change in aspects of Irish climate across the atmospheric, oceanic and terrestrial domains. Modelling of future climate New global model simulations carried out in Ireland by Met Éireann (2013) provide an update on the expected changes in the Earth’s climate over the 21st Century. Ireland has contributed to the scientific development of a new global climate model (EC-Earth), performing centennial-scale simulations with the model and contributing to date to CMIP5 for assessment by the IPCC in AR5. Impacts, risks and vulnerability assessment Analysis of potential impacts for Ireland is summarised in the State of Knowledge Report (Desmond et al., 2009). Research on specific impacts are included in the Hydrodetect project (Murphy et al., 2013), which identified a reference river flow network for monitoring and detecting climate driven changes in Irish river flows. Analysis of change from the reference network shows an increase in the size of flood events, particularly since the late 1990’s for many stations. A Phenology study (Donnelly et al., 2012) showed that the warmer Irish climate has led to a change in the seasonal cycle of a range of plant and animal species. The study linked increasing air temperature, particularly in spring, to earlier emergence of leaves which contributed to a longer growing season. Adaptation information and responses A National Adaptive Capacity Assessment (Desmond and Shine, 2012), provided an assessment of Ireland’s capacity to adapt to climate change through:
Analysis of the context within which adaptation will take place;
Assessment of adaptive capacity; and
Recommendations on how to enhance adaptive capacity. The study advised that enough information exists to start to plan for the positive and negative impacts of climate change. This Assessment provided the policy context for a strategic national adaptation response to climate change in Ireland.
158

The National Adaptive Capacity Assessment (Desmond and Shine, 2012), concluded that while Ireland is in the early stages of the adaptation process, there are good-quality information and established processes and tools to plan for the positive and negative impacts of climate change. The study recognised that the most effective strategy for adaptation planning is to integrate climate change adaptation into policies, plans, programmes and projects at all levels of government and across all sectors. It further recommended that adaptation to climate change needs an integrated approach (horizontal and vertical) involving all stakeholders on all institutional levels. The NCCAF leans heavily on the National Adaptive Capacity Assessment.
In an overarching study, COCOADAPT (Sweeney et al., 2013) provided recommendations on how key sectors and vulnerable areas could increase their resilience to climate change through adaptation. These include the water sector, biodiversity, construction and tourism. The CLAD project (Falaleeva et al., 2013) developed a tool for climate adaptation in response to the need for capacity building at the coastal zone. The outputs provide coastal communities with a tool for climate adaptation planning based on local resources and should support administrations to begin to meet their obligations under the NCCAF. Ongoing and future research Ongoing research includes the development of guidelines for costing adaptation options; the development of guidelines for the integration of adaptation into spatial planning and SEA; and the second phase of the development of ICIP. Future work under the EPA’s CCRP will meet existing and forthcoming international and national adaptation obligations such as those set out under the UNFCCC, EU Adaptation Strategy (2013) and the NCCAF (2012). This should include for example, the development of adaptation indicators to assist in monitoring, review and reporting of adaptation actions. Sector specific climate change impacts research Some sectors have already independently begun the process of identifying key vulnerabilities for their activities. The report by the Irish Academy of Engineering, Ireland at Risk: Critical Infrastructure – Adaptation for Climate Change 89(The Irish Academy of Engineering, 2009) and the report by the Heritage Council and Fáilte Ireland (the National Tourism Development Authority), Climate Change, Heritage and Tourism, Implications for Ireland’s Coast and Inland Waterways 90(ed. Kelly and Stack, 2009) are examples of initiatives of this kind. These studies show how analysis of climate change has been advanced at key sectoral levels, using information resulting from investment in climate projections in order to assess impacts and to inform planning. Other research work on adaptation in specific sectors has been carried out or commissioned by other Government Departments/bodies such as the OPW, CoFoRD, etc. (e.g. CLIMADAPT)91 6.2 ADAPTING TO CLIMATE CHANGE IN IRELAND – EXPECTED IMPACTS 6.2.1 INTRODUCTION Two approaches have been used to assess the potential impact of climate change in Ireland: “Regional Climate Modelling” and “Statistical Downscaling”. The methodologies are complementary approaches to translate the output from Global Climate Models to high resolution spatial
89
http://www.iae.ie/publications/publication/critical-infrastructure-adaptation-for-climate-cha/ 90
http://www.heritagecouncil.ie/fileadmin/user_upload/Publications/Marine/ClimateReportWeb_version_june_09FINAL.pdf 91
http://82.165.27.141/climadapt_client/index.jsp
159

information. Work on climate projections has been mainly carried out by Met Éireann and the ICARUS group in National University of Ireland, Maynooth. 6.2.2 Climate change impacts for Ireland Depending on the global GHG emission scenarios, the projected changes in the Irish climate and related impacts include:
continued warming, particularly in the winter and summer seasons;
more extreme weather conditions including storms and rainfall events;
an increased likelihood of river and coastal flooding;
wetter winters and drier summers, the latter possibly leading to water shortages; and
changes in types and distribution of species. Ireland’s Climate: the road ahead (Met Éireann, 2013), presents a synthesis of knowledge on observed and expected impacts for Ireland, the main elements of which are set out in the table below( additional information on sea level rise also included).
160

TABLE 6.2
OBSERVED IMPACTS PROJECTED IMPACTS
TEMPERATURE Temperatures have increased by about 0.8 degrees Celsius over the period 1990-2012; an average of about 0.07 degrees Celsius per decade
Average temperatures will rise by about 1.5 degrees Celsius (RCP4.5 scenario) by mid-century and up to 3 degrees Celsius by 2100 compared to the 1961-1990 average
PRECIPITATION Mean annual precipitation over the period 1981-2010 has increased by 5% relative to the 1961-1990 period.
Wetter winters (14% increase in precipitation for RCP8.5 by mid-century); drier summers (20% reduction for RCP8.5 by mid-century).
EXTREME EVENTS There is evidence of an increase in the frequency of days with heavy rain (10mm or more) over the period 1981-2010 relative to the period 1961-1990.
Increase in the frequency of heavy rainfall, particularly in winter.
SEA LEVELS During the satellite era, a sea level rise of 3.5cm per decade
A rise of 50cm to 2100 is projected for Ireland, consistent with projections from regional and global models (Olbert et al., 2012). This sea level rise includes contributions due to changes in ocean density and also from ice melt.
ENVIRONMENT Ecological impacts have been observed in species such as butterflies (e.g. a northward expansion of the population since the 1970s); impacts on key phonological phases associated with trees/plants, birds and insects have also been observed (1990-1999).
Advance of the ‘bud burst’ day for birch trees (e.g. up to 10 days earlier in the 2080s relative to the 1990s in the Northeast of the country, but little change expected in the Southwest).
Other key results for the Irish climate are as follows:
Warming is enhanced for the extremes (i.e. hot or cold days) with highest daytime temperatures projected to rise by up to 2 degrees in summer and lowest night-time temperatures to rise by up to 2-3 degrees in winter;
In relation to observed warming, the strongest signals are in winter and summer;
Milder winters will, on average, reduce the cold-related mortality rates among the elderly and frail but this may be offset by increases due to heat stress during summer;
The frequency of heavy precipitation events during winter shows notable increases of up to 20%;
Changes in precipitation are likely to have significant impacts on river catchment hydrology;
161

The models predict an overall increase (0 to 8%) in the energy content of the wind for the future winter months and a decrease (4-14%) during the summer months;
A small decrease in mean wave heights is expected around Ireland by the end of the century, while in winter and spring, storm wave heights are likely to increase;
Expected increases in temperature will further affect the ecologies of Irish butterflies, in particular their flight periods, voltinism and abundances.
Average sea level rise of about 43cm is projected in the North Atlantic. Local effects around Ireland will lead to an additional sea level increase of about 7cm in the Irish Sea. It is likely that all Irish coastal waters will experience a similar sea level rise.
Projected warming trends in the sea surface temperature and depth-average temperature throughout the basin are approximately 1.9˚C and 1.8˚C, respectively, with autumn accounting for the greatest warming and spring for the smallest. There will be a time shift in the annual temperature cycle: maxima and minima annual temperatures in future climate will occur about 2 weeks later each year92.
6.2.3 DISSEMINATION AND CAPACITY BUILDING While a sizable amount of climate information currently exists for Ireland, much of this is spread out among a number of institutions and agencies. The need for a centralised information resource has been identified and initial work is already underway on the development of a pilot national climate change information system. The pilot phase of Ireland’s Climate Information Platform Project (ICIP), is being developed by EPA’s CCRP. It will complement the European Climate Adaptation Platform (Climate Adapt) and will be designed specifically to provide local and national level planners with the know-how and the knowledge required to integrate adaptation into their planning.
Ireland’s Climate Information Platform (ICIP), available as Climate Ireland (www.climateireland.ie). In Phase one, the key areas of resource development include: Climate Change Explained; Climate Information Provision, and Decision Support. Phase two is due to commence and aims to be available to end users by 2015. Phase two will see the functionality of the platform enhanced through the provision of greater data analysis and decision support tools.
The system will aim to provide information to key stakeholders working on climate change adaptation, to create awareness and understanding of climate impacts and adaptation and to understand the measures that can be taken to reduce risk. The Platform will be a key support to the implementation of the NCCAF. There are also other sectoral specific climate change information systems. For example, CLIMADAPT is a web-based decision support system (DSS) based on Ecological Site classification (ESC) developed specifically for Irish Forestry. The system is based on soil and climatic information that can be used to assess species suitability and yield of different species for individual sites under current and future climate change scenarios (Ray et al., 2010). 6.3 VULNERABILITY ASSESSMENT 6.3.1 INTRODUCTION Vulnerability is a measure of the susceptibility of a sector, region, group or activity to adverse external drivers. A vulnerability assessment identifies who and what is exposed and sensitive to climate change and considers the factors that make people, and their interests and activities, or the environment susceptible to harm. It builds upon the information available on observed and
92
Personal correspondence with Dr. Mike Hartnett, NUIG
162

projected impacts, and is useful in the development of strategies or policies to limit the adverse impacts of climate change and variability on environmental and human systems. 6.3.2 NATIONAL VULNERABILITY ASSESSMENT In 2012, a National Climate Change Vulnerability Scoping study was undertaken by researchers at the National University of Ireland Maynooth to identify first generation vulnerabilities for Ireland based on a sensitivity analysis across the key sectors. The analysis identified a clustering of impacts and their importance in relation to an assessment of likely resilience by sector. The assessment methodology used was akin to an impacts-first, science-first, or classical approach. This identified where some of the key sensitivities lie, and by weighing up sensitivity versus the impact, the initial results can be also be interpreted as a ‘best estimate’ of first-generation vulnerability. The priority sectors identified for further investigation are:
Biodiversity and fisheries;
Water resources and the built coastal environment;
Forestry and agriculture. 6.3.3 FUTURE RESEARCH SUPPORT Relevant research work will also continue to be supported and promoted by other relevant Departments. The EPA will continue to lead in the development of the ICIP to full implementation. Other State bodies will also provide specifics of their adaptation research for publication on the Platform. DECLG will continue to support Met Éireann in its development of climate predictions systems and provision of climate services for Ireland. Met Éireann will integrate its efforts with European and international initiatives, within the overall coordination of the WMO. DECLG will also continue to support the development of enhanced national co-ordination of observation systems, under the leadership of the EPA and Met Éireann, who will, with the assistance of other responsible bodies and institutions, provide periodic updates on the state of Ireland’s climate system and provide useful and transferable analysis of data from this system. 6.4 FLOOD RISK It is likely that climate change will have a significant impact on flood risk in Ireland.
Sea level rise is already being observed and is projected to continue to rise into the future, increasing risk to our coastal communities and assets, and threatening coastal squeeze of inter-tidal habitats where hard defences exist;
It’s possible that the number of heavy rainfall days per year may increase, which could lead to an increase in both fluvial and pluvial (urban storm water) flood risk, although there is considerable uncertainty associated with projections of short duration, intense rainfall changes due to climate model scale and temporal and spatial down-scaling issues;
The projected wetter winters, particularly in the West of the Country, could give rise to increased groundwater flood risk associated with turloughs.
While there is considerable uncertainty associated with most aspects of the potential impacts of climate change on flood risk, it is prudent to take the potential for change into account in the development of FRM policies and strategies, and the design of FRM measures. THE CFRAM PROGRAMME To implement a number of recommendations of the Report of the National Flood Policy Review Group (2004)93, the OPW commissioned some pilot CFRAM studies in 2006 and in 2011 began the
93
http://www.opw.ie/en/media/Report%20of%20the%20Flood%20Policy%20Review%20Group.pdf
163

implementation of the national CFRAM programme. The purpose of these studies is to develop flood maps for areas of potentially significant flood risk (referred to as Areas for further Assessment (AFAs)), and to prepare FRMPs in 2015 to set out a series of specific flood risk management measures aimed at reducing and managing flood risk in those areas. The CFRAM programme will also deliver upon the key requirements of the EU Directive on the assessment and management of flood risks (2007/60/EC). The flood mapping and risk assessment being implemented through the CFRAM Programme includes mapping and assessment for two potential future scenarios (the ‘Mid-Range’ and ‘High-End’) as well as the current scenario to provide an understanding of how ongoing urban development, catchment changes and climate change could impact on flood risk over the long-term into the future. The development of FRM measures under the CFRAM Programme is equally cognisant of the potential impacts of climate and other future changes, and follows either an adaptive (i.e., providing for future enhancements) or assumptive (i.e., designing now for potential future conditions). A ‘no regrets’ or ‘robust decision-making’ approach is also taken with respect to the planning of FRM interventions over time to provide for a temporal adaptability to be able to respond to changing knowledge, projections and reality over time. The CFRAM Programme is central to the planning of future FRM activity in Ireland, and was designed as the vehicle through which climate change adaptation policies would be implemented with respect to flood defence. It will hence be the cornerstone of climate change adaptation in the flood defence sector. Information on and outputs from the pilot CFRAM studies, and on the ongoing National CFRAM Programme are available from the Programme website: http://www.cfram.ie DEVELOPMENT OF THE FLOOD DEFENCE SECTORAL ADAPTATION PLAN A Flood Defence Sectoral Adaptation Plan will be developed by the OPW and published, after appropriate consultation, in mid-2014. This will be a high-level plan setting out:
A review of the existing science relating to the potential impacts of climate change on flooding;
An outline of the potential increase in flood hazard and flood risk, with links to locations of more detailed data, drawing on the work done under the CFRAM Programme and PFRA;
Information on potential increases in flood risk for consideration by other sectors;
Policies on climate change adaptation to be pursued and applied in the development of FRM strategies and measures.
Detailed adaptation approaches and measures, to a specified programme, will be set out in the FRMPs developed under the CFRAM Programme. 6.5 INTEGRATED COASTAL ZONE MANAGEMENT Integrated coastal zone management is supported by the planning system. Since its inception, the planning system has had a broad remit, not only in the proper planning of land resources but also in environmental protection. While specialised environmental legislation has been introduced over the years, the planning system still complements environmental legislation and will continue to play a major part in relation to coastal zone management. The Planning and Development Act, 2000 was introduced to ensure that the Irish planning system can face the challenges meeting the country as it continues to grow and prosper.
164

Under the 2000 Act, requirements for forward and strategic planning were introduced and a sustainable development ethos has been explicitly incorporated into the planning system. Under the provisions of the Act, each local planning authority must prepare a development plan setting out an overall strategy for the proper planning and sustainable development of the area. The Act provides that a planning authority’s development plan may include objectives for, inter alia:
regulating, restricting or controlling development in areas at risk of flooding (whether inland or coastal), erosion and other natural hazards;
regulating, restricting and controlling the development of coastal areas and development in the vicinity of inland waterways;
regulating, restricting and controlling development on the foreshore, or any part of the foreshore.
The process of modernising the foreshore consent process has commenced with the drafting of a Maritime Area and Foreshore (Amendment) Bill being approved by the Government in July 2013. In broad terms, the proposed Bill is intended to provide for a more streamlined development consent process for both the onshore and offshore elements of strategic infrastructure projects, with An Bord Pleanála94 (the Board) as the consent authority. Responsibility for development located in the nearshore area will be assigned to coastal local authorities, apart from developments requiring either Environmental Impact Assessment or Appropriate Assessment, which will fall under the direct remit of the Board. The Bill is the most significant reform of the marine consenting architecture in the 80 years since enactment of the Foreshore Act in 193395. The Bill will provide a modern regulatory system for Ireland’s marine environment that promotes sustainability and facilitates development within a planned, balanced framework.
EXAMPLE OF AGRICULTURAL ADAPTIVE MEASURES Conservation of Plant Genetic Resources Plant Genetic Resources for Food and Agriculture (PGRFA) are the raw material that farmers and plant breeders use to improve the quality and productivity of crops. They can be defined as any genetic material of plant origin of actual or potential value for food and agriculture, e.g. seeds, tubers, mature plants etc. The collection and preservation of these resources could make an important contribution to future crop research both at home and abroad. Most agriculture seeds can be stored successfully for very long periods of time in storage facilities called genebanks. There are a number of PGRFA collections in Ireland conserved by both public sector bodies and non-governmental organisations. National Genebank DAFM's Cereal Genebank at Backweston, Leixlip, Co. Kildare is designated as the national genebank for the country. Facilities have been upgraded and expanded at the Backweston genebank and its remit broadened to include safety duplicate storage for other important PGRFA collections held in the State. This provides a back up for any accidental loss of germplasm in other Irish genebanks and enables its replacement. The Backweston genebank shall also function as a designated location to deposit all types of PGRFA seeds of national importance that may be collected in Ireland in the future.
94
The Irish Planning Appeals Board 95
http://www.irishstatutebook.ie/1933/en/act/pub/0012/print.html
165

Potatoes The unique collection of potato varieties is maintained by the Department of Agriculture, Food and the Marine at its potato genebank at the Tops Potato Centre, located in Raphoe, Co. Donegal. Comprising over 400 unique potato varieties, the oldest of which pre-date the Irish Famine, the collection includes old and modern Irish varieties and varieties from abroad. Cereals Old indigenous varieties and landraces of Oats, Wheat and Barley were once commonly cultivated in Ireland. While some of these may still be found in rural areas in locations such as the islands off the west coast of Ireland, many of them are maintained in the Department's genebank at Backweston Farm, Leixlip, Co. Kildare. In addition, the Backweston genebank also conserves cereal breeding lines from the various cereal crop breeding programmes undertaken by the State over the past century. Crop Wild Relatives CWR are species found growing in the wild that are genetically related to domesticated crops cultivated by humankind. Most are found growing as weeds in disturbed habitats, such as roadsides, field margins, orchards and traditionally managed agricultural land. An important ex situ collection of CWR's are maintained in the National Genebank in Backweston. This extensive collection consists of 24 different crop species which were sourced primarily by Genetic Heritage Ireland. Database for Plant Genetic Resources A database listing all the crops and varieties in Ireland's National Inventory for Plant Genetic Resources for Food and Agriculture is available at Eurisco which is a web portal that hosts data on crop diversity from 41 different country's National Inventories, and provides access to all ex situ Plant Genetic Resources information across Europe. Livestock Genebanks The Global Plan of Action for Animal Genetic Resources published in 2007 by the FAO, highlights the following action ‘Establish or strengthen National and regional facilities for ex situ conservation, in particular cryogenic storage’. A priority for Ireland is the establishment of a national genebank. The use of cryopreservation and the setting up of genebanks to secure genetic diversity of farms breeds is a priority for all countries. The choices of biological material may differ according to conservation aims and available technologies e.g. in order to reconstruct a breed embryos are more appropriate than semen. There are currently discussions among all stakeholders on the issue of a National DNA/tissue bank. This has become more relevent with the advent of Genomic technologies, whereby it is envisaged that a large proportion of all animals born each year will have a DNA sample taken for genomic analysis/genetic defect analysis/traceability purposes/identification of disease carriers etc.
6.6 Ireland’s contribution to EU work on Adaptation Environment Council conclusions on the EU Adaptation Strategy were adopted by EU Environment Ministers in June 2013 under the Irish EU Presidency (1 January 2013 – 30 June 2013). EU Finance Ministers also adopted conclusions on the EU Adaptation Strategy at ECOFIN Council in June 2013. The objective of the EU Adaptation Strategy is to contribute to a more climate resilient Europe. The Strategy has three main aims:
166
Promoting action by Member States,
Better informed decision making , and
Climate Proofing EU action.
The Strategy consists of a package of documents which include a Communication: the main political document which sets out eight actions to be taken in the EU Adaptation Strategy’s three priority areas; staff working documents on adaptation in specific sectors and policy areas: migration, marine and coastal areas, health, infrastructure, agriculture, cohesion policy and insurance; and guidelines on preparing national adaptation strategies. As part of the process of implementing the EU’s Adaptation Strategy Ireland will report on progress, as required, under the EU’s Monitoring Mechanism Regulation (MMR), as well as participating on the relevant working groups under the EU’s Climate Change Committee. The Environment Council Conclusions emphasised the importance of key policy instruments such as mainstreaming cross cutting sectors that are deeply integrated in EU common policies such as agriculture, fisheries and environment. 6.7 International Co-operation on Adaptation The majority of Ireland’s international co-operation on adaptation since the 5th National Communication has been carried out under the auspices of Ireland’s international development policy. Ireland’s international development assistance programme has been focused on the Least Developed Countries, particularly those in sub-Saharan Africa. Since the 5th National Communication, Ireland has had bilateral development programmes with ten partner countries: Sierra Leone, Lesotho, Mozambique, Malawi, Zambia, Tanzania, Uganda, Ethiopia, Vietnam and Timor Leste. Despite constraints on public finances in the context of the global financial crisis, Ireland has made a strong contribution to addressing climate change through its overseas development programme. The majority of Ireland’s assistance to developing countries is administered by the Department of Foreign Affairs and Trade (Irish Aid) on the basis of untied grant funding. DAFM and DECLG have also contributed to Ireland’s efforts. Of Ireland’s FSF contributions, over 95% went to support climate change adaptation. Further details96 of Ireland’s climate finance contributions are available in Chapter 7. Ireland’s international co-operation on adaptation has been predominantly achieved through bilateral grants to Key Partner Countries. The focus of these grants to date has been largely on achieving results in the areas of sustainable food and nutrition security, particularly in climate resilient agriculture, improved natural resource management, disaster risk reduction, improving efficient and sustainable energy at the household level and gender equality. Ireland also supports the Climate Change work of the World Resources Institute, the International Institute for Environment and Development, the Least Developed Countries Fund and the UNFCCC LEG. Ireland launched a new policy for international development, ‘One World, One Future’97, in May 2013. This policy aims to take a whole-of-Government approach to international development and places an increased emphasis on climate change and sustainable development, through the Priority Area for Action on ‘Climate Change and Development’. The Irish Aid programme has a clear emphasis on international co-operation on climate adaptation in the least Developed countries.
96
See Tables 7.8 and 7.9 for climate finance information at programme-level 97
http://www.irishaid.ie/media/irishaid/allwebsitemedia/20newsandpublications/publicationpdfsenglish/one-world-one-future-irelands-new-policy.pdf
167

Example: Climate Adaptation programmes in Malawi Irish Aid’s programme in Malawi aims to ensure that households and smallholder farmers benefit from improved crop productivity and diversification of crops so that vulnerable communities can adapt to the changing conditions caused by climate change. Examples of Irish Aid’s work include: - Supplying improved drought-resistant seed varieties to farmers - Researching crops that are adaptable to changing environmental conditions - Promoting conservation agriculture (agricultural practices that conserve the environment) - Encouraging agro-forestry, which is the combined use of trees and shrubs in the same area as
food crops and/or livestock to create a more diverse, sustainable and profitable use of land. “Evergreen” agriculture is the combination of trees with conservation agriculture in the same plots providing smallholder farmers with increased climate resilient food production.
Ireland also supports households in disaster-prone areas in Malawi so that they are better equipped to respond to sudden or slow-onset environmental disasters linked to climate change. This support includes the development of disaster risk reduction plans in certain districts and strengthening the capacity of the Government to identify risks with the aim of reducing the impact of disasters on the poorest communities. Ireland also supports the development of fuel-efficient improved cook stoves in Malawi that reduce the amount of firewood required by about 40% per stove.
168

References Coll, J and Sweeney, J. 2013. Current and Future Vulnerabilities to Climate Change in Ireland. Climate Change Research Programme (CCRP) 2007 - 2013 Report Series No. 29. http://www.epa.ie/pubs/reports/research/climate/CCRP_29.pdf Desmond, M, O’Brien, P and F. McGovern, 2009. A Summary of the State of Knowledge on Climate Change impacts for Ireland. Climate Change Research Programme (CCRP) 2007 - 2013 Report Series No. 1 https://www.epa.ie/pubs/reports/research/climate/CCRP1(low).pdf Desmond, M and Shine, T.2012. National Adaptive Capacity Assessment. Climate Change Research Programme (CCRP) 2007 - 2013 Report Series No 17. http://www.epa.ie/pubs/reports/research/climate/CCRP_17_web.pdf Donnelly, et al., 2013. Climate Change Impacts on Phenology: Implications for Terrestrial Ecosystems. Climate Change Research Programme (CCRP) 2007 - 2013 Report Series No. 22 http://www.epa.ie/pubs/reports/research/climate/CCRP_22.pdf Falaleeva, M et al, 2013. Coastal Climate Adaptation in Ireland. Climate Change Research Programme (CCRP) 2007 - 2013 Report Series No 28. http://www.epa.ie/pubs/reports/research/climate/CCRP_28.pdf Gleeson, E, McGrath, R and Treanor M, 2013, Ireland’s Climate: the road ahead. Met Éireann: Dublin, Ireland. http://www.met.ie/publications/IrelandsWeather-13092013.pdf IPCC (2007) IPCC Fourth Assessment Report, Climate Change 2007 Synthesis Report. In: PK Pachauri, A Reisinger (eds). Cambridge University Press, UK http://www.ipcc.ch/pdf/assessment-report/ar4/syr/ar4_syr.pdf McElwain L and Sweeney, J, 2007. Key Meteorological Indicators of Climate Change in Ireland. EPA Report No.6. EPA: Wexford, Ireland. http://www.epa.ie/pubs/reports/research/climate/ERC-6-Climate%20Change-web-ready3.pdf McGrath, R., Dunne, S., Hanafin, J., Lynch, P., Nishimura, E., Nolan, P., Venkata Rathnam, Semmler, T., Sweeney, C., Varghese, S. and Wang, S., 2008. Ireland in a Warmer World. Scientific Predictions of the Irish Climate in the Twenty-First Century. Community Climate Change Consortium for Ireland. Met Éireann: Dublin, Ireland. http://www.epa.ie/pubs/reports/research/climate/STRIVE_27_Dunne_C4I_web.pdf Murphy, C., Harrigan, S, Hall, j and Robert L.Wilby, 2013. Hydrodetect. Climate Change Research Programme (CCRP) 2007 - 2013 Report Series No 27. http://www.epa.ie/pubs/reports/research/climate/CCRP_27_HydroDetect.pdf Nolan, G, Gillooly, M and Whelan, K (eds). 2010. Irish Ocean Climate and Ecosystems Status report 2009. Marine Institute: Galway, Ireland. http://www.marine.ie/NR/rdonlyres/E581708D-6269-4941-836F-6B012DD7A4BD/0/IrishOceanClimateandEcosystemStatusReport2009.pdf
169

Olbert, A.I., Dabrowski, T., Nash, S. & Hartnett, M. 2012. Regional modelling of the 21st century climate changes in the Irish Sea. Continental Shelf Research 41, 48-60. http://www.sciencedirect.com/science/journal/02784343/41 Ray, D., Xenakis, G., Tene, A. and Black, K., (2010). Developing a site classification system to assess the impact of climate change on species selection in Ireland. Irish Forestry. 66: 101-122 http://www.binarysolo.org/other/ray2009.pdf Sweeney, et al., 2013. Co-ordination, Communication and Adaptation for Climate Change in Ireland: An Integrated Approach. Climate Change Research Programme (CCRP) 2007 - 2013 Report Series No 30. http://www.epa.ie/pubs/reports/research/climate/CCRP_30.pdf
170
CHAPTER 7: FINANCIAL RESOURCES
7.1 Introduction 7.2 Fast Start Finance 2010-2012 7.3 Bilateral Activities 7.4 Multilateral Activities 7.5 Climate Finance – The Future 7.6 Carbon funds and other Investments 7.7 Contributions to the Global Environment Facility 7.8 Contributions to Multilateral Institutions and Programmes 7.9 Bilateral and Regional financial contributions to the implementation of the Convention
171

7.1 Introduction One of the key benefits of providing climate finance to developing countries is to assist such countries to mitigate and adapt to the impacts of climate change. In some instances climate finance can help to deliver reductions in GHG emissions in developing countries, while also up-skilling such countries with the means and expertise to develop and implement their own emission mitigation plans. At the UNFCCC conference in Copenhagen in 2009, and in the context of meaningful mitigation actions and transparency on implementation, developed countries including the Irish Government, made a voluntary political commitment to the goal of mobilising jointly, by 2020, US $100bn in annual financial flows from a wide variety of sources (public, private, bilateral, and multilateral, including alternative sources of finance), in order to address the needs of developing countries. Through the relevant EU and UNFCCC processes, Ireland is continuing to engage constructively with developed and developing country Parties on identifying pathways for scaling up the mobilisation of climate finance between now and 2020 while taking account of current economic realities.
7.2 Fast-Start Finance 2010 – 2012
Key messages from FSF: • Ireland exceeded its voluntary political commitment to provide up to €100m in public funding
by reporting a figure of €110.2m. • Ireland’s FSF contributions were entirely in grant-form. • Of Ireland’s FSF contributions over 90% went to sub-Saharan Africa. • Of Ireland’s FSF contributions over 95% went to support climate change adaptation.
At Copenhagen in 2009, developed country Parties to the UNFCCC agreed to provide an initial US $30bn as part of an initial “Fast Start Finance” period from 2010 to 2012. The developed countries’ FSF contributions provided support for actions by developing countries to strengthen their resilience to climate change and mitigate their greenhouse gas emissions, including those from deforestation. The political commitments made in Copenhagen by the EU and its MS for the FSF period were voluntary in nature, with Ireland committing to provide up to €100m in public climate finance. Ireland exceeded this voluntary commitment by reporting an FSF contribution of climate finance of approximately €110m, which was provided via a combination of:
€76m direct Exchequer contribution from climate relevant ODA.
€33m funding from DECLG through the EU’s GCCA and the LDCF; and
€1.2m funding from DAFM.
Ireland’s FSF contributions over the period consisted entirely of grant-funding sourced from Irish Aid, the DECLG and DAFM Votes. These contributions were directed through a variety of channels: bilateral (ODA to Ireland’s partner countries); multilateral (contributions to climate-relevant multilateral funds e.g. GCCA, LDCF); and other climate-relevant funding channels (such as funding of climate-relevant projects through the FAO). Approximately 95% of Ireland’s FSF funding went towards adaptation activities with sub-Saharan African countries being the primary recipients. A more detailed picture of Ireland’s FSF contributions can be seen in Tables 7.2 and 7.3.
7.3 Bilateral Activities
172

Ireland has worked bilaterally with a number of Key Partner Countries as well as international institutions to decrease vulnerability to the adverse effects of climate change through a range of modalities. For example:
In Mozambique, Ireland has supported the work of the Government’s National Institute for Disaster Management (INGC). The INGC prepares for and responds to natural disasters, such as droughts, floods and tropical cyclones, and in 2011, the INGC launched the second phase of its disaster preparedness work for early warning systems, coastal protection measures, water management, and food security.
In Ethiopia, Ireland supports the Government’s Productive Safety Nets Programme (PSNP), which decreases food insecurity and climate vulnerability of the poorest communities and households in Ethiopia. More detail on the climate-relevance of the PSNP is contained in the box below.
In Malawi, Ireland supports the work of the National Smallholder Farmers Association of Malawi (NASFAM) to build a ‘knowledge chain’, spreading conservation agriculture techniques to more than 37,000 farmers throughout the country
IIED: Ireland supports the work of IIED, in particular their efforts to strengthen the role of local organisations to manage natural resources, support vulnerable countries and communities to adapt to climate change, and sustain and secure livelihoods in a changing world.
7.4 Multilateral Activities Ireland has worked to decrease vulnerability to climate change through various multilateral channels. In this regard, Ireland has provided support to multilateral trust funds as well as international organisations with a strong focus on climate change. Some examples of this include support to the:
Least Developed Countries Expert Group (LEG)
Ireland has continued to support the work of the Least Developed Countries Expert Group in the period since submission of the 5th National Communication. In particular, Ireland’s support has been focused on capacity building to contribute to sustainable development through the Least Developed Countries Expert Group’s two-year work programmes.
Least Developed Countries Fund (LDCF)
Ireland has continued to provide annual support to the Least Developed Countries Fund for the preparation and implementation of National Adaptation Plans of Action (NAPA)s for least developed countries in response to their urgent and immediate climate adaptation needs.
Global Climate Change Alliance (GCCA)
The GCCA was launched in 2007. It provides technical and financial support to more than 35 Least Developed Countries (LDC) and Small Island Developing States. The €31m of FSF allocated by Ireland (€23m in 2010 and €8m in 2011) to the GCCA has been programmed for climate change projects in Mozambique, Uganda, Sierra Leone, Lesotho, Vietnam, and Timor Leste.
Example of Multilateral climate finance support from Ireland (GCCA) Title: Support project to the Government of Mozambique for the mainstreaming of climate change into policies and strategies and to adapt to climate change impact. Priority areas: Mainstreaming, adaptation and DRR.
173
Sectors: Overall development and poverty reduction. Budget: Total value €47 million with €15.2 million GCCA contribution (including €5 million fast start funding from Ireland) through project approach. Other contributors include Ministry of Foreign Affairs of Denmark (Danida) with €31.5 million and the Government of Mozambique with €0.3 million. Partners: Ministries for the Coordination of Environmental Action, Planning and Development, State Administration, Agriculture, Mineral Resources, Fisheries, Energy, Health, Tourism, Public Works and Housing and Labour, the National Institute for Natural Disaster Management, and the National Council for Sustainable Development, Danida. Key achievements to date: Completion of the Institutional Performance and Impact of Climate Change studies; approval of budget and activity plan for 2011 based on the National Annual Economic and Social Plan; terms of reference for the National Climate Change Strategy are nearing completion. Lessons learned: Environment and climate change are not yet adequately treated as cross-cutting issues at policy level, with environmental management too often perceived as an obstacle to economic development. As a result, investment decisions are often made with little consideration to environment regulation and sustainable development. Institutional and capacity strengthening and financial support to government institutions responsible for the coordination of climate change is crucial for a sustainable integration of the issue in sectoral policies and investment decisions.
7.5 Climate finance - The Future Looking towards the future, there is, as yet, no clarity regarding pathways to achieving the 2020 US$100bn goal or what the EU or Ireland’s share of this goal might be. It is known however that the goal will be met using a variety of sources including public, private, bilateral, and multilateral, innovative, and alternative sources. Public finances in Ireland, like in many other countries, are and will remain constrained over the coming years. While acknowledging the continued role of public climate finance, there is a need to identify other sources of climate finance going forward. Ireland recognises the need to plan for the fiscal and budgetary implications flowing from the commitment made in 2009 to contribute to International climate finance goals agreed under the UNFCCC processes. In this regard Ireland made an important contribution during its term as EU Presidency (1 January 2013 – 30 June 2013) by helping to develop the EU submission to the UNFCCC on Strategies and Approaches for mobilising scaled-up finance towards the US $100bn 2020 goal. Ireland will continue to work constructively with its fellow EU Member States and other developed country Parties to the UNFCCC in this regard while taking account of current economic realities. Examples of Ireland’s continued commitment to the provision of climate finance are evident in the work of Irish Aid in the Tigray region of Northern Ethiopia:
Example: Social Protection, Watershed Management and Disaster Risk Reduction in Ethiopia In Ethiopia, Irish Aid has built on previous support to an integrated watershed management approach in the Tigray region of Northern Ethiopia by harnessing the benefits of social protection to increase adaptation to climate change. The PSNP, which Ireland supports, has developed a global reputation for delivering transformative improvements to Ethiopia’s natural resource base as well as introducing comprehensive social protection for the poorest and most vulnerable Ethiopians. The
174

PSNP has been instrumental in successfully scaling up local ‘watershed community’ approaches to soil and water conservation into a national safety net programme tackling hunger and reducing vulnerabilities to climate change. Communities are now more resilient to climate-related shocks and employ a wider variety of preparation and adaptive strategies. When they experience shocks they can generally meet their household food needs and are better able to cope because they have a wider array of income sources and soil and water conservation skills. Irish Aid is working with the WMO and the National Meteorological Agency of Ethiopia to generate and distribute accurate, timely and user friendly agri-met data to smallholder farmers in the Tigray Region of Ethiopia. Irish Aid currently supports an operational research programme in Tigray which has been successful in involving farmers in the region to test and trial drought resistant crop varieties and climate smart agricultural techniques, while making best use of existing local knowledge and local technologies. Farmers involved in the operational research programme, which itself was built on the success of a community based watershed management project, will form the basis of the pilot programme currently being developed jointly by the Meteorological Organisation and the National Meteorological Agency of Ethiopia with funding from Irish Aid.
7.6 Carbon Funds and other investments As outlined in Section 4.4 Ireland has had some involvement in a number of funds managed by multilateral development banks with a view to achieving compliance with its obligations for the first commitment period of the Kyoto Protocol. The Carbon Fund Act 2007 designated the NTMA as the national authority for taking actions in the carbon market but even before this Ireland had made commitments to funds managed by the World Bank and the EBRD. The NTMA publishes an annual report on its activities98. The first investment was of €20m made in December 2006 in the MCCF of the EBRD. Two further commitments of €10m and $12.88m were made respectively to the CFE and the BCF in January 2007. Consistent with its decision to suspend the carbon purchasing programme in February 2009, the DECLG has negotiated a reduction in the commitment to both World Bank funds; a reduction from €10m to €5.26m in the case of Carbon Fund for Europe and from $12.88m to $10.08m in the case of the BioCarbon Fund. The MCCF was established by the EBRD in partnership with the EIB in May 2006. The aim of the fund is “to promote much needed energy savings projects in the EBRD countries of operation while at the same time helping those countries and corporate companies purchasing carbon credits to meet their emissions reductions targets”. Projects are located in up to 30 EBRD countries in central and eastern Europe and the Commonwealth of Independent States. The full €20m committed by Ireland has been paid over to the EBRD. The fund uses both the JI and CDM flexible mechanisms established under the Kyoto Protocol. The CFE is jointly managed by the World Bank and the EIB, and was launched in March 2007. The fund, which is directed towards securing investments from EU Member States, acquires greenhouse gas reduction credits on behalf of the participants using the World Bank’s expertise and experience and the EIB’s large project pipeline in developing countries. The other participants in the fund include Luxembourg, Portugal, and the Flemish Region of Belgium. €4.1m of the fund’s commitments from Ireland had been paid by end 2012. The focus of the BCF is to fund emissions reductions while promoting biodiversity, conservation and poverty alleviation. It has a particular focus on projects which generate temporary Certified
98
http://www.ntma.ie/publications/
175

Emissions Reductions from afforestation projects. Projects in the portfolio are in countries such as Brazil, Chile, India, China and Moldova. To end October 2013, the investments in these various funds have generated carbon credits representing 2.42Mt of emissions reductions. In 2008 the NTMA initiated its purchase of carbon units, a process which was subsequently suspended in February of 2009. During that time 5.255Mt of Certified Emissions Reductions CERs were purchased, of which 0.9Mt were purchased in 2009. In all there were 21 trades in which Ireland contracted to purchase CERs at an average price of €14.03 (excluding VAT). In light of the recent Provisional inventory data for 1990-2012 published by the EPA it is unlikely that the units purchased by the NTMA or through the various funds will be used for compliance with Ireland’s obligations under the first commitment period of the Kyoto Protocol. Other Investments Ireland began its support to Renewable Energy and Energy Efficiency Partnership (REEEP) in 2005. Following the decision by the Irish Government in 2007 to offset all its carbon emissions from official travel, REEEP was chosen as its implementing partner. Following the implementation of Aviation Directive (2008/101/EC) the offsetting scheme was terminated. The offsetting scheme provided €0.209m to help reduce the use of non-renewable biomass through the supply of improved household cooking-stoves stoves in Malawi and Uganda over the period 2010-2013. 7.7 Contributions to the Global Environment Facility TABLE 7.1
YEAR CORE GENERAL €
CORE GENERAL US $*
2008 1,420,000 1,956,405
2009 1,421,000 1,957,783
2010 1,469,000 2,023,915
2011 1,420,000 1,956,405
2012 1,420,000 1,956,405
TOTAL 7,150,000 9,850,913
*US$ conversion rate as at 23/10/2013, €1 = $1.37775 The GEF was initially established in 1991 to provide financing to developing countries for the incremental costs of projects that produce global environmental benefits in four areas:
Biodiversity;
Climate change;
International waters; and
Ozone depletion. The GEF serves as the financial mechanism for, inter alia, the UNFCCC. Ireland has been a member of the GEF since 1994. Ireland has committed to contributing €5.73m to the fifth replenishment of the GEF trust fund (GEF5), over the period 2010 to 2013, of which some €4.3m was paid by the end of 2012. Prior to GEF5, Ireland had contributed some €18.22 million to the fund. Ireland’s contributions to the fund are not earmarked for any specific area or project, so
176

it’s not possible to outline how much of this was climate specific. Note that Ireland has not counted any of its contributions to the GEF towards its FSF figures. GEF FUNDING IN RELATION TO CLIMATE CHANGE The GEF website summarises the Facility’s overall goal in relation to climate change as follows: ‘GEF projects in climate change help developing countries and economies in transition to contribute to the overall objective of the UNFCCC ("to achieve [...] stabilization of greenhouse gas concentrations in the atmosphere at a level that would prevent dangerous anthropogenic interference with the climate system”)’. GEF funds are used to support projects in relation to both climate change mitigation and adaptation. Mitigation projects are aimed at reducing or avoiding greenhouse gas emissions in the areas of:
Renewable energy;
Energy efficiency;
Sustainable transport; and
Management of LULUCF. In its fiscal year 2013, the GEF allocated $408.7m to 68 projects related to climate change mitigation, and a further $271.4m to 41 adaptation related projects and programmes. Those 68 mitigation projects are expected to mitigate some 510 MtCO2e directly and indirectly over their lifetime. The following are some examples of 2013 GEF funded mitigation projects:
Belarus Green Cities: Supporting Green Urban Development in Small and Medium Sized Cities in Belarus;
Demonstration and Assessment of Battery-electric Vehicles for Mass Transit in Colombia;
Scaling up Small Hydro Power (SHP) in Nigeria;
Cleantech Program for SMEs in India.
177

7.8 CONTRIBUTIONS TO MULTILATERAL INSTITUTIONS AND PROGRAMMES TABLE 7.2
Beneficiary Country / Region
Thematic area
Programme or Project title Implementation Period
Implementing Agency Contribution by EU or MS (million€)
Type (grant / loan)
Additional information (short description of the action, co-financing arrangements, etc.)
Africa Adaptation Global Climate Change Alliance (GCCA): Specific countries yet to be decided.
2010-2012 EC GCCA 23.00 grant Support to EC-GCCA for increasing the capacities of developing countries to cope with the effects of climate change. Priority to be given to one or a number of countries which Ireland prioritises in it's overseas development assistance, i.e. Ethiopia, Uganda, Tanzania, Zambia, Malawi, Mozambique, Lesotho, Timor-Leste and Vietnam.
Multilateral UNFCCC 2010 0.05 grant
Multilateral IIED 2010 0.1 grant
Multilateral WRI 2010 0.1 grant
Multilateral IUCN 2010 0.025 grant
Multilateral Adaptation CGIAR 2010 0.59 grant
Multilateral UNDP 2010 0.05 grant Multilateral UNEP 2010 0.1 grant Multilateral UNCCD 2010 0.03 grant Ireland's contribution to the United
Nations Convention to Combat Desertification
Multilateral EDF 2010 0.1 grant estimated climate change relevant expenditure
Multilateral Adaptation Traditional seed systems-Bioversity international
2010 Biodiversity International 0.52 grant Traditional seed systems for tackling climate change
Multilateral Adaptation Global Information and Early Warning System (GIEWS)
2011 FAO 0.10 grant Preparation for food shortages
Multilateral Adaptation Conserving Plant genetic resources
2011 FAO 0.03 grant Global plan of action for plant genetic resources
Multilateral Adaptation Traditional seed systems-Bioversity international
2011 Bioversity International 0.41 grant Traditional seed systems for tackling climate change
Multilateral Adaptation IFAD global support 2011 IFAD 2.00 grant Core support to global work
Multilateral Adaptation Poverty Environment Initiative
2011 UNDP - UNEP 0.70 grant Support for environment and climate mainstreaming work of the Poverty Environment Initiative
178

Multilateral Adaptation Climate research and Advocacy
2011 IIED 0.10 grant Leading global environment and development research and advocacy group
Multilateral Adaptation Climate research and Advocacy
2011 WRI 0.09 grant Leading global environment and development research and advocacy group
Multilateral Adaptation CGIAR Climate Programme 2011 CGIAR 0.85 grant Specific support to the Climate programme within CGIAR global programmes
Multilateral / LDCs
Adaptation UNFCCC LEG 2011 UNFCCC 0.05 grant Least Developed countries expert group operating under the framework of the UNFCCC framework
Africa Adaptation Global Climate Change Alliance (GCCA): Specific countries yet to be decided.
2011 EC GCCA 8.00 grant
Multilateral Least Developed Countries Fund established by the UNFCCC
2011 UNFCCC 2.50 grant
Multilateral / LDCs
Adaptation UNFCCC LEG 2012 UNFCCC 0.05 grant Least developed countries expert group operating under the framework of the UNFCCC framework
Multilateral Adaptation Climate research and Advocacy
2012 IIED 0.10 grant Leading global environment and development research and advocacy group
Multilateral Adaptation Climate research and Advocacy
2012 WRI 0.09 grant Leading global environment and development research and advocacy group
Multilateral Adaptation IFAD global support 2012 IFAD 2.00 grant Core support to global work
Multilateral Adaptation Hunger Reduction and Climate Change Adaptation
2012 Institute of Development Studies (IDS)
0.10 grant Establishing linkages between hunger reduction, climate adaptation and social protection programmes
Multilateral Adaptation Various finance approved initiatives in planning including supports to climate advocacy, community resilience and drought resiliance
2012 Various NGOs 1.75 grants Interventions at an advanced planning stage to support a range of activities that will inter alia support the promotion of clean and efficient cooking methods, climate change advocacy, social programmes and increased resiliance to the adverse impacts of climate change on small farmers.
Multilateral Adaptation CGIAR Climate Programme 2012 CGIAR 0.85 grant Specific support to the Climate programme within CGIAR global programmes
Multilateral REDD+ European Forest Institute EU REDD facility
2012 European Forest Institute 0.15 grant REDD+ outreach programme in developing countries
Multilateral Adaptation/Mitigation
Benchmarking of methane emissions for livestock production
2012 FAO 0.04 grant Benchmarking of methane emissions for livestock production
179
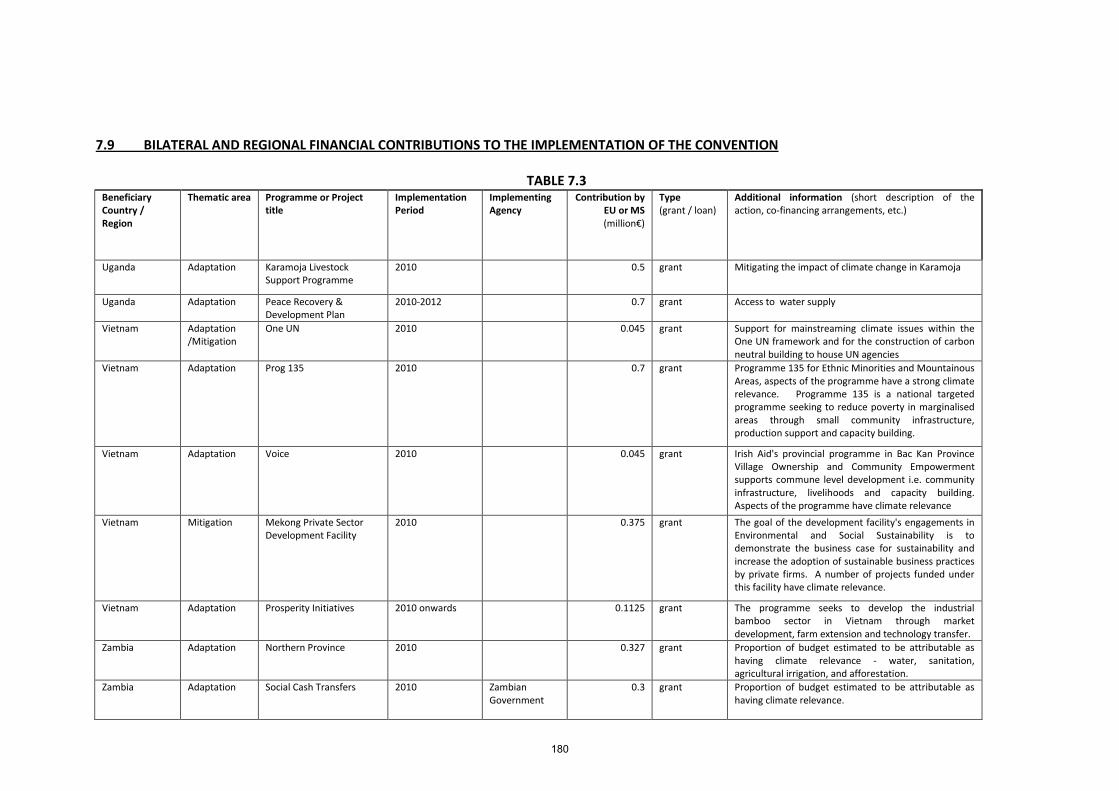
7.9 BILATERAL AND REGIONAL FINANCIAL CONTRIBUTIONS TO THE IMPLEMENTATION OF THE CONVENTION TABLE 7.3
Beneficiary Country / Region
Thematic area Programme or Project title
Implementation Period
Implementing Agency
Contribution by EU or MS (million€)
Type (grant / loan)
Additional information (short description of the action, co-financing arrangements, etc.)
Uganda Adaptation Karamoja Livestock Support Programme
2010 0.5 grant Mitigating the impact of climate change in Karamoja
Uganda Adaptation Peace Recovery & Development Plan
2010-2012 0.7 grant Access to water supply
Vietnam Adaptation /Mitigation
One UN 2010 0.045 grant Support for mainstreaming climate issues within the One UN framework and for the construction of carbon neutral building to house UN agencies
Vietnam Adaptation Prog 135 2010 0.7 grant Programme 135 for Ethnic Minorities and Mountainous Areas, aspects of the programme have a strong climate relevance. Programme 135 is a national targeted programme seeking to reduce poverty in marginalised areas through small community infrastructure, production support and capacity building.
Vietnam Adaptation Voice 2010 0.045 grant Irish Aid's provincial programme in Bac Kan Province Village Ownership and Community Empowerment supports commune level development i.e. community infrastructure, livelihoods and capacity building. Aspects of the programme have climate relevance
Vietnam Mitigation Mekong Private Sector Development Facility
2010 0.375 grant The goal of the development facility's engagements in Environmental and Social Sustainability is to demonstrate the business case for sustainability and increase the adoption of sustainable business practices by private firms. A number of projects funded under this facility have climate relevance.
Vietnam Adaptation Prosperity Initiatives 2010 onwards 0.1125 grant The programme seeks to develop the industrial bamboo sector in Vietnam through market development, farm extension and technology transfer.
Zambia Adaptation Northern Province 2010 0.327 grant Proportion of budget estimated to be attributable as having climate relevance - water, sanitation, agricultural irrigation, and afforestation.
Zambia Adaptation Social Cash Transfers 2010 Zambian Government
0.3 grant Proportion of budget estimated to be attributable as having climate relevance.
180
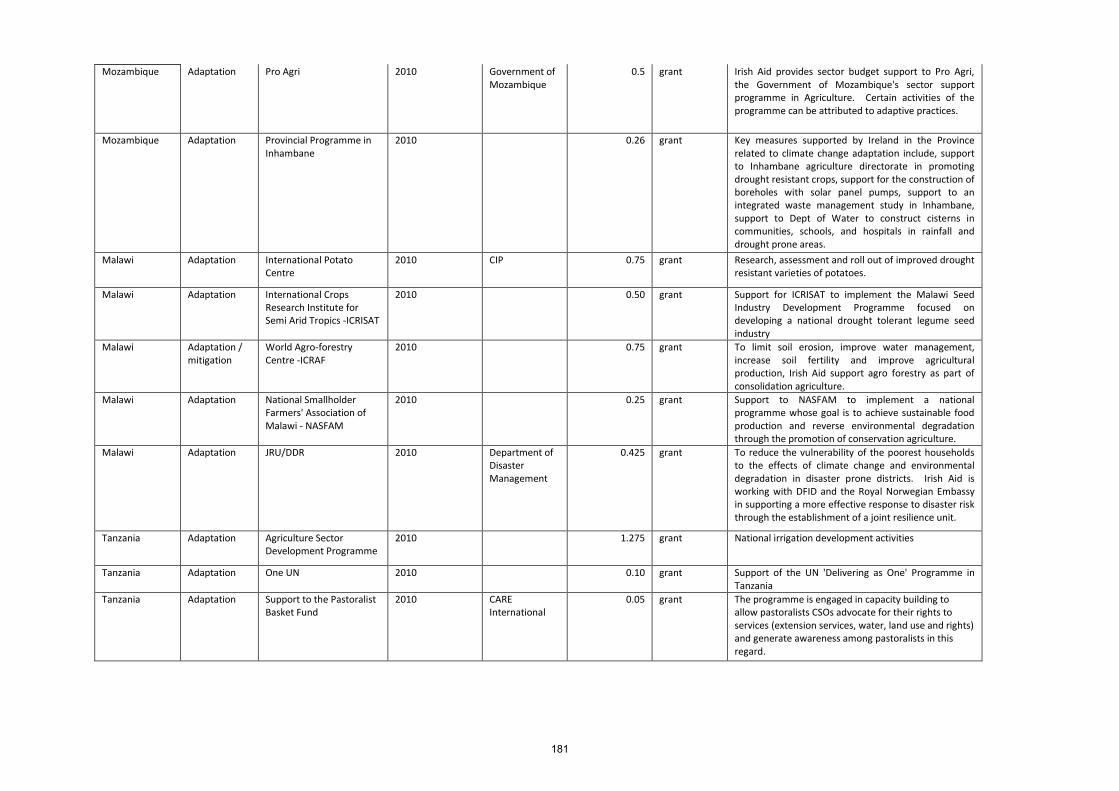
Mozambique Adaptation Pro Agri 2010 Government of Mozambique
0.5 grant Irish Aid provides sector budget support to Pro Agri, the Government of Mozambique's sector support programme in Agriculture. Certain activities of the programme can be attributed to adaptive practices.
Mozambique Adaptation Provincial Programme in Inhambane
2010 0.26 grant Key measures supported by Ireland in the Province related to climate change adaptation include, support to Inhambane agriculture directorate in promoting drought resistant crops, support for the construction of boreholes with solar panel pumps, support to an integrated waste management study in Inhambane, support to Dept of Water to construct cisterns in communities, schools, and hospitals in rainfall and drought prone areas.
Malawi Adaptation International Potato Centre
2010 CIP 0.75 grant Research, assessment and roll out of improved drought resistant varieties of potatoes.
Malawi Adaptation International Crops Research Institute for Semi Arid Tropics -ICRISAT
2010 0.50 grant Support for ICRISAT to implement the Malawi Seed Industry Development Programme focused on developing a national drought tolerant legume seed industry
Malawi Adaptation / mitigation
World Agro-forestry Centre -ICRAF
2010 0.75 grant To limit soil erosion, improve water management, increase soil fertility and improve agricultural production, Irish Aid support agro forestry as part of consolidation agriculture.
Malawi Adaptation National Smallholder Farmers' Association of Malawi - NASFAM
2010 0.25 grant Support to NASFAM to implement a national programme whose goal is to achieve sustainable food production and reverse environmental degradation through the promotion of conservation agriculture.
Malawi Adaptation JRU/DDR 2010 Department of Disaster Management
0.425 grant To reduce the vulnerability of the poorest households to the effects of climate change and environmental degradation in disaster prone districts. Irish Aid is working with DFID and the Royal Norwegian Embassy in supporting a more effective response to disaster risk through the establishment of a joint resilience unit.
Tanzania Adaptation Agriculture Sector Development Programme
2010 1.275 grant National irrigation development activities
Tanzania Adaptation One UN 2010 0.10 grant Support of the UN 'Delivering as One' Programme in Tanzania
Tanzania Adaptation Support to the Pastoralist Basket Fund
2010 CARE International
0.05 grant The programme is engaged in capacity building to allow pastoralists CSOs advocate for their rights to services (extension services, water, land use and rights) and generate awareness among pastoralists in this regard.
181

Ethiopia Adaptation Productive Safety Net Programme (PSNP)
2010 1.00 grant Proportion of budget estimated to be climate change relevant. The programme contributes to protecting the most vulnerable people in Ethiopia from the impacts of droughts and floods through environmental restoration projects.
Ethiopia Adaptation Bale Mountains Programme
2010 0.25 grant Block Grant funding to regional government. Proportion of budget estimated to be climate change relevant.
Ethiopia Adaptation Operational Research 2010 0.08 grant The Agriculture Operational Research Programmes based in Awassa and Mekelle Universities contribute to raising the capacities of farmers and researchers to improve food security and promote sustainable livelihoods in the Southern Nations and national People Republic and Tigray regions of Ethiopia
Ethiopia Adaptation Regional (Tigray) support programme
2010 Ethiopian Govt. 0.50 grant Building resilience to drought and hunger by halting and reversing environmental degradation.
Somalia, Ethiopia, Kenya, Sudan, Uganda
Adaptation Horn of Africa - FAO drought response program
2011 FAO 0.13 grant Building climate resilience
Ethiopia Adaptation Productive Safety Nets Programme
2011 Govt. Of Ethiopa
8.00 grant This government led multi donor programme provides food and cash support for approx. 7 million Ethiopians on an annual basis improving their reslience to climatic shocks
Malawi Adaptation Improved crop productivity and soil fertility management
2011 Various NGOs 5.15 grant Support to civil society and government to improve peoples resilience through use of climate smart agriculture practises and technologies.
Tanzania Adaptation Agricultural Sectoral Support Programme
2011 Govt of Tanzania
4.43 grant Promotion within the sectoral programme of conservation agriculture, use of drought resistent crops, and drip fed irrigation systems
Ethiopa Adaptation Tigray Regional Support programme
2011 Govt Of Ethiopia
2.00 grant Support to this drought prone region aimed at increasing resilence to climatic and other shocks
Lesotho Adaptation Improved Rural Water and Sanitation
2011 Govt. of Lesotho
1.70 grant Improving rural populations resilience to climate change impacts through provision of rural water supply and sanitation facilities.
Zambia Adaptation Northern Province Support Programme
2011 Govt of Zambia 0.79 grant Water and sanitation interventions, climate smart agriculture, and afforestation activities are all covered under this programme.
Ethiopia Adaptation Household Asset Building Programme
2011 Govt. Of Ethiopa
0.50 grant This is a sister programme of the PSNP and seeks to help people graduate from the PSNP, building the assets of household, and improving their resilience to climatic and other shocks. It supports on and off farm activities income generating opportunities by providing
182

appropriate credit and expertise.
Uganda Adaptation Karamoja Livelihood Support programme
2011 Oxfam 0.50 grant This programme addresses the key vulnerabilities of this mainly pastoralist community, increasing their resilience to climatic and other shocks
Tanzania Adaptation Pastoralist Support Programme
2011 Various NGOs 0.45 grant Support for Basket fund for actions aimed to improve the livelihoods of pastoral communities, including improving their resilience to climatic shocks
Ethiopia Adaptation Smallholder Livelihoods Improvement Project
2011 SOS Sahel 0.30 grant The project seeks to promote climate smart agriculture practises, addressing issues of soil erosion, deforestation, and general environmental degradation.
Lesotho Adaptation Climate / Hunger initiatives
2011 CRS 0.20 grant Livelihood support programme, using climate smart agriculture interventions
South Africa Adaptation Water Research Commission
2011 Govt of South Africa
0.20 grant Support to water commission to research future water provision under climatic variability
Ethiopia Adaptation Agriculture Operational Research
2011 Irish and Ethiopian Universities
0.15 grant Operational research programme, identifying best farming practises to respond to climate variation and climatic shocks
Ethiopia Adaptation Womens Association 2011 Womens Association Tigray
0.15 grant Improving womens resilience to climatic and other shocks through livelihood measures, including building women's access to political economic and social rights. improving land access rights
Ethiopia Adaptation Rural Eco Tourism initiative
2011 TESFA 0.02 grant Livelihood support programme, diversifying peoples livelihoods, increasoing their resilience through development of sustainable agri tourism industry.
Mozambique Adaptation Regional Support Programme
2011 Govt. Of Mozambique
1.78 grant Support to this drought prone region aimed at increasing resilence to climatic shocks
Zambia Adaptation Social Cash Transfer 2011 Govt of Zambia 1.10 grant Social protection programme to increase the resilience of the poorest.
Malawi Adaptation Disaster risk reduction and stregthening resilience programme
2011 Govt of Mozambique and Donor partners
0.77 grant Multi donor support to advance disaster risk reduction measures and local and national level
183

Mozambique Adaptation Agricultural Sectoral Support Programme Pro Agri
2011 Govt of Mozambique
0.75 grant Funding of sectoral programme, including research to climate proof the sector
Ethiopia Adaptation Rural Women's Economic Empowerment
2011 Farm Africa 0.05 grant This initiative seeks to improve poor rural womens resilience to climate change through access to credit, livelihood diversification and income generating activities
Vietnam Adaptation/ mitigation
One UN support initiative 2011 UNDP 0.05 grant Number of climate relevant initiatives support, including stregthening capacity of climate negotiators, DRR, REDD etc.
Lesotho Mitigation Health systems support 2011 Govt. of Lesotho
0.10 grant Installation of solar PV energy systems in remote Health Centres
Vietnam Mitigation Civil Society Support 2011 Various NGOs 0.07 grant Fuel efficient stoves promotion, energy saving measures in Hanoi city
Ethiopia Adaptation Productive Safety Nets Programme
2012 Govt. of Ethiopia
8.00 grant This government led multi donor programme provides food and cash support for approx.7 million Ethiopians on an annual basis improving their resilience to climatic induced shocks
Ethiopia Adaptation Household Asset Building Programme
2012 Govt. Of Ethiopa
0.50 grant This is a sister programme of the PSNP and seeks to help people graduate from the PSNP, building the assets of household, and improving their resilience to climatic induced shocks. It supports on and off farm activities income generating opportunities by providing appropriate credit and expertise.
Ethiopa Adaptation Tigray Regional Support programme
2012 Govt Of Ethiopia
1.50 grant Support to this drought prone region aimed at increasing resilience to climatic induced shocks
Ethiopia Adaptation Smallholder Livelihoods Improvement Project
2012 SOS Sahel 0.60 grant The project seeks to promote climate smart agriculture practises, addressing issues of soil erosion, deforestation, and general environmental degradation.
Ethiopia Adaptation Rural Women's Economic Empowerment
2012 Farm Africa 0.05 grant This initiative seeks to improve poor rural womens resilience to climate change through access to credit, livelihood diversification and income generating activities
Ethiopia Adaptation Rural Eco Tourism initiative
2012 TESFA 0.01 grant Livelihood support programme, diversifying people’s livelihoods, increasoing their resilience through development of sustainable agri tourism industry.
Ethiopia Adaptation Agriculture Operational Research
2012 Irish and Ethiopian Universities
0.22 grant Operational research programme, identifying best farming practises to respond to climate variation and climatic shocks
184

Ethiopia Adaptation International Potato Centre (CIP)
2012 CIP 0.15 grant Assistance to smallholder farmers to grow more productive varities of potato and increase farmers incomes.
Lesotho Mitigation Health systems support 2012 Gov of Lesotho 0.02 grant Installation of solar PV energy systems in remote Health Centres
Lesotho Adaptation Emerging Needs - Flooding relief
2012 Gov of Lesotho 0.75 grant Support to Disaster Management Fund established by Government of Lesotho following 2011 floods.
Vietnam Adaptation/ mitigation
One UN support initiative 2012 UNDP 0.05 grant Number of climate relevant initiatives support, including stregthening capacity of climate negotiators, DRR, REDD etc.
Vietnam Mitigation Civil Society Support 2012 Various NGOs 0.13 grant Sustainable management of natural resources, livlihoods enhancement in Hanoi, education on responses to natural disasters (typhoons) in Quang Binh and Quang Tri provinces.
Vietnam Adaptation Programme 135 2012 Govt of Vietnam (CEM)
0.55 grant National Targeted Programme for Sustainable Reduction of Poverty amongst marginalised communities including ethnic minorities.
Mozambique Adaptation Regional Support Programme - Inhambane Province
2012 Govt. Of Mozambique
0.65 grant Support to this drought prone region aimed at increasing resilence to climatic induced shocks
Mozambique Adaptation Livelihoods/Farmer Support/Resilience Prog
2012 CARE & TECHNOSERVE
1.00 grant Programmes to improve resilience of small holder farmers during dry season and increased productivity and access to markets
Mozambique Adaptation Climate Change 2012 Govt of Mozambique
0.55 grant Programme to enhance environmental sustainability
Mozambique Adaptation Decentralisation (Municipalities - PDA)
2012 Govt of Mozambique
0.35 grant Urban poverty reduction, sustainable development of municipalities and addressing challenges of climate change.
Malawi Adaptation Improved crop productivity and soil fertility management
2012 Various NGOs 3.67 grant Support to civil society and government to improve peoples resilience through use of climate smart agriculture practises and technologies.
Malawi Adaptation Disaster risk reduction and stregthening resilience programme
2012 Govt of Malawi and Donor partners
0.69 grant Multi donor support to advance disaster risk reduction measures and local and national level
South Africa Adaptation Water Research Commission
2012 Govt of South Africa
0.20 grant Support to water commission to research future water provision under climatic variability
South Africa Adaption Limpopo Water Consortium
2012 Various NGOs (LINGO)
0.80 grant Support to improvement of water and sanitation services in Limpopo Province
Tanzania Adaptation Agricultural Sectoral Support Programme
2012 Govt of Tanzania
4.00 grant Promotion within the sectoral programme of conservation agriculture, use of drought resistent crops, and drip fed irrigation systems
Tanzania Adaptation Pastoralist Support Programme
2012 Various NGOs 0.40 grant Support for Basket fund for actions aimed to improve the livelihoods of pastoral communities, including improving their resilience to climatic shocks
185

Tanzania Adaptation One UN support initiative 2012 UN 0.10 grant Reducing emissions from deforestation, assistance to Government management of disasters, mainstreaming disaster management into development programmes
Tanzania Adaptation Cocoa Value Added/Market Programme
2012 TechnoServe 1.00 grant Improved livlihoods for pastoralists and smallholders including assistance with access to markets, use of environmentally friendly insecticides and crop bio-diversity.
Uganda Adaptation Karamoja Livelihood Support programme
2012 Oxfam 0.33 grant This programme addresses the key vulnerabilities of this mainly pastoralist community, increasing their resilience to climatic shocks
Zambia Adaptation Northern Province Support Programme
2012 Govt of Zambia 0.47 grant Water and sanitation interventions, climate smart agriculture, and afforestation activities are all covered under this programme.
Zambia Adaptation Social Cash Transfer 2012 Govt of Zambia 1.35 grant Social protection programme to increase the resilience of the poorest.
186

CHAPTER 8: RESEARCH AND SYSTEMATIC OBSERVATION 8.1 Introduction 8.2 General Policy on funding of Research and Systematic Observations 8.3 Exchange of data and information 8.4 Climate Change Research
8.4.1 Climate Process and Climate Systems Studies including Paleoclimate 8.4.2 GHG Emissions and Sinks 8.4.3 Peatlands 8.4.4 Top down analysis of GHG emissions and sinks
8.5 Modelling and Prediction, Impacts and Adaptation 8.5.1 Observations and Indicators of Climate Change 8.5.2 Projections of Climate Change 8.5.3 Analysis of Impacts, Risk, Vulnerability and costed adaptation options 8.5.4 Paleoclimateology 8.5.5 Information systems and supports for policy and decision making
8.6 Socio-Economic Analysis and Technologies 8.6.1 Socio-economic analysis 8.6.2 Mitigation Technologies 8.6.3 Model Development
8.7 Cross cutting Issues 8.7.1 Aerosol Radiative Impacts
8.8 International Participation 8.9 Systematic Observation
8.9.1 Atmospheric Observations 8.9.2 Oceanic Observations 8.9.3 Terrestrial Observations
ANNEX I to Chapter 8
187

Ireland has developed a well structured climate change research programme which is primarily aimed at informing and supporting climate change policy implementation and development and informing actions by stakeholders. Ireland carries out an extensive range of systematic observations of essential climate variables and also hosts a range of advanced observations which are part of regional and global networks. Information and analysis from research and systematic observation systems are made available to key stakeholders and the public. Ireland actively engages with process at the science to policy interface including contributing to the work of the IPCC and engagement with UNFCCC Subsidiary Body on Scientific and Technical Advice (SBSTA). 8.1 Introduction Research and systematic observations are essential to understanding and responding to climate change. Ireland has advanced a series of initiatives to support, develop and co-ordinate, climate change research as part of a national programme. Systematic observation of ECVs99 are being developed by building on existing observation systems in the atmospheric, ocean and terrestrial domains and though investment in new systems. An overview of these is provided here, in the context of the administrative and operational structures under which these take place. 8.2 General policy on funding of Research & Systematic Observations In Ireland funding for climate change research, systematic observations and related activities is provided though a number of state agencies and organisations. The budgetary allocations are provided via relevant Government Departments. Since 2007 research funding at a national level has been provided through the NDP 2007-2013. However, the level of funding has been significantly reduced since 2008 due to the economic crisis. Investment in the development of climate change research was also made under earlier programmes. Climate related systematic observations are funded as a component of the operational activities of a number of state bodies as outlined in Table 8.1. Observations carried out by research institutions are funded through research programmes. Direct funding for environmental research is the responsibility of DECLG who have mandated the EPA to undertake the task of management of this research allocation. The NDP 2007-2013 also included some additional funding for climate change research. This allowed for the development of a structured CCRP with improved coordination and communication processes. However, while the additional NDP funding ceased in 2009, the structure was retained. The CCRP is structured along thematic areas as shown in Figure 8.1.
99
Essential Climate Variables are identified in adequacy reports provided by the Global Climate Observing System secretariat.
188

FIGURE 8.1 Figure 8.1. A schematic of the organisational structure of Climate Change Research in Ireland based on thematic research in four areas; (1) Greenhouse gas emissions and sinks, (2),climate change impacts and adaptation,(3) socio-economic analysis and technologies focused mitigation and adaptation solutions and (4) trans-boundary air pollution/ short life climate forcers. Cross cutting activities include observation systems and data /information. This was reported in the 5th National Communication, since then ownership of activities within the programme has been more diverse with specialist agencies and bodies advancing research in key topic areas for Ireland e.g., the agriculture sector. There has also been a growing engagement with pan European research work through the Joint Programming Initiatives (JPIs) and the development of wider international links. The overall objective of the CCRP remains to advance research or a cross sectoral basis through enhanced coordination, avoiding duplication and increasing overall use and value of research. This includes research funded by the EPA and through other Government Departments who have similarly devolved responsibility for research funding. Topics and areas covered include; energy research funded by Sustainable Energy Ireland; agriculture research and soil carbon analysis funded through DAFM and Teagasc (www.teagasc.ie); forest research funded by the DAFM under the CoFoRD programme (www.agriculture.gov.ie); research funded by the Marine Institute (www.marine.ie); and socio-economic and enterprise orientated research being advanced by Forfás (www.forfas.ie) and Enterprise Ireland (www.enterprise-ireland.com). Climate change related studies are also supported by investments made by such as SFI (www.sfi.ie) and the HEA (www.hea.ie) which provides funding for university and other educational institutions. The research priorities identified in the Forfás research prioritisation process and adopted at Government level also contribute to advancing areas of climate change research, for example: Sustainable Food Production and Processing, Marine Renewable Energy and Smart Grids and Smart Cities. The SEAI is also active in advancing elements of this work and developed the national action plans for research in Marine Renewable Energy100 and Smart Grids & Smart Cities101. These plans set
100
http://www.seai.ie/Renewables/Energy_Research_Portal/National-Energy-Research/J-Marine-Renewable-Energy-AP.pdf 101
http://www.seai.ie/Renewables/Energy_Research_Portal/National-Energy-Research/K-Smart-Grids-and-Smart-Cities-AP.pdf
189

out a programme of action for establishing a co-ordinated approach to five sets of issues: funding strategy; research infrastructure; tackling skills issues; enabling technology transfer and commercialisation, and alignment with regulations and standards. As the national contact point for EU energy research programmes, SEAI provides information and mentoring support to prospective Irish proposers. Following the call for proposals under the EU Framework Programme for Research, funding offers totalling €5m were issued to successful Irish proposers. This brings total funding secured over the seven-year term of the programme to €25m. Annex I to this Chapter provides more details of the Renewable Energy RD&D Programme. The national meteorological service, Met Éireann, operates a climate analysis and modelling section from within its own budget and has primary responsibility for systematic observations of meteorological parameters. Individual NGOs have also been engaged in research initiatives.
8.3 Exchange of data and information Meteorological data for climate change related research are provided on request by Met Éireann. All such data are provided free, or at cost, for research purposes. The EPA has provided online access to its archive of non-meteorological climate change related data. This is accessible from www.safer.ie which is a development under the EPA Environmental Research Centre of Excellence (http://coe.epa.ie/). This includes data on national GHG emissions and sinks. These data are open access. Further use of research data is subject to standard publication protocols. 8.4 Climate Change Research Climate change research has developed significantly under the current and previous National Development Plan. The planned EPA investment in climate research over the 2007-2013 period is of the order of €18m. An equivalent sum has been provided by other bodies leading on sectoral research in the areas of energy, agriculture, forestry and marine research. Research projects are largely carried out in the university sector, but also in specialised state bodies and by consultants. This investment has enabled enhanced domestic capacity and provided information on a range of climate issues. 8.4.1 Climate Process and Climate Systems Studies including Paleoclimate Climate processes and systems studies are cross-cutting elements of work being carried out under the thematic areas identified above in a broad spectrum of research. Paleo-climate work has been advanced through a number of national and EU research programmes. These are summarised in the following sections.
8.4.2 GHG Emissions and Sinks The main objective of this thematic research area is to support improvement of the national emissions inventory, projections of future emissions and inform management options. A key aim is to ensure that the national inventory is based on the best possible science and, where feasible, subject to independent scientific verification. The topics of projects in this area include:
Emissions from livestock through enteric fermentation;
Emissions from other agriculture sources e.g. fertilizer use, manure storage and land application technologies and practices;
Land fill gas management and utilisation;
LULUCF; and
Top down analysis of greenhouse gas emissions and sinks based on observations and modelling.
190

Since the 5th National Communication much of the agriculture related research is led by Teagasc, in close collaboration with third level institutes. The EPA research programme is complemented by funding by DAFM, Teagasc and SEAI . In particular, DAFM has funded an important initiative, the Greenhouse Gas Consortium, which brings together researchers from a number of research institutions, led by Teagasc, to address GHG emissions associated with agriculture in Ireland, and adaptation issues. Due to Ireland’s GHG emissions profile there is a significant focus on the agricultural sector and land-use land-use change issues including work on enteric fermentation and options to reduce these emissions e.g. dietary supplements. This work has been initiated through EPA funding and progressed under the DAFM stimulus projects. Work on LULUCF has focused on the integration of data from various sources (remote sensing, administration etc.) to provide robust activity data related to land management practices and soil process observation and modelling to quantify the impact of management on GHG emissions and removals. Ireland has developed Tier 3 methodologies for reporting CO2 emissions and removals associated with forest lands. Country specific research aims to provide at least Tier 2 emission factors and methodologies for agricultural land use. A number of research initiatives have been undertaken to help quantify carbon stock changes in response to land use management. Field scale, flux measurement experiments have been carried out on grasslands, croplands, peatland and forest land (using both chamber and eddy covariance methodologies). The sites have been in operation for a number of years and are contributing to the production of country specific emissions profiles. These studies have been initiated to links with European projects such as CarboEurope, NitroEurope and follow-on programmes including ICOS and InGOS. An important development has been the exploration of various process models, such as the ECOSSE and DNDC to analyse Carbon and N2O emissions. The EPA funded the SOILC project, which has made detailed measurements of soil carbon at 60 representative sites across the country identified from analysis of the National Soil Database. The CoFoRD funded FORESTC has provided data for 60 additional forest sites using the same sampling methodology. Quantification of land -use and land- use change is being addressed through on-going engagement with the CORINE and other remote sensing platforms, with additional research on adapting existing national land parcel information systems data for land use tracking purposes. This work informs national inventory analysis for UNFCCC reporting purposes as well as providing information for decision making. All efforts to quantify carbon stock change are being included in the Irish Soil Information System (ISIS) project. This project will provide a 1:250,000 soils map of Ireland and an associated Soil Information System which will be fully open and accessible to all. 8.4.3 Peatlands Approximately 17%-20% of lands in Ireland are peatlands, or have peat as a substrate. It is estimated that these lands contain between 53-62% of the total soil carbon stock102. The need to ensure the sustainability of peatlands has been recognised through the establishment of the large scale integrated sustainable development project, BOGLAND, which reported findings and
102
Reference to Tomlinson (2005,2006), Kiely (2008) and Connolly (2009)
191
recommendations in 2011103. A number of follow-on studies, funded by EPA, have focused specifically on the impact of management on drained and restored wetlands. Greenhouse gas emissions and sinks associated with human intervention of peatlands are reported under the UNFCCC under three IPCC land use categories: Wetlands, Forest land and Grassland104, and identified through analysis of land cover and the specific land use declared by land managers. Peatland under forest and grass are assumed to be subject to artificial drainage and carbon losses are estimated using country specific emission factors and methodologies. Peatlands within the Wetlands category are dominated by areas of degraded and pristine peatland ecosystems. Recent research has estimated that at least 74% of these lands exist in a degraded condition, with other estimates of greater than 90%105,106. These degraded peatlands have largely reverted to ecosystem classes which resemble pristine peatlands but with disturbed patterns of biodiversity, and with a much reduced resilience and carbon sequestration potential. Ireland welcomes the recent acceptance of 2013 Supplements to the IPCC 2006 guidance107 for inventories. Ireland will consider these in the context of on-going research into GHG emissions and sinks, country specific conditions, the development of inventory methodologies and potential reporting under Article 3.4 activity Wetlands Drainage and Rewetting. There may be carbon emission mitigation, and sequestration options available with the adoption of policies related to peatland restoration and re-vegetation. A first step in the assessment of such options is the mapping and classification of the state of national peatlands, and also the response of peatland to active restoration management and additional studies have been undertaken to assess usage of cutaway and degraded peatland. 8.4.4 Top down analysis of GHG emissions and sinks At a macro-scale, work on the application of inverse modelling techniques has been applied to ambient measurements of greenhouse gases at the Mace Head atmospheric research station. These methods have been applied to estimate Irish emissions and sinks for certain greenhouse gases including industrial gases. The general approach is to develop complementary bottom-up, top-down and intermediate scale analyses in order to provide cross-validation of research outputs. The EPA has advanced work in this area through the establishment of GHG measurements at sites in the North and South East of the country. This effectively triangulates Ireland and is a part of the Irish contribution to the EU ICOS. This is a large-scale European infrastructure development.
103
Florence Renou-Wilson, et al, (2011). BOGLAND: Sustainable Management of Peatlands in Ireland -
PROTOCOL DOCUMENT, STRIVE Report 76, ISBN: 978-1-84095-404-3
104 P. Duffy, et al.,2013, Ireland National Inventory Report 2013, Greenhouse Gas Emissions 1990-
201,1Reported to the United Nations Framework Convention on Climate Change, Published online by the
Environmental Protection Agency, Ireland
105 CONNOLLY, J., HOLDEN, N. M. & WARD, S. M. 2007. Mapping peatlands in Ireland using a rule-based
methodology and digital data. Soil Science Society of America Journal, 71, 492–9.
106 Clarke, D. 2006, Brief History of the Peat Industry in Ireland, Irish Peat Society Seminar Proceedings.
107
IPCC,2013, Decisions of the 37th
Session of the IPCC, Batumi, Georgia,.
http://www.ipcc.ch/scripts/_session_template.php?page=_37ipcc.htm
192

8.5 Modelling and Prediction, Impacts and Adaptation 8.5.1 Observations and Indicators of Climate Change Analysis of climate change indicators is ongoing. An updated report on analysis of climate change indicators was produced in 2007108. This report provided a detailed analysis of signals of climate change from meteorological records. Research on ecosystem indicators and impacts has been advanced with a large scale investment in the development of phenological observation systems. The study Climate Change Impacts on Phenology: Implications for Terrestrial Ecosystems (Donnelly et al, 2013)109 demonstrated that the warmer Irish climate has led to a change in the seasonal cycle of a range of plant and animal species. This study also contributed to Europe wide indicators analysis. Research on hydrological indicators for climate change was progressed through the the Hydrodetect project (Murphy et al., 2013). The study identified a reference network of river flow stations which are fundamental in understanding the complex changes that are happening in Ireland. Analysis of this data highlights the sensitivity of Irish hydrology to both climate change and climate variability. Analysis of change from the reference network shows an increase in the size of flood events, particularly since the late 1990s for many stations. 8.5.2 Projections of Climate Change A regional climate modelling facility was established in Met Éireann in 2003 to provide forecasts of the future climate and to examine the impacts of climate change at a regional scale. A comprehensive report110 was released in 2008, describing the expected changes in a variety of climate parameters and the likely impacts for water resources, flooding potential, wind energy, etc. Climate modelling is now a core activity in Met Éireann and new global model simulations carried out in Ireland by Met Éireann (2013) provide an update on the expected changes in the Earth’s climate over the 21st Century. It was a partner in the EU-funded ENSEMBLES project and has run centennial climate simulations for the European area. Together with University College Dublin (UCD) and the Irish Centre for High-End Computing (ICHEC), it has contributed to the scientific development of a new global climate model (EC-Earth), performing centennial-scale simulations with the model and contributing to the coupled model intercomparison project (CMIP5) for assessment by the IPCC in the AR5 report. This Multi Model Ensemble approach provides the basic data to assess the impacts of climate change on Ireland. Statistical downscaling approaches to analysis of future climate conditions have also been developed in the university sector. The output from this work informs impacts analysis which aims to quantify regional and sectoral impacts of future climate conditions. Ireland’s coastline and waterways may be particularly vulnerable to climate change impacts. Targeted research has been established to look at coastal zone issues and management options. This work is also linked to other regional studies in Europe (www.imcore.eu). Links between the development of river modelling tools and climate impacts modelling have also been advanced.
108
Key Meteorological Indicators of Climate Change, in Ireland, McElwain and Sweeney, 2007 ERC Report Series No. 6. 109
http://www.epa.ie/pubs/reports/research/climate/CCRP_22.pdf 110
Ireland in a Warmer World. Scientific Predictions of the Irish Climate in the Twenty-First Century (available at http://www.c4i.ie)
193

8.5.3. Analysis of impacts, risk, vulnerability and costed adaptation options A National Climate Change Vulnerability Scoping study (2013) was undertaken to identify first generation vulnerabilities for Ireland. The priority sectors identified for further investigation are: biodiversity and fisheries; Water resources and the built coastal environment; forestry and agriculture. An overarching study, Co-ordination, Communication and Adaptation for Climate Change in Ireland: an Integrated Approach (COCOADAPT) (Sweeney et al., 2013)111 provided recommendations on how key sectors and vulnerable areas could increase their resilience to climate change through adaptation. These include the water sector, biodiversity, construction and tourism. The Coastal Climate Adaptation in Ireland (CLAD) study (Falaleeva et al., 2013)112 developed a tool for climate adaptation in response to the need for capacity building at the coastal zone. The outputs provide coastal communities with a tool for climate adaptation planning based on local resources. The study of Extreme Weather, Climate and Natural Disasters in Ireland (Kiely et al., 2010)113 collated historical, proxy and observational (recent) records, and analysed the information for incidences of extreme weather events and natural disasters in Ireland. The study concluded there has been an increase in extreme rainfall events since the mid-1970s, which is observed in some river flow records. 8.5.4 Paleoclimateology Irish peatland and lake systems provide a rich source of information on long-term climate change. The NUIG based Paleoenvironmental Research Unit (www.nuigalway.ie/pru/) has a very active research programme on the late-glacial period c. 15,000 to 11,500 years Before Present and Holocene environments in Ireland. 114 Studies in TCD have advanced the application of statistical methods to the reconstruction of past climate, based on pollen analysis (www.tcd.ie/Statistics/). A summary analysis of paleoclimate research has been provided in an analysis of the implications of the EU’s two degree climate protection target for Ireland115. More recent research within this group has explored the signal of changing precipitation in peat accumulation in Ireland and the contrasting conditions associated with the Medieval Warm Period and the Little Ice Age116.
111
http://www.epa.ie/pubs/reports/research/climate/CCRP_30.pdf 112
http://www.epa.ie/pubs/reports/research/climate/CCRP_28.pdf 113
http://www.ucc.ie/hydromet/files/epa.2010.pdf 114
Ghilardi, B. and O’Connell, M. 2013. Early Holocene vegetation and climate dynamics with particular
reference to the 8.2 ka event: pollen and macrofossil evidence from a small lake in western Ireland. Vegetation
History and Archaeobotany,22, 99–114
Schettler, G., Romer, R.L., O’Connell, M. and Molloy, K. 2006. Holocene climatic variations and postglacial sea-
level rise geochemically recorded in the sediments of the brackish karst lake An Loch Mór, western Ireland.
Boreas, 35, 674-692
115 Implications of the EU climate protection target for Ireland McElwain and Sweeney, 2007 ERC Report Series
No. 5 116
Charman, D.J., et.al., A 1000-year reconstruction of summer precipitation from Ireland: Calibration of a peat-based palaeoclimate record, Quaternary International (2011), doi:
194

The recently completed national sea-bed survey by Geological Survey Ireland (www.gsi.ie) and the Marine Institute has provided a detailed morphology of seabed features and information on composition creating a framework for future paleoclimate studies (www.gsiseabed.ie). A recent EPA study of extreme events provided an opportunity to review synthesis and information on such events from a range of proxy sources including paleo and tree ring data, and unique monastic archives. This study showed a link between pre-instrumental written records of extremely adverse weather conditions in Ireland and regional volcanic events117. 8.5.5 Information systems and supports for policy and decision making The National Adaptive Capacity Assessment (Desmond and Shine, 2012) established that there is adequate information and data available in Ireland to begin planning for climate change adaptation. This was further recognised by the publication of the National Climate Change Adaptation Framework (2012). In order to support decision makers in meeting the requirements of the NCCAF and the EU Adaptation Strategy (2013) a centralised information resource, Climate Ireland (www.climateireland.ie) is being developed. The aim of ICIP is to facilitate decision makers to transition through the phases of the adaptation cycle, overcome the barriers presented and, through the use of policy-orientated decision support tools, address the requirements of the NCCAF and the EU Adaptation Strategy. The system complements the European Climate Adaptation Platform (Climate Adapt). 8.6 Socio-Economic Analysis and Technologies Research on socio-economic analysis and technologies is advanced under Theme 3 of the CCRP. Work in this area is solution focussed. It aims to analyse and identify new approaches to mitigation and adaptation. A key aim is to identify pathways for achievement of a carbon/GHG neutral Ireland by 2050. This provides a framework for integrated analysis of solutions including new and emerging technologies. The types of projects in this area include:
Socio-economic studies and analysis of national and international targets;
Mitigation technologies including Carbon Capture and Storage;
Sectoral (energy, transport) and integrated assessment modelling. In addition to the EPA’s research, work in this area is advanced by DCENR/SEAI, Forfás, SFI, DAFM, and DTTAS. 8.6.1 Socio-economic analysis Studies have been developed to determine economic and social impacts of climate change. These have principally been focused on impacts of energy/carbon taxes, lifestyles, business and competitiveness during transformation to a low carbon economy. Ongoing analysis is focused on EU targets and issues arising from differentiation of the ETS and non-ETS sectors. 8.6.2 Mitigation Technologies The EPA has engaged in the promotion of the EC Environmental Technologies Action Plan (ETAP) within Ireland, which includes low emission technologies. There is ongoing research in relation to energy efficiency and sustainability mainly funded by SEAI. This includes work on research on the efficient use of energy, CHP and renewable energy sources including biofuels. Ocean energy research is promoted by SEAI and the Marine Institute. This is considered to have considerable long term potential for Ireland. However, significant technical and other barriers exist in relation to this potential.
117
Francis Ludlow, et al, 2013, Medieval Irish chronicles reveal persistent volcanic forcing of severe winter cold events, 431–1649 CE , ,Environ. Res. Lett. 8 024035
195

The potential for geological storage of carbon dioxide has been explored in two studies. The first study based on existing data, was carried out on an all-island basis. This identified a significant theoretical potential for CCS, particularly in relation to depleted gas fields off the south coast of Ireland. A more detailed second study examined the potential of a region of specific interest. 8.6.3 Model development The EPA and SEAI are supporting the development of energy modelling capacity for Ireland based on the international TIMES model (www.etsap.org/Tools/TIMES.htm). This work provides analysis of energy pathways for achievement of medium term targets for renewable energy and GHG emissions, and longer term emission mitigation targets i.e. up to 2050. Current work is focussed on linking the TIMES model to more accurate representation of the Irish electricity system and in another initiative, linking up with long-term modelling of GHG emissions from agriculture to offer a more comprehensive view of GHG emissions in Ireland. The EPA is supporting integrated assessment modelling which is a powerful tool for the provision of sectoral and cross sectoral analysis of targets and cost effectiveness of policies and measures to meet these targets. This approach has been applied to trans-boundary pollutants and greenhouse gas emissions using the GAINS model (http://gains.iiasa.ac.at/) and applying it to Ireland. 8.7 Cross cutting issues Cross cutting studies aim to address synergies and trade-offs between policy objectives and sectors and include some fundamental atmospheric processes. These include work on integrated assessment modelling, development of integrated approaches to mitigation and adaptation as well as areas like air quality and climate change.
8.7.1 Aerosol Radiative Impacts Historically Irish scientists have made important contributions to the development of atmospheric sciences. In recent years national research has focused on aerosol science and aerosol cloud inter-actions. Aerosol radiative forcing provides most of the uncertainty in relation to anthropogenic forcing of climate. An extensive range of aerosol measurements and other atmospheric composition studies are carried out at the Mace Head Atmospheric Research Station118 operated by the National University of Ireland, Galway. Mace Head is a Global Atmospheric Watch site. These are funded through national and international sources. Process studies are considered to include work on GHG emissions and sinks, analysis of peatlands, studies of aerosol radiative impacts and paleoclimate analysis. Aerosol climate studies have been largely focused on aerosol air sea exchange processes119, and linked changes in direct and indirect radiative focusing by aerosols. The aim is to improve paramerterisation of these in climate models. 8.8 International Participation
118
Jakub Bialek et al,,(2012), On the contribution of organics to the North East Atlantic aerosol number,
Environ. Res. Lett. 7pp
J.-P. Pietikainen, et al, (2012) The regional aerosol-climate model REMO-HAM, Geosci. Model Dev., 5, 1323–
1339,
119 EPA LS project 07-CCRP-5.5.3a Exchange at the Air-Sea Interface: Air Quality, Atmospheric Deposition and
Noise & Climate Impacts, C. O’Dowd, NUI, Galway
196
Ireland recognises the international nature of climate change and the need to participate in global efforts. Research groups have strong links to research groups in Europe and beyond. The CCC coordinates activities in relation to international bodies such as the International Geosphere -Biosphere Programme (IGBP) and World climate Research Programme (WCRP). The development of national climate research capacity has enabled greater national participation in IPCC activities. A number of Irish scientists were lead or review authors in the IPCC fourth assessment report (AR4). Ireland hosted an IPCC workshop on uncertainty and risk. Irish scientists are contributing to the forthcoming IPCC special report on renewable energy. Ireland supports the EU European Space Agency (ESA) Global Monitoring for the Environment and Security (GMES) activities and influences and is part of the ESA Earth Observation research programme. Ireland is a member of the GEO and supports its development. Both GMES and GEO contribute to the development of sustained observations systems as required and in support of Global Atmospheric Observing Systems (GCOS). 8.9 Systematic Observation A number of national bodies/organisations are engaged in systematic observations including contributions to the GCOS. Met Éireann has primary responsibility for the atmospheric observations listed below, although the National University of Ireland, Galway also co-ordinates upper-air and composition observations at the Mace Head facility. Responsibility for terrestrial and oceanographic observations is divided among a number of State agencies including the EPA, Marine Institute, universities and other academic institutions. In order to respond to the Global Atmospheric Observing Systems Implementation Plan (GIP), the EPA (www.epa.ie ), MI (www.marine.ie ) and Met Éireann (www.met.ie ) established an assessment group to review the GIP and its implementation in Ireland. Under the coordination of this group, work is on-going on the implementation of the observations action plan for Ireland (Dwyer, 2009) 120. A key activity has been a comprehensive review of Ireland’s climate observation system and a report on the trends observed in time-series analysis of all the ECVs of relevance to Ireland (Dwyer, 2013) 121. Table 8.1 summarises the current monitoring status for these ECVs. It shows the length of the observation period, the key organisations carrying out the measurements, the level of analysis to date and the security of the measurement programme. The report concludes that many elements of a climate observation, analysis and reporting system are in place, but that there are a number of issues that need to be addressed in order to make it more robust and capable of addressing the country’s long-term needs with regard to climate monitoring and understanding. A number of recommendations to address these issues are made in the report. Work has also progressed on re-enforcing elements of the climate observation system across the atmospheric, oceanic and terrestrial domains and these are described in the relevant sections below.
120
Dwyer, N., 2009, Current Status and Required Actions for National Climate Observing Systems,
Environmental Research Centre Report 14, Environmental Protection Agency, Johnstown Castle,
http://www.epa.ie/pubs/reports/research/climate/ercreport14.html
121 Dwyer, N, 2013, The Status of Ireland’s Climate, 2012, Climate Change Research Programme Report 26,
Environmental protection Agency, Johnstown Castle,
http://www.epa.ie/pubs/reports/research/climate/ccrpreport26.html,
197
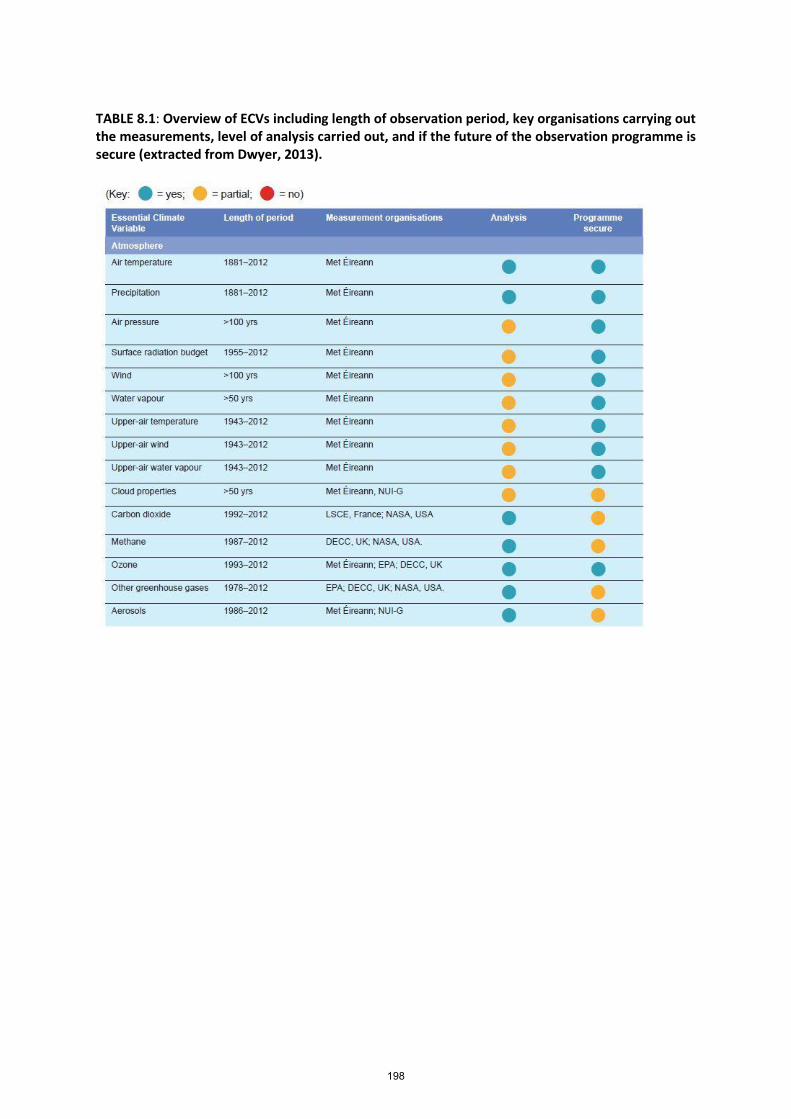
TABLE 8.1: Overview of ECVs including length of observation period, key organisations carrying out the measurements, level of analysis carried out, and if the future of the observation programme is secure (extracted from Dwyer, 2013).
198

8.9.1 Atmospheric Observations Ireland has three main groupings of meteorological observing stations:
25 Synoptic stations
70 Climate stations
450 Rainfall stations The synoptic station network consists of one Observatory (Valentia), four airport stations manned 24 hours, one inland station manned part time but with an Automatic Weather Station (AWS), and
199
sixteen unmanned AWS. The manned synoptic stations operated by Met Éireann provide hourly observations of the standard meteorological parameters, while most of the Automatic Weather Stations provide observations of the standard meteorological parameters by the minute. Both solar radiation and sunshine duration are observed at 5 synoptic stations. Solar radiation is measured at an additional 17 AWS. Sunshine duration only is measured at 3 other staffed synoptic stations. Further upgrades to the sunshine and radiation observation network are in progress. The climate station network consist of 70 stations which return daily values of Dry-bulb, Wet-bulb, Max and Min temperatures and rainfall; 15 of these also report daily sunshine. Approximately 50% of these stations report soil and earth temperatures at different depths. The daily readings are taken at 0900 GMT. Readings are taken by private individuals, Government bodies, local authorities, schools and colleges, etc. The rainfall station network consists of 452 stations which report daily rainfall at 0900 GMT and 39 stations which report monthly falls. Readings are provided by a variety of bodies and private individuals in the same way as for climate stations. In addition, there are 40 daily and 4 weekly Dines Tilting Syphon Rain Recorders in operation at various locations. There are also 15 evaporation stations using Class A pan evaporimeters. Data from all the above networks are archived by Met Éireann. These data are quality controlled and kept under continuous scrutiny by the Climatology and Observations Division. The stations are visited regularly by inspectors to ensure, as much as possible, that the siting of instruments and the accuracy of records conform to WMO standards. Records from some stations span more than 100 years. Much of the data since 1941 from the above stations are held in electronic form. Total column ozone (O3) has been measured at Valentia Observatory since 1993 using ground-based optical equipment. Since 1994 vertical ozone profiles are routinely measured using equipment carried on weather balloons. Air quality measurements are undertaken daily at the Observatory; a comprehensive analysis of air (SO4, NO3, NH4, Cl, Mg, Na, Ca, K) and precipitation (SO4, SO2, NH4, NO3, Na, Ca, Mg, K – including pH and conductivity) is performed by Met Éireann in Dublin for Valentia and a number of other sites on behalf of the EPA and NUIG (air quality); daily and monthly values are provided. A ground-based O3 observational network has been established with 11 sites around the country. The Mace Head Atmospheric Research Station is operated by personnel from the Centre for Climate & Air Pollution Studies, Ryan Institute and School of Physics of the National University of Ireland Galway in collaboration with several international projects. It is best known internationally for its measurements of atmospheric gases and aerosols. Atmospheric methane (CH4) and nitrous oxide (N2O) concentrations have been measured since 1987, and carbon dioxide (CO2) since 1992. Ground level O3 has been measured since 1983. Chlorofluorocarbons (CFCs) have been measured since 1987, as part of the AGAGE Programme. Their replacements, HCFCs, have been measured at Mace Head since 1995. A number of other important reactive gases are also observed (e.g. SO2, OH, H2SO4, MSA, I2).
8.9.2 Oceanic Observations A number of ocean surface variables are measured by the national weather network. The first buoy was installed in 2000. The network now comprises 5 offshore buoys including M6 deployed in deep water West of Ireland. The weather buoys return hourly information on:
Wind speed and direction
Atmospheric pressure and tendency
200

Air temperature
Relative humidity
Sea surface temperature
Wave height and period
New instrumentation has been installed on the buoys to record sea water conductivity and salinity from 1m below the surface. The full water column to 3,000m depth will be instrumented on the M6 buoy in 2014. A national tide gauge network coordinated by the Marine Institute is currently under development with 18 gauges operational as of 2013. These gauges are serviced on an annual basis and provide real-time data. A number of other gauges are operated by port authorities and private companies. A number of sub-surface variables are measured by the two national research vessels annually. These typically include temperature, salinity, dissolved oxygen and chlorophyll fluorescence. Approximately 12 Argo floats have been deployed to date from Ireland to complement the ca. 3,600 floats in use at a global scale. Funding has been on an ad-hoc basis with a typical contribution of 2 additional floats per year.
Table 8.2 Participation in the Global Oceanographic Observing Systems
VOS SOOP TIDE GUAGES
SFC DRIFTERS
SUB-SFC FLOATS
MOORED BUOYS
ASAP
For how many platforms is the Party responsible?
15 0 18 0 42 per year
5 0***
How many are providing data to international datacentres?
15 0 2 0 0 5 0
How many are expected to be operating in 2015?
15 0 17 0 15 5 0
* Reports to GTS only. ** Part of EUCOS SURFMAR. Detailed analyses of much of the data collected has been carried out, and a significant report on the status of the Irish ocean climate and ecosystem was published recently (Nolan et al., 2010) 122. Between 2008 and 2010, as part of a joint project between the Marine Institute and NUI Galway a series of measurements of carbonate and associated biochemical parameters were taken in coastal,
122
Nolan, G., Gillooly, M. and Whelan, K. (eds.), 2010, Irish Ocean Climate and Ecosystem Status Report 2009.
Marine Institute, Co. Galway, pp 100 http://hdl.handle.net/10793/81
201

shelf and deep waters of the Northeast Atlantic, to establish the baseline state and variability of the carbonate system. Analysis of the data demonstrated increasing acidification of both the sub-surface waters and those at depth (Ní Longphuirt et al, 2010) 123.
8.9.3 Terrestrial Observations Activities related to the collection of information on hydrological variables are coordinated through a Hydrology working group, whose members are made up of the key agencies involved in this sector, the EPA and the OPW. The selection of high-quality reference hydrometric gauges that can be used for monitoring and detecting climate change signals has recently been completed. Thirty five stations have been identified that have an average record length of 40 years. Recent analysis of flows from this reference network indicates that trends in mean flows are highly complex and subject to large variability, with trends derived highly dependent on the time period analysed- making it difficult to extract climate change signals (Murphy et al., 2013) 124. Nonetheless, analysis of longer records of annual mean flows shows a tendency for increasing flows. A central land-assessment capability needs to be put in place with a view to developing a coherent and consistent set of land-cover/use products, as the European based CORINE land cover product has been the only one used to date, and has many shortcomings for national needs. A land cover interest group is exploring a range of issues in order to improve collection of land cover related information. As part of this initiative a number of research projects have been funded by the EPA to explore approaches to enhanced land cover mapping using combinations of satellite data and classification methodologies. The EPA has also funded the expansion of the International Phenological Garden Network. The number of gardens in Ireland that now form part of this network has increased from four to thirteen. In addition, ten ‘native species’ gardens have been established for the monitoring of a number of nationally important native tree species (Donnelly et al, 2013) 125
123
Ní Longphuirt, S., Stengel, D., O’Dowd C., and McGovern, E. ,2010, Ocean Acidification: An Emerging Threat to our Marine Environment. Marine Foresight Series No. 6, Marine Institute, Co. Galway, pp 98. http://hdl.handle.net/10793/80 124
Murphy, C., Harrigan, S., hall, J. & Wilby, R.L., 2013, HydroDetect, The Identification and Assessment of
Climate Change Indicators for an Irish Reference Network of River Flow Stations, CCRP Report 27,
Environmental protection Agency, Johnstown Castle,
http://www.epa.ie/pubs/reports/research/climate/climatechangeresearchreportnumber27.html
125 Donnelly, A., Proctor, H., & O’ Connor, B., 2013, Ireland’s national Phenology Network, CCRP Report 23,
Environmental protection Agency, Johnstown Castle,
http://www.epa.ie/pubs/reports/research/climate/climatechangeresearchprogrammereportnumber23.html
202
ANNEX I to Chapter 8, SEAI Energy RD&D Programme SEAI’s Energy RD&D Programme is open to a wide range of proposal types – including technology RD&D, field research, feasibility studies and policy studies. The move towards sustainable energy options depends on resource availability, technical maturity and capacity, and a policy environment that is conducive to both technology improvements and commercialisation. SEAI under its Energy R&D Programme seeks to promote research into technologies and options best suited to Ireland’s own resources and needs. The RD&D Programme aims to stimulate the deployment of sustainable energy by: - Accelerating the development and deployment in the Irish marketplace of competitive
renewable energy products, processes and systems with a particular emphasis on achieving Ireland's 2020 NEEAP and National Energy Renewable Action Plan;
- Providing support for solutions that enable technical and other barriers to market uptake to be overcome;
- Establishing, where necessary, and strengthening, where possible, a national capacity to access, develop and apply international class RD&D in a way that can best meet specific Irish needs on a continuing basis;
- Supporting and providing guidance to policy makers and public bodies that facilitate renewable energy deployment.
Following the National Research Prioritisation Exercise of 2011 led by DJEI and Forfás, two Working Groups led by SEAI developed the national action plans for research in Marine Renewable Energy and Smart Grids & Smart Cities. Small- and Micro- Scale Generation Pilot Field Trials: The key objectives of SEAI’s Small- and Micro- Scale Generation Programme are to assess technical, financial and regulatory issues surrounding the deployment of small and micro generation technologies in Ireland. The programme includes a detailed review of commercial arrangements and potential supports for small scale and micro-generation and the definition of quality standards for products and installers as well as the pilot trial of monitored installations. As part of a suite of measures established by Government to support the development of small- and micro-scale electricity generation in Ireland, SEAI implemented a programme of pilot field trials to evaluate the operational performance of relevant technologies and assess their potential contribution to national renewable electricity targets. A total of 45 projects at small and micro-scale wind, solar PV and hydropower sites were funded, so as to obtain real operational evidence on technology costs, quality and performance. The projects included 29 wind-turbine installations with products from 11 manufacturers, and 15 solar PV installations with products from five manufacturers. All but one of the wind-turbine installations were in the 5–6 kW rated power range; the other was rated at 50 kW. The solar PV participants were generally in the 1–5 kW peak-power range, with three installations of over 11 kW. The 18-month period of performance monitoring concluded in June 2012, followed by detailed analyses of the findings. A final report on the pilot is in preparation and will be published in 2013. Ocean Energy Development Unit OEDU has been established to accelerate the research and development of ocean energy (wave and tidal technologies) in Ireland. The Unit will specifically advance the deployment of ocean energy technologies in Ireland by increasing the capacity for relevant research and development both in academic institutions and commercial entities in Ireland.
203
In 2012 it organised the International Conference on Ocean Energy (ICOE) at Dublin’s Convention Centre. ICOE was attended by over 900 international delegates and was the largest ever conference on ocean energy worldwide. A total of four projects received €1m support through the prototype fund. It is clear that this remains a challenging sector as companies strive to bring prototype concepts through to maturity. The AMETS in Belmullet is now entering the final stages of the planning and foreshore licensing process. Biomass energy and Combined Heat & Power Deployment programme This programme is aimed at accelerating the uptake of bioenergy solutions and new technologies while also supporting the deployment of CHP in Ireland. A study assessing the supply scenarios and associated cost profiles of bioenergy resources, national and imported, over the period 2010 to 2030 was completed. The scenarios considered for the potential development of international bioenergy commodity trade and the resulting findings can be used to assess the costs of producing bioenergy in Ireland and assist policy to achieve appropriate targets. Electric Vehicles The rollout of EVs continued in 2012; supported by the Government grant scheme and VRT relief from Revenue, and there are now over 230 vehicles operating on Irish roads. A total of 30 fast chargers were installed at filling stations around the country, while in urban areas 530 public EV charge points have been installed. SEAI is supporting an electric vehicle project on the Aran Islands together with DAHG. Eight electric vehicles have been monitored each month on the islands since 2010. The analysis of the first full year results over 2010/2011 suggests that almost 20% of the energy required comes from wind when night charging is used. This points to the potential for EVs to be charged by locally generated energy, displacing imports of petrol and diesel.
Sustainable energy Communities SEAI’s sustainable energy communities programme aims to stimulate a national move towards sustainable energy practice through the establishment of an SEC network. The SEC Network concentrated on jobs development and the Energy Intern programme was rolled out to network members. The three exemplars completed their 2012 work plans, concentrating efforts on the community energy master plans. Dundalk began work on smart monitoring and metering and implemented the first element of the Community Energy Management system under the Better Energy Communities.
204

CHAPTER 9: EDUCATION, TRAINING AND PUBLIC AWARENESS 9.1 Introduction 9.2 Education 9.3 Public Awareness
205
Key Developments
The Green-Schools Programme (known internationally as Eco-Schools) continues to develop, with over 90% of all schools participating. The programme is run by the environmental NGO – An Taisce, and is primarily funded by Government . The programme aims to instil a strong sense of environmental responsibility in students, which then also spreads beyond the classroom into students’ homes and the wider community. Key developments in the programme during this period included the introduction of the Green-Campus initiative for third level institutions. The Green-Schools Website (www.greenschoolsireland.org) was also redesigned and re-launched in 2012.
The Eco Detectives climate change education resource was developed as a further support for environmental awareness in schools. The resource was developed as part of the CHANGE Campaign (Ireland’s Climate Change Awareness Campaign); and was distributed to all of the primary schools in the country.
The EPA developed and launched a second level resource: 2020 VISION: A Closer Look at Ireland’s Environment. This multimedia resource (resource pack and accompanying website), supports teachers and students in exploring the Irish environment, in the context of the second level curriculum.
DES is currently finalising a National Strategy on Education for Sustainable Development (ESD). A public consultation has been carried out in this regard and it is planned that the strategy will be completed in the first half of 2014. Finalising the strategy will fulfil a commitment set out in Ireland’s Framework for Sustainable Development - Our Sustainable Future.
Ireland continues to provide funding to environmental NGOs, to build their capacity and facilitate participation, and to support awareness raising.
The SEAI successfully completed the National Smart Metering Trial and associated assessments in 2011 and the National Smart Metering Programme has been developing plans for the national rollout of smart meters.
The EPA continues to implement the National Waste Prevention Programme and as part of the programme it launched a Stop Food Waste Programme to promote food waste prevention and home composting.
9.1 Introduction The importance of education, training and the raising of public awareness on environmental issues is recognised in Ireland’s framework for sustainable development – ‘Our Sustainable Future’. This framework takes a whole of Government approach to sustainable development and aims to embed sustainable development in the policy making process across Departments, in order to reap benefits, not only in terms of protecting the environment but also in terms of the Green Economy, Jobs and Growth. Overall, the objective of ‘Our Sustainable Future’ is to identify and prioritise policy areas and mechanisms where a sustainable development approach will add value and will enable continuous improvement of quality of life for current and future generations. The framework makes it clear that education and awareness play a crucial role in moving towards a more sustainable society. Education strengthens the capacity of individuals, communities, businesses and governments to make judgements and decisions that take proper account of environmental protection. ‘Our Sustainable Future’ recognises that education for sustainable development needs to be embedded at every level of the formal and informal education system, and that public awareness measures are vital for sustainable development to be better understood and appreciated. Public authorities need to actively engage with citizens and stakeholders in the development and implementation of policy if we are to encourage a change in behaviour and the transition to a more sustainable society and economy.
206

The Department of Education and Skills is currently finalising a National Strategy on Education for Sustainable Development (ESD). A public consultation has been carried out in this regard and it is planned that the strategy will be completed in the first half of 2014. A wide range of environmental awareness raising programmes and initiatives are supported by various Government agencies, building on the awareness raising achievements of earlier awareness campaigns including the CHANGE Campaign on climate change awareness.
9.2 Education National Strategy on Education for Sustainable Development DES is currently developing Ireland’s National Strategy on Education for Sustainable Development. This will deliver on a commitment set out in Ireland’s Framework for Sustainable Development which was agreed at the end of 2012. DES have consulted on the proposed strategy and plan to finalise this in the first half of 2014. The strategy will aim to further promote education for sustainable development across the formal and non-formal education sectors. The Green-Schools Programme The Green-Schools Programme (www.greenschoolsireland.org) is the pre-eminent environmental education programme in Ireland with a participation rate of approximately 90% of all Irish Schools – approximately 3,740 schools are registered with the programme. Green Schools is part of the Eco-Schools programme which is coordinated internationally by the FEE. The programme is run in Ireland by the environmental NGO, An Taisce, in partnership with local authorities. The Green-Schools programme promotes whole school action for the environment and aims to instil a strong sense of environmental responsibility in students that also spreads beyond the classroom into students’ homes and the wider community. The programme is supported and funded by a number of Government Departments and State Agencies as well as some private funders. Schools are visited throughout the year by representatives of An Taisce and local authority Environmental Awareness Officers, who advise them on successful implementation of the Green-Schools Programme. Each year An Taisce runs a series of seminars for teachers involved in the programme. In July 2013, An Taisce also ran four teacher-training courses which were approved by DES for primary and secondary schools teachers. DTTAS continues to support the Green-Schools Travel Programme, which raises awareness, among school children, of the environmental impacts of our transport choices. This has been rolled out to over 220,000 pupils in the period 2008 to 2012. Smarter Travel schemes have also been rolled out in workplaces for large employers and third level institutions. As of October 2013, 114 employers and third level institutions comprising over 282,690 employees and students were engaged. Building on the success of the Green-Schools Programme, a new programme was introduced at third-level to encourage a partnership approach to environmental management in third level institutions. The Green-Campus Programme aims to make environmental awareness and action an intrinsic part of the life and ethos of third-level institutions. The Green-Campus initiative mirrors the principles of Green-Schools and endeavours to extend learning beyond the lecture theatre to develop responsible attitudes and commitment to the environment, both at home and in the wider community. The Green-Campus Programme is an enhancement of traditional environmental management systems which tend to be management driven. The Green-Campus Programme identifies the
207

campus as a community and places significant importance on the inclusion of all sectors of the campus community in its environmental management and enhancement. The Green-Campus Programme has been in operation in Ireland since 2007 with University College Cork being the first university in the world to be awarded the status of a Green Campus in 2010. At present 22 Campuses are participating in the Programme. The Programme encourages practical environmental education and the empowerment of campuses to become exemplars in environmental stewardship. Primary School Educational Resource Eco Detectives is a teacher resource pack comprising of environmental and climate change investigations for primary schools. It was produced by the DECLG in conjunction with the Centre for Human Rights and Citizenship at St. Patrick’s Teaching College, Dublin. The resources, which formed part of the CHANGE Campaign (Ireland’s Climate Change Awareness Campaign), was distributed to all primary schools in the state in 2011 and is also available on the environmental information site www.enfo.ie. The resource incorporates creative ways to teach about climate change and environmental issues, primarily through geography and science. Secondary School Educational Resource The EPA developed a multimedia resource for second-level schools - 2020 VISION: A Closer Look at Ireland’s Environment. The resource pack and the accompanying website (www.epa.ie/researchandeducation/education/educ/ ) have been developed to support teachers and students in exploring the Irish environment, in the context of the second level curriculum. 2020 Vision is the EPA’s strategy to protect and improve Ireland’s Environment into the future. The strategy outlines six environmental goals for the period 2007 to 2020: Limiting & Adapting to Climate Change; Clean Air; Clean Water; Protected Soil & Biodiversity; Sustainable Resource Use and Integration & Enforcement. These goals form the six modules of the resource pack. The lessons provide opportunities to explore the themes in a way which is relevant to the curriculum, using group and individual work, and on-line map work. The EPA’s educational initiatives aim to encourage thought, debate and action on the environment. As well as the second level resource the Agency has also developed resources for primary schools, including environmental games for 8 - 12 year olds, and has sponsored conferences, seminars, interactive exhibitions and television programmes including ‘Eco Eye’ which has an average audience of approximately 500,000 per episode. ENFO – Environmental Information Website The ENFO website www.enfo.ie is an online environmental information service, sponsored by DECLG. The website, which is aimed primarily at school level provides a wide range of interactive learning resources for children and teachers, and has been promoted through the library network. Energy usage – education and awareness SEAI plays a leading role in providing energy education for primary and post primary schools, informing the attitudes, beliefs and behaviours of children of all ages - www.seai.ie/Schools/. A broad range of programmes are available, tailored specifically for schools who want to teach energy within the curricula and save energy and costs through improved energy management. Teaching resources designed to be relevant to the various curricula include lesson plans, on-line teaching resources, workshops, post primary project and e-newsletter. SEAI’s Energy In Education Programme, developed in collaboration with DES, offers a range of supports designed to help schools to improve energy management practices, reduce school operating costs and protect the environment. These resources include step by step guides and
208

workbooks, a dedicated website with factsheets, videos, on-line energy management tools and case studies, training courses and energy advisors for schools. Environmental NGOs in Education ECO-UNESCO is an environmental NGO which is affiliated to the World Federation of UNESCO Clubs, Centres and Associations. ECO-UNESCO raises environmental awareness, promotes environmental protection and encourages active citizenship in children and young people across Ireland. Its programmes receive support from various Government Departments and Agencies. ECO-UNESCO has an extensive network and works with young people, teachers, local authorities, business and community leaders as well as participants from the environmental, youth, community and international NGOs. ECO-UNESCO provides a range of youth and education programmes including training programmes, environmental workshops and peer education programmes. It also supports teachers and youth leaders by providing various educational resources. Along with its youth programmes, ECO-UNESCO also provides accredited and non-accredited adult training in areas such as sustainable development, community gardening and environmental education. ECO-UNESCO also runs the Young Environmentalist Awards which is aimed at promoting environmental responsibility among young people aged 10 to 18. The programme culminates in an annual National showcase and awards ceremony.
9.3 Public Awareness Environmental Protection Agency The EPA is at the front-line of environmental protection and policing in Ireland. The EPA has a wide range of functions including environmental licensing; enforcement of environmental law; environmental planning, education and guidance; monitoring, analysing and reporting on the environment; regulating Ireland's greenhouse gas emissions; environmental research development; Strategic Environmental Assessment and Waste Management. The EPA's Climate Change Lecture Series has been running since late 2007, as part of its programme of increasing public awareness of climate change issues. The series has included a wide range of Irish and international speakers, who have discussed key aspects of climate change. The lectures are available on the EPA’s website (www.epa.ie) and on its You Tube channel (www.youtube.com/epaireland ). A climate change section on the EPA’s website (www.epa.ie/climate ) provides a range of information for the public, including the latest research findings from EPA funded climate projects, information from international climate negotiations, links to international and national organisations working on climate change, carbon calculator tools for personal and business use, and answers to frequently asked questions about climate change. The carbon calculator tools include the Carbon / CO2 Calculator which allows an individual to calculate the amount of carbon dioxide emitted as a result of their daily actions, and the Carbon Management Tool which allows businesses to calculate carbon emissions and which shows how those emissions can be reduced. The EPA and DECLG have provided funding for the popular environmental television series, Eco Eye, which attracts an audience of approximately 500,000 per episode. The EPA also supported and participated in a one-off climate change programme entitled ‘A Burning Question’, broadcast in June 2010.
209
The EPA has publicised the findings of its various research projects through the media and sectoral workshops. Research supported under the CCRP has focused on investigating priority issues related to Ireland’s response to climate change and has produced valuable insights on a range of issues including adaptation and options for mitigation in various sectors. In November 2012, in cooperation with NESC, the EPA co-hosted a major seminar entitled ‘Ireland in 2050: A Low Carbon Future’ which focused on long-term greenhouse gas and sustainable economy ambitions for Ireland. In July 2011 a stakeholder seminar entitled ‘Climate Change and Ireland’s Future Energy Pathways’ was organised under the EPA’s CCRP, with support from SEAI. In June 2010 the EPA hosted a significant conference on climate change, attended by over 300 delegates. The conference provided an overall perspective on some of the key challenges that climate change presents for Ireland, and explored developments in the climate science and policy arenas. The EPA’s NWPP is delivering substantive results in preventing and minimising waste. The programme aims to bring about waste prevention through programmes and initiatives to promote sustainable consumption behaviours and resource efficiency. To get the message to as many people as possible and avoid duplication of effort, NWPP actively pursues opportunities for collaboration with other organisations targeting similar audiences or having mutually beneficial goals, such as representative bodies, trade associations, enterprise agencies, business and industry bodies, local authorities, sectoral and community champions, NGOs, etc. Programmes developed as part of the NWPP such as Green Business, Green Hospitality and Green Healthcare aim to increase resource efficiency in businesses and public sector organisations, including reduction in energy and water consumption and preventing waste generation. Through the Local Authority Prevention Network, the NWPP also collaborates with local authorities to promote sustainability in local businesses and communities, encouraging reduction of energy and water consumption and preventing waste generation. NWPP also promotes sustainable environmental behaviour in local communities, in association with An Taisce, through Green Homes and Greening Communities. Consumers are becoming increasingly aware of food waste and its link to climate change. The EPA’s SFW aims to prevent food waste by empowering consumers to rethink how they shop, store cook and eat. The work of the SFW programme was the subject of a TV documentary, Waste Watchers, which was broadcast at the end of 2013. Sustainable Energy Authority of Ireland SEAI works towards transforming Ireland into a society based on sustainable energy structures, technologies and practices. The SEAI, under its Sustainable Energy Communities Programme, continues to build capacity in communities for the use of more sustainable energy. 32 organisations across the public sector, with an annual energy spend of €340m; have signed up to SEAI’s Public Sector Energy Partnership Programme which commits them to implement the highest level of energy management. Energy in Education, a new web portal, was launched in October 2012 following pilot testing earlier in the year. The resources available include an extensive range of support materials, guides, advice and best-practice videos for teachers, principals, boards of management, and designers/contractors.
210

Over 150 schools completed the more intensive support activities on offer, including training combined with energy assessment specifically designed for schools. The SEAI’s Consumer Information Programme continues to engage and motivate consumers to actively play their role in greater energy sustainability. The success of a number of SEAI administered grant schemes, the recent boom in home energy retrofitting and the substantial volatility of home and transport energy prices has heightened consumer interest in energy efficiency which in turn feeds into greater awareness of the importance of sustainable energy. SEAI’s consumer information programme informs consumers of practical steps to becoming more energy-efficient in the home. Consumer information activities typically complement the aims of specific schemes administered by SEAI such as building energy rating, home energy grants and heating system maintenance. A range of tools are used including advertising, public relations and promotional events all supported by an array of materials on line. SEAI is also making extensive use of social media as a means to reach motivated and engaged consumers. Following the successful completion in 2011 of the National Smart Metering Trial and associated assessments, the National Smart Metering Programme has been developing its plans for the national rollout of smart meters. Building on its work in the trial, SEAI is leading the Customer Engagement work stream of the programme. Smart Grid and Smart Cities have been selected as a priority theme in the National Research Prioritisation exercise, chaired by the Minister of State at DJEI. SEAI led the working group that developed the action plan for this theme in 2012, and is the lead agency in the process of implementing that action plan, working with the range of public funding bodies for energy research in Ireland and other key institutional bodies. SEAI has also developed a Smart Grid Roadmap to 2050 and maintains an online energy research portal for Ireland as well as annually publishing a national energy research inventory. Support for Environmental NGOs DECLG continues to engage with and provide funding to the environmental Non-Governmental Organisation (NGO) Sector in order to support them in the role they play in protecting the environment, raising awareness, promoting sustainability and participating in environmental policy development. The Department funds the IEN an umbrella organisation of environmental NGOs in Ireland. Local Agenda 21 Environmental Partnership Fund The objective of the Local Agenda 21 Environmental Partnership Fund (www.environ.ie/en/Environment/LocalAgenda21/) is to promote sustainable development by assisting environmental projects, including awareness projects at local level. The funding scheme is open to non-profit local and community groups, and is co-financed by local authorities and DECLG. A wide variety of projects and schemes have been supported under the Fund in previous years including, for example, community gardens, allotments and compost schemes, rainwater conservation schemes, educational initiatives and environmental exhibitions. TidyTowns The TidyTowns competition is a long-running awards scheme which encourages community involvement in improving towns and villages, and which incorporates natural environment elements, including biodiversity. The competition is run by DECLG with sponsorship from a national retailer. The TidyTowns initiative has been very successful in encouraging voluntary effort throughout the country and it promotes a sense of pride in communities and the local environment. The competition includes a specific Climate Change award.
211
Environmental Awareness Officers Local authority Environmental Awareness Officers promote positive Environmental Action at local level. The Awareness Officers raise awareness of environmental issues with schools, community groups and the public in general. DECLG facilitates the Environmental Awareness Officers’ Network, which provides opportunities for exchange of best practice.
212
Annex A: Summary tables on Emission Trends
A.1.1 CO2Emission Trends 1990-2011 A.1.2 CH4 Emission Trends 1990-2011 A.1.3 N2O Emission Trends 1990-2011 A.1.4 HFCs, PFCs, SF6 Emission Trends 1990-2011 A.1.5 All GHG Summary Emission Trends 1990-2011
213
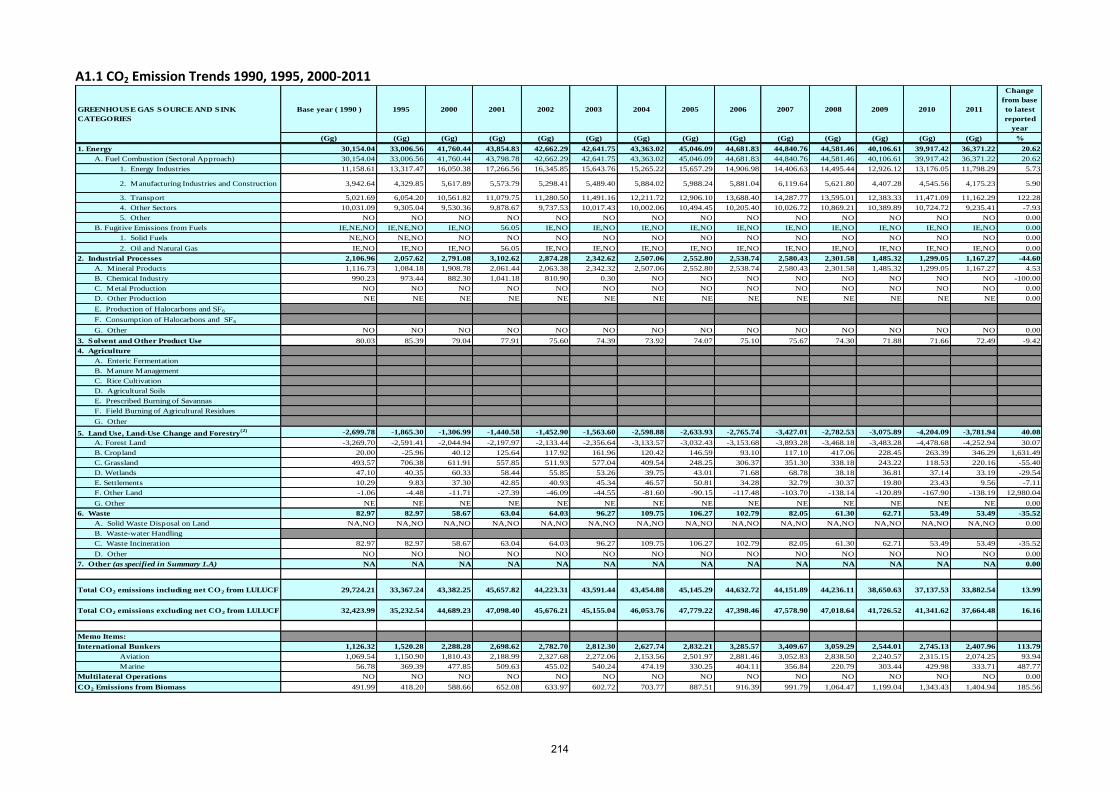
A1.1 CO2 Emission Trends 1990, 1995, 2000-2011
Base year ( 1990 ) 1995 2000 2001 2002 2003 2004 2005 2006 2007 2008 2009 2010 2011
Change
from base
to latest
reported
year
(Gg) (Gg) (Gg) (Gg) (Gg) (Gg) (Gg) (Gg) (Gg) (Gg) (Gg) (Gg) (Gg) (Gg) %
1. Energy 30,154.04 33,006.56 41,760.44 43,854.83 42,662.29 42,641.75 43,363.02 45,046.09 44,681.83 44,840.76 44,581.46 40,106.61 39,917.42 36,371.22 20.62
A. Fuel Combustion (Sectoral Approach) 30,154.04 33,006.56 41,760.44 43,798.78 42,662.29 42,641.75 43,363.02 45,046.09 44,681.83 44,840.76 44,581.46 40,106.61 39,917.42 36,371.22 20.62
1. Energy Industries 11,158.61 13,317.47 16,050.38 17,266.56 16,345.85 15,643.76 15,265.22 15,657.29 14,906.98 14,406.63 14,495.44 12,926.12 13,176.05 11,798.29 5.73
2. Manufacturing Industries and Construction 3,942.64 4,329.85 5,617.89 5,573.79 5,298.41 5,489.40 5,884.02 5,988.24 5,881.04 6,119.64 5,621.80 4,407.28 4,545.56 4,175.23 5.90
3. Transport 5,021.69 6,054.20 10,561.82 11,079.75 11,280.50 11,491.16 12,211.72 12,906.10 13,688.40 14,287.77 13,595.01 12,383.33 11,471.09 11,162.29 122.28
4. Other Sectors 10,031.09 9,305.04 9,530.36 9,878.67 9,737.53 10,017.43 10,002.06 10,494.45 10,205.40 10,026.72 10,869.21 10,389.89 10,724.72 9,235.41 -7.93
5. Other NO NO NO NO NO NO NO NO NO NO NO NO NO NO 0.00
B. Fugitive Emissions from Fuels IE,NE,NO IE,NE,NO IE,NO 56.05 IE,NO IE,NO IE,NO IE,NO IE,NO IE,NO IE,NO IE,NO IE,NO IE,NO 0.00
1. Solid Fuels NE,NO NE,NO NO NO NO NO NO NO NO NO NO NO NO NO 0.00
2. Oil and Natural Gas IE,NO IE,NO IE,NO 56.05 IE,NO IE,NO IE,NO IE,NO IE,NO IE,NO IE,NO IE,NO IE,NO IE,NO 0.00
2. Industrial Processes 2,106.96 2,057.62 2,791.08 3,102.62 2,874.28 2,342.62 2,507.06 2,552.80 2,538.74 2,580.43 2,301.58 1,485.32 1,299.05 1,167.27 -44.60
A. Mineral Products 1,116.73 1,084.18 1,908.78 2,061.44 2,063.38 2,342.32 2,507.06 2,552.80 2,538.74 2,580.43 2,301.58 1,485.32 1,299.05 1,167.27 4.53
B. Chemical Industry 990.23 973.44 882.30 1,041.18 810.90 0.30 NO NO NO NO NO NO NO NO -100.00
C. Metal Production NO NO NO NO NO NO NO NO NO NO NO NO NO NO 0.00
D. Other Production NE NE NE NE NE NE NE NE NE NE NE NE NE NE 0.00
E. Production of Halocarbons and SF6
F. Consumption of Halocarbons and SF6
G. Other NO NO NO NO NO NO NO NO NO NO NO NO NO NO 0.00
3. Solvent and Other Product Use 80.03 85.39 79.04 77.91 75.60 74.39 73.92 74.07 75.10 75.67 74.30 71.88 71.66 72.49 -9.42
4. Agriculture
A. Enteric Fermentation
B. Manure Management
C. Rice Cultivation
D. Agricultural Soils
E. Prescribed Burning of Savannas
F. Field Burning of Agricultural Residues
G. Other
5. Land Use, Land-Use Change and Forestry(2) -2,699.78 -1,865.30 -1,306.99 -1,440.58 -1,452.90 -1,563.60 -2,598.88 -2,633.93 -2,765.74 -3,427.01 -2,782.53 -3,075.89 -4,204.09 -3,781.94 40.08
A. Forest Land -3,269.70 -2,591.41 -2,044.94 -2,197.97 -2,133.44 -2,356.64 -3,133.57 -3,032.43 -3,153.68 -3,893.28 -3,468.18 -3,483.28 -4,478.68 -4,252.94 30.07
B. Cropland 20.00 -25.96 40.12 125.64 117.92 161.96 120.42 146.59 93.10 117.10 417.06 228.45 263.39 346.29 1,631.49
C. Grassland 493.57 706.38 611.91 557.85 511.93 577.04 409.54 248.25 306.37 351.30 338.18 243.22 118.53 220.16 -55.40
D. Wetlands 47.10 40.35 60.33 58.44 55.85 53.26 39.75 43.01 71.68 68.78 38.18 36.81 37.14 33.19 -29.54
E. Settlements 10.29 9.83 37.30 42.85 40.93 45.34 46.57 50.81 34.28 32.79 30.37 19.80 23.43 9.56 -7.11
F. Other Land -1.06 -4.48 -11.71 -27.39 -46.09 -44.55 -81.60 -90.15 -117.48 -103.70 -138.14 -120.89 -167.90 -138.19 12,980.04
G. Other NE NE NE NE NE NE NE NE NE NE NE NE NE NE 0.00
6. Waste 82.97 82.97 58.67 63.04 64.03 96.27 109.75 106.27 102.79 82.05 61.30 62.71 53.49 53.49 -35.52
A. Solid Waste Disposal on Land NA,NO NA,NO NA,NO NA,NO NA,NO NA,NO NA,NO NA,NO NA,NO NA,NO NA,NO NA,NO NA,NO NA,NO 0.00
B. Waste-water Handling
C. Waste Incineration 82.97 82.97 58.67 63.04 64.03 96.27 109.75 106.27 102.79 82.05 61.30 62.71 53.49 53.49 -35.52
D. Other NO NO NO NO NO NO NO NO NO NO NO NO NO NO 0.00
7. Other (as specified in Summary 1.A) NA NA NA NA NA NA NA NA NA NA NA NA NA NA 0.00
Total CO2 emissions including net CO2 from LULUCF 29,724.21 33,367.24 43,382.25 45,657.82 44,223.31 43,591.44 43,454.88 45,145.29 44,632.72 44,151.89 44,236.11 38,650.63 37,137.53 33,882.54 13.99
Total CO2 emissions excluding net CO2 from LULUCF 32,423.99 35,232.54 44,689.23 47,098.40 45,676.21 45,155.04 46,053.76 47,779.22 47,398.46 47,578.90 47,018.64 41,726.52 41,341.62 37,664.48 16.16
Memo Items:
International Bunkers 1,126.32 1,520.28 2,288.28 2,698.62 2,782.70 2,812.30 2,627.74 2,832.21 3,285.57 3,409.67 3,059.29 2,544.01 2,745.13 2,407.96 113.79
Aviation 1,069.54 1,150.90 1,810.43 2,188.99 2,327.68 2,272.06 2,153.56 2,501.97 2,881.46 3,052.83 2,838.50 2,240.57 2,315.15 2,074.25 93.94
Marine 56.78 369.39 477.85 509.63 455.02 540.24 474.19 330.25 404.11 356.84 220.79 303.44 429.98 333.71 487.77
Multilateral Operations NO NO NO NO NO NO NO NO NO NO NO NO NO NO 0.00
CO2 Emissions from Biomass 491.99 418.20 588.66 652.08 633.97 602.72 703.77 887.51 916.39 991.79 1,064.47 1,199.04 1,343.43 1,404.94 185.56
GREENHOUSE GAS SOURCE AND SINK
CATEGORIES
214
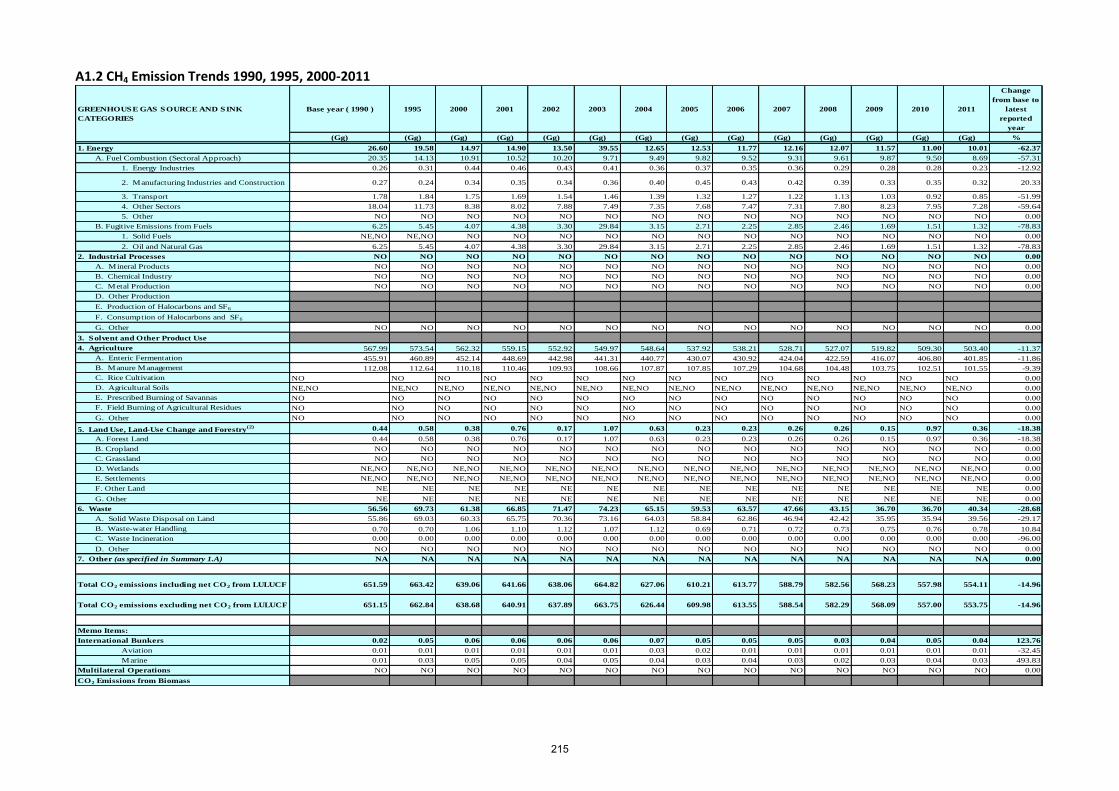
A1.2 CH4 Emission Trends 1990, 1995, 2000-2011
Base year ( 1990 ) 1995 2000 2001 2002 2003 2004 2005 2006 2007 2008 2009 2010 2011
Change
from base to
latest
reported
year
(Gg) (Gg) (Gg) (Gg) (Gg) (Gg) (Gg) (Gg) (Gg) (Gg) (Gg) (Gg) (Gg) (Gg) %
1. Energy 26.60 19.58 14.97 14.90 13.50 39.55 12.65 12.53 11.77 12.16 12.07 11.57 11.00 10.01 -62.37
A. Fuel Combustion (Sectoral Approach) 20.35 14.13 10.91 10.52 10.20 9.71 9.49 9.82 9.52 9.31 9.61 9.87 9.50 8.69 -57.31
1. Energy Industries 0.26 0.31 0.44 0.46 0.43 0.41 0.36 0.37 0.35 0.36 0.29 0.28 0.28 0.23 -12.92
2. Manufacturing Industries and Construction 0.27 0.24 0.34 0.35 0.34 0.36 0.40 0.45 0.43 0.42 0.39 0.33 0.35 0.32 20.33
3. Transport 1.78 1.84 1.75 1.69 1.54 1.46 1.39 1.32 1.27 1.22 1.13 1.03 0.92 0.85 -51.99
4. Other Sectors 18.04 11.73 8.38 8.02 7.88 7.49 7.35 7.68 7.47 7.31 7.80 8.23 7.95 7.28 -59.64
5. Other NO NO NO NO NO NO NO NO NO NO NO NO NO NO 0.00
B. Fugitive Emissions from Fuels 6.25 5.45 4.07 4.38 3.30 29.84 3.15 2.71 2.25 2.85 2.46 1.69 1.51 1.32 -78.83
1. Solid Fuels NE,NO NE,NO NO NO NO NO NO NO NO NO NO NO NO NO 0.00
2. Oil and Natural Gas 6.25 5.45 4.07 4.38 3.30 29.84 3.15 2.71 2.25 2.85 2.46 1.69 1.51 1.32 -78.83
2. Industrial Processes NO NO NO NO NO NO NO NO NO NO NO NO NO NO 0.00
A. Mineral Products NO NO NO NO NO NO NO NO NO NO NO NO NO NO 0.00
B. Chemical Industry NO NO NO NO NO NO NO NO NO NO NO NO NO NO 0.00
C. Metal Production NO NO NO NO NO NO NO NO NO NO NO NO NO NO 0.00
D. Other Production
E. Production of Halocarbons and SF6
F. Consumption of Halocarbons and SF6
G. Other NO NO NO NO NO NO NO NO NO NO NO NO NO NO 0.00
3. Solvent and Other Product Use
4. Agriculture 567.99 573.54 562.32 559.15 552.92 549.97 548.64 537.92 538.21 528.71 527.07 519.82 509.30 503.40 -11.37
A. Enteric Fermentation 455.91 460.89 452.14 448.69 442.98 441.31 440.77 430.07 430.92 424.04 422.59 416.07 406.80 401.85 -11.86
B. Manure Management 112.08 112.64 110.18 110.46 109.93 108.66 107.87 107.85 107.29 104.68 104.48 103.75 102.51 101.55 -9.39
C. Rice Cultivation NO NO NO NO NO NO NO NO NO NO NO NO NO NO 0.00
D. Agricultural Soils NE,NO NE,NO NE,NO NE,NO NE,NO NE,NO NE,NO NE,NO NE,NO NE,NO NE,NO NE,NO NE,NO NE,NO 0.00
E. Prescribed Burning of Savannas NO NO NO NO NO NO NO NO NO NO NO NO NO NO 0.00
F. Field Burning of Agricultural Residues NO NO NO NO NO NO NO NO NO NO NO NO NO NO 0.00
G. Other NO NO NO NO NO NO NO NO NO NO NO NO NO NO 0.00
5. Land Use, Land-Use Change and Forestry(2) 0.44 0.58 0.38 0.76 0.17 1.07 0.63 0.23 0.23 0.26 0.26 0.15 0.97 0.36 -18.38
A. Forest Land 0.44 0.58 0.38 0.76 0.17 1.07 0.63 0.23 0.23 0.26 0.26 0.15 0.97 0.36 -18.38
B. Cropland NO NO NO NO NO NO NO NO NO NO NO NO NO NO 0.00
C. Grassland NO NO NO NO NO NO NO NO NO NO NO NO NO NO 0.00
D. Wetlands NE,NO NE,NO NE,NO NE,NO NE,NO NE,NO NE,NO NE,NO NE,NO NE,NO NE,NO NE,NO NE,NO NE,NO 0.00
E. Settlements NE,NO NE,NO NE,NO NE,NO NE,NO NE,NO NE,NO NE,NO NE,NO NE,NO NE,NO NE,NO NE,NO NE,NO 0.00
F. Other Land NE NE NE NE NE NE NE NE NE NE NE NE NE NE 0.00
G. Other NE NE NE NE NE NE NE NE NE NE NE NE NE NE 0.00
6. Waste 56.56 69.73 61.38 66.85 71.47 74.23 65.15 59.53 63.57 47.66 43.15 36.70 36.70 40.34 -28.68
A. Solid Waste Disposal on Land 55.86 69.03 60.33 65.75 70.36 73.16 64.03 58.84 62.86 46.94 42.42 35.95 35.94 39.56 -29.17
B. Waste-water Handling 0.70 0.70 1.06 1.10 1.12 1.07 1.12 0.69 0.71 0.72 0.73 0.75 0.76 0.78 10.84
C. Waste Incineration 0.00 0.00 0.00 0.00 0.00 0.00 0.00 0.00 0.00 0.00 0.00 0.00 0.00 0.00 -96.00
D. Other NO NO NO NO NO NO NO NO NO NO NO NO NO NO 0.00
7. Other (as specified in Summary 1.A) NA NA NA NA NA NA NA NA NA NA NA NA NA NA 0.00
Total CO2 emissions including net CO2 from LULUCF 651.59 663.42 639.06 641.66 638.06 664.82 627.06 610.21 613.77 588.79 582.56 568.23 557.98 554.11 -14.96
Total CO2 emissions excluding net CO2 from LULUCF 651.15 662.84 638.68 640.91 637.89 663.75 626.44 609.98 613.55 588.54 582.29 568.09 557.00 553.75 -14.96
Memo Items:
International Bunkers 0.02 0.05 0.06 0.06 0.06 0.06 0.07 0.05 0.05 0.05 0.03 0.04 0.05 0.04 123.76
Aviation 0.01 0.01 0.01 0.01 0.01 0.01 0.03 0.02 0.01 0.01 0.01 0.01 0.01 0.01 -32.45
Marine 0.01 0.03 0.05 0.05 0.04 0.05 0.04 0.03 0.04 0.03 0.02 0.03 0.04 0.03 493.83
Multilateral Operations NO NO NO NO NO NO NO NO NO NO NO NO NO NO 0.00
CO2 Emissions from Biomass
GREENHOUSE GAS SOURCE AND SINK
CATEGORIES
215

A1.3 N2O Emission Trends 1990, 1995, 2000-2011
Base year ( 1990 ) 1995 2000 2001 2002 2003 2004 2005 2006 2007 2008 2009 2010 2011
Change
from base
to latest
reported
year
(Gg) (Gg) (Gg) (Gg) (Gg) (Gg) (Gg) (Gg) (Gg) (Gg) (Gg) (Gg) (Gg) (Gg) %
1. Energy 0.83 1.38 1.24 1.30 1.32 1.35 1.31 1.37 1.38 1.36 1.34 1.24 1.23 1.15 38.63
A. Fuel Combustion (Sectoral Approach) 0.83 1.38 1.24 1.30 1.32 1.35 1.31 1.37 1.38 1.36 1.34 1.24 1.23 1.15 38.63
1. Energy Industries 0.24 0.25 0.26 0.28 0.32 0.35 0.31 0.34 0.37 0.39 0.49 0.47 0.49 0.45 86.04
2. Manufacturing Industries and Construction 0.04 0.04 0.05 0.06 0.05 0.06 0.06 0.07 0.07 0.06 0.06 0.05 0.05 0.05 10.25
3. Transport 0.20 0.68 0.55 0.58 0.58 0.56 0.57 0.57 0.57 0.54 0.41 0.39 0.36 0.36 76.49
4. Other Sectors 0.35 0.41 0.37 0.37 0.37 0.38 0.36 0.39 0.37 0.36 0.39 0.34 0.33 0.31 -12.48
5. Other NO NO NO NO NO NO NO NO NO NO NO NO NO NO 0.00
B. Fugitive Emissions from Fuels NO NO NO NO NO NO NO NO NO NO NO NO NO NO 0.00
1. Solid Fuels NO NO NO NO NO NO NO NO NO NO NO NO NO NO 0.00
2. Oil and Natural Gas NO NO NO NO NO NO NO NO NO NO NO NO NO NO 0.00
2. Industrial Processes 3.34 2.62 2.62 1.89 0.94 NO NO NO NO NO NO NO NO NO -100.00
A. Mineral Products NO NO NO NO NO NO NO NO NO NO NO NO NO NO 0.00
B. Chemical Industry 3.34 2.62 2.62 1.89 0.94 NO NO NO NO NO NO NO NO NO -100.00
C. Metal Production NO NO NO NO NO NO NO NO NO NO NO NO NO NO 0.00
D. Other Production
E. Production of Halocarbons and SF6
F. Consumption of Halocarbons and SF6
G. Other NO NO NO NO NO NO NO NO NO NO NO NO NO NO 0.00
3. Solvent and Other Product Use NA,NE NA,NE NA,NE NA,NE NA,NE NA,NE NA,NE NA,NE NA,NE NA,NE NA,NE NA,NE NA,NE NA,NE 0.00
4. Agriculture 24.86 26.68 26.33 25.33 25.06 25.68 25.14 24.39 23.94 23.17 22.83 22.63 23.55 22.97 -7.59
A. Enteric Fermentation
B. Manure Management 1.40 1.51 1.53 1.54 1.53 1.52 1.54 1.56 1.52 1.49 1.51 1.50 1.44 1.41 0.56
C. Rice Cultivation
D. Agricultural Soils 23.46 25.17 24.80 23.79 23.53 24.16 23.60 22.83 22.42 21.67 21.33 21.14 22.11 21.56 -8.07
E. Prescribed Burning of Savannas NO NO NO NO NO NO NO NO NO NO NO NO NO NO 0.00
F. Field Burning of Agricultural Residues NO NO NO NO NO NO NO NO NO NO NO NO NO NO 0.00
G. Other NO NO NO NO NO NO NO NO NO NO NO NO NO NO 0.00
5. Land Use, Land-Use Change and Forestry(2) 0.09 0.13 0.15 0.16 0.16 0.19 0.19 0.18 0.18 0.18 0.22 0.22 0.23 0.23 156.37
A. Forest Land 0.08 0.10 0.11 0.12 0.11 0.13 0.13 0.12 0.12 0.12 0.12 0.12 0.13 0.13 56.60
B. Cropland NA,NO 0.01 0.02 0.03 0.04 0.05 0.05 0.05 0.05 0.05 0.09 0.09 0.09 0.10 100.00
C. Grassland NO NO NO NO NO NO NO NO NO NO NO NO NO NO 0.00
D. Wetlands 0.01 0.01 0.01 0.01 0.01 0.01 0.01 0.01 0.01 0.01 0.01 0.01 0.01 0.01 -28.55
E. Settlements NE,NO NE,NO NE,NO NE,NO NE,NO NE,NO NE,NO NE,NO NE,NO NE,NO NE,NO NE,NO NE,NO NE,NO 0.00
F. Other Land NE NE NE NE NE NE NE NE NE NE NE NE NE NE 0.00
G. Other NE NE NE NE NE NE NE NE NE NE NE NE NE NE 0.00
6. Waste 0.36 0.36 0.41 0.42 0.42 0.43 0.43 0.43 0.44 0.44 0.45 0.46 0.46 0.46 26.07
A. Solid Waste Disposal on Land
B. Waste-water Handling 0.36 0.35 0.40 0.42 0.42 0.43 0.43 0.43 0.44 0.44 0.45 0.45 0.45 0.46 26.54
C. Waste Incineration 0.00 0.00 0.00 0.00 0.00 0.00 0.00 0.00 0.00 0.00 0.00 0.00 0.00 0.00 -34.60
D. Other NO NO NO NO NO NO NO NO NO NO NO NO NO NO 0.00
7. Other (as specified in Summary 1.A) NA NA NA NA NA NA NA NA NA NA NA NA NA NA 0.00
Total CO2 emissions including net CO2 from LULUCF 29.49 31.16 30.74 29.10 27.90 27.65 27.07 26.37 25.94 25.14 24.85 24.56 25.47 24.82 -15.83
Total CO2 emissions excluding net CO2 from LULUCF 29.39 31.03 30.59 28.94 27.74 27.46 26.88 26.19 25.76 24.96 24.62 24.33 25.24 24.58 -16.36
Memo Items:
International Bunkers 0.04 0.05 0.07 0.09 0.09 0.09 0.08 0.09 0.10 0.11 0.10 0.08 0.09 0.08 105.67
Aviation 0.04 0.04 0.06 0.07 0.08 0.07 0.07 0.08 0.09 0.10 0.09 0.07 0.08 0.07 89.21
Marine 0.00 0.01 0.01 0.01 0.01 0.01 0.01 0.01 0.01 0.01 0.01 0.01 0.01 0.01 493.83
Multilateral Operations NO NO NO NO NO NO NO NO NO NO NO NO NO NO 0.00
CO2 Emissions from Biomass
GREENHOUSE GAS SOURCE AND SINK
CATEGORIES
216
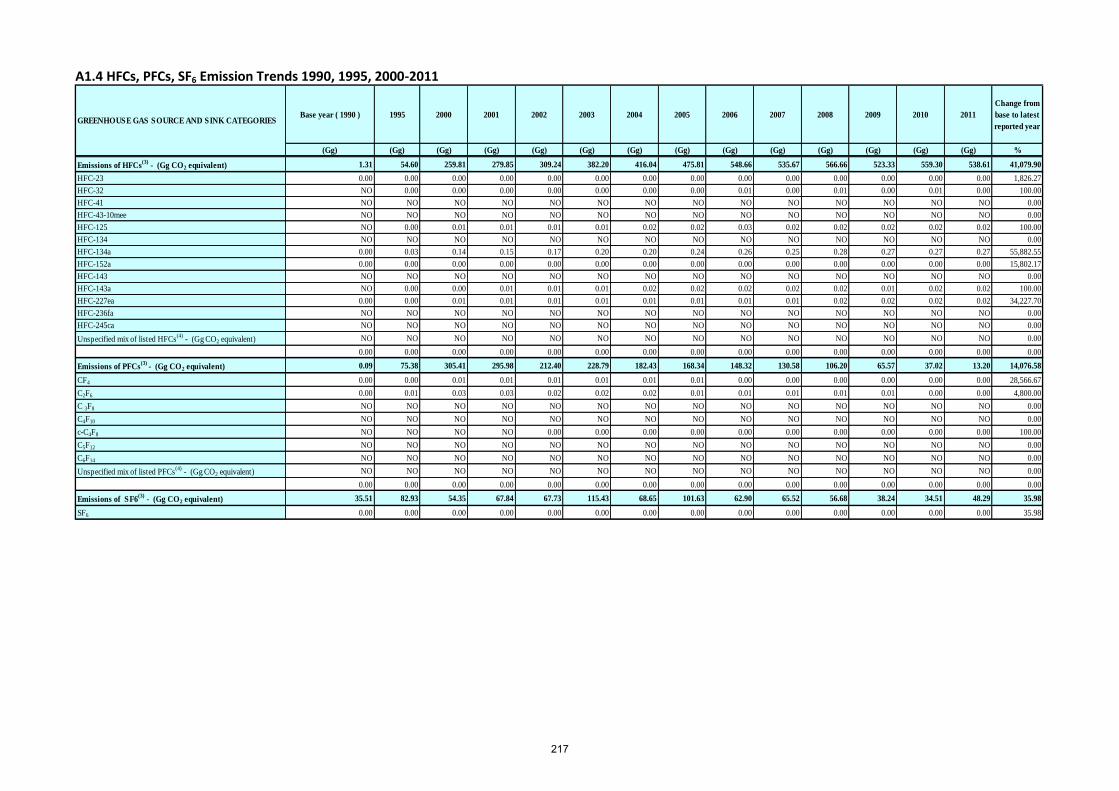
A1.4 HFCs, PFCs, SF6 Emission Trends 1990, 1995, 2000-2011
Base year ( 1990 ) 1995 2000 2001 2002 2003 2004 2005 2006 2007 2008 2009 2010 2011
Change from
base to latest
reported year
(Gg) (Gg) (Gg) (Gg) (Gg) (Gg) (Gg) (Gg) (Gg) (Gg) (Gg) (Gg) (Gg) (Gg) %
Emissions of HFCs(3)
- (Gg CO2 equivalent) 1.31 54.60 259.81 279.85 309.24 382.20 416.04 475.81 548.66 535.67 566.66 523.33 559.30 538.61 41,079.90
HFC-23 0.00 0.00 0.00 0.00 0.00 0.00 0.00 0.00 0.00 0.00 0.00 0.00 0.00 0.00 1,826.27
HFC-32 NO 0.00 0.00 0.00 0.00 0.00 0.00 0.00 0.01 0.00 0.01 0.00 0.01 0.00 100.00
HFC-41 NO NO NO NO NO NO NO NO NO NO NO NO NO NO 0.00
HFC-43-10mee NO NO NO NO NO NO NO NO NO NO NO NO NO NO 0.00
HFC-125 NO 0.00 0.01 0.01 0.01 0.01 0.02 0.02 0.03 0.02 0.02 0.02 0.02 0.02 100.00
HFC-134 NO NO NO NO NO NO NO NO NO NO NO NO NO NO 0.00
HFC-134a 0.00 0.03 0.14 0.15 0.17 0.20 0.20 0.24 0.26 0.25 0.28 0.27 0.27 0.27 55,882.55
HFC-152a 0.00 0.00 0.00 0.00 0.00 0.00 0.00 0.00 0.00 0.00 0.00 0.00 0.00 0.00 15,802.17
HFC-143 NO NO NO NO NO NO NO NO NO NO NO NO NO NO 0.00
HFC-143a NO 0.00 0.00 0.01 0.01 0.01 0.02 0.02 0.02 0.02 0.02 0.01 0.02 0.02 100.00
HFC-227ea 0.00 0.00 0.01 0.01 0.01 0.01 0.01 0.01 0.01 0.01 0.02 0.02 0.02 0.02 34,227.70
HFC-236fa NO NO NO NO NO NO NO NO NO NO NO NO NO NO 0.00
HFC-245ca NO NO NO NO NO NO NO NO NO NO NO NO NO NO 0.00
Unspecified mix of listed HFCs(4)
- (Gg CO2 equivalent) NO NO NO NO NO NO NO NO NO NO NO NO NO NO 0.00
0.00 0.00 0.00 0.00 0.00 0.00 0.00 0.00 0.00 0.00 0.00 0.00 0.00 0.00 0.00
Emissions of PFCs(3)
- (Gg CO2 equivalent) 0.09 75.38 305.41 295.98 212.40 228.79 182.43 168.34 148.32 130.58 106.20 65.57 37.02 13.20 14,076.58
CF4 0.00 0.00 0.01 0.01 0.01 0.01 0.01 0.01 0.00 0.00 0.00 0.00 0.00 0.00 28,566.67
C2F6 0.00 0.01 0.03 0.03 0.02 0.02 0.02 0.01 0.01 0.01 0.01 0.01 0.00 0.00 4,800.00
C 3F8 NO NO NO NO NO NO NO NO NO NO NO NO NO NO 0.00
C4F10 NO NO NO NO NO NO NO NO NO NO NO NO NO NO 0.00
c-C4F8 NO NO NO NO 0.00 0.00 0.00 0.00 0.00 0.00 0.00 0.00 0.00 0.00 100.00
C5F12 NO NO NO NO NO NO NO NO NO NO NO NO NO NO 0.00
C6F14 NO NO NO NO NO NO NO NO NO NO NO NO NO NO 0.00
Unspecified mix of listed PFCs(4)
- (Gg CO2 equivalent) NO NO NO NO NO NO NO NO NO NO NO NO NO NO 0.00
0.00 0.00 0.00 0.00 0.00 0.00 0.00 0.00 0.00 0.00 0.00 0.00 0.00 0.00 0.00
Emissions of SF6(3)
- (Gg CO2 equivalent) 35.51 82.93 54.35 67.84 67.73 115.43 68.65 101.63 62.90 65.52 56.68 38.24 34.51 48.29 35.98
SF6 0.00 0.00 0.00 0.00 0.00 0.00 0.00 0.00 0.00 0.00 0.00 0.00 0.00 0.00 35.98
GREENHOUSE GAS SOURCE AND SINK CATEGORIES
217

A1.5 All GHG Summary Emission Trends 1990, 1995, 2000-2011
Base year (
1990 )1995 2000 2001 2002 2003 2004 2005 2006 2007 2008 2009 2010 2011
Change from base to
latest reported year
(%)
CO2 emissions including net CO2 from LULUCF 29,724.21 33,367.24 43,382.25 45,657.82 44,223.31 43,591.44 43,454.88 45,145.29 44,632.72 44,151.89 44,236.11 38,650.63 37,137.53 33,882.54 13.99
CO2 emissions excluding net CO2 from LULUCF 32,423.99 35,232.54 44,689.23 47,098.40 45,676.21 45,155.04 46,053.76 47,779.22 47,398.46 47,578.90 47,018.64 41,726.52 41,341.62 37,664.48 16.16
CH4 emissions including CH4 from LULUCF 13,683.42 13,931.81 13,420.17 13,474.94 13,399.30 13,961.32 13,168.30 12,814.38 12,889.26 12,364.64 12,233.72 11,932.93 11,717.53 11,636.40 -14.96
CH4 emissions excluding CH4 from LULUCF 13,674.13 13,919.68 13,412.20 13,459.04 13,395.64 13,938.77 13,155.16 12,809.60 12,884.48 12,359.27 12,228.17 11,929.81 11,697.10 11,628.82 -14.96
N2O emissions including N2O from LULUCF 9,140.50 9,660.69 9,528.06 9,021.37 8,648.47 8,571.60 8,391.34 8,174.63 8,040.98 7,794.68 7,702.86 7,612.73 7,896.40 7,693.86 -15.83
N2O emissions excluding N2O from LULUCF 9,112.13 9,620.70 9,482.75 8,970.28 8,598.81 8,512.25 8,333.13 8,117.83 7,984.55 7,737.83 7,633.62 7,543.38 7,825.02 7,621.12 -16.36
HFCs 1.31 54.60 259.81 279.85 309.24 382.20 416.04 475.81 548.66 535.67 566.66 523.33 559.30 538.61 41,079.90
PFCs 0.09 75.38 305.41 295.98 212.40 228.79 182.43 168.34 148.32 130.58 106.20 65.57 37.02 13.20 14,076.58
SF6 35.51 82.93 54.35 67.84 67.73 115.43 68.65 101.63 62.90 65.52 56.68 38.24 34.51 48.29 35.98
Total (including LULUCF) 52,585.05 57,172.65 66,950.04 68,797.81 66,860.45 66,850.77 65,681.64 66,880.07 66,322.84 65,042.97 64,902.23 58,823.42 57,382.30 53,812.90 2.33
Total (excluding LULUCF) 55,247.17 58,985.84 68,203.75 70,171.39 68,260.04 68,332.48 68,209.17 69,452.43 69,027.37 68,407.76 67,609.96 61,826.84 61,494.57 57,514.53 4.10
Base year (
1990 )1995 2000 2001 2002 2003 2004 2005 2006 2007 2008 2009 2010 2011
Change from base to
latest reported year
(%)
1. Energy 30,970.47 33,845.38 42,458.12 44,569.56 43,355.14 43,890.73 44,034.04 45,732.42 45,355.60 45,516.25 45,249.87 40,735.36 40,530.48 36,938.87 19.27
2. Industrial Processes 3,179.27 3,082.98 4,223.10 4,330.65 3,755.83 3,069.03 3,174.18 3,298.58 3,298.62 3,312.20 3,031.12 2,112.45 1,929.88 1,767.37 -44.41
3. Solvent and Other Product Use 80.03 85.39 79.04 77.91 75.60 74.39 73.92 74.07 75.10 75.67 74.30 71.88 71.66 72.49 -9.42
4. Agriculture 19,634.08 20,314.40 19,970.19 19,594.75 19,378.62 19,510.45 19,315.01 18,857.48 18,723.70 18,284.27 18,146.98 17,932.52 17,996.85 17,693.21 -9.89
5. Land Use, Land-Use Change and Forestry(5) -2,662.12 -1,813.19 -1,253.70 -1,373.59 -1,399.58 -1,481.71 -2,527.53 -2,572.36 -2,704.53 -3,364.79 -2,707.74 -3,003.42 -4,112.27 -3,701.62 39.05
6. Waste 1,383.32 1,657.68 1,473.30 1,598.52 1,694.85 1,787.87 1,612.01 1,489.89 1,574.34 1,219.38 1,107.69 974.62 965.69 1,042.58 -24.63
7. Other NA NA NA NA NA NA NA NA NA NA NA NA NA NA 0.00
Total (including LULUCF)(5) 52,585.05 57,172.65 66,950.04 68,797.81 66,860.45 66,850.77 65,681.64 66,880.07 66,322.84 65,042.97 64,902.23 58,823.42 57,382.30 53,812.90 2.33
GREENHOUSE GAS EMISSIONS
GREENHOUSE GAS SOURCE AND SINK CATEGORIES
218
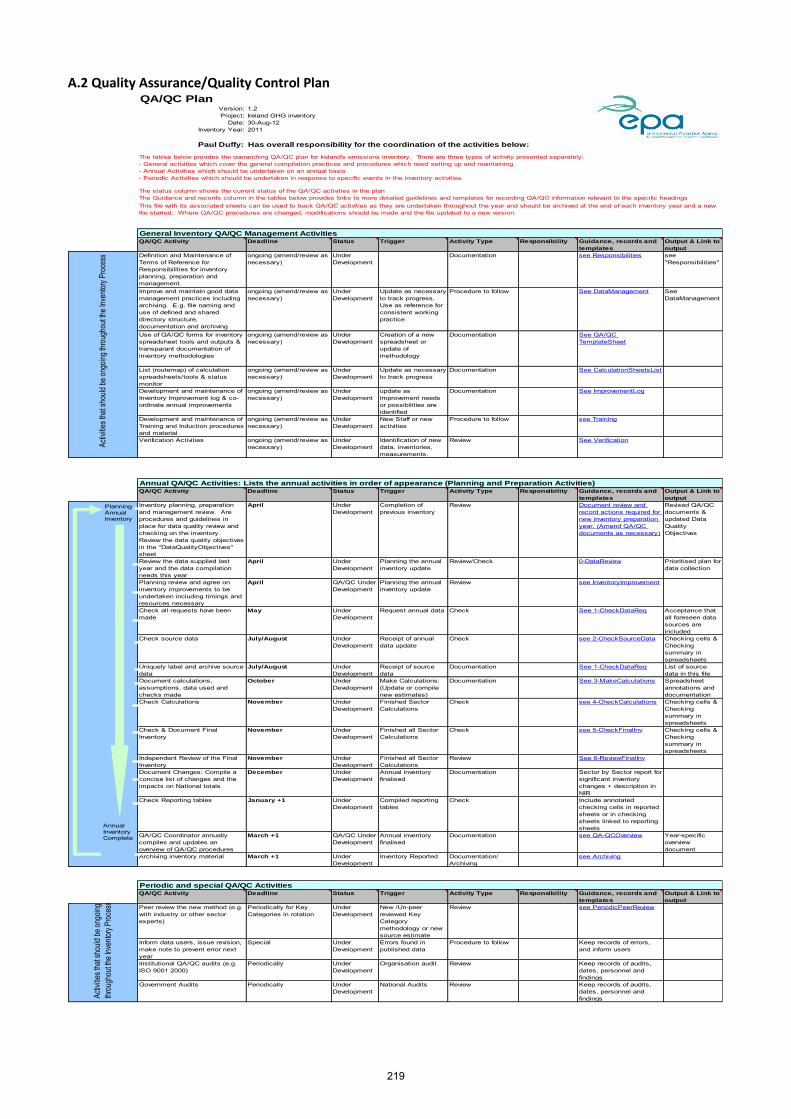
A.2 Quality Assurance/Quality Control Plan
QA/QC PlanVersion: 1.2Project: Ireland GHG inventory
Date: 30-Aug-12Inventory Year: 2011
Paul Duffy: Has overall responsibility for the coordination of the activities below:
The status column shows the current status of the QA/QC activities in the plan The Guidance and records column in the tables below provides links to more detailed guidelines and templates for recording QA/QC information relevant to the specific headings
General Inventory QA/QC Management ActivitiesQA/QC Activity Deadline Status Trigger Activity Type Responsibility Guidance, records and
templates
Output & Link to
output
Definition and Maintenance of Terms of Reference for Responsibilities for inventory planning, preparation and management.
ongoing (amend/review as necessary)
Under Development
Documentation see Responsibilities see "Responsibilities"
Improve and maintain good data management practices including archiving. E.g. file naming and use of defined and shared directory structure, documentation and archiving
ongoing (amend/review as necessary)
Under Development
Update as necessary to track progress. Use as reference for consistent working practice
Procedure to follow See DataManagement See DataManagement
Use of QA/QC forms for inventory spreadsheet tools and outputs & transparant documentation of inventory methodologies
ongoing (amend/review as necessary)
Under Development
Creation of a new spreadsheet or update of methodology
Documentation See QA/QC TemplateSheet
List (routemap) of calculation spreadsheets/tools & status monitor
ongoing (amend/review as necessary)
Under Development
Update as necessary to track progress
Documentation See CalculationSheetsList
Development and maintenance of Inventory Improvement log & co-ordinate annual improvements
ongoing (amend/review as necessary)
Under Development
update as improvement needs or possibilities are identified
Documentation See ImprovementLog
Development and maintenance of Training and Induction procedures and material
ongoing (amend/review as necessary)
Under Development
New Staff or new activities
Procedure to follow see Training
Verification Activities ongoing (amend/review as necessary)
Under Development
Identification of new data, inventories, measurements.
Review See Verification
Annual QA/QC Activities: Lists the annual activities in order of appearance (Planning and Preparation Activities)QA/QC Activity Deadline Status Trigger Activity Type Responsibility Guidance, records and
templates
Output & Link to
output
Inventory planning, preparation and management review. Are procedures and guidelines in place for data quality review and checking on the inventory. Review the data quality objectives in the "DataQualityObjectives" sheet
April Under Development
Completion of previous inventory
Review Document review and record actions required for new inventory preparation year. (Amend QA/QC documents as necessary)
Revised QA/QC documents & updated Data Quality Objectives
Review the data supplied last year and the data compilation needs this year
April Under Development
Planning the annual inventory update
Review/Check 0-DataReview Prioritised plan for data collection
Planning review and agree on inventory improvements to be undertaken including timings and resources necessary
April QA/QC Under Development
Planning the annual inventory update
Review see InventoryImprovement
Check all requests have been made
May Under Development
Request annual data Check See 1-CheckDataReq Acceptance that all foreseen data sources are included
Check source data July/August Under Development
Receipt of annual data update
Check see 2-CheckSourceData Checking cells & Checking summary in spreadsheets
Uniquely label and archive source data
July/August Under Development
Receipt of source data
Documentation See 1-CheckDataReq List of source data in this file
Document calculations, assumptions, data used and checks made
October Under Development
Make Calculations: (Update or compile new estimates)
Documentation See 3-MakeCalculations Spreadsheet annotations and documentation
Check Calculations November Under Development
Finished Sector Calculations
Check see 4-CheckCalculations Checking cells & Checking summary in spreadsheets
Check & Document Final Inventory
November Under Development
Finished all Sector Calculations
Check see 5-CheckFinalInv Checking cells & Checking summary in spreadsheets
Independent Review of the Final Inventory
November Under Development
Finished all Sector Calculations
Review See 6-ReviewFinalInv
Document Changes: Compile a concise list of changes and the impacts on National totals
December Under Development
Annual inventory finalised
Documentation Sector by Sector report for significant inventory changes + description in NIR
Check Reporting tables January +1 Under Development
Compiled reporting tables
Check Include annotated checking cells in reported sheets or in checking sheets linked to reporting sheets
QA/QC Coordinator annually compiles and updates an overview of QA/QC procedures
March +1 QA/QC Under Development
Annual inventory finalised
Documentation see QA-QCOverview Year-specific overview document
Archiving inventory material March +1 Under Development
Inventory Reported Documentation/ Archiving
see Archiving
Periodic and special QA/QC ActivitiesQA/QC Activity Deadline Status Trigger Activity Type Responsibility Guidance, records and
templates
Output & Link to
output
Peer review the new method (e.g. with industry or other sector experts)
Periodically for Key Categories in rotation
Under Development
New /Un-peer reviewed Key Category methodology or new source estimate
Review see PeriodicPeerReview
Inform data users, issue revision, make note to prevent error next year
Special Under Development
Errors found in published data
Procedure to follow Keep records of errors, and inform users
Institutional QA/QC audits (e.g. ISO 9001 2000)
Periodically Under Development
Organisation audit Review Keep records of audits, dates, personnel and findings
Government Audits Periodically Under Development
National Audits Review Keep records of audits, dates, personnel and findingsAc
tivitie
s tha
t sho
uld be
ongo
ing
throu
ghou
t the I
nven
tory P
roce
ssAc
tivitie
s tha
t sho
uld be
ongo
ing th
roug
hout
the In
vento
ry Pr
oces
s
The tables below provides the overarching QA/QC plan for Ireland's emissions inventory. There are three types of activity presented separately:- General activities which cover the general compilation practices and procedures which need setting up and maintaining- Annual Activities which should be undertaken on an annual basis- Periodic Activities which should be undertaken in response to specific events in the inventory activities
This file with its associated sheets can be used to track QA/QC activities as they are undertaken throughout the year and should be archived at the end of each inventory year and a new file started. Where QA/QC procedures are changed, modifications should be made and the file updated to a new version.
Annual Inventory Complete
PlanningAnnual Inventory
219

A.3 Institutional Arrangements for Compilation of Emission Inventories
ESTIMATION OF GHG EMISSIONS
and CRF Reporter
PREPARATION
IPCC GLs Default EFs,
GPG Default EFs
National Emission Factors
EMISSIONS TRADING
UNIT (CRRP) SUPPLEMENTARY
DATA SOURCES
KEY DATA
PROVIDERS
GHG Inventory Time-Series and National Inventory Report
Dept of Environment Community & Local
Govt
European Commission
Decision 280/2004/EC
UNFCCC
Secretariat
ACTIVITY DATA and ETS DATA
COMPILATION
Data Preparation and
Preprocessing
SELECTION OF
EMISSION FACTORS
Inventory
Approval
MOUs
Consultation
External Review
Inventory Manager
Programme Manager QA/QC Manager
EPA Board of Directors
QA/QC
QA/QC
Research, Special Studies
DAFM
KP Article 3.3
220
Annex A.4 GHG Inventory Key Category Analysis 2011 A.4.1 Key Category Analysis Level Assessment 1990 (excluding LULUCF) A.4.2 Key Category Analysis Level Assessment 2011 (excluding LULUCF) A.4.3 Key Category Analysis Level Assessment 1990 (including LULUCF) A.4.4 Key Category Analysis Level Assessment 2011 (including LULUCF) A.4.5 Key Category Analysis Trend Assessment 1990-2011 (excluding LULUCF) A.4.6 Key Category Analysis Trend Assessment 1990-2011 (including LULUCF)
221

A.4.1 Key Category Analysis Level Assessment 1990 (excluding LULUCF)
Ranking IPCC Sub-category
Emission Source / Activity Direct GHG
1990 Emissions
exclud. LULUCF
(Gg CO2 eq)
1990 Level assessment
exclud. LULUCF (%)
Cumulative Total (%)
1 1.A.1 Energy Industries - Solid Fuels CO2 8,009.44 14.50 14.50 2 4.A.1 Enteric Fermentation - Non-Dairy Cattle CH4 5,630.17 10.19 24.69 3 1.A.4.b Residential - Solid Fuels CO2 5,606.94 10.15 34.84 4 1.A.3.b Road Transport - Liquid Fuels CO2 4,690.42 8.49 43.33 5 4.D.1 Agricultural Soils - Direct Soil Emissions N2O 3,021.86 5.47 48.80 6 4.D.2 Agricultural Soils - Pasture, Range & Paddock N2O 2,868.35 5.19 53.99 7 4.A.1 Enteric Fermentation - Dairy Cattle CH4 2,854.99 5.17 59.16
8 1.A.2 Manufacturing Industries & Construction - Liquid Fuels CO2 2,198.38 3.98 63.14
9 1.A.4.a Commercial/Institutional - Liquid Fuels CO2 1,957.00 3.54 66.68 10 1.A.1 Energy Industries - Gaseous Fuels CO2 1,880.66 3.40 70.08 11 4.D.3 Agricultural Soils - Indirect Emissions N2O 1,381.01 2.50 72.58 12 4.B.1 Manure Management - Non-Dairy cattle CH4 1,279.75 2.32 74.90 13 1.A.1 Energy Industries - Liquid Fuels CO2 1,268.51 2.30 77.19 14 1.A.4.b Residential - Liquid Fuels CO2 1,175.35 2.13 79.32 15 6.A Waste - Solid Waste Disposal on land CH4 1,173.05 2.12 81.44 16 2.B Chemical Industry N2O 1,035.40 1.87 83.32 17 4.A.3 Enteric Fermentation - Sheep CH4 1,032.48 1.87 85.19 18 2.B Chemical Industry CO2 990.23 1.79 86.98 19 2.A.1 Cement Production CO2 884.00 1.60 88.58
20 1.A.2 Manufacturing Industries & Construction - Gaseous Fuels CO2 873.02 1.58 90.16
21 1.A.2 Manufacturing Industries & Construction - Solid Fuels CO2 871.24 1.58 91.74
22 1.A.4.c Agriculture/Forestry/Fisheries - Liquid Fuels CO2 660.30 1.20 92.93 23 4.B.1 Manure Management - Dairy Cattle CH4 608.23 1.10 94.03 24 4.B.13 Manure Management - Solid Storage N2O 371.24 0.67 94.71 25 1.A.4.b Residential - Solid Fuels CH4 356.29 0.64 95.35
222

A.4.2 Key Category Analysis Level Assessment 2011 (excluding LULUCF)
Ranking IPCC Sub-category
Emission Source / Activity Direct GHG
2011 Emissions
exclud. LULUCF (
Gg CO2 eq)
2011 Level assessment
exclud. LULUCF (%)
Cumulative Total (%)
1 1.A.3.b Road Transport - Liquid Fuels CO2 10,696.23 18.60 18.60 2 1.A.1 Energy Industries - Solid Fuels CO2 5,950.18 10.35 28.94 3 1.A.1 Energy Industries - Gaseous Fuels CO2 5,403.02 9.39 38.34 4 4.A.1 Enteric Fermentation - Non-Dairy Cattle CH4 5,221.02 9.08 47.41 5 1.A.4.b Residential - Liquid Fuels CO2 3,106.47 5.40 52.82 6 4.D.1 Agricultural Soils - Direct Soil Emissions N2O 2,762.22 4.80 57.62 7 4.D.2 Agricultural Soils - Pasture, Range & Paddock N2O 2,611.47 4.54 62.16 8 4.A.1 Enteric Fermentation - Dairy Cattle CH4 2,572.06 4.47 66.63
9 1.A.2 Manufacturing Industries & Construction - Gaseous Fuels CO2 2,042.55 3.55 70.18
10 1.A.4.b Residential - Solid Fuels CO2 1,966.41 3.42 73.60
11 1.A.2 Manufacturing Industries & Construction - Liquid Fuels CO2 1,725.04 3.00 76.60
12 1.A.4.b Residential - Gaseous Fuels CO2 1,359.20 2.36 78.96 13 4.D.3 Agricultural Soils - Indirect Emissions N2O 1,310.55 2.28 81.24 14 1.A.4.a Commercial/Institutional - Liquid Fuels CO2 1,183.33 2.06 83.30 15 4.B.1 Manure Management - Non-Dairy Cattle CH4 1,106.56 1.92 85.22 16 2.A.1 Cement Production CO2 966.27 1.68 86.90 17 1.A.4.a Commercial/Institutional - Gaseous Fuels CO2 906.22 1.58 88.48 18 6.A Waste - Solid Waste Disposal on land CH4 830.85 1.44 89.92 19 1.A.4.c Agriculture/Forestry/Fisheries - Liquid Fuels CO2 713.79 1.24 91.17 20 4.A.3 Enteric Fermentation - Sheep CH4 571.08 0.99 92.16 21 2.F Consumption of Halocarbons & SF6 HFC 538.61 0.94 93.09 22 4.B.1 Manure Management - Dairy Cattle CH4 474.76 0.83 93.92 23 1.A.1 Energy Industries - Liquid Fuels CO2 428.70 0.75 94.67 24 4.B.8 Manure Management - Pigs CH4 414.29 0.72 95.39
223
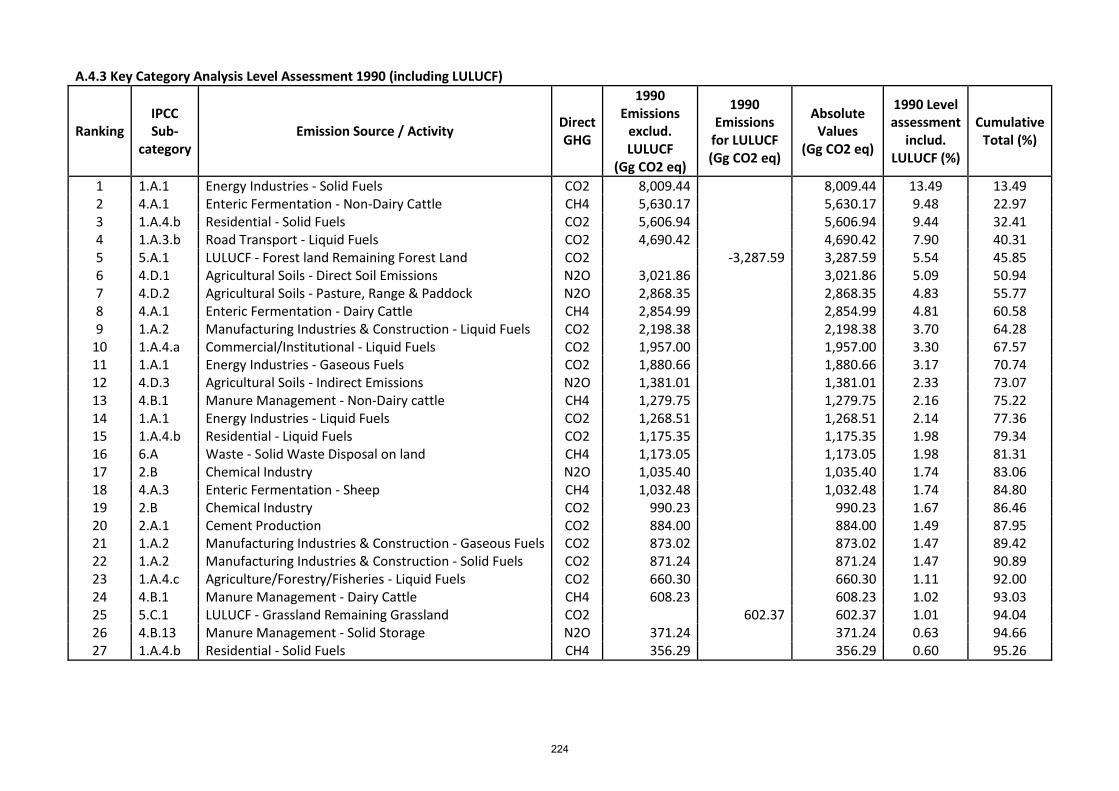
A.4.3 Key Category Analysis Level Assessment 1990 (including LULUCF)
Ranking IPCC Sub-
category Emission Source / Activity
Direct GHG
1990 Emissions
exclud. LULUCF
(Gg CO2 eq)
1990 Emissions
for LULUCF (Gg CO2 eq)
Absolute Values
(Gg CO2 eq)
1990 Level assessment
includ. LULUCF (%)
Cumulative Total (%)
1 1.A.1 Energy Industries - Solid Fuels CO2 8,009.44 8,009.44 13.49 13.49 2 4.A.1 Enteric Fermentation - Non-Dairy Cattle CH4 5,630.17 5,630.17 9.48 22.97 3 1.A.4.b Residential - Solid Fuels CO2 5,606.94 5,606.94 9.44 32.41 4 1.A.3.b Road Transport - Liquid Fuels CO2 4,690.42 4,690.42 7.90 40.31 5 5.A.1 LULUCF - Forest land Remaining Forest Land CO2 -3,287.59 3,287.59 5.54 45.85 6 4.D.1 Agricultural Soils - Direct Soil Emissions N2O 3,021.86 3,021.86 5.09 50.94 7 4.D.2 Agricultural Soils - Pasture, Range & Paddock N2O 2,868.35 2,868.35 4.83 55.77 8 4.A.1 Enteric Fermentation - Dairy Cattle CH4 2,854.99 2,854.99 4.81 60.58 9 1.A.2 Manufacturing Industries & Construction - Liquid Fuels CO2 2,198.38 2,198.38 3.70 64.28
10 1.A.4.a Commercial/Institutional - Liquid Fuels CO2 1,957.00 1,957.00 3.30 67.57 11 1.A.1 Energy Industries - Gaseous Fuels CO2 1,880.66 1,880.66 3.17 70.74 12 4.D.3 Agricultural Soils - Indirect Emissions N2O 1,381.01 1,381.01 2.33 73.07 13 4.B.1 Manure Management - Non-Dairy cattle CH4 1,279.75 1,279.75 2.16 75.22 14 1.A.1 Energy Industries - Liquid Fuels CO2 1,268.51 1,268.51 2.14 77.36 15 1.A.4.b Residential - Liquid Fuels CO2 1,175.35 1,175.35 1.98 79.34 16 6.A Waste - Solid Waste Disposal on land CH4 1,173.05 1,173.05 1.98 81.31 17 2.B Chemical Industry N2O 1,035.40 1,035.40 1.74 83.06 18 4.A.3 Enteric Fermentation - Sheep CH4 1,032.48 1,032.48 1.74 84.80 19 2.B Chemical Industry CO2 990.23 990.23 1.67 86.46 20 2.A.1 Cement Production CO2 884.00 884.00 1.49 87.95 21 1.A.2 Manufacturing Industries & Construction - Gaseous Fuels CO2 873.02 873.02 1.47 89.42 22 1.A.2 Manufacturing Industries & Construction - Solid Fuels CO2 871.24 871.24 1.47 90.89 23 1.A.4.c Agriculture/Forestry/Fisheries - Liquid Fuels CO2 660.30 660.30 1.11 92.00 24 4.B.1 Manure Management - Dairy Cattle CH4 608.23 608.23 1.02 93.03 25 5.C.1 LULUCF - Grassland Remaining Grassland CO2 602.37 602.37 1.01 94.04 26 4.B.13 Manure Management - Solid Storage N2O 371.24 371.24 0.63 94.66 27 1.A.4.b Residential - Solid Fuels CH4 356.29 356.29 0.60 95.26
224
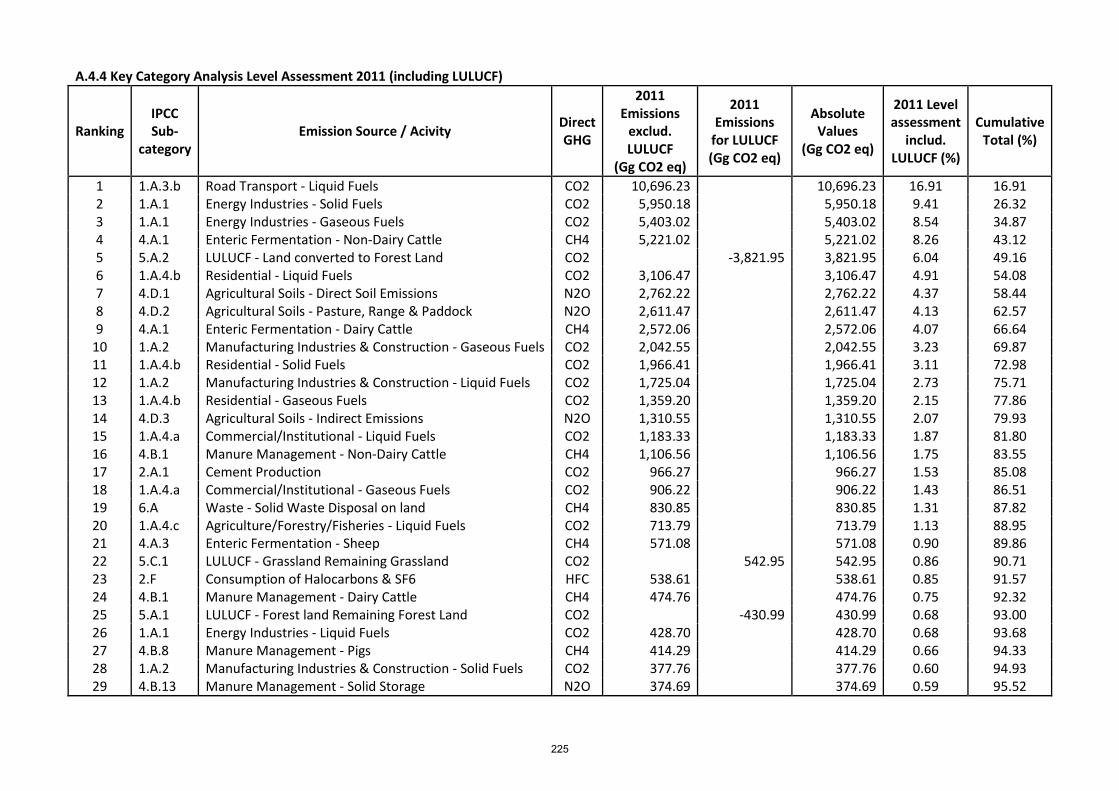
A.4.4 Key Category Analysis Level Assessment 2011 (including LULUCF)
Ranking IPCC Sub-
category Emission Source / Acivity
Direct GHG
2011 Emissions
exclud. LULUCF
(Gg CO2 eq)
2011 Emissions
for LULUCF (Gg CO2 eq)
Absolute Values
(Gg CO2 eq)
2011 Level assessment
includ. LULUCF (%)
Cumulative Total (%)
1 1.A.3.b Road Transport - Liquid Fuels CO2 10,696.23 10,696.23 16.91 16.91 2 1.A.1 Energy Industries - Solid Fuels CO2 5,950.18 5,950.18 9.41 26.32 3 1.A.1 Energy Industries - Gaseous Fuels CO2 5,403.02 5,403.02 8.54 34.87 4 4.A.1 Enteric Fermentation - Non-Dairy Cattle CH4 5,221.02 5,221.02 8.26 43.12 5 5.A.2 LULUCF - Land converted to Forest Land CO2 -3,821.95 3,821.95 6.04 49.16 6 1.A.4.b Residential - Liquid Fuels CO2 3,106.47 3,106.47 4.91 54.08 7 4.D.1 Agricultural Soils - Direct Soil Emissions N2O 2,762.22 2,762.22 4.37 58.44 8 4.D.2 Agricultural Soils - Pasture, Range & Paddock N2O 2,611.47 2,611.47 4.13 62.57 9 4.A.1 Enteric Fermentation - Dairy Cattle CH4 2,572.06 2,572.06 4.07 66.64
10 1.A.2 Manufacturing Industries & Construction - Gaseous Fuels CO2 2,042.55 2,042.55 3.23 69.87 11 1.A.4.b Residential - Solid Fuels CO2 1,966.41 1,966.41 3.11 72.98 12 1.A.2 Manufacturing Industries & Construction - Liquid Fuels CO2 1,725.04 1,725.04 2.73 75.71 13 1.A.4.b Residential - Gaseous Fuels CO2 1,359.20 1,359.20 2.15 77.86 14 4.D.3 Agricultural Soils - Indirect Emissions N2O 1,310.55 1,310.55 2.07 79.93 15 1.A.4.a Commercial/Institutional - Liquid Fuels CO2 1,183.33 1,183.33 1.87 81.80 16 4.B.1 Manure Management - Non-Dairy Cattle CH4 1,106.56 1,106.56 1.75 83.55 17 2.A.1 Cement Production CO2 966.27 966.27 1.53 85.08 18 1.A.4.a Commercial/Institutional - Gaseous Fuels CO2 906.22 906.22 1.43 86.51 19 6.A Waste - Solid Waste Disposal on land CH4 830.85 830.85 1.31 87.82 20 1.A.4.c Agriculture/Forestry/Fisheries - Liquid Fuels CO2 713.79 713.79 1.13 88.95 21 4.A.3 Enteric Fermentation - Sheep CH4 571.08 571.08 0.90 89.86 22 5.C.1 LULUCF - Grassland Remaining Grassland CO2 542.95 542.95 0.86 90.71 23 2.F Consumption of Halocarbons & SF6 HFC 538.61 538.61 0.85 91.57 24 4.B.1 Manure Management - Dairy Cattle CH4 474.76 474.76 0.75 92.32 25 5.A.1 LULUCF - Forest land Remaining Forest Land CO2 -430.99 430.99 0.68 93.00 26 1.A.1 Energy Industries - Liquid Fuels CO2 428.70 428.70 0.68 93.68 27 4.B.8 Manure Management - Pigs CH4 414.29 414.29 0.66 94.33 28 1.A.2 Manufacturing Industries & Construction - Solid Fuels CO2 377.76 377.76 0.60 94.93 29 4.B.13 Manure Management - Solid Storage N2O 374.69 374.69 0.59 95.52
225

A.4.5 Key Category Analysis Trend Assessment 1990-2011 (excluding LULUCF)
Ranking IPCC Sub-category
Emission Source / Acivity Direct GHG
1990 Emissions
exclud. LULUCF
(Gg CO2 eq)
2011 Emissions
exclud. LULUCF
(Gg CO2 eq)
2011 Level assessment
exclud. LULUCF
(%)
2011 Trend assessmen
t exclud. LULUCF
(%)
Contribution to Trend (%)
Cumulative Total (%)
1 1.A.3.b Road Transport - Liquid Fuels CO2 4,690.42 10,696.23 18.60 9.71 20.73 20.73 2 1.A.4.b Residential - Solid Fuels CO2 5,606.94 1,966.41 3.42 6.46 13.80 34.53 3 1.A.1 Energy Industries - Gaseous Fuels CO2 1,880.66 5,403.02 9.39 5.75 12.28 46.81 4 1.A.1 Energy Industries - Solid Fuels CO2 8,009.44 5,950.18 10.35 3.99 8.51 55.33 5 1.A.4.b Residential - Liquid Fuels CO2 1,175.35 3,106.47 5.40 3.14 6.71 62.04
6 1.A.2 Manufacturing Industries & Construction - Gaseous Fuels CO2 873.02 2,042.55 3.55 1.89 4.04 66.09
7 1.A.4.b Residential - Gaseous Fuels CO2 269.73 1,359.20 2.36 1.80 3.85 69.93 8 1.A.1 Energy Industries - Liquid Fuels CO2 1,268.51 428.70 0.75 1.49 3.18 73.11 9 1.A.4.a Commercial/Institutional - Liquid Fuels CO2 1,957.00 1,183.33 2.06 1.43 3.05 76.16
10 1.A.4.a Commercial/Institutional - Gaseous Fuels CO2 223.49 906.22 1.58 1.12 2.40 78.56 11 4.A.1 Enteric Fermentation - Non-Dairy Cattle CH4 5,630.17 5,221.02 9.08 1.07 2.28 80.84
12 1.A.2 Manufacturing Industries & Construction - Liquid Fuels CO2 2,198.38 1,725.04 3.00 0.94 2.01 82.85
13 2.F Consumption of Halocarbons & SF6 HFC 1.31 538.61 0.94 0.90 1.92 84.77
14 1.A.2 Manufacturing Industries & Construction - Solid Fuels CO2 871.24 377.76 0.66 0.88 1.89 86.65
15 4.A.3 Enteric Fermentation - Sheep CH4 1,032.48 571.08 0.99 0.84 1.80 88.45 16 4.A.1 Enteric Fermentation - Dairy Cattle CH4 2,854.99 2,572.06 4.47 0.67 1.43 89.88 17 6.A Waste - Solid Waste Disposal on land CH4 1,173.05 830.85 1.44 0.65 1.39 91.27 18 4.D.1 Agricultural Soils - Direct Soil Emissions N2O 3,021.86 2,762.22 4.80 0.64 1.37 92.64 19 4.D.2 Agricultural Soils - Pasture, Range & Paddock N2O 2,868.35 2,611.47 4.54 0.63 1.34 93.97 20 1.A.4.b Residential - Solid Fuels CH4 356.29 124.88 0.22 0.41 0.88 94.85 21 4.B.1 Manure Management - Non-Dairy Cattle CH4 1,279.75 1,106.56 1.92 0.38 0.80 95.65
226

A.4.6 Key Category Analysis Trend Assessment 1990-2011 (including LULUCF)
Ranking IPCC Sub-
category Emission Source / Acivity
Direct GHG
1990 Emissions
includ. LULUCF
(Gg CO2 eq)
2011 Emissions
includ. LULUCF
(Gg CO2 eq)
2011 Level assessment
includ. LULUCF
(%)
2011 Trend assessment
includ. LULUCF
(%)
Contribution to Trend (%)
Cumulative Total (%)
1 1.A.3.b Road Transport - Liquid Fuels CO2 4,690.42 10,696.23 16.91 8.44 14.67 14.67 2 1.A.4.b Residential - Solid Fuels CO2 5,606.94 1,966.41 3.11 5.95 10.34 25.02 3 5.A.2 LULUCF - Land converted to Forest Land CO2 17.90 3,821.95 6.04 5.64 9.80 34.81 4 1.A.1 Energy Industries - Gaseous Fuels CO2 1,880.66 5,403.02 8.54 5.04 8.75 43.57 5 5.A.1 LULUCF - Forest land Remaining Forest Land CO2 3,287.59 430.99 0.68 4.56 7.93 51.49 6 1.A.1 Energy Industries - Solid Fuels CO2 8,009.44 5,950.18 9.41 3.84 6.68 58.17 7 1.A.4.b Residential - Liquid Fuels CO2 1,175.35 3,106.47 4.91 2.75 4.77 62.95 8 5.E.2 LULUCF - Land converted to Settlements CO2 1,173.05 9.56 0.02 1.84 3.20 66.15
9 1.A.2 Manufacturing Industries & Construction - Gaseous Fuels CO2 873.02 2,042.55 3.23 1.65 2.86 69.01
10 1.A.4.b Residential - Gaseous Fuels CO2 269.73 1,359.20 2.15 1.59 2.76 71.77 11 1.A.1 Energy Industries - Liquid Fuels CO2 1,268.51 428.70 0.68 1.37 2.38 74.16 12 1.A.4.a Commercial/Institutional - Liquid Fuels CO2 1,957.00 1,183.33 1.87 1.34 2.33 76.49 13 6.A Waste - Solid Waste Disposal on land CH4 14.73 830.85 1.31 1.21 2.10 78.59 14 4.A.1 Enteric Fermentation - Non-Dairy Cattle CH4 5,630.17 5,221.02 8.26 1.16 2.02 80.61 15 1.A.4.a Commercial/Institutional - Gaseous Fuels CO2 223.49 906.22 1.43 0.99 1.72 82.33
16 1.A.2 Manufacturing Industries & Construction - Liquid Fuels CO2 2,198.38 1,725.04 2.73 0.92 1.60 83.92
17 1.A.2 Manufacturing Industries & Construction - Solid Fuels CO2 871.24 377.76 0.60 0.82 1.42 85.34
18 2.F Consumption of Halocarbons & SF6 HFC 1.31 538.61 0.85 0.80 1.38 86.73 19 4.A.3 Enteric Fermentation - Sheep CH4 1,032.48 571.08 0.90 0.79 1.37 88.10 20 5.C.1 LULUCF - Grassland Remaining Grassland CO2 47.10 542.95 0.86 0.73 1.27 89.36 21 4.A.1 Enteric Fermentation - Dairy Cattle CH4 2,854.99 2,572.06 4.07 0.70 1.22 90.58 22 4.D.1 Agricultural Soils - Direct Soil Emissions N2O 3,021.86 2,762.22 4.37 0.68 1.19 91.77 23 4.D.2 Agricultural Soils - Pasture, Range & Paddock N2O 2,868.35 2,611.47 4.13 0.66 1.15 92.92 24 5.C.2 LULUCF - Land converted to Grassland CO2 0.00 322.79 0.51 0.48 0.83 93.76 25 5.B.2 LULUCF - Land converted to Cropland CO2 602.37 329.34 0.52 0.46 0.81 94.56 26 4.B.1 Manure Management - Non-Dairy Cattle CH4 1,279.75 1,106.56 1.75 0.38 0.67 95.23
227

Annex A.5 GHG Inventory Uncertainty Analysis 2011 A.5.1 Tier 1 Uncertainty Estimates 2011 (excluding LULUCF) A.5.2 Tier 1 Uncertainty Estimates 2011 (including LULUCF)
228

A.5.1 Tier 1 Uncertainty Estimates 2011 (excluding LULUCF)
IPCC Source Category
Gas
Emissio
ns in
19
90
Emissio
ns in
20
11
Activity D
ata (AD
)
Un
certainty
Emissio
n Facto
r (EF) U
ncertain
ty
Co
mb
ine
d U
nce
rtainty
Co
mb
ine
d U
nce
rtainty
as % o
f Emissio
ns in
2
01
1
Co
mb
ine
d Em
ission
s
Un
certainty Sq
uared
Type
A Sen
sitivity
Type
B Sen
sitivity
Un
certainty in
Tren
d in
To
tal Emissio
ns d
ue
to
AD
Un
certainty in
Tren
d in
Total Em
ission
s du
e to
EF
Co
mb
ine
d U
nce
rtainty
in Tre
nd
in To
tal Em
ission
s
Co
mb
ine
d Tre
nd
U
ncertain
ty Squ
ared
Gg CO2eq Gg CO2eq % % % % % % % % %
1.A.1 Energy Industries - Liquid Fuels CO2 1,268.51 428.70 1.00 2.50 2.69 0.02 0.00 -0.02 0.01 0.01 -0.04 0.04 0.00
1.A.1 Energy Industries - Solid Fuels CO2 8,009.44 5,966.57 1.00 5.00 5.10 0.53 0.28 -0.04 0.11 0.15 -0.21 0.26 0.07
1.A.1 Energy Industries - Gaseous Fuels CO2 1,880.66 5,403.02 1.00 2.50 2.69 0.25 0.06 0.06 0.10 0.14 0.16 0.21 0.04
1.A.2 Manufacturing Industries & Construction - Liquid Fuels exc Pet Coke CO2 2,013.71 1,533.54 10.00 2.50 10.31 0.27 0.08 -0.01 0.03 0.39 -0.03 0.39 0.15
1.A.2 Manufacturing Industries & Construction - Coal CO2 871.24 377.76 2.00 5.00 5.39 0.04 0.00 -0.01 0.01 0.02 -0.05 0.05 0.00
1.A.2 Manufacturing Industries & Construction - Pet Coke CO2 184.67 191.50 5.00 5.00 7.07 0.02 0.00 0.00 0.00 0.02 0.00 0.02 0.00
1.A.2 Manufacturing Industries & Construction - Gaseous Fuels CO2 873.02 2,042.55 2.50 2.50 3.54 0.13 0.02 0.02 0.04 0.13 0.05 0.14 0.02
1.A.2 Manufacturing Industries & Construction - Non-Renewable Waste CO2 0.00 29.88 1.00 5.00 5.10 0.00 0.00 0.00 0.00 0.00 0.00 0.00 0.00
1.A.3 Transport - Oil CO2 4,959.65 11,008.98 1.00 2.50 2.69 0.52 0.27 0.11 0.20 0.28 0.26 0.39 0.15
1.A.3.e Other Transport - Gaseous Fuels CO2 62.04 153.31 1.00 2.50 2.69 0.01 0.00 0.00 0.00 0.00 0.00 0.01 0.00
1.A.4.a Commercial/Institutional - Liquid Fuels CO2 1,957.00 1,183.33 10.00 5.00 11.18 0.23 0.05 -0.02 0.02 0.30 -0.08 0.31 0.10
1.A.4.a Commercial/Institutional - Coal CO2 2.56 0.00 5.00 10.00 11.18 0.00 0.00 0.00 0.00 0.00 0.00 0.00 0.00
1.A.4.a Commercial/Institutional - Peat CO2 135.73 0.00 10.00 20.00 22.36 0.00 0.00 0.00 0.00 0.00 -0.05 0.05 0.00
1.A.4.a Commercial/Institutional - Gaseous Fuels CO2 223.49 906.22 2.50 2.50 3.54 0.06 0.00 0.01 0.02 0.06 0.03 0.07 0.00
1.A.4.b Residential - Liquid Fuels CO2 1,099.66 3,072.66 10.00 5.00 11.18 0.60 0.36 0.03 0.06 0.79 0.17 0.81 0.65
1.A.4.b Residential - Coal CO2 2,483.57 932.77 5.00 10.00 11.18 0.18 0.03 -0.03 0.02 0.12 -0.30 0.32 0.10
1.A.4.b Residential - Pet coke CO2 75.68 33.81 5.00 5.00 7.07 0.00 0.00 0.00 0.00 0.00 0.00 0.01 0.00
1.A.4.b Residential - Peat CO2 3,123.37 1,033.63 10.00 20.00 22.36 0.40 0.16 -0.04 0.02 0.26 -0.80 0.84 0.71
1.A.4.b Residential - Gaseous Fuels CO2 269.73 1,359.20 2.50 2.50 3.54 0.08 0.01 0.02 0.02 0.09 0.05 0.10 0.01
1.A.4.c Agriculture/Forestry/Fisheries - Liquid Fuels CO2 660.30 713.79 10.00 5.00 11.18 0.14 0.02 0.00 0.01 0.18 0.00 0.18 0.03
2.A.1 Cement Production CO2 884.00 966.27 1.50 1.50 2.12 0.04 0.00 0.00 0.02 0.04 0.00 0.04 0.00
2.A.2 Lime Production CO2 214.08 199.06 5.00 5.00 7.07 0.02 0.00 0.00 0.00 0.03 0.00 0.03 0.00
2.A.3 Limestone Use CO2 0.15 1.04 5.00 2.50 5.59 0.00 0.00 0.00 0.00 0.00 0.00 0.00 0.00
2.A.4 Soda Ash Production and Use CO2 0.10 0.07 5.00 2.50 5.59 0.00 0.00 0.00 0.00 0.00 0.00 0.00 0.00
2.A.7 Glass Production CO2 13.33 0.00 5.00 5.00 7.07 0.00 0.00 0.00 0.00 0.00 0.00 0.00 0.00
2.A.7 Bricks & Ceramics CO2 5.07 0.83 5.00 5.00 7.07 0.00 0.00 0.00 0.00 0.00 0.00 0.00 0.00
2.B.1 Ammonia Production CO2 990.23 0.00 1.00 5.00 5.10 0.00 0.00 -0.02 0.00 0.00 -0.09 0.09 0.01
3 Solvent and Other Product Use CO2 80.03 72.49 30.00 5.00 30.41 0.04 0.00 0.00 0.00 0.06 0.00 0.06 0.00
6.C Waste - Waste Incineration CO2 82.97 53.49 10.00 5.00 11.18 0.01 0.00 0.00 0.00 0.01 0.00 0.01 0.00
Total CO2 32,423.99 37,664.48 0.65 1.16 1.34 1.44 2.07
229

IPCC Source Category
Gas
Emissio
ns in
19
90
Emissio
ns in
20
11
Activity D
ata (AD
) U
ncertain
ty
Emissio
n Facto
r (EF) U
ncertain
ty
Co
mb
ine
d U
nce
rtainty
Co
mb
ine
d U
nce
rtainty
as % o
f Emissio
ns in
20
11
Co
mb
ine
d Em
ission
s U
ncertain
ty Squ
ared
Type
A Sen
sitivity
Type
B Sen
sitivity
Un
certainty in
Tren
d in
To
tal Emissio
ns d
ue
to
AD
Un
certainty in
Tren
d in
To
tal Emissio
ns d
ue
to
EF
Co
mb
ine
d U
nce
rtainty
in Tre
nd
in To
tal
Emissio
ns
Co
mb
ine
d Tre
nd
Un
certainty Sq
uared
Gg CO2eq Gg CO2eq % % % % % % % % %
1.A.1 Energy Industries - Liquid Fuels CH4 0.33 0.12 1.00 50.00 50.01 0.00 0.00 0.00 0.00 0.00 0.00 0.00 0.00
1.A.1 Energy Industries - Solid Fuels CH4 2.36 1.93 1.00 50.00 50.01 0.00 0.00 0.00 0.00 0.00 0.00 0.00 0.00
1.A.1 Energy Industries - Gaseous Fuels CH4 2.88 2.36 1.00 50.00 50.01 0.00 0.00 0.00 0.00 0.00 0.00 0.00 0.00
1.A.2 Manufacturing Industries & Construction - Liquid Fuels exc Pet Coke CH4 1.60 1.17 10.00 50.00 50.99 0.00 0.00 0.00 0.00 0.00 0.00 0.00 0.00
1.A.2 Manufacturing Industries & Construction - Coal CH4 1.93 0.84 2.00 50.00 50.04 0.00 0.00 0.00 0.00 0.00 0.00 0.00 0.00
1.A.2 Manufacturing Industries & Construction - Pet Coke CH4 0.12 0.13 5.00 50.00 50.25 0.00 0.00 0.00 0.00 0.00 0.00 0.00 0.00
1.A.2 Manufacturing Industries & Construction - Gaseous Fuels CH4 0.33 0.75 2.50 50.00 50.06 0.00 0.00 0.00 0.00 0.00 0.00 0.00 0.00
1.A.2 Manufacturing Industries & Construction - Non-Renewable Waste CH4 0.00 0.04 1.00 50.00 50.01 0.00 0.00 0.00 0.00 0.00 0.00 0.00 0.00
1.A.3 Transport - Oil CH4 37.16 17.62 1.00 50.00 50.01 0.02 0.00 0.00 0.00 0.00 -0.02 0.02 0.00
1.A.3.e Other Transport - Gaseous Fuels CH4 0.12 0.28 1.00 50.00 50.01 0.00 0.00 0.00 0.00 0.00 0.00 0.00 0.00
1.A.4.a Commercial/Institutional - Liquid Fuels CH4 5.53 3.36 10.00 50.00 50.99 0.00 0.00 0.00 0.00 0.00 0.00 0.00 0.00
1.A.4.a Commercial/Institutional - Coal CH4 0.01 0.00 5.00 50.00 50.25 0.00 0.00 0.00 0.00 0.00 0.00 0.00 0.00
1.A.4.a Commercial/Institutional - Peat CH4 0.28 0.00 10.00 50.00 50.99 0.00 0.00 0.00 0.00 0.00 0.00 0.00 0.00
1.A.4.a Commercial/Institutional - Gaseous Fuels CH4 0.43 1.67 2.50 50.00 50.06 0.00 0.00 0.00 0.00 0.00 0.00 0.00 0.00
1.A.4.b Residential - Liquid Fuels CH4 2.95 8.87 10.00 50.00 50.99 0.01 0.00 0.00 0.00 0.00 0.01 0.01 0.00
1.A.4.b Residential - Coal CH4 165.07 61.24 5.00 50.00 50.25 0.05 0.00 0.00 0.00 0.01 -0.10 0.10 0.01
1.A.4.b Residential - Pet coke CH4 0.17 0.08 5.00 50.00 50.25 0.00 0.00 0.00 0.00 0.00 0.00 0.00 0.00
1.A.4.b Residential - Peat CH4 191.22 63.64 10.00 50.00 50.99 0.06 0.00 0.00 0.00 0.02 -0.12 0.12 0.02
1.A.4.b Residential - Gaseous Fuels CH4 0.52 2.50 2.50 50.00 50.06 0.00 0.00 0.00 0.00 0.00 0.00 0.00 0.00
1.A.4.c Agriculture/Forestry/Fisheries - Liquid Fuels CH4 0.90 1.01 10.00 50.00 50.99 0.00 0.00 0.00 0.00 0.00 0.00 0.00 0.00
1.A Biomass CH4 13.43 14.81 10.00 50.00 50.99 0.01 0.00 0.00 0.00 0.00 0.00 0.00 0.00
1.B Fugitive Emissions CH4 131.26 27.79 2.50 10.00 10.31 0.00 0.00 0.00 0.00 0.00 -0.02 0.02 0.00
4.A.1 Enteric Fermentation - Dairy Cattle CH4 2,854.99 2,572.06 1.00 15.00 15.03 0.67 0.45 -0.01 0.05 0.07 -0.11 0.13 0.02
4.A.1 Enteric Fermentation - Non-dairy Cattle CH4 5,630.17 5,221.02 1.00 15.00 15.03 1.36 1.86 -0.01 0.09 0.13 -0.17 0.22 0.05
4.A Enteric Fermentation - Other Livestock CH4 1,088.95 645.84 1.00 30.00 30.02 0.34 0.11 -0.01 0.01 0.02 -0.26 0.27 0.07
4.B.1 Manure Management - Dairy Cattle CH4 608.23 474.76 1.00 15.00 15.03 0.12 0.02 0.00 0.01 0.01 -0.04 0.04 0.00
4.B.1 Manure Management - Non-dairy Cattle CH4 1,279.75 1,106.56 1.00 15.00 15.03 0.29 0.08 0.00 0.02 0.03 -0.06 0.07 0.00
4.B Manure Management - Other Livestock CH4 465.65 551.19 1.00 30.00 30.02 0.29 0.08 0.00 0.01 0.01 0.04 0.04 0.00
6.A Waste - Solid Waste Disposal on land (abc) CH4 1,173.05 830.85 34.64 34.64 31.13 0.45 0.20 -0.01 0.02 0.74 -0.24 0.78 0.60
6.B Waste - Waste Water Handling CH4 14.73 16.32 10.00 30.00 31.62 0.01 0.00 0.00 0.00 0.00 0.00 0.00 0.00
6.C Waste - Waste Incineration CH4 0.01 0.00 10.00 30.00 31.62 0.00 0.00 0.00 0.00 0.00 0.00 0.00 0.00
Total CH4 13,674.13 11,628.82 1.68 2.82 0.88 0.77
230

IPCC Source Category
Gas
Emissio
ns in
19
90
Emissio
ns in
20
11
Activity D
ata (AD
)
Un
certainty
Emissio
n Facto
r (EF)
Un
certainty
Co
mb
ine
d U
nce
rtainty
Co
mb
ine
d U
nce
rtainty
as % o
f Emissio
ns in
2
01
1
Co
mb
ine
d Em
ission
s
Un
certainty Sq
uared
Type
A Sen
sitivity
Type
B Sen
sitivity
Un
certainty in
Tren
d in
To
tal Emissio
ns d
ue
to
AD
Un
certainty in
Tren
d in
Total Em
ission
s du
e to
EF
Co
mb
ine
d U
nce
rtainty
in Tre
nd
in To
tal
Emissio
ns
Co
mb
ine
d Tre
nd
U
ncertain
ty Squ
ared
Gg CO2eq Gg CO2eq % % % % % % % % %
1.A.1 Energy Industries - Liquid Fuels N2O 1.52 0.33 1.00 50.00 50.01 0.00 0.00 0.00 0.00 0.00 0.00 0.00 0.00
1.A.1 Energy Industries - Solid Fuels N2O 62.22 49.53 1.00 50.00 50.01 0.04 0.00 0.00 0.00 0.00 -0.01 0.01 0.00
1.A.1 Energy Industries - Gaseous Fuels N2O 10.62 84.08 1.00 50.00 50.01 0.07 0.01 0.00 0.00 0.00 0.07 0.07 0.00
1.A.2 Manufacturing Industries & Construction - Liquid Fuels exc Pet Coke N2O 4.65 3.32 10.00 50.00 50.99 0.00 0.00 0.00 0.00 0.00 0.00 0.00 0.00
1.A.2 Manufacturing Industries & Construction - Coal N2O 4.28 1.86 2.00 50.00 50.04 0.00 0.00 0.00 0.00 0.00 0.00 0.00 0.00
1.A.2 Manufacturing Industries & Construction - Pet Coke N2O 0.37 0.38 5.00 50.00 50.25 0.00 0.00 0.00 0.00 0.00 0.00 0.00 0.00
1.A.2 Manufacturing Industries & Construction - Gaseous Fuels N2O 0.00 0.11 1.00 50.00 50.01 0.00 0.00 0.00 0.00 0.00 0.00 0.00 0.00
1.A.2 Manufacturing Industries & Construction - Non-Renewable Waste N2O 0.49 1.11 2.50 50.00 50.06 0.00 0.00 0.00 0.00 0.00 0.00 0.00 0.00
1.A.3 Transport - Oil N2O 61.77 108.58 1.00 25.00 25.02 0.05 0.00 0.00 0.00 0.00 0.02 0.02 0.00
1.A.3.e Other Transport - Gaseous Fuels N2O 0.70 1.67 1.00 50.00 50.01 0.00 0.00 0.00 0.00 0.00 0.00 0.00 0.00
1.A.4.a Commercial/Institutional - Liquid Fuels N2O 4.87 2.96 10.00 50.00 50.99 0.00 0.00 0.00 0.00 0.00 0.00 0.00 0.00
1.A.4.a Commercial/Institutional - Coal N2O 0.01 0.00 5.00 50.00 50.25 0.00 0.00 0.00 0.00 0.00 0.00 0.00 0.00
1.A.4.a Commercial/Institutional - Peat N2O 0.58 0.00 10.00 50.00 50.99 0.00 0.00 0.00 0.00 0.00 0.00 0.00 0.00
1.A.4.a Commercial/Institutional - Gaseous Fuels N2O 0.13 0.49 2.50 50.00 50.06 0.00 0.00 0.00 0.00 0.00 0.00 0.00 0.00
1.A.4.b Residential - Liquid Fuels N2O 2.43 7.77 10.00 50.00 50.99 0.01 0.00 0.00 0.00 0.00 0.00 0.01 0.00
1.A.4.b Residential - Coal N2O 12.18 4.52 5.00 50.00 50.25 0.00 0.00 0.00 0.00 0.00 -0.01 0.01 0.00
1.A.4.b Residential - Pet coke N2O 0.15 0.07 5.00 50.00 50.25 0.00 0.00 0.00 0.00 0.00 0.00 0.00 0.00
1.A.4.b Residential - Peat N2O 13.17 4.38 10.00 50.00 50.99 0.00 0.00 0.00 0.00 0.00 -0.01 0.01 0.00
1.A.4.b Residential - Gaseous Fuels N2O 0.15 0.74 2.50 50.00 50.06 0.00 0.00 0.00 0.00 0.00 0.00 0.00 0.00
1.A.4.c Agriculture/Forestry/Fisheries - Liquid Fuels N2O 72.05 71.60 10.00 50.00 50.99 0.06 0.00 0.00 0.00 0.02 0.00 0.02 0.00
1.A Biomass N2O 5.48 13.94 10.00 50.00 50.99 0.01 0.00 0.00 0.00 0.00 0.01 0.01 0.00
2.B Nitric Acid N2O 1,035.40 0.00 1.00 10.00 10.05 0.00 0.00 -0.02 0.00 0.00 -0.20 0.20 0.04
4.B.12 Manure Management - Liquid Systems (d) N2O 63.87 62.84 11.22 100.00 100.63 0.11 0.01 0.00 0.00 0.02 -0.01 0.02 0.00
4.B.13 Manure Management - Solid Storage (d) N2O 371.24 374.69 11.22 100.00 100.63 0.66 0.43 0.00 0.01 0.11 -0.02 0.11 0.01
4.D.1 Agricultural Soils - Direct Soil Emissions (d) N2O 3,021.86 2,762.22 11.22 100.00 100.63 4.83 23.36 -0.01 0.05 0.79 -0.69 1.05 1.11
4.D.2 Agricultural Soils - Pasture, Range & Paddock (d) N2O 2,868.35 2,611.47 11.22 100.00 100.63 4.57 20.88 -0.01 0.05 0.75 -0.68 1.01 1.02
4.D.3 Agricultural Soils - Indirect Emissions (d) N2O 1,381.01 1,310.55 11.22 50.00 51.24 1.17 1.36 0.00 0.02 0.38 -0.12 0.39 0.16
6.B Waste - Waste Water Handling N2O 111.71 141.35 10.00 10.00 14.14 0.03 0.00 0.00 0.00 0.04 0.00 0.04 0.00
6.C Waste - Waste Incineration N2O 0.86 0.57 10.00 10.00 14.14 0.00 0.00 0.00 0.00 0.00 0.00 0.00 0.00
Total N2O 9,112.13 7,621.12 6.79 46.05 1.53 2.35
231

IPCC Source Category
Gas
Emissio
ns in
19
90
Emissio
ns in
20
11
Activity D
ata (AD
)
Un
certainty
Emissio
n Facto
r (EF)
Un
certainty
Co
mb
ine
d U
nce
rtainty
Co
mb
ine
d U
nce
rtainty
as % o
f Emissio
ns in
2
01
1
Co
mb
ine
d Em
ission
s U
ncertain
ty Squ
ared
Type
A Sen
sitivity
Type
B Sen
sitivity
Un
certainty in
Tren
d in
To
tal Emissio
ns d
ue
to
AD
Un
certainty in
Tren
d in
Total Em
ission
s du
e to
EF
Co
mb
ine
d U
nce
rtainty
in Tre
nd
in To
tal
Emissio
ns
Co
mb
ine
d Tre
nd
Un
certainty Sq
uared
Gg CO2eq Gg CO2eq % % % % % % % % %
2.F Consumption of Halocarbons & SF6 HFC 1.31 538.61 20.00 10.00 22.36 0.21 0.04 0.01 0.01 0.28 0.10 0.29 0.09
2.F Consumption of Halocarbons & SF6 PFC 0.09 13.20 10.00 2.50 10.31 0.00 0.00 0.00 0.00 0.00 0.00 0.00 0.00
2.F Consumption of Halocarbons & SF6 SF6 35.51 48.29 15.00 5.00 15.81 0.01 0.00 0.00 0.00 0.02 0.00 0.02 0.00
Total HFC, PFC & SF6 36.91 600.10 0.21 0.04 0.29 0.09
Total all gases 55,247.17 57,514.53 50.26 5.27
Overall Uncertainty in
Emissions 7.09 Trend Uncertainty 2.30
232

A.5.2 Tier 1 Uncertainty Estimates 2011 (including LULUCF)
IPCC Source Category
Gas
Emissio
ns
in 19
90
Emissio
ns
in 2
011
Activity D
ata (AD
) U
nce
rtainty
Emissio
n Facto
r (EF) U
nce
rtainty
Co
mb
ine
d
Un
certain
ty
Co
mb
ine
d
Un
certain
ty as %
of Em
ission
s
in 20
11
Co
mb
ine
d Em
ission
s
Un
certain
ty Squ
ared
Type
A Sen
sitivity
Type
B Sen
sitivity
Un
certain
ty in Tren
d
in
Total Em
ission
s du
e
to A
D
Un
certain
ty in Tren
d
in
Total Em
ission
s du
e
to EF
Co
mb
ine
d
Un
certain
ty in
Tren
d in
Total
Emissio
ns
Co
mb
ine
d Tren
d
Un
certain
ty Squ
ared
Gg CO2eq
Gg CO2eq
% % % % % % % % % 1.A.1 Energy Industries - Liquid Fuels CO
2 1,268.51 428.70 1.00 2.50 2.69 0.02 0.00 -0.02 0.01 0.01 -0.04 0.04 0.00
1.A.1 Energy Industries - Solid Fuels CO2
8,009.44 5,966.57 1.00 5.00 5.10 0.57 0.32 -0.04 0.11 0.16 -0.21 0.27 0.07 1.A.1 Energy Industries - Gaseous Fuels CO
2 1,880.66 5,403.02 1.00 2.50 2.69 0.27 0.07 0.07 0.10 0.15 0.17 0.22 0.05
1.A.2 Manufacturing Industries & Construction - Liquid Fuels exc Pet Coke
CO2
2,013.71 1,533.54 10.00
2.50 10.31 0.29 0.09 -0.01 0.03 0.41 -0.03 0.41 0.17 1.A.2 Manufacturing Industries & Construction - Coal CO
2 871.24 377.76 2.00 5.00 5.39 0.04 0.00 -0.01 0.01 0.02 -0.05 0.05 0.00
1.A.2 Manufacturing Industries & Construction - Pet Coke CO2
184.67 191.50 5.00 5.00 7.07 0.03 0.00 0.00 0.00 0.03 0.00 0.03 0.00 1.A.2 Manufacturing Industries & Construction - Gaseous Fuels CO
2 873.02 2,042.55 2.50 2.50 3.54 0.13 0.02 0.02 0.04 0.14 0.05 0.15 0.02
1.A.2 Manufacturing Industries & Construction - Non-Renewable Waste
CO2
0.00 29.88 1.00 5.00 5.10 0.00 0.00 0.00 0.00 0.00 0.00 0.00 0.00 1.A.3 Transport - Oil CO
2 4,959.65 11,008.9
8 1.00 2.50 2.69 0.55 0.30 0.11 0.21 0.30 0.28 0.41 0.17
1.A.3.e Other Transport - Gaseous Fuels CO2
62.04 153.31 1.00 2.50 2.69 0.01 0.00 0.00 0.00 0.00 0.00 0.01 0.00 1.A.4.a Commercial/Institutional - Liquid Fuels CO
2 1,957.00 1,183.33 10.0
0 5.00 11.18 0.25 0.06 -0.02 0.02 0.32 -0.08 0.33 0.11
1.A.4.a Commercial/Institutional - Coal CO2
2.56 0.00 5.00 10.00 11.18 0.00 0.00 0.00 0.00 0.00 0.00 0.00 0.00 1.A.4.a Commercial/Institutional - Peat CO
2 135.73 0.00 10.0
0 20.00 22.36 0.00 0.00 0.00 0.00 0.00 -0.05 0.05 0.00
1.A.4.a Commercial/Institutional - Gaseous Fuels CO2
223.49 906.22 2.50 2.50 3.54 0.06 0.00 0.01 0.02 0.06 0.03 0.07 0.00 1.A.4.b Residential - Liquid Fuels CO
2 1,099.66 3,072.66 10.0
0 5.00 11.18 0.64 0.41 0.04 0.06 0.83 0.19 0.85 0.72
1.A.4.b Residential - Coal CO2
2,483.57 932.77 5.00 10.00 11.18 0.19 0.04 -0.03 0.02 0.13 -0.31 0.33 0.11 1.A.4.b Residential - Petcoke CO
2 75.68 33.81 5.00 5.00 7.07 0.00 0.00 0.00 0.00 0.00 0.00 0.01 0.00
1.A.4.b Residential - Peat CO2
3,123.37 1,033.63 10.00
20.00 22.36 0.43 0.18 -0.04 0.02 0.28 -0.82 0.87 0.75 1.A.4.b Residential - Gaseous Fuels CO
2 269.73 1,359.20 2.50 2.50 3.54 0.09 0.01 0.02 0.03 0.09 0.05 0.10 0.01
1.A.4.c Agriculture/Forestry/Fisheries - Liquid Fuels CO2
660.30 713.79 10.00
5.00 11.18 0.15 0.02 0.00 0.01 0.19 0.00 0.19 0.04 2.A.1 Cement Production CO
2 884.00 966.27 1.50 1.50 2.12 0.04 0.00 0.00 0.02 0.04 0.00 0.04 0.00
2.A.2 Lime Production CO2
214.08 199.06 5.00 5.00 7.07 0.03 0.00 0.00 0.00 0.03 0.00 0.03 0.00 2.A.3 Limestone Use CO
2 0.15 1.04 5.00 2.50 5.59 0.00 0.00 0.00 0.00 0.00 0.00 0.00 0.00
2.A.4 Soda Ash Production and Use CO2
0.10 0.07 5.00 2.50 5.59 0.00 0.00 0.00 0.00 0.00 0.00 0.00 0.00 2.A.7 Glass Production CO
2 13.33 0.00 5.00 5.00 7.07 0.00 0.00 0.00 0.00 0.00 0.00 0.00 0.00
2.A.7 Bricks & Ceramics CO2
5.07 0.83 5.00 5.00 7.07 0.00 0.00 0.00 0.00 0.00 0.00 0.00 0.00 2.B.1 Ammonia Production CO
2 990.23 0.00 1.00 5.00 5.10 0.00 0.00 -0.02 0.00 0.00 -0.10 0.10 0.01
3 Solvent and Other Product Use CO2
80.03 72.49 30.00
5.00 30.41 0.04 0.00 0.00 0.00 0.06 0.00 0.06 0.00 5.A LULUCF - Forest Land CO
2 -
3,269.70 -
4,252.94 51.0
0 114.0
0 124.8
9 -9.87 97.43 -0.02 -0.08 -5.83 -1.97 6.16 37.90
5.B.1 LULUCF - Cropland remaining Cropland CO2
20.00 16.95 22.57
69.15 72.74 0.02 0.00 0.00 0.00 0.01 0.00 0.01 0.00 5.B.2 LULUCF - Total Land converted to Cropland CO
2 0.00 329.34 18.6
3 69.15 71.61 0.44 0.19 0.01 0.01 0.16 0.43 0.46 0.21
5.C.1 LULUCF - Grassland Remaining Grassland CO2
602.37 542.95 12.18
90.00 90.82 0.92 0.84 0.00 0.01 0.18 -0.13 0.22 0.05 5.C.2 LULUCF - Grassland in Transition CO
2 -108.80 -322.79 31.5
2 80.27 86.23 -0.52 0.27 0.00 -0.01 -0.27 -0.32 0.42 0.18
5.D.1 LULUCF - Wetlands remaining Wetlands CO2
47.10 33.94 12.47
51.53 53.02 0.03 0.00 0.00 0.00 0.01 -0.01 0.02 0.00 5.D.2 LULUCF - Total Land converted to Wetland CO
2 0.00 -0.75 2.50 50.00 50.06 0.00 0.00 0.00 0.00 0.00 0.00 0.00 0.00
5.E.1 LULUCF - Settlement remaing Settlement CO2
0.00 0.00 39.06
75.00 84.56 0.00 0.00 0.00 0.00 0.00 0.00 0.00 0.00 5.E.2 LULUCF - Lands converted to Settlement CO
2 10.29 9.56 39.0
6 75.00 84.56 0.02 0.00 0.00 0.00 0.01 0.00 0.01 0.00
5.F.1 LULUCF - Other Land remaining Other Land CO2
0.00 0.00 31.49
90.00 95.35 0.00 0.00 0.00 0.00 0.00 0.00 0.00 0.00 5.F.2 LULUCF - Lands converted to Other Land CO
2 -1.06 -138.19 53.9
1 71.56 89.60 -0.23 0.05 0.00 0.00 -0.20 -0.19 0.27 0.07
6.C Waste - Waste Incineration CO2
82.97 53.49 10.00
5.00 11.18 0.01 0.00 0.00 0.00 0.01 0.00 0.01 0.00 Total CO2 29,724.2
1 33,882.5
4 0.63 10.02 100.3
1 6.38 40.66
233

IPCC Source Category
Gas
Emissio
ns in
19
90
Emissio
ns in
201
1
Activity D
ata (AD
) U
nce
rtainty
Emissio
n Facto
r (EF)
Un
certain
ty
Co
mb
ine
d
Un
certain
ty
Co
mb
ine
d U
nce
rtainty
as % o
f Emissio
ns
in 20
11
Co
mb
ine
d Em
ission
s
Un
certain
ty Squ
ared
Type
A Sen
sitivity
Type
B Sen
sitivity
Un
certain
ty in Tren
d
in To
tal Emissio
ns
du
e to
AD
Un
certain
ty in Tren
d
in To
tal Emissio
ns
du
e to
EF
Co
mb
ine
d U
nce
rtainty
in Tren
d
in To
tal Emissio
ns
Co
mb
ine
d Tren
d
Un
certain
ty Squ
ared
Gg CO2eq Gg CO2eq
% % % % % % % % %
1.A.1 Energy Industries - Liquid Fuels CH4 0.33 0.12 1.00 50.00 50.01 0.00 0.00 0.00 0.00 0.00 0.00 0.00 0.00 1.A.1 Energy Industries - Solid Fuels CH4 2.36 1.93 1.00 50.00 50.01 0.00 0.00 0.00 0.00 0.00 0.00 0.00 0.00 1.A.1 Energy Industries - Gaseous Fuels CH4 2.88 2.36 1.00 50.00 50.01 0.00 0.00 0.00 0.00 0.00 0.00 0.00 0.00 1.A.2 Manufacturing Industries & Construction - Liquid Fuels exc Pet
Coke CH4 1.60 1.17 10.0
0 50.00 50.99 0.00 0.00 0.00 0.00 0.00 0.00 0.00 0.0
0 1.A.2 Manufacturing Industries & Construction - Coal CH4 1.93 0.84 2.00 50.00 50.04 0.00 0.00 0.00 0.00 0.00 0.00 0.00 0.00 1.A.2 Manufacturing Industries & Construction - Pet Coke CH4 0.12 0.13 5.00 50.00 50.25 0.00 0.00 0.00 0.00 0.00 0.00 0.00 0.00 1.A.2 Manufacturing Industries & Construction - Gaseous Fuels CH4 0.33 0.75 2.50 50.00 50.06 0.00 0.00 0.00 0.00 0.00 0.00 0.00 0.00 1.A.2 Manufacturing Industries & Construction - Non-Renewable
Waste CH4 0.00 0.04 1.00 50.00 50.01 0.00 0.00 0.00 0.00 0.00 0.00 0.00 0.0
0 1.A.3 Transport - Oil CH4 37.16 17.62 1.00 50.00 50.01 0.02 0.00 0.00 0.00 0.00 -0.02 0.02 0.00 1.A.3.
e Other Transport - Gaseous Fuels CH4 0.12 0.28 1.00 50.00 50.01 0.00 0.00 0.00 0.00 0.00 0.00 0.00 0.0
0 1.A.4.a
Commercial/Institutional - Liquid Fuels CH4 5.53 3.36 10.00
50.00 50.99 0.00 0.00 0.00 0.00 0.00 0.00 0.00 0.00 1.A.4.
a Commercial/Institutional - Coal CH4 0.01 0.00 5.00 50.00 50.25 0.00 0.00 0.00 0.00 0.00 0.00 0.00 0.0
0 1.A.4.a
Commercial/Institutional - Peat CH4 0.28 0.00 10.00
50.00 50.99 0.00 0.00 0.00 0.00 0.00 0.00 0.00 0.00 1.A.4.
a Commercial/Institutional - Gaseous Fuels CH4 0.43 1.67 2.50 50.00 50.06 0.00 0.00 0.00 0.00 0.00 0.00 0.00 0.0
0 1.A.4.b
Residential - Liquid Fuels CH4 2.95 8.87 10.00
50.00 50.99 0.01 0.00 0.00 0.00 0.00 0.01 0.01 0.00 1.A.4.
b Residential - Coal CH4 165.07 61.24 5.00 50.00 50.25 0.06 0.00 0.00 0.00 0.01 -0.10 0.10 0.0
1 1.A.4.b
Residential - Petcoke CH4 0.17 0.08 5.00 50.00 50.25 0.00 0.00 0.00 0.00 0.00 0.00 0.00 0.00 1.A.4.
b Residential - Peat CH4 191.22 63.64 10.0
0 50.00 50.99 0.06 0.00 0.00 0.00 0.02 -0.13 0.13 0.0
2 1.A.4.b
Residential - Gaseous Fuels CH4 0.52 2.50 2.50 50.00 50.06 0.00 0.00 0.00 0.00 0.00 0.00 0.00 0.00 1.A.4.
c Agriculture/Forestry/Fisheries - Liquid Fuels CH4 0.90 1.01 10.0
0 50.00 50.99 0.00 0.00 0.00 0.00 0.00 0.00 0.00 0.0
0 1.A Biomass CH4 13.43 14.81 10.00
50.00 50.99 0.01 0.00 0.00 0.00 0.00 0.00 0.00 0.00 1.B Fugitive Emissions CH4 131.26 27.79 2.50 10.00 10.31 0.01 0.00 0.00 0.00 0.00 -0.02 0.02 0.00 4.A.1 Enteric Fermentation - Dairy Cattle CH4 2,854.99 2,572.06 1.00 15.00 15.03 0.72 0.52 -0.01 0.05 0.07 -0.10 0.12 0.01 4.A.1 Enteric Fermentation - Non-dairy Cattle CH4 5,630.17 5,221.02 1.00 15.00 15.03 1.46 2.13 -0.01 0.10 0.14 -0.15 0.21 0.04 4.A Enteric Fermentation - Other Livestock CH4 1,088.95 645.84 1.00 30.00 30.02 0.36 0.13 -0.01 0.01 0.02 -0.27 0.27 0.07 4.B.1 Manure Management - Dairy Cattle CH4 608.23 474.76 1.00 15.00 15.03 0.13 0.02 0.00 0.01 0.01 -0.04 0.04 0.00 4.B.1 Manure Management - Non-dairy Cattle CH4 1,279.75 1,106.56 1.00 15.00 15.03 0.31 0.10 0.00 0.02 0.03 -0.06 0.07 0.00 4.B Manure Management - Other Livestock CH4 465.65 551.19 1.00 30.00 30.02 0.31 0.09 0.00 0.01 0.01 0.04 0.05 0.00 5.A LULUCF - Forest Land CH4 9.29 7.58 30.0
0 100.0
0 104.4
0 0.01 0.00 0.00 0.00 0.01 0.00 0.01 0.0
0 6.A Waste - Solid Waste Disposal on land CH4 1,173.05 830.85 34.64
34.64 48.99 0.76 0.57 -0.01 0.02 0.77 -0.24 0.81 0.66 6.B Waste - Waste Water Handling CH4 14.73 16.32 10.0
0 30.00 31.62 0.01 0.00 0.00 0.00 0.00 0.00 0.00 0.0
0 6.C Waste - Waste Incineration CH4 0.01 0.00 10.00
30.00 31.62 0.00 0.00 0.00 0.00 0.00 0.00 0.00 0.00 Total CH4 13,683.42 11,636.4
0 1.89 3.56 0.91 0.8
2
234

IPCC Source Category
Gas
Emissio
ns in
19
90
Emissio
ns in
20
11
Activity D
ata (AD
)
Un
certainty
Emissio
n Facto
r (EF) U
ncertain
ty
Co
mb
ine
d U
nce
rtainty
Co
mb
ine
d U
nce
rtainty
as % o
f Emissio
ns in
20
11
Co
mb
ine
d Em
ission
s U
ncertain
ty Squ
ared
Type
A Sen
sitivity
Type
B Sen
sitivity
Un
certainty in
Tren
d in
To
tal Emissio
ns d
ue
to
AD
Un
certainty in
Tren
d in
To
tal Emissio
ns d
ue
to
EF
Co
mb
ine
d U
nce
rtainty
in Tre
nd
in To
tal
Emissio
ns
Co
mb
ine
d Tre
nd
Un
certainty Sq
uared
Gg CO2eq Gg CO2eq % % % % % % % % %
1.A.1 Energy Industries - Liquid Fuels N2O 1.52 0.33 1.00 50.00 50.01 0.00 0.00 0.00 0.00 0.00 0.00 0.00 0.00
1.A.1 Energy Industries - Solid Fuels N2O 62.22 49.53 1.00 50.00 50.01 0.05 0.00 0.00 0.00 0.00 -0.01 0.01 0.00
1.A.1 Energy Industries - Gaseous Fuels N2O 10.62 84.08 1.00 50.00 50.01 0.08 0.01 0.00 0.00 0.00 0.07 0.07 0.00
1.A.2 Manufacturing Industries & Construction - Liquid Fuels exc Pet Coke N2O 4.65 3.32 10.00 50.00 50.99 0.00 0.00 0.00 0.00 0.00 0.00 0.00 0.00
1.A.2 Manufacturing Industries & Construction - Coal N2O 4.28 1.86 2.00 50.00 50.04 0.00 0.00 0.00 0.00 0.00 0.00 0.00 0.00
1.A.2 Manufacturing Industries & Construction - Pet Coke N2O 0.37 0.38 5.00 50.00 50.25 0.00 0.00 0.00 0.00 0.00 0.00 0.00 0.00
1.A.2 Manufacturing Industries & Construction - Gaseous Fuels N2O 0.00 0.11 1.00 50.00 50.01 0.00 0.00 0.00 0.00 0.00 0.00 0.00 0.00
1.A.2 Manufacturing Industries & Construction - Non-Renewable Waste N2O 0.49 1.11 2.50 50.00 50.06 0.00 0.00 0.00 0.00 0.00 0.00 0.00 0.00
1.A.3 Transport - Oil N2O 61.77 108.58 1.00 25.00 25.02 0.05 0.00 0.00 0.00 0.00 0.02 0.02 0.00
1.A.3.e Other Transport - Gaseous Fuels N2O 0.70 1.67 1.00 50.00 50.01 0.00 0.00 0.00 0.00 0.00 0.00 0.00 0.00
1.A.4.a Commercial/Institutional - Liquid Fuels N2O 4.87 2.96 10.00 50.00 50.99 0.00 0.00 0.00 0.00 0.00 0.00 0.00 0.00
1.A.4.a Commercial/Institutional - Coal N2O 0.01 0.00 5.00 50.00 50.25 0.00 0.00 0.00 0.00 0.00 0.00 0.00 0.00
1.A.4.a Commercial/Institutional - Peat N2O 0.58 0.00 10.00 50.00 50.99 0.00 0.00 0.00 0.00 0.00 0.00 0.00 0.00
1.A.4.a Commercial/Institutional - Gaseous Fuels N2O 0.13 0.49 2.50 50.00 50.06 0.00 0.00 0.00 0.00 0.00 0.00 0.00 0.00
1.A.4.b Residential - Liquid Fuels N2O 2.43 7.77 10.00 50.00 50.99 0.01 0.00 0.00 0.00 0.00 0.01 0.01 0.00
1.A.4.b Residential - Coal N2O 12.18 4.52 5.00 50.00 50.25 0.00 0.00 0.00 0.00 0.00 -0.01 0.01 0.00
1.A.4.b Residential - Pet coke N2O 0.15 0.07 5.00 50.00 50.25 0.00 0.00 0.00 0.00 0.00 0.00 0.00 0.00
1.A.4.b Residential - Peat N2O 13.17 4.38 10.00 50.00 50.99 0.00 0.00 0.00 0.00 0.00 -0.01 0.01 0.00
1.A.4.b Residential - Gaseous Fuels N2O 0.15 0.74 2.50 50.00 50.06 0.00 0.00 0.00 0.00 0.00 0.00 0.00 0.00
1.A.4.c Agriculture/Forestry/Fisheries - Liquid Fuels N2O 72.05 71.60 10.00 50.00 50.99 0.07 0.00 0.00 0.00 0.02 0.00 0.02 0.00
1.A Biomass N2O 5.48 13.94 10.00 50.00 50.99 0.01 0.00 0.00 0.00 0.00 0.01 0.01 0.00
2.B Nitric Acid N2O 1,035.40 0.00 1.00 10.00 10.05 0.00 0.00 -0.02 0.00 0.00 -0.20 0.20 0.04
4.B.12 Manure Management - Liquid Systems N2O 63.87 62.84 11.22 100.00 100.63 0.12 0.01 0.00 0.00 0.02 0.00 0.02 0.00
4.B.13 Manure Management - Solid Storage N2O 371.24 374.69 11.22 100.00 100.63 0.70 0.49 0.00 0.01 0.11 -0.01 0.11 0.01
4.D.1 Agricultural Soils - Direct Soil Emissions N2O 3,021.86 2,762.22 11.22 100.00 100.63 5.17 26.68 -0.01 0.05 0.83 -0.63 1.04 1.09
4.D.2 Agricultural Soils - Pasture, Range & Paddock N2O 2,868.35 2,611.47 11.22 100.00 100.63 4.88 23.85 -0.01 0.05 0.79 -0.62 1.00 1.00
4.D.3 Agricultural Soils - Indirect Emissions N2O 1,381.01 1,310.55 11.22 50.00 51.24 1.25 1.56 0.00 0.02 0.40 -0.10 0.41 0.17
5.A LULUCF - Forest Land N2O 24.78 38.80 30.00 100.00 104.40 0.08 0.01 0.00 0.00 0.03 0.03 0.04 0.00
5.B.2 LULUCF - Land converted to Cropland N2O 0.00 31.37 30.00 100.00 104.40 0.06 0.00 0.00 0.00 0.03 0.06 0.06 0.00
5.C.1 LULUCF - Grassland Remaining Grassland N2O 0.00 0.00 91.02 100.00 135.22 0.00 0.00 0.00 0.00 0.00 0.00 0.00 0.00
5.C.2 LULUCF - Land converted to Grassland N2O 0.00 0.00 91.02 100.00 135.22 0.00 0.00 0.00 0.00 0.00 0.00 0.00 0.00
5.D.2 LULUCF - Land Converted to Wetlands N2O 3.59 2.57 92.16 100.00 135.99 0.01 0.00 0.00 0.00 0.01 0.00 0.01 0.00
6.B Waste - Waste Water Handling N2O 111.71 141.35 10.00 10.00 14.14 0.04 0.00 0.00 0.00 0.04 0.01 0.04 0.00
6.C Waste - Waste Incineration N2O 0.86 0.57 10.00 10.00 14.14 0.00 0.00 0.00 0.00 0.00 0.00 0.00 0.00
Total N2O 9,140.50 7,693.86 7.25 52.62 1.52 2.32
235

IPCC Source Category
Gas
Emissio
ns in
19
90
Emissio
ns in
20
11
Activity D
ata (AD
) U
ncertain
ty
Emissio
n Facto
r (EF)
Un
certainty
Co
mb
ine
d U
nce
rtainty
Co
mb
ine
d U
nce
rtainty
as % o
f Emissio
ns in
2
01
1
Co
mb
ine
d Em
ission
s U
ncertain
ty Squ
ared
Type
A Sen
sitivity
Type
B Sen
sitivity
Un
certainty in
Tren
d in
Total Em
ission
s du
e to
A
D
Un
certainty in
Tren
d in
To
tal Emissio
ns d
ue
to
EF
Co
mb
ine
d U
nce
rtainty
in Tre
nd
in To
tal Em
ission
s
Co
mb
ine
d Tre
nd
Un
certainty Sq
uared
Gg CO2eq Gg CO2eq % % % % % % % % %
2.F Consumption of Halocarbons & SF6 HFC 1.31 538.61 20.00 10.00 22.36 0.21 0.04 0.01 0.01 0.28 0.10 0.29 0.09
2.F Consumption of Halocarbons & SF6 PFC 0.09 13.20 10.00 2.50 10.31 0.00 0.00 0.00 0.00 0.00 0.00 0.00 0.00
2.F Consumption of Halocarbons & SF6 SF6 35.51 48.29 15.00 5.00 15.81 0.01 0.00 0.00 0.00 0.02 0.00 0.02 0.00
Total HFC, PFC & SF6 36.91 600.10 0.21 0.04 0.29 0.09
Total all gases 52,585.05 53,812.90 156.53 43.89
Overall Uncertainty in Emissions 12.51 Trend Uncertainty 6.62
236

ANNEX B: Summary of reporting of supplementary information under Article 7, Paragraph 2 of the Kyoto Protocol (a) The name and contact information for the national entity and its designated representative with overall responsibility for the national inventory of the Party The establishment of Ireland’s national inventory system was completed by Government Decision in early 2007, building on the framework that had been applied for many years. The EPA’s OCLR was designated the inventory agency and the EPA was also designated as the single national entity with overall responsibility for the annual greenhouse gas inventory. Within the OCLR, the CRRP compiles the national greenhouse gas emission inventories for submission under the Framework Convention on Climate Change and Decision 280/2004/EC (EP and CEU, 2004a), the latter being the basis for EU Member States’ reporting under the Convention and the Kyoto Protocol. (b) The roles and responsibilities of various agencies and entities in relation to the inventory development process, as well as the institutional, legal and procedural arrangements made to prepare the inventory Following establishment of the national system, institutional arrangements directed towards national inventory reporting that involve the EPA, DECLG and other stakeholders were re-organised, extended and legally consolidated across all participating institutions to strengthen inventory capacity within the EPA. This ensured that more formal and comprehensive mechanisms of data collection and processing were established and maintained for long term implementation. In particular, the system puts in place formal procedures for the planning, preparation and management of the national atmospheric inventory and identifies the roles and responsibilities of all the organisations involved in its compilation. This was achieved through extensive discussions with all key data providers leading to the adoption of MOU between the key data providers and the inventory agency. These MOUs stipulate the scope, timing and quality of the inputs necessary for inventory compilation in accordance with the guidelines for national systems. Secondary MOUs are, in turn, used by some key data providers to formalise the receipt of data from their own particular sources. Table Annex B.1 lists the key data providers and indicates the range of data covered by MOU in the national system.
237

Table Annex B.1 Key Data Providers and Information covered by MOU
Key Data Provider Data Supplied Deadline Sector in which data are used
Sustainable Energy Authority of Ireland
National Energy Balance; Detailed national energy consumption disaggregated by economic sector and fuel
30 September
Energy, Waste
Department of Agriculture, Food and Marine Department of Agriculture, Food and Marine (Forest Sector Development Division)
Table 1.1-1.4 Statistical data for cattle compiled under the Animal Identification and Movement (AIM) scheme Fertiliser and lime statistics Poultry statistics Sheep statistics Table 2.1 GHG emission/removal estimates from all pools for forest lands under the Convention Statistical data on Afforestation, Reforestation, Deforestation and harvesting for forest land lands under Article 3.3 of KP GHG emission/removal estimates from all biomass pools for KP Article 3.3
30 September
Agriculture
30 September
LULUCF and Article 3.3 of the Kyoto Protocol
Central Statistics Office Annual population, livestock populations, crop statistics, housing survey data
30 September
Agriculture, Industrial Processes, Waste
Bord Gais Analysis results for indigenous and imported natural gas
30 September
Energy
Marine Institute Annual Report on Discharges, Spills and Emissions from Offshore Gas Production Installations
30 October Energy
Emissions Trading Unit Verified CO2 estimates and related fuel and production data for installations covered by the EU ETS
1
30 April Energy, Industrial Processes
*Department of Communications, Energy and Natural Resources
National Oil Balance (as a component of the energy balance)
30 September
Energy
*Road Safety Authority Road transport statistics from the National Car Test (NCT)
30 April Energy
**Forest Service
(i) GIS data base on premiums and grants afforestation areas (iFORIS) with associated attributes (II) NFI database
30 September 2007, 2012
LULUCF and Article 3.3 activities
**Coillte
GIS data base of intersected of NFI permanent sample plot points (Coillte-NFI plots) with sub-compartment and management unit data.
30 September
LULUCF and Article 3.3 activities
1ETS – Emissions Trading Scheme
*These bodies have MOUs with SEAI rather than with OCLR **These bodies have MOUs with DAFM rather than with OCLR
238
(c) A description of the process for collecting activity data, for selecting emission factors and methods, and for the development of emission estimates An emissions inventory database normally contains information on measured emission quantities, activity statistics (populations, fuel consumption, vehicle/kilometres of travel, industrial production and land areas), emission factors and the associated emission estimates for a specified list of source categories. In practice, very few measured data are available for greenhouse gases and, consequently, the emissions from most activities are estimated by applying emission factors for each source/gas combination to appropriate activity data for the activity concerned. Virtually all emissions and removals estimates may be ultimately derived on the basis of such simple product of activity data and emission factor. However, a certain amount of data analysis and preparatory calculations are generally needed in order to make available suitable combinations of activity data and emission factors at the level of disaggregation that gives the best estimates of emissions and removals. In the case of some source/gas combinations, such as methane emissions from solid waste landfills and CO2 sequestration by forest biomass, it may be necessary to apply sophisticated models to generate the activity data, the emission factors or the emissions. The methods recommended by the Revised 1996 IPCC Guidelines (IPCC, 1997), IPCC Good Practice Guidance (IPCC, 2000) and IPCC Good Practice Guidance on LULUCF (IPCC, 2003) use a tier system to take account of these issues and other factors, such as data availability, technical expertise, inventory capacity and other circumstances, which may vary considerably across countries. Preparation for the annual GHG inventory takes place in an Excel spread sheet system where activity data stored in Source Data files are linked to calculation sheets in Data Processing files that produce the emissions estimates at the lowest possible level of disaggregation. These are combined and allocated according to IPCC requirements for direct transmission into the CRF Reporter utility for the generation of the CRF tables. These results are stored in Outputs files while supporting QA/QC sheets, extracted from Data Processing files, are held in summary QA/QC record files. The Data Processing files hold the emission factors and they are structured on a time-series basis, which facilitates efficient recalculation and output to the CRF Reporter. This procedure applies to all IPCC sectors of the GHG inventory for which the calculations are made by the inventory team and the full set of files applicable to each year under the four headings is stored using appropriate version control on the OCLR servers. Table Annex B.1 lists the principal data suppliers and the information that they are required to deliver to the inventory agency annually under MOU for the preparation of the GHG inventory. In some cases, e.g. the national energy balance, the input file received from the data supplier may be linked directly to the Data Processing files, but generally some degree of preparation and pre-processing is needed before the activity data are used in inventory preparation. In collating and compiling the activity data, the inventory team collects data from the various data streams e.g. Annual Environmental Report and submissions under the European Pollutant Release and Transfer Register. A national model called CARBWARE is used to derive the estimates of emissions and removals for forest lands, which are incorporated in the overall scheme for LULUCF reporting under the Convention following the procedure outlined above. A variety of databases related to land cover, soil type and forest areas are applied for the LULUCF inventory under the Convention. These include the National Forest Inventory (NFI), the Forest Inventory and Planning System (FIPS), the Land Parcels Information System (LPIS), CORINE Land Cover Maps and the General Soil Map of Ireland. These are supported by statistical information from Bord na Móna and the National Roads Authority. The static national model, CARBWARE has been extensively developed to a dynamic version to provide the necessary estimates for Article 3.3 activities under the Kyoto Protocol. This work was
239

undertaken by FERs Ltd, the consultants working to DAFM, who supply the Article 3.3 results to OCLR under an agreed MOU (Table Annex B.1). Secondary MOUs between DAFM and its data suppliers formalise annual data collection for this area of the inventory. The model contains a multitude of component modules needed to produce estimates of the carbon stock changes for the various carbon pools under afforestation and deforestation areas and for reporting any relevant emissions of CH4 and N2O. The model processes detailed spatially explicit data on forest species and soil type obtained from the NFI, FIPS, soils maps, supported by the Grants and Premiums Administration System (GPAS), and felling license records. The model uses complex pre-processing functions, growth models, allometric equations and pool allocation and transfers to produce the results required for Article 3.3 activities. The annual ETS compilation serves as an important source of activity-specific and company-specific data on CO2 emissions, fuel use and emission factors for major combustion sources and industrial processes. The emissions trading scheme covers approximately 100 installations in Ireland with combined CO2 emissions of 15,770 Gg in 2011, accounting for 27.4 per cent of total greenhouse gas emissions (57,512.48 Gg CO2 equivalent). Guidance provided under the associated Decision 2004/156/EC (EP and CEU, 2004) on methodologies for estimating and reporting greenhouse gas emissions to support Directive 2003/87/EC, together with monitoring and verification mechanisms administered by the ETU, consolidates and improves the information in relation to a substantial proportion of CO2 emissions for the purposes of reporting national GHG inventories under the Convention and the Protocol. All of the data used in the compilation of the national GHG inventory submission is stored on an EPA data server located in the Monaghan Regional Inspectorate of the EPA where key staff involved in inventory compilation is located. All background data for recent years are available in electronic format, with a transparent file structure. All data (emission estimates, AD, inventory submissions, references, QA/QC) on the data server are backed up daily. (d) A description of the process and the results of key source identification and, where relevant, archiving of test data The IPCC good practice guidance defines a key category as one that is prioritised within the national inventory system because its emission estimate has a significant influence on the Party’s total inventory in terms of the absolute level of emissions, the trend in emissions or both. Information about key categories is considered to be crucial to the choice of methodology for individual sources and to the management and reduction of overall inventory uncertainty. The identification of such categories is recommended in order that inventory agencies can give them priority in the preparation of annual inventories, especially in cases where resources may be limited. Information on key categories is clearly also vital for the development of policies and measures for emissions reduction. The IPCC good practice guidance provides several methods for undertaking the analysis of key categories that can be applied at any appropriate level of source aggregation, depending on the information available. The simplest Tier 1 approach is again used for 2011 to further highlight which sources of emissions are the most important in Ireland. The IPCC good practice guidance encourages inventory agencies to perform a Tier 2 Key Category Analysis, and this has also been suggested in previous annual inventory review reports. In response to this, initial work on the Tier 2 Key Category Analysis was carried out, which highlighted differences between the level of disaggregation found in the Tier 1 Key Category Analysis compared to the Tier 1 Uncertainty Assessment. Some sub-categories are reported at a more detailed level in the Key Category Analysis compared to the Uncertainty Analysis (such as transport). Due to resource constraints, it was not possible to complete this work so the finalisation of the Tier 2 Key Category
240

Analysis and the disaggregation of the Tier 1 Uncertainty Analysis are planned improvements for the 2014 submission.
(e) A description of the process for the recalculation of previously submitted inventory data On-going demands for more complete and more accurate estimates of greenhouse gas emissions means that the methodologies being used are subject to regular revision and refinement as inventory capacity is increased and better data become available. The general improvement in inventories over time may therefore introduce inconsistencies between the emissions estimates for recent years and those for years much earlier in the time-series. Recalculated estimates are often needed to eliminate these inconsistencies and to ensure that the inventories for all years in a time-series are directly comparable with respect to the sources and gases covered and that the methods, activity data and emission factors are applied in a transparent and consistent manner. In this way, the results can be used with greater confidence in identifying trends and in monitoring progress towards the commitments that have been defined with reference to emissions in the base year. The UNFCCC reporting guidelines provide for the reporting of recalculations as part of the annual submissions from Annex 1 Parties. Justification for the recalculations are provided, as well as explanations of the changes that have been made and the numerical values of the original and revised estimates must be compared to show the impact of the changes.
(f) A description of the quality assurance and quality control plan, its implementation and the quality objectives established, and information on internal and external evaluation and review processes and their results in accordance with the guidelines for national systems In early 2005, the inventory agency in Ireland commissioned a project with UK consultants NETCEN to establish formal QA/QC procedures that would meet the needs of the UNFCCC reporting requirements. The project developed a QA/QC system including a documented QA/QC plan and procedures along with a QA/QC manual. The manual provides a general overview of the QA/QC system. In addition, the manual provides guidance and templates for appropriate quality checking, documentation and traceability. The selection of source data, calculation methodologies, peer and expert review of inventory data and the annual requirements for continuous improvement for the inventory are also outlined in the manual. The QA/QC plan identifies the specific data quality objectives related to the principles of transparency, consistency, completeness, comparability and accuracy required for Ireland's national inventory and provides specific guidance and documentation forms and templates for the practical implementation of QA/QC procedures. The QA/QC procedures cover such elements as data selection and acquisition, data processing and reporting. The inventory agency initiated a new approach to QA/QC in the 2006 reporting cycle. Its application was completed and consolidated in delivering the submissions up to 2011. This involved the allocation of responsibilities linked to the national system mentioned in the section above and the use of a template spreadsheet system to record the establishment and maintenance of general inventory checking and management activities covering the overall compilation process, as well as the undertaking of specific annual activities and any necessary periodic activities in response to specific events or outcomes in inventory reporting and review. The system facilitates record keeping related to the chain of activities from data capture, through emissions calculations and checking, to archiving and the identification of improvements. The system has been carried forward for use in completing the 2013 submission.
241

Ireland’s calculation spreadsheets in all sectors are structured and organised to facilitate the QA/QC process and more efficient time-series analysis and also to ensure ease of transfer of the outputs to the CRF Reporter Tool. This facilitates rapid year-on-year extension of the time-series, rapid inter-annual comparisons and efficient updating and recalculation, where appropriate, in the annual reporting cycle. Internal aggregation to various levels corresponding to the CRF tables provides immediate and complete checks on the results. The inventory team contracted an external service provider, Aether, to assist in aspects of inventory compilation in 2012. The transparency, robustness and accessibility of the inventory data within the electronic filing structures were assessed by Aether, who concluded that the system is very well organised.
(g) A description of the procedures for the official consideration and approval of the inventory The approval of the completed annual inventory involves sign-off by the QA/QC manager and the inventory manager before it is transmitted to the Board of the EPA via the Programme Manager of the Climate Resource and Research Programme in OCLR. Any issues arising from the Board’s examination of the estimates are communicated to the inventory experts for resolution before final adoption of the inventory. The results for the inventory year are normally released at national level in autumn of the following year. This is in advance of their official submission to the European Commission in accordance with Decision 280/2004/EC in January of the reporting year and subsequently to the UNFCCC secretariat.
242


I. Introduction Ireland is pleased to submit its first Biennial Report to the UNFCCC. II. Information on greenhouse gas emissions and trends Information on GHG emissions and trends is provided in Chapter 3 of the sixth national communication and the relevant CTF tables to this Biennial Report. The CTF tables are enclosed at the end of this report. Information on Ireland’s national inventory arrangements is described in section 3.2 Chapter 3 of the sixth National Communication. The changes to these national inventory arrangements since the last national communication are outlined below. These changes are also fully addressed in chapter 13 of Ireland’s National Inventory Reports, 2010, 2011 and 2013126. There have been no significant changes to the national inventory arrangements since the last National Communication. There were some minor changes to the arrangements for reporting of information between the institutions involved in the national system. These changes are outlined below:
During the 2010 reporting cycle the provisions for reporting on afforestation and deforestation areas related to LULUCF under the Convention and Article 3.3 of the Kyoto Protocol were strengthened to some degree by the establishment of secondary MOU to formalise data collection by CoFoRD, the Council for Forest Research and Development, which is responsible for these parts of the inventory submission. The MOU were put into effect between CoFoRD and the Forest Service and between CoFoRD and Coillte. Signed copies of the MOUs are held on file along with other MOU underpinning the national system at the EPA offices in Dublin and Monaghan.
In 2010, the provider of national energy statistics, Sustainable Energy Ireland, was renamed Sustainable Energy Authority of Ireland.
The two current primary MOU between the inventory agency and DAFM have been revised and drafted into one new MOU in 2012 to include the provision of key statistics for agriculture, forest areas under the Convention and Kyoto Protocol Article 3.3 activities. This new MOU was signed by the EPA on the 25th April 2012 and by the DAFM on the 10th of May 2012.
The current primary MOU between the inventory agency and the CSO was revised in 2012 and signed by both organisations on the 13th February 2013. This revised MOU sets out a framework for cooperation and assistance in areas of environmental data governance facilitating the free and timely exchange of data between both organisations.
Under the National Atmospheric Inventory System (NAIS), the inventory agency shall review the operation of the system and maintain and update existing MOU as appropriate. The revised MOU described above are in accordance with the continuing review and maintenance of the NAIS. III. Quantified economy-wide emission reduction target Information on Ireland’s quantified economy-wide emission reduction target has been communicated to the secretariat as part of the information on the joint target under the Convention for the EU and its MS, which is an independent quantified economy-wide emission reduction target of 20% by 2020 compared with 1990 levels. As this 20% reduction target will be fulfilled jointly by
126
Ireland National Inventory Report 2010, 2011 and 2013
244

the EU and its MS, no individual target for Ireland is included. This is documented in the UNFCCC document (FCCC/SB/2011/INF.1/Rev.1). In its submission to the UNFCCC in March 2012 (FCCC/AWGLCA/2012/MISC.1), the EU provided additional information for the joint target as part of the process of clarifying its quantified economy-wide emission reduction targets. The use of carbon credits from international market-based mechanisms is explained in this submission. With regard to the role of LULUCF, the EU pledge does not include emissions/removals from LULUCF. As a Member State of the EU, Ireland will take on a quantified economy-wide emission reduction target jointly with all other MS. The EU’s commitment to meeting the 20% target is underlined by the fact that it is already enshrined in EU legislation. In 2008 the European Parliament and the European Council agreed on the EU Climate and Energy Package, which for the first time provided an integrated and ambitious package of policies and measures to tackle climate change. The Climate and Energy Package was formally adopted in 2009. It includes the 20-20-20 targets, which set the following key objectives:
to reduce GHG emissions by at least 20% compared to 1990 by 2020;
to achieve 20% of energy from renewable sources by 2020; and
a commitment to save 20% of total primary energy consumption by 2020 compared to a business as usual baseline.
In order to meet these key objectives, the Climate and Energy Package comprises four pieces of complementary legislation:
a Directive revising the EU ETS, which covers some 40% of EU greenhouse gas emissions;
an "effort-sharing" Decision setting binding national targets for emissions from sectors not covered by the EU ETS;
a Directive setting binding national targets for increasing the share of renewable energy sources in the energy mix.
a Directive creating a legal framework for the safe and environmentally sound use of carbon capture and storage technologies.
IV. Progress in achievement of quantified economy-wide emission reduction targets and relevant information Ireland’s policy response to climate change mitigation is broad and cuts across many sectors of the economy and society. The European Union and its 2008 Climate and Energy Package is central in this regard by way of providing a legislative backdrop for actions across a range of sectors but in particular as regards Energy Efficiency and Renewables policy development. Improvements in building standards for new buildings, alongside schemes to incentivise the retrofitting of existing buildings are particularly relevant in the area of energy efficiency. In the renewables area, the EU has set appropriate national overall targets for 2020 alongside a specific EU wide target for renewables in transport. This leaves scope for each Member State to design its own policy response. In Ireland a guaranteed price for renewable electricity has greatly increased the penetration of clean technologies in this sector. Whilst these tools have objectives focussed on energy supply and demand, the European Union Emissions Trading Scheme is a quantity based tool particularly focussed on emissions reductions in power generation and energy intensity industry. There are over 100 Irish installations covered by the scheme, collectively responsible for about 28% of Irish emissions, who must incorporate the emissions constraint into all their business decisions.
245

European Union Agriculture policy also plays an important role in ensuring that food production and animal management practices take place in a way that is respectful to their potential impact on the environment. A large range of initiatives are in place on the ground which thereby limit the potential growth of emissions in this area. Other European legislation in areas such as Waste and F-gases is also particularly relevant. Some policy initiatives also take place outside these legal frameworks and the implementation of the carbon tax in 2009 and the re-orientation of taxation of private motor cars are particularly relevant in this regard. Nonetheless Ireland still needs to identify further policies and measures in order to ensure compliance with its commitments in the second commitment period of the Kyoto Protocol and work continues to identify the most cost efficient additional measures in this regard. Please refer to Chapter 4 of the sixth National Communication for further information. Please also refer to Chapters 4, 5 and 7 for material regarding the use of units from market-based mechanisms, particularly sections 4.4, 5.10 and 7.6. In anticipation of planned primary legislation, a National Low-Carbon Roadmap to 2050 is now being developed. Departments with responsibility for the key sectors in the national transition agenda are currently preparing the sectoral elements for incorporation into the national roadmap. The key sectors are electricity generation, the built environment, transport and agriculture. To ensure that the road-mapping process is inclusive, informed and transparent, the public has already been invited, by the Departments concerned, to input to the sectoral work on electricity generation, agriculture and transport. A public consultation paper on the built environment, which is being developed jointly by DECLG and DCENR is at an advanced stage and will be issued for consultation shortly. Feedback through these sectoral consultations will input into the key sectoral contributions to the first draft National Low-Carbon Roadmap which is intended to be released, together with a draft Strategic Environment Assessment, for a substantial period of open consultation later this year. The intention is to ensure that the first draft national roadmap will be informed and technically sound, and provide a solid basis for a constructive, transparent and inclusive open debate. In addition to a direct involvement in the sectoral element of the road-mapping process related to the built environment, DECLG’s responsibility for overall coordination of national climate policy, both mitigation and adaptation, constitutes a major contribution to the development of national greenhouse gas emission reduction policies and actions. Having facilitated the comprehensive open consultation at the outset of the national policy development Programme, the Department will also lead and coordinate the open consultation on the draft National Low-Carbon Roadmap and Strategic Environment Assessment which will conclude the Programme later this year. Please refer to section 4.2 for further information on the Climate Action and Low Carbon Development Bill.
V. Projections The projections provided in Chapter 5 of the sixth national communication are consistent with the Guidelines for the preparation of national communications by Parties included in Annex I to the Convention, Part II: UNFCCC reporting guidelines on national communications. There have been no changes to the model (outside of updated economic data) or methodologies used to prepare projections since the fifth national communication.
246

National emission projections are provided under two scenarios, a ‘with measures’ scenario and a ‘with additional measures’ scenario. Emission projections are provided to 2030, however emissions post 2020 are only provided on the basis of providing a point of discussion rather than any particular policy setting as no long term policies and measures exist post 2020. VI. Provision of financial, technological and capacity-building support to developing country Parties
A Finance Ireland, as a developed country Party to the UNFCCC, provides support to assist developing countries to mitigate and adapt to the impacts of climate change. While, in some instances the provision of such support can help to deliver reductions in GHG emissions in developing countries, most Irish-supported programmes support climate change adaptation while also up-skilling these countries with the means and expertise to develop and implement their own national adaptation plans. Further information on the support provided by Ireland is detailed in the CTF tables enclosed at the end of this report and in Chapter 7 of the sixth National Communication. The BR period (2011 and 2012) incorporates two of the three years of the FSF period (2010-2012 inclusive) for which Ireland met and exceeded its voluntary commitment to provide up to €100m in public climate finance. Some key features of the support provided by Ireland over the BR period (2011/2012) are highlighted below:
Ireland’s reported contributions for the BR period (2011/2012) were entirely in grant-form.
Over 95% of Ireland’s contributions for the BR period (2011/2012) have been reported as support for climate change adaptation.
Ireland’s reported contributions for the BR period (2011/2012) were prioritised towards Least-Developed Countries (LDCs), particularly those in sub-Saharan Africa.
Information on Ireland’s climate finance contributions as reported in CTF: Common-tabular format (CTF) – Ireland’s climate finance contributions for the BR period (2011/2012) are represented in the CTF Tables. More detail on the financial support provided by Ireland to developing country Parties can be found in Chapter 7 of the sixth National Communication. Currency exchange rate - Ireland’s climate finance contributions for the BR period (2011/ 2012) are reported in “Euro (€) millions”. The currency exchange rate used for conversion to USD $, as required in the CTF, was based on the Central Bank of Ireland’s annual average exchange rate (Euro € to USD $) for 2011 and 2012 respectively. Pledged / Committed / Provided All of Ireland’s ODA financial contributions are reported only after they have been provided to partners. New and additional - Ireland has delivered on its international commitment to climate finance even in the context of seriously reduced national budget spending. Ireland's fast-start finance contribution in 2011 and 2012 was drawn from grant and other non-refundable contributions provided by DECLG; DAFM; and climate- relevant ODA. Meeting developing country needs: Ireland’s international co-operation - which is primarily focused on adaptation - has been predominantly achieved through bilateral grants to Key Partner Countries. The focus of these grants
247

to date has been largely on achieving results in the areas of sustainable food and nutrition security, particularly in climate resilient agriculture, improved natural resource management, disaster risk reduction, improving efficient and sustainable energy at the household level and gender equality. Ireland also supports the Climate Change work of the World Resources Institute, the International Institute for Environment and Development, the Least Developed Countries Fund and the UNFCCC-LEG. Private Finance: No information is available for inclusion in the current BR on private finance flows as the mechanisms for tracking such flows are not yet in place. However, Ireland is aware of the need to develop and enhance tracking mechanisms for private climate finance flows going forward and work is underway in this regard.
EXAMPLE, DAFM FUNDING DAFM provides limited funding, over and above the normal country allocation to multilateral organisations (i.e. FAO). Once the objective of the projects directly or indirectly contributed to climate mitigation, adaptation or food security, DAFM considered all of the finance as new and additional climate finance. Projects supported by DAFM included biodiversity, conservation of plant genetic resources, Global Information and Early Warning Systems (GIEWS), as well as drought response in the Horn of Africa. As funding by DAFM was part of larger multilateral Donor-funded projects, it had the added advantage of combined synergy which resulted in better use of limited resources. All projects were subject to international rules of governance which ensured that committed funds were properly administered and directed where the need was greatest. Evaluation of these projects was undertaken by the coordinating agencies.
B Technology development and transfer The Irish Government’s support to technology transfer in relation to implementation of the UNFCCC includes a broad spectrum of activities, mainly surrounding interaction through the Technology Mechanism. The Technology Mechanism was established for the stimulation of technology cooperation and to enhance the development and transfer of technologies. Ireland tracks the provision of technological and capacity building supports through engagement with the Technology Mechanism. This occurs through Ireland’s participation on the policy and operational arms of the Technology Mechanism, namely the Technology Executive Committee and Climate Technology Centre Advisory Board. The suite of Ireland’s technology development and transfer supports under the UNFCCC includes both ‘hard’ and soft technologies and cannot be clearly separated from other activities in Ireland’s overseas development cooperation. Ireland’s approach focuses on improving communities’ resilience to climate change through the promotion of environmental sustainability. Examples of technology development and transfer are mainly located in Sub-Saharan Africa and include the deployment of: 1. Watershed management systems engaging local farmers, 2. Agricultural irrigation systems, 3. Climate forecasting systems to improve enable accurate agricultural decisions, 4. Academic fellowships to university research.; 5. Research on climate adapted seeds and planting materials; 6. Fuel efficient cookstoves and thermo electric generators; 7. Agroforestry and climate smart agriculture; 8. Climate adaptation planning and disaster risk reduction.
248

Reporting on Technology Transfer is difficult as Ireland includes capacity strengthening across programme arrangements and technology transfer will also be packaged in the relevant funding arrangements. Frequently, funding for climate related activities will also include capacity strengthening and technology related components. In Ireland’s ODA commitments, there are very few stand-alone technology transfer or capacity building activities. Further information on some projects that have been fully or partly targeted for ‘Technology development and transfer’ is enclosed in CTF Table 9, which is enclosed at the end of this report. C Capacity building Please refer to CTF Table 9 enclosed at the end of this report. Please see the previous paragraph regarding Ireland including capacity strengthening across programme arrangements and technology transfer will also be packaged in the relevant funding arrangements. A well functioning Technology Mechanism can strengthen international cooperation, accelerate innovation processes and facilitate capacity building. Ireland is represented on the Advisory Board of the Climate Technology centre. Participation and engagement facilitates the building of absorptive capacities in developing countries and so enables the effective preparation and implementation of technology projects. Tracking of such capacity building efforts includes training support for sound planning practices, interactions with financial institutions and enabling the facilitation of outreach to technology providers and their networks.
VII. Other reporting matters None
249

Table 1 IRL_BR1_v1.0
Emission trends: summary (1) Source: Submission 2014 v2.1, IRELAND
(Sheet 1 of 3) CRF: IRL_CRF__ v2.1
Base yeara 1991 1992 1993 1994 1995 1996 1997 1998
kt CO 2 eq kt CO 2 eq kt CO2 eq kt CO2 eq kt CO2 eq kt CO2 eq kt CO2 eq kt CO2 eq kt CO2 eq
CO2 emissions including net CO2 from LULUCF 29,724.21 30,444.34 30,657.14 30,433.39 31,962.72 33,367.24 35,092.42 35,748.36 37,916.06
CO2 emissions excluding net CO2 from LULUCF 32,423.99 33,206.32 33,074.16 33,206.81 34,422.32 35,232.54 36,839.95 38,255.68 40,270.73
CH4 emissions including CH4 from LULUCF 13,683.42 13,852.85 13,967.17 13,982.62 13,911.20 13,931.81 14,190.65 14,204.22 14,422.52
CH4 emissions excluding CH4 from LULUCF 13,674.13 13,846.87 13,963.33 13,974.88 13,902.32 13,919.68 14,177.15 14,196.84 14,418.62
N2O emissions including N2O from LULUCF 9,140.50 8,949.60 8,942.61 9,139.25 9,418.87 9,660.69 9,785.06 9,736.21 10,345.58
N2O emissions excluding N2O from LULUCF 9,112.13 8,920.07 8,912.07 9,104.48 9,384.36 9,620.70 9,744.70 9,696.33 10,303.17
HFCs 1.31 7.11 9.90 15.13 27.73 54.60 91.85 153.44 217.03
PFCs 0.09 7.62 15.15 30.21 45.27 75.38 103.09 130.82 61.87
SF6 35.51 40.74 45.97 55.46 64.94 82.93 102.17 132.20 93.09
Total (including LULUCF) 52,585.05 53,302.25 53,637.94 53,656.06 55,430.73 57,172.65 59,365.22 60,105.26 63,056.15
Total (excluding LULUCF) 55,247.17 56,028.74 56,020.58 56,386.96 57,846.92 58,985.84 61,058.90 62,565.31 65,364.51
Base yeara 1991 1992 1993 1994 1995 1996 1997 1998
kt CO 2 eq kt CO 2 eq kt CO2 eq kt CO2 eq kt CO2 eq kt CO2 eq kt CO2 eq kt CO2 eq kt CO2 eq
1. Energy 30,970.47 31,832.89 31,730.32 31,957.05 32,959.66 33,845.38 35,433.16 36,574.83 38,822.07
2. Industrial Processes 3,179.27 2,890.63 2,820.01 2,810.56 3,088.71 3,082.98 3,230.78 3,686.96 3,531.12
3. Solvent and Other Product Use 80.03 81.78 82.25 82.62 83.67 85.39 85.39 85.88 86.63
4. Agriculture 19,634.08 19,757.40 19,862.29 19,964.15 20,097.37 20,314.40 20,740.09 20,858.61 21,513.18
5. Land Use, Land-Use Change and Forestryb -2,662.12 -2,726.49 -2,382.64 -2,730.90 -2,416.19 -1,813.19 -1,693.68 -2,460.06 -2,308.36
6. Waste 1,383.32 1,466.04 1,525.72 1,572.59 1,617.51 1,657.68 1,569.47 1,359.04 1,411.52
7. Other NA NA NA NA NA NA NA NA NA
Total (including LULUCF) 52,585.05 53,302.25 53,637.94 53,656.06 55,430.73 57,172.65 59,365.22 60,105.26 63,056.15
Note: All footnotes for this table are given on sheet 3.
GREENHOUSE GAS EMISSIONS
GREENHOUSE GAS SOURCE AND SINK CATEGORIES
1 The common tabular format will be revised, in accordance with relevant decisions of the Conference of the Parties and, where
applicable, with decisions of the Conference of the Parties serving as the meeting of the Parties to the Kyoto Protocol."
250

Table 1 IRL_BR1_v1.0
Emission trends: summary (1) Source: Submission 2014 v2.1, IRELAND
(Sheet 2 of 3) CRF: IRL_CRF__ v2.1
1999 2000 2001 2002 2003 2004 2005 2006 2007 2008
kt CO 2 eq kt CO 2 eq kt CO2 eq kt CO2 eq kt CO2 eq kt CO2 eq kt CO2 eq kt CO2 eq kt CO2 eq kt CO2 eq
CO2 emissions including net CO2 from LULUCF 39,711.57 43,382.25 45,657.82 44,223.31 43,591.44 43,454.88 45,145.29 44,632.72 44,151.89 44,236.11
CO2 emissions excluding net CO2 from LULUCF 41,907.05 44,689.23 47,098.40 45,676.21 45,155.04 46,053.76 47,779.22 47,398.46 47,578.90 47,018.64
CH4 emissions including CH4 from LULUCF 13,959.47 13,420.17 13,474.94 13,399.30 13,961.32 13,168.30 12,814.38 12,889.26 12,364.64 12,233.72
CH4 emissions excluding CH4 from LULUCF 13,956.29 13,412.20 13,459.04 13,395.64 13,938.77 13,155.16 12,809.60 12,884.48 12,359.27 12,228.17
N2O emissions including N2O from LULUCF 9,983.55 9,528.06 9,021.37 8,648.47 8,571.60 8,391.34 8,174.63 8,040.98 7,794.68 7,702.86
N2O emissions excluding N2O from LULUCF 9,943.09 9,482.75 8,970.28 8,598.81 8,512.25 8,333.13 8,117.83 7,984.55 7,737.83 7,633.62
HFCs 223.94 259.81 279.85 309.24 382.20 416.04 475.81 548.66 535.67 566.66
PFCs 195.93 305.41 295.98 212.40 228.79 182.43 168.34 148.32 130.58 106.20
SF6 67.38 54.35 67.84 67.73 115.43 68.65 101.63 62.90 65.52 56.68
Total (including LULUCF) 64,141.84 66,950.04 68,797.81 66,860.45 66,850.77 65,681.64 66,880.07 66,322.84 65,042.97 64,902.23
Total (excluding LULUCF) 66,293.68 68,203.75 70,171.39 68,260.04 68,332.48 68,209.17 69,452.43 69,027.37 68,407.76 67,609.96
1999 2000 2001 2002 2003 2004 2005 2006 2007 2008
kt CO 2 eq kt CO 2 eq kt CO2 eq kt CO2 eq kt CO2 eq kt CO2 eq kt CO2 eq kt CO2 eq kt CO2 eq kt CO2 eq
1. Energy 40,156.84 42,458.12 44,569.56 43,355.14 43,890.73 44,034.04 45,732.42 45,355.60 45,516.25 45,249.87
2. Industrial Processes 3,595.98 4,223.10 4,330.65 3,755.83 3,069.03 3,174.18 3,298.58 3,298.62 3,312.20 3,031.12
3. Solvent and Other Product Use 83.73 79.04 77.91 75.60 74.39 73.92 74.07 75.10 75.67 74.30
4. Agriculture 21,018.65 19,970.19 19,594.75 19,378.62 19,510.45 19,315.01 18,857.48 18,723.70 18,284.27 18,146.98
5. Land Use, Land-Use Change and Forestryb -2,151.83 -1,253.70 -1,373.59 -1,399.58 -1,481.71 -2,527.53 -2,572.36 -2,704.53 -3,364.79 -2,707.74
6. Waste 1,438.48 1,473.30 1,598.52 1,694.85 1,787.87 1,612.01 1,489.89 1,574.34 1,219.38 1,107.69
7. Other NA NA NA NA NA NA NA NA NA NA
Total (including LULUCF) 64,141.84 66,950.04 68,797.81 66,860.45 66,850.77 65,681.64 66,880.07 66,322.84 65,042.97 64,902.23
Note: All footnotes for this table are given on sheet 3.
GREENHOUSE GAS EMISSIONS
GREENHOUSE GAS SOURCE AND SINK CATEGORIES
251

Table 1 IRL_BR1_v1.0
Emission trends: summary (1) Source: Submission 2014 v2.1, IRELAND
(Sheet 3 of 3) CRF: IRL_CRF__ v2.1
2009 2010 2011 Change from
base to latest
reported year
kt CO 2 eq kt CO 2 eq kt CO2 eq (%)
CO2 emissions including net CO2 from LULUCF 38,650.63 37,137.53 33,882.54 13.99
CO2 emissions excluding net CO2 from LULUCF 41,726.52 41,341.62 37,664.48 16.16
CH4 emissions including CH4 from LULUCF 11,932.93 11,717.53 11,636.40 -14.96
CH4 emissions excluding CH4 from LULUCF 11,929.81 11,697.10 11,628.82 -14.96
N2O emissions including N2O from LULUCF 7,612.73 7,896.40 7,693.86 -15.83
N2O emissions excluding N2O from LULUCF 7,543.38 7,825.02 7,621.12 -16.36
HFCs 523.33 559.30 538.61 41,079.90
PFCs 65.57 37.02 13.20 14,076.58
SF6 38.24 34.51 48.29 35.98
Total (including LULUCF) 58,823.42 57,382.30 53,812.90 2.33
Total (excluding LULUCF) 61,826.84 61,494.57 57,514.53 4.10
2009 2010 2011 Change from
base to latest
reported year
kt CO 2 eq kt CO 2 eq kt CO2 eq (%)
1. Energy 40,735.36 40,530.48 36,938.87 19.27
2. Industrial Processes 2,112.45 1,929.88 1,767.37 -44.41
3. Solvent and Other Product Use 71.88 71.66 72.49 -9.42
4. Agriculture 17,932.52 17,996.85 17,693.21 -9.89
5. Land Use, Land-Use Change and Forestryb -3,003.42 -4,112.27 -3,701.62 39.05
6. Waste 974.62 965.69 1,042.58 -24.63
7. Other NA NA NA 0.00
Total (including LULUCF) 58,823.42 57,382.30 53,812.90 2.33
Notes :
(3) 1 kt CO2 eq equals 1 Gg CO2 eq.
Custom Footnotes
a The column “Base year” should be filled in only by those Parties with economies in transition that use a base year different from 1990 in
accordance with the relevant decisions of the Conference of the Parties. For these Parties, this different base year is used to calculate the
percentage change in the final column of this table.
b Includes net CO2, CH4 and N2O from LULUCF.
GREENHOUSE GAS EMISSIONS
(1) Further detailed information could be found in the common reporting format tables of the Party’s greenhouse gas inventory, namely
“Emission trends (CO2)”, “Emission trends (CH4)”, “Emission trends (N2O)” and “Emission trends (HFCs, PFCs and SF6)”, which is included
in an annex to this biennial report.
Abbreviation: LULUCF = land use, land-use change and forestry.
(2) 2011 is the latest reported inventory year.
GREENHOUSE GAS SOURCE AND SINK CATEGORIES
252

Table 1 (a) IRL_BR1_v1.0
Emission trends (CO2) Source: Submission 2014 v2.1, IRELAND
(Sheet 1 of 3) CRF: IRL_CRF__ v2.1
Base yeara 1991 1992 1993 1994 1995 1996 1997 1998
kt kt kt kt kt kt kt kt kt
1. Energy 30,154.04 31,018.87 30,972.41 31,143.91 32,117.35 33,006.56 34,550.36 35,642.29 37,784.72
A. Fuel Combustion (Sectoral Approach) 30,154.04 31,018.87 30,972.41 31,143.91 32,117.35 33,006.56 34,550.36 35,642.29 37,784.72
1. Energy Industries 11,158.61 11,617.34 12,279.74 12,297.59 12,634.28 13,317.47 14,031.86 14,692.87 15,080.52
2. Manufacturing Industries and Construction 3,942.64 4,055.14 3,752.29 3,969.39 4,225.46 4,329.85 4,163.99 4,531.31 4,569.07
3. Transport 5,021.69 5,199.86 5,614.73 5,577.05 5,799.89 6,054.20 7,023.59 7,344.83 8,618.23
4. Other Sectors 10,031.09 10,146.53 9,325.65 9,299.88 9,457.73 9,305.04 9,330.93 9,073.28 9,516.89
5. Other NO NO NO NO NO NO NO NO NO
B. Fugitive Emissions from Fuels IE, NE, NO IE, NE, NO IE, NE, NO IE, NE, NO IE, NE, NO IE, NE, NO IE, NO IE, NO IE, NO
1. Solid Fuels NE, NO NE, NO NE, NO NE, NO NE, NO NE, NO NO NO NO
2. Oil and Natural Gas IE, NO IE, NO IE, NO IE, NO IE, NO IE, NO IE, NO IE, NO IE, NO
2. Industrial Processes 2,106.96 2,022.71 1,936.53 1,897.31 2,138.33 2,057.62 2,121.24 2,458.05 2,346.93
A. Mineral Products 1,116.73 992.39 932.97 951.13 1,081.70 1,084.18 1,198.39 1,384.92 1,288.13
B. Chemical Industry 990.23 1,030.32 1,003.56 946.19 1,056.63 973.44 922.85 1,073.12 1,058.81
C. Metal Production NO NO NO NO NO NO NO NO NO
D. Other Production NE NE NE NE NE NE NE NE NE
E. Production of Halocarbons and SF6
F. Consumption of Halocarbons and SF6
G. Other NO NO NO NO NO NO NO NO NO
3. Solvent and Other Product Use 80.03 81.78 82.25 82.62 83.67 85.39 85.39 85.88 86.63
4. Agriculture
A. Enteric Fermentation
B. Manure Management
C. Rice Cultivation
D. Agricultural Soils
E. Prescribed Burning of Savannas
F. Field Burning of Agricultural Residues
G. Other
5. Land Use, Land-Use Change and Forestry -2,699.78 -2,761.99 -2,417.02 -2,773.42 -2,459.60 -1,865.30 -1,747.53 -2,507.32 -2,354.67
A. Forest Land -3,269.70 -3,406.74 -2,925.25 -3,190.07 -2,851.45 -2,591.41 -2,505.54 -3,255.36 -2,849.72
B. Cropland 20.00 21.19 25.00 21.88 -53.68 -25.96 37.52 72.03 18.47
C. Grassland 493.57 568.21 441.17 355.04 409.09 706.38 698.02 661.41 468.63
D. Wetlands 47.10 45.49 45.54 43.95 41.92 40.35 38.15 36.55 35.23
E. Settlements 10.29 9.59 9.70 10.21 12.05 9.83 12.46 13.65 14.74
F. Other Land -1.06 0.28 -13.18 -14.43 -17.52 -4.48 -28.13 -35.61 -42.02
G. Other NE NE NE NE NE NE NE NE NE
6. Waste 82.97 82.97 82.97 82.97 82.97 82.97 82.97 69.47 52.45
A. Solid Waste Disposal on Land NA, NO NA, NO NA, NO NA, NO NA, NO NA, NO NA, NO NA, NO NA, NO
B. Waste-water Handling
C. Waste Incineration 82.97 82.97 82.97 82.97 82.97 82.97 82.97 69.47 52.45
D. Other NO NO NO NO NO NO NO NO NO
7. Other (as specified in the summary table in CRF) NA NA NA NA NA NA NA NA NA
Total CO2 emissions including net CO2 from LULUCF 29,724.21 30,444.34 30,657.14 30,433.39 31,962.72 33,367.24 35,092.42 35,748.36 37,916.06
Total CO2 emissions excluding net CO2 from LULUCF 32,423.99 33,206.32 33,074.16 33,206.81 34,422.32 35,232.54 36,839.95 38,255.68 40,270.73
Memo Items:
International Bunkers 1,126.32 1,143.75 955.44 1,509.57 1,308.87 1,520.28 1,555.24 1,754.75 1,814.69
Aviation 1,069.54 1,036.71 901.96 1,338.96 1,185.87 1,150.90 1,056.03 1,277.39 1,315.15
Marine 56.78 107.04 53.48 170.61 122.99 369.39 499.22 477.36 499.54
Multilateral Operations NO NO NO NO NO NO NO NO NO
CO2 Emissions from Biomass 491.99 471.12 416.76 423.22 424.11 418.20 461.32 483.29 579.65
Note: All footnotes for this table are given on sheet 3.
GREENHOUSE GAS SOURCE AND SINK CATEGORIES
253

Table 1 (a) IRL_BR1_v1.0
Emission trends (CO2) Source: Submission 2014 v2.1, IRELAND
(Sheet 2 of 3) CRF: IRL_CRF__ v2.1
1999 2000 2001 2002 2003 2004 2005 2006 2007 2008
kt kt kt kt kt kt kt kt kt kt
1. Energy 39,471.24 41,760.44 43,854.83 42,662.29 42,641.75 43,363.02 45,046.09 44,681.83 44,840.76 44,581.46
A. Fuel Combustion (Sectoral Approach) 39,432.97 41,760.44 43,798.78 42,662.29 42,641.75 43,363.02 45,046.09 44,681.83 44,840.76 44,581.46
1. Energy Industries 15,732.98 16,050.38 17,266.56 16,345.85 15,643.76 15,265.22 15,657.29 14,906.98 14,406.63 14,495.44
2. Manufacturing Industries and Construction 4,789.52 5,617.89 5,573.79 5,298.41 5,489.40 5,884.02 5,988.24 5,881.04 6,119.64 5,621.80
3. Transport 9,532.18 10,561.82 11,079.75 11,280.50 11,491.16 12,211.72 12,906.10 13,688.40 14,287.77 13,595.01
4. Other Sectors 9,378.29 9,530.36 9,878.67 9,737.53 10,017.43 10,002.06 10,494.45 10,205.40 10,026.72 10,869.21
5. Other NO NO NO NO NO NO NO NO NO NO
B. Fugitive Emissions from Fuels 38.27 IE, NO 56.05 IE, NO IE, NO IE, NO IE, NO IE, NO IE, NO IE, NO
1. Solid Fuels NO NO NO NO NO NO NO NO NO NO
2. Oil and Natural Gas 38.27 IE, NO 56.05 IE, NO IE, NO IE, NO IE, NO IE, NO IE, NO IE, NO
2. Industrial Processes 2,296.53 2,791.08 3,102.62 2,874.28 2,342.62 2,507.06 2,552.80 2,538.74 2,580.43 2,301.58
A. Mineral Products 1,353.71 1,908.78 2,061.44 2,063.38 2,342.32 2,507.06 2,552.80 2,538.74 2,580.43 2,301.58
B. Chemical Industry 942.82 882.30 1,041.18 810.90 0.30 NO NO NO NO NO
C. Metal Production NO NO NO NO NO NO NO NO NO NO
D. Other Production NE NE NE NE NE NE NE NE NE NE
E. Production of Halocarbons and SF6
F. Consumption of Halocarbons and SF6
G. Other NO NO NO NO NO NO NO NO NO NO
3. Solvent and Other Product Use 83.73 79.04 77.91 75.60 74.39 73.92 74.07 75.10 75.67 74.30
4. Agriculture
A. Enteric Fermentation
B. Manure Management
C. Rice Cultivation
D. Agricultural Soils
E. Prescribed Burning of Savannas
F. Field Burning of Agricultural Residues
G. Other
5. Land Use, Land-Use Change and Forestry -2,195.48 -1,306.99 -1,440.58 -1,452.90 -1,563.60 -2,598.88 -2,633.93 -2,765.74 -3,427.01 -2,782.53
A. Forest Land -2,783.83 -2,044.94 -2,197.97 -2,133.44 -2,356.64 -3,133.57 -3,032.43 -3,153.68 -3,893.28 -3,468.18
B. Cropland -5.99 40.12 125.64 117.92 161.96 120.42 146.59 93.10 117.10 417.06
C. Grassland 568.82 611.91 557.85 511.93 577.04 409.54 248.25 306.37 351.30 338.18
D. Wetlands 46.07 60.33 58.44 55.85 53.26 39.75 43.01 71.68 68.78 38.18
E. Settlements 15.78 37.30 42.85 40.93 45.34 46.57 50.81 34.28 32.79 30.37
F. Other Land -36.32 -11.71 -27.39 -46.09 -44.55 -81.60 -90.15 -117.48 -103.70 -138.14
G. Other NE NE NE NE NE NE NE NE NE NE
6. Waste 55.56 58.67 63.04 64.03 96.27 109.75 106.27 102.79 82.05 61.30
A. Solid Waste Disposal on Land NA, NO NA, NO NA, NO NA, NO NA, NO NA, NO NA, NO NA, NO NA, NO NA, NO
B. Waste-water Handling
C. Waste Incineration 55.56 58.67 63.04 64.03 96.27 109.75 106.27 102.79 82.05 61.30
D. Other NO NO NO NO NO NO NO NO NO NO
7. Other (as specified in the summary table in CRF) NA NA NA NA NA NA NA NA NA NA
Total CO2 emissions including net CO2 from LULUCF 39,711.57 43,382.25 45,657.82 44,223.31 43,591.44 43,454.88 45,145.29 44,632.72 44,151.89 44,236.11
Total CO2 emissions excluding net CO2 from LULUCF 41,907.05 44,689.23 47,098.40 45,676.21 45,155.04 46,053.76 47,779.22 47,398.46 47,578.90 47,018.64
Memo Items:
International Bunkers 2,101.27 2,288.28 2,698.62 2,782.70 2,812.30 2,627.74 2,832.21 3,285.57 3,409.67 3,059.29
Aviation 1,557.28 1,810.43 2,188.99 2,327.68 2,272.06 2,153.56 2,501.97 2,881.46 3,052.83 2,838.50
Marine 543.98 477.85 509.63 455.02 540.24 474.19 330.25 404.11 356.84 220.79
Multilateral Operations NO NO NO NO NO NO NO NO NO NO
CO2 Emissions from Biomass 547.72 588.66 652.08 633.97 602.72 703.77 887.51 916.39 991.79 1,064.47
Note: All footnotes for this table are given on sheet 3.
GREENHOUSE GAS SOURCE AND SINK CATEGORIES
254

Table 1(a) IRL_BR1_v1.0
Emission trends (CO2) Source: Submission 2014 v2.1, IRELAND
(Sheet 3 of 3) CRF: IRL_CRF__ v2.1
2009 2010 2011 Change
from base to
latest
reported
yearkt kt kt %
1. Energy 40,106.61 39,917.42 36,371.22 20.62
A. Fuel Combustion (Sectoral Approach) 40,106.61 39,917.42 36,371.22 20.62
1. Energy Industries 12,926.12 13,176.05 11,798.29 5.73
2. Manufacturing Industries and Construction 4,407.28 4,545.56 4,175.23 5.90
3. Transport 12,383.33 11,471.09 11,162.29 122.28
4. Other Sectors 10,389.89 10,724.72 9,235.41 -7.93
5. Other NO NO NO 0.00
B. Fugitive Emissions from Fuels IE, NO IE, NO IE, NO 0.00
1. Solid Fuels NO NO NO 0.00
2. Oil and Natural Gas IE, NO IE, NO IE, NO 0.00
2. Industrial Processes 1,485.32 1,299.05 1,167.27 -44.60
A. Mineral Products 1,485.32 1,299.05 1,167.27 4.53
B. Chemical Industry NO NO NO -100.00
C. Metal Production NO NO NO 0.00
D. Other Production NE NE NE 0.00
E. Production of Halocarbons and SF6
F. Consumption of Halocarbons and SF6
G. Other NO NO NO 0.00
3. Solvent and Other Product Use 71.88 71.66 72.49 -9.42
4. Agriculture
A. Enteric Fermentation
B. Manure Management
C. Rice Cultivation
D. Agricultural Soils
E. Prescribed Burning of Savannas
F. Field Burning of Agricultural Residues
G. Other
5. Land Use, Land-Use Change and Forestry -3,075.89 -4,204.09 -3,781.94 40.08
A. Forest Land -3,483.28 -4,478.68 -4,252.94 30.07
B. Cropland 228.45 263.39 346.29 1,631.49
C. Grassland 243.22 118.53 220.16 -55.40
D. Wetlands 36.81 37.14 33.19 -29.54
E. Settlements 19.80 23.43 9.56 -7.11
F. Other Land -120.89 -167.90 -138.19 12,980.04
G. Other NE NE NE 0.00
6. Waste 62.71 53.49 53.49 -35.52
A. Solid Waste Disposal on Land NA, NO NA, NO NA, NO 0.00
B. Waste-water Handling
C. Waste Incineration 62.71 53.49 53.49 -35.52
D. Other NO NO NO 0.00
7. Other (as specified in the summary table in CRF) NA NA NA 0.00
Total CO2 emissions including net CO2 from LULUCF 38,650.63 37,137.53 33,882.54 13.99
Total CO2 emissions excluding net CO2 from LULUCF 41,726.52 41,341.62 37,664.48 16.16
Memo Items:
International Bunkers 2,544.01 2,745.13 2,407.96 113.79
Aviation 2,240.57 2,315.15 2,074.25 93.94
Marine 303.44 429.98 333.71 487.77
Multilateral Operations NO NO NO 0.00
CO2 Emissions from Biomass 1,199.04 1,343.43 1,404.94 185.56
Abbreviations : CRF = common reporting format, LULUCF = land use, land-use change and forestry.
Custom Footnotes
GREENHOUSE GAS SOURCE AND SINK CATEGORIES
a The column “Base year” should be filled in only by those Parties with economies in transition that use a base
year different from 1990 in accordance with the relevant decisions of the Conference of the Parties. For these
Parties, this different base year is used to calculate the percentage change in the final column of this table.
b Fill in net emissions/removals as reported in CRF table Summary 1.A of the latest reported inventory year.
For the purposes of reporting, the signs for removals are always negative (-) and for emissions positive (+).
255

Table 1(b) IRL_BR1_v1.0
Emission trends (CH4) Source: Submission 2014 v2.1, IRELAND
(Sheet 1 of 3) CRF: IRL_CRF__ v2.1
Base yeara 1991 1992 1993 1994 1995 1996 1997 1998
kt kt kt kt kt kt kt kt kt
1. Energy 26.60 26.06 23.33 22.75 20.82 19.58 19.49 17.80 17.83
A. Fuel Combustion (Sectoral Approach) 20.35 19.98 17.48 16.94 15.20 14.13 14.23 12.77 13.43
1. Energy Industries 0.26 0.27 0.27 0.29 0.29 0.31 0.36 0.37 0.37
2. Manufacturing Industries and Construction 0.27 0.27 0.23 0.24 0.23 0.24 0.26 0.26 0.28
3. Transport 1.78 1.81 1.96 1.79 1.72 1.84 1.91 1.84 1.89
4. Other Sectors 18.04 17.63 15.02 14.63 12.96 11.73 11.71 10.29 10.89
5. Other NO NO NO NO NO NO NO NO NO
B. Fugitive Emissions from Fuels 6.25 6.07 5.86 5.81 5.63 5.45 5.25 5.04 4.40
1. Solid Fuels NE, NO NE, NO NE, NO NE, NO NE, NO NE, NO NO NO NO
2. Oil and Natural Gas 6.25 6.07 5.86 5.81 5.63 5.45 5.25 5.04 4.40
2. Industrial Processes NO NO NO NO NO NO NO NO NO
A. Mineral Products NO NO NO NO NO NO NO NO NO
B. Chemical Industry NO NO NO NO NO NO NO NO NO
C. Metal Production NO NO NO NO NO NO NO NO NO
D. Other Production
E. Production of Halocarbons and SF6
F. Consumption of Halocarbons and SF6
G. Other NO NO NO NO NO NO NO NO NO
3. Solvent and Other Product Use
4. Agriculture 567.99 573.01 578.38 577.14 573.33 573.54 590.28 602.40 609.83
A. Enteric Fermentation 455.91 459.97 464.11 463.20 460.35 460.89 473.31 482.83 488.90
B. Manure Management 112.08 113.04 114.26 113.94 112.98 112.64 116.97 119.57 120.94
C. Rice Cultivation NO NO NO NO NO NO NO NO NO
D. Agricultural Soils NE, NO NE, NO NO NE, NO NE, NO NE, NO NE, NO NE, NO NE, NO
E. Prescribed Burning of Savannas NO NO NO NO NO NO NO NO NO
F. Field Burning of Agricultural Residues NO NO NO NO NO NO NO NO NO
G. Other NO NO NO NO NO NO NO NO NO
5. Land Use, Land-Use Change and Forestry 0.44 0.28 0.18 0.37 0.42 0.58 0.64 0.35 0.19
A. Forest Land 0.44 0.28 0.18 0.37 0.42 0.58 0.64 0.35 0.19
B. Cropland NO NO NO NO NO NO NO NO NO
C. Grassland NO NO NO NO NO NO NO NO NO
D. Wetlands NE, NO NE, NO NE, NO NE, NO NE, NO NE, NO NE, NO NE, NO NE, NO
E. Settlements NE, NO NE, NO NE, NO NE, NO NE, NO NE, NO NE, NO NE, NO NE, NO
F. Other Land NE NE NE NE NE NE NE NE NE
G. Other NE NE NE NE NE NE NE NE NE
6. Waste 56.56 60.31 63.21 65.58 67.86 69.73 65.34 55.83 58.94
A. Solid Waste Disposal on Land 55.86 59.61 62.50 64.86 67.14 69.03 64.64 54.87 57.96
B. Waste-water Handling 0.70 0.71 0.71 0.72 0.72 0.70 0.70 0.97 0.98
C. Waste Incineration 0.00 0.00 0.00 0.00 0.00 0.00 0.00 0.00 0.00
D. Other NO NO NO NO NO NO NO NO NO
7. Other (as specified in the summary table in CRF) NA NA NA NA NA NA NA NA NA
Total CH4 emissions including CH4 from LULUCF 651.59 659.66 665.10 665.84 662.44 663.42 675.75 676.39 686.79
Total CH4 emissions excluding CH4 from LULUCF 651.15 659.37 664.92 665.47 662.02 662.84 675.10 676.04 686.60
Memo Items:
International Bunkers 0.02 0.02 0.02 0.03 0.02 0.05 0.06 0.06 0.06
Aviation 0.01 0.01 0.01 0.01 0.01 0.01 0.01 0.01 0.01
Marine 0.01 0.01 0.00 0.02 0.01 0.03 0.05 0.05 0.05
Multilateral Operations NO NO NO NO NO NO NO NO NO
CO2 Emissions from Biomass
Note: All footnotes for this table are given on sheet 3.
GREENHOUSE GAS SOURCE AND SINK CATEGORIES
256

Table 1(b) IRL_BR1_v1.0
Emission trends (CH4) Source: Submission 2014 v2.1, IRELAND
(Sheet 2 of 3) CRF: IRL_CRF__ v2.1
1999 2000 2001 2002 2003 2004 2005 2006 2007 2008
kt kt kt kt kt kt kt kt kt kt
1. Energy 15.22 14.97 14.90 13.50 39.55 12.65 12.53 11.77 12.16 12.07
A. Fuel Combustion (Sectoral Approach) 10.95 10.91 10.52 10.20 9.71 9.49 9.82 9.52 9.31 9.61
1. Energy Industries 0.40 0.44 0.46 0.43 0.41 0.36 0.37 0.35 0.36 0.29
2. Manufacturing Industries and Construction 0.29 0.34 0.35 0.34 0.36 0.40 0.45 0.43 0.42 0.39
3. Transport 1.87 1.75 1.69 1.54 1.46 1.39 1.32 1.27 1.22 1.13
4. Other Sectors 8.40 8.38 8.02 7.88 7.49 7.35 7.68 7.47 7.31 7.80
5. Other NO NO NO NO NO NO NO NO NO NO
B. Fugitive Emissions from Fuels 4.27 4.07 4.38 3.30 29.84 3.15 2.71 2.25 2.85 2.46
1. Solid Fuels NO NO NO NO NO NO NO NO NO NO
2. Oil and Natural Gas 4.27 4.07 4.38 3.30 29.84 3.15 2.71 2.25 2.85 2.46
2. Industrial Processes NO NO NO NO NO NO NO NO NO NO
A. Mineral Products NO NO NO NO NO NO NO NO NO NO
B. Chemical Industry NO NO NO NO NO NO NO NO NO NO
C. Metal Production NO NO NO NO NO NO NO NO NO NO
D. Other Production
E. Production of Halocarbons and SF6
F. Consumption of Halocarbons and SF6
G. Other NO NO NO NO NO NO NO NO NO NO
3. Solvent and Other Product Use
4. Agriculture 589.52 562.32 559.15 552.92 549.97 548.64 537.92 538.21 528.71 527.07
A. Enteric Fermentation 473.70 452.14 448.69 442.98 441.31 440.77 430.07 430.92 424.04 422.59
B. Manure Management 115.83 110.18 110.46 109.93 108.66 107.87 107.85 107.29 104.68 104.48
C. Rice Cultivation NO NO NO NO NO NO NO NO NO NO
D. Agricultural Soils NE, NO NE, NO NE, NO NE, NO NE, NO NE, NO NE, NO NE, NO NE, NO NE, NO
E. Prescribed Burning of Savannas NO NO NO NO NO NO NO NO NO NO
F. Field Burning of Agricultural Residues NO NO NO NO NO NO NO NO NO NO
G. Other NO NO NO NO NO NO NO NO NO NO
5. Land Use, Land-Use Change and Forestry 0.15 0.38 0.76 0.17 1.07 0.63 0.23 0.23 0.26 0.26
A. Forest Land 0.15 0.38 0.76 0.17 1.07 0.63 0.23 0.23 0.26 0.26
B. Cropland NO NO NO NO NO NO NO NO NO NO
C. Grassland NO NO NO NO NO NO NO NO NO NO
D. Wetlands NE, NO NE, NO NE, NO NE, NO NE, NO NE, NO NE, NO NE, NO NE, NO NE, NO
E. Settlements NE, NO NE, NO NE, NO NE, NO NE, NO NE, NO NE, NO NE, NO NE, NO NE, NO
F. Other Land NE NE NE NE NE NE NE NE NE NE
G. Other NE NE NE NE NE NE NE NE NE NE
6. Waste 59.84 61.38 66.85 71.47 74.23 65.15 59.53 63.57 47.66 43.15
A. Solid Waste Disposal on Land 58.80 60.33 65.75 70.36 73.16 64.03 58.84 62.86 46.94 42.42
B. Waste-water Handling 1.04 1.06 1.10 1.12 1.07 1.12 0.69 0.71 0.72 0.73
C. Waste Incineration 0.00 0.00 0.00 0.00 0.00 0.00 0.00 0.00 0.00 0.00
D. Other NO NO NO NO NO NO NO NO NO NO
7. Other (as specified in the summary table in CRF) NA NA NA NA NA NA NA NA NA NA
Total CH4 emissions including CH4 from LULUCF 664.74 639.06 641.66 638.06 664.82 627.06 610.21 613.77 588.79 582.56
Total CH4 emissions excluding CH4 from LULUCF 664.59 638.68 640.91 637.89 663.75 626.44 609.98 613.55 588.54 582.29
Memo Items:
International Bunkers 0.07 0.06 0.06 0.06 0.06 0.07 0.05 0.05 0.05 0.03
Aviation 0.01 0.01 0.01 0.01 0.01 0.03 0.02 0.01 0.01 0.01
Marine 0.05 0.05 0.05 0.04 0.05 0.04 0.03 0.04 0.03 0.02
Multilateral Operations NO NO NO NO NO NO NO NO NO NO
CO2 Emissions from Biomass
Note: All footnotes for this table are given on sheet 3.
GREENHOUSE GAS SOURCE AND SINK CATEGORIES
257

Table 1(b) IRL_BR1_v1.0
Emission trends (CH4) Source: Submission 2014 v2.1, IRELAND
(Sheet 3 of 3) CRF: IRL_CRF__ v2.1
2009 2010 2011 Change from
base to latest
reported
year
kt kt kt %
1. Energy 11.57 11.00 10.01 -62.37
A. Fuel Combustion (Sectoral Approach) 9.87 9.50 8.69 -57.31
1. Energy Industries 0.28 0.28 0.23 -12.92
2. Manufacturing Industries and Construction 0.33 0.35 0.32 20.33
3. Transport 1.03 0.92 0.85 -51.99
4. Other Sectors 8.23 7.95 7.28 -59.64
5. Other NO NO NO 0.00
B. Fugitive Emissions from Fuels 1.69 1.51 1.32 -78.83
1. Solid Fuels NO NO NO 0.00
2. Oil and Natural Gas 1.69 1.51 1.32 -78.83
2. Industrial Processes NO NO NO 0.00
A. Mineral Products NO NO NO 0.00
B. Chemical Industry NO NO NO 0.00
C. Metal Production NO NO NO 0.00
D. Other Production
E. Production of Halocarbons and SF6
F. Consumption of Halocarbons and SF6
G. Other NO NO NO 0.00
3. Solvent and Other Product Use
4. Agriculture 519.82 509.30 503.40 -11.37
A. Enteric Fermentation 416.07 406.80 401.85 -11.86
B. Manure Management 103.75 102.51 101.55 -9.39
C. Rice Cultivation NO NO NO 0.00
D. Agricultural Soils NE, NO NE, NO NE, NO 0.00
E. Prescribed Burning of Savannas NO NO NO 0.00
F. Field Burning of Agricultural Residues NO NO NO 0.00
G. Other NO NO NO 0.00
5. Land Use, Land-Use Change and Forestry 0.15 0.97 0.36 -18.38
A. Forest Land 0.15 0.97 0.36 -18.38
B. Cropland NO NO NO 0.00
C. Grassland NO NO NO 0.00
D. Wetlands NE, NO NE, NO NE, NO 0.00
E. Settlements NE, NO NE, NO NE, NO 0.00
F. Other Land NE NE NE 0.00
G. Other NE NE NE 0.00
6. Waste 36.70 36.70 40.34 -28.68
A. Solid Waste Disposal on Land 35.95 35.94 39.56 -29.17
B. Waste-water Handling 0.75 0.76 0.78 10.84
C. Waste Incineration 0.00 0.00 0.00 -96.00
D. Other NO NO NO 0.00
7. Other (as specified in the summary table in CRF) NA NA NA 0.00
Total CH4 emissions including CH4 from LULUCF 568.23 557.98 554.11 -14.96
Total CH4 emissions excluding CH4 from LULUCF 568.09 557.00 553.75 -14.96
Memo Items:
International Bunkers 0.04 0.05 0.04 123.76
Aviation 0.01 0.01 0.01 -32.45
Marine 0.03 0.04 0.03 493.83
Multilateral Operations NO NO NO 0.00
CO2 Emissions from Biomass
Custom Footnotes
GREENHOUSE GAS SOURCE AND SINK CATEGORIES
Abbreviations : CRF = common reporting format, LULUCF = land use, land-use change and forestry.
a The column “Base year” should be filled in only by those Parties with economies in transition
that use a base year different from 1990 in accordance with the relevant decisions of the
Conference of the Parties. For these Parties, this different base year is used to calculate the
percentage change in the final column of this table.
258

Table 1(c) IRL_BR1_v1.0
Emission trends (N2O) Source: Submission 2014 v2.1, IRELAND
(Sheet 1 of 3) CRF: IRL_CRF__ v2.1
Base yeara 1991 1992 1993 1994 1995 1996 1997 1998
kt kt kt kt kt kt kt kt kt
1. Energy 0.83 0.86 0.86 1.08 1.31 1.38 1.53 1.80 2.14
A. Fuel Combustion (Sectoral Approach) 0.83 0.86 0.86 1.08 1.31 1.38 1.53 1.80 2.14
1. Energy Industries 0.24 0.25 0.25 0.24 0.25 0.25 0.26 0.26 0.25
2. Manufacturing Industries and Construction 0.04 0.04 0.04 0.04 0.04 0.04 0.04 0.04 0.05
3. Transport 0.20 0.22 0.23 0.46 0.65 0.68 0.88 1.15 1.49
4. Other Sectors 0.35 0.36 0.34 0.34 0.37 0.41 0.35 0.35 0.35
5. Other NO NO NO NO NO NO NO NO NO
B. Fugitive Emissions from Fuels NO NO NO NO NO NO NO NO NO
1. Solid Fuels NO NO NO NO NO NO NO NO NO
2. Oil and Natural Gas NO NO NO NO NO NO NO NO NO
2. Industrial Processes 3.34 2.62 2.62 2.62 2.62 2.62 2.62 2.62 2.62
A. Mineral Products NO NO NO NO NO NO NO NO NO
B. Chemical Industry 3.34 2.62 2.62 2.62 2.62 2.62 2.62 2.62 2.62
C. Metal Production NO NO NO NO NO NO NO NO NO
D. Other Production
E. Production of Halocarbons and SF6
F. Consumption of Halocarbons and SF6
G. Other NO NO NO NO NO NO NO NO NO
3. Solvent and Other Product Use NA, NE NA, NE NA, NE NA, NE NA, NE NA, NE NA, NE NA, NE NA, NE
4. Agriculture 24.86 24.92 24.89 25.30 25.99 26.68 26.92 26.48 28.09
A. Enteric Fermentation
B. Manure Management 1.40 1.46 1.47 1.47 1.49 1.51 1.57 1.62 1.66
C. Rice Cultivation
D. Agricultural Soils 23.46 23.46 23.43 23.84 24.50 25.17 25.35 24.86 26.43
E. Prescribed Burning of Savannas NO NO NO NO NO NO NO NO NO
F. Field Burning of Agricultural Residues NO NO NO NO NO NO NO NO NO
G. Other NO NO NO NO NO NO NO NO NO
5. Land Use, Land-Use Change and Forestry 0.09 0.10 0.10 0.11 0.11 0.13 0.13 0.13 0.14
A. Forest Land 0.08 0.08 0.09 0.09 0.09 0.10 0.10 0.10 0.11
B. Cropland NA, NO NA, NO 0.00 0.01 0.01 0.01 0.02 0.02 0.02
C. Grassland NO NO NO NO NO NO NO NO NO
D. Wetlands 0.01 0.01 0.01 0.01 0.01 0.01 0.01 0.01 0.01
E. Settlements NE, NO NE, NO NE, NO NE, NO NE, NO NE, NO NE, NO NE, NO NE, NO
F. Other Land NE NE NE NE NE NE NE NE NE
G. Other NE NE NE NE NE NE NE NE NE
6. Waste 0.36 0.38 0.37 0.36 0.35 0.36 0.37 0.38 0.39
A. Solid Waste Disposal on Land
B. Waste-water Handling 0.36 0.37 0.37 0.36 0.35 0.35 0.37 0.38 0.39
C. Waste Incineration 0.00 0.00 0.00 0.00 0.00 0.00 0.00 0.00 0.00
D. Other NO NO NO NO NO NO NO NO NO
7. Other (as specified in the summary table in CRF) NA NA NA NA NA NA NA NA NA
Total N2O emissions including N2O from LULUCF 29.49 28.87 28.85 29.48 30.38 31.16 31.56 31.41 33.37
Total N2O emissions excluding N2O from LULUCF 29.39 28.77 28.75 29.37 30.27 31.03 31.43 31.28 33.24
Memo Items:
International Bunkers 0.04 0.04 0.03 0.05 0.04 0.05 0.05 0.06 0.06
Aviation 0.04 0.03 0.03 0.04 0.04 0.04 0.04 0.04 0.04
Marine 0.00 0.00 0.00 0.00 0.00 0.01 0.01 0.01 0.01
Multilateral Operations NO NO NO NO NO NO NO NO NO
CO2 Emissions from Biomass
Note: All footnotes for this table are given on sheet 3.
GREENHOUSE GAS SOURCE AND SINK CATEGORIES
259
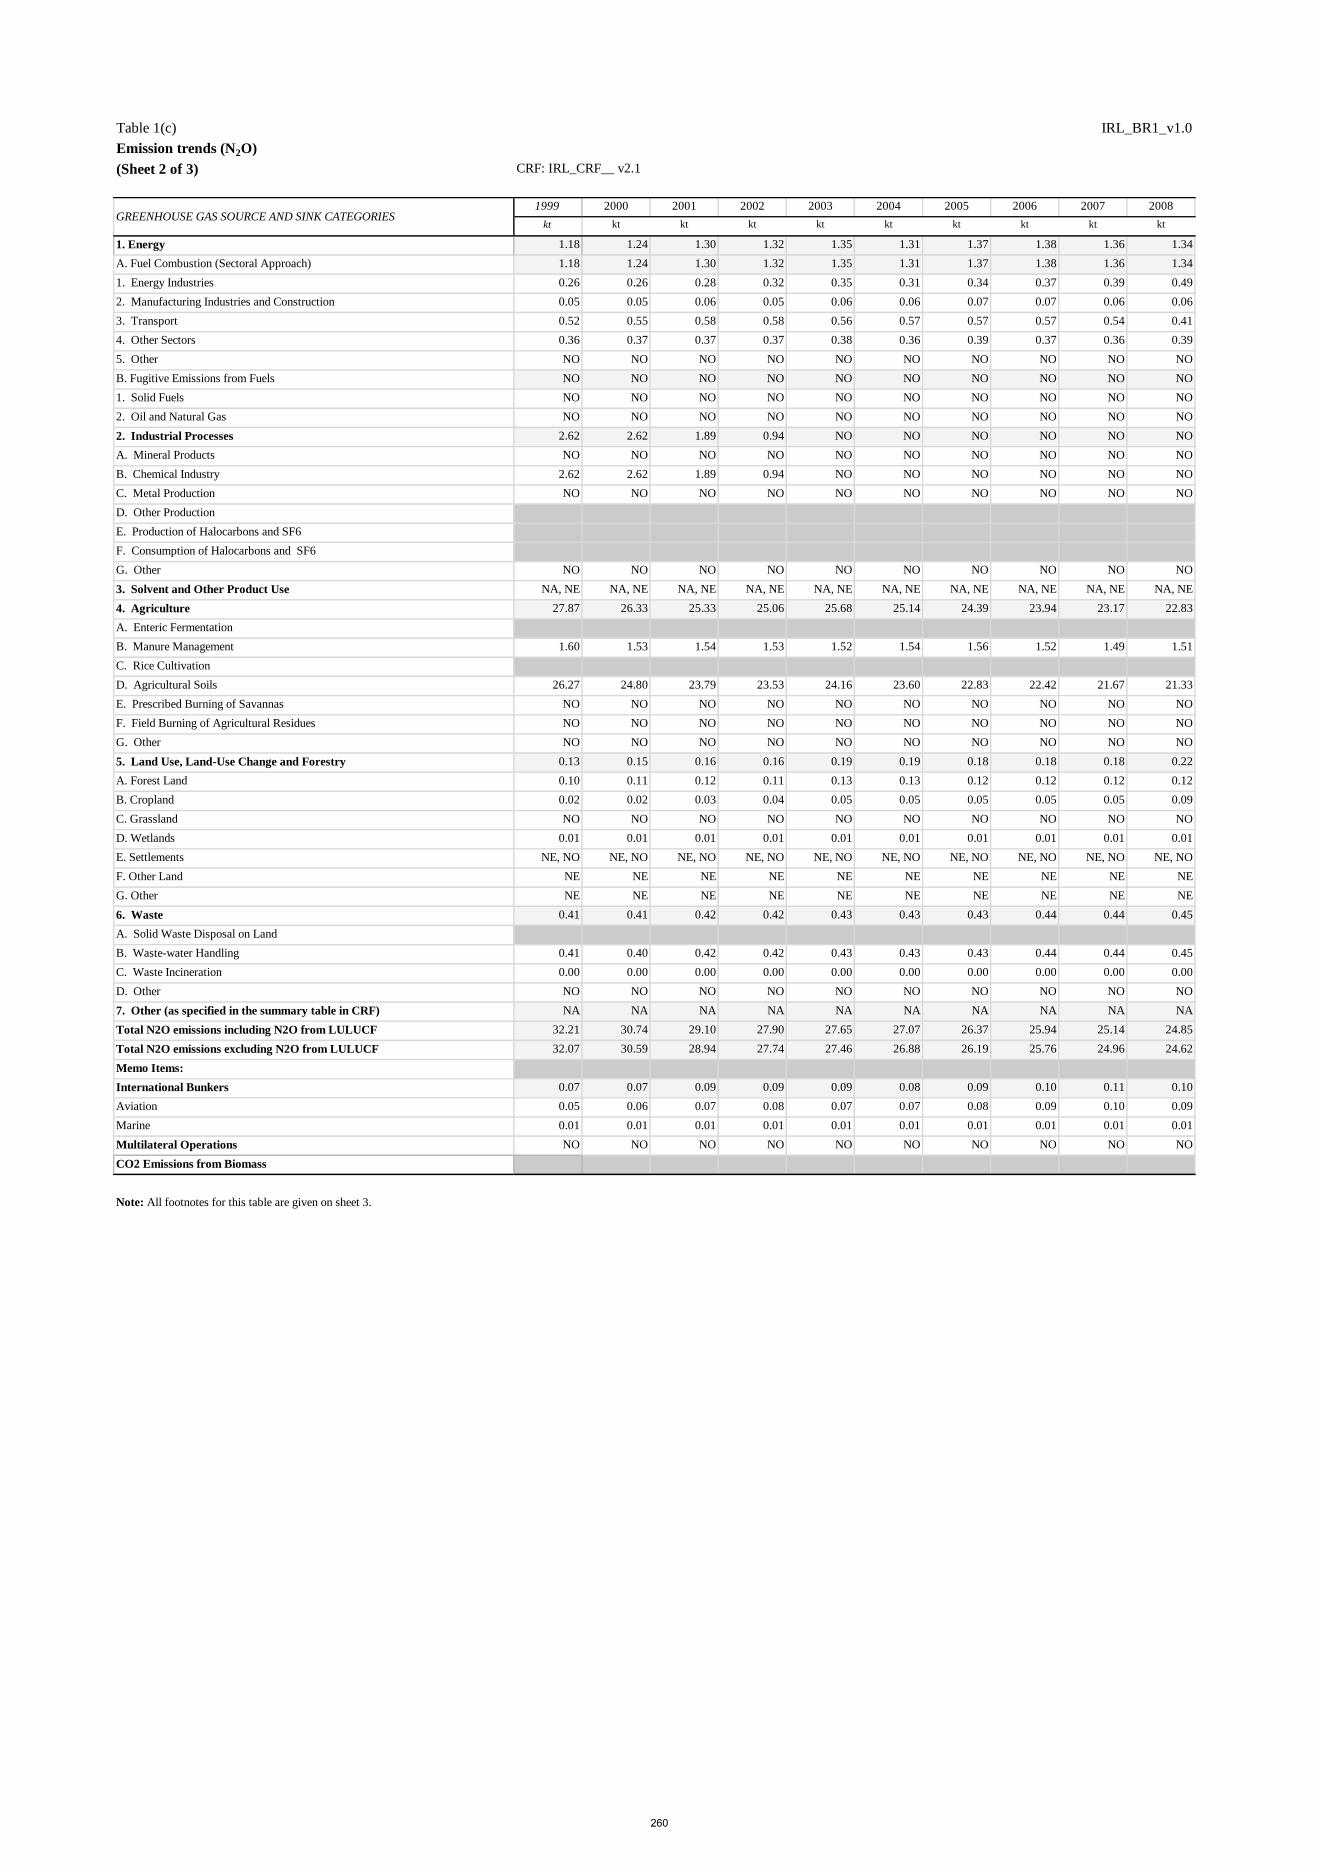
Table 1(c) IRL_BR1_v1.0
Emission trends (N2O) Source: Submission 2014 v2.1, IRELAND
(Sheet 2 of 3) CRF: IRL_CRF__ v2.1
1999 2000 2001 2002 2003 2004 2005 2006 2007 2008
kt kt kt kt kt kt kt kt kt kt
1. Energy 1.18 1.24 1.30 1.32 1.35 1.31 1.37 1.38 1.36 1.34
A. Fuel Combustion (Sectoral Approach) 1.18 1.24 1.30 1.32 1.35 1.31 1.37 1.38 1.36 1.34
1. Energy Industries 0.26 0.26 0.28 0.32 0.35 0.31 0.34 0.37 0.39 0.49
2. Manufacturing Industries and Construction 0.05 0.05 0.06 0.05 0.06 0.06 0.07 0.07 0.06 0.06
3. Transport 0.52 0.55 0.58 0.58 0.56 0.57 0.57 0.57 0.54 0.41
4. Other Sectors 0.36 0.37 0.37 0.37 0.38 0.36 0.39 0.37 0.36 0.39
5. Other NO NO NO NO NO NO NO NO NO NO
B. Fugitive Emissions from Fuels NO NO NO NO NO NO NO NO NO NO
1. Solid Fuels NO NO NO NO NO NO NO NO NO NO
2. Oil and Natural Gas NO NO NO NO NO NO NO NO NO NO
2. Industrial Processes 2.62 2.62 1.89 0.94 NO NO NO NO NO NO
A. Mineral Products NO NO NO NO NO NO NO NO NO NO
B. Chemical Industry 2.62 2.62 1.89 0.94 NO NO NO NO NO NO
C. Metal Production NO NO NO NO NO NO NO NO NO NO
D. Other Production
E. Production of Halocarbons and SF6
F. Consumption of Halocarbons and SF6
G. Other NO NO NO NO NO NO NO NO NO NO
3. Solvent and Other Product Use NA, NE NA, NE NA, NE NA, NE NA, NE NA, NE NA, NE NA, NE NA, NE NA, NE
4. Agriculture 27.87 26.33 25.33 25.06 25.68 25.14 24.39 23.94 23.17 22.83
A. Enteric Fermentation
B. Manure Management 1.60 1.53 1.54 1.53 1.52 1.54 1.56 1.52 1.49 1.51
C. Rice Cultivation
D. Agricultural Soils 26.27 24.80 23.79 23.53 24.16 23.60 22.83 22.42 21.67 21.33
E. Prescribed Burning of Savannas NO NO NO NO NO NO NO NO NO NO
F. Field Burning of Agricultural Residues NO NO NO NO NO NO NO NO NO NO
G. Other NO NO NO NO NO NO NO NO NO NO
5. Land Use, Land-Use Change and Forestry 0.13 0.15 0.16 0.16 0.19 0.19 0.18 0.18 0.18 0.22
A. Forest Land 0.10 0.11 0.12 0.11 0.13 0.13 0.12 0.12 0.12 0.12
B. Cropland 0.02 0.02 0.03 0.04 0.05 0.05 0.05 0.05 0.05 0.09
C. Grassland NO NO NO NO NO NO NO NO NO NO
D. Wetlands 0.01 0.01 0.01 0.01 0.01 0.01 0.01 0.01 0.01 0.01
E. Settlements NE, NO NE, NO NE, NO NE, NO NE, NO NE, NO NE, NO NE, NO NE, NO NE, NO
F. Other Land NE NE NE NE NE NE NE NE NE NE
G. Other NE NE NE NE NE NE NE NE NE NE
6. Waste 0.41 0.41 0.42 0.42 0.43 0.43 0.43 0.44 0.44 0.45
A. Solid Waste Disposal on Land
B. Waste-water Handling 0.41 0.40 0.42 0.42 0.43 0.43 0.43 0.44 0.44 0.45
C. Waste Incineration 0.00 0.00 0.00 0.00 0.00 0.00 0.00 0.00 0.00 0.00
D. Other NO NO NO NO NO NO NO NO NO NO
7. Other (as specified in the summary table in CRF) NA NA NA NA NA NA NA NA NA NA
Total N2O emissions including N2O from LULUCF 32.21 30.74 29.10 27.90 27.65 27.07 26.37 25.94 25.14 24.85
Total N2O emissions excluding N2O from LULUCF 32.07 30.59 28.94 27.74 27.46 26.88 26.19 25.76 24.96 24.62
Memo Items:
International Bunkers 0.07 0.07 0.09 0.09 0.09 0.08 0.09 0.10 0.11 0.10
Aviation 0.05 0.06 0.07 0.08 0.07 0.07 0.08 0.09 0.10 0.09
Marine 0.01 0.01 0.01 0.01 0.01 0.01 0.01 0.01 0.01 0.01
Multilateral Operations NO NO NO NO NO NO NO NO NO NO
CO2 Emissions from Biomass
Note: All footnotes for this table are given on sheet 3.
GREENHOUSE GAS SOURCE AND SINK CATEGORIES
260

Table 1(c) IRL_BR1_v1.0
Emission trends (N2O) Source: Submission 2014 v2.1, IRELAND
(Sheet 3 of 3) CRF: IRL_CRF__ v2.1
2009 2010 2011 Change from
base to latest
reported
year
kt kt kt %
1. Energy 1.24 1.23 1.15 38.63
A. Fuel Combustion (Sectoral Approach) 1.24 1.23 1.15 38.63
1. Energy Industries 0.47 0.49 0.45 86.04
2. Manufacturing Industries and Construction 0.05 0.05 0.05 10.25
3. Transport 0.39 0.36 0.36 76.49
4. Other Sectors 0.34 0.33 0.31 -12.48
5. Other NO NO NO 0.00
B. Fugitive Emissions from Fuels NO NO NO 0.00
1. Solid Fuels NO NO NO 0.00
2. Oil and Natural Gas NO NO NO 0.00
2. Industrial Processes NO NO NO -100.00
A. Mineral Products NO NO NO 0.00
B. Chemical Industry NO NO NO -100.00
C. Metal Production NO NO NO 0.00
D. Other Production
E. Production of Halocarbons and SF6
F. Consumption of Halocarbons and SF6
G. Other NO NO NO 0.00
3. Solvent and Other Product Use NA, NE NA, NE NA, NE 0.00
4. Agriculture 22.63 23.55 22.97 -7.59
A. Enteric Fermentation
B. Manure Management 1.50 1.44 1.41 0.56
C. Rice Cultivation
D. Agricultural Soils 21.14 22.11 21.56 -8.07
E. Prescribed Burning of Savannas NO NO NO 0.00
F. Field Burning of Agricultural Residues NO NO NO 0.00
G. Other NO NO NO 0.00
5. Land Use, Land-Use Change and Forestry 0.22 0.23 0.23 156.37
A. Forest Land 0.12 0.13 0.13 56.60
B. Cropland 0.09 0.09 0.10 100.00
C. Grassland NO NO NO 0.00
D. Wetlands 0.01 0.01 0.01 -28.55
E. Settlements NE, NO NE, NO NE, NO 0.00
F. Other Land NE NE NE 0.00
G. Other NE NE NE 0.00
6. Waste 0.46 0.46 0.46 26.07
A. Solid Waste Disposal on Land
B. Waste-water Handling 0.45 0.45 0.46 26.54
C. Waste Incineration 0.00 0.00 0.00 -34.60
D. Other NO NO NO 0.00
7. Other (as specified in the summary table in CRF) NA NA NA 0.00
Total N2O emissions including N2O from LULUCF 24.56 25.47 24.82 -15.83
Total N2O emissions excluding N2O from LULUCF 24.33 25.24 24.58 -16.36
Memo Items:
International Bunkers 0.08 0.09 0.08 105.67
Aviation 0.07 0.08 0.07 89.21
Marine 0.01 0.01 0.01 493.83
Multilateral Operations NO NO NO 0.00
CO2 Emissions from Biomass
Custom Footnotes
GREENHOUSE GAS SOURCE AND SINK CATEGORIES
Abbreviations : CRF = common reporting format, LULUCF = land use, land-use change and forestry.
a The column “Base year” should be filled in only by those Parties with economies in transition
that use a base year different from 1990 in accordance with the relevant decisions of the
Conference of the Parties. For these Parties, this different base year is used to calculate the
percentage change in the final column of this table.
261
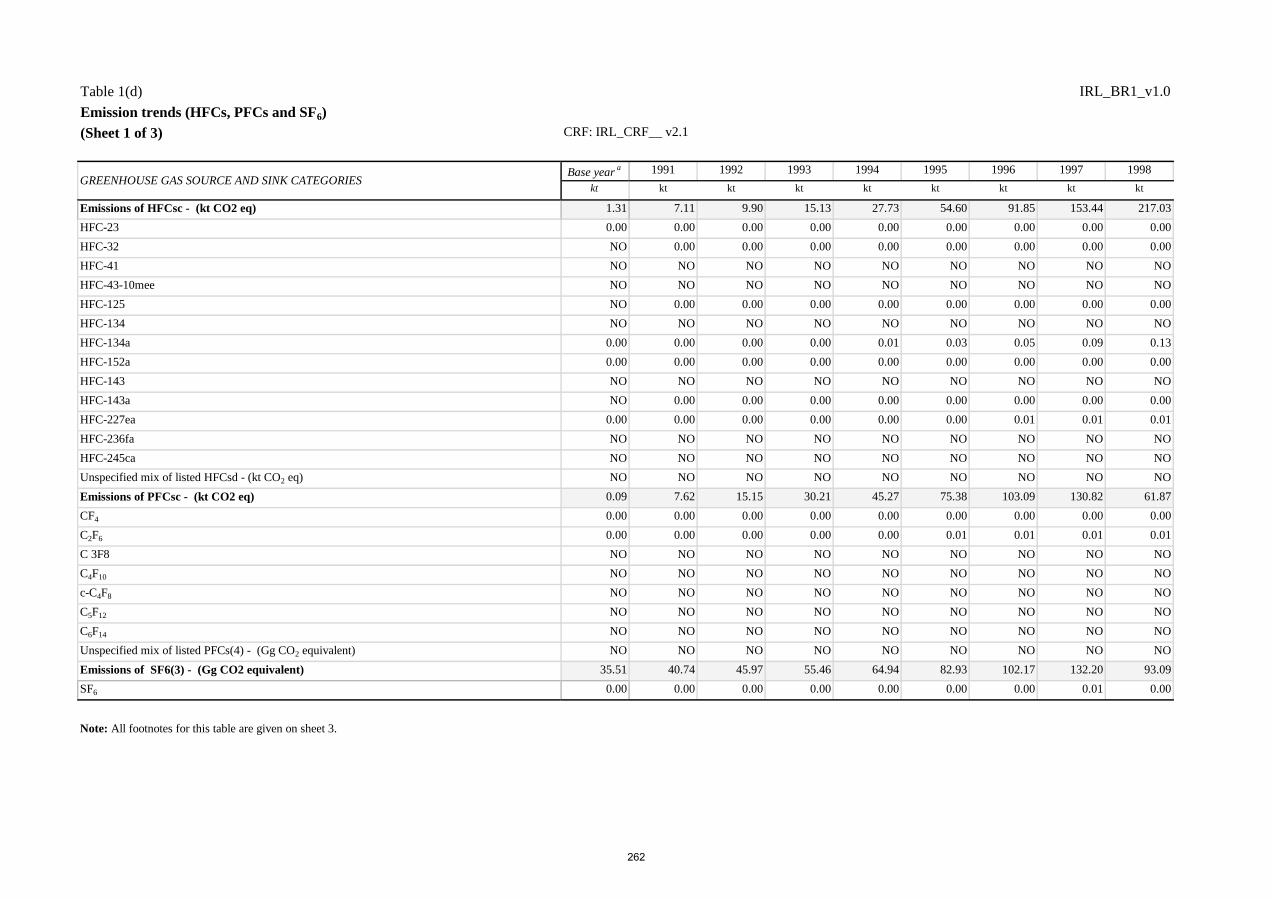
Table 1(d) IRL_BR1_v1.0
Emission trends (HFCs, PFCs and SF6) Source: Submission 2014 v2.1, IRELAND
(Sheet 1 of 3) CRF: IRL_CRF__ v2.1
Base yeara 1991 1992 1993 1994 1995 1996 1997 1998
kt kt kt kt kt kt kt kt kt
Emissions of HFCsc - (kt CO2 eq) 1.31 7.11 9.90 15.13 27.73 54.60 91.85 153.44 217.03
HFC-23 0.00 0.00 0.00 0.00 0.00 0.00 0.00 0.00 0.00
HFC-32 NO 0.00 0.00 0.00 0.00 0.00 0.00 0.00 0.00
HFC-41 NO NO NO NO NO NO NO NO NO
HFC-43-10mee NO NO NO NO NO NO NO NO NO
HFC-125 NO 0.00 0.00 0.00 0.00 0.00 0.00 0.00 0.00
HFC-134 NO NO NO NO NO NO NO NO NO
HFC-134a 0.00 0.00 0.00 0.00 0.01 0.03 0.05 0.09 0.13
HFC-152a 0.00 0.00 0.00 0.00 0.00 0.00 0.00 0.00 0.00
HFC-143 NO NO NO NO NO NO NO NO NO
HFC-143a NO 0.00 0.00 0.00 0.00 0.00 0.00 0.00 0.00
HFC-227ea 0.00 0.00 0.00 0.00 0.00 0.00 0.01 0.01 0.01
HFC-236fa NO NO NO NO NO NO NO NO NO
HFC-245ca NO NO NO NO NO NO NO NO NO
Unspecified mix of listed HFCsd - (kt CO2 eq) NO NO NO NO NO NO NO NO NO
Emissions of PFCsc - (kt CO2 eq) 0.09 7.62 15.15 30.21 45.27 75.38 103.09 130.82 61.87
CF4 0.00 0.00 0.00 0.00 0.00 0.00 0.00 0.00 0.00
C2F6 0.00 0.00 0.00 0.00 0.00 0.01 0.01 0.01 0.01
C 3F8 NO NO NO NO NO NO NO NO NO
C4F10 NO NO NO NO NO NO NO NO NO
c-C4F8 NO NO NO NO NO NO NO NO NO
C5F12 NO NO NO NO NO NO NO NO NO
C6F14 NO NO NO NO NO NO NO NO NO
Unspecified mix of listed PFCs(4) - (Gg CO2 equivalent) NO NO NO NO NO NO NO NO NO
Emissions of SF6(3) - (Gg CO2 equivalent) 35.51 40.74 45.97 55.46 64.94 82.93 102.17 132.20 93.09
SF6 0.00 0.00 0.00 0.00 0.00 0.00 0.00 0.01 0.00
Note: All footnotes for this table are given on sheet 3.
GREENHOUSE GAS SOURCE AND SINK CATEGORIES
262

Table 1(d) IRL_BR1_v1.0
Emission trends (HFCs, PFCs and SF6) Source: Submission 2014 v2.1, IRELAND
(Sheet 2 of 3) CRF: IRL_CRF__ v2.1
1999 2000 2001 2002 2003 2004 2005 2006 2007 2008
kt kt kt kt kt kt kt kt kt kt
Emissions of HFCsc - (kt CO2 eq) 223.94 259.81 279.85 309.24 382.20 416.04 475.81 548.66 535.67 566.66
HFC-23 0.00 0.00 0.00 0.00 0.00 0.00 0.00 0.00 0.00 0.00
HFC-32 0.00 0.00 0.00 0.00 0.00 0.00 0.00 0.01 0.00 0.01
HFC-41 NO NO NO NO NO NO NO NO NO NO
HFC-43-10mee NO NO NO NO NO NO NO NO NO NO
HFC-125 0.01 0.01 0.01 0.01 0.01 0.02 0.02 0.03 0.02 0.02
HFC-134 NO NO NO NO NO NO NO NO NO NO
HFC-134a 0.12 0.14 0.15 0.17 0.20 0.20 0.24 0.26 0.25 0.28
HFC-152a 0.00 0.00 0.00 0.00 0.00 0.00 0.00 0.00 0.00 0.00
HFC-143 NO NO NO NO NO NO NO NO NO NO
HFC-143a 0.00 0.00 0.01 0.01 0.01 0.02 0.02 0.02 0.02 0.02
HFC-227ea 0.01 0.01 0.01 0.01 0.01 0.01 0.01 0.01 0.01 0.02
HFC-236fa NO NO NO NO NO NO NO NO NO NO
HFC-245ca NO NO NO NO NO NO NO NO NO NO
Unspecified mix of listed HFCsd - (kt CO2 eq) NO NO NO NO NO NO NO NO NO NO
Emissions of PFCsc - (kt CO2 eq) 195.93 305.41 295.98 212.40 228.79 182.43 168.34 148.32 130.58 106.20
CF4 0.00 0.01 0.01 0.01 0.01 0.01 0.01 0.00 0.00 0.00
C2F6 0.02 0.03 0.03 0.02 0.02 0.02 0.01 0.01 0.01 0.01
C 3F8 NO NO NO NO NO NO NO NO NO NO
C4F10 NO NO NO NO NO NO NO NO NO NO
c-C4F8 NO NO NO 0.00 0.00 0.00 0.00 0.00 0.00 0.00
C5F12 NO NO NO NO NO NO NO NO NO NO
C6F14 NO NO NO NO NO NO NO NO NO NO
Unspecified mix of listed PFCs(4) - (Gg CO2 equivalent) NO NO NO NO NO NO NO NO NO NO
Emissions of SF6(3) - (Gg CO2 equivalent) 67.38 54.35 67.84 67.73 115.43 68.65 101.63 62.90 65.52 56.68
SF6 0.00 0.00 0.00 0.00 0.00 0.00 0.00 0.00 0.00 0.00
Note: All footnotes for this table are given on sheet 3.
GREENHOUSE GAS SOURCE AND SINK CATEGORIES
263
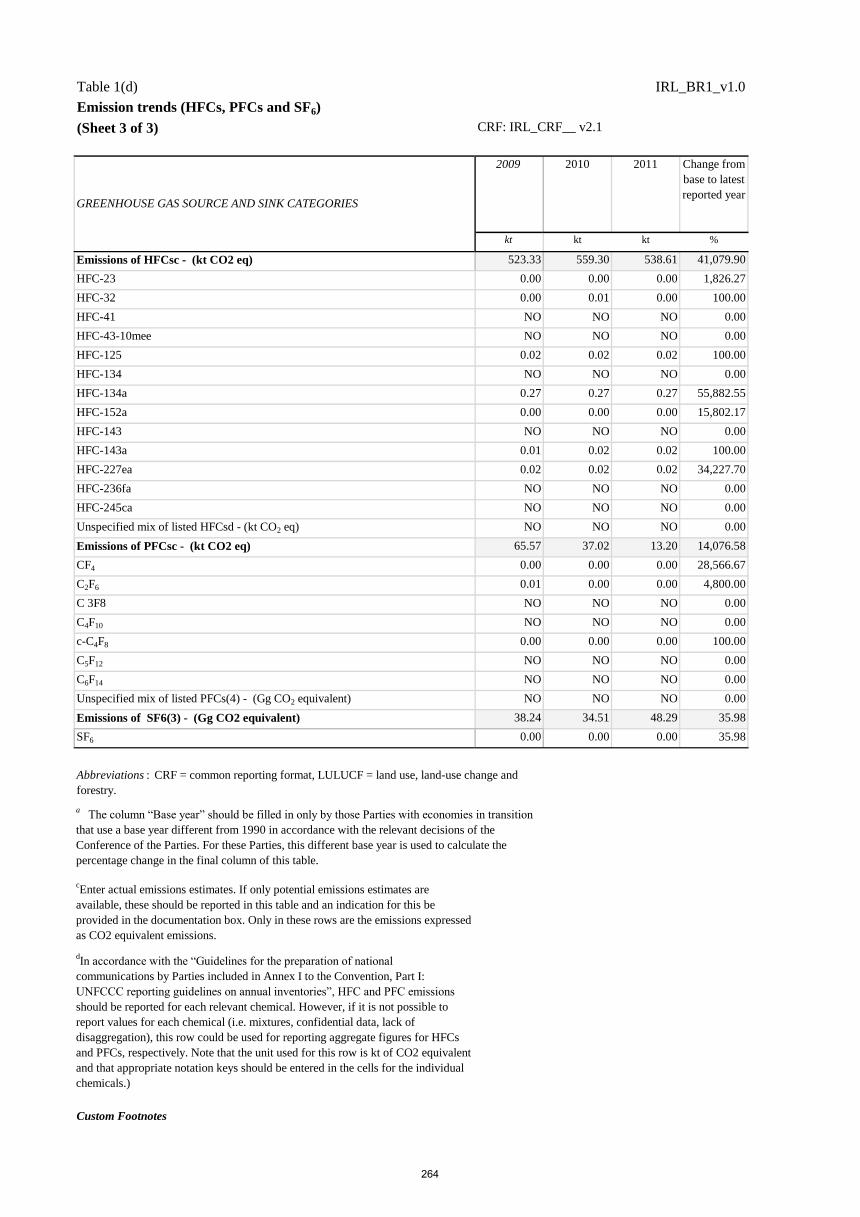
Table 1(d) IRL_BR1_v1.0
Emission trends (HFCs, PFCs and SF6) Source: Submission 2014 v2.1, IRELAND
(Sheet 3 of 3) CRF: IRL_CRF__ v2.1
2009 2010 2011 Change from
base to latest
reported year
kt kt kt %
Emissions of HFCsc - (kt CO2 eq) 523.33 559.30 538.61 41,079.90
HFC-23 0.00 0.00 0.00 1,826.27
HFC-32 0.00 0.01 0.00 100.00
HFC-41 NO NO NO 0.00
HFC-43-10mee NO NO NO 0.00
HFC-125 0.02 0.02 0.02 100.00
HFC-134 NO NO NO 0.00
HFC-134a 0.27 0.27 0.27 55,882.55
HFC-152a 0.00 0.00 0.00 15,802.17
HFC-143 NO NO NO 0.00
HFC-143a 0.01 0.02 0.02 100.00
HFC-227ea 0.02 0.02 0.02 34,227.70
HFC-236fa NO NO NO 0.00
HFC-245ca NO NO NO 0.00
Unspecified mix of listed HFCsd - (kt CO2 eq) NO NO NO 0.00
Emissions of PFCsc - (kt CO2 eq) 65.57 37.02 13.20 14,076.58
CF4 0.00 0.00 0.00 28,566.67
C2F6 0.01 0.00 0.00 4,800.00
C 3F8 NO NO NO 0.00
C4F10 NO NO NO 0.00
c-C4F8 0.00 0.00 0.00 100.00
C5F12 NO NO NO 0.00
C6F14 NO NO NO 0.00
Unspecified mix of listed PFCs(4) - (Gg CO2 equivalent) NO NO NO 0.00
Emissions of SF6(3) - (Gg CO2 equivalent) 38.24 34.51 48.29 35.98
SF6 0.00 0.00 0.00 35.98
cEnter actual emissions estimates. If only potential emissions estimates are
available, these should be reported in this table and an indication for this be
provided in the documentation box. Only in these rows are the emissions expressed
as CO2 equivalent emissions.
dIn accordance with the “Guidelines for the preparation of national
communications by Parties included in Annex I to the Convention, Part I:
UNFCCC reporting guidelines on annual inventories”, HFC and PFC emissions
should be reported for each relevant chemical. However, if it is not possible to
report values for each chemical (i.e. mixtures, confidential data, lack of
disaggregation), this row could be used for reporting aggregate figures for HFCs
and PFCs, respectively. Note that the unit used for this row is kt of CO2 equivalent
and that appropriate notation keys should be entered in the cells for the individual
chemicals.)
Custom Footnotes
GREENHOUSE GAS SOURCE AND SINK CATEGORIES
Abbreviations : CRF = common reporting format, LULUCF = land use, land-use change and
forestry.
a The column “Base year” should be filled in only by those Parties with economies in transition
that use a base year different from 1990 in accordance with the relevant decisions of the
Conference of the Parties. For these Parties, this different base year is used to calculate the
percentage change in the final column of this table.
264

Table 2(a) IRL_BR1_v1.0
Description of quantified economy-wide emission reduction target: base yeara
Party
Base year /base period
% of base year/base period % of 1990 b
20.00 20.00
Period for reaching target
b Optional.
Ireland
1990
BY-2020
a Reporting by a developed country Party on the information specified in the common tabular format does not prejudge the position of other Parties with regard to the
treatment of units from market-based mechanisms under the Convention or other market-based mechanisms towards achievement of quantified economy-wide emission
reduction targets.
Emission reduction target
265
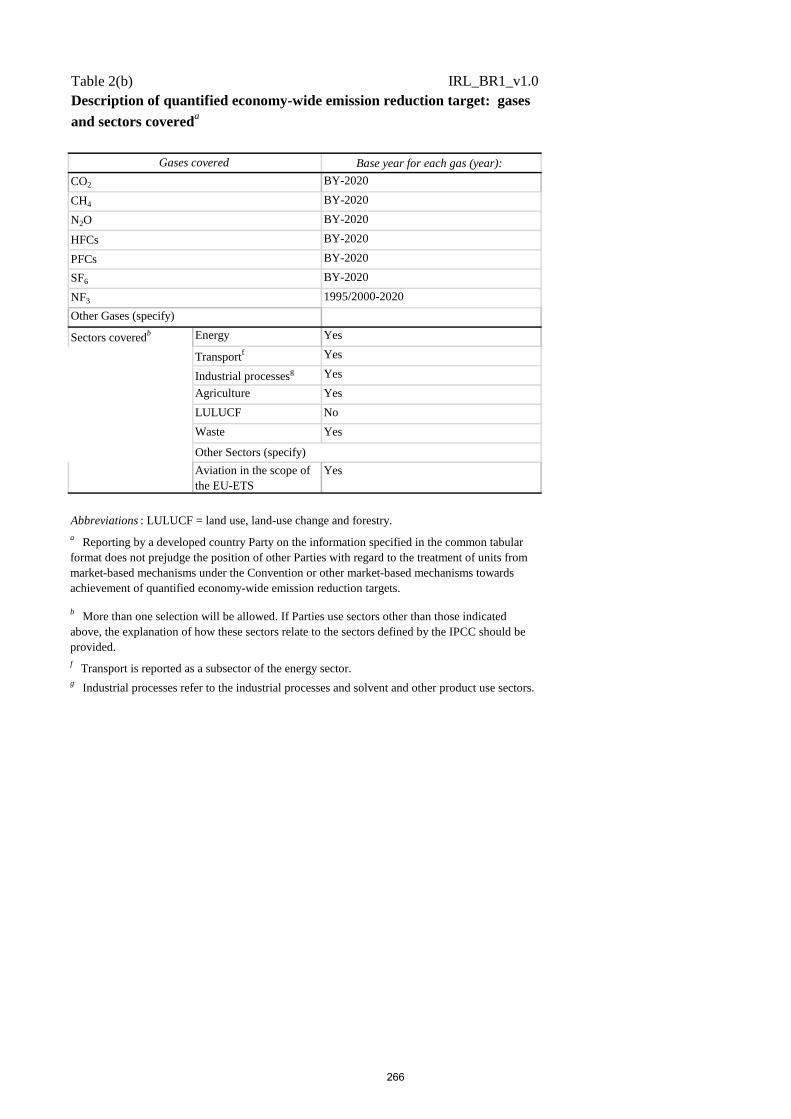
Table 2(b) IRL_BR1_v1.0
Base year for each gas (year):
BY-2020
BY-2020
BY-2020
BY-2020
BY-2020
BY-2020
1995/2000-2020
Energy Yes
Transportf Yes
Industrial processesg Yes
Agriculture Yes
LULUCF No
Waste Yes
Aviation in the scope of
the EU-ETS
Yes
Abbreviations : LULUCF = land use, land-use change and forestry.
Description of quantified economy-wide emission reduction target: gases
and sectors covereda
Gases covered
CO2
CH4
N2O
HFCs
PFCs
SF6
NF3
Other Sectors (specify)
Other Gases (specify)
Sectors coveredb
b More than one selection will be allowed. If Parties use sectors other than those indicated
above, the explanation of how these sectors relate to the sectors defined by the IPCC should be
provided.
g Industrial processes refer to the industrial processes and solvent and other product use sectors.
a Reporting by a developed country Party on the information specified in the common tabular
format does not prejudge the position of other Parties with regard to the treatment of units from
market-based mechanisms under the Convention or other market-based mechanisms towards
achievement of quantified economy-wide emission reduction targets.
f Transport is reported as a subsector of the energy sector.
266

Table 2(c) IRL_BR1_v1.0
Gases GWP values b
CO2 2nd AR
CH4 2nd AR
N2O 2nd AR
HFCs 2nd AR
PFCs 2nd AR
SF6 2nd AR
NF3 2nd AR
Abbreviations : GWP = global warming potential
Description of quantified economy-wide emission reduction target: global
warming potential values (GWP)a
a Reporting by a developed country Party on the information specified in the common tabular format
does not prejudge the position of other Parties with regard to the treatment of units from market-based
mechanisms under the Convention or other market-based mechanisms towards achievement of
quantified economy-wide emission reduction targets.b
Please specify the reference for the GWP: Second Assessment Report of the Intergovernmental
Panel on Climate Change (IPCC) or the Fourth Assessment Report of the IPCC.
Other Gases (specify)
267

Table 2(d) IRL_BR1_v1.0
Role of LULUCF LULUCF in base year level and target Excluded
Contribution of LULUCF is calculated using
Abbreviation : LULUCF = land use, land-use change and forestry.
a Reporting by a developed country Party on the information specified in the common tabular format does not prejudge the position of other Parties with regard to the
treatment of units from market-based mechanisms under the Convention or other market-based mechanisms towards achievement of quantified economy-wide emission
reduction targets.
Description of quantified economy-wide emission reduction target: approach to counting emissions and removals from the LULUCF
sectora
268

Table 2(e)I IRL_BR1_v1.0
Market-based mechanisms Possible scale of contributions
under the Convention (estimated kt CO 2 eq)
CERs 0.00
ERUs 0.00
AAUsi 0.00
Carry-over unitsj 0.00
Abbreviations : AAU = assigned amount unit, CER = certified emission reduction, ERU = emission reduction unit.
i AAUs issued to or purchased by a Party.
j Units carried over from the first to the second commitment periods of the Kyoto Protocol, as described in decision 13/CMP.1
and consistent with decision 1/CMP.8.
a Reporting by a developed country Party on the information specified in the common tabular format does not prejudge the
position of other Parties with regard to the treatment of units from market-based mechanisms under the Convention or other
market-based mechanisms towards achievement of quantified economy-wide emission reduction targets.
d As indicated in paragraph 5(e) of the guidelines contained in annex I of decision 2/CP.17 .
Description of quantified economy-wide emission reduction target: market-based mechanisms
under the Conventiona
Other mechanism units under the Convention (specify)d
269

Table 2(e)II IRL_BR1_v1.0
Other market-based mechanisms Possible scale of contributions
(Specify) (estimated kt CO 2 eq)
a Reporting by a developed country Party on the information specified in the common tabular format does not prejudge the position of
other Parties with regard to the treatment of units from market-based mechanisms under the Convention or other market-based
mechanisms towards achievement of quantified economy-wide emission reduction targets.
Description of quantified economy-wide emission reduction target: other market-based mechanismsa
270

Table 2(f) IRL_BR1_v1.0
Description of quantified economy-wide emission reduction target: any other informationa,b
Custom Footnotes
In December 2009, the European Council reiterated the conditional offer of the EU to move to a 30% reduction by 2020 compared to 1990 levels as part of a global and comprehensive agreement
for the period beyond 2012, provided that other developed countries commit themselves to comparable emission reductions and that developing countries contribute adequately according to their
responsibilities and respective capabilities.
a Reporting by a developed country Party on the information specified in the common tabular format does not prejudge the position of other Parties with regard to the treatment of units from
market-based mechanisms under the Convention or other market-based mechanisms towards achievement of quantified economy-wide emission reduction targets.
b This information could include information on the domestic legal status of the target or the total assigned amount of emission units for the period for reaching a target. Some of this information is
presented in the narrative part of the biennial report.
271

Table 3 IRL_BR1_v1.0
Progress in achievement of the quantified economy-wide emission reduction target: information on mitigation actions and their effects
Electricity generation
efficiency
improvements*
Energy CH4, CO2, N2O Achieve 20%
improvement in
energy efficiency by
2020 in line with
commitments made in
the Energy White
Paper (2007) and the
EU Energy Efficiency
Action Plan. In
addition, meet the
requirements of the
Energy End-Use
Efficiency and Energy
Services Directive ie
acheive energy
efficiency savings of
9% by 2016.
Fiscal Implemented Through the development and use of CHP and
other more efficient electricity generation
methods the efficiency of electricity generation
is increased
2008 Department of
Communications,
Energy and National
Resources
966.10
24 % Renewables
penetration in electricity
generation in 2020*
Energy CH4, CO2, N2O Renewable energy
will contribute 23% of
gross electricty
consumption (total
electricty generated
plus net imports) in
2020
Economic Implemented Renewable energy will contribute 23% of gross
electricity consumption in 2020 on the basis of
the what already has been sanctioned for the
Renewable Electricity Feed in Tarrif (REFIT).
REFIT is designed to provide price certainty to
renewable electricity generators. It has been in
operation for wind and hydro power since 2006.
2006 Department of
Communications,
Energy and National
Resources
1,487.30
Reduced electricity
demand from energy
efficiency measures
Energy CH4, CO2, N2O Electricity savings
from measures in the
Industry, Services,
Residential, Transport
sectors
Economic|Fiscal|
Regulatory
Planned This is the sum of electricty savings associated
with the additional policies and measures that
are included in the WAM scenario
Department of
Communications,
Energy and National
Resources, Sustainable
Energy Authority of
Ireland
451.12
40% renewables in
electricity generation by
2020
Energy CH4, CO2, N2O Renewable energy
will contribute 40% of
gross electricty
consumption (total
electricty generated
plus net imports) in
2020
Fiscal Planned 40% RES-E is the target set in the Irish
Governments Energy White Paper of 2007 and
compliments the Renewable Energy Directive
(28/EC/2009). It forms part of Ireland's overall
commitment of 16% RES by 2020 as required
under 28/EC/2009. The Renewable Energy Feed-
In Tarrif (REFIT) is the main policy instrument
used to support the expansion of renewable
electricity capacity. REFIT is designed to
provide price certainty to renewable electricity
generators.
Department of
Communications,
Energy and National
Resources, Commission
for Energy Regulation
785.15
Brief descriptione Start year of
implementation
Implementing entity or
entitiesName of mitigation action
a
Estimate of mitigation impact (not
cumulative, in kt CO 2 eq)Objective and/or
activity affected
Type of
instrumentc
Status of
implementationd
Sector(s)
affectedb
GHG(s)
affected
272

Table 3 IRL_BR1_v1.0
Progress in achievement of the quantified economy-wide emission reduction target: information on mitigation actions and their effects
Brief descriptione Start year of
implementation
Implementing entity or
entitiesName of mitigation action
a
Estimate of mitigation impact (not
cumulative, in kt CO 2 eq)Objective and/or
activity affected
Type of
instrumentc
Status of
implementationd
Sector(s)
affectedb
GHG(s)
affected
Electric vehicle
deployment*
Energy, Transport CH4, CO2, N2O The objective of this
measure is that
electric vehicles make
up 10% of the
transport fleet by
2020.
Fiscal Adopted A 10% replacement of the private passenger car
fleet with electric vehicles is targeted for 2020.
Information campaigns, installation of charging
infrastructure and grant aid will be provided to
incentivise the purchase of electric vehicles.
2011 Department of
Communications,
Energy and National
Resources
180.36
VRT and Motor Tax
changes*
Transport CH4, CO2, N2O Motor tax (annual
circulation tax) and
VRT for new
passenger cars linked
to CO2 emissions
Fiscal Implemented This measure is a fundamental change in the
VRT and annual motor tax regime, whereby
vehicles are taxed on the basis of their CO2
emission levels. Seven bands, ranging from A-,
of specific CO2 emissions are defined and all
new cars are categorised within these bands.
VRT and annual motor tax are then applied
according to the cars specific CO2 emission
categorisation.
2008 Department of Finance 172.37
Improved fuel economy
of private cars*
Transport CH4, CO2, N2O Increasing efficiency
of the vehicle fleet
through the ACEA
Agreement
Voluntary
Agreement
Implemented The agreement defines fleet-average CO2
emission targets from new cars sold in the
European Union, to be reached collectively by
the members of the European Automobiles
Manfacturers Association
2009 European Commission 790.28
Aviation efficiency
improvements*
Transport, Other
(Aviation in the
scope of the EU-
ETS)
CH4, CO2, N2O Increase the
efficiency of fuel use
in aviation. IATA
airlines have adopted
a voluntary fuel
efficiency goal. This
is to reduce fuel
consumption and CO2
emissions (per
revenue tonne
kilometer) by at least
25% by 2020,
compared to 2005
levels
Voluntary
Agreement
Implemented New aircraft are 70% more fuel efficient than
40 years ago and 20% better than 10 years ago.
Airlines are aiming for a further 25% fuel
efficiency improvement by 2020. Through
gradually incorporating advanced technology
into their fleets, airlines have made impressive
fuel efficiency improvements.
2008 Irish Aviation Authority
and UK National Air
Traffic Services
66.29
273

Table 3 IRL_BR1_v1.0
Progress in achievement of the quantified economy-wide emission reduction target: information on mitigation actions and their effects
Brief descriptione Start year of
implementation
Implementing entity or
entitiesName of mitigation action
a
Estimate of mitigation impact (not
cumulative, in kt CO 2 eq)Objective and/or
activity affected
Type of
instrumentc
Status of
implementationd
Sector(s)
affectedb
GHG(s)
affected
Public transport
efficiency improvements
Transport CH4, CO2, N2O The objective of this
measure is to radically
improve the level,
accessibility and
quality of rail and bus
services throughout
the country and in
urban transport
services both by bus,
light rail, suburban
rail and metro.
Voluntary
Agreement
Planned The semi-state CIE group of public transport
companies have and are implementing a range
of programs aimed at improving energy
efficiency including eco-driving within the bus
fleet; reduced fuel use in rail through more
efficient schedules and automatic train engine
shutdowns and; a switch to lower voltage supply
and regenerative breaking technologies in the
electric train fleet.
Irish Rail, Bus Eireann,
Dublin Bus
41.43
More efficient traffic
movements
Transport CH4, CO2, N2O Enable more fuel-
efficient, inter-urban
freight and private car
movements through
improved road
infrastructure.
Other (Education) Planned Motorways and other high-quality road
infrastructure allow long-distance inter-urban
vehicle movements to take place in a more fuel
efficient manner. As vehicles can maintain
higher gears and therefore lower revolutions for
prolonged periods, with less need for braking/re-
acceleration, fuel economy is maximised. This
is particularly the case for heavy goods vehicles.
Department of the
Environment,
Community and Local
Government and
Department of
Transport
186.82
Renewables penetration
in Transport
Transport CH4, CO2, N2O Renewables
penetration to
increase from 3% in
2020 under WEM to
10% under WAM by
2020
Regulatory Adopted Renewables penetration in transport to increase
to 10% of consumption as laid out in the Energy
White Paper of 2007. The Biofuels Obligation
Act of 2010 and the rollout of electric vehicles
support measures, in aid of achievemnt of 10%
of road vehicles to be electric by 2020, drive
renewable energy in transport. The Biofule
Obligation Act is designed so it can adjusted
upward as required to meet the overall RES-T
target.
2010 Department of
Communications,
Energy and National
Resources
797.46
2002 Building
Regulations*
Energy CH4, CO2, N2O To improve the
energy performance
of residential
buildings
Regulatory Implemented A building shall be so designed and constructed
as to secure, as far as is reasonably practicable,
the conservation of fuel and energy
2003 Department of
Environment,
Community and Local
Government
303.73
2008 Building
Regulations*
Energy CH4, CO2, N2O 40% improvement on
energy performance
of residential
buildings relative to
current building
regulations
Regulatory Implemented A building shall be designed and constructed so
as to ensure that the energy performance of the
building is such as to limit the amount of energy
required for the operation of the building and
the amount of CO2 emissions associated with
this energy use insofar as is reasonably
practicable.
2008 Department of
Environment,
Community and Local
Government
322.39
274

Table 3 IRL_BR1_v1.0
Progress in achievement of the quantified economy-wide emission reduction target: information on mitigation actions and their effects
Brief descriptione Start year of
implementation
Implementing entity or
entitiesName of mitigation action
a
Estimate of mitigation impact (not
cumulative, in kt CO 2 eq)Objective and/or
activity affected
Type of
instrumentc
Status of
implementationd
Sector(s)
affectedb
GHG(s)
affected
Efficient Boiler
Standard*
Energy CH4, CO2, N2O To improve the
efficiency of
residential boilers.
Regulatory Implemented To promote the use of high efficiency boilers,
reduce heating costs, greenhouse gas emissions
and increase comfort levels.
2008 Department of
Environment,
Community and Local
Government
285.06
Greener Homes
Scheme*
Energy CH4, CO2, N2O The Greener Homes
Scheme provides
assistance to
homeowners who
intend to purchase a
new renewable energy
heating system for
existing homes
Economic Implemented The Greener Homes Scheme aims to increase
the use of renewable energy and sustainable
energy technologies in Irish homes.
2006 Sustainable Energy
Authority of Ireland
24.91
Warmer Homes
Scheme*
Energy CH4, CO2, N2O The purpose of the
Low Income Housing
Programme is to assist
with the establishment
of a national plan of
action to address fuel
poverty in low-income
households.
Voluntary
Agreement
Implemented This scheme aims to improve the energy
efficiency and comfort conditions of homes
occupied by low-income households, and to
establish the systems and growing the capacity
in Ireland to install such measures.
2000 Sustainable Energy
Authority of Ireland
31.17
Home Energy Savings
Scheme*
Energy CH4, CO2, N2O Improve energy
efficiency in
households.
Voluntary
Agreement
Implemented The Home Energy Saving (HES) scheme
provides assistance to homeowners who are
interested in improving the energy efficiency of
their home in order to reduce energy use and
costs as well as greenhouse gas emissions.
2008 Sustainable Energy
Authority of Ireland
84.33
2011 Building
Regulations
Energy CH4, CO2, N2O 60% improvement of
residential buildings
relative to current
building regulations.
Regulatory Planned A building shall be designed and constructed so
as to ensure that the energy performance of the
building is such as to limit the amount of energy
required for the operation of the building and
the amount of CO2 emissions associated with
this energy use insofar as is reasonably
practicable.
2011 Department of
Environment,
Community and Local
Government
135.59
Nearly Zero Energy
Dwellings
Energy CH4, CO2, N2O 70% improvement of
residential buildings
relative to current
building regulations.
Economic Planned The aim of the Low Carbon Homes programme
is to accelerate improvements in the quality of
energy features in Irish housing.
2016 Department of
Environment,
Community and Local
Government
43.01
Retrofit Scheme (Better
Energy Homes)
Energy CH4, CO2, N2O Energy efficiency
improvements in
existing residential
buildings
Economic Planned Retrofit aims to deliver a major increase in the
scale and depth of energy efficiency investments
in upgrading existing residential buildings.
2011 Sustainable Energy
Authority of Ireland
1,384.66
275

Table 3 IRL_BR1_v1.0
Progress in achievement of the quantified economy-wide emission reduction target: information on mitigation actions and their effects
Brief descriptione Start year of
implementation
Implementing entity or
entitiesName of mitigation action
a
Estimate of mitigation impact (not
cumulative, in kt CO 2 eq)Objective and/or
activity affected
Type of
instrumentc
Status of
implementationd
Sector(s)
affectedb
GHG(s)
affected
Renewables penetration
in the residential sector
Energy CH4, CO2, N2O To increase the use of
renewable energy in
the residential sector
Regulatory Planned 12% of thermal energy requirements to come
from renewable energy by 2020 - displacing oil
and gas use in the residential sector.
2012 Department of
Communications,
Energy and National
Resources
33.08
2005 Building
Regulations*
Energy CH4, CO2, N2O To improve the
energy efficiency of
new buildings from
2005 onwards
Regulatory Implemented A building shall be designed and constructed so
as to ensure that the energy performance of the
building is such as to limit the amount of energy
required for the operation of the buidling and
the amount of CO2 emissions associated with its
energy use as is reasonably practicable
2005 Department of
Environment,
Community and Local
Government
72.22
SEAI Small Business
Support Scheme*
Energy CH4, CO2, N2O To promote reduced
energy use in small
businesses.
Education Implemented Assessment of energy use in small businesses
and development of measures that can be
employed to reduce costs.
2008 Sustainable Energy
Authority of Ireland
74.34
SEEP & EERF (public
sector)*
Energy CH4, CO2, N2O Supports for
Exemplar Energy
Efficiency Projects
(SEEEP) and Energy
Efficiency Retrofit
Fund (EERF)
Economic Implemented Grant aid provided energy efficiency projects
that will achieve significant energy savings and
will create demand for labour-intensive services
during implementation. Measurable and
verifiable energy efficiency impacts in pursuit of
national targets.
2009 Department of
Communications,
Energy and National
Resources
12.35
Accelerated Capital
Allowance (private
sector/services)*
Energy CH4, CO2, N2O The Accelerated
Capital Allowance is a
tax incentive
introduced by the
Government in the
Finance Act, 2008 , to
encourage companies
to buy energy-
efficient equipment.
Fiscal Implemented The ACA is a tax incentive for companies
paying corporation tax and aims to encourage
investment in energy efficient equipment. The
ACA offers an attractive incentive whereby it
allows companies to write off 100% of the
purchase value of qualifying energy efficient
equipment against their profit in the year of
purchase.
2008 Department of Finance,
Office of The Revenue
Comissioners
4.14
276
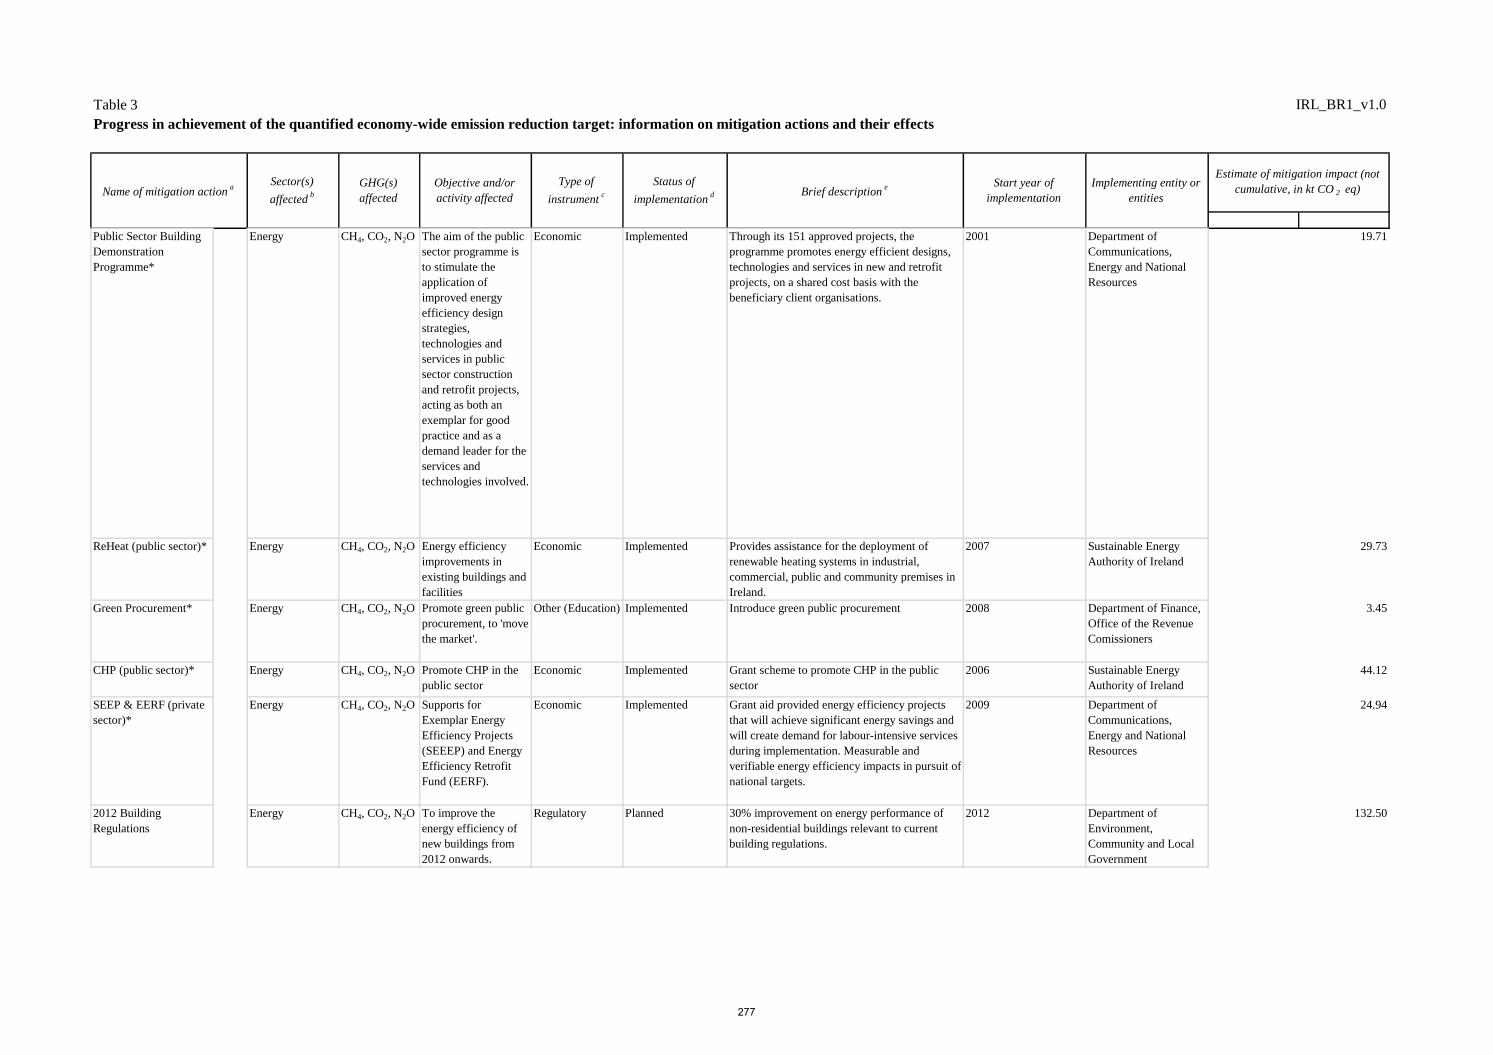
Table 3 IRL_BR1_v1.0
Progress in achievement of the quantified economy-wide emission reduction target: information on mitigation actions and their effects
Brief descriptione Start year of
implementation
Implementing entity or
entitiesName of mitigation action
a
Estimate of mitigation impact (not
cumulative, in kt CO 2 eq)Objective and/or
activity affected
Type of
instrumentc
Status of
implementationd
Sector(s)
affectedb
GHG(s)
affected
Public Sector Building
Demonstration
Programme*
Energy CH4, CO2, N2O The aim of the public
sector programme is
to stimulate the
application of
improved energy
efficiency design
strategies,
technologies and
services in public
sector construction
and retrofit projects,
acting as both an
exemplar for good
practice and as a
demand leader for the
services and
technologies involved.
Economic Implemented Through its 151 approved projects, the
programme promotes energy efficient designs,
technologies and services in new and retrofit
projects, on a shared cost basis with the
beneficiary client organisations.
2001 Department of
Communications,
Energy and National
Resources
19.71
ReHeat (public sector)* Energy CH4, CO2, N2O Energy efficiency
improvements in
existing buildings and
facilities
Economic Implemented Provides assistance for the deployment of
renewable heating systems in industrial,
commercial, public and community premises in
Ireland.
2007 Sustainable Energy
Authority of Ireland
29.73
Green Procurement* Energy CH4, CO2, N2O Promote green public
procurement, to 'move
the market'.
Other (Education) Implemented Introduce green public procurement 2008 Department of Finance,
Office of the Revenue
Comissioners
3.45
CHP (public sector)* Energy CH4, CO2, N2O Promote CHP in the
public sector
Economic Implemented Grant scheme to promote CHP in the public
sector
2006 Sustainable Energy
Authority of Ireland
44.12
SEEP & EERF (private
sector)*
Energy CH4, CO2, N2O Supports for
Exemplar Energy
Efficiency Projects
(SEEEP) and Energy
Efficiency Retrofit
Fund (EERF).
Economic Implemented Grant aid provided energy efficiency projects
that will achieve significant energy savings and
will create demand for labour-intensive services
during implementation. Measurable and
verifiable energy efficiency impacts in pursuit of
national targets.
2009 Department of
Communications,
Energy and National
Resources
24.94
2012 Building
Regulations
Energy CH4, CO2, N2O To improve the
energy efficiency of
new buildings from
2012 onwards.
Regulatory Planned 30% improvement on energy performance of
non-residential buildings relevant to current
building regulations.
2012 Department of
Environment,
Community and Local
Government
132.50
277

Table 3 IRL_BR1_v1.0
Progress in achievement of the quantified economy-wide emission reduction target: information on mitigation actions and their effects
Brief descriptione Start year of
implementation
Implementing entity or
entitiesName of mitigation action
a
Estimate of mitigation impact (not
cumulative, in kt CO 2 eq)Objective and/or
activity affected
Type of
instrumentc
Status of
implementationd
Sector(s)
affectedb
GHG(s)
affected
Retrofit (public sector) Energy CH4, CO2, N2O Deliver a major
increase in the pace,
scale and depth of
sustainable energy
investments in
upgrading existing
buildings and
facilities
Economic Planned Within this programme, financial support is
available through the Better Energy Workplaces
scheme for implementing a wide range of
qualifying sustainable energy upgrading projects
in the public, commercial, industrial and
community sectors.
2011 Sustainable Energy
Authority of Ireland
127.20
Retrofit (commercial
sector)
Energy CH4, CO2, N2O Deliver a major
increase in the pace,
scale and depth of
sustainable energy
investments in
upgrading existing
buildings and
facilities
Economic Planned Within this programme, financial support is
available through the Better Energy Workplaces
scheme for implementing a wide range of
qualifying sustainable energy upgrading projects
in the public, commercial, industrial and
community sectors.
2011 Sustainable Energy
Authority of Ireland
63.60
Public Sector Energy
Efficiency Target
Energy CH4, CO2, N2O Public sector
contribution to
national energy
efficiency target.
Regulatory Planned Implemetation of measures to enable the public
sector contribute to its requirements under the
national target of increasing energy efficiency
nationally by 20% by 2020.
2011 Department of
Communications,
Energy and National
Resources; Sustainable
Energy Authority of
Ireland
177.55
Renewables penetration
in the services sector
Energy CH4, CO2, N2O To increase the use of
renewable energy in
the services sector.
Regulatory Planned 12% of thermal energy requirements to come
from renewable energy by 2020 - displacing oil
and gas use in the services sector.
2012 Department of
Communications,
Energy and National
Resources
82.54
SEAI Large Industry
Programme*
Industry/industria
l processes
CH4, CO2, N2O Develop and maintain
robust energy
management in
industry.
Voluntary
Agreement
Implemented The Large Industry Energy Network is a
voluntary network of companies working to
maintain strong energy management and
environmental protection practices.
2000 Sustainable Energy
Authority of Ireland
412.90
CHP efficiency* Industry/industria
l processes
CH4, CO2, N2O Promote CHP in the
industrial sector.
Economic Implemented Grant scheme to promote CHP in the industrial
sector.
2006 Sustainable Energy
Authority of Ireland
103.36
Accelerated Capital
Allowance (Industry)*
Industry/industria
l processes
CH4, CO2, N2O The ACA is a tax
incentive introduced
by the Government in
the Finance Act, 2008
, to encourage
companies to buy
energy-efficient
equipment.
Fiscal Implemented The ACA is a tax incentive for companies
paying corporation tax and aims to encourage
investment in energy efficient equipment. The
ACA offers an attractive incentive whereby it
allows companies to write off 100% of the
purchase value of qualifying energy efficient
equipment against their profit in the year of
purchase.
2008 Department of Finance;
Office of the Revenue
Commissioners
4.15
ReHeat (Industry)* Industry/industria
l processes
CH4, CO2, N2O Energy efficiency
improvements in
existing buildings and
facilities.
Economic Implemented Provides assistance for the deployment of
renewable heating systems in industrial,
commercial, public and community premises in
Ireland.
2007 Sustainable Energy
Authority of Ireland
69.64
278

Table 3 IRL_BR1_v1.0
Progress in achievement of the quantified economy-wide emission reduction target: information on mitigation actions and their effects
Brief descriptione Start year of
implementation
Implementing entity or
entitiesName of mitigation action
a
Estimate of mitigation impact (not
cumulative, in kt CO 2 eq)Objective and/or
activity affected
Type of
instrumentc
Status of
implementationd
Sector(s)
affectedb
GHG(s)
affected
Retrofit (Industry) Industry/industria
l processes
CH4, CO2, N2O Deliver a major
increase in the pace,
scale and depth of
sustainable energy
investments in
upgrading existing
buildings and
facilities.
Economic Planned Within this programme, financial support is
available through the Better Energy Workplaces
scheme for implementing a wide range of
qualifying sustainable energy upgrading projects
in the public, commercial, industrial and
community sectors. Projects entailing upgrades
to thermal, electrical or transport energy
performance are all considered eligible.
Networking, training and advisory programmes
are also available.
2011 Sustainable Energy
Authority of Ireland
63.74
Renewables penetration
in the industrial sector
Industry/industria
l processes
CH4, CO2, N2O To increase the use of
renewable energy in
the industrial sector
Regulatory Planned 12% of thermal energy requirements to come
from renewable energy by 2020 - displacing oil
and gas use in the industrial sector.
2012 Department of
Communications,
Energy and National
Resources
311.04
Gas transport and
distribution savings
Transport CH4, CO2, N2O Savings attributed to
reduced fugitive
emissions from gas
transport and
distribution between
the with measures
scenario and the with
additional measure
scenario.
Implemented This is a Non CCPM which accounts for the
reduced fugitive emissions from gas transport
and distribution as a result of the lower
quantities of gas forecastsed to be combusted
across all sectors of the economy in the with
additional measures scenario, when compared to
the forecasted quantities of gas combusted in
the with existing measures scenario.
15.14
Lime production Industry/industria
l processes
CH4, CO2, N2O Account for differing
quantities of lime
used for air pollutant
abatement at
electricity generation
plant
Planned This is a Non CCPM which accounts for the
reduced process emissions from lime production
as a result of the lower quantities of peat
forecatsed to be combusted for electricity
generation in the with additional measures
scenario, when compared to the forecasted
quantities of peat combusted for electricity
generated in the with existing measures
scenario. Lime is used for air pollutant
abatement.
3.85
Domestic Lighting* Cross-cutting CH4, CO2, N2O Increase the
efficiency of domestic
lighting
Other
(Regulatory)
Implemented Continued roll out of low energy lighting in
response to the gradual withdrawl of
incandescent light bulbs from the European
market.
2008 Department of
Enterprise, Trade and
Innovation
121.99
279

Table 3 IRL_BR1_v1.0
Progress in achievement of the quantified economy-wide emission reduction target: information on mitigation actions and their effects
Brief descriptione Start year of
implementation
Implementing entity or
entitiesName of mitigation action
a
Estimate of mitigation impact (not
cumulative, in kt CO 2 eq)Objective and/or
activity affected
Type of
instrumentc
Status of
implementationd
Sector(s)
affectedb
GHG(s)
affected
Mobile Air Conditioning
Directive*
Industry/industria
l processes
HFCs Control the leakage of
specific fluorinated
gases in air-
conditioning systems
fitted to vehicles and
to prohibit air-
conditioning systems
designed to contain
fluorinated
greenhouse gases with
a global warming
potential higher than
150.
Regulatory Implemented This Directive puts in place limit values for
leakage rates and test procedures for the
assessment of leakage in mobile air-conditioning
systems designed to contain fluorinated gases
with a global warming potential higher than 150.
It also puts in place a prohibition on the use of
fluorinated gases with a global warming
potential higher than 150 in new vehicles.
2012 European Commission 73.47
F-Gas Regulation* Industry/industria
l processes
HFCs, PFCs,
SF6
The objective of this
Regulation is to
reduce the emissions
of fluorinated
greenhouse gases.
Regulatory Implemented This Regulation aims to contain, prevent and
thereby reduce emissions of fluorinated
greenhouse gases. It addresses the labelling and
disposal of products and equipment containing
these gases, the reporting of information on
these gases, the control of use and the placing
on the market prohibitions.
2007 European Commission 30.00
Landfill Directive Waste
management/wast
e
CH4 The objective of this
directive is to reduce
the environmental
impact of landfills
Regulatory Implemented This Directive by way of strict operational and
technical requirements aims as far as is possible
to reduce the negative effects of landfills on the
environment, in partciular the pollution of
surface water, groundwater, soil and air, and on
the global environment.
2010 Department of the
Environment,
Community and Local
Government
190.74
Note : The two final columns specify the year identified by the Party for estimating impacts (based on the status of the measure and whether an ex post or ex ante estimation is available).
Abbreviations : GHG = greenhouse gas; LULUCF = land use, land-use change and forestry.
Custom Footnotes
a Parties should use an asterisk (*) to indicate that a mitigation action is included in the ‘with measures’ projection.
b To the extent possible, the following sectors should be used: energy, transport, industry/industrial processes, agriculture, forestry/LULUCF, waste management/waste, other sectors, cross-cutting, as appropriate.
c To the extent possible, the following types of instrument should be used: economic, fiscal, voluntary agreement, regulatory, information, education, research, other.
d To the extent possible, the following descriptive terms should be used to report on the status of implementation: implemented, adopted, planned.
e Additional information may be provided on the cost of the mitigation actions and the relevant timescale.
f Optional year or years deemed relevant by the Party.
280
Table 4 IRL_BR1_v1.0
Reporting on progressa, b
Total emissions
excluding LULUCF
Contribution from
LULUCFd
Yearc (kt CO 2 eq) (kt CO 2 eq) (number of units) (kt CO 2 eq) (number of units) (kt CO 2 eq)
(1990)
2010
2011
2012
Abbreviation : GHG = greenhouse gas, LULUCF = land use, land-use change and forestry.
Custom Footnotes
d Information in this column should be consistent with the information reported in table 4(a)I or 4(a)II, as appropriate. The Parties for which all relevant information on the LULUCF
contribution is reported in table 1 of this common tabular format can refer to table 1.
Quantity of units from other market based
mechanisms
Quantity of units from market based
mechanisms under the Convention
a Reporting by a developed country Party on the information specified in the common tabular format does not prejudge the position of other Parties with regard to the treatment of units
from market-based mechanisms under the Convention or other market-based mechanisms towards achievement of quantified economy-wide emission reduction targets.
b For the base year, information reported on the emission reduction target shall include the following: (a) total GHG emissions, excluding emissions and removals from the LULUCF sector;
(b) emissions and/or removals from the LULUCF sector based on the accounting approach applied taking into consideration any relevant decisions of the Conference of the Parties and the
activities and/or land that will be accounted for; (c) total GHG emissions, including emissions and removals from the LULUCF sector. For each reported year, information reported on
progress made towards the emission reduction targets shall include, in addition to the information noted in paragraphs 9(a–c) of the UNFCCC biennial reporting guidelines for developed
country Parties, information on the use of units from market-based mechanisms.c
Parties may add additional rows for years other than those specified below.
281

Table 4(a)I IRL_BR1_v1.0
Net GHG
emissions/removals from
LULUCF categories c
Base year/period or
reference level value d
Contribution from
LULUCF for
reported year
Cumulative
contribution from
LULUCF e
Total LULUCF
A. Forest land
1. Forest land remaining forest land
2. Land converted to forest land
3. Other g
B. Cropland
1. Cropland remaining cropland
2. Land converted to cropland
3. Other g
C. Grassland
1. Grassland remaining grassland
2. Land converted to grassland
3. Other g
D. Wetlands
1. Wetland remaining wetland
2. Land converted to wetland
3. Other g
E. Settlements
1. Settlements remaining settlements
2. Land converted to settlements
3. Other g
F. Other land
1. Other land remaining other land
2. Land converted to other land
3. Other g
Harvested wood products
Abbreviations : GHG = greenhouse gas, LULUCF = land use, land-use change and forestry.
Custom Footnotes
Progress in achieving the quantified economy-wide emission reduction targets – further information on mitigation actions relevant to the
contribution of the land use, land-use change and forestry sector in 2011 a,b
Accounting
approach f
(kt CO 2 eq)
f Label each accounting approach and indicate where additional information is provided within this biennial report explaining how it was implemented, including all relevant accounting
parameters (i.e. natural disturbances, caps).g
Specify what was used for the category “other”. Explain in this biennial report how each was defined and how it relates to the categories used for reporting under the Convention or its Kyoto
Protocol.
a Reporting by a developed country Party on the information specified in the common tabular format does not prejudge the position of other Parties with regard to the treatment of units from
market-based mechanisms under the Convention or other market-based mechanisms towards achievement of quantified economy-wide emission reduction targets.b
Parties that use the LULUCF approach that is based on table 1 do not need to complete this table, but should indicate the approach in table 2. Parties should fill in a separate table for each year,
namely 2011 and 2012, where 2014 is the reporting year.
c For each category, enter the net emissions or removals reported in the most recent inventory submission for the corresponding inventory year. If a category differs from that used for the
reporting under the Convention or its Kyoto Protocol, explain in the biennial report how the value was derived.d
Enter one reference level or base year/period value for each category. Explain in the biennial report how these values have been calculated.e
If applicable to the accounting approach chosen. Explain in this biennial report to which years or period the cumulative contribution refers to.
282

Table 4(a)I IRL_BR1_v1.0
Net GHG
emissions/removals from
LULUCF categories c
Base year/period or
reference level value d
Contribution from
LULUCF for
reported year
Cumulative
contribution from
LULUCF e
Total LULUCF
A. Forest land
1. Forest land remaining forest land
2. Land converted to forest land
3. Other g
B. Cropland
1. Cropland remaining cropland
2. Land converted to cropland
3. Other g
C. Grassland
1. Grassland remaining grassland
2. Land converted to grassland
3. Other g
D. Wetlands
1. Wetland remaining wetland
2. Land converted to wetland
3. Other g
E. Settlements
1. Settlements remaining settlements
2. Land converted to settlements
3. Other g
F. Other land
1. Other land remaining other land
2. Land converted to other land
3. Other g
Harvested wood products
Abbreviations : GHG = greenhouse gas, LULUCF = land use, land-use change and forestry.
Custom Footnotes
Progress in achieving the quantified economy-wide emission reduction targets – further information on mitigation actions relevant to the
contribution of the land use, land-use change and forestry sector in 2012 a, b
d Enter one reference level or base year/period value for each category. Explain in the biennial report how these values have been calculated.
e If applicable to the accounting approach chosen. Explain in this biennial report to which years or period the cumulative contribution refers to.
f Label each accounting approach and indicate where additional information is provided within this biennial report explaining how it was implemented, including all relevant accounting
parameters (i.e. natural disturbances, caps).g
Specify what was used for the category “other”. Explain in this biennial report how each was defined and how it relates to the categories used for reporting under the Convention or its Kyoto
Protocol.
Accounting
approach f
(kt CO 2 eq)
a Reporting by a developed country Party on the information specified in the common tabular format does not prejudge the position of other Parties with regard to the treatment of units from
market-based mechanisms under the Convention or other market-based mechanisms towards achievement of quantified economy-wide emission reduction targets.b
Parties that use the LULUCF approach that is based on table 1 do not need to complete this table, but should indicate the approach in table 2. Parties should fill in a separate table for each year,
namely 2011 and 2012, where 2014 is the reporting year.
c For each category, enter the net emissions or removals reported in the most recent inventory submission for the corresponding inventory year. If a category differs from that used for the
reporting under the Convention or its Kyoto Protocol, explain in the biennial report how the value was derived.
283
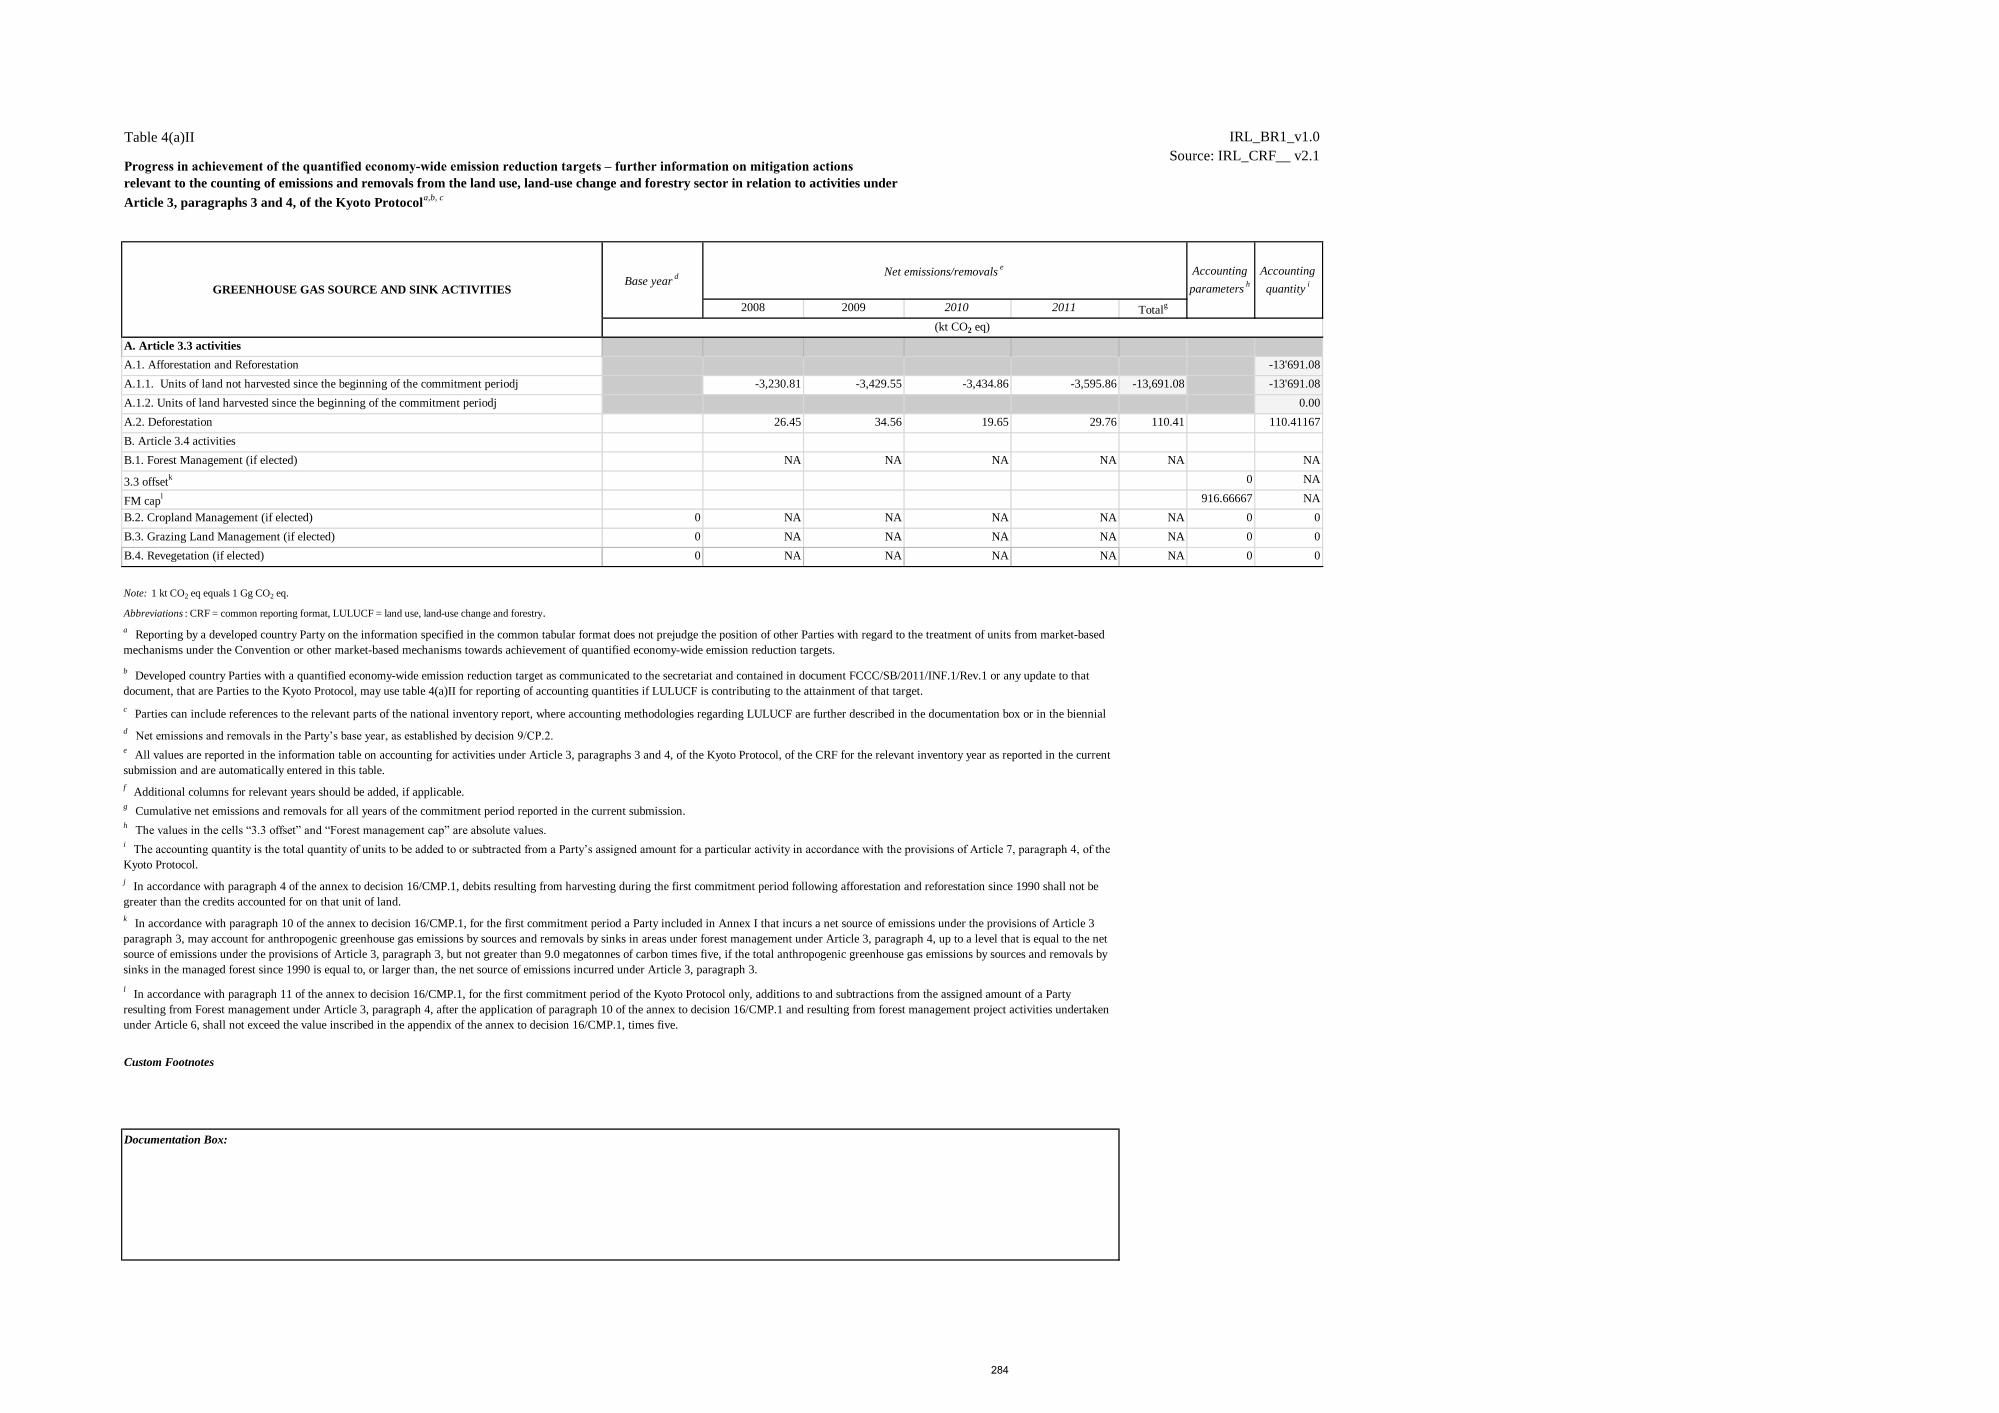
Table 4(a)II IRL_BR1_v1.0
Source: IRL_CRF__ v2.1
2008 2009 2010 2011 Totalg
A. Article 3.3 activities
A.1. Afforestation and Reforestation -13'691.08
A.1.1. Units of land not harvested since the beginning of the commitment periodj -3,230.81 -3,429.55 -3,434.86 -3,595.86 -13,691.08 -13'691.08
A.1.2. Units of land harvested since the beginning of the commitment periodj 0.00
A.2. Deforestation 26.45 34.56 19.65 29.76 110.41 110.41167
B. Article 3.4 activities
B.1. Forest Management (if elected) NA NA NA NA NA NA
3.3 offsetk 0 NA
FM capl 916.66667 NA
B.2. Cropland Management (if elected) 0 NA NA NA NA NA 0 0
B.3. Grazing Land Management (if elected) 0 NA NA NA NA NA 0 0
B.4. Revegetation (if elected) 0 NA NA NA NA NA 0 0
Note: 1 kt CO2 eq equals 1 Gg CO2 eq.
Abbreviations : CRF = common reporting format, LULUCF = land use, land-use change and forestry.
Custom Footnotes
Accounting
parametersh
Accounting
quantityi
(kt CO2 eq)
Documentation Box:
l In accordance with paragraph 11 of the annex to decision 16/CMP.1, for the first commitment period of the Kyoto Protocol only, additions to and subtractions from the assigned amount of a Party
resulting from Forest management under Article 3, paragraph 4, after the application of paragraph 10 of the annex to decision 16/CMP.1 and resulting from forest management project activities undertaken
under Article 6, shall not exceed the value inscribed in the appendix of the annex to decision 16/CMP.1, times five.
f Additional columns for relevant years should be added, if applicable.
g Cumulative net emissions and removals for all years of the commitment period reported in the current submission.
h The values in the cells “3.3 offset” and “Forest management cap” are absolute values.
i The accounting quantity is the total quantity of units to be added to or subtracted from a Party’s assigned amount for a particular activity in accordance with the provisions of Article 7, paragraph 4, of the
Kyoto Protocol.
j In accordance with paragraph 4 of the annex to decision 16/CMP.1, debits resulting from harvesting during the first commitment period following afforestation and reforestation since 1990 shall not be
greater than the credits accounted for on that unit of land.
k In accordance with paragraph 10 of the annex to decision 16/CMP.1, for the first commitment period a Party included in Annex I that incurs a net source of emissions under the provisions of Article 3
paragraph 3, may account for anthropogenic greenhouse gas emissions by sources and removals by sinks in areas under forest management under Article 3, paragraph 4, up to a level that is equal to the net
source of emissions under the provisions of Article 3, paragraph 3, but not greater than 9.0 megatonnes of carbon times five, if the total anthropogenic greenhouse gas emissions by sources and removals by
sinks in the managed forest since 1990 is equal to, or larger than, the net source of emissions incurred under Article 3, paragraph 3.
Progress in achievement of the quantified economy-wide emission reduction targets – further information on mitigation actions
relevant to the counting of emissions and removals from the land use, land-use change and forestry sector in relation to activities under
Article 3, paragraphs 3 and 4, of the Kyoto Protocola,b, c
GREENHOUSE GAS SOURCE AND SINK ACTIVITIESBase year
d
d Net emissions and removals in the Party’s base year, as established by decision 9/CP.2.
e All values are reported in the information table on accounting for activities under Article 3, paragraphs 3 and 4, of the Kyoto Protocol, of the CRF for the relevant inventory year as reported in the current
submission and are automatically entered in this table.
a Reporting by a developed country Party on the information specified in the common tabular format does not prejudge the position of other Parties with regard to the treatment of units from market-based
mechanisms under the Convention or other market-based mechanisms towards achievement of quantified economy-wide emission reduction targets.
b Developed country Parties with a quantified economy-wide emission reduction target as communicated to the secretariat and contained in document FCCC/SB/2011/INF.1/Rev.1 or any update to that
document, that are Parties to the Kyoto Protocol, may use table 4(a)II for reporting of accounting quantities if LULUCF is contributing to the attainment of that target.
c Parties can include references to the relevant parts of the national inventory report, where accounting methodologies regarding LULUCF are further described in the documentation box or in the biennial
reports.
Net emissions/removalse
284

Table 4(b) IRL_BR1_v1.0
Reporting on progressa, b, c
2011 2012
(number of units)
(kt CO 2 eq)
(number of units)
(kt CO2 eq)
(number of units)
(kt CO2 eq)
(number of units)
(kt CO2 eq)
(number of units)
(kt CO2 eq)
(number of units)
(kt CO2 eq)
(number of units)
(kt CO 2 eq)
(number of units)
(kt CO 2 eq)
(number of units)
(kt CO 2 eq)
c Parties may include this information, as appropriate and if relevant to their target.
d Units surrendered by that Party for that year that have not been previously surrendered by that or any other Party.
e Additional rows for each market-based mechanism should be added, if applicable.
Custom Footnotes
b For each reported year, information reported on progress made towards the emission reduction target shall include, in addition to the
information noted in paragraphs 9(a-c) of the reporting guidelines, on the use of units from market-based mechanisms.
Abbreviations : AAUs = assigned amount units, CERs = certified emission reductions, ERUs = emission reduction units, lCERs = long-term
certified emission reductions, tCERs = temporary certified emission reductions.
a Reporting by a developed country Party on the information specified in the common tabular format does not prejudge the position of other
Parties with regard to the treatment of units from market-based mechanisms under the Convention or other market-based mechanisms towards
achievement of quantified economy-wide emission reduction targets.
Total
Note: 2011 is the latest reporting year.
Other units d,e
Units of market based mechanismsYear
Units from market-based mechanisms under the
Convention
Units from other market-based mechanisms
Kyoto
Protocol
unitsd
Kyoto Protocol units
AAUs
ERUs
CERs
tCERs
lCERs
285

Table 5 IRL_BR1_v1.0
Summary of key variables and assumptions used in the projections analysisa
Assumption Unit 1990 1995 2000 2005 2010 2011 2015 2020 2025 2030
Population thousands 3,506.70 3,061.40 3,789.60 4,134.10 4,429.38 4,429.74 4,491.15 4,606.20 4,724.79 4,823.89
GDP growth rate % 4.08 12.75 9.02 5.92 -0.62 1.71 1.91 3.21 2.70 2.20
Population growth % 0.57 0.42 1.28 2.19 -0.46 0.01 0.33 0.57 0.51 0.42
Number of households thousands 1,159.00 1,253.00 1,429.00 1,730.00 1,815.00 1,815.00 1,833.00 1,935.00 2,060.00 2,194.00
International oil price USD / boe 60.50 70.80 111.80 115.10 116.00 121.00
International coal price USD / boe 17.00 20.80 28.60 29.40 30.80 31.20
International gas price USD / boe 40.40 49.30 69.90 80.00 76.60 83.90
b Parties should include historical data used to develop the greenhouse gas projections reported.
Custom Footnotes
Key underlying assumptions
a Parties should include key underlying assumptions as appropriate.
Historicalb Projected
286
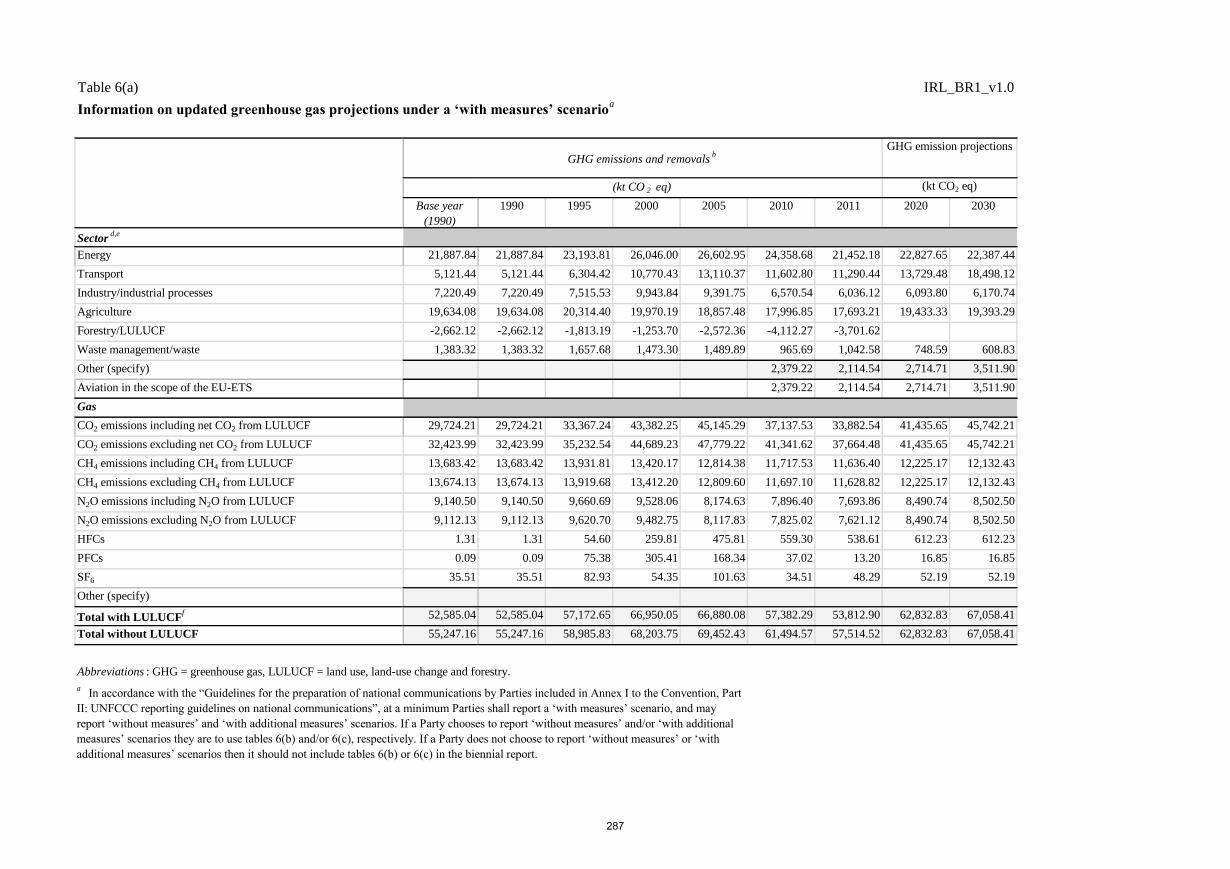
Table 6(a) IRL_BR1_v1.0
Information on updated greenhouse gas projections under a ‘with measures’ scenarioa
Base year
(1990)
1990 1995 2000 2005 2010 2011 2020 2030
Sectord,e
Energy 21,887.84 21,887.84 23,193.81 26,046.00 26,602.95 24,358.68 21,452.18 22,827.65 22,387.44
Transport 5,121.44 5,121.44 6,304.42 10,770.43 13,110.37 11,602.80 11,290.44 13,729.48 18,498.12
Industry/industrial processes 7,220.49 7,220.49 7,515.53 9,943.84 9,391.75 6,570.54 6,036.12 6,093.80 6,170.74
Agriculture 19,634.08 19,634.08 20,314.40 19,970.19 18,857.48 17,996.85 17,693.21 19,433.33 19,393.29
Forestry/LULUCF -2,662.12 -2,662.12 -1,813.19 -1,253.70 -2,572.36 -4,112.27 -3,701.62
Waste management/waste 1,383.32 1,383.32 1,657.68 1,473.30 1,489.89 965.69 1,042.58 748.59 608.83
Other (specify) 2,379.22 2,114.54 2,714.71 3,511.90
Aviation in the scope of the EU-ETS 2,379.22 2,114.54 2,714.71 3,511.90
Gas
CO2 emissions including net CO2 from LULUCF 29,724.21 29,724.21 33,367.24 43,382.25 45,145.29 37,137.53 33,882.54 41,435.65 45,742.21
CO2 emissions excluding net CO2 from LULUCF 32,423.99 32,423.99 35,232.54 44,689.23 47,779.22 41,341.62 37,664.48 41,435.65 45,742.21
CH4 emissions including CH4 from LULUCF 13,683.42 13,683.42 13,931.81 13,420.17 12,814.38 11,717.53 11,636.40 12,225.17 12,132.43
CH4 emissions excluding CH4 from LULUCF 13,674.13 13,674.13 13,919.68 13,412.20 12,809.60 11,697.10 11,628.82 12,225.17 12,132.43
N2O emissions including N2O from LULUCF 9,140.50 9,140.50 9,660.69 9,528.06 8,174.63 7,896.40 7,693.86 8,490.74 8,502.50
N2O emissions excluding N2O from LULUCF 9,112.13 9,112.13 9,620.70 9,482.75 8,117.83 7,825.02 7,621.12 8,490.74 8,502.50
HFCs 1.31 1.31 54.60 259.81 475.81 559.30 538.61 612.23 612.23
PFCs 0.09 0.09 75.38 305.41 168.34 37.02 13.20 16.85 16.85
SF6 35.51 35.51 82.93 54.35 101.63 34.51 48.29 52.19 52.19
Other (specify)
Total with LULUCFf 52,585.04 52,585.04 57,172.65 66,950.05 66,880.08 57,382.29 53,812.90 62,832.83 67,058.41
Total without LULUCF 55,247.16 55,247.16 58,985.83 68,203.75 69,452.43 61,494.57 57,514.52 62,832.83 67,058.41
Abbreviations : GHG = greenhouse gas, LULUCF = land use, land-use change and forestry.
(kt CO2 eq)
GHG emission projections
a In accordance with the “Guidelines for the preparation of national communications by Parties included in Annex I to the Convention, Part
II: UNFCCC reporting guidelines on national communications”, at a minimum Parties shall report a ‘with measures’ scenario, and may
report ‘without measures’ and ‘with additional measures’ scenarios. If a Party chooses to report ‘without measures’ and/or ‘with additional
measures’ scenarios they are to use tables 6(b) and/or 6(c), respectively. If a Party does not choose to report ‘without measures’ or ‘with
additional measures’ scenarios then it should not include tables 6(b) or 6(c) in the biennial report.
(kt CO 2 eq)
GHG emissions and removalsb
287

Table 6(a) IRL_BR1_v1.0
Information on updated greenhouse gas projections under a ‘with measures’ scenarioa
Base year
(1990)
1990 1995 2000 2005 2010 2011 2020 2030
(kt CO2 eq)
GHG emission projections
(kt CO 2 eq)
GHG emissions and removalsb
Custom Footnotes
d In accordance with paragraph 34 of the “Guidelines for the preparation of national communications by Parties included in Annex I to the
Convention, Part II: UNFCCC reporting guidelines on national communications”, projections shall be presented on a sectoral basis, to the
extent possible, using the same sectoral categories used in the policies and measures section. This table should follow, to the extent possible,
the same sectoral categories as those listed in paragraph 17 of those guidelines, namely, to the extent appropriate, the following sectors
should be considered: energy, transport, industry, agriculture, forestry and waste management. e
To the extent possible, the following sectors should be used: energy, transport, industry/industrial processes, agriculture,
forestry/LULUCF, waste management/waste, other sectors (i.e. cross-cutting), as appropriate.
f Parties may choose to report total emissions with or without LULUCF, as appropriate.
c 20XX is the reporting due-date year (i.e. 2014 for the first biennial report).
b Emissions and removals reported in these columns should be as reported in the latest GHG inventory and consistent with the emissions
and removals reported in the table on GHG emissions and trends provided in this biennial report. Where the sectoral breakdown differs from
that reported in the GHG inventory Parties should explain in their biennial report how the inventory sectors relate to the sectors reported in
this table.
288

Table 6(c) IRL_BR1_v1.0
Information on updated greenhouse gas projections under a ‘with additional measures’ scenarioa
Base year
(1990)
1990 1995 2000 2005 2010 2011 2020 2030
Sectord,e
Energy 21,887.84 21,887.84 23,193.81 26,046.00 26,602.95 24,358.68 21,452.18 19,411.62 14,386.77
Transport 5,121.44 5,121.44 6,304.42 10,770.43 13,110.37 11,602.80 11,290.44 12,688.64 16,592.23
Industry/industrial processes 7,220.49 7,220.49 7,515.53 9,943.84 9,391.75 6,570.54 6,036.12 5,715.17 5,188.64
Agriculture 19,634.08 19,634.08 20,314.40 19,970.19 18,857.48 17,996.85 17,693.21 19,433.33 19,393.29
Forestry/LULUCF -2,662.12 -2,662.12 -1,813.19 -1,253.70 -2,572.36 -4,112.27 -3,701.62
Waste management/waste 1,383.32 1,383.32 1,657.68 1,473.30 1,489.89 965.69 1,042.58 748.59 608.83
Other (specify) 2,379.22 2,114.54 2,714.03 3,510.90
Aviation in the scope of the EU-ETS 2,379.22 2,114.54 2,714.03 3,510.90
Gas
CO2 emissions including net CO2 from LULUCF 29,724.21 29,724.21 33,367.24 43,382.25 45,145.29 37,137.53 33,882.54 36,613.26 34,885.36
CO2 emissions excluding net CO2 from LULUCF 32,423.99 32,423.99 35,232.54 44,689.23 47,779.22 41,341.62 37,664.48 36,613.26 34,885.36
CH4 emissions including CH4 from LULUCF 13,683.42 13,683.42 13,931.81 13,420.17 12,814.38 11,717.53 11,636.40 12,218.24 12,128.27
CH4 emissions excluding CH4 from LULUCF 13,674.13 13,674.13 13,919.68 13,412.20 12,809.60 11,697.10 11,628.82 12,218.24 12,128.27
N2O emissions including N2O from LULUCF 9,140.50 9,140.50 9,660.69 9,528.06 8,174.63 7,896.40 7,693.86 8,484.58 8,474.86
N2O emissions excluding N2O from LULUCF 9,112.13 9,112.13 9,620.70 9,482.75 8,117.83 7,825.02 7,621.12 8,484.58 8,474.86
HFCs 1.31 1.31 54.60 259.81 475.81 559.30 538.61 612.23 612.23
PFCs 0.09 0.09 75.38 305.41 168.34 37.02 13.20 16.85 16.85
SF6 35.51 35.51 82.93 54.35 101.63 34.51 48.29 52.19 52.19
Other (specify)
Total with LULUCFf 52,585.04 52,585.04 57,172.65 66,950.05 66,880.08 57,382.29 53,812.90 57,997.35 56,169.76
Total without LULUCF 55,247.16 55,247.16 58,985.83 68,203.75 69,452.43 61,494.57 57,514.52 57,997.35 56,169.76
Abbreviations : GHG = greenhouse gas, LULUCF = land use, land-use change and forestry.
a In accordance with the “Guidelines for the preparation of national communications by Parties included in Annex I to the Convention, Part II: UNFCCC reporting guidelines on national
communications”, at a minimum Parties shall report a ‘with measures’ scenario, and may report ‘without measures’ and ‘with additional measures’ scenarios. If a Party chooses to report ‘without
measures’ and/or ‘with additional measures’ scenarios they are to use tables 6(b) and/or 6(c), respectively. If a Party does not choose to report ‘without measures’ or ‘with additional measures’
scenarios then it should not include tables 6(b) or 6(c) in the biennial report.
(kt CO 2 eq)
GHG emissions and removalsb
(kt CO2 eq)
GHG emission projections
289

Table 6(c) IRL_BR1_v1.0
Information on updated greenhouse gas projections under a ‘with additional measures’ scenarioa
Base year
(1990)
1990 1995 2000 2005 2010 2011 2020 2030
(kt CO 2 eq)
GHG emissions and removalsb
(kt CO2 eq)
GHG emission projections
f Parties may choose to report total emissions with or without LULUCF, as appropriate.
b Emissions and removals reported in these columns should be as reported in the latest GHG inventory and consistent with the emissions and removals reported in the table on GHG emissions and
trends provided in this biennial report. Where the sectoral breakdown differs from that reported in the GHG inventory Parties should explain in their biennial report how the inventory sectors relate
to the sectors reported in this table.
c 20XX is the reporting due-date year (i.e. 2014 for the first biennial report).
d In accordance with paragraph 34 of the “Guidelines for the preparation of national communications by Parties included in Annex I to the Convention, Part II: UNFCCC reporting guidelines on
national communications”, projections shall be presented on a sectoral basis, to the extent possible, using the same sectoral categories used in the policies and measures section. This table should
follow, to the extent possible, the same sectoral categories as those listed in paragraph 17 of those guidelines, namely, to the extent appropriate, the following sectors should be considered: energy,
transport, industry, agriculture, forestry and waste management.
e To the extent possible, the following sectors should be used: energy, transport, industry/industrial processes, agriculture, forestry/LULUCF, waste management/waste, other sectors (i.e. cross-
cutting), as appropriate.
290

Table 7 IRL_BR1_v1.0
Provision of public financial support: summary information in 2011a
Mitigation Adaptation Cross-cuttinge
Otherf Mitigation Adaptation Cross-cutting
eOther
f
Total contributions through multilateral channels: 29,586,475.00 10,500,000.00 41,184,373.20 14,616,000.00
Multilateral climate change fundsg 1,420,000.00 10,500,000.00 1,976,640.00 14,616,000.00
Other multilateral climate change fundsh 8,000,000.00 11,136,000.00
Multilateral financial institutions, including regional
development banks
28,166,475.00 39,207,733.20
Specialized United Nations bodies
Total contributions through bilateral, regional and other
channels
170,000.00 33,450,000.00 50,000.00 240,000.00 46,570,000.00 70,000.00
Total 29,586,475.00 170,000.00 43,950,000.00 50,000.00 41,184,373.20 240,000.00 61,186,000.00 70,000.00
Abbreviation: USD = United States dollars.
a Parties should fill in a separate table for each year, namely 2011 and 2012, where 2014 is the reporting year.
b Parties should provide an explanation on methodology used for currency exchange for the information provided in table 7, 7(a) and 7(b) in the box below.
c This refers to support to multilateral institutions that Parties cannot specify as climate-specific.
d Parties should explain in their biennial reports how they define funds as being climate-specific.
e This refers to funding for activities which are cross-cutting across mitigation and adaptation.
f Please specify.
g Multilateral climate change funds listed in paragraph 17(a) of the “UNFCCC biennial reporting guidelines for developed country Parties” in decision 2/CP.17.
h Other multilateral climate change funds as referred in paragraph 17(b) of the “UNFCCC biennial reporting guidelines for developed country Parties” in decision 2/CP.17.
Custom Footnotes
Documentation Box:
Ireland has delivered on its international commitment to climate finance even in the context of seriously reduced national budget spending. Ireland's fast-start finance (FSF) contribution in 2011 and 2012 was drawn from grant and other non-refundable contributions
provided by the Department of the Environment, Community and Local Government, the Department of Agriculture, Food and the Marine and climate-relevant ODA.
Each Party shall provide an indication of what new and additional financial resources they have provided, and clarify how they have determined that such resources are new and additional. Please provide this information in relation to table 7(a) and table 7(b).
European euro - EUR
Climate-specificd
USDb
Allocation channels
Year
Climate-specificd
Core/ generalc
Core/ generalc
Notes:- Figures subject to rounding;- Exchange rate used in 2011is the Central Bank of Ireland annual average exchange rate: €1 = $1.392; (See http://centralbanl.ie/polstats/stats/exrates/Pages/default.aspx;- Exchange rate used in 2012 is the
Central Bank of Ireland annual average exchange rate: €1= $1.2848; (See http://www.centralbank.ie/polstats/stats/exrates/Pages/default.aspx);- OECD-DAC Environment and Rio Markers were used to track relevant ODA climate finance
expenditure.
291
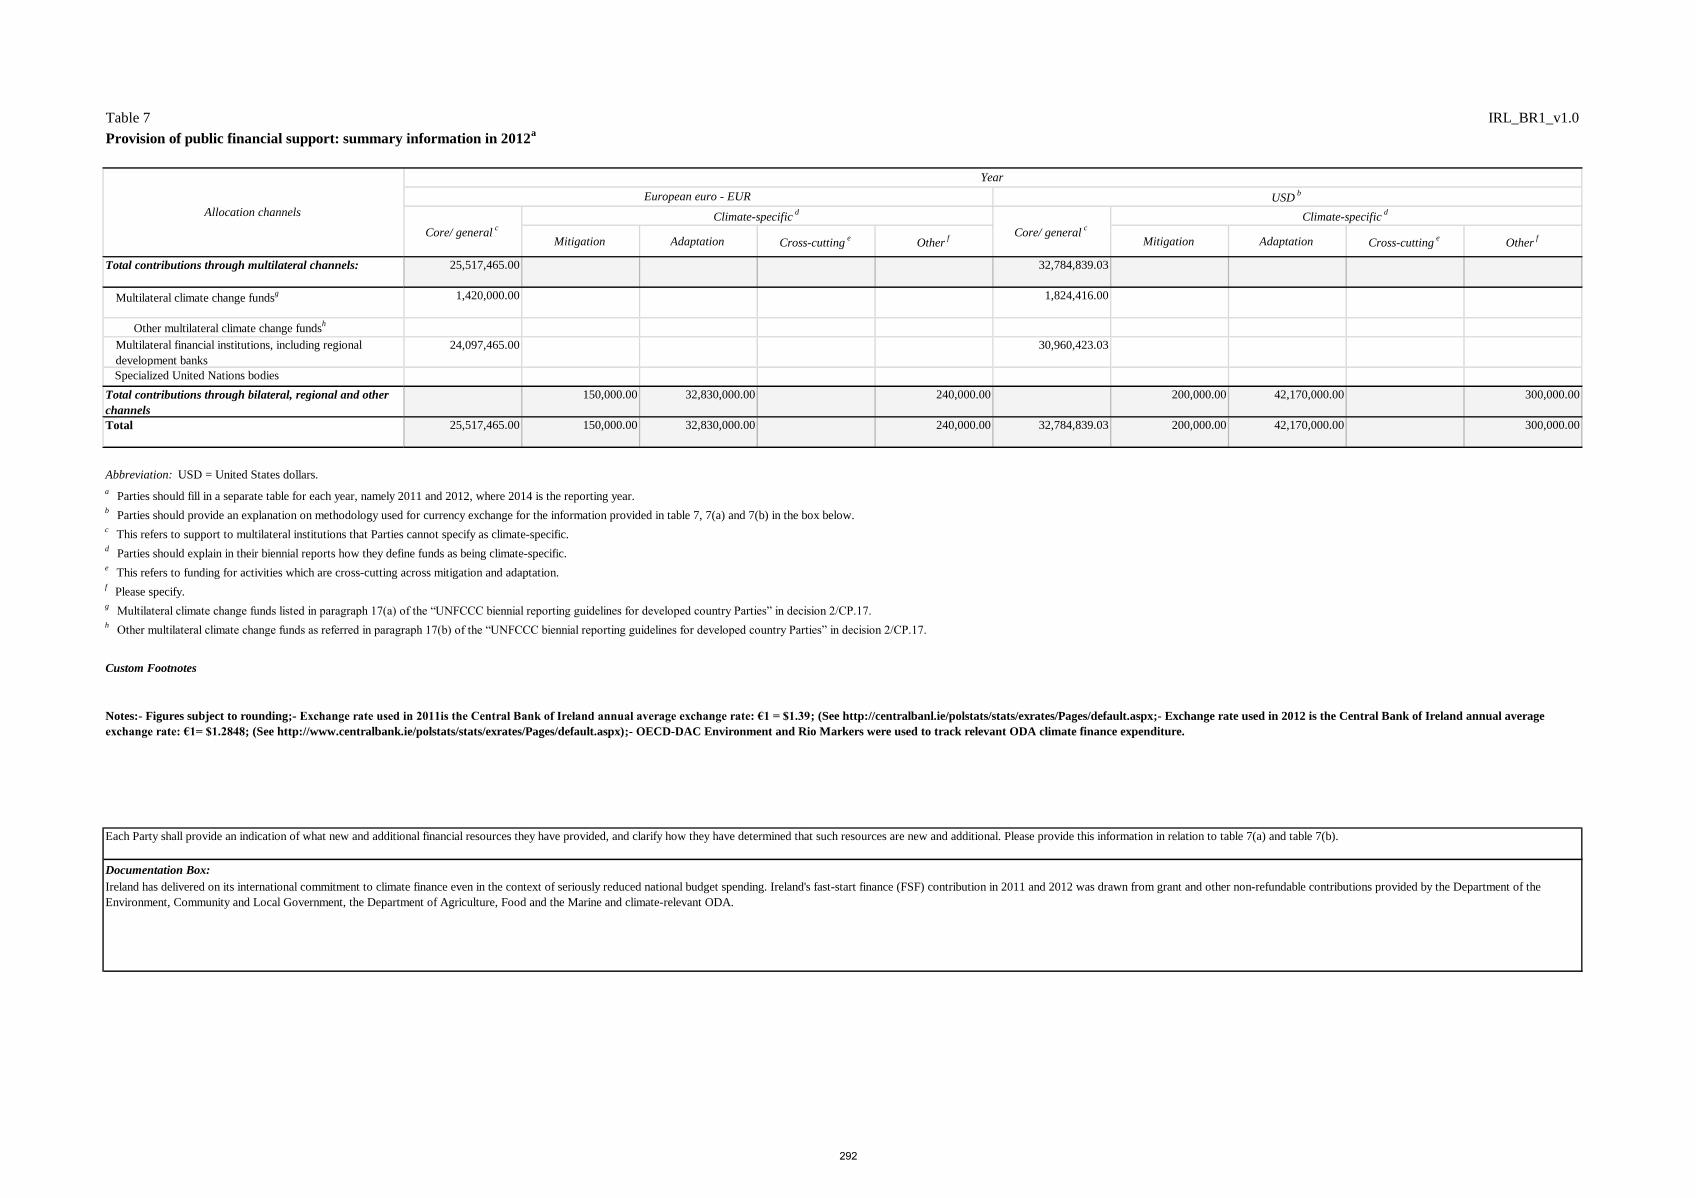
Table 7 IRL_BR1_v1.0
Provision of public financial support: summary information in 2012a
Mitigation Adaptation Cross-cuttinge
Otherf Mitigation Adaptation Cross-cutting
eOther
f
Total contributions through multilateral channels: 25,517,465.00 32,784,839.03
Multilateral climate change fundsg 1,420,000.00 1,824,416.00
Other multilateral climate change fundsh
Multilateral financial institutions, including regional
development banks
24,097,465.00 30,960,423.03
Specialized United Nations bodies
Total contributions through bilateral, regional and other
channels
150,000.00 32,830,000.00 240,000.00 200,000.00 42,170,000.00 300,000.00
Total 25,517,465.00 150,000.00 32,830,000.00 240,000.00 32,784,839.03 200,000.00 42,170,000.00 300,000.00
Abbreviation: USD = United States dollars.
a Parties should fill in a separate table for each year, namely 2011 and 2012, where 2014 is the reporting year.
b Parties should provide an explanation on methodology used for currency exchange for the information provided in table 7, 7(a) and 7(b) in the box below.
c This refers to support to multilateral institutions that Parties cannot specify as climate-specific.
d Parties should explain in their biennial reports how they define funds as being climate-specific.
e This refers to funding for activities which are cross-cutting across mitigation and adaptation.
f Please specify.
g Multilateral climate change funds listed in paragraph 17(a) of the “UNFCCC biennial reporting guidelines for developed country Parties” in decision 2/CP.17.
h Other multilateral climate change funds as referred in paragraph 17(b) of the “UNFCCC biennial reporting guidelines for developed country Parties” in decision 2/CP.17.
Custom Footnotes
Documentation Box:
Ireland has delivered on its international commitment to climate finance even in the context of seriously reduced national budget spending. Ireland's fast-start finance (FSF) contribution in 2011 and 2012 was drawn from grant and other non-refundable contributions provided by the Department of the
Environment, Community and Local Government, the Department of Agriculture, Food and the Marine and climate-relevant ODA.
Each Party shall provide an indication of what new and additional financial resources they have provided, and clarify how they have determined that such resources are new and additional. Please provide this information in relation to table 7(a) and table 7(b).
Year
European euro - EUR USDb
Core/ generalc
Climate-specificd
Core/ generalc
Climate-specificdAllocation channels
Notes:- Figures subject to rounding;- Exchange rate used in 2011is the Central Bank of Ireland annual average exchange rate: €1 = $1.39; (See http://centralbanl.ie/polstats/stats/exrates/Pages/default.aspx;- Exchange rate used in 2012 is the Central Bank of Ireland annual average
exchange rate: €1= $1.2848; (See http://www.centralbank.ie/polstats/stats/exrates/Pages/default.aspx);- OECD-DAC Environment and Rio Markers were used to track relevant ODA climate finance expenditure.
292

Table 7(a) IRL_BR1_v1.0
Provision of public financial support: contribution through multilateral channels in 2011a
European euro -
EURUSD
European euro -
EURUSD
Total contributions through multilateral channels 29,586,475.00 41,184,373.20 10,500,000.00 14,616,000.00
Multilateral climate change funds g 1,420,000.00 1,976,640.00 10,500,000.00 14,616,000.00
1. Global Environment Facility 1,420,000.00 1,976,640.00 Provided ODA Grant Other () Other (Other)
2. Least Developed Countries Fund 2,500,000.00 3,480,000.00 Provided ODA Grant Adaptation Cross-cutting
3. Special Climate Change Fund
4. Adaptation Fund
5. Green Climate Fund
6. UNFCCC Trust Fund for Supplementary Activities Provided
7. Other multilateral climate change funds 8,000,000.00 11,136,000.00
Global Climate Change Alliance (GCCA) 8,000,000.00 11,136,000.00 Provided ODA Grant Adaptation Other (Other)
Multilateral financial institutions, including regional development banks 28,166,475.00 39,207,733.20
1. World Bank 18,000,000.00 25,056,000.00 Provided ODA Grant Other () Other (Other)
2. International Finance Corporation
3. African Development Bank
4. Asian Development Bank 10,166,475.00 14,151,733.20 Provided ODA Grant Other () Other (Other)
5. European Bank for Reconstruction and Development Provided
6. Inter-American Development Bank
7. Other
Specialized United Nations bodies
1. United Nations Development Programme
2. United Nations Environment Programme
3. Other
Custom Footnotes
Notes:- Figures subject to rounding;- Exchange rate used in 2011is the Central Bank of Ireland annual average exchange rate: €1 = $1.392; (See http://centralbanl.ie/polstats/stats/exrates/Pages/default.aspx);- Exchange rate used in 2012 is the Central Bank of
Ireland annual average exchange rate: €1= $1.2848; (See http://www.centralbank.ie/polstats/stats/exrates/Pages/default.aspx);- OECD-DAC Environment and Rio Markers were used to track relevant ODA climate finance expenditure.
Donor funding Core/generald
c Parties may select several applicable sectors. Parties may report sectoral distribution, as applicable, under “Other”.
Total amount
Climate-specifice
Statusb
Funding sourcef
Financial
instrumentf Type of support
f, gSector
c
Abbreviations: ODA = official development assistance, OOF = other official flows.
a Parties should fill in a separate table for each year, namely 2011 and 2012, where 2014 is the reporting year.
b Parties should explain, in their biennial reports, the methodologies used to specify the funds as provided, committed and/or pledged. Parties will provide the information for as many status categories as appropriate in the following order of priority: provided, committed,
pledged.
f Please specify.
g Cross-cutting type of support refers to funding for activities which are cross-cutting across mitigation and adaptation.
d This refers to support to multilateral institutions that Parties cannot specify as climate-specific.
e Parties should explain in their biennial reports how they define funds as being climate-specific.
293

Table 7(a) IRL_BR1_v1.0
Provision of public financial support: contribution through multilateral channels in 2012a
European euro -
EURUSD
European euro -
EURUSD
Total contributions through multilateral channels 25,517,465.00 32,784,839.03
Multilateral climate change funds g 1,420,000.00 1,824,416.00
1. Global Environment Facility 1,420,000.00 1,824,416.00 Provided ODA Grant Other () Other (Other)
2. Least Developed Countries Fund
3. Special Climate Change Fund
4. Adaptation Fund
5. Green Climate Fund
6. UNFCCC Trust Fund for Supplementary Activities
7. Other multilateral climate change funds
Multilateral financial institutions, including regional development banks 24,097,465.00 30,960,423.03
1. World Bank 23,400,000.00 30,064,320.00 Provided ODA Grant Other () Other (Other)
2. International Finance Corporation
3. African Development Bank
4. Asian Development Bank 697,465.00 896,103.03 Provided ODA Grant Other () Other (Other)
5. European Bank for Reconstruction and Development Provided
6. Inter-American Development Bank
7. Other
Specialized United Nations bodies
1. United Nations Development Programme
2. United Nations Environment Programme
3. Other
Custom Footnotes
Notes:- Figures subject to rounding;- Exchange rate used in 2011is the Central Bank of Ireland annual average exchange rate: €1 = $1.392; (See http://centralbanl.ie/polstats/stats/exrates/Pages/default.aspx);- Exchange rate used in 2012 is the Central Bank of
Ireland annual average exchange rate: €1= $1.2848; (See http://www.centralbank.ie/polstats/stats/exrates/Pages/default.aspx);- OECD-DAC Environment and Rio Markers were used to track relevant ODA climate finance expenditure.
c Parties may select several applicable sectors. Parties may report sectoral distribution, as applicable, under “Other”.
Donor funding
Total amount
Statusb
Funding sourcef
Financial
instrumentf Type of support
f, gCore/generald
SectorcClimate-specific
e
Abbreviations: ODA = official development assistance, OOF = other official flows.
a Parties should fill in a separate table for each year, namely 2011 and 2012, where 2014 is the reporting year.
b Parties should explain, in their biennial reports, the methodologies used to specify the funds as provided, committed and/or pledged. Parties will provide the information for as many status categories as appropriate in the following order of priority: provided, committed,
pledged.
f Please specify.
g Cross-cutting type of support refers to funding for activities which are cross-cutting across mitigation and adaptation.
e Parties should explain in their biennial reports how they define funds as being climate-specific.
d This refers to support to multilateral institutions that Parties cannot specify as climate-specific.
294

Table 7(b) IRL_BR1_v1.0
Provision of public financial support: contribution through bilateral, regional and other channels in 2011a
European euro - EUR USD
Total contributions through bilateral,
regional and other channels
33,670,000.00 46,880,000.00
Ethiopia / Tigray Regional Support
Programme
2,000,000.00 2,780,000.00 Provided ODA Grant Adaptation Agriculture, Water and
sanitation
Ethiopia / Agriculture Operational
Research
150,000.00 210,000.00 Provided ODA Grant Adaptation Agriculture
Ethiopia / Household Asset Building
Programme
500,000.00 700,000.00 Provided ODA Grant Adaptation Agriculture
Ethiopia / Productive Safety Nets
Programme
8,000,000.00 11,140,000.00 Provided ODA Grant Adaptation Other (Other)
Ethiopia / Rural Eco Tourism
Initiative
20,000.00 30,000.00 Provided ODA Grant Adaptation Other (Other)
Ethiopia / Rural Women's Economic
Empowerment
50,000.00 70,000.00 Provided ODA Grant Adaptation Other (Other)
Ethiopia / Smallholder Livelihoods
Improvement Project
300,000.00 420,000.00 Provided ODA Grant Adaptation Agriculture
Ethiopia / Womens Association 150,000.00 210,000.00 Provided ODA Grant Adaptation Other (Other)
Lesotho / Climate/ Hunger Initiatives 200,000.00 280,000.00 Provided ODA Grant Adaptation Agriculture
Lesotho / Health Systems Support 100,000.00 140,000.00 Provided ODA Grant Mitigation Other (Other)
Lesotho / Improved Rural Water and
Sanitation
1,700,000.00 2,370,000.00 Provided ODA Grant Adaptation Water and sanitation
Malawi / Disaster risk reduction and
strengthening resilience programme
770,000.00 1,060,000.00 Provided ODA Grant Adaptation Other (Other)
Malawi / Improved crop productivity
and soil fertility management
5,150,000.00 7,170,000.00 Provided ODA Grant Adaptation Agriculture
Mozambique / Agricultural Sectoral
Support Programme Pro Agri
750,000.00 1,040,000.00 Provided ODA Grant Adaptation Agriculture
Mozambique / Regional Support
Programme
1,780,000.00 2,480,000.00 Provided ODA Grant Adaptation Agriculture, Water and
sanitation
Multi Country Recipients / Poverty
Environment Initiative
700,000.00 970,000.00 Provided ODA Grant Adaptation Other (Other)
Sectord
Additional
informatione
Total amount
Recipient country/
region/project/programmeb
Climate-specificf
Statusc
Funding sourceg
Financial instrumentg
Type of supportg, h
295

Table 7(b) IRL_BR1_v1.0
Provision of public financial support: contribution through bilateral, regional and other channels in 2011a
European euro - EUR USD
Sectord
Additional
informatione
Total amount
Recipient country/
region/project/programmeb
Climate-specificf
Statusc
Funding sourceg
Financial instrumentg
Type of supportg, h
Multi Country Recipients / CGIAR
Climate Programme
850,000.00 1,190,000.00 Provided ODA Grant Adaptation Agriculture
Multi Country Recipients / Climate
research and Advocacy
100,000.00 140,000.00 Provided ODA Grant Adaptation Other (Other)
Multi Country Recipients / Climate
research and Advocacy
90,000.00 130,000.00 Provided ODA Grant Adaptation Other (Other)
Multi Country Recipients / IFAD
global support
2,000,000.00 2,780,000.00 Provided ODA Grant Adaptation Agriculture
Multi Country Recipients / UNFCCC
LEG
50,000.00 70,000.00 Provided ODA Grant Adaptation Other (Other)
South Africa / Water Research
Commission
200,000.00 280,000.00 Provided ODA Grant Adaptation Water and sanitation
Tanzania / Agricultural Sectoral
Support Programme
4,430,000.00 6,160,000.00 Provided ODA Grant Adaptation Agriculture
Tanzania / Pastoralist Support
Programme
450,000.00 630,000.00 Provided ODA Grant Adaptation Agriculture
Uganda / Karamoja Livelihood
Support programme
500,000.00 700,000.00 Provided ODA Grant Adaptation Agriculture, Water and
sanitation
Vietnam / Civil Society Support 70,000.00 100,000.00 Provided ODA Grant Mitigation Other (Other)
Vietnam / One UN support initiative 50,000.00 70,000.00 Provided ODA Grant Other (Adaptation /
Mitigation)
Other (Other)
Zambia / Northern Province Support
Programme
790,000.00 1,100,000.00 Provided ODA Grant Adaptation Agriculture, Water and
sanitation
Zambia / Social Cash Transfer 1,100,000.00 1,530,000.00 Provided ODA Grant Adaptation Other (Other)
Multi Country Recipients /
Traditional seed systems -
Biodiversity International
410,000.00 570,000.00 Committed ODA Grant Adaptation Agriculture
Multi Country Recipients /
Conserving plant genetic resources
30,000.00 40,000.00 Committed OOF Grant Adaptation Agriculture
Multi Country Recipients / Global
Information and Early Warning
System (GIEWS)
100,000.00 140,000.00 Committed ODA Grant Adaptation Agriculture
296

Table 7(b) IRL_BR1_v1.0
Provision of public financial support: contribution through bilateral, regional and other channels in 2011a
European euro - EUR USD
Sectord
Additional
informatione
Total amount
Recipient country/
region/project/programmeb
Climate-specificf
Statusc
Funding sourceg
Financial instrumentg
Type of supportg, h
Somalia, Ethiopia, Kenya, Sudan,
Uganda / Horn of Africa - FAO
drought response program
130,000.00 180,000.00 Committed ODA Grant Adaptation Agriculture
Abbreviations: ODA = official development assistance, OOF = other official flows; USD = United States dollars.
Custom Footnotes
Notes: Figures subject to rounding; Exchange rate used in 2011is the Central Bank of Ireland annual average exchange rate: €1 = $1.392; (See http://centralbanl.ie/polstats/stats/exrates/Pages/default.aspx) Exchange rate used in
2012 is the Central Bank of Ireland annual average exchange rate: €1= $1.2848; (See http://www.centralbank.ie/polstats/stats/exrates/Pages/default.aspx). OECDDAC Environment and Rio Markers were used to track relevant
ODA climate finance expenditure.
d Parties may select several applicable sectors. Parties may report sectoral distribution, as applicable, under “Other”.
e Parties should report, as appropriate, on project details and the implementing agency.
f Parties should explain in their biennial reports how they define funds as being climate-specific.
g Please specify.
h Cross-cutting type of support refers to funding for activities which are cross-cutting across mitigation and adaptation.
a Parties should fill in a separate table for each year, namely 2011 and 2012, where 2014 is the reporting year.
b Parties should report, to the extent possible, on details contained in this table.
c Parties should explain, in their biennial reports, the methodologies used to specify the funds as provided, committed and/or pledged. Parties will provide the information for as many status categories as appropriate in the following
order of priority: provided, committed, pledged.
297
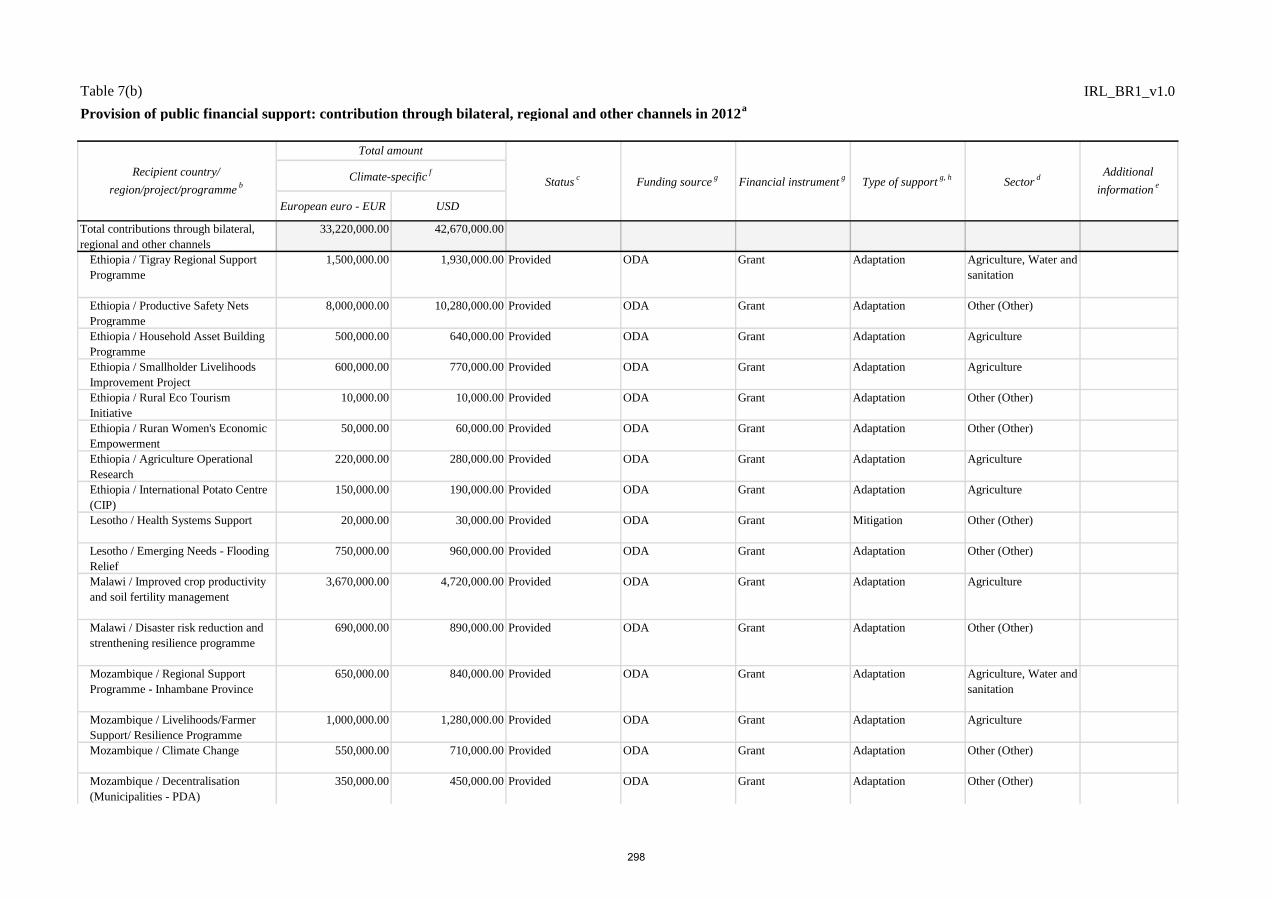
Table 7(b) IRL_BR1_v1.0
Provision of public financial support: contribution through bilateral, regional and other channels in 2012a
European euro - EUR USD
Total contributions through bilateral,
regional and other channels
33,220,000.00 42,670,000.00
Ethiopia / Tigray Regional Support
Programme
1,500,000.00 1,930,000.00 Provided ODA Grant Adaptation Agriculture, Water and
sanitation
Ethiopia / Productive Safety Nets
Programme
8,000,000.00 10,280,000.00 Provided ODA Grant Adaptation Other (Other)
Ethiopia / Household Asset Building
Programme
500,000.00 640,000.00 Provided ODA Grant Adaptation Agriculture
Ethiopia / Smallholder Livelihoods
Improvement Project
600,000.00 770,000.00 Provided ODA Grant Adaptation Agriculture
Ethiopia / Rural Eco Tourism
Initiative
10,000.00 10,000.00 Provided ODA Grant Adaptation Other (Other)
Ethiopia / Ruran Women's Economic
Empowerment
50,000.00 60,000.00 Provided ODA Grant Adaptation Other (Other)
Ethiopia / Agriculture Operational
Research
220,000.00 280,000.00 Provided ODA Grant Adaptation Agriculture
Ethiopia / International Potato Centre
(CIP)
150,000.00 190,000.00 Provided ODA Grant Adaptation Agriculture
Lesotho / Health Systems Support 20,000.00 30,000.00 Provided ODA Grant Mitigation Other (Other)
Lesotho / Emerging Needs - Flooding
Relief
750,000.00 960,000.00 Provided ODA Grant Adaptation Other (Other)
Malawi / Improved crop productivity
and soil fertility management
3,670,000.00 4,720,000.00 Provided ODA Grant Adaptation Agriculture
Malawi / Disaster risk reduction and
strenthening resilience programme
690,000.00 890,000.00 Provided ODA Grant Adaptation Other (Other)
Mozambique / Regional Support
Programme - Inhambane Province
650,000.00 840,000.00 Provided ODA Grant Adaptation Agriculture, Water and
sanitation
Mozambique / Livelihoods/Farmer
Support/ Resilience Programme
1,000,000.00 1,280,000.00 Provided ODA Grant Adaptation Agriculture
Mozambique / Climate Change 550,000.00 710,000.00 Provided ODA Grant Adaptation Other (Other)
Mozambique / Decentralisation
(Municipalities - PDA)
350,000.00 450,000.00 Provided ODA Grant Adaptation Other (Other)
Recipient country/
region/project/programmeb
Total amount
Statusc
Funding sourceg
Financial instrumentg
Type of supportg, h
Sectord
Additional
informatione
Climate-specificf
298

Table 7(b) IRL_BR1_v1.0
Provision of public financial support: contribution through bilateral, regional and other channels in 2012a
European euro - EUR USD
Recipient country/
region/project/programmeb
Total amount
Statusc
Funding sourceg
Financial instrumentg
Type of supportg, h
Sectord
Additional
informatione
Climate-specificf
Multi Country Recipients / IFAD
global support
2,000,000.00 2,570,000.00 Provided ODA Grant Adaptation Agriculture
Multi Country Recipients / Hunger
Reduction and Climate Change
Adaptation
100,000.00 130,000.00 Provided ODA Grant Adaptation Agriculture
Multi Country Recipients / Various
finance approved initiatives in
planning including supports to climate
advocacy, community resilience and
drought resiliance
1,750,000.00 2,250,000.00 Provided ODA Grant Adaptation Other (Other)
Multi Country Recipients / European
Forest Institute EU REDD facility
150,000.00 190,000.00 Provided ODA Grant Other (REDD+) Agriculture
Multi Country Recipients / Climate
Research and Advocacy
100,000.00 130,000.00 Provided ODA Grant Adaptation Other (Other)
Multry Country Recipients / Climate
Research and Advocacy
90,000.00 120,000.00 Provided ODA Grant Adaptation Industry
Multi Country Recipients / CGIAR
Climate Programme
850,000.00 1,090,000.00 Provided ODA Grant Adaptation Other (Other)
Multi Country Recipients / UNFCCC
LEG
50,000.00 60,000.00 Provided ODA Grant Adaptation Other (Other)
South Africa / Water Research
Commission
200,000.00 260,000.00 Provided ODA Grant Adaptation Water and sanitation
South Africa / Limpopo Water
Consortium
800,000.00 1,030,000.00 Provided ODA Grant Adaptation Water and sanitation
Tanzania / Agricultural Sectoral
Support Programme
4,000,000.00 5,140,000.00 Provided ODA Grant Adaptation Agriculture
Tanzania / Pastoralist Support
Programme
400,000.00 510,000.00 Provided ODA Grant Adaptation Agriculture
Tanzania / One UN support initiative 100,000.00 130,000.00 Provided ODA Grant Adaptation Other (Other)
Tanzania / Cocoa Value
Added/Market Programme
1,000,000.00 1,280,000.00 Provided ODA Grant Adaptation Agriculture
Uganda / Karamoja Livelihood
Support Programme
330,000.00 420,000.00 Provided ODA Grant Adaptation Agriculture
299

Table 7(b) IRL_BR1_v1.0
Provision of public financial support: contribution through bilateral, regional and other channels in 2012a
European euro - EUR USD
Recipient country/
region/project/programmeb
Total amount
Statusc
Funding sourceg
Financial instrumentg
Type of supportg, h
Sectord
Additional
informatione
Climate-specificf
Vietnam / One UN support initiative 50,000.00 60,000.00 Provided ODA Grant Other
(Adaptation/Mitigation
)
Other (Other)
Vietnam / Civil Society Support 130,000.00 170,000.00 Provided ODA Grant Mitigation Other (Other)
Vietnam / Programme 135 550,000.00 710,000.00 Provided ODA Grant Adaptation Other (Other)
Zambia / Northern Province Support
Programme
470,000.00 600,000.00 Provided ODA Grant Adaptation Agriculture, Water and
sanitation
Zambia / Social Cash Transfer 1,350,000.00 1,730,000.00 Provided ODA Grant Adaptation Other (Other)
Multi Country Recipients /
Benchmarking of methane emissions
for livestock production
40,000.00 50,000.00 Committed OOF Grant Other
(Adaptation/Mitigation
)
Agriculture
Abbreviations: ODA = official development assistance, OOF = other official flows; USD = United States dollars.
Custom Footnotes
Notes: Figures subject to rounding; Exchange rate used in 2011is the Central Bank of Ireland annual average exchange rate: €1 = $1.392; (See http://centralbanl.ie/polstats/stats/exrates/Pages/default.aspx) Exchange rate used in
2012 is the Central Bank of Ireland annual average exchange rate: €1= $1.2848; (See http://www.centralbank.ie/polstats/stats/exrates/Pages/default.aspx). OECDDAC Environment and Rio Markers were used to track relevant
ODA climate finance expenditure.
d Parties may select several applicable sectors. Parties may report sectoral distribution, as applicable, under “Other”.
e Parties should report, as appropriate, on project details and the implementing agency.
f Parties should explain in their biennial reports how they define funds as being climate-specific.
g Please specify.
h Cross-cutting type of support refers to funding for activities which are cross-cutting across mitigation and adaptation.
c Parties should explain, in their biennial reports, the methodologies used to specify the funds as provided, committed and/or pledged. Parties will provide the information for as many status categories as appropriate in the
following order of priority: provided, committed, pledged.
a Parties should fill in a separate table for each year, namely 2011 and 2012, where 2014 is the reporting year.
b Parties should report, to the extent possible, on details contained in this table.
300

Table 8 IRL_BR1_v1.0
Provision of technology development and transfer supporta,b
Recipient country and/or region Targeted area
Measures and activities
related to technology
transfer
Sectorc Source of the funding
for technology transferActivities undertaken by Status Additional information
d
a To be reported to the extent possible.
Custom Footnotes
b The tables should include measures and activities since the last national communication or biennial report.
c Parties may report sectoral disaggregation, as appropriate.
d Additional information may include, for example, funding for technology development and transfer provided, a short description of the measure or activity and co-financing arrangements.
Information on Ireland's provision of Technology development and transfer supports is outlined in Section VI of Ireland's first biennial report.
301

IRL_BR1_v1.0
Provision of capacity-building supporta
Recipient
country/regionTargeted area Programme or project title Description of programme or project
b,c
Ethiopia Adaptation Tigray Regional Support
Programme
Support to this drought prone region aimed at increasing resilience to
climatic and other shocks.
Ethiopia Multiple Areas Agriculture Operational
Research
Operational research programme, identifying best farming practices
to respond to climate variation and climatic shocks.
Ethiopia Technology
Development and
Transfer
International Potato Centre
(CIP)
Assistance to smallholder farmers to grow more productive climate
adapted varieties of potato and increase farmers incomes.
Malawi Multiple Areas Improved crop productivity
and soil fertility management
Malawi's national research system has developed new Vitamin A rich
sweet potato varieties with the support of the International Potato
Centre. The programme "Rooting Hunger in Malawi with Nutritious
Orange Fleshed Sweet Potatoes" is intended "to ensure the provision
of high quality, drought tolerant and disease free primary planting
material and determine the appropriate orange fleshed sweet potato
(OFSP) varieties to promote". Ultimately the programme seeks to
improve Vitamin A and energy intake for mothers and young
children, the group that are most vulnerable to Vitamin A deficiency.
A key objective is to support farmers with planting materials from
varieties that are adapted to climate change.
Malawi Multiple Areas Disaster risk reduction and
strengthening resilience
programme
The Local Development Support Programme strengthens 4 district
councils in central region: Dedza, Ntcheu, Balaka and Phalombe
reducing family vulnerability and strengthening household resilience
through improved district responses to disasters, building water and
sanitation systems, fuel efficient cook stoves and thermo electric
generators. In addition, the programme focuses on two Traditional
Authorities in Dedza and Ntcheu working with 32,000 households
(135,000 people) to improve family food security and nutrition
through enhanced food crop production adapted to climate change.
The Concern Universal programme promotes climate smart
agricultural practices to address issues of sustainable soil fertility,
through improved drought resistant food production, increased use of
small scale irrigation and promoting diversification of agricultural
food crop production.
Malawi Multiple Areas Livelihoods / Farmer Support
/ Resilience Programme
The overall goal of the programme is to increase smallholder farmer
yields and incomes through the provision of high quality affordable
seeds to smallholder farmers and also to facilitate the development of
a competitive seed industry which focuses on developing locally
climate adapted seed varieties of legumes. The programme builds on
other efforts to improve quality seed availability in Malawi. It
involves working with public sector institutions, the private sector
and non-governmental organisations with a view to strengthen the
seed development sector in Malawi. The programme will contribute
to improving the policy environment for seed trade and to strengthen
seed companies' commercial distribution networks for improved
seeds and complementary inputs.
Multi Country
Recipients
Multiple Areas CGIAR Climate Programme Specific support to the Climate Programme within CGIAR global
programmes.
Multi Country
Recipients
Adaptation UNFCCC LEG Least Developed countries expert group operating under the
UNFCCC framework.
Tanzania Multiple Areas Agricultural Sectoral Support
Programme
Promotion within the sectoral programme of conservation
agriculture, use of drought resistent crops, and drip fed irrigation
systems.
Tanzania Multiple Areas Pastoralist Support
Programme
Support for Basket fund for actions aimed to improve the livelihoods
of pastoral communities, including improving their resilience to
climatic shocks.
Uganda Multiple Areas Karamoja Livelihood Support
Programme
This programme addresses the key vulnerabilities of this mainly
pastoralist community, increasing their resilience to climatic and
other shocks.
Zambia Multiple Areas Northern Province Support
Programme
Water and sanitation interventions, climate smart agriculture, and
afforestation activities are all covered under this programme.
302

IRL_BR1_v1.0
Provision of capacity-building supporta
Recipient
country/regionTargeted area Programme or project title Description of programme or project
b,c
Mozambique Multiple Areas Building capacity to adapt to
Climate Change
Inhambane is prone to cyclical floods and droughts, which have
become more frequent and intense over recent years. Given the high
percentage of the provincial population which is dependent on
subsistence agriculture and natural resource extraction, managing the
response to these problems is critical. Key measures supported by
Ireland in the Province during 2012 related to climate change
adaptation and included support to the Provincial Directorate of
Public Works (including rural water supply and sanitation, with
construction of cisterns for rain water harvesting at community level
in low rainfall and drought prone areas; support for the construction
of boreholes to improve access to safe drinking; build with solar
panel pumps to increase the availability of water sources); Support to
the Agriculture Directorate in promoting drought resistant crops
through the Department of Agriculture; replanting of fruit trees in
schools and hospitals and support to an Integrated Water
Management study in Inhambane Province and implementation of its
recommendations. Irish Aid support was also directed at capacity
strengthening in the governance of the Province.
a To be reported to the extent possible.
c Additional information may be provided on, for example, the measure or activity and co-financing arrangements.
Custom Footnotes
b Each Party included in Annex II to the Convention shall provide information, to the extent possible, on how it has provided capacity-building support
that responds to the existing and emerging capacity-building needs identified by Parties not included in Annex I to the Convention in the areas of
mitigation, adaptation and technology development and transfer.
The information provided in this Table is compiled based on information extrapolated from different documents currently available. However, this is a
preliminary list as there are indeed a number of technology transfer and capacity building activities that are embedded in many of our projects, but the
details are not directly to hand.
303