National Greenhouse Gas Inventory Report of JAPAN...Table of Contents iv National Greenhouse Gas...
410
National Greenhouse Gas Inventory Report of JAPAN May, 2006 Ministry of the Environment, Japan Greenhouse Gas Inventory Office of Japan (GIO), CGER, NIES Center for Global Environmental Research National Institute for Environmental Studies, Japan
Transcript of National Greenhouse Gas Inventory Report of JAPAN...Table of Contents iv National Greenhouse Gas...
National Greenhouse Gas Inventory Report of JAPAN
May, 2006
Ministry of the Environment, Japan Greenhouse Gas Inventory Office of Japan (GIO), CGER, NIES
Center for Global Environmental Research National Institute for Environmental Studies, Japan

Table of Contents
National Greenhouse Gas Inventory Report of Japan 2006 i
Table of Contents Acknowledgement Preface Executive Summary of National GHGs Inventory Report of Japan 2005 1
E.S.1. BACKGROUND INFORMATION ON GREENHOUSE GAS INVENTORIES AND CLIMATE CHANGE 1
E.S.2. SUMMARY OF NATIONAL EMISSION AND REMOVAL RELATED TRENDS 1 E.S.3. OVERVIEW OF SOURCE AND SINK CATEGORY EMISSION
ESTIMATES AND TRENDS 3 E.S.4. OTHER INFORMATION (INDIRECT GREENHOUSE GASES) 4
CHAPTER 1. INTRODUCTION AND QA/QC PLAN 1.1
1.1. BACKGROUND INFORMATION ON GREENHOUSE GAS INVENTORIES AND CLIMATE CHANGE 1.1
1.2. QA/QC PLAN 1.1 1.2.1. Inventory Compilation System 1.1 1.2.2. Brief General Description of Methodologies and Data Sources Used 1.3 1.2.3. Brief Description of the Process of Inventory Preparation
and Implementation of QA/QC 1.4 1.2.4. Brief Description of Key Categories 1.6
1.3. FURTHER INVENTORY DEVELOPMENT 1.7 1.3.1. Crosscutting Issues 1.7 1.3.2. Energy (Category1) 1.7
1.3.2.1. Fuel Combustion (CO2) 1.7 1.3.2.2. Fuel Combustion (Stationary Sources: CH4, N2O) 1.7 1.3.2.3. Fuel Combustion (Mobile Sources: CH4, N2O) 1.8
1.3.3. Industrial Processes (Category2) 1.8 1.3.3.1. CO2, CH4 and N2O 1.8 1.3.3.2. F-gas 1.8
1.3.4. Use of Solvents and Other Products (Category 3) 1.9 1.3.5. Agriculture (Category4) 1.9 1.3.6. Land-Use, Land-Use Change and Forestry (Category5) 1.9 1.3.7. Waste (Category6) 1.10
1.4. GENERAL UNCERTAINTY EVALUATION, INCLUDING DATA ON THE OVERALL UNCERTAINTY FOR THE INVENTORY TOTALS 1.10 1.4.1. Uncertainty of Japan’s Total Emissions 1.10
1.5. GENERAL ASSESSMENT OF THE COMPLETENESS 1.11 CHAPTER 2. TRENDS IN GHGS EMISSIONS AND REMOVALS 2.1
2.1. DESCRIPTION AND INTERPRETATION OF EMISSION AND REMOVAL TRENDS FOR AGGREGATE GREENHOUSE GASES 2.1 2.1.1. Greenhouse Gas Emissions and Removals 2.1 2.1.2. CO2 Emissions Per Capita 2.2 2.1.3. CO2 Emissions Per Unit of GDP 2.2
2.2. DESCRIPTION AND INTERPRETATION OF EMISSION AND REMOVAL
Table of Contents
ii National Greenhouse Gas Inventory Report of Japan 2006
TRENDS BY GAS 2.3 2.2.1. CO2 2.4 2.2.2. CH4 2.6 2.2.3. N2O 2.7 2.2.4. HFCs 2.8 2.2.5. PFCs 2.8 2.2.6. SF6 2.9
2.3. DESCRIPTION AND INTERPRETATION OF EMISSION AND REMOVAL TRENDS BY CATEGORIES 2.10 2.3.1. Energy 2.12 2.3.2. Industrial Processes 2.12 2.3.3. Solvent and Other Product Use 2.13 2.3.4. Agriculture 2.13 2.3.5. Land-Use Change and Forestry 2.14 2.3.6. Waste 2.15
2.4. DESCRIPTION AND INTERPRETATION OF EMISSION TRENDS FOR INDIRECT GREENHOUSE GASES AND SO2 2.15
CHAPTER 3. ENERGY (CRF SECTOR 1) 3.1
3.1. FUEL COMBUSTION (1.A.) 3.1 3.1.1. Fuel Combustion (CO2) 3.1 3.1.2. Stationary Combustion (1.A.1., 1.A.2., 1.A.4.: CH4 and N2O) 3.8 3.1.3. Mobile Combustion (1.A.3.: CH4 and N2O) 3.14
3.1.3.1. Civil Aviation (1.A.3.a.) 3.14 3.1.3.2. Road Transportation (1.A.3.b. ) 3.15 3.1.3.3. Railways (1.A.3.c. ) 3.21 3.1.3.4. Navigation (1.A.3.d.) 3.23
3.2. FUGITIVE EMISSIONS FROM FUELS (1.B.) 3.24 3.2.1. Solid Fuels (1.B.1.) 3.24
3.2.1.1. Coal Mining and Handling (1.B.1.a.) 3.24 3.2.1.2. Solid Fuel Transformation (1.B.1.b.) 3.27
3.2.2. Oil and Natural Gas (1.B.2.) 3.27 3.2.2.1. Oil (1.B.2.a.) 3.27 3.2.2.2. Natural Gas (1.B.2.b.) 3.32 3.2.2.3. Venting and Flaring (1.B.2.c.) 3.36
CHAPTER 4. INDUSTRIAL PROCESSES (CRF SECTOR 2) 4.1
4.1. MINERAL PRODUCTS (2.A.) 4.3 4.1.1. Cement Production (2.A.1.) 4.3 4.1.2. Lime Production (2.A.2.) 4.5 4.1.3. Limestone and Dolomite Use (2.A.3.) 4.7 4.1.4. Soda Ash Production and Use (2.A.4.) 4.10
4.1.4.1. Soda Ash Production (2.A.4.-) 4.10 4.1.4.2. Soda Ash Use (2.A.4.-) 4.10
4.1.5. Asphalt Roofing (2.A.5.) 4.10 4.1.6. Road Paving with Asphalt (2.A.6.) 4.11
4.2. CHEMICAL INDUSTRY (2.B.) 4.11 4.2.1. Ammonia Production (2.B.1.) 4.11
Table of Contents
National Greenhouse Gas Inventory Report of Japan 2006 iii
4.2.2. Nitric Acid Production (2.B.2.) 4.12 4.2.3. Adipic Acid Production (2.B.3.) 4.13 4.2.4. Carbide Production (2.B.4.) 4.15
4.2.4.1. Silicon Carbide (2.B.4.-) 4.15 4.2.4.2. Calcium Carbide (2.B.4.-) 4.16
4.2.5. Other (2.B.5.) 4.17 4.2.5.1. Carbon Black (2.B.5.-) 4.17 4.2.5.2. Ethylene (2.B.5.-) 4.18 4.2.5.3. 1,2-Dichloroethane (2.B.5.-) 4.19 4.2.5.4. Styrene (2.B.5.-) 4.21 4.2.5.5. Methanol (2.B.5.-) 4.22 4.2.5.6. Coke (2.B.5.-) 4.22
4.3. METAL PRODUCTION (2.C.) 4.25 4.3.1. Iron and Steel Production (2.C.1.) 4.25
4.3.1.1. Steel (2.C.1.-) 4.25 4.3.1.2. Pig Iron (2.C.1.-) 4.25 4.3.1.3. Sinter (2.C.1.-) 4.25 4.3.1.4. Coke (2.C.1.-) 4.26 4.3.1.5. Use of Electric Arc Furnaces in Steel Production (2.C.1-) 4.26
4.3.2. Ferroalloys Production (2.C.2.) 4.26 4.3.3. Aluminium Production (2.C.3.) 4.27 4.3.4. SF6 Used in Aluminium and Magnesium Foundries (2.C.4.) 4.28
4.3.4.1. Aluminium 4.28 4.3.4.2. Magnesium 4.28
4.4. OTHER PRODUCTION (2.D.) 4.28 4.4.1. Pulp and Paper (2.D.1.) 4.28 4.4.2. Food and Drink (2.D.2.) 4.28
4.5. PRODUCTION OF HALOCARBONS AND SF6 (2.E.) 4.29 4.5.1. By-product Emissions: Production of HCFC-22 (2.E.1.-) 4.29 4.5.2. Fugitive Emissions (2.E.2.) 4.29
4.6. CONSUMPTION OF HALOCARBONS AND SF6 (2.F.) 4.30 4.6.1. Refrigeration and Air Conditioning Equipment (2.F.1.) 4.30
4.6.1.1. Domestic Refrigeration (2.F.1.-) 4.30 4.6.1.2. Commercial Refrigeration (2.F.1.-) 4.30 4.6.1.3. Transport Refrigeration (2.F.1.-) 4.32 4.6.1.4. Industrial Refrigeration (2.F.1.-) 4.32 4.6.1.5. Stationary Air-Conditioning (Household) (2.F.1.-) 4.32 4.6.1.6. Mobile Air-Conditioning (Car Air Conditioners) (2.F.1.-) 4.33
4.6.2. Foam Blowing (2.F.2.) 4.34 4.6.2.1. Hard Form (2.F.2.-) 4.34 4.6.2.2. Soft Form (2.F.2.-) 4.35
4.6.3. Fire Extinguishers (2.F.3.) 4.35 4.6.4. Aerosols/Metered Dose Inhalers (2.F.4.) 4.36
4.6.4.1. Aerosols (2.F.4.-) 4.36 4.6.4.2. Metered Dose Inhalers (2.F.4.-) 4.36
4.6.5. Solvents (2.F.5.) 4.37 4.6.6. Other applications using ODS substitutes (2.F.6.) 4.37 4.6.7. Semiconductors (2.F.7.) 4.37
Table of Contents
iv National Greenhouse Gas Inventory Report of Japan 2006
4.6.8. Electrical Equipment (2.F.8.) 4.38 CHAPTER 5. SOLVENT AND OTHER PRODUCT USE (CRF SECTOR 3) 5.1
5.1. PAINT APPLICATION (3.A.) 5.1 5.2. DEGREASING AND DRY-CLEANING (3.B.) 5.1 5.3. CHEMICAL PRODUCTS, MANUFACTURE AND PROCESSING (3.C.) 5.1 5.4. OTHER (3.D.) 5.2
5.4.1. Use of Nitrous Oxide for Anesthesia (3.D.-) 5.2 5.4.2. Fire Extinguishers (3.D.-) 5.2 5.4.3. Aerosol Cans (3.D.-) 5.3
CHAPTER 6. AGRICULTURE (CRF SECTOR 4) 6.1
6.1. ENTERIC FERMENTATION (4.A.) 6.2 6.1.1. Cattle (4.A.1.) 6.1 6.1.2. Buffalo, Sheep, Goats, Horses & Swine (4.A.2., 4.A.3., 4.A.4., 4.A.6., 4.A.8.) 6.4 6.1.3. Poultry (4.A.9.) 6.5 6.1.4. Camels and Llamas, Mules and Asses (4.A.5., 4.A.7.) 6.5 6.1.5. Other (4.A.10.) 6.6
6.2. MANURE MANAGEMENT (4.B.) 6.6 6.2.1. Cattle, Swine and Poultry (4.B.1., 4.B.8., 4.B.9.: CH4, N2O) 6.6 6.2.2. Buffalo, Sheep, Goats & Horses (4.B.2., 4.B.3., 4.B.4., 4.B.6.) 6.16 6.2.3. Camels and Llamas, Mules and Asses (4.B.5., 4.B.7.) 6.19 6.2.4. Other (4.B.10.) 6.19
6.3. RICE CULTIVATION (4.C.) 6.19 6.3.1. Intermittently Flooded (Single Aeration) (4.C.1.-) 6.19 6.3.2. Continuously Flooded (4.C.1.-) 6.21 6.3.3. Rainfed & Deep Water (4.C.2., 4.C.3.) 6.22 6.3.4. Other (4.C.4.) 6.22
6.4. AGRICULTURAL SOILS (4.D.) 6.23 6.4.1. Direct Soil Emissions (N2O) (4.D.1.) 6.23
6.4.1.1. Synthetic Fertilizers (4.D.1.-) 6.23 6.4.1.2. Organic Fertilizer (Application of Animal Waste) (4.D.1.-) 6.25 6.4.1.3. N-fixing Crops (4.D.1.-) 6.26 6.4.1.4. Crop Residue (4.D.1.-) 6.26 6.4.1.5. Plowing of Organic Soil (4.D.1.-) 6.28
6.4.2. Pasture, Range and Paddock Manure (4.D.2.) 6.29 6.4.3. Indirect Emissions (4.D.3.) 6.29
6.4.3.1. Atmospheric Deposition (4.D.3.-) 6.29 6.4.3.2. Nitrogen Leaching and Run-off (4.D.3.-) 6.32 6.4.3.3. Indirect Emissions (CH4) (4.D.3.-) 6.32
6.4.4. Other (4.D.4.) 6.33 6.5. PRESCRIBED BURNING OF SAVANNAS (4.E.) 6.33 6.6. FIELD BURNING OF AGRICULTURAL RESIDUES (4.F.) 6.33
6.6.1. Rice Wheat, Barley, Rye and Oat s (4.F.1.) 6.33 6.6.2. Maize, Peas, Soybeans, Adzuki beans, Kidney beans, Peanuts,
Potatoes, Sugarbeet & Sugar cane (4.F.1., 4.F.2., 4.F.3., 4.F.4.) 6.36 6.6.3. Dry bean (4.F.2.-) 6.37 6.6.4. Other (4.F.5.) 6.37
Table of Contents
National Greenhouse Gas Inventory Report of Japan 2006 v
CHAPTER 7. LAND-USE CHANGE AND FORESTRY (CRF SECTOR5) 7.1
7.1. METHOD OF DETERMINING LAND USE CATEGORIES 7.1 7.1.1. Basic approach 7.1 7.1.2. Method of determining land use categories and areas 7.1 7.1.3. Survey method and due date of major land area statistics 7.2
7.2. FOREST LAND (5.A.) 7.3 7.2.1. Forest land remaining Forest land (5.A.1.) 7.3 7.2.2. Land converted to Forest land (5.A.2.) 7.11
7.3. CROPLAND (5.B.) 7.17 7.3.1. Cropland remaining Cropland (5.B.1.) 7.17 7.3.2. Land converted to Cropland (5.B.2.) 7.17
7.4. GRASSLAND (5.C.) 7.20 7.4.1. Grassland remaining Grassland (5.C.1.) 7.20 7.4.2. Land converted to Grassland (5.C.2.) 7.21
7.5. WETLANDS (5.D.) 7.24 7.5.1. Wetlands remaining Wetlands (5.D.1.) 7.24 7.5.2. Land converted to Wetlands (5.D.2.) 7.24
7.6. SETTLEMENTS (5.E.) 7.26 7.6.1. Settlements remaining Settlements (5.E.1.) 7.26 7.6.2. Land converted to Settlements (5.E.2.) 7.28
7.7. OTHER LAND (5.F.) 7.30 7.7.1. Other land remaining Other land (5.E.1.) 7.30 7.7.2. Land converted to Other land (5.E.2.) 7.30
7.8. Non CO2 Gases 7.33 7.8.1. Direct N2O emissions from N fertilization (5.(I)) 7.33 7.8.2. N2O emissions from drainage of soils (5.(II)) 7.33 7.8.3. N2O emissions from disturbance associated with land-use conversion
to cropland (5.(III)) 7.34 7.8.4. Carbon emissions from agricultural lime application (5.(IV)) 7.34 7.8.5. Biomass burning (5.(V)) 7.34
CHAPTER 8. WASTE (CRF SECTOR6) 8.1
8.1. SOLID WASTE DISPOSAL ON LAND (6.A.) 8.1 8.1.1. Emissions from Controlled Landfill Sites (6.A.1.) 8.2 8.1.2. Emissions from Other Controlled Landfill Sites (6.A.3) 8.9
8.2. WASTEWATER HANDLING (6.B.) 8.11 8.2.1. Industrial Wastewater (6.B.1.) 8.12 8.2.2. Domestic and Commercial Wastewater (6.B.2.) 8.15
8.2.2.1. Sewage Treatment Plant (6.B.2.-) 8.15 8.2.2.2. Domestic Sewage Treatment Plant (Private Sewerage Tank) (6.B.2.-) 8.16 8.2.2.3. Human-Waste Treatment Plant (6.B.2.-) 8.18 8.2.2.4. Emission from the Natural Decomposition of Domestic Wastewater
(6.B.2.-) 8.22 8.3. WASTE INCINERATION (6.C.) 8.24
8.3.1. Incineration of Municipal Solid Waste, Industrial Waste, and Specially controlled Industrial Waste (6.C.-) 8.25 8.3.1.1. Municipal Solid Waste Incineration(6.C.-) 8.25
Table of Contents
vi National Greenhouse Gas Inventory Report of Japan 2006
8.3.1.2. Industrial Wastes Incineration(6.C.-) 8.30 8.3.1.3. Incineration of Specially controlled Industrial Waste (6.C.-) 8.35
8.3.2. Waste Used as Alternative Fuels (6.C.-) 8.37 8.4. Emissions from the Decomposition of Petroleum-Derived Surfactants (6.D.) 8.45
CHAPTER 9. OTHER (CRF SECTOR 7) 9.1
9.1. CO2, CH4, N2O, HFCs, PFCs AND SF6 9.1 9.2. NOX, CO, NMVOC AND SO2 9.1
CHAPTER 10. RECALCULATION AND IMPROVEMENTS 10.1
10.1. EXPLANATION AND JUSTIFICATION FOR RECALCULATIONS 10.1 10.1.1. General 10.1 10.1.2. Energy sector 10.1
10.1.2.1. 1.A. Fuel Combustion (Stationary Combustion): CO2 10.1 10.1.2.2. 1.A. Fuel Combustion (Stationary Combustion): CH4 and N2O 10.3 10.1.2.3. 1.A.3. Fuel Combustion (Mobile Combustion): CH4 and N2O 10.3 10.1.2.4. 1.B. Fugitive emissions from fuels 10.4
10.1.3. Industrial process sector 10.5 10.1.4. Agricultural sector 10.7 10.1.5. Land Use, Land-Use Change, and Forestry (LULUCF) Sector 10.8 10.1.6. Waste sector 10.9
10.1.6.1. New and Revised Estimation Methods 10.9 10.1.6.2. Sector Reorganization for Reporting of Waste Used
as Alternative Energy 10.12 10.2. IMPLICATIONS FOR EMISSION LEVELS 10.13 10.3. IMPLICATION FOR EMISSION TRENDS, INCLUDING TIME SERIES
CONSISTENCY 10.14 10.4. RECALCULATIONS, INCLUDING IN RESPONSE TO THE REVIEW
PROCESS, AND PLANNED IMPROVEMENTS TO THE INVENTORY 10.15 10.4.1. Improvements from inventory submitted last year 10.15
10.4.1.1. Methodology for estimating emissions of GHGs 10.15 10.4.1.2. National Inventory Report (NIR) 10.17 10.4.1.3. Common Reporting Format (CRF) 10.18
Annex 1. Key Categories Annex 2. Detailed Discussion of Methodology and Data for estimating CO2 Emissions from
Fossil Fuel Combustion Annex 3. Other Detailed Methodological Descriptions for Individual Source or Sink Categories Annex 4. CO2 Reference Approach and Comparison with Sectoral Approach, and Relevant
Information on the National Energy Balance Annex 5. Assessment of Completeness and (Potential) Sources and Sinks of Greenhouse Gas
Emissions and Removals Excluded Annex 6. Additional Information to be considered as part of the NIR Submission or Other Useful
Reference Information Annex 7. Methodology and Results of Uncertainty Assessment Annex 8. National Greenhouse Gas Emissions in Fiscal Year 2003 (for Domestic Publication) Annex 9. Hierarchical Structure of Japan’s National GHG Inventory File System Annex 10. Summary of Common Reporting Format
Acknowledgement
National Greenhouse Gas Inventory Report of Japan 2006
Acknowledgement The Kyoto Protocol accepted by Japan in June 2002 targets the reduction of six greenhouse
gases (GHGs): carbon dioxide (CO2); methane (CH4); nitrous oxide (N2O); hydrofluorocarbons (HFCs); perfluorocarbons (PFCs); and sulfur hexafluoride (SF6). Quantified targets for reductions in emissions of greenhouse gases have been set for each of the developed nations. The target given to Japan for the first commitment period (five years from 2008 to 2012), is to reduce average emissions of greenhouse gases by six percent from the base year (1990 for carbon dioxide, methane and nitrous oxide, and 1995 for HFCs, PFCs, and sulfur hexafluoride). At the same time, the developed countries are required to improve the accuracy of their emission estimates, and by one year before the beginning of the commitment period (2007), a national system for the estimation of anthropogenic emissions by sources and removals by sinks of the aforementioned greenhouse gases must have in place. The GHGs inventories are therefore important data for Japan in reporting its achievement of the Kyoto Protocol’s commitment.
Estimation of GHGs emissions has started in Japan since the latter half of the 1980s. Since 1992, with the cooperation of ministries, the Environment Agency has estimated carbon dioxide emissions and has submitted annual reports to the Council of Ministers for Global Environmental Conservation every year. The Government also publicizes total emissions of greenhouse gases in Japan.
The GHGs inventory including this report represents the combined knowledge of over 70 experts in a range of fields from universities, industrial bodies, regional governments, relevant government departments and agencies, and relevant research institutes, who are members of the Committee for the Greenhouse Gas Emissions Estimation Methods established in November 1999 and has been often held since then.
In compiling GHGs inventories, the Greenhouse Gas Inventory Office of Japan (GIO) would like to acknowledge not just the work of the Committee members in seeking to develop the methodology, but those experts who made available the latest scientific knowledge, the industrial bodies and government departments and agencies that made available the data necessary to compile the inventories, and the Mitsubishi UFJ Research and Consulting and the Suuri Keikaku Co. Ltd. who provided immeasurable assistance in compiling the inventories. We would like to express our gratitude to the Climate Change Policy Division of the Global Environment Bureau of the Ministry of the Environment for their efforts and support to the establishment of the GIO in July 2002.
Tomoyuki Aizawa, a GIO researcher, and Atsushi Sato, a GIO collaborating researcher, were responsible for writing this report and compiling the inventory files. Chisa Umemiya, a GIO assistant fellow, did proofreading. Finally, our Secretary, Masako White conducted relevant administrative duties including the liaison with the Convention Secretariat.
May, 2006 Yukihiro Nojiri Manager Greenhouse Gas Inventory Office of Japan (GIO) Center for Global Environmental Research National Institute for Environmental Studies

National Greenhouse Gas Inventory Report of Japan 2006
Preface
National Greenhouse Gas Inventory Report of Japan 2006
Preface On the basis of Article 4 and 12 of the United Nations Framework Convention on Climate
Change (UNFCCC), all Parties to the Convention are required to submit national inventories of greenhouse gas emissions and removals to the Secretariat of the Convention. Therefore, the inventories on emissions and removals of greenhouse gases and precursors are reported in the Common Reporting Format (CRF) and in this National Inventory Report, in accordance with UNFCCC Inventory Reporting Guidelines (FCCC/SBTA/2004/8).
This Report presents Japan’s institutional arrangement for the inventory preparation, the estimation methods of greenhouse gas emissions and removals from sources and sinks, the trends in emissions and removals for greenhouse gases (carbon dioxide (CO2); methane (CH4); nitrous oxide (N2O); hydrofluorocarbons (HFCs); perfluorocarbons (PFCs); and sulfur hexafluoride (SF6)) and precursors (nitrogen oxides (NOX), carbon monoxide (CO), non-methane volatile organic compounds (NMVOC), and sulfur dioxide (SO2)).
The structure of this report is fully in line with the recommended structure indicated in the
Annex I of UNFCCC Inventory Reporting Guidelines (FCCC/SBSTA/2004/8). The Executive Summary focuses on the latest trends in emissions and removals of
greenhouse gases in Japan. Chapter 1 deals with the institutional arrangement for the inventory preparation, summary of the estimation methodology, key source category analysis, and results of uncertainty assessment. Chapter 2 describes the latest information on trends in emissions and removals of greenhouse gases in Japan. Chapters 3 to 8 provide the detailed estimation methods for emissions and removals respectively, described in the Revised 1996 IPCC Guidelines. Chapter 9 comprises current status of reporting of the emissions from sources not covered by IPCC guidelines. Chapter 10 provides the explanations on improvement and recalculation (data revision, addition of new source, etc.) from since the previous submission.
Annex offers additional information to assist further understanding of Japan’s inventory. The background data submitted to the secretariat provides the complete process of estimating Japan’s inventory.
For the latest updates or changes in data, refer to the web-site (URL: www-gio.nies.go.jp) of the Greenhouse Gas Inventory Office of Japan (GIO).
May, 2006
Climate Change Policy Division Global Environment Bureau Ministry of the Environment
Preface
National Greenhouse Gas Inventory Report of Japan 2006
Executive Summary
National Greenhouse Gas Inventory Report of Japan 2006 Page.1
Executive Summary of National GHGs Inventory Report of Japan 2006
E.S. 1. Background Information on Greenhouse Gas Inventories and
Climate Change
This National Inventory Report comprises the inventory of the emissions and removals of greenhouse gases, indirect greenhouse gases and SO2 in Japan for fiscal 1990 through to 20041, on the basis of Article 4 and 12 of the United Nations Framework Convention on Climate Change (UNFCCC).
Estimation methodologies of greenhouse gas inventories should be in line with the Revised 1996 IPCC Guidelines for National Greenhouse Gas Inventories (hereafter, Revised 1996 IPCC Guidelines) which was developed by the Intergovernmental Panel on Climate Change (IPCC). In 2000, the Good Practice and Uncertainty Management in National Greenhouse Gas Inventories (2000) (hereafter, the Good Practice Guidance (2000)) was published. The Guidance presents the methods for choosing methodologies appropriate to the circumstances of each country and quantitative methods for evaluating uncertainty. Parties are required to seek to apply the Good Practice Guidance (2000) to their inventory reporting from 2001 and after ward.
For the submission of Japan’s inventories, the trial use of the UNFCCC Reporting Guidelines on Annual Inventories (FCCC/SBSTA/2004/8) has been determined by the Conference of the Parties, and the inventory will be reported in accordance with this guideline. For the preparation of the LULUCF inventory, the IPCC Good Practice Guidance for Land Use, Land-Use Change and Forestry (hereafter, LULUCF-GPG) was published in 2003, and parties are required to seek to apply the LULUCF-GPG to their inventory reporting from 2005 and after ward.
E.S. 2. Summary of National Emission and Removal Related Trends
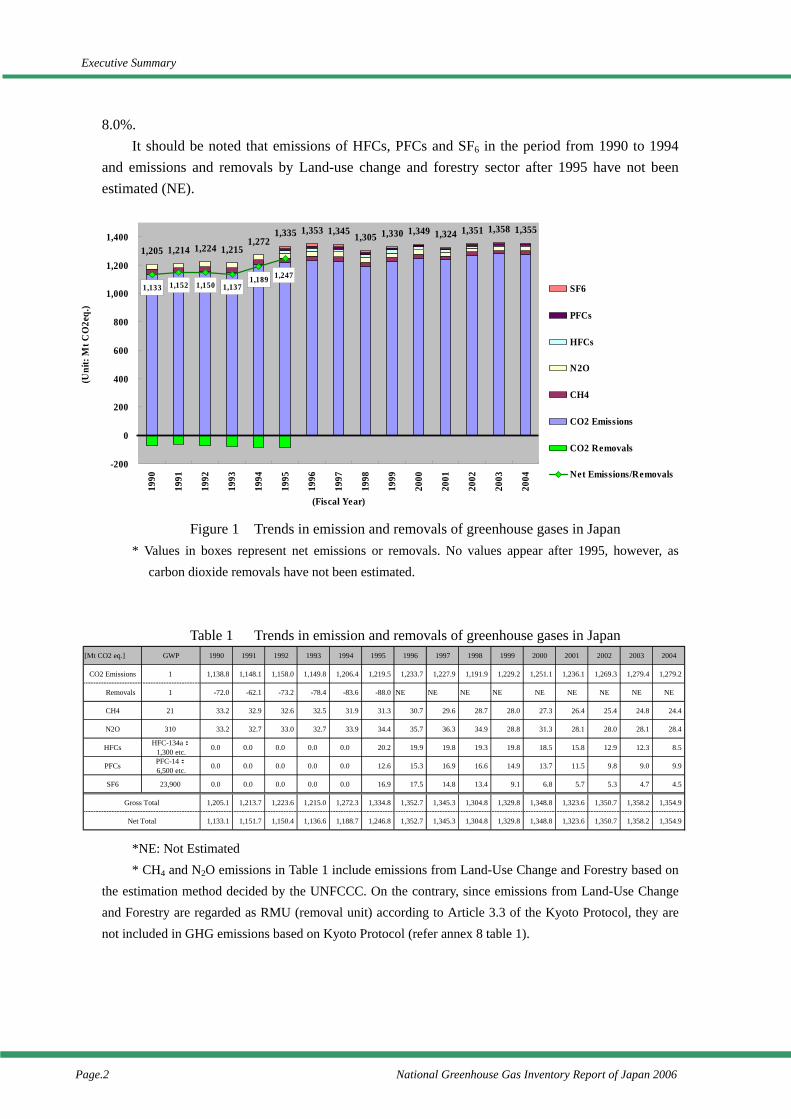
Total greenhouse gas emission in fiscal 2004 (the sum of emissions of each type of greenhouse gas multiplied by its global warming potential [GWP]2; except for carbon dioxide removals) was 1,530 million tons (in CO2 equivalents), an increase by 12.2% from FY1990. Removals of carbon dioxide in FY1995 were 88.0 million tons3, an increase by 22.2% from FY1990. Compared to emissions in the base year under the Kyoto Protocol (FY1990 for emissions of CO2, CH4, N2O; FY1995 for emissions of HFCs, PFCs, and SF6), it increased by
1 “Fiscal” is used because CO2 is the primary GHGs emissions and estimated on the fiscal year basis; from April
of the year to March of the next year. 2 Global Warming Potential (GWP): It is the coefficients that indicate degrees of greenhouse gas effects caused
by greenhouse gases converted into the proportion of equivalent degrees of CO2. The coefficients are subjected to the Second National Assessment Report (1995) issued by the Intergovernmental Panel on Climate Change (IPCC).
3 In the inventory submitted under the FCCC, removals by forest planted before 1990 are contained. Therefore, this value do not correspond to 13 Mt indicated in the annex of “Draft decision -/CMP.1 (Land use, land-use change and forestry) (FCCC/CP/2001/13/Add.1 p54) adopted in the decision 11/COP7.
Executive Summary
Page.2 National Greenhouse Gas Inventory Report of Japan 2006
8.0%. It should be noted that emissions of HFCs, PFCs and SF6 in the period from 1990 to 1994
and emissions and removals by Land-use change and forestry sector after 1995 have not been estimated (NE).
Figure 1 Trends in emission and removals of greenhouse gases in Japan * Values in boxes represent net emissions or removals. No values appear after 1995, however, as
carbon dioxide removals have not been estimated.
Table 1 Trends in emission and removals of greenhouse gases in Japan *NE: Not Estimated * CH4 and N2O emissions in Table 1 include emissions from Land-Use Change and Forestry based on
the estimation method decided by the UNFCCC. On the contrary, since emissions from Land-Use Change and Forestry are regarded as RMU (removal unit) according to Article 3.3 of the Kyoto Protocol, they are not included in GHG emissions based on Kyoto Protocol (refer annex 8 table 1).
1,205 1,214 1,224 1,2151,272
1,335 1,353 1,345 1,305 1,330 1,349 1,324 1,351 1,358 1,355
1,133 1,152 1,150 1,1371,189 1,247
-200
0
200
400
600
800
1,000
1,200
1,400
1990
1991
1992
1993
1994
1995
1996
1997
1998
1999
2000
2001
2002
2003
2004
(Fiscal Year)
(Uni
t: M
t CO
2eq.
)
SF6
PFCs
HFCs
N2O
CH4
CO2 Emissions
CO2 Removals
Net Emissions/Removals
[Mt CO2 eq.] GWP 1990 1991 1992 1993 1994 1995 1996 1997 1998 1999 2000 2001 2002 2003 2004
CO2 Emissions 1 1,138.8 1,148.1 1,158.0 1,149.8 1,206.4 1,219.5 1,233.7 1,227.9 1,191.9 1,229.2 1,251.1 1,236.1 1,269.3 1,279.4 1,279.2
CO2 Removals 1 -72.0 -62.1 -73.2 -78.4 -83.6 -88.0 NE NE NE NE NE NE NE NE NE
CH4 21 33.2 32.9 32.6 32.5 31.9 31.3 30.7 29.6 28.7 28.0 27.3 26.4 25.4 24.8 24.4
N2O 310 33.2 32.7 33.0 32.7 33.9 34.4 35.7 36.3 34.9 28.8 31.3 28.1 28.0 28.1 28.4
HFCs HFC-134a:1,300 etc. 0.0 0.0 0.0 0.0 0.0 20.2 19.9 19.8 19.3 19.8 18.5 15.8 12.9 12.3 8.5
PFCs PFC-14:6,500 etc. 0.0 0.0 0.0 0.0 0.0 12.6 15.3 16.9 16.6 14.9 13.7 11.5 9.8 9.0 9.9
SF6 23,900 0.0 0.0 0.0 0.0 0.0 16.9 17.5 14.8 13.4 9.1 6.8 5.7 5.3 4.7 4.5
Gross Total 1,205.1 1,213.7 1,223.6 1,215.0 1,272.3 1,334.8 1,352.7 1,345.3 1,304.8 1,329.8 1,348.8 1,323.6 1,350.7 1,358.2 1,354.9
Net Total 1,133.1 1,151.7 1,150.4 1,136.6 1,188.7 1,246.8 1,352.7 1,345.3 1,304.8 1,329.8 1,348.8 1,323.6 1,350.7 1,358.2 1,354.9
Executive Summary
National Greenhouse Gas Inventory Report of Japan 2006 Page.3
E.S. 3. Overview of Source and Sink Category Emission Estimates and Trends
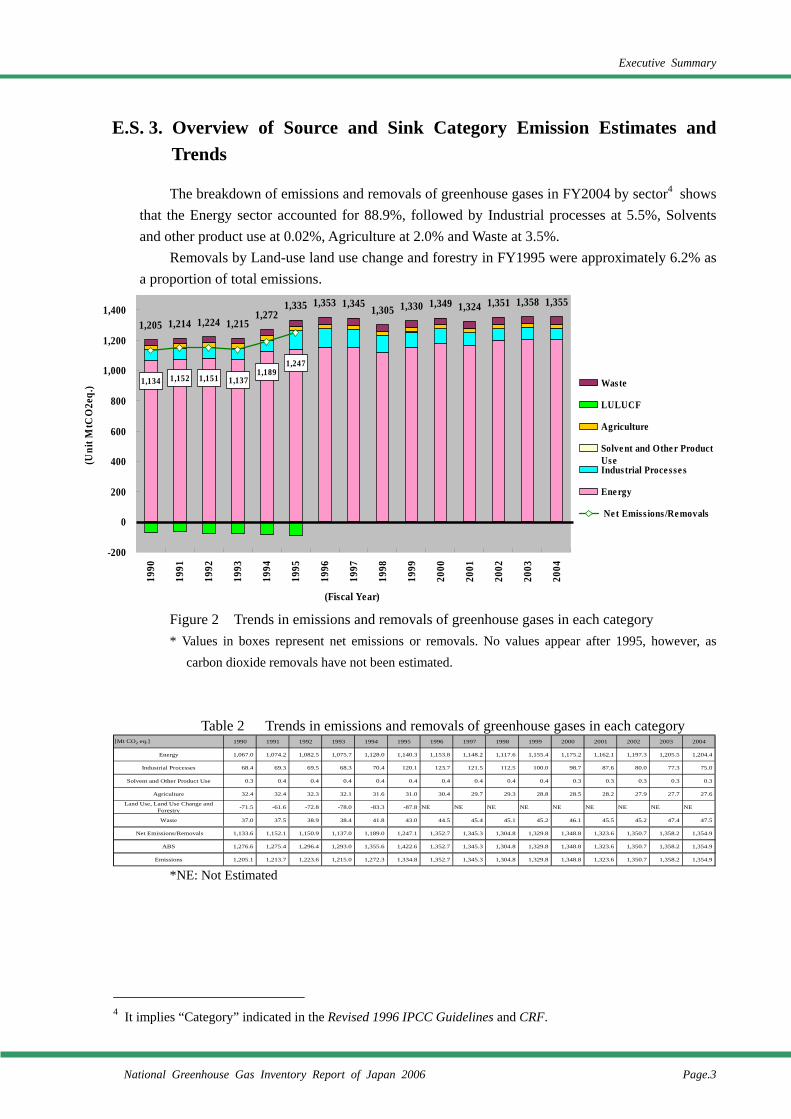
The breakdown of emissions and removals of greenhouse gases in FY2004 by sector4 shows that the Energy sector accounted for 88.9%, followed by Industrial processes at 5.5%, Solvents and other product use at 0.02%, Agriculture at 2.0% and Waste at 3.5%.
Removals by Land-use land use change and forestry in FY1995 were approximately 6.2% as a proportion of total emissions.
Figure 2 Trends in emissions and removals of greenhouse gases in each category * Values in boxes represent net emissions or removals. No values appear after 1995, however, as
carbon dioxide removals have not been estimated.
Table 2 Trends in emissions and removals of greenhouse gases in each category *NE: Not Estimated
4 It implies “Category” indicated in the Revised 1996 IPCC Guidelines and CRF.
1,205 1,214 1,224 1,2151,272
1,335 1,353 1,345 1,305 1,330 1,349 1,324 1,351 1,358 1,355
1,2471,189
1,1371,1511,1521,134
-200
0
200
400
600
800
1,000
1,200
1,400
1990
1991
1992
1993
1994
1995
1996
1997
1998
1999
2000
2001
2002
2003
2004
(Fiscal Year)
(Uni
t MtC
O2e
q.) Waste
LULUCF
Agriculture
Solve nt and Othe r ProductUseIndustrial Proce sse s
Ene rgy
Ne t Emiss ions /Removals
Emiss ions
[Mt CO2 eq.] 1990 1991 1992 1993 1994 1995 1996 1997 1998 1999 2000 2001 2002 2003 2004
Energy 1,067.0 1,074.2 1,082.5 1,075.7 1,128.0 1,140.3 1,153.8 1,148.2 1,117.6 1,155.4 1,175.2 1,162.1 1,197.3 1,205.5 1,204.4
Industrial Processes 68.4 69.3 69.5 68.3 70.4 120.1 123.7 121.5 112.5 100.0 98.7 87.6 80.0 77.3 75.0
Solvent and Other Product Use 0.3 0.4 0.4 0.4 0.4 0.4 0.4 0.4 0.4 0.4 0.3 0.3 0.3 0.3 0.3
Agriculture 32.4 32.4 32.3 32.1 31.6 31.0 30.4 29.7 29.3 28.8 28.5 28.2 27.9 27.7 27.6
Land Use, Land Use Change andForestry -71.5 -61.6 -72.8 -78.0 -83.3 -87.8 NE NE NE NE NE NE NE NE NE
Waste 37.0 37.5 38.9 38.4 41.8 43.0 44.5 45.4 45.1 45.2 46.1 45.5 45.2 47.4 47.5
Net Emissions/Removals 1,133.6 1,152.1 1,150.9 1,137.0 1,189.0 1,247.1 1,352.7 1,345.3 1,304.8 1,329.8 1,348.8 1,323.6 1,350.7 1,358.2 1,354.9
ABS 1,276.6 1,275.4 1,296.4 1,293.0 1,355.6 1,422.6 1,352.7 1,345.3 1,304.8 1,329.8 1,348.8 1,323.6 1,350.7 1,358.2 1,354.9
Emissions 1,205.1 1,213.7 1,223.6 1,215.0 1,272.3 1,334.8 1,352.7 1,345.3 1,304.8 1,329.8 1,348.8 1,323.6 1,350.7 1,358.2 1,354.9
Executive Summary
Page.4 National Greenhouse Gas Inventory Report of Japan 2006
E.S. 4. Other Information (Indirect Greenhouse Gases)
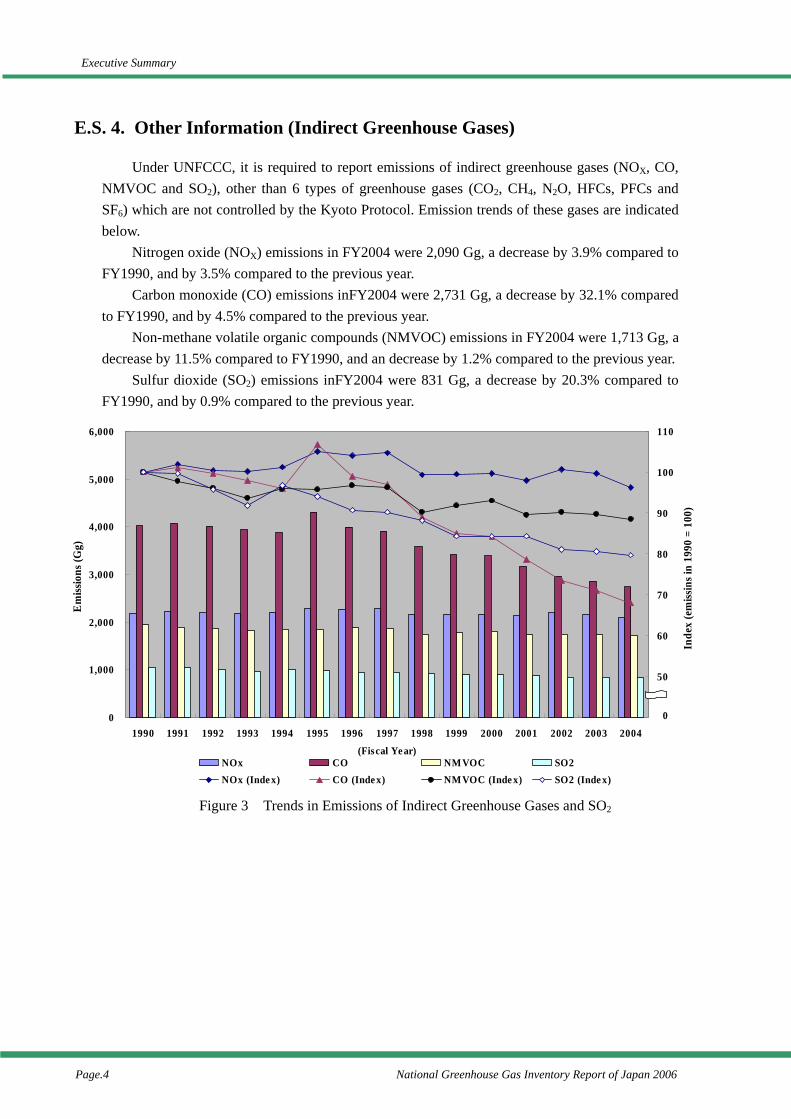
Under UNFCCC, it is required to report emissions of indirect greenhouse gases (NOX, CO, NMVOC and SO2), other than 6 types of greenhouse gases (CO2, CH4, N2O, HFCs, PFCs and SF6) which are not controlled by the Kyoto Protocol. Emission trends of these gases are indicated below.
Nitrogen oxide (NOX) emissions in FY2004 were 2,090 Gg, a decrease by 3.9% compared to FY1990, and by 3.5% compared to the previous year.
Carbon monoxide (CO) emissions inFY2004 were 2,731 Gg, a decrease by 32.1% compared to FY1990, and by 4.5% compared to the previous year.
Non-methane volatile organic compounds (NMVOC) emissions in FY2004 were 1,713 Gg, a decrease by 11.5% compared to FY1990, and an decrease by 1.2% compared to the previous year.
Sulfur dioxide (SO2) emissions inFY2004 were 831 Gg, a decrease by 20.3% compared to FY1990, and by 0.9% compared to the previous year.
Figure 3 Trends in Emissions of Indirect Greenhouse Gases and SO2
0
1,000
2,000
3,000
4,000
5,000
6,000
1990 1991 1992 1993 1994 1995 1996 1997 1998 1999 2000 2001 2002 2003 2004(Fiscal Year)
Em
issio
ns (G
g)
40
50
60
70
80
90
100
110
Inde
x (e
miss
ins i
n 19
90 =
100
)
NOx CO NMVOC SO2NOx (Inde x) CO (Index) NMVOC (Inde x) SO2 (Inde x)
0
Chapter 1. Introduction and QA/QC plan
National Greenhouse Gas Inventory Report of Japan 2006 Page 1.1
Chapter 1. Introduction and QA/QC plan
1.1. Background Information on Greenhouse Gas Inventories and Climate Change (1990–2004)
In accordance with Articles 4 and 12 of the United Nations Framework Convention on Climate Change (UNFCCC), this document reports Japan’s inventory of emissions and removals of greenhouse gases, their precursors, and other substances from FY 1990 through FY 2004 to the FCCC secretariat.
Methodologies for developing the inventory are described in the Revised 1996 IPCC Guidelines for National Greenhouse Gas Inventories (hereafter, Revised 1996 IPCC Guidelines) and the Good Practice and Uncertainty Management in National Greenhouse Gas Inventories (2000) (hereafter, the Good Practice Guidance (2000)), developed by the Intergovernmental Panel on Climate Change (IPCC), and the estimation methodologies of the emissions and removals of greenhouse gas should be in line with them. In 2003, the IPCC Good Practice Guidance for Land Use, Land-Use Change, and Forestry (hereafter, LULUCF-GPG), was published. Parties are required to seek to apply the LULUCF-GPG to their inventory reporting from 2005 and after ward.
1.2. QA/QC Plan
1.2.1. Inventory Compilation System
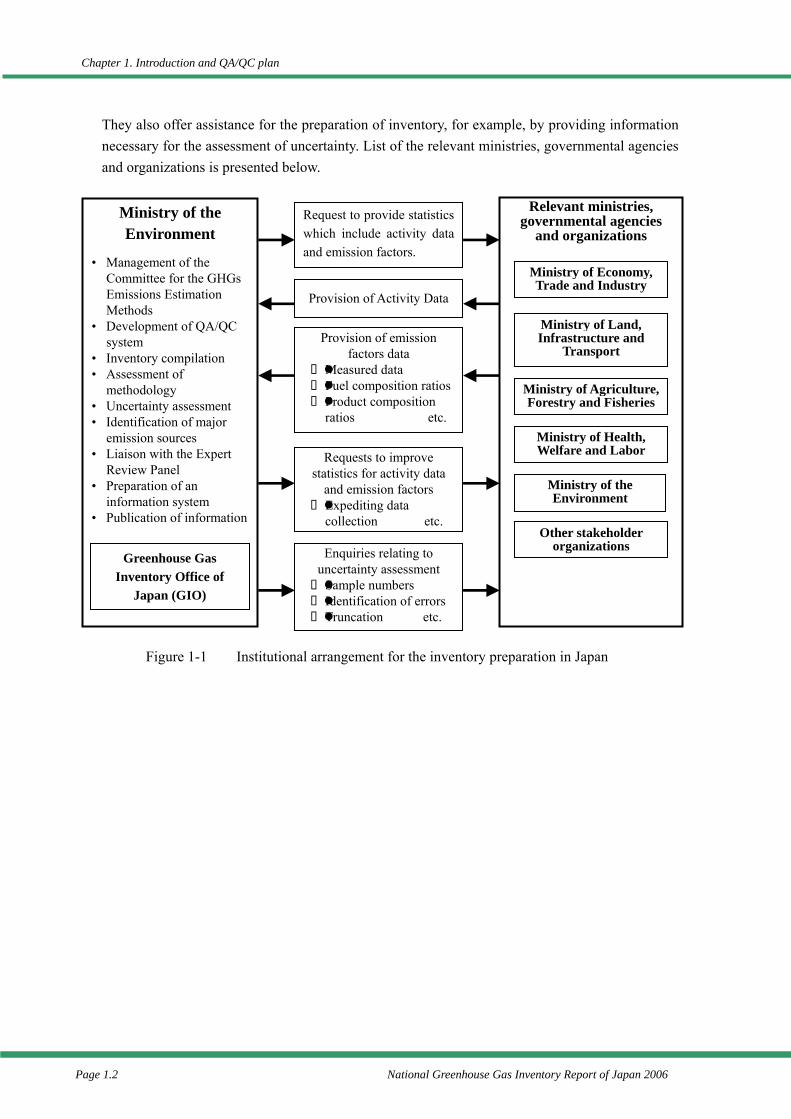
In Japan, the Ministry of the Environment (MOE) has annually compiled and submitted the national greenhouse gas inventory to UNFCCC secretariat under the UNFCCC in cooperation with relevant ministries, governmental agencies and organizations (see Figure 1-1).
The MOE has overall responsibility for the national inventory. In order to response to the international requirements and to reflect the latest scientific knowledge in the inventory, the MOE has convened and managed the Committee for the Greenhouse Gas Emissions Estimation Methods. On the basis of the results of the Committee’s deliberations, the MOE compiles inventories including the estimation of GHGs emissions and removals, identification of key categories1, and uncertainty assessment. The actual task of inventory compilation, including data input, calculation of emissions and removals and preparation of Common Reporting Format (CRF) and National Inventory Report (NIR), is achieved by Greenhouse Gas Inventory Office of Japan (GIO)2, of the Center for Global Environmental Research of the National Institute for Environmental Studies.
The relevant ministries, governmental agencies and organizations concerned provide data for emission factors, activity data, etc., through the ways such as the publication of relevant statistics.
1 The IPCC Good Practice Guidance for Land Use, Land-Use Change and Forestry (2003), which was
welcomed in COP9, extends the key source analysis to LULUCF categories. In the latest UNFCCC reporting guidelines (FCCC/SBSTA/2004/8), the term “key source category” was revised to “key category”. Japan adopts the term “key category” according to these guidelines, although it has not conducted key category analysis covering the LULUCF categories.
2 GIO has consigned a part of task to private consultants.
Chapter 1. Introduction and QA/QC plan
Page 1.2 National Greenhouse Gas Inventory Report of Japan 2006
They also offer assistance for the preparation of inventory, for example, by providing information necessary for the assessment of uncertainty. List of the relevant ministries, governmental agencies and organizations is presented below.
Figure 1-1 Institutional arrangement for the inventory preparation in Japan
Relevant ministries, governmental agencies
and organizations
Greenhouse Gas Inventory Office of
Japan (GIO)
Ministry of Economy, Trade and Industry
Ministry of Land, Infrastructure and
Transport
Ministry of Agriculture, Forestry and Fisheries
Ministry of Health, Welfare and Labor
Ministry of the Environment
Other stakeholder organizations
Provision of Activity Data
Provision of emission factors data
Measured data Fuel composition ratios Product composition ratios etc.
Request to provide statistics which include activity data and emission factors.
Enquiries relating to uncertainty assessment Sample numbers Identification of errors Truncation etc.
Requests to improve statistics for activity data
and emission factors Expediting data collection etc.
Ministry of the Environment
• Management of the
Committee for the GHGs Emissions Estimation Methods
• Development of QA/QC system
• Inventory compilation • Assessment of
methodology • Uncertainty assessment • Identification of major
emission sources • Liaison with the Expert
Review Panel • Preparation of an
information system • Publication of information
Chapter 1. Introduction and QA/QC plan
National Greenhouse Gas Inventory Report of Japan 2006 Page 1.3
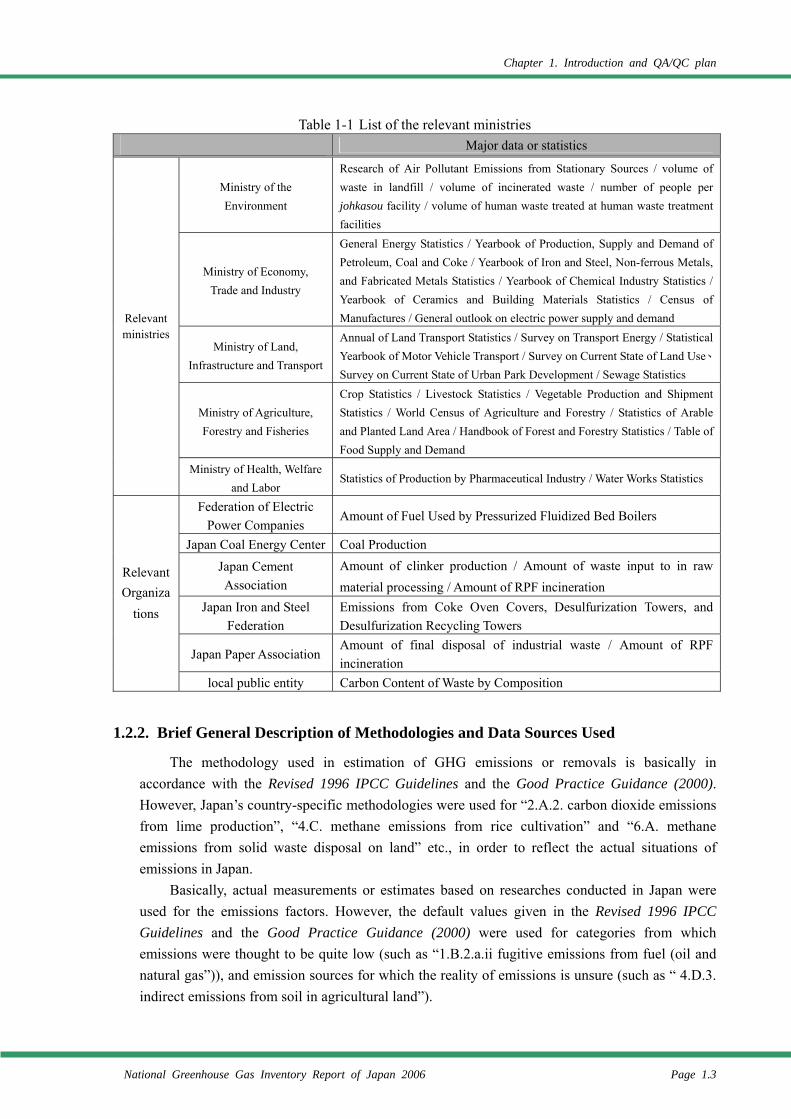
Table 1-1 List of the relevant ministries Major data or statistics
Ministry of the Environment
Research of Air Pollutant Emissions from Stationary Sources / volume of waste in landfill / volume of incinerated waste / number of people per johkasou facility / volume of human waste treated at human waste treatment facilities
Ministry of Economy, Trade and Industry
General Energy Statistics / Yearbook of Production, Supply and Demand of Petroleum, Coal and Coke / Yearbook of Iron and Steel, Non-ferrous Metals, and Fabricated Metals Statistics / Yearbook of Chemical Industry Statistics / Yearbook of Ceramics and Building Materials Statistics / Census of Manufactures / General outlook on electric power supply and demand
Ministry of Land, Infrastructure and Transport
Annual of Land Transport Statistics / Survey on Transport Energy / Statistical Yearbook of Motor Vehicle Transport / Survey on Current State of Land Use、Survey on Current State of Urban Park Development / Sewage Statistics
Ministry of Agriculture, Forestry and Fisheries
Crop Statistics / Livestock Statistics / Vegetable Production and Shipment Statistics / World Census of Agriculture and Forestry / Statistics of Arable and Planted Land Area / Handbook of Forest and Forestry Statistics / Table of Food Supply and Demand
Relevant ministries
Ministry of Health, Welfare and Labor
Statistics of Production by Pharmaceutical Industry / Water Works Statistics
Federation of Electric Power Companies
Amount of Fuel Used by Pressurized Fluidized Bed Boilers
Japan Coal Energy Center Coal Production
Japan Cement Association
Amount of clinker production / Amount of waste input to in raw material processing / Amount of RPF incineration
Japan Iron and Steel Federation
Emissions from Coke Oven Covers, Desulfurization Towers, and Desulfurization Recycling Towers
Japan Paper Association Amount of final disposal of industrial waste / Amount of RPF incineration
Relevant Organiza
tions
local public entity Carbon Content of Waste by Composition
1.2.2. Brief General Description of Methodologies and Data Sources Used
The methodology used in estimation of GHG emissions or removals is basically in accordance with the Revised 1996 IPCC Guidelines and the Good Practice Guidance (2000). However, Japan’s country-specific methodologies were used for “2.A.2. carbon dioxide emissions from lime production”, “4.C. methane emissions from rice cultivation” and “6.A. methane emissions from solid waste disposal on land” etc., in order to reflect the actual situations of emissions in Japan.
Basically, actual measurements or estimates based on researches conducted in Japan were used for the emissions factors. However, the default values given in the Revised 1996 IPCC Guidelines and the Good Practice Guidance (2000) were used for categories from which emissions were thought to be quite low (such as “1.B.2.a.ii fugitive emissions from fuel (oil and natural gas”)), and emission sources for which the reality of emissions is unsure (such as “ 4.D.3. indirect emissions from soil in agricultural land”).
Chapter 1. Introduction and QA/QC plan
Page 1.4 National Greenhouse Gas Inventory Report of Japan 2006
1.2.3. Brief Description of the Process of Inventory Preparation and Implementation of QA/QC
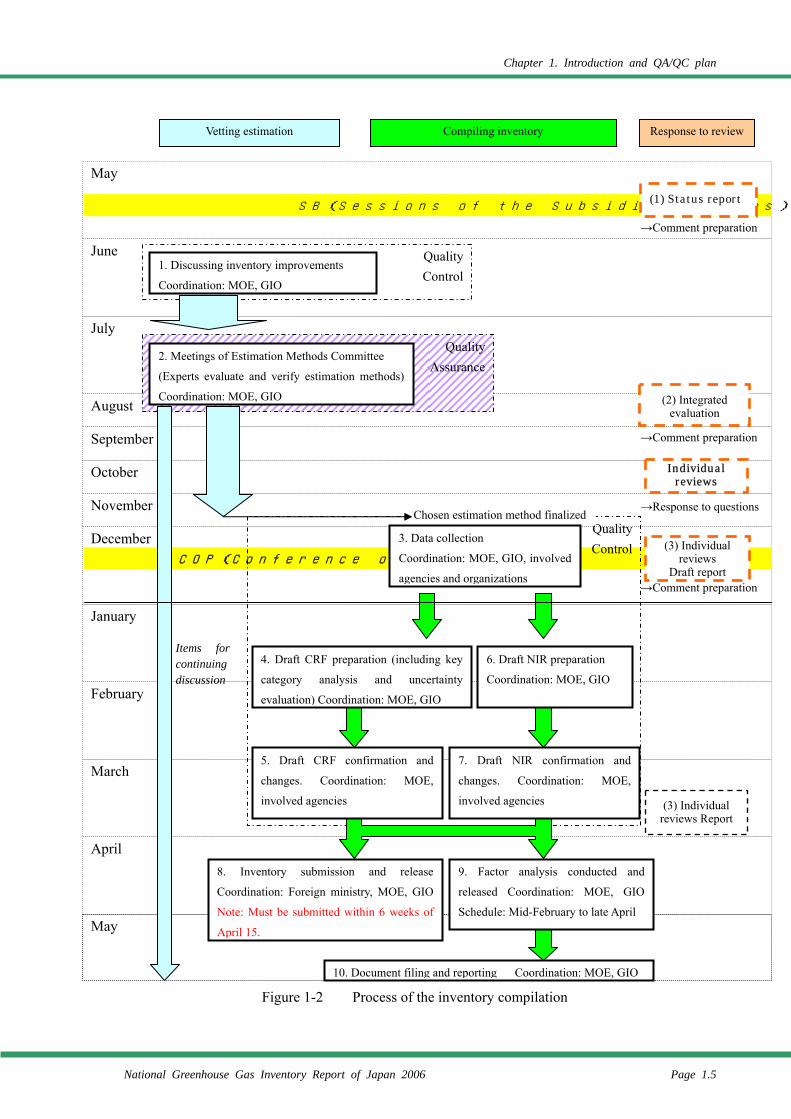
Japan has compiled an inventory by following the steps shown in Figure 1-2, in order to ensure and maintain the quality control for such as the completeness, accuracy and consistency of data. Submission of inventory to the UNFCCC secretariat is due on April 15th every year.3 Dates overlapping between different steps are due to the fact that Japan implements more than one step contemporaneously to enhance working efficiency.
As shown in Figure 1-2, Japan has implemented QC activities, such as checking estimation accuracy and archiving documents, in each step of the inventory compilation process in accordance with Good Practice Guidance (2000) to manage the quality of inventories. In Japan, the inventory preparation procedures conducted by the MOE (including the GIO and private-sector companies commissioned for the job), which is the agency involved in inventory preparation, as well as by other related agencies and organizations, are considered to be QC procedures.
The process of evaluating and verifying assessment methods by Japanese experts conducted within the Committee for the Greenhouse Gases Emissions Estimation Methods (Step 2: Expert review of previous inventories [Committee for the Greenhouse Gases Emissions Estimation Methods]) is considered to be a quality assurance (QA) activity in which outside experts not involved in inventory preparation conduct external reviews, thereby evaluating and verifying data quality in view of scientific findings and data availability.
3 Annex I Parties have to submit their inventories within 6 weeks from the submission date, which is April 15th,
to be eligible to participate in the Kyoto mechanism.
Chapter 1. Introduction and QA/QC plan
National Greenhouse Gas Inventory Report of Japan 2006 Page 1.5
Figure 1-2 Process of the inventory compilation
May
June
August
December
January
February
March
September
October
November
April
July
COP(Conference of the Parties)
Quality Control
QualityControl
QualityAssurance
May
SB(Sessions of the Subsidiary Bodies)
Vetting estimation Compiling inventory Response to review
(1) Status report
(2) Integrated evaluation
Individual reviews
(3) Individual reviews Report
→Comment preparation
(3) Individualreviews
Draft report
Chosen estimation method finalized
Items for continuing discussion
→Comment preparation
1. Discussing inventory improvements
Coordination: MOE, GIO
2. Meetings of Estimation Methods Committee
(Experts evaluate and verify estimation methods)
Coordination: MOE, GIO
→Response to questions
3. Data collection
Coordination: MOE, GIO, involved
agencies and organizations →Comment preparation
4. Draft CRF preparation (including key
category analysis and uncertainty
evaluation) Coordination: MOE, GIO
6. Draft NIR preparation
Coordination: MOE, GIO
5. Draft CRF confirmation and
changes. Coordination: MOE,
involved agencies
7. Draft NIR confirmation and
changes. Coordination: MOE,
involved agencies
8. Inventory submission and release
Coordination: Foreign ministry, MOE, GIO
Note: Must be submitted within 6 weeks of
April 15.
9. Factor analysis conducted and
released Coordination: MOE, GIO
Schedule: Mid-February to late April
10. Document filing and reporting Coordination: MOE, GIO
Chapter 1. Introduction and QA/QC plan
Page 1.6 National Greenhouse Gas Inventory Report of Japan 2006
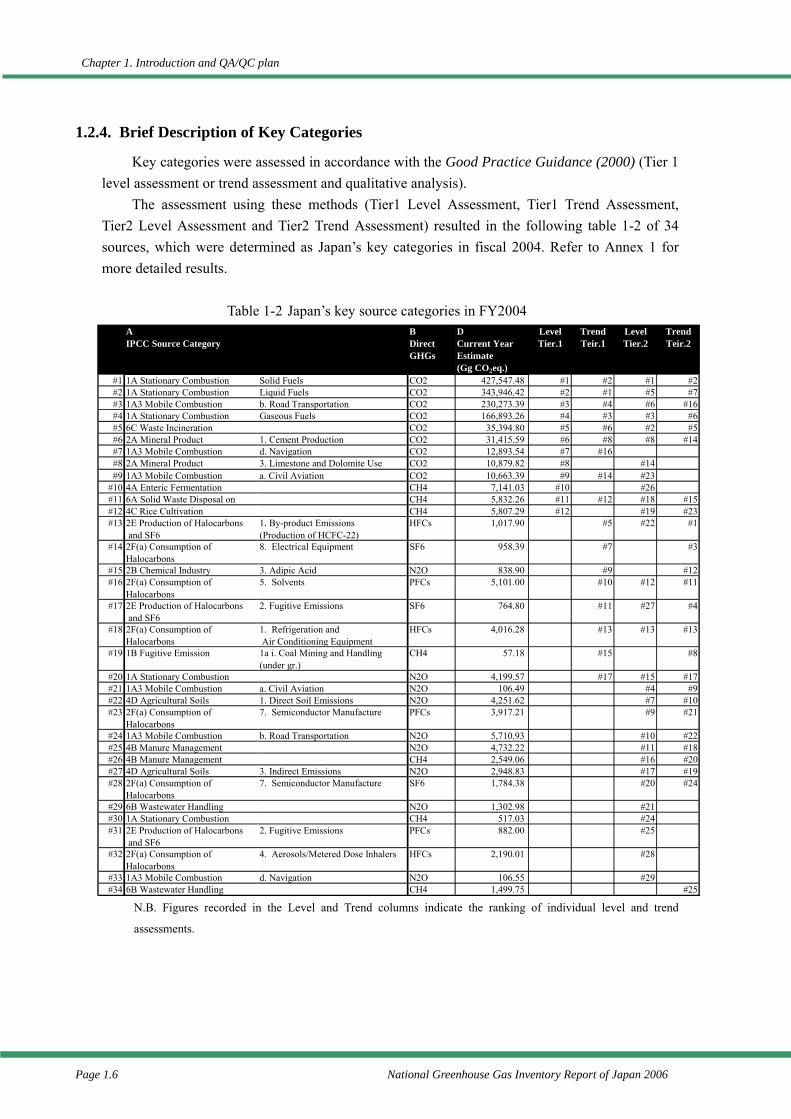
1.2.4. Brief Description of Key Categories
Key categories were assessed in accordance with the Good Practice Guidance (2000) (Tier 1 level assessment or trend assessment and qualitative analysis).
The assessment using these methods (Tier1 Level Assessment, Tier1 Trend Assessment, Tier2 Level Assessment and Tier2 Trend Assessment) resulted in the following table 1-2 of 34 sources, which were determined as Japan’s key categories in fiscal 2004. Refer to Annex 1 for more detailed results.
Table 1-2 Japan’s key source categories in FY2004
N.B. Figures recorded in the Level and Trend columns indicate the ranking of individual level and trend
assessments.
AIPCC Source Category
BDirectGHGs
DCurrent YearEstimate(Gg CO2eq.)
LevelTier.1
TrendTeir.1
LevelTier.2
TrendTeir.2
#1 1A Stationary Combustion Solid Fuels CO2 427,547.48 #1 #2 #1 #2#2 1A Stationary Combustion Liquid Fuels CO2 343,946.42 #2 #1 #5 #7#3 1A3 Mobile Combustion b. Road Transportation CO2 230,273.39 #3 #4 #6 #16#4 1A Stationary Combustion Gaseous Fuels CO2 166,893.26 #4 #3 #3 #6#5 6C Waste Incineration CO2 35,394.80 #5 #6 #2 #5#6 2A Mineral Product 1. Cement Production CO2 31,415.59 #6 #8 #8 #14#7 1A3 Mobile Combustion d. Navigation CO2 12,893.54 #7 #16#8 2A Mineral Product 3. Limestone and Dolomite Use CO2 10,879.82 #8 #14#9 1A3 Mobile Combustion a. Civil Aviation CO2 10,663.39 #9 #14 #23
#10 4A Enteric Fermentation CH4 7,141.03 #10 #26#11 6A Solid Waste Disposal on CH4 5,832.26 #11 #12 #18 #15#12 4C Rice Cultivation CH4 5,807.29 #12 #19 #23#13 2E Production of Halocarbons
and SF61. By-product Emissions(Production of HCFC-22)
HFCs 1,017.90 #5 #22 #1
#14 2F(a) Consumption ofHalocarbons
8. Electrical Equipment SF6 958.39 #7 #3
#15 2B Chemical Industry 3. Adipic Acid N2O 838.90 #9 #12#16 2F(a) Consumption of
Halocarbons5. Solvents PFCs 5,101.00 #10 #12 #11
#17 2E Production of Halocarbons and SF6
2. Fugitive Emissions SF6 764.80 #11 #27 #4
#18 2F(a) Consumption ofHalocarbons
1. Refrigeration and Air Conditioning Equipment
HFCs 4,016.28 #13 #13 #13
#19 1B Fugitive Emission 1a i. Coal Mining and Handling(under gr.)
CH4 57.18 #15 #8
#20 1A Stationary Combustion N2O 4,199.57 #17 #15 #17#21 1A3 Mobile Combustion a. Civil Aviation N2O 106.49 #4 #9#22 4D Agricultural Soils 1. Direct Soil Emissions N2O 4,251.62 #7 #10#23 2F(a) Consumption of
Halocarbons7. Semiconductor Manufacture PFCs 3,917.21 #9 #21
#24 1A3 Mobile Combustion b. Road Transportation N2O 5,710.93 #10 #22#25 4B Manure Management N2O 4,732.22 #11 #18#26 4B Manure Management CH4 2,549.06 #16 #20#27 4D Agricultural Soils 3. Indirect Emissions N2O 2,948.83 #17 #19#28 2F(a) Consumption of
Halocarbons7. Semiconductor Manufacture SF6 1,784.38 #20 #24
#29 6B Wastewater Handling N2O 1,302.98 #21#30 1A Stationary Combustion CH4 517.03 #24#31 2E Production of Halocarbons
and SF62. Fugitive Emissions PFCs 882.00 #25
#32 2F(a) Consumption ofHalocarbons
4. Aerosols/Metered Dose Inhalers HFCs 2,190.01 #28
#33 1A3 Mobile Combustion d. Navigation N2O 106.55 #29#34 6B Wastewater Handling CH4 1,499.75 #25
Chapter 1. Introduction and QA/QC plan
National Greenhouse Gas Inventory Report of Japan 2006 Page 1.7
1.3. Further Inventory Development
For further development of inventory, following issues need to be addressed. All the problems enumerated below are proposed as those to be solved by the Committee for the Greenhouse Gas Emissions Estimation Methods. Our approach for dealing with these problems is to examine them, in accordance with Japan’s QA/QC plan, by giving priority to important ones such as those involving key categories and those flagged in reviews.
1.3.1. Crosscutting Issues
For the not-estimated (NE) categories it is necessary to take into account the possibility of emissions and to further investigate the state of emissions (see 1.5 Completeness and Annex 5 regarding not-estimated source categories).
Sources estimated with default values of the Revised 1996 IPCC Guidelines or Good Practice Guidance (2000) could be overestimated because the default values may not reflect the circumstances of Japan correctly. Therefore, the estimation methods need to be improved in accordance with expansion of the scientific country-specific information if it’s available.
Japan has reported its emissions of greenhouse gases in fiscal year basis (April to March). However, the Revised 1996 IPCC Guidelines requires to report in calendar year basis in the course of calculation of greenhouse gas emissions and removals. During the in-country visit review in 2003 under UNFCCC, difficulties in converting the data to calendar year basis and possibility of counting on calendar year basis after 2004 were discussed. Expert Review Team (ERT) concluded that it would be preferable for Japan to continue to report to the UNFCCC on a fiscal year basis, but encourages Japan to continue its work on the possibilities for conversion4.
1.3.2. Energy (Category1)
1.3.2.1. Fuel Combustion (CO2)
Estimation methods for NMVOC emissions from sources including products other than organic solvents and for emissions from byproduct fuel use have not been subjected to long-term consideration, raising the possibility of insufficient estimation accuracy. As work has begun in Japan on producing a VOC inventory, this matter will be addressed while verifying the accuracy of current estimation methods.
1.3.2.2. Fuel Combustion (Stationary Sources: CH4, N2O)
As activity data in this sector, we use the value obtained through proportionally distributing the energy consumption given in General Energy Statistics, and the energy consumption proportions according to industry type, fuel type, and furnace type, as estimated from MAP
4 FCCC/WEB/IRI(2)/2003/JPN para.14
Chapter 1. Introduction and QA/QC plan
Page 1.8 National Greenhouse Gas Inventory Report of Japan 2006
Surveys. However, comparison of statistical data for industry type and furnace type reveals a contradiction in which data not counted for one are counted for the other. Although activity data are determined while taking this problem into account, further consideration shall be accorded to the soundness of our method. Additionally, it is likely we will no longer be able to use fuel consumption data from MAP Surveys from the FY2002 survey onward, and discussions are needed now how to deal with this.
Emissions recovered from electric arc furnaces must be deduced to obtain the electric arc
furnace emission factor, but this will be a long-term effort due to the difficulty of determining recoveries.
1.3.2.3. Fuel Combustion (Mobile Sources: CH4, N2O)
There are few measured data on N2O emission factors of road transportation. These data are affected by the type of equipped catalyst, temperature of catalyst, and aged deterioration of catalyst. Therefore, development of the driving cycle (such as 10-15 mode) applied for measuring GHGs from automobile is needed, as well as the accumulation of measured data are needed.
Discussions will be conducted on methods of estimating and otherwise assessing GHG (CH4, N2O) emissions from new products (such as fuel cell vehicles and low-emission vehicles) resulting from technological innovation.
1.3.3. Industrial Processes (Category2)
1.3.3.1. CO2, CH4 and N2O
Some data are no longer available due to reasons including the elimination of statistical items, and discussions will be needed on how to address this.
1.3.3.2. F-gas
Some substances of F-gas are emitted from only few companies, and their aggregated data is reported without its details such as emissions by gases because of the confidentiality. However, some sources mentioned above have large amount of emissions. Since the code of practice for the handling of confidential information was adopted in COP, handling of these data along the code of practice would be needed.
Credibility of estimation should be developed by evaluating mass-balance between actual emissions and potential emissions (including amount of production, export, import, shipment, consumption, stock, disposal, recovery, destruction, recycling, reclamation and emissions).
Chapter 1. Introduction and QA/QC plan
National Greenhouse Gas Inventory Report of Japan 2006 Page 1.9
1.3.4. Use of Solvents and Other Products (Category 3)
Estimation methods for NMVOC emissions from sources including products other than organic solvents and for emissions from byproduct fuel use have not been subjected to long-term consideration, raising the possibility of insufficient estimation accuracy. As work has begun in Japan on producing a VOC inventory, this matter will be addressed while verifying the accuracy of current estimation methods (same as above).
1.3.5. Agriculture (Category4)
Since there is no single statistics for all crops in Japan, various statistics are used in compiling Japan’s inventories. Definition of each crop in these statistics may be different. Hence, in calculating the total amount of farm products, it is important to take care of double counting and left out of data. The estimation for total growing area of farmland has same issues.
Although the inventory does not reflect the effects of remedial measures against CH4
emissions from enteric fermentation, we currently lack research data needed to set emission factors that take natural conditions and livestock management conditions into account.
In the livestock waste management sector, cattle and swine wastes are mixed and cannot be
strictly separated. The present emission factor categories of “feces,” “urine,” and “mixed feces and urine” cannot fully describe the actual situation, but as data for setting new emission factors are currently insufficient, the problem will be addressed as data become available.
Estimation of emissions in livestock waste management does not reflect disposal by piling it
up outside or digging holes for disposal, or composting in a composting facility. While getting ideas from new findings and other countries’ inventories, we will conduct long-term discussions on dividing “deposition and other management” of feces and “deposition” disposal of mixed urine and feces into the two categories of “deposition” and “outdoor disposal,” and set an emission factor for each.
There is not enough knowledge on histosols to know what land was originally histosol, or
how much land which could be called histosol remained in the past. Discussions are underway to provide for conformity with the land use, land use change, and forestry sectors.
1.3.6. Land Use, Land-Use Change and Forestry (Category5)
As it has been in the process of verifying the latest land area statistics and developing various parameters necessary for the estimation in the Forest land sector, emissions and removals have been decided to be reported as "NE" (Not Estimated) from 1996 onwards. It will be considered to incorporate the results of the data developed to the inventories as appropriate in the future. In addition, it is also under verification of the land area statistics and has been
Chapter 1. Introduction and QA/QC plan
Page 1.10 National Greenhouse Gas Inventory Report of Japan 2006
developing various parameters, which will be lead to be considered to reflect the developed data as appropriate in the Settlements sector.
Key category analysis, uncertainty assessment and preparation of QA/QC plan have not been conducted under the inventory of the LULUCF sector in this submission. However, it is necessary to develop the national system as soon as possible since the implementation of these analyses and assessments have been laid down in the UNFCCC reporting guidelines, and they are also stipulated as the essential factors under the Kyoto Protocol.
As the Ministry of the Environment has been preparing the inventory with cooperation from relevant ministries and agencies after establishing national system in the source category, there also is a necessity to develop national system for the preparation of the inventory in the LULUCF sector.
1.3.7. Waste (Category6)
At present there is no information available on the recovery of CH4 emissions from landfill disposal sites, CH4 emissions arising from industrial wastewater treatment, and CH4 emissions arising from the treatment of domestic and commercial wastewater. Long-term discussions will be held on findings pertaining to CH4 recovery amount.
1.4. General Uncertainty Evaluation, Including Data on the Overall Uncertainty for the Inventory Totals
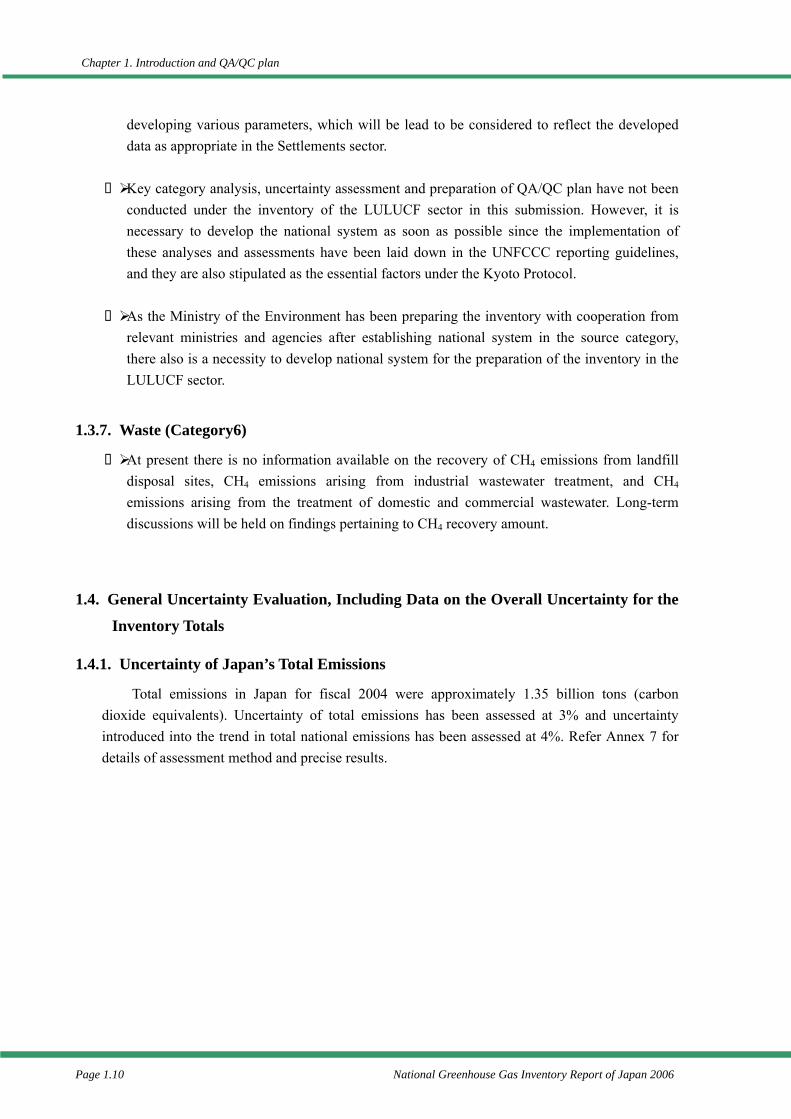
1.4.1. Uncertainty of Japan’s Total Emissions
Total emissions in Japan for fiscal 2004 were approximately 1.35 billion tons (carbon dioxide equivalents). Uncertainty of total emissions has been assessed at 3% and uncertainty introduced into the trend in total national emissions has been assessed at 4%. Refer Annex 7 for details of assessment method and precise results.
Chapter 1. Introduction and QA/QC plan
National Greenhouse Gas Inventory Report of Japan 2006 Page 1.11
Table 1-3 Uncertainty of Japan’s Total Emissions 1) C = A × B / D 2) E = C1
2 + C22 + ··········
Hereafter, the same method for calculating uncertainty assessment has been used in each sector appearing in Tables 3 and follows.
1.5. General Assessment of the Completeness
In this inventory, emissions from some categories are not estimated and reported as “NE”. The FY2005 report dealt with categories reported as not estimated (NE) by examining the possibilities of GHG emissions and newly estimating the emissions in many of the categories which were thought to be highly in need of estimation improvement, such as categories whose emissions were expected to be large.
Source categories reported as NE in this year’s report include those whose emissions are thought to be very small, those whose emissions are unknown, and those for which emission estimation methods have not been developed. In accordance with Japan’s QA/QC plan, discussions will be held on emission possibilities, emission estimation, and other matters pertaining to these categories. See Annex 5 for a list of not-estimated emission source categories.
Due to the many categories in which it is difficult to obtain past activity data for 1990–1994 emissions of HFCs, PFCs, and SF6, such sources are reported as NE.
It should be noted that emissions and removals by Land use, Land-use change and forestry sector after 1995 have not been estimated (NE).
IPCC Source Category GHGs Emissions[Gg CO2eq.]
rank Combineduncertaintyas % of total
nationalemissions
rank
A [%] C1A. Fuel Combustion (CO2) CO2 1,192,865.5 88.0% 3% 9 2.60% 11A. Fuel Combustion (Stationary:CH4,N2O) CH4、N2O 4,716.4 0.3% 43% 2 0.15% 71A. Fuel Combustion (Transport:CH4,N2O) CO2、CH4、N2O 6,237.6 0.5% 146% 1 0.67% 31B. Fugitive Emissions from Fuels CO2、CH4、N2O 584.2 0.0% 14% 6 0.01% 82. Industrial Processes (CO2,CH4,N2O) CO2、CH4、N2O 52,147.9 3.8% 7% 7 0.28% 62. Industrial Processes (HFCs,PFCs,SF6) HFCs、PFCs、SF6 22,879.1 1.7% 19% 5 0.32% 53. Solvent & other Product Use N2O 297.5 0.0% 5% 8 0.00% 94. Agriculture CH4、N2O 27,605.5 2.0% 26% 3 0.53% 46. Waste CO2、CH4、N2O 47,535.3 3.5% 23% 4 0.82% 2Total Emissions (D) 1,354,868.9 100.0% (E) 3%
CombinedUncertainty
[%]
B

Chapter 1. Introduction and QA/QC plan
Page 1.12 National Greenhouse Gas Inventory Report of Japan 2006
Chapter 2. Trends in GHGs Emissions and Removals
National Greenhouse Gas Inventory Report of Japan 2006 Page 2.1
Chapter 2. Trends in GHGs Emissions and Removals
2.1. Description and Interpretation of Emission and Removal Trends for Aggregate Greenhouse Gases
2.1.1. Greenhouse Gas Emissions and Removals
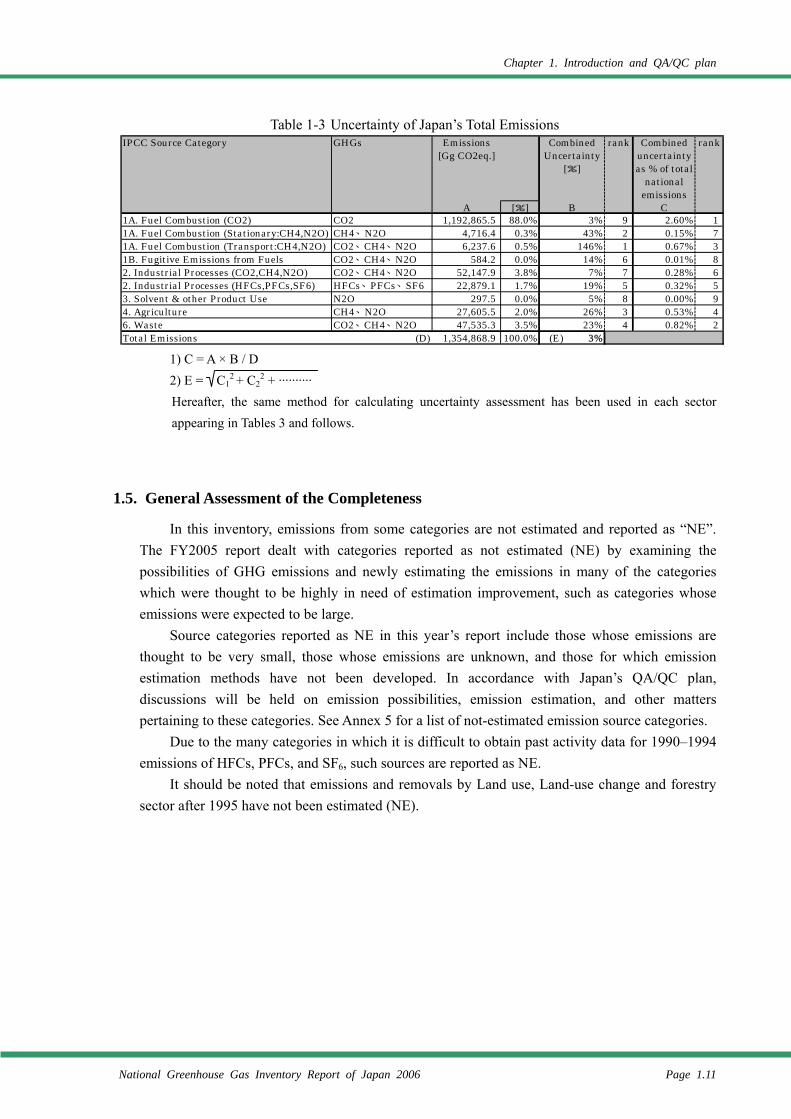
Total greenhouse gas emission in fiscal 20041 (the sum of emissions of CO2, CH4, N2O, HFCs, PFCs, and SF6 converted to CO2 equivalents by multiplying its global warming potential [GWP]2 respectively; excluding for carbon dioxide removals) was 1,355 million tons (in CO2 equivalents), an increase by 12.4% compared to emissions (CO2, CH4, N2O, excluding carbon dioxide removals) in FY1990 (Removals of carbon dioxide in FY1995 were 88.0 million tons3, an increase by 22.2% from FY1990). Compared to emissions in the base year under the Kyoto Protocol (FY1990 for emissions of CO2, CH4, N2O; FY1995 for emissions of HFCs, PFCs, and SF6), it increased by 8.0%.
It should be noted that emissions of HFCs, PFCs, and SF6 in the period from 1990 to 1994, and emissions and removals by Land Use, Land Use change and forestry sector after 1995 have not been estimated (NE).
Figure 2-1 Trends in emission and removals of greenhouse gases in Japan * Values in boxes represent net emissions or removals. No values appear after 1995, however, as
carbon dioxide removals have not been estimated.
1 “Fiscal” is used because CO2 is the primary GHGs emissions and estimated on the fiscal year basis; from April
of the year to March of the next year. 2 Global Warming Potential (GWP): It is the coefficients that indicate degrees of greenhouse gas effects caused
by greenhouse gases converted into the proportion of equivalent degrees of CO2. The coefficients are subjected to the Second National Assessment Report (1995) issued by the Intergovernmental Panel on Climate Change (IPCC).
3 In the inventory submitted under the FCCC, removals by forest planted before 1990 are contained. Therefore, this value do not correspond to 13 Mt indicated in the annex of “Draft decision -/CMP.1 (Land Use, Land Use change and forestry) (FCCC/CP/2001/13/Add.1 p54) adopted in the decision 11/COP7.
1,205 1,214 1,224 1,2151,272
1,335 1,353 1,345 1,305 1,330 1,349 1,324 1,351 1,358 1,355
1,133 1,152 1,150 1,1371,189 1,247
-200
0
200
400
600
800
1,000
1,200
1,400
1990
1991
1992
1993
1994
1995
1996
1997
1998
1999
2000
2001
2002
2003
2004
(Fiscal Year)
(Uni
t: M
t CO
2eq.
)
SF6
PFCs
HFCs
N2O
CH4
CO2 Emissions
CO2 Removals
Net Emissions/Removals
Chapter 2. Trends in GHGs Emissions and Removals
Page 2.2 National Greenhouse Gas Inventory Report of Japan 2006
2.1.2. CO2 Emissions Per Capita
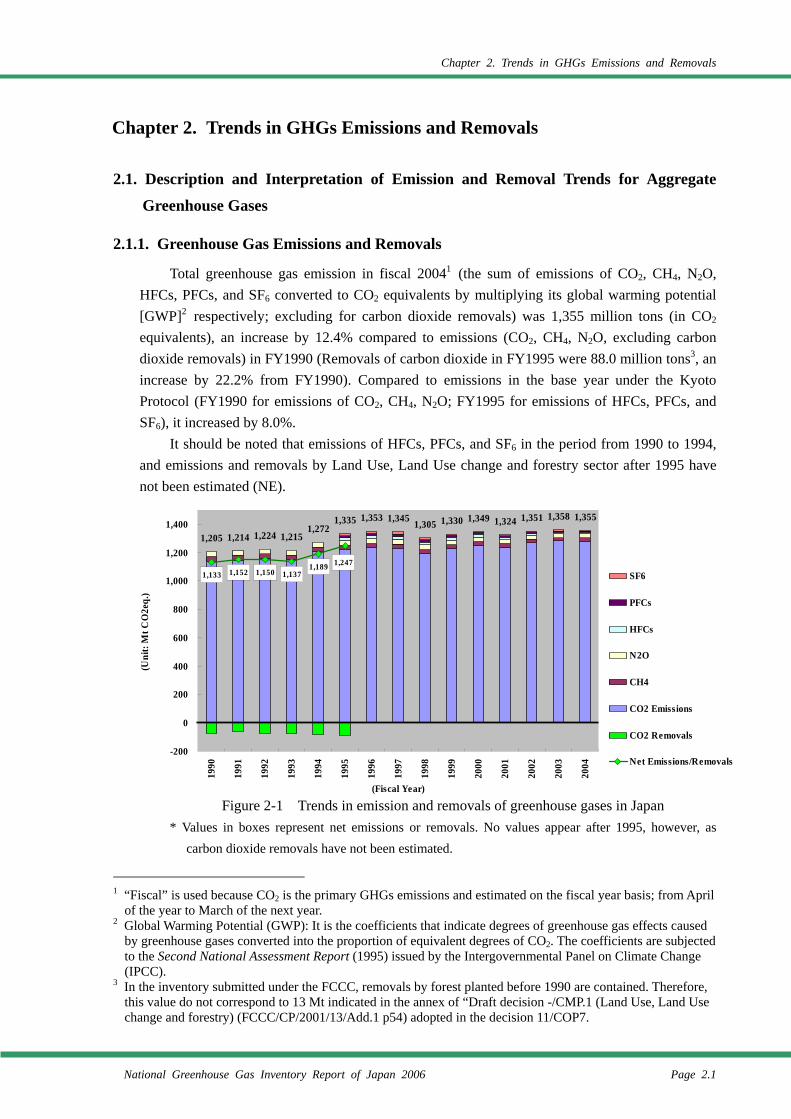
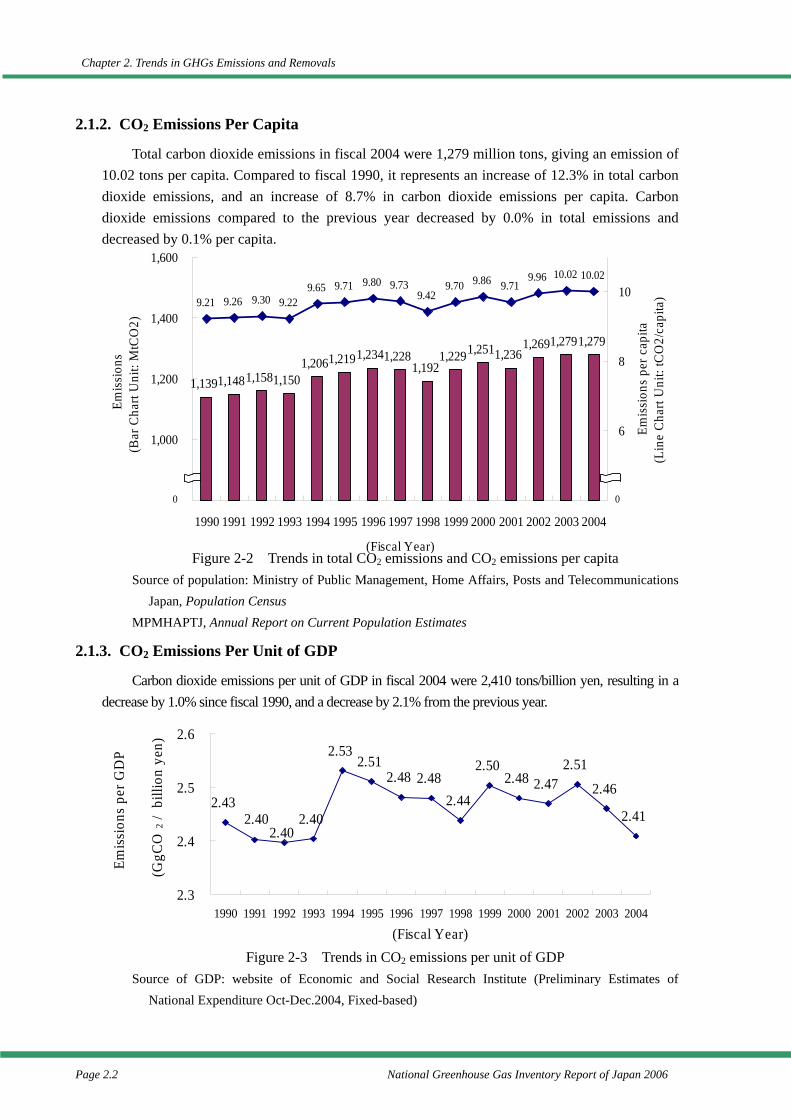
Total carbon dioxide emissions in fiscal 2004 were 1,279 million tons, giving an emission of 10.02 tons per capita. Compared to fiscal 1990, it represents an increase of 12.3% in total carbon dioxide emissions, and an increase of 8.7% in carbon dioxide emissions per capita. Carbon dioxide emissions compared to the previous year decreased by 0.0% in total emissions and decreased by 0.1% per capita.
Figure 2-2 Trends in total CO2 emissions and CO2 emissions per capita Source of population: Ministry of Public Management, Home Affairs, Posts and Telecommunications
Japan, Population Census MPMHAPTJ, Annual Report on Current Population Estimates
2.1.3. CO2 Emissions Per Unit of GDP
Carbon dioxide emissions per unit of GDP in fiscal 2004 were 2,410 tons/billion yen, resulting in a decrease by 1.0% since fiscal 1990, and a decrease by 2.1% from the previous year.
Figure 2-3 Trends in CO2 emissions per unit of GDP Source of GDP: website of Economic and Social Research Institute (Preliminary Estimates of
National Expenditure Oct-Dec.2004, Fixed-based)
1,1391,1481,1581,1501,2061,2191,2341,228
1,1921,2291,2511,236
1,2691,2791,279
9.21 9.26 9.30 9.229.65 9.71 9.80 9.73
9.429.70 9.86 9.71
9.96 10.02 10.02
800
1,000
1,200
1,400
1,600
1990 1991 1992 1993 1994 1995 1996 1997 1998 1999 2000 2001 2002 2003 2004
(Fiscal Year)
4
6
8
10
Emis
sion
s(B
ar C
hart
Uni
t: M
tCO
2)
0 0
Emis
sion
s pe
r cap
ita(L
ine
Cha
rt U
nit:
tCO
2/ca
pita
)
2.432.40
2.532.51
2.48 2.482.44
2.502.48 2.47
2.51
2.46
2.412.40
2.40
2.3
2.4
2.5
2.6
1990 1991 1992 1993 1994 1995 1996 1997 1998 1999 2000 2001 2002 2003 2004
(Fiscal Year)
Emis
sion
s pe
r GD
P
(GgC
O 2
/ b
illio
n ye
n)
Chapter 2. Trends in GHGs Emissions and Removals
National Greenhouse Gas Inventory Report of Japan 2006 Page 2.3
2.2. Description and Interpretation of Emission and Removal Trends by Gas
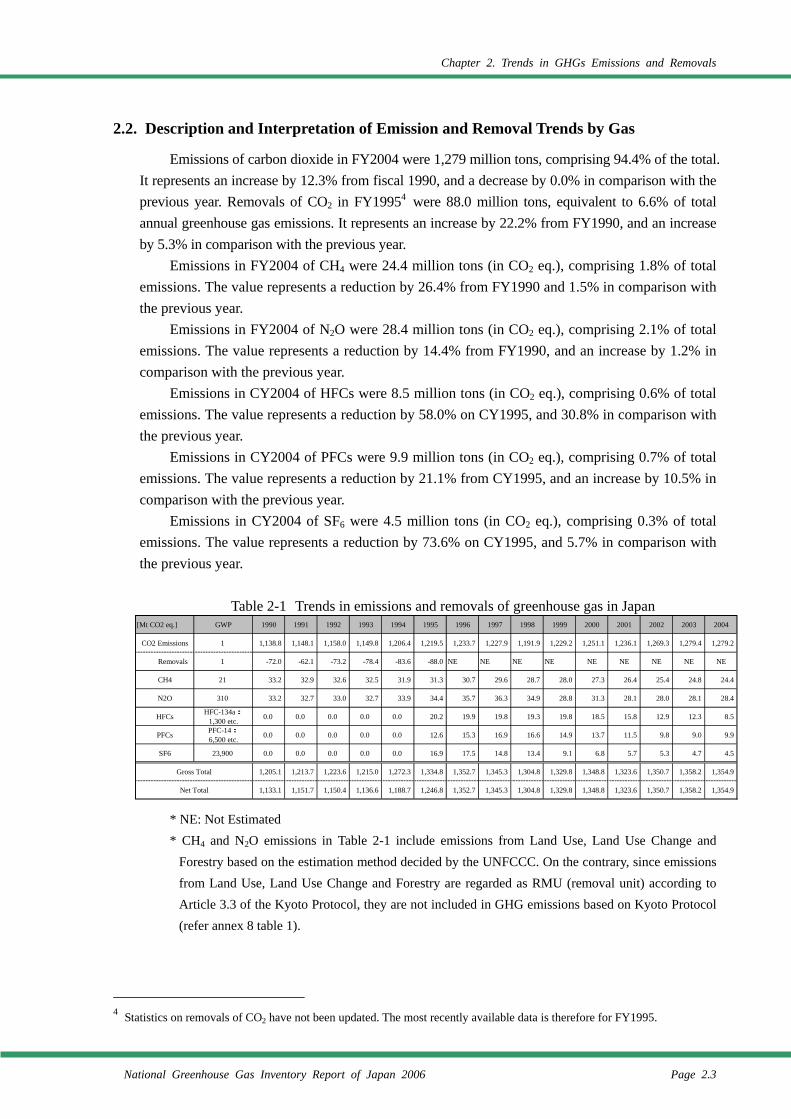
Emissions of carbon dioxide in FY2004 were 1,279 million tons, comprising 94.4% of the total. It represents an increase by 12.3% from fiscal 1990, and a decrease by 0.0% in comparison with the previous year. Removals of CO2 in FY19954 were 88.0 million tons, equivalent to 6.6% of total annual greenhouse gas emissions. It represents an increase by 22.2% from FY1990, and an increase by 5.3% in comparison with the previous year.
Emissions in FY2004 of CH4 were 24.4 million tons (in CO2 eq.), comprising 1.8% of total emissions. The value represents a reduction by 26.4% from FY1990 and 1.5% in comparison with the previous year.
Emissions in FY2004 of N2O were 28.4 million tons (in CO2 eq.), comprising 2.1% of total emissions. The value represents a reduction by 14.4% from FY1990, and an increase by 1.2% in comparison with the previous year.
Emissions in CY2004 of HFCs were 8.5 million tons (in CO2 eq.), comprising 0.6% of total emissions. The value represents a reduction by 58.0% on CY1995, and 30.8% in comparison with the previous year.
Emissions in CY2004 of PFCs were 9.9 million tons (in CO2 eq.), comprising 0.7% of total emissions. The value represents a reduction by 21.1% from CY1995, and an increase by 10.5% in comparison with the previous year.
Emissions in CY2004 of SF6 were 4.5 million tons (in CO2 eq.), comprising 0.3% of total emissions. The value represents a reduction by 73.6% on CY1995, and 5.7% in comparison with the previous year.
Table 2-1 Trends in emissions and removals of greenhouse gas in Japan
* NE: Not Estimated * CH4 and N2O emissions in Table 2-1 include emissions from Land Use, Land Use Change and
Forestry based on the estimation method decided by the UNFCCC. On the contrary, since emissions from Land Use, Land Use Change and Forestry are regarded as RMU (removal unit) according to Article 3.3 of the Kyoto Protocol, they are not included in GHG emissions based on Kyoto Protocol (refer annex 8 table 1).
4 Statistics on removals of CO2 have not been updated. The most recently available data is therefore for FY1995.
[Mt CO2 eq.] GWP 1990 1991 1992 1993 1994 1995 1996 1997 1998 1999 2000 2001 2002 2003 2004
CO2 Emissions 1 1,138.8 1,148.1 1,158.0 1,149.8 1,206.4 1,219.5 1,233.7 1,227.9 1,191.9 1,229.2 1,251.1 1,236.1 1,269.3 1,279.4 1,279.2
CO2 Removals 1 -72.0 -62.1 -73.2 -78.4 -83.6 -88.0 NE NE NE NE NE NE NE NE NE
CH4 21 33.2 32.9 32.6 32.5 31.9 31.3 30.7 29.6 28.7 28.0 27.3 26.4 25.4 24.8 24.4
N2O 310 33.2 32.7 33.0 32.7 33.9 34.4 35.7 36.3 34.9 28.8 31.3 28.1 28.0 28.1 28.4
HFCs HFC-134a:1,300 etc. 0.0 0.0 0.0 0.0 0.0 20.2 19.9 19.8 19.3 19.8 18.5 15.8 12.9 12.3 8.5
PFCs PFC-14:6,500 etc. 0.0 0.0 0.0 0.0 0.0 12.6 15.3 16.9 16.6 14.9 13.7 11.5 9.8 9.0 9.9
SF6 23,900 0.0 0.0 0.0 0.0 0.0 16.9 17.5 14.8 13.4 9.1 6.8 5.7 5.3 4.7 4.5
Gross Total 1,205.1 1,213.7 1,223.6 1,215.0 1,272.3 1,334.8 1,352.7 1,345.3 1,304.8 1,329.8 1,348.8 1,323.6 1,350.7 1,358.2 1,354.9
Net Total 1,133.1 1,151.7 1,150.4 1,136.6 1,188.7 1,246.8 1,352.7 1,345.3 1,304.8 1,329.8 1,348.8 1,323.6 1,350.7 1,358.2 1,354.9
Chapter 2. Trends in GHGs Emissions and Removals
Page 2.4 National Greenhouse Gas Inventory Report of Japan 2006
2.2.1. CO25
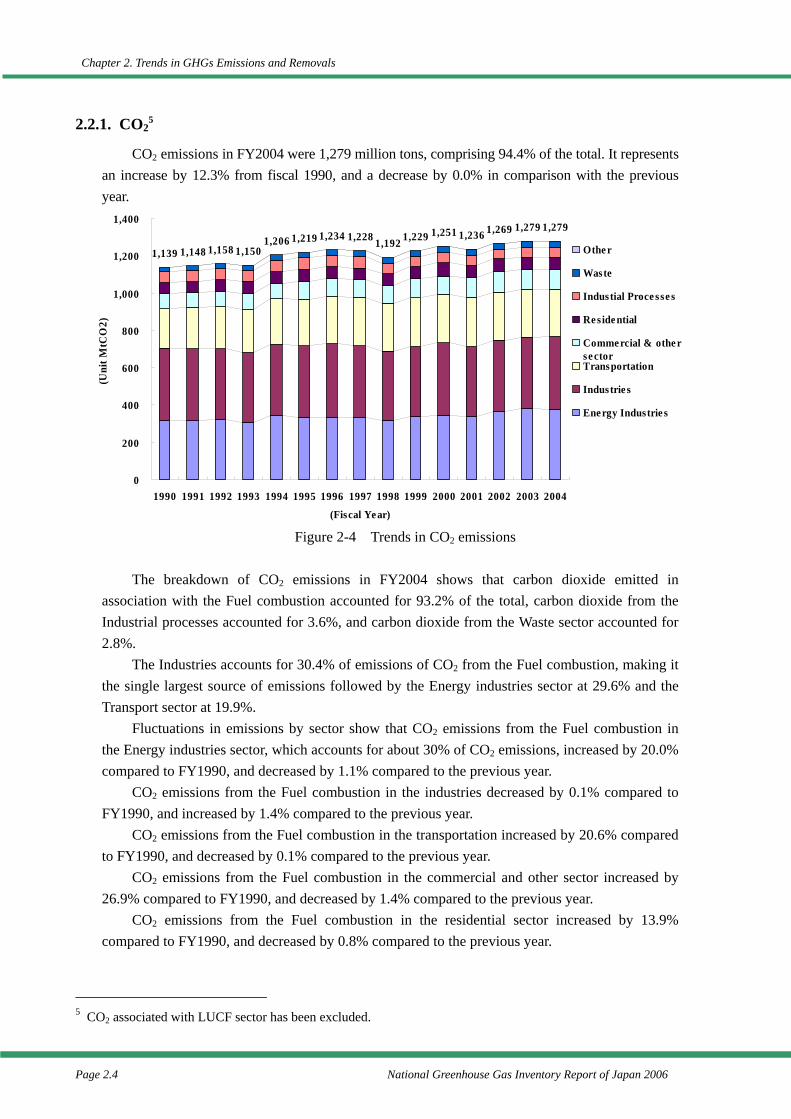
CO2 emissions in FY2004 were 1,279 million tons, comprising 94.4% of the total. It represents an increase by 12.3% from fiscal 1990, and a decrease by 0.0% in comparison with the previous year.
Figure 2-4 Trends in CO2 emissions The breakdown of CO2 emissions in FY2004 shows that carbon dioxide emitted in
association with the Fuel combustion accounted for 93.2% of the total, carbon dioxide from the Industrial processes accounted for 3.6%, and carbon dioxide from the Waste sector accounted for 2.8%.
The Industries accounts for 30.4% of emissions of CO2 from the Fuel combustion, making it the single largest source of emissions followed by the Energy industries sector at 29.6% and the Transport sector at 19.9%.
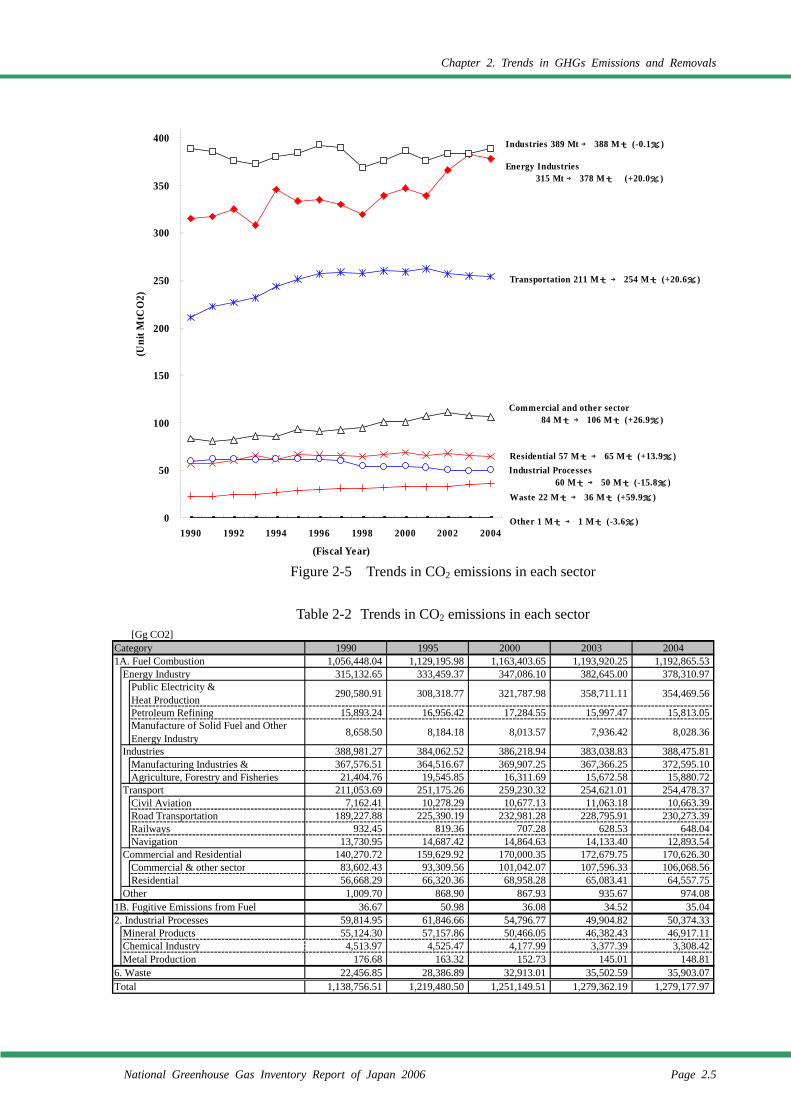
Fluctuations in emissions by sector show that CO2 emissions from the Fuel combustion in the Energy industries sector, which accounts for about 30% of CO2 emissions, increased by 20.0% compared to FY1990, and decreased by 1.1% compared to the previous year.
CO2 emissions from the Fuel combustion in the industries decreased by 0.1% compared to FY1990, and increased by 1.4% compared to the previous year.
CO2 emissions from the Fuel combustion in the transportation increased by 20.6% compared to FY1990, and decreased by 0.1% compared to the previous year.
CO2 emissions from the Fuel combustion in the commercial and other sector increased by 26.9% compared to FY1990, and decreased by 1.4% compared to the previous year.
CO2 emissions from the Fuel combustion in the residential sector increased by 13.9% compared to FY1990, and decreased by 0.8% compared to the previous year.
5 CO2 associated with LUCF sector has been excluded.
1,139 1,148 1,158 1,1501,206 1,219 1,234 1,228 1,192 1,229 1,251 1,236 1,269 1,279 1,279
0
200
400
600
800
1,000
1,200
1,400
1990 1991 1992 1993 1994 1995 1996 1997 1998 1999 2000 2001 2002 2003 2004
(Fiscal Ye ar)
(Uni
t MtC
O2)
Othe r
Waste
Industial Proce sse s
Re side ntial
Comme rcial & othe rse ctorTransportation
Industrie s
Energy Industrie s
Chapter 2. Trends in GHGs Emissions and Removals
National Greenhouse Gas Inventory Report of Japan 2006 Page 2.5
Figure 2-5 Trends in CO2 emissions in each sector
Table 2-2 Trends in CO2 emissions in each sector
0
50
100
150
200
250
300
350
400
1990 1992 1994 1996 1998 2000 2002 2004
(Fiscal Year)
(Uni
t MtC
O2)
Industries 389 Mt → 388 Mt (-0.1% )
Energy Industries 315 Mt → 378 Mt (+20.0% )
Transportation 211 Mt → 254 Mt (+20.6% )
Residential 57 Mt → 65 Mt (+13.9% )
Commercial and other sector 84 Mt → 106 Mt (+26.9% )
Industrial Processes 60 Mt → 50 Mt (-15.8% )Waste 22 Mt → 36 Mt (+59.9% )
Other 1 Mt → 1 Mt (-3.6% )
[Gg CO2]Category 1990 1995 2000 2003 20041A. Fuel Combustion 1,056,448.04 1,129,195.98 1,163,403.65 1,193,920.25 1,192,865.53
Energy Industry 315,132.65 333,459.37 347,086.10 382,645.00 378,310.97Public Electricity &Heat Production 290,580.91 308,318.77 321,787.98 358,711.11 354,469.56
Petroleum Refining 15,893.24 16,956.42 17,284.55 15,997.47 15,813.05Manufacture of Solid Fuel and OtherEnergy Industry 8,658.50 8,184.18 8,013.57 7,936.42 8,028.36
Industries 388,981.27 384,062.52 386,218.94 383,038.83 388,475.81Manufacturing Industries & 367,576.51 364,516.67 369,907.25 367,366.25 372,595.10Agriculture, Forestry and Fisheries 21,404.76 19,545.85 16,311.69 15,672.58 15,880.72
Transport 211,053.69 251,175.26 259,230.32 254,621.01 254,478.37Civil Aviation 7,162.41 10,278.29 10,677.13 11,063.18 10,663.39Road Transportation 189,227.88 225,390.19 232,981.28 228,795.91 230,273.39Railways 932.45 819.36 707.28 628.53 648.04Navigation 13,730.95 14,687.42 14,864.63 14,133.40 12,893.54
Commercial and Residential 140,270.72 159,629.92 170,000.35 172,679.75 170,626.30Commercial & other sector 83,602.43 93,309.56 101,042.07 107,596.33 106,068.56Residential 56,668.29 66,320.36 68,958.28 65,083.41 64,557.75
Other 1,009.70 868.90 867.93 935.67 974.081B. Fugitive Emissions from Fuel 36.67 50.98 36.08 34.52 35.042. Industrial Processes 59,814.95 61,846.66 54,796.77 49,904.82 50,374.33
Mineral Products 55,124.30 57,157.86 50,466.05 46,382.43 46,917.11Chemical Industry 4,513.97 4,525.47 4,177.99 3,377.39 3,308.42Metal Production 176.68 163.32 152.73 145.01 148.81
6. Waste 22,456.85 28,386.89 32,913.01 35,502.59 35,903.07Total 1,138,756.51 1,219,480.50 1,251,149.51 1,279,362.19 1,279,177.97
Chapter 2. Trends in GHGs Emissions and Removals
Page 2.6 National Greenhouse Gas Inventory Report of Japan 2006
2.2.2. CH4
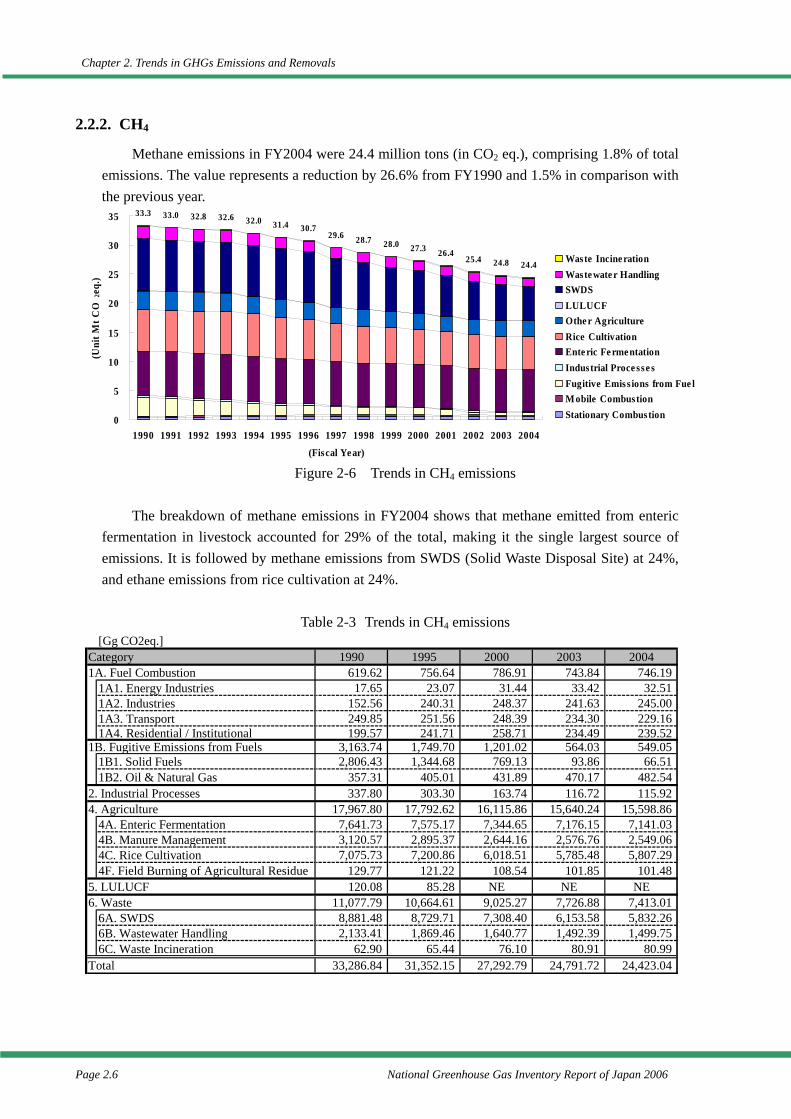
Methane emissions in FY2004 were 24.4 million tons (in CO2 eq.), comprising 1.8% of total emissions. The value represents a reduction by 26.6% from FY1990 and 1.5% in comparison with the previous year.
Figure 2-6 Trends in CH4 emissions The breakdown of methane emissions in FY2004 shows that methane emitted from enteric
fermentation in livestock accounted for 29% of the total, making it the single largest source of emissions. It is followed by methane emissions from SWDS (Solid Waste Disposal Site) at 24%, and ethane emissions from rice cultivation at 24%.
Table 2-3 Trends in CH4 emissions
33.3 32.831.4
29.628.0
26.425.4 24.8 24.4
27.328.7
30.732.032.633.0
0
5
10
15
20
25
30
35
1990 1991 1992 1993 1994 1995 1996 1997 1998 1999 2000 2001 2002 2003 2004
(Fiscal Year)
(Uni
t Mt C
O2e
q.)
Waste IncinerationWastewate r HandlingSWDSLULUCFOthe r AgricultureRice CultivationEnte ric Fe rmentationIndustrial Proce sse sFugitive Emiss ions from Fue lM obile CombustionStationary CombustionTotal
[Gg CO2eq.]Category 1990 1995 2000 2003 20041A. Fuel Combustion 619.62 756.64 786.91 743.84 746.19
1A1. Energy Industries 17.65 23.07 31.44 33.42 32.511A2. Industries 152.56 240.31 248.37 241.63 245.001A3. Transport 249.85 251.56 248.39 234.30 229.161A4. Residential / Institutional 199.57 241.71 258.71 234.49 239.52
1B. Fugitive Emissions from Fuels 3,163.74 1,749.70 1,201.02 564.03 549.051B1. Solid Fuels 2,806.43 1,344.68 769.13 93.86 66.511B2. Oil & Natural Gas 357.31 405.01 431.89 470.17 482.54
2. Industrial Processes 337.80 303.30 163.74 116.72 115.924. Agriculture 17,967.80 17,792.62 16,115.86 15,640.24 15,598.86
4A. Enteric Fermentation 7,641.73 7,575.17 7,344.65 7,176.15 7,141.034B. Manure Management 3,120.57 2,895.37 2,644.16 2,576.76 2,549.064C. Rice Cultivation 7,075.73 7,200.86 6,018.51 5,785.48 5,807.294F. Field Burning of Agricultural Residue 129.77 121.22 108.54 101.85 101.48
5. LULUCF 120.08 85.28 NE NE NE6. Waste 11,077.79 10,664.61 9,025.27 7,726.88 7,413.01
6A. SWDS 8,881.48 8,729.71 7,308.40 6,153.58 5,832.266B. Wastewater Handling 2,133.41 1,869.46 1,640.77 1,492.39 1,499.756C. Waste Incineration 62.90 65.44 76.10 80.91 80.99
Total 33,286.84 31,352.15 27,292.79 24,791.72 24,423.04
Chapter 2. Trends in GHGs Emissions and Removals
National Greenhouse Gas Inventory Report of Japan 2006 Page 2.7
2.2.3. N2O
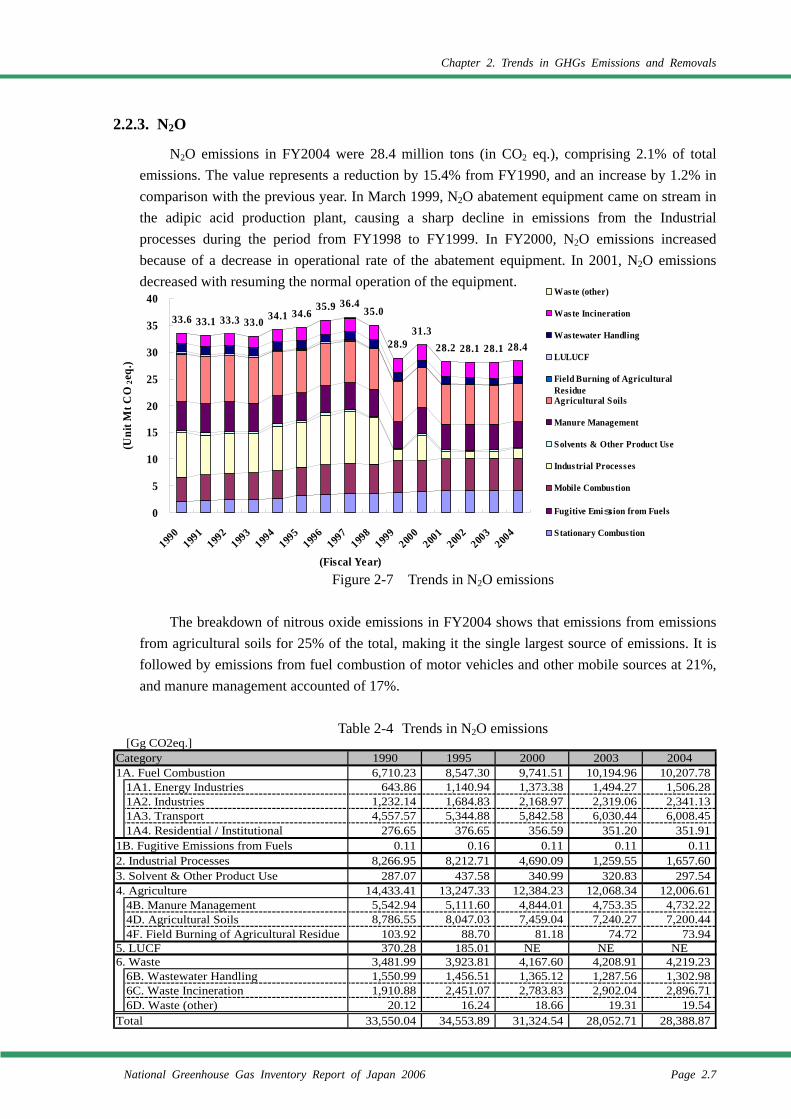
N2O emissions in FY2004 were 28.4 million tons (in CO2 eq.), comprising 2.1% of total emissions. The value represents a reduction by 15.4% from FY1990, and an increase by 1.2% in comparison with the previous year. In March 1999, N2O abatement equipment came on stream in the adipic acid production plant, causing a sharp decline in emissions from the Industrial processes during the period from FY1998 to FY1999. In FY2000, N2O emissions increased because of a decrease in operational rate of the abatement equipment. In 2001, N2O emissions decreased with resuming the normal operation of the equipment.
Figure 2-7 Trends in N2O emissions The breakdown of nitrous oxide emissions in FY2004 shows that emissions from emissions
from agricultural soils for 25% of the total, making it the single largest source of emissions. It is followed by emissions from fuel combustion of motor vehicles and other mobile sources at 21%, and manure management accounted of 17%.
Table 2-4 Trends in N2O emissions
[Gg CO2eq.]Category 1990 1995 2000 2003 20041A. Fuel Combustion 6,710.23 8,547.30 9,741.51 10,194.96 10,207.78
1A1. Energy Industries 643.86 1,140.94 1,373.38 1,494.27 1,506.281A2. Industries 1,232.14 1,684.83 2,168.97 2,319.06 2,341.131A3. Transport 4,557.57 5,344.88 5,842.58 6,030.44 6,008.451A4. Residential / Institutional 276.65 376.65 356.59 351.20 351.91
1B. Fugitive Emissions from Fuels 0.11 0.16 0.11 0.11 0.112. Industrial Processes 8,266.95 8,212.71 4,690.09 1,259.55 1,657.603. Solvent & Other Product Use 287.07 437.58 340.99 320.83 297.544. Agriculture 14,433.41 13,247.33 12,384.23 12,068.34 12,006.61
4B. Manure Management 5,542.94 5,111.60 4,844.01 4,753.35 4,732.224D. Agricultural Soils 8,786.55 8,047.03 7,459.04 7,240.27 7,200.444F. Field Burning of Agricultural Residue 103.92 88.70 81.18 74.72 73.94
5. LUCF 370.28 185.01 NE NE NE6. Waste 3,481.99 3,923.81 4,167.60 4,208.91 4,219.23
6B. Wastewater Handling 1,550.99 1,456.51 1,365.12 1,287.56 1,302.986C. Waste Incineration 1,910.88 2,451.07 2,783.83 2,902.04 2,896.716D. Waste (other) 20.12 16.24 18.66 19.31 19.54
Total 33,550.04 34,553.89 31,324.54 28,052.71 28,388.87
33.6 33.3 34.6 35.0
28.931.3
28.2 28.1 28.1 28.4
33.1 33.0 34.135.9 36.4
0
5
10
15
20
25
30
35
40
1990
1991
1992
1993
1994
1995
1996
1997
1998
1999
2000
2001
2002
2003
2004
(Fiscal Year)
(Uni
t Mt C
O2e
q.)
Waste (other)
Waste Incineration
Wastewater Handling
LULUCF
Field Burning of AgriculturalResidueAgricultural Soils
Manure Management
Solvents & Other Product Use
Industrial Processes
Mobile Combustion
Fugitive Emiss ion from Fuels
Stationary Combustion
Chapter 2. Trends in GHGs Emissions and Removals
Page 2.8 National Greenhouse Gas Inventory Report of Japan 2006
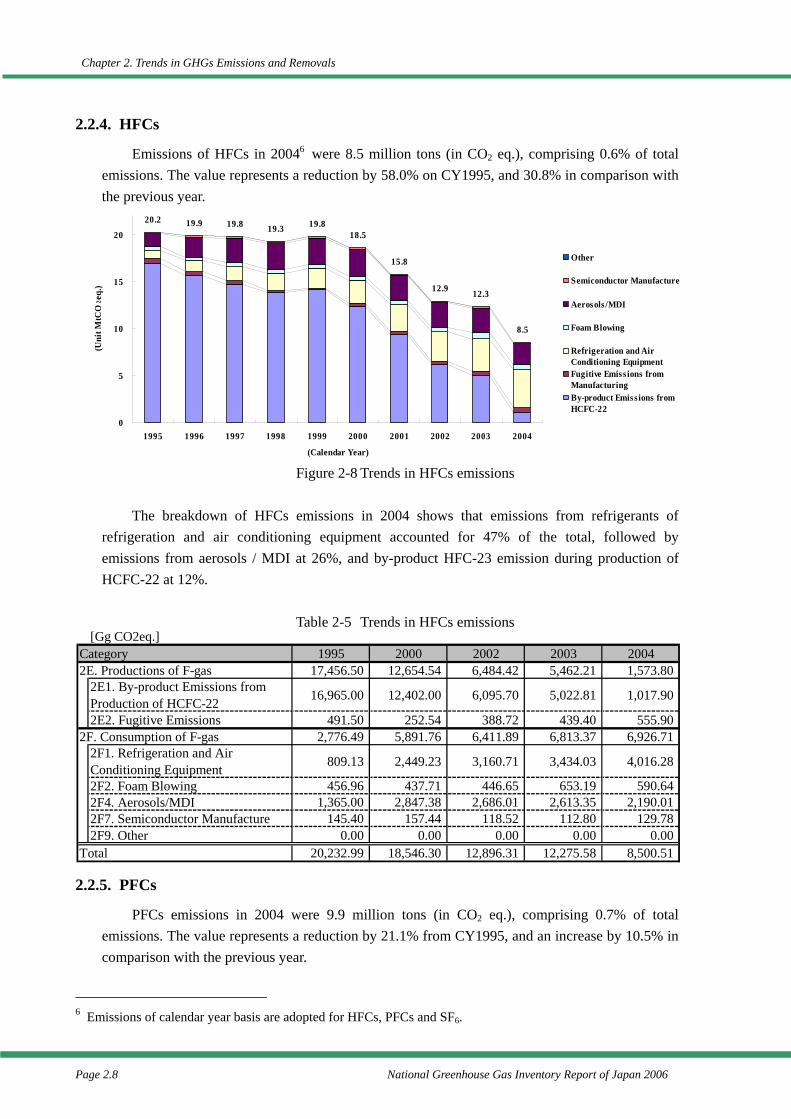
2.2.4. HFCs
Emissions of HFCs in 20046 were 8.5 million tons (in CO2 eq.), comprising 0.6% of total emissions. The value represents a reduction by 58.0% on CY1995, and 30.8% in comparison with the previous year.
Figure 2-8 Trends in HFCs emissions The breakdown of HFCs emissions in 2004 shows that emissions from refrigerants of
refrigeration and air conditioning equipment accounted for 47% of the total, followed by emissions from aerosols / MDI at 26%, and by-product HFC-23 emission during production of HCFC-22 at 12%.
Table 2-5 Trends in HFCs emissions
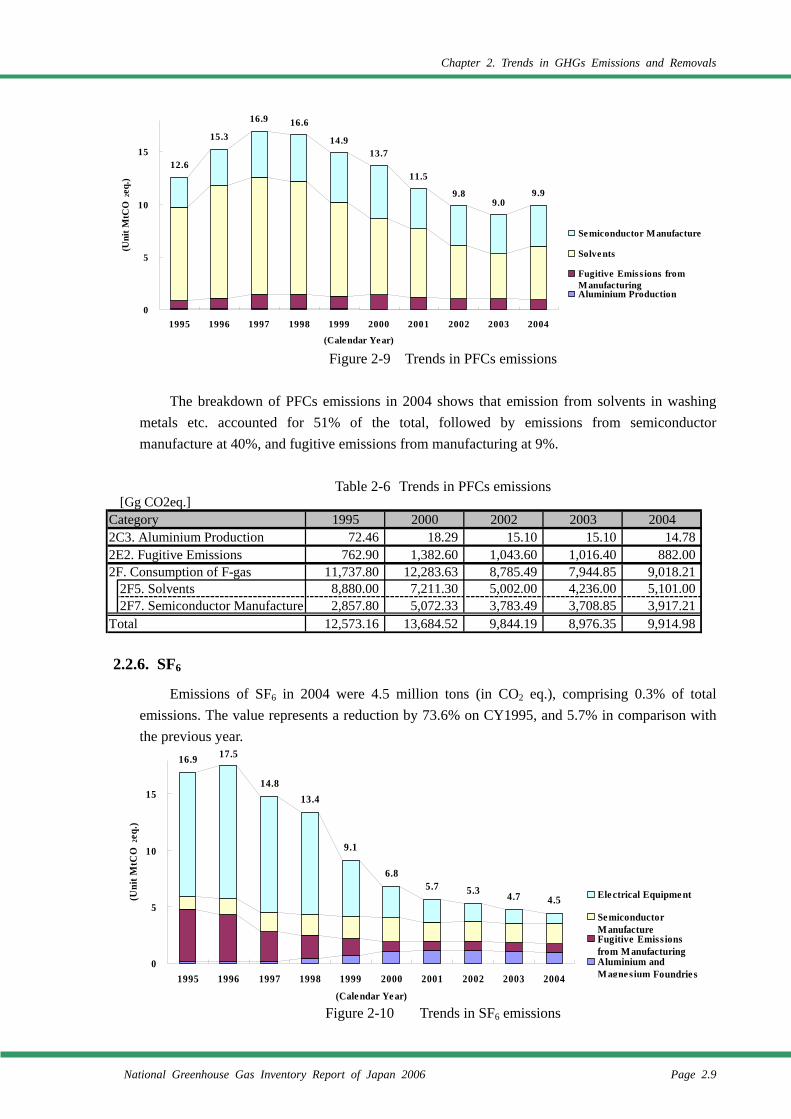
2.2.5. PFCs
PFCs emissions in 2004 were 9.9 million tons (in CO2 eq.), comprising 0.7% of total emissions. The value represents a reduction by 21.1% from CY1995, and an increase by 10.5% in comparison with the previous year.
6 Emissions of calendar year basis are adopted for HFCs, PFCs and SF6.
[Gg CO2eq.]Category 1995 2000 2002 2003 20042E. Productions of F-gas 17,456.50 12,654.54 6,484.42 5,462.21 1,573.80
2E1. By-product Emissions fromProduction of HCFC-22 16,965.00 12,402.00 6,095.70 5,022.81 1,017.90
2E2. Fugitive Emissions 491.50 252.54 388.72 439.40 555.902F. Consumption of F-gas 2,776.49 5,891.76 6,411.89 6,813.37 6,926.71
2F1. Refrigeration and AirConditioning Equipment 809.13 2,449.23 3,160.71 3,434.03 4,016.28
2F2. Foam Blowing 456.96 437.71 446.65 653.19 590.642F4. Aerosols/MDI 1,365.00 2,847.38 2,686.01 2,613.35 2,190.012F7. Semiconductor Manufacture 145.40 157.44 118.52 112.80 129.782F9. Other 0.00 0.00 0.00 0.00 0.00
Total 20,232.99 18,546.30 12,896.31 12,275.58 8,500.51
20.2 19.9 19.8 19.3 19.818.5
15.8
12.9 12.3
8.5
0
5
10
15
20
1995 1996 1997 1998 1999 2000 2001 2002 2003 2004
(Calendar Year)
(Uni
t MtC
O2 e
q.)
Other
Semiconductor Manufacture
Aerosols /MDI
Foam Blowing
Refrigeration and AirConditioning EquipmentFugitive Emiss ions fromManufacturingBy-product Emiss ions fromHCFC-22Total
Chapter 2. Trends in GHGs Emissions and Removals
National Greenhouse Gas Inventory Report of Japan 2006 Page 2.9
Figure 2-9 Trends in PFCs emissions The breakdown of PFCs emissions in 2004 shows that emission from solvents in washing
metals etc. accounted for 51% of the total, followed by emissions from semiconductor manufacture at 40%, and fugitive emissions from manufacturing at 9%.
Table 2-6 Trends in PFCs emissions
2.2.6. SF6
Emissions of SF6 in 2004 were 4.5 million tons (in CO2 eq.), comprising 0.3% of total emissions. The value represents a reduction by 73.6% on CY1995, and 5.7% in comparison with the previous year.
Figure 2-10 Trends in SF6 emissions
12.6
15.3
16.9 16.6
14.913.7
11.5
9.89.0
9.9
0
5
10
15
1995 1996 1997 1998 1999 2000 2001 2002 2003 2004
(Cale ndar Year)
(Uni
t MtC
O2e
q.)
Se miconductor Manufacture
Solvents
Fugitive Emiss ions fromManufacturingAluminium Production
Total
[Gg CO2eq.]Category 1995 2000 2002 2003 20042C3. Aluminium Production 72.46 18.29 15.10 15.10 14.782E2. Fugitive Emissions 762.90 1,382.60 1,043.60 1,016.40 882.002F. Consumption of F-gas 11,737.80 12,283.63 8,785.49 7,944.85 9,018.21
2F5. Solvents 8,880.00 7,211.30 5,002.00 4,236.00 5,101.002F7. Semiconductor Manufacture 2,857.80 5,072.33 3,783.49 3,708.85 3,917.21
Total 12,573.16 13,684.52 9,844.19 8,976.35 9,914.98
16.9 17.5
14.813.4
9.1
6.85.7 5.3 4.7 4.5
0
5
10
15
1995 1996 1997 1998 1999 2000 2001 2002 2003 2004
(Cale ndar Ye ar)
(Uni
t MtC
O2e
q.)
Ele ctrical Equipme nt
Se miconductorManufactureFugitive Emiss ionsfrom ManufacturingAluminium andMagnesium Foundrie sTotal
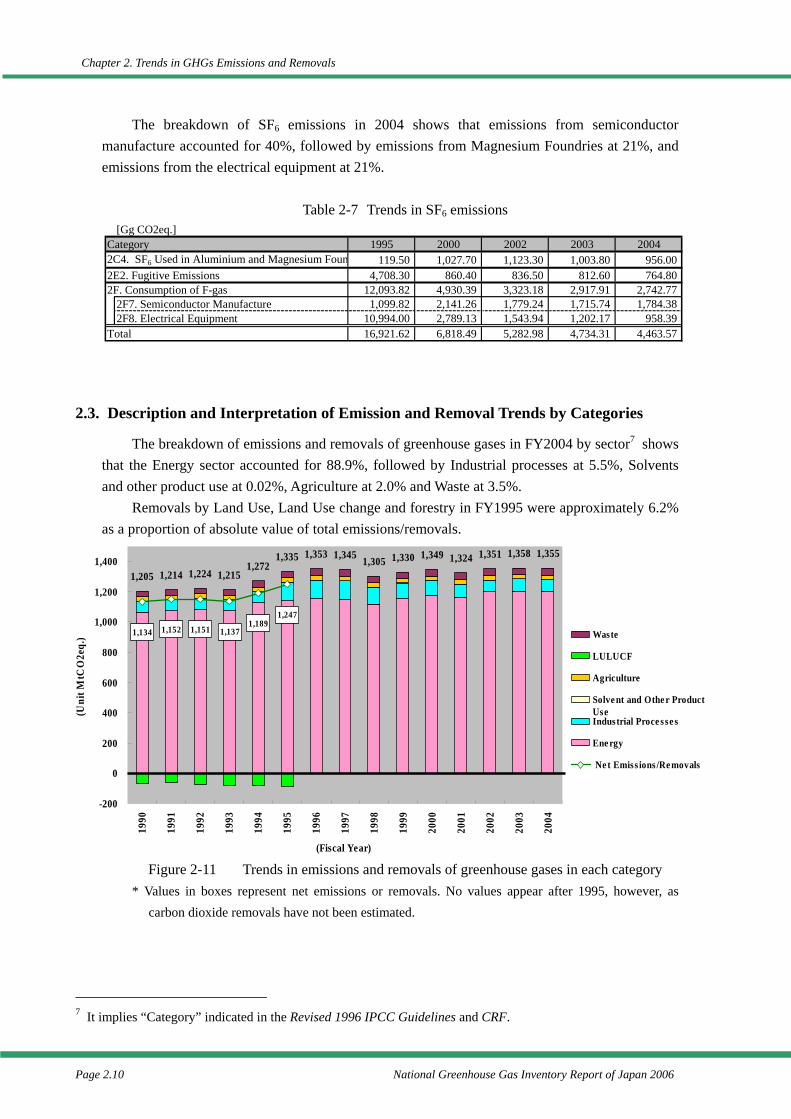
Chapter 2. Trends in GHGs Emissions and Removals
Page 2.10 National Greenhouse Gas Inventory Report of Japan 2006
The breakdown of SF6 emissions in 2004 shows that emissions from semiconductor manufacture accounted for 40%, followed by emissions from Magnesium Foundries at 21%, and emissions from the electrical equipment at 21%.
Table 2-7 Trends in SF6 emissions
2.3. Description and Interpretation of Emission and Removal Trends by Categories
The breakdown of emissions and removals of greenhouse gases in FY2004 by sector7 shows that the Energy sector accounted for 88.9%, followed by Industrial processes at 5.5%, Solvents and other product use at 0.02%, Agriculture at 2.0% and Waste at 3.5%.
Removals by Land Use, Land Use change and forestry in FY1995 were approximately 6.2% as a proportion of absolute value of total emissions/removals.
Figure 2-11 Trends in emissions and removals of greenhouse gases in each category * Values in boxes represent net emissions or removals. No values appear after 1995, however, as
carbon dioxide removals have not been estimated.
7 It implies “Category” indicated in the Revised 1996 IPCC Guidelines and CRF.
[Gg CO2eq.]Category 1995 2000 2002 2003 20042C4. SF6 Used in Aluminium and Magnesium Foun 119.50 1,027.70 1,123.30 1,003.80 956.002E2. Fugitive Emissions 4,708.30 860.40 836.50 812.60 764.802F. Consumption of F-gas 12,093.82 4,930.39 3,323.18 2,917.91 2,742.77
2F7. Semiconductor Manufacture 1,099.82 2,141.26 1,779.24 1,715.74 1,784.382F8. Electrical Equipment 10,994.00 2,789.13 1,543.94 1,202.17 958.39
Total 16,921.62 6,818.49 5,282.98 4,734.31 4,463.57
1,205 1,214 1,224 1,2151,272
1,335 1,353 1,345 1,305 1,330 1,349 1,324 1,351 1,358 1,355
1,2471,189
1,1371,1511,1521,134
-200
0
200
400
600
800
1,000
1,200
1,400
1990
1991
1992
1993
1994
1995
1996
1997
1998
1999
2000
2001
2002
2003
2004
(Fiscal Year)
(Uni
t MtC
O2e
q.) Waste
LULUCF
Agriculture
Solve nt and Othe r ProductUseIndustrial Proce sse s
Ene rgy
Ne t Emiss ions /Removals
Emiss ions
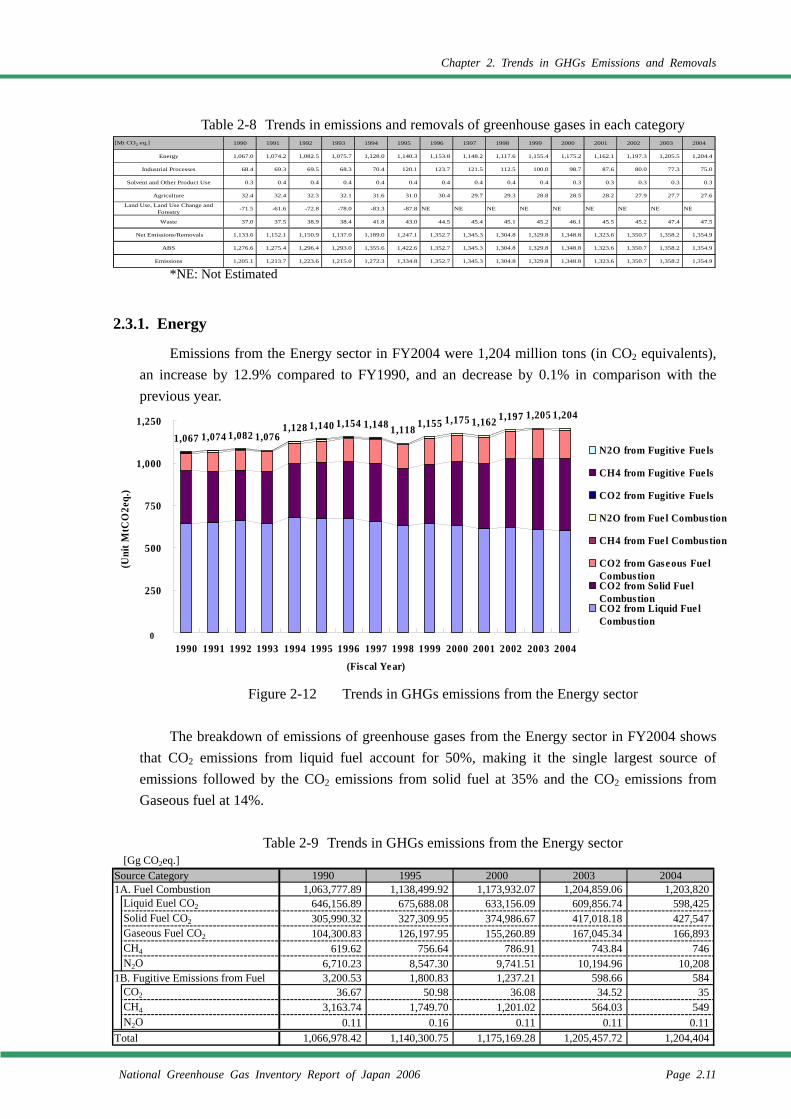
Chapter 2. Trends in GHGs Emissions and Removals
National Greenhouse Gas Inventory Report of Japan 2006 Page 2.11
Table 2-8 Trends in emissions and removals of greenhouse gases in each category *NE: Not Estimated
2.3.1. Energy
Emissions from the Energy sector in FY2004 were 1,204 million tons (in CO2 equivalents), an increase by 12.9% compared to FY1990, and an decrease by 0.1% in comparison with the previous year.
Figure 2-12 Trends in GHGs emissions from the Energy sector The breakdown of emissions of greenhouse gases from the Energy sector in FY2004 shows
that CO2 emissions from liquid fuel account for 50%, making it the single largest source of emissions followed by the CO2 emissions from solid fuel at 35% and the CO2 emissions from Gaseous fuel at 14%.
Table 2-9 Trends in GHGs emissions from the Energy sector
[Mt CO2 eq.] 1990 1991 1992 1993 1994 1995 1996 1997 1998 1999 2000 2001 2002 2003 2004
Energy 1,067.0 1,074.2 1,082.5 1,075.7 1,128.0 1,140.3 1,153.8 1,148.2 1,117.6 1,155.4 1,175.2 1,162.1 1,197.3 1,205.5 1,204.4
Industrial Processes 68.4 69.3 69.5 68.3 70.4 120.1 123.7 121.5 112.5 100.0 98.7 87.6 80.0 77.3 75.0
Solvent and Other Product Use 0.3 0.4 0.4 0.4 0.4 0.4 0.4 0.4 0.4 0.4 0.3 0.3 0.3 0.3 0.3
Agriculture 32.4 32.4 32.3 32.1 31.6 31.0 30.4 29.7 29.3 28.8 28.5 28.2 27.9 27.7 27.6
Land Use, Land Use Change andForestry -71.5 -61.6 -72.8 -78.0 -83.3 -87.8 NE NE NE NE NE NE NE NE NE
Waste 37.0 37.5 38.9 38.4 41.8 43.0 44.5 45.4 45.1 45.2 46.1 45.5 45.2 47.4 47.5
Net Emissions/Removals 1,133.6 1,152.1 1,150.9 1,137.0 1,189.0 1,247.1 1,352.7 1,345.3 1,304.8 1,329.8 1,348.8 1,323.6 1,350.7 1,358.2 1,354.9
ABS 1,276.6 1,275.4 1,296.4 1,293.0 1,355.6 1,422.6 1,352.7 1,345.3 1,304.8 1,329.8 1,348.8 1,323.6 1,350.7 1,358.2 1,354.9
Emissions 1,205.1 1,213.7 1,223.6 1,215.0 1,272.3 1,334.8 1,352.7 1,345.3 1,304.8 1,329.8 1,348.8 1,323.6 1,350.7 1,358.2 1,354.9
1,067 1,074 1,082 1,0761,128 1,140 1,154 1,148 1,118 1,155 1,175 1,162 1,197 1,205 1,204
0
250
500
750
1,000
1,250
1990 1991 1992 1993 1994 1995 1996 1997 1998 1999 2000 2001 2002 2003 2004(Fiscal Ye ar)
(Uni
t MtC
O2e
q.)
N2O from Fugitive Fue ls
CH4 from Fugitive Fue ls
CO2 from Fugitive Fue ls
N2O from Fue l Combustion
CH4 from Fue l Combustion
CO2 from Gase ous Fue lCombustion CO2 from Solid Fue lCombustion CO2 from Liquid Fue lCombustion Total0
[Gg CO2eq.]Source Category 1990 1995 2000 2003 20041A. Fuel Combustion 1,063,777.89 1,138,499.92 1,173,932.07 1,204,859.06 1,203,820
Liquid Euel CO2 646,156.89 675,688.08 633,156.09 609,856.74 598,425Solid Fuel CO2 305,990.32 327,309.95 374,986.67 417,018.18 427,547Gaseous Fuel CO2 104,300.83 126,197.95 155,260.89 167,045.34 166,893CH4 619.62 756.64 786.91 743.84 746N2O 6,710.23 8,547.30 9,741.51 10,194.96 10,208
1B. Fugitive Emissions from Fuel 3,200.53 1,800.83 1,237.21 598.66 584CO2 36.67 50.98 36.08 34.52 35CH4 3,163.74 1,749.70 1,201.02 564.03 549N2O 0.11 0.16 0.11 0.11 0.11
Total 1,066,978.42 1,140,300.75 1,175,169.28 1,205,457.72 1,204,404
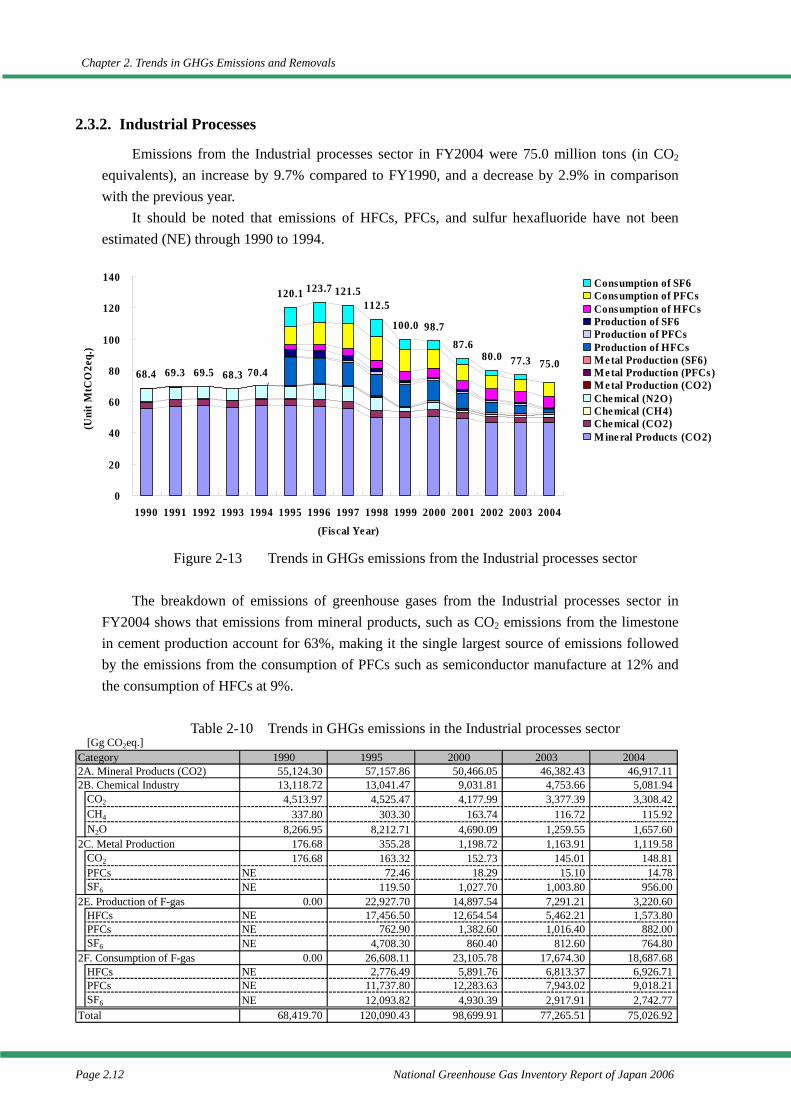
Chapter 2. Trends in GHGs Emissions and Removals
Page 2.12 National Greenhouse Gas Inventory Report of Japan 2006
2.3.2. Industrial Processes
Emissions from the Industrial processes sector in FY2004 were 75.0 million tons (in CO2 equivalents), an increase by 9.7% compared to FY1990, and a decrease by 2.9% in comparison with the previous year.
It should be noted that emissions of HFCs, PFCs, and sulfur hexafluoride have not been estimated (NE) through 1990 to 1994.
Figure 2-13 Trends in GHGs emissions from the Industrial processes sector
The breakdown of emissions of greenhouse gases from the Industrial processes sector in
FY2004 shows that emissions from mineral products, such as CO2 emissions from the limestone in cement production account for 63%, making it the single largest source of emissions followed by the emissions from the consumption of PFCs such as semiconductor manufacture at 12% and the consumption of HFCs at 9%.
Table 2-10 Trends in GHGs emissions in the Industrial processes sector
[Gg CO2eq.]Category 1990 1995 2000 2003 20042A. Mineral Products (CO2) 55,124.30 57,157.86 50,466.05 46,382.43 46,917.112B. Chemical Industry 13,118.72 13,041.47 9,031.81 4,753.66 5,081.94
CO2 4,513.97 4,525.47 4,177.99 3,377.39 3,308.42CH4 337.80 303.30 163.74 116.72 115.92N2O 8,266.95 8,212.71 4,690.09 1,259.55 1,657.60
2C. Metal Production 176.68 355.28 1,198.72 1,163.91 1,119.58CO2 176.68 163.32 152.73 145.01 148.81PFCs NE 72.46 18.29 15.10 14.78SF6 NE 119.50 1,027.70 1,003.80 956.00
2E. Production of F-gas 0.00 22,927.70 14,897.54 7,291.21 3,220.60HFCs NE 17,456.50 12,654.54 5,462.21 1,573.80PFCs NE 762.90 1,382.60 1,016.40 882.00SF6 NE 4,708.30 860.40 812.60 764.80
2F. Consumption of F-gas 0.00 26,608.11 23,105.78 17,674.30 18,687.68HFCs NE 2,776.49 5,891.76 6,813.37 6,926.71PFCs NE 11,737.80 12,283.63 7,943.02 9,018.21SF6 NE 12,093.82 4,930.39 2,917.91 2,742.77
Total 68,419.70 120,090.43 98,699.91 77,265.51 75,026.92
68.4 69.3 69.5 68.3
120.1 123.7 121.5112.5
100.0 98.787.6
80.0 77.3 75.070.4
0
20
40
60
80
100
120
140
1990 1991 1992 1993 1994 1995 1996 1997 1998 1999 2000 2001 2002 2003 2004(Fiscal Year)
(Uni
t MtC
O2e
q.)
Consumption of SF6Consumption of PFCsConsumption of HFCsProduction of SF6Production of PFCsProduction of HFCsMetal Production (SF6)Metal Production (PFCs)Metal Production (CO2)Chemical (N2O)Chemical (CH4)Chemical (CO2)Mineral Products (CO2)Total
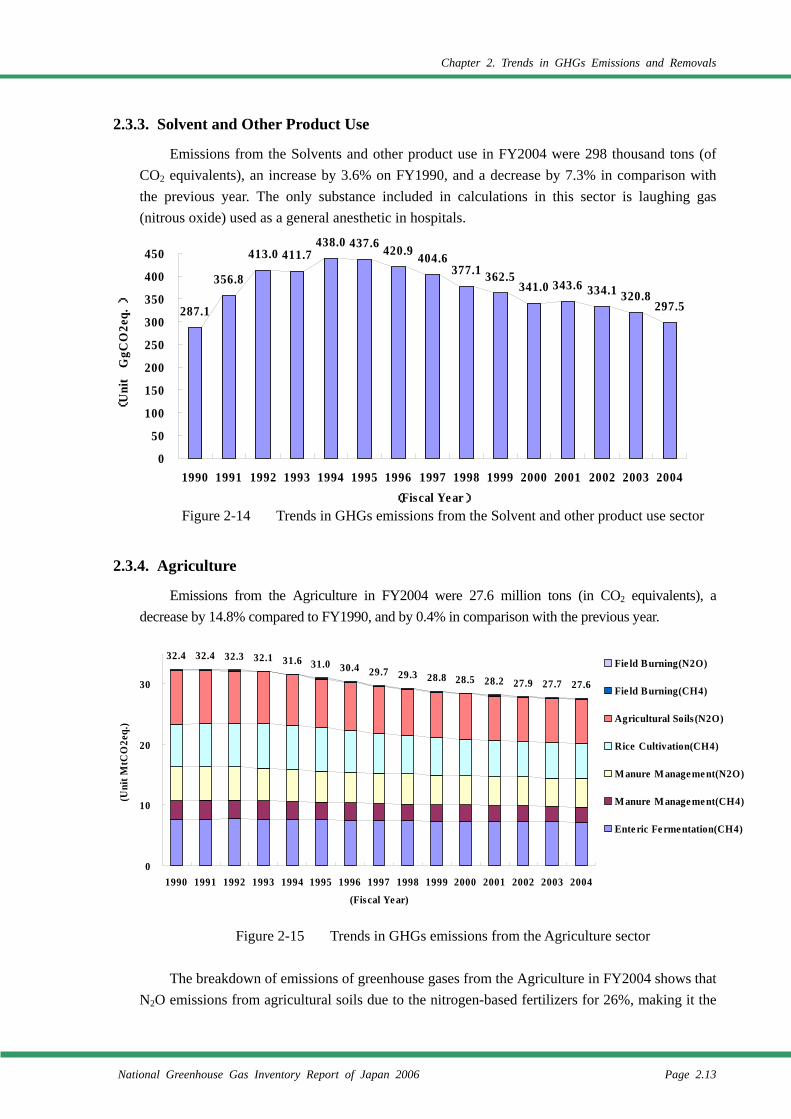
Chapter 2. Trends in GHGs Emissions and Removals
National Greenhouse Gas Inventory Report of Japan 2006 Page 2.13
2.3.3. Solvent and Other Product Use
Emissions from the Solvents and other product use in FY2004 were 298 thousand tons (of CO2 equivalents), an increase by 3.6% on FY1990, and a decrease by 7.3% in comparison with the previous year. The only substance included in calculations in this sector is laughing gas (nitrous oxide) used as a general anesthetic in hospitals.
Figure 2-14 Trends in GHGs emissions from the Solvent and other product use sector
2.3.4. Agriculture
Emissions from the Agriculture in FY2004 were 27.6 million tons (in CO2 equivalents), a decrease by 14.8% compared to FY1990, and by 0.4% in comparison with the previous year.
Figure 2-15 Trends in GHGs emissions from the Agriculture sector The breakdown of emissions of greenhouse gases from the Agriculture in FY2004 shows that
N2O emissions from agricultural soils due to the nitrogen-based fertilizers for 26%, making it the
287.1
356.8
413.0 411.7438.0 437.6 420.9 404.6
377.1 362.5341.0 343.6 334.1 320.8
297.5
0
50
100
150
200
250
300
350
400
450
1990 1991 1992 1993 1994 1995 1996 1997 1998 1999 2000 2001 2002 2003 2004( Fiscal Year)
(U
nit
GgC
O2e
q.)
32.4 32.4 32.3 32.1 31.6 31.0 30.4 29.7 29.3 28.8 28.5 28.2 27.9 27.7 27.6
0
10
20
30
1990 1991 1992 1993 1994 1995 1996 1997 1998 1999 2000 2001 2002 2003 2004
(Fiscal Ye ar)
(Uni
t MtC
O2e
q.)
Fie ld Burning(N2O)
Fie ld Burning(CH4)
Agricultural Soils (N2O)
Rice Cultivation(CH4)
Manure Manage me nt(N2O)
Manure Manage me nt(CH4)
Ente ric Fe rme ntation(CH4)
Total
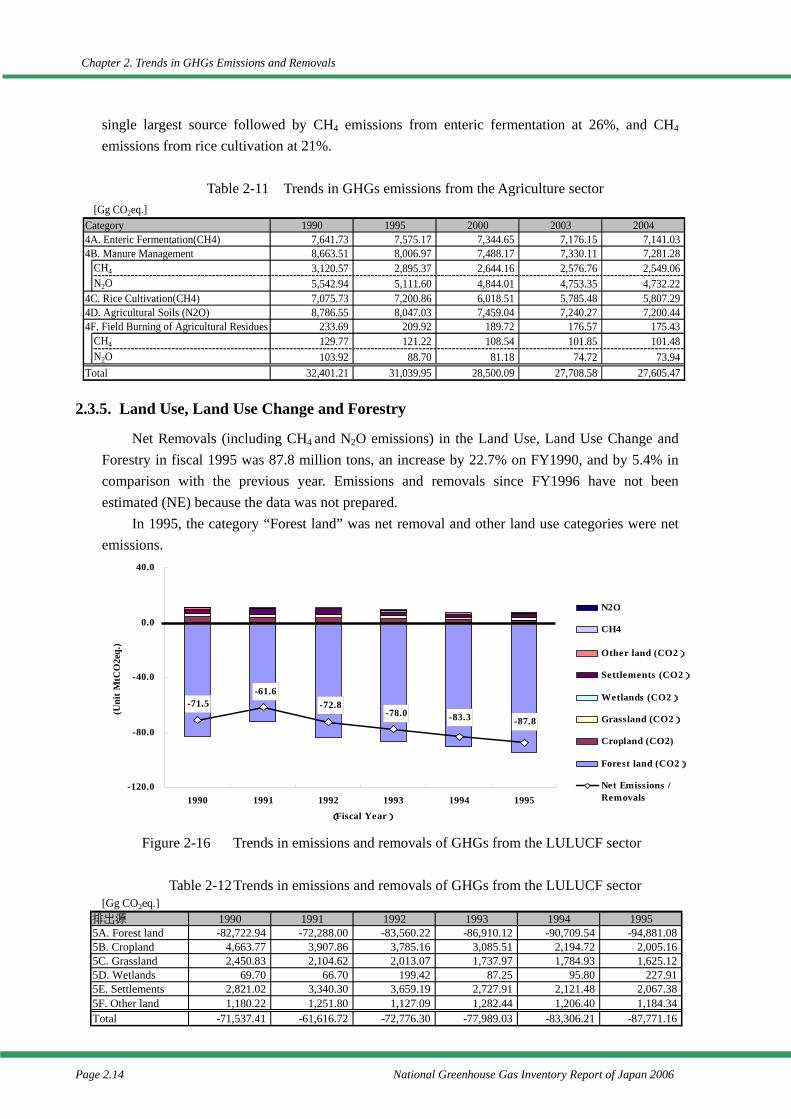
Chapter 2. Trends in GHGs Emissions and Removals
Page 2.14 National Greenhouse Gas Inventory Report of Japan 2006
single largest source followed by CH4 emissions from enteric fermentation at 26%, and CH4 emissions from rice cultivation at 21%.
Table 2-11 Trends in GHGs emissions from the Agriculture sector
2.3.5. Land Use, Land Use Change and Forestry
Net Removals (including CH4 and N2O emissions) in the Land Use, Land Use Change and Forestry in fiscal 1995 was 87.8 million tons, an increase by 22.7% on FY1990, and by 5.4% in comparison with the previous year. Emissions and removals since FY1996 have not been estimated (NE) because the data was not prepared.
In 1995, the category “Forest land” was net removal and other land use categories were net emissions.
Figure 2-16 Trends in emissions and removals of GHGs from the LULUCF sector
Table 2-12 Trends in emissions and removals of GHGs from the LULUCF sector
-71.5-61.6
-72.8
-87.8-83.3-78.0
-120.0
-80.0
-40.0
0.0
40.0
1990 1991 1992 1993 1994 1995
(Fiscal Year)
(Uni
t MtC
O2e
q.)
N2O
CH4
Other land (CO2)
Settlements (CO2)
Wetlands (CO2)
Grassland (CO2)
Cropland (CO2)
Forest land (CO2)
Net Emissions /Removals
[Gg CO2eq.]排出源 1990 1991 1992 1993 1994 19955A. Forest land -82,722.94 -72,288.00 -83,560.22 -86,910.12 -90,709.54 -94,881.085B. Cropland 4,663.77 3,907.86 3,785.16 3,085.51 2,194.72 2,005.165C. Grassland 2,450.83 2,104.62 2,013.07 1,737.97 1,784.93 1,625.125D. Wetlands 69.70 66.70 199.42 87.25 95.80 227.915E. Settlements 2,821.02 3,340.30 3,659.19 2,727.91 2,121.48 2,067.385F. Other land 1,180.22 1,251.80 1,127.09 1,282.44 1,206.40 1,184.34Total -71,537.41 -61,616.72 -72,776.30 -77,989.03 -83,306.21 -87,771.16
[Gg CO2eq.]Category 1990 1995 2000 2003 20044A. Enteric Fermentation(CH4) 7,641.73 7,575.17 7,344.65 7,176.15 7,141.034B. Manure Management 8,663.51 8,006.97 7,488.17 7,330.11 7,281.28
CH4 3,120.57 2,895.37 2,644.16 2,576.76 2,549.06N2O 5,542.94 5,111.60 4,844.01 4,753.35 4,732.22
4C. Rice Cultivation(CH4) 7,075.73 7,200.86 6,018.51 5,785.48 5,807.294D. Agricultural Soils (N2O) 8,786.55 8,047.03 7,459.04 7,240.27 7,200.444F. Field Burning of Agricultural Residues 233.69 209.92 189.72 176.57 175.43
CH4 129.77 121.22 108.54 101.85 101.48N2O 103.92 88.70 81.18 74.72 73.94
Total 32,401.21 31,039.95 28,500.09 27,708.58 27,605.47
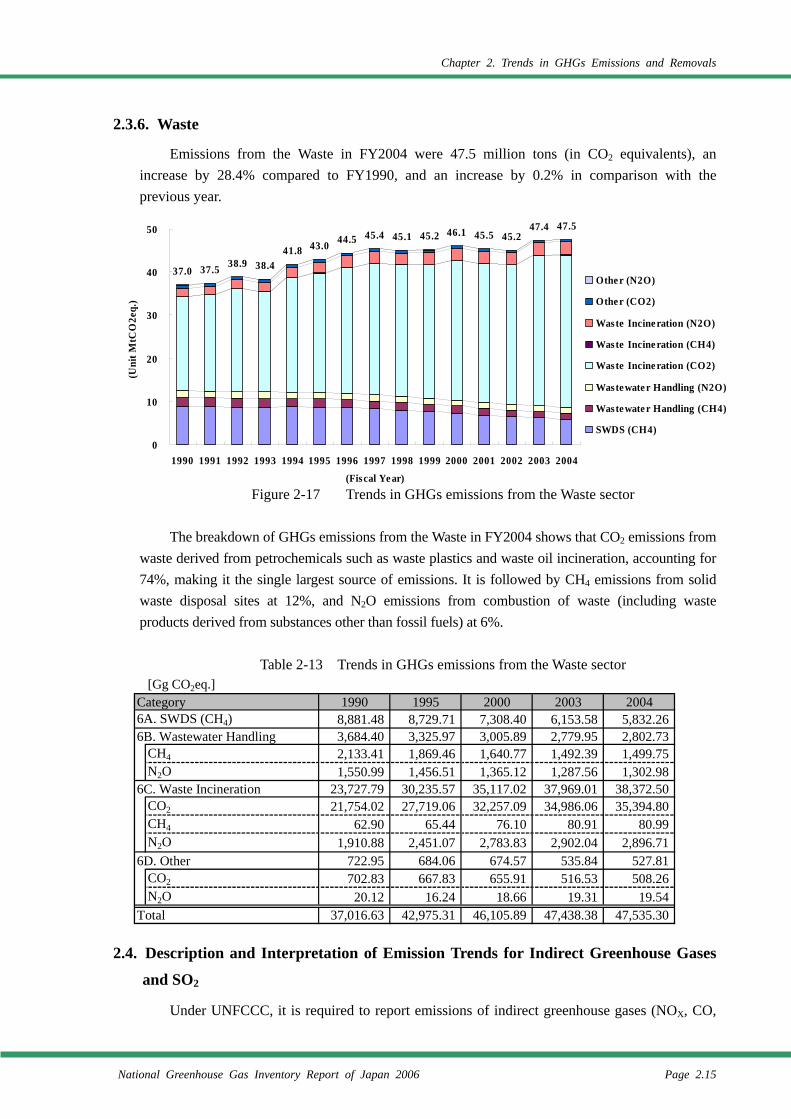
Chapter 2. Trends in GHGs Emissions and Removals
National Greenhouse Gas Inventory Report of Japan 2006 Page 2.15
2.3.6. Waste
Emissions from the Waste in FY2004 were 47.5 million tons (in CO2 equivalents), an increase by 28.4% compared to FY1990, and an increase by 0.2% in comparison with the previous year.
Figure 2-17 Trends in GHGs emissions from the Waste sector The breakdown of GHGs emissions from the Waste in FY2004 shows that CO2 emissions from
waste derived from petrochemicals such as waste plastics and waste oil incineration, accounting for 74%, making it the single largest source of emissions. It is followed by CH4 emissions from solid waste disposal sites at 12%, and N2O emissions from combustion of waste (including waste products derived from substances other than fossil fuels) at 6%.
Table 2-13 Trends in GHGs emissions from the Waste sector
2.4. Description and Interpretation of Emission Trends for Indirect Greenhouse Gases and SO2
Under UNFCCC, it is required to report emissions of indirect greenhouse gases (NOX, CO,
37.0 37.5 38.9 38.441.8 43.0 44.5 45.4 45.1 45.2 46.1 45.5 45.2
47.4 47.5
0
10
20
30
40
50
1990 1991 1992 1993 1994 1995 1996 1997 1998 1999 2000 2001 2002 2003 2004
(Fiscal Ye ar)
(Uni
t MtC
O2e
q.)
Othe r (N2O)
Othe r (CO2)
Waste Incine ration (N2O)
Waste Incine ration (CH4)
Waste Incine ration (CO2)
Wastewate r Handling (N2O)
Wastewate r Handling (CH4)
SWDS (CH4)
Total
[Gg CO2eq.]Category 1990 1995 2000 2003 20046A. SWDS (CH4) 8,881.48 8,729.71 7,308.40 6,153.58 5,832.266B. Wastewater Handling 3,684.40 3,325.97 3,005.89 2,779.95 2,802.73
CH4 2,133.41 1,869.46 1,640.77 1,492.39 1,499.75N2O 1,550.99 1,456.51 1,365.12 1,287.56 1,302.98
6C. Waste Incineration 23,727.79 30,235.57 35,117.02 37,969.01 38,372.50CO2 21,754.02 27,719.06 32,257.09 34,986.06 35,394.80CH4 62.90 65.44 76.10 80.91 80.99N2O 1,910.88 2,451.07 2,783.83 2,902.04 2,896.71
6D. Other 722.95 684.06 674.57 535.84 527.81CO2 702.83 667.83 655.91 516.53 508.26N2O 20.12 16.24 18.66 19.31 19.54
Total 37,016.63 42,975.31 46,105.89 47,438.38 47,535.30
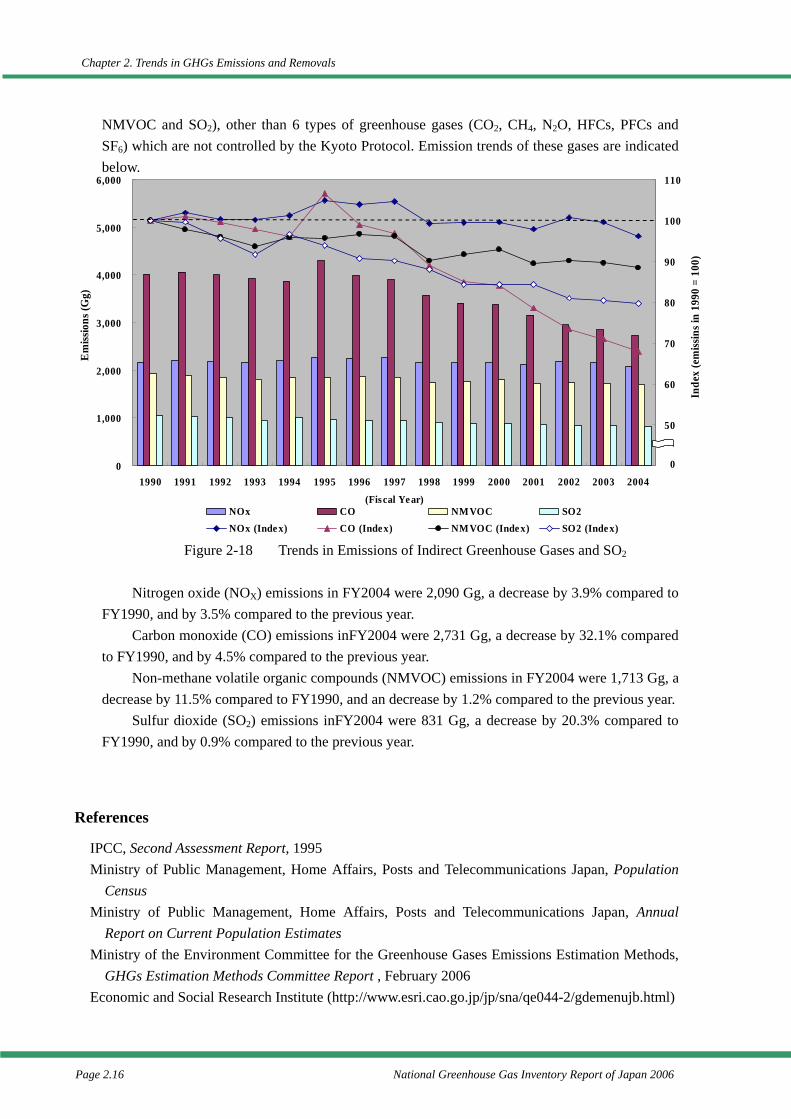
Chapter 2. Trends in GHGs Emissions and Removals
Page 2.16 National Greenhouse Gas Inventory Report of Japan 2006
NMVOC and SO2), other than 6 types of greenhouse gases (CO2, CH4, N2O, HFCs, PFCs and SF6) which are not controlled by the Kyoto Protocol. Emission trends of these gases are indicated below.
Figure 2-18 Trends in Emissions of Indirect Greenhouse Gases and SO2 Nitrogen oxide (NOX) emissions in FY2004 were 2,090 Gg, a decrease by 3.9% compared to
FY1990, and by 3.5% compared to the previous year. Carbon monoxide (CO) emissions inFY2004 were 2,731 Gg, a decrease by 32.1% compared
to FY1990, and by 4.5% compared to the previous year. Non-methane volatile organic compounds (NMVOC) emissions in FY2004 were 1,713 Gg, a
decrease by 11.5% compared to FY1990, and an decrease by 1.2% compared to the previous year. Sulfur dioxide (SO2) emissions inFY2004 were 831 Gg, a decrease by 20.3% compared to
FY1990, and by 0.9% compared to the previous year.
References
IPCC, Second Assessment Report, 1995 Ministry of Public Management, Home Affairs, Posts and Telecommunications Japan, Population
Census Ministry of Public Management, Home Affairs, Posts and Telecommunications Japan, Annual
Report on Current Population Estimates Ministry of the Environment Committee for the Greenhouse Gases Emissions Estimation Methods,
GHGs Estimation Methods Committee Report , February 2006 Economic and Social Research Institute (http://www.esri.cao.go.jp/jp/sna/qe044-2/gdemenujb.html)
0
1,000
2,000
3,000
4,000
5,000
6,000
1990 1991 1992 1993 1994 1995 1996 1997 1998 1999 2000 2001 2002 2003 2004(Fiscal Year)
Em
issio
ns (G
g)
40
50
60
70
80
90
100
110
Inde
x (e
miss
ins i
n 19
90 =
100
)
NOx CO NMVOC SO2NOx (Inde x) CO (Index) NMVOC (Inde x) SO2 (Inde x)
0
Chapter 3. Energy (CRF sector 1)
National Greenhouse Gas Inventory Report of Japan 2006 Page 3.1
Chapter 3. Energy (CRF sector 1)
3.1. Fuel Combustion (1.A.)
3.1.1. Fuel Combustion (CO2)
• Background When fossil fuels such as coal, oil products and natural gas are combusted, carbon
contained in these types of fuels is oxidized and emitted into the atmosphere.
• Methodology for Estimating Emissions of GHGs Tier 1 Sectoral Approach has been used in accordance with the decision tree of the Good
Practice Guidance (2000) (Page 2.10, Fig. 2.1) to calculate emissions. Country-specific emission factors are used for all types of fuel.
E : CO2 emissions from fossil fuel combustion [ tCO2 ] A : Energy consumption [ t, kl, m3 ] N : Non-energy product use of fossil fuels [ t, kl, m3 ]
GCV : Gross calorific value [ MJ/kg, MJ/l, MJ/m3 ] EF : Carbon content of the fuel [ tC/TJ ] OF : Oxidation factor
i : Type of energy j : Sector
• Emission Factors -Carbon emission factors
, The carbon content of fuels expressed as the unit of calorific value (Gross Calorific Value) was used for carbon emission factors. Most of them are country-specific values.
Emission factors were developed based on three different concepts; (a) Energy sources other than Blast Furnace Gas (BFG) and Town gas, (b) BFG, and (c) Town gas.
(a) Energy sources other than Blast Furnace Gas (BFG) and Town gas: Emission factors are based on the carbon content of each fuel type.
(b) BFG: During iron and steel production process, in the blast furnace and L.D. converter, the amount of energy and carbon contained in coke and PCI coal which are injected to the processes and these contained in BFG and LDG which are calculated should be theoretically balanced. Since the composition of BFG is unstable, emission factors for BFG was established with annually calculated value in order to keep carbon balance in blast furnace and L.D. converter during the iron and steel production process.
(c) Town gas: Town gas is produced from the mixture of raw materials and air dilution. In order to calculate town gas emission factors, total carbon contained in fossil fuel used as raw materials was divided by the total calorific value of produced town gas.
( )[ ] 12/44***10** 3∑ −−=ij iiiijij OFEFGCVNAE
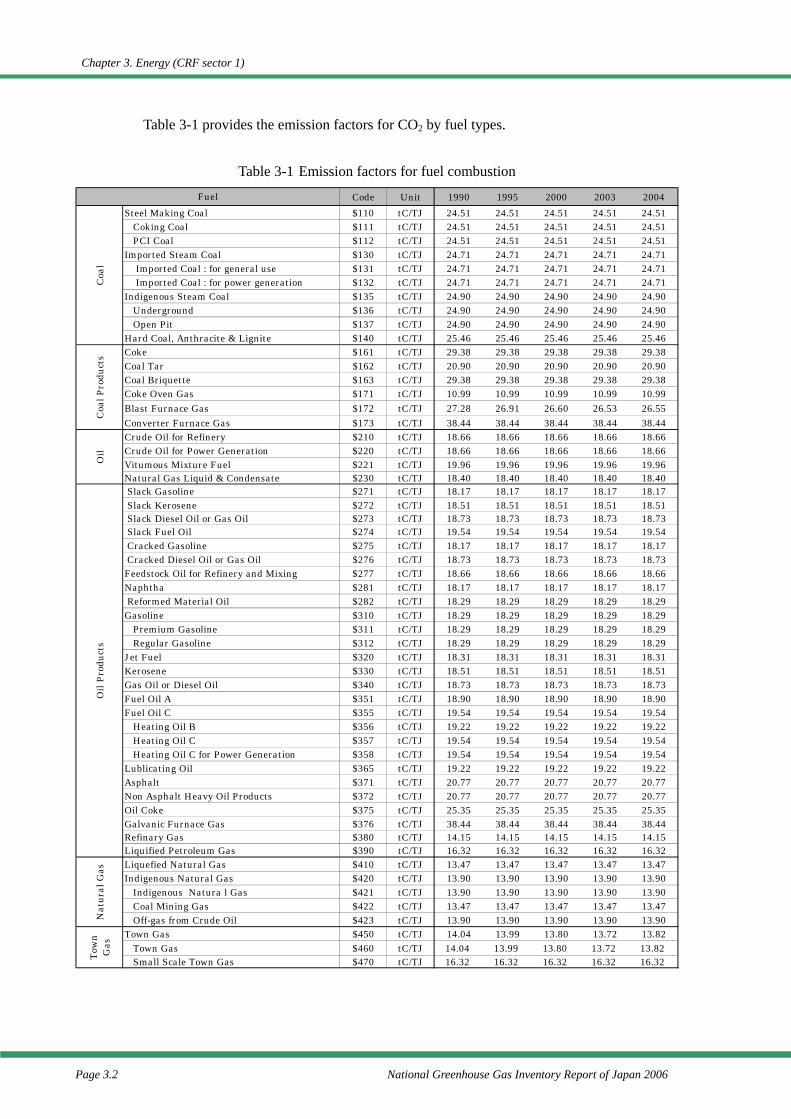
Chapter 3. Energy (CRF sector 1)
Page 3.2 National Greenhouse Gas Inventory Report of Japan 2006
Table 3-1 provides the emission factors for CO2 by fuel types.
Table 3-1 Emission factors for fuel combustion
Code Unit 1990 1995 2000 2003 2004Steel Making Coal $110 tC/TJ 24.51 24.51 24.51 24.51 24.51
Coking Coal $111 tC/TJ 24.51 24.51 24.51 24.51 24.51PCI Coal $112 tC/TJ 24.51 24.51 24.51 24.51 24.51
Imported Steam Coal $130 tC/TJ 24.71 24.71 24.71 24.71 24.71 Imported Coal : for general use $131 tC/TJ 24.71 24.71 24.71 24.71 24.71 Imported Coal : for power generation $132 tC/TJ 24.71 24.71 24.71 24.71 24.71
Indigenous Steam Coal $135 tC/TJ 24.90 24.90 24.90 24.90 24.90Underground $136 tC/TJ 24.90 24.90 24.90 24.90 24.90Open Pit $137 tC/TJ 24.90 24.90 24.90 24.90 24.90
Hard Coal, Anthracite & Lignite $140 tC/TJ 25.46 25.46 25.46 25.46 25.46Coke $161 tC/TJ 29.38 29.38 29.38 29.38 29.38Coal Tar $162 tC/TJ 20.90 20.90 20.90 20.90 20.90Coal Briquette $163 tC/TJ 29.38 29.38 29.38 29.38 29.38Coke Oven Gas $171 tC/TJ 10.99 10.99 10.99 10.99 10.99Blast Furnace Gas $172 tC/TJ 27.28 26.91 26.60 26.53 26.55Converter Furnace Gas $173 tC/TJ 38.44 38.44 38.44 38.44 38.44Crude Oil for Refinery $210 tC/TJ 18.66 18.66 18.66 18.66 18.66Crude Oil for Power Generation $220 tC/TJ 18.66 18.66 18.66 18.66 18.66Vitumous Mixture Fuel $221 tC/TJ 19.96 19.96 19.96 19.96 19.96Natural Gas Liquid & Condensate $230 tC/TJ 18.40 18.40 18.40 18.40 18.40 Slack Gasoline $271 tC/TJ 18.17 18.17 18.17 18.17 18.17 Slack Kerosene $272 tC/TJ 18.51 18.51 18.51 18.51 18.51 Slack Diesel Oil or Gas Oil $273 tC/TJ 18.73 18.73 18.73 18.73 18.73 Slack Fuel Oil $274 tC/TJ 19.54 19.54 19.54 19.54 19.54 Cracked Gasoline $275 tC/TJ 18.17 18.17 18.17 18.17 18.17 Cracked Diesel Oil or Gas Oil $276 tC/TJ 18.73 18.73 18.73 18.73 18.73Feedstock Oil for Refinery and Mixing $277 tC/TJ 18.66 18.66 18.66 18.66 18.66Naphtha $281 tC/TJ 18.17 18.17 18.17 18.17 18.17 Reformed Material Oil $282 tC/TJ 18.29 18.29 18.29 18.29 18.29Gasoline $310 tC/TJ 18.29 18.29 18.29 18.29 18.29
Premium Gasoline $311 tC/TJ 18.29 18.29 18.29 18.29 18.29Regular Gasoline $312 tC/TJ 18.29 18.29 18.29 18.29 18.29
Jet Fuel $320 tC/TJ 18.31 18.31 18.31 18.31 18.31Kerosene $330 tC/TJ 18.51 18.51 18.51 18.51 18.51Gas Oil or Diesel Oil $340 tC/TJ 18.73 18.73 18.73 18.73 18.73Fuel Oil A $351 tC/TJ 18.90 18.90 18.90 18.90 18.90Fuel Oil C $355 tC/TJ 19.54 19.54 19.54 19.54 19.54
Heating Oil B $356 tC/TJ 19.22 19.22 19.22 19.22 19.22Heating Oil C $357 tC/TJ 19.54 19.54 19.54 19.54 19.54Heating Oil C for Power Generation $358 tC/TJ 19.54 19.54 19.54 19.54 19.54
Lublicating Oil $365 tC/TJ 19.22 19.22 19.22 19.22 19.22Asphalt $371 tC/TJ 20.77 20.77 20.77 20.77 20.77Non Asphalt Heavy Oil Products $372 tC/TJ 20.77 20.77 20.77 20.77 20.77Oil Coke $375 tC/TJ 25.35 25.35 25.35 25.35 25.35Galvanic Furnace Gas $376 tC/TJ 38.44 38.44 38.44 38.44 38.44Refinary Gas $380 tC/TJ 14.15 14.15 14.15 14.15 14.15Liquified Petroleum Gas $390 tC/TJ 16.32 16.32 16.32 16.32 16.32Liquefied Natural Gas $410 tC/TJ 13.47 13.47 13.47 13.47 13.47Indigenous Natural Gas $420 tC/TJ 13.90 13.90 13.90 13.90 13.90
Indigenous Natura l Gas $421 tC/TJ 13.90 13.90 13.90 13.90 13.90Coal Mining Gas $422 tC/TJ 13.47 13.47 13.47 13.47 13.47Off-gas from Crude Oil $423 tC/TJ 13.90 13.90 13.90 13.90 13.90
Town Gas $450 tC/TJ 14.04 13.99 13.80 13.72 13.82Town Gas $460 tC/TJ 14.04 13.99 13.80 13.72 13.82Small Scale Town Gas $470 tC/TJ 16.32 16.32 16.32 16.32 16.32
Oil
Prod
ucts
Nat
ural
Gas
Tow
nG
as
Fuel
Coa
lC
oal P
rodu
cts
Oil
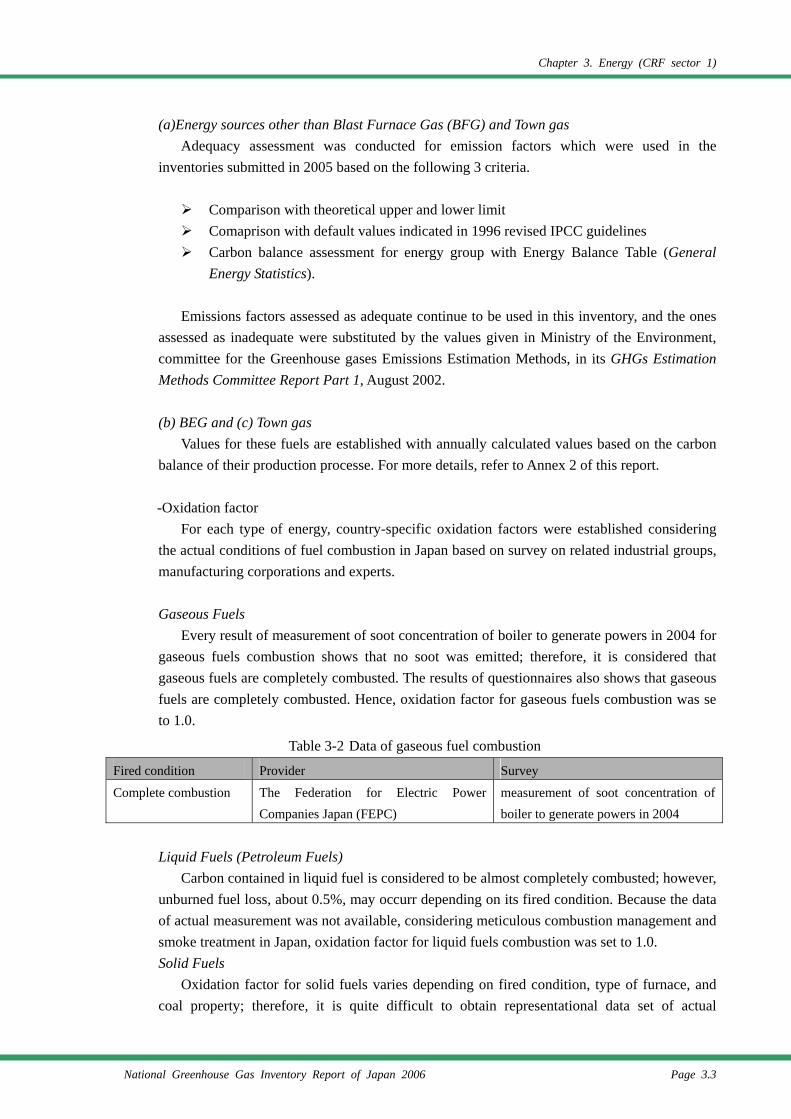
Chapter 3. Energy (CRF sector 1)
National Greenhouse Gas Inventory Report of Japan 2006 Page 3.3
(a)Energy sources other than Blast Furnace Gas (BFG) and Town gas Adequacy assessment was conducted for emission factors which were used in the
inventories submitted in 2005 based on the following 3 criteria.
Comparison with theoretical upper and lower limit Comaprison with default values indicated in 1996 revised IPCC guidelines Carbon balance assessment for energy group with Energy Balance Table (General
Energy Statistics). Emissions factors assessed as adequate continue to be used in this inventory, and the ones
assessed as inadequate were substituted by the values given in Ministry of the Environment, committee for the Greenhouse gases Emissions Estimation Methods, in its GHGs Estimation Methods Committee Report Part 1, August 2002.
(b) BEG and (c) Town gas
Values for these fuels are established with annually calculated values based on the carbon balance of their production processe. For more details, refer to Annex 2 of this report.
-Oxidation factor
For each type of energy, country-specific oxidation factors were established considering the actual conditions of fuel combustion in Japan based on survey on related industrial groups, manufacturing corporations and experts.
Gaseous Fuels
Every result of measurement of soot concentration of boiler to generate powers in 2004 for gaseous fuels combustion shows that no soot was emitted; therefore, it is considered that gaseous fuels are completely combusted. The results of questionnaires also shows that gaseous fuels are completely combusted. Hence, oxidation factor for gaseous fuels combustion was se to 1.0.
Table 3-2 Data of gaseous fuel combustion
Fired condition Provider Survey
Complete combustion The Federation for Electric Power Companies Japan (FEPC)
measurement of soot concentration of boiler to generate powers in 2004
Liquid Fuels (Petroleum Fuels)
Carbon contained in liquid fuel is considered to be almost completely combusted; however, unburned fuel loss, about 0.5%, may occurr depending on its fired condition. Because the data of actual measurement was not available, considering meticulous combustion management and smoke treatment in Japan, oxidation factor for liquid fuels combustion was set to 1.0. Solid Fuels
Oxidation factor for solid fuels varies depending on fired condition, type of furnace, and coal property; therefore, it is quite difficult to obtain representational data set of actual
Chapter 3. Energy (CRF sector 1)
Page 3.4 National Greenhouse Gas Inventory Report of Japan 2006
measurement of unburned fuel loss. Meanwhile, almost all the unburned carbon generated during combustion in furnace is considered to be contained in coal ash. Coal ash is effectively utilized or landfilled. Carbon contained in coal ash which is used as raw material of cement is oxidized to carbon dioxide and emitted into the atmosphere during calcinations processes.
Average oxidation factor from 1990 to 2003 considering unburned carbon oxidized in firing process of coal ash eventually is 0.996, expressed as 3 effective digits after decimal point. 2 effective digits after the decimal point are considered to be adequate in the view of other coefficients’ accuracy; therefore, oxidation factor for solid fuels is set to 1.0 rounding off to two decimal places.
• Activity Data -Energy consumption and non-energy product use of fossil fuels
Values subtracting energy consumption reported under ‘Non-energy’ [#9500] from energy consumption reported under ‘Energy Conversion & Own use’ [#2000], ‘Industry’ [#6000], ‘Residential’ [#7100], ‘Commercial & Others’ [#7500], and ‘Transportation’ [#8000] in Japan’s Energy Balance Table (General Energy Statistics) are used for activity data. Because energy consumption reported under ‘Non-energy’ [#9500] was used for the purposes other than combustion and was considered not emitting CO2, these values were deducted.
In ‘Energy Conversion & Own use’, ‘Power Generation’ [#2100], ‘Auto Power Generation’ [#2200] , ‘Industrial Steam Generation’ [#2300] , ‘District Heat Supply’ [#2350] and ‘Own Use & Loss’ [#2900] are calculated, and other sectors ( ‘Town Gas Production’ [#2400] , ‘Coal Products’ [#2500] , ‘Oil Products’ [#2600] , ‘Other Conversions & Blending’ [#2700], ‘Other Input/Output’ [#3000] and ‘Stock Change’ [#3500]) are excluded from calculations.
Energy consumptios reported under ‘Town Gas Production’ [#2400] are feedstocks of town gas production, and was not used to purposes combustion. Therefore, they are excluded from calculations. Meanwhile, CO2 emissions from carbon contained in these feedstocks are calculated with town gas consumption in final energy consumption sector (industry, residential, commercial & others and transportation).
Energy consumptions reported under ‘Coal Products’ [#2500] and ‘Oil Products’ [#2600] are feedstocks for coal products and oil products, and was not used for the purpose of combustion. Meanwhile, CO2 emissions from carbon contained in these feedstocks are calculated with each kind of energy consumption in energy conversion sector and final energy consumption sector (industry, residential, commercial & others and transportation).
‘Other Conversions & Blending’ [#2700] sector means energy conversion other than power generation, steam generation, coal product and oil refinery, and product chategory change by minor operation. Energy consumption reported under this sector is not for the purpose of combusttion; therefore, this sector is excluded from calculations.
‘Other Input/Output’ [#3000] is sector to report the inconsistency between shipping volume and production/receiving volume. ‘Stock Change’ [#3500] means change in stocks in final energy consumption sector. Energy consumptions reported under both sectors are excluded from calculation because these carbons are not combusted.
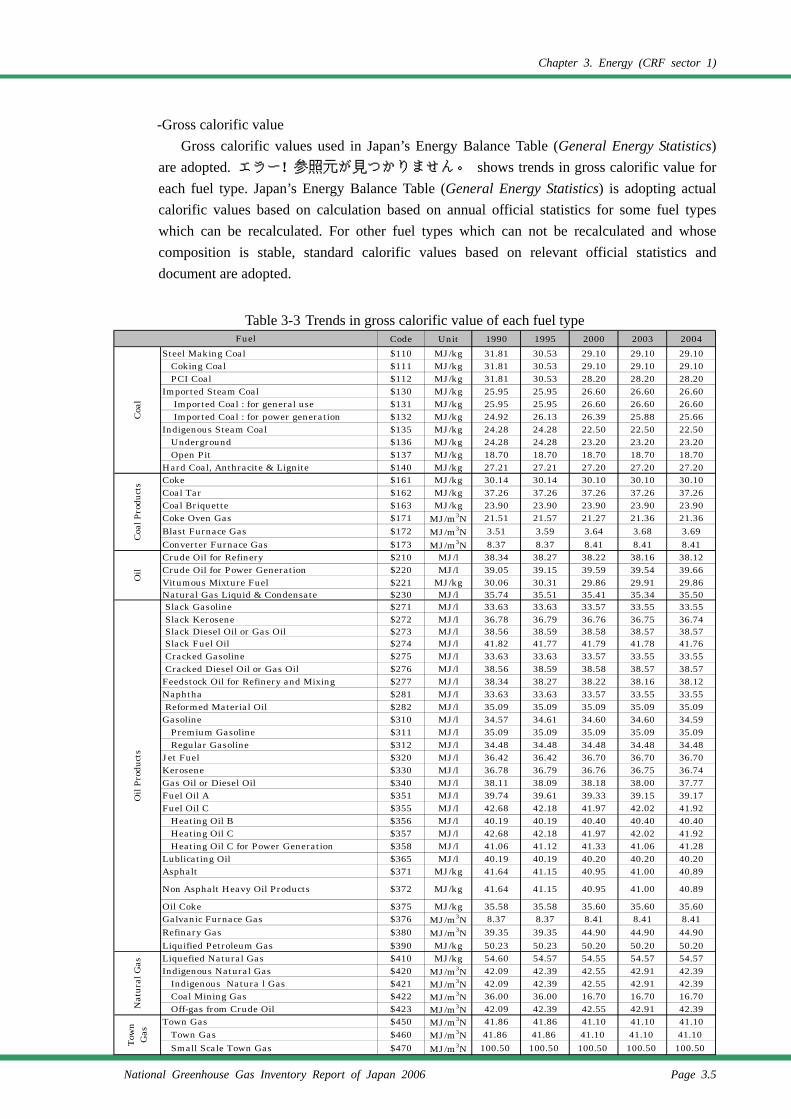
Chapter 3. Energy (CRF sector 1)
National Greenhouse Gas Inventory Report of Japan 2006 Page 3.5
-Gross calorific value Gross calorific values used in Japan’s Energy Balance Table (General Energy Statistics)
are adopted. エラー! 参照元が見つかりません。 shows trends in gross calorific value for each fuel type. Japan’s Energy Balance Table (General Energy Statistics) is adopting actual calorific values based on calculation based on annual official statistics for some fuel types which can be recalculated. For other fuel types which can not be recalculated and whose composition is stable, standard calorific values based on relevant official statistics and document are adopted.
Table 3-3 Trends in gross calorific value of each fuel type
Code Unit 1990 1995 2000 2003 2004Steel Making Coal $110 MJ/kg 31.81 30.53 29.10 29.10 29.10
Coking Coal $111 MJ/kg 31.81 30.53 29.10 29.10 29.10PCI Coal $112 MJ/kg 31.81 30.53 28.20 28.20 28.20
Imported Steam Coal $130 MJ/kg 25.95 25.95 26.60 26.60 26.60 Imported Coal : for general use $131 MJ/kg 25.95 25.95 26.60 26.60 26.60 Imported Coal : for power generation $132 MJ/kg 24.92 26.13 26.39 25.88 25.66
Indigenous Steam Coal $135 MJ/kg 24.28 24.28 22.50 22.50 22.50Underground $136 MJ/kg 24.28 24.28 23.20 23.20 23.20Open Pit $137 MJ/kg 18.70 18.70 18.70 18.70 18.70
Hard Coal, Anthracite & Lignite $140 MJ/kg 27.21 27.21 27.20 27.20 27.20Coke $161 MJ/kg 30.14 30.14 30.10 30.10 30.10Coal Tar $162 MJ/kg 37.26 37.26 37.26 37.26 37.26Coal Briquette $163 MJ/kg 23.90 23.90 23.90 23.90 23.90Coke Oven Gas $171 MJ/m3N 21.51 21.57 21.27 21.36 21.36Blast Furnace Gas $172 MJ/m3N 3.51 3.59 3.64 3.68 3.69Converter Furnace Gas $173 MJ/m3N 8.37 8.37 8.41 8.41 8.41Crude Oil for Refinery $210 MJ/l 38.34 38.27 38.22 38.16 38.12Crude Oil for Power Generation $220 MJ/l 39.05 39.15 39.59 39.54 39.66Vitumous Mixture Fuel $221 MJ/kg 30.06 30.31 29.86 29.91 29.86Natural Gas Liquid & Condensate $230 MJ/l 35.74 35.51 35.41 35.34 35.50 Slack Gasoline $271 MJ/l 33.63 33.63 33.57 33.55 33.55 Slack Kerosene $272 MJ/l 36.78 36.79 36.76 36.75 36.74 Slack Diesel Oil or Gas Oil $273 MJ/l 38.56 38.59 38.58 38.57 38.57 Slack Fuel Oil $274 MJ/l 41.82 41.77 41.79 41.78 41.76 Cracked Gasoline $275 MJ/l 33.63 33.63 33.57 33.55 33.55 Cracked Diesel Oil or Gas Oil $276 MJ/l 38.56 38.59 38.58 38.57 38.57Feedstock Oil for Refinery and Mixing $277 MJ/l 38.34 38.27 38.22 38.16 38.12Naphtha $281 MJ/l 33.63 33.63 33.57 33.55 33.55 Reformed Material Oil $282 MJ/l 35.09 35.09 35.09 35.09 35.09Gasoline $310 MJ/l 34.57 34.61 34.60 34.60 34.59
Premium Gasoline $311 MJ/l 35.09 35.09 35.09 35.09 35.09Regular Gasoline $312 MJ/l 34.48 34.48 34.48 34.48 34.48
Jet Fuel $320 MJ/l 36.42 36.42 36.70 36.70 36.70Kerosene $330 MJ/l 36.78 36.79 36.76 36.75 36.74Gas Oil or Diesel Oil $340 MJ/l 38.11 38.09 38.18 38.00 37.77Fuel Oil A $351 MJ/l 39.74 39.61 39.33 39.15 39.17Fuel Oil C $355 MJ/l 42.68 42.18 41.97 42.02 41.92
Heating Oil B $356 MJ/l 40.19 40.19 40.40 40.40 40.40Heating Oil C $357 MJ/l 42.68 42.18 41.97 42.02 41.92Heating Oil C for Power Generation $358 MJ/l 41.06 41.12 41.33 41.06 41.28
Lublicating Oil $365 MJ/l 40.19 40.19 40.20 40.20 40.20Asphalt $371 MJ/kg 41.64 41.15 40.95 41.00 40.89
Non Asphalt Heavy Oil Products $372 MJ/kg 41.64 41.15 40.95 41.00 40.89
Oil Coke $375 MJ/kg 35.58 35.58 35.60 35.60 35.60Galvanic Furnace Gas $376 MJ/m3N 8.37 8.37 8.41 8.41 8.41Refinary Gas $380 MJ/m3N 39.35 39.35 44.90 44.90 44.90Liquified Petroleum Gas $390 MJ/kg 50.23 50.23 50.20 50.20 50.20Liquefied Natural Gas $410 MJ/kg 54.60 54.57 54.55 54.57 54.57Indigenous Natural Gas $420 MJ/m3N 42.09 42.39 42.55 42.91 42.39
Indigenous Natura l Gas $421 MJ/m3N 42.09 42.39 42.55 42.91 42.39Coal Mining Gas $422 MJ/m3N 36.00 36.00 16.70 16.70 16.70Off-gas from Crude Oil $423 MJ/m3N 42.09 42.39 42.55 42.91 42.39
Town Gas $450 MJ/m3N 41.86 41.86 41.10 41.10 41.10Town Gas $460 MJ/m3N 41.86 41.86 41.10 41.10 41.10Small Scale Town Gas $470 MJ/m3N 100.50 100.50 100.50 100.50 100.50
Oil
Prod
ucts
Nat
ural
Gas
Tow
nG
as
Fuel
Coal
Coal
Pro
duct
sO
il
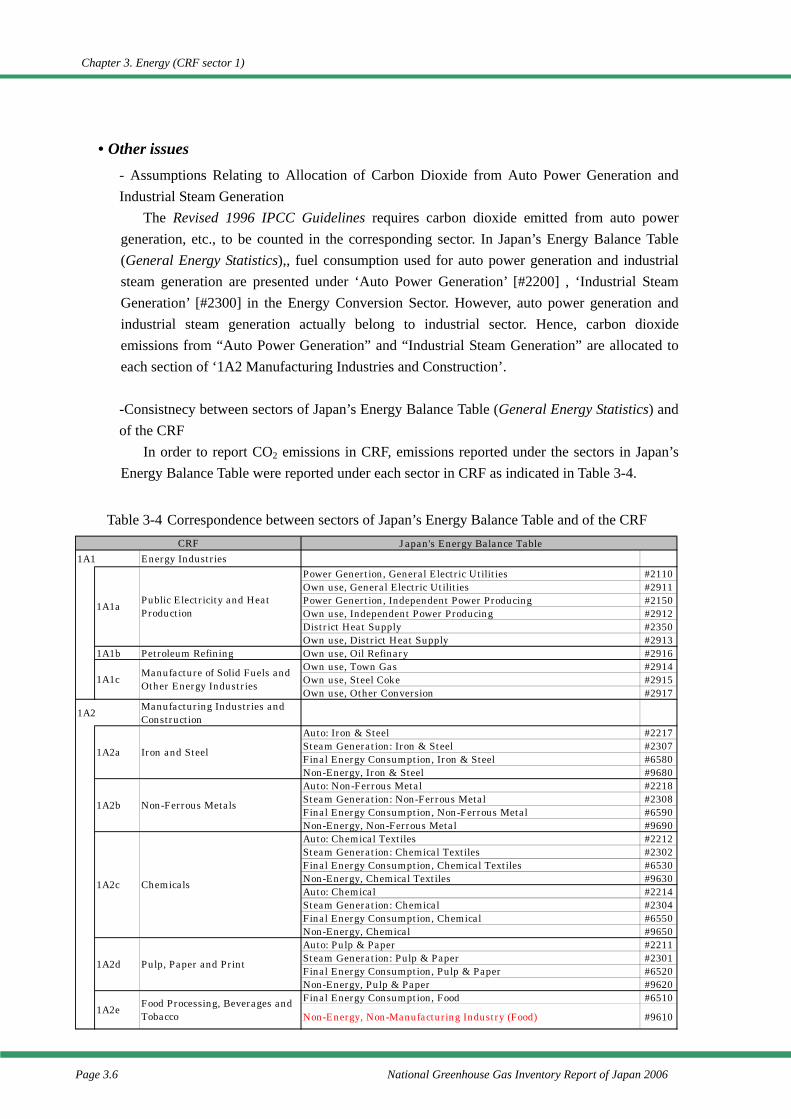
Chapter 3. Energy (CRF sector 1)
Page 3.6 National Greenhouse Gas Inventory Report of Japan 2006
• Other issues - Assumptions Relating to Allocation of Carbon Dioxide from Auto Power Generation and Industrial Steam Generation
The Revised 1996 IPCC Guidelines requires carbon dioxide emitted from auto power generation, etc., to be counted in the corresponding sector. In Japan’s Energy Balance Table (General Energy Statistics),, fuel consumption used for auto power generation and industrial steam generation are presented under ‘Auto Power Generation’ [#2200] , ‘Industrial Steam Generation’ [#2300] in the Energy Conversion Sector. However, auto power generation and industrial steam generation actually belong to industrial sector. Hence, carbon dioxide emissions from “Auto Power Generation” and “Industrial Steam Generation” are allocated to each section of ‘1A2 Manufacturing Industries and Construction’.
-Consistnecy between sectors of Japan’s Energy Balance Table (General Energy Statistics) and of the CRF
In order to report CO2 emissions in CRF, emissions reported under the sectors in Japan’s Energy Balance Table were reported under each sector in CRF as indicated in Table 3-4.
Table 3-4 Correspondence between sectors of Japan’s Energy Balance Table and of the CRF
Japan's Energy Balance Table1A1 Energy Industries
Power Genertion, General Electric Utilities #2110Own use, General Electric Utilities #2911Power Genertion, Independent Power Producing #2150Own use, Independent Power Producing #2912District Heat Supply #2350Own use, District Heat Supply #2913
1A1b Petroleum Refining Own use, Oil Refinary #2916Own use, Town Gas #2914Own use, Steel Coke #2915Own use, Other Conversion #2917
1A2 Manufacturing Industries andConstruction
Auto: Iron & Steel #2217Steam Generation: Iron & Steel #2307Final Energy Consumption, Iron & Steel #6580Non-Energy, Iron & Steel #9680Auto: Non-Ferrous Metal #2218Steam Generation: Non-Ferrous Metal #2308Final Energy Consumption, Non-Ferrous Metal #6590Non-Energy, Non-Ferrous Metal #9690Auto: Chemical Textiles #2212Steam Generation: Chemical Textiles #2302Final Energy Consumption, Chemical Textiles #6530Non-Energy, Chemical Textiles #9630Auto: Chemical #2214Steam Generation: Chemical #2304Final Energy Consumption, Chemical #6550Non-Energy, Chemical #9650Auto: Pulp & Paper #2211Steam Generation: Pulp & Paper #2301Final Energy Consumption, Pulp & Paper #6520Non-Energy, Pulp & Paper #9620Final Energy Consumption, Food #6510
Non-Energy, Non-Manufacturing Industry (Food) #9610
1A2c Chemicals
1A1c
Pulp, Paper and Print1A2d
CRF
1A1a Public Electricity and HeatProduction
1A2e Food Processing, Beverages andTobacco
1A2b Non-Ferrous Metals
Manufacture of Solid Fuels andOther Energy Industries
1A2a Iron and Steel
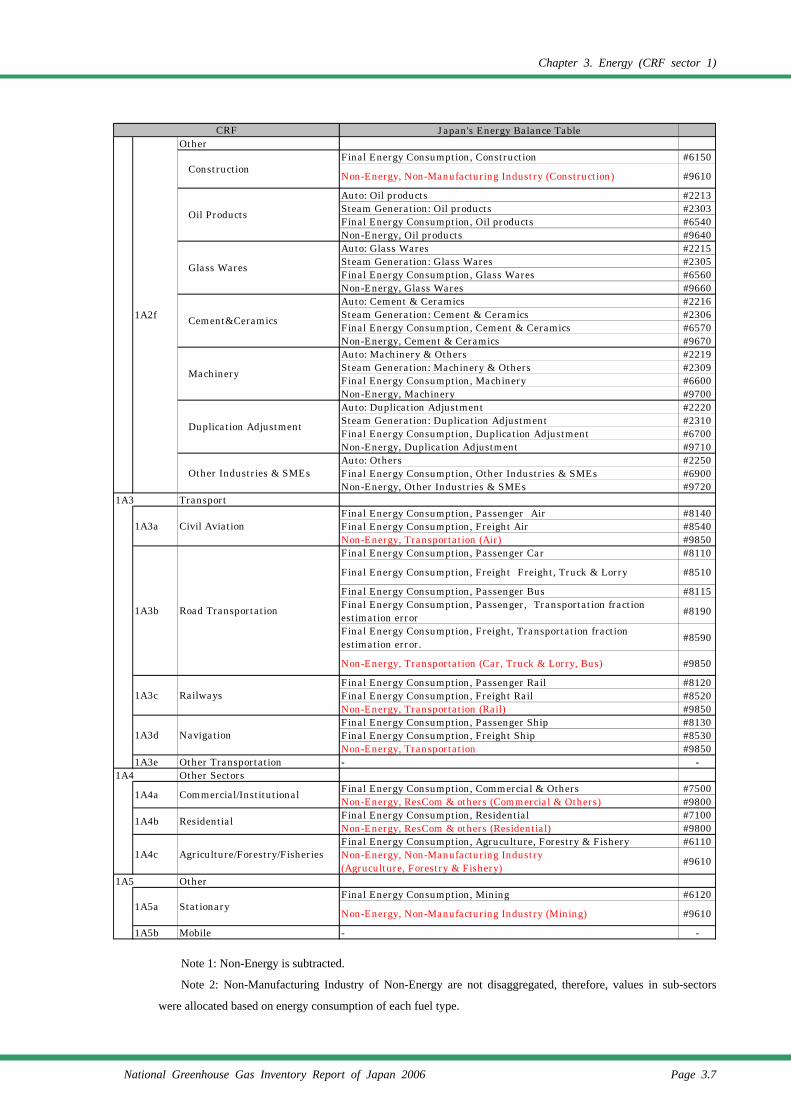
Chapter 3. Energy (CRF sector 1)
National Greenhouse Gas Inventory Report of Japan 2006 Page 3.7
Japan's Energy Balance TableOther
Final Energy Consumption, Construction #6150
Non-Energy, Non-Manufacturing Industry (Construction) #9610
Auto: Oil products #2213Steam Generation: Oil products #2303Final Energy Consumption, Oil products #6540Non-Energy, Oil products #9640Auto: Glass Wares #2215Steam Generation: Glass Wares #2305Final Energy Consumption, Glass Wares #6560Non-Energy, Glass Wares #9660Auto: Cement & Ceramics #2216Steam Generation: Cement & Ceramics #2306Final Energy Consumption, Cement & Ceramics #6570Non-Energy, Cement & Ceramics #9670Auto: Machinery & Others #2219Steam Generation: Machinery & Others #2309Final Energy Consumption, Machinery #6600Non-Energy, Machinery #9700Auto: Duplication Adjustment #2220Steam Generation: Duplication Adjustment #2310Final Energy Consumption, Duplication Adjustment #6700Non-Energy, Duplication Adjustment #9710Auto: Others #2250Final Energy Consumption, Other Industries & SMEs #6900Non-Energy, Other Industries & SMEs #9720
1A3 TransportFinal Energy Consumption, Passenger Air #8140Final Energy Consumption, Freight Air #8540Non-Energy, Transportation (Air) #9850Final Energy Consumption, Passenger Car #8110
Final Energy Consumption, Freight Freight, Truck & Lorry #8510
Final Energy Consumption, Passenger Bus #8115Final Energy Consumption, Passenger, Transportation fractionestimation error #8190
Final Energy Consumption, Freight, Transportation fractionestimation error. #8590
Non-Energy, Transportation (Car, Truck & Lorry, Bus) #9850
Final Energy Consumption, Passenger Rail #8120Final Energy Consumption, Freight Rail #8520Non-Energy, Transportation (Rail) #9850Final Energy Consumption, Passenger Ship #8130Final Energy Consumption, Freight Ship #8530Non-Energy, Transportation #9850
1A3e Other Transportation - -1A4 Other Sectors
Final Energy Consumption, Commercial & Others #7500Non-Energy, ResCom & others (Commercial & Others) #9800Final Energy Consumption, Residential #7100Non-Energy, ResCom & others (Residential) #9800Final Energy Consumption, Agruculture, Forestry & Fishery #6110Non-Energy, Non-Manufacturing Industry(Agruculture, Forestry & Fishery) #9610
1A5 OtherFinal Energy Consumption, Mining #6120
Non-Energy, Non-Manufacturing Industry (Mining) #9610
1A5b Mobile - -
Glass Wares
CRF
Cement&Ceramics
Machinery
Duplication Adjustment
1A2f
Other Industries & SMEs
Construction
Oil Products
1A4c Agriculture/Forestry/Fisheries
1A3d Navigation
1A4a Commercial/Institutional
1A5a Stationary
1A3a Civil Aviation
1A3b Road Transportation
1A3c
1A4b Residential
Railways
Note 1: Non-Energy is subtracted.
Note 2: Non-Manufacturing Industry of Non-Energy are not disaggregated, therefore, values in sub-sectors
were allocated based on energy consumption of each fuel type.
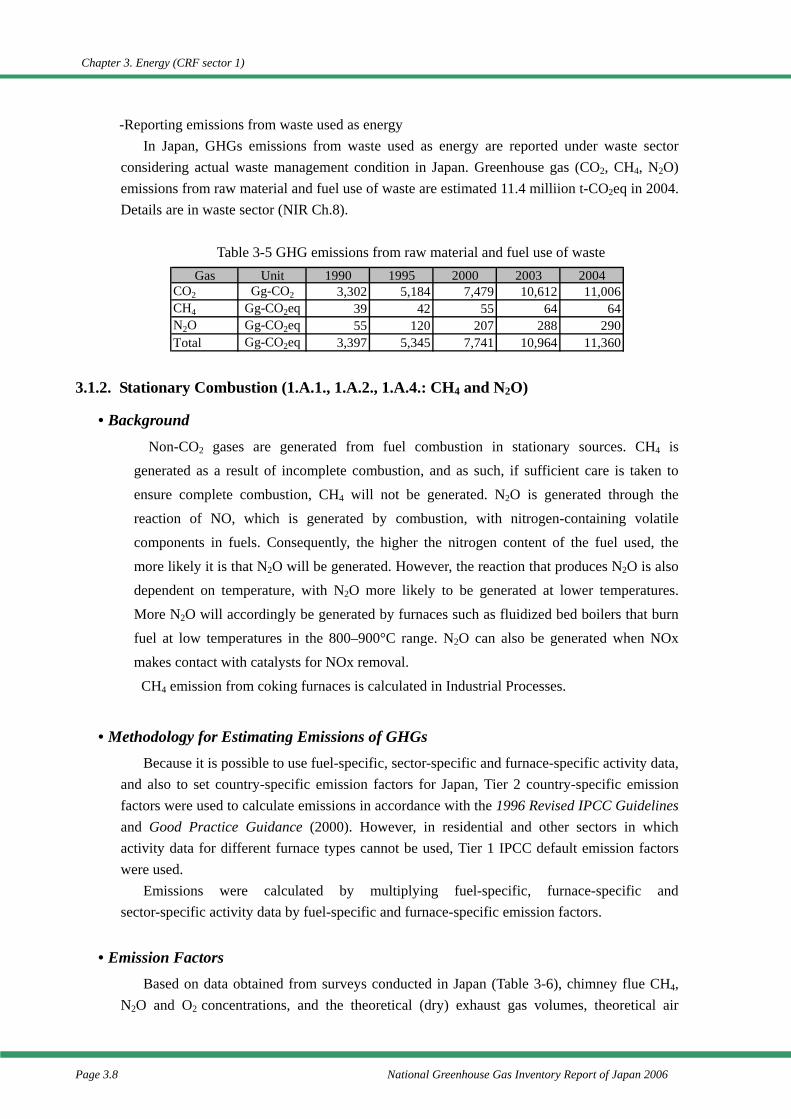
Chapter 3. Energy (CRF sector 1)
Page 3.8 National Greenhouse Gas Inventory Report of Japan 2006
-Reporting emissions from waste used as energy In Japan, GHGs emissions from waste used as energy are reported under waste sector
considering actual waste management condition in Japan. Greenhouse gas (CO2, CH4, N2O) emissions from raw material and fuel use of waste are estimated 11.4 milliion t-CO2eq in 2004. Details are in waste sector (NIR Ch.8).
Table 3-5 GHG emissions from raw material and fuel use of waste
3.1.2. Stationary Combustion (1.A.1., 1.A.2., 1.A.4.: CH4 and N2O)
• Background Non-CO2 gases are generated from fuel combustion in stationary sources. CH4 is
generated as a result of incomplete combustion, and as such, if sufficient care is taken to ensure complete combustion, CH4 will not be generated. N2O is generated through the reaction of NO, which is generated by combustion, with nitrogen-containing volatile components in fuels. Consequently, the higher the nitrogen content of the fuel used, the more likely it is that N2O will be generated. However, the reaction that produces N2O is also dependent on temperature, with N2O more likely to be generated at lower temperatures. More N2O will accordingly be generated by furnaces such as fluidized bed boilers that burn fuel at low temperatures in the 800–900°C range. N2O can also be generated when NOx makes contact with catalysts for NOx removal.
CH4 emission from coking furnaces is calculated in Industrial Processes.
• Methodology for Estimating Emissions of GHGs Because it is possible to use fuel-specific, sector-specific and furnace-specific activity data,
and also to set country-specific emission factors for Japan, Tier 2 country-specific emission factors were used to calculate emissions in accordance with the 1996 Revised IPCC Guidelines and Good Practice Guidance (2000). However, in residential and other sectors in which activity data for different furnace types cannot be used, Tier 1 IPCC default emission factors were used.
Emissions were calculated by multiplying fuel-specific, furnace-specific and sector-specific activity data by fuel-specific and furnace-specific emission factors.
• Emission Factors Based on data obtained from surveys conducted in Japan (Table 3-6), chimney flue CH4,
N2O and O2 concentrations, and the theoretical (dry) exhaust gas volumes, theoretical air
Gas Unit 1990 1995 2000 2003 2004CO2 Gg-CO2 3,302 5,184 7,479 10,612 11,006CH4 Gg-CO2eq 39 42 55 64 64N2O Gg-CO2eq 55 120 207 288 290Total Gg-CO2eq 3,397 5,345 7,741 10,964 11,360
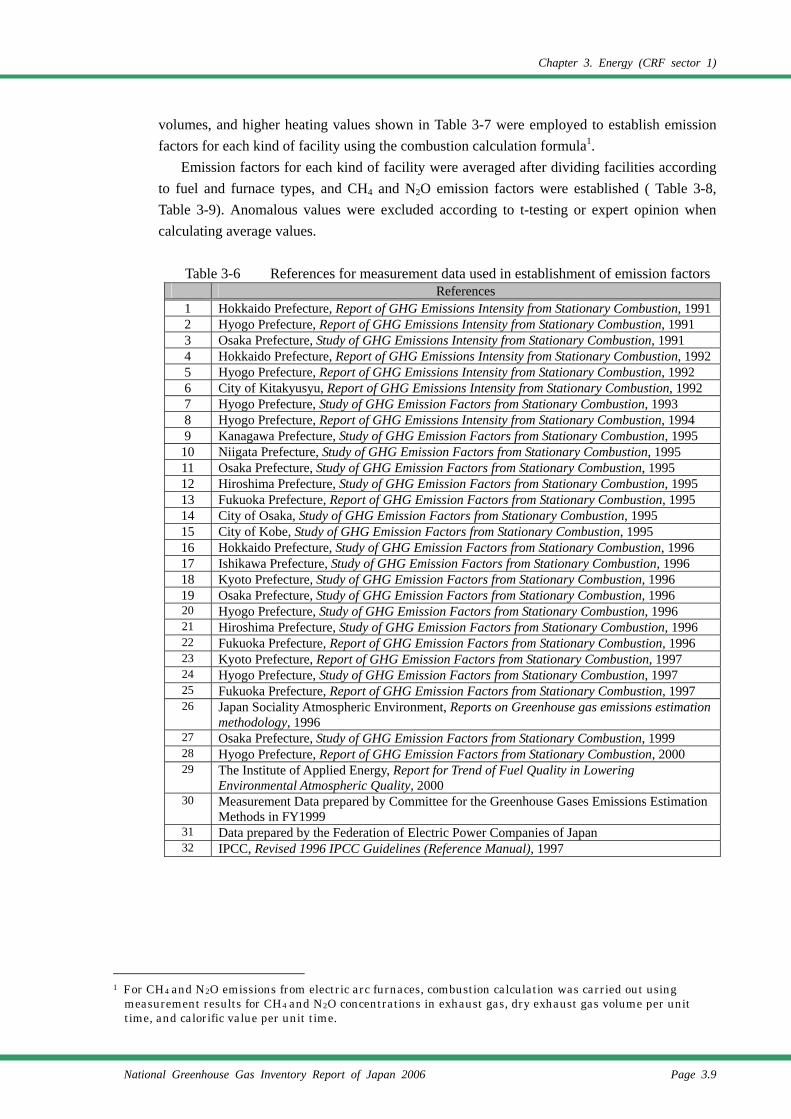
Chapter 3. Energy (CRF sector 1)
National Greenhouse Gas Inventory Report of Japan 2006 Page 3.9
volumes, and higher heating values shown in Table 3-7 were employed to establish emission factors for each kind of facility using the combustion calculation formula1.
Emission factors for each kind of facility were averaged after dividing facilities according to fuel and furnace types, and CH4 and N2O emission factors were established ( Table 3-8, Table 3-9). Anomalous values were excluded according to t-testing or expert opinion when calculating average values.
Table 3-6 References for measurement data used in establishment of emission factors References
1 Hokkaido Prefecture, Report of GHG Emissions Intensity from Stationary Combustion, 19912 Hyogo Prefecture, Report of GHG Emissions Intensity from Stationary Combustion, 1991 3 Osaka Prefecture, Study of GHG Emissions Intensity from Stationary Combustion, 1991 4 Hokkaido Prefecture, Report of GHG Emissions Intensity from Stationary Combustion, 19925 Hyogo Prefecture, Report of GHG Emissions Intensity from Stationary Combustion, 1992 6 City of Kitakyusyu, Report of GHG Emissions Intensity from Stationary Combustion, 1992 7 Hyogo Prefecture, Study of GHG Emission Factors from Stationary Combustion, 1993 8 Hyogo Prefecture, Report of GHG Emissions Intensity from Stationary Combustion, 1994 9 Kanagawa Prefecture, Study of GHG Emission Factors from Stationary Combustion, 1995
10 Niigata Prefecture, Study of GHG Emission Factors from Stationary Combustion, 1995 11 Osaka Prefecture, Study of GHG Emission Factors from Stationary Combustion, 1995 12 Hiroshima Prefecture, Study of GHG Emission Factors from Stationary Combustion, 1995 13 Fukuoka Prefecture, Report of GHG Emission Factors from Stationary Combustion, 1995 14 City of Osaka, Study of GHG Emission Factors from Stationary Combustion, 1995 15 City of Kobe, Study of GHG Emission Factors from Stationary Combustion, 1995 16 Hokkaido Prefecture, Study of GHG Emission Factors from Stationary Combustion, 1996 17 Ishikawa Prefecture, Study of GHG Emission Factors from Stationary Combustion, 1996 18 Kyoto Prefecture, Study of GHG Emission Factors from Stationary Combustion, 1996 19 Osaka Prefecture, Study of GHG Emission Factors from Stationary Combustion, 1996 20 Hyogo Prefecture, Study of GHG Emission Factors from Stationary Combustion, 1996 21 Hiroshima Prefecture, Study of GHG Emission Factors from Stationary Combustion, 1996 22 Fukuoka Prefecture, Report of GHG Emission Factors from Stationary Combustion, 1996 23 Kyoto Prefecture, Report of GHG Emission Factors from Stationary Combustion, 1997 24 Hyogo Prefecture, Study of GHG Emission Factors from Stationary Combustion, 1997 25 Fukuoka Prefecture, Report of GHG Emission Factors from Stationary Combustion, 1997 26 Japan Sociality Atmospheric Environment, Reports on Greenhouse gas emissions estimation
methodology, 1996 27 Osaka Prefecture, Study of GHG Emission Factors from Stationary Combustion, 1999 28 Hyogo Prefecture, Report of GHG Emission Factors from Stationary Combustion, 2000 29 The Institute of Applied Energy, Report for Trend of Fuel Quality in Lowering
Environmental Atmospheric Quality, 2000 30 Measurement Data prepared by Committee for the Greenhouse Gases Emissions Estimation
Methods in FY1999 31 Data prepared by the Federation of Electric Power Companies of Japan 32 IPCC, Revised 1996 IPCC Guidelines (Reference Manual), 1997
1 For CH4 and N2O emissions from electric arc furnaces, combustion calculation was carried out using
measurement results for CH4 and N2O concentrations in exhaust gas, dry exhaust gas volume per unit time, and calorific value per unit time.
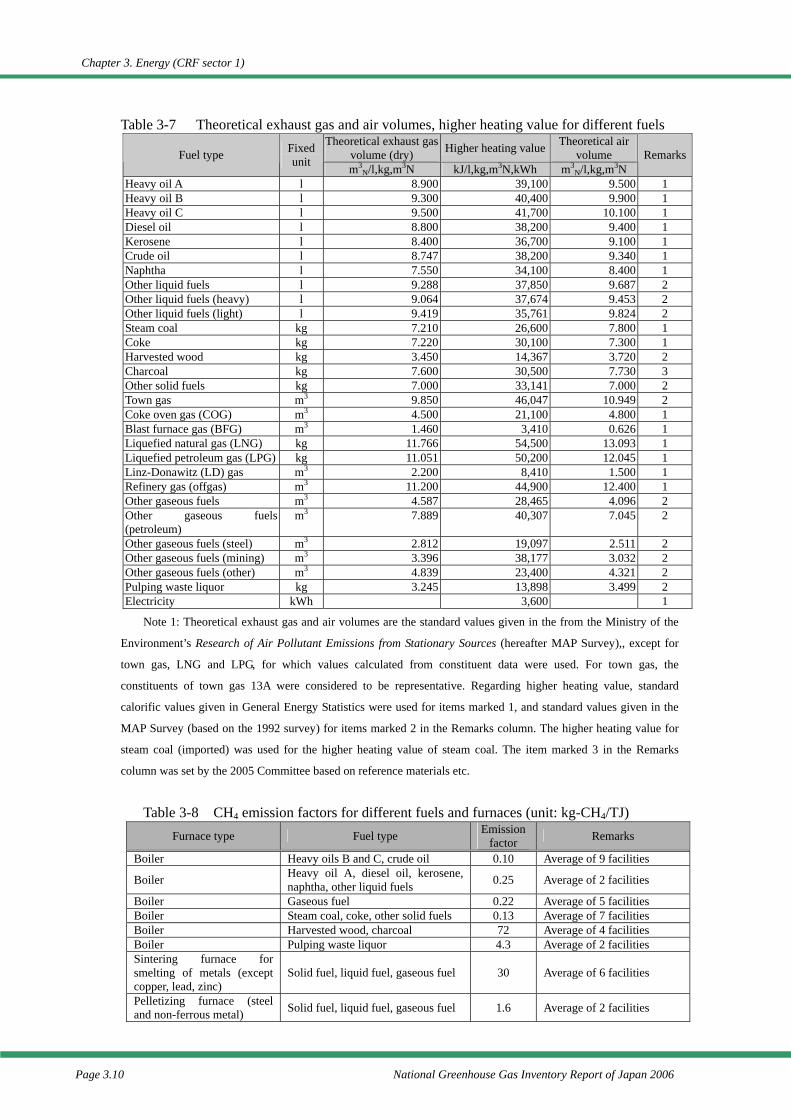
Chapter 3. Energy (CRF sector 1)
Page 3.10 National Greenhouse Gas Inventory Report of Japan 2006
Table 3-7 Theoretical exhaust gas and air volumes, higher heating value for different fuels Theoretical exhaust gas
volume (dry) Higher heating value Theoretical air volume Fuel type Fixed
unit m3N/l,kg,m3N kJ/l,kg,m3N,kWh m3
N/l,kg,m3N Remarks
Heavy oil A l 8.900 39,100 9.500 1 Heavy oil B l 9.300 40,400 9.900 1 Heavy oil C l 9.500 41,700 10.100 1 Diesel oil l 8.800 38,200 9.400 1 Kerosene l 8.400 36,700 9.100 1 Crude oil l 8.747 38,200 9.340 1 Naphtha l 7.550 34,100 8.400 1 Other liquid fuels l 9.288 37,850 9.687 2 Other liquid fuels (heavy) l 9.064 37,674 9.453 2 Other liquid fuels (light) l 9.419 35,761 9.824 2 Steam coal kg 7.210 26,600 7.800 1 Coke kg 7.220 30,100 7.300 1 Harvested wood kg 3.450 14,367 3.720 2 Charcoal kg 7.600 30,500 7.730 3 Other solid fuels kg 7.000 33,141 7.000 2 Town gas m3 9.850 46,047 10.949 2 Coke oven gas (COG) m3 4.500 21,100 4.800 1 Blast furnace gas (BFG) m3 1.460 3,410 0.626 1 Liquefied natural gas (LNG) kg 11.766 54,500 13.093 1 Liquefied petroleum gas (LPG) kg 11.051 50,200 12.045 1 Linz-Donawitz (LD) gas m3 2.200 8,410 1.500 1 Refinery gas (offgas) m3 11.200 44,900 12.400 1 Other gaseous fuels m3 4.587 28,465 4.096 2 Other gaseous fuels (petroleum)
m3 7.889 40,307 7.045 2
Other gaseous fuels (steel) m3 2.812 19,097 2.511 2 Other gaseous fuels (mining) m3 3.396 38,177 3.032 2 Other gaseous fuels (other) m3 4.839 23,400 4.321 2 Pulping waste liquor kg 3.245 13,898 3.499 2 Electricity kWh 3,600 1
Note 1: Theoretical exhaust gas and air volumes are the standard values given in the from the Ministry of the
Environment’s Research of Air Pollutant Emissions from Stationary Sources (hereafter MAP Survey),, except for
town gas, LNG and LPG, for which values calculated from constituent data were used. For town gas, the
constituents of town gas 13A were considered to be representative. Regarding higher heating value, standard
calorific values given in General Energy Statistics were used for items marked 1, and standard values given in the
MAP Survey (based on the 1992 survey) for items marked 2 in the Remarks column. The higher heating value for
steam coal (imported) was used for the higher heating value of steam coal. The item marked 3 in the Remarks
column was set by the 2005 Committee based on reference materials etc.
Table 3-8 CH4 emission factors for different fuels and furnaces (unit: kg-CH4/TJ)
Furnace type Fuel type Emission factor Remarks
Boiler Heavy oils B and C, crude oil 0.10 Average of 9 facilities
Boiler Heavy oil A, diesel oil, kerosene, naphtha, other liquid fuels 0.25 Average of 2 facilities
Boiler Gaseous fuel 0.22 Average of 5 facilities Boiler Steam coal, coke, other solid fuels 0.13 Average of 7 facilities Boiler Harvested wood, charcoal 72 Average of 4 facilities Boiler Pulping waste liquor 4.3 Average of 2 facilities Sintering furnace for smelting of metals (except copper, lead, zinc)
Solid fuel, liquid fuel, gaseous fuel 30 Average of 6 facilities
Pelletizing furnace (steel and non-ferrous metal) Solid fuel, liquid fuel, gaseous fuel 1.6 Average of 2 facilities
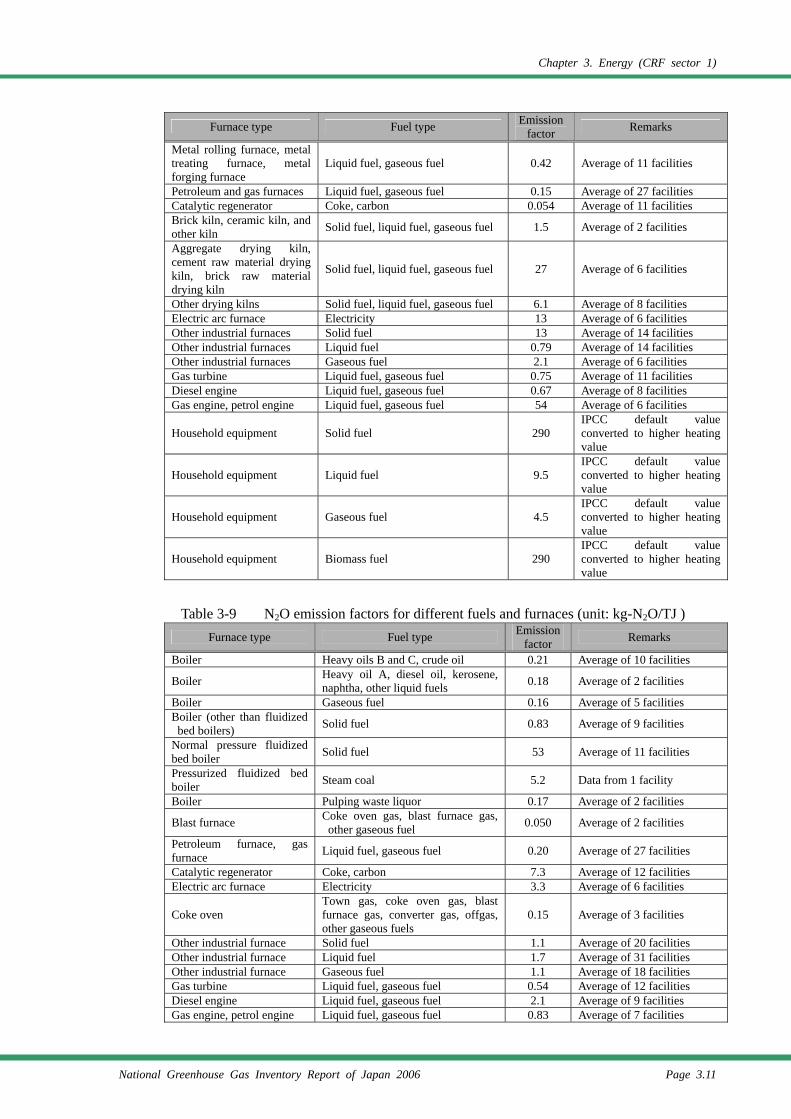
Chapter 3. Energy (CRF sector 1)
National Greenhouse Gas Inventory Report of Japan 2006 Page 3.11
Furnace type Fuel type Emission factor Remarks
Metal rolling furnace, metal treating furnace, metal forging furnace
Liquid fuel, gaseous fuel 0.42 Average of 11 facilities
Petroleum and gas furnaces Liquid fuel, gaseous fuel 0.15 Average of 27 facilities Catalytic regenerator Coke, carbon 0.054 Average of 11 facilities Brick kiln, ceramic kiln, and other kiln Solid fuel, liquid fuel, gaseous fuel 1.5 Average of 2 facilities
Aggregate drying kiln, cement raw material drying kiln, brick raw material drying kiln
Solid fuel, liquid fuel, gaseous fuel 27 Average of 6 facilities
Other drying kilns Solid fuel, liquid fuel, gaseous fuel 6.1 Average of 8 facilities Electric arc furnace Electricity 13 Average of 6 facilities Other industrial furnaces Solid fuel 13 Average of 14 facilities Other industrial furnaces Liquid fuel 0.79 Average of 14 facilities Other industrial furnaces Gaseous fuel 2.1 Average of 6 facilities Gas turbine Liquid fuel, gaseous fuel 0.75 Average of 11 facilities Diesel engine Liquid fuel, gaseous fuel 0.67 Average of 8 facilities Gas engine, petrol engine Liquid fuel, gaseous fuel 54 Average of 6 facilities
Household equipment Solid fuel 290 IPCC default value converted to higher heating value
Household equipment Liquid fuel 9.5 IPCC default value converted to higher heating value
Household equipment Gaseous fuel 4.5 IPCC default value converted to higher heating value
Household equipment Biomass fuel 290 IPCC default value converted to higher heating value
Table 3-9 N2O emission factors for different fuels and furnaces (unit: kg-N2O/TJ )
Furnace type Fuel type Emission factor Remarks
Boiler Heavy oils B and C, crude oil 0.21 Average of 10 facilities
Boiler Heavy oil A, diesel oil, kerosene, naphtha, other liquid fuels 0.18 Average of 2 facilities
Boiler Gaseous fuel 0.16 Average of 5 facilities Boiler (other than fluidized bed boilers) Solid fuel 0.83 Average of 9 facilities
Normal pressure fluidized bed boiler Solid fuel 53 Average of 11 facilities
Pressurized fluidized bed boiler Steam coal 5.2 Data from 1 facility
Boiler Pulping waste liquor 0.17 Average of 2 facilities
Blast furnace Coke oven gas, blast furnace gas, other gaseous fuel 0.050 Average of 2 facilities
Petroleum furnace, gas furnace Liquid fuel, gaseous fuel 0.20 Average of 27 facilities
Catalytic regenerator Coke, carbon 7.3 Average of 12 facilities Electric arc furnace Electricity 3.3 Average of 6 facilities
Coke oven Town gas, coke oven gas, blast furnace gas, converter gas, offgas, other gaseous fuels
0.15 Average of 3 facilities
Other industrial furnace Solid fuel 1.1 Average of 20 facilities Other industrial furnace Liquid fuel 1.7 Average of 31 facilities Other industrial furnace Gaseous fuel 1.1 Average of 18 facilities Gas turbine Liquid fuel, gaseous fuel 0.54 Average of 12 facilities Diesel engine Liquid fuel, gaseous fuel 2.1 Average of 9 facilities Gas engine, petrol engine Liquid fuel, gaseous fuel 0.83 Average of 7 facilities
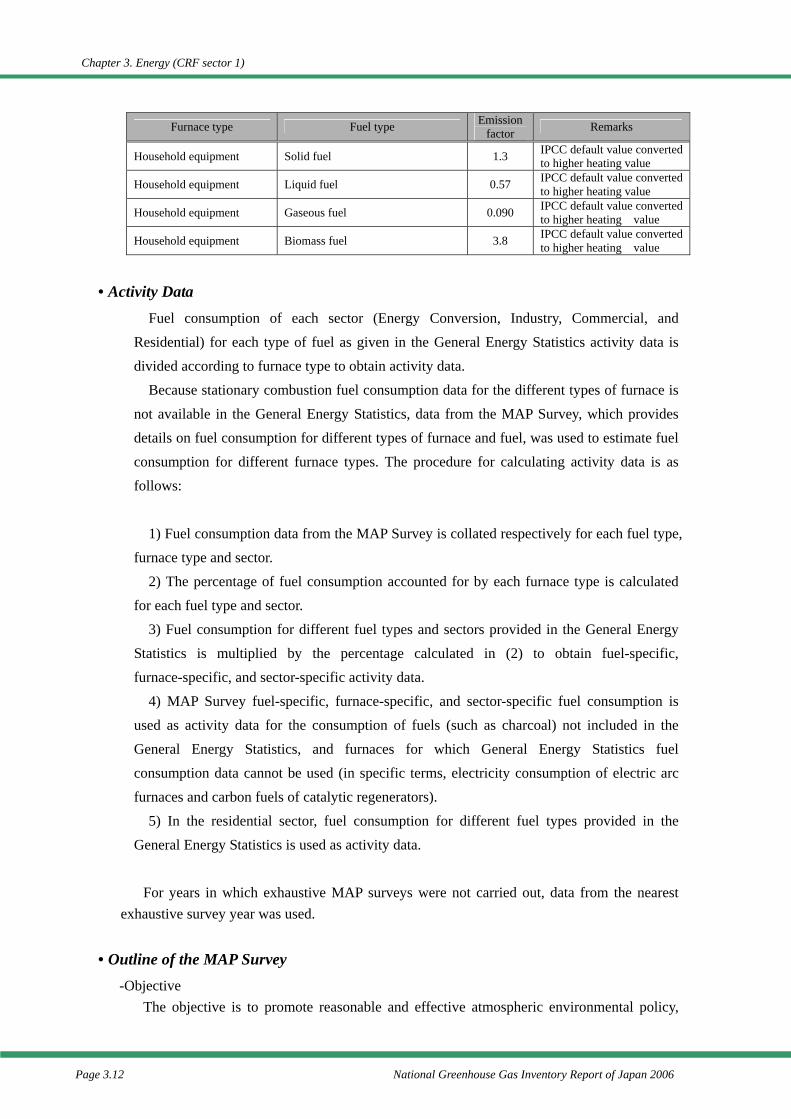
Chapter 3. Energy (CRF sector 1)
Page 3.12 National Greenhouse Gas Inventory Report of Japan 2006
Furnace type Fuel type Emission factor Remarks
Household equipment Solid fuel 1.3 IPCC default value converted to higher heating value
Household equipment Liquid fuel 0.57 IPCC default value converted to higher heating value
Household equipment Gaseous fuel 0.090 IPCC default value converted to higher heating value
Household equipment Biomass fuel 3.8 IPCC default value converted to higher heating value
• Activity Data Fuel consumption of each sector (Energy Conversion, Industry, Commercial, and
Residential) for each type of fuel as given in the General Energy Statistics activity data is divided according to furnace type to obtain activity data.
Because stationary combustion fuel consumption data for the different types of furnace is not available in the General Energy Statistics, data from the MAP Survey, which provides details on fuel consumption for different types of furnace and fuel, was used to estimate fuel consumption for different furnace types. The procedure for calculating activity data is as follows:
1) Fuel consumption data from the MAP Survey is collated respectively for each fuel type,
furnace type and sector. 2) The percentage of fuel consumption accounted for by each furnace type is calculated
for each fuel type and sector. 3) Fuel consumption for different fuel types and sectors provided in the General Energy
Statistics is multiplied by the percentage calculated in (2) to obtain fuel-specific, furnace-specific, and sector-specific activity data.
4) MAP Survey fuel-specific, furnace-specific, and sector-specific fuel consumption is used as activity data for the consumption of fuels (such as charcoal) not included in the General Energy Statistics, and furnaces for which General Energy Statistics fuel consumption data cannot be used (in specific terms, electricity consumption of electric arc furnaces and carbon fuels of catalytic regenerators).
5) In the residential sector, fuel consumption for different fuel types provided in the General Energy Statistics is used as activity data.
For years in which exhaustive MAP surveys were not carried out, data from the nearest exhaustive survey year was used.
• Outline of the MAP Survey -Objective
The objective is to promote reasonable and effective atmospheric environmental policy,
Chapter 3. Energy (CRF sector 1)
National Greenhouse Gas Inventory Report of Japan 2006 Page 3.13
with to obtain the information on current activities according to the Air Pollutant Control Law (e.g. (i) current status on registration of stationary sources which are soot and smokes emitting facilities registered to a local government and facilities emitting ordinary soot or particular soot, (ii) current status of air pollutant control), to develop the submitted data on facilities emitting soot and smokes, and to estimate amount of air pollutant emissions from facilities emitting soot and smokes.
-Target
(a) “Facilities emitting soot and smokes” defined in the article 2, paragraph 2 of the Air Pollutant Control Law (including “Facilities emitting soot and smokes” defined in the Electric Utility Law and the Town Gas Utility Law)
(b) “Facilities emitting mine smoke” or “Facilities emitting soot and smoke” defined in the article 2 of the “Ministerial Ordinance for standard of regulation to avoid mine pollution” according to the Security of Mine Law
(c) Facilities regulated by municipal bylaw of local governments (d) Other
-Method This survey is conducted with survey questionnaires. The response sheets and this survey’s
explanations are distributed to target facilities mentioned above. Complete enumeration surveys, in the form of the MAP Survey, were carried out in fiscal
1992, 1995, 1996, and 1999, in relation to all facilities emitting soot and smoke.
• Point to Note Up to the 2005 Inventory, Japan corrected for intake gas concentrations by using the
difference in GHG concentrations in exhaust gas and intake gas (intake gas correction) when setting emission factors for 1.A.1. Energy Industry (CH4, N2O), 1.A.2. Manufacturing and Construction Industries (CH4, N2O), and 1.A.4. Other Sectors (CH4, N2O), based on the conclusions of earlier studies of estimation methodology (Reports on Greenhouse Gas Emissions Estimation Methodology (1996), etc.). As a result, emission factors for some emission sources were given negative values based on measurements showing that due to combustion, the concentrations of methane and nitrous oxide in exhaust gases become lower than their concentrations in intake gas.
However, during the 2003 in-country review, the Expert Review Team (ERT) noted that while intake gas correction is desirable from the viewpoint of obtaining accurate emissions data, negative emission factors are not consistent with the 1996 Revised IPCC Guidelines and IPCC Good Practice Guidance (2000), which from the desirability of ensuring international consistency require the use of positive emission factors based on actual exhaust gas concentrations of methane and nitrous oxide. In order to meet this requirement, Japan now uses actual exhaust gas concentrations as they are to calculate emission factors. (see Chapter 10 Recalculation and Improvements)
Chapter 3. Energy (CRF sector 1)
Page 3.14 National Greenhouse Gas Inventory Report of Japan 2006
3.1.3. Mobile Combustion (1.A.3.: CH4 and N2O)
For emissions from mobile sources, methane and nitrous oxide emissions from aviation, road transportation, railways and navigation are calculated.
3.1.3.1. Civil Aviation (1.A.3.a.)
• Background Greenhouse gases associated with the domestic operation of Japanese airliners are mainly
emitted from jet fuels. In addition, a small amount of aviation gasoline used by light aircraft and helicopters is also a source of methane and nitrous oxide emission.
• Methodology for Estimating Emissions of GHGs Emissions have been calculated using the Tier 2a method for jet fuel and the Tier 1 for
aviation gasoline, in accordance with Decision Tree of the Good Practice Guidance (2000) (Page 2.58, Fig. 2.7). (Refer to 1A3-2005.xls¥ Airplane Emissions for detail on the calculation process.)
Methane and nitrous oxide emissions associated with landing and take-off (LTO) of domestic airliners using jet fuel = Emission factor per LTO1 cycle per domestic airliner × Number of LTO cycles of aircraft in domestic routes
Methane and nitrous oxide emissions from domestic airliner during cruising using jet fuel = Emission factor associated with jet fuel consumption × Jet fuel consumption by aircraft during cruising in domestic routes
Methane and nitrous oxide emission associated with flight of gasoline-powered domestic aircraft = Emission factor associated with consumption of aviation gasoline × Consumption of aviation gasoline by aircraft in domestic routes
• Emission Factors -Jet fuel
The default values given in the Revised 1996 IPCC Guidelines are used for emission factors for methane and nitrous oxide for LTO. The values used for emission factors for methane and nitrous oxide for cruising were calculated by converting the default values given in the Revised 1996 IPCC Guidelines into kg-CH4/l using the specific gravity of jet fuel (0.78 t/kl). The following table provides the emission factors for methane and nitrous oxide at LTO and cruising.
-Aviation gasoline
The default values given in the Revised 1996 IPCC Guidelines are used for emission factors for methane and nitrous oxide.
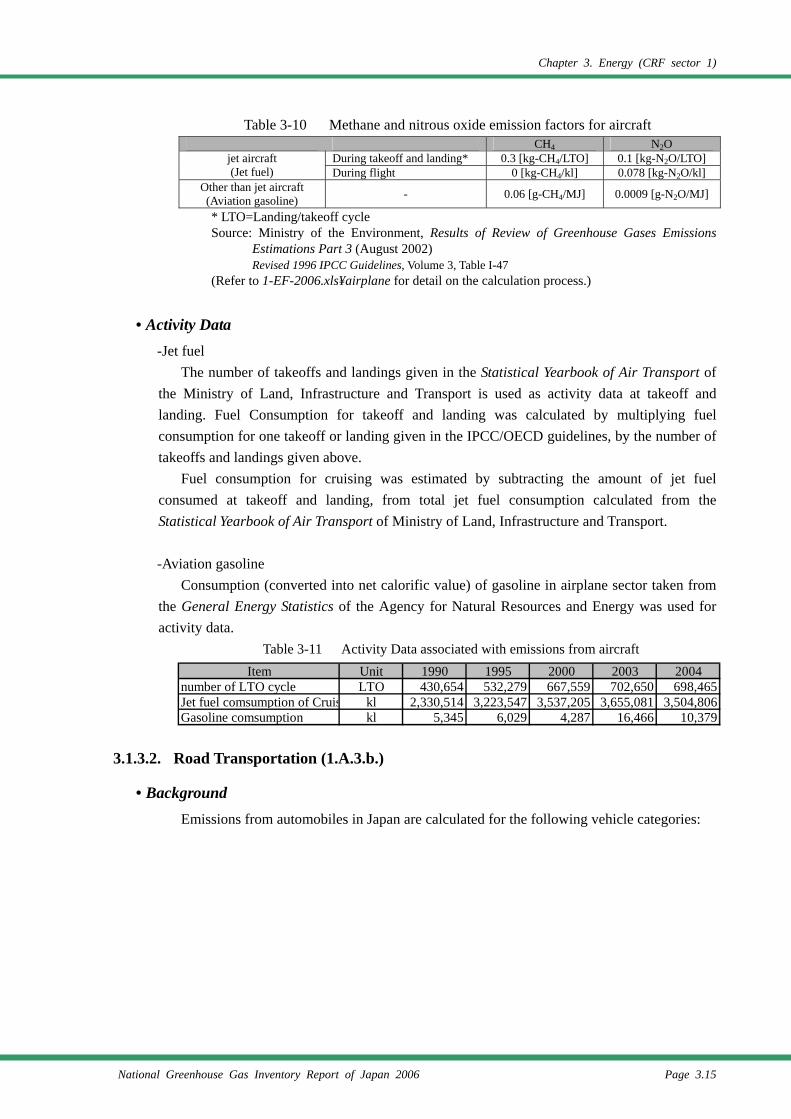
Chapter 3. Energy (CRF sector 1)
National Greenhouse Gas Inventory Report of Japan 2006 Page 3.15
Table 3-10 Methane and nitrous oxide emission factors for aircraft CH4 N2O
During takeoff and landing* 0.3 [kg-CH4/LTO] 0.1 [kg-N2O/LTO] jet aircraft (Jet fuel) During flight 0 [kg-CH4/kl] 0.078 [kg-N2O/kl]
Other than jet aircraft (Aviation gasoline) - 0.06 [g-CH4/MJ] 0.0009 [g-N2O/MJ]
* LTO=Landing/takeoff cycle Source: Ministry of the Environment, Results of Review of Greenhouse Gases Emissions
Estimations Part 3 (August 2002) Revised 1996 IPCC Guidelines, Volume 3, Table I-47
(Refer to 1-EF-2006.xls¥airplane for detail on the calculation process.)
• Activity Data -Jet fuel
The number of takeoffs and landings given in the Statistical Yearbook of Air Transport of the Ministry of Land, Infrastructure and Transport is used as activity data at takeoff and landing. Fuel Consumption for takeoff and landing was calculated by multiplying fuel consumption for one takeoff or landing given in the IPCC/OECD guidelines, by the number of takeoffs and landings given above.
Fuel consumption for cruising was estimated by subtracting the amount of jet fuel consumed at takeoff and landing, from total jet fuel consumption calculated from the Statistical Yearbook of Air Transport of Ministry of Land, Infrastructure and Transport.
-Aviation gasoline
Consumption (converted into net calorific value) of gasoline in airplane sector taken from the General Energy Statistics of the Agency for Natural Resources and Energy was used for activity data.
Table 3-11 Activity Data associated with emissions from aircraft
3.1.3.2. Road Transportation (1.A.3.b.)
• Background Emissions from automobiles in Japan are calculated for the following vehicle categories:
Item Unit 1990 1995 2000 2003 2004number of LTO cycle LTO 430,654 532,279 667,559 702,650 698,465Jet fuel comsumption of Cruis kl 2,330,514 3,223,547 3,537,205 3,655,081 3,504,806Gasoline comsumption kl 5,345 6,029 4,287 16,466 10,379
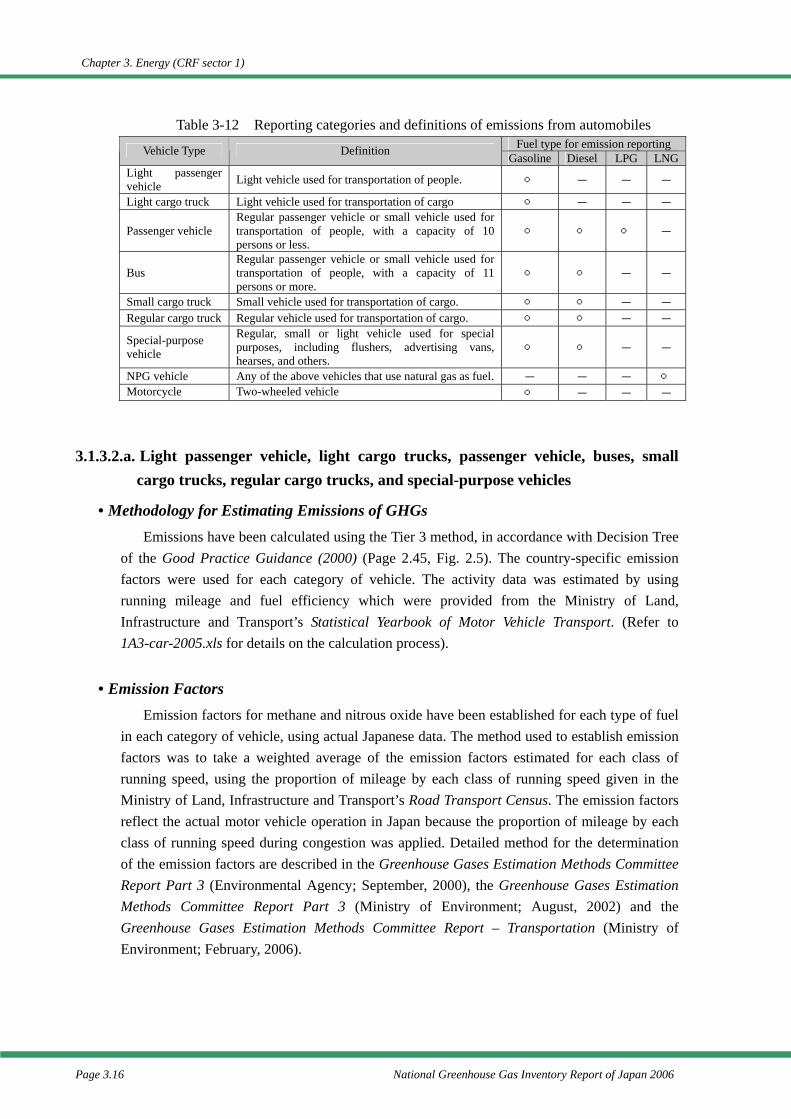
Chapter 3. Energy (CRF sector 1)
Page 3.16 National Greenhouse Gas Inventory Report of Japan 2006
Table 3-12 Reporting categories and definitions of emissions from automobiles Fuel type for emission reporting Vehicle Type Definition Gasoline Diesel LPG LNG
Light passenger vehicle Light vehicle used for transportation of people. ○ - - -
Light cargo truck Light vehicle used for transportation of cargo ○ - - -
Passenger vehicle Regular passenger vehicle or small vehicle used for transportation of people, with a capacity of 10 persons or less.
○ ○ ○ -
Bus Regular passenger vehicle or small vehicle used for transportation of people, with a capacity of 11 persons or more.
○ ○ - -
Small cargo truck Small vehicle used for transportation of cargo. ○ ○ - - Regular cargo truck Regular vehicle used for transportation of cargo. ○ ○ - -
Special-purpose vehicle
Regular, small or light vehicle used for special purposes, including flushers, advertising vans, hearses, and others.
○ ○ - -
NPG vehicle Any of the above vehicles that use natural gas as fuel. - - - ○ Motorcycle Two-wheeled vehicle ○ - - -
3.1.3.2.a. Light passenger vehicle, light cargo trucks, passenger vehicle, buses, small cargo trucks, regular cargo trucks, and special-purpose vehicles
• Methodology for Estimating Emissions of GHGs Emissions have been calculated using the Tier 3 method, in accordance with Decision Tree
of the Good Practice Guidance (2000) (Page 2.45, Fig. 2.5). The country-specific emission factors were used for each category of vehicle. The activity data was estimated by using running mileage and fuel efficiency which were provided from the Ministry of Land, Infrastructure and Transport’s Statistical Yearbook of Motor Vehicle Transport. (Refer to 1A3-car-2005.xls for details on the calculation process).
• Emission Factors Emission factors for methane and nitrous oxide have been established for each type of fuel
in each category of vehicle, using actual Japanese data. The method used to establish emission factors was to take a weighted average of the emission factors estimated for each class of running speed, using the proportion of mileage by each class of running speed given in the Ministry of Land, Infrastructure and Transport’s Road Transport Census. The emission factors reflect the actual motor vehicle operation in Japan because the proportion of mileage by each class of running speed during congestion was applied. Detailed method for the determination of the emission factors are described in the Greenhouse Gases Estimation Methods Committee Report Part 3 (Environmental Agency; September, 2000), the Greenhouse Gases Estimation Methods Committee Report Part 3 (Ministry of Environment; August, 2002) and the Greenhouse Gases Estimation Methods Committee Report – Transportation (Ministry of Environment; February, 2006).
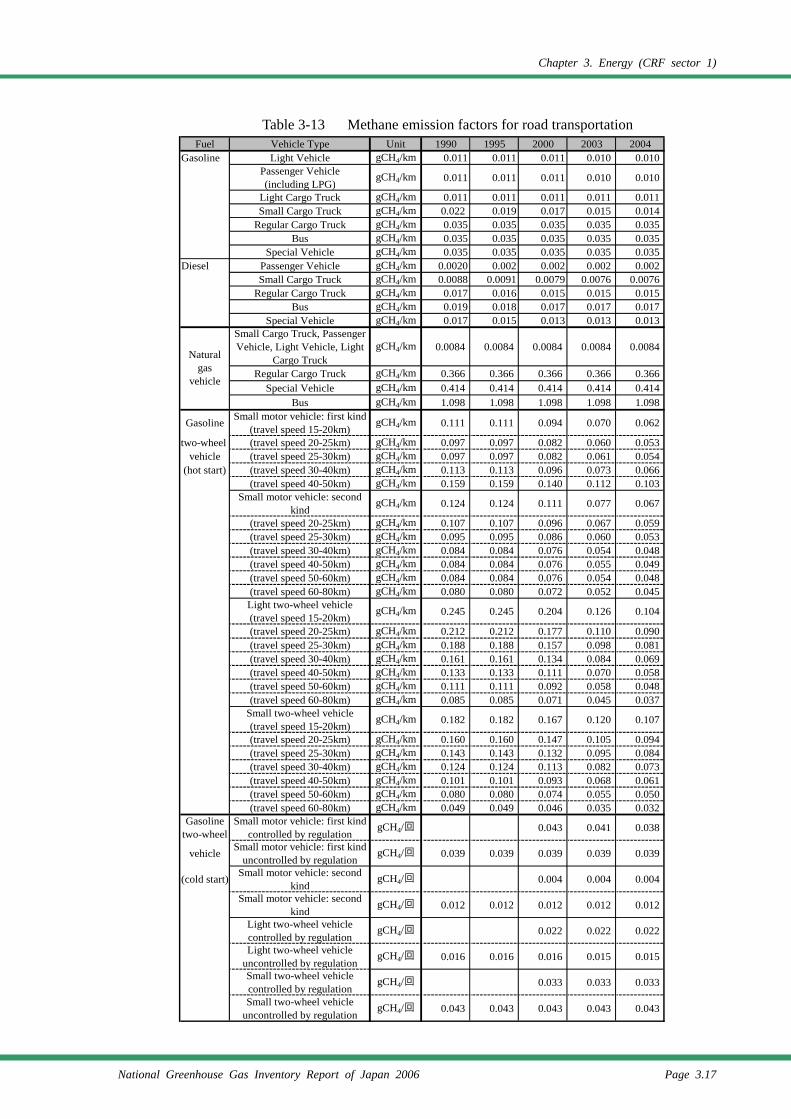
Chapter 3. Energy (CRF sector 1)
National Greenhouse Gas Inventory Report of Japan 2006 Page 3.17
Table 3-13 Methane emission factors for road transportation
Fuel Vehicle Type Unit 1990 1995 2000 2003 2004Gasoline Light Vehicle gCH4/km 0.011 0.011 0.011 0.010 0.010
Passenger Vehicle(including LPG)
gCH4/km 0.011 0.011 0.011 0.010 0.010
Light Cargo Truck gCH4/km 0.011 0.011 0.011 0.011 0.011Small Cargo Truck gCH4/km 0.022 0.019 0.017 0.015 0.014
Regular Cargo Truck gCH4/km 0.035 0.035 0.035 0.035 0.035Bus gCH4/km 0.035 0.035 0.035 0.035 0.035
Special Vehicle gCH4/km 0.035 0.035 0.035 0.035 0.035Diesel Passenger Vehicle gCH4/km 0.0020 0.002 0.002 0.002 0.002
Small Cargo Truck gCH4/km 0.0088 0.0091 0.0079 0.0076 0.0076Regular Cargo Truck gCH4/km 0.017 0.016 0.015 0.015 0.015
Bus gCH4/km 0.019 0.018 0.017 0.017 0.017Special Vehicle gCH4/km 0.017 0.015 0.013 0.013 0.013
Small Cargo Truck, PassengerVehicle, Light Vehicle, Light
Cargo TruckgCH4/km 0.0084 0.0084 0.0084 0.0084 0.0084
Regular Cargo Truck gCH4/km 0.366 0.366 0.366 0.366 0.366Special Vehicle gCH4/km 0.414 0.414 0.414 0.414 0.414
Bus gCH4/km 1.098 1.098 1.098 1.098 1.098
Gasoline Small motor vehicle: first kind(travel speed 15-20km)
gCH4/km 0.111 0.111 0.094 0.070 0.062
two-wheel (travel speed 20-25km) gCH4/km 0.097 0.097 0.082 0.060 0.053vehicle (travel speed 25-30km) gCH4/km 0.097 0.097 0.082 0.061 0.054
(hot start) (travel speed 30-40km) gCH4/km 0.113 0.113 0.096 0.073 0.066(travel speed 40-50km) gCH4/km 0.159 0.159 0.140 0.112 0.103
Small motor vehicle: secondkind
gCH4/km 0.124 0.124 0.111 0.077 0.067
(travel speed 20-25km) gCH4/km 0.107 0.107 0.096 0.067 0.059(travel speed 25-30km) gCH4/km 0.095 0.095 0.086 0.060 0.053(travel speed 30-40km) gCH4/km 0.084 0.084 0.076 0.054 0.048(travel speed 40-50km) gCH4/km 0.084 0.084 0.076 0.055 0.049(travel speed 50-60km) gCH4/km 0.084 0.084 0.076 0.054 0.048(travel speed 60-80km) gCH4/km 0.080 0.080 0.072 0.052 0.045Light two-wheel vehicle(travel speed 15-20km)
gCH4/km 0.245 0.245 0.204 0.126 0.104
(travel speed 20-25km) gCH4/km 0.212 0.212 0.177 0.110 0.090(travel speed 25-30km) gCH4/km 0.188 0.188 0.157 0.098 0.081(travel speed 30-40km) gCH4/km 0.161 0.161 0.134 0.084 0.069(travel speed 40-50km) gCH4/km 0.133 0.133 0.111 0.070 0.058(travel speed 50-60km) gCH4/km 0.111 0.111 0.092 0.058 0.048(travel speed 60-80km) gCH4/km 0.085 0.085 0.071 0.045 0.037
Small two-wheel vehicle(travel speed 15-20km)
gCH4/km 0.182 0.182 0.167 0.120 0.107
(travel speed 20-25km) gCH4/km 0.160 0.160 0.147 0.105 0.094(travel speed 25-30km) gCH4/km 0.143 0.143 0.132 0.095 0.084(travel speed 30-40km) gCH4/km 0.124 0.124 0.113 0.082 0.073(travel speed 40-50km) gCH4/km 0.101 0.101 0.093 0.068 0.061(travel speed 50-60km) gCH4/km 0.080 0.080 0.074 0.055 0.050(travel speed 60-80km) gCH4/km 0.049 0.049 0.046 0.035 0.032
Gasolinetwo-wheel
Small motor vehicle: first kindcontrolled by regulation
gCH4/回 0.043 0.041 0.038
vehicle Small motor vehicle: first kinduncontrolled by regulation
gCH4/回 0.039 0.039 0.039 0.039 0.039
(cold start) Small motor vehicle: secondkind
gCH4/回 0.004 0.004 0.004
Small motor vehicle: secondkind
gCH4/回 0.012 0.012 0.012 0.012 0.012
Light two-wheel vehiclecontrolled by regulation
gCH4/回 0.022 0.022 0.022
Light two-wheel vehicleuncontrolled by regulation
gCH4/回 0.016 0.016 0.016 0.015 0.015
Small two-wheel vehiclecontrolled by regulation
gCH4/回 0.033 0.033 0.033
Small two-wheel vehicleuncontrolled by regulation
gCH4/回 0.043 0.043 0.043 0.043 0.043
Naturalgas
vehicle
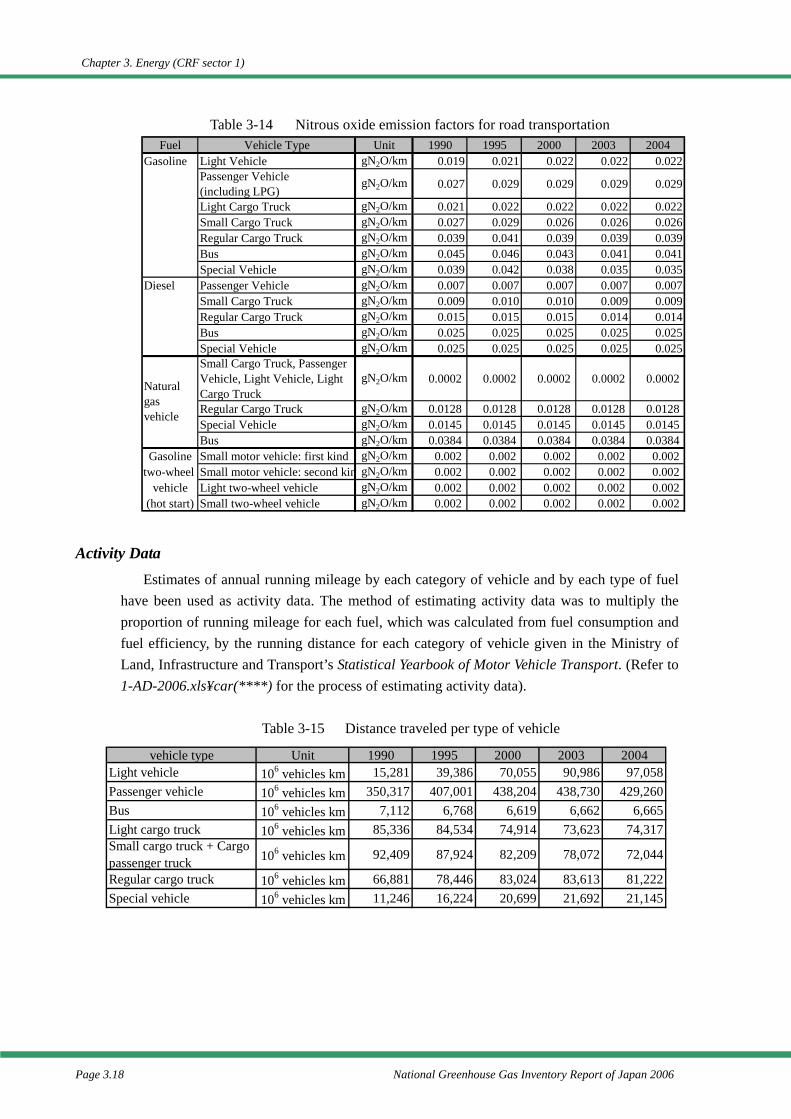
Chapter 3. Energy (CRF sector 1)
Page 3.18 National Greenhouse Gas Inventory Report of Japan 2006
Table 3-14 Nitrous oxide emission factors for road transportation
Activity Data Estimates of annual running mileage by each category of vehicle and by each type of fuel
have been used as activity data. The method of estimating activity data was to multiply the proportion of running mileage for each fuel, which was calculated from fuel consumption and fuel efficiency, by the running distance for each category of vehicle given in the Ministry of Land, Infrastructure and Transport’s Statistical Yearbook of Motor Vehicle Transport. (Refer to 1-AD-2006.xls¥car(****) for the process of estimating activity data).
Table 3-15 Distance traveled per type of vehicle
Fuel Vehicle Type Unit 1990 1995 2000 2003 2004Gasoline Light Vehicle gN2O/km 0.019 0.021 0.022 0.022 0.022
Passenger Vehicle(including LPG)
gN2O/km 0.027 0.029 0.029 0.029 0.029
Light Cargo Truck gN2O/km 0.021 0.022 0.022 0.022 0.022Small Cargo Truck gN2O/km 0.027 0.029 0.026 0.026 0.026Regular Cargo Truck gN2O/km 0.039 0.041 0.039 0.039 0.039Bus gN2O/km 0.045 0.046 0.043 0.041 0.041Special Vehicle gN2O/km 0.039 0.042 0.038 0.035 0.035
Diesel Passenger Vehicle gN2O/km 0.007 0.007 0.007 0.007 0.007Small Cargo Truck gN2O/km 0.009 0.010 0.010 0.009 0.009Regular Cargo Truck gN2O/km 0.015 0.015 0.015 0.014 0.014Bus gN2O/km 0.025 0.025 0.025 0.025 0.025Special Vehicle gN2O/km 0.025 0.025 0.025 0.025 0.025Small Cargo Truck, PassengerVehicle, Light Vehicle, LightCargo Truck
gN2O/km 0.0002 0.0002 0.0002 0.0002 0.0002
Regular Cargo Truck gN2O/km 0.0128 0.0128 0.0128 0.0128 0.0128Special Vehicle gN2O/km 0.0145 0.0145 0.0145 0.0145 0.0145Bus gN2O/km 0.0384 0.0384 0.0384 0.0384 0.0384
Gasoline Small motor vehicle: first kind gN2O/km 0.002 0.002 0.002 0.002 0.002two-wheel Small motor vehicle: second kin gN2O/km 0.002 0.002 0.002 0.002 0.002
vehicle Light two-wheel vehicle gN2O/km 0.002 0.002 0.002 0.002 0.002(hot start) Small two-wheel vehicle gN2O/km 0.002 0.002 0.002 0.002 0.002
Naturalgasvehicle
vehicle type Unit 1990 1995 2000 2003 2004Light vehicle 106 vehicles km 15,281 39,386 70,055 90,986 97,058Passenger vehicle 106 vehicles km 350,317 407,001 438,204 438,730 429,260Bus 106 vehicles km 7,112 6,768 6,619 6,662 6,665Light cargo truck 106 vehicles km 85,336 84,534 74,914 73,623 74,317Small cargo truck + Cargopassenger truck 106 vehicles km 92,409 87,924 82,209 78,072 72,044
Regular cargo truck 106 vehicles km 66,881 78,446 83,024 83,613 81,222Special vehicle 106 vehicles km 11,246 16,224 20,699 21,692 21,145
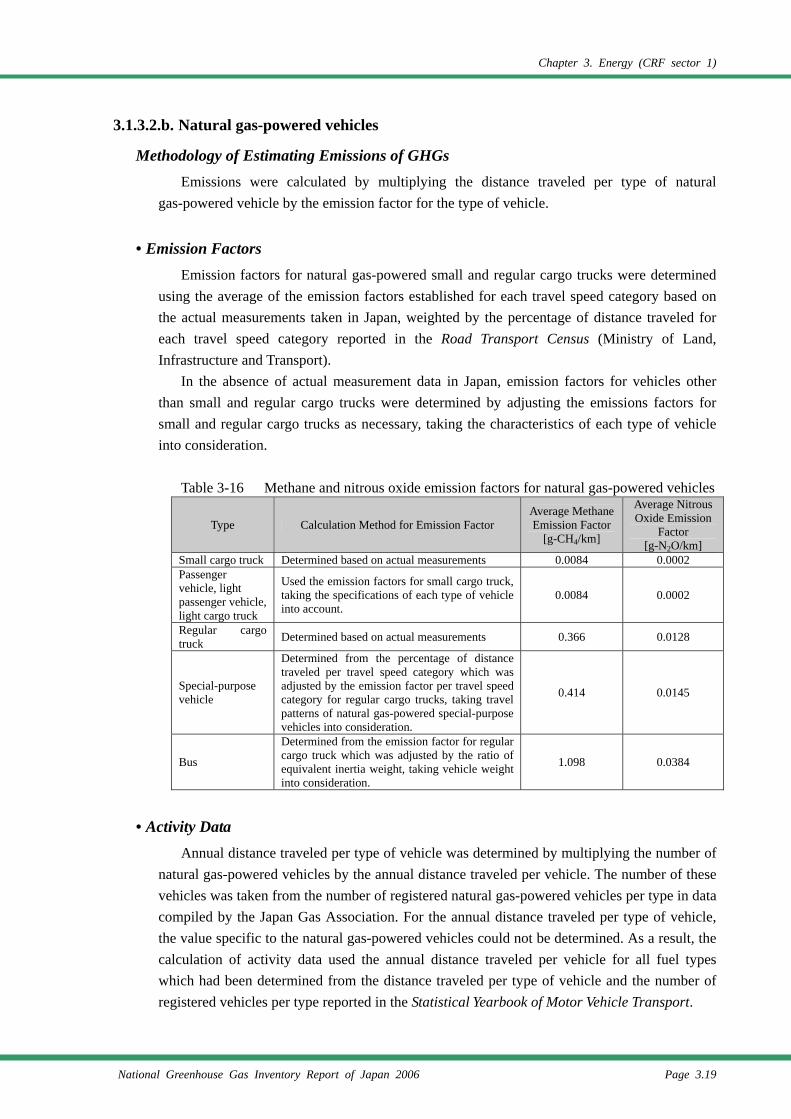
Chapter 3. Energy (CRF sector 1)
National Greenhouse Gas Inventory Report of Japan 2006 Page 3.19
3.1.3.2.b. Natural gas-powered vehicles
Methodology of Estimating Emissions of GHGs Emissions were calculated by multiplying the distance traveled per type of natural
gas-powered vehicle by the emission factor for the type of vehicle.
• Emission Factors Emission factors for natural gas-powered small and regular cargo trucks were determined
using the average of the emission factors established for each travel speed category based on the actual measurements taken in Japan, weighted by the percentage of distance traveled for each travel speed category reported in the Road Transport Census (Ministry of Land, Infrastructure and Transport).
In the absence of actual measurement data in Japan, emission factors for vehicles other than small and regular cargo trucks were determined by adjusting the emissions factors for small and regular cargo trucks as necessary, taking the characteristics of each type of vehicle into consideration.
Table 3-16 Methane and nitrous oxide emission factors for natural gas-powered vehicles
Type Calculation Method for Emission Factor Average Methane Emission Factor
[g-CH4/km]
Average Nitrous Oxide Emission
Factor [g-N2O/km]
Small cargo truck Determined based on actual measurements 0.0084 0.0002 Passenger vehicle, light passenger vehicle, light cargo truck
Used the emission factors for small cargo truck, taking the specifications of each type of vehicle into account.
0.0084 0.0002
Regular cargo truck Determined based on actual measurements 0.366 0.0128
Special-purpose vehicle
Determined from the percentage of distance traveled per travel speed category which was adjusted by the emission factor per travel speed category for regular cargo trucks, taking travel patterns of natural gas-powered special-purpose vehicles into consideration.
0.414 0.0145
Bus
Determined from the emission factor for regular cargo truck which was adjusted by the ratio of equivalent inertia weight, taking vehicle weight into consideration.
1.098 0.0384
• Activity Data Annual distance traveled per type of vehicle was determined by multiplying the number of
natural gas-powered vehicles by the annual distance traveled per vehicle. The number of these vehicles was taken from the number of registered natural gas-powered vehicles per type in data compiled by the Japan Gas Association. For the annual distance traveled per type of vehicle, the value specific to the natural gas-powered vehicles could not be determined. As a result, the calculation of activity data used the annual distance traveled per vehicle for all fuel types which had been determined from the distance traveled per type of vehicle and the number of registered vehicles per type reported in the Statistical Yearbook of Motor Vehicle Transport.
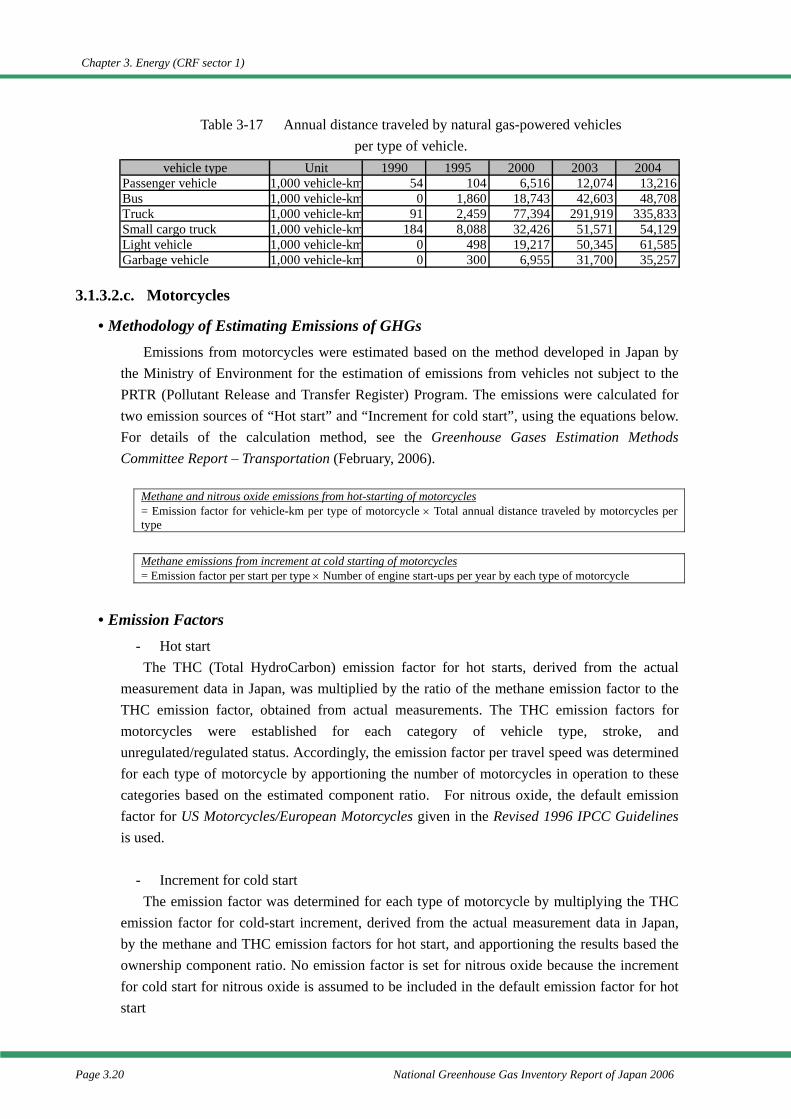
Chapter 3. Energy (CRF sector 1)
Page 3.20 National Greenhouse Gas Inventory Report of Japan 2006
Table 3-17 Annual distance traveled by natural gas-powered vehicles per type of vehicle.
3.1.3.2.c. Motorcycles
• Methodology of Estimating Emissions of GHGs Emissions from motorcycles were estimated based on the method developed in Japan by
the Ministry of Environment for the estimation of emissions from vehicles not subject to the PRTR (Pollutant Release and Transfer Register) Program. The emissions were calculated for two emission sources of “Hot start” and “Increment for cold start”, using the equations below. For details of the calculation method, see the Greenhouse Gases Estimation Methods Committee Report – Transportation (February, 2006).
Methane and nitrous oxide emissions from hot-starting of motorcycles = Emission factor for vehicle-km per type of motorcycle × Total annual distance traveled by motorcycles per type
Methane emissions from increment at cold starting of motorcycles = Emission factor per start per type × Number of engine start-ups per year by each type of motorcycle
• Emission Factors - Hot start
The THC (Total HydroCarbon) emission factor for hot starts, derived from the actual measurement data in Japan, was multiplied by the ratio of the methane emission factor to the THC emission factor, obtained from actual measurements. The THC emission factors for motorcycles were established for each category of vehicle type, stroke, and unregulated/regulated status. Accordingly, the emission factor per travel speed was determined for each type of motorcycle by apportioning the number of motorcycles in operation to these categories based on the estimated component ratio. For nitrous oxide, the default emission factor for US Motorcycles/European Motorcycles given in the Revised 1996 IPCC Guidelines is used.
- Increment for cold start
The emission factor was determined for each type of motorcycle by multiplying the THC emission factor for cold-start increment, derived from the actual measurement data in Japan, by the methane and THC emission factors for hot start, and apportioning the results based the ownership component ratio. No emission factor is set for nitrous oxide because the increment for cold start for nitrous oxide is assumed to be included in the default emission factor for hot start
vehicle type Unit 1990 1995 2000 2003 2004Passenger vehicle 1,000 vehicle-km 54 104 6,516 12,074 13,216Bus 1,000 vehicle-km 0 1,860 18,743 42,603 48,708Truck 1,000 vehicle-km 91 2,459 77,394 291,919 335,833Small cargo truck 1,000 vehicle-km 184 8,088 32,426 51,571 54,129Light vehicle 1,000 vehicle-km 0 498 19,217 50,345 61,585Garbage vehicle 1,000 vehicle-km 0 300 6,955 31,700 35,257
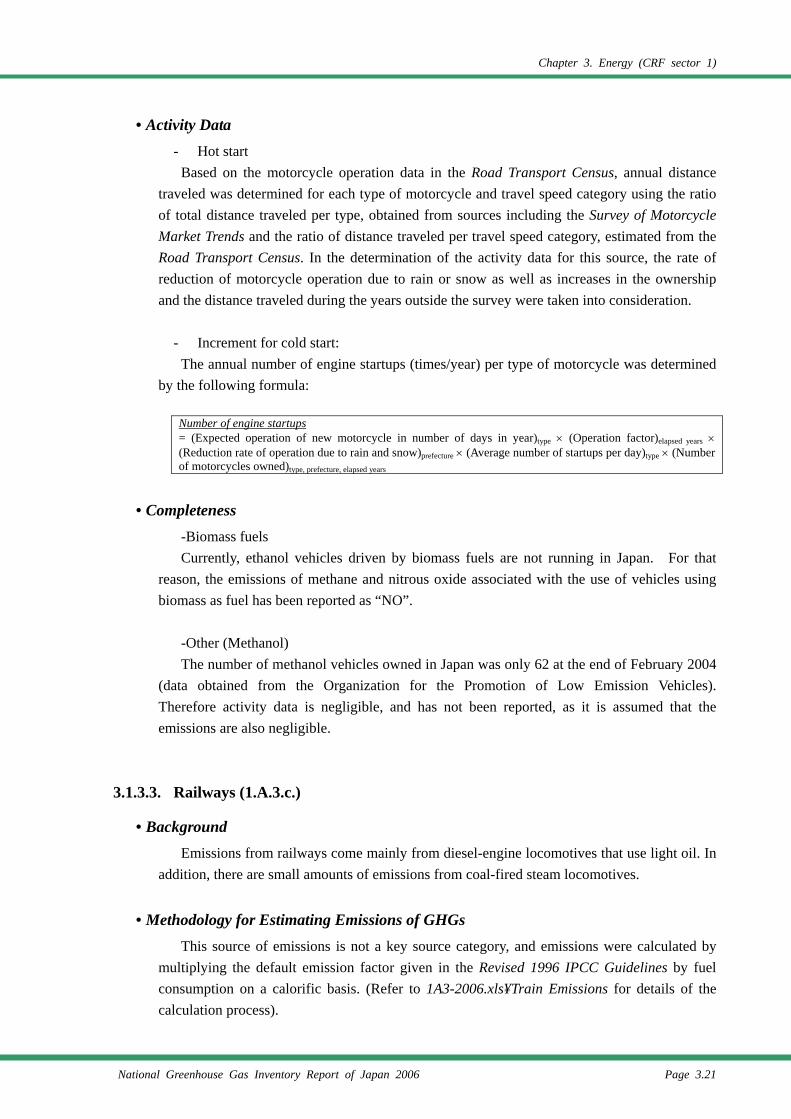
Chapter 3. Energy (CRF sector 1)
National Greenhouse Gas Inventory Report of Japan 2006 Page 3.21
• Activity Data - Hot start
Based on the motorcycle operation data in the Road Transport Census, annual distance traveled was determined for each type of motorcycle and travel speed category using the ratio of total distance traveled per type, obtained from sources including the Survey of Motorcycle Market Trends and the ratio of distance traveled per travel speed category, estimated from the Road Transport Census. In the determination of the activity data for this source, the rate of reduction of motorcycle operation due to rain or snow as well as increases in the ownership and the distance traveled during the years outside the survey were taken into consideration.
- Increment for cold start:
The annual number of engine startups (times/year) per type of motorcycle was determined by the following formula:
Number of engine startups = (Expected operation of new motorcycle in number of days in year)type × (Operation factor)elapsed years × (Reduction rate of operation due to rain and snow)prefecture × (Average number of startups per day)type × (Number of motorcycles owned)type, prefecture, elapsed years
• Completeness -Biomass fuels Currently, ethanol vehicles driven by biomass fuels are not running in Japan. For that
reason, the emissions of methane and nitrous oxide associated with the use of vehicles using biomass as fuel has been reported as “NO”.
-Other (Methanol) The number of methanol vehicles owned in Japan was only 62 at the end of February 2004
(data obtained from the Organization for the Promotion of Low Emission Vehicles). Therefore activity data is negligible, and has not been reported, as it is assumed that the emissions are also negligible.
3.1.3.3. Railways (1.A.3.c.)
• Background Emissions from railways come mainly from diesel-engine locomotives that use light oil. In
addition, there are small amounts of emissions from coal-fired steam locomotives.
• Methodology for Estimating Emissions of GHGs This source of emissions is not a key source category, and emissions were calculated by
multiplying the default emission factor given in the Revised 1996 IPCC Guidelines by fuel consumption on a calorific basis. (Refer to 1A3-2006.xls¥Train Emissions for details of the calculation process).
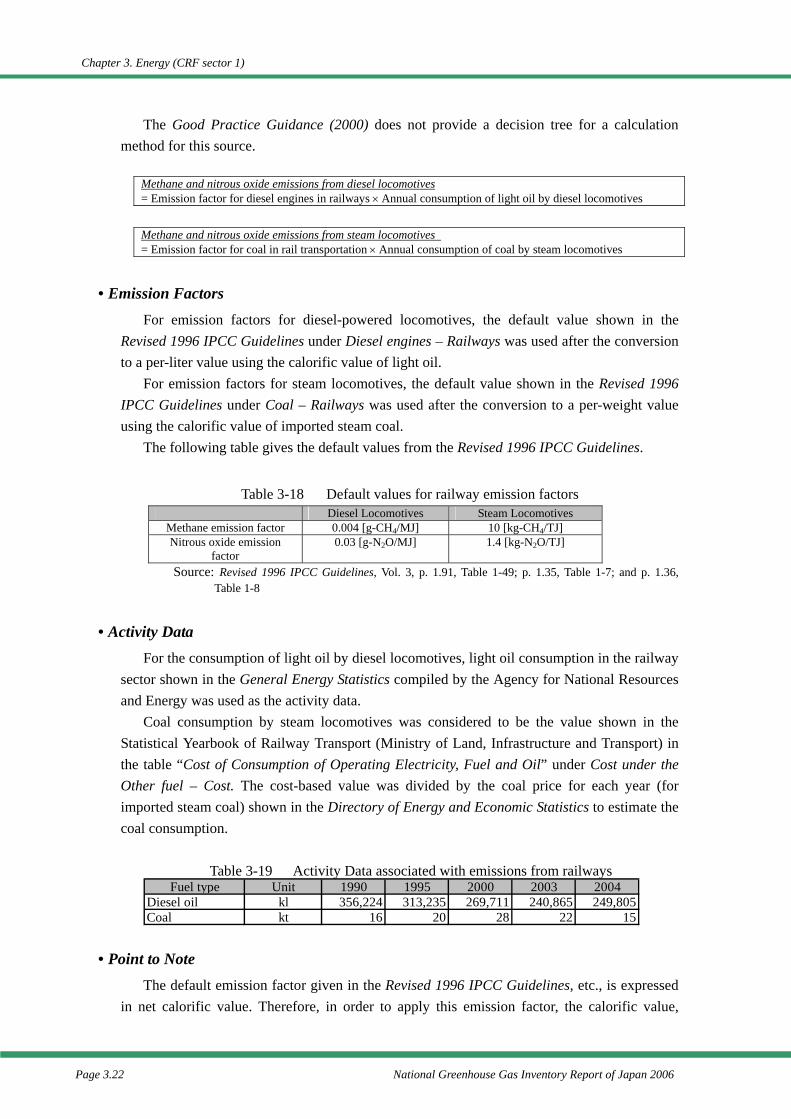
Chapter 3. Energy (CRF sector 1)
Page 3.22 National Greenhouse Gas Inventory Report of Japan 2006
The Good Practice Guidance (2000) does not provide a decision tree for a calculation method for this source.
Methane and nitrous oxide emissions from diesel locomotives = Emission factor for diesel engines in railways × Annual consumption of light oil by diesel locomotives
Methane and nitrous oxide emissions from steam locomotives = Emission factor for coal in rail transportation × Annual consumption of coal by steam locomotives
• Emission Factors For emission factors for diesel-powered locomotives, the default value shown in the
Revised 1996 IPCC Guidelines under Diesel engines – Railways was used after the conversion to a per-liter value using the calorific value of light oil.
For emission factors for steam locomotives, the default value shown in the Revised 1996 IPCC Guidelines under Coal – Railways was used after the conversion to a per-weight value using the calorific value of imported steam coal.
The following table gives the default values from the Revised 1996 IPCC Guidelines.
Table 3-18 Default values for railway emission factors Diesel Locomotives Steam Locomotives
Methane emission factor 0.004 [g-CH4/MJ] 10 [kg-CH4/TJ] Nitrous oxide emission
factor 0.03 [g-N2O/MJ] 1.4 [kg-N2O/TJ]
Source: Revised 1996 IPCC Guidelines, Vol. 3, p. 1.91, Table 1-49; p. 1.35, Table 1-7; and p. 1.36, Table 1-8
• Activity Data For the consumption of light oil by diesel locomotives, light oil consumption in the railway
sector shown in the General Energy Statistics compiled by the Agency for National Resources and Energy was used as the activity data.
Coal consumption by steam locomotives was considered to be the value shown in the Statistical Yearbook of Railway Transport (Ministry of Land, Infrastructure and Transport) in the table “Cost of Consumption of Operating Electricity, Fuel and Oil” under Cost under the Other fuel – Cost. The cost-based value was divided by the coal price for each year (for imported steam coal) shown in the Directory of Energy and Economic Statistics to estimate the coal consumption.
Table 3-19 Activity Data associated with emissions from railways
• Point to Note The default emission factor given in the Revised 1996 IPCC Guidelines, etc., is expressed
in net calorific value. Therefore, in order to apply this emission factor, the calorific value,
Fuel type Unit 1990 1995 2000 2003 2004Diesel oil kl 356,224 313,235 269,711 240,865 249,805Coal kt 16 20 28 22 15
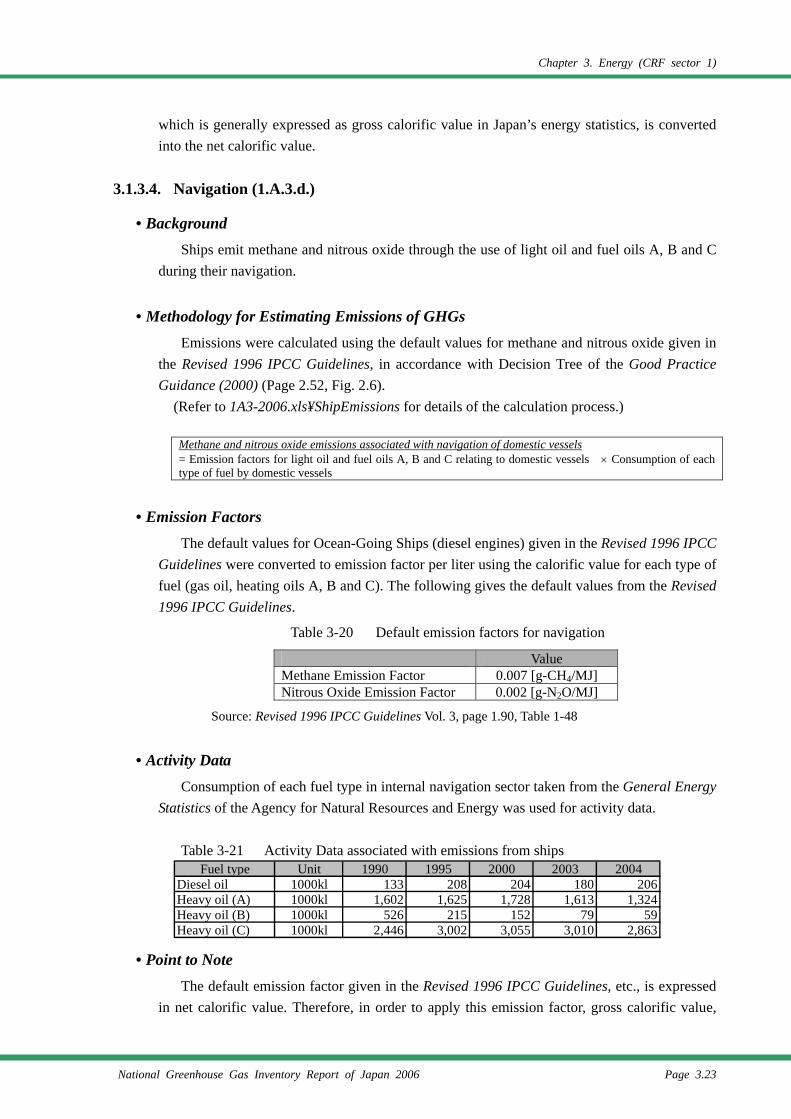
Chapter 3. Energy (CRF sector 1)
National Greenhouse Gas Inventory Report of Japan 2006 Page 3.23
which is generally expressed as gross calorific value in Japan’s energy statistics, is converted into the net calorific value.
3.1.3.4. Navigation (1.A.3.d.)
• Background Ships emit methane and nitrous oxide through the use of light oil and fuel oils A, B and C
during their navigation.
• Methodology for Estimating Emissions of GHGs Emissions were calculated using the default values for methane and nitrous oxide given in
the Revised 1996 IPCC Guidelines, in accordance with Decision Tree of the Good Practice Guidance (2000) (Page 2.52, Fig. 2.6).
(Refer to 1A3-2006.xls¥ShipEmissions for details of the calculation process.) Methane and nitrous oxide emissions associated with navigation of domestic vessels = Emission factors for light oil and fuel oils A, B and C relating to domestic vessels × Consumption of each type of fuel by domestic vessels
• Emission Factors The default values for Ocean-Going Ships (diesel engines) given in the Revised 1996 IPCC
Guidelines were converted to emission factor per liter using the calorific value for each type of fuel (gas oil, heating oils A, B and C). The following gives the default values from the Revised 1996 IPCC Guidelines.
Table 3-20 Default emission factors for navigation
Source: Revised 1996 IPCC Guidelines Vol. 3, page 1.90, Table 1-48
• Activity Data Consumption of each fuel type in internal navigation sector taken from the General Energy
Statistics of the Agency for Natural Resources and Energy was used for activity data. Table 3-21 Activity Data associated with emissions from ships
• Point to Note The default emission factor given in the Revised 1996 IPCC Guidelines, etc., is expressed
in net calorific value. Therefore, in order to apply this emission factor, gross calorific value,
Value Methane Emission Factor 0.007 [g-CH4/MJ] Nitrous Oxide Emission Factor 0.002 [g-N2O/MJ]
Fuel type Unit 1990 1995 2000 2003 2004Diesel oil 1000kl 133 208 204 180 206Heavy oil (A) 1000kl 1,602 1,625 1,728 1,613 1,324Heavy oil (B) 1000kl 526 215 152 79 59Heavy oil (C) 1000kl 2,446 3,002 3,055 3,010 2,863
Chapter 3. Energy (CRF sector 1)
Page 3.24 National Greenhouse Gas Inventory Report of Japan 2006
which is generally adopted in Japan’s energy statistics, is first converted into net calorific value, and then it is used for the conversion to the liter-based emissions factor.
• Completeness The Common Reporting Format (CRF) provides a “Residual Oil” category, which is
believed to correspond to ‘Heating Oil’ in Japan. Emissions of methane and nitrous oxide from heating oil A, B, and C have been calculated for each type of fuel. The resulting emissions have been reported under Other Fuels in the CRF, and, therefore, the Residual Oil column has been reported as “IE”.
3.2. Fugitive Emissions from Fuels (1.B.)
Unburned fossil fuels emit carbon dioxide, methane and nitrous oxide during their mining, production, processing and refining, transportation, storage and distribution. Venting and flaring in the oil and natural gas industries also emits carbon dioxide, methane and nitrous oxide. The main source of emissions from solid fuels is methane contained in coal seams, while fugitive emissions, venting, flaring, volatilization and accidents are the main emission sources in the oil and natural gas industries.
3.2.1. Solid Fuels (1.B.1.)
3.2.1.1. Coal Mining and Handling (1.B.1.a.)
Coal contains methane that formed during the coalification process. Most will have been naturally released from the ground surface before mine development, but mining releases the methane remaining in coal beds into the atmosphere.
3.2.1.1.a. Underground Mines (1.B.1.a.i.)
• Methodology for Estimating Emissions of GHGs -Mining Activities
Emissions from mining activities were drawn from actual measurements obtained from individual coal mines, in accordance with Decision Tree of the Good Practice Guidance (2000) (Page 2.72, Fig. 2.10). (Refer to 1B1-2006.xls for the calculation process.) -Post-Mining Activities
Emissions from post-mining activities were calculated using the Tier 1 method, which uses default emission factors in accordance with Decision Tree of the Good Practice Guidance (2000) (Page 2.73, Fig. 2.11). (Refer to 1B1-2006.xls for the calculation process.)
Emissions were calculated by multiplying the amount of coal mined from coal mines by the
emission factor.
• Emission Factors -Mining Activities
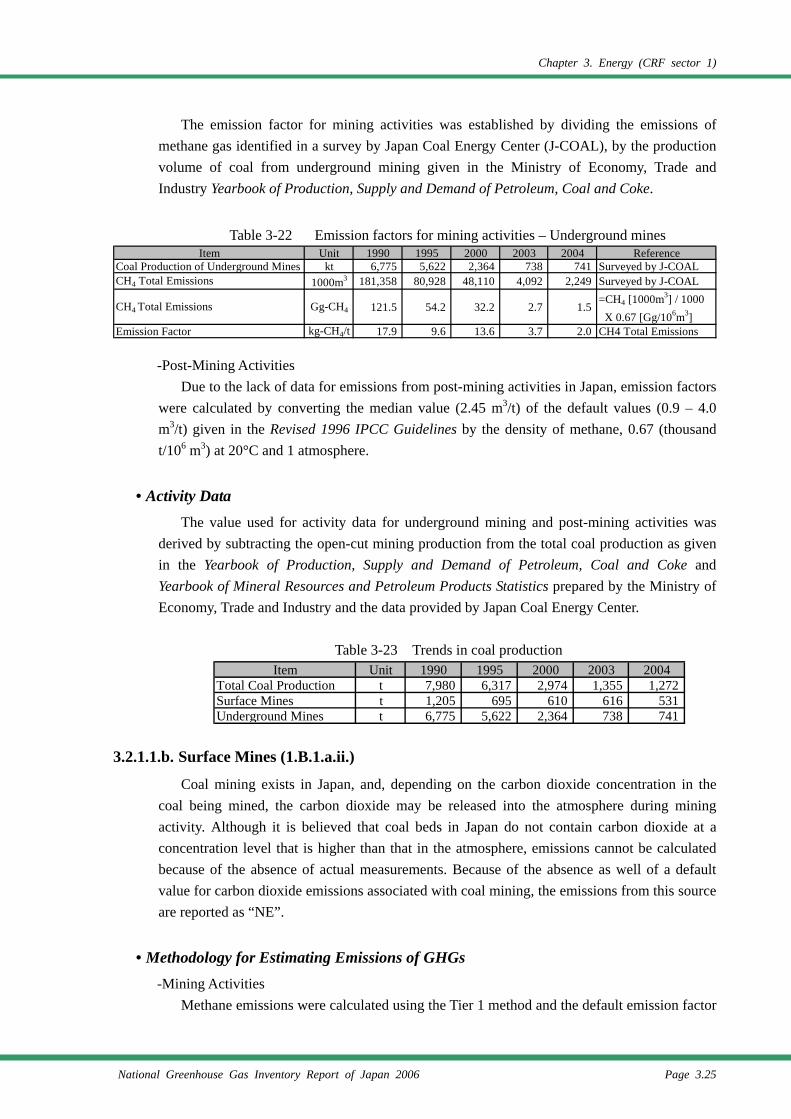
Chapter 3. Energy (CRF sector 1)
National Greenhouse Gas Inventory Report of Japan 2006 Page 3.25
The emission factor for mining activities was established by dividing the emissions of methane gas identified in a survey by Japan Coal Energy Center (J-COAL), by the production volume of coal from underground mining given in the Ministry of Economy, Trade and Industry Yearbook of Production, Supply and Demand of Petroleum, Coal and Coke.
Table 3-22 Emission factors for mining activities – Underground mines
-Post-Mining Activities Due to the lack of data for emissions from post-mining activities in Japan, emission factors
were calculated by converting the median value (2.45 m3/t) of the default values (0.9 – 4.0 m3/t) given in the Revised 1996 IPCC Guidelines by the density of methane, 0.67 (thousand t/106 m3) at 20°C and 1 atmosphere.
• Activity Data The value used for activity data for underground mining and post-mining activities was
derived by subtracting the open-cut mining production from the total coal production as given in the Yearbook of Production, Supply and Demand of Petroleum, Coal and Coke and Yearbook of Mineral Resources and Petroleum Products Statistics prepared by the Ministry of Economy, Trade and Industry and the data provided by Japan Coal Energy Center.
Table 3-23 Trends in coal production
3.2.1.1.b. Surface Mines (1.B.1.a.ii.)
Coal mining exists in Japan, and, depending on the carbon dioxide concentration in the coal being mined, the carbon dioxide may be released into the atmosphere during mining activity. Although it is believed that coal beds in Japan do not contain carbon dioxide at a concentration level that is higher than that in the atmosphere, emissions cannot be calculated because of the absence of actual measurements. Because of the absence as well of a default value for carbon dioxide emissions associated with coal mining, the emissions from this source are reported as “NE”.
• Methodology for Estimating Emissions of GHGs -Mining Activities
Methane emissions were calculated using the Tier 1 method and the default emission factor
Item Unit 1990 1995 2000 2003 2004 ReferenceCoal Production of Underground Mines kt 6,775 5,622 2,364 738 741 Surveyed by J-COALCH4 Total Emissions 1000m3 181,358 80,928 48,110 4,092 2,249 Surveyed by J-COAL
CH4 Total Emissions Gg-CH4 121.5 54.2 32.2 2.7 1.5=CH4 [1000m3] / 1000 X 0.67 [Gg/106m3]
Emission Factor kg-CH4/t 17.9 9.6 13.6 3.7 2.0 CH4 Total Emissions
Item Unit 1990 1995 2000 2003 2004Total Coal Production t 7,980 6,317 2,974 1,355 1,272Surface Mines t 1,205 695 610 616 531Underground Mines t 6,775 5,622 2,364 738 741
Chapter 3. Energy (CRF sector 1)
Page 3.26 National Greenhouse Gas Inventory Report of Japan 2006
in accordance with Decision Tree of the Good Practice Guidance (2000) (Page 2.71, Fig. 2.9). (Refer to 1B1-2006.xls for the calculation process.)
-Post-Mining Activities
Methane emissions were calculated using the Tier 1 method and the default emission factor in accordance with Decision Tree or the Good Practice Guidance (2000) (Page 2.73, Fig. 2.11). (Refer to 1B1-2006.xls for the calculation process.)
Both were calculated by multiplying the amount of coal mined from open-cut mining by the relevant emission factors.
• Emission Factors -Mining Activities
A value (0.77 [kg-CH4/t-coal]) was used as the emission factor for mining activities. It was derived by converting the median (1.15 [m3/t]) of the default values given in the Revised 1996 IPCC Guidelines (0.3–2.0 [m3/t]), using the concentration of methane at one atmospheric pressure and 20°C (0.67 [Gg/106m3]).
-Post-Mining Activities
A value (0.067 [kg-CH4/t-coal]) was used as emission factor for post-mining activities. It was derived by converting the median (0.1 [m3/t]) of the default values given in the Revised 1996 IPCC Guidelines (0–0.2 [m3/t]), using the concentration of methane at one atmospheric pressure and 20°C (0.67 [Gg/106m3]).
• Activity Data The figure for the open-cut production given in the Yearbook of Production, Supply and
Demand of Petroleum, Coal and Coke and the Yearbook of Mineral Resources and Petroleum Products Statistics prepared by the Ministry of Economy, Trade and Industry and the data provided by the Japan Coal Energy Center were used as the activity data for mining and post-mining activities (Table 3-23).
• Completeness Along with the methane emission during coal mining, carbon dioxide may be released to
the atmosphere as emissions from mining, depending on its concentration in coal being mined. Japanese coal strata are not thought to contain build-ups of carbon dioxide in higher concentrations than in the atmosphere, but no actual data is available, making it impossible to calculate emissions at this point in time.
Although a reporting column is provided for carbon dioxide emissions associated with coal mining, in the absence of a default emission factor, emissions from this source were reported as “NE”.
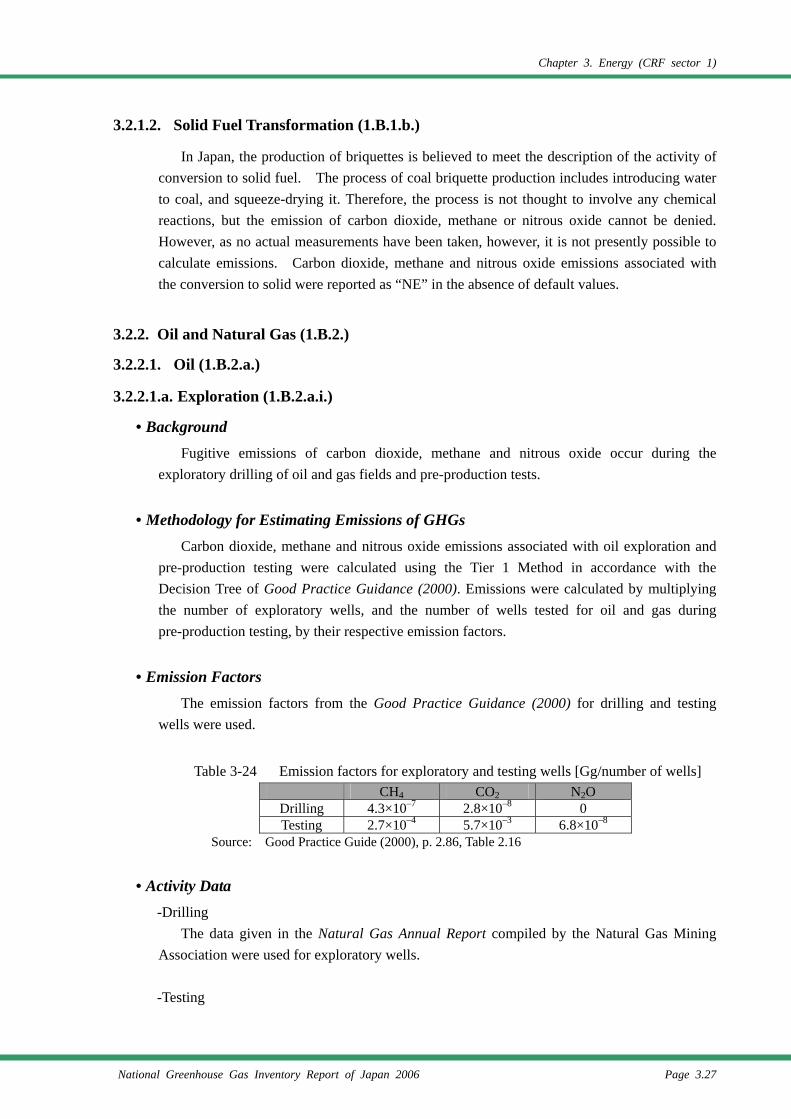
Chapter 3. Energy (CRF sector 1)
National Greenhouse Gas Inventory Report of Japan 2006 Page 3.27
3.2.1.2. Solid Fuel Transformation (1.B.1.b.)
In Japan, the production of briquettes is believed to meet the description of the activity of conversion to solid fuel. The process of coal briquette production includes introducing water to coal, and squeeze-drying it. Therefore, the process is not thought to involve any chemical reactions, but the emission of carbon dioxide, methane or nitrous oxide cannot be denied. However, as no actual measurements have been taken, however, it is not presently possible to calculate emissions. Carbon dioxide, methane and nitrous oxide emissions associated with the conversion to solid were reported as “NE” in the absence of default values.
3.2.2. Oil and Natural Gas (1.B.2.)
3.2.2.1. Oil (1.B.2.a.)
3.2.2.1.a. Exploration (1.B.2.a.i.)
• Background Fugitive emissions of carbon dioxide, methane and nitrous oxide occur during the
exploratory drilling of oil and gas fields and pre-production tests.
• Methodology for Estimating Emissions of GHGs Carbon dioxide, methane and nitrous oxide emissions associated with oil exploration and
pre-production testing were calculated using the Tier 1 Method in accordance with the Decision Tree of Good Practice Guidance (2000). Emissions were calculated by multiplying the number of exploratory wells, and the number of wells tested for oil and gas during pre-production testing, by their respective emission factors.
• Emission Factors The emission factors from the Good Practice Guidance (2000) for drilling and testing
wells were used.
Table 3-24 Emission factors for exploratory and testing wells [Gg/number of wells] CH4 CO2 N2O
Drilling 4.3×10⁻⁷ 2.8×10⁻⁸ 0 Testing 2.7×10⁻⁴ 5.7×10⁻³ 6.8×10⁻⁸
Source: Good Practice Guide (2000), p. 2.86, Table 2.16
• Activity Data -Drilling
The data given in the Natural Gas Annual Report compiled by the Natural Gas Mining Association were used for exploratory wells.
-Testing
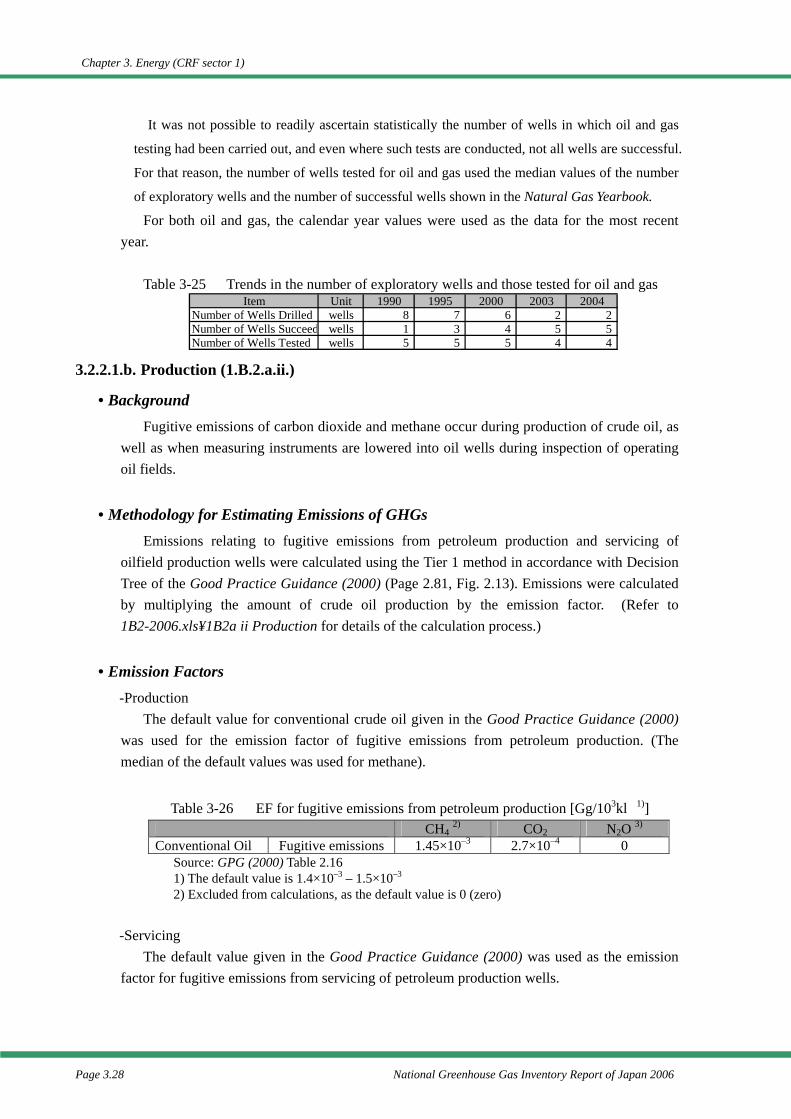
Chapter 3. Energy (CRF sector 1)
Page 3.28 National Greenhouse Gas Inventory Report of Japan 2006
It was not possible to readily ascertain statistically the number of wells in which oil and gas
testing had been carried out, and even where such tests are conducted, not all wells are successful.
For that reason, the number of wells tested for oil and gas used the median values of the number
of exploratory wells and the number of successful wells shown in the Natural Gas Yearbook.
For both oil and gas, the calendar year values were used as the data for the most recent year.
Table 3-25 Trends in the number of exploratory wells and those tested for oil and gas
3.2.2.1.b. Production (1.B.2.a.ii.)
• Background Fugitive emissions of carbon dioxide and methane occur during production of crude oil, as
well as when measuring instruments are lowered into oil wells during inspection of operating oil fields.
• Methodology for Estimating Emissions of GHGs Emissions relating to fugitive emissions from petroleum production and servicing of
oilfield production wells were calculated using the Tier 1 method in accordance with Decision Tree of the Good Practice Guidance (2000) (Page 2.81, Fig. 2.13). Emissions were calculated by multiplying the amount of crude oil production by the emission factor. (Refer to 1B2-2006.xls¥1B2a ii Production for details of the calculation process.)
• Emission Factors -Production
The default value for conventional crude oil given in the Good Practice Guidance (2000) was used for the emission factor of fugitive emissions from petroleum production. (The median of the default values was used for methane).
Table 3-26 EF for fugitive emissions from petroleum production [Gg/103kl 1)] CH4 2) CO2 N2O 3) Conventional Oil Fugitive emissions 1.45×10⁻³ 2.7×10⁻⁴ 0
Source: GPG (2000) Table 2.16 1) The default value is 1.4×10⁻³ – 1.5×10⁻³ 2) Excluded from calculations, as the default value is 0 (zero)
-Servicing
The default value given in the Good Practice Guidance (2000) was used as the emission factor for fugitive emissions from servicing of petroleum production wells.
Item Unit 1990 1995 2000 2003 2004Number of Wells Drilled wells 8 7 6 2 2Number of Wells Succeed wells 1 3 4 5 5Number of Wells Tested wells 5 5 5 4 4
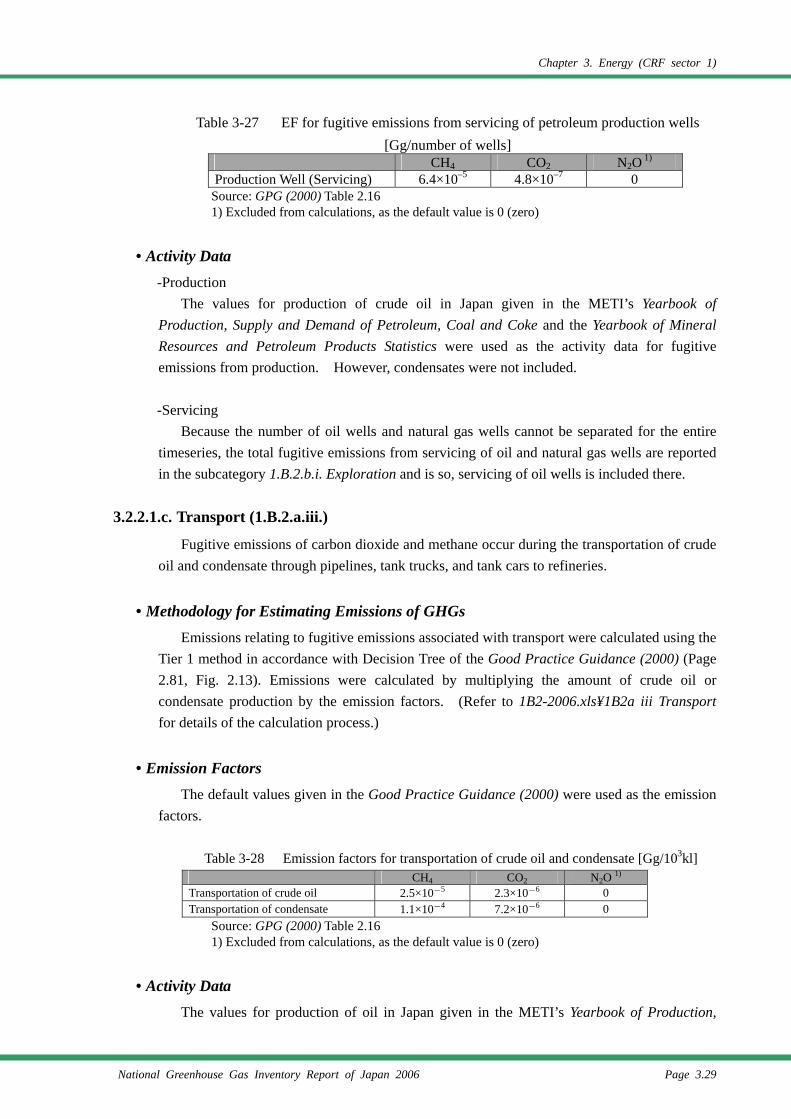
Chapter 3. Energy (CRF sector 1)
National Greenhouse Gas Inventory Report of Japan 2006 Page 3.29
Table 3-27 EF for fugitive emissions from servicing of petroleum production wells [Gg/number of wells]
CH4 CO2 N2O 1) Production Well (Servicing) 6.4×10⁻⁵ 4.8×10⁻⁷ 0
Source: GPG (2000) Table 2.16 1) Excluded from calculations, as the default value is 0 (zero)
• Activity Data -Production
The values for production of crude oil in Japan given in the METI’s Yearbook of Production, Supply and Demand of Petroleum, Coal and Coke and the Yearbook of Mineral Resources and Petroleum Products Statistics were used as the activity data for fugitive emissions from production. However, condensates were not included.
-Servicing
Because the number of oil wells and natural gas wells cannot be separated for the entire timeseries, the total fugitive emissions from servicing of oil and natural gas wells are reported in the subcategory 1.B.2.b.i. Exploration and is so, servicing of oil wells is included there.
3.2.2.1.c. Transport (1.B.2.a.iii.)
Fugitive emissions of carbon dioxide and methane occur during the transportation of crude oil and condensate through pipelines, tank trucks, and tank cars to refineries.
• Methodology for Estimating Emissions of GHGs Emissions relating to fugitive emissions associated with transport were calculated using the
Tier 1 method in accordance with Decision Tree of the Good Practice Guidance (2000) (Page 2.81, Fig. 2.13). Emissions were calculated by multiplying the amount of crude oil or condensate production by the emission factors. (Refer to 1B2-2006.xls¥1B2a iii Transport for details of the calculation process.)
• Emission Factors The default values given in the Good Practice Guidance (2000) were used as the emission
factors.
Table 3-28 Emission factors for transportation of crude oil and condensate [Gg/103kl] CH4 CO2 N2O 1)
Transportation of crude oil 2.5×10⁻⁵ 2.3×10⁻⁶ 0 Transportation of condensate 1.1×10⁻⁴ 7.2×10⁻⁶ 0
Source: GPG (2000) Table 2.16 1) Excluded from calculations, as the default value is 0 (zero)
• Activity Data The values for production of oil in Japan given in the METI’s Yearbook of Production,
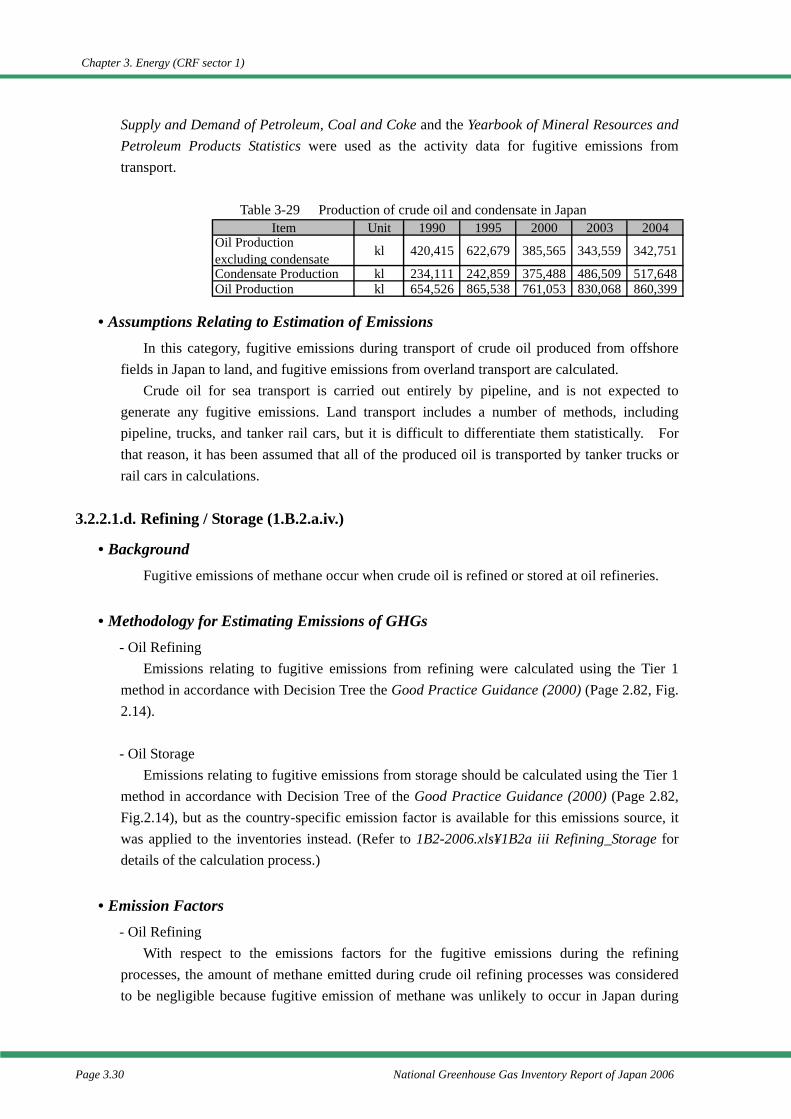
Chapter 3. Energy (CRF sector 1)
Page 3.30 National Greenhouse Gas Inventory Report of Japan 2006
Supply and Demand of Petroleum, Coal and Coke and the Yearbook of Mineral Resources and Petroleum Products Statistics were used as the activity data for fugitive emissions from transport.
Table 3-29 Production of crude oil and condensate in Japan
• Assumptions Relating to Estimation of Emissions In this category, fugitive emissions during transport of crude oil produced from offshore
fields in Japan to land, and fugitive emissions from overland transport are calculated. Crude oil for sea transport is carried out entirely by pipeline, and is not expected to
generate any fugitive emissions. Land transport includes a number of methods, including pipeline, trucks, and tanker rail cars, but it is difficult to differentiate them statistically. For that reason, it has been assumed that all of the produced oil is transported by tanker trucks or rail cars in calculations.
3.2.2.1.d. Refining / Storage (1.B.2.a.iv.)
• Background Fugitive emissions of methane occur when crude oil is refined or stored at oil refineries.
• Methodology for Estimating Emissions of GHGs - Oil Refining
Emissions relating to fugitive emissions from refining were calculated using the Tier 1 method in accordance with Decision Tree the Good Practice Guidance (2000) (Page 2.82, Fig. 2.14).
- Oil Storage
Emissions relating to fugitive emissions from storage should be calculated using the Tier 1 method in accordance with Decision Tree of the Good Practice Guidance (2000) (Page 2.82, Fig.2.14), but as the country-specific emission factor is available for this emissions source, it was applied to the inventories instead. (Refer to 1B2-2006.xls¥1B2a iii Refining_Storage for details of the calculation process.)
• Emission Factors - Oil Refining
With respect to the emissions factors for the fugitive emissions during the refining processes, the amount of methane emitted during crude oil refining processes was considered to be negligible because fugitive emission of methane was unlikely to occur in Japan during
Item Unit 1990 1995 2000 2003 2004Oil Productionexcluding condensate kl 420,415 622,679 385,565 343,559 342,751
Condensate Production kl 234,111 242,859 375,488 486,509 517,648Oil Production kl 654,526 865,538 761,053 830,068 860,399
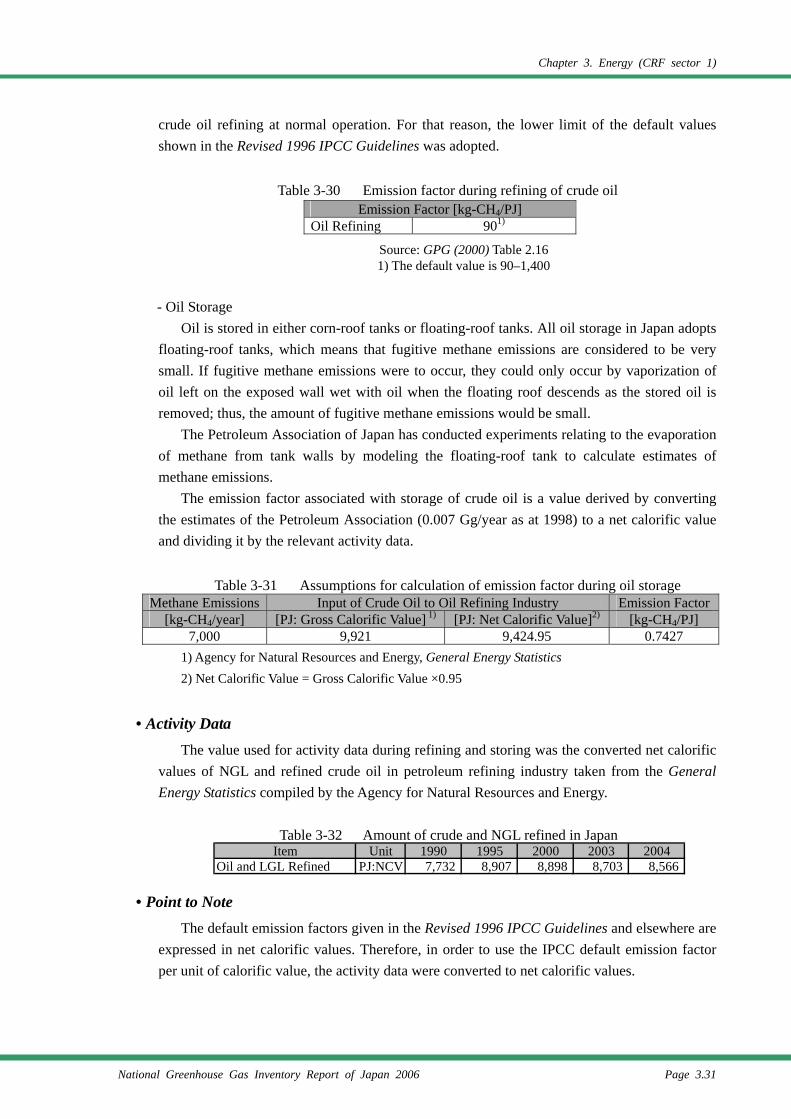
Chapter 3. Energy (CRF sector 1)
National Greenhouse Gas Inventory Report of Japan 2006 Page 3.31
crude oil refining at normal operation. For that reason, the lower limit of the default values shown in the Revised 1996 IPCC Guidelines was adopted.
Table 3-30 Emission factor during refining of crude oil
Source: GPG (2000) Table 2.16 1) The default value is 90–1,400
- Oil Storage
Oil is stored in either corn-roof tanks or floating-roof tanks. All oil storage in Japan adopts floating-roof tanks, which means that fugitive methane emissions are considered to be very small. If fugitive methane emissions were to occur, they could only occur by vaporization of oil left on the exposed wall wet with oil when the floating roof descends as the stored oil is removed; thus, the amount of fugitive methane emissions would be small.
The Petroleum Association of Japan has conducted experiments relating to the evaporation of methane from tank walls by modeling the floating-roof tank to calculate estimates of methane emissions.
The emission factor associated with storage of crude oil is a value derived by converting the estimates of the Petroleum Association (0.007 Gg/year as at 1998) to a net calorific value and dividing it by the relevant activity data.
Table 3-31 Assumptions for calculation of emission factor during oil storage
Methane Emissions Input of Crude Oil to Oil Refining Industry Emission Factor[kg-CH4/year] [PJ: Gross Calorific Value] 1) [PJ: Net Calorific Value]2) [kg-CH4/PJ]
7,000 9,921 9,424.95 0.7427 1) Agency for Natural Resources and Energy, General Energy Statistics 2) Net Calorific Value = Gross Calorific Value ×0.95
• Activity Data The value used for activity data during refining and storing was the converted net calorific
values of NGL and refined crude oil in petroleum refining industry taken from the General Energy Statistics compiled by the Agency for Natural Resources and Energy.
Table 3-32 Amount of crude and NGL refined in Japan
• Point to Note The default emission factors given in the Revised 1996 IPCC Guidelines and elsewhere are
expressed in net calorific values. Therefore, in order to use the IPCC default emission factor per unit of calorific value, the activity data were converted to net calorific values.
Emission Factor [kg-CH4/PJ] Oil Refining 901)
Item Unit 1990 1995 2000 2003 2004Oil and LGL Refined PJ:NCV 7,732 8,907 8,898 8,703 8,566
Chapter 3. Energy (CRF sector 1)
Page 3.32 National Greenhouse Gas Inventory Report of Japan 2006
• Completeness Oil and NGL are refined and stored in Japan, and where carbon dioxide is dissolved in
crude oil, it is conceivable that it will be emitted as a result of the relevant activity. The level of carbon dioxide emitted by the activity is probably negligible, but because there are no examples of measurement of the carbon dioxide content in crude oil, it is not currently possible to calculate emissions. Emissions were reported as “NE” in the absence of the default emission factors.
3.2.2.1.e. Distribution of Oil Products (1.B.2.a.v.)
Petroleum products are distributed in Japan, and where carbon dioxide and methane are dissolved, it is conceivable that either or both will be emitted as a result of the relevant activity. The level of carbon dioxide or methane emitted by the activity is probably negligible, in light of the composition of the petroleum products, but because there are no examples of measurement of the carbon dioxide or methane content of petroleum products, it is not currently possible to calculate emissions. Emissions were reported as “NE” in the absence of the default emission factors.
3.2.2.2. Natural Gas (1.B.2.b.)
3.2.2.2.a. Exploration (1.B.2.b.i.)
There is test drillings of oil and gas fields in Japan, and it is conceivable that the activity could give rise to emissions of carbon dioxide, methane, or nitrous oxide. It is difficult, however, to distinguish between oilfields and gas fields prior to test drilling, Emissions were reported as “IE” because the calculation was combined with the subcategory of 1.B.2.a.i. Fugitive Emissions Associated with Oil Exploration.
3.2.2.2.b. Production / Processing (1.B.2.b.ii.)
• Background Fugitive emissions of carbon dioxide and methane occur during the production and
conditioning process of natural gas, as well as when measuring instruments are lowered into wells during the inspection of operating gas wells.
• Methodology for Estimating Emissions of GHGs Fugitive emissions of the production of natural gas and processing of natural gas, such as
adjusting its constituent elements, and servicing natural gas production wells was calculated using the Tier 1 method, and in accordance with Decision Tree of the Good Practice Guidance (2000) (Page 2.80, Fig. 2.12) (Refer to 1B2-2006.xls¥1B2b i Production_Processing for detail on the calculation process.).
Fugitive emissions during natural gas production and conditioning processes were estimated by multiplying the amount of natural gas production by their respective emission factors. Fugitive emissions during gas field inspections were calculated by multiplying the
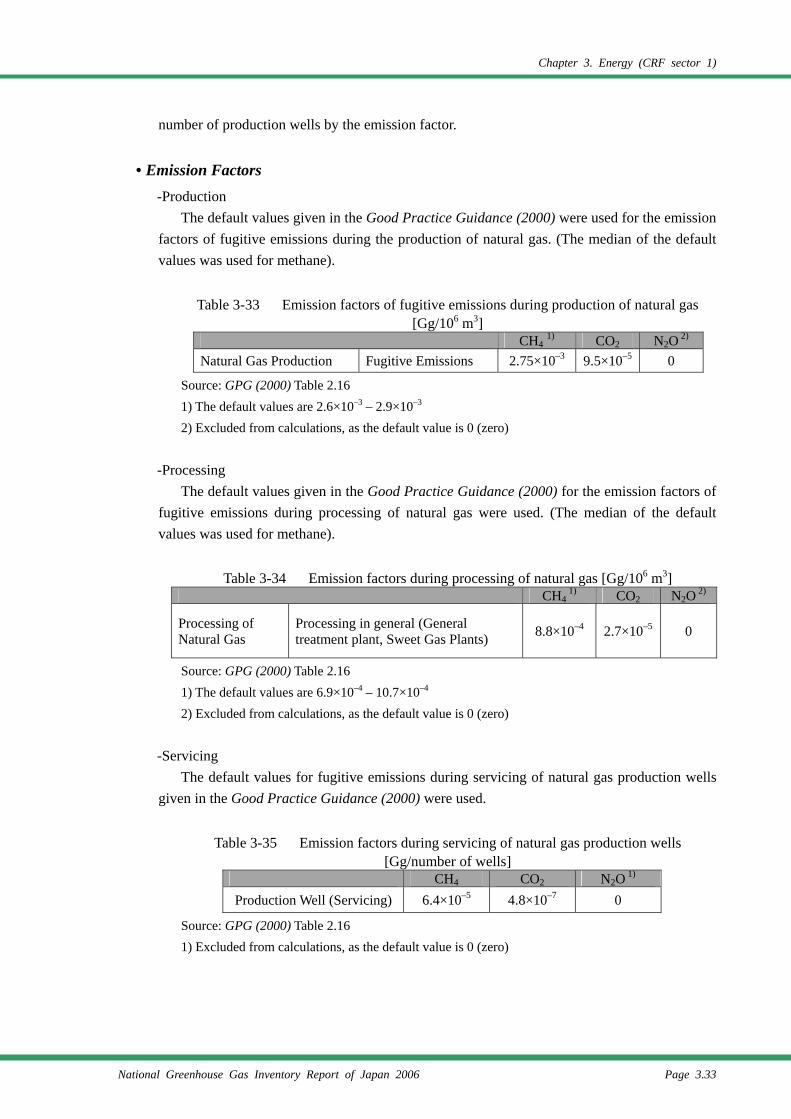
Chapter 3. Energy (CRF sector 1)
National Greenhouse Gas Inventory Report of Japan 2006 Page 3.33
number of production wells by the emission factor.
• Emission Factors -Production
The default values given in the Good Practice Guidance (2000) were used for the emission factors of fugitive emissions during the production of natural gas. (The median of the default values was used for methane).
Table 3-33 Emission factors of fugitive emissions during production of natural gas
[Gg/106 m3] CH4 1) CO2 N2O 2) Natural Gas Production Fugitive Emissions 2.75×10⁻³ 9.5×10⁻⁵ 0
Source: GPG (2000) Table 2.16 1) The default values are 2.6×10⁻³ – 2.9×10⁻³ 2) Excluded from calculations, as the default value is 0 (zero)
-Processing The default values given in the Good Practice Guidance (2000) for the emission factors of
fugitive emissions during processing of natural gas were used. (The median of the default values was used for methane).
Table 3-34 Emission factors during processing of natural gas [Gg/106 m3]
CH4 1) CO2 N2O 2)
Processing of Natural Gas
Processing in general (General treatment plant, Sweet Gas Plants) 8.8×10⁻⁴ 2.7×10⁻⁵ 0
Source: GPG (2000) Table 2.16 1) The default values are 6.9×10⁻⁴ – 10.7×10⁻⁴ 2) Excluded from calculations, as the default value is 0 (zero)
-Servicing The default values for fugitive emissions during servicing of natural gas production wells
given in the Good Practice Guidance (2000) were used.
Table 3-35 Emission factors during servicing of natural gas production wells [Gg/number of wells]
CH4 CO2 N2O 1) Production Well (Servicing) 6.4×10⁻⁵ 4.8×10⁻⁷ 0
Source: GPG (2000) Table 2.16 1) Excluded from calculations, as the default value is 0 (zero)
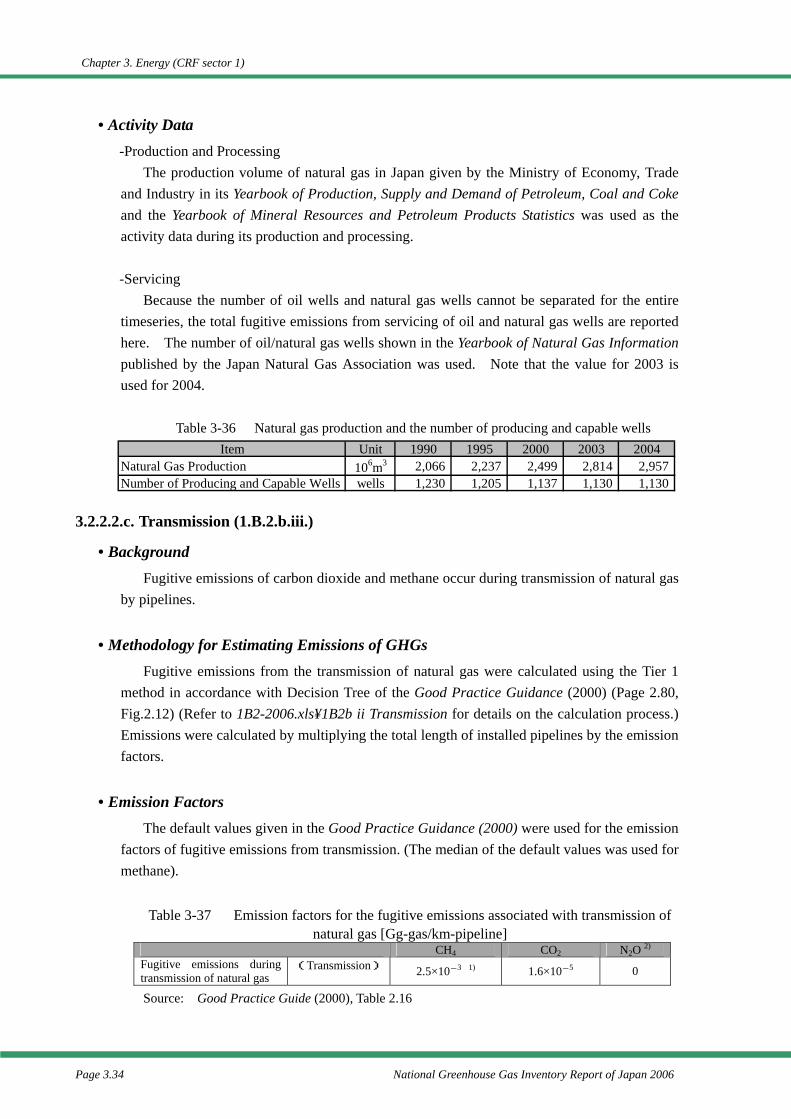
Chapter 3. Energy (CRF sector 1)
Page 3.34 National Greenhouse Gas Inventory Report of Japan 2006
• Activity Data -Production and Processing
The production volume of natural gas in Japan given by the Ministry of Economy, Trade and Industry in its Yearbook of Production, Supply and Demand of Petroleum, Coal and Coke and the Yearbook of Mineral Resources and Petroleum Products Statistics was used as the activity data during its production and processing.
-Servicing
Because the number of oil wells and natural gas wells cannot be separated for the entire timeseries, the total fugitive emissions from servicing of oil and natural gas wells are reported here. The number of oil/natural gas wells shown in the Yearbook of Natural Gas Information published by the Japan Natural Gas Association was used. Note that the value for 2003 is used for 2004.
Table 3-36 Natural gas production and the number of producing and capable wells
3.2.2.2.c. Transmission (1.B.2.b.iii.)
• Background Fugitive emissions of carbon dioxide and methane occur during transmission of natural gas
by pipelines.
• Methodology for Estimating Emissions of GHGs Fugitive emissions from the transmission of natural gas were calculated using the Tier 1
method in accordance with Decision Tree of the Good Practice Guidance (2000) (Page 2.80, Fig.2.12) (Refer to 1B2-2006.xls¥1B2b ii Transmission for details on the calculation process.) Emissions were calculated by multiplying the total length of installed pipelines by the emission factors.
• Emission Factors The default values given in the Good Practice Guidance (2000) were used for the emission
factors of fugitive emissions from transmission. (The median of the default values was used for methane).
Table 3-37 Emission factors for the fugitive emissions associated with transmission of
natural gas [Gg-gas/km-pipeline] CH4 CO2 N2O 2)
Fugitive emissions during transmission of natural gas
(Transmission) 2.5×10⁻³ 1) 1.6×10⁻⁵ 0
Source: Good Practice Guide (2000), Table 2.16
Item Unit 1990 1995 2000 2003 2004Natural Gas Production 106m3 2,066 2,237 2,499 2,814 2,957Number of Producing and Capable Wells wells 1,230 1,205 1,137 1,130 1,130
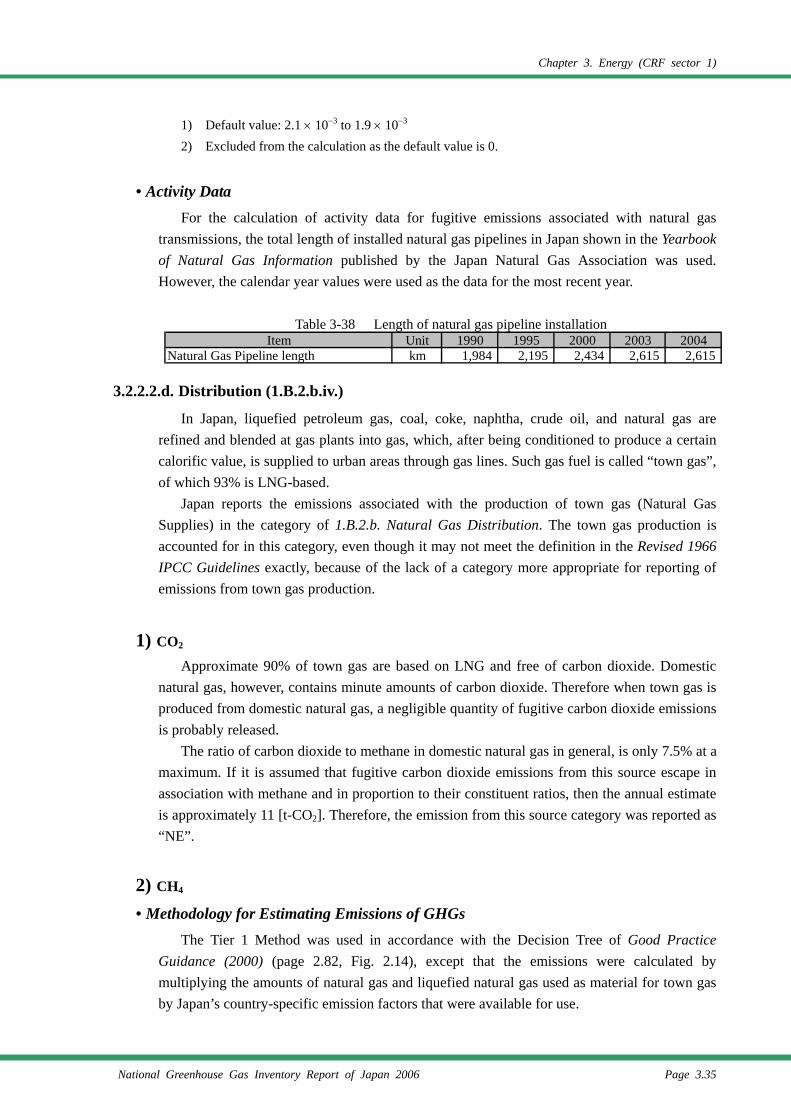
Chapter 3. Energy (CRF sector 1)
National Greenhouse Gas Inventory Report of Japan 2006 Page 3.35
1) Default value: 2.1 × 10⁻³ to 1.9 × 10⁻³ 2) Excluded from the calculation as the default value is 0.
• Activity Data For the calculation of activity data for fugitive emissions associated with natural gas
transmissions, the total length of installed natural gas pipelines in Japan shown in the Yearbook of Natural Gas Information published by the Japan Natural Gas Association was used. However, the calendar year values were used as the data for the most recent year.
Table 3-38 Length of natural gas pipeline installation
3.2.2.2.d. Distribution (1.B.2.b.iv.)
In Japan, liquefied petroleum gas, coal, coke, naphtha, crude oil, and natural gas are refined and blended at gas plants into gas, which, after being conditioned to produce a certain calorific value, is supplied to urban areas through gas lines. Such gas fuel is called “town gas”, of which 93% is LNG-based.
Japan reports the emissions associated with the production of town gas (Natural Gas Supplies) in the category of 1.B.2.b. Natural Gas Distribution. The town gas production is accounted for in this category, even though it may not meet the definition in the Revised 1966 IPCC Guidelines exactly, because of the lack of a category more appropriate for reporting of emissions from town gas production.
1) CO2 Approximate 90% of town gas are based on LNG and free of carbon dioxide. Domestic
natural gas, however, contains minute amounts of carbon dioxide. Therefore when town gas is produced from domestic natural gas, a negligible quantity of fugitive carbon dioxide emissions is probably released.
The ratio of carbon dioxide to methane in domestic natural gas in general, is only 7.5% at a maximum. If it is assumed that fugitive carbon dioxide emissions from this source escape in association with methane and in proportion to their constituent ratios, then the annual estimate is approximately 11 [t-CO2]. Therefore, the emission from this source category was reported as “NE”.
2) CH4
• Methodology for Estimating Emissions of GHGs The Tier 1 Method was used in accordance with the Decision Tree of Good Practice
Guidance (2000) (page 2.82, Fig. 2.14), except that the emissions were calculated by multiplying the amounts of natural gas and liquefied natural gas used as material for town gas by Japan’s country-specific emission factors that were available for use.
Item Unit 1990 1995 2000 2003 2004Natural Gas Pipeline length km 1,984 2,195 2,434 2,615 2,615
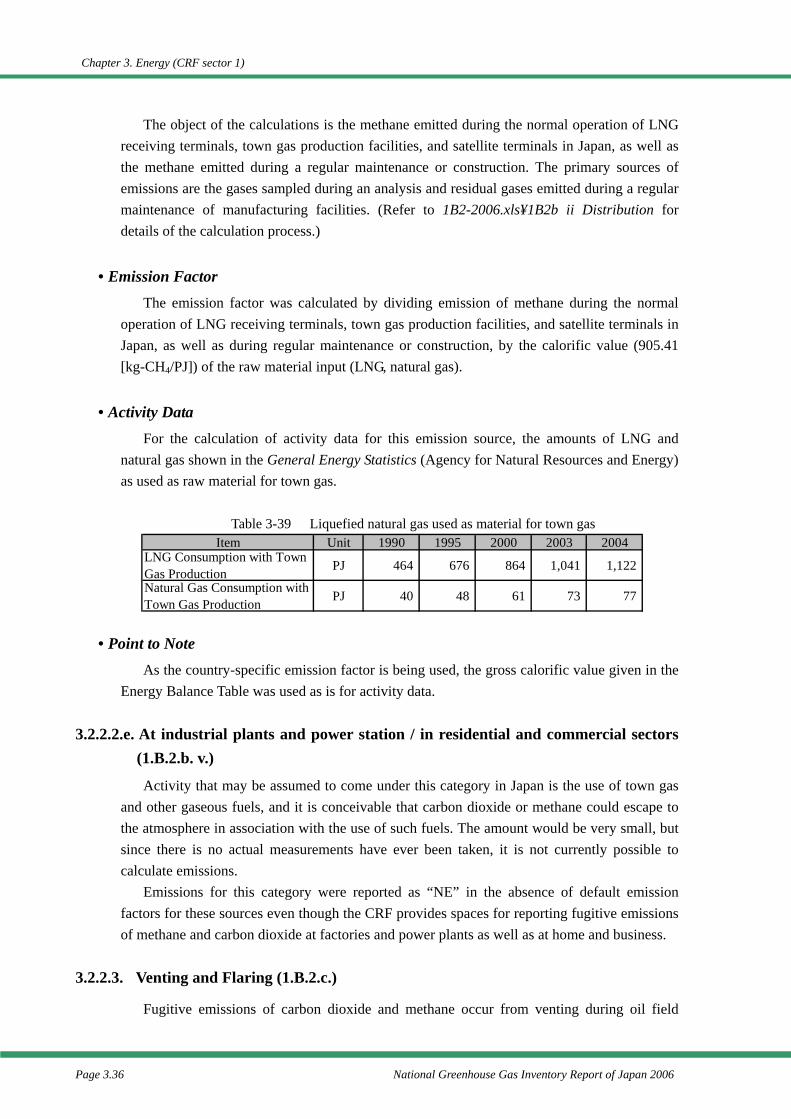
Chapter 3. Energy (CRF sector 1)
Page 3.36 National Greenhouse Gas Inventory Report of Japan 2006
The object of the calculations is the methane emitted during the normal operation of LNG receiving terminals, town gas production facilities, and satellite terminals in Japan, as well as the methane emitted during a regular maintenance or construction. The primary sources of emissions are the gases sampled during an analysis and residual gases emitted during a regular maintenance of manufacturing facilities. (Refer to 1B2-2006.xls¥1B2b ii Distribution for details of the calculation process.)
• Emission Factor The emission factor was calculated by dividing emission of methane during the normal
operation of LNG receiving terminals, town gas production facilities, and satellite terminals in Japan, as well as during regular maintenance or construction, by the calorific value (905.41 [kg-CH4/PJ]) of the raw material input (LNG, natural gas).
• Activity Data For the calculation of activity data for this emission source, the amounts of LNG and
natural gas shown in the General Energy Statistics (Agency for Natural Resources and Energy) as used as raw material for town gas.
Table 3-39 Liquefied natural gas used as material for town gas
• Point to Note As the country-specific emission factor is being used, the gross calorific value given in the
Energy Balance Table was used as is for activity data.
3.2.2.2.e. At industrial plants and power station / in residential and commercial sectors (1.B.2.b. v.)
Activity that may be assumed to come under this category in Japan is the use of town gas and other gaseous fuels, and it is conceivable that carbon dioxide or methane could escape to the atmosphere in association with the use of such fuels. The amount would be very small, but since there is no actual measurements have ever been taken, it is not currently possible to calculate emissions.
Emissions for this category were reported as “NE” in the absence of default emission factors for these sources even though the CRF provides spaces for reporting fugitive emissions of methane and carbon dioxide at factories and power plants as well as at home and business.
3.2.2.3. Venting and Flaring (1.B.2.c.)
Fugitive emissions of carbon dioxide and methane occur from venting during oil field
Item Unit 1990 1995 2000 2003 2004LNG Consumption with TownGas Production PJ 464 676 864 1,041 1,122
Natural Gas Consumption withTown Gas Production PJ 40 48 61 73 77
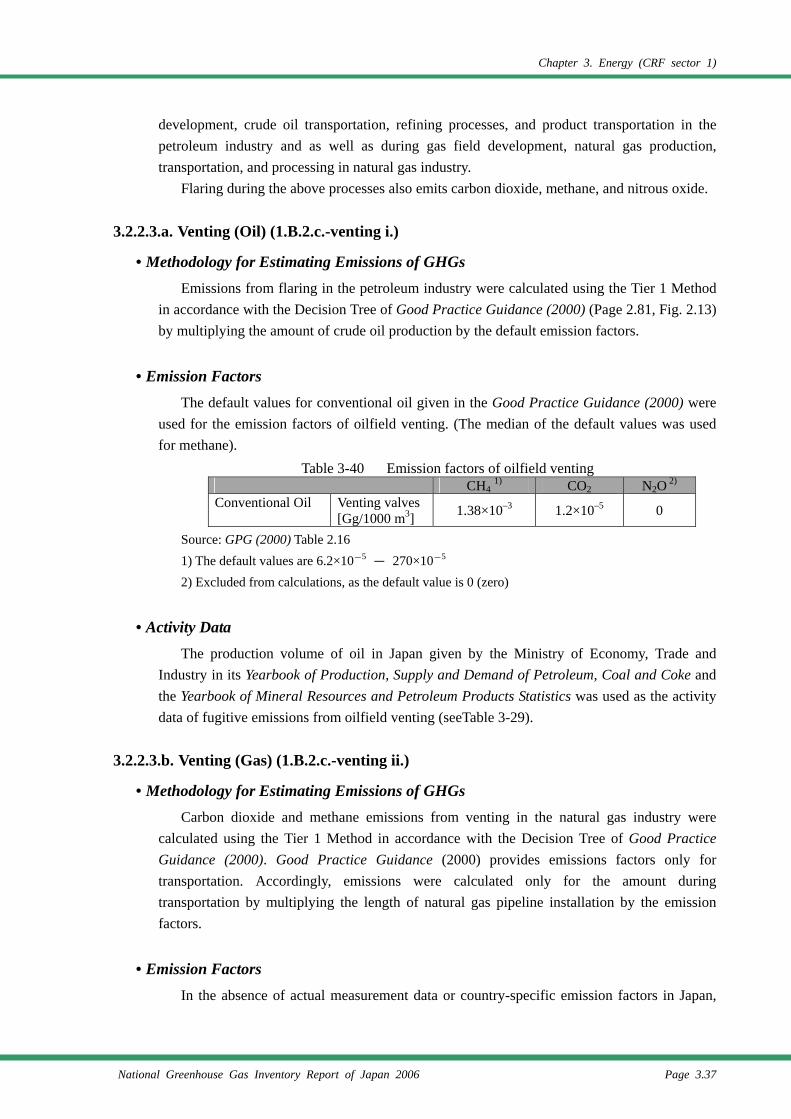
Chapter 3. Energy (CRF sector 1)
National Greenhouse Gas Inventory Report of Japan 2006 Page 3.37
development, crude oil transportation, refining processes, and product transportation in the petroleum industry and as well as during gas field development, natural gas production, transportation, and processing in natural gas industry.
Flaring during the above processes also emits carbon dioxide, methane, and nitrous oxide.
3.2.2.3.a. Venting (Oil) (1.B.2.c.-venting i.)
• Methodology for Estimating Emissions of GHGs Emissions from flaring in the petroleum industry were calculated using the Tier 1 Method
in accordance with the Decision Tree of Good Practice Guidance (2000) (Page 2.81, Fig. 2.13) by multiplying the amount of crude oil production by the default emission factors.
• Emission Factors The default values for conventional oil given in the Good Practice Guidance (2000) were
used for the emission factors of oilfield venting. (The median of the default values was used for methane).
Table 3-40 Emission factors of oilfield venting CH4 1) CO2 N2O 2) Conventional Oil Venting valves
[Gg/1000 m3] 1.38×10⁻³ 1.2×10⁻⁵ 0
Source: GPG (2000) Table 2.16 1) The default values are 6.2×10⁻⁵ - 270×10-5 2) Excluded from calculations, as the default value is 0 (zero)
• Activity Data The production volume of oil in Japan given by the Ministry of Economy, Trade and
Industry in its Yearbook of Production, Supply and Demand of Petroleum, Coal and Coke and the Yearbook of Mineral Resources and Petroleum Products Statistics was used as the activity data of fugitive emissions from oilfield venting (seeTable 3-29).
3.2.2.3.b. Venting (Gas) (1.B.2.c.-venting ii.)
• Methodology for Estimating Emissions of GHGs Carbon dioxide and methane emissions from venting in the natural gas industry were
calculated using the Tier 1 Method in accordance with the Decision Tree of Good Practice Guidance (2000). Good Practice Guidance (2000) provides emissions factors only for transportation. Accordingly, emissions were calculated only for the amount during transportation by multiplying the length of natural gas pipeline installation by the emission factors.
• Emission Factors In the absence of actual measurement data or country-specific emission factors in Japan,
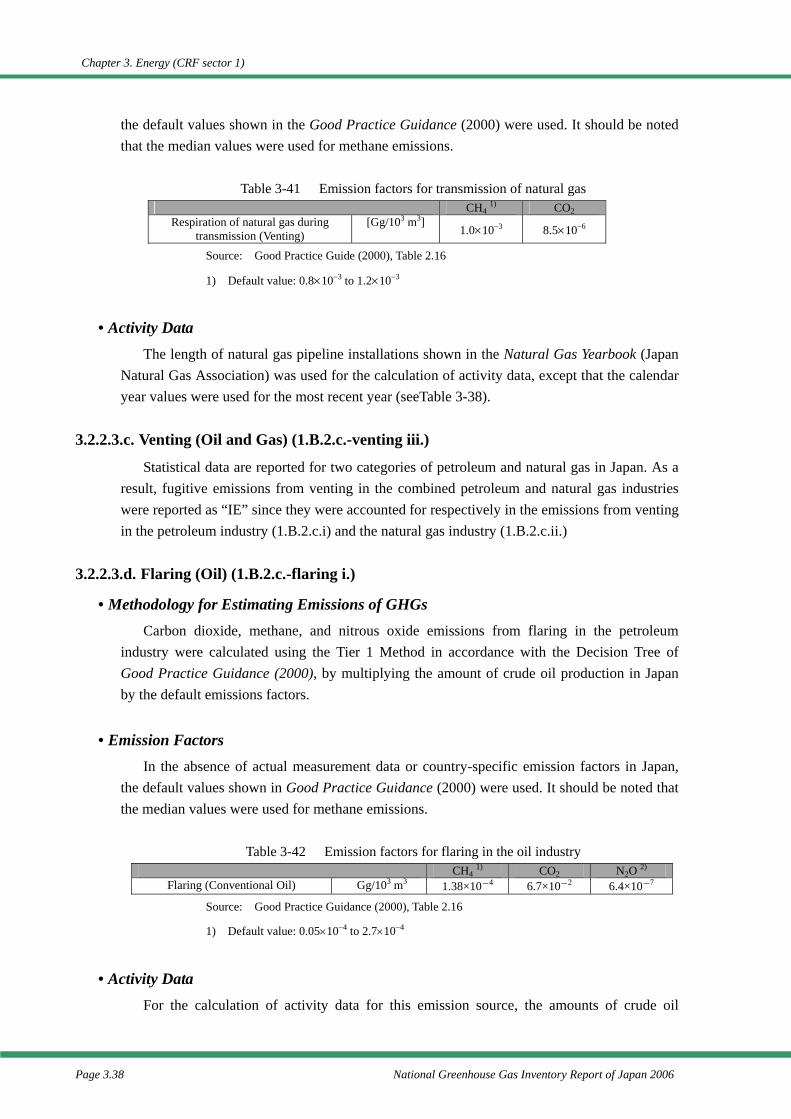
Chapter 3. Energy (CRF sector 1)
Page 3.38 National Greenhouse Gas Inventory Report of Japan 2006
the default values shown in the Good Practice Guidance (2000) were used. It should be noted that the median values were used for methane emissions.
Table 3-41 Emission factors for transmission of natural gas
CH4 1) CO2 Respiration of natural gas during
transmission (Venting) [Gg/103 m3]
1.0×10⁻³ 8.5×10⁻⁶
Source: Good Practice Guide (2000), Table 2.16
1) Default value: 0.8×10⁻³ to 1.2×10⁻³
• Activity Data The length of natural gas pipeline installations shown in the Natural Gas Yearbook (Japan
Natural Gas Association) was used for the calculation of activity data, except that the calendar year values were used for the most recent year (seeTable 3-38).
3.2.2.3.c. Venting (Oil and Gas) (1.B.2.c.-venting iii.)
Statistical data are reported for two categories of petroleum and natural gas in Japan. As a result, fugitive emissions from venting in the combined petroleum and natural gas industries were reported as “IE” since they were accounted for respectively in the emissions from venting in the petroleum industry (1.B.2.c.i) and the natural gas industry (1.B.2.c.ii.)
3.2.2.3.d. Flaring (Oil) (1.B.2.c.-flaring i.)
• Methodology for Estimating Emissions of GHGs Carbon dioxide, methane, and nitrous oxide emissions from flaring in the petroleum
industry were calculated using the Tier 1 Method in accordance with the Decision Tree of Good Practice Guidance (2000), by multiplying the amount of crude oil production in Japan by the default emissions factors.
• Emission Factors In the absence of actual measurement data or country-specific emission factors in Japan,
the default values shown in Good Practice Guidance (2000) were used. It should be noted that the median values were used for methane emissions.
Table 3-42 Emission factors for flaring in the oil industry
CH4 1) CO2 N2O 2) Flaring (Conventional Oil) Gg/103 m3 1.38×10⁻⁴ 6.7×10⁻² 6.4×10⁻⁷
Source: Good Practice Guidance (2000), Table 2.16
1) Default value: 0.05×10⁻⁴ to 2.7×10⁻⁴
• Activity Data For the calculation of activity data for this emission source, the amounts of crude oil
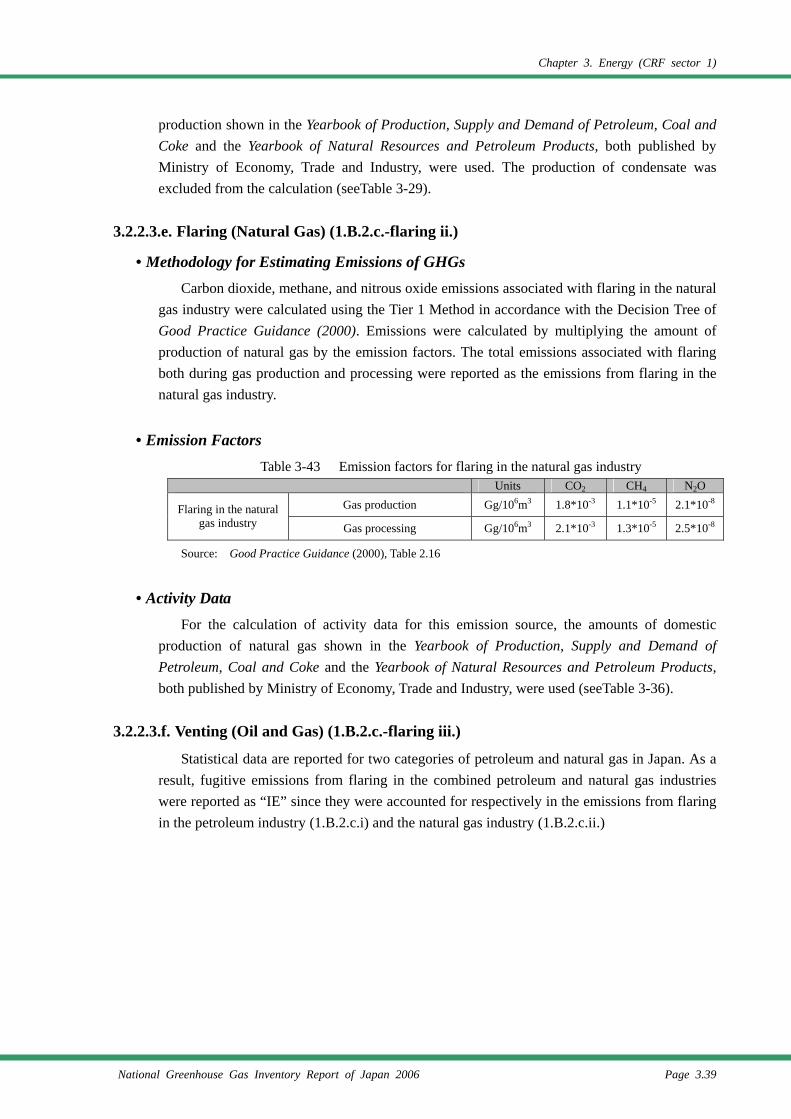
Chapter 3. Energy (CRF sector 1)
National Greenhouse Gas Inventory Report of Japan 2006 Page 3.39
production shown in the Yearbook of Production, Supply and Demand of Petroleum, Coal and Coke and the Yearbook of Natural Resources and Petroleum Products, both published by Ministry of Economy, Trade and Industry, were used. The production of condensate was excluded from the calculation (seeTable 3-29).
3.2.2.3.e. Flaring (Natural Gas) (1.B.2.c.-flaring ii.)
• Methodology for Estimating Emissions of GHGs Carbon dioxide, methane, and nitrous oxide emissions associated with flaring in the natural
gas industry were calculated using the Tier 1 Method in accordance with the Decision Tree of Good Practice Guidance (2000). Emissions were calculated by multiplying the amount of production of natural gas by the emission factors. The total emissions associated with flaring both during gas production and processing were reported as the emissions from flaring in the natural gas industry.
• Emission Factors Table 3-43 Emission factors for flaring in the natural gas industry
Units CO2 CH4 N2O Gas production Gg/106m3 1.8*10-3 1.1*10-5 2.1*10-8
Flaring in the natural gas industry Gas processing Gg/106m3 2.1*10-3 1.3*10-5 2.5*10-8
Source: Good Practice Guidance (2000), Table 2.16
• Activity Data For the calculation of activity data for this emission source, the amounts of domestic
production of natural gas shown in the Yearbook of Production, Supply and Demand of Petroleum, Coal and Coke and the Yearbook of Natural Resources and Petroleum Products, both published by Ministry of Economy, Trade and Industry, were used (seeTable 3-36).
3.2.2.3.f. Venting (Oil and Gas) (1.B.2.c.-flaring iii.)
Statistical data are reported for two categories of petroleum and natural gas in Japan. As a result, fugitive emissions from flaring in the combined petroleum and natural gas industries were reported as “IE” since they were accounted for respectively in the emissions from flaring in the petroleum industry (1.B.2.c.i) and the natural gas industry (1.B.2.c.ii.)
Chapter 3. Energy (CRF sector 1)
Page 3.40 National Greenhouse Gas Inventory Report of Japan 2006
References IPCC, Revised 1996 IPCC Guidelines for National Greenhouse Gas Inventories, 1997 IPCC, Good Practice Guidance and Uncertainty Management in National Greenhouse Gas
Inventories, 2000 UNFCCC “UNFCCC Reporting Guidelines on Annual Inventories” (FCCC/SBSTA/2004/8) Agency for Natural Resources and Energy, General Energy Statistics Ministry of the Environment, Research of Air Pollutant Emissions from Stationary Sources (MAP
Survey) Environmental Agency, The Estimation of CO2 Emissions in Japan, 1992 Environmental Agency Committee for the Greenhouse Gases Emissions Estimation Methods,
GHGs Estimation Methods Committee Report Part 1, September 2000 Environmental Agency Committee for the Greenhouse Gases Emissions Estimation Methods,
GHGs Estimation Methods Committee Report Part 2, September 2000 Environmental Agency Committee for the Greenhouse Gases Emissions Estimation Methods,
GHGs Estimation Methods Committee Report Part 3, September 2000 Ministry of the Environment, Committee for the Greenhouse Gases Emissions Estimation Methods,
GHGs Estimation Methods Committee Report Part 1, August 2002 Ministry of the Environment, Committee for the Greenhouse Gases Emissions Estimation Methods,
GHGs Estimation Methods Committee Report Part 2, August 2002 Ministry of the Environment Committee for the Greenhouse Gases Emissions Estimation Methods,
GHGs Estimation Methods Committee Report Part 3, August 2002 Ministry of Economy, Trade and Industry, Structural Survey of Energy Consumption in Commerce
and Manufacturing Ministry of Economy, Trade and Industry, Yearbook of Mineral Resources and Petroleum Products
Statistics Ministry of Economy, Trade and Industry, Yearbook of Production, Supply and Demand of
Petroleum, Coal and Coke Ministry of Land, Infrastructure and Transport, Road Transport Census Ministry of Land, Infrastructure, and Transports, Statistical Yearbook of Air Transport Ministry of Land, Infrastructure and Transport, Statistical Yearbook of Motor Vehicle Transport Automobile Inspection and Registration Association (http://www.aira.or.jp/data/data.html) Japan Gas Association website (http://www.gas.or.jp/default.html) Japan Sociality Atmospheric Environment, Reports on Greenhouse gas emissions estimation
methodology, 1996 Natural Gas Mining Association, Natural Gas Annual Report Kazunari Kaino, Interpretation of General Energy Statistics, February 2003
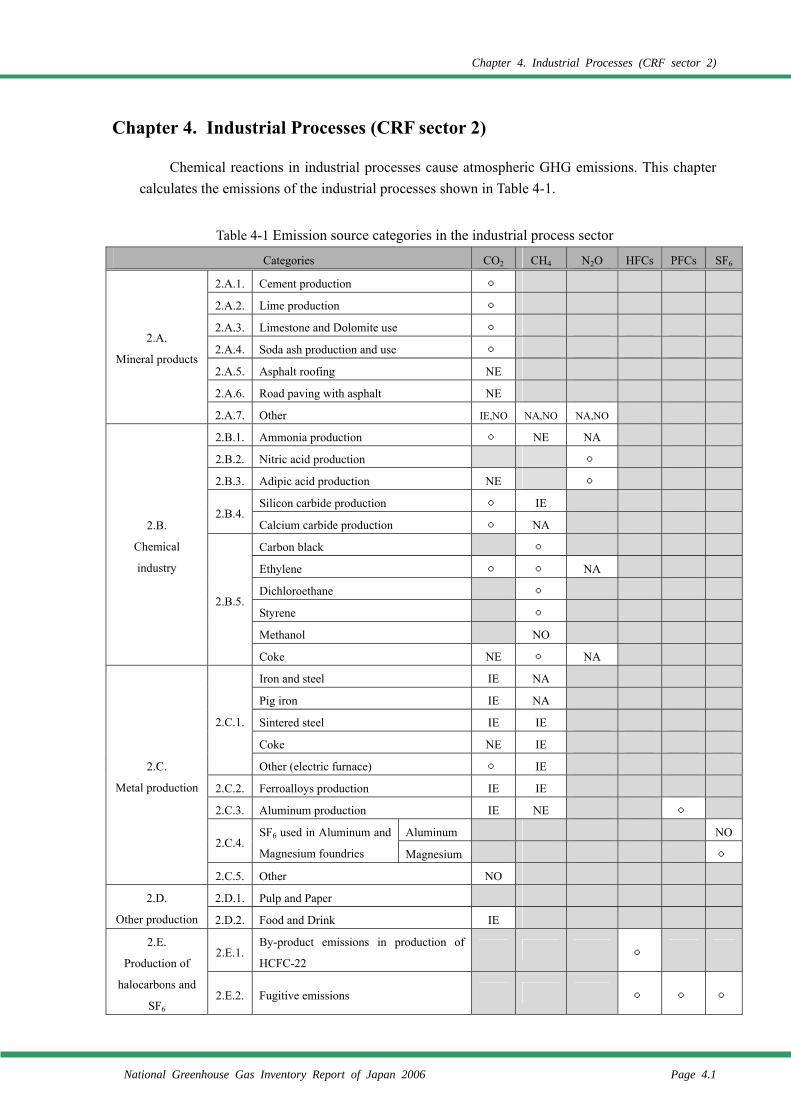
Chapter 4. Industrial Processes (CRF sector 2)
National Greenhouse Gas Inventory Report of Japan 2006 Page 4.1
Chapter 4. Industrial Processes (CRF sector 2)
Chemical reactions in industrial processes cause atmospheric GHG emissions. This chapter calculates the emissions of the industrial processes shown in Table 4-1.
Table 4-1 Emission source categories in the industrial process sector
Categories CO2 CH4 N2O HFCs PFCs SF6
2.A.1. Cement production ○
2.A.2. Lime production ○
2.A.3. Limestone and Dolomite use ○
2.A.4. Soda ash production and use ○
2.A.5. Asphalt roofing NE
2.A.6. Road paving with asphalt NE
2.A.
Mineral products
2.A.7. Other IE,NO NA,NO NA,NO
2.B.1. Ammonia production ○ NE NA
2.B.2. Nitric acid production ○
2.B.3. Adipic acid production NE ○
Silicon carbide production ○ IE 2.B.4.
Calcium carbide production ○ NA
Carbon black ○
Ethylene ○ ○ NA
Dichloroethane ○
Styrene ○
Methanol NO
2.B.
Chemical
industry
2.B.5.
Coke NE ○ NA
Iron and steel IE NA
Pig iron IE NA
Sintered steel IE IE
Coke NE IE
2.C.1.
Other (electric furnace) ○ IE
2.C.2. Ferroalloys production IE IE
2.C.3. Aluminum production IE NE ○
Aluminum NO2.C.4.
SF6 used in Aluminum and
Magnesium foundries Magnesium ○
2.C.
Metal production
2.C.5. Other NO
2.D.1. Pulp and Paper 2.D.
Other production 2.D.2. Food and Drink IE
2.E.1.By-product emissions in production of
HCFC-22 ○
2.E.
Production of
halocarbons and
SF6 2.E.2. Fugitive emissions ○ ○ ○
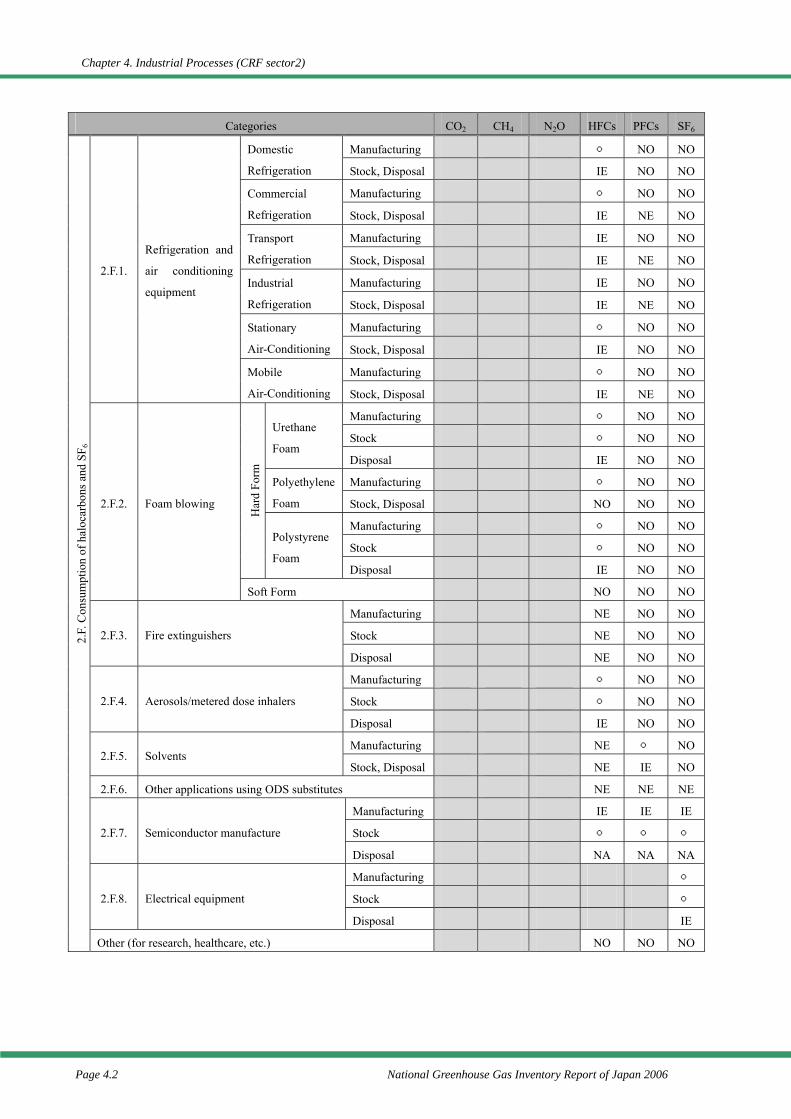
Chapter 4. Industrial Processes (CRF sector2)
Page 4.2 National Greenhouse Gas Inventory Report of Japan 2006
Categories CO2 CH4 N2O HFCs PFCs SF6
Manufacturing ○ NO NODomestic
Refrigeration Stock, Disposal IE NO NO
Manufacturing ○ NO NOCommercial
Refrigeration Stock, Disposal IE NE NO
Manufacturing IE NO NOTransport
Refrigeration Stock, Disposal IE NE NO
Manufacturing IE NO NOIndustrial
Refrigeration Stock, Disposal IE NE NO
Manufacturing ○ NO NOStationary
Air-Conditioning Stock, Disposal IE NO NO
Manufacturing ○ NO NO
2.F.1.
Refrigeration and
air conditioning
equipment
Mobile
Air-Conditioning Stock, Disposal IE NE NO
Manufacturing ○ NO NO
Stock ○ NO NOUrethane
Foam Disposal IE NO NO
Manufacturing ○ NO NOPolyethylene
Foam Stock, Disposal NO NO NO
Manufacturing ○ NO NO
Stock ○ NO NO
Har
d Fo
rm
Polystyrene
Foam Disposal IE NO NO
2.F.2. Foam blowing
Soft Form NO NO NO
Manufacturing NE NO NO
Stock NE NO NO2.F.3. Fire extinguishers
Disposal NE NO NO
Manufacturing ○ NO NO
Stock ○ NO NO2.F.4. Aerosols/metered dose inhalers
Disposal IE NO NO
Manufacturing NE ○ NO2.F.5. Solvents
Stock, Disposal NE IE NO
2.F.6. Other applications using ODS substitutes NE NE NE
Manufacturing IE IE IE
Stock ○ ○ ○ 2.F.7. Semiconductor manufacture
Disposal NA NA NA
Manufacturing ○
Stock ○ 2.F.8. Electrical equipment
Disposal IE
2.F.
Con
sum
ptio
n of
hal
ocar
bons
and
SF 6
Other (for research, healthcare, etc.) NO NO NO
Chapter 4. Industrial Processes (CRF sector 2)
National Greenhouse Gas Inventory Report of Japan 2006 Page 4.3
4.1. Mineral Products (2.A.)
4.1.1. Cement Production (2.A.1.)
• Background CO2 is emitted by calcinating limestone, the main component of which is calcium
carbonate, when producing clinker, an intermediate product of cement.
CO2 emission mechanism of the cement production
process
CaCO3→CaO+CO2
• Methodology for Estimating Emissions of GHGs The GPG (2000) decision tree was followed in calculating the CO2 emissions of this
source by multiplying the production amount of clinker, an intermediate product of cement production, by an emission factor.
CO2 emissions (t-CO2) of cement production
= emission factor (t-CO2/t-clinker) × clinker production (t) × cement kiln dust correction coefficient
• Emission Factors Multiplying the CaO content of clinker by the molecular weight ratio of CaO and CO2
(0.785) yields the emission factor. Because Japan’s cement industry takes in large amounts of wastes and byproducts from other industries and recycles them as substitute raw materials for cement, clinker contains CaO other than that from carbonates. This CaO has not been through the limestone calcination stage and has not emitted CO2 in clinker production. For that reason emission factors were determined by finding the CaO content of clinker from carbonates, from which CaO originating from waste and other sources has been subtracted. We use 1.00 for the cement kiln dust (CKD) correction coefficient because it is deemed likely that CKD is recovered and used again as an input.
Emission factors of CO2 emitted from cement production were calculated using the following procedure.
1 Estimate dry weight of waste and other materials input in raw material processing. 2 Estimate the amount and content of CaO from waste and other materials in clinker. 3 Estimate the CaO content of clinker, excluding the CaO from waste and other
materials. 4 Determine the clinker emission factor.
Emission factors of CO2 emissions from cement production
= [(CaO content of clinker) − (CaO content of clinker from waste and other materials)] × 0.785
CaO content of clinker from waste and other materials
= dry weight of inputs of waste and other materials × CaO content of waste and other materials ÷ clinker
production volume
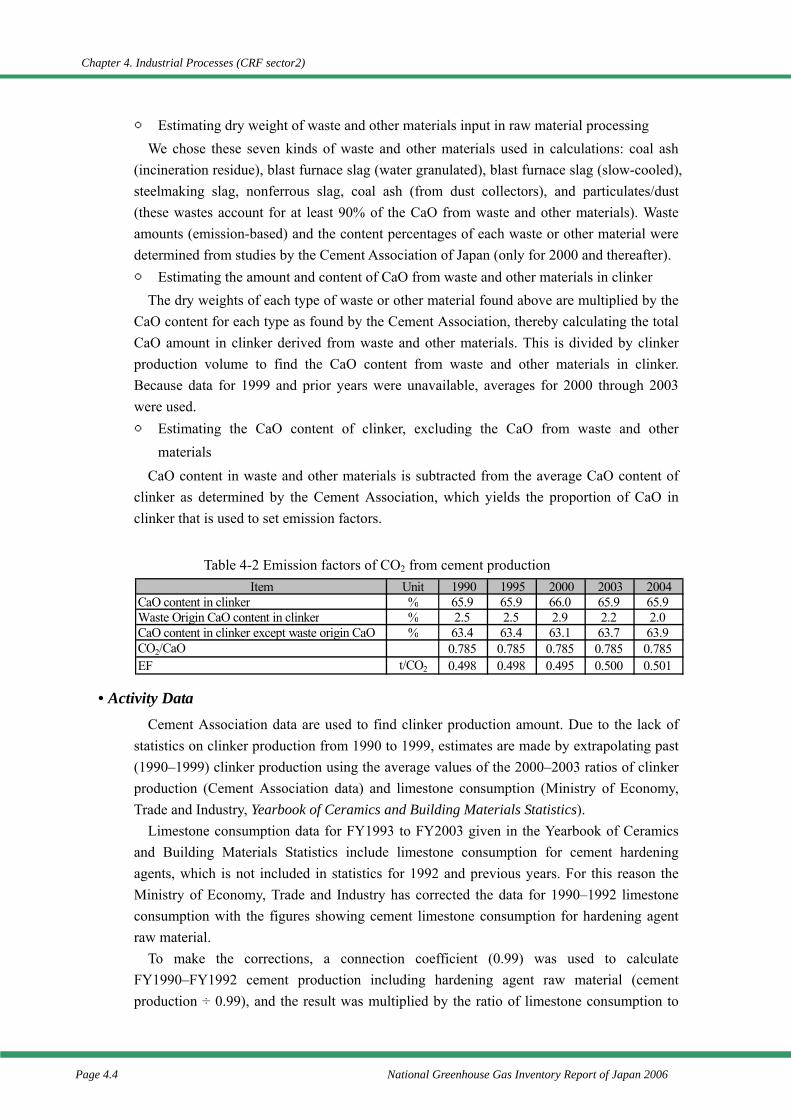
Chapter 4. Industrial Processes (CRF sector2)
Page 4.4 National Greenhouse Gas Inventory Report of Japan 2006
○ Estimating dry weight of waste and other materials input in raw material processing We chose these seven kinds of waste and other materials used in calculations: coal ash
(incineration residue), blast furnace slag (water granulated), blast furnace slag (slow-cooled), steelmaking slag, nonferrous slag, coal ash (from dust collectors), and particulates/dust (these wastes account for at least 90% of the CaO from waste and other materials). Waste amounts (emission-based) and the content percentages of each waste or other material were determined from studies by the Cement Association of Japan (only for 2000 and thereafter). ○ Estimating the amount and content of CaO from waste and other materials in clinker
The dry weights of each type of waste or other material found above are multiplied by the CaO content for each type as found by the Cement Association, thereby calculating the total CaO amount in clinker derived from waste and other materials. This is divided by clinker production volume to find the CaO content from waste and other materials in clinker. Because data for 1999 and prior years were unavailable, averages for 2000 through 2003 were used. ○ Estimating the CaO content of clinker, excluding the CaO from waste and other
materials CaO content in waste and other materials is subtracted from the average CaO content of
clinker as determined by the Cement Association, which yields the proportion of CaO in clinker that is used to set emission factors.
Table 4-2 Emission factors of CO2 from cement production
• Activity Data Cement Association data are used to find clinker production amount. Due to the lack of
statistics on clinker production from 1990 to 1999, estimates are made by extrapolating past (1990–1999) clinker production using the average values of the 2000–2003 ratios of clinker production (Cement Association data) and limestone consumption (Ministry of Economy, Trade and Industry, Yearbook of Ceramics and Building Materials Statistics).
Limestone consumption data for FY1993 to FY2003 given in the Yearbook of Ceramics and Building Materials Statistics include limestone consumption for cement hardening agents, which is not included in statistics for 1992 and previous years. For this reason the Ministry of Economy, Trade and Industry has corrected the data for 1990–1992 limestone consumption with the figures showing cement limestone consumption for hardening agent raw material.
To make the corrections, a connection coefficient (0.99) was used to calculate FY1990–FY1992 cement production including hardening agent raw material (cement production ÷ 0.99), and the result was multiplied by the ratio of limestone consumption to
Item Unit 1990 1995 2000 2003 2004CaO content in clinker % 65.9 65.9 66.0 65.9 65.9Waste Origin CaO content in clinker % 2.5 2.5 2.9 2.2 2.0CaO content in clinker except waste origin CaO % 63.4 63.4 63.1 63.7 63.9CO2/CaO 0.785 0.785 0.785 0.785 0.785EF t/CO2 0.498 0.498 0.495 0.500 0.501
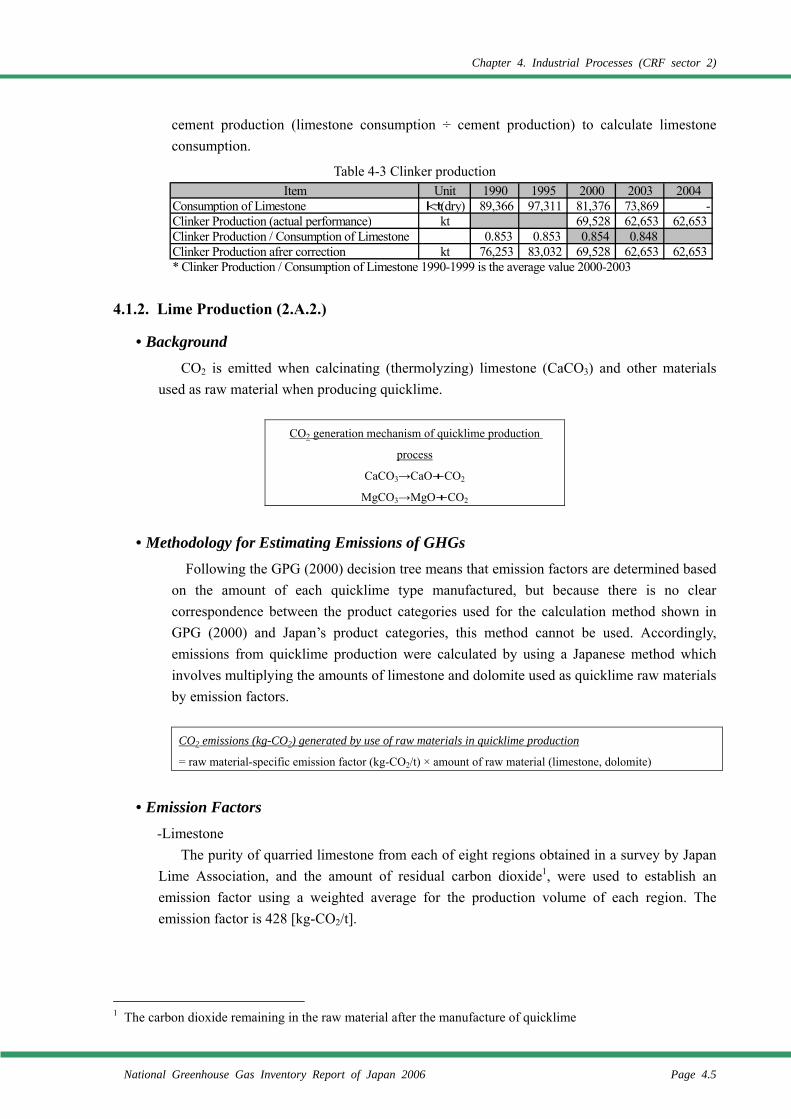
Chapter 4. Industrial Processes (CRF sector 2)
National Greenhouse Gas Inventory Report of Japan 2006 Page 4.5
cement production (limestone consumption ÷ cement production) to calculate limestone consumption.
Table 4-3 Clinker production
4.1.2. Lime Production (2.A.2.)
• Background CO2 is emitted when calcinating (thermolyzing) limestone (CaCO3) and other materials
used as raw material when producing quicklime.
CO2 generation mechanism of quicklime production
process
CaCO3→CaO+CO2
MgCO3→MgO+CO2
• Methodology for Estimating Emissions of GHGs Following the GPG (2000) decision tree means that emission factors are determined based
on the amount of each quicklime type manufactured, but because there is no clear correspondence between the product categories used for the calculation method shown in GPG (2000) and Japan’s product categories, this method cannot be used. Accordingly, emissions from quicklime production were calculated by using a Japanese method which involves multiplying the amounts of limestone and dolomite used as quicklime raw materials by emission factors.
CO2 emissions (kg-CO2) generated by use of raw materials in quicklime production
= raw material-specific emission factor (kg-CO2/t) × amount of raw material (limestone, dolomite)
• Emission Factors -Limestone
The purity of quarried limestone from each of eight regions obtained in a survey by Japan Lime Association, and the amount of residual carbon dioxide1, were used to establish an emission factor using a weighted average for the production volume of each region. The emission factor is 428 [kg-CO2/t].
1 The carbon dioxide remaining in the raw material after the manufacture of quicklime
Item Unit 1990 1995 2000 2003 2004Consumption of Limestone kt (dry) 89,366 97,311 81,376 73,869 -Clinker Production (actual performance) kt 69,528 62,653 62,653Clinker Production / Consumption of Limestone 0.853 0.853 0.854 0.848Clinker Production afrer correction kt 76,253 83,032 69,528 62,653 62,653* Clinker Production / Consumption of Limestone 1990-1999 is the average value 2000-2003
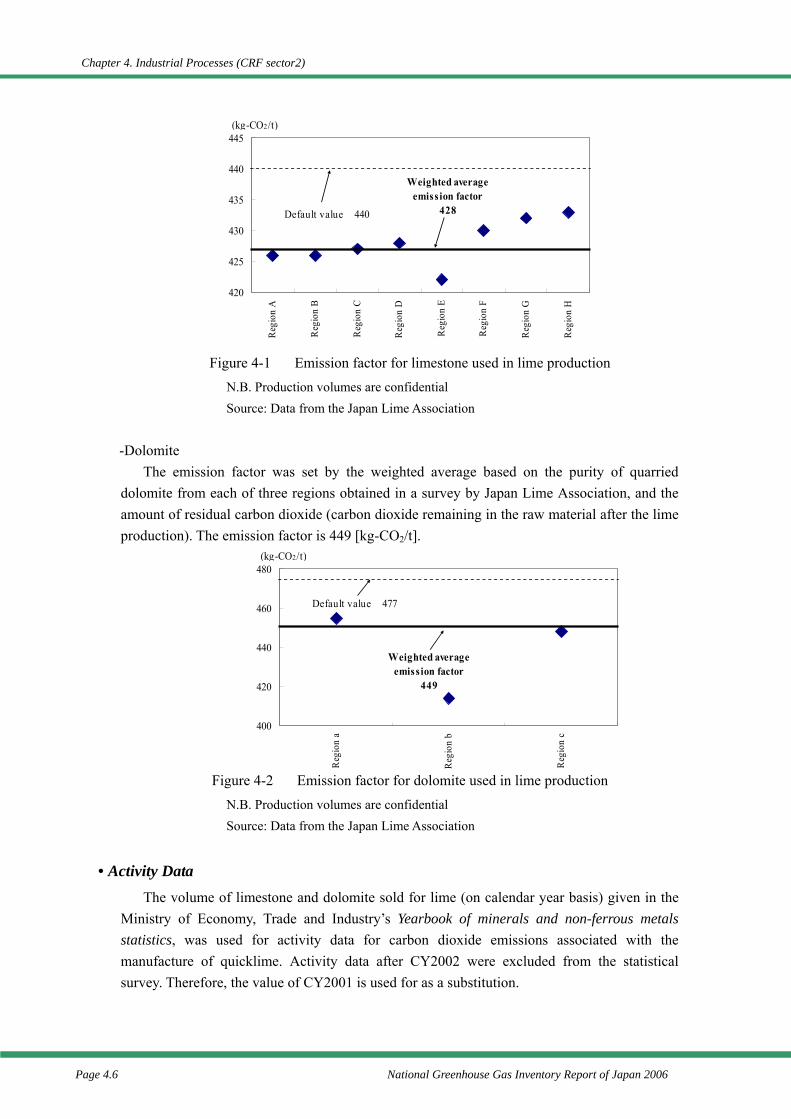
Chapter 4. Industrial Processes (CRF sector2)
Page 4.6 National Greenhouse Gas Inventory Report of Japan 2006
Figure 4-1 Emission factor for limestone used in lime production N.B. Production volumes are confidential Source: Data from the Japan Lime Association
-Dolomite
The emission factor was set by the weighted average based on the purity of quarried dolomite from each of three regions obtained in a survey by Japan Lime Association, and the amount of residual carbon dioxide (carbon dioxide remaining in the raw material after the lime production). The emission factor is 449 [kg-CO2/t].
Figure 4-2 Emission factor for dolomite used in lime production N.B. Production volumes are confidential Source: Data from the Japan Lime Association
• Activity Data The volume of limestone and dolomite sold for lime (on calendar year basis) given in the
Ministry of Economy, Trade and Industry’s Yearbook of minerals and non-ferrous metals statistics, was used for activity data for carbon dioxide emissions associated with the manufacture of quicklime. Activity data after CY2002 were excluded from the statistical survey. Therefore, the value of CY2001 is used for as a substitution.
420
425
430
435
440
445
Reg
ion
A
Reg
ion
B
Reg
ion
C
Reg
ion
D
Reg
ion
E
Reg
ion
F
Reg
ion
G
Reg
ion
H
(kg-CO2/t)
Default value 440
Weighted averageemission factor
428
400
420
440
460
480
Reg
ion
a
Reg
ion
b
Reg
ion
c(kg-CO2/t)
Default value 477
Weighted averageemission factor
449
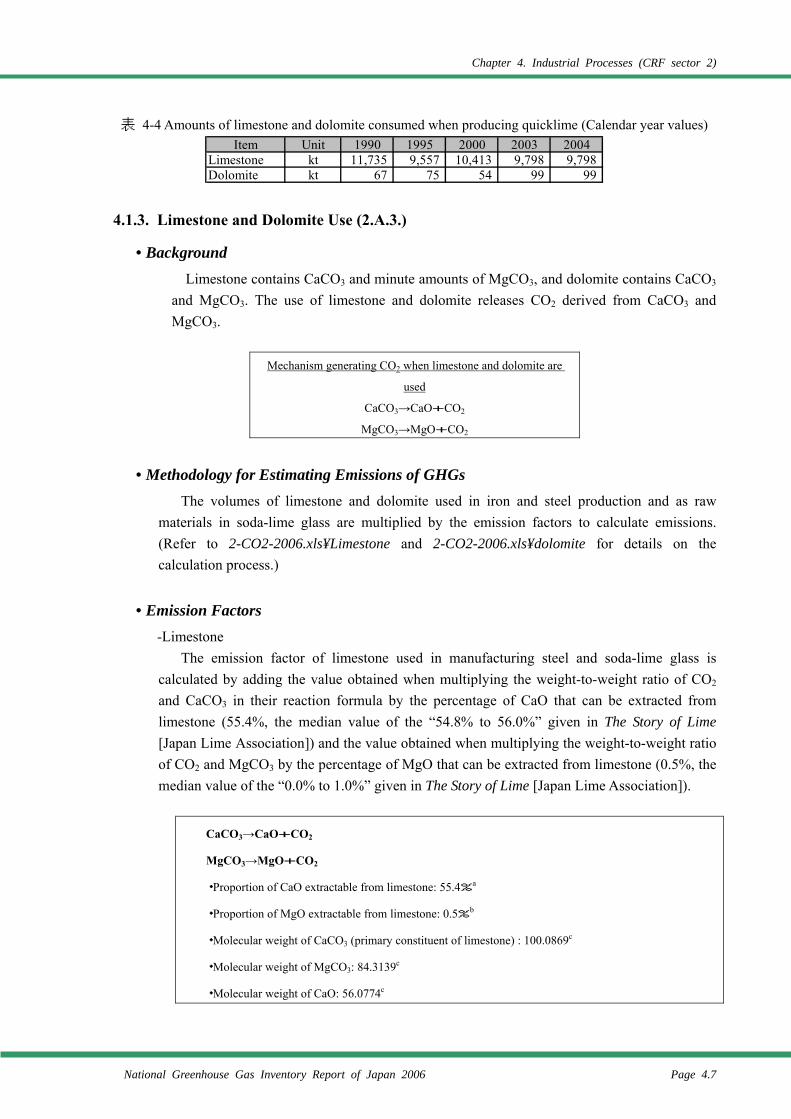
Chapter 4. Industrial Processes (CRF sector 2)
National Greenhouse Gas Inventory Report of Japan 2006 Page 4.7
表 4-4 Amounts of limestone and dolomite consumed when producing quicklime (Calendar year values)
4.1.3. Limestone and Dolomite Use (2.A.3.)
• Background Limestone contains CaCO3 and minute amounts of MgCO3, and dolomite contains CaCO3
and MgCO3. The use of limestone and dolomite releases CO2 derived from CaCO3 and MgCO3.
Mechanism generating CO2 when limestone and dolomite are
used
CaCO3→CaO+CO2
MgCO3→MgO+CO2
• Methodology for Estimating Emissions of GHGs The volumes of limestone and dolomite used in iron and steel production and as raw
materials in soda-lime glass are multiplied by the emission factors to calculate emissions. (Refer to 2-CO2-2006.xls¥Limestone and 2-CO2-2006.xls¥dolomite for details on the calculation process.)
• Emission Factors -Limestone
The emission factor of limestone used in manufacturing steel and soda-lime glass is calculated by adding the value obtained when multiplying the weight-to-weight ratio of CO2 and CaCO3 in their reaction formula by the percentage of CaO that can be extracted from limestone (55.4%, the median value of the “54.8% to 56.0%” given in The Story of Lime [Japan Lime Association]) and the value obtained when multiplying the weight-to-weight ratio of CO2 and MgCO3 by the percentage of MgO that can be extracted from limestone (0.5%, the median value of the “0.0% to 1.0%” given in The Story of Lime [Japan Lime Association]).
CaCO3→CaO+CO2
MgCO3→MgO+CO2
・ Proportion of CaO extractable from limestone: 55.4%a
・ Proportion of MgO extractable from limestone: 0.5%b
・ Molecular weight of CaCO3 (primary constituent of limestone) : 100.0869c
・ Molecular weight of MgCO3: 84.3139c
・ Molecular weight of CaO: 56.0774c
Item Unit 1990 1995 2000 2003 2004Limestone kt 11,735 9,557 10,413 9,798 9,798Dolomite kt 67 75 54 99 99
Chapter 4. Industrial Processes (CRF sector2)
Page 4.8 National Greenhouse Gas Inventory Report of Japan 2006
・ Molecular weight of MgO: 40.3044c
・ Molecular weight of CO2: 44.0095c
・CaCO3content = proportion of CaO extractable from limestone × molecular weight of CaCO3 ÷
molecular weight of CaO
= (55.4% × 100.0869) ÷ 56.0774 × 100 = 98.88%
・MgCO3content = proportion of MgO extractable from limestone × molecular weight of MgCO3 ÷
molecular weight of MgO
= 0.5% × 84.3139 ÷ 40.3044 = 1.05%
○Emission factor = (molecular weight of CO2 ÷ molecular weight of CaCO3 × CaCO3 content)
+ (molecular weight of CO2 ÷ molecular weight of MgCO3 × MgCO3 content)
=44.0095/100.0869*0.9888+44.0095/84.3139*0.0105
=0.4348+0.0055 =0.4402 [t-CO2/t]
=440[kg-CO2/t]
Sources)
a. Median of 54.8% to 56.0%: Japan Lime Association, The Story of Lime
b. Median of 0.0% to 1.0%: Japan Lime Association, The Story of Lime
c. IUPAC “Atomic Weights of the Elements 1999”
(http://www.chem.qmul.ac.uk/iupac/AtWt/AtWt9.html)
-Dolomite
The emission factor of dolomite is calculated by adding the value obtained when multiplying the weight-to-weight ratio of CO2 and CaCO3 in their reaction formula by the percentage of CaO that can be extracted from dolomite (34.5%, the median value of the 33.1% to 35.85% range given in The Story of Lime [Japan Lime Association]) and the value obtained when multiplying the weight-to-weight ratio of CO2 and MgCO3 by the percentage of MgO that can be extracted from dolomite (18.3%, the median value of the 17.2% to 19.5% range given in The Story of Lime [Japan Lime Association]).
CaCO3 → CaO +CO2
MgCO3 → MgO +CO2
・Proportion of CaO extractable from dolomite: 34.5%
(Median value of the 33.1% to 35.85% range given in The Story of Lime [Japan Lime Association])
・Proportion of MgO extractable from dolomite: 18.3%18.3%
(Median value of the 17.2% to 19.5% range given in The Story of Lime [Japan Lime
Chapter 4. Industrial Processes (CRF sector 2)
National Greenhouse Gas Inventory Report of Japan 2006 Page 4.9
Association])
・Molecular weight of CaCO3 (major constituent of dolomite): 100.0872
・Molecular weight of MgCO3 (major constituent of dolomite): 84.3142
・Molecular weight of CaO: 56.0774
・Molecular weight of MgO: 40.3044
・CaCO3 content = proportion of CaO extractable from dolomite × molecular weight of CaCO3 ÷
molecular weight of CaO
= 34.5% × 100.0872 ÷ 56.0774
= 61.53%
・MgCO3 content = proportion of MgO extractable from dolomite × molecular weight of MgCO3 ÷
molecular weight of MgO
= 18.3% × 84.3142 ÷ 40.3044
= 38.39%
・Molecular weight of CO2: 44.0098
○Emission factor = molecular weight of CO2 ÷ molecular weight of CaCO3 × CaCO3 content
+ molecular weight of CO2 ÷ molecular weight of MgCO3 × MgCO3 content
= 44.0098 ÷ 100.0872×0.6153+44.0098 ÷ 84.3142×0.3839
= 0.2706+0.2004
= 0.4709
= 471(kg-CO2/t)
• Activity Data For the activity of CO2 emissions from the use of limestone and dolomite the inventory
used the amounts of limestone and dolomite sold for use in steel refining and soda glass given in the Ministry of Economy, Trade and Industry’s Yearbook of Minerals and Nonferrous Metals Statistics and Yearbook of Mineral Resources and Petroleum Products Statistics.
Table 4-5 Amounts of limestone and dolomite sold for use in steel refining and soda glass
Item Unit 1990 1995 2000 2003 2004Limestone (for Steel and Refinement) kt 22,375 22,371 22,902 22,259 23,066Limestone (for Soda and Glass) kt 1,846 1,946 1,722 916 997Dolomite (for Steel and Refinement) kt 1,619 771 438 418 461Dolomite (for Soda and Glass) kt 228 197 177 142 160
Chapter 4. Industrial Processes (CRF sector2)
Page 4.10 National Greenhouse Gas Inventory Report of Japan 2006
4.1.4. Soda Ash Production and Use (2.A.4.)
4.1.4.1. Soda Ash Production (2.A.4.-)
In Japan the ammonium chloride soda process is used to produce soda ash (Na2CO3). The soda ash production process involves calcinating limestone and coke in a lime kiln, which emits CO2. Almost all lime-derived CO2 is taken into the product.
In the soda ash production process, purchased CO2 is sometimes input through a pipeline, but because these CO2 emissions are from the ammonia industry, they are already included in “Ammonia Production (2.B.1)”. Also, the coke consumed is listed as that for heating in statistics on the consumption dynamics of petroleum and other fuels, and thus CO2 emissions from coke are already counted under “Fuel Combustion (1.A)”. Therefore all emissions from this source are already included in other categories, and are reported as “IE”. Coke is input as a heat-source and CO2 source.
The Revised 1996 IPCC Guidelines offer a method to calculate CO2 emissions from calcinating trona (Na2CO3⋅NaHCO3⋅2H2O), but these emissions are not estimated because in Japan soda ash has never been manufactured by trona calcination.
4.1.4.2. Soda Ash Use (2.A.4.-)
• Methodology for Estimating Emissions of GHGs CO2 emissions from soda ash use are calculated on the basis of the method in the Revised
1996 IPCC Guidelines by multiplying the soda ash consumption amount by the default emission factor.
• Emission Factors Because Japan does not have its own measured data or emission factor, this inventory uses
the default value (0.415 t-CO2/t-Na2CO3) in the Revised 1996 IPCC Guidelines (vol. 3 p. 2.13).
• Activity Data Activity data are the total of (1) shipping totals from Japan Soda Industry Association data,
(2) imports and exports of soda ash from trade statistics, and (3) imports and exports of other sodium sesquicarbonate (mainly trona ash) from trade statistics.
Table 4-6 Soda ash use
4.1.5. Asphalt Roofing (2.A.5.)
Asphalt roofing is manufactured in Japan, but information about the manufacturing process and activity data is inadequate, and it is not possible to definitively conclude that carbon dioxide are not emitted from the manufacture of asphalt roofing. Emissions have also never been actually measured, and as no default emission value is available, it is not currently possible to calculate
Item Unit 1990 1995 2000 2003 2004Soda Ash Shipping kt 1,098 977 634 434 475Soda Ash Imported kt 0.03 11 49 94 90Other Disodium Carbonate Imported kt 295 305 346 359 358
Chapter 4. Industrial Processes (CRF sector 2)
National Greenhouse Gas Inventory Report of Japan 2006 Page 4.11
emissions. Therefore, it has been reported as “NE”.
4.1.6. Road Paving with Asphalt (2.A.6.)
Roads in Japan are paved with asphalt, but almost no carbon dioxide would be emitted in the process. It is not possible, however, to be completely definitive about such emissions. Emissions have also never been actually measured, and as no default emission value is available, it is not currently possible to calculate emissions. Therefore, it has been reported as “NE”.
4.2. Chemical Industry (2.B.)
4.2.1. Ammonia Production (2.B.1.)
1) CO2
• Background CO2 is emitted when hydrocarbon feedstock in ammonia production is broken down to
make H2 feedstock.
Mechanism generating CO2 in ammonia production
0.88CH4 + 1.26air + 1.24H2O → 0.88CO2 + N2 + 3H2
Ammonia synthesis
N2 + 3H2 → 2NH3
• Methodology for Estimating Emissions of GHGs CO2 emissions are calculated by multiplying the consumed amounts of fuel types
used as ammonia feedstock by emission factors.
• Emission Factors For each feedstock listed in Table 4-7, the inventory uses values that are the same as
emission factors used to calculate CO2 emissions from the fuel combustion sector (see Chapter 3).
• Activity Data The fixed units (including weight and volume) for the fuel types in the table below, which
are from the Ministry of Economy, Trade and Industry’s Yearbook of the Current Survey of Energy Consumption, were converted using the calorific values in the Agency for Natural Resources and Energy’s General Energy Statistics, and results were used as activity data. Consumption data on some fuel types are confidential.
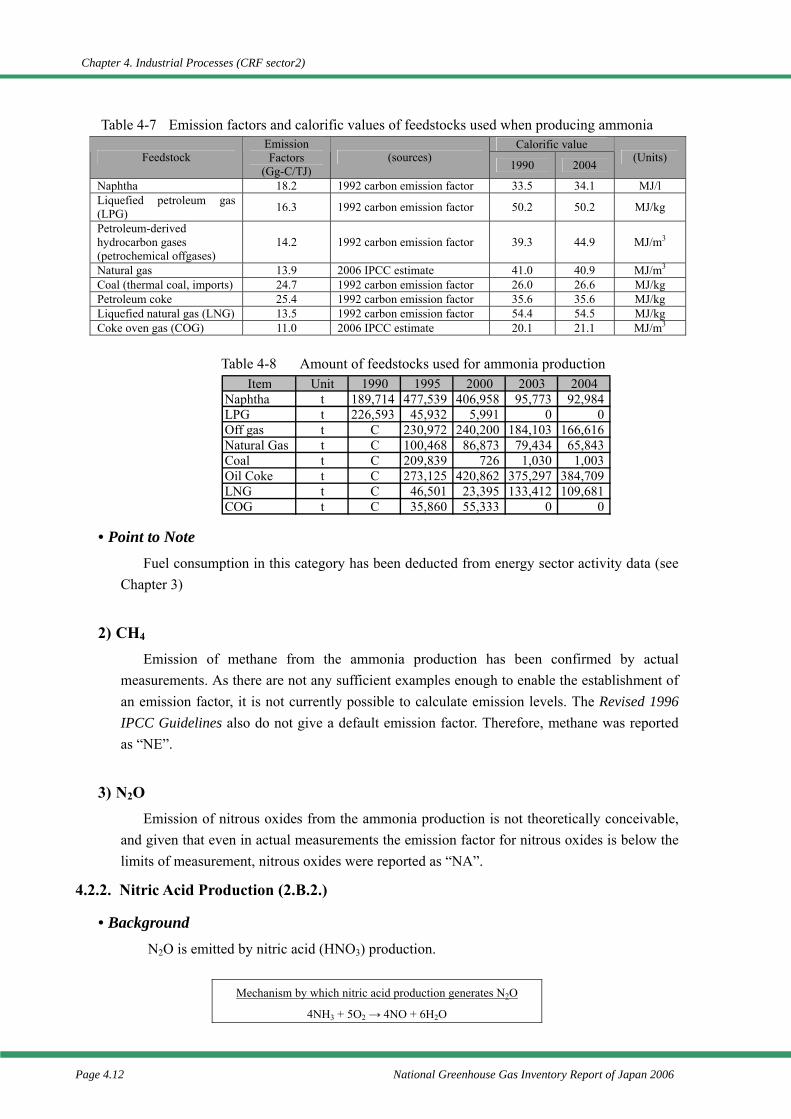
Chapter 4. Industrial Processes (CRF sector2)
Page 4.12 National Greenhouse Gas Inventory Report of Japan 2006
Table 4-7 Emission factors and calorific values of feedstocks used when producing ammonia Calorific value
Feedstock Emission Factors
(Gg-C/TJ) (sources)
1990 2004 (Units)
Naphtha 18.2 1992 carbon emission factor 33.5 34.1 MJ/l Liquefied petroleum gas (LPG) 16.3 1992 carbon emission factor 50.2 50.2 MJ/kg
Petroleum-derived hydrocarbon gases (petrochemical offgases)
14.2 1992 carbon emission factor 39.3 44.9 MJ/m3
Natural gas 13.9 2006 IPCC estimate 41.0 40.9 MJ/m3 Coal (thermal coal, imports) 24.7 1992 carbon emission factor 26.0 26.6 MJ/kg Petroleum coke 25.4 1992 carbon emission factor 35.6 35.6 MJ/kg Liquefied natural gas (LNG) 13.5 1992 carbon emission factor 54.4 54.5 MJ/kg Coke oven gas (COG) 11.0 2006 IPCC estimate 20.1 21.1 MJ/m3
Table 4-8 Amount of feedstocks used for ammonia production
• Point to Note Fuel consumption in this category has been deducted from energy sector activity data (see
Chapter 3)
2) CH4 Emission of methane from the ammonia production has been confirmed by actual
measurements. As there are not any sufficient examples enough to enable the establishment of an emission factor, it is not currently possible to calculate emission levels. The Revised 1996 IPCC Guidelines also do not give a default emission factor. Therefore, methane was reported as “NE”.
3) N2O Emission of nitrous oxides from the ammonia production is not theoretically conceivable,
and given that even in actual measurements the emission factor for nitrous oxides is below the limits of measurement, nitrous oxides were reported as “NA”.
4.2.2. Nitric Acid Production (2.B.2.)
• Background N2O is emitted by nitric acid (HNO3) production.
Mechanism by which nitric acid production generates N2O
4NH3 + 5O2 → 4NO + 6H2O
Item Unit 1990 1995 2000 2003 2004Naphtha t 189,714 477,539 406,958 95,773 92,984LPG t 226,593 45,932 5,991 0 0Off gas t C 230,972 240,200 184,103 166,616Natural Gas t C 100,468 86,873 79,434 65,843Coal t C 209,839 726 1,030 1,003Oil Coke t C 273,125 420,862 375,297 384,709LNG t C 46,501 23,395 133,412 109,681COG t C 35,860 55,333 0 0
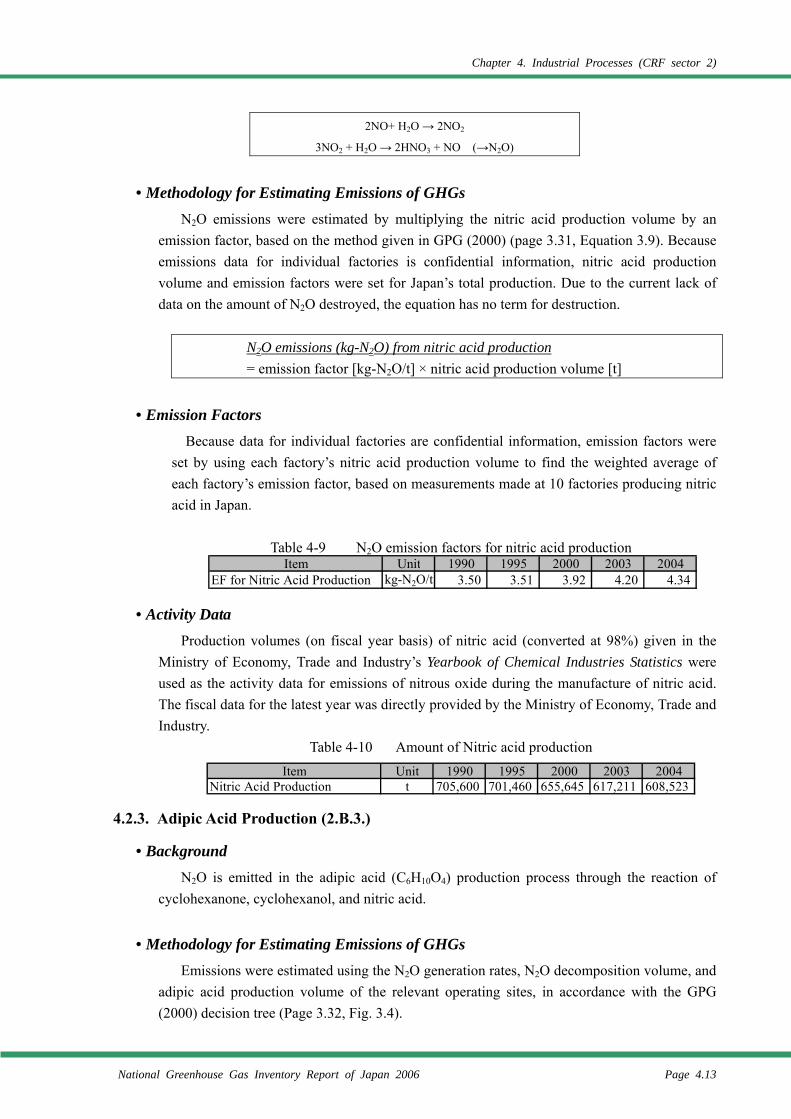
Chapter 4. Industrial Processes (CRF sector 2)
National Greenhouse Gas Inventory Report of Japan 2006 Page 4.13
2NO+ H2O → 2NO2
3NO2 + H2O → 2HNO3 + NO (→N2O)
• Methodology for Estimating Emissions of GHGs N2O emissions were estimated by multiplying the nitric acid production volume by an
emission factor, based on the method given in GPG (2000) (page 3.31, Equation 3.9). Because emissions data for individual factories is confidential information, nitric acid production volume and emission factors were set for Japan’s total production. Due to the current lack of data on the amount of N2O destroyed, the equation has no term for destruction.
N2O emissions (kg-N2O) from nitric acid production = emission factor [kg-N2O/t] × nitric acid production volume [t]
• Emission Factors Because data for individual factories are confidential information, emission factors were
set by using each factory’s nitric acid production volume to find the weighted average of each factory’s emission factor, based on measurements made at 10 factories producing nitric acid in Japan.
Table 4-9 N2O emission factors for nitric acid production
• Activity Data Production volumes (on fiscal year basis) of nitric acid (converted at 98%) given in the
Ministry of Economy, Trade and Industry’s Yearbook of Chemical Industries Statistics were used as the activity data for emissions of nitrous oxide during the manufacture of nitric acid. The fiscal data for the latest year was directly provided by the Ministry of Economy, Trade and Industry.
Table 4-10 Amount of Nitric acid production
4.2.3. Adipic Acid Production (2.B.3.)
• Background N2O is emitted in the adipic acid (C6H10O4) production process through the reaction of
cyclohexanone, cyclohexanol, and nitric acid.
• Methodology for Estimating Emissions of GHGs Emissions were estimated using the N2O generation rates, N2O decomposition volume, and
adipic acid production volume of the relevant operating sites, in accordance with the GPG (2000) decision tree (Page 3.32, Fig. 3.4).
Item Unit 1990 1995 2000 2003 2004EF for Nitric Acid Production kg-N2O/t 3.50 3.51 3.92 4.20 4.34
Item Unit 1990 1995 2000 2003 2004Nitric Acid Production t 705,600 701,460 655,645 617,211 608,523
Chapter 4. Industrial Processes (CRF sector2)
Page 4.14 National Greenhouse Gas Inventory Report of Japan 2006
N2O emissions from adipic acid production = [N2O generation rate × (1−N2O generation rate × decomposition unit operating rate)] × adipic acid production rate
• Emission Factors Values calculated using the above equation has been used as the emission factors.
Parameters were established by the following methods. Relevant data used in estimation is confidential.
-Rate of generation of nitrous oxide
The figure based on actual measurement2 data has been used. The actual measurement data is provided from the only operating site in Japan that is producing adipic acid as an end product.
-Rate of decomposition of nitrous oxide
The figure used is the result of measurement of the rate of decomposition of nitrous oxide in the operating site.
-Operating rate of decomposition unit
A full-scale survey on the number of hours operated is conducted annually for N2O decomposition units and adipic acid production plants. The figure adopted here is based on this survey.
Number of hours worked of decomposition unit:
Hours starting from the beginning of feeding the entire volume of N2O gases till the end of feeding Number of hours worked of adipic acid production plants:
Hours starting from the beginning of feeding materials till the end of feeding
• Activity Data The data used for activity data for nitrous oxide emissions associated with the manufacture
of adipic acid was the production of adipic acid submitted to the Ministry of Economy, Trade and Industry by the manufacturer. Relevant data used in estimation is confidential.
• Point to Note From 1990 to 1997, N2O emissions from the adipic acid production increased gradually.
Calculation of operating ratio of decomposition unit
Operating ratio of decomposition unit (%) = Number of hours worked of decomposition unit / Number of hours worked of adipic acid production plants × 100 (%)
Chapter 4. Industrial Processes (CRF sector 2)
National Greenhouse Gas Inventory Report of Japan 2006 Page 4.15
However, given the fact that N2O decomposition units started operating in adipic acid production plants after May 1999, the emissions after 1999 have decreased dramatically. The temporary growth of the emissions was happened in 2000 because of the low operating ratio of N2O decomposition units then due to the breakdown of the decomposition units.
4.2.4. Carbide Production (2.B.4.)
4.2.4.1. Silicon Carbide (2.B.4.-)
1) CO2
• Background CO2 is emitted by the use of petroleum coke as a raw material in the production of silicon
carbide.
Mechanism of CO2 generation by the silicon carbide production process
SIO2 + 3C → SiC + 2CO → 2CO2
• Methodology for Estimating Emissions of GHGs Emissions are calculated by multiplying the amount of petroleum coke used as silicon
carbide feedstock by an emission factor.
• Emission Factors Because Japan does not have its own measured data or emission factor, this inventory uses
the default value 2.3 [t-CO2/t] for silicon carbide production in the Revised 1996 IPCC Guidelines (vol. 3 p. 2.21).
• Activity Data As the activity data for CO2 emissions from silicon carbide production, this inventory uses
the petroleum coke consumption amount provided by Japan’s only silicon carbide production facility. The data are confidential.
2) CH4 In Japan silicon carbide is made in electric arc furnaces, and it is believed that CH4 is
generated from the oxidation of coke, which is used as a reducing agent in silicon carbide production. Electric furnaces used to make carbide are covered by Table No. 1-12 of the Air Pollution Control Law’s Execution Ordinance. CH4 emissions from these furnaces are reported as “IE” because they are already calculated in Combustion of Fuel (1A).
Chapter 4. Industrial Processes (CRF sector2)
Page 4.16 National Greenhouse Gas Inventory Report of Japan 2006
4.2.4.2. Calcium Carbide (2.B.4.-)
1) CO2
• Background CO2 is generated in the process of making the quicklime used in calcium carbide
production. CO2 is also emitted by CO combustion when making calcium carbide. Further, calcium carbide is made to react with water, producing calcium hydroxide (slaked lime) and acetylene, and CO2 is generated when the acetylene is used.
Mechanism by which CO2 is generated in the calcium carbide production process
(Production)
CaCO3 → CaO + CO2
CaO + 3C → CaC2+CO (→CO2)
(Use)
CaC2+2H2O → Ca(OH)2+C2H2 →2CO2
• Methodology for Estimating Emissions of GHGs CO2 emissions are calculated by multiplying calcium carbide production by the default
emission factor, based on the Revised 1996 IPCC Guidelines.
CO2 emissions in conjunction with calcium carbide production and consumption
= ∑(emission factors of CO2 from limestone, from reducing agent, and use) × calcium carbide production
volume
• Emission Factors Because Japan does not have its own measured data or emission factors, this inventory
uses the default values given in the Revised 1996 IPCC Guidelines for the emission factors of CO2 from limestone, from reducing agent, and use.
Table 4-11 Emission factors of CO2 generated by calcium carbide production and consumption
Units From limestone in production From reducing agent in production From use
t-CO2/t 0.760 1.090 1.100
Source: Revised 1996 IPCC Guidelines, vol. 3, p. 2.22.
• Activity Data Calcium carbide production data provided by the Carbide Industry Association are used as
the calcium carbide production volume. The data are confidential.
2) CH4 Byproduct gases (mainly CO) generated in carbide reactions include a small amount of
CH4, all of which is recovered and burned as fuel, with none being emitted outside the system.
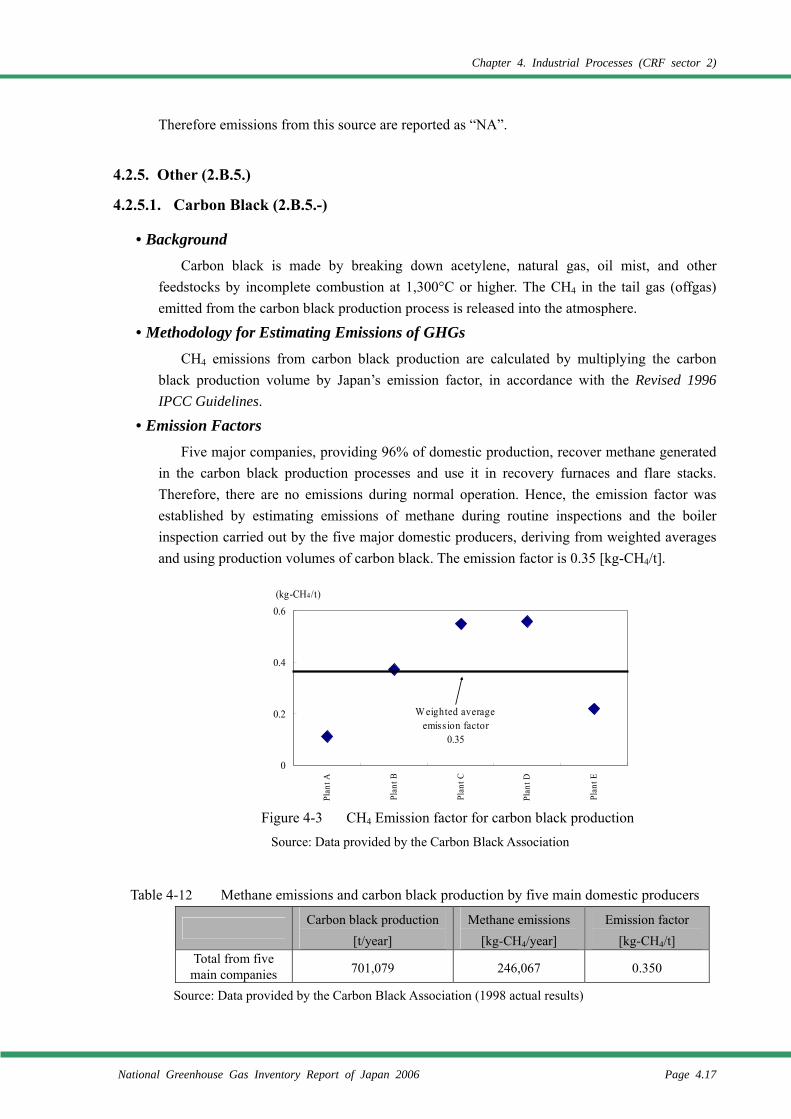
Chapter 4. Industrial Processes (CRF sector 2)
National Greenhouse Gas Inventory Report of Japan 2006 Page 4.17
Therefore emissions from this source are reported as “NA”.
4.2.5. Other (2.B.5.)
4.2.5.1. Carbon Black (2.B.5.-)
• Background Carbon black is made by breaking down acetylene, natural gas, oil mist, and other
feedstocks by incomplete combustion at 1,300°C or higher. The CH4 in the tail gas (offgas) emitted from the carbon black production process is released into the atmosphere.
• Methodology for Estimating Emissions of GHGs CH4 emissions from carbon black production are calculated by multiplying the carbon
black production volume by Japan’s emission factor, in accordance with the Revised 1996 IPCC Guidelines.
• Emission Factors Five major companies, providing 96% of domestic production, recover methane generated
in the carbon black production processes and use it in recovery furnaces and flare stacks. Therefore, there are no emissions during normal operation. Hence, the emission factor was established by estimating emissions of methane during routine inspections and the boiler inspection carried out by the five major domestic producers, deriving from weighted averages and using production volumes of carbon black. The emission factor is 0.35 [kg-CH4/t].
Figure 4-3 CH4 Emission factor for carbon black production Source: Data provided by the Carbon Black Association
Table 4-12 Methane emissions and carbon black production by five main domestic producers
Carbon black production
[t/year] Methane emissions
[kg-CH4/year] Emission factor
[kg-CH4/t] Total from five main companies 701,079 246,067 0.350
Source: Data provided by the Carbon Black Association (1998 actual results)
0
0.2
0.4
0.6
Plan
t A
Plan
t B
Plan
t C
Plan
t D
Plan
t E(kg-CH4/t)
Weighted averageemission factor
0.35
Chapter 4. Industrial Processes (CRF sector2)
Page 4.18 National Greenhouse Gas Inventory Report of Japan 2006
• Activity Data Carbon black production volumes (on fiscal year basis) given in the Yearbook of Chemical
Industries Statistics compiled by the Ministry of Economy, Trade and Industry (METI) were used for activity data for methane emissions associated with the manufacture of carbon black. However, as data for the latest fiscal year were not listed, the calendar-year values were used.
Table 4-13 Carbon black production volume
4.2.5.2. Ethylene (2.B.5.-)
1) CO2, CH4
• Background CO2 is emitted when it is separated in the ethylene production process. CH4 is emitted by
naphtha cracking through stream cracking in the ethylene production process.
• Methodology for Estimating Emissions of GHGs CH4 and CO2 emissions from ethylene production were calculated by multiplying ethylene
production by a Japan-specific emission factor, in accordance with the Revised 1996 IPCC Guidelines.
• Emission Factors -CH4
Estimates of volume of exhaust gas from flare stacks at operational startup and shutdown at operating sites in Japan (assuming that 98% of the volume that enters is combusted), and measured volume of exhaust gas from naphtha cracking furnace and furnaces heated by re-cycled gas, were divided by the production volume to calculate emission factors for each company. The weighted average of production from each company was then applied to establish the emission factor. The emission factor is 0.015 [kg-CH4/t].
Item Unit 1990 1995 2000 2003 2004Carbon Black Production t 792,722 758,536 771,875 792,114 809,012
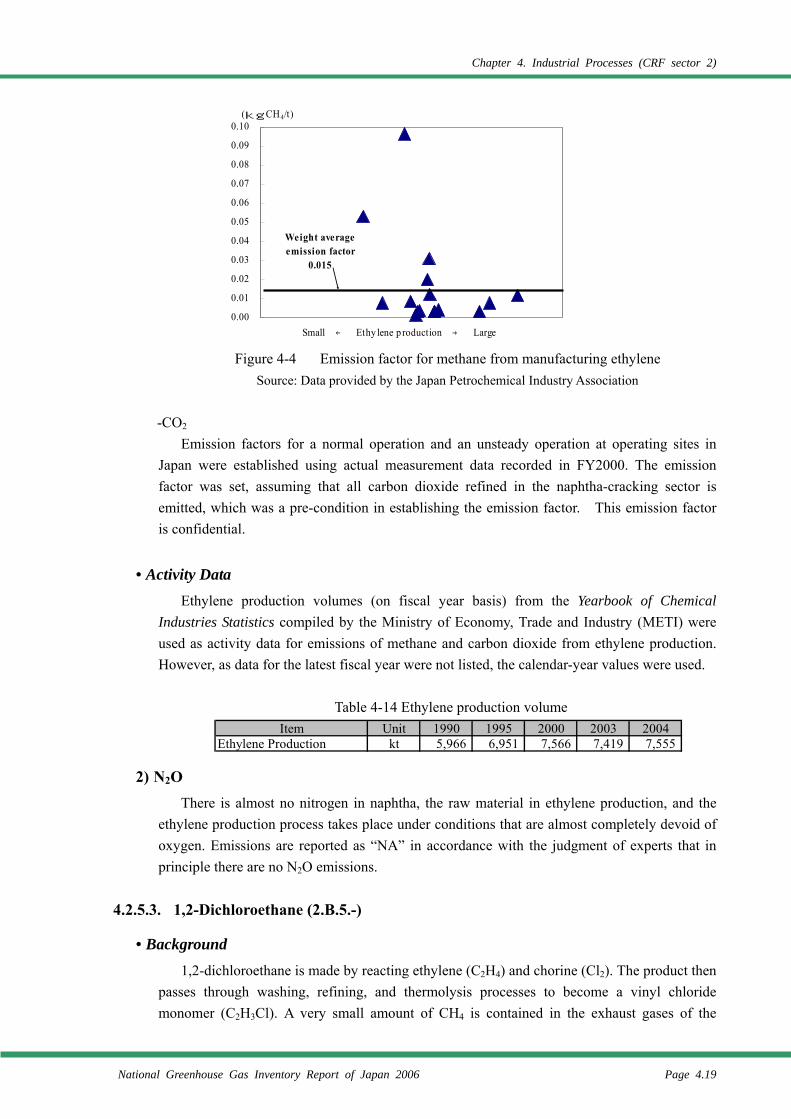
Chapter 4. Industrial Processes (CRF sector 2)
National Greenhouse Gas Inventory Report of Japan 2006 Page 4.19
Figure 4-4 Emission factor for methane from manufacturing ethylene Source: Data provided by the Japan Petrochemical Industry Association
-CO2
Emission factors for a normal operation and an unsteady operation at operating sites in Japan were established using actual measurement data recorded in FY2000. The emission factor was set, assuming that all carbon dioxide refined in the naphtha-cracking sector is emitted, which was a pre-condition in establishing the emission factor. This emission factor is confidential.
• Activity Data Ethylene production volumes (on fiscal year basis) from the Yearbook of Chemical
Industries Statistics compiled by the Ministry of Economy, Trade and Industry (METI) were used as activity data for emissions of methane and carbon dioxide from ethylene production. However, as data for the latest fiscal year were not listed, the calendar-year values were used.
Table 4-14 Ethylene production volume
2) N2O There is almost no nitrogen in naphtha, the raw material in ethylene production, and the
ethylene production process takes place under conditions that are almost completely devoid of oxygen. Emissions are reported as “NA” in accordance with the judgment of experts that in principle there are no N2O emissions.
4.2.5.3. 1,2-Dichloroethane (2.B.5.-)
• Background 1,2-dichloroethane is made by reacting ethylene (C2H4) and chorine (Cl2). The product then
passes through washing, refining, and thermolysis processes to become a vinyl chloride monomer (C2H3Cl). A very small amount of CH4 is contained in the exhaust gases of the
Item Unit 1990 1995 2000 2003 2004Ethylene Production kt 5,966 6,951 7,566 7,419 7,555
0.00
0.01
0.02
0.03
0.04
0.05
0.06
0.07
0.08
0.09
0.10(kgCH4/t)
Weight averageemission factor
0.015
Small ← Ethy lene p roduction → Large
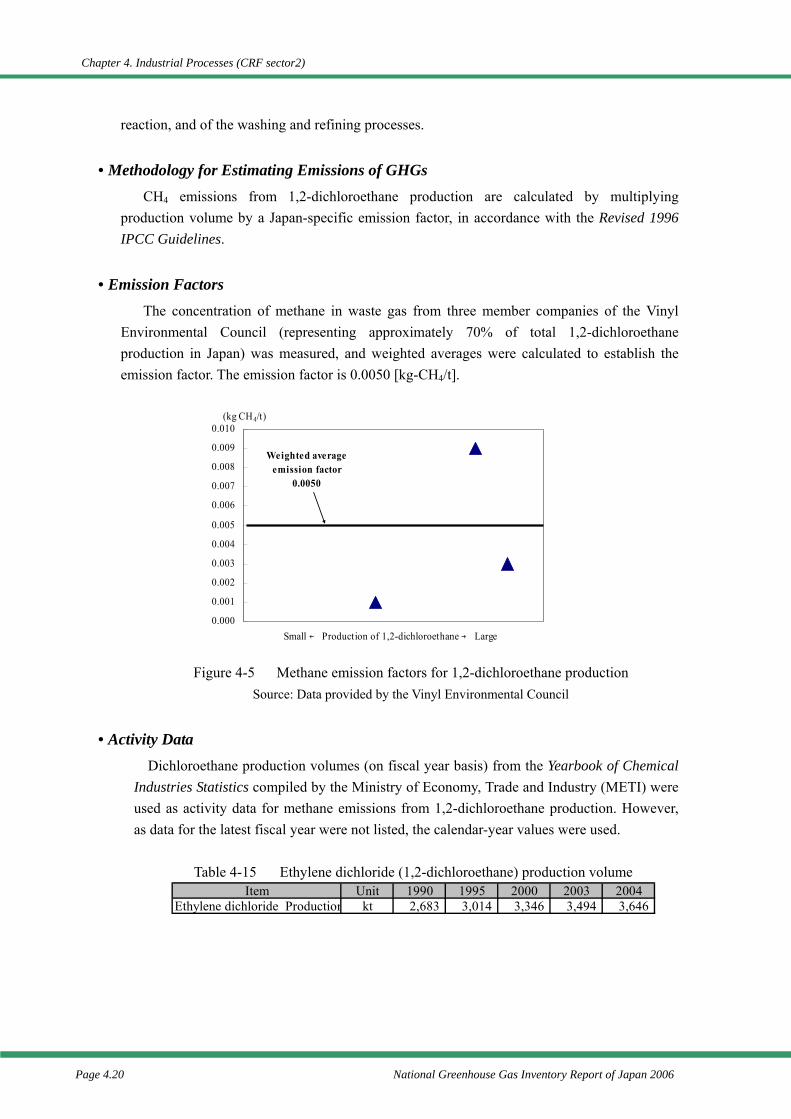
Chapter 4. Industrial Processes (CRF sector2)
Page 4.20 National Greenhouse Gas Inventory Report of Japan 2006
reaction, and of the washing and refining processes.
• Methodology for Estimating Emissions of GHGs CH4 emissions from 1,2-dichloroethane production are calculated by multiplying
production volume by a Japan-specific emission factor, in accordance with the Revised 1996 IPCC Guidelines.
• Emission Factors The concentration of methane in waste gas from three member companies of the Vinyl
Environmental Council (representing approximately 70% of total 1,2-dichloroethane production in Japan) was measured, and weighted averages were calculated to establish the emission factor. The emission factor is 0.0050 [kg-CH4/t].
Figure 4-5 Methane emission factors for 1,2-dichloroethane production Source: Data provided by the Vinyl Environmental Council
• Activity Data Dichloroethane production volumes (on fiscal year basis) from the Yearbook of Chemical
Industries Statistics compiled by the Ministry of Economy, Trade and Industry (METI) were used as activity data for methane emissions from 1,2-dichloroethane production. However, as data for the latest fiscal year were not listed, the calendar-year values were used.
Table 4-15 Ethylene dichloride (1,2-dichloroethane) production volume
0.000
0.001
0.002
0.003
0.004
0.005
0.006
0.007
0.008
0.009
0.010(kg CH4/t)
Weighted averageemission factor
0.0050
Small ← Production of 1,2-dichloroethane → Large
Item Unit 1990 1995 2000 2003 2004Ethylene dichloride Production kt 2,683 3,014 3,346 3,494 3,646
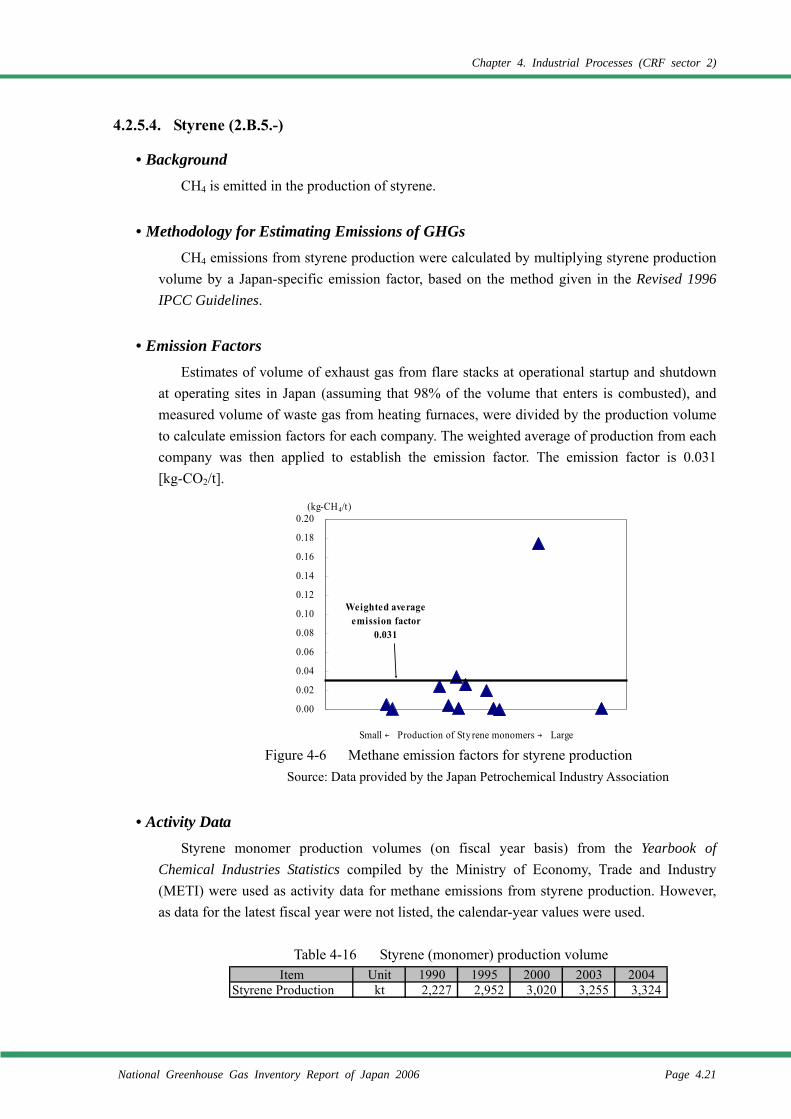
Chapter 4. Industrial Processes (CRF sector 2)
National Greenhouse Gas Inventory Report of Japan 2006 Page 4.21
4.2.5.4. Styrene (2.B.5.-)
• Background CH4 is emitted in the production of styrene.
• Methodology for Estimating Emissions of GHGs CH4 emissions from styrene production were calculated by multiplying styrene production
volume by a Japan-specific emission factor, based on the method given in the Revised 1996 IPCC Guidelines.
• Emission Factors Estimates of volume of exhaust gas from flare stacks at operational startup and shutdown
at operating sites in Japan (assuming that 98% of the volume that enters is combusted), and measured volume of waste gas from heating furnaces, were divided by the production volume to calculate emission factors for each company. The weighted average of production from each company was then applied to establish the emission factor. The emission factor is 0.031 [kg-CO2/t].
Figure 4-6 Methane emission factors for styrene production Source: Data provided by the Japan Petrochemical Industry Association
• Activity Data Styrene monomer production volumes (on fiscal year basis) from the Yearbook of
Chemical Industries Statistics compiled by the Ministry of Economy, Trade and Industry (METI) were used as activity data for methane emissions from styrene production. However, as data for the latest fiscal year were not listed, the calendar-year values were used.
Table 4-16 Styrene (monomer) production volume
0.00
0.02
0.04
0.06
0.08
0.10
0.12
0.14
0.16
0.18
0.20(kg-CH4/t)
Weighted averageemission factor
0.031
Small ← Production of Sty rene monomers → Large
Item Unit 1990 1995 2000 2003 2004Styrene Production kt 2,227 2,952 3,020 3,255 3,324
Chapter 4. Industrial Processes (CRF sector2)
Page 4.22 National Greenhouse Gas Inventory Report of Japan 2006
4.2.5.5. Methanol (2.B.5.-)
• Background CH4 is emitted in the production of methanol.
• Methodology for Estimating Emissions of GHGs CH4 emissions from methanol production are calculated using the method given in the
Revised 1996 IPCC Guidelines. According to industry organizations, the production (synthesis) of methanol stopped in
Japan in 1995 due to the price difference with overseas methanol. Since then all methanol has been imported, and methanol production plants disappeared from Japan in about 1995. According to the Yearbook of Chemical Industries Statistics, beginning in 1997 there was also no production of refined methanol. Because the methanol refining process merely dewaters the synthesized methanol, in principle no CH4 is generated.
Accordingly, from 1990 to 1995, emissions are reported using the production volumes in industry organization statistics. For 1996 and thereafter, the report is “NO” because it is assumed that methanol has not been produced (synthesized) since 1995.
• Emission Factors The default value for methanol given in the Revised 1996 IPCC Guidelines was used. The
emission factor is 2 [kg-CH4/t] (Refer to Revised 1996 IPCC Guidelines Vol. 2 p 2.22, Table 2-9).
• Activity Data Production volumes of methanol (on calendar year basis) given in Methanol Supply and
Demand published by the Methanol and Formalin Association were used as activity data for methane emissions from methanol production.
Table 4-17 Methanol production volume
4.2.5.6. Coke (2.B.5.-)
1) CO2
Coke is mainly produced in the iron and steel production in Japan, and it is conceivable that carbon dioxide will be generated during the carbonization of coal in the process of producing coke, and it may leak from the lid of the coking furnace. Currently, however, there is no actual measurement data of emissions, and it is not possible to calculate emissions. No default emission factor is given in the Revised 1996 IPCC Guidelines, and emissions have been reported as “NE”.
Item Unit 1990 1991 1992 1993 1994 1995Methanol Production t 83,851 76,772 23,043 45,426 40,662 75,498
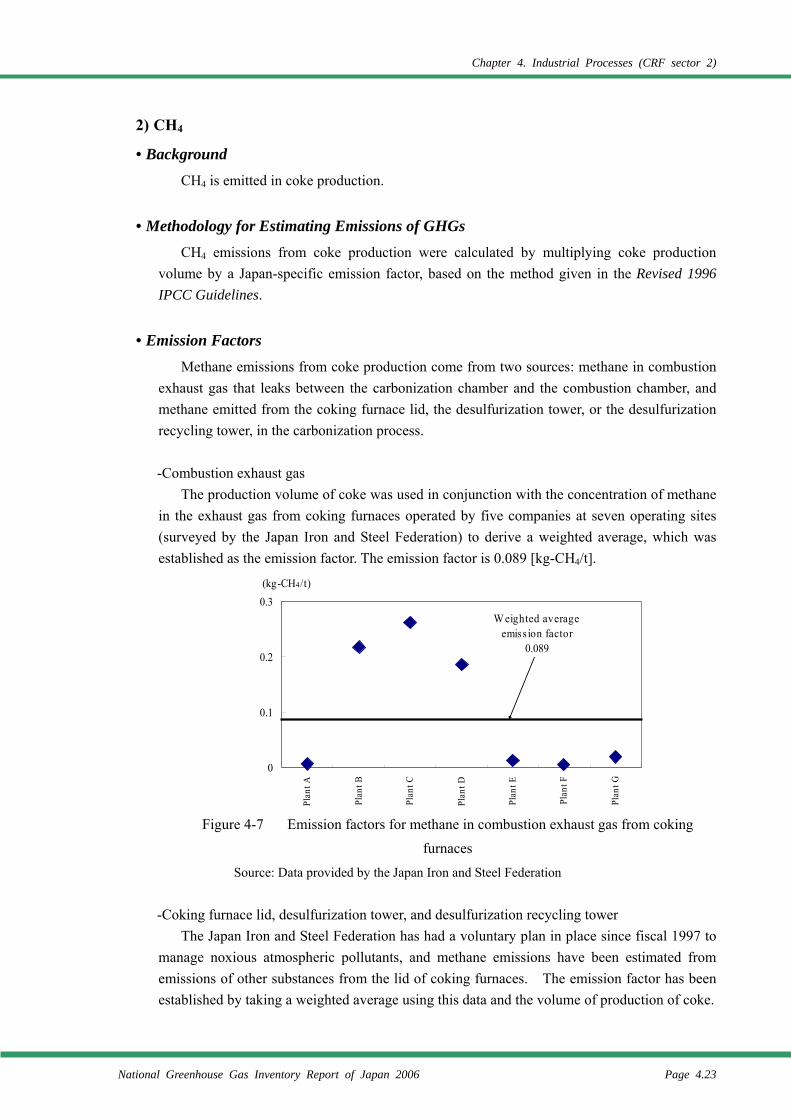
Chapter 4. Industrial Processes (CRF sector 2)
National Greenhouse Gas Inventory Report of Japan 2006 Page 4.23
2) CH4
• Background CH4 is emitted in coke production.
• Methodology for Estimating Emissions of GHGs CH4 emissions from coke production were calculated by multiplying coke production
volume by a Japan-specific emission factor, based on the method given in the Revised 1996 IPCC Guidelines.
• Emission Factors Methane emissions from coke production come from two sources: methane in combustion
exhaust gas that leaks between the carbonization chamber and the combustion chamber, and methane emitted from the coking furnace lid, the desulfurization tower, or the desulfurization recycling tower, in the carbonization process.
-Combustion exhaust gas
The production volume of coke was used in conjunction with the concentration of methane in the exhaust gas from coking furnaces operated by five companies at seven operating sites (surveyed by the Japan Iron and Steel Federation) to derive a weighted average, which was established as the emission factor. The emission factor is 0.089 [kg-CH4/t].
Figure 4-7 Emission factors for methane in combustion exhaust gas from coking furnaces
Source: Data provided by the Japan Iron and Steel Federation
-Coking furnace lid, desulfurization tower, and desulfurization recycling tower The Japan Iron and Steel Federation has had a voluntary plan in place since fiscal 1997 to
manage noxious atmospheric pollutants, and methane emissions have been estimated from emissions of other substances from the lid of coking furnaces. The emission factor has been established by taking a weighted average using this data and the volume of production of coke.
0
0.1
0.2
0.3
Plan
t A
Plan
t B
Plan
t C
Plan
t D
Plan
t E
Plan
t F
Plan
t G
(kg-CH4/t)
Weighted averageemiss ion factor
0.089
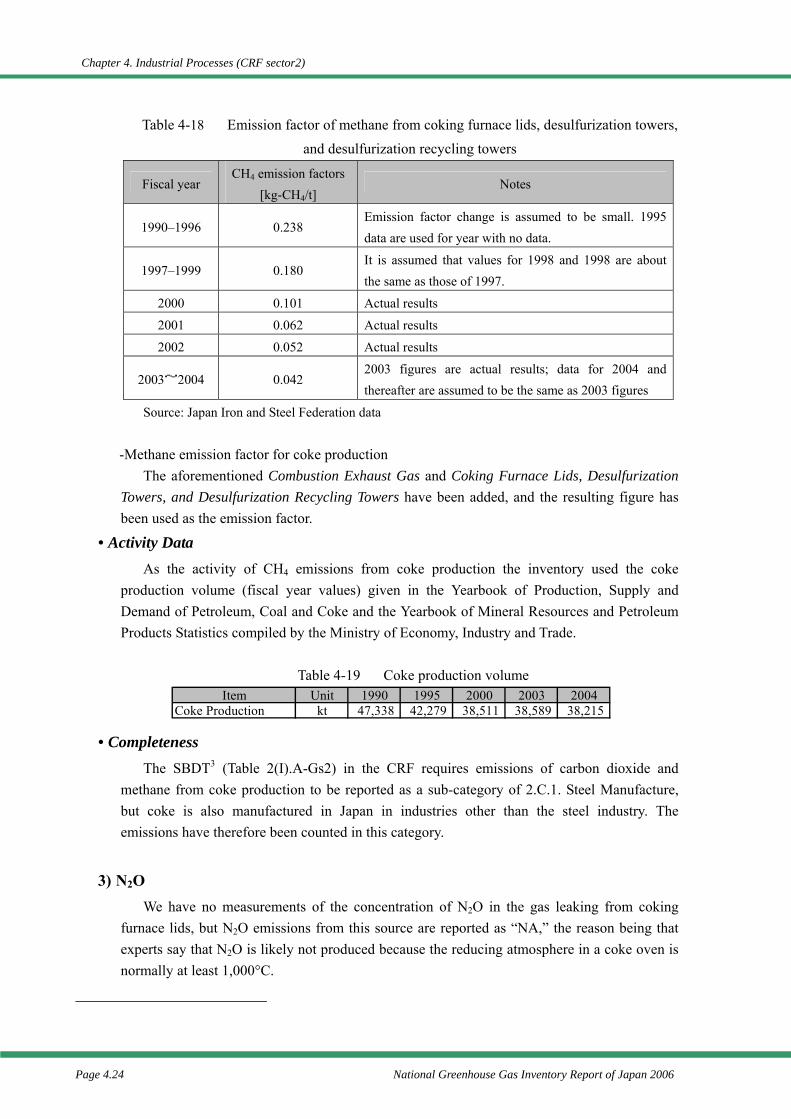
Chapter 4. Industrial Processes (CRF sector2)
Page 4.24 National Greenhouse Gas Inventory Report of Japan 2006
Table 4-18 Emission factor of methane from coking furnace lids, desulfurization towers, and desulfurization recycling towers
Fiscal year CH4 emission factors
[kg-CH4/t] Notes
1990–1996 0.238 Emission factor change is assumed to be small. 1995 data are used for year with no data.
1997–1999 0.180 It is assumed that values for 1998 and 1998 are about the same as those of 1997.
2000 0.101 Actual results
2001 0.062 Actual results
2002 0.052 Actual results
2003~2004 0.042 2003 figures are actual results; data for 2004 and thereafter are assumed to be the same as 2003 figures
Source: Japan Iron and Steel Federation data
-Methane emission factor for coke production The aforementioned Combustion Exhaust Gas and Coking Furnace Lids, Desulfurization
Towers, and Desulfurization Recycling Towers have been added, and the resulting figure has been used as the emission factor.
• Activity Data As the activity of CH4 emissions from coke production the inventory used the coke
production volume (fiscal year values) given in the Yearbook of Production, Supply and Demand of Petroleum, Coal and Coke and the Yearbook of Mineral Resources and Petroleum Products Statistics compiled by the Ministry of Economy, Industry and Trade.
Table 4-19 Coke production volume
• Completeness The SBDT3 (Table 2(I).A-Gs2) in the CRF requires emissions of carbon dioxide and
methane from coke production to be reported as a sub-category of 2.C.1. Steel Manufacture, but coke is also manufactured in Japan in industries other than the steel industry. The emissions have therefore been counted in this category.
3) N2O We have no measurements of the concentration of N2O in the gas leaking from coking
furnace lids, but N2O emissions from this source are reported as “NA,” the reason being that experts say that N2O is likely not produced because the reducing atmosphere in a coke oven is normally at least 1,000°C.
Item Unit 1990 1995 2000 2003 2004Coke Production kt 47,338 42,279 38,511 38,589 38,215
Chapter 4. Industrial Processes (CRF sector 2)
National Greenhouse Gas Inventory Report of Japan 2006 Page 4.25
4.3. Metal Production (2.C.)
4.3.1. Iron and Steel Production (2.C.1.)
4.3.1.1. Steel (2.C.1.-)
1) CO2 Coke oxidizes when it is used as a reduction agent in the steel production, and carbon
dioxide is generated. The volume of coke used has been included under consumption of fuel in Fuel Combustion Sector (1.A.), and the carbon dioxide generated through the oxidization of coke used as a reducing agent has already been calculated under Fuel Combustion Sector (1.A.), too. Therefore, it has been reported as “IE”.
4.3.1.2. Pig Iron (2.C.1.-)
1) CO2 Carbon dioxide generated from pig iron production is emitted when coke is used as a
reduction agent. The amount of coke used has been included under consumption of fuel in Fuel Combustion Sector (1.A.), and the carbon dioxide generated through the oxidization of coke used as a reducing agent has already been calculated under Fuel Combustion Sector (1.A.), too. Therefore, it has been reported as “IE”.
2) CH4 It is not theoretically possible that methane will be generated in association with the pig
iron production, and it has been confirmed that methane is not emitted from actual measurements. Therefore, emissions have been reported as “NA”.
4.3.1.3. Sinter (2.C.1.-)
1) CO2 CO2 generated when making sinter is all generated by the combustion of coke fines; these
emissions come under the Fuel Combustion Sector (1.A.). As they are already calculated in this sector, they are reported as “IE”.
CO2 emissions from limestone and dolomite used when making sinter are counted under “4.1.3. Limestone and Dolomite Use”.
2) CH4 CH4 generated when making sinter is all generated by the combustion of coke fines; these
emissions come under the Fuel Combustion Sector (1.A.). As they are already calculated in this sector, they are reported as “IE”.
Chapter 4. Industrial Processes (CRF sector2)
Page 4.26 National Greenhouse Gas Inventory Report of Japan 2006
4.3.1.4. Coke (2.C.1.-)
1) CO2 Coke is mainly produced in the iron and steel production in Japan, and it is conceivable
that carbon dioxide generated during the carbonization of coal in the process of producing coke may leak from the lid of the coking furnace. Currently, however, there is no actual measurement data of emissions, and it is not possible to calculate emissions. No default emission factor is given in the Revised 1996 IPCC Guidelines, and emissions have been reported as “NE”.
2) CH4 Emissions of methane were calculated at 4.2.5.6. Coke (2.B.5.f.), and have been reported as
“IE”.
4.3.1.5. Use of Electric Arc Furnaces in Steel Production (2.C.1.-)
• Background CO2 is emitted from carbon electrodes when using electric arc furnaces to make steel.
• Methodology for Estimating Emissions of GHGs CO2 emissions from arc furnaces for steel production are calculated by multiplying the
crude steel production volume from arc furnaces in Japan by the default emission factor given in GPG (2000), and using the method given in GPG (2000).
• Emission Factor The default value [5 kg-CO2/t] given in GPG (2000) is used (page 3.28).
• Activity Data The inventory uses crude steel production volume by arc furnace given in the Yearbook of
Iron and Steel, Non-ferrous Metals, and Fabricated Metals Statistics compiled by the Ministry of Economy, Trade and Industry. However, as data for the latest fiscal year are not listed, the calendar-year values are used.
Table 4-20 Crude steel production by electric arc furnace
4.3.2. Ferroalloys Production (2.C.2.)
1) CO2 Ferroalloys are produced in Japan, and the carbon dioxide that is generated in association
with the ferroalloys production is emitted as a result of the oxidization of coke used as a
Item Unit 1990 1995 2000 2003 2004Crude Steel Production in electric furnace kt 35,336 32,665 30,547 29,002 29,762
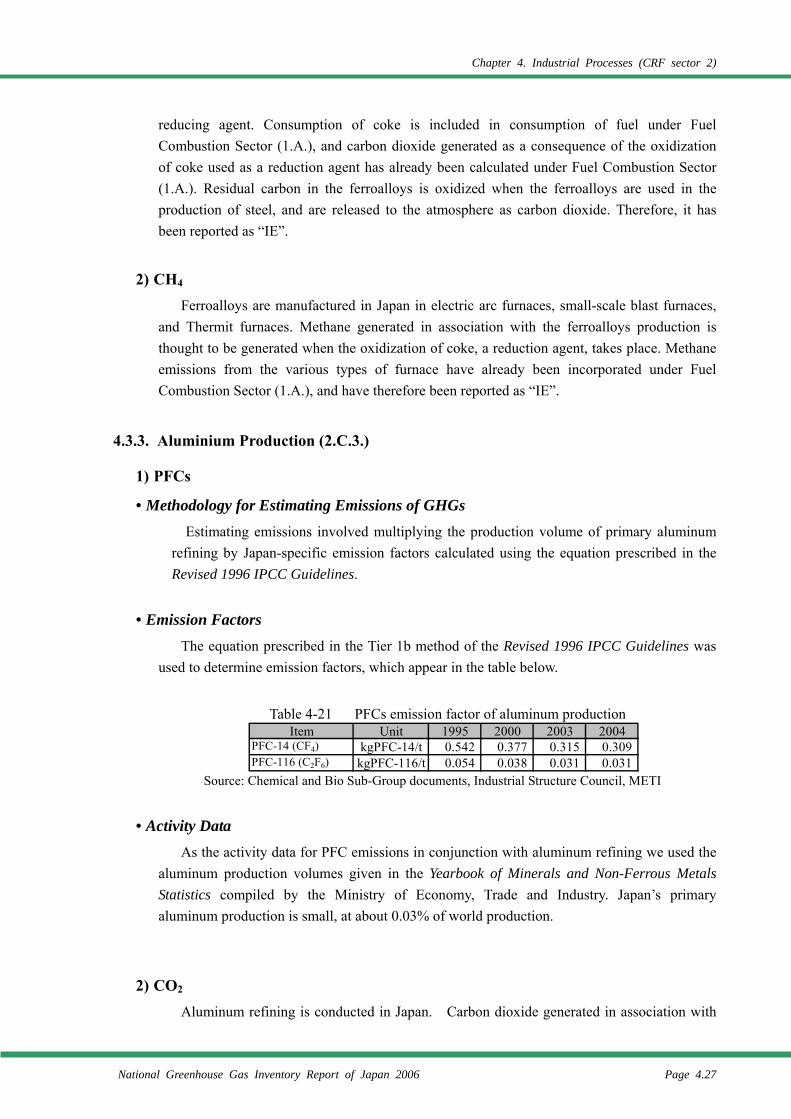
Chapter 4. Industrial Processes (CRF sector 2)
National Greenhouse Gas Inventory Report of Japan 2006 Page 4.27
reducing agent. Consumption of coke is included in consumption of fuel under Fuel Combustion Sector (1.A.), and carbon dioxide generated as a consequence of the oxidization of coke used as a reduction agent has already been calculated under Fuel Combustion Sector (1.A.). Residual carbon in the ferroalloys is oxidized when the ferroalloys are used in the production of steel, and are released to the atmosphere as carbon dioxide. Therefore, it has been reported as “IE”.
2) CH4 Ferroalloys are manufactured in Japan in electric arc furnaces, small-scale blast furnaces,
and Thermit furnaces. Methane generated in association with the ferroalloys production is thought to be generated when the oxidization of coke, a reduction agent, takes place. Methane emissions from the various types of furnace have already been incorporated under Fuel Combustion Sector (1.A.), and have therefore been reported as “IE”.
4.3.3. Aluminium Production (2.C.3.)
1) PFCs
• Methodology for Estimating Emissions of GHGs Estimating emissions involved multiplying the production volume of primary aluminum
refining by Japan-specific emission factors calculated using the equation prescribed in the Revised 1996 IPCC Guidelines.
• Emission Factors The equation prescribed in the Tier 1b method of the Revised 1996 IPCC Guidelines was
used to determine emission factors, which appear in the table below.
Table 4-21 PFCs emission factor of aluminum production
Source: Chemical and Bio Sub-Group documents, Industrial Structure Council, METI
• Activity Data As the activity data for PFC emissions in conjunction with aluminum refining we used the
aluminum production volumes given in the Yearbook of Minerals and Non-Ferrous Metals Statistics compiled by the Ministry of Economy, Trade and Industry. Japan’s primary aluminum production is small, at about 0.03% of world production.
2) CO2 Aluminum refining is conducted in Japan. Carbon dioxide generated in association with
Item Unit 1995 2000 2003 2004PFC-14 (CF4) kgPFC-14/t 0.542 0.377 0.315 0.309PFC-116 (C2F6) kgPFC-116/t 0.054 0.038 0.031 0.031
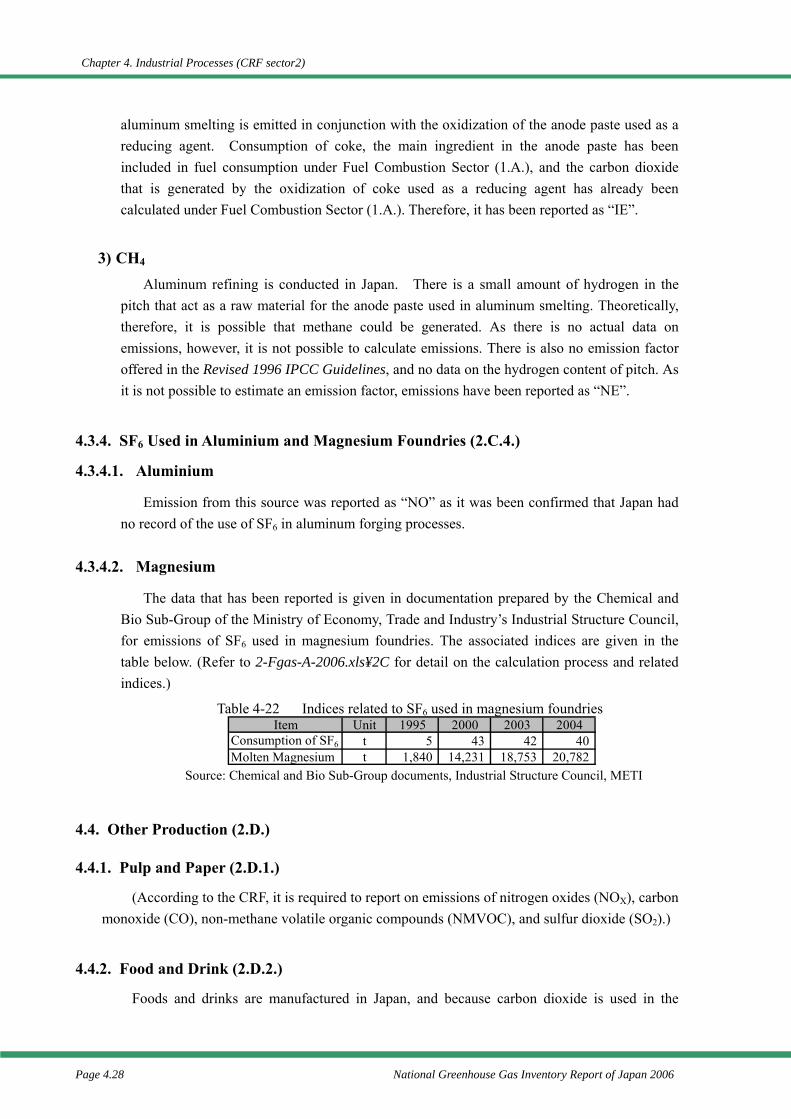
Chapter 4. Industrial Processes (CRF sector2)
Page 4.28 National Greenhouse Gas Inventory Report of Japan 2006
aluminum smelting is emitted in conjunction with the oxidization of the anode paste used as a reducing agent. Consumption of coke, the main ingredient in the anode paste has been included in fuel consumption under Fuel Combustion Sector (1.A.), and the carbon dioxide that is generated by the oxidization of coke used as a reducing agent has already been calculated under Fuel Combustion Sector (1.A.). Therefore, it has been reported as “IE”.
3) CH4 Aluminum refining is conducted in Japan. There is a small amount of hydrogen in the
pitch that act as a raw material for the anode paste used in aluminum smelting. Theoretically, therefore, it is possible that methane could be generated. As there is no actual data on emissions, however, it is not possible to calculate emissions. There is also no emission factor offered in the Revised 1996 IPCC Guidelines, and no data on the hydrogen content of pitch. As it is not possible to estimate an emission factor, emissions have been reported as “NE”.
4.3.4. SF6 Used in Aluminium and Magnesium Foundries (2.C.4.)
4.3.4.1. Aluminium
Emission from this source was reported as “NO” as it was been confirmed that Japan had no record of the use of SF6 in aluminum forging processes.
4.3.4.2. Magnesium
The data that has been reported is given in documentation prepared by the Chemical and Bio Sub-Group of the Ministry of Economy, Trade and Industry’s Industrial Structure Council, for emissions of SF6 used in magnesium foundries. The associated indices are given in the table below. (Refer to 2-Fgas-A-2006.xls¥2C for detail on the calculation process and related indices.)
Table 4-22 Indices related to SF6 used in magnesium foundries
Source: Chemical and Bio Sub-Group documents, Industrial Structure Council, METI
4.4. Other Production (2.D.)
4.4.1. Pulp and Paper (2.D.1.)
(According to the CRF, it is required to report on emissions of nitrogen oxides (NOX), carbon monoxide (CO), non-methane volatile organic compounds (NMVOC), and sulfur dioxide (SO2).)
4.4.2. Food and Drink (2.D.2.)
Foods and drinks are manufactured in Japan, and because carbon dioxide is used in the
Item Unit 1995 2000 2003 2004Consumption of SF6 t 5 43 42 40Molten Magnesium t 1,840 14,231 18,753 20,782
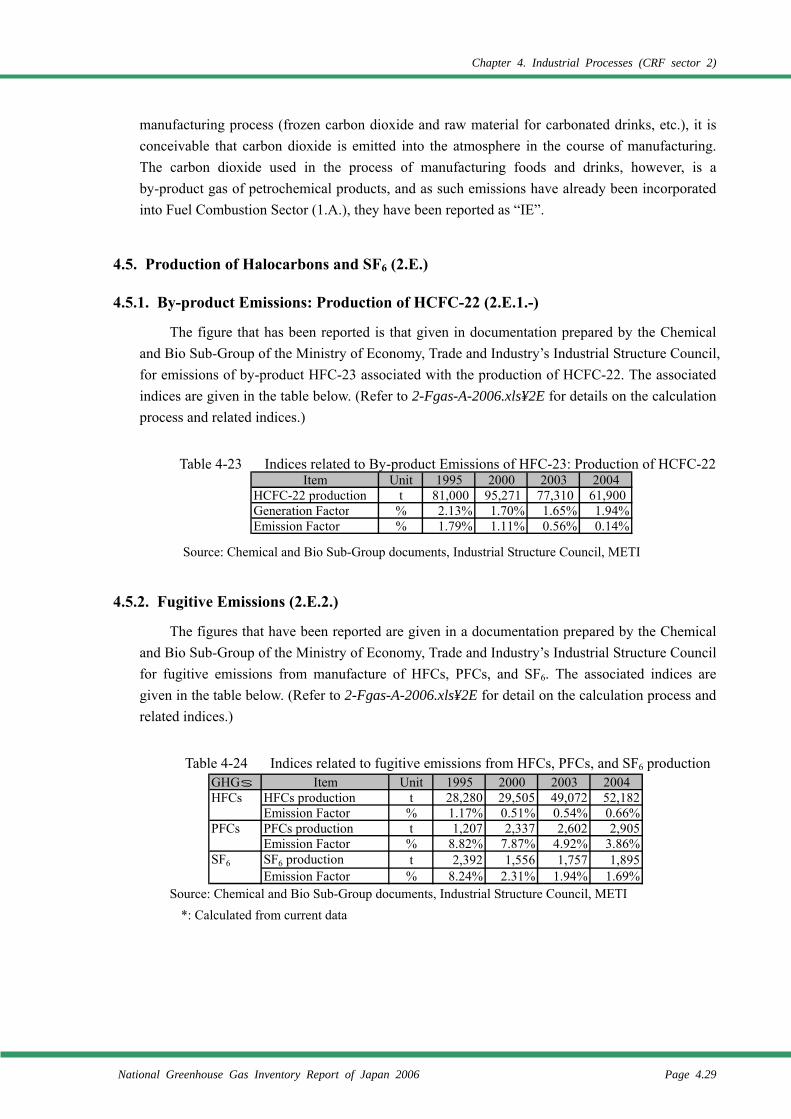
Chapter 4. Industrial Processes (CRF sector 2)
National Greenhouse Gas Inventory Report of Japan 2006 Page 4.29
manufacturing process (frozen carbon dioxide and raw material for carbonated drinks, etc.), it is conceivable that carbon dioxide is emitted into the atmosphere in the course of manufacturing. The carbon dioxide used in the process of manufacturing foods and drinks, however, is a by-product gas of petrochemical products, and as such emissions have already been incorporated into Fuel Combustion Sector (1.A.), they have been reported as “IE”.
4.5. Production of Halocarbons and SF6 (2.E.)
4.5.1. By-product Emissions: Production of HCFC-22 (2.E.1.-)
The figure that has been reported is that given in documentation prepared by the Chemical and Bio Sub-Group of the Ministry of Economy, Trade and Industry’s Industrial Structure Council, for emissions of by-product HFC-23 associated with the production of HCFC-22. The associated indices are given in the table below. (Refer to 2-Fgas-A-2006.xls¥2E for details on the calculation process and related indices.)
Table 4-23 Indices related to By-product Emissions of HFC-23: Production of HCFC-22
Source: Chemical and Bio Sub-Group documents, Industrial Structure Council, METI
4.5.2. Fugitive Emissions (2.E.2.)
The figures that have been reported are given in a documentation prepared by the Chemical and Bio Sub-Group of the Ministry of Economy, Trade and Industry’s Industrial Structure Council for fugitive emissions from manufacture of HFCs, PFCs, and SF6. The associated indices are given in the table below. (Refer to 2-Fgas-A-2006.xls¥2E for detail on the calculation process and related indices.)
Table 4-24 Indices related to fugitive emissions from HFCs, PFCs, and SF6 production Source: Chemical and Bio Sub-Group documents, Industrial Structure Council, METI
*: Calculated from current data
Item Unit 1995 2000 2003 2004HCFC-22 production t 81,000 95,271 77,310 61,900Generation Factor % 2.13% 1.70% 1.65% 1.94%Emission Factor % 1.79% 1.11% 0.56% 0.14%
GHGs Item Unit 1995 2000 2003 2004HFCs HFCs production t 28,280 29,505 49,072 52,182
Emission Factor % 1.17% 0.51% 0.54% 0.66%PFCs PFCs production t 1,207 2,337 2,602 2,905
Emission Factor % 8.82% 7.87% 4.92% 3.86%SF6 SF6 production t 2,392 1,556 1,757 1,895
Emission Factor % 8.24% 2.31% 1.94% 1.69%
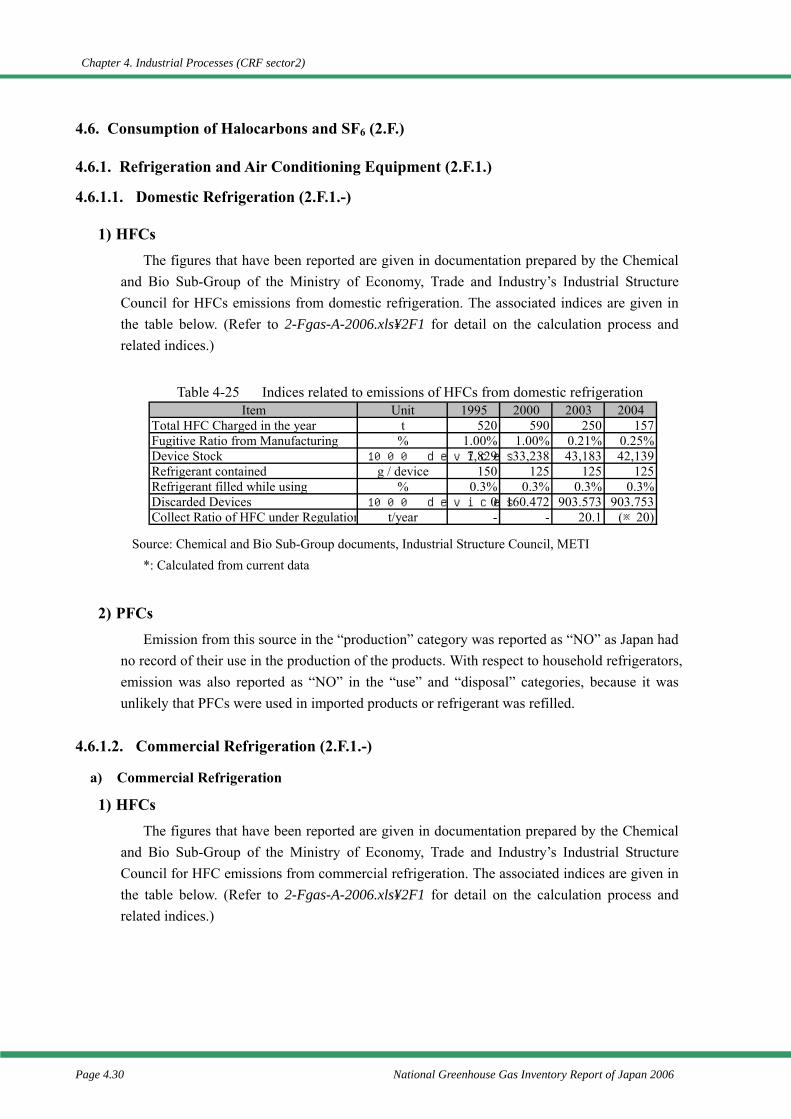
Chapter 4. Industrial Processes (CRF sector2)
Page 4.30 National Greenhouse Gas Inventory Report of Japan 2006
4.6. Consumption of Halocarbons and SF6 (2.F.)
4.6.1. Refrigeration and Air Conditioning Equipment (2.F.1.)
4.6.1.1. Domestic Refrigeration (2.F.1.-)
1) HFCs The figures that have been reported are given in documentation prepared by the Chemical
and Bio Sub-Group of the Ministry of Economy, Trade and Industry’s Industrial Structure Council for HFCs emissions from domestic refrigeration. The associated indices are given in the table below. (Refer to 2-Fgas-A-2006.xls¥2F1 for detail on the calculation process and related indices.)
Table 4-25 Indices related to emissions of HFCs from domestic refrigeration Source: Chemical and Bio Sub-Group documents, Industrial Structure Council, METI
*: Calculated from current data
2) PFCs Emission from this source in the “production” category was reported as “NO” as Japan had
no record of their use in the production of the products. With respect to household refrigerators, emission was also reported as “NO” in the “use” and “disposal” categories, because it was unlikely that PFCs were used in imported products or refrigerant was refilled.
4.6.1.2. Commercial Refrigeration (2.F.1.-)
a) Commercial Refrigeration
1) HFCs The figures that have been reported are given in documentation prepared by the Chemical
and Bio Sub-Group of the Ministry of Economy, Trade and Industry’s Industrial Structure Council for HFC emissions from commercial refrigeration. The associated indices are given in the table below. (Refer to 2-Fgas-A-2006.xls¥2F1 for detail on the calculation process and related indices.)
Item Unit 1995 2000 2003 2004Total HFC Charged in the year t 520 590 250 157
Fugitive Ratio from Manufacturing % 1.00% 1.00% 0.21% 0.25%Device Stock 1000 devices 7,829 33,238 43,183 42,139Refrigerant contained g / device 150 125 125 125Refrigerant filled while using % 0.3% 0.3% 0.3% 0.3%Discarded Devices 1000 devices 0 160.472 903.573 903.753Collect Ratio of HFC under Regulation t/year - - 20.1 (※20)
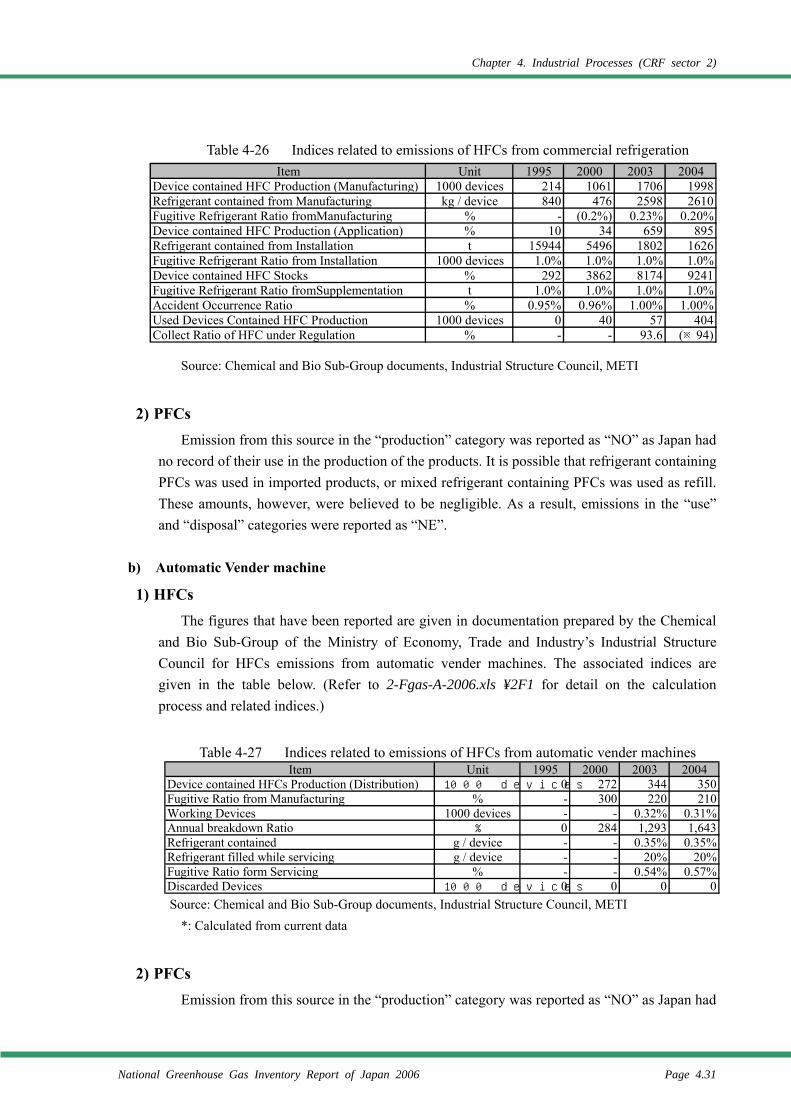
Chapter 4. Industrial Processes (CRF sector 2)
National Greenhouse Gas Inventory Report of Japan 2006 Page 4.31
Table 4-26 Indices related to emissions of HFCs from commercial refrigeration Source: Chemical and Bio Sub-Group documents, Industrial Structure Council, METI
2) PFCs Emission from this source in the “production” category was reported as “NO” as Japan had
no record of their use in the production of the products. It is possible that refrigerant containing PFCs was used in imported products, or mixed refrigerant containing PFCs was used as refill. These amounts, however, were believed to be negligible. As a result, emissions in the “use” and “disposal” categories were reported as “NE”.
b) Automatic Vender machine
1) HFCs The figures that have been reported are given in documentation prepared by the Chemical
and Bio Sub-Group of the Ministry of Economy, Trade and Industry’s Industrial Structure Council for HFCs emissions from automatic vender machines. The associated indices are given in the table below. (Refer to 2-Fgas-A-2006.xls ¥2F1 for detail on the calculation process and related indices.)
Table 4-27 Indices related to emissions of HFCs from automatic vender machines Source: Chemical and Bio Sub-Group documents, Industrial Structure Council, METI
*: Calculated from current data
2) PFCs Emission from this source in the “production” category was reported as “NO” as Japan had
Item Unit 1995 2000 2003 2004Device contained HFC Production (Manufacturing) 1000 devices 214 1061 1706 1998Refrigerant contained from Manufacturing kg / device 840 476 2598 2610
Fugitive Refrigerant Ratio fromManufacturing % - (0.2%) 0.23% 0.20% Device contained HFC Production (Application) % 10 34 659 895
Refrigerant contained from Installation t 15944 5496 1802 1626Fugitive Refrigerant Ratio from Installation 1000 devices 1.0% 1.0% 1.0% 1.0%Device contained HFC Stocks % 292 3862 8174 9241
Fugitive Refrigerant Ratio fromSupplementation t 1.0% 1.0% 1.0% 1.0%Accident Occurrence Ratio % 0.95% 0.96% 1.00% 1.00%Used Devices Contained HFC Production 1000 devices 0 40 57 404Collect Ratio of HFC under Regulation % - - 93.6 (※94)
Item Unit 1995 2000 2003 2004Device contained HFCs Production (Distribution) 1000 devices 0 272 344 350
Fugitive Ratio from Manufacturing % - 300 220 210Working Devices 1000 devices - - 0.32% 0.31%Annual breakdown Ratio % 0 284 1,293 1,643Refrigerant contained g / device - - 0.35% 0.35%Refrigerant filled while servicing g / device - - 20% 20%Fugitive Ratio form Servicing % - - 0.54% 0.57%Discarded Devices 1000 devices 0 0 0 0
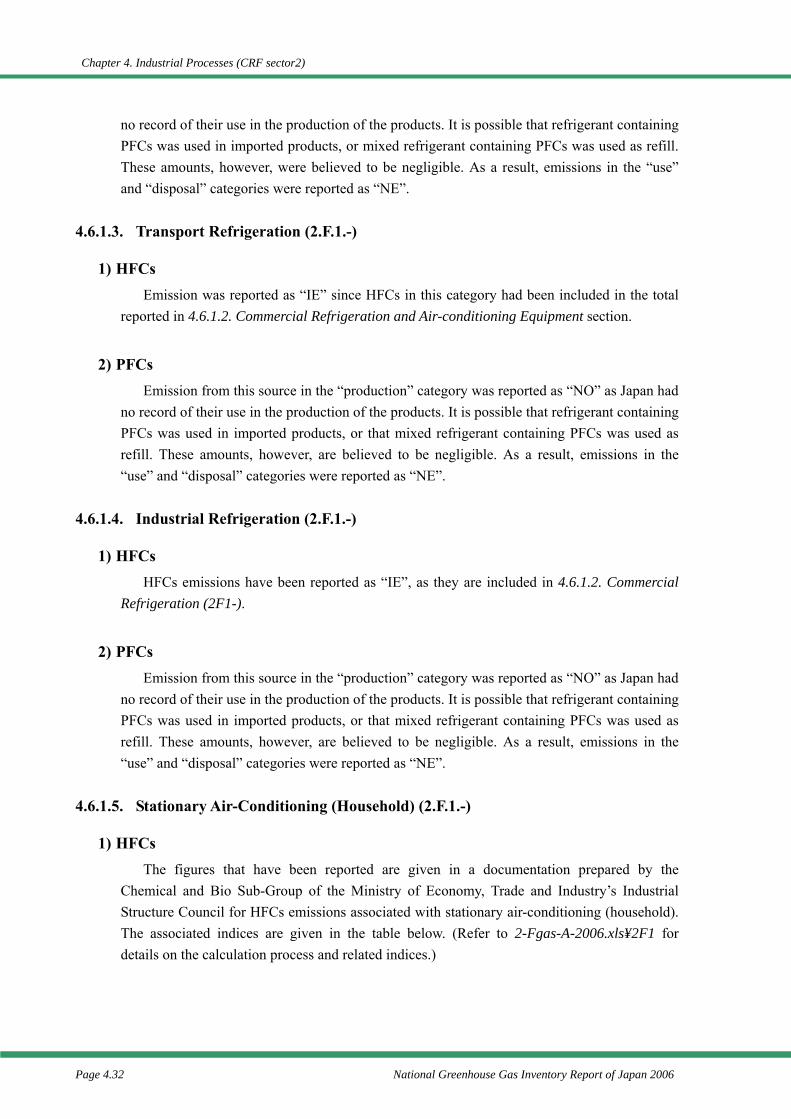
Chapter 4. Industrial Processes (CRF sector2)
Page 4.32 National Greenhouse Gas Inventory Report of Japan 2006
no record of their use in the production of the products. It is possible that refrigerant containing PFCs was used in imported products, or mixed refrigerant containing PFCs was used as refill. These amounts, however, were believed to be negligible. As a result, emissions in the “use” and “disposal” categories were reported as “NE”.
4.6.1.3. Transport Refrigeration (2.F.1.-)
1) HFCs Emission was reported as “IE” since HFCs in this category had been included in the total
reported in 4.6.1.2. Commercial Refrigeration and Air-conditioning Equipment section.
2) PFCs Emission from this source in the “production” category was reported as “NO” as Japan had
no record of their use in the production of the products. It is possible that refrigerant containing PFCs was used in imported products, or that mixed refrigerant containing PFCs was used as refill. These amounts, however, are believed to be negligible. As a result, emissions in the “use” and “disposal” categories were reported as “NE”.
4.6.1.4. Industrial Refrigeration (2.F.1.-)
1) HFCs HFCs emissions have been reported as “IE”, as they are included in 4.6.1.2. Commercial
Refrigeration (2F1-).
2) PFCs Emission from this source in the “production” category was reported as “NO” as Japan had
no record of their use in the production of the products. It is possible that refrigerant containing PFCs was used in imported products, or that mixed refrigerant containing PFCs was used as refill. These amounts, however, are believed to be negligible. As a result, emissions in the “use” and “disposal” categories were reported as “NE”.
4.6.1.5. Stationary Air-Conditioning (Household) (2.F.1.-)
1) HFCs The figures that have been reported are given in a documentation prepared by the
Chemical and Bio Sub-Group of the Ministry of Economy, Trade and Industry’s Industrial Structure Council for HFCs emissions associated with stationary air-conditioning (household). The associated indices are given in the table below. (Refer to 2-Fgas-A-2006.xls¥2F1 for details on the calculation process and related indices.)
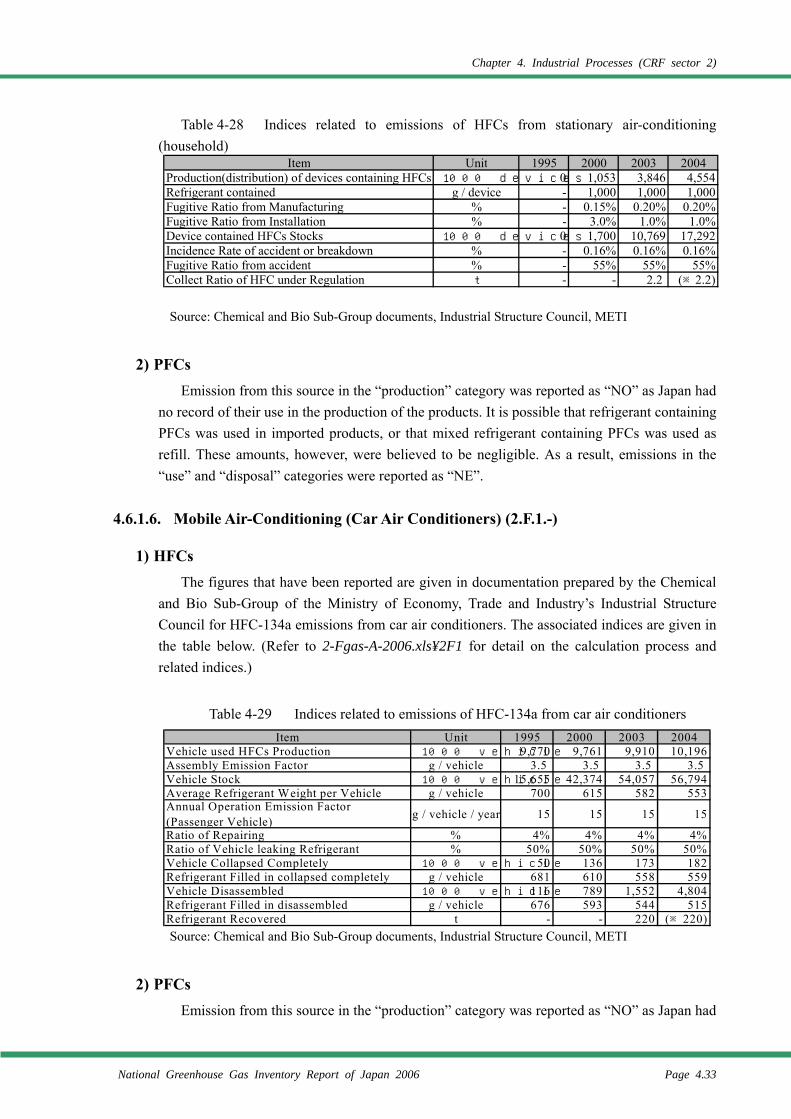
Chapter 4. Industrial Processes (CRF sector 2)
National Greenhouse Gas Inventory Report of Japan 2006 Page 4.33
Table 4-28 Indices related to emissions of HFCs from stationary air-conditioning (household)
Source: Chemical and Bio Sub-Group documents, Industrial Structure Council, METI
2) PFCs Emission from this source in the “production” category was reported as “NO” as Japan had
no record of their use in the production of the products. It is possible that refrigerant containing PFCs was used in imported products, or that mixed refrigerant containing PFCs was used as refill. These amounts, however, were believed to be negligible. As a result, emissions in the “use” and “disposal” categories were reported as “NE”.
4.6.1.6. Mobile Air-Conditioning (Car Air Conditioners) (2.F.1.-)
1) HFCs The figures that have been reported are given in documentation prepared by the Chemical
and Bio Sub-Group of the Ministry of Economy, Trade and Industry’s Industrial Structure Council for HFC-134a emissions from car air conditioners. The associated indices are given in the table below. (Refer to 2-Fgas-A-2006.xls¥2F1 for detail on the calculation process and related indices.)
Table 4-29 Indices related to emissions of HFC-134a from car air conditioners
Source: Chemical and Bio Sub-Group documents, Industrial Structure Council, METI
2) PFCs Emission from this source in the “production” category was reported as “NO” as Japan had
Item Unit 1995 2000 2003 2004Production(distribution) of devices containing HFCs 1000 devices 0 1,053 3,846 4,554Refrigerant contained g / device - 1,000 1,000 1,000
Fugitive Ratio from Manufacturing % - 0.15% 0.20% 0.20% Fugitive Ratio from Installation % - 3.0% 1.0% 1.0%
Device contained HFCs Stocks 1000 devices 0 1,700 10,769 17,292Incidence Rate of accident or breakdown % - 0.16% 0.16% 0.16%
Fugitive Ratio from accident % - 55% 55% 55%Collect Ratio of HFC under Regulation t - - 2.2 (※2.2)
Item Unit 1995 2000 2003 2004Vehicle used HFCs Production 1000 vehicle 9,770 9,761 9,910 10,196Assembly Emission Factor g / vehicle 3.5 3.5 3.5 3.5Vehicle Stock 1000 vehicle 15,655 42,374 54,057 56,794Average Refrigerant Weight per Vehicle g / vehicle 700 615 582 553Annual Operation Emission Factor(Passenger Vehicle) g / vehicle / year 15 15 15 15
Ratio of Repairing % 4% 4% 4% 4%Ratio of Vehicle leaking Refrigerant % 50% 50% 50% 50%Vehicle Collapsed Completely 1000 vehicle 50 136 173 182Refrigerant Filled in collapsed completely g / vehicle 681 610 558 559Vehicle Disassembled 1000 vehicle 116 789 1,552 4,804Refrigerant Filled in disassembled g / vehicle 676 593 544 515Refrigerant Recovered t - - 220 (※220)
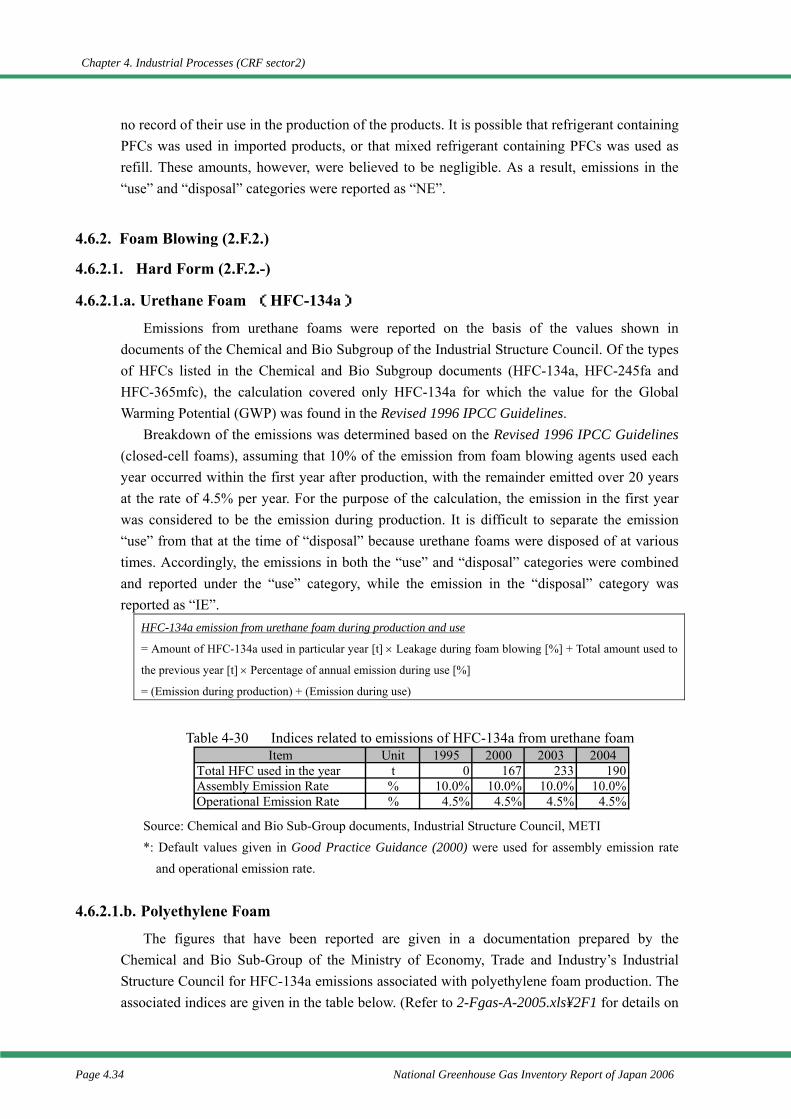
Chapter 4. Industrial Processes (CRF sector2)
Page 4.34 National Greenhouse Gas Inventory Report of Japan 2006
no record of their use in the production of the products. It is possible that refrigerant containing PFCs was used in imported products, or that mixed refrigerant containing PFCs was used as refill. These amounts, however, were believed to be negligible. As a result, emissions in the “use” and “disposal” categories were reported as “NE”.
4.6.2. Foam Blowing (2.F.2.)
4.6.2.1. Hard Form (2.F.2.-)
4.6.2.1.a. Urethane Foam (HFC-134a)
Emissions from urethane foams were reported on the basis of the values shown in documents of the Chemical and Bio Subgroup of the Industrial Structure Council. Of the types of HFCs listed in the Chemical and Bio Subgroup documents (HFC-134a, HFC-245fa and HFC-365mfc), the calculation covered only HFC-134a for which the value for the Global Warming Potential (GWP) was found in the Revised 1996 IPCC Guidelines.
Breakdown of the emissions was determined based on the Revised 1996 IPCC Guidelines (closed-cell foams), assuming that 10% of the emission from foam blowing agents used each year occurred within the first year after production, with the remainder emitted over 20 years at the rate of 4.5% per year. For the purpose of the calculation, the emission in the first year was considered to be the emission during production. It is difficult to separate the emission “use” from that at the time of “disposal” because urethane foams were disposed of at various times. Accordingly, the emissions in both the “use” and “disposal” categories were combined and reported under the “use” category, while the emission in the “disposal” category was reported as “IE”.
HFC-134a emission from urethane foam during production and use
= Amount of HFC-134a used in particular year [t] × Leakage during foam blowing [%] + Total amount used to
the previous year [t] × Percentage of annual emission during use [%]
= (Emission during production) + (Emission during use)
Table 4-30 Indices related to emissions of HFC-134a from urethane foam
Source: Chemical and Bio Sub-Group documents, Industrial Structure Council, METI *: Default values given in Good Practice Guidance (2000) were used for assembly emission rate
and operational emission rate.
4.6.2.1.b. Polyethylene Foam
The figures that have been reported are given in a documentation prepared by the Chemical and Bio Sub-Group of the Ministry of Economy, Trade and Industry’s Industrial Structure Council for HFC-134a emissions associated with polyethylene foam production. The associated indices are given in the table below. (Refer to 2-Fgas-A-2005.xls¥2F1 for details on
Item Unit 1995 2000 2003 2004Total HFC used in the year t 0 167 233 190Assembly Emission Rate % 10.0% 10.0% 10.0% 10.0%Operational Emission Rate % 4.5% 4.5% 4.5% 4.5%
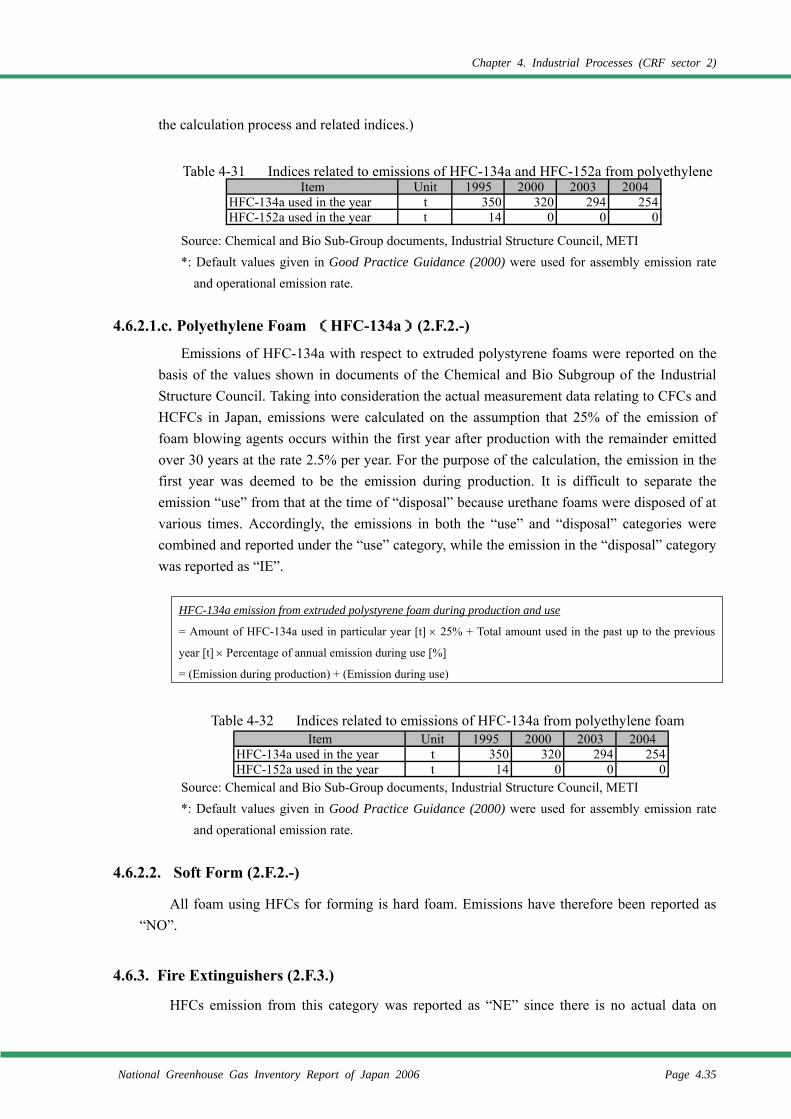
Chapter 4. Industrial Processes (CRF sector 2)
National Greenhouse Gas Inventory Report of Japan 2006 Page 4.35
the calculation process and related indices.)
Table 4-31 Indices related to emissions of HFC-134a and HFC-152a from polyethylene foam
Source: Chemical and Bio Sub-Group documents, Industrial Structure Council, METI *: Default values given in Good Practice Guidance (2000) were used for assembly emission rate
and operational emission rate.
4.6.2.1.c. Polyethylene Foam (HFC-134a)(2.F.2.-)
Emissions of HFC-134a with respect to extruded polystyrene foams were reported on the basis of the values shown in documents of the Chemical and Bio Subgroup of the Industrial Structure Council. Taking into consideration the actual measurement data relating to CFCs and HCFCs in Japan, emissions were calculated on the assumption that 25% of the emission of foam blowing agents occurs within the first year after production with the remainder emitted over 30 years at the rate 2.5% per year. For the purpose of the calculation, the emission in the first year was deemed to be the emission during production. It is difficult to separate the emission “use” from that at the time of “disposal” because urethane foams were disposed of at various times. Accordingly, the emissions in both the “use” and “disposal” categories were combined and reported under the “use” category, while the emission in the “disposal” category was reported as “IE”.
HFC-134a emission from extruded polystyrene foam during production and use
= Amount of HFC-134a used in particular year [t] × 25% + Total amount used in the past up to the previous
year [t] × Percentage of annual emission during use [%]
= (Emission during production) + (Emission during use)
Table 4-32 Indices related to emissions of HFC-134a from polyethylene foam
Source: Chemical and Bio Sub-Group documents, Industrial Structure Council, METI *: Default values given in Good Practice Guidance (2000) were used for assembly emission rate
and operational emission rate.
4.6.2.2. Soft Form (2.F.2.-)
All foam using HFCs for forming is hard foam. Emissions have therefore been reported as “NO”.
4.6.3. Fire Extinguishers (2.F.3.)
HFCs emission from this category was reported as “NE” since there is no actual data on
Item Unit 1995 2000 2003 2004HFC-134a used in the year t 350 320 294 254HFC-152a used in the year t 14 0 0 0
Item Unit 1995 2000 2003 2004HFC-134a used in the year t 350 320 294 254HFC-152a used in the year t 14 0 0 0
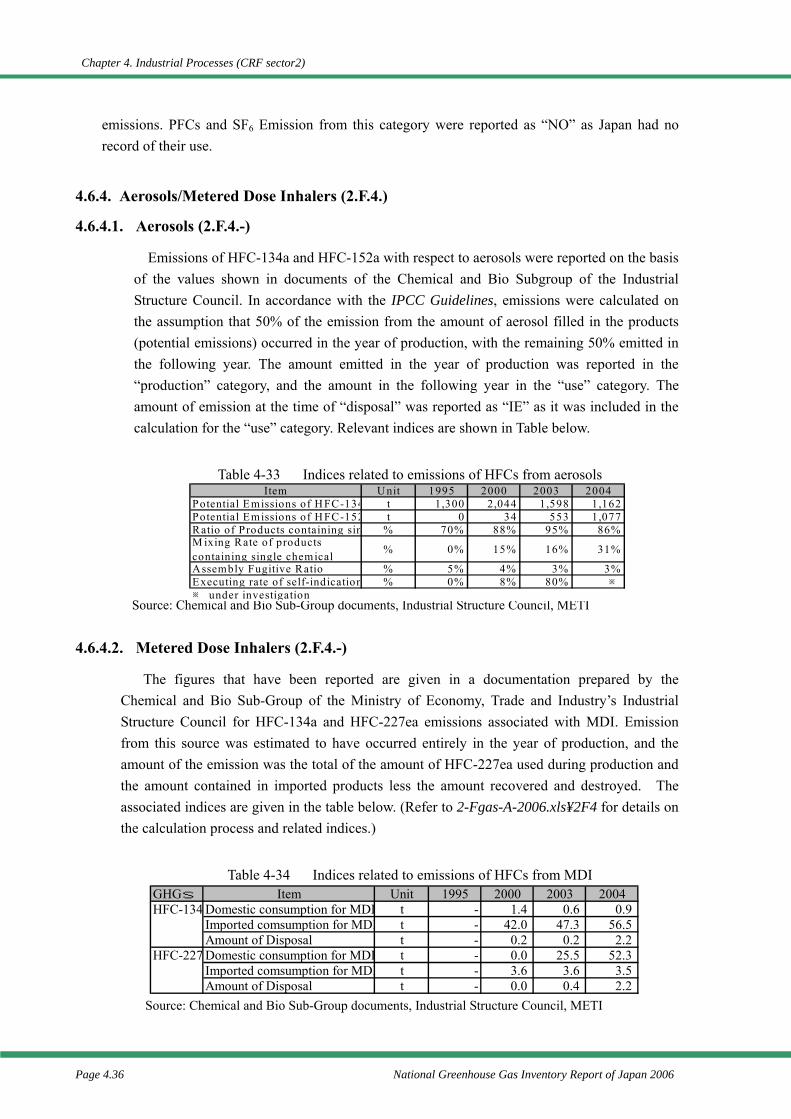
Chapter 4. Industrial Processes (CRF sector2)
Page 4.36 National Greenhouse Gas Inventory Report of Japan 2006
emissions. PFCs and SF6 Emission from this category were reported as “NO” as Japan had no record of their use.
4.6.4. Aerosols/Metered Dose Inhalers (2.F.4.)
4.6.4.1. Aerosols (2.F.4.-)
Emissions of HFC-134a and HFC-152a with respect to aerosols were reported on the basis of the values shown in documents of the Chemical and Bio Subgroup of the Industrial Structure Council. In accordance with the IPCC Guidelines, emissions were calculated on the assumption that 50% of the emission from the amount of aerosol filled in the products (potential emissions) occurred in the year of production, with the remaining 50% emitted in the following year. The amount emitted in the year of production was reported in the “production” category, and the amount in the following year in the “use” category. The amount of emission at the time of “disposal” was reported as “IE” as it was included in the calculation for the “use” category. Relevant indices are shown in Table below.
Table 4-33 Indices related to emissions of HFCs from aerosols Source: Chemical and Bio Sub-Group documents, Industrial Structure Council, METI
4.6.4.2. Metered Dose Inhalers (2.F.4.-)
The figures that have been reported are given in a documentation prepared by the Chemical and Bio Sub-Group of the Ministry of Economy, Trade and Industry’s Industrial Structure Council for HFC-134a and HFC-227ea emissions associated with MDI. Emission from this source was estimated to have occurred entirely in the year of production, and the amount of the emission was the total of the amount of HFC-227ea used during production and the amount contained in imported products less the amount recovered and destroyed. The associated indices are given in the table below. (Refer to 2-Fgas-A-2006.xls¥2F4 for details on the calculation process and related indices.)
Table 4-34 Indices related to emissions of HFCs from MDI
Source: Chemical and Bio Sub-Group documents, Industrial Structure Council, METI
Item Unit 1995 2000 2003 2004Potential Emissions of H FC-134 t 1,300 2,044 1,598 1,162Potential Emissions of H FC-152 t 0 34 553 1,077Ratio of Products containing sin % 70% 88% 95% 86%M ixing Rate of productscontaining single chemical % 0% 15% 16% 31%
Assembly Fugitive Ratio % 5% 4% 3% 3%Executing rate of self-indication % 0% 8% 80% ※※ under investigation
GHGs Item Unit 1995 2000 2003 2004HFC-134 Domestic consumption for MDI t - 1.4 0.6 0.9
Imported comsumption for MDI t - 42.0 47.3 56.5Amount of Disposal t - 0.2 0.2 2.2
HFC-227 Domestic consumption for MDI t - 0.0 25.5 52.3Imported comsumption for MDI t - 3.6 3.6 3.5Amount of Disposal t - 0.0 0.4 2.2
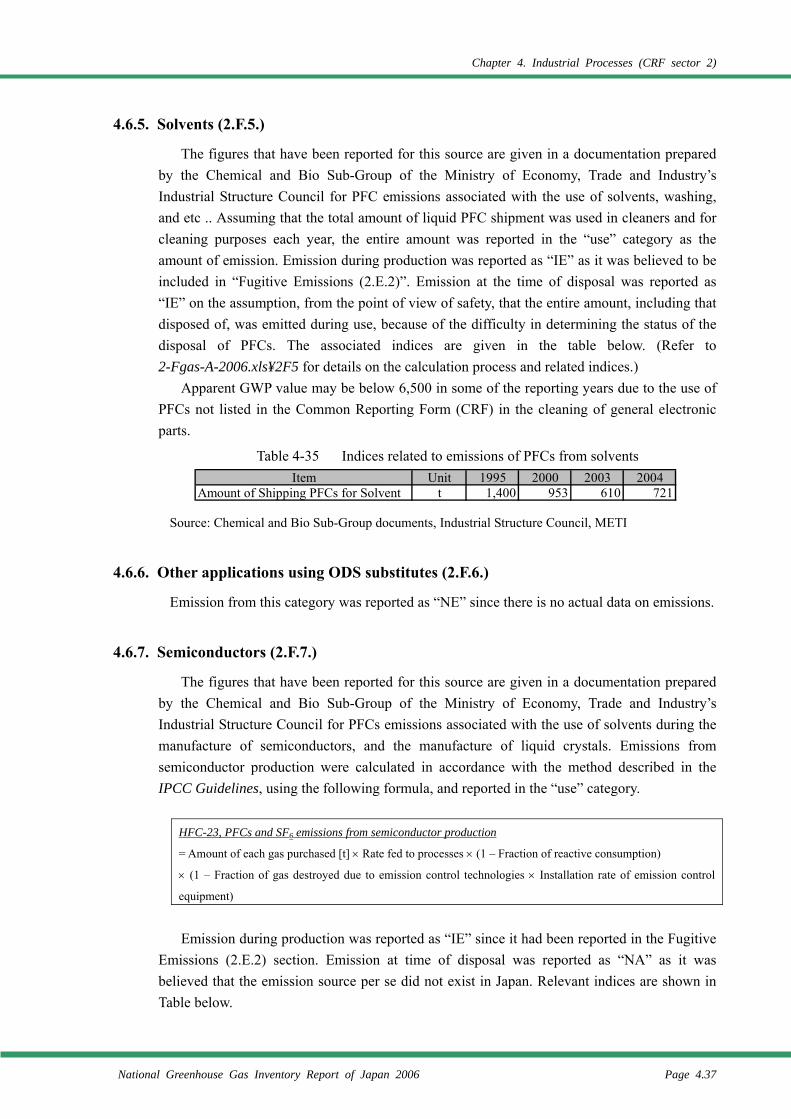
Chapter 4. Industrial Processes (CRF sector 2)
National Greenhouse Gas Inventory Report of Japan 2006 Page 4.37
4.6.5. Solvents (2.F.5.)
The figures that have been reported for this source are given in a documentation prepared by the Chemical and Bio Sub-Group of the Ministry of Economy, Trade and Industry’s Industrial Structure Council for PFC emissions associated with the use of solvents, washing, and etc .. Assuming that the total amount of liquid PFC shipment was used in cleaners and for cleaning purposes each year, the entire amount was reported in the “use” category as the amount of emission. Emission during production was reported as “IE” as it was believed to be included in “Fugitive Emissions (2.E.2)”. Emission at the time of disposal was reported as “IE” on the assumption, from the point of view of safety, that the entire amount, including that disposed of, was emitted during use, because of the difficulty in determining the status of the disposal of PFCs. The associated indices are given in the table below. (Refer to 2-Fgas-A-2006.xls¥2F5 for details on the calculation process and related indices.)
Apparent GWP value may be below 6,500 in some of the reporting years due to the use of PFCs not listed in the Common Reporting Form (CRF) in the cleaning of general electronic parts.
Table 4-35 Indices related to emissions of PFCs from solvents Source: Chemical and Bio Sub-Group documents, Industrial Structure Council, METI
4.6.6. Other applications using ODS substitutes (2.F.6.)
Emission from this category was reported as “NE” since there is no actual data on emissions.
4.6.7. Semiconductors (2.F.7.)
The figures that have been reported for this source are given in a documentation prepared by the Chemical and Bio Sub-Group of the Ministry of Economy, Trade and Industry’s Industrial Structure Council for PFCs emissions associated with the use of solvents during the manufacture of semiconductors, and the manufacture of liquid crystals. Emissions from semiconductor production were calculated in accordance with the method described in the IPCC Guidelines, using the following formula, and reported in the “use” category.
HFC-23, PFCs and SF6 emissions from semiconductor production
= Amount of each gas purchased [t] × Rate fed to processes × (1 – Fraction of reactive consumption)
× (1 – Fraction of gas destroyed due to emission control technologies × Installation rate of emission control
equipment)
Emission during production was reported as “IE” since it had been reported in the Fugitive
Emissions (2.E.2) section. Emission at time of disposal was reported as “NA” as it was believed that the emission source per se did not exist in Japan. Relevant indices are shown in Table below.
Item Unit 1995 2000 2003 2004Amount of Shipping PFCs for Solvent t 1,400 953 610 721
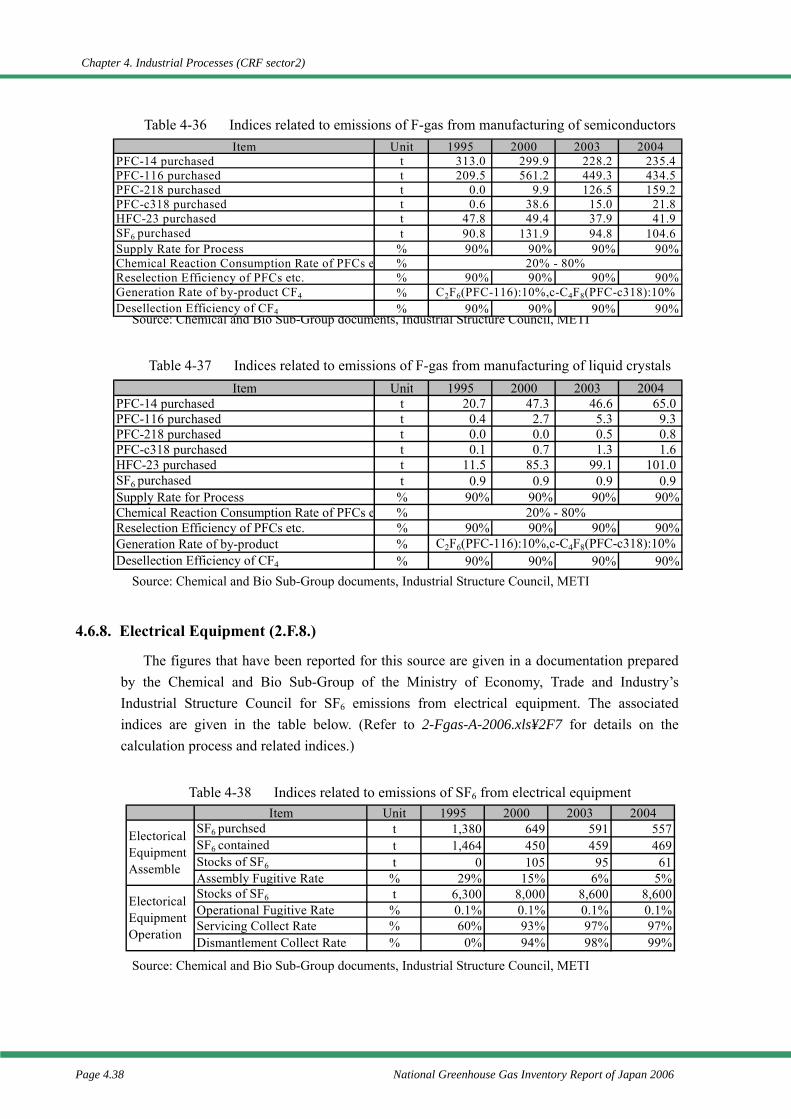
Chapter 4. Industrial Processes (CRF sector2)
Page 4.38 National Greenhouse Gas Inventory Report of Japan 2006
Table 4-36 Indices related to emissions of F-gas from manufacturing of semiconductors Source: Chemical and Bio Sub-Group documents, Industrial Structure Council, METI
Table 4-37 Indices related to emissions of F-gas from manufacturing of liquid crystals Source: Chemical and Bio Sub-Group documents, Industrial Structure Council, METI
4.6.8. Electrical Equipment (2.F.8.)
The figures that have been reported for this source are given in a documentation prepared by the Chemical and Bio Sub-Group of the Ministry of Economy, Trade and Industry’s Industrial Structure Council for SF6 emissions from electrical equipment. The associated indices are given in the table below. (Refer to 2-Fgas-A-2006.xls¥2F7 for details on the calculation process and related indices.)
Table 4-38 Indices related to emissions of SF6 from electrical equipment Source: Chemical and Bio Sub-Group documents, Industrial Structure Council, METI
Item Unit 1995 2000 2003 2004PFC-14 purchased t 313.0 299.9 228.2 235.4PFC-116 purchased t 209.5 561.2 449.3 434.5PFC-218 purchased t 0.0 9.9 126.5 159.2PFC-c318 purchased t 0.6 38.6 15.0 21.8HFC-23 purchased t 47.8 49.4 37.9 41.9SF6 purchased t 90.8 131.9 94.8 104.6Supply Rate for Process % 90% 90% 90% 90%Chemical Reaction Consumption Rate of PFCs e % 20% - 80%Reselection Efficiency of PFCs etc. % 90% 90% 90% 90%Generation Rate of by-product CF4 % C2F6(PFC-116):10%,c-C4F8(PFC-c318):10%Desellection Efficiency of CF4 % 90% 90% 90% 90%
Item Unit 1995 2000 2003 2004PFC-14 purchased t 20.7 47.3 46.6 65.0PFC-116 purchased t 0.4 2.7 5.3 9.3PFC-218 purchased t 0.0 0.0 0.5 0.8PFC-c318 purchased t 0.1 0.7 1.3 1.6HFC-23 purchased t 11.5 85.3 99.1 101.0SF6 purchased t 0.9 0.9 0.9 0.9Supply Rate for Process % 90% 90% 90% 90%Chemical Reaction Consumption Rate of PFCs e % 20% - 80%Reselection Efficiency of PFCs etc. % 90% 90% 90% 90%Generation Rate of by-product % C2F6(PFC-116):10%,c-C4F8(PFC-c318):10%Desellection Efficiency of CF4 % 90% 90% 90% 90%
Item Unit 1995 2000 2003 2004SF6 purchsed t 1,380 649 591 557SF6 contained t 1,464 450 459 469Stocks of SF6 t 0 105 95 61Assembly Fugitive Rate % 29% 15% 6% 5%Stocks of SF6 t 6,300 8,000 8,600 8,600Operational Fugitive Rate % 0.1% 0.1% 0.1% 0.1%Servicing Collect Rate % 60% 93% 97% 97%Dismantlement Collect Rate % 0% 94% 98% 99%
ElectoricalEquipmentAssemble
ElectoricalEquipmentOperation
Chapter 4. Industrial Processes (CRF sector 2)
National Greenhouse Gas Inventory Report of Japan 2006 Page 4.39
References
IPCC, Revised 1996 IPCC Guidelines for National Greenhouse Gas Inventories, 1997 IPCC, Good Practice Guidance and Uncertainty Management in National Greenhouse Gas
Inventories, 2000 Agency for Natural Resources and Energy, General Energy Statistics Environmental Agency Committee for the Greenhouse Gases Emissions Estimation Methods,
GHGs Estimation Methods Committee Report Part 2, September 2000 Ministry of the Environment Committee for the Greenhouse Gases Emissions Estimation Methods,
GHGs Estimation Methods Committee Report Part 4, August 2002 Ministry of the Environment Committee for the Greenhouse Gases Emissions Estimation Methods,
GHGs Estimation Methods Committee Report, February 2006 Ministry of Economy, Trade and Industry, Yearbook of Ceramics and Building Materials Statistics Ministry of Economy, Trade and Industry, Yearbook of Chemical Industries Statistics Ministry of Economy, Trade and Industry, Yearbook of Current Survey of Energy Consumption Ministry of Economy, Trade and Industry, Yearbook of Minerals and Non-Ferrous Metals Statistics Ministry of Economy, Trade and Industry, Yearbook of Mineral Resources and Petroleum Products
Statistics Ministry of Economy, Trade and Industry, Yearbook of Production, Supply and Demand of
Petroleum, Coal and Coke Ministry of Economy, Trade and Industry, Yearbook of Iron and Steel, Non-ferrous Metals, and
Fabricated Metals Statistics Ministry of Economy, Trade and Industry, Yearbook of Iron and Steel Statistics Ministry of Finance, Trade Statistics of Japan Cement Sub-Group of the WBCSD (World Business Council for Sustainable Development), Cement
Protocol, “CO2 Emissions Monitoring and Reporting Protocol for the Cement Industry Guide to the Protocol, Version 1.6, WBSCD Working Group Cement” October 19, 2001
IUPAC website “Atomic Weights of the Elements 1999” (http://www.chem.qmul.ac.uk/iupac/AtWt/AtWt9.html” Japan Lime Association, The Story of Lime Methanol and Formalin Association, Methanol Supply and Demand
Chapter 4. Industrial Processes (CRF sector2)
Page 4.40 National Greenhouse Gas Inventory Report of Japan 2006
Chapter 5. Solvent and Other Product Use (CRF sector 3)
National Greenhouse Gas Inventory Report of Japan 2005 Page 5.1
Chapter 5. Solvent and Other Product Use (CRF sector 3)
Emissions of carbon dioxide, nitrous dioxide, and NMVOC are generated following the
solvent and other product use. In this chapter, emissions due to the following product uses are estimated:
・ Paint solvents ・ Degreasing and dry-cleaning ・ Chemical products ・ Other products (e.g. anesthesia)
5.1. Paint Application (3.A.)
Paint solvents are used in Japan, but their application is basically restricted only to mixing and they are assumed not to take part in chemical reactions. Therefore, they do not generate carbon dioxide or nitrous oxide. They have been reported as “NA.”
5.2. Degreasing and Dry-Cleaning (3.B.)
1) CO2 Degreasing and dry-cleaning are practiced in Japan. Degreasing is defined as “washing processes that do not involve chemical reactions”, and it
is assumed that it does not generate carbon dioxide. Although the carbon dioxide emissions may occur in association with washing methods involving dry ice or carbonic gas, such methods are not thought to be used in Japan.
There are no processes in dry-cleaning in which chemical reactions may occur, and it is basically assumed that it does not generate carbon dioxide. However washing methods using liquefied carbonic gas are being used experimentally in research facilities, and it is not possible to completely negate the possibility of carbon dioxide emissions.
As a result, these activities have been reported as “NE” due to the fact that there are no sufficient data available on the actual condition of emissions from degreasing and dry-cleaning and the absence of a default emission factor prevents any calculations from being performed.
2) N2O Degreasing and dry-cleaning are practiced in Japan, but degreasing is defined under the
heading, ‘washing processes that do not involve chemical reactions’, and there are no processes in dry-cleaning in which chemical reactions may occur. Therefore, it is assumed that nitrous oxide is not generated. In Japan, there are also no methods which have the potential to emit nitrous oxide used for degreasing or dry-cleaning, and they have therefore been reported as “NA”.
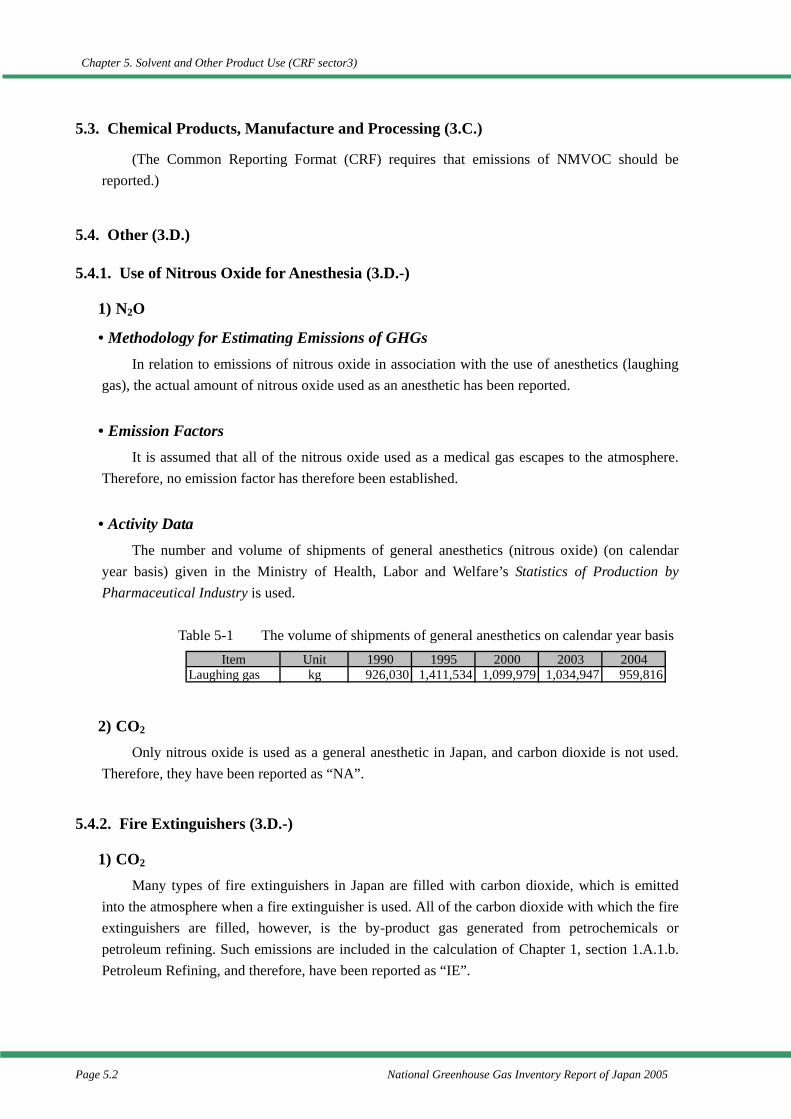
Chapter 5. Solvent and Other Product Use (CRF sector3)
Page 5.2 National Greenhouse Gas Inventory Report of Japan 2005
5.3. Chemical Products, Manufacture and Processing (3.C.)
(The Common Reporting Format (CRF) requires that emissions of NMVOC should be reported.)
5.4. Other (3.D.)
5.4.1. Use of Nitrous Oxide for Anesthesia (3.D.-)
1) N2O
• Methodology for Estimating Emissions of GHGs In relation to emissions of nitrous oxide in association with the use of anesthetics (laughing
gas), the actual amount of nitrous oxide used as an anesthetic has been reported.
• Emission Factors It is assumed that all of the nitrous oxide used as a medical gas escapes to the atmosphere.
Therefore, no emission factor has therefore been established.
• Activity Data The number and volume of shipments of general anesthetics (nitrous oxide) (on calendar
year basis) given in the Ministry of Health, Labor and Welfare’s Statistics of Production by Pharmaceutical Industry is used.
Table 5-1 The volume of shipments of general anesthetics on calendar year basis
2) CO2 Only nitrous oxide is used as a general anesthetic in Japan, and carbon dioxide is not used.
Therefore, they have been reported as “NA”.
5.4.2. Fire Extinguishers (3.D.-)
1) CO2 Many types of fire extinguishers in Japan are filled with carbon dioxide, which is emitted
into the atmosphere when a fire extinguisher is used. All of the carbon dioxide with which the fire extinguishers are filled, however, is the by-product gas generated from petrochemicals or petroleum refining. Such emissions are included in the calculation of Chapter 1, section 1.A.1.b. Petroleum Refining, and therefore, have been reported as “IE”.
Item Unit 1990 1995 2000 2003 2004Laughing gas kg 926,030 1,411,534 1,099,979 1,034,947 959,816
Chapter 5. Solvent and Other Product Use (CRF sector 3)
National Greenhouse Gas Inventory Report of Japan 2005 Page 5.3
2) N2O There are fire extinguishers used in Japan that are filled with nitrogen gas. When such fire
extinguishers are used, there is a possibility that the emitted nitrogen gas may engage in a series of chemical reactions which generate nitrous oxide. There is still no sufficient data on the reality of nitrous oxide emissions associated with the use of fire extinguishers filled with nitrogen gas, and it is not currently possible to calculate emissions. There is also no default emission factor. Hence, it is reported as “NE”.
5.4.3. Aerosol Cans (3.D.-)
1) CO2 Aerosol products, which fills spray cans with carbon dioxide, are manufactured in Japan. It is
assumed that the carbon dioxide could be emitted to the atmosphere when the aerosol products are used. However, becuase the carbon dioxide used in the aerosol industry is a by-product gas of petrochemical products, these emissions are counted in the Combustion of Fuel sector (1.A.), and have been reported as “IE”.
2) N2O Aerosol products manufactured in Japan do not use nitrous oxide. In principle, no nitrous
oxide is emitted, too, and it has been reported as “NA”.
Chapter 5. Solvent and Other Product Use (CRF sector3)
Page 5.4 National Greenhouse Gas Inventory Report of Japan 2005
References
Ministry of Health, Labor and Welfare’s Statistics of Production by Pharmaceutical Industry Ministry of the Environment Committee for the Greenhouse Gases Emissions Estimation Methods,
Review of Greenhouse Gases Emissions Estimation Methods Part 2, August 2002
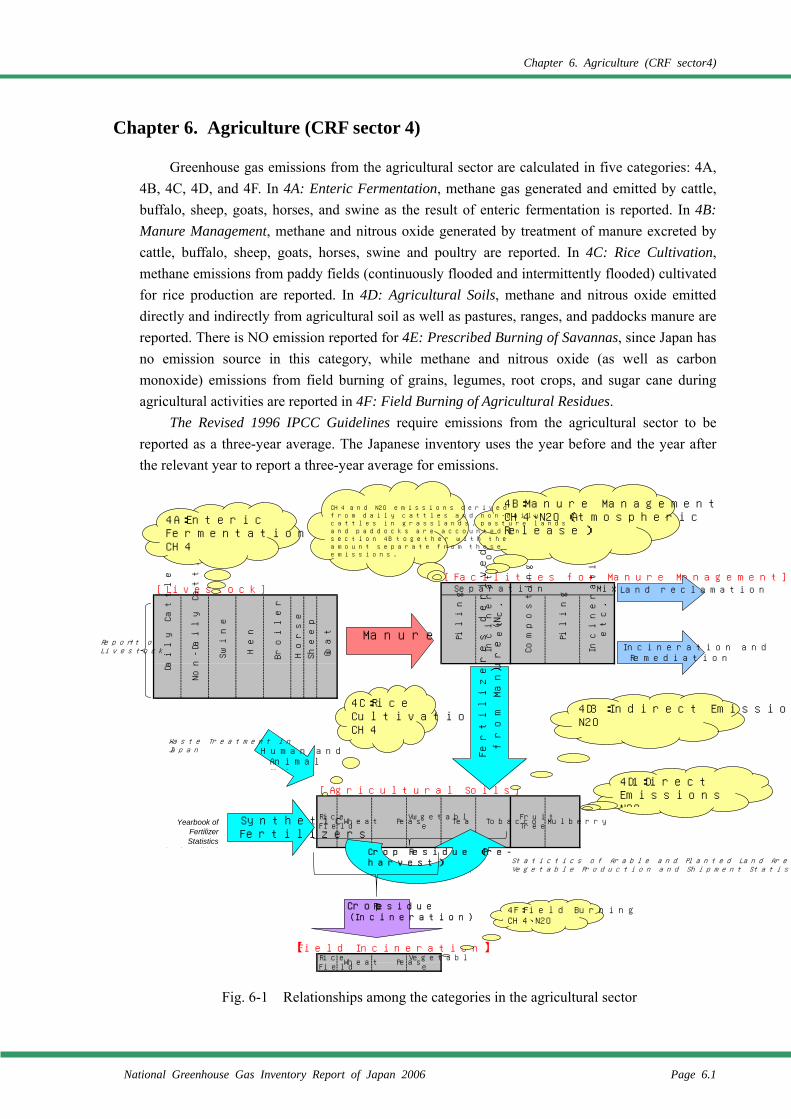
Chapter 6. Agriculture (CRF sector4)
National Greenhouse Gas Inventory Report of Japan 2006 Page 6.1
Chapter 6. Agriculture (CRF sector 4)
Greenhouse gas emissions from the agricultural sector are calculated in five categories: 4A, 4B, 4C, 4D, and 4F. In 4A: Enteric Fermentation, methane gas generated and emitted by cattle, buffalo, sheep, goats, horses, and swine as the result of enteric fermentation is reported. In 4B: Manure Management, methane and nitrous oxide generated by treatment of manure excreted by cattle, buffalo, sheep, goats, horses, swine and poultry are reported. In 4C: Rice Cultivation, methane emissions from paddy fields (continuously flooded and intermittently flooded) cultivated for rice production are reported. In 4D: Agricultural Soils, methane and nitrous oxide emitted directly and indirectly from agricultural soil as well as pastures, ranges, and paddocks manure are reported. There is NO emission reported for 4E: Prescribed Burning of Savannas, since Japan has no emission source in this category, while methane and nitrous oxide (as well as carbon monoxide) emissions from field burning of grains, legumes, root crops, and sugar cane during agricultural activities are reported in 4F: Field Burning of Agricultural Residues.
The Revised 1996 IPCC Guidelines require emissions from the agricultural sector to be reported as a three-year average. The Japanese inventory uses the year before and the year after the relevant year to report a three-year average for emissions.
Fig. 6-1 Relationships among the categories in the agricultural sector
[Facilities for Manure Management][Livestock]
[Agricultural Soils]
Statictics of Arable and Planted Land Area作物統計 Vegetable Production and Shipment Statistics
【Field Incineration】
Bro
iler
Hors
e
Sheep
Goat
Dai
ly C
attle
Non-D
aily
Cat
tle
Sw
ine
Hen
Inci
ner
atio
netc
.
Com
post
ing
Pili
ng
Separation MixtureIn
ciner
atio
netc
.
Pili
ng
RiceField
Wheat PeasVwgetabl
eTea Tobacco
FruitTree
Mulberry
RiceField
Wheat PeasVegetabl
e
Report ofLivestock
4A:EntericFermentationCH4
Manure
4B:Manure ManagementCH4、N2O(AtmosphericRelease)
CH4 and N2O emissions derivedfrom daily cattles and non-dailycattles in grasslands, pasture landsand paddocks are accounted insection 4B together with theamount separate from theseemissions.
SyntheticFertilizers
Yearbook ofFertilizerStatistics
(P k t Editi )
4D1:DirectEmissionsN2O
4C:RiceCultivationCH4
4D3:Indirect EmissionsN2O
Crop Residue(Incineration)
Crop Residue (Pre-harvest)
4F:Field BurningCH4、N2O
Fert
ilize
res
derive
d
from
M
anure
(N)
Incineration andRemediation
Land reclamation
Human andAnimalW t
Waste Treatment inJapan
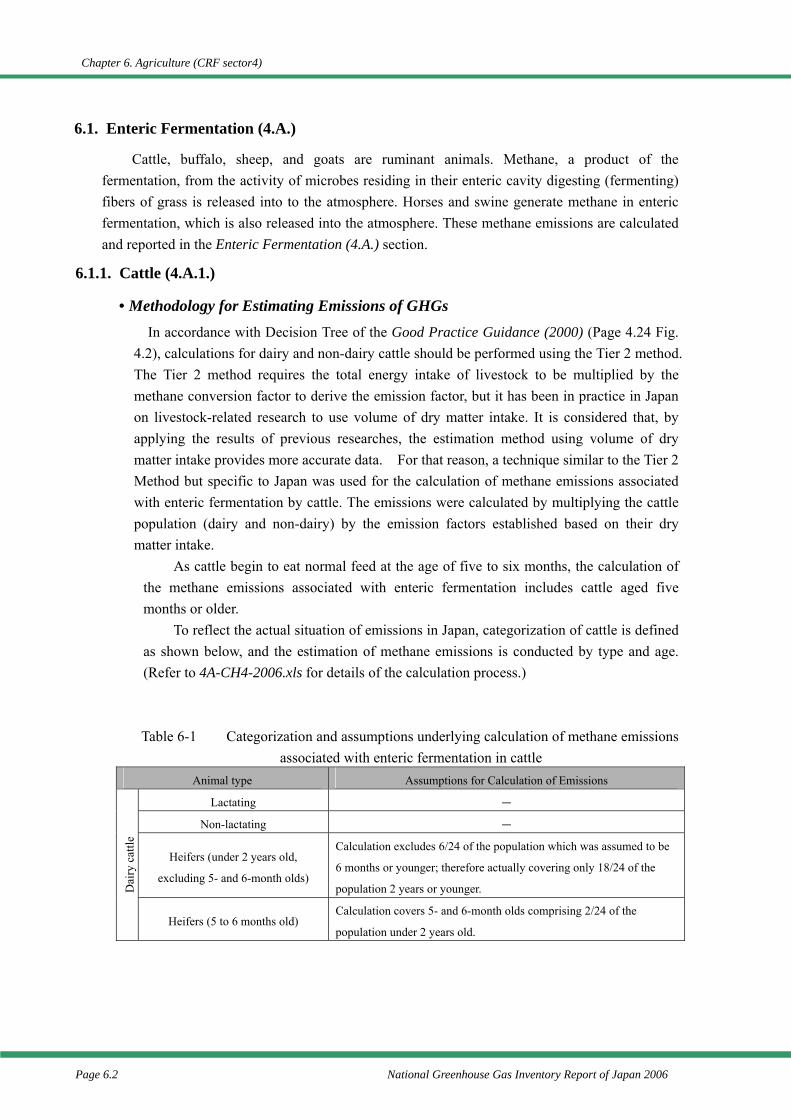
Chapter 6. Agriculture (CRF sector4)
Page 6.2 National Greenhouse Gas Inventory Report of Japan 2006
6.1. Enteric Fermentation (4.A.)
Cattle, buffalo, sheep, and goats are ruminant animals. Methane, a product of the fermentation, from the activity of microbes residing in their enteric cavity digesting (fermenting) fibers of grass is released into to the atmosphere. Horses and swine generate methane in enteric fermentation, which is also released into the atmosphere. These methane emissions are calculated and reported in the Enteric Fermentation (4.A.) section.
6.1.1. Cattle (4.A.1.)
• Methodology for Estimating Emissions of GHGs In accordance with Decision Tree of the Good Practice Guidance (2000) (Page 4.24 Fig.
4.2), calculations for dairy and non-dairy cattle should be performed using the Tier 2 method. The Tier 2 method requires the total energy intake of livestock to be multiplied by the methane conversion factor to derive the emission factor, but it has been in practice in Japan on livestock-related research to use volume of dry matter intake. It is considered that, by applying the results of previous researches, the estimation method using volume of dry matter intake provides more accurate data. For that reason, a technique similar to the Tier 2 Method but specific to Japan was used for the calculation of methane emissions associated with enteric fermentation by cattle. The emissions were calculated by multiplying the cattle population (dairy and non-dairy) by the emission factors established based on their dry matter intake.
As cattle begin to eat normal feed at the age of five to six months, the calculation of the methane emissions associated with enteric fermentation includes cattle aged five months or older.
To reflect the actual situation of emissions in Japan, categorization of cattle is defined as shown below, and the estimation of methane emissions is conducted by type and age. (Refer to 4A-CH4-2006.xls for details of the calculation process.)
Table 6-1 Categorization and assumptions underlying calculation of methane emissions associated with enteric fermentation in cattle
Animal type Assumptions for Calculation of Emissions
Lactating -
Non-lactating -
Heifers (under 2 years old,
excluding 5- and 6-month olds)
Calculation excludes 6/24 of the population which was assumed to be
6 months or younger; therefore actually covering only 18/24 of the
population 2 years or younger. Dai
ry c
attle
Heifers (5 to 6 months old) Calculation covers 5- and 6-month olds comprising 2/24 of the
population under 2 years old.
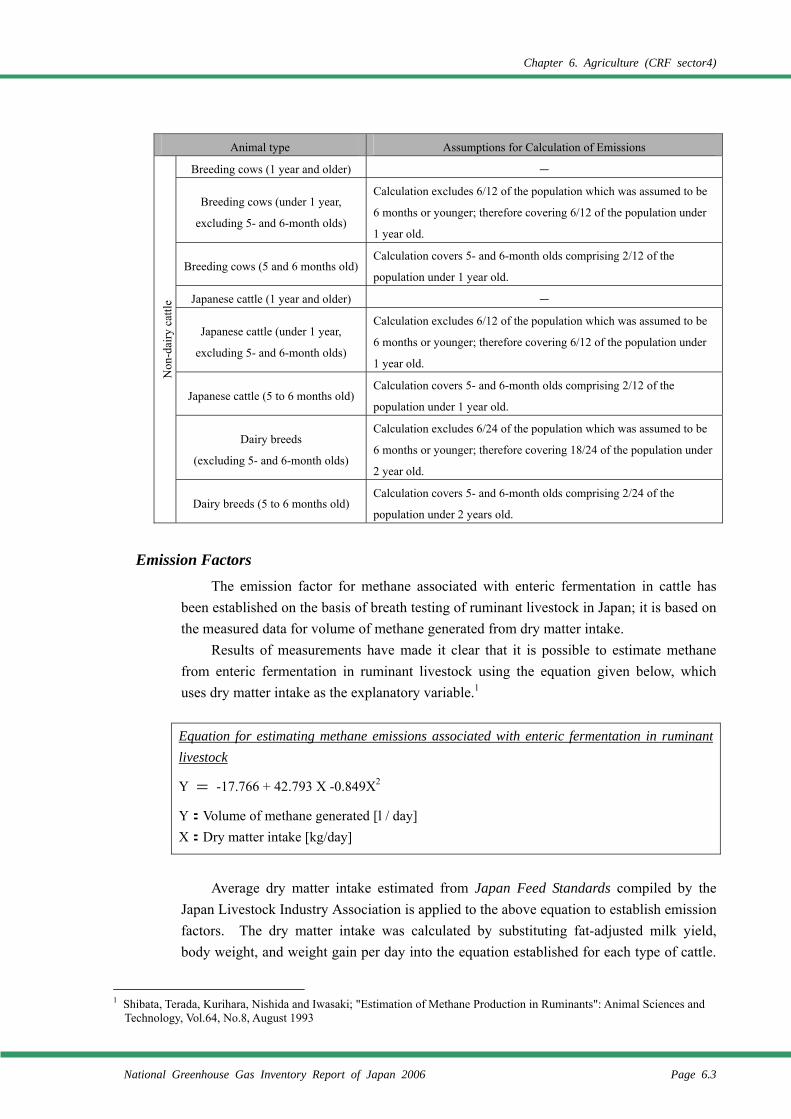
Chapter 6. Agriculture (CRF sector4)
National Greenhouse Gas Inventory Report of Japan 2006 Page 6.3
Animal type Assumptions for Calculation of Emissions
Breeding cows (1 year and older) -
Breeding cows (under 1 year,
excluding 5- and 6-month olds)
Calculation excludes 6/12 of the population which was assumed to be
6 months or younger; therefore covering 6/12 of the population under
1 year old.
Breeding cows (5 and 6 months old)Calculation covers 5- and 6-month olds comprising 2/12 of the
population under 1 year old.
Japanese cattle (1 year and older) -
Japanese cattle (under 1 year,
excluding 5- and 6-month olds)
Calculation excludes 6/12 of the population which was assumed to be
6 months or younger; therefore covering 6/12 of the population under
1 year old.
Japanese cattle (5 to 6 months old)Calculation covers 5- and 6-month olds comprising 2/12 of the
population under 1 year old.
Dairy breeds
(excluding 5- and 6-month olds)
Calculation excludes 6/24 of the population which was assumed to be
6 months or younger; therefore covering 18/24 of the population under
2 year old.
Non
-dai
ry c
attle
Dairy breeds (5 to 6 months old) Calculation covers 5- and 6-month olds comprising 2/24 of the
population under 2 years old.
Emission Factors The emission factor for methane associated with enteric fermentation in cattle has
been established on the basis of breath testing of ruminant livestock in Japan; it is based on the measured data for volume of methane generated from dry matter intake.
Results of measurements have made it clear that it is possible to estimate methane from enteric fermentation in ruminant livestock using the equation given below, which uses dry matter intake as the explanatory variable.1
Equation for estimating methane emissions associated with enteric fermentation in ruminant livestock Y = -17.766 + 42.793 X -0.849X2 Y:Volume of methane generated [l / day] X:Dry matter intake [kg/day]
Average dry matter intake estimated from Japan Feed Standards compiled by the
Japan Livestock Industry Association is applied to the above equation to establish emission factors. The dry matter intake was calculated by substituting fat-adjusted milk yield, body weight, and weight gain per day into the equation established for each type of cattle.
1 Shibata, Terada, Kurihara, Nishida and Iwasaki; "Estimation of Methane Production in Ruminants": Animal Sciences and
Technology, Vol.64, No.8, August 1993

Chapter 6. Agriculture (CRF sector4)
Page 6.4 National Greenhouse Gas Inventory Report of Japan 2006
Data for the fat-adjusted milk yield was obtained from the Statistics on Milk and Dairy Products (Ministry of Agriculture, Fisheries and Forestry; MAFF) and the Statistics on Livestock (MAFF), and those for the fat content from the Survey of Livestock Production Costs (MAFF). Both sets of the data are updated on a yearly basis. Data for body weight and weight gain per day were obtained from the table of weight by age (months) for each type of cattle included at the back of the Japanese Feeding Standards (Japan Livestock Industry Association).
Formula of CH4 Emission Factor of Enteric Fermentation (kg-CH4/head) =(Methane generated [L/day/head]) / (Volume of 1 mol) × (molecular weight of methane) × (no. of days in year) =Y/22.4 (l/mol)×0.016 (kg/mol)×365or 366(day)
• Activity Data The values used for activity data for this source are the herd size for each type of
livestock at 1 February in each year, recorded by the Ministry of Agriculture, Forestry and Fisheries in its Livestock Statistics.
Table 6-2 activity data associated with enteric fermentation by cattle (Single yaear)
6.1.2. Buffalo, Sheep, Goats, Horses & Swine (4.A.2., 4.A.3., 4.A.4., 4.A.6., 4.A.8.)
• Methodology for Estimating Emissions of GHGs Methane emissions associated with enteric fermentation by buffalo, sheep, goats,
swine, and horses were calculated using the Tier 1 Method in accordance with the Decision Tree of the Good Practice Guidance (2000).
• Emission Factors The emission factor for methane associated with sheep and goats has been established
in the same way as for cattle, based on the emissions of methane estimated from dry matter intake. The emission factor for swine has been established on the basis of results of
Item Unit 1990 1995 2000 2003 2004 2005Dairy Cattle (Lactating) 1000 head 1,082 1,035 971 936 910 910Dairy Cattle (Dry) 1000 head 332 299 249 244 235 235
Dairy Cattle (Heifer: Under Two Year, over six month) 1000 head 600 544 463 468 468 468
Dairy Cattle (Heifer: Five and six month ) 1000 head 55 49 42 43 43 43Non-Dairy Cattle (Breeding Cows: One Year and Over) 1000 head 565 676 632 632 636 636Non-Dairy Cattle (Breeding Cows: Under One Year,over six month) 1000 head 378 396 344 374 365 365
Non-Dairy Cattle (Breeding Cows: Fiveand six month) 1000 head 76 79 69 75 73 73Non-Dairy Cattle (Fattening: One Year and Over) 1000 head 368 412 385 383 373 373Non-Dairy Cattle (Fattening: Under One Year, over sixmanth) 1000 head 125 133 114 127 123 123
Non-Dairy Cattle (Fattening: Fiveand six month) 1000 head 42 44 38 42 41 41Non-Dairy Cattle (Dairy breed: Over six month) 1000 head 805 808 845 809 787 787Non-Dairy Cattle (Dairy breed: Five and six month) 1000 head 89 90 94 90 87 87
* Data for 2005 are substituted by data for 2004
Dai
ry C
attle
Non
-Dai
ry C
attle
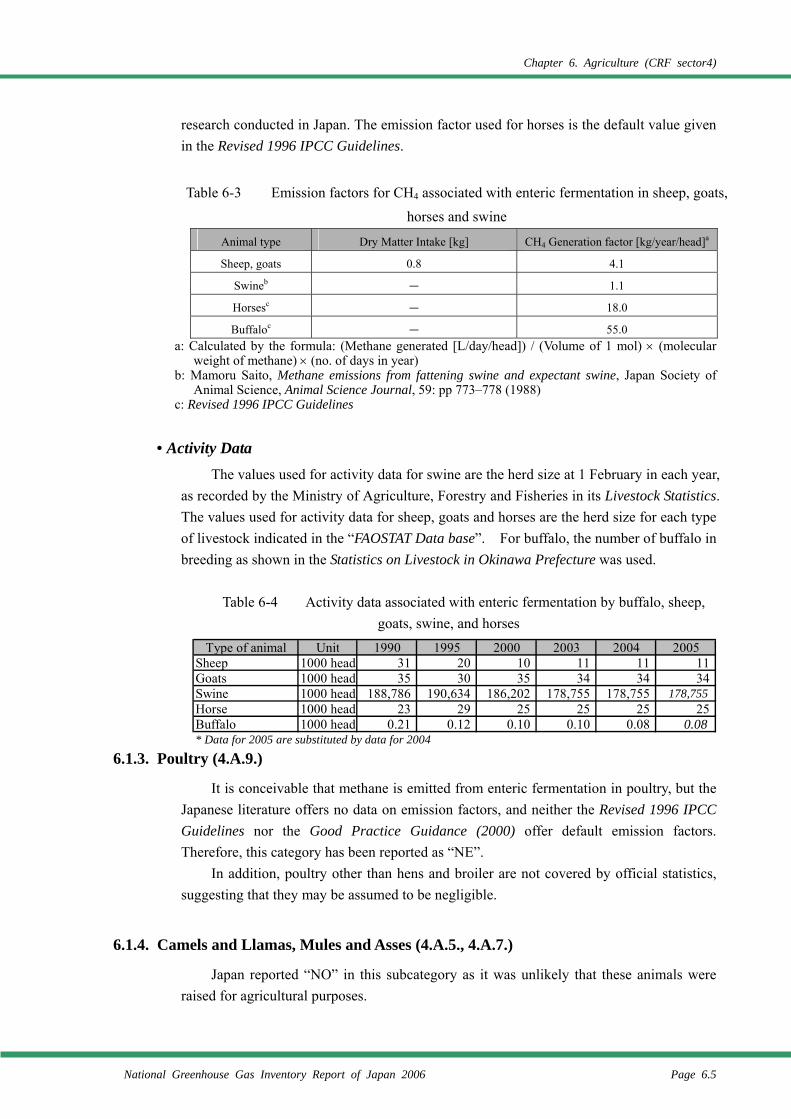
Chapter 6. Agriculture (CRF sector4)
National Greenhouse Gas Inventory Report of Japan 2006 Page 6.5
research conducted in Japan. The emission factor used for horses is the default value given in the Revised 1996 IPCC Guidelines.
Table 6-3 Emission factors for CH4 associated with enteric fermentation in sheep, goats, horses and swine
Animal type Dry Matter Intake [kg] CH4 Generation factor [kg/year/head]a
Sheep, goats 0.8 4.1
Swineb - 1.1
Horsesc - 18.0
Buffaloc - 55.0 a: Calculated by the formula: (Methane generated [L/day/head]) / (Volume of 1 mol) × (molecular
weight of methane) × (no. of days in year) b: Mamoru Saito, Methane emissions from fattening swine and expectant swine, Japan Society of
Animal Science, Animal Science Journal, 59: pp 773–778 (1988) c: Revised 1996 IPCC Guidelines
• Activity Data The values used for activity data for swine are the herd size at 1 February in each year,
as recorded by the Ministry of Agriculture, Forestry and Fisheries in its Livestock Statistics. The values used for activity data for sheep, goats and horses are the herd size for each type of livestock indicated in the “FAOSTAT Data base”. For buffalo, the number of buffalo in breeding as shown in the Statistics on Livestock in Okinawa Prefecture was used.
Table 6-4 Activity data associated with enteric fermentation by buffalo, sheep,
goats, swine, and horses
6.1.3. Poultry (4.A.9.)
It is conceivable that methane is emitted from enteric fermentation in poultry, but the Japanese literature offers no data on emission factors, and neither the Revised 1996 IPCC Guidelines nor the Good Practice Guidance (2000) offer default emission factors. Therefore, this category has been reported as “NE”.
In addition, poultry other than hens and broiler are not covered by official statistics, suggesting that they may be assumed to be negligible.
6.1.4. Camels and Llamas, Mules and Asses (4.A.5., 4.A.7.)
Japan reported “NO” in this subcategory as it was unlikely that these animals were raised for agricultural purposes.
Type of animal Unit 1990 1995 2000 2003 2004 2005Sheep 1000 head 31 20 10 11 11 11Goats 1000 head 35 30 35 34 34 34Swine 1000 head 188,786 190,634 186,202 178,755 178,755 178,755Horse 1000 head 23 29 25 25 25 25Buffalo 1000 head 0.21 0.12 0.10 0.10 0.08 0.08* Data for 2005 are substituted by data for 2004
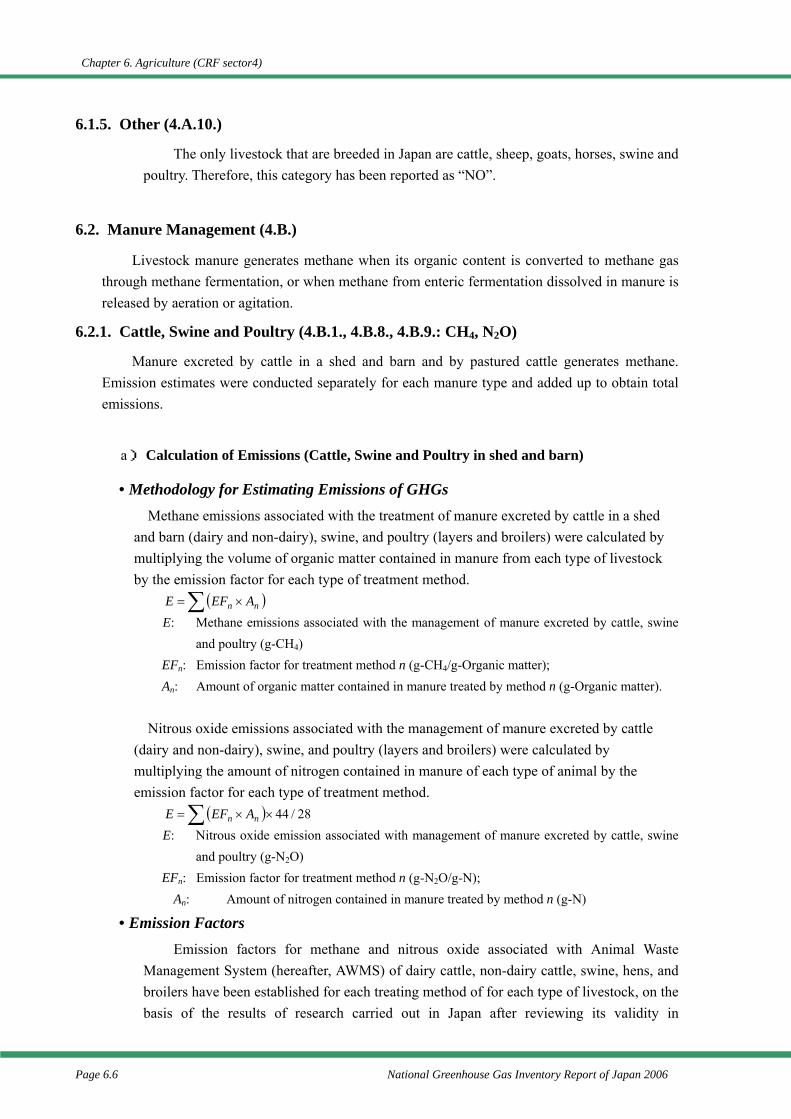
Chapter 6. Agriculture (CRF sector4)
Page 6.6 National Greenhouse Gas Inventory Report of Japan 2006
6.1.5. Other (4.A.10.)
The only livestock that are breeded in Japan are cattle, sheep, goats, horses, swine and poultry. Therefore, this category has been reported as “NO”.
6.2. Manure Management (4.B.)
Livestock manure generates methane when its organic content is converted to methane gas through methane fermentation, or when methane from enteric fermentation dissolved in manure is released by aeration or agitation.
6.2.1. Cattle, Swine and Poultry (4.B.1., 4.B.8., 4.B.9.: CH4, N2O)
Manure excreted by cattle in a shed and barn and by pastured cattle generates methane. Emission estimates were conducted separately for each manure type and added up to obtain total emissions.
a) Calculation of Emissions (Cattle, Swine and Poultry in shed and barn)
• Methodology for Estimating Emissions of GHGs Methane emissions associated with the treatment of manure excreted by cattle in a shed
and barn (dairy and non-dairy), swine, and poultry (layers and broilers) were calculated by multiplying the volume of organic matter contained in manure from each type of livestock by the emission factor for each type of treatment method.
( )∑ ×= nn AEFE E: Methane emissions associated with the management of manure excreted by cattle, swine
and poultry (g-CH4) EFn: Emission factor for treatment method n (g-CH4/g-Organic matter); An: Amount of organic matter contained in manure treated by method n (g-Organic matter).
Nitrous oxide emissions associated with the management of manure excreted by cattle (dairy and non-dairy), swine, and poultry (layers and broilers) were calculated by multiplying the amount of nitrogen contained in manure of each type of animal by the emission factor for each type of treatment method.
( )∑ ××= 28/44nn AEFE E: Nitrous oxide emission associated with management of manure excreted by cattle, swine
and poultry (g-N2O) EFn: Emission factor for treatment method n (g-N2O/g-N);
An: Amount of nitrogen contained in manure treated by method n (g-N)
• Emission Factors Emission factors for methane and nitrous oxide associated with Animal Waste
Management System (hereafter, AWMS) of dairy cattle, non-dairy cattle, swine, hens, and broilers have been established for each treating method of for each type of livestock, on the basis of the results of research carried out in Japan after reviewing its validity in
Chapter 6. Agriculture (CRF sector4)
National Greenhouse Gas Inventory Report of Japan 2006 Page 6.7
accordance with the decision tree shown in Figure 6-2. Actual values are given in the following tables.
Figure 6-2 Decision tree for determination of EF
Table 6-5 CH4 Emission factors for each method of treating manure from cattle, Swine, Hen & Broiler
treating method Daily Cattle Non-daily cattle Swine Hen, Broiler
12. Pit storage 3.90 % D 3.00 % D 8.7 % D - -
13. Sunlight drying 0.20 % J 0.20 % J 0.20 % J 0.20 % J
13a. Thermal drying 0 % Z 0 % Z 0 % Z 0 % Z
13b. Composting (feces) 0.044 % D 0.034 % D 0.097 % D 0.14 % J
13c. Deposition 3.80 % J 0.13 % J 0.16 % J 0.14 % J
13d. Incineration 0.4 % O 0.4 % O 0.4 % O 0.4 % O
13e. Composting (feces and urine mixed)
0.044 % D 0.034 % D 0.097 % D - -
14. O
ther
13f. Wastewater management 0.0087% D 0.0067% D 0.019% D - -
Table 6-6 N2O Emission factors for each method of treating manure from cattle, Swine Hen & Broiler
treating method Daily Cattle Non-daily cattle Swine Hen, Broiler
12. Pit storage 0.10 % D
13. Sunlight drying 2.0 % J
13a. Thermal drying 2.0 % J
13b. Composting (feces) 0.25 % J
13c. Deposition 2.40 % J 1.60 % J 2.50 % J 2.0 % D
13d. Incineration 0.1 % O
13e. Composting (feces and urine mixed)
2.0 % D
14. O
ther
13f. Wastewater management 5.0 % J
Existing Reliable country specific data
Rational explanation can be performed on
the differences between calculated EF and
default EF if exist
YES
Existing foreign countries data close to Japan
NO
NO
Country specific EF used
Rational explanation can be performed on the
differences between calculated EF and default
EF if exist
YES
YES
EF calculated by foreign countries used
YES
Default EF used
NO
NO
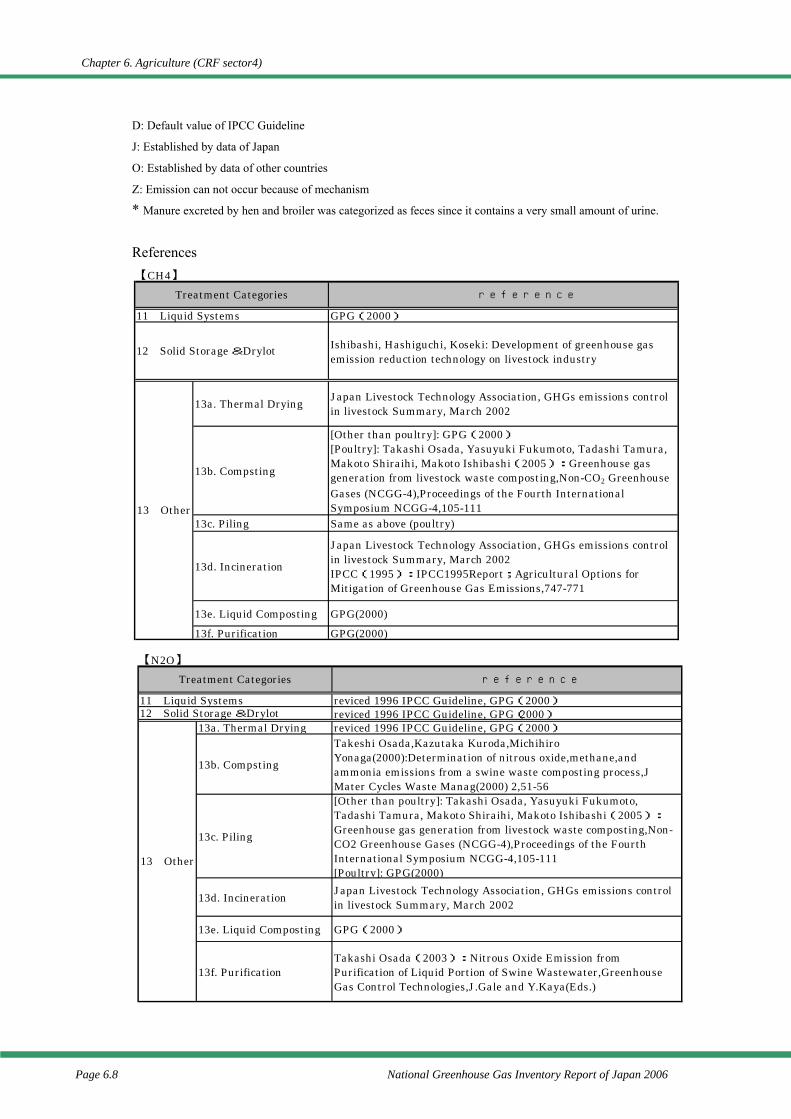
Chapter 6. Agriculture (CRF sector4)
Page 6.8 National Greenhouse Gas Inventory Report of Japan 2006
D: Default value of IPCC Guideline
J: Established by data of Japan
O: Established by data of other countries
Z: Emission can not occur because of mechanism
* Manure excreted by hen and broiler was categorized as feces since it contains a very small amount of urine.
References
【CH4】
GPG(2000)
Ishibashi, Hashiguchi, Koseki: Development of greenhouse gasemission reduction technology on livestock industry
13a. Thermal Drying Japan Livestock Technology Association, GHGs emissions controlin livestock Summary, March 2002
13b. Compsting
[Other than poultry]: GPG(2000)[Poultry]: Takashi Osada, Yasuyuki Fukumoto, Tadashi Tamura,Makoto Shiraihi, Makoto Ishibashi(2005):Greenhouse gasgeneration from livestock waste composting,Non-CO2 GreenhouseGases (NCGG-4),Proceedings of the Fourth InternationalSymposium NCGG-4,105-111
13c. Piling Same as above (poultry)
13d. Incineration
Japan Livestock Technology Association, GHGs emissions controlin livestock Summary, March 2002IPCC(1995):IPCC1995Report;Agricultural Options forMitigation of Greenhouse Gas Emissions,747-771
13e. Liquid Composting GPG(2000)13f. Purification GPG(2000)
referenceTreatment Categories
11 Liquid Systems
12 Solid Storage &Drylot
13 Other
【N2O】
reviced 1996 IPCC Guideline, GPG(2000)reviced 1996 IPCC Guideline, GPG(2000)
13a. Thermal Drying reviced 1996 IPCC Guideline, GPG(2000)
13b. Compsting
Takeshi Osada,Kazutaka Kuroda,MichihiroYonaga(2000):Determination of nitrous oxide,methane,andammonia emissions from a swine waste composting process,JMater Cycles Waste Manag(2000) 2,51-56
13c. Piling
[Other than poultry]: Takashi Osada, Yasuyuki Fukumoto,Tadashi Tamura, Makoto Shiraihi, Makoto Ishibashi(2005):
Greenhouse gas generation from livestock waste composting,Non-CO2 Greenhouse Gases (NCGG-4),Proceedings of the FourthInternational Symposium NCGG-4,105-111[Poultry]: GPG(2000)
13d. Incineration Japan Livestock Technology Association, GHGs emissions controlin livestock Summary, March 2002
13e. Liquid Composting GPG(2000)
13f. PurificationTakashi Osada(2003):Nitrous Oxide Emission fromPurification of Liquid Portion of Swine Wastewater,GreenhouseGas Control Technologies,J.Gale and Y.Kaya(Eds.)
11 Liquid Systems12 Solid Storage &Drylot
13 Other
referenceTreatment Categories
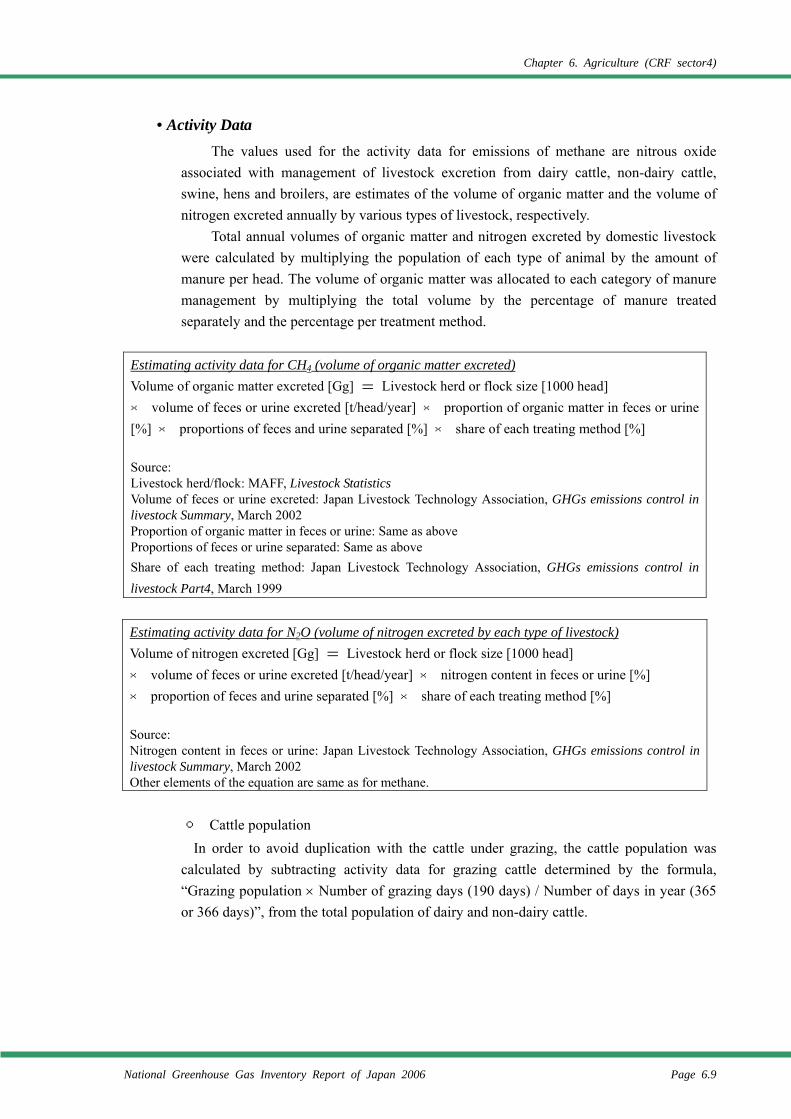
Chapter 6. Agriculture (CRF sector4)
National Greenhouse Gas Inventory Report of Japan 2006 Page 6.9
• Activity Data The values used for the activity data for emissions of methane are nitrous oxide
associated with management of livestock excretion from dairy cattle, non-dairy cattle, swine, hens and broilers, are estimates of the volume of organic matter and the volume of nitrogen excreted annually by various types of livestock, respectively.
Total annual volumes of organic matter and nitrogen excreted by domestic livestock were calculated by multiplying the population of each type of animal by the amount of manure per head. The volume of organic matter was allocated to each category of manure management by multiplying the total volume by the percentage of manure treated separately and the percentage per treatment method.
Estimating activity data for CH4 (volume of organic matter excreted) Volume of organic matter excreted [Gg] = Livestock herd or flock size [1000 head] × volume of feces or urine excreted [t/head/year] × proportion of organic matter in feces or urine [%] × proportions of feces and urine separated [%] × share of each treating method [%] Source: Livestock herd/flock: MAFF, Livestock Statistics Volume of feces or urine excreted: Japan Livestock Technology Association, GHGs emissions control in livestock Summary, March 2002 Proportion of organic matter in feces or urine: Same as above Proportions of feces or urine separated: Same as above Share of each treating method: Japan Livestock Technology Association, GHGs emissions control in livestock Part4, March 1999
Estimating activity data for N2O (volume of nitrogen excreted by each type of livestock) Volume of nitrogen excreted [Gg] = Livestock herd or flock size [1000 head] × volume of feces or urine excreted [t/head/year] × nitrogen content in feces or urine [%] × proportion of feces and urine separated [%] × share of each treating method [%] Source: Nitrogen content in feces or urine: Japan Livestock Technology Association, GHGs emissions control in livestock Summary, March 2002 Other elements of the equation are same as for methane.
○ Cattle population
In order to avoid duplication with the cattle under grazing, the cattle population was calculated by subtracting activity data for grazing cattle determined by the formula, “Grazing population × Number of grazing days (190 days) / Number of days in year (365 or 366 days)”, from the total population of dairy and non-dairy cattle.
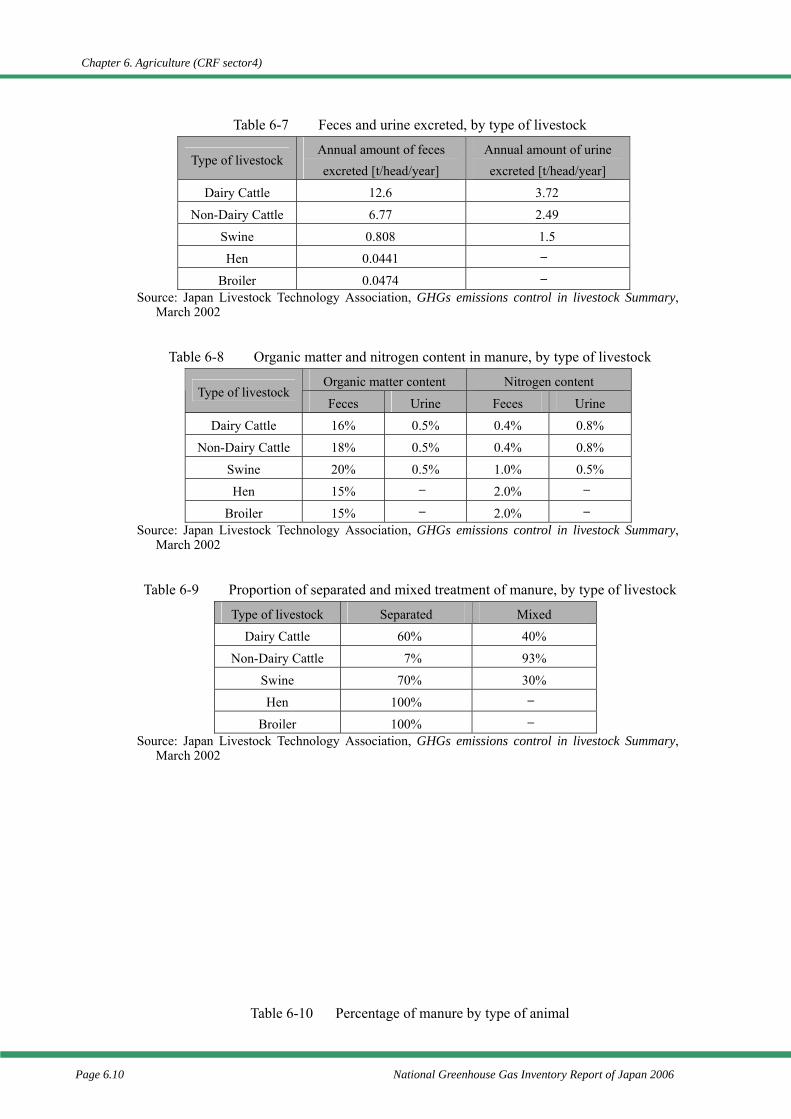
Chapter 6. Agriculture (CRF sector4)
Page 6.10 National Greenhouse Gas Inventory Report of Japan 2006
Table 6-7 Feces and urine excreted, by type of livestock
Type of livestock Annual amount of feces excreted [t/head/year]
Annual amount of urine excreted [t/head/year]
Dairy Cattle 12.6 3.72
Non-Dairy Cattle 6.77 2.49
Swine 0.808 1.5
Hen 0.0441 ─
Broiler 0.0474 ─ Source: Japan Livestock Technology Association, GHGs emissions control in livestock Summary,
March 2002
Table 6-8 Organic matter and nitrogen content in manure, by type of livestock
Organic matter content Nitrogen content Type of livestock
Feces Urine Feces Urine
Dairy Cattle 16% 0.5% 0.4% 0.8%
Non-Dairy Cattle 18% 0.5% 0.4% 0.8%
Swine 20% 0.5% 1.0% 0.5%
Hen 15% ─ 2.0% ─
Broiler 15% ─ 2.0% ─ Source: Japan Livestock Technology Association, GHGs emissions control in livestock Summary,
March 2002
Table 6-9 Proportion of separated and mixed treatment of manure, by type of livestock
Type of livestock Separated Mixed
Dairy Cattle 60% 40%
Non-Dairy Cattle 7% 93%
Swine 70% 30%
Hen 100% ─
Broiler 100% ─ Source: Japan Livestock Technology Association, GHGs emissions control in livestock Summary,
March 2002
Table 6-10 Percentage of manure by type of animal
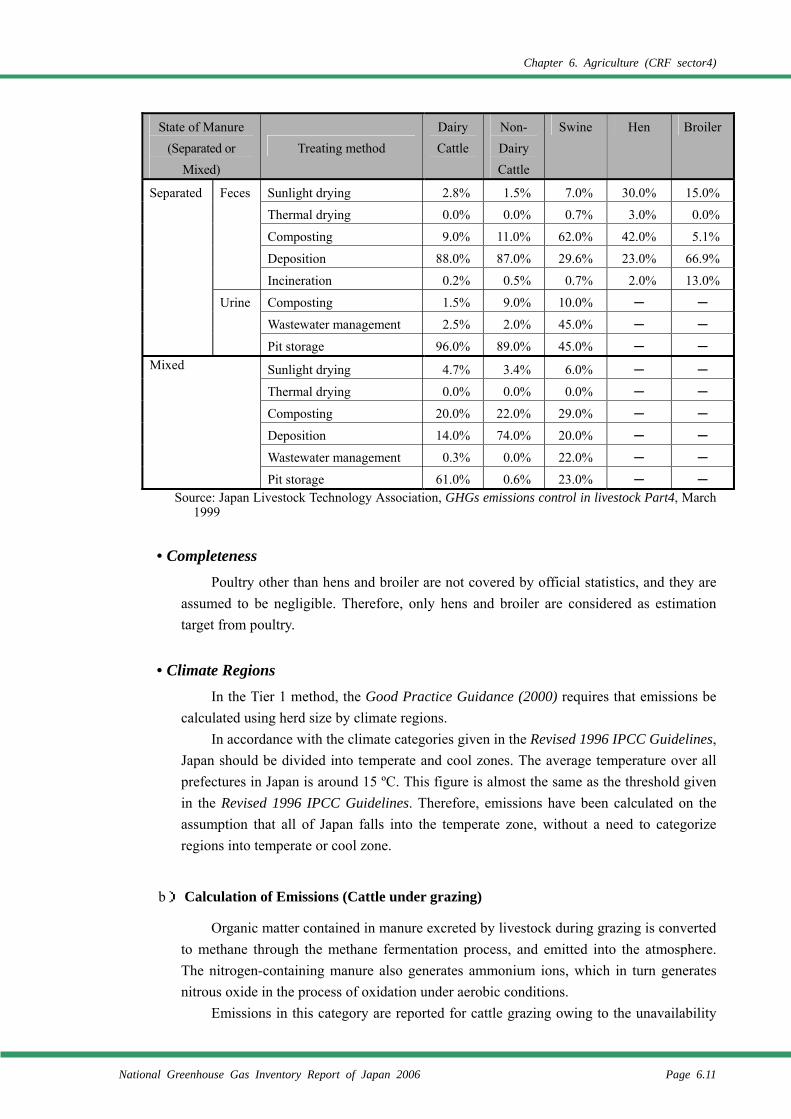
Chapter 6. Agriculture (CRF sector4)
National Greenhouse Gas Inventory Report of Japan 2006 Page 6.11
State of Manure (Separated or
Mixed) Treating method
Dairy Cattle
Non- Dairy Cattle
Swine Hen Broiler
Separated Feces Sunlight drying 2.8% 1.5% 7.0% 30.0% 15.0%
Thermal drying 0.0% 0.0% 0.7% 3.0% 0.0%
Composting 9.0% 11.0% 62.0% 42.0% 5.1%
Deposition 88.0% 87.0% 29.6% 23.0% 66.9%
Incineration 0.2% 0.5% 0.7% 2.0% 13.0%
Urine Composting 1.5% 9.0% 10.0% ─ ─
Wastewater management 2.5% 2.0% 45.0% ─ ─
Pit storage 96.0% 89.0% 45.0% ─ ─ Mixed Sunlight drying 4.7% 3.4% 6.0% ─ ─ Thermal drying 0.0% 0.0% 0.0% ─ ─
Composting 20.0% 22.0% 29.0% ─ ─
Deposition 14.0% 74.0% 20.0% ─ ─
Wastewater management 0.3% 0.0% 22.0% ─ ─
Pit storage 61.0% 0.6% 23.0% ─ ─ Source: Japan Livestock Technology Association, GHGs emissions control in livestock Part4, March
1999
• Completeness Poultry other than hens and broiler are not covered by official statistics, and they are
assumed to be negligible. Therefore, only hens and broiler are considered as estimation target from poultry.
• Climate Regions In the Tier 1 method, the Good Practice Guidance (2000) requires that emissions be
calculated using herd size by climate regions. In accordance with the climate categories given in the Revised 1996 IPCC Guidelines,
Japan should be divided into temperate and cool zones. The average temperature over all prefectures in Japan is around 15 ºC. This figure is almost the same as the threshold given in the Revised 1996 IPCC Guidelines. Therefore, emissions have been calculated on the assumption that all of Japan falls into the temperate zone, without a need to categorize regions into temperate or cool zone.
b) Calculation of Emissions (Cattle under grazing)
Organic matter contained in manure excreted by livestock during grazing is converted to methane through the methane fermentation process, and emitted into the atmosphere. The nitrogen-containing manure also generates ammonium ions, which in turn generates nitrous oxide in the process of oxidation under aerobic conditions.
Emissions in this category are reported for cattle grazing owing to the unavailability
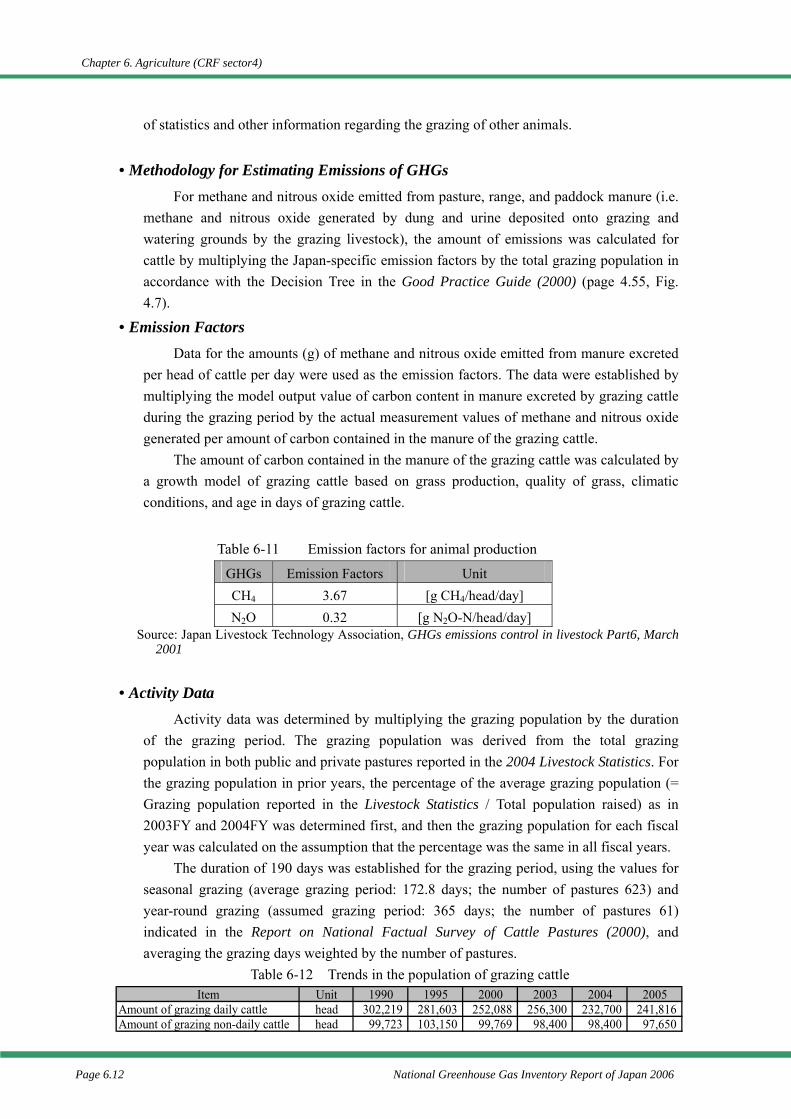
Chapter 6. Agriculture (CRF sector4)
Page 6.12 National Greenhouse Gas Inventory Report of Japan 2006
of statistics and other information regarding the grazing of other animals.
• Methodology for Estimating Emissions of GHGs For methane and nitrous oxide emitted from pasture, range, and paddock manure (i.e.
methane and nitrous oxide generated by dung and urine deposited onto grazing and watering grounds by the grazing livestock), the amount of emissions was calculated for cattle by multiplying the Japan-specific emission factors by the total grazing population in accordance with the Decision Tree in the Good Practice Guide (2000) (page 4.55, Fig. 4.7).
• Emission Factors Data for the amounts (g) of methane and nitrous oxide emitted from manure excreted
per head of cattle per day were used as the emission factors. The data were established by multiplying the model output value of carbon content in manure excreted by grazing cattle during the grazing period by the actual measurement values of methane and nitrous oxide generated per amount of carbon contained in the manure of the grazing cattle.
The amount of carbon contained in the manure of the grazing cattle was calculated by a growth model of grazing cattle based on grass production, quality of grass, climatic conditions, and age in days of grazing cattle.
Table 6-11 Emission factors for animal production
GHGs Emission Factors Unit CH4 3.67 [g CH4/head/day] N2O 0.32 [g N2O-N/head/day]
Source: Japan Livestock Technology Association, GHGs emissions control in livestock Part6, March 2001
• Activity Data Activity data was determined by multiplying the grazing population by the duration
of the grazing period. The grazing population was derived from the total grazing population in both public and private pastures reported in the 2004 Livestock Statistics. For the grazing population in prior years, the percentage of the average grazing population (= Grazing population reported in the Livestock Statistics / Total population raised) as in 2003FY and 2004FY was determined first, and then the grazing population for each fiscal year was calculated on the assumption that the percentage was the same in all fiscal years.
The duration of 190 days was established for the grazing period, using the values for seasonal grazing (average grazing period: 172.8 days; the number of pastures 623) and year-round grazing (assumed grazing period: 365 days; the number of pastures 61) indicated in the Report on National Factual Survey of Cattle Pastures (2000), and averaging the grazing days weighted by the number of pastures.
Table 6-12 Trends in the population of grazing cattle Item Unit 1990 1995 2000 2003 2004 2005
Amount of grazing daily cattle head 302,219 281,603 252,088 256,300 232,700 241,816Amount of grazing non-daily cattle head 99,723 103,150 99,769 98,400 98,400 97,650
Chapter 6. Agriculture (CRF sector4)
National Greenhouse Gas Inventory Report of Japan 2006 Page 6.13
• c) Reporting in Common Reporting Format (CRF) In the CRF, with regard to CH4 emissions from this category, it is required to report
emissions by each livestock. However, for N2O emissions from this category, it is required to report emissions by AWMS (11. Anaerobic Lagoons、12. Liquid Systems、13. Solid Storage and Dry Lot、14. Other.
For cattle, swine, and poultry, Japan’s country-specific manure management categories and the implementation rates of the management categories have been established for each type of animal. For details, see Table 6-11 below.
The current CRF divides the reporting categories into Anaerobic Lagoons, Liquid Systems, Solid Storage and Dry Lots, and Other. In Japan, however, composting is widely practiced, particularly with respect to domestic livestock feces. Consequently the composting-related subcategories of “Piling” and “Composting” have been established under the Other category. Additional subcategories of “Thermal drying” and “Incineration”, which are practiced for the purposes of volume reduction and easier handling of dung, have been also included in the Other category. Urine undergoes purification treatment as sewage with high concentrations of pollutants. Accordingly, a subcategory of “Purification” has been added to the CRF category of Other.
Composting is widely practiced in Japan because, among other things: (1) it is essential for Japanese livestock farmers to facilitate transportation and handling, because the lack of space required for the on-site reduction of manure makes it necessary to direct the manure for uses outside their farms; and (2) compost is in considerably higher demand as a fertilizer for various crops than is slurry or liquid manure in Japan where fertilizers tend to be lost by heavy rain and the expectations of the protection of water quality, prevention of odor, and sanitary management are high.
“11. Anaerobic Lagoons” have been reported as “NO”. Because there are quite small number of livestock farmers who has enough area of field to spread manure, and it is assumed that there are no livestock farmers who use anaerobic lagoons. There are cases when manure is spread to fields in Japan, but even in these cases, stirring is conducted before the spreading. Therefore, there are no anaerobic manure management systems.
Table 6-13 Correspondence between the Japanese and CRF manure management
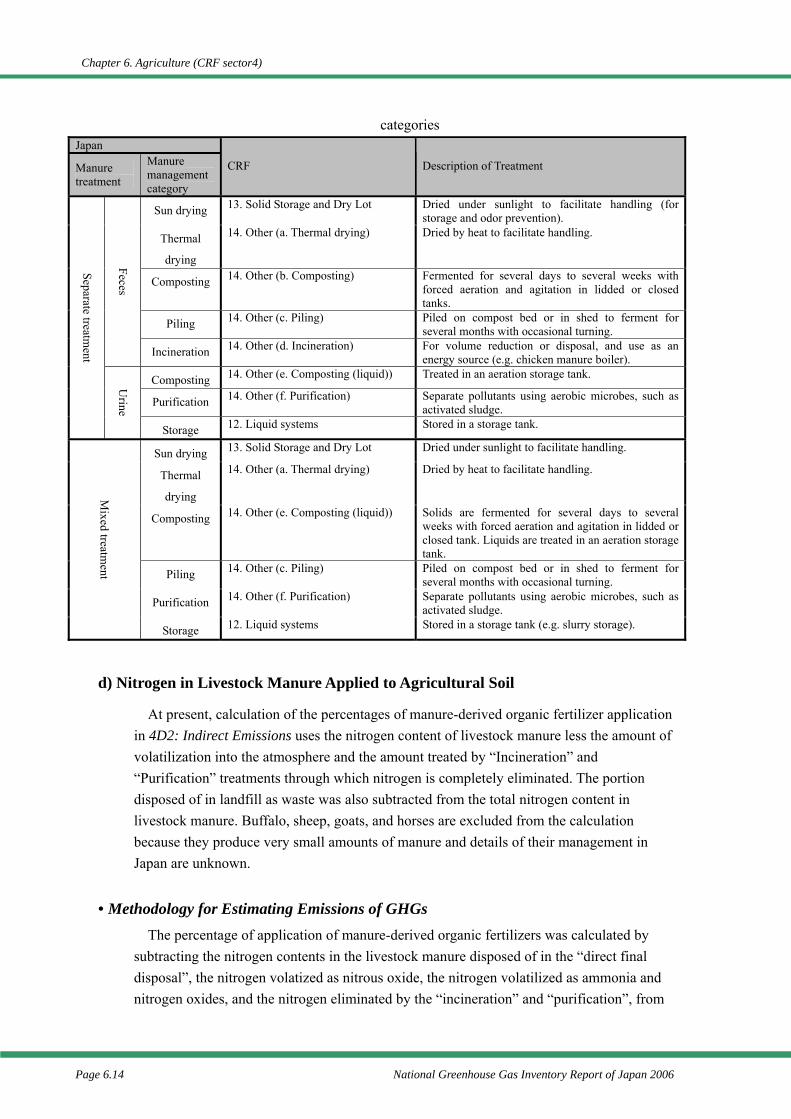
Chapter 6. Agriculture (CRF sector4)
Page 6.14 National Greenhouse Gas Inventory Report of Japan 2006
categories Japan
Manure treatment
Manure management category
CRF Description of Treatment
Sun drying 13. Solid Storage and Dry Lot Dried under sunlight to facilitate handling (for storage and odor prevention).
Thermal
drying
14. Other (a. Thermal drying) Dried by heat to facilitate handling.
Composting 14. Other (b. Composting) Fermented for several days to several weeks with forced aeration and agitation in lidded or closed tanks.
Piling 14. Other (c. Piling) Piled on compost bed or in shed to ferment for several months with occasional turning.
Feces
Incineration 14. Other (d. Incineration) For volume reduction or disposal, and use as an energy source (e.g. chicken manure boiler).
Composting 14. Other (e. Composting (liquid)) Treated in an aeration storage tank.
Purification 14. Other (f. Purification) Separate pollutants using aerobic microbes, such as activated sludge.
Separate treatment
Urine
Storage 12. Liquid systems Stored in a storage tank.
Sun drying 13. Solid Storage and Dry Lot Dried under sunlight to facilitate handling.
Thermal
drying
14. Other (a. Thermal drying) Dried by heat to facilitate handling.
Composting 14. Other (e. Composting (liquid)) Solids are fermented for several days to several weeks with forced aeration and agitation in lidded or closed tank. Liquids are treated in an aeration storage tank.
Piling 14. Other (c. Piling) Piled on compost bed or in shed to ferment for several months with occasional turning.
Purification 14. Other (f. Purification) Separate pollutants using aerobic microbes, such as activated sludge.
Mixed treatm
ent
Storage 12. Liquid systems Stored in a storage tank (e.g. slurry storage).
d) Nitrogen in Livestock Manure Applied to Agricultural Soil
At present, calculation of the percentages of manure-derived organic fertilizer application in 4D2: Indirect Emissions uses the nitrogen content of livestock manure less the amount of volatilization into the atmosphere and the amount treated by “Incineration” and “Purification” treatments through which nitrogen is completely eliminated. The portion disposed of in landfill as waste was also subtracted from the total nitrogen content in livestock manure. Buffalo, sheep, goats, and horses are excluded from the calculation because they produce very small amounts of manure and details of their management in Japan are unknown.
• Methodology for Estimating Emissions of GHGs The percentage of application of manure-derived organic fertilizers was calculated by
subtracting the nitrogen contents in the livestock manure disposed of in the “direct final disposal”, the nitrogen volatized as nitrous oxide, the nitrogen volatilized as ammonia and nitrogen oxides, and the nitrogen eliminated by the “incineration” and “purification”, from
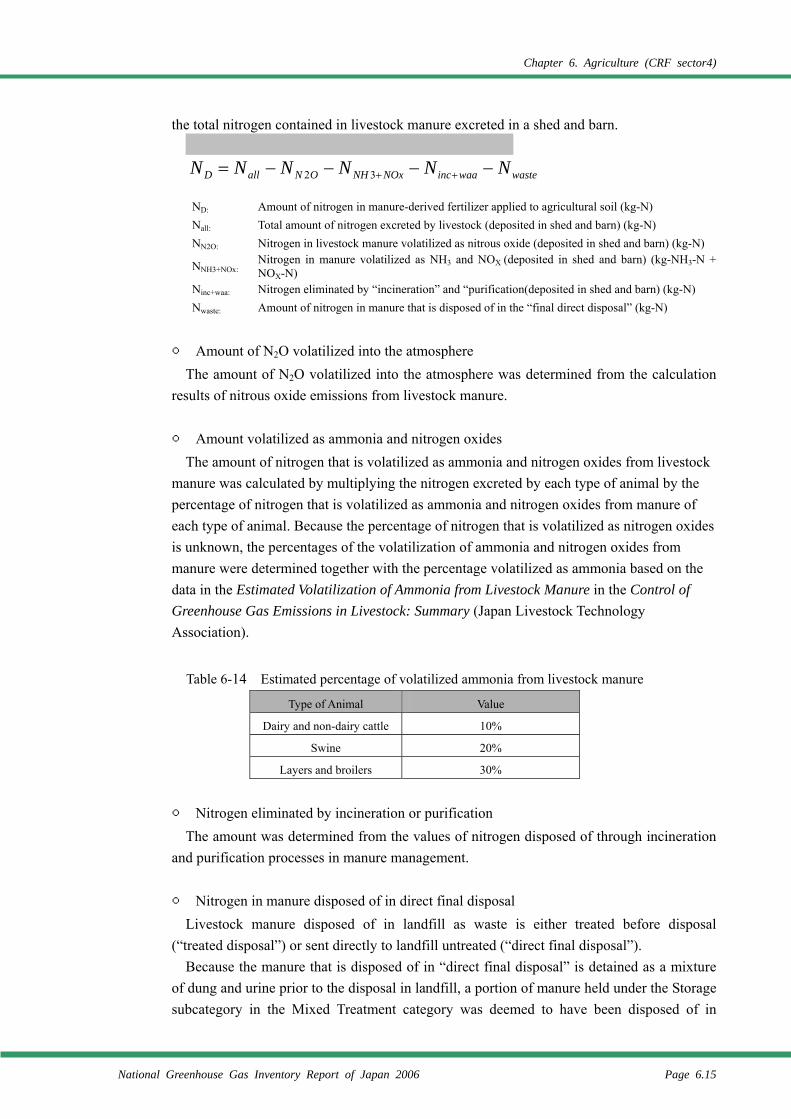
Chapter 6. Agriculture (CRF sector4)
National Greenhouse Gas Inventory Report of Japan 2006 Page 6.15
the total nitrogen contained in livestock manure excreted in a shed and barn.
ND: Amount of nitrogen in manure-derived fertilizer applied to agricultural soil (kg-N) Nall: Total amount of nitrogen excreted by livestock (deposited in shed and barn) (kg-N) NN2O: Nitrogen in livestock manure volatilized as nitrous oxide (deposited in shed and barn) (kg-N)
NNH3+NOx: Nitrogen in manure volatilized as NH3 and NOX (deposited in shed and barn) (kg-NH3-N + NOX-N)
Ninc+waa: Nitrogen eliminated by “incineration” and “purification(deposited in shed and barn) (kg-N) Nwaste: Amount of nitrogen in manure that is disposed of in the “final direct disposal” (kg-N)
○ Amount of N2O volatilized into the atmosphere
The amount of N2O volatilized into the atmosphere was determined from the calculation results of nitrous oxide emissions from livestock manure.
○ Amount volatilized as ammonia and nitrogen oxides
The amount of nitrogen that is volatilized as ammonia and nitrogen oxides from livestock manure was calculated by multiplying the nitrogen excreted by each type of animal by the percentage of nitrogen that is volatilized as ammonia and nitrogen oxides from manure of each type of animal. Because the percentage of nitrogen that is volatilized as nitrogen oxides is unknown, the percentages of the volatilization of ammonia and nitrogen oxides from manure were determined together with the percentage volatilized as ammonia based on the data in the Estimated Volatilization of Ammonia from Livestock Manure in the Control of Greenhouse Gas Emissions in Livestock: Summary (Japan Livestock Technology Association).
Table 6-14 Estimated percentage of volatilized ammonia from livestock manure
Type of Animal Value
Dairy and non-dairy cattle 10%
Swine 20%
Layers and broilers 30%
○ Nitrogen eliminated by incineration or purification
The amount was determined from the values of nitrogen disposed of through incineration and purification processes in manure management.
○ Nitrogen in manure disposed of in direct final disposal
Livestock manure disposed of in landfill as waste is either treated before disposal (“treated disposal”) or sent directly to landfill untreated (“direct final disposal”).
Because the manure that is disposed of in “direct final disposal” is detained as a mixture of dung and urine prior to the disposal in landfill, a portion of manure held under the Storage subcategory in the Mixed Treatment category was deemed to have been disposed of in
wastewaaincNOxNHONallD NNNNNN −−−−= ++32
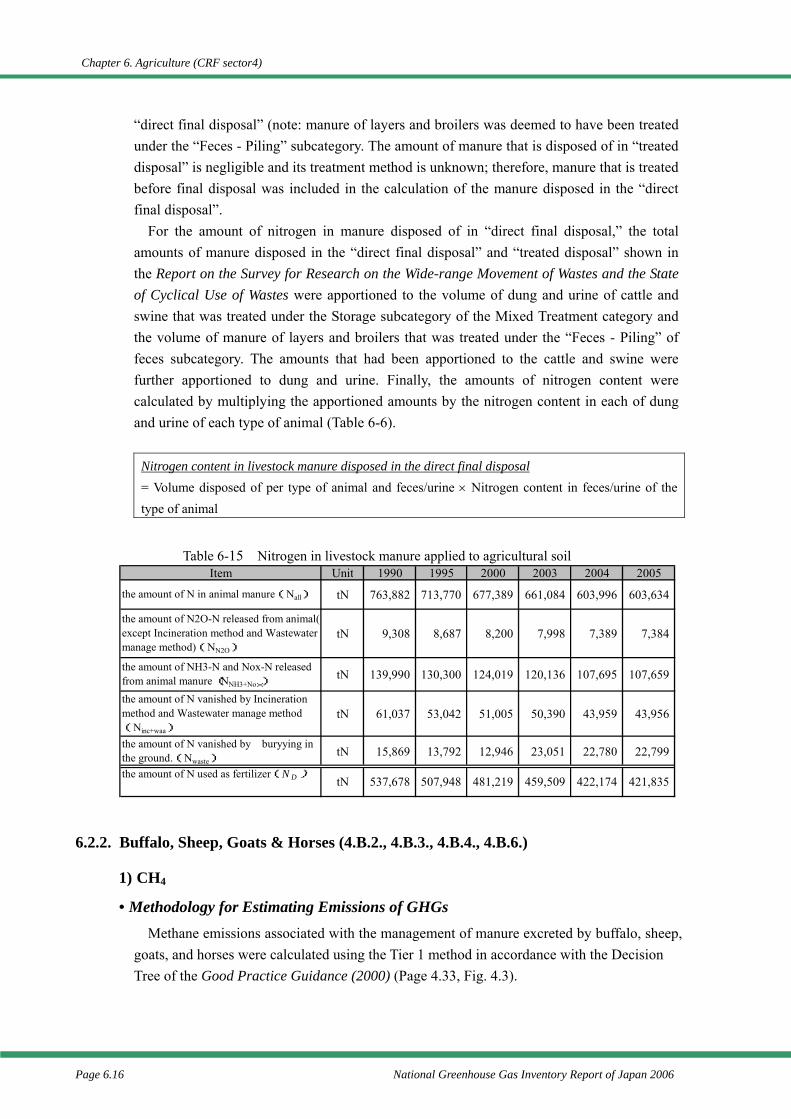
Chapter 6. Agriculture (CRF sector4)
Page 6.16 National Greenhouse Gas Inventory Report of Japan 2006
“direct final disposal” (note: manure of layers and broilers was deemed to have been treated under the “Feces - Piling” subcategory. The amount of manure that is disposed of in “treated disposal” is negligible and its treatment method is unknown; therefore, manure that is treated before final disposal was included in the calculation of the manure disposed in the “direct final disposal”.
For the amount of nitrogen in manure disposed of in “direct final disposal,” the total amounts of manure disposed in the “direct final disposal” and “treated disposal” shown in the Report on the Survey for Research on the Wide-range Movement of Wastes and the State of Cyclical Use of Wastes were apportioned to the volume of dung and urine of cattle and swine that was treated under the Storage subcategory of the Mixed Treatment category and the volume of manure of layers and broilers that was treated under the “Feces - Piling” of feces subcategory. The amounts that had been apportioned to the cattle and swine were further apportioned to dung and urine. Finally, the amounts of nitrogen content were calculated by multiplying the apportioned amounts by the nitrogen content in each of dung and urine of each type of animal (Table 6-6).
Nitrogen content in livestock manure disposed in the direct final disposal = Volume disposed of per type of animal and feces/urine × Nitrogen content in feces/urine of the type of animal
Table 6-15 Nitrogen in livestock manure applied to agricultural soil
6.2.2. Buffalo, Sheep, Goats & Horses (4.B.2., 4.B.3., 4.B.4., 4.B.6.)
1) CH4
• Methodology for Estimating Emissions of GHGs Methane emissions associated with the management of manure excreted by buffalo, sheep,
goats, and horses were calculated using the Tier 1 method in accordance with the Decision Tree of the Good Practice Guidance (2000) (Page 4.33, Fig. 4.3).
Item Unit 1990 1995 2000 2003 2004 2005
the amount of N in animal manure(Nall) tN 763,882 713,770 677,389 661,084 603,996 603,634
the amount of N2O-N released from animal(except Incineration method and Wastewatermanage method)(NN2O)
tN 9,308 8,687 8,200 7,998 7,389 7,384
the amount of NH3-N and Nox-N releasedfrom animal manure (NNH3+Nox)
tN 139,990 130,300 124,019 120,136 107,695 107,659
the amount of N vanished by Incinerationmethod and Wastewater manage method(Ninc+waa)
tN 61,037 53,042 51,005 50,390 43,959 43,956
the amount of N vanished by buryying inthe ground.(Nwaste)
tN 15,869 13,792 12,946 23,051 22,780 22,799
the amount of N used as fertilizer(N D ) tN 537,678 507,948 481,219 459,509 422,174 421,835
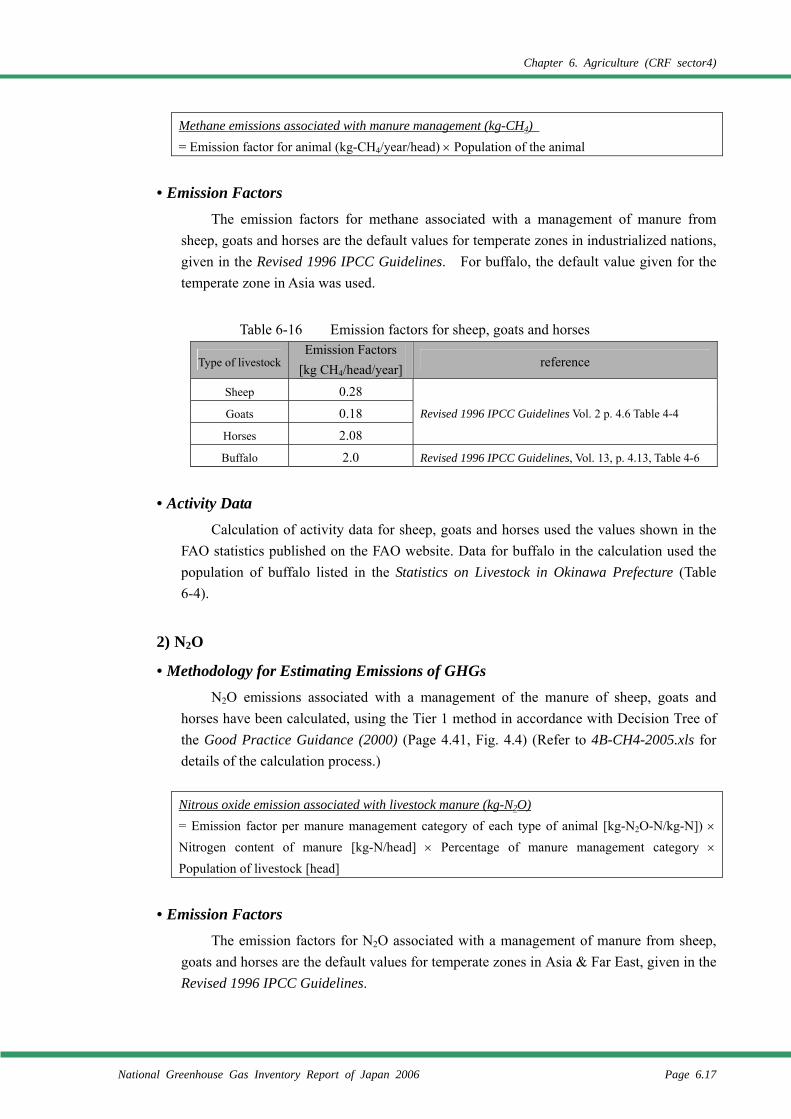
Chapter 6. Agriculture (CRF sector4)
National Greenhouse Gas Inventory Report of Japan 2006 Page 6.17
Methane emissions associated with manure management (kg-CH4) = Emission factor for animal (kg-CH4/year/head) × Population of the animal
• Emission Factors The emission factors for methane associated with a management of manure from
sheep, goats and horses are the default values for temperate zones in industrialized nations, given in the Revised 1996 IPCC Guidelines. For buffalo, the default value given for the temperate zone in Asia was used.
Table 6-16 Emission factors for sheep, goats and horses
Type of livestock Emission Factors
[kg CH4/head/year] reference
Sheep 0.28
Goats 0.18
Horses 2.08
Revised 1996 IPCC Guidelines Vol. 2 p. 4.6 Table 4-4
Buffalo 2.0 Revised 1996 IPCC Guidelines, Vol. 13, p. 4.13, Table 4-6
• Activity Data Calculation of activity data for sheep, goats and horses used the values shown in the
FAO statistics published on the FAO website. Data for buffalo in the calculation used the population of buffalo listed in the Statistics on Livestock in Okinawa Prefecture (Table 6-4).
2) N2O
• Methodology for Estimating Emissions of GHGs N2O emissions associated with a management of the manure of sheep, goats and
horses have been calculated, using the Tier 1 method in accordance with Decision Tree of the Good Practice Guidance (2000) (Page 4.41, Fig. 4.4) (Refer to 4B-CH4-2005.xls for details of the calculation process.)
Nitrous oxide emission associated with livestock manure (kg-N2O) = Emission factor per manure management category of each type of animal [kg-N2O-N/kg-N]) × Nitrogen content of manure [kg-N/head] × Percentage of manure management category × Population of livestock [head]
• Emission Factors The emission factors for N2O associated with a management of manure from sheep,
goats and horses are the default values for temperate zones in Asia & Far East, given in the Revised 1996 IPCC Guidelines.
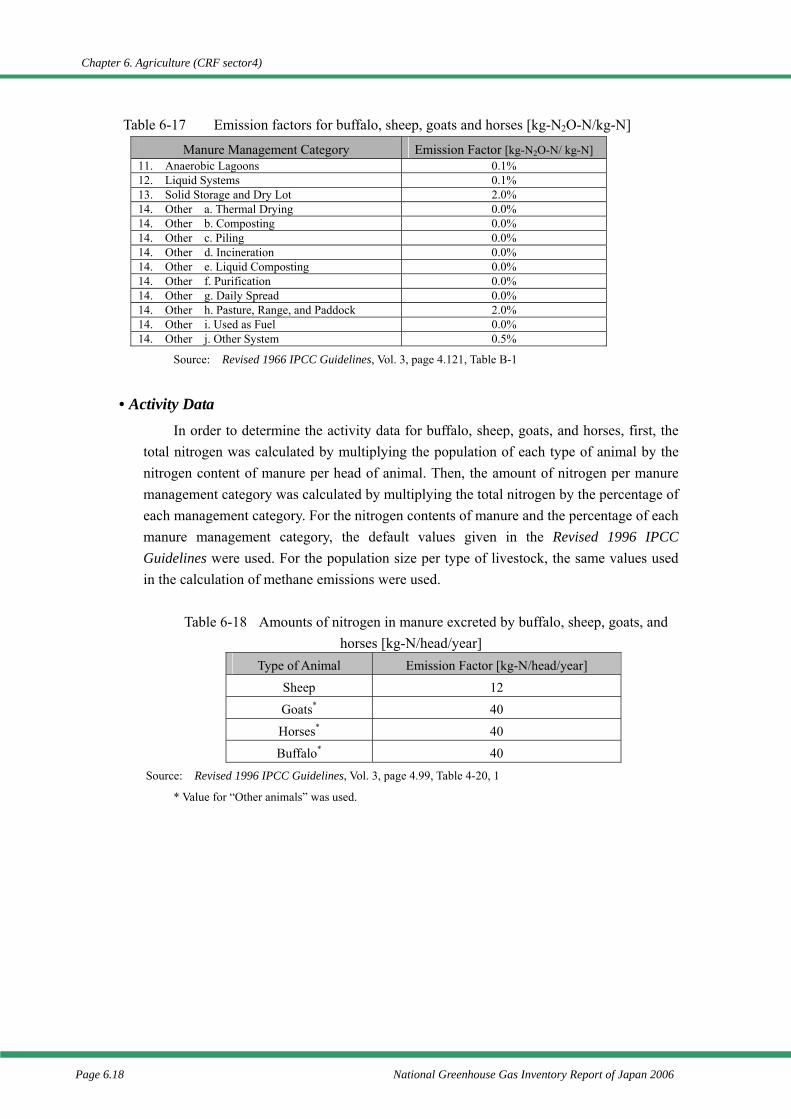
Chapter 6. Agriculture (CRF sector4)
Page 6.18 National Greenhouse Gas Inventory Report of Japan 2006
Table 6-17 Emission factors for buffalo, sheep, goats and horses [kg-N2O-N/kg-N]
Manure Management Category Emission Factor [kg-N2O-N/ kg-N] 11. Anaerobic Lagoons 0.1% 12. Liquid Systems 0.1% 13. Solid Storage and Dry Lot 2.0% 14. Other a. Thermal Drying 0.0% 14. Other b. Composting 0.0% 14. Other c. Piling 0.0% 14. Other d. Incineration 0.0% 14. Other e. Liquid Composting 0.0% 14. Other f. Purification 0.0% 14. Other g. Daily Spread 0.0% 14. Other h. Pasture, Range, and Paddock 2.0% 14. Other i. Used as Fuel 0.0% 14. Other j. Other System 0.5%
Source: Revised 1966 IPCC Guidelines, Vol. 3, page 4.121, Table B-1
• Activity Data In order to determine the activity data for buffalo, sheep, goats, and horses, first, the
total nitrogen was calculated by multiplying the population of each type of animal by the nitrogen content of manure per head of animal. Then, the amount of nitrogen per manure management category was calculated by multiplying the total nitrogen by the percentage of each management category. For the nitrogen contents of manure and the percentage of each manure management category, the default values given in the Revised 1996 IPCC Guidelines were used. For the population size per type of livestock, the same values used in the calculation of methane emissions were used.
Table 6-18 Amounts of nitrogen in manure excreted by buffalo, sheep, goats, and horses [kg-N/head/year]
Type of Animal Emission Factor [kg-N/head/year]
Sheep 12
Goats* 40
Horses* 40
Buffalo* 40
Source: Revised 1996 IPCC Guidelines, Vol. 3, page 4.99, Table 4-20, 1
* Value for “Other animals” was used.
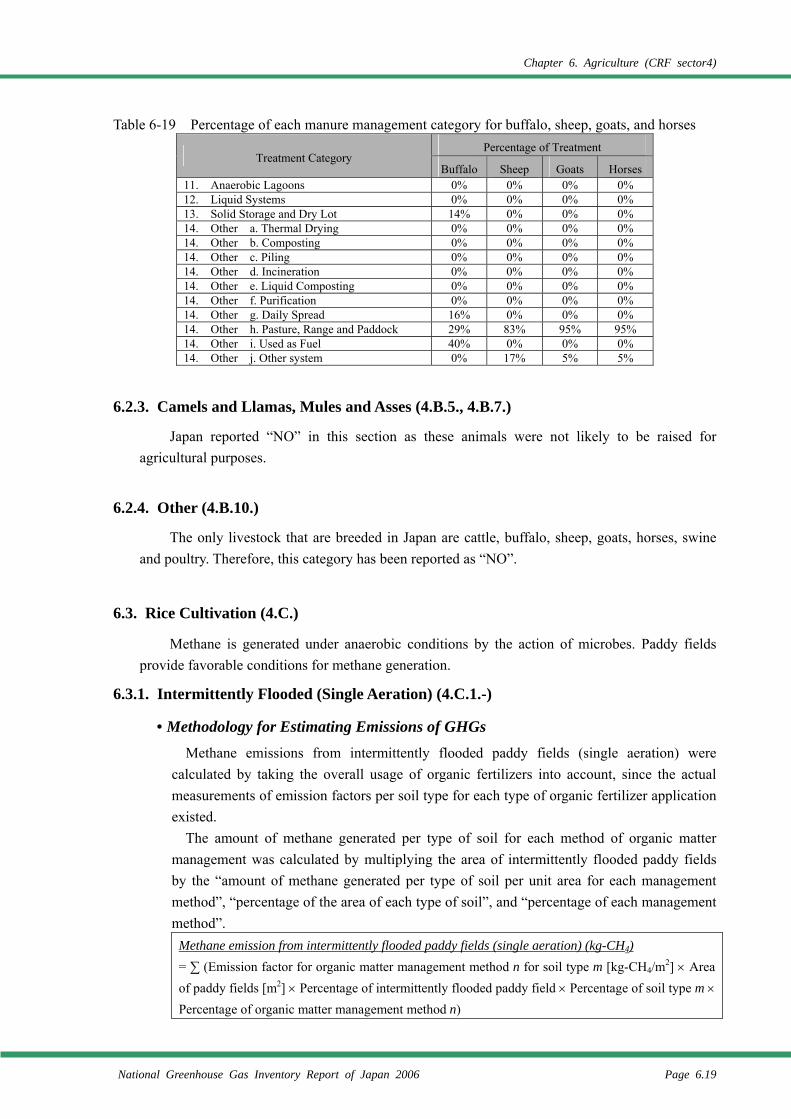
Chapter 6. Agriculture (CRF sector4)
National Greenhouse Gas Inventory Report of Japan 2006 Page 6.19
Table 6-19 Percentage of each manure management category for buffalo, sheep, goats, and horses Percentage of Treatment
Treatment Category Buffalo Sheep Goats Horses
11. Anaerobic Lagoons 0% 0% 0% 0% 12. Liquid Systems 0% 0% 0% 0% 13. Solid Storage and Dry Lot 14% 0% 0% 0% 14. Other a. Thermal Drying 0% 0% 0% 0% 14. Other b. Composting 0% 0% 0% 0% 14. Other c. Piling 0% 0% 0% 0% 14. Other d. Incineration 0% 0% 0% 0% 14. Other e. Liquid Composting 0% 0% 0% 0% 14. Other f. Purification 0% 0% 0% 0% 14. Other g. Daily Spread 16% 0% 0% 0% 14. Other h. Pasture, Range and Paddock 29% 83% 95% 95% 14. Other i. Used as Fuel 40% 0% 0% 0% 14. Other j. Other system 0% 17% 5% 5%
6.2.3. Camels and Llamas, Mules and Asses (4.B.5., 4.B.7.)
Japan reported “NO” in this section as these animals were not likely to be raised for agricultural purposes.
6.2.4. Other (4.B.10.)
The only livestock that are breeded in Japan are cattle, buffalo, sheep, goats, horses, swine and poultry. Therefore, this category has been reported as “NO”.
6.3. Rice Cultivation (4.C.)
Methane is generated under anaerobic conditions by the action of microbes. Paddy fields provide favorable conditions for methane generation.
6.3.1. Intermittently Flooded (Single Aeration) (4.C.1.-)
• Methodology for Estimating Emissions of GHGs Methane emissions from intermittently flooded paddy fields (single aeration) were
calculated by taking the overall usage of organic fertilizers into account, since the actual measurements of emission factors per soil type for each type of organic fertilizer application existed.
The amount of methane generated per type of soil for each method of organic matter management was calculated by multiplying the area of intermittently flooded paddy fields by the “amount of methane generated per type of soil per unit area for each management method”, “percentage of the area of each type of soil”, and “percentage of each management method”.
Methane emission from intermittently flooded paddy fields (single aeration) (kg-CH4) = ∑ (Emission factor for organic matter management method n for soil type m [kg-CH4/m2] × Area of paddy fields [m2] × Percentage of intermittently flooded paddy field × Percentage of soil type m × Percentage of organic matter management method n)
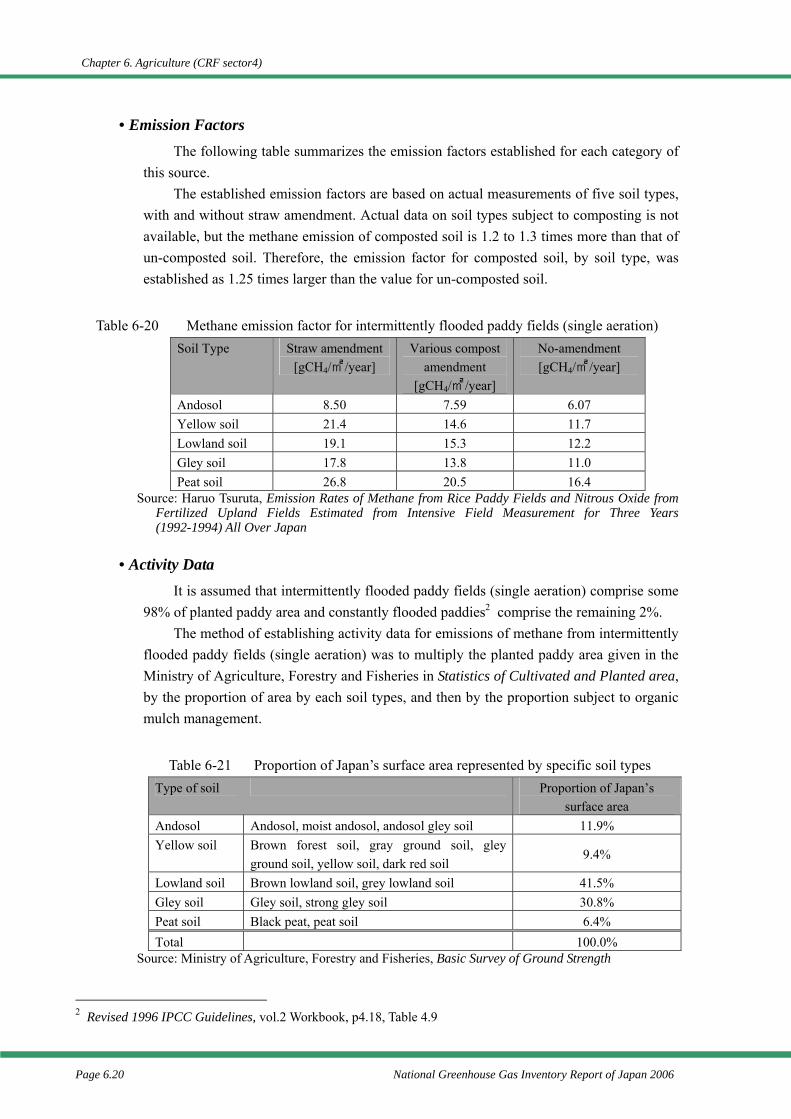
Chapter 6. Agriculture (CRF sector4)
Page 6.20 National Greenhouse Gas Inventory Report of Japan 2006
• Emission Factors The following table summarizes the emission factors established for each category of
this source. The established emission factors are based on actual measurements of five soil types,
with and without straw amendment. Actual data on soil types subject to composting is not available, but the methane emission of composted soil is 1.2 to 1.3 times more than that of un-composted soil. Therefore, the emission factor for composted soil, by soil type, was established as 1.25 times larger than the value for un-composted soil.
Table 6-20 Methane emission factor for intermittently flooded paddy fields (single aeration) Soil Type Straw amendment
[gCH4/㎡/year] Various compost
amendment [gCH4/㎡/year]
No-amendment [gCH4/㎡/year]
Andosol 8.50 7.59 6.07 Yellow soil 21.4 14.6 11.7 Lowland soil 19.1 15.3 12.2 Gley soil 17.8 13.8 11.0 Peat soil 26.8 20.5 16.4
Source: Haruo Tsuruta, Emission Rates of Methane from Rice Paddy Fields and Nitrous Oxide from Fertilized Upland Fields Estimated from Intensive Field Measurement for Three Years (1992-1994) All Over Japan
• Activity Data It is assumed that intermittently flooded paddy fields (single aeration) comprise some
98% of planted paddy area and constantly flooded paddies2 comprise the remaining 2%. The method of establishing activity data for emissions of methane from intermittently
flooded paddy fields (single aeration) was to multiply the planted paddy area given in the Ministry of Agriculture, Forestry and Fisheries in Statistics of Cultivated and Planted area, by the proportion of area by each soil types, and then by the proportion subject to organic mulch management.
Table 6-21 Proportion of Japan’s surface area represented by specific soil types Type of soil Proportion of Japan’s
surface area Andosol Andosol, moist andosol, andosol gley soil 11.9% Yellow soil Brown forest soil, gray ground soil, gley
ground soil, yellow soil, dark red soil 9.4%
Lowland soil Brown lowland soil, grey lowland soil 41.5% Gley soil Gley soil, strong gley soil 30.8% Peat soil Black peat, peat soil 6.4% Total 100.0%
Source: Ministry of Agriculture, Forestry and Fisheries, Basic Survey of Ground Strength
2 Revised 1996 IPCC Guidelines, vol.2 Workbook, p4.18, Table 4.9
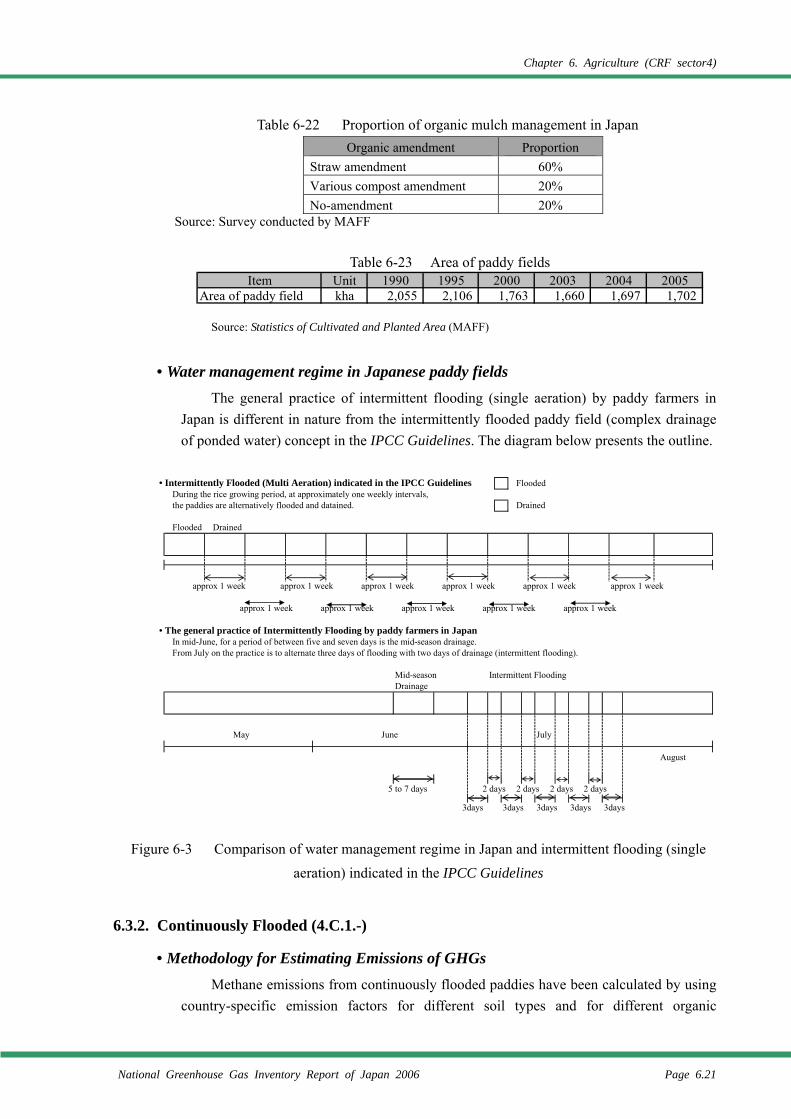
Chapter 6. Agriculture (CRF sector4)
National Greenhouse Gas Inventory Report of Japan 2006 Page 6.21
• Intermittently Flooded (Multi Aeration) indicated in the IPCC Guidelines FloodedDuring the rice growing period, at approximately one weekly intervals,the paddies are alternatively flooded and datained. Drained
Flooded Drained
approx 1 week approx 1 week approx 1 week approx 1 week approx 1 week approx 1 week
approx 1 week approx 1 week approx 1 week approx 1 week approx 1 week
• The general practice of Intermittently Flooding by paddy farmers in Japan In mid-June, for a period of between five and seven days is the mid-season drainage.From July on the practice is to alternate three days of flooding with two days of drainage (intermittent flooding).
Mid-season Intermittent FloodingDrainage
May June July
August
5 to 7 days 2 days 2 days 2 days 2 days
3days 3days 3days 3days 3days
Table 6-22 Proportion of organic mulch management in Japan Organic amendment Proportion
Straw amendment 60% Various compost amendment 20% No-amendment 20%
Source: Survey conducted by MAFF
Table 6-23 Area of paddy fields
Source: Statistics of Cultivated and Planted Area (MAFF)
• Water management regime in Japanese paddy fields The general practice of intermittent flooding (single aeration) by paddy farmers in
Japan is different in nature from the intermittently flooded paddy field (complex drainage of ponded water) concept in the IPCC Guidelines. The diagram below presents the outline.
Figure 6-3 Comparison of water management regime in Japan and intermittent flooding (single aeration) indicated in the IPCC Guidelines
6.3.2. Continuously Flooded (4.C.1.-)
• Methodology for Estimating Emissions of GHGs Methane emissions from continuously flooded paddies have been calculated by using
country-specific emission factors for different soil types and for different organic
Item Unit 1990 1995 2000 2003 2004 2005Area of paddy field kha 2,055 2,106 1,763 1,660 1,697 1,702
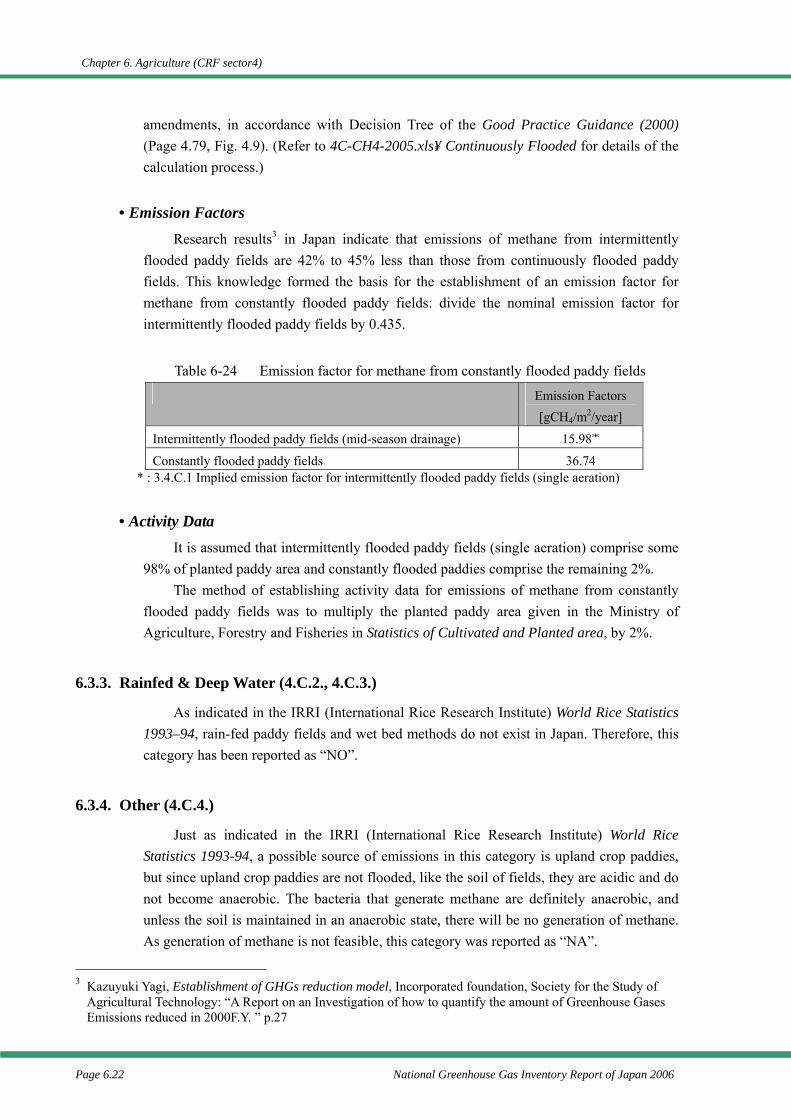
Chapter 6. Agriculture (CRF sector4)
Page 6.22 National Greenhouse Gas Inventory Report of Japan 2006
amendments, in accordance with Decision Tree of the Good Practice Guidance (2000) (Page 4.79, Fig. 4.9). (Refer to 4C-CH4-2005.xls¥ Continuously Flooded for details of the calculation process.)
• Emission Factors Research results3 in Japan indicate that emissions of methane from intermittently
flooded paddy fields are 42% to 45% less than those from continuously flooded paddy fields. This knowledge formed the basis for the establishment of an emission factor for methane from constantly flooded paddy fields: divide the nominal emission factor for intermittently flooded paddy fields by 0.435.
Table 6-24 Emission factor for methane from constantly flooded paddy fields
Emission Factors [gCH4/m2/year]
Intermittently flooded paddy fields (mid-season drainage) 15.98*
Constantly flooded paddy fields 36.74 * : 3.4.C.1 Implied emission factor for intermittently flooded paddy fields (single aeration)
• Activity Data It is assumed that intermittently flooded paddy fields (single aeration) comprise some
98% of planted paddy area and constantly flooded paddies comprise the remaining 2%. The method of establishing activity data for emissions of methane from constantly
flooded paddy fields was to multiply the planted paddy area given in the Ministry of Agriculture, Forestry and Fisheries in Statistics of Cultivated and Planted area, by 2%.
6.3.3. Rainfed & Deep Water (4.C.2., 4.C.3.)
As indicated in the IRRI (International Rice Research Institute) World Rice Statistics 1993–94, rain-fed paddy fields and wet bed methods do not exist in Japan. Therefore, this category has been reported as “NO”.
6.3.4. Other (4.C.4.)
Just as indicated in the IRRI (International Rice Research Institute) World Rice Statistics 1993-94, a possible source of emissions in this category is upland crop paddies, but since upland crop paddies are not flooded, like the soil of fields, they are acidic and do not become anaerobic. The bacteria that generate methane are definitely anaerobic, and unless the soil is maintained in an anaerobic state, there will be no generation of methane. As generation of methane is not feasible, this category was reported as “NA”.
3 Kazuyuki Yagi, Establishment of GHGs reduction model, Incorporated foundation, Society for the Study of
Agricultural Technology: “A Report on an Investigation of how to quantify the amount of Greenhouse Gases Emissions reduced in 2000F.Y. ” p.27
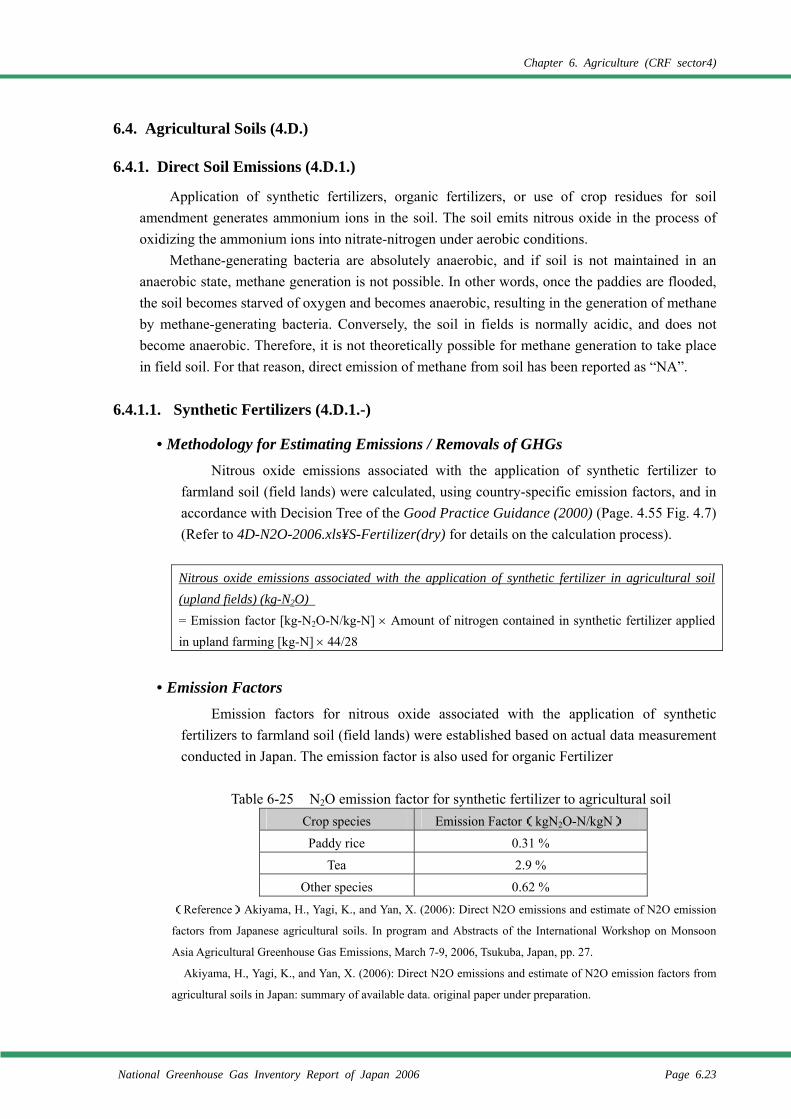
Chapter 6. Agriculture (CRF sector4)
National Greenhouse Gas Inventory Report of Japan 2006 Page 6.23
6.4. Agricultural Soils (4.D.)
6.4.1. Direct Soil Emissions (4.D.1.)
Application of synthetic fertilizers, organic fertilizers, or use of crop residues for soil amendment generates ammonium ions in the soil. The soil emits nitrous oxide in the process of oxidizing the ammonium ions into nitrate-nitrogen under aerobic conditions.
Methane-generating bacteria are absolutely anaerobic, and if soil is not maintained in an anaerobic state, methane generation is not possible. In other words, once the paddies are flooded, the soil becomes starved of oxygen and becomes anaerobic, resulting in the generation of methane by methane-generating bacteria. Conversely, the soil in fields is normally acidic, and does not become anaerobic. Therefore, it is not theoretically possible for methane generation to take place in field soil. For that reason, direct emission of methane from soil has been reported as “NA”.
6.4.1.1. Synthetic Fertilizers (4.D.1.-)
• Methodology for Estimating Emissions / Removals of GHGs Nitrous oxide emissions associated with the application of synthetic fertilizer to
farmland soil (field lands) were calculated, using country-specific emission factors, and in accordance with Decision Tree of the Good Practice Guidance (2000) (Page. 4.55 Fig. 4.7) (Refer to 4D-N2O-2006.xls¥S-Fertilizer(dry) for details on the calculation process).
Nitrous oxide emissions associated with the application of synthetic fertilizer in agricultural soil (upland fields) (kg-N2O) = Emission factor [kg-N2O-N/kg-N] × Amount of nitrogen contained in synthetic fertilizer applied in upland farming [kg-N] × 44/28
• Emission Factors Emission factors for nitrous oxide associated with the application of synthetic
fertilizers to farmland soil (field lands) were established based on actual data measurement conducted in Japan. The emission factor is also used for organic Fertilizer
Table 6-25 N2O emission factor for synthetic fertilizer to agricultural soil
Crop species Emission Factor(kgN2O-N/kgN)
Paddy rice 0.31 %
Tea 2.9 %
Other species 0.62 %
(Reference)Akiyama, H., Yagi, K., and Yan, X. (2006): Direct N2O emissions and estimate of N2O emission
factors from Japanese agricultural soils. In program and Abstracts of the International Workshop on Monsoon
Asia Agricultural Greenhouse Gas Emissions, March 7-9, 2006, Tsukuba, Japan, pp. 27.
Akiyama, H., Yagi, K., and Yan, X. (2006): Direct N2O emissions and estimate of N2O emission factors from
agricultural soils in Japan: summary of available data. original paper under preparation.
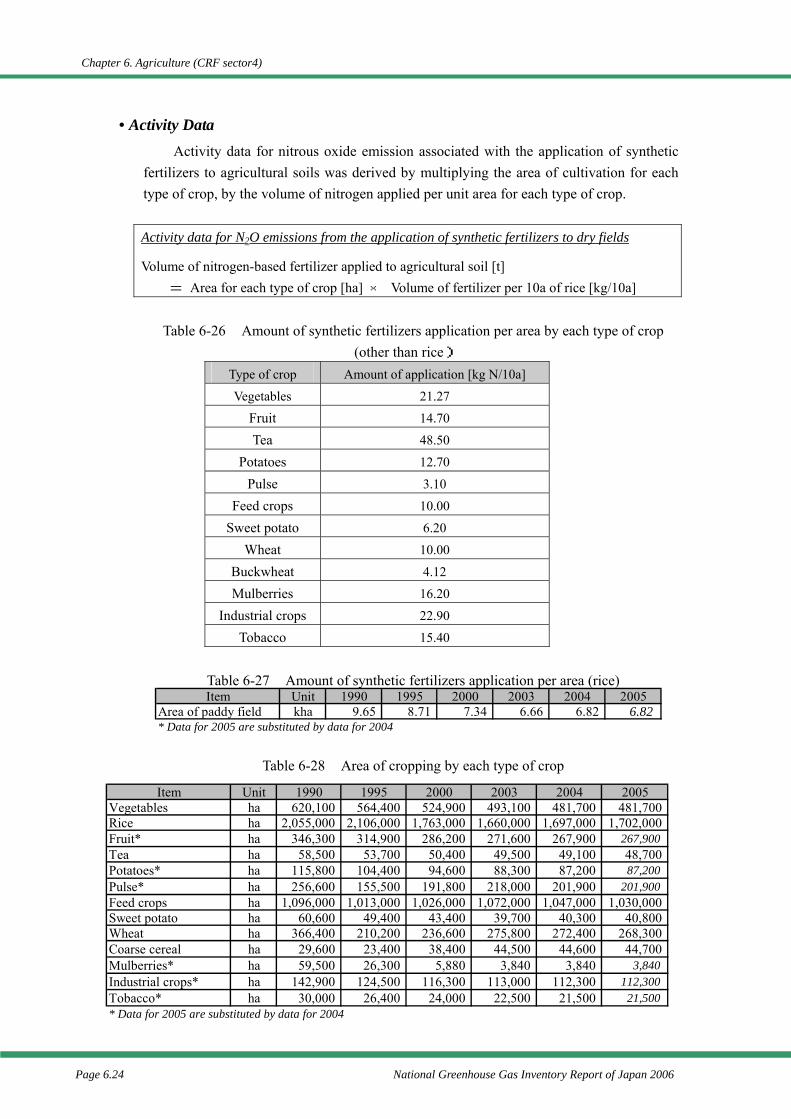
Chapter 6. Agriculture (CRF sector4)
Page 6.24 National Greenhouse Gas Inventory Report of Japan 2006
• Activity Data Activity data for nitrous oxide emission associated with the application of synthetic
fertilizers to agricultural soils was derived by multiplying the area of cultivation for each type of crop, by the volume of nitrogen applied per unit area for each type of crop.
Activity data for N2O emissions from the application of synthetic fertilizers to dry fields Volume of nitrogen-based fertilizer applied to agricultural soil [t]
= Area for each type of crop [ha] × Volume of fertilizer per 10a of rice [kg/10a]
Table 6-26 Amount of synthetic fertilizers application per area by each type of crop (other than rice)
Type of crop Amount of application [kg N/10a]
Vegetables 21.27
Fruit 14.70
Tea 48.50
Potatoes 12.70
Pulse 3.10
Feed crops 10.00
Sweet potato 6.20
Wheat 10.00
Buckwheat 4.12
Mulberries 16.20
Industrial crops 22.90
Tobacco 15.40
Table 6-27 Amount of synthetic fertilizers application per area (rice)
Table 6-28 Area of cropping by each type of crop
Item Unit 1990 1995 2000 2003 2004 2005Area of paddy field kha 9.65 8.71 7.34 6.66 6.82 6.82* Data for 2005 are substituted by data for 2004
Item Unit 1990 1995 2000 2003 2004 2005Vegetables ha 620,100 564,400 524,900 493,100 481,700 481,700Rice ha 2,055,000 2,106,000 1,763,000 1,660,000 1,697,000 1,702,000Fruit* ha 346,300 314,900 286,200 271,600 267,900 267,900Tea ha 58,500 53,700 50,400 49,500 49,100 48,700Potatoes* ha 115,800 104,400 94,600 88,300 87,200 87,200Pulse* ha 256,600 155,500 191,800 218,000 201,900 201,900Feed crops ha 1,096,000 1,013,000 1,026,000 1,072,000 1,047,000 1,030,000Sweet potato ha 60,600 49,400 43,400 39,700 40,300 40,800Wheat ha 366,400 210,200 236,600 275,800 272,400 268,300Coarse cereal ha 29,600 23,400 38,400 44,500 44,600 44,700Mulberries* ha 59,500 26,300 5,880 3,840 3,840 3,840Industrial crops* ha 142,900 124,500 116,300 113,000 112,300 112,300Tobacco* ha 30,000 26,400 24,000 22,500 21,500 21,500* Data for 2005 are substituted by data for 2004
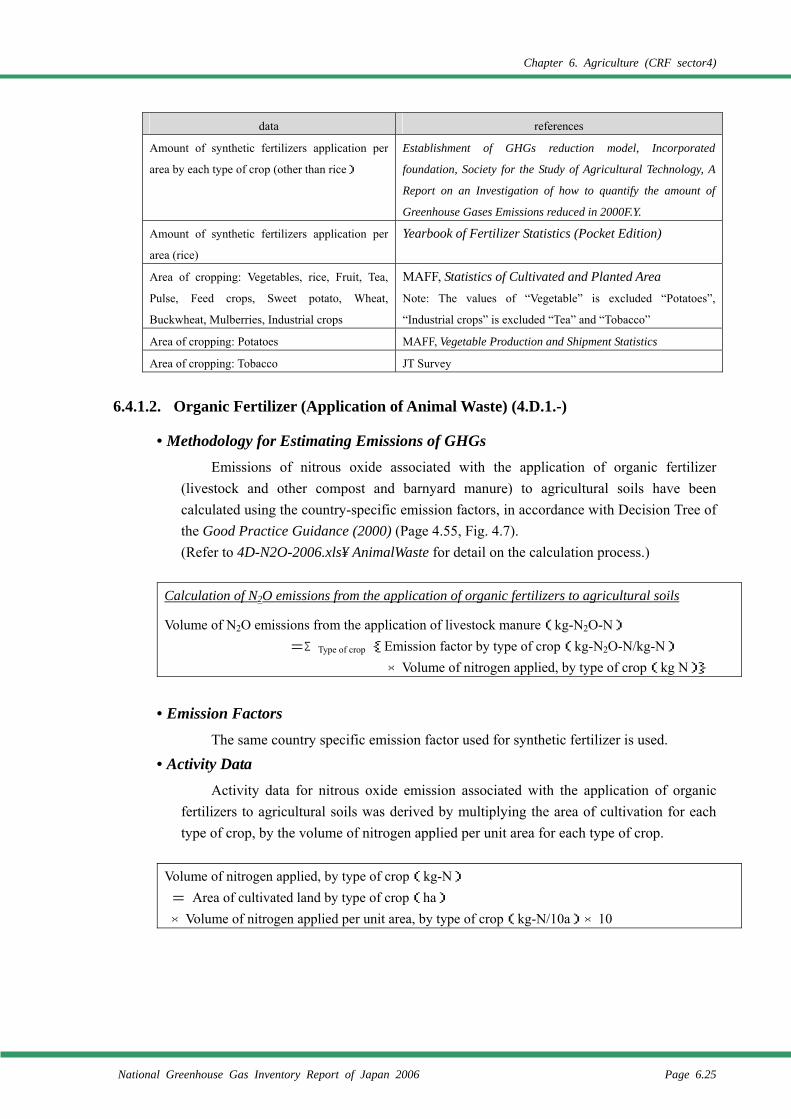
Chapter 6. Agriculture (CRF sector4)
National Greenhouse Gas Inventory Report of Japan 2006 Page 6.25
data references
Amount of synthetic fertilizers application per
area by each type of crop (other than rice)
Establishment of GHGs reduction model, Incorporated
foundation, Society for the Study of Agricultural Technology, A
Report on an Investigation of how to quantify the amount of
Greenhouse Gases Emissions reduced in 2000F.Y.
Amount of synthetic fertilizers application per
area (rice)
Yearbook of Fertilizer Statistics (Pocket Edition)
Area of cropping: Vegetables, rice, Fruit, Tea,
Pulse, Feed crops, Sweet potato, Wheat,
Buckwheat, Mulberries, Industrial crops
MAFF, Statistics of Cultivated and Planted Area
Note: The values of “Vegetable” is excluded “Potatoes”,
“Industrial crops” is excluded “Tea” and “Tobacco”
Area of cropping: Potatoes MAFF, Vegetable Production and Shipment Statistics
Area of cropping: Tobacco JT Survey
6.4.1.2. Organic Fertilizer (Application of Animal Waste) (4.D.1.-)
• Methodology for Estimating Emissions of GHGs Emissions of nitrous oxide associated with the application of organic fertilizer
(livestock and other compost and barnyard manure) to agricultural soils have been calculated using the country-specific emission factors, in accordance with Decision Tree of the Good Practice Guidance (2000) (Page 4.55, Fig. 4.7). (Refer to 4D-N2O-2006.xls¥ AnimalWaste for detail on the calculation process.)
Calculation of N2O emissions from the application of organic fertilizers to agricultural soils Volume of N2O emissions from the application of livestock manure(kg-N2O-N)
=ΣType of crop {Emission factor by type of crop(kg-N2O-N/kg-N) ×Volume of nitrogen applied, by type of crop(kg N)}
• Emission Factors The same country specific emission factor used for synthetic fertilizer is used.
• Activity Data Activity data for nitrous oxide emission associated with the application of organic
fertilizers to agricultural soils was derived by multiplying the area of cultivation for each type of crop, by the volume of nitrogen applied per unit area for each type of crop.
Volume of nitrogen applied, by type of crop(kg-N) = Area of cultivated land by type of crop(ha) ×Volume of nitrogen applied per unit area, by type of crop(kg-N/10a)×10
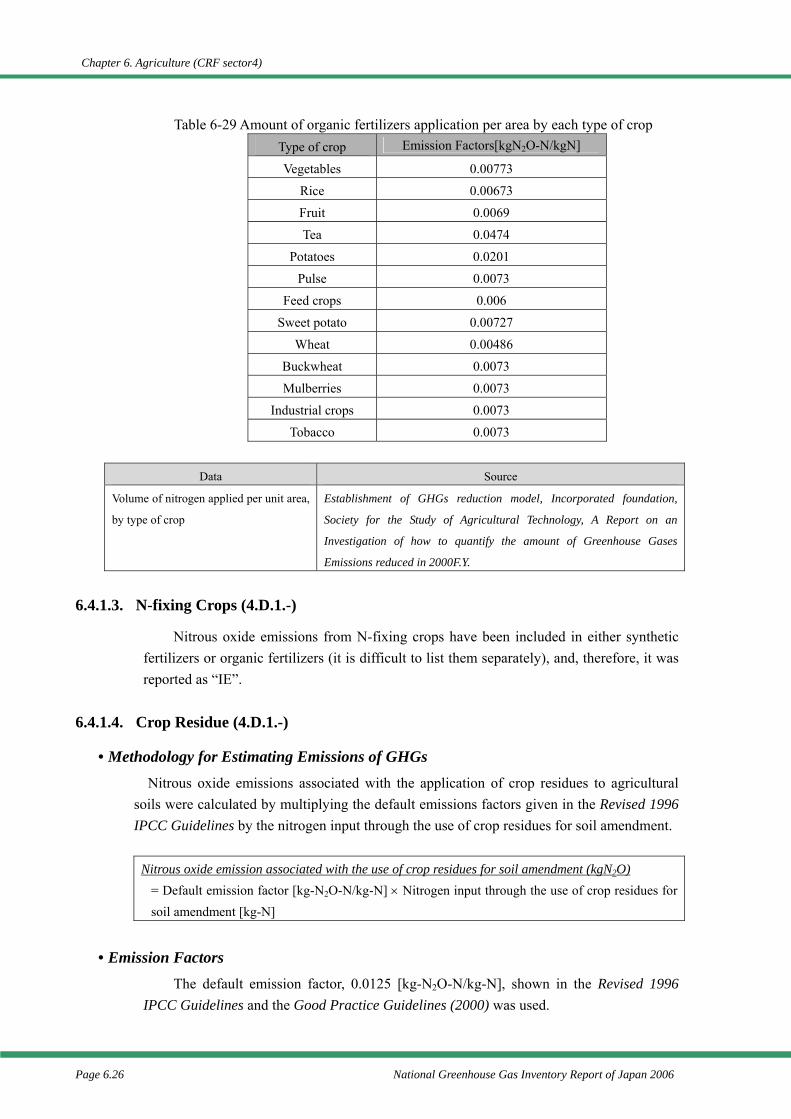
Chapter 6. Agriculture (CRF sector4)
Page 6.26 National Greenhouse Gas Inventory Report of Japan 2006
Table 6-29 Amount of organic fertilizers application per area by each type of crop Type of crop Emission Factors[kgN2O-N/kgN]
Vegetables 0.00773
Rice 0.00673
Fruit 0.0069
Tea 0.0474
Potatoes 0.0201
Pulse 0.0073
Feed crops 0.006
Sweet potato 0.00727
Wheat 0.00486
Buckwheat 0.0073
Mulberries 0.0073
Industrial crops 0.0073
Tobacco 0.0073
Data Source
Volume of nitrogen applied per unit area,
by type of crop
Establishment of GHGs reduction model, Incorporated foundation,
Society for the Study of Agricultural Technology, A Report on an
Investigation of how to quantify the amount of Greenhouse Gases
Emissions reduced in 2000F.Y.
6.4.1.3. N-fixing Crops (4.D.1.-)
Nitrous oxide emissions from N-fixing crops have been included in either synthetic fertilizers or organic fertilizers (it is difficult to list them separately), and, therefore, it was reported as “IE”.
6.4.1.4. Crop Residue (4.D.1.-)
• Methodology for Estimating Emissions of GHGs Nitrous oxide emissions associated with the application of crop residues to agricultural
soils were calculated by multiplying the default emissions factors given in the Revised 1996 IPCC Guidelines by the nitrogen input through the use of crop residues for soil amendment.
Nitrous oxide emission associated with the use of crop residues for soil amendment (kgN2O)
= Default emission factor [kg-N2O-N/kg-N] × Nitrogen input through the use of crop residues for soil amendment [kg-N]
• Emission Factors The default emission factor, 0.0125 [kg-N2O-N/kg-N], shown in the Revised 1996
IPCC Guidelines and the Good Practice Guidelines (2000) was used.
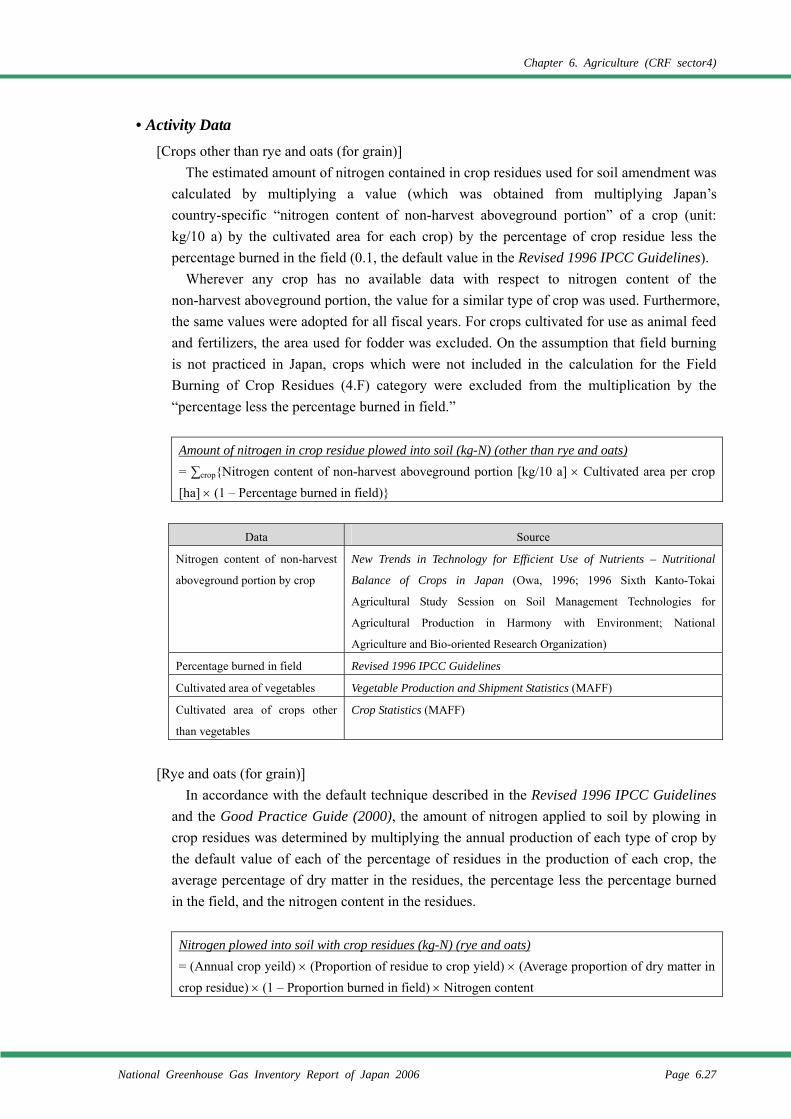
Chapter 6. Agriculture (CRF sector4)
National Greenhouse Gas Inventory Report of Japan 2006 Page 6.27
• Activity Data [Crops other than rye and oats (for grain)]
The estimated amount of nitrogen contained in crop residues used for soil amendment was calculated by multiplying a value (which was obtained from multiplying Japan’s country-specific “nitrogen content of non-harvest aboveground portion” of a crop (unit: kg/10 a) by the cultivated area for each crop) by the percentage of crop residue less the percentage burned in the field (0.1, the default value in the Revised 1996 IPCC Guidelines).
Wherever any crop has no available data with respect to nitrogen content of the non-harvest aboveground portion, the value for a similar type of crop was used. Furthermore, the same values were adopted for all fiscal years. For crops cultivated for use as animal feed and fertilizers, the area used for fodder was excluded. On the assumption that field burning is not practiced in Japan, crops which were not included in the calculation for the Field Burning of Crop Residues (4.F) category were excluded from the multiplication by the “percentage less the percentage burned in field.”
Amount of nitrogen in crop residue plowed into soil (kg-N) (other than rye and oats) = ∑crop{Nitrogen content of non-harvest aboveground portion [kg/10 a] × Cultivated area per crop [ha] × (1 – Percentage burned in field)}
Data Source
Nitrogen content of non-harvest
aboveground portion by crop
New Trends in Technology for Efficient Use of Nutrients – Nutritional
Balance of Crops in Japan (Owa, 1996; 1996 Sixth Kanto-Tokai
Agricultural Study Session on Soil Management Technologies for
Agricultural Production in Harmony with Environment; National
Agriculture and Bio-oriented Research Organization)
Percentage burned in field Revised 1996 IPCC Guidelines
Cultivated area of vegetables Vegetable Production and Shipment Statistics (MAFF)
Cultivated area of crops other
than vegetables
Crop Statistics (MAFF)
[Rye and oats (for grain)]
In accordance with the default technique described in the Revised 1996 IPCC Guidelines and the Good Practice Guide (2000), the amount of nitrogen applied to soil by plowing in crop residues was determined by multiplying the annual production of each type of crop by the default value of each of the percentage of residues in the production of each crop, the average percentage of dry matter in the residues, the percentage less the percentage burned in the field, and the nitrogen content in the residues.
Nitrogen plowed into soil with crop residues (kg-N) (rye and oats) = (Annual crop yeild) × (Proportion of residue to crop yield) × (Average proportion of dry matter in crop residue) × (1 – Proportion burned in field) × Nitrogen content
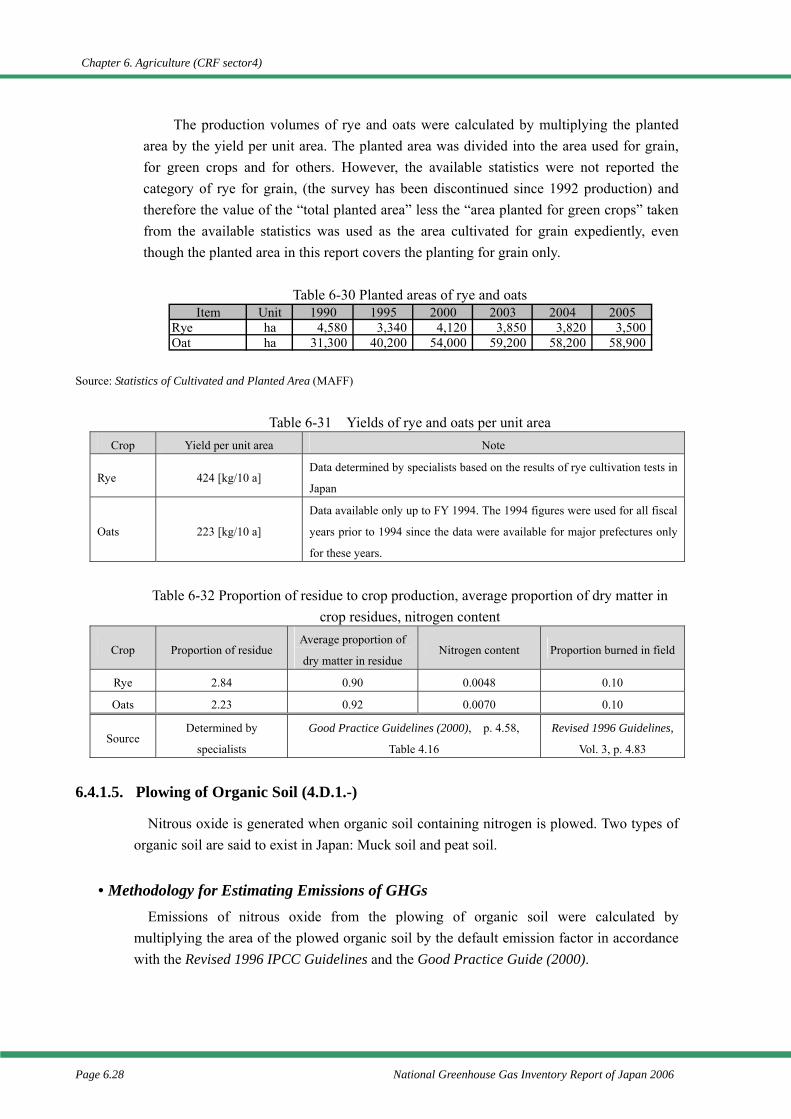
Chapter 6. Agriculture (CRF sector4)
Page 6.28 National Greenhouse Gas Inventory Report of Japan 2006
The production volumes of rye and oats were calculated by multiplying the planted area by the yield per unit area. The planted area was divided into the area used for grain, for green crops and for others. However, the available statistics were not reported the category of rye for grain, (the survey has been discontinued since 1992 production) and therefore the value of the “total planted area” less the “area planted for green crops” taken from the available statistics was used as the area cultivated for grain expediently, even though the planted area in this report covers the planting for grain only.
Table 6-30 Planted areas of rye and oats
Source: Statistics of Cultivated and Planted Area (MAFF)
Table 6-31 Yields of rye and oats per unit area
Crop Yield per unit area Note
Rye 424 [kg/10 a] Data determined by specialists based on the results of rye cultivation tests in
Japan
Oats 223 [kg/10 a]
Data available only up to FY 1994. The 1994 figures were used for all fiscal
years prior to 1994 since the data were available for major prefectures only
for these years.
Table 6-32 Proportion of residue to crop production, average proportion of dry matter in
crop residues, nitrogen content
Crop Proportion of residue Average proportion of
dry matter in residue Nitrogen content Proportion burned in field
Rye 2.84 0.90 0.0048 0.10
Oats 2.23 0.92 0.0070 0.10
Source Determined by
specialists
Good Practice Guidelines (2000), p. 4.58,
Table 4.16
Revised 1996 Guidelines,
Vol. 3, p. 4.83
6.4.1.5. Plowing of Organic Soil (4.D.1.-)
Nitrous oxide is generated when organic soil containing nitrogen is plowed. Two types of organic soil are said to exist in Japan: Muck soil and peat soil.
• Methodology for Estimating Emissions of GHGs Emissions of nitrous oxide from the plowing of organic soil were calculated by
multiplying the area of the plowed organic soil by the default emission factor in accordance with the Revised 1996 IPCC Guidelines and the Good Practice Guide (2000).
Item Unit 1990 1995 2000 2003 2004 2005Rye ha 4,580 3,340 4,120 3,850 3,820 3,500Oat ha 31,300 40,200 54,000 59,200 58,200 58,900
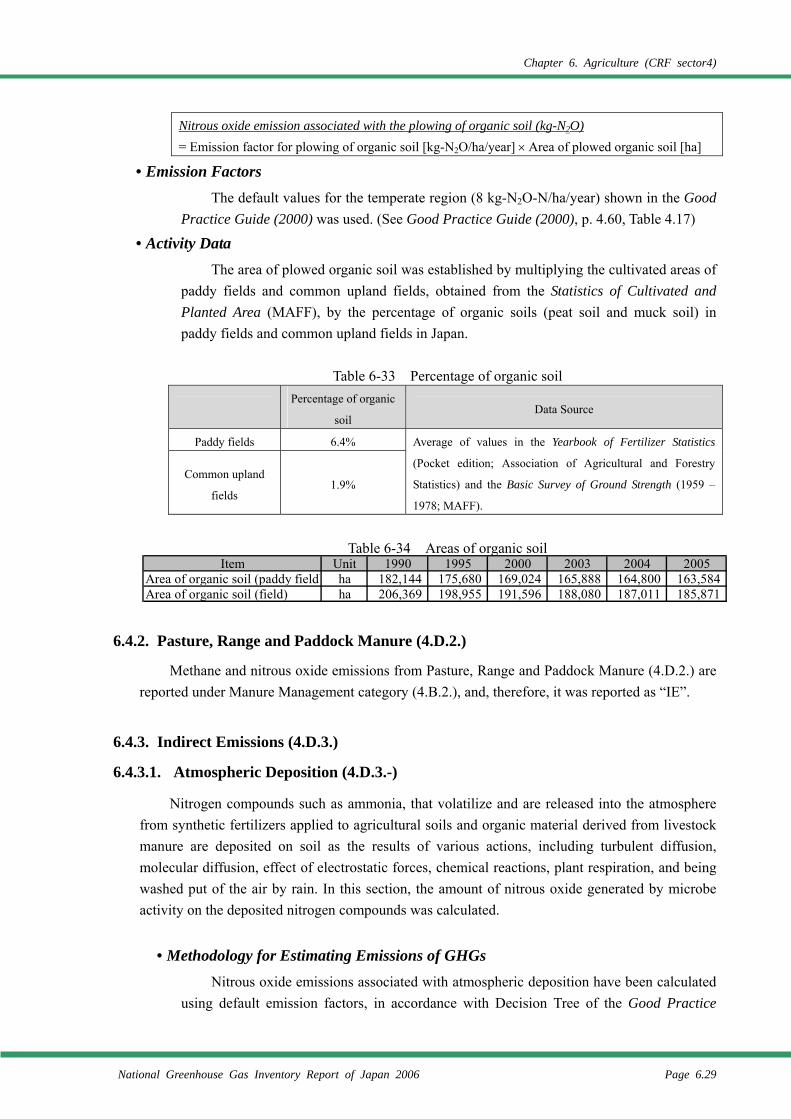
Chapter 6. Agriculture (CRF sector4)
National Greenhouse Gas Inventory Report of Japan 2006 Page 6.29
Nitrous oxide emission associated with the plowing of organic soil (kg-N2O) = Emission factor for plowing of organic soil [kg-N2O/ha/year] × Area of plowed organic soil [ha]
• Emission Factors The default values for the temperate region (8 kg-N2O-N/ha/year) shown in the Good
Practice Guide (2000) was used. (See Good Practice Guide (2000), p. 4.60, Table 4.17)
• Activity Data The area of plowed organic soil was established by multiplying the cultivated areas of
paddy fields and common upland fields, obtained from the Statistics of Cultivated and Planted Area (MAFF), by the percentage of organic soils (peat soil and muck soil) in paddy fields and common upland fields in Japan.
Table 6-33 Percentage of organic soil
Percentage of organic
soil Data Source
Paddy fields 6.4%
Common upland
fields 1.9%
Average of values in the Yearbook of Fertilizer Statistics
(Pocket edition; Association of Agricultural and Forestry
Statistics) and the Basic Survey of Ground Strength (1959 –
1978; MAFF).
Table 6-34 Areas of organic soil
6.4.2. Pasture, Range and Paddock Manure (4.D.2.)
Methane and nitrous oxide emissions from Pasture, Range and Paddock Manure (4.D.2.) are reported under Manure Management category (4.B.2.), and, therefore, it was reported as “IE”.
6.4.3. Indirect Emissions (4.D.3.)
6.4.3.1. Atmospheric Deposition (4.D.3.-)
Nitrogen compounds such as ammonia, that volatilize and are released into the atmosphere from synthetic fertilizers applied to agricultural soils and organic material derived from livestock manure are deposited on soil as the results of various actions, including turbulent diffusion, molecular diffusion, effect of electrostatic forces, chemical reactions, plant respiration, and being washed put of the air by rain. In this section, the amount of nitrous oxide generated by microbe activity on the deposited nitrogen compounds was calculated.
• Methodology for Estimating Emissions of GHGs Nitrous oxide emissions associated with atmospheric deposition have been calculated
using default emission factors, in accordance with Decision Tree of the Good Practice
Item Unit 1990 1995 2000 2003 2004 2005Area of organic soil (paddy field) ha 182,144 175,680 169,024 165,888 164,800 163,584Area of organic soil (field) ha 206,369 198,955 191,596 188,080 187,011 185,871
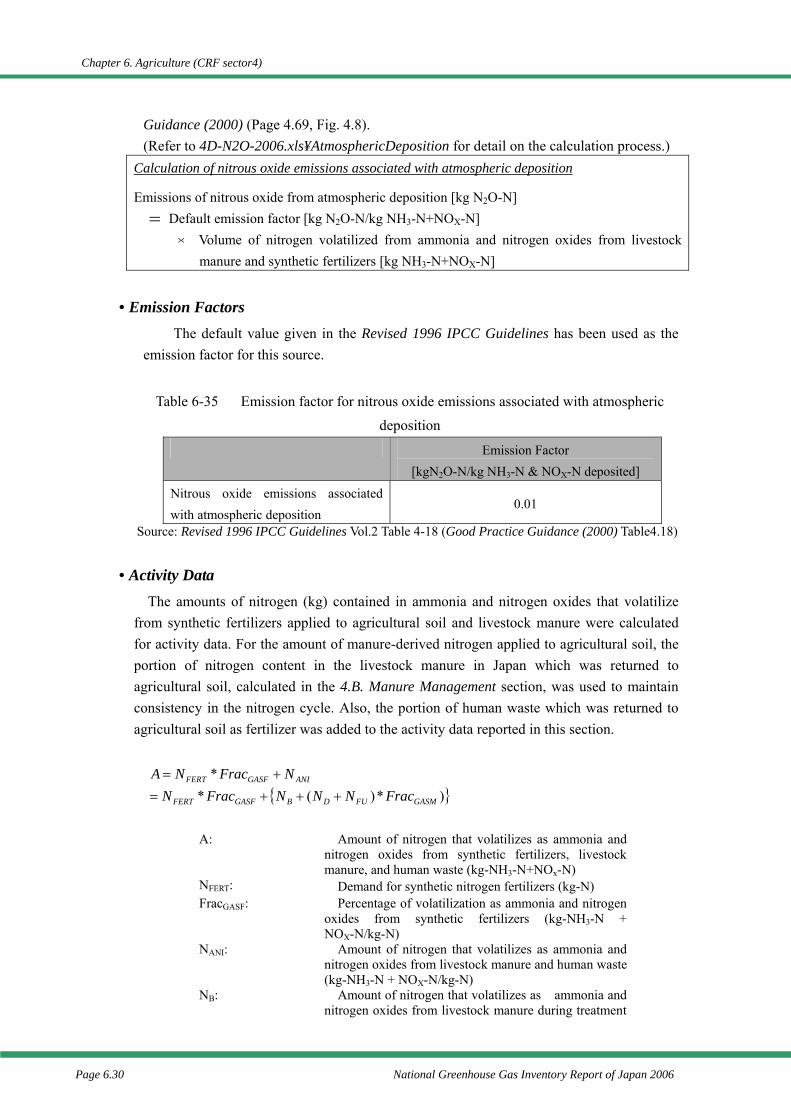
Chapter 6. Agriculture (CRF sector4)
Page 6.30 National Greenhouse Gas Inventory Report of Japan 2006
Guidance (2000) (Page 4.69, Fig. 4.8). (Refer to 4D-N2O-2006.xls¥AtmosphericDeposition for detail on the calculation process.)
Calculation of nitrous oxide emissions associated with atmospheric deposition Emissions of nitrous oxide from atmospheric deposition [kg N2O-N]
= Default emission factor [kg N2O-N/kg NH3-N+NOX-N] × Volume of nitrogen volatilized from ammonia and nitrogen oxides from livestock
manure and synthetic fertilizers [kg NH3-N+NOX-N]
• Emission Factors The default value given in the Revised 1996 IPCC Guidelines has been used as the
emission factor for this source.
Table 6-35 Emission factor for nitrous oxide emissions associated with atmospheric deposition
Emission Factor [kgN2O-N/kg NH3-N & NOX-N deposited]
Nitrous oxide emissions associated with atmospheric deposition
0.01
Source: Revised 1996 IPCC Guidelines Vol.2 Table 4-18 (Good Practice Guidance (2000) Table4.18)
• Activity Data The amounts of nitrogen (kg) contained in ammonia and nitrogen oxides that volatilize
from synthetic fertilizers applied to agricultural soil and livestock manure were calculated for activity data. For the amount of manure-derived nitrogen applied to agricultural soil, the portion of nitrogen content in the livestock manure in Japan which was returned to agricultural soil, calculated in the 4.B. Manure Management section, was used to maintain consistency in the nitrogen cycle. Also, the portion of human waste which was returned to agricultural soil as fertilizer was added to the activity data reported in this section.
{ })*)(**
GASMFUDBGASFFERT
ANIGASFFERT
FracNNNFracNNFracNA
+++=+=
A: Amount of nitrogen that volatilizes as ammonia and
nitrogen oxides from synthetic fertilizers, livestock manure, and human waste (kg-NH3-N+NOx-N)
NFERT: Demand for synthetic nitrogen fertilizers (kg-N) FracGASF: Percentage of volatilization as ammonia and nitrogen
oxides from synthetic fertilizers (kg-NH3-N + NOX-N/kg-N)
NANI: Amount of nitrogen that volatilizes as ammonia and nitrogen oxides from livestock manure and human waste (kg-NH3-N + NOX-N/kg-N)
NB: Amount of nitrogen that volatilizes as ammonia and nitrogen oxides from livestock manure during treatment
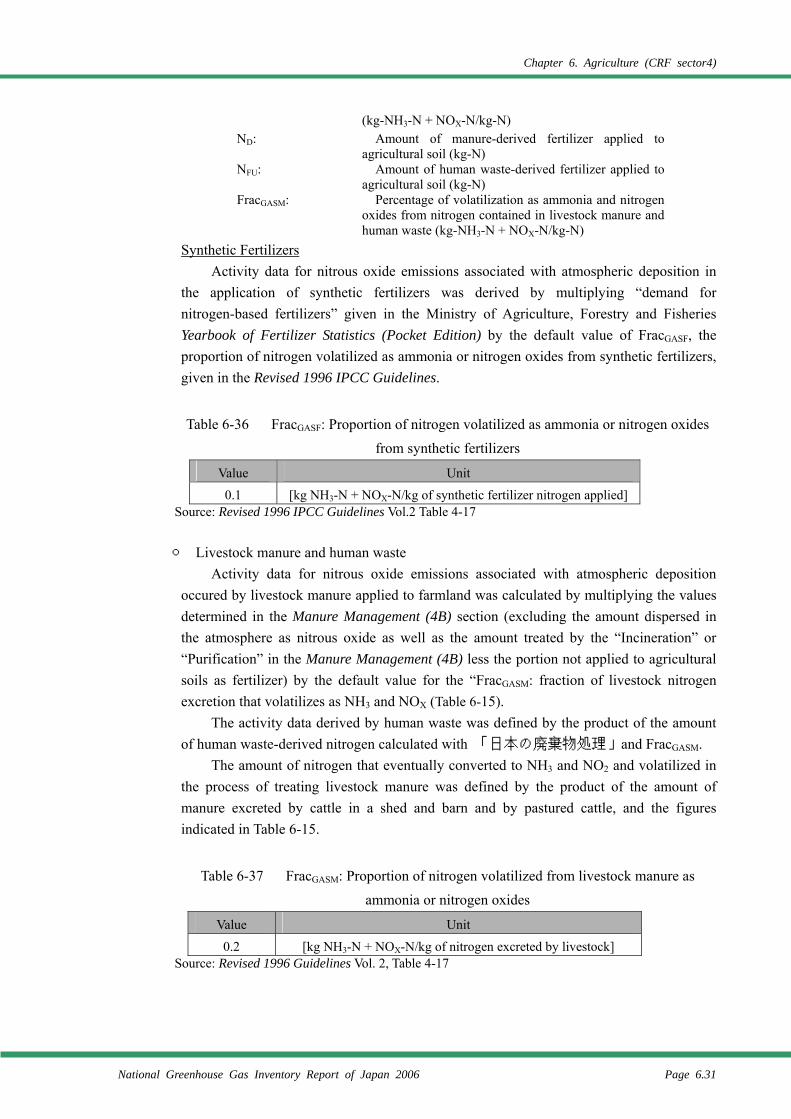
Chapter 6. Agriculture (CRF sector4)
National Greenhouse Gas Inventory Report of Japan 2006 Page 6.31
(kg-NH3-N + NOX-N/kg-N) ND: Amount of manure-derived fertilizer applied to
agricultural soil (kg-N) NFU: Amount of human waste-derived fertilizer applied to
agricultural soil (kg-N) FracGASM: Percentage of volatilization as ammonia and nitrogen
oxides from nitrogen contained in livestock manure and human waste (kg-NH3-N + NOX-N/kg-N)
Synthetic Fertilizers Activity data for nitrous oxide emissions associated with atmospheric deposition in
the application of synthetic fertilizers was derived by multiplying “demand for nitrogen-based fertilizers” given in the Ministry of Agriculture, Forestry and Fisheries Yearbook of Fertilizer Statistics (Pocket Edition) by the default value of FracGASF, the proportion of nitrogen volatilized as ammonia or nitrogen oxides from synthetic fertilizers, given in the Revised 1996 IPCC Guidelines.
Table 6-36 FracGASF: Proportion of nitrogen volatilized as ammonia or nitrogen oxides from synthetic fertilizers
Value Unit
0.1 [kg NH3-N + NOX-N/kg of synthetic fertilizer nitrogen applied] Source: Revised 1996 IPCC Guidelines Vol.2 Table 4-17
○ Livestock manure and human waste
Activity data for nitrous oxide emissions associated with atmospheric deposition occured by livestock manure applied to farmland was calculated by multiplying the values determined in the Manure Management (4B) section (excluding the amount dispersed in the atmosphere as nitrous oxide as well as the amount treated by the “Incineration” or “Purification” in the Manure Management (4B) less the portion not applied to agricultural soils as fertilizer) by the default value for the “FracGASM: fraction of livestock nitrogen excretion that volatilizes as NH3 and NOX (Table 6-15).
The activity data derived by human waste was defined by the product of the amount of human waste-derived nitrogen calculated with 「日本の廃棄物処理」and FracGASM.
The amount of nitrogen that eventually converted to NH3 and NO2 and volatilized in the process of treating livestock manure was defined by the product of the amount of manure excreted by cattle in a shed and barn and by pastured cattle, and the figures indicated in Table 6-15.
Table 6-37 FracGASM: Proportion of nitrogen volatilized from livestock manure as ammonia or nitrogen oxides
Value Unit
0.2 [kg NH3-N + NOX-N/kg of nitrogen excreted by livestock] Source: Revised 1996 Guidelines Vol. 2, Table 4-17
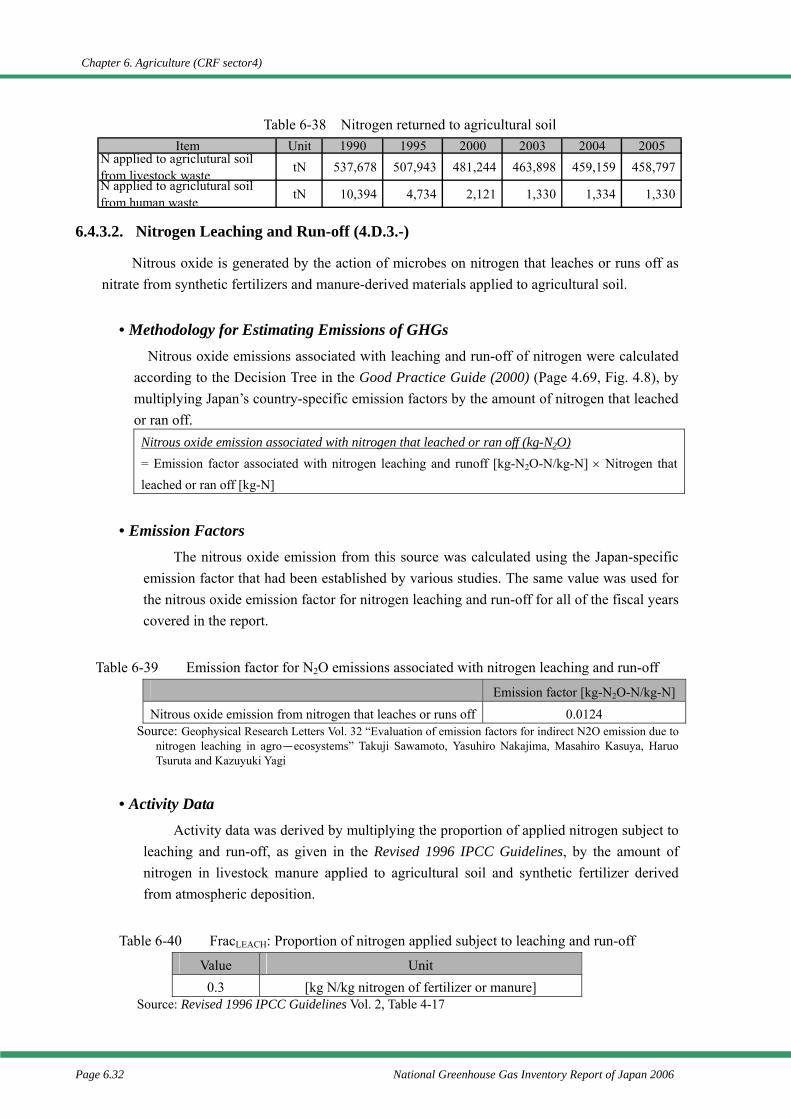
Chapter 6. Agriculture (CRF sector4)
Page 6.32 National Greenhouse Gas Inventory Report of Japan 2006
Table 6-38 Nitrogen returned to agricultural soil
6.4.3.2. Nitrogen Leaching and Run-off (4.D.3.-)
Nitrous oxide is generated by the action of microbes on nitrogen that leaches or runs off as nitrate from synthetic fertilizers and manure-derived materials applied to agricultural soil.
• Methodology for Estimating Emissions of GHGs Nitrous oxide emissions associated with leaching and run-off of nitrogen were calculated
according to the Decision Tree in the Good Practice Guide (2000) (Page 4.69, Fig. 4.8), by multiplying Japan’s country-specific emission factors by the amount of nitrogen that leached or ran off.
Nitrous oxide emission associated with nitrogen that leached or ran off (kg-N2O) = Emission factor associated with nitrogen leaching and runoff [kg-N2O-N/kg-N] × Nitrogen that leached or ran off [kg-N]
• Emission Factors The nitrous oxide emission from this source was calculated using the Japan-specific
emission factor that had been established by various studies. The same value was used for the nitrous oxide emission factor for nitrogen leaching and run-off for all of the fiscal years covered in the report.
Table 6-39 Emission factor for N2O emissions associated with nitrogen leaching and run-off
Emission factor [kg-N2O-N/kg-N]
Nitrous oxide emission from nitrogen that leaches or runs off 0.0124 Source: Geophysical Research Letters Vol. 32 “Evaluation of emission factors for indirect N2O emission due to
nitrogen leaching in agro-ecosystems” Takuji Sawamoto, Yasuhiro Nakajima, Masahiro Kasuya, Haruo Tsuruta and Kazuyuki Yagi
• Activity Data Activity data was derived by multiplying the proportion of applied nitrogen subject to
leaching and run-off, as given in the Revised 1996 IPCC Guidelines, by the amount of nitrogen in livestock manure applied to agricultural soil and synthetic fertilizer derived from atmospheric deposition.
Table 6-40 FracLEACH: Proportion of nitrogen applied subject to leaching and run-off
Value Unit 0.3 [kg N/kg nitrogen of fertilizer or manure]
Source: Revised 1996 IPCC Guidelines Vol. 2, Table 4-17
Item Unit 1990 1995 2000 2003 2004 2005N applied to agriclutural soilfrom livestock waste tN 537,678 507,943 481,244 463,898 459,159 458,797N applied to agriclutural soilfrom human waste tN 10,394 4,734 2,121 1,330 1,334 1,330
Chapter 6. Agriculture (CRF sector4)
National Greenhouse Gas Inventory Report of Japan 2006 Page 6.33
6.4.3.3. Indirect Emissions (CH4) (4.D.3.-)
Direct emission of methane from soil is not possible, and consequently it is not theoretically possible for methane to be emitted indirectly from field soil as well. Therefore, these sources have been reported as “NA”.
Except for atmospheric deposition or nitrogen leaching and run-off, there is no conceivable source of methane emissions from cultivated farmland soil other than direct emissions from soil, animal production, and indirect emissions. Therefore, they have therefore been reported as “NO”.
6.4.4. Other (4.D.4)
Because it is not likely that agricultural sources of methane and nitrous oxide emissions exist in Japan other than the direct soil emissions, and indirect emissions, these sources were reported as “NO” as was the case in previous years.
6.5. Prescribed Burning of Savannas (4.E.)
This source is given in the IPCC Guidelines as “being for the purpose of managing pastureland in sub-tropical zones”. There is no equivalent activity in Japan, and this source has been reported as “NO”.
6.6. Field Burning of Agricultural Residues (4.F.)
Incomplete burning of crop residues in field releases methane and nitrous oxide into the atmosphere. Methane and nitrous oxide emissions from this source are calculated and reported in Category 4.F.
6.6.1. Rice, Wheat, Barley, Rye, and Oats (4.F.1.)
• Methodology for Estimating Emissions of GHGs Methane and nitrous oxide emissions from field burning of crop residues of rice,
wheat, barley, rye, and oats were calculated, using the default technique indicated in the Revised 1996 IPCC Guidelines and the Good Practice Guide (2000), by multiplying the amounts of carbon and nitrogen released by field burning by the methane emission rate and nitrous oxide emission rate, respectively.
Wheat, barley, rye, and oats were cultivated either as grain or green crops. The portions of the green crops which were cultivated for use of the entire aboveground mass for cattle feed were excluded from the calculation of emissions.
Methane emission associated with field burning of agricultural residues = Methane emission rate × Total carbon released × 16/12
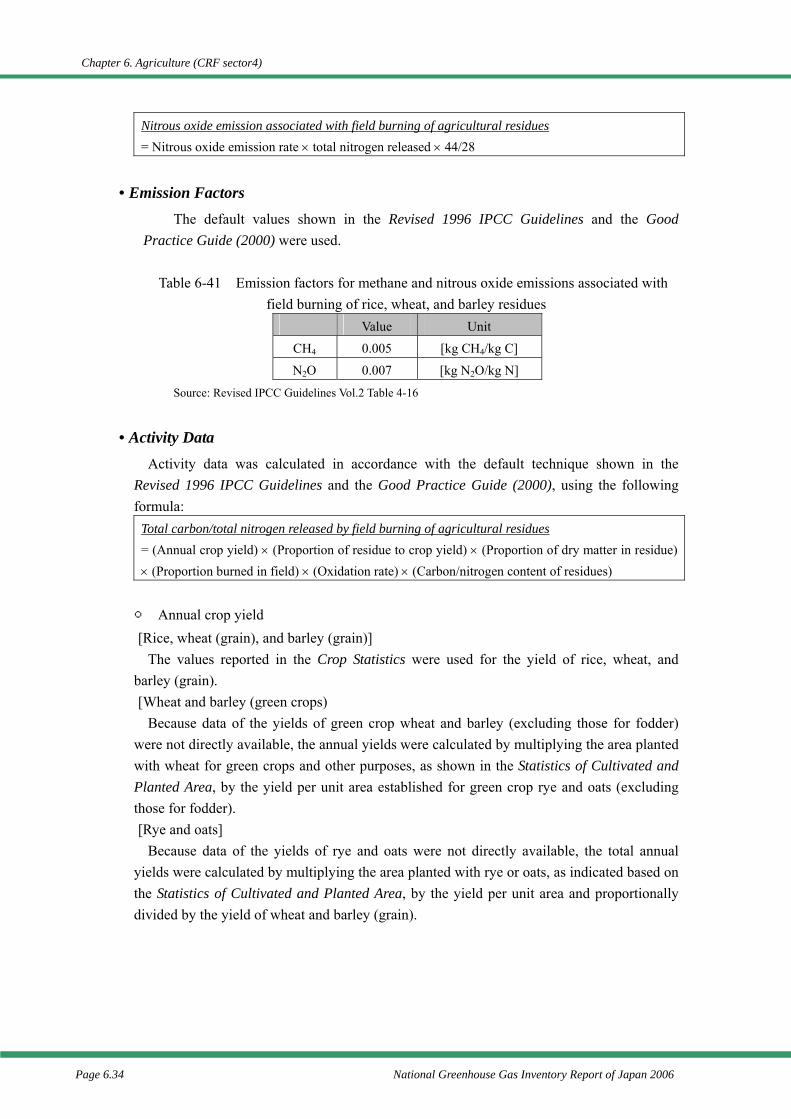
Chapter 6. Agriculture (CRF sector4)
Page 6.34 National Greenhouse Gas Inventory Report of Japan 2006
Nitrous oxide emission associated with field burning of agricultural residues = Nitrous oxide emission rate × total nitrogen released × 44/28
• Emission Factors The default values shown in the Revised 1996 IPCC Guidelines and the Good
Practice Guide (2000) were used.
Table 6-41 Emission factors for methane and nitrous oxide emissions associated with field burning of rice, wheat, and barley residues
Value Unit
CH4 0.005 [kg CH4/kg C]
N2O 0.007 [kg N2O/kg N]
Source: Revised IPCC Guidelines Vol.2 Table 4-16
• Activity Data Activity data was calculated in accordance with the default technique shown in the
Revised 1996 IPCC Guidelines and the Good Practice Guide (2000), using the following formula:
Total carbon/total nitrogen released by field burning of agricultural residues = (Annual crop yield) × (Proportion of residue to crop yield) × (Proportion of dry matter in residue) × (Proportion burned in field) × (Oxidation rate) × (Carbon/nitrogen content of residues)
○ Annual crop yield [Rice, wheat (grain), and barley (grain)]
The values reported in the Crop Statistics were used for the yield of rice, wheat, and barley (grain). [Wheat and barley (green crops)
Because data of the yields of green crop wheat and barley (excluding those for fodder) were not directly available, the annual yields were calculated by multiplying the area planted with wheat for green crops and other purposes, as shown in the Statistics of Cultivated and Planted Area, by the yield per unit area established for green crop rye and oats (excluding those for fodder). [Rye and oats]
Because data of the yields of rye and oats were not directly available, the total annual yields were calculated by multiplying the area planted with rye or oats, as indicated based on the Statistics of Cultivated and Planted Area, by the yield per unit area and proportionally divided by the yield of wheat and barley (grain).
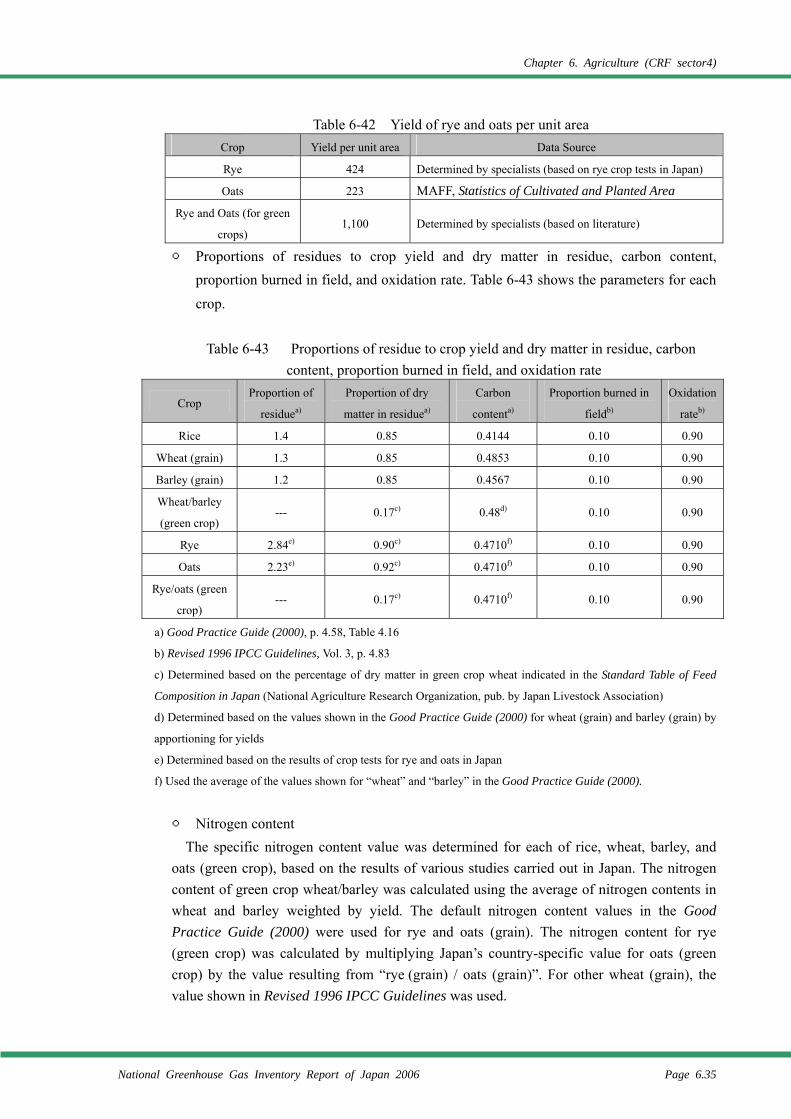
Chapter 6. Agriculture (CRF sector4)
National Greenhouse Gas Inventory Report of Japan 2006 Page 6.35
Table 6-42 Yield of rye and oats per unit area Crop Yield per unit area Data Source
Rye 424 Determined by specialists (based on rye crop tests in Japan)
Oats 223 MAFF, Statistics of Cultivated and Planted Area
Rye and Oats (for green
crops) 1,100 Determined by specialists (based on literature)
○ Proportions of residues to crop yield and dry matter in residue, carbon content, proportion burned in field, and oxidation rate. Table 6-43 shows the parameters for each crop.
Table 6-43 Proportions of residue to crop yield and dry matter in residue, carbon
content, proportion burned in field, and oxidation rate
Crop Proportion of
residuea)
Proportion of dry
matter in residuea)
Carbon
contenta)
Proportion burned in
fieldb)
Oxidation
rateb)
Rice 1.4 0.85 0.4144 0.10 0.90
Wheat (grain) 1.3 0.85 0.4853 0.10 0.90
Barley (grain) 1.2 0.85 0.4567 0.10 0.90
Wheat/barley
(green crop) --- 0.17c) 0.48d) 0.10 0.90
Rye 2.84e) 0.90c) 0.4710f) 0.10 0.90
Oats 2.23e) 0.92c) 0.4710f) 0.10 0.90
Rye/oats (green
crop) --- 0.17c) 0.4710f) 0.10 0.90
a) Good Practice Guide (2000), p. 4.58, Table 4.16
b) Revised 1996 IPCC Guidelines, Vol. 3, p. 4.83
c) Determined based on the percentage of dry matter in green crop wheat indicated in the Standard Table of Feed
Composition in Japan (National Agriculture Research Organization, pub. by Japan Livestock Association)
d) Determined based on the values shown in the Good Practice Guide (2000) for wheat (grain) and barley (grain) by
apportioning for yields
e) Determined based on the results of crop tests for rye and oats in Japan
f) Used the average of the values shown for “wheat” and “barley” in the Good Practice Guide (2000).
○ Nitrogen content The specific nitrogen content value was determined for each of rice, wheat, barley, and
oats (green crop), based on the results of various studies carried out in Japan. The nitrogen content of green crop wheat/barley was calculated using the average of nitrogen contents in wheat and barley weighted by yield. The default nitrogen content values in the Good Practice Guide (2000) were used for rye and oats (grain). The nitrogen content for rye (green crop) was calculated by multiplying Japan’s country-specific value for oats (green crop) by the value resulting from “rye (grain) / oats (grain)”. For other wheat (grain), the value shown in Revised 1996 IPCC Guidelines was used.
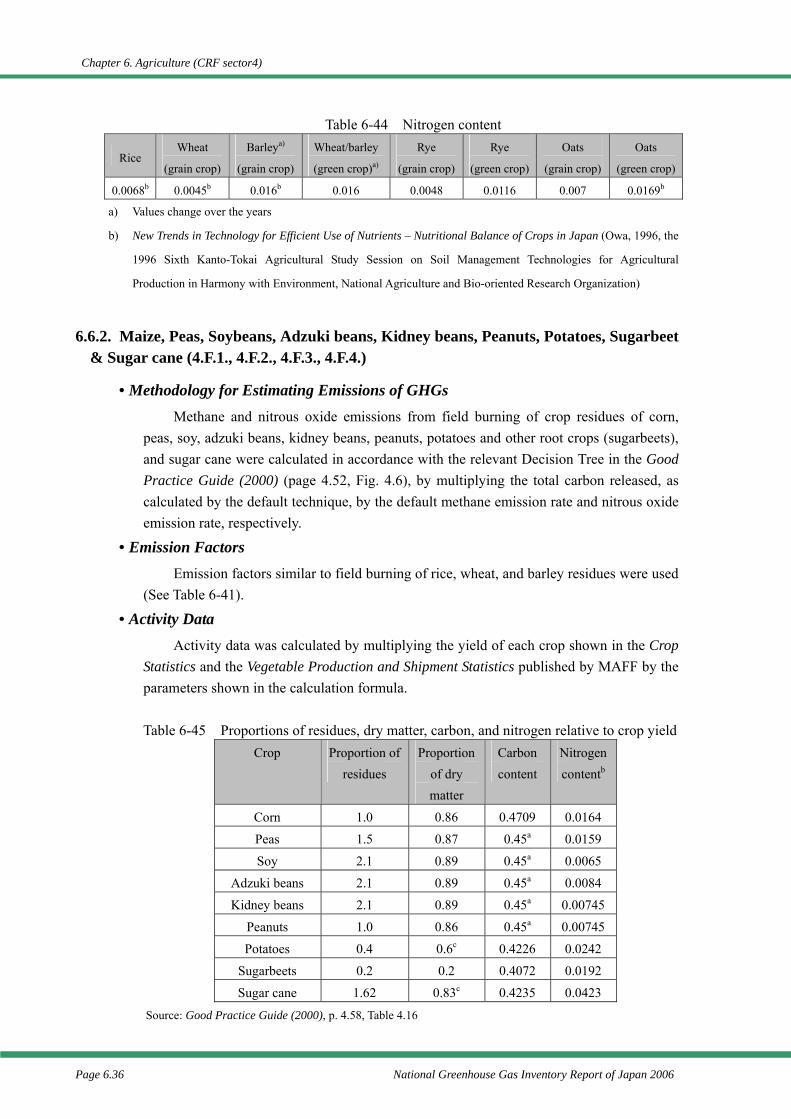
Chapter 6. Agriculture (CRF sector4)
Page 6.36 National Greenhouse Gas Inventory Report of Japan 2006
Table 6-44 Nitrogen content
Rice Wheat
(grain crop)
Barleya)
(grain crop)
Wheat/barley
(green crop)a)
Rye
(grain crop)
Rye
(green crop)
Oats
(grain crop)
Oats
(green crop)
0.0068b 0.0045b 0.016b 0.016 0.0048 0.0116 0.007 0.0169b
a) Values change over the years
b) New Trends in Technology for Efficient Use of Nutrients – Nutritional Balance of Crops in Japan (Owa, 1996, the
1996 Sixth Kanto-Tokai Agricultural Study Session on Soil Management Technologies for Agricultural
Production in Harmony with Environment, National Agriculture and Bio-oriented Research Organization)
6.6.2. Maize, Peas, Soybeans, Adzuki beans, Kidney beans, Peanuts, Potatoes, Sugarbeet & Sugar cane (4.F.1., 4.F.2., 4.F.3., 4.F.4.)
• Methodology for Estimating Emissions of GHGs Methane and nitrous oxide emissions from field burning of crop residues of corn,
peas, soy, adzuki beans, kidney beans, peanuts, potatoes and other root crops (sugarbeets), and sugar cane were calculated in accordance with the relevant Decision Tree in the Good Practice Guide (2000) (page 4.52, Fig. 4.6), by multiplying the total carbon released, as calculated by the default technique, by the default methane emission rate and nitrous oxide emission rate, respectively.
• Emission Factors Emission factors similar to field burning of rice, wheat, and barley residues were used
(See Table 6-41).
• Activity Data Activity data was calculated by multiplying the yield of each crop shown in the Crop
Statistics and the Vegetable Production and Shipment Statistics published by MAFF by the parameters shown in the calculation formula.
Table 6-45 Proportions of residues, dry matter, carbon, and nitrogen relative to crop yield
Crop Proportion of residues
Proportion of dry matter
Carbon content
Nitrogen contentb
Corn 1.0 0.86 0.4709 0.0164
Peas 1.5 0.87 0.45a 0.0159
Soy 2.1 0.89 0.45a 0.0065
Adzuki beans 2.1 0.89 0.45a 0.0084
Kidney beans 2.1 0.89 0.45a 0.00745
Peanuts 1.0 0.86 0.45a 0.00745
Potatoes 0.4 0.6c 0.4226 0.0242
Sugarbeets 0.2 0.2 0.4072 0.0192
Sugar cane 1.62 0.83c 0.4235 0.0423
Source: Good Practice Guide (2000), p. 4.58, Table 4.16
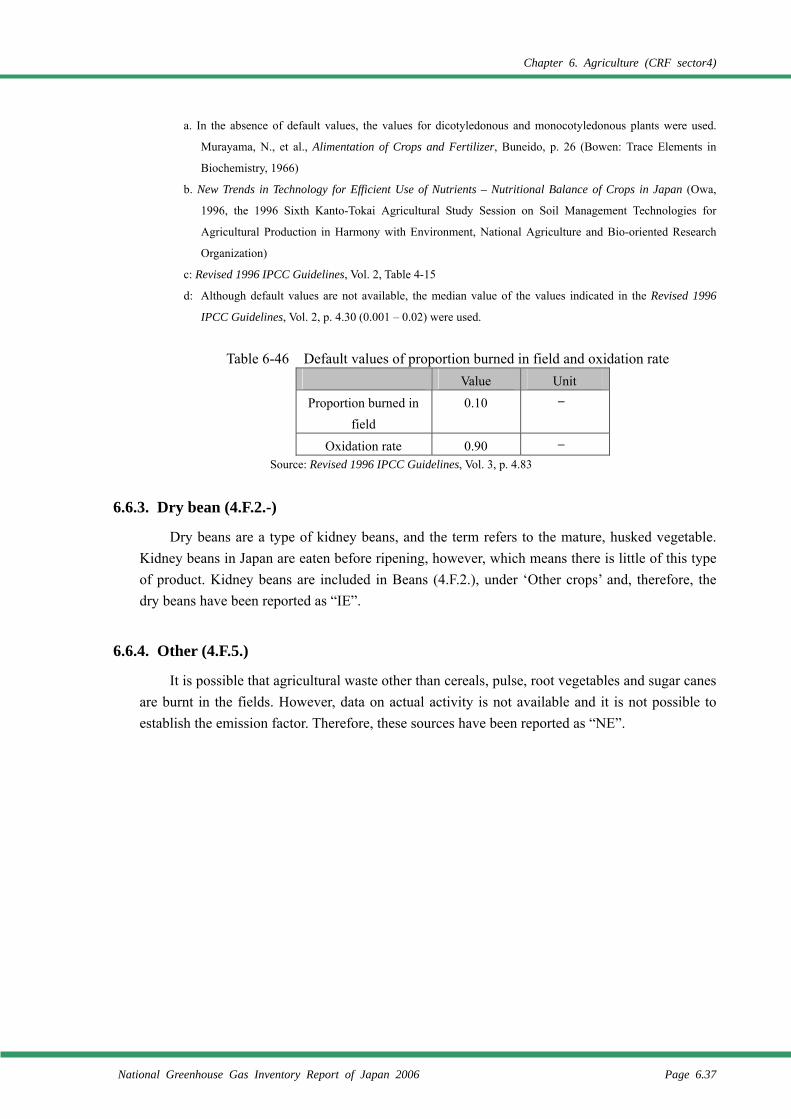
Chapter 6. Agriculture (CRF sector4)
National Greenhouse Gas Inventory Report of Japan 2006 Page 6.37
a. In the absence of default values, the values for dicotyledonous and monocotyledonous plants were used.
Murayama, N., et al., Alimentation of Crops and Fertilizer, Buneido, p. 26 (Bowen: Trace Elements in
Biochemistry, 1966)
b. New Trends in Technology for Efficient Use of Nutrients – Nutritional Balance of Crops in Japan (Owa,
1996, the 1996 Sixth Kanto-Tokai Agricultural Study Session on Soil Management Technologies for
Agricultural Production in Harmony with Environment, National Agriculture and Bio-oriented Research
Organization)
c: Revised 1996 IPCC Guidelines, Vol. 2, Table 4-15
d: Although default values are not available, the median value of the values indicated in the Revised 1996
IPCC Guidelines, Vol. 2, p. 4.30 (0.001 – 0.02) were used.
Table 6-46 Default values of proportion burned in field and oxidation rate
Value Unit
Proportion burned in field
0.10 ─
Oxidation rate 0.90 ─ Source: Revised 1996 IPCC Guidelines, Vol. 3, p. 4.83
6.6.3. Dry bean (4.F.2.-)
Dry beans are a type of kidney beans, and the term refers to the mature, husked vegetable. Kidney beans in Japan are eaten before ripening, however, which means there is little of this type of product. Kidney beans are included in Beans (4.F.2.), under ‘Other crops’ and, therefore, the dry beans have been reported as “IE”.
6.6.4. Other (4.F.5.)
It is possible that agricultural waste other than cereals, pulse, root vegetables and sugar canes are burnt in the fields. However, data on actual activity is not available and it is not possible to establish the emission factor. Therefore, these sources have been reported as “NE”.
Chapter 6. Agriculture (CRF sector4)
Page 6.38 National Greenhouse Gas Inventory Report of Japan 2006
References
IPCC, Revised 1996 IPCC Guidelines for National Greenhouse Gas Inventories, 1997 IPCC, Good Practice Guidance and Uncertainty Management in National Greenhouse Gas
Inventories, 2000 Environmental Agency Committee for the Greenhouse Gases Emissions Estimation Methods,
Review of Greenhouse Gases Emissions Estimation Methods Part 1, September 2000 Ministry of the Environment Committee for the Greenhouse Gases Emissions Estimation Methods,
Review of Greenhouse Gases Emissions Estimation Methods Part 3, August 2002 Ministry of the Environment Committee for the Greenhouse Gases Emissions Estimation Methods,
Review of Greenhouse Gases Emissions Estimation Methods, February 2006 Japan Meteorological Agency, Climate Charts of Japan Ministry of Agriculture, Forestry and Fisheries of Japan, Basic Study of Soil Fertility Ministry of Agriculture, Forestry and Fisheries of Japan, Basic Survey of Ground Strength Ministry of Agriculture, Forestry and Fisheries of Japan, Crop Statistics Ministry of Agriculture, Forestry and Fisheries of Japan, Statistics on Milk and Dairy Products Ministry of Agriculture, Forestry and Fisheries of Japan, Survey of Livestock Production Costs Ministry of Agriculture, Forestry and Fisheries of Japan, Livestock Statistics Ministry of Agriculture, Forestry and Fisheries of Japan, Statistics of Cultivated and Planted Area Ministry of Agriculture, Forestry and Fisheries of Japan, Survey on Public ranches farms Ministry of Agriculture, Forestry and Fisheries of Japan, Vegetable Production and Shipment
Statistics Ministry of Agriculture, Forestry and Fisheries of Japan, Yearbook of Fertilizer Statistics (Pocket
Edition) Food and Agriculture Organization of the United Nations, FAOSTAT Database
(http://apps.fao.org/page/collections?subset=agriculture) International Rice Research Institute, World Rice Statistics 1993-94 Japan Agriculture Technology Association, Report of Survey on Method of Quantifying Reduction of
Emissions of Greenhouse Gases (2000 FY), March 2001 Japan Livestock Industry Association, Japanese Feed Standard Japan Livestock Technology Association, GHGs emissions control in livestock Part4, March 1999 Japan Livestock Technology Association, GHGs emissions control in livestock Part6, March 2001 Japan Livestock Technology Association, GHGs emissions control in livestock Summary, March
2002 Society for the Study of Agricultural Technology, A report on an Investigation of how to quantify
the amount of Greenhouse Gases Emissions reduced in 2000 F.Y. National Institute of Animal Health "Research of the actual situation of pastures in Japan." Okinawa prefecture, Livestock Statistics of Okinawa Bando, Sakamaki, Moritomi and Suzuki, “Study on methane & nitrous oxide emission from biomass
burning”, National Institute for Environmental Studies, Final Reports of The Global Environment Research Fund in 1992
Crutzen, P.J., et al. “Methane production by domestic animals, wild ruminants, other herbivorous
Chapter 6. Agriculture (CRF sector4)
National Greenhouse Gas Inventory Report of Japan 2006 Page 6.39
fauna, and humans”, Tellus 33B, pp271-284, 1986 Haruo Tsuruta, “Emission Rates of Methane from Rice Paddy Fields and Nitrous Oxide from
Fertilized Upland Fields Estimated from Intensive Field Measurement for Three Years (1992-1994) All Over Japan”, National Institute for Agro-Environmental Sciences, Study report of branch for management of resource and ecosystem vol.13 supplementary volume
Haruo Tsuruta, “Establishment of GHGs reduction model”, Society for the Study of Agricultural Technology, A Report on an Investigation of how to quantify the amount of Greenhouse Gases Emissions reduced in 2000F.Y.
Kazuyuki Yagi, “Establishment of GHGs reduction model”, Society for the Study of Agricultural Technology, A Report on an Investigation of how to quantify the amount of Greenhouse Gases Emissions reduced in 2000F.Y., p27
Mamoru Saito, “Methane emissions from fattening swine and expectant swine”, Japan Society of Animal Science, Animal Science Journal 59, pp779-778, 1998
Noboru Murayama, et al. “Alimentation of Crops and Fertilizer”, Buneido, p26 Shibata, Terada, Kurihara, Nishida and Iwasaki, “Estimation of Methane Production in Ruminants”,
Animal Sciences and Technology, Vol.64, No.8, August 1993 Y. Fukumoto, T. Osada, D. Hanajima, K. Kuroda & K. Haga, “Measurement of NH3, N2O and CH4
emissions from swine manure composting using a new dynamic chamber system”, Proceedings of 1st IWA International Conference on Odor and VOCs; Measurement, Regulation and Control techniques. Australia, pp613-620, March 2001
Yoshinori Miura and Tadanori Kannno, “Emissions of Trace Gases (CO2, CO, CH4, and N2O) Resulting from Rice Straw Burning”, Soil Sci.Plant Nutr., 43(4), pp849-854, 1997
Owa, “New Trends in Technology for Efficient Use of Nutrients – Nutritional Balance of Crops in Japan” 1996 Sixth Kanto-Tokai Agricultural Study Session on Soil Management Technologies for Agricultural Production in Harmony with Environment; National Agriculture and Bio-oriented Research Organization ,1996
Makoto Ishibashi,Jyunya Hashiguchi,Morihiro Koga, "Development of technology of reducing GHG on the livestock industry(second report)" the experiment and study of environmental safeguards on the livestock industry, Report of the research institute of livestock(2003) Kumamoto Prefecture Agricultural Research Center, The research institute of livestock
Takuji Sawamoto、Yasuhiro Nakajima、Masahiro Kasuya、Haruo Tsuruta and Kazuyuki Yagi “Evaluation of emission factors for indirect N2O emission due to nitrogen leaching in agro-ecosystems” GEOPHYSICAL RESEARCH LETTERS VOL.32
Takashi Osada, Yasuyuki Fukumoto, Tadashi Tamura, Makoto Shiraihi, Makoto Ishibashi:Greenhouse gas generation from livestock waste composting,Non-CO2 Greenhouse Gases (NCGG-4),Proceedings of the Fourth International Symposium NCGG-4,105-111(2005)
Chapter 6. Agriculture (CRF sector4)
Page 6.40 National Greenhouse Gas Inventory Report of Japan 2006
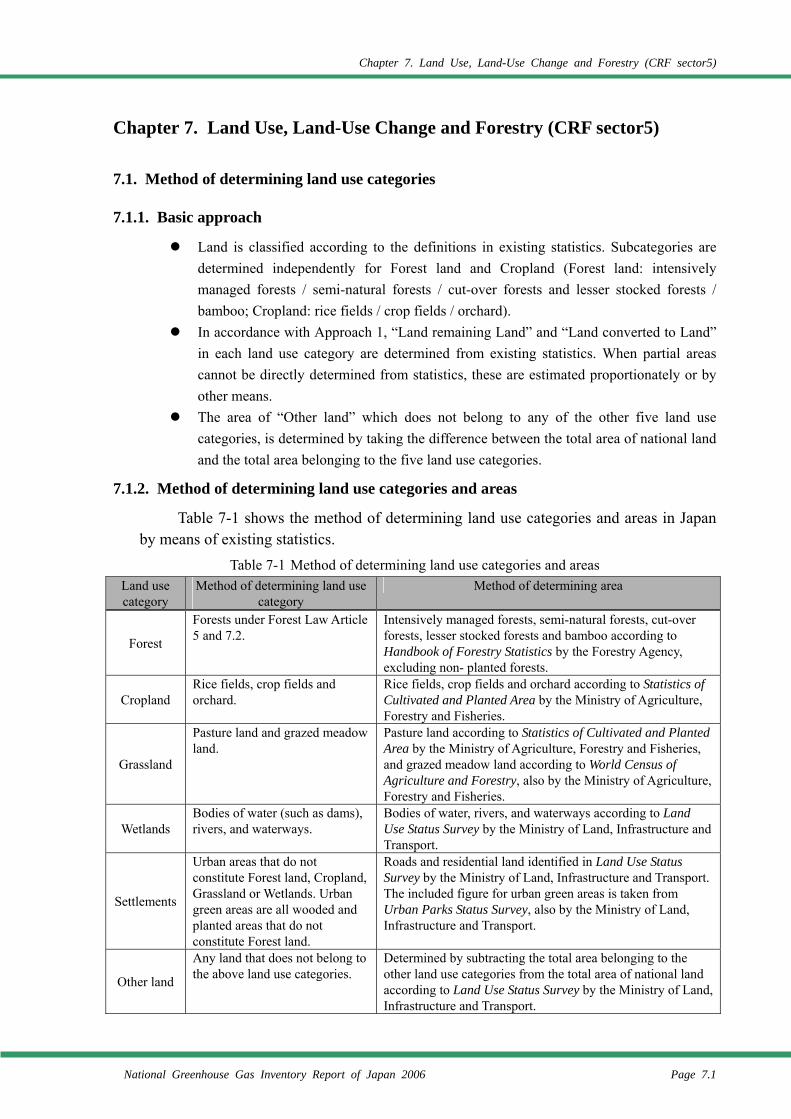
Chapter 7. Land Use, Land-Use Change and Forestry (CRF sector5)
National Greenhouse Gas Inventory Report of Japan 2006 Page 7.1
Chapter 7. Land Use, Land-Use Change and Forestry (CRF sector5)
7.1. Method of determining land use categories
7.1.1. Basic approach
Land is classified according to the definitions in existing statistics. Subcategories are determined independently for Forest land and Cropland (Forest land: intensively managed forests / semi-natural forests / cut-over forests and lesser stocked forests / bamboo; Cropland: rice fields / crop fields / orchard).
In accordance with Approach 1, “Land remaining Land” and “Land converted to Land” in each land use category are determined from existing statistics. When partial areas cannot be directly determined from statistics, these are estimated proportionately or by other means.
The area of “Other land” which does not belong to any of the other five land use categories, is determined by taking the difference between the total area of national land and the total area belonging to the five land use categories.
7.1.2. Method of determining land use categories and areas
Table 7-1 shows the method of determining land use categories and areas in Japan by means of existing statistics.
Table 7-1 Method of determining land use categories and areas Land use category
Method of determining land use category
Method of determining area
Forest
Forests under Forest Law Article 5 and 7.2.
Intensively managed forests, semi-natural forests, cut-over forests, lesser stocked forests and bamboo according to Handbook of Forestry Statistics by the Forestry Agency, excluding non- planted forests.
Cropland Rice fields, crop fields and orchard.
Rice fields, crop fields and orchard according to Statistics of Cultivated and Planted Area by the Ministry of Agriculture, Forestry and Fisheries.
Grassland
Pasture land and grazed meadow land.
Pasture land according to Statistics of Cultivated and Planted Area by the Ministry of Agriculture, Forestry and Fisheries, and grazed meadow land according to World Census of Agriculture and Forestry, also by the Ministry of Agriculture, Forestry and Fisheries.
Wetlands Bodies of water (such as dams), rivers, and waterways.
Bodies of water, rivers, and waterways according to Land Use Status Survey by the Ministry of Land, Infrastructure and Transport.
Settlements
Urban areas that do not constitute Forest land, Cropland, Grassland or Wetlands. Urban green areas are all wooded and planted areas that do not constitute Forest land.
Roads and residential land identified in Land Use Status Survey by the Ministry of Land, Infrastructure and Transport. The included figure for urban green areas is taken from Urban Parks Status Survey, also by the Ministry of Land, Infrastructure and Transport.
Other land
Any land that does not belong to the above land use categories.
Determined by subtracting the total area belonging to the other land use categories from the total area of national land according to Land Use Status Survey by the Ministry of Land, Infrastructure and Transport.
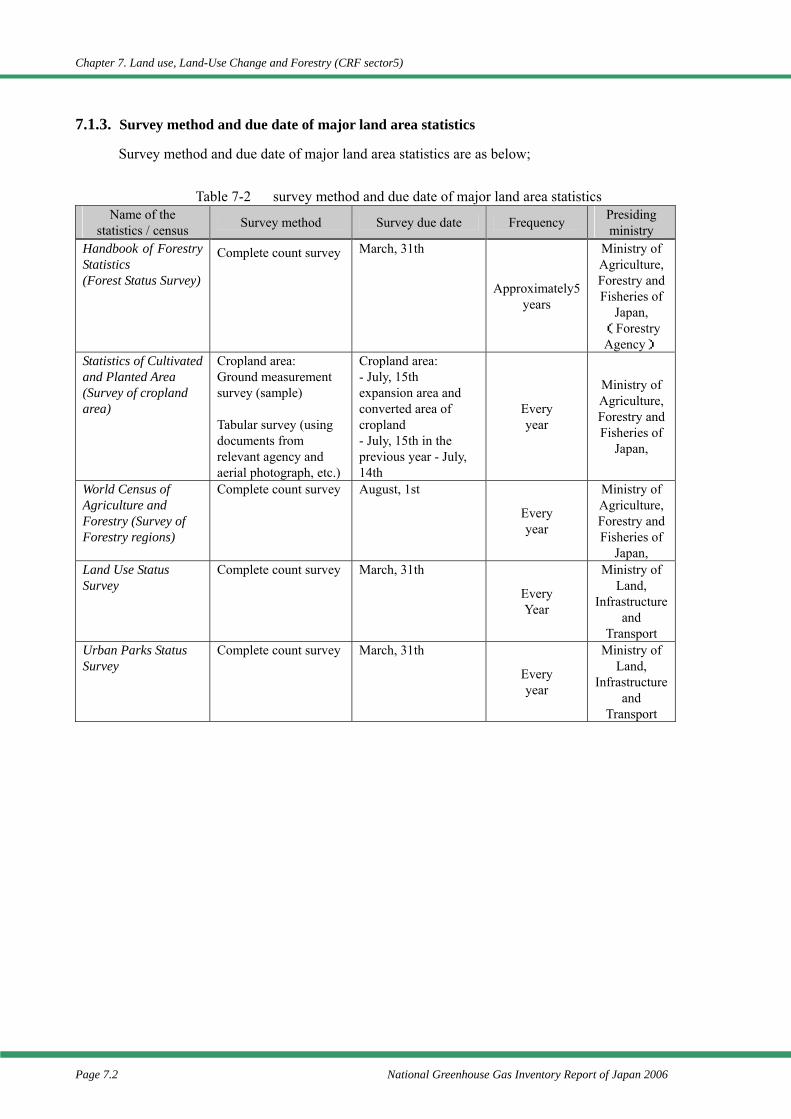
Chapter 7. Land use, Land-Use Change and Forestry (CRF sector5)
Page 7.2 National Greenhouse Gas Inventory Report of Japan 2006
7.1.3. Survey method and due date of major land area statistics
Survey method and due date of major land area statistics are as below;
Table 7-2 survey method and due date of major land area statistics Name of the
statistics / census Survey method Survey due date Frequency Presiding ministry
Handbook of Forestry Statistics (Forest Status Survey)
Complete count survey March, 31th
Approximately5 years
Ministry of Agriculture, Forestry and Fisheries of
Japan, (Forestry Agency)
Statistics of Cultivated and Planted Area (Survey of cropland area)
Cropland area: Ground measurement survey (sample) Tabular survey (using documents from relevant agency and aerial photograph, etc.)
Cropland area: - July, 15th expansion area and converted area of cropland - July, 15th in the previous year - July, 14th
Every year
Ministry of Agriculture, Forestry and Fisheries of
Japan,
World Census of Agriculture and Forestry (Survey of Forestry regions)
Complete count survey August, 1st
Every year
Ministry of Agriculture, Forestry and Fisheries of
Japan, Land Use Status Survey
Complete count survey March, 31th
Every Year
Ministry of Land,
Infrastructure and
Transport Urban Parks Status Survey
Complete count survey March, 31th
Every year
Ministry of Land,
Infrastructure and
Transport
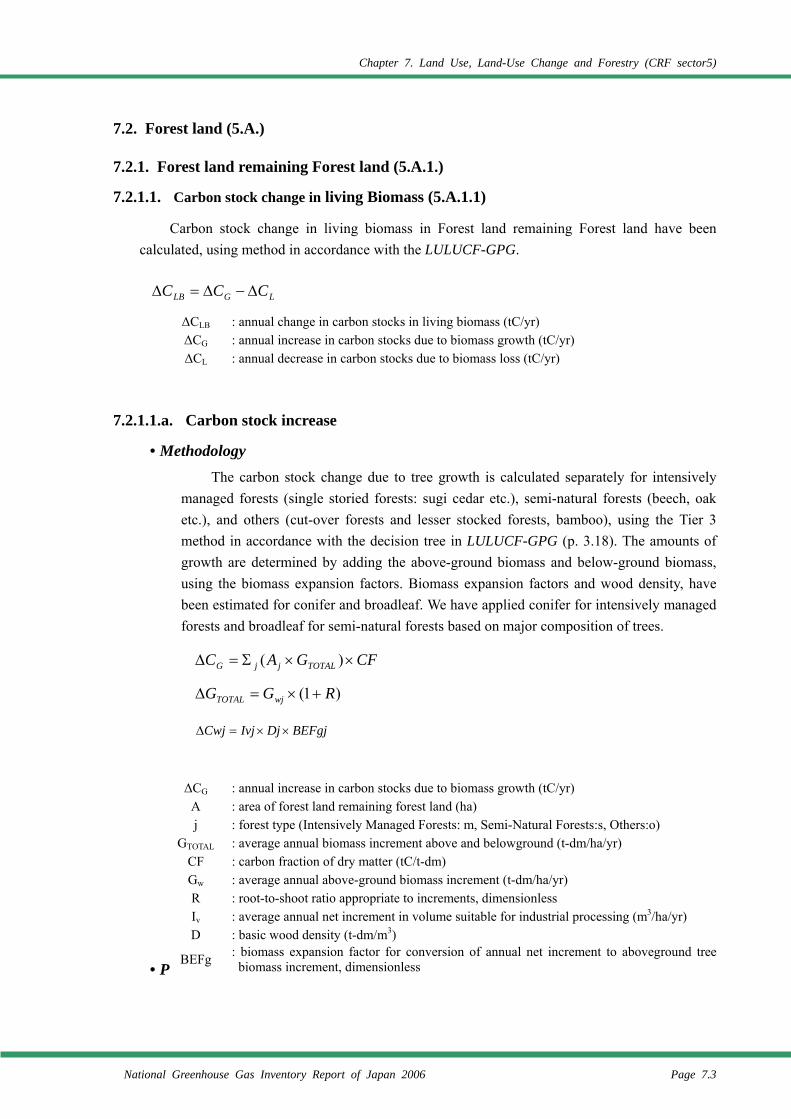
Chapter 7. Land Use, Land-Use Change and Forestry (CRF sector5)
National Greenhouse Gas Inventory Report of Japan 2006 Page 7.3
7.2. Forest land (5.A.)
7.2.1. Forest land remaining Forest land (5.A.1.)
7.2.1.1. Carbon stock change in living Biomass (5.A.1.1)
Carbon stock change in living biomass in Forest land remaining Forest land have been calculated, using method in accordance with the LULUCF-GPG.
7.2.1.1.a. Carbon stock increase
• Methodology The carbon stock change due to tree growth is calculated separately for intensively
managed forests (single storied forests: sugi cedar etc.), semi-natural forests (beech, oak etc.), and others (cut-over forests and lesser stocked forests, bamboo), using the Tier 3 method in accordance with the decision tree in LULUCF-GPG (p. 3.18). The amounts of growth are determined by adding the above-ground biomass and below-ground biomass, using the biomass expansion factors. Biomass expansion factors and wood density, have been estimated for conifer and broadleaf. We have applied conifer for intensively managed forests and broadleaf for semi-natural forests based on major composition of trees.
• P
∆CLB : annual change in carbon stocks in living biomass (tC/yr) ∆CG : annual increase in carbon stocks due to biomass growth (tC/yr) ∆CL : annual decrease in carbon stocks due to biomass loss (tC/yr)
∆CG : annual increase in carbon stocks due to biomass growth (tC/yr) A : area of forest land remaining forest land (ha) j : forest type (Intensively Managed Forests: m, Semi-Natural Forests:s, Others:o)
GTOTAL : average annual biomass increment above and belowground (t-dm/ha/yr) CF : carbon fraction of dry matter (tC/t-dm) Gw : average annual above-ground biomass increment (t-dm/ha/yr) R : root-to-shoot ratio appropriate to increments, dimensionless Iv : average annual net increment in volume suitable for industrial processing (m3/ha/yr) D : basic wood density (t-dm/m3)
BEFg : biomass expansion factor for conversion of annual net increment to aboveground tree biomass increment, dimensionless
LGLB CCC ∆−∆=∆
)1( RGG wjTOTAL +×=∆
CFGAC TOTALjjG ××Σ=∆ )(
BEFgjDjIvjCwj ××=∆
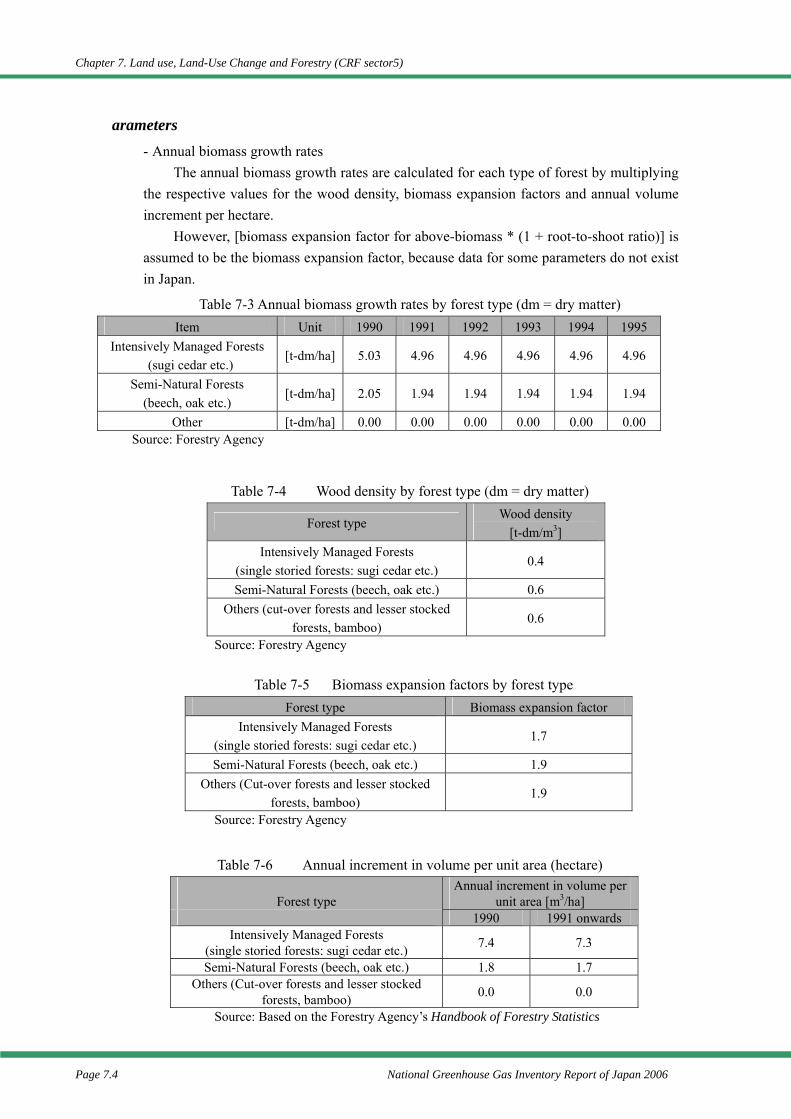
Chapter 7. Land use, Land-Use Change and Forestry (CRF sector5)
Page 7.4 National Greenhouse Gas Inventory Report of Japan 2006
arameters - Annual biomass growth rates
The annual biomass growth rates are calculated for each type of forest by multiplying the respective values for the wood density, biomass expansion factors and annual volume increment per hectare.
However, [biomass expansion factor for above-biomass * (1 + root-to-shoot ratio)] is assumed to be the biomass expansion factor, because data for some parameters do not exist in Japan.
Table 7-3 Annual biomass growth rates by forest type (dm = dry matter) Item Unit 1990 1991 1992 1993 1994 1995
Intensively Managed Forests (sugi cedar etc.)
[t-dm/ha] 5.03 4.96 4.96 4.96 4.96 4.96
Semi-Natural Forests (beech, oak etc.)
[t-dm/ha] 2.05 1.94 1.94 1.94 1.94 1.94
Other [t-dm/ha] 0.00 0.00 0.00 0.00 0.00 0.00 Source: Forestry Agency
Table 7-4 Wood density by forest type (dm = dry matter)
Forest type Wood density
[t-dm/m3] Intensively Managed Forests
(single storied forests: sugi cedar etc.) 0.4
Semi-Natural Forests (beech, oak etc.) 0.6 Others (cut-over forests and lesser stocked
forests, bamboo) 0.6
Source: Forestry Agency
Table 7-5 Biomass expansion factors by forest type Forest type Biomass expansion factor
Intensively Managed Forests (single storied forests: sugi cedar etc.)
1.7
Semi-Natural Forests (beech, oak etc.) 1.9 Others (Cut-over forests and lesser stocked
forests, bamboo) 1.9
Source: Forestry Agency
Table 7-6 Annual increment in volume per unit area (hectare)
Forest type Annual increment in volume per
unit area [m3/ha] 1990 1991 onwards
Intensively Managed Forests (single storied forests: sugi cedar etc.) 7.4 7.3
Semi-Natural Forests (beech, oak etc.) 1.8 1.7 Others (Cut-over forests and lesser stocked
forests, bamboo) 0.0 0.0
Source: Based on the Forestry Agency’s Handbook of Forestry Statistics
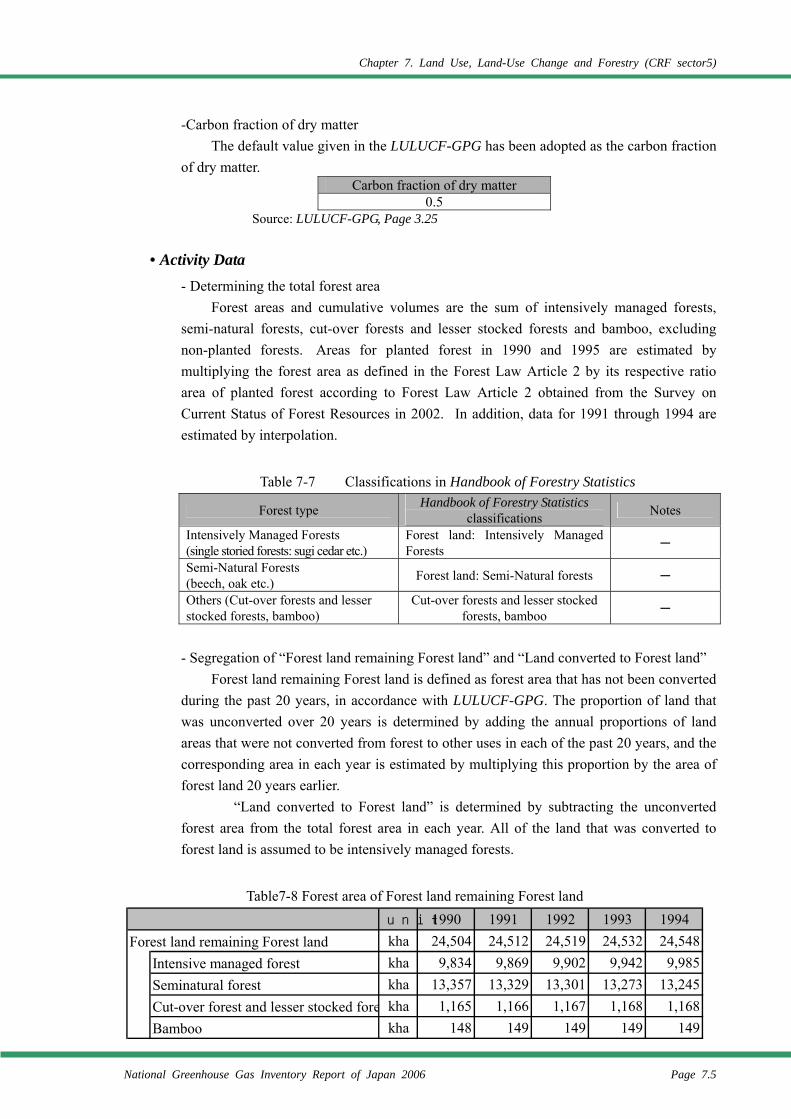
Chapter 7. Land Use, Land-Use Change and Forestry (CRF sector5)
National Greenhouse Gas Inventory Report of Japan 2006 Page 7.5
-Carbon fraction of dry matter The default value given in the LULUCF-GPG has been adopted as the carbon fraction
of dry matter. Carbon fraction of dry matter
0.5 Source: LULUCF-GPG, Page 3.25
• Activity Data
- Determining the total forest area Forest areas and cumulative volumes are the sum of intensively managed forests,
semi-natural forests, cut-over forests and lesser stocked forests and bamboo, excluding non-planted forests. Areas for planted forest in 1990 and 1995 are estimated by multiplying the forest area as defined in the Forest Law Article 2 by its respective ratio area of planted forest according to Forest Law Article 2 obtained from the Survey on Current Status of Forest Resources in 2002. In addition, data for 1991 through 1994 are estimated by interpolation.
Table 7-7 Classifications in Handbook of Forestry Statistics
Forest type Handbook of Forestry Statistics classifications Notes
Intensively Managed Forests (single storied forests: sugi cedar etc.)
Forest land: Intensively Managed Forests ─
Semi-Natural Forests (beech, oak etc.) Forest land: Semi-Natural forests ─
Others (Cut-over forests and lesser stocked forests, bamboo)
Cut-over forests and lesser stocked forests, bamboo ─
- Segregation of “Forest land remaining Forest land” and “Land converted to Forest land”
Forest land remaining Forest land is defined as forest area that has not been converted during the past 20 years, in accordance with LULUCF-GPG. The proportion of land that was unconverted over 20 years is determined by adding the annual proportions of land areas that were not converted from forest to other uses in each of the past 20 years, and the corresponding area in each year is estimated by multiplying this proportion by the area of forest land 20 years earlier.
“Land converted to Forest land” is determined by subtracting the unconverted forest area from the total forest area in each year. All of the land that was converted to forest land is assumed to be intensively managed forests.
Table7-8 Forest area of Forest land remaining Forest land
unit 1990 1991 1992 1993 1994Forest land remaining Forest land kha 24,504 24,512 24,519 24,532 24,548
Intensive managed forest kha 9,834 9,869 9,902 9,942 9,985Seminatural forest kha 13,357 13,329 13,301 13,273 13,245Cut-over forest and lesser stocked fore kha 1,165 1,166 1,167 1,168 1,168Bamboo kha 148 149 149 149 149
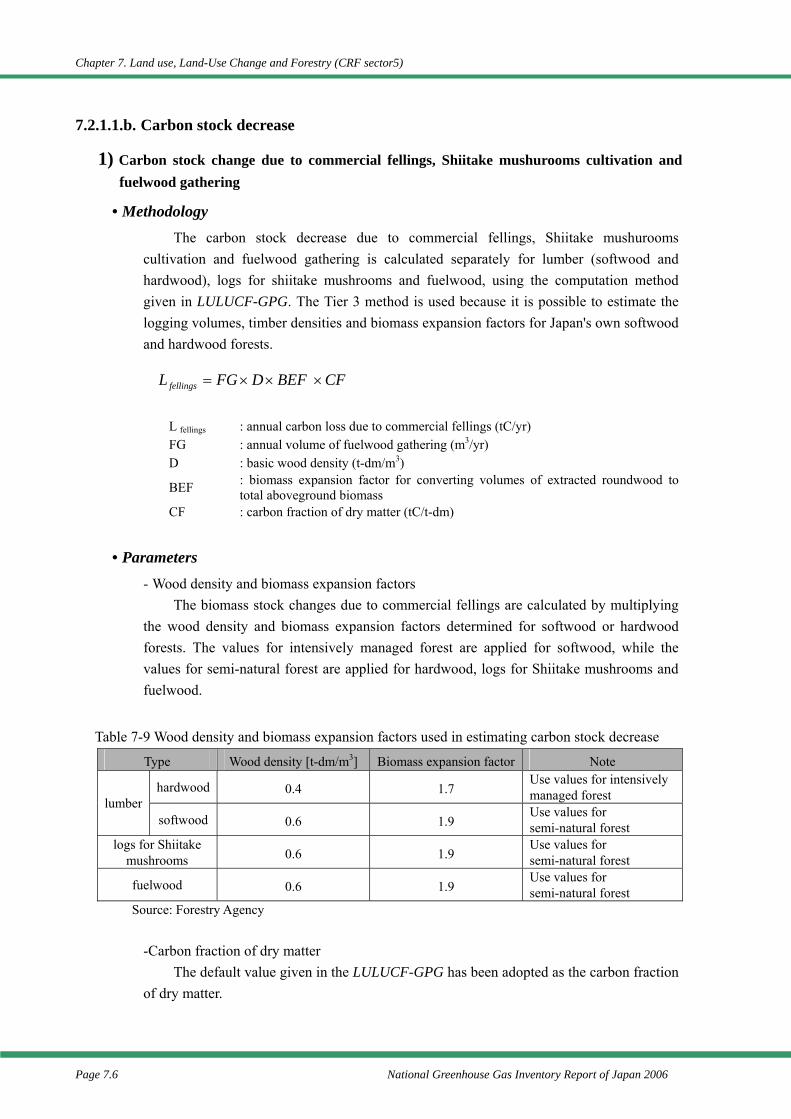
Chapter 7. Land use, Land-Use Change and Forestry (CRF sector5)
Page 7.6 National Greenhouse Gas Inventory Report of Japan 2006
7.2.1.1.b. Carbon stock decrease
1) Carbon stock change due to commercial fellings, Shiitake mushurooms cultivation and fuelwood gathering
• Methodology The carbon stock decrease due to commercial fellings, Shiitake mushurooms
cultivation and fuelwood gathering is calculated separately for lumber (softwood and hardwood), logs for shiitake mushrooms and fuelwood, using the computation method given in LULUCF-GPG. The Tier 3 method is used because it is possible to estimate the logging volumes, timber densities and biomass expansion factors for Japan's own softwood and hardwood forests.
L fellings : annual carbon loss due to commercial fellings (tC/yr) FG : annual volume of fuelwood gathering (m3/yr) D : basic wood density (t-dm/m3)
BEF : biomass expansion factor for converting volumes of extracted roundwood to total aboveground biomass
CF : carbon fraction of dry matter (tC/t-dm)
• Parameters - Wood density and biomass expansion factors
The biomass stock changes due to commercial fellings are calculated by multiplying the wood density and biomass expansion factors determined for softwood or hardwood forests. The values for intensively managed forest are applied for softwood, while the values for semi-natural forest are applied for hardwood, logs for Shiitake mushrooms and fuelwood.
Table 7-9 Wood density and biomass expansion factors used in estimating carbon stock decrease
Type Wood density [t-dm/m3] Biomass expansion factor Note
hardwood 0.4 1.7 Use values for intensively managed forest lumber
softwood 0.6 1.9 Use values for semi-natural forest
logs for Shiitake mushrooms 0.6 1.9
Use values for semi-natural forest
fuelwood 0.6 1.9 Use values for semi-natural forest
Source: Forestry Agency
-Carbon fraction of dry matter The default value given in the LULUCF-GPG has been adopted as the carbon fraction
of dry matter.
CFBEFDFGL fellings ×××=
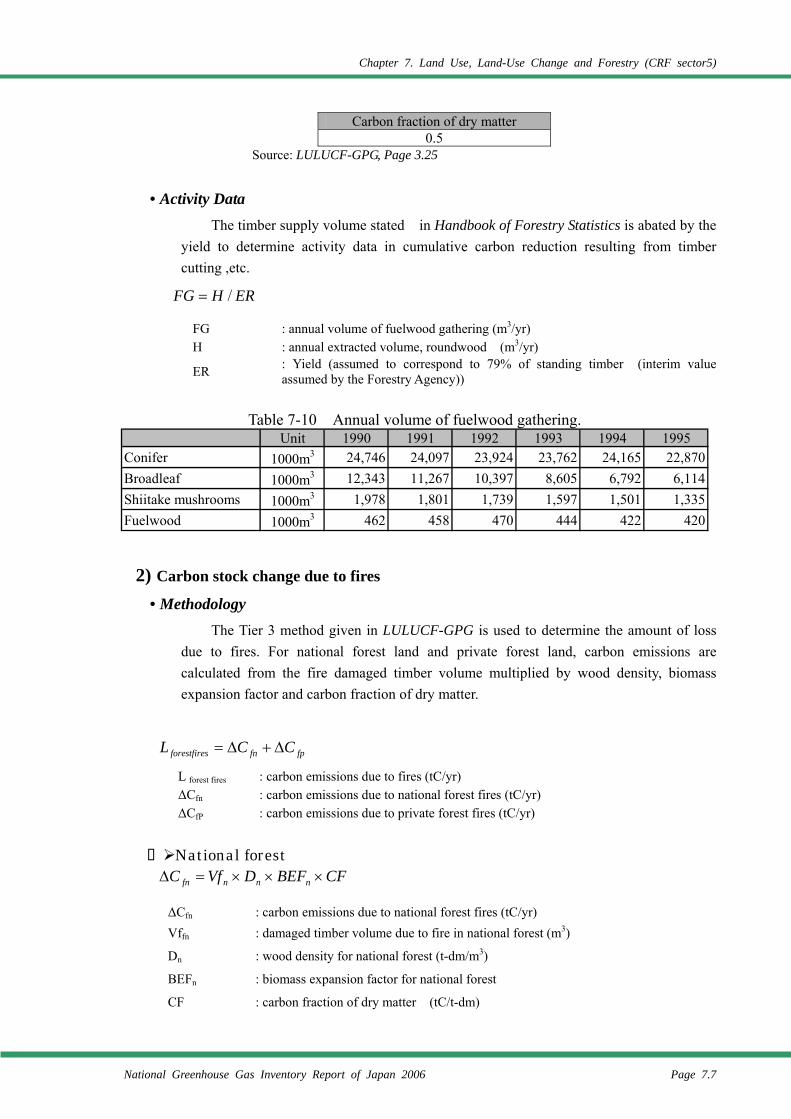
Chapter 7. Land Use, Land-Use Change and Forestry (CRF sector5)
National Greenhouse Gas Inventory Report of Japan 2006 Page 7.7
Carbon fraction of dry matter 0.5
Source: LULUCF-GPG, Page 3.25
• Activity Data The timber supply volume stated in Handbook of Forestry Statistics is abated by the
yield to determine activity data in cumulative carbon reduction resulting from timber cutting ,etc.
FG : annual volume of fuelwood gathering (m3/yr) H : annual extracted volume, roundwood (m3/yr)
ER : Yield (assumed to correspond to 79% of standing timber (interim value assumed by the Forestry Agency))
Table 7-10 Annual volume of fuelwood gathering.
2) Carbon stock change due to fires
• Methodology The Tier 3 method given in LULUCF-GPG is used to determine the amount of loss
due to fires. For national forest land and private forest land, carbon emissions are calculated from the fire damaged timber volume multiplied by wood density, biomass expansion factor and carbon fraction of dry matter.
L forest fires : carbon emissions due to fires (tC/yr) ∆Cfn : carbon emissions due to national forest fires (tC/yr) ∆CfP : carbon emissions due to private forest fires (tC/yr)
National forest
∆Cfn : carbon emissions due to national forest fires (tC/yr) Vffn : damaged timber volume due to fire in national forest (m3)
Dn : wood density for national forest (t-dm/m3)
BEFn : biomass expansion factor for national forest
CF : carbon fraction of dry matter (tC/t-dm)
ERHFG /=
fpfnsforestfire CCL ∆+∆=
CFBEFDVfC nnnfn ×××=∆
Unit 1990 1991 1992 1993 1994 1995Conifer 1000m3 24,746 24,097 23,924 23,762 24,165 22,870Broadleaf 1000m3 12,343 11,267 10,397 8,605 6,792 6,114Shiitake mushrooms 1000m3 1,978 1,801 1,739 1,597 1,501 1,335Fuelwood 1000m3 462 458 470 444 422 420
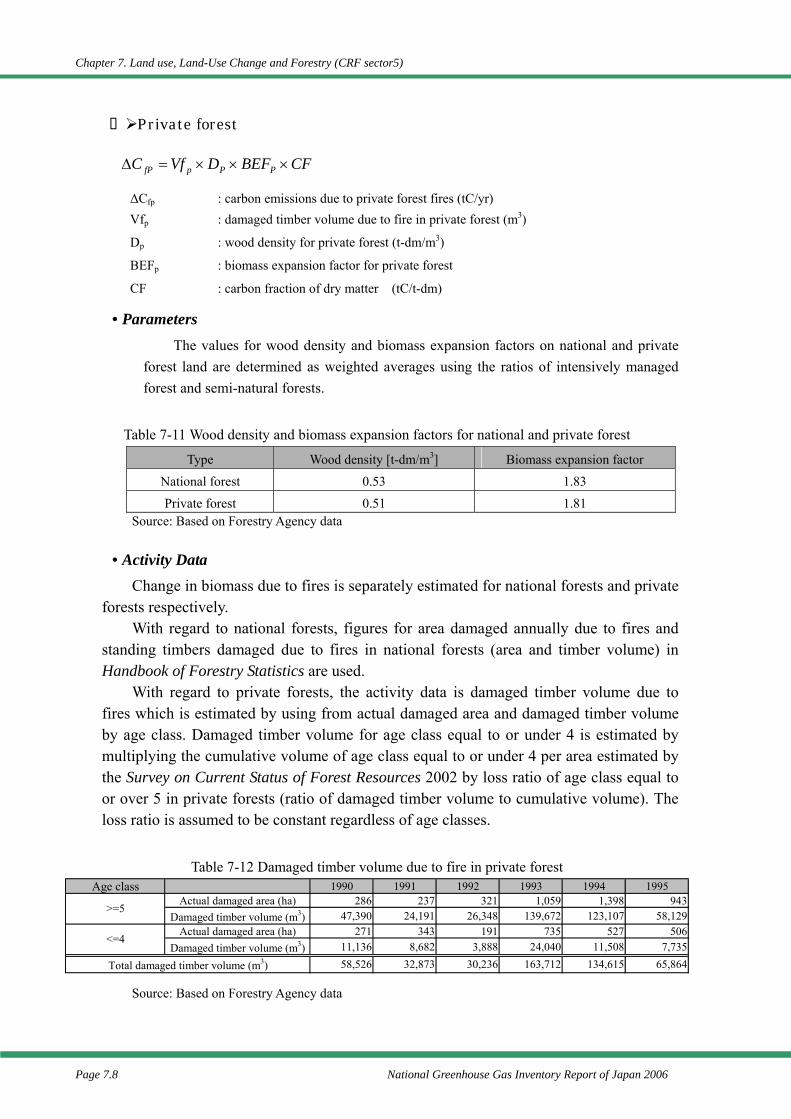
Chapter 7. Land use, Land-Use Change and Forestry (CRF sector5)
Page 7.8 National Greenhouse Gas Inventory Report of Japan 2006
Private forest • Parameters
The values for wood density and biomass expansion factors on national and private forest land are determined as weighted averages using the ratios of intensively managed forest and semi-natural forests.
Table 7-11 Wood density and biomass expansion factors for national and private forest
Type Wood density [t-dm/m3] Biomass expansion factor
National forest 0.53 1.83
Private forest 0.51 1.81 Source: Based on Forestry Agency data
• Activity Data Change in biomass due to fires is separately estimated for national forests and private
forests respectively. With regard to national forests, figures for area damaged annually due to fires and
standing timbers damaged due to fires in national forests (area and timber volume) in Handbook of Forestry Statistics are used.
With regard to private forests, the activity data is damaged timber volume due to fires which is estimated by using from actual damaged area and damaged timber volume by age class. Damaged timber volume for age class equal to or under 4 is estimated by multiplying the cumulative volume of age class equal to or under 4 per area estimated by the Survey on Current Status of Forest Resources 2002 by loss ratio of age class equal to or over 5 in private forests (ratio of damaged timber volume to cumulative volume). The loss ratio is assumed to be constant regardless of age classes.
Table 7-12 Damaged timber volume due to fire in private forest
Source: Based on Forestry Agency data
∆Cfp : carbon emissions due to private forest fires (tC/yr) Vfp : damaged timber volume due to fire in private forest (m3)
Dp : wood density for private forest (t-dm/m3)
BEFp : biomass expansion factor for private forest
CF : carbon fraction of dry matter (tC/t-dm)
CFBEFDVfC PPpfP ×××=∆
Age class 1990 1991 1992 1993 1994 1995Actual damaged area (ha) 286 237 321 1,059 1,398 943
Damaged timber volume (m3) 47,390 24,191 26,348 139,672 123,107 58,129Actual damaged area (ha) 271 343 191 735 527 506
Damaged timber volume (m3) 11,136 8,682 3,888 24,040 11,508 7,73558,526 32,873 30,236 163,712 134,615 65,864
>=5
<=4
Total damaged timber volume (m3)
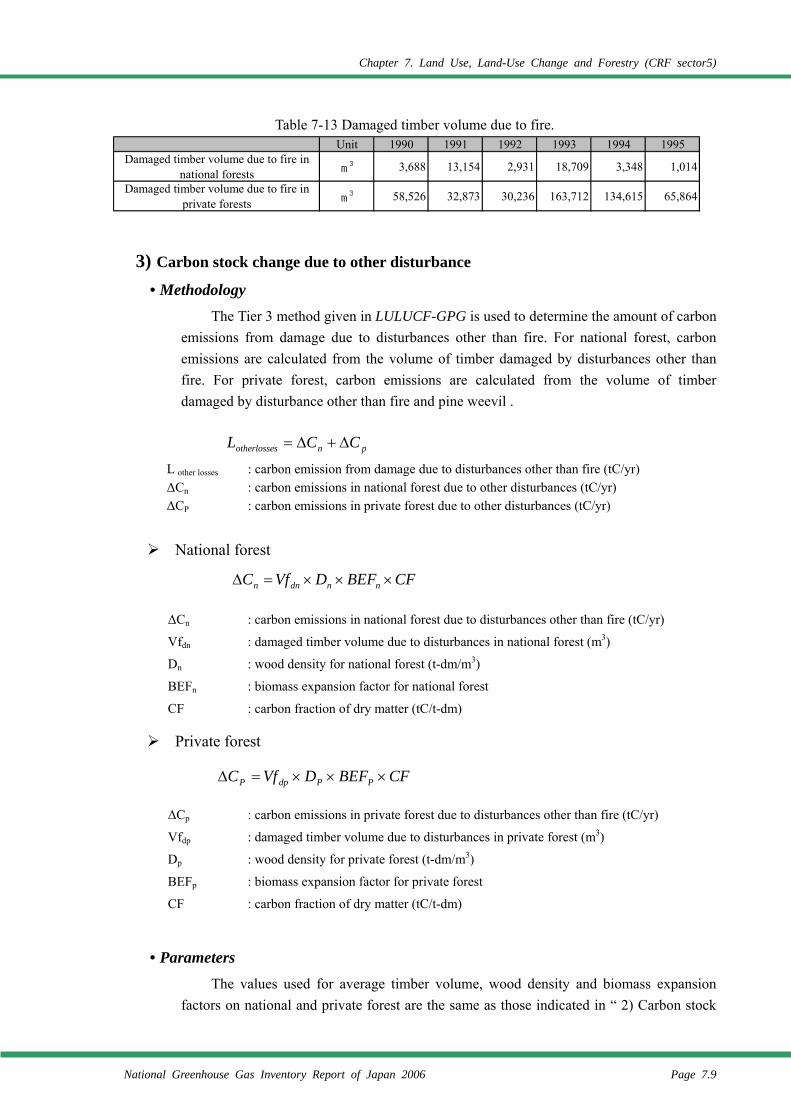
Chapter 7. Land Use, Land-Use Change and Forestry (CRF sector5)
National Greenhouse Gas Inventory Report of Japan 2006 Page 7.9
Table 7-13 Damaged timber volume due to fire.
3) Carbon stock change due to other disturbance
• Methodology The Tier 3 method given in LULUCF-GPG is used to determine the amount of carbon
emissions from damage due to disturbances other than fire. For national forest, carbon emissions are calculated from the volume of timber damaged by disturbances other than fire. For private forest, carbon emissions are calculated from the volume of timber damaged by disturbance other than fire and pine weevil .
National forest
Private forest
• Parameters The values used for average timber volume, wood density and biomass expansion
factors on national and private forest are the same as those indicated in “ 2) Carbon stock
L other losses : carbon emission from damage due to disturbances other than fire (tC/yr) ∆Cn : carbon emissions in national forest due to other disturbances (tC/yr) ∆CP : carbon emissions in private forest due to other disturbances (tC/yr)
∆Cn : carbon emissions in national forest due to disturbances other than fire (tC/yr)
Vfdn : damaged timber volume due to disturbances in national forest (m3)
Dn : wood density for national forest (t-dm/m3)
BEFn : biomass expansion factor for national forest
CF : carbon fraction of dry matter (tC/t-dm)
∆Cp : carbon emissions in private forest due to disturbances other than fire (tC/yr)
Vfdp : damaged timber volume due to disturbances in private forest (m3)
Dp : wood density for private forest (t-dm/m3)
BEFp : biomass expansion factor for private forest
CF : carbon fraction of dry matter (tC/t-dm)
pnsotherlosse CCL ∆+∆=
CFBEFDVfC nndnn ×××=∆
CFBEFDVfC PPdpP ×××=∆
Unit 1990 1991 1992 1993 1994 1995Damaged timber volume due to fire in
national forests m3 3,688 13,154 2,931 18,709 3,348 1,014
Damaged timber volume due to fire inprivate forests m
3 58,526 32,873 30,236 163,712 134,615 65,864
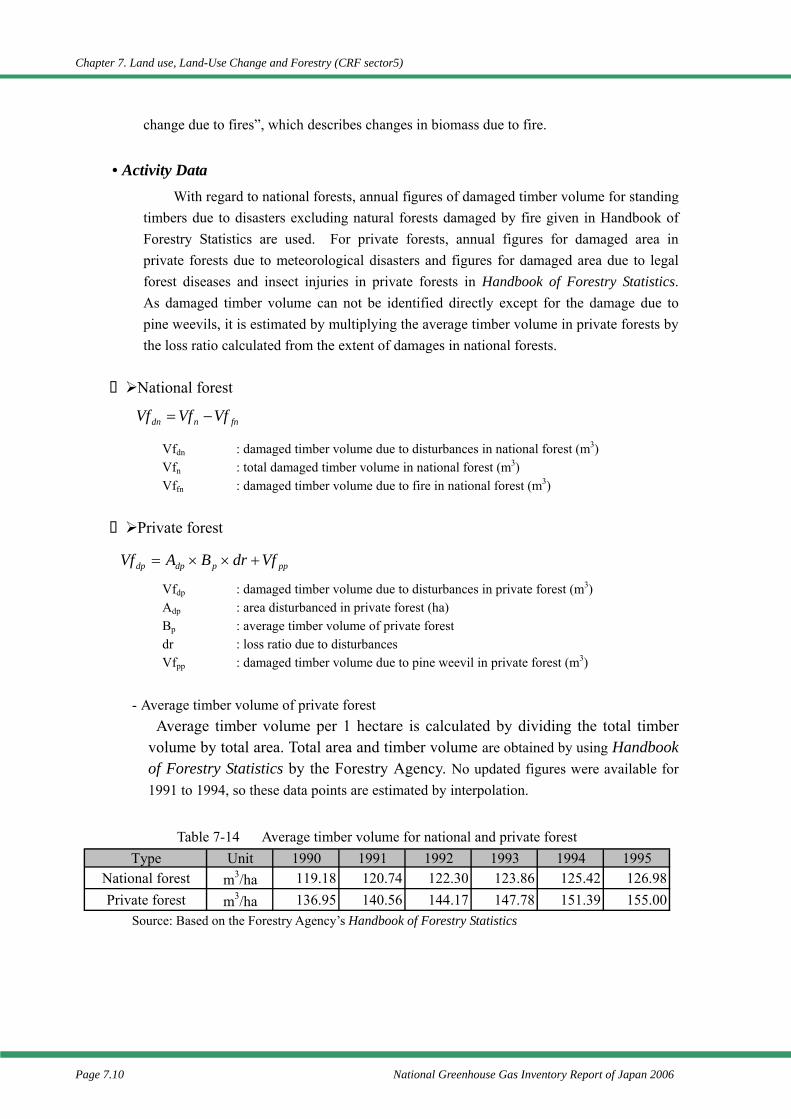
Chapter 7. Land use, Land-Use Change and Forestry (CRF sector5)
Page 7.10 National Greenhouse Gas Inventory Report of Japan 2006
change due to fires”, which describes changes in biomass due to fire.
• Activity Data With regard to national forests, annual figures of damaged timber volume for standing
timbers due to disasters excluding natural forests damaged by fire given in Handbook of Forestry Statistics are used. For private forests, annual figures for damaged area in private forests due to meteorological disasters and figures for damaged area due to legal forest diseases and insect injuries in private forests in Handbook of Forestry Statistics. As damaged timber volume can not be identified directly except for the damage due to pine weevils, it is estimated by multiplying the average timber volume in private forests by the loss ratio calculated from the extent of damages in national forests.
National forest
Vfdn : damaged timber volume due to disturbances in national forest (m3) Vfn : total damaged timber volume in national forest (m3) Vffn : damaged timber volume due to fire in national forest (m3)
Private forest
Vfdp : damaged timber volume due to disturbances in private forest (m3) Adp : area disturbanced in private forest (ha) Bp : average timber volume of private forest dr : loss ratio due to disturbances Vfpp : damaged timber volume due to pine weevil in private forest (m3)
- Average timber volume of private forest Average timber volume per 1 hectare is calculated by dividing the total timber
volume by total area. Total area and timber volume are obtained by using Handbook of Forestry Statistics by the Forestry Agency. No updated figures were available for 1991 to 1994, so these data points are estimated by interpolation.
Table 7-14 Average timber volume for national and private forest
Source: Based on the Forestry Agency’s Handbook of Forestry Statistics
fnndn VfVfVf −=
pppdpdp VfdrBAVf +××=
Type Unit 1990 1991 1992 1993 1994 1995National forest m3/ha 119.18 120.74 122.30 123.86 125.42 126.98Private forest m3/ha 136.95 140.56 144.17 147.78 151.39 155.00
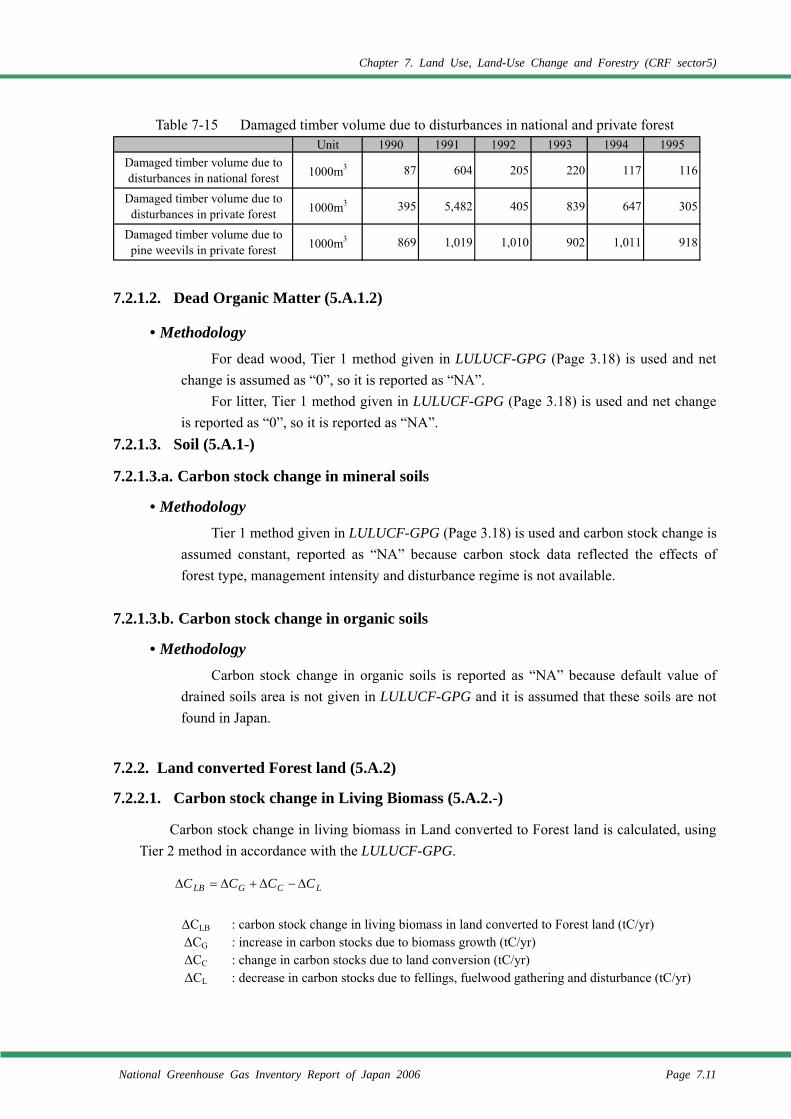
Chapter 7. Land Use, Land-Use Change and Forestry (CRF sector5)
National Greenhouse Gas Inventory Report of Japan 2006 Page 7.11
Table 7-15 Damaged timber volume due to disturbances in national and private forest
7.2.1.2. Dead Organic Matter (5.A.1.2)
• Methodology For dead wood, Tier 1 method given in LULUCF-GPG (Page 3.18) is used and net
change is assumed as “0”, so it is reported as “NA”. For litter, Tier 1 method given in LULUCF-GPG (Page 3.18) is used and net change
is reported as “0”, so it is reported as “NA”. 7.2.1.3. Soil (5.A.1-)
7.2.1.3.a. Carbon stock change in mineral soils
• Methodology Tier 1 method given in LULUCF-GPG (Page 3.18) is used and carbon stock change is
assumed constant, reported as “NA” because carbon stock data reflected the effects of forest type, management intensity and disturbance regime is not available.
7.2.1.3.b. Carbon stock change in organic soils
• Methodology Carbon stock change in organic soils is reported as “NA” because default value of
drained soils area is not given in LULUCF-GPG and it is assumed that these soils are not found in Japan.
7.2.2. Land converted Forest land (5.A.2)
7.2.2.1. Carbon stock change in Living Biomass (5.A.2.-)
Carbon stock change in living biomass in Land converted to Forest land is calculated, using Tier 2 method in accordance with the LULUCF-GPG.
∆CLB : carbon stock change in living biomass in land converted to Forest land (tC/yr) ∆CG : increase in carbon stocks due to biomass growth (tC/yr) ∆CC : change in carbon stocks due to land conversion (tC/yr) ∆CL : decrease in carbon stocks due to fellings, fuelwood gathering and disturbance (tC/yr)
LCGLB CCCC ∆−∆+∆=∆
Unit 1990 1991 1992 1993 1994 1995Damaged timber volume due todisturbances in national forest 1000m3 87 604 205 220 117 116
Damaged timber volume due todisturbances in private forest 1000m3 395 5,482 405 839 647 305
Damaged timber volume due topine weevils in private forest 1000m3 869 1,019 1,010 902 1,011 918
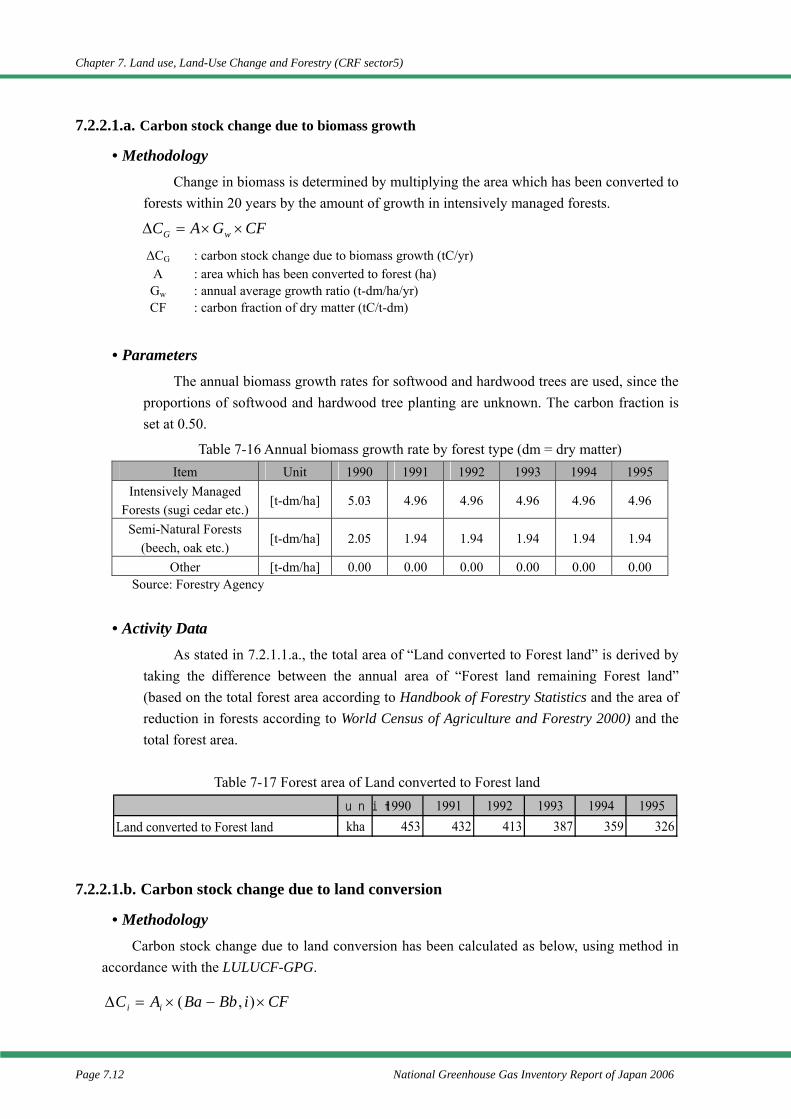
Chapter 7. Land use, Land-Use Change and Forestry (CRF sector5)
Page 7.12 National Greenhouse Gas Inventory Report of Japan 2006
unit 1990 1991 1992 1993 1994 1995Land converted to Forest land kha 453 432 413 387 359 326
7.2.2.1.a. Carbon stock change due to biomass growth
• Methodology Change in biomass is determined by multiplying the area which has been converted to
forests within 20 years by the amount of growth in intensively managed forests.
• Parameters The annual biomass growth rates for softwood and hardwood trees are used, since the
proportions of softwood and hardwood tree planting are unknown. The carbon fraction is set at 0.50.
Table 7-16 Annual biomass growth rate by forest type (dm = dry matter) Item Unit 1990 1991 1992 1993 1994 1995
Intensively Managed Forests (sugi cedar etc.)
[t-dm/ha] 5.03 4.96 4.96 4.96 4.96 4.96
Semi-Natural Forests (beech, oak etc.)
[t-dm/ha] 2.05 1.94 1.94 1.94 1.94 1.94
Other [t-dm/ha] 0.00 0.00 0.00 0.00 0.00 0.00 Source: Forestry Agency
• Activity Data As stated in 7.2.1.1.a., the total area of “Land converted to Forest land” is derived by
taking the difference between the annual area of “Forest land remaining Forest land” (based on the total forest area according to Handbook of Forestry Statistics and the area of reduction in forests according to World Census of Agriculture and Forestry 2000) and the total forest area.
Table 7-17 Forest area of Land converted to Forest land
7.2.2.1.b. Carbon stock change due to land conversion
• Methodology Carbon stock change due to land conversion has been calculated as below, using method in
accordance with the LULUCF-GPG.
∆CG : carbon stock change due to biomass growth (tC/yr) A : area which has been converted to forest (ha) Gw : annual average growth ratio (t-dm/ha/yr) CF : carbon fraction of dry matter (tC/t-dm)
CFGAC wG ××=∆
CFiBbBaAC ii ×−×=∆ ),(
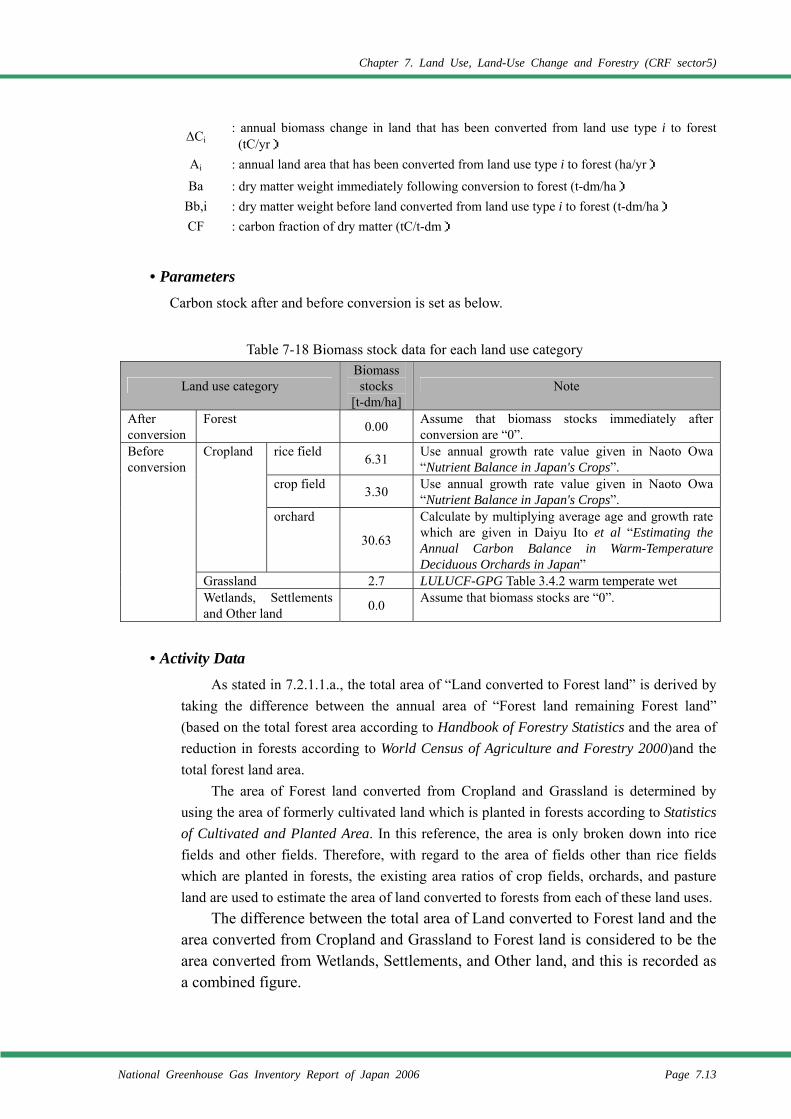
Chapter 7. Land Use, Land-Use Change and Forestry (CRF sector5)
National Greenhouse Gas Inventory Report of Japan 2006 Page 7.13
• Parameters
Carbon stock after and before conversion is set as below.
Table 7-18 Biomass stock data for each land use category
Land use category Biomass stocks
[t-dm/ha]Note
After conversion
Forest 0.00 Assume that biomass stocks immediately after conversion are “0”.
rice field 6.31 Use annual growth rate value given in Naoto Owa “Nutrient Balance in Japan's Crops”.
crop field 3.30 Use annual growth rate value given in Naoto Owa “Nutrient Balance in Japan's Crops”.
Cropland
orchard
30.63
Calculate by multiplying average age and growth rate which are given in Daiyu Ito et al “Estimating the Annual Carbon Balance in Warm-Temperature Deciduous Orchards in Japan”
Grassland 2.7 LULUCF-GPG Table 3.4.2 warm temperate wet
Before conversion
Wetlands, Settlements and Other land 0.0 Assume that biomass stocks are “0”.
• Activity Data
As stated in 7.2.1.1.a., the total area of “Land converted to Forest land” is derived by taking the difference between the annual area of “Forest land remaining Forest land” (based on the total forest area according to Handbook of Forestry Statistics and the area of reduction in forests according to World Census of Agriculture and Forestry 2000)and the total forest land area.
The area of Forest land converted from Cropland and Grassland is determined by using the area of formerly cultivated land which is planted in forests according to Statistics of Cultivated and Planted Area. In this reference, the area is only broken down into rice fields and other fields. Therefore, with regard to the area of fields other than rice fields which are planted in forests, the existing area ratios of crop fields, orchards, and pasture land are used to estimate the area of land converted to forests from each of these land uses.
The difference between the total area of Land converted to Forest land and the area converted from Cropland and Grassland to Forest land is considered to be the area converted from Wetlands, Settlements, and Other land, and this is recorded as a combined figure.
∆Ci : annual biomass change in land that has been converted from land use type i to forest (tC/yr)
Ai : annual land area that has been converted from land use type i to forest (ha/yr) Ba : dry matter weight immediately following conversion to forest (t-dm/ha)
Bb,i : dry matter weight before land converted from land use type i to forest (t-dm/ha) CF : carbon fraction of dry matter (tC/t-dm)
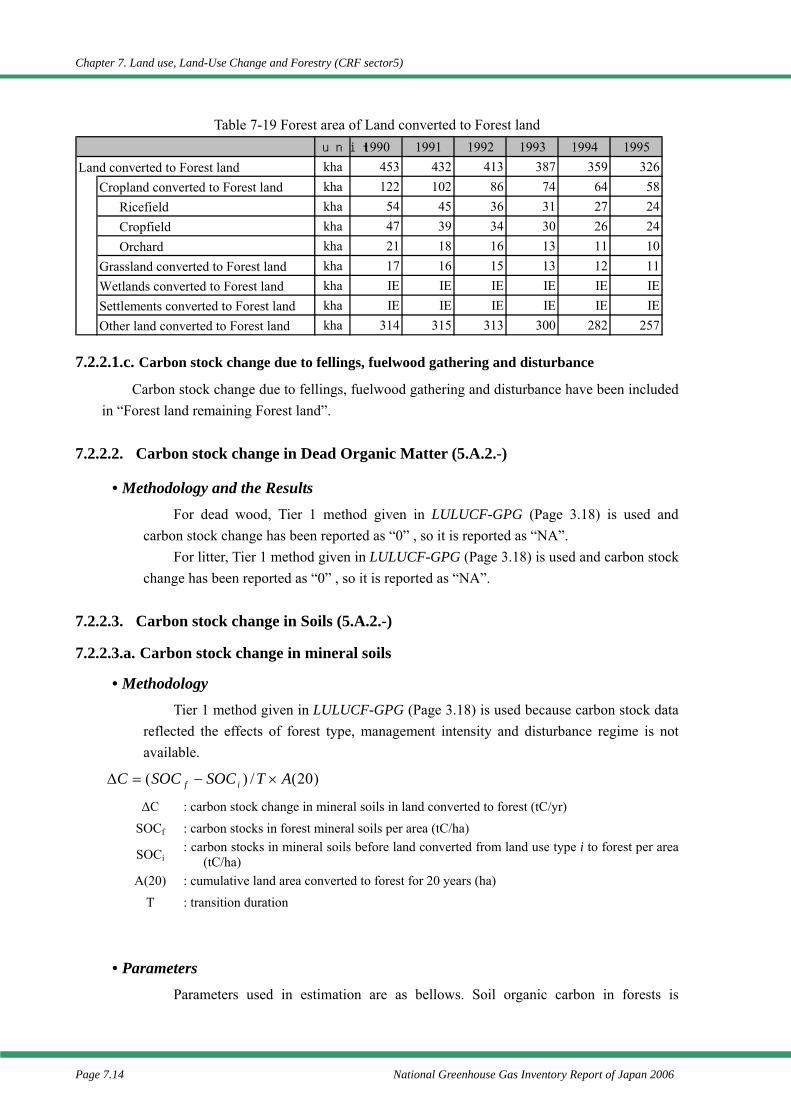
Chapter 7. Land use, Land-Use Change and Forestry (CRF sector5)
Page 7.14 National Greenhouse Gas Inventory Report of Japan 2006
Table 7-19 Forest area of Land converted to Forest land
7.2.2.1.c. Carbon stock change due to fellings, fuelwood gathering and disturbance
Carbon stock change due to fellings, fuelwood gathering and disturbance have been included in “Forest land remaining Forest land”.
7.2.2.2. Carbon stock change in Dead Organic Matter (5.A.2.-)
• Methodology and the Results For dead wood, Tier 1 method given in LULUCF-GPG (Page 3.18) is used and
carbon stock change has been reported as “0” , so it is reported as “NA”. For litter, Tier 1 method given in LULUCF-GPG (Page 3.18) is used and carbon stock
change has been reported as “0” , so it is reported as “NA”.
7.2.2.3. Carbon stock change in Soils (5.A.2.-)
7.2.2.3.a. Carbon stock change in mineral soils
• Methodology Tier 1 method given in LULUCF-GPG (Page 3.18) is used because carbon stock data
reflected the effects of forest type, management intensity and disturbance regime is not available.
• Parameters Parameters used in estimation are as bellows. Soil organic carbon in forests is
∆C : carbon stock change in mineral soils in land converted to forest (tC/yr) SOCf : carbon stocks in forest mineral soils per area (tC/ha)
SOCi : carbon stocks in mineral soils before land converted from land use type i to forest per area
(tC/ha) A(20) : cumulative land area converted to forest for 20 years (ha)
T : transition duration
)20(/)( ATSOCSOCC if ×−=∆
unit 1990 1991 1992 1993 1994 1995Land converted to Forest land kha 453 432 413 387 359 326
Cropland converted to Forest land kha 122 102 86 74 64 58 Ricefield kha 54 45 36 31 27 24 Cropfield kha 47 39 34 30 26 24 Orchard kha 21 18 16 13 11 10Grassland converted to Forest land kha 17 16 15 13 12 11Wetlands converted to Forest land kha IE IE IE IE IE IESettlements converted to Forest land kha IE IE IE IE IE IEOther land converted to Forest land kha 314 315 313 300 282 257
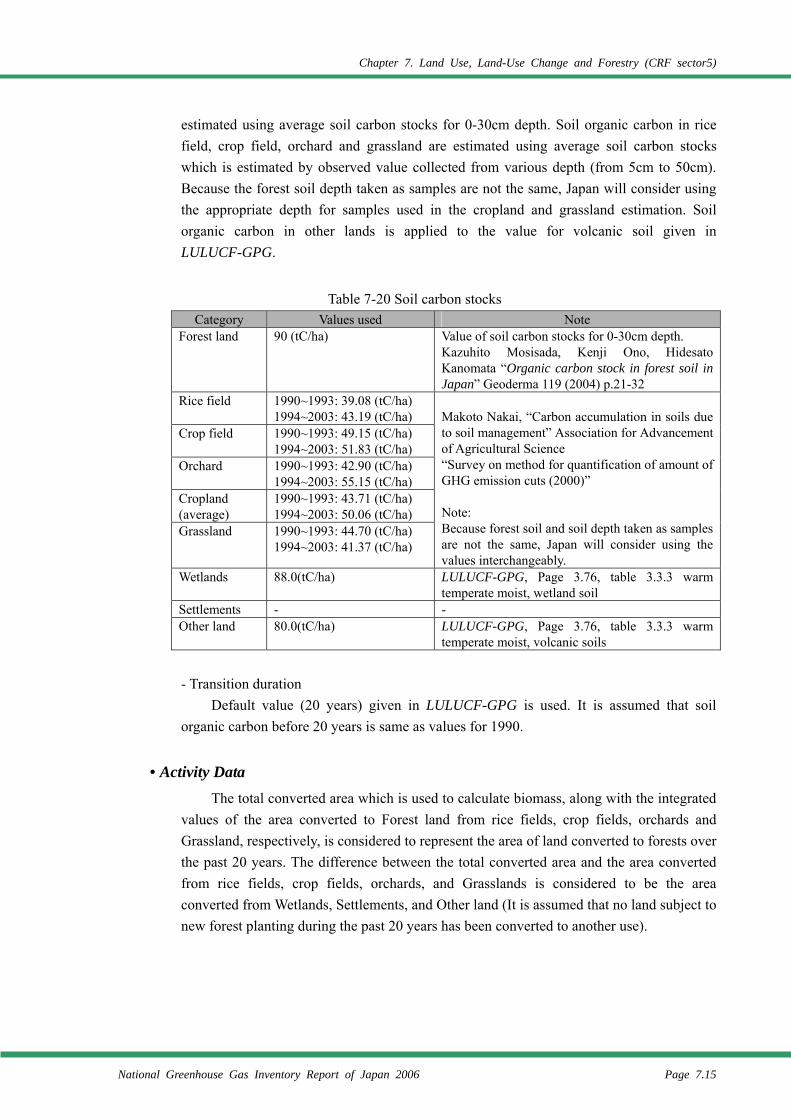
Chapter 7. Land Use, Land-Use Change and Forestry (CRF sector5)
National Greenhouse Gas Inventory Report of Japan 2006 Page 7.15
estimated using average soil carbon stocks for 0-30cm depth. Soil organic carbon in rice field, crop field, orchard and grassland are estimated using average soil carbon stocks which is estimated by observed value collected from various depth (from 5cm to 50cm). Because the forest soil depth taken as samples are not the same, Japan will consider using the appropriate depth for samples used in the cropland and grassland estimation. Soil organic carbon in other lands is applied to the value for volcanic soil given in LULUCF-GPG.
Table 7-20 Soil carbon stocks
Category Values used Note Forest land 90 (tC/ha) Value of soil carbon stocks for 0-30cm depth.
Kazuhito Mosisada, Kenji Ono, Hidesato Kanomata “Organic carbon stock in forest soil in Japan” Geoderma 119 (2004) p.21-32
Rice field 1990~1993: 39.08 (tC/ha) 1994~2003: 43.19 (tC/ha)
Crop field 1990~1993: 49.15 (tC/ha) 1994~2003: 51.83 (tC/ha)
Orchard 1990~1993: 42.90 (tC/ha) 1994~2003: 55.15 (tC/ha)
Cropland (average)
1990~1993: 43.71 (tC/ha) 1994~2003: 50.06 (tC/ha)
Grassland 1990~1993: 44.70 (tC/ha) 1994~2003: 41.37 (tC/ha)
Makoto Nakai, “Carbon accumulation in soils due to soil management” Association for Advancement of Agricultural Science “Survey on method for quantification of amount of GHG emission cuts (2000)” Note: Because forest soil and soil depth taken as samples are not the same, Japan will consider using the values interchangeably.
Wetlands 88.0(tC/ha) LULUCF-GPG, Page 3.76, table 3.3.3 warm temperate moist, wetland soil
Settlements - - Other land 80.0(tC/ha) LULUCF-GPG, Page 3.76, table 3.3.3 warm
temperate moist, volcanic soils
- Transition duration Default value (20 years) given in LULUCF-GPG is used. It is assumed that soil
organic carbon before 20 years is same as values for 1990.
• Activity Data The total converted area which is used to calculate biomass, along with the integrated
values of the area converted to Forest land from rice fields, crop fields, orchards and Grassland, respectively, is considered to represent the area of land converted to forests over the past 20 years. The difference between the total converted area and the area converted from rice fields, crop fields, orchards, and Grasslands is considered to be the area converted from Wetlands, Settlements, and Other land (It is assumed that no land subject to new forest planting during the past 20 years has been converted to another use).
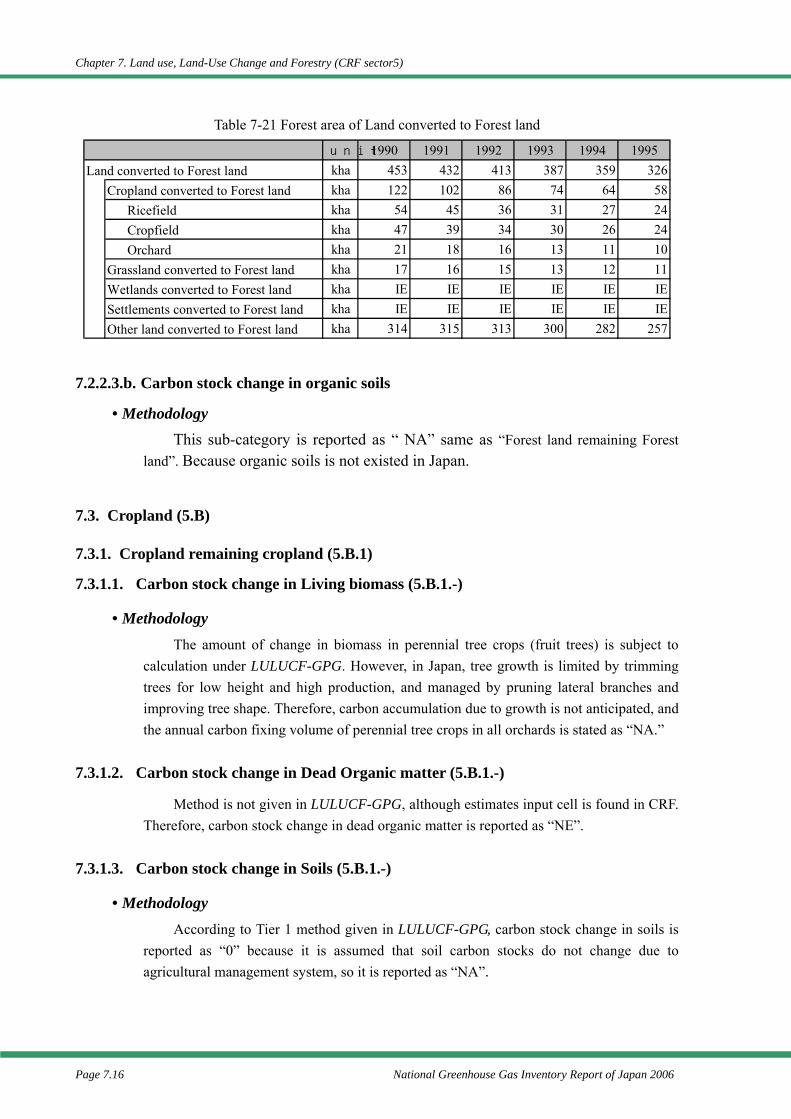
Chapter 7. Land use, Land-Use Change and Forestry (CRF sector5)
Page 7.16 National Greenhouse Gas Inventory Report of Japan 2006
Table 7-21 Forest area of Land converted to Forest land 7.2.2.3.b. Carbon stock change in organic soils
• Methodology This sub-category is reported as “ NA” same as “Forest land remaining Forest
land”. Because organic soils is not existed in Japan.
7.3. Cropland (5.B)
7.3.1. Cropland remaining cropland (5.B.1)
7.3.1.1. Carbon stock change in Living biomass (5.B.1.-)
• Methodology The amount of change in biomass in perennial tree crops (fruit trees) is subject to
calculation under LULUCF-GPG. However, in Japan, tree growth is limited by trimming trees for low height and high production, and managed by pruning lateral branches and improving tree shape. Therefore, carbon accumulation due to growth is not anticipated, and the annual carbon fixing volume of perennial tree crops in all orchards is stated as “NA.”
7.3.1.2. Carbon stock change in Dead Organic matter (5.B.1.-)
Method is not given in LULUCF-GPG, although estimates input cell is found in CRF. Therefore, carbon stock change in dead organic matter is reported as “NE”.
7.3.1.3. Carbon stock change in Soils (5.B.1.-)
• Methodology According to Tier 1 method given in LULUCF-GPG, carbon stock change in soils is
reported as “0” because it is assumed that soil carbon stocks do not change due to agricultural management system, so it is reported as “NA”.
unit 1990 1991 1992 1993 1994 1995Land converted to Forest land kha 453 432 413 387 359 326
Cropland converted to Forest land kha 122 102 86 74 64 58 Ricefield kha 54 45 36 31 27 24 Cropfield kha 47 39 34 30 26 24 Orchard kha 21 18 16 13 11 10Grassland converted to Forest land kha 17 16 15 13 12 11Wetlands converted to Forest land kha IE IE IE IE IE IESettlements converted to Forest land kha IE IE IE IE IE IEOther land converted to Forest land kha 314 315 313 300 282 257
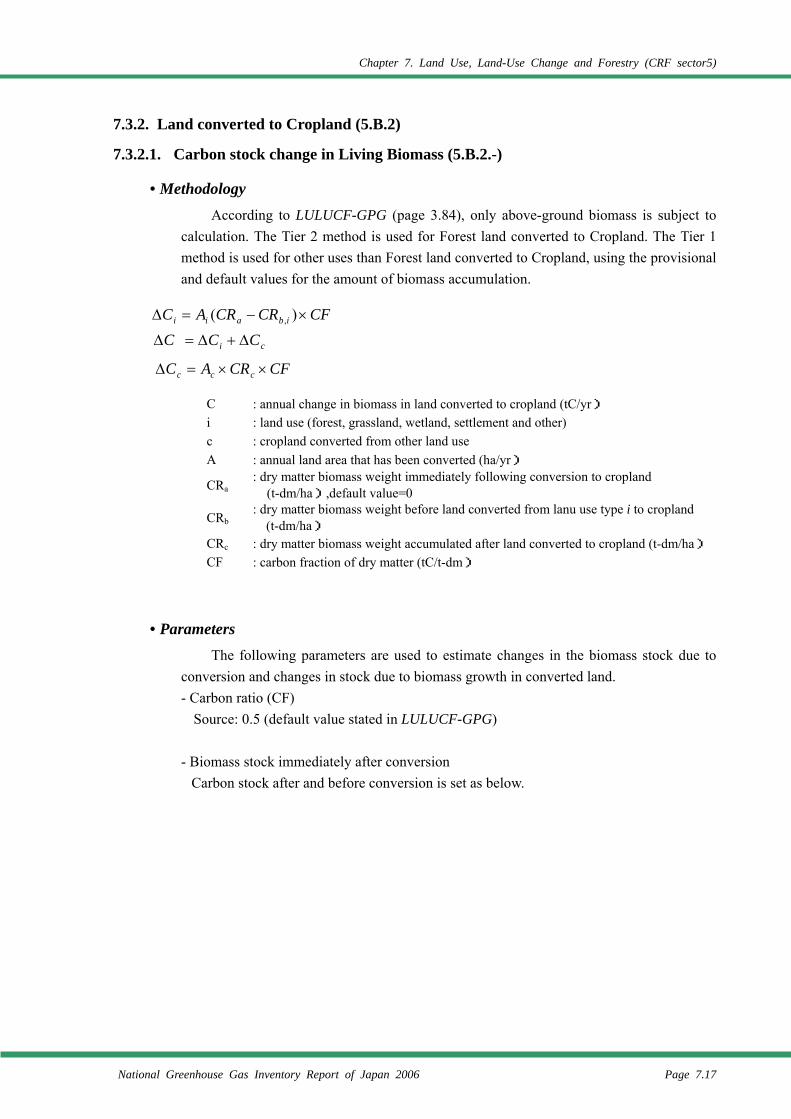
Chapter 7. Land Use, Land-Use Change and Forestry (CRF sector5)
National Greenhouse Gas Inventory Report of Japan 2006 Page 7.17
7.3.2. Land converted to Cropland (5.B.2)
7.3.2.1. Carbon stock change in Living Biomass (5.B.2.-)
• Methodology According to LULUCF-GPG (page 3.84), only above-ground biomass is subject to
calculation. The Tier 2 method is used for Forest land converted to Cropland. The Tier 1 method is used for other uses than Forest land converted to Cropland, using the provisional and default values for the amount of biomass accumulation.
C : annual change in biomass in land converted to cropland (tC/yr) i : land use (forest, grassland, wetland, settlement and other) c : cropland converted from other land use A : annual land area that has been converted (ha/yr)
CRa : dry matter biomass weight immediately following conversion to cropland
(t-dm/ha),default value=0
CRb : dry matter biomass weight before land converted from lanu use type i to cropland
(t-dm/ha) CRc : dry matter biomass weight accumulated after land converted to cropland (t-dm/ha) CF : carbon fraction of dry matter (tC/t-dm)
• Parameters
The following parameters are used to estimate changes in the biomass stock due to conversion and changes in stock due to biomass growth in converted land. - Carbon ratio (CF)
Source: 0.5 (default value stated in LULUCF-GPG)
- Biomass stock immediately after conversion Carbon stock after and before conversion is set as below.
CFCRCRAC ibaii ×−=∆ )( ,
ci CCC ∆+∆=∆
CFCRAC ccc ××=∆
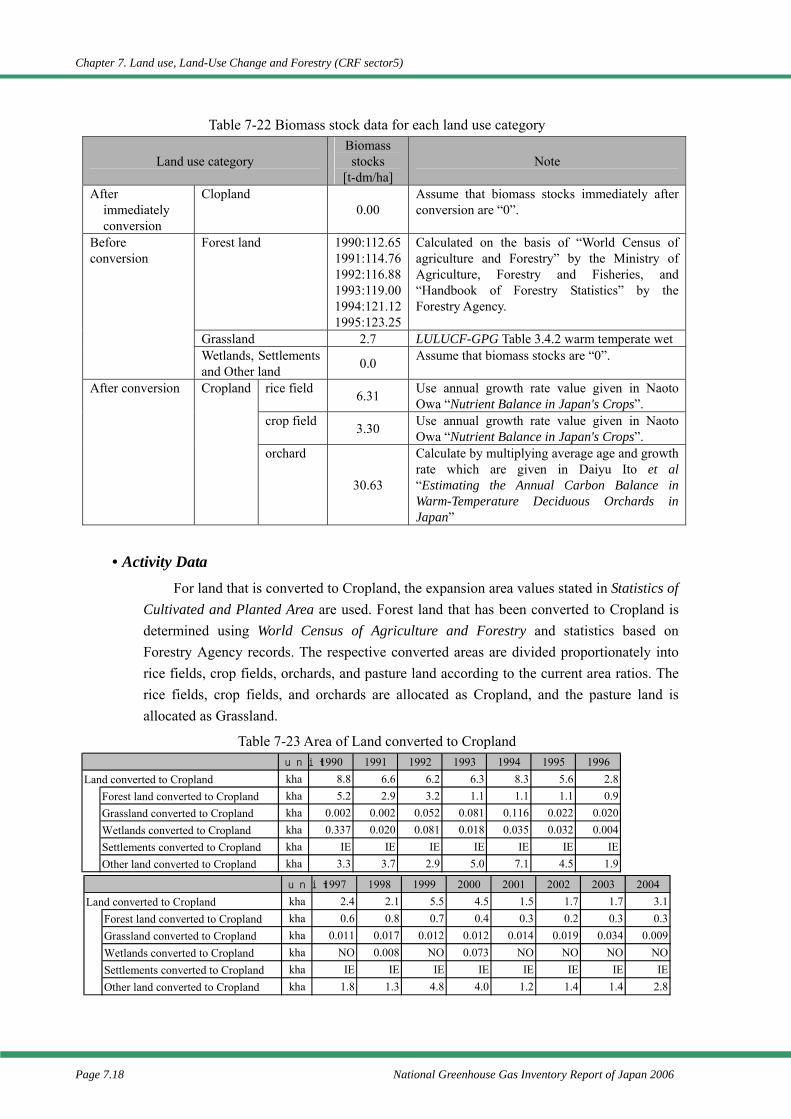
Chapter 7. Land use, Land-Use Change and Forestry (CRF sector5)
Page 7.18 National Greenhouse Gas Inventory Report of Japan 2006
Table 7-22 Biomass stock data for each land use category
Land use category Biomass stocks
[t-dm/ha] Note
After immediately conversion
Clopland 0.00
Assume that biomass stocks immediately after conversion are “0”.
Forest land 1990:112.651991:114.761992:116.881993:119.001994:121.121995:123.25
Calculated on the basis of “World Census of agriculture and Forestry” by the Ministry of Agriculture, Forestry and Fisheries, and “Handbook of Forestry Statistics” by the Forestry Agency.
Grassland 2.7 LULUCF-GPG Table 3.4.2 warm temperate wet
Before conversion
Wetlands, Settlements and Other land 0.0 Assume that biomass stocks are “0”.
rice field 6.31 Use annual growth rate value given in Naoto Owa “Nutrient Balance in Japan's Crops”.
crop field 3.30 Use annual growth rate value given in Naoto Owa “Nutrient Balance in Japan's Crops”.
After conversion Cropland
orchard
30.63
Calculate by multiplying average age and growth rate which are given in Daiyu Ito et al “Estimating the Annual Carbon Balance in Warm-Temperature Deciduous Orchards in Japan”
• Activity Data
For land that is converted to Cropland, the expansion area values stated in Statistics of Cultivated and Planted Area are used. Forest land that has been converted to Cropland is determined using World Census of Agriculture and Forestry and statistics based on Forestry Agency records. The respective converted areas are divided proportionately into rice fields, crop fields, orchards, and pasture land according to the current area ratios. The rice fields, crop fields, and orchards are allocated as Cropland, and the pasture land is allocated as Grassland.
Table 7-23 Area of Land converted to Cropland
unit 1990 1991 1992 1993 1994 1995 1996Land converted to Cropland kha 8.8 6.6 6.2 6.3 8.3 5.6 2.8
Forest land converted to Cropland kha 5.2 2.9 3.2 1.1 1.1 1.1 0.9Grassland converted to Cropland kha 0.002 0.002 0.052 0.081 0.116 0.022 0.020Wetlands converted to Cropland kha 0.337 0.020 0.081 0.018 0.035 0.032 0.004Settlements converted to Cropland kha IE IE IE IE IE IE IEOther land converted to Cropland kha 3.3 3.7 2.9 5.0 7.1 4.5 1.9
unit 1997 1998 1999 2000 2001 2002 2003 2004Land converted to Cropland kha 2.4 2.1 5.5 4.5 1.5 1.7 1.7 3.1
Forest land converted to Cropland kha 0.6 0.8 0.7 0.4 0.3 0.2 0.3 0.3Grassland converted to Cropland kha 0.011 0.017 0.012 0.012 0.014 0.019 0.034 0.009Wetlands converted to Cropland kha NO 0.008 NO 0.073 NO NO NO NOSettlements converted to Cropland kha IE IE IE IE IE IE IE IEOther land converted to Cropland kha 1.8 1.3 4.8 4.0 1.2 1.4 1.4 2.8
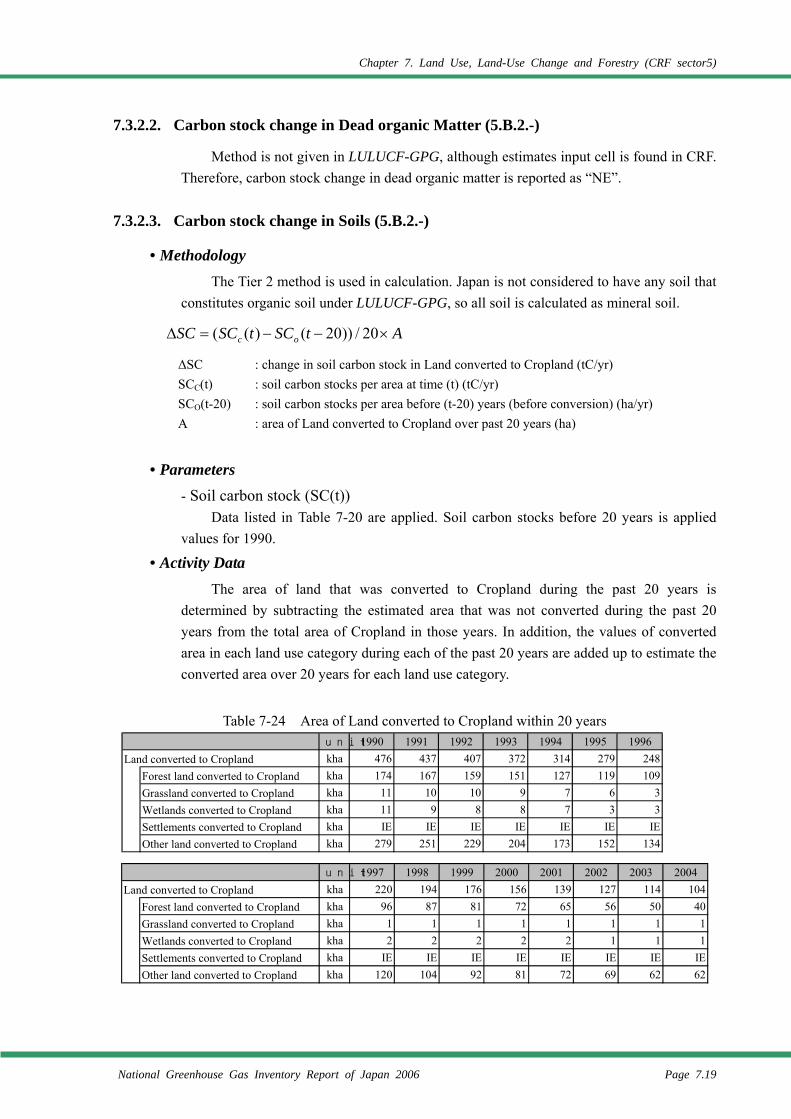
Chapter 7. Land Use, Land-Use Change and Forestry (CRF sector5)
National Greenhouse Gas Inventory Report of Japan 2006 Page 7.19
7.3.2.2. Carbon stock change in Dead organic Matter (5.B.2.-)
Method is not given in LULUCF-GPG, although estimates input cell is found in CRF. Therefore, carbon stock change in dead organic matter is reported as “NE”.
7.3.2.3. Carbon stock change in Soils (5.B.2.-)
• Methodology The Tier 2 method is used in calculation. Japan is not considered to have any soil that
constitutes organic soil under LULUCF-GPG, so all soil is calculated as mineral soil.
∆SC : change in soil carbon stock in Land converted to Cropland (tC/yr) SCC(t) : soil carbon stocks per area at time (t) (tC/yr) SCO(t-20) : soil carbon stocks per area before (t-20) years (before conversion) (ha/yr) A : area of Land converted to Cropland over past 20 years (ha)
• Parameters
- Soil carbon stock (SC(t)) Data listed in Table 7-20 are applied. Soil carbon stocks before 20 years is applied
values for 1990.
• Activity Data The area of land that was converted to Cropland during the past 20 years is
determined by subtracting the estimated area that was not converted during the past 20 years from the total area of Cropland in those years. In addition, the values of converted area in each land use category during each of the past 20 years are added up to estimate the converted area over 20 years for each land use category.
Table 7-24 Area of Land converted to Cropland within 20 years
AtSCtSCSC oc ×−−=∆ 20/))20()((
unit 1990 1991 1992 1993 1994 1995 1996Land converted to Cropland kha 476 437 407 372 314 279 248
Forest land converted to Cropland kha 174 167 159 151 127 119 109Grassland converted to Cropland kha 11 10 10 9 7 6 3Wetlands converted to Cropland kha 11 9 8 8 7 3 3Settlements converted to Cropland kha IE IE IE IE IE IE IEOther land converted to Cropland kha 279 251 229 204 173 152 134
unit 1997 1998 1999 2000 2001 2002 2003 2004Land converted to Cropland kha 220 194 176 156 139 127 114 104
Forest land converted to Cropland kha 96 87 81 72 65 56 50 40Grassland converted to Cropland kha 1 1 1 1 1 1 1 1Wetlands converted to Cropland kha 2 2 2 2 2 1 1 1Settlements converted to Cropland kha IE IE IE IE IE IE IE IEOther land converted to Cropland kha 120 104 92 81 72 69 62 62
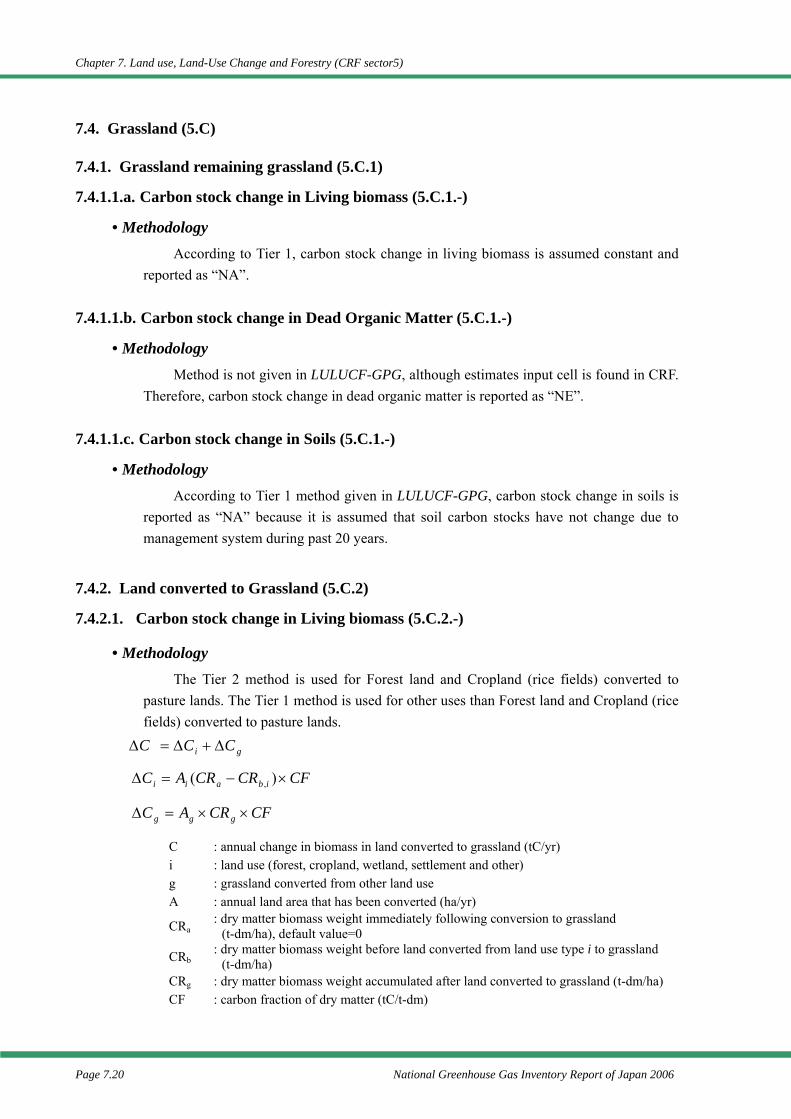
Chapter 7. Land use, Land-Use Change and Forestry (CRF sector5)
Page 7.20 National Greenhouse Gas Inventory Report of Japan 2006
7.4. Grassland (5.C)
7.4.1. Grassland remaining grassland (5.C.1)
7.4.1.1.a. Carbon stock change in Living biomass (5.C.1.-)
• Methodology According to Tier 1, carbon stock change in living biomass is assumed constant and
reported as “NA”.
7.4.1.1.b. Carbon stock change in Dead Organic Matter (5.C.1.-)
• Methodology Method is not given in LULUCF-GPG, although estimates input cell is found in CRF.
Therefore, carbon stock change in dead organic matter is reported as “NE”.
7.4.1.1.c. Carbon stock change in Soils (5.C.1.-)
• Methodology According to Tier 1 method given in LULUCF-GPG, carbon stock change in soils is
reported as “NA” because it is assumed that soil carbon stocks have not change due to management system during past 20 years.
7.4.2. Land converted to Grassland (5.C.2)
7.4.2.1. Carbon stock change in Living biomass (5.C.2.-)
• Methodology The Tier 2 method is used for Forest land and Cropland (rice fields) converted to
pasture lands. The Tier 1 method is used for other uses than Forest land and Cropland (rice fields) converted to pasture lands.
C : annual change in biomass in land converted to grassland (tC/yr) i : land use (forest, cropland, wetland, settlement and other) g : grassland converted from other land use A : annual land area that has been converted (ha/yr)
CRa : dry matter biomass weight immediately following conversion to grassland
(t-dm/ha), default value=0
CRb : dry matter biomass weight before land converted from land use type i to grassland
(t-dm/ha) CRg : dry matter biomass weight accumulated after land converted to grassland (t-dm/ha) CF : carbon fraction of dry matter (tC/t-dm)
gi CCC ∆+∆=∆
CFCRCRAC ibaii ×−=∆ )( ,
CFCRAC ggg ××=∆
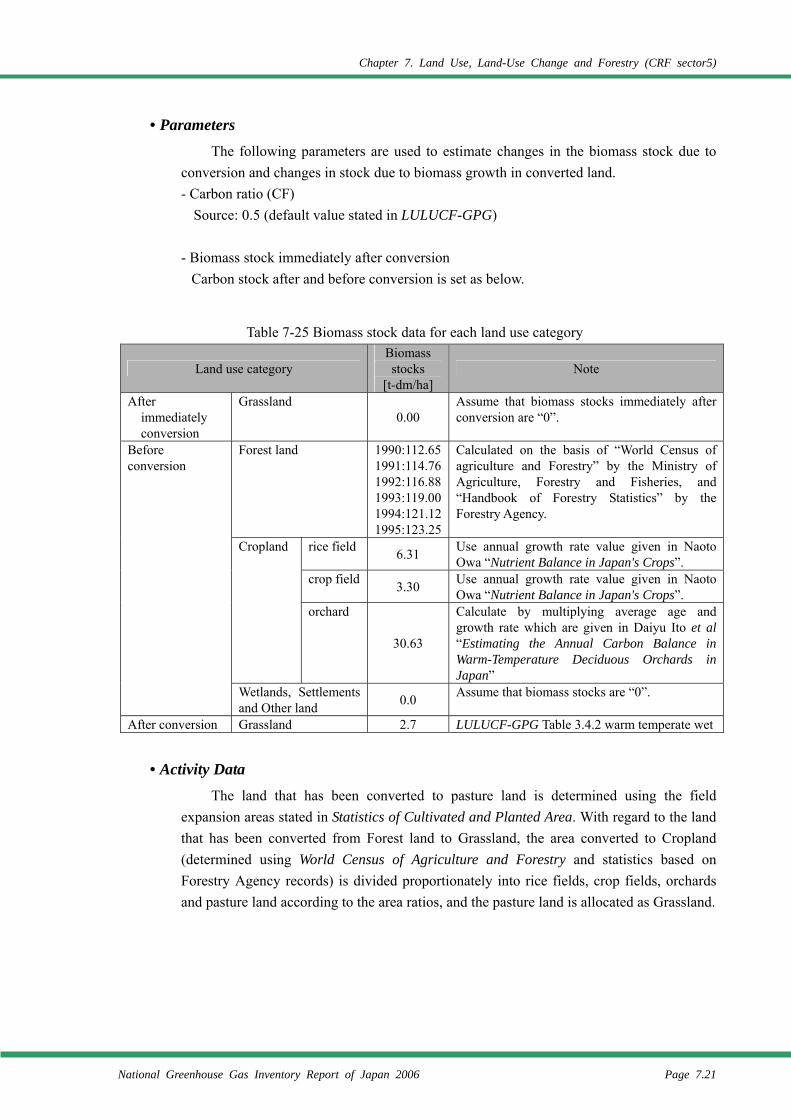
Chapter 7. Land Use, Land-Use Change and Forestry (CRF sector5)
National Greenhouse Gas Inventory Report of Japan 2006 Page 7.21
• Parameters The following parameters are used to estimate changes in the biomass stock due to
conversion and changes in stock due to biomass growth in converted land. - Carbon ratio (CF)
Source: 0.5 (default value stated in LULUCF-GPG)
- Biomass stock immediately after conversion Carbon stock after and before conversion is set as below.
Table 7-25 Biomass stock data for each land use category
Land use category Biomass stocks
[t-dm/ha] Note
After immediately conversion
Grassland 0.00
Assume that biomass stocks immediately after conversion are “0”.
Forest land 1990:112.651991:114.761992:116.881993:119.001994:121.121995:123.25
Calculated on the basis of “World Census of agriculture and Forestry” by the Ministry of Agriculture, Forestry and Fisheries, and “Handbook of Forestry Statistics” by the Forestry Agency.
rice field 6.31 Use annual growth rate value given in Naoto Owa “Nutrient Balance in Japan's Crops”.
crop field 3.30 Use annual growth rate value given in Naoto Owa “Nutrient Balance in Japan's Crops”.
Cropland
orchard
30.63
Calculate by multiplying average age and growth rate which are given in Daiyu Ito et al “Estimating the Annual Carbon Balance in Warm-Temperature Deciduous Orchards in Japan”
Before conversion
Wetlands, Settlements and Other land 0.0 Assume that biomass stocks are “0”.
After conversion Grassland 2.7 LULUCF-GPG Table 3.4.2 warm temperate wet
• Activity Data The land that has been converted to pasture land is determined using the field
expansion areas stated in Statistics of Cultivated and Planted Area. With regard to the land that has been converted from Forest land to Grassland, the area converted to Cropland (determined using World Census of Agriculture and Forestry and statistics based on Forestry Agency records) is divided proportionately into rice fields, crop fields, orchards and pasture land according to the area ratios, and the pasture land is allocated as Grassland.
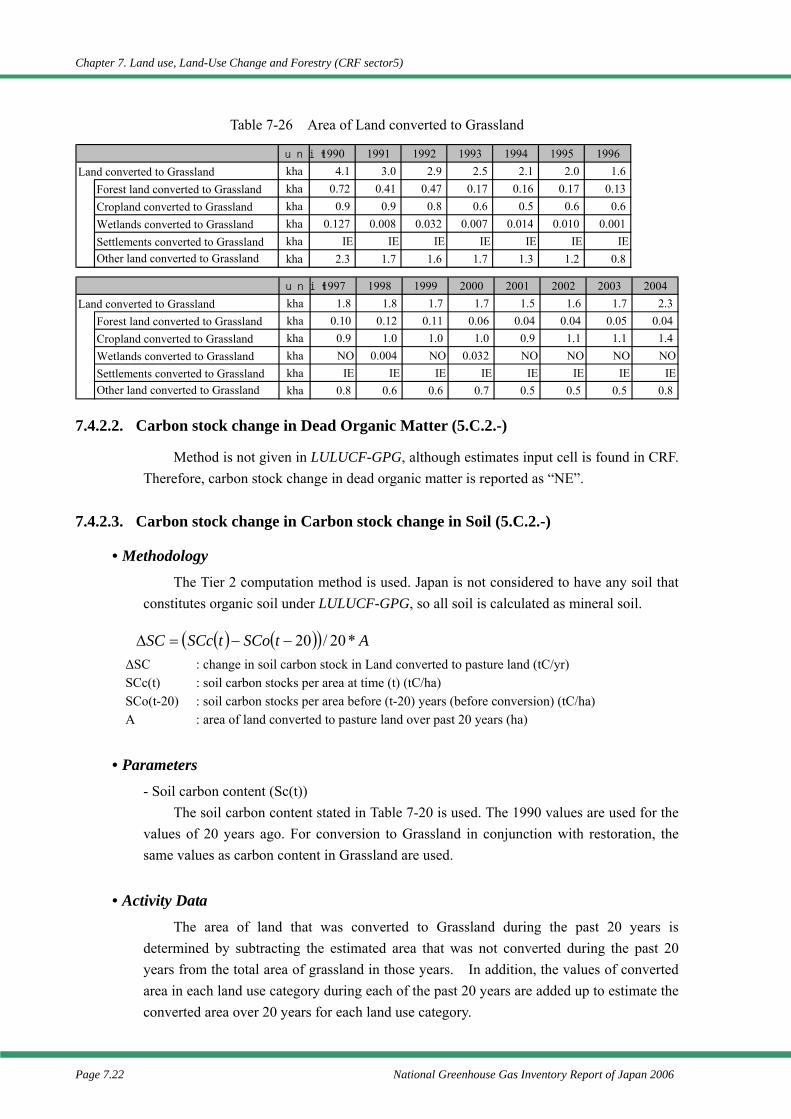
Chapter 7. Land use, Land-Use Change and Forestry (CRF sector5)
Page 7.22 National Greenhouse Gas Inventory Report of Japan 2006
Table 7-26 Area of Land converted to Grassland 7.4.2.2. Carbon stock change in Dead Organic Matter (5.C.2.-)
Method is not given in LULUCF-GPG, although estimates input cell is found in CRF. Therefore, carbon stock change in dead organic matter is reported as “NE”.
7.4.2.3. Carbon stock change in Carbon stock change in Soil (5.C.2.-)
• Methodology The Tier 2 computation method is used. Japan is not considered to have any soil that
constitutes organic soil under LULUCF-GPG, so all soil is calculated as mineral soil.
∆SC : change in soil carbon stock in Land converted to pasture land (tC/yr) SCc(t) : soil carbon stocks per area at time (t) (tC/ha) SCo(t-20) : soil carbon stocks per area before (t-20) years (before conversion) (tC/ha) A : area of land converted to pasture land over past 20 years (ha)
• Parameters
- Soil carbon content (Sc(t)) The soil carbon content stated in Table 7-20 is used. The 1990 values are used for the
values of 20 years ago. For conversion to Grassland in conjunction with restoration, the same values as carbon content in Grassland are used.
• Activity Data
The area of land that was converted to Grassland during the past 20 years is determined by subtracting the estimated area that was not converted during the past 20 years from the total area of grassland in those years. In addition, the values of converted area in each land use category during each of the past 20 years are added up to estimate the converted area over 20 years for each land use category.
( ) ( )( ) AtSCotSCcSC *20/20−−=∆
unit 1990 1991 1992 1993 1994 1995 1996Land converted to Grassland kha 4.1 3.0 2.9 2.5 2.1 2.0 1.6
Forest land converted to Grassland kha 0.72 0.41 0.47 0.17 0.16 0.17 0.13Cropland converted to Grassland kha 0.9 0.9 0.8 0.6 0.5 0.6 0.6Wetlands converted to Grassland kha 0.127 0.008 0.032 0.007 0.014 0.010 0.001Settlements converted to Grassland kha IE IE IE IE IE IE IEOther land converted to Grassland kha 2.3 1.7 1.6 1.7 1.3 1.2 0.8
unit 1997 1998 1999 2000 2001 2002 2003 2004Land converted to Grassland kha 1.8 1.8 1.7 1.7 1.5 1.6 1.7 2.3
Forest land converted to Grassland kha 0.10 0.12 0.11 0.06 0.04 0.04 0.05 0.04Cropland converted to Grassland kha 0.9 1.0 1.0 1.0 0.9 1.1 1.1 1.4Wetlands converted to Grassland kha NO 0.004 NO 0.032 NO NO NO NOSettlements converted to Grassland kha IE IE IE IE IE IE IE IEOther land converted to Grassland kha 0.8 0.6 0.6 0.7 0.5 0.5 0.5 0.8
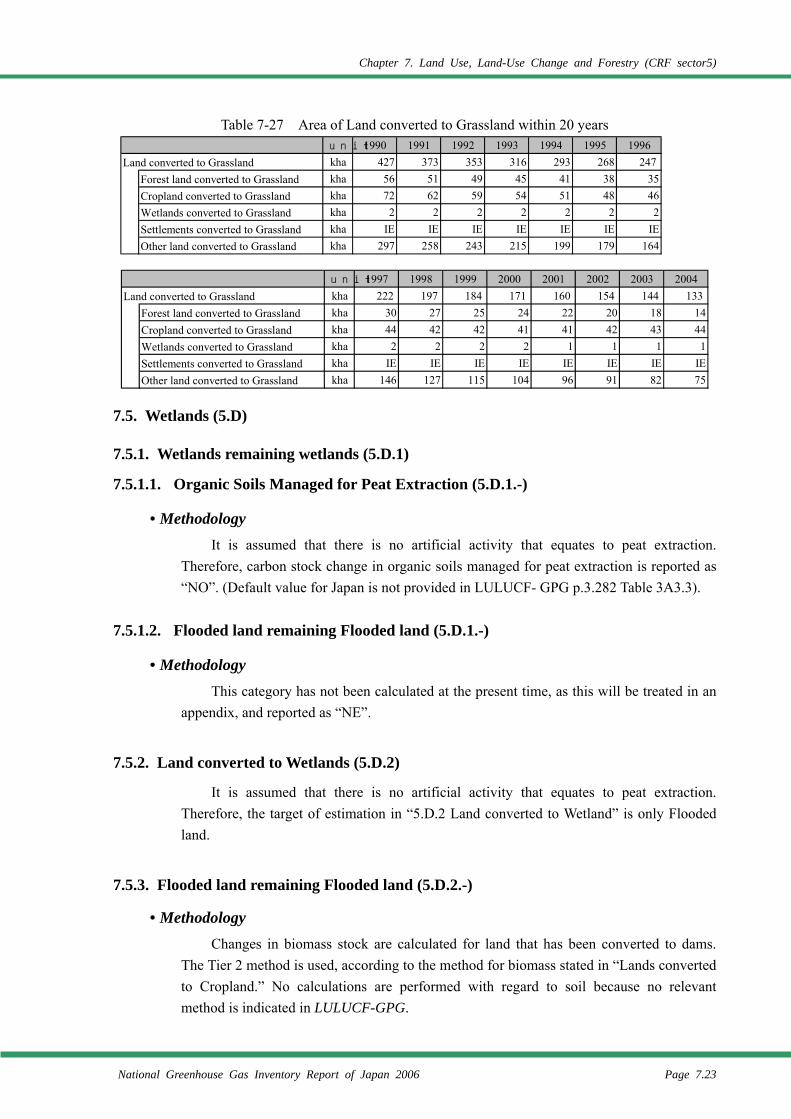
Chapter 7. Land Use, Land-Use Change and Forestry (CRF sector5)
National Greenhouse Gas Inventory Report of Japan 2006 Page 7.23
Table 7-27 Area of Land converted to Grassland within 20 years
7.5. Wetlands (5.D)
7.5.1. Wetlands remaining wetlands (5.D.1)
7.5.1.1. Organic Soils Managed for Peat Extraction (5.D.1.-)
• Methodology It is assumed that there is no artificial activity that equates to peat extraction.
Therefore, carbon stock change in organic soils managed for peat extraction is reported as “NO”. (Default value for Japan is not provided in LULUCF- GPG p.3.282 Table 3A3.3).
7.5.1.2. Flooded land remaining Flooded land (5.D.1.-)
• Methodology This category has not been calculated at the present time, as this will be treated in an
appendix, and reported as “NE”.
7.5.2. Land converted to Wetlands (5.D.2)
It is assumed that there is no artificial activity that equates to peat extraction. Therefore, the target of estimation in “5.D.2 Land converted to Wetland” is only Flooded land.
7.5.3. Flooded land remaining Flooded land (5.D.2.-)
• Methodology Changes in biomass stock are calculated for land that has been converted to dams.
The Tier 2 method is used, according to the method for biomass stated in “Lands converted to Cropland.” No calculations are performed with regard to soil because no relevant method is indicated in LULUCF-GPG.
unit 1990 1991 1992 1993 1994 1995 1996Land converted to Grassland kha 427 373 353 316 293 268 247
Forest land converted to Grassland kha 56 51 49 45 41 38 35Cropland converted to Grassland kha 72 62 59 54 51 48 46Wetlands converted to Grassland kha 2 2 2 2 2 2 2Settlements converted to Grassland kha IE IE IE IE IE IE IEOther land converted to Grassland kha 297 258 243 215 199 179 164
unit 1997 1998 1999 2000 2001 2002 2003 2004Land converted to Grassland kha 222 197 184 171 160 154 144 133
Forest land converted to Grassland kha 30 27 25 24 22 20 18 14Cropland converted to Grassland kha 44 42 42 41 41 42 43 44Wetlands converted to Grassland kha 2 2 2 2 1 1 1 1Settlements converted to Grassland kha IE IE IE IE IE IE IE IEOther land converted to Grassland kha 146 127 115 104 96 91 82 75
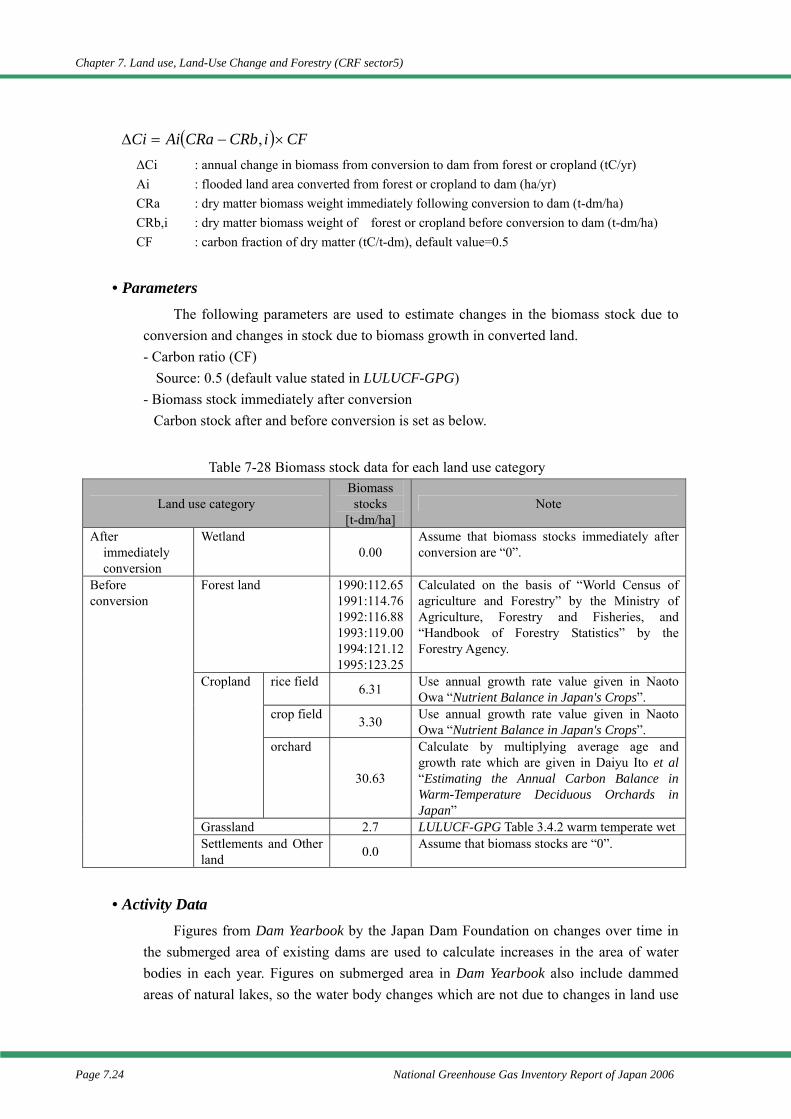
Chapter 7. Land use, Land-Use Change and Forestry (CRF sector5)
Page 7.24 National Greenhouse Gas Inventory Report of Japan 2006
∆Ci : annual change in biomass from conversion to dam from forest or cropland (tC/yr) Ai : flooded land area converted from forest or cropland to dam (ha/yr) CRa : dry matter biomass weight immediately following conversion to dam (t-dm/ha) CRb,i : dry matter biomass weight of forest or cropland before conversion to dam (t-dm/ha) CF : carbon fraction of dry matter (tC/t-dm), default value=0.5
• Parameters
The following parameters are used to estimate changes in the biomass stock due to conversion and changes in stock due to biomass growth in converted land. - Carbon ratio (CF)
Source: 0.5 (default value stated in LULUCF-GPG) - Biomass stock immediately after conversion
Carbon stock after and before conversion is set as below.
Table 7-28 Biomass stock data for each land use category
Land use category Biomass stocks
[t-dm/ha] Note
After immediately conversion
Wetland 0.00
Assume that biomass stocks immediately after conversion are “0”.
Forest land 1990:112.651991:114.761992:116.881993:119.001994:121.121995:123.25
Calculated on the basis of “World Census of agriculture and Forestry” by the Ministry of Agriculture, Forestry and Fisheries, and “Handbook of Forestry Statistics” by the Forestry Agency.
rice field 6.31 Use annual growth rate value given in Naoto Owa “Nutrient Balance in Japan's Crops”.
crop field 3.30 Use annual growth rate value given in Naoto Owa “Nutrient Balance in Japan's Crops”.
Cropland
orchard
30.63
Calculate by multiplying average age and growth rate which are given in Daiyu Ito et al “Estimating the Annual Carbon Balance in Warm-Temperature Deciduous Orchards in Japan”
Grassland 2.7 LULUCF-GPG Table 3.4.2 warm temperate wet
Before conversion
Settlements and Other land 0.0 Assume that biomass stocks are “0”.
• Activity Data
Figures from Dam Yearbook by the Japan Dam Foundation on changes over time in the submerged area of existing dams are used to calculate increases in the area of water bodies in each year. Figures on submerged area in Dam Yearbook also include dammed areas of natural lakes, so the water body changes which are not due to changes in land use
( ) CFiCRbCRaAiCi ×−=∆ ,
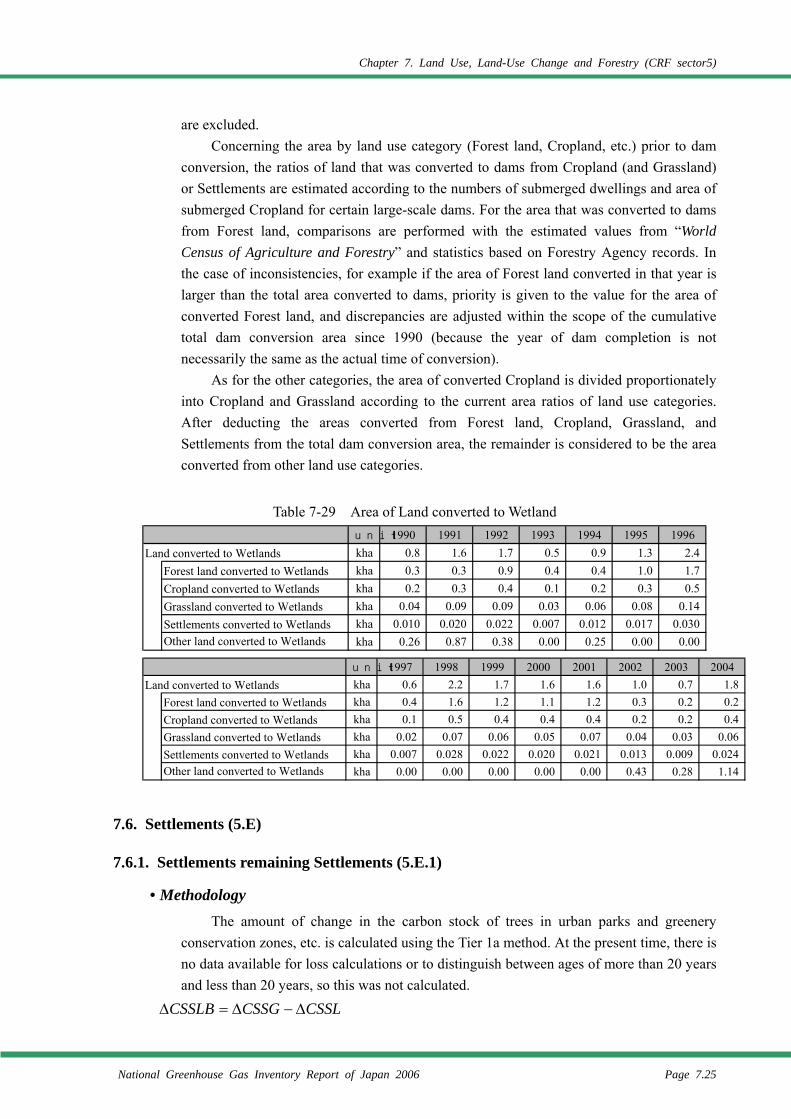
Chapter 7. Land Use, Land-Use Change and Forestry (CRF sector5)
National Greenhouse Gas Inventory Report of Japan 2006 Page 7.25
are excluded. Concerning the area by land use category (Forest land, Cropland, etc.) prior to dam
conversion, the ratios of land that was converted to dams from Cropland (and Grassland) or Settlements are estimated according to the numbers of submerged dwellings and area of submerged Cropland for certain large-scale dams. For the area that was converted to dams from Forest land, comparisons are performed with the estimated values from “World Census of Agriculture and Forestry” and statistics based on Forestry Agency records. In the case of inconsistencies, for example if the area of Forest land converted in that year is larger than the total area converted to dams, priority is given to the value for the area of converted Forest land, and discrepancies are adjusted within the scope of the cumulative total dam conversion area since 1990 (because the year of dam completion is not necessarily the same as the actual time of conversion).
As for the other categories, the area of converted Cropland is divided proportionately into Cropland and Grassland according to the current area ratios of land use categories. After deducting the areas converted from Forest land, Cropland, Grassland, and Settlements from the total dam conversion area, the remainder is considered to be the area converted from other land use categories.
Table 7-29 Area of Land converted to Wetland
7.6. Settlements (5.E)
7.6.1. Settlements remaining Settlements (5.E.1)
• Methodology The amount of change in the carbon stock of trees in urban parks and greenery
conservation zones, etc. is calculated using the Tier 1a method. At the present time, there is no data available for loss calculations or to distinguish between ages of more than 20 years and less than 20 years, so this was not calculated.
CSSLCSSGCSSLB ∆−∆=∆
unit 1997 1998 1999 2000 2001 2002 2003 2004Land converted to Wetlands kha 0.6 2.2 1.7 1.6 1.6 1.0 0.7 1.8
Forest land converted to Wetlands kha 0.4 1.6 1.2 1.1 1.2 0.3 0.2 0.2Cropland converted to Wetlands kha 0.1 0.5 0.4 0.4 0.4 0.2 0.2 0.4Grassland converted to Wetlands kha 0.02 0.07 0.06 0.05 0.07 0.04 0.03 0.06Settlements converted to Wetlands kha 0.007 0.028 0.022 0.020 0.021 0.013 0.009 0.024Other land converted to Wetlands kha 0.00 0.00 0.00 0.00 0.00 0.43 0.28 1.14
unit 1990 1991 1992 1993 1994 1995 1996Land converted to Wetlands kha 0.8 1.6 1.7 0.5 0.9 1.3 2.4
Forest land converted to Wetlands kha 0.3 0.3 0.9 0.4 0.4 1.0 1.7Cropland converted to Wetlands kha 0.2 0.3 0.4 0.1 0.2 0.3 0.5Grassland converted to Wetlands kha 0.04 0.09 0.09 0.03 0.06 0.08 0.14Settlements converted to Wetlands kha 0.010 0.020 0.022 0.007 0.012 0.017 0.030Other land converted to Wetlands kha 0.26 0.87 0.38 0.00 0.25 0.00 0.00
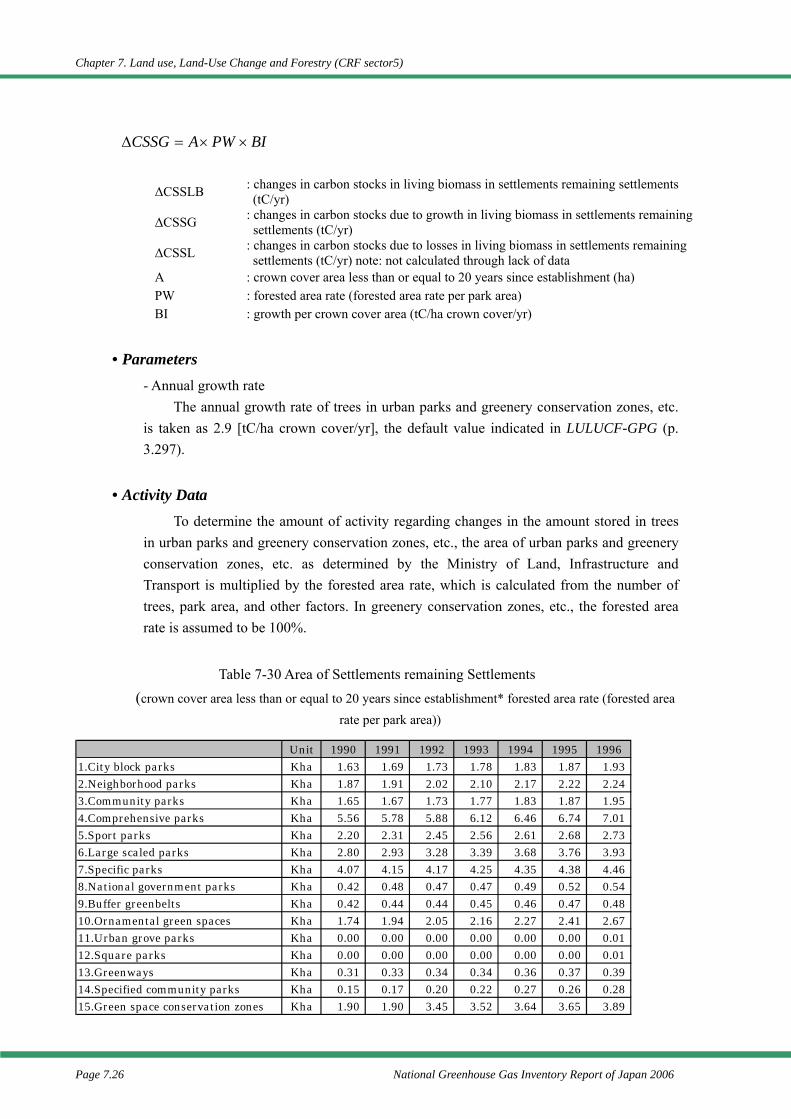
Chapter 7. Land use, Land-Use Change and Forestry (CRF sector5)
Page 7.26 National Greenhouse Gas Inventory Report of Japan 2006
∆CSSLB : changes in carbon stocks in living biomass in settlements remaining settlements (tC/yr)
∆CSSG : changes in carbon stocks due to growth in living biomass in settlements remaining settlements (tC/yr)
∆CSSL : changes in carbon stocks due to losses in living biomass in settlements remaining settlements (tC/yr) note: not calculated through lack of data
A : crown cover area less than or equal to 20 years since establishment (ha) PW : forested area rate (forested area rate per park area) BI : growth per crown cover area (tC/ha crown cover/yr)
• Parameters
- Annual growth rate The annual growth rate of trees in urban parks and greenery conservation zones, etc.
is taken as 2.9 [tC/ha crown cover/yr], the default value indicated in LULUCF-GPG (p. 3.297).
• Activity Data
To determine the amount of activity regarding changes in the amount stored in trees in urban parks and greenery conservation zones, etc., the area of urban parks and greenery conservation zones, etc. as determined by the Ministry of Land, Infrastructure and Transport is multiplied by the forested area rate, which is calculated from the number of trees, park area, and other factors. In greenery conservation zones, etc., the forested area rate is assumed to be 100%.
Table 7-30 Area of Settlements remaining Settlements
(crown cover area less than or equal to 20 years since establishment* forested area rate (forested area rate per park area))
BIPWACSSG ××=∆
Unit 1990 1991 1992 1993 1994 1995 19961.City block parks Kha 1.63 1.69 1.73 1.78 1.83 1.87 1.932.Neighborhood parks Kha 1.87 1.91 2.02 2.10 2.17 2.22 2.243.Community parks Kha 1.65 1.67 1.73 1.77 1.83 1.87 1.954.Comprehensive parks Kha 5.56 5.78 5.88 6.12 6.46 6.74 7.015.Sport parks Kha 2.20 2.31 2.45 2.56 2.61 2.68 2.736.Large scaled parks Kha 2.80 2.93 3.28 3.39 3.68 3.76 3.937.Specific parks Kha 4.07 4.15 4.17 4.25 4.35 4.38 4.468.National government parks Kha 0.42 0.48 0.47 0.47 0.49 0.52 0.549.Buffer greenbelts Kha 0.42 0.44 0.44 0.45 0.46 0.47 0.4810.Ornamental green spaces Kha 1.74 1.94 2.05 2.16 2.27 2.41 2.6711.Urban grove parks Kha 0.00 0.00 0.00 0.00 0.00 0.00 0.0112.Square parks Kha 0.00 0.00 0.00 0.00 0.00 0.00 0.0113.Greenways Kha 0.31 0.33 0.34 0.34 0.36 0.37 0.3914.Specified community parks Kha 0.15 0.17 0.20 0.22 0.27 0.26 0.2815.Green space conservation zones Kha 1.90 1.90 3.45 3.52 3.64 3.65 3.89
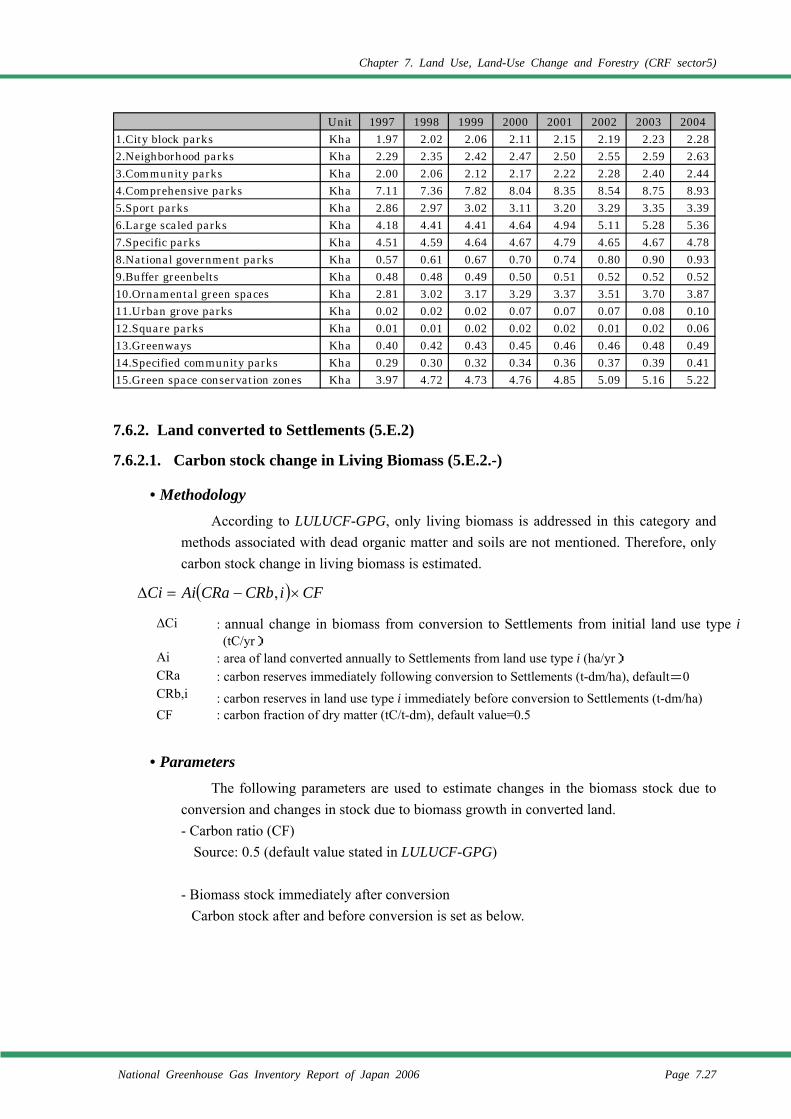
Chapter 7. Land Use, Land-Use Change and Forestry (CRF sector5)
National Greenhouse Gas Inventory Report of Japan 2006 Page 7.27
7.6.2. Land converted to Settlements (5.E.2)
7.6.2.1. Carbon stock change in Living Biomass (5.E.2.-)
• Methodology According to LULUCF-GPG, only living biomass is addressed in this category and
methods associated with dead organic matter and soils are not mentioned. Therefore, only carbon stock change in living biomass is estimated.
∆Ci : annual change in biomass from conversion to Settlements from initial land use type i(tC/yr)
Ai : area of land converted annually to Settlements from land use type i (ha/yr) CRa : carbon reserves immediately following conversion to Settlements (t-dm/ha), default=0 CRb,i : carbon reserves in land use type i immediately before conversion to Settlements (t-dm/ha) CF : carbon fraction of dry matter (tC/t-dm), default value=0.5
• Parameters
The following parameters are used to estimate changes in the biomass stock due to conversion and changes in stock due to biomass growth in converted land. - Carbon ratio (CF)
Source: 0.5 (default value stated in LULUCF-GPG)
- Biomass stock immediately after conversion Carbon stock after and before conversion is set as below.
( ) CFiCRbCRaAiCi ×−=∆ ,
Unit 1997 1998 1999 2000 2001 2002 2003 20041.City block parks Kha 1.97 2.02 2.06 2.11 2.15 2.19 2.23 2.282.Neighborhood parks Kha 2.29 2.35 2.42 2.47 2.50 2.55 2.59 2.633.Community parks Kha 2.00 2.06 2.12 2.17 2.22 2.28 2.40 2.444.Comprehensive parks Kha 7.11 7.36 7.82 8.04 8.35 8.54 8.75 8.935.Sport parks Kha 2.86 2.97 3.02 3.11 3.20 3.29 3.35 3.396.Large scaled parks Kha 4.18 4.41 4.41 4.64 4.94 5.11 5.28 5.367.Specific parks Kha 4.51 4.59 4.64 4.67 4.79 4.65 4.67 4.788.National government parks Kha 0.57 0.61 0.67 0.70 0.74 0.80 0.90 0.939.Buffer greenbelts Kha 0.48 0.48 0.49 0.50 0.51 0.52 0.52 0.5210.Ornamental green spaces Kha 2.81 3.02 3.17 3.29 3.37 3.51 3.70 3.8711.Urban grove parks Kha 0.02 0.02 0.02 0.07 0.07 0.07 0.08 0.1012.Square parks Kha 0.01 0.01 0.02 0.02 0.02 0.01 0.02 0.0613.Greenways Kha 0.40 0.42 0.43 0.45 0.46 0.46 0.48 0.4914.Specified community parks Kha 0.29 0.30 0.32 0.34 0.36 0.37 0.39 0.4115.Green space conservation zones Kha 3.97 4.72 4.73 4.76 4.85 5.09 5.16 5.22
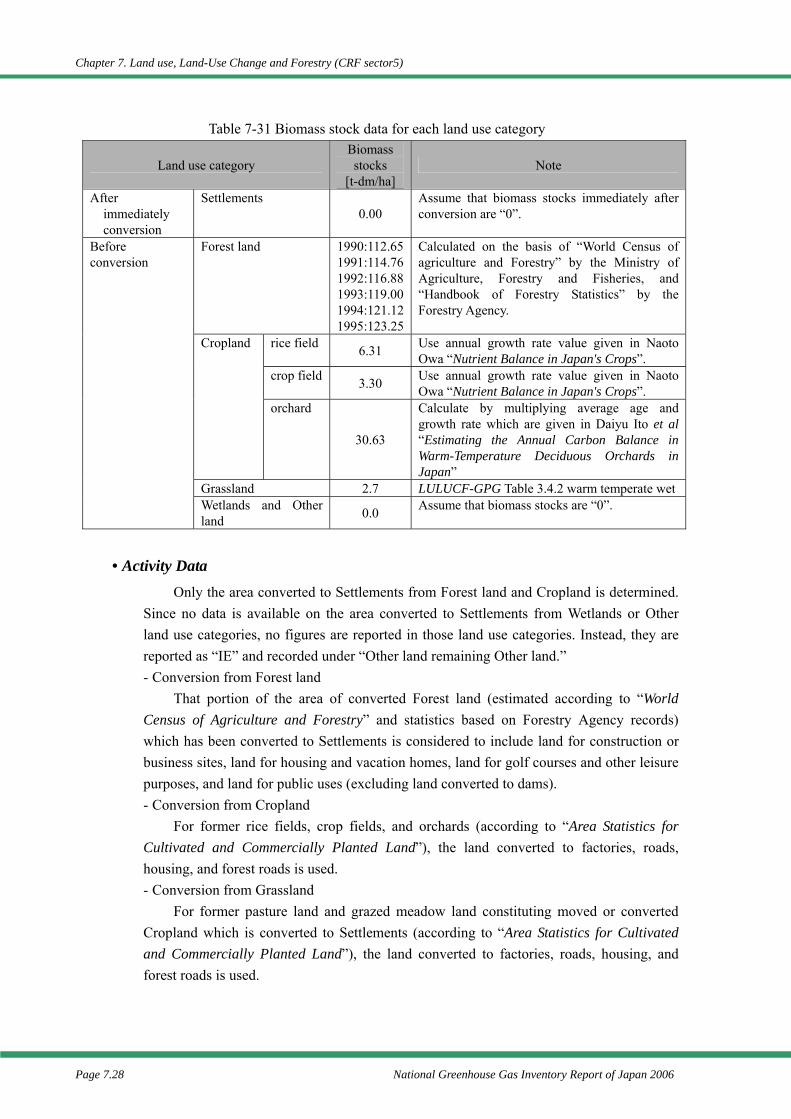
Chapter 7. Land use, Land-Use Change and Forestry (CRF sector5)
Page 7.28 National Greenhouse Gas Inventory Report of Japan 2006
Table 7-31 Biomass stock data for each land use category
Land use category Biomass stocks
[t-dm/ha] Note
After immediately conversion
Settlements 0.00
Assume that biomass stocks immediately after conversion are “0”.
Forest land 1990:112.651991:114.761992:116.881993:119.001994:121.121995:123.25
Calculated on the basis of “World Census of agriculture and Forestry” by the Ministry of Agriculture, Forestry and Fisheries, and “Handbook of Forestry Statistics” by the Forestry Agency.
rice field 6.31 Use annual growth rate value given in Naoto Owa “Nutrient Balance in Japan's Crops”.
crop field 3.30 Use annual growth rate value given in Naoto Owa “Nutrient Balance in Japan's Crops”.
Cropland
orchard
30.63
Calculate by multiplying average age and growth rate which are given in Daiyu Ito et al “Estimating the Annual Carbon Balance in Warm-Temperature Deciduous Orchards in Japan”
Grassland 2.7 LULUCF-GPG Table 3.4.2 warm temperate wet
Before conversion
Wetlands and Other land 0.0 Assume that biomass stocks are “0”.
• Activity Data
Only the area converted to Settlements from Forest land and Cropland is determined. Since no data is available on the area converted to Settlements from Wetlands or Other land use categories, no figures are reported in those land use categories. Instead, they are reported as “IE” and recorded under “Other land remaining Other land.” - Conversion from Forest land
That portion of the area of converted Forest land (estimated according to “World Census of Agriculture and Forestry” and statistics based on Forestry Agency records) which has been converted to Settlements is considered to include land for construction or business sites, land for housing and vacation homes, land for golf courses and other leisure purposes, and land for public uses (excluding land converted to dams). - Conversion from Cropland
For former rice fields, crop fields, and orchards (according to “Area Statistics for Cultivated and Commercially Planted Land”), the land converted to factories, roads, housing, and forest roads is used. - Conversion from Grassland
For former pasture land and grazed meadow land constituting moved or converted Cropland which is converted to Settlements (according to “Area Statistics for Cultivated and Commercially Planted Land”), the land converted to factories, roads, housing, and forest roads is used.
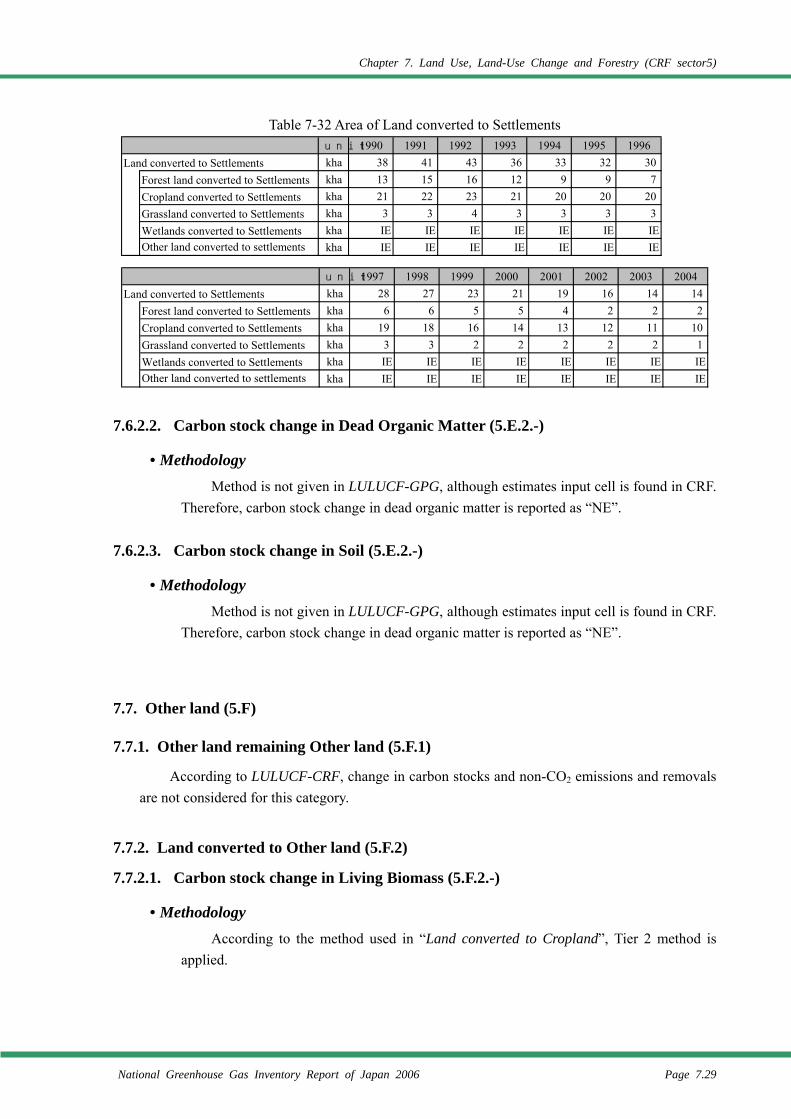
Chapter 7. Land Use, Land-Use Change and Forestry (CRF sector5)
National Greenhouse Gas Inventory Report of Japan 2006 Page 7.29
Table 7-32 Area of Land converted to Settlements
7.6.2.2. Carbon stock change in Dead Organic Matter (5.E.2.-)
• Methodology Method is not given in LULUCF-GPG, although estimates input cell is found in CRF.
Therefore, carbon stock change in dead organic matter is reported as “NE”. 7.6.2.3. Carbon stock change in Soil (5.E.2.-)
• Methodology Method is not given in LULUCF-GPG, although estimates input cell is found in CRF.
Therefore, carbon stock change in dead organic matter is reported as “NE”.
7.7. Other land (5.F)
7.7.1. Other land remaining Other land (5.F.1)
According to LULUCF-CRF, change in carbon stocks and non-CO2 emissions and removals are not considered for this category.
7.7.2. Land converted to Other land (5.F.2)
7.7.2.1. Carbon stock change in Living Biomass (5.F.2.-)
• Methodology According to the method used in “Land converted to Cropland”, Tier 2 method is
applied.
unit 1990 1991 1992 1993 1994 1995 1996Land converted to Settlements kha 38 41 43 36 33 32 30
Forest land converted to Settlements kha 13 15 16 12 9 9 7Cropland converted to Settlements kha 21 22 23 21 20 20 20Grassland converted to Settlements kha 3 3 4 3 3 3 3Wetlands converted to Settlements kha IE IE IE IE IE IE IEOther land converted to settlements kha IE IE IE IE IE IE IE
unit 1997 1998 1999 2000 2001 2002 2003 2004Land converted to Settlements kha 28 27 23 21 19 16 14 14
Forest land converted to Settlements kha 6 6 5 5 4 2 2 2Cropland converted to Settlements kha 19 18 16 14 13 12 11 10Grassland converted to Settlements kha 3 3 2 2 2 2 2 1Wetlands converted to Settlements kha IE IE IE IE IE IE IE IEOther land converted to settlements kha IE IE IE IE IE IE IE IE
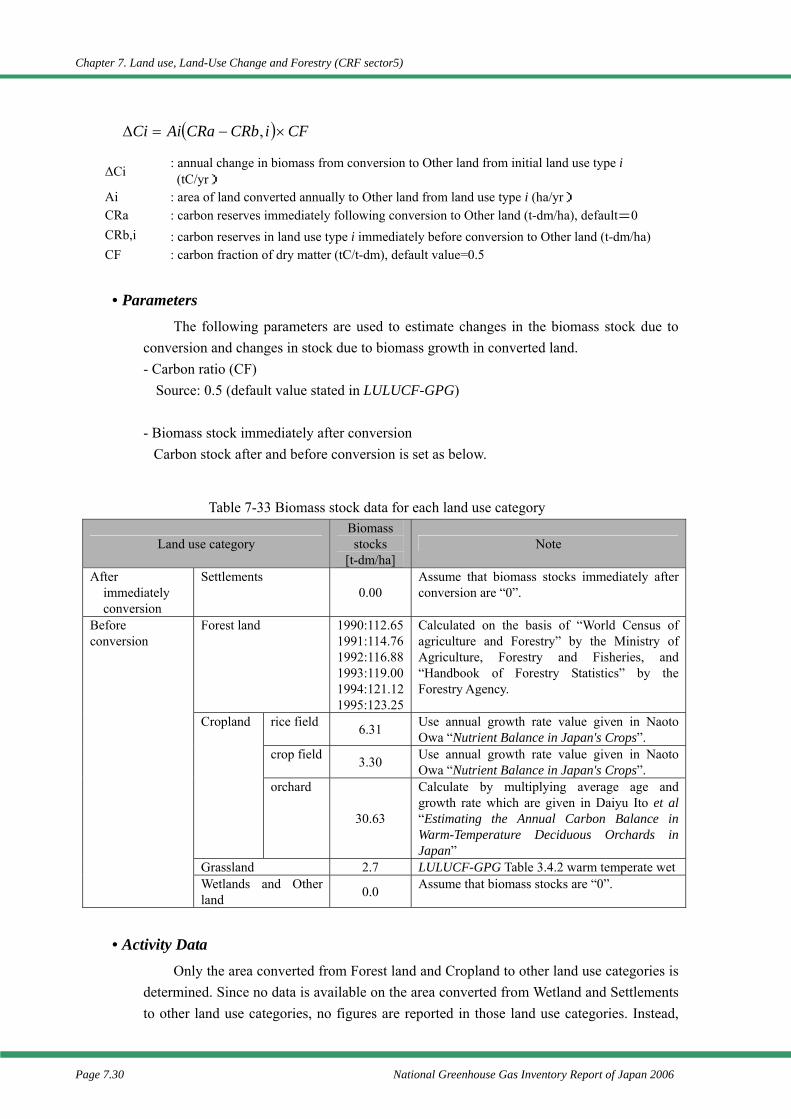
Chapter 7. Land use, Land-Use Change and Forestry (CRF sector5)
Page 7.30 National Greenhouse Gas Inventory Report of Japan 2006
∆Ci : annual change in biomass from conversion to Other land from initial land use type i (tC/yr)
Ai : area of land converted annually to Other land from land use type i (ha/yr) CRa : carbon reserves immediately following conversion to Other land (t-dm/ha), default=0 CRb,i : carbon reserves in land use type i immediately before conversion to Other land (t-dm/ha) CF : carbon fraction of dry matter (tC/t-dm), default value=0.5
• Parameters
The following parameters are used to estimate changes in the biomass stock due to conversion and changes in stock due to biomass growth in converted land. - Carbon ratio (CF)
Source: 0.5 (default value stated in LULUCF-GPG)
- Biomass stock immediately after conversion Carbon stock after and before conversion is set as below.
Table 7-33 Biomass stock data for each land use category
Land use category Biomass stocks
[t-dm/ha] Note
After immediately conversion
Settlements 0.00
Assume that biomass stocks immediately after conversion are “0”.
Forest land 1990:112.651991:114.761992:116.881993:119.001994:121.121995:123.25
Calculated on the basis of “World Census of agriculture and Forestry” by the Ministry of Agriculture, Forestry and Fisheries, and “Handbook of Forestry Statistics” by the Forestry Agency.
rice field 6.31 Use annual growth rate value given in Naoto Owa “Nutrient Balance in Japan's Crops”.
crop field 3.30 Use annual growth rate value given in Naoto Owa “Nutrient Balance in Japan's Crops”.
Cropland
orchard
30.63
Calculate by multiplying average age and growth rate which are given in Daiyu Ito et al “Estimating the Annual Carbon Balance in Warm-Temperature Deciduous Orchards in Japan”
Grassland 2.7 LULUCF-GPG Table 3.4.2 warm temperate wet
Before conversion
Wetlands and Other land 0.0 Assume that biomass stocks are “0”.
• Activity Data
Only the area converted from Forest land and Cropland to other land use categories is determined. Since no data is available on the area converted from Wetland and Settlements to other land use categories, no figures are reported in those land use categories. Instead,
( ) CFiCRbCRaAiCi ×−=∆ ,
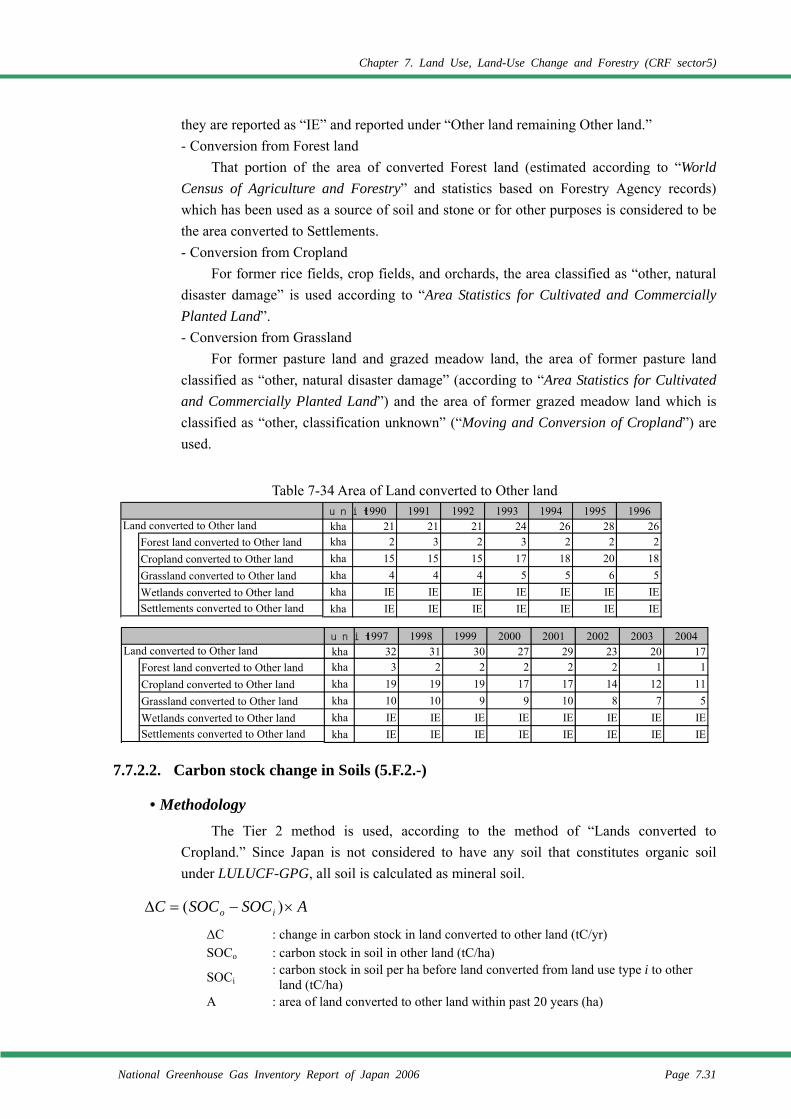
Chapter 7. Land Use, Land-Use Change and Forestry (CRF sector5)
National Greenhouse Gas Inventory Report of Japan 2006 Page 7.31
they are reported as “IE” and reported under “Other land remaining Other land.” - Conversion from Forest land
That portion of the area of converted Forest land (estimated according to “World Census of Agriculture and Forestry” and statistics based on Forestry Agency records) which has been used as a source of soil and stone or for other purposes is considered to be the area converted to Settlements. - Conversion from Cropland
For former rice fields, crop fields, and orchards, the area classified as “other, natural disaster damage” is used according to “Area Statistics for Cultivated and Commercially Planted Land”. - Conversion from Grassland
For former pasture land and grazed meadow land, the area of former pasture land classified as “other, natural disaster damage” (according to “Area Statistics for Cultivated and Commercially Planted Land”) and the area of former grazed meadow land which is classified as “other, classification unknown” (“Moving and Conversion of Cropland”) are used.
Table 7-34 Area of Land converted to Other land
7.7.2.2. Carbon stock change in Soils (5.F.2.-)
• Methodology The Tier 2 method is used, according to the method of “Lands converted to
Cropland.” Since Japan is not considered to have any soil that constitutes organic soil under LULUCF-GPG, all soil is calculated as mineral soil.
∆C : change in carbon stock in land converted to other land (tC/yr) SOCo : carbon stock in soil in other land (tC/ha)
SOCi : carbon stock in soil per ha before land converted from land use type i to other land (tC/ha)
A : area of land converted to other land within past 20 years (ha)
ASOCSOCC io ×−=∆ )(
unit 1990 1991 1992 1993 1994 1995 1996Land converted to Other land kha 21 21 21 24 26 28 26
Forest land converted to Other land kha 2 3 2 3 2 2 2Cropland converted to Other land kha 15 15 15 17 18 20 18Grassland converted to Other land kha 4 4 4 5 5 6 5Wetlands converted to Other land kha IE IE IE IE IE IE IESettlements converted to Other land kha IE IE IE IE IE IE IE
unit 1997 1998 1999 2000 2001 2002 2003 2004Land converted to Other land kha 32 31 30 27 29 23 20 17
Forest land converted to Other land kha 3 2 2 2 2 2 1 1Cropland converted to Other land kha 19 19 19 17 17 14 12 11Grassland converted to Other land kha 10 10 9 9 10 8 7 5Wetlands converted to Other land kha IE IE IE IE IE IE IE IESettlements converted to Other land kha IE IE IE IE IE IE IE IE
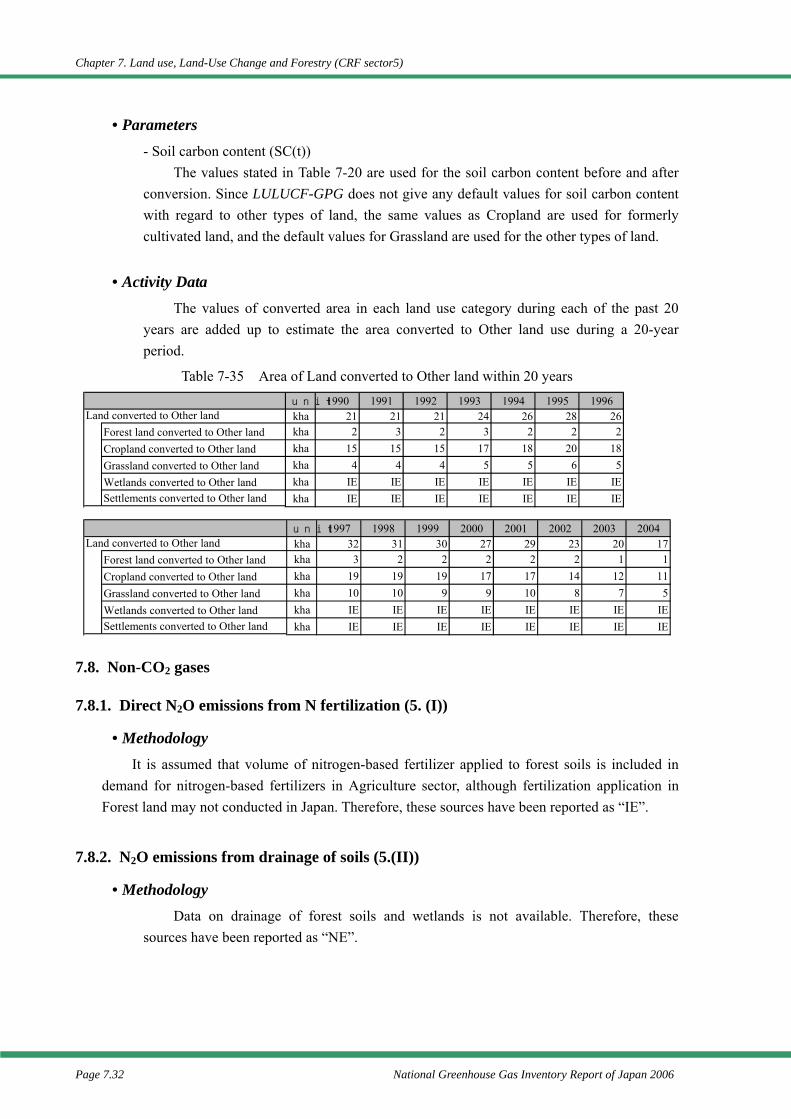
Chapter 7. Land use, Land-Use Change and Forestry (CRF sector5)
Page 7.32 National Greenhouse Gas Inventory Report of Japan 2006
• Parameters - Soil carbon content (SC(t))
The values stated in Table 7-20 are used for the soil carbon content before and after conversion. Since LULUCF-GPG does not give any default values for soil carbon content with regard to other types of land, the same values as Cropland are used for formerly cultivated land, and the default values for Grassland are used for the other types of land.
• Activity Data
The values of converted area in each land use category during each of the past 20 years are added up to estimate the area converted to Other land use during a 20-year period.
Table 7-35 Area of Land converted to Other land within 20 years
7.8. Non-CO2 gases
7.8.1. Direct N2O emissions from N fertilization (5. (I))
• Methodology It is assumed that volume of nitrogen-based fertilizer applied to forest soils is included in
demand for nitrogen-based fertilizers in Agriculture sector, although fertilization application in Forest land may not conducted in Japan. Therefore, these sources have been reported as “IE”.
7.8.2. N2O emissions from drainage of soils (5.(II))
• Methodology Data on drainage of forest soils and wetlands is not available. Therefore, these
sources have been reported as “NE”.
unit 1990 1991 1992 1993 1994 1995 1996Land converted to Other land kha 21 21 21 24 26 28 26
Forest land converted to Other land kha 2 3 2 3 2 2 2Cropland converted to Other land kha 15 15 15 17 18 20 18Grassland converted to Other land kha 4 4 4 5 5 6 5Wetlands converted to Other land kha IE IE IE IE IE IE IESettlements converted to Other land kha IE IE IE IE IE IE IE
unit 1997 1998 1999 2000 2001 2002 2003 2004Land converted to Other land kha 32 31 30 27 29 23 20 17
Forest land converted to Other land kha 3 2 2 2 2 2 1 1Cropland converted to Other land kha 19 19 19 17 17 14 12 11Grassland converted to Other land kha 10 10 9 9 10 8 7 5Wetlands converted to Other land kha IE IE IE IE IE IE IE IESettlements converted to Other land kha IE IE IE IE IE IE IE IE
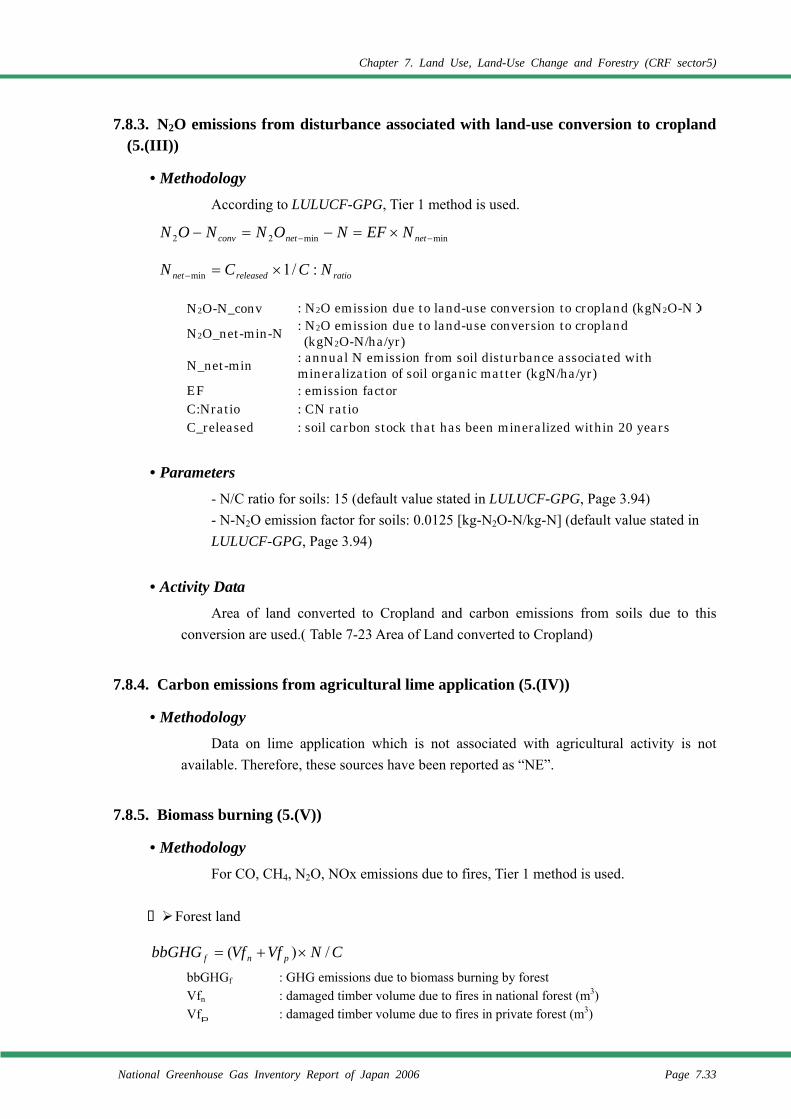
Chapter 7. Land Use, Land-Use Change and Forestry (CRF sector5)
National Greenhouse Gas Inventory Report of Japan 2006 Page 7.33
7.8.3. N2O emissions from disturbance associated with land-use conversion to cropland (5.(III))
• Methodology According to LULUCF-GPG, Tier 1 method is used.
N2O-N_conv : N2O emission due to land-use conversion to cropland (kgN2O-N)
N2O_net-min-N : N2O emission due to land-use conversion to cropland (kgN2O-N/ha/yr)
N_net-min : annual N emission from soil disturbance associated with mineralization of soil organic matter (kgN/ha/yr)
EF : emission factor C:Nratio : CN ratio C_released : soil carbon stock that has been mineralized within 20 years
• Parameters - N/C ratio for soils: 15 (default value stated in LULUCF-GPG, Page 3.94) - N-N2O emission factor for soils: 0.0125 [kg-N2O-N/kg-N] (default value stated in LULUCF-GPG, Page 3.94)
• Activity Data Area of land converted to Cropland and carbon emissions from soils due to this
conversion are used.( Table 7-23 Area of Land converted to Cropland)
7.8.4. Carbon emissions from agricultural lime application (5.(IV))
• Methodology Data on lime application which is not associated with agricultural activity is not
available. Therefore, these sources have been reported as “NE”.
7.8.5. Biomass burning (5.(V))
• Methodology For CO, CH4, N2O, NOx emissions due to fires, Tier 1 method is used.
Forest land
bbGHGf : GHG emissions due to biomass burning by forest Vfn : damaged timber volume due to fires in national forest (m3) Vfp : damaged timber volume due to fires in private forest (m3)
minmin22 −− ×=−=− netnetconv NEFNONNON
ratioreleasednet NCCN :/1min ×=−
CNVfVfbbGHG pnf /)( ×+=
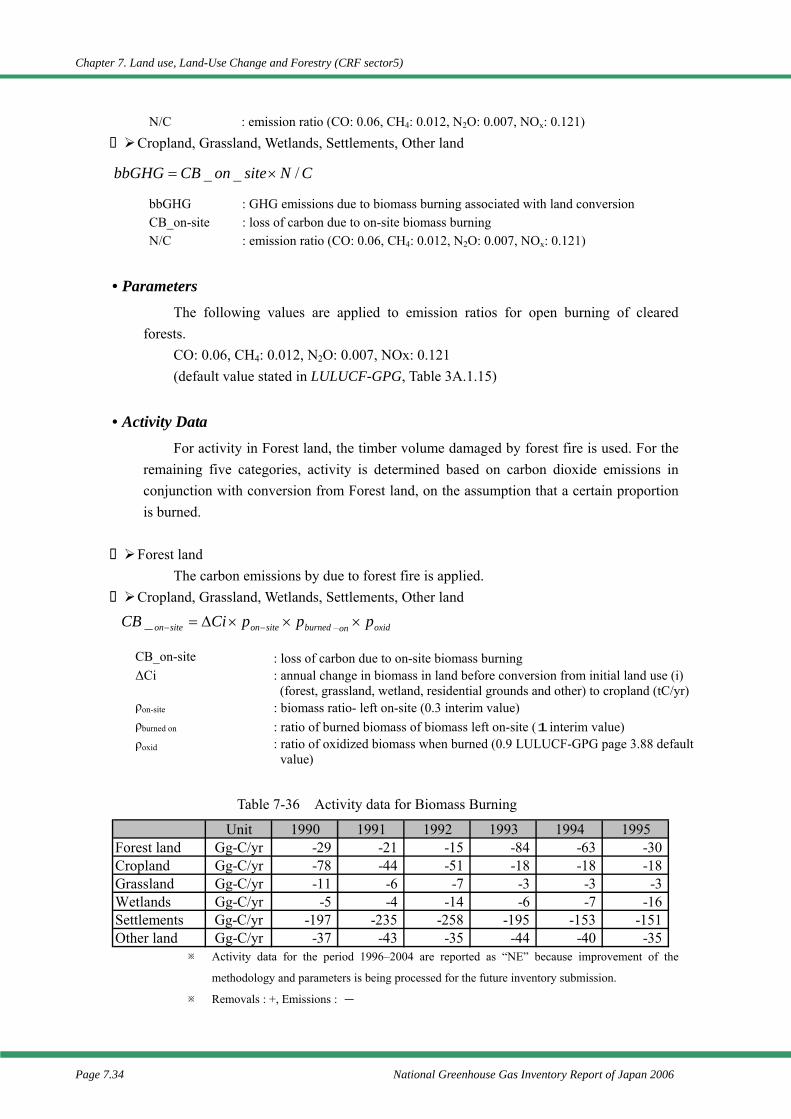
Chapter 7. Land use, Land-Use Change and Forestry (CRF sector5)
Page 7.34 National Greenhouse Gas Inventory Report of Japan 2006
N/C : emission ratio (CO: 0.06, CH4: 0.012, N2O: 0.007, NOx: 0.121) Cropland, Grassland, Wetlands, Settlements, Other land
bbGHG : GHG emissions due to biomass burning associated with land conversion CB_on-site : loss of carbon due to on-site biomass burning N/C : emission ratio (CO: 0.06, CH4: 0.012, N2O: 0.007, NOx: 0.121)
• Parameters The following values are applied to emission ratios for open burning of cleared
forests. CO: 0.06, CH4: 0.012, N2O: 0.007, NOx: 0.121 (default value stated in LULUCF-GPG, Table 3A.1.15)
• Activity Data For activity in Forest land, the timber volume damaged by forest fire is used. For the
remaining five categories, activity is determined based on carbon dioxide emissions in conjunction with conversion from Forest land, on the assumption that a certain proportion is burned.
Forest land
The carbon emissions by due to forest fire is applied. Cropland, Grassland, Wetlands, Settlements, Other land
CB_on-site : loss of carbon due to on-site biomass burning ∆Ci : annual change in biomass in land before conversion from initial land use (i)
(forest, grassland, wetland, residential grounds and other) to cropland (tC/yr) ρon-site : biomass ratio- left on-site (0.3 interim value) ρburned on : ratio of burned biomass of biomass left on-site (1interim value) ρoxid : ratio of oxidized biomass when burned (0.9 LULUCF-GPG page 3.88 default
value)
Table 7-36 Activity data for Biomass Burning
※ Activity data for the period 1996–2004 are reported as “NE” because improvement of the
methodology and parameters is being processed for the future inventory submission.
※ Removals : +, Emissions : -
CNsiteonCBbbGHG /__ ×=
oxidonburnedsiteonsiteon pppCiCB ×××∆= −−_
Unit 1990 1991 1992 1993 1994 1995Forest land Gg-C/yr -29 -21 -15 -84 -63 -30 Cropland Gg-C/yr -78 -44 -51 -18 -18 -18 Grassland Gg-C/yr -11 -6 -7 -3 -3 -3 Wetlands Gg-C/yr -5 -4 -14 -6 -7 -16 Settlements Gg-C/yr -197 -235 -258 -195 -153 -151 Other land Gg-C/yr -37 -43 -35 -44 -40 -35
Chapter 7. Land Use, Land-Use Change and Forestry (CRF sector5)
National Greenhouse Gas Inventory Report of Japan 2006 Page 7.35
Reference
IPCC, Revised 1996 IPCC Guidelines for National Greenhouse Gas Inventories, 1997 IPCC, Good Practice Guidance and Uncertainty Management for Land Use, Land-Use change and forestry, 2002 Environmental Agency Committee for the Greenhouse Gases Emissions Estimation Methods, Review of Greenhouse Gases Emissions Estimation Methods Part 1, September 2000 Ministry of the Environment Committee for the Greenhouse Gases Emissions Estimation Methods, Review of Greenhouse Gases Emissions Estimation Methods Part 3, August 2002 Ministry of Agriculture, Forestry and Fisheries, World Census of agriculture and Forestry MAFF, Statistics of Cultivated and Planted Area (Survey of cropland area) MAFF, A move and conversion of Cropland Forestry Agency, Handbook of Forestry Statistics Ministry of Land Infrastructure and Transport, Land Use Status Survey Ministry of Land Infrastructure and Transport, Urban Park Status Survey Japan Dam Foundation, Dam Yearbook Ministry of Internal Affairs and Communications, Housing and Land Survey of Japan Naoto Owa, “Nutrient Balance in Japan’s Crops” Daiyu Ito et al, “Estimating the Annual Carbon Balance in Warm-Temperature Deciduous Orchards in Japan” Makoto Nakai, “Carbon accumulation in soils due to soil management” Association for Advancement of Agricultural Science“Survey on method for quantification of amount of GHG emission cuts (2000)” Kazuhito Morisada, Kenji Ono, Hidesato Kanomata, “ Organic carbon stock in forest soil in Japan”, Geoderma 119 (2004) p.21-32
UNFCCC, Guidelines on reporting and review(FCCC/SBSTA/2004/8) UNFCCC, Tables of the common reporting format for land use, land-use change and forestry(FCCC/SBSTA/2005/L.19、FCCC/SBSTA/2005/L.19/Add.1)
Chapter 7. Land use, Land-Use Change and Forestry (CRF sector5)
Page 7.36 National Greenhouse Gas Inventory Report of Japan 2006
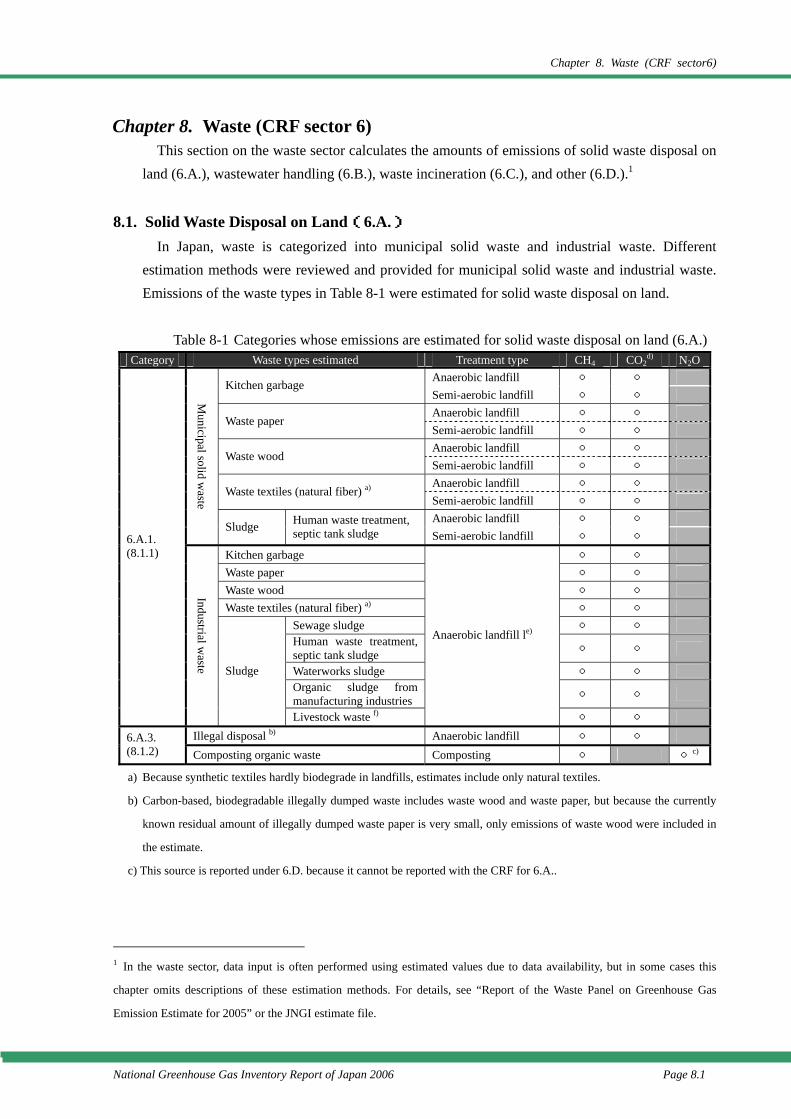
Chapter 8. Waste (CRF sector6)
National Greenhouse Gas Inventory Report of Japan 2006 Page 8.1
Chapter 8. Waste (CRF sector 6) This section on the waste sector calculates the amounts of emissions of solid waste disposal on
land (6.A.), wastewater handling (6.B.), waste incineration (6.C.), and other (6.D.).1
8.1. Solid Waste Disposal on Land(6.A.) In Japan, waste is categorized into municipal solid waste and industrial waste. Different
estimation methods were reviewed and provided for municipal solid waste and industrial waste. Emissions of the waste types in Table 8-1 were estimated for solid waste disposal on land.
Table 8-1 Categories whose emissions are estimated for solid waste disposal on land (6.A.)
Category Waste types estimated Treatment type CH4 CO2d) N2O
Anaerobic landfill ○ ○ Kitchen garbage Semi-aerobic landfill ○ ○ Anaerobic landfill ○ ○
Waste paper Semi-aerobic landfill ○ ○ Anaerobic landfill ○ ○
Waste wood Semi-aerobic landfill ○ ○ Anaerobic landfill ○ ○
Waste textiles (natural fiber) a) Semi-aerobic landfill ○ ○ Anaerobic landfill ○ ○
Municipal solid w
aste
Sludge Human waste treatment, septic tank sludge Semi-aerobic landfill ○ ○
Kitchen garbage ○ ○ Waste paper ○ ○ Waste wood ○ ○ Waste textiles (natural fiber) a) ○ ○
Sewage sludge ○ ○ Human waste treatment, septic tank sludge ○ ○
Waterworks sludge ○ ○ Organic sludge from manufacturing industries ○ ○
6.A.1. (8.1.1)
Industrial waste Sludge
Livestock waste f)
Anaerobic landfill le)
○ ○ Illegal disposal b) Anaerobic landfill ○ ○ 6.A.3.
(8.1.2) Composting organic waste Composting ○ ○c)
a) Because synthetic textiles hardly biodegrade in landfills, estimates include only natural textiles.
b) Carbon-based, biodegradable illegally dumped waste includes waste wood and waste paper, but because the currently
known residual amount of illegally dumped waste paper is very small, only emissions of waste wood were included in
the estimate.
c) This source is reported under 6.D. because it cannot be reported with the CRF for 6.A..
1 In the waste sector, data input is often performed using estimated values due to data availability, but in some cases this
chapter omits descriptions of these estimation methods. For details, see “Report of the Waste Panel on Greenhouse Gas
Emission Estimate for 2005” or the JNGI estimate file.
Chapter 8. Waste (CRF sector6)
Page 8.2 National Greenhouse Gas Inventory Report of Japan 2006
d) The carbon dioxide emitted from this source is biological in its origin. Therefore, it has not been added to Japan’s total
emissions. As a reference, these carbon dioxide emissions have been provided under “Additional Information” in the
Common Reporting Format.
e) Since the ratio of semi-aerobic landfills is uncertain, all the industrial waste landfills were considered to be anaerobic
landfills for emission estimates.
f) Although livestock waste does not fall under the category of sludge legally, emissions from livestock waste were
estimated under the category of sludge since the characteristic of livestock waste was similar to that of sludge.
8.1.1. Emissions from Controlled Landfill Sites (6.A.1.)
Background
In Japan some of the kitchen garbage, waste paper, waste textiles, waste wood, and sludge in municipal solid waste and industrial waste is landfilled without incineration, producing methane when the organic components biodegrade in landfills. Because Japanese landfill sites are appropriately controlled pursuant to the Wastes Disposal and Public Cleansing Law, the amount of methane released is counted under “Emissions from Controlled Landfill Sites (6.A.1).”
Methodology
Since the country-specific data is available, methane and carbon dioxide emissions from this source were calculated using the country-specific methodology instead of the Tier 2: FOD method in accordance with the decision tree (page 5.6, fig. 5.1) of the Good Practice Guidance (2000).
Researches have been conducted to understand the actual emissions of methane on waste landfill sites in Japan. The results of these researches have been used to derive emissions, using a more advanced model of a simple approximation of the Sheldon Arleta model that depicts the decomposition of waste on a landfill sites over time.
Estimating emissions involved multiplying the emission factor by the amount of previously landfilled waste that biodegraded in the relevant year.
AEFE ×= E : Amount of methane emitted from controlled landfill sites (kg-CH4) EF : Emission factor for anaerobic landfill or semi-aerobic landfill (dry basis)
(kg-CH4/t) A : Amount of each type of waste landfilled without incineration until the
basic estimation period started and which degraded during the basic estimation period (dry basis) (t)
Emission Factors
-Overview Emission factors were set by multiplying each of kitchen garbage, waste paper, waste textiles
(of natural fibers), waste wood, and sludge by carbon content, disposal site-specific methane
Chapter 8. Waste (CRF sector6)
National Greenhouse Gas Inventory Report of Japan 2006 Page 8.3
correction coefficients, waste-to-gas conversion rate of landfilled waste, and percentages of methane in this landfill gas.
Emission factor = (carbon content) × (methane correction coefficient) × (gas conversion rate) × (percentages of CH4 in landfill gas)
-Carbon Content [Kitchen garbage, waste paper, waste wood] Carbon content in each type of waste has been estimated as an average for the relevant year, by
using actual results from the data gathered in cities of Tokyo, Yokohama, Kawasaki, Kobe, and Fukuoka; calculate a moving average of the carbon content in each type of waste over a five-year period, centered around the relevant year, for each municipal government; and convert it to a weighted average using the individual populations of each municipality.(For details on the assumptions underlying the calculations, refer to 6-EF-2006.xls¥6A-CH4.)
[Waste natural fiber textiles] Carbon content of the natural fiber used in textile products was used as the carbon content of
waste natural fiber textiles. The carbon content of each natural fiber type (cotton, wool, silk, linen, and recycled textiles was calculated from the percentage of each fiber type and the carbon content, then this value’s weighted average was calculated with each textile’s domestic demand to find waste textile carbon content.
[Sludge] The upper limit values of sewage sludge carbon content shown in the Good Practice Guidance
(2000) was used as the carbon content of sewage sludge. The sewage sludge carbon content was used as the carbon content of sewage treatment and septic tank sludge, and livestock waste treatment. The intermediate results of analyzing the percentages of organic constituents obtained by FY2005 measurements at several water purification plants was used as the carbon content of waterworks sludge.The carbon content of organic sludge generated by manufacturing industries used here was the value for the papermaking industry, which has the largest final disposal quantity of organic sludge. Because the main constituent of the organic sludge generated by the papermaking industry is paper sludge, we set the carbon content with reference to carbon content of cellulose. The same value is used for every year because it is likely that the properties of sludge do not change much from year to year.
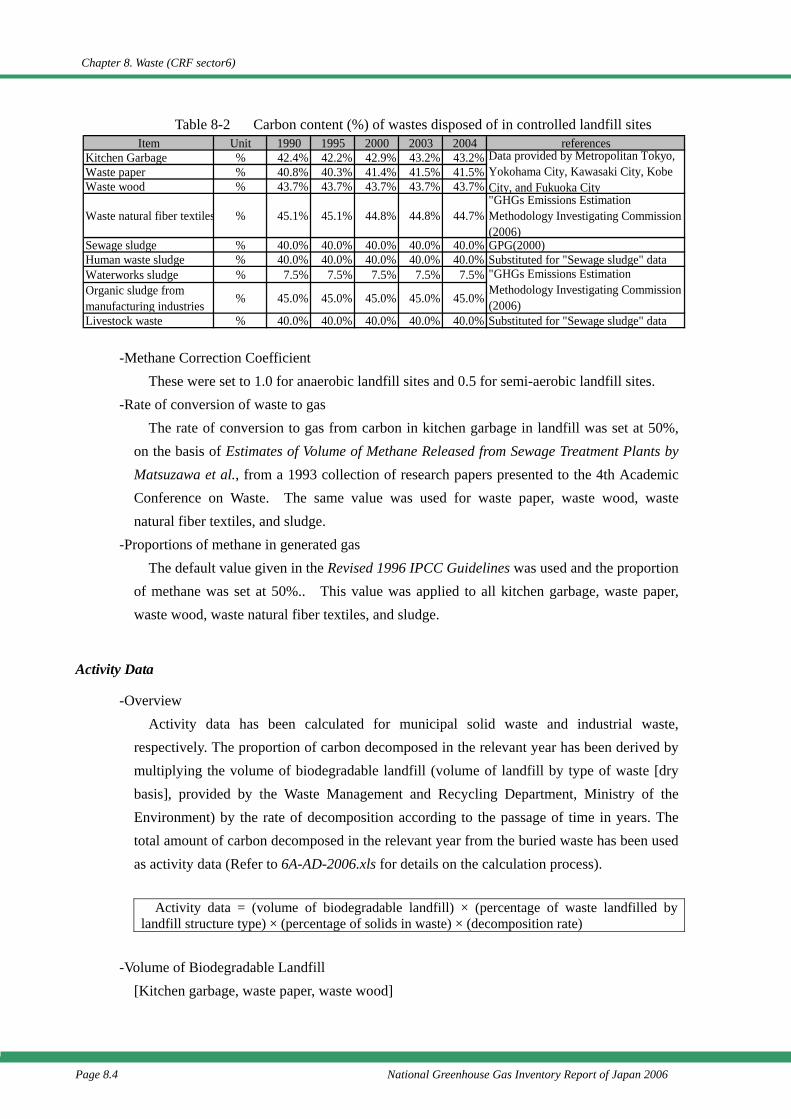
Chapter 8. Waste (CRF sector6)
Page 8.4 National Greenhouse Gas Inventory Report of Japan 2006
Table 8-2 Carbon content (%) of wastes disposed of in controlled landfill sites
-Methane Correction Coefficient
These were set to 1.0 for anaerobic landfill sites and 0.5 for semi-aerobic landfill sites. -Rate of conversion of waste to gas
The rate of conversion to gas from carbon in kitchen garbage in landfill was set at 50%, on the basis of Estimates of Volume of Methane Released from Sewage Treatment Plants by Matsuzawa et al., from a 1993 collection of research papers presented to the 4th Academic Conference on Waste. The same value was used for waste paper, waste wood, waste natural fiber textiles, and sludge.
-Proportions of methane in generated gas The default value given in the Revised 1996 IPCC Guidelines was used and the proportion
of methane was set at 50%.. This value was applied to all kitchen garbage, waste paper, waste wood, waste natural fiber textiles, and sludge.
Activity Data
-Overview Activity data has been calculated for municipal solid waste and industrial waste,
respectively. The proportion of carbon decomposed in the relevant year has been derived by multiplying the volume of biodegradable landfill (volume of landfill by type of waste [dry basis], provided by the Waste Management and Recycling Department, Ministry of the Environment) by the rate of decomposition according to the passage of time in years. The total amount of carbon decomposed in the relevant year from the buried waste has been used as activity data (Refer to 6A-AD-2006.xls for details on the calculation process).
Activity data = (volume of biodegradable landfill) × (percentage of waste landfilled by
landfill structure type) × (percentage of solids in waste) × (decomposition rate)
-Volume of Biodegradable Landfill [Kitchen garbage, waste paper, waste wood]
Item Unit 1990 1995 2000 2003 2004 referencesKitchen Garbage % 42.4% 42.2% 42.9% 43.2% 43.2%Waste paper % 40.8% 40.3% 41.4% 41.5% 41.5%Waste wood % 43.7% 43.7% 43.7% 43.7% 43.7%
Waste natural fiber textiles % 45.1% 45.1% 44.8% 44.8% 44.7%"GHGs Emissions EstimationMethodology Investigating Commission(2006)
Sewage sludge % 40.0% 40.0% 40.0% 40.0% 40.0% GPG(2000)Human waste sludge % 40.0% 40.0% 40.0% 40.0% 40.0% Substituted for "Sewage sludge" dataWaterworks sludge % 7.5% 7.5% 7.5% 7.5% 7.5%Organic sludge frommanufacturing industries % 45.0% 45.0% 45.0% 45.0% 45.0%
Livestock waste % 40.0% 40.0% 40.0% 40.0% 40.0% Substituted for "Sewage sludge" data
Data provided by Metropolitan Tokyo,Yokohama City, Kawasaki City, KobeCity, and Fukuoka City
"GHGs Emissions EstimationMethodology Investigating Commission(2006)
Chapter 8. Waste (CRF sector6)
National Greenhouse Gas Inventory Report of Japan 2006 Page 8.5
The amounts of directly landfilled kitchen garbage, waste paper, and waste wood were determined from the Report of the Research on the State of Wide-range Movement and Cyclical Use of Wastes (Volume on Cyclical Use) (Waste Management and Recycling Department of the Ministry of the Environment; below, Cyclical Use of Waste Report). The amount of municipal solid waste were obtained by multiplying the volume of direct landfill waste for each classification of waste accumulation (by waste type) by the percentages of kitchen garbage, waste paper, and waste wood contained in the volume of direct landfill waste, and added up by the classification of waste accumulation. For the amount of kitchen garbage from industrial waste, “the volume of direct landfill waste” of animal and plant residue and livestock carcasses and “the volume of landfill after intermediate processing” were used. For the amount of waste paper and waste wood for industrial waste, “the volume of direct landfill waste” was used. To cover years for which solid waste data were unavailable, gaps were filled by means such as interpolation, extrapolation, substitution, and estimating from totals.2 [Waste Natural Fiber Textiles]
The amount of waste natural fiber textiles directly landfilled was estimated by multiplying the directly landfilled amount of waste textiles, which was determined expediently from the Cyclical Use of Waste Report, by the intermediate values (75%), as defined, of for municipal solid waste, the percentages of natural fiber in textile products of each year as determined from the Annual Textile Statistics Report, and for industrial waste, the percentages of natural fiber in the textile waste included in industrial waste, as determined from Waste Handbook. [Sewage Sludge]
Included in the estimation of landfilled sewage sludge amount were the types “raw sludge”, “dewatered sludge (dehydrated cake),” “mechanically dried sludge,” “concentrated sludge,” “dewatering vehicle sludge”, “sun-dried sludge”, “digested sludge”, “screen residue”, and “compost” in the sewage treatment plant categories “directly managed” and “disposal by other departments’ facilities/public corporations or private sector” as reported in annual editions of Sewage Statistics (Admin. Ed.) (Japan Sewage Works Association). [Human Waste Treatment, Septic Tank Sludge]
For landfilled amount of human waste treatment and septic tank sludge, we used the amounts given for “direct final disposal” and “final disposal after treatment” of “human waste treatment and septic tank sludge” in annual editions of Cyclical Use of Waste Report. The entire amount is considered as the biodegradable landfill amount. Landfilled amounts in FY1998 and prior years were estimated by taking the amounts of human waste treatment and septic tank sludge for each year in the section “Human Waste Processing Year by Year” of Waste Treatment in Japan (Ministry of the Environment, Waste Management and Recycling
2 See JNGI calculation file 6A-AD for details on the estimation method.
Chapter 8. Waste (CRF sector6)
Page 8.6 National Greenhouse Gas Inventory Report of Japan 2006
Department), then multiplying those amounts by the final disposal percentages of human waste and septic tank sludge in FY2000. [Waterworks Sludge]
The amount of water purification sludge generated and the percentage landfilled were determined from “total amount of soil disposed of” and “landfilled percentage” by each water purification plant given in each year’s Waterworks Statistics (Japan Water Works Association). [Organic Sludge from Manufacturing Industries]
Since there are no sources making it possible to determine the total amount of organic sludge landfilled by manufacturing industries year by year, activity data was determined by calculating for “food manufacturing”, “papermaking”, and “chemicals”, industries which landfill large quantities of organic sludge. The amount landfilled by the papermaking industry was determined by using the final disposal amount of organic sludge in Results of a Study on Industrial Wastes from Paper and Pulp Plants (Japan Paper Association, Japan Technical Association of the Pulp and Paper Industry, 2006). The landfill amounts for FY1999 and thereafter of the food manufacturing and chemical industries were determined by using Report on Results of Trend and Industry-Specific Studies on Industrial Wastes (Mining Industry Waste) and Recyclable Waste (2003 Data) (Clean Japan Center), while the amount for FY1998 and previous years we used Voluntary Environmental Report (Waste Control Volume), FY2004 Follow-up Results). [Livestock Waste Treatment]
The amounts used for the amount of livestock waste treated and landfilled were those given in “direct final disposal” and “final disposal after treatment” of “livestock waste” in annual editions of Report on the Research on the Wide-range Waste Movement and Control. Data for 1997 and prior years were from the Study on Direct Landfill Amounts of Livestock Waste (Ministry of the Environment, Waste Management and Recycling Department), which is conducted every five years. Values for interim years were interpolated from those studies.
-Percentages of Landfill Sites of Each Site Structure Type Determining the percentages of municipal solid waste landfill sites of each site structure
type involved referring to annual editions of Results of Study on Municipal Solid Waste Disposal (Ministry of the Environment, Waste Management and Recycling Department), which lists Japan’s municipal solid waste disposal sites in the section “Facility by Type (Final Disposal Sites),” regarding as semi-aerobic those sites which have leachate treatment facilities and subsurface containment structures, and regarding the percentage of semi-aerobic landfill disposal volume to be the percentage of their total landfill capacity (m3). However, disposal sites where landfilling started before the 1977 joint order, and all coastal and inland water landfills are treated as anaerobic disposal sites. Additionally, because sites where landfilling started between FY1978 and FY1989 likely include both anaerobic and semi-aerobic sites, we followed the judgment of specialists and calculated the
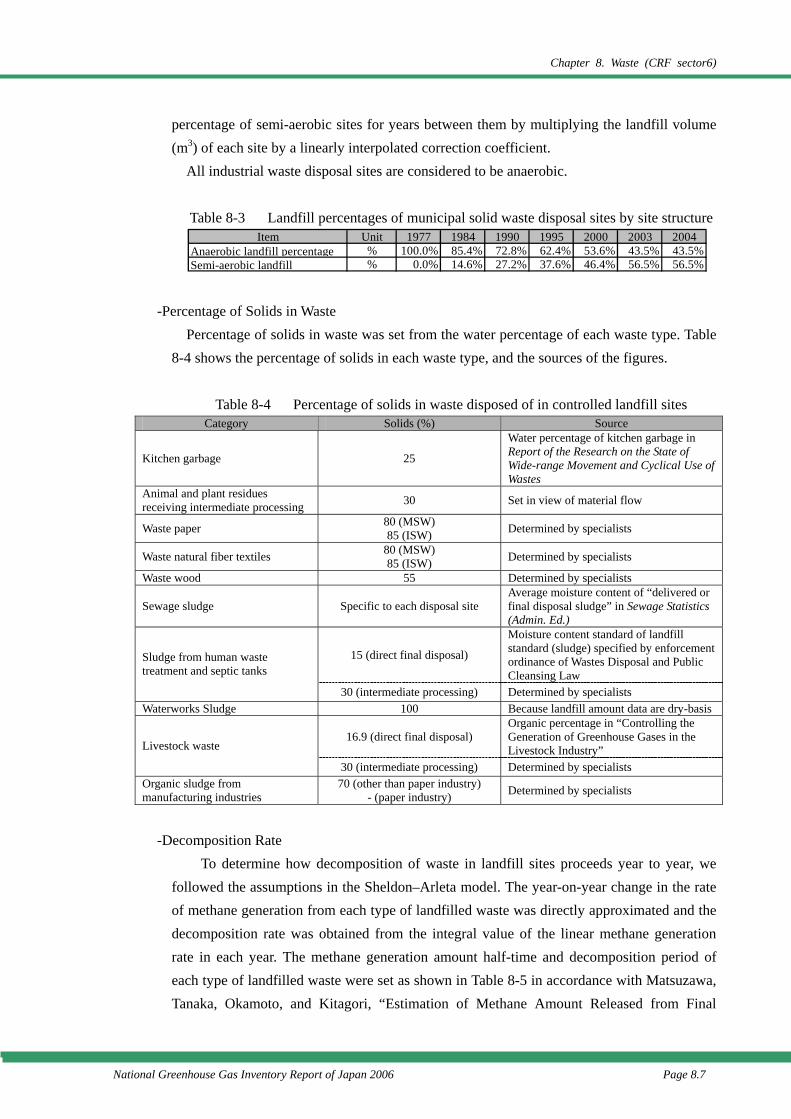
Chapter 8. Waste (CRF sector6)
National Greenhouse Gas Inventory Report of Japan 2006 Page 8.7
percentage of semi-aerobic sites for years between them by multiplying the landfill volume (m3) of each site by a linearly interpolated correction coefficient.
All industrial waste disposal sites are considered to be anaerobic.
Table 8-3 Landfill percentages of municipal solid waste disposal sites by site structure
-Percentage of Solids in Waste
Percentage of solids in waste was set from the water percentage of each waste type. Table 8-4 shows the percentage of solids in each waste type, and the sources of the figures.
Table 8-4 Percentage of solids in waste disposed of in controlled landfill sites
Category Solids (%) Source
Kitchen garbage 25
Water percentage of kitchen garbage in Report of the Research on the State of Wide-range Movement and Cyclical Use of Wastes
Animal and plant residues receiving intermediate processing 30 Set in view of material flow
Waste paper 80 (MSW) 85 (ISW) Determined by specialists
Waste natural fiber textiles 80 (MSW) 85 (ISW) Determined by specialists
Waste wood 55 Determined by specialists
Sewage sludge Specific to each disposal site Average moisture content of “delivered or final disposal sludge” in Sewage Statistics (Admin. Ed.)
15 (direct final disposal)
Moisture content standard of landfill standard (sludge) specified by enforcement ordinance of Wastes Disposal and Public Cleansing Law
Sludge from human waste treatment and septic tanks
30 (intermediate processing) Determined by specialists Waterworks Sludge 100 Because landfill amount data are dry-basis
16.9 (direct final disposal) Organic percentage in “Controlling the Generation of Greenhouse Gases in the Livestock Industry” Livestock waste
30 (intermediate processing) Determined by specialists Organic sludge from manufacturing industries
70 (other than paper industry) - (paper industry) Determined by specialists
-Decomposition Rate
To determine how decomposition of waste in landfill sites proceeds year to year, we followed the assumptions in the Sheldon–Arleta model. The year-on-year change in the rate of methane generation from each type of landfilled waste was directly approximated and the decomposition rate was obtained from the integral value of the linear methane generation rate in each year. The methane generation amount half-time and decomposition period of each type of landfilled waste were set as shown in Table 8-5 in accordance with Matsuzawa, Tanaka, Okamoto, and Kitagori, “Estimation of Methane Amount Released from Final
Item Unit 1977 1984 1990 1995 2000 2003 2004Anaerobic landfill percentage % 100.0% 85.4% 72.8% 62.4% 53.6% 43.5% 43.5%Semi-aerobic landfill % 0.0% 14.6% 27.2% 37.6% 46.4% 56.5% 56.5%
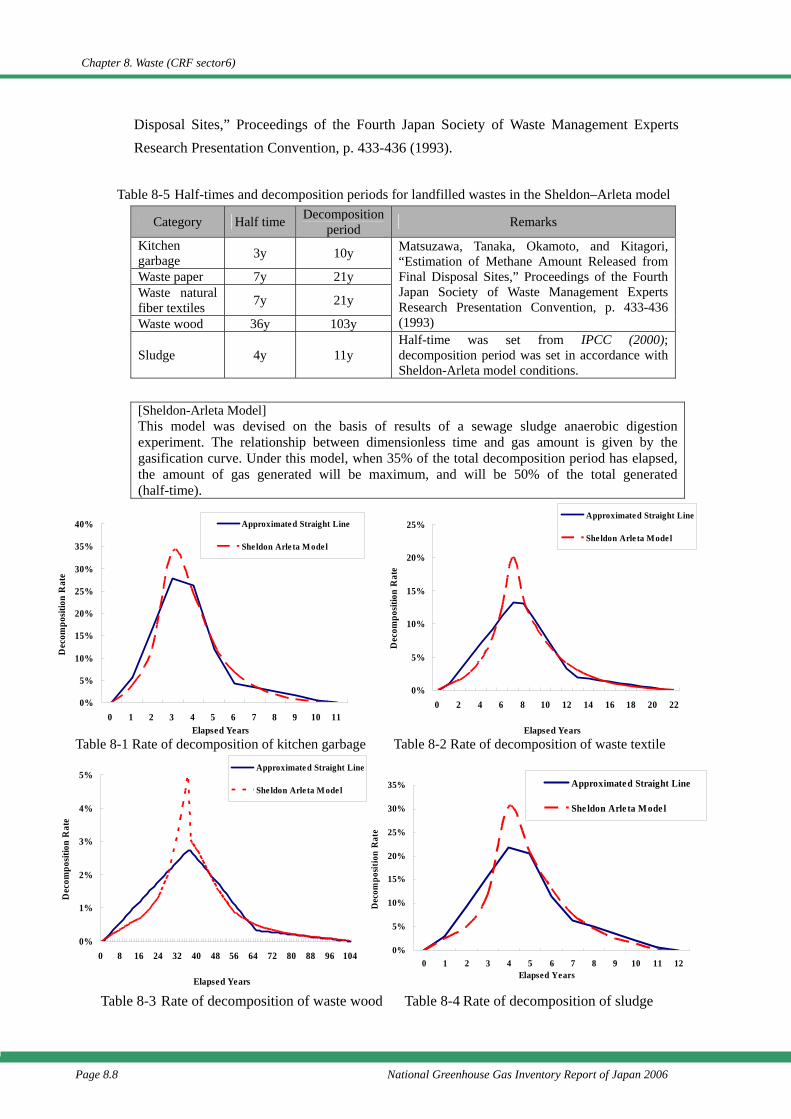
Chapter 8. Waste (CRF sector6)
Page 8.8 National Greenhouse Gas Inventory Report of Japan 2006
Disposal Sites,” Proceedings of the Fourth Japan Society of Waste Management Experts Research Presentation Convention, p. 433-436 (1993).
Table 8-5 Half-times and decomposition periods for landfilled wastes in the Sheldon–Arleta model
Category Half time Decomposition period Remarks
Kitchen garbage 3y 10y
Waste paper 7y 21y Waste natural fiber textiles 7y 21y
Waste wood 36y 103y
Matsuzawa, Tanaka, Okamoto, and Kitagori, “Estimation of Methane Amount Released from Final Disposal Sites,” Proceedings of the Fourth Japan Society of Waste Management Experts Research Presentation Convention, p. 433-436 (1993)
Sludge 4y 11y Half-time was set from IPCC (2000); decomposition period was set in accordance with Sheldon-Arleta model conditions.
[Sheldon-Arleta Model] This model was devised on the basis of results of a sewage sludge anaerobic digestion experiment. The relationship between dimensionless time and gas amount is given by the gasification curve. Under this model, when 35% of the total decomposition period has elapsed, the amount of gas generated will be maximum, and will be 50% of the total generated (half-time).
Table 8-1 Rate of decomposition of kitchen garbage Table 8-2 Rate of decomposition of waste textile
Table 8-3 Rate of decomposition of waste wood Table 8-4 Rate of decomposition of sludge
0%
5%
10%
15%
20%
25%
30%
35%
40%
0 1 2 3 4 5 6 7 8 9 10 11Elapsed Years
Dec
ompo
sitio
n R
ate
Approximate d Straight Line
She ldon Arle ta M ode l
0%
5%
10%
15%
20%
25%
0 2 4 6 8 10 12 14 16 18 20 22
Elapsed Years
Dec
ompo
sitio
n R
ate
Approximate d Straight Line
She ldon Arle ta Mode l
0%
1%
2%
3%
4%
5%
0 8 16 24 32 40 48 56 64 72 80 88 96 104
Elapsed Years
Dec
ompo
sitio
n R
ate
Approximate d Straight Line
She ldon Arle ta M ode l
0%
5%
10%
15%
20%
25%
30%
35%
0 1 2 3 4 5 6 7 8 9 10 11 12Elapsed Years
Dec
ompo
sitio
n R
ate
Approximated Straight Line
She ldon Arle ta Mode l
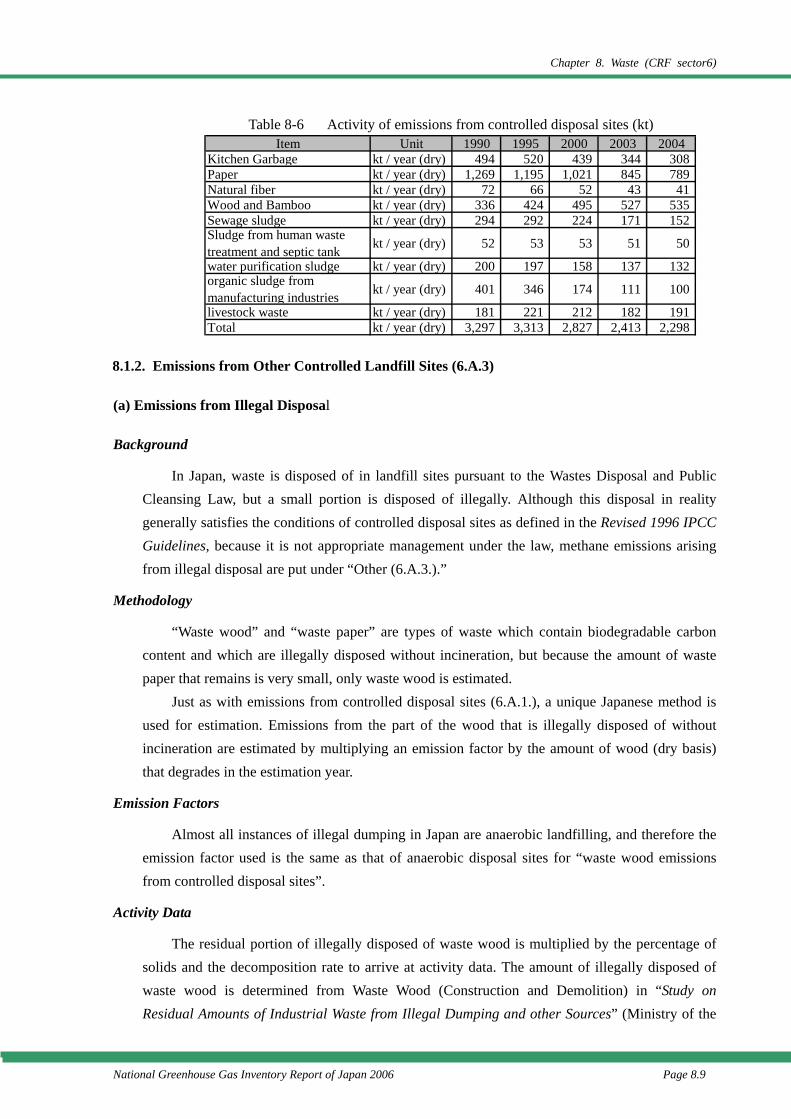
Chapter 8. Waste (CRF sector6)
National Greenhouse Gas Inventory Report of Japan 2006 Page 8.9
Table 8-6 Activity of emissions from controlled disposal sites (kt)
8.1.2. Emissions from Other Controlled Landfill Sites (6.A.3)
(a) Emissions from Illegal Disposal
Background
In Japan, waste is disposed of in landfill sites pursuant to the Wastes Disposal and Public Cleansing Law, but a small portion is disposed of illegally. Although this disposal in reality generally satisfies the conditions of controlled disposal sites as defined in the Revised 1996 IPCC Guidelines, because it is not appropriate management under the law, methane emissions arising from illegal disposal are put under “Other (6.A.3.).”
Methodology
“Waste wood” and “waste paper” are types of waste which contain biodegradable carbon content and which are illegally disposed without incineration, but because the amount of waste paper that remains is very small, only waste wood is estimated.
Just as with emissions from controlled disposal sites (6.A.1.), a unique Japanese method is used for estimation. Emissions from the part of the wood that is illegally disposed of without incineration are estimated by multiplying an emission factor by the amount of wood (dry basis) that degrades in the estimation year.
Emission Factors
Almost all instances of illegal dumping in Japan are anaerobic landfilling, and therefore the emission factor used is the same as that of anaerobic disposal sites for “waste wood emissions from controlled disposal sites”.
Activity Data
The residual portion of illegally disposed of waste wood is multiplied by the percentage of solids and the decomposition rate to arrive at activity data. The amount of illegally disposed of waste wood is determined from Waste Wood (Construction and Demolition) in “Study on Residual Amounts of Industrial Waste from Illegal Dumping and other Sources” (Ministry of the
Item Unit 1990 1995 2000 2003 2004Kitchen Garbage kt / year (dry) 494 520 439 344 308Paper kt / year (dry) 1,269 1,195 1,021 845 789Natural fiber kt / year (dry) 72 66 52 43 41Wood and Bamboo kt / year (dry) 336 424 495 527 535Sewage sludge kt / year (dry) 294 292 224 171 152Sludge from human wastetreatment and septic tank kt / year (dry) 52 53 53 51 50
water purification sludge kt / year (dry) 200 197 158 137 132organic sludge frommanufacturing industries kt / year (dry) 401 346 174 111 100
livestock waste kt / year (dry) 181 221 212 182 191Total kt / year (dry) 3,297 3,313 2,827 2,413 2,298
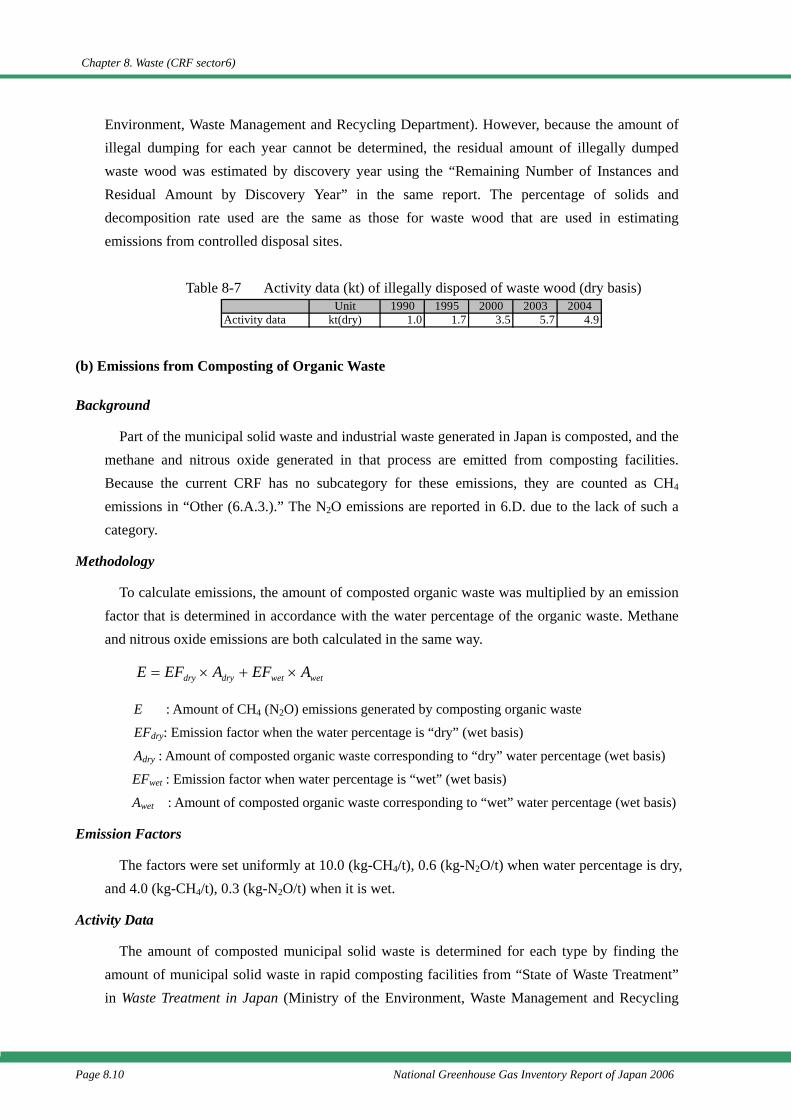
Chapter 8. Waste (CRF sector6)
Page 8.10 National Greenhouse Gas Inventory Report of Japan 2006
Environment, Waste Management and Recycling Department). However, because the amount of illegal dumping for each year cannot be determined, the residual amount of illegally dumped waste wood was estimated by discovery year using the “Remaining Number of Instances and Residual Amount by Discovery Year” in the same report. The percentage of solids and decomposition rate used are the same as those for waste wood that are used in estimating emissions from controlled disposal sites.
Table 8-7 Activity data (kt) of illegally disposed of waste wood (dry basis)
(b) Emissions from Composting of Organic Waste
Background
Part of the municipal solid waste and industrial waste generated in Japan is composted, and the methane and nitrous oxide generated in that process are emitted from composting facilities. Because the current CRF has no subcategory for these emissions, they are counted as CH4 emissions in “Other (6.A.3.).” The N2O emissions are reported in 6.D. due to the lack of such a category.
Methodology
To calculate emissions, the amount of composted organic waste was multiplied by an emission factor that is determined in accordance with the water percentage of the organic waste. Methane and nitrous oxide emissions are both calculated in the same way.
wetwetdrydry AEFAEFE ×+×=
E : Amount of CH4 (N2O) emissions generated by composting organic waste
EFdry: Emission factor when the water percentage is “dry” (wet basis)
Adry : Amount of composted organic waste corresponding to “dry” water percentage (wet basis)
EFwet : Emission factor when water percentage is “wet” (wet basis)
Awet : Amount of composted organic waste corresponding to “wet” water percentage (wet basis)
Emission Factors
The factors were set uniformly at 10.0 (kg-CH4/t), 0.6 (kg-N2O/t) when water percentage is dry, and 4.0 (kg-CH4/t), 0.3 (kg-N2O/t) when it is wet.
Activity Data
The amount of composted municipal solid waste is determined for each type by finding the amount of municipal solid waste in rapid composting facilities from “State of Waste Treatment” in Waste Treatment in Japan (Ministry of the Environment, Waste Management and Recycling
Unit 1990 1995 2000 2003 2004Activity data kt(dry) 1.0 1.7 3.5 5.7 4.9
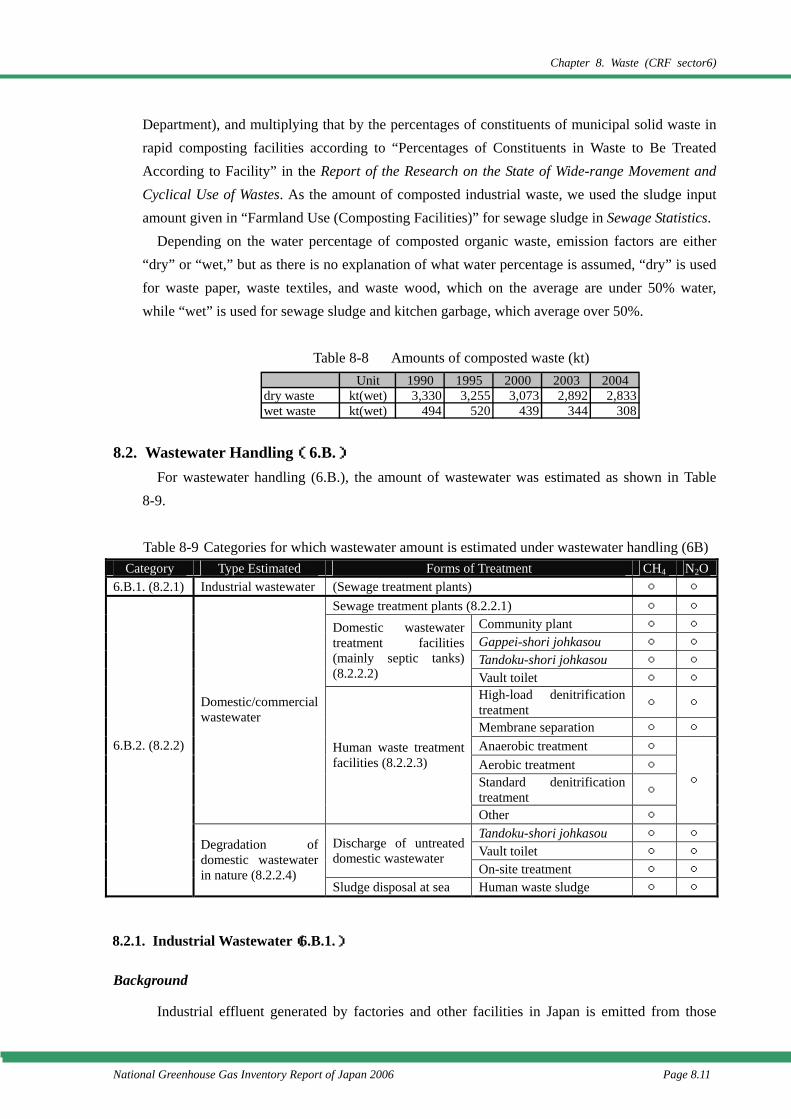
Chapter 8. Waste (CRF sector6)
National Greenhouse Gas Inventory Report of Japan 2006 Page 8.11
Department), and multiplying that by the percentages of constituents of municipal solid waste in rapid composting facilities according to “Percentages of Constituents in Waste to Be Treated According to Facility” in the Report of the Research on the State of Wide-range Movement and Cyclical Use of Wastes. As the amount of composted industrial waste, we used the sludge input amount given in “Farmland Use (Composting Facilities)” for sewage sludge in Sewage Statistics.
Depending on the water percentage of composted organic waste, emission factors are either “dry” or “wet,” but as there is no explanation of what water percentage is assumed, “dry” is used for waste paper, waste textiles, and waste wood, which on the average are under 50% water, while “wet” is used for sewage sludge and kitchen garbage, which average over 50%.
Table 8-8 Amounts of composted waste (kt)
8.2. Wastewater Handling(6.B.) For wastewater handling (6.B.), the amount of wastewater was estimated as shown in Table
8-9.
Table 8-9 Categories for which wastewater amount is estimated under wastewater handling (6B) Category Type Estimated Forms of Treatment CH4 N2O
6.B.1. (8.2.1) Industrial wastewater (Sewage treatment plants) ○ ○ Sewage treatment plants (8.2.2.1) ○ ○
Community plant ○ ○ Gappei-shori johkasou ○ ○ Tandoku-shori johkasou ○ ○
Domestic wastewater treatment facilities (mainly septic tanks) (8.2.2.2) Vault toilet ○ ○
High-load denitrification treatment ○ ○
Membrane separation ○ ○ Anaerobic treatment ○ Aerobic treatment ○ Standard denitrification treatment ○
Domestic/commercial wastewater
Human waste treatment facilities (8.2.2.3)
Other ○
○
Tandoku-shori johkasou ○ ○ Vault toilet ○ ○ Discharge of untreated
domestic wastewater On-site treatment ○ ○
6.B.2. (8.2.2)
Degradation of domestic wastewater in nature (8.2.2.4)
Sludge disposal at sea Human waste sludge ○ ○
8.2.1. Industrial Wastewater(6.B.1.)
Background
Industrial effluent generated by factories and other facilities in Japan is emitted from those
Unit 1990 1995 2000 2003 2004dry waste kt(wet) 3,330 3,255 3,073 2,892 2,833wet waste kt(wet) 494 520 439 344 308
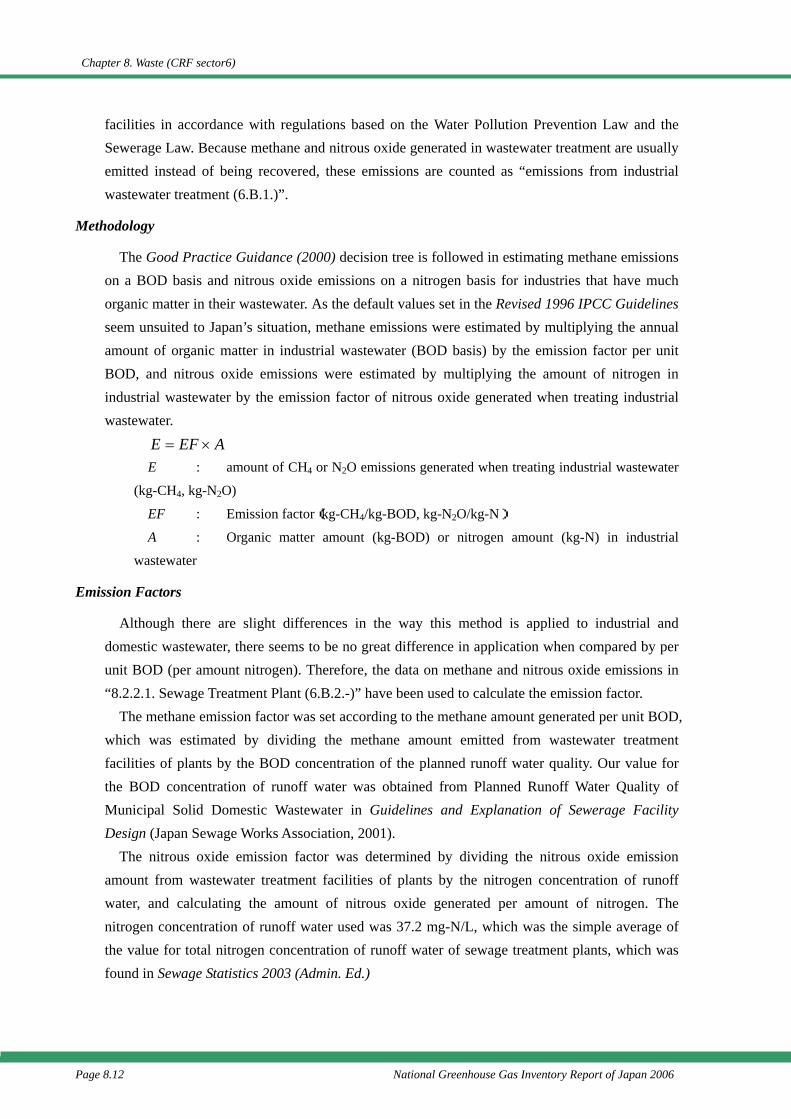
Chapter 8. Waste (CRF sector6)
Page 8.12 National Greenhouse Gas Inventory Report of Japan 2006
facilities in accordance with regulations based on the Water Pollution Prevention Law and the Sewerage Law. Because methane and nitrous oxide generated in wastewater treatment are usually emitted instead of being recovered, these emissions are counted as “emissions from industrial wastewater treatment (6.B.1.)”.
Methodology
The Good Practice Guidance (2000) decision tree is followed in estimating methane emissions on a BOD basis and nitrous oxide emissions on a nitrogen basis for industries that have much organic matter in their wastewater. As the default values set in the Revised 1996 IPCC Guidelines seem unsuited to Japan’s situation, methane emissions were estimated by multiplying the annual amount of organic matter in industrial wastewater (BOD basis) by the emission factor per unit BOD, and nitrous oxide emissions were estimated by multiplying the amount of nitrogen in industrial wastewater by the emission factor of nitrous oxide generated when treating industrial wastewater.
AEFE ×= E : amount of CH4 or N2O emissions generated when treating industrial wastewater
(kg-CH4, kg-N2O)
EF : Emission factor(kg-CH4/kg-BOD, kg-N2O/kg-N)
A : Organic matter amount (kg-BOD) or nitrogen amount (kg-N) in industrial
wastewater
Emission Factors
Although there are slight differences in the way this method is applied to industrial and domestic wastewater, there seems to be no great difference in application when compared by per unit BOD (per amount nitrogen). Therefore, the data on methane and nitrous oxide emissions in “8.2.2.1. Sewage Treatment Plant (6.B.2.-)” have been used to calculate the emission factor.
The methane emission factor was set according to the methane amount generated per unit BOD, which was estimated by dividing the methane amount emitted from wastewater treatment facilities of plants by the BOD concentration of the planned runoff water quality. Our value for the BOD concentration of runoff water was obtained from Planned Runoff Water Quality of Municipal Solid Domestic Wastewater in Guidelines and Explanation of Sewerage Facility Design (Japan Sewage Works Association, 2001).
The nitrous oxide emission factor was determined by dividing the nitrous oxide emission amount from wastewater treatment facilities of plants by the nitrogen concentration of runoff water, and calculating the amount of nitrous oxide generated per amount of nitrogen. The nitrogen concentration of runoff water used was 37.2 mg-N/L, which was the simple average of the value for total nitrogen concentration of runoff water of sewage treatment plants, which was found in Sewage Statistics 2003 (Admin. Ed.)
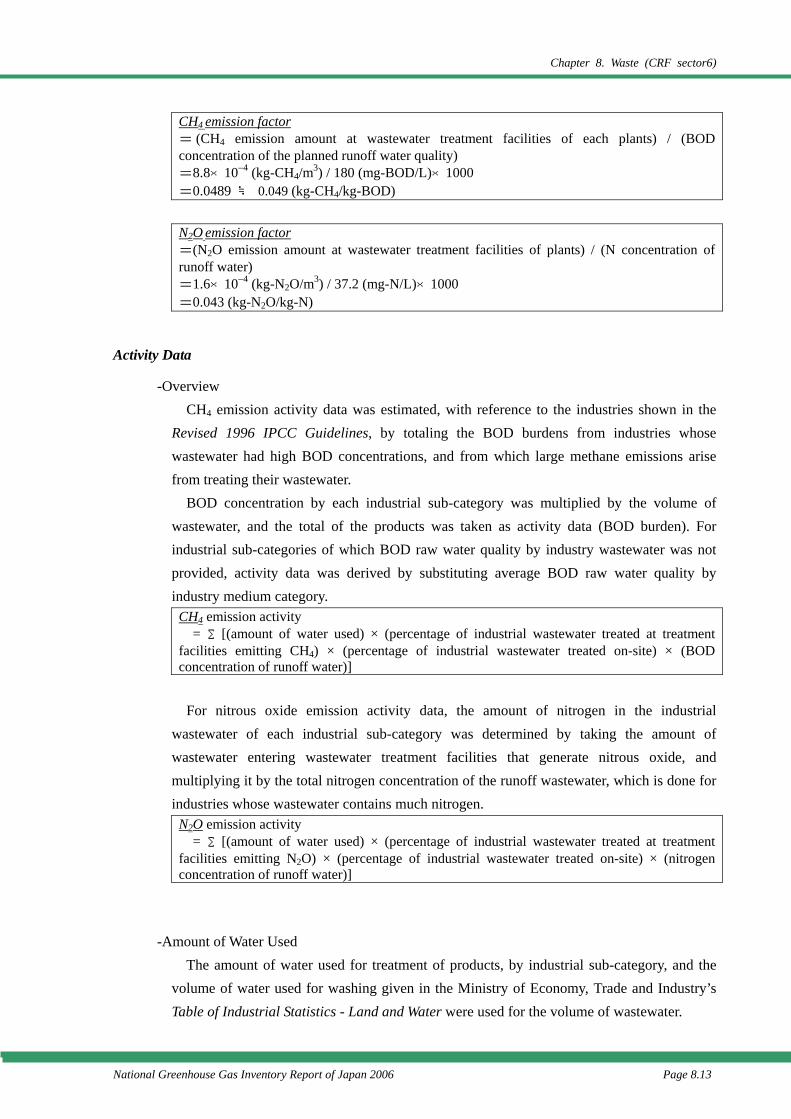
Chapter 8. Waste (CRF sector6)
National Greenhouse Gas Inventory Report of Japan 2006 Page 8.13
CH4 emission factor = (CH4 emission amount at wastewater treatment facilities of each plants) / (BOD concentration of the planned runoff water quality) =8.8×10⁻⁴ (kg-CH4/m3) / 180 (mg-BOD/L)×1000 =0.0489 ≒ 0.049 (kg-CH4/kg-BOD)
N2O emission factor =(N2O emission amount at wastewater treatment facilities of plants) / (N concentration of runoff water) =1.6×10⁻⁴ (kg-N2O/m3) / 37.2 (mg-N/L)×1000 =0.043 (kg-N2O/kg-N)
Activity Data
-Overview CH4 emission activity data was estimated, with reference to the industries shown in the
Revised 1996 IPCC Guidelines, by totaling the BOD burdens from industries whose wastewater had high BOD concentrations, and from which large methane emissions arise from treating their wastewater.
BOD concentration by each industrial sub-category was multiplied by the volume of wastewater, and the total of the products was taken as activity data (BOD burden). For industrial sub-categories of which BOD raw water quality by industry wastewater was not provided, activity data was derived by substituting average BOD raw water quality by industry medium category.
CH4 emission activity = ∑[(amount of water used) × (percentage of industrial wastewater treated at treatment
facilities emitting CH4) × (percentage of industrial wastewater treated on-site) × (BOD concentration of runoff water)]
For nitrous oxide emission activity data, the amount of nitrogen in the industrial
wastewater of each industrial sub-category was determined by taking the amount of wastewater entering wastewater treatment facilities that generate nitrous oxide, and multiplying it by the total nitrogen concentration of the runoff wastewater, which is done for industries whose wastewater contains much nitrogen.
N2O emission activity = ∑[(amount of water used) × (percentage of industrial wastewater treated at treatment
facilities emitting N2O) × (percentage of industrial wastewater treated on-site) × (nitrogen concentration of runoff water)]
-Amount of Water Used The amount of water used for treatment of products, by industrial sub-category, and the
volume of water used for washing given in the Ministry of Economy, Trade and Industry’s Table of Industrial Statistics - Land and Water were used for the volume of wastewater.
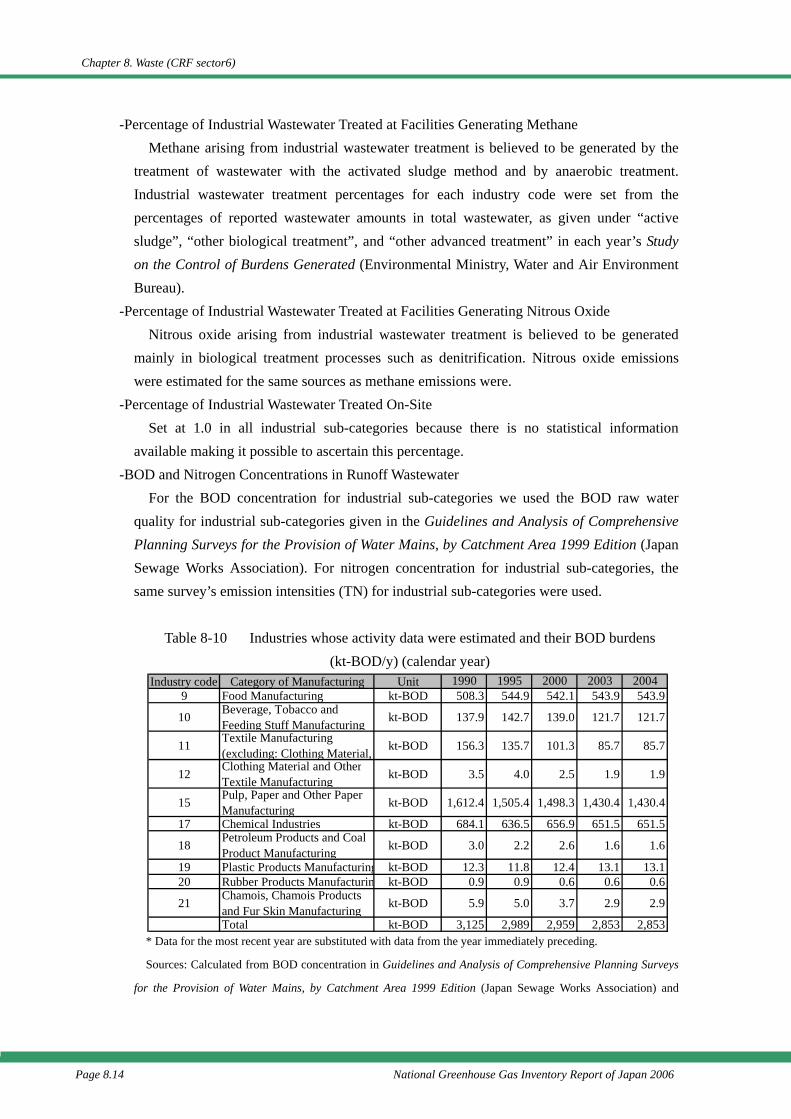
Chapter 8. Waste (CRF sector6)
Page 8.14 National Greenhouse Gas Inventory Report of Japan 2006
-Percentage of Industrial Wastewater Treated at Facilities Generating Methane Methane arising from industrial wastewater treatment is believed to be generated by the
treatment of wastewater with the activated sludge method and by anaerobic treatment. Industrial wastewater treatment percentages for each industry code were set from the percentages of reported wastewater amounts in total wastewater, as given under “active sludge”, “other biological treatment”, and “other advanced treatment” in each year’s Study on the Control of Burdens Generated (Environmental Ministry, Water and Air Environment Bureau).
-Percentage of Industrial Wastewater Treated at Facilities Generating Nitrous Oxide Nitrous oxide arising from industrial wastewater treatment is believed to be generated
mainly in biological treatment processes such as denitrification. Nitrous oxide emissions were estimated for the same sources as methane emissions were.
-Percentage of Industrial Wastewater Treated On-Site Set at 1.0 in all industrial sub-categories because there is no statistical information
available making it possible to ascertain this percentage. -BOD and Nitrogen Concentrations in Runoff Wastewater
For the BOD concentration for industrial sub-categories we used the BOD raw water quality for industrial sub-categories given in the Guidelines and Analysis of Comprehensive Planning Surveys for the Provision of Water Mains, by Catchment Area 1999 Edition (Japan Sewage Works Association). For nitrogen concentration for industrial sub-categories, the same survey’s emission intensities (TN) for industrial sub-categories were used.
Table 8-10 Industries whose activity data were estimated and their BOD burdens
(kt-BOD/y) (calendar year)
* Data for the most recent year are substituted with data from the year immediately preceding.
Sources: Calculated from BOD concentration in Guidelines and Analysis of Comprehensive Planning Surveys
for the Provision of Water Mains, by Catchment Area 1999 Edition (Japan Sewage Works Association) and
Industry code Category of Manufacturing Unit 1990 1995 2000 2003 20049 Food Manufacturing kt-BOD 508.3 544.9 542.1 543.9 543.9
10 Beverage, Tobacco andFeeding Stuff Manufacturing kt-BOD 137.9 142.7 139.0 121.7 121.7
11 Textile Manufacturing(excluding: Clothing Material, kt-BOD 156.3 135.7 101.3 85.7 85.7
12 Clothing Material and OtherTextile Manufacturing kt-BOD 3.5 4.0 2.5 1.9 1.9
15 Pulp, Paper and Other PaperManufacturing kt-BOD 1,612.4 1,505.4 1,498.3 1,430.4 1,430.4
17 Chemical Industries kt-BOD 684.1 636.5 656.9 651.5 651.5
18 Petroleum Products and CoalProduct Manufacturing kt-BOD 3.0 2.2 2.6 1.6 1.6
19 Plastic Products Manufacturing kt-BOD 12.3 11.8 12.4 13.1 13.120 Rubber Products Manufacturin kt-BOD 0.9 0.9 0.6 0.6 0.6
21 Chamois, Chamois Productsand Fur Skin Manufacturing kt-BOD 5.9 5.0 3.7 2.9 2.9
Total kt-BOD 3,125 2,989 2,959 2,853 2,853
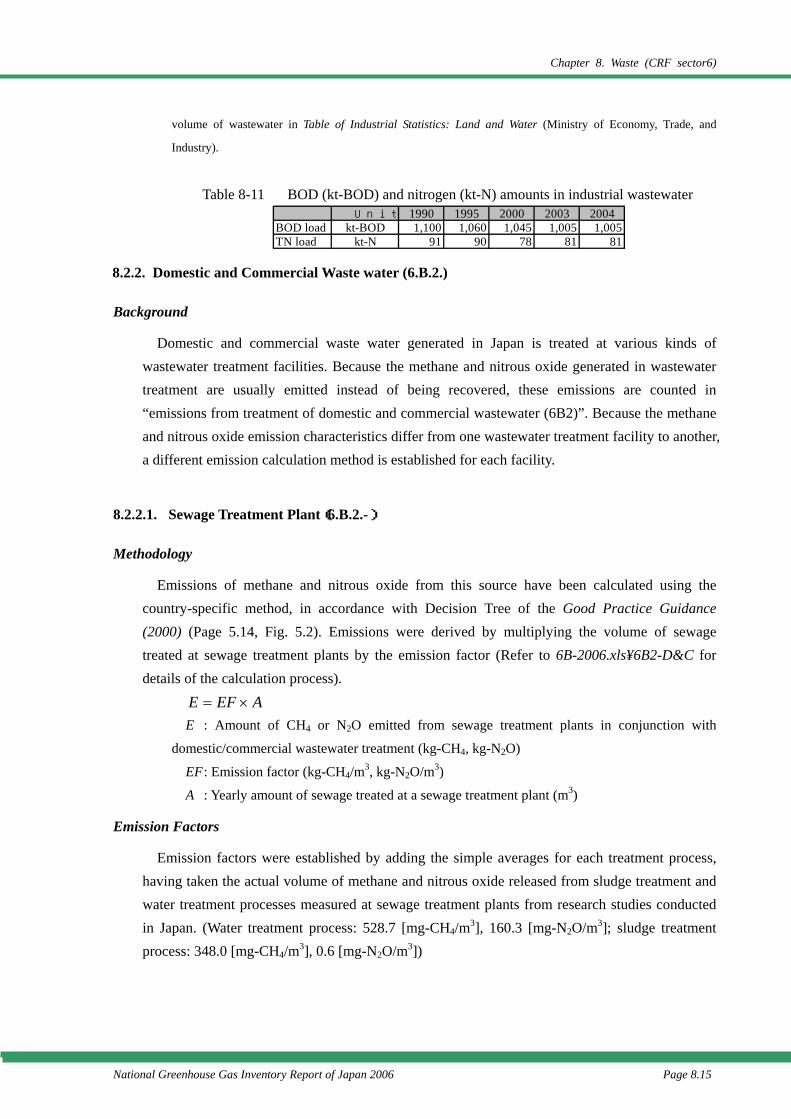
Chapter 8. Waste (CRF sector6)
National Greenhouse Gas Inventory Report of Japan 2006 Page 8.15
volume of wastewater in Table of Industrial Statistics: Land and Water (Ministry of Economy, Trade, and
Industry).
Table 8-11 BOD (kt-BOD) and nitrogen (kt-N) amounts in industrial wastewater
8.2.2. Domestic and Commercial Waste water (6.B.2.)
Background
Domestic and commercial waste water generated in Japan is treated at various kinds of wastewater treatment facilities. Because the methane and nitrous oxide generated in wastewater treatment are usually emitted instead of being recovered, these emissions are counted in “emissions from treatment of domestic and commercial wastewater (6B2)”. Because the methane and nitrous oxide emission characteristics differ from one wastewater treatment facility to another, a different emission calculation method is established for each facility.
8.2.2.1. Sewage Treatment Plant(6.B.2.-)
Methodology
Emissions of methane and nitrous oxide from this source have been calculated using the country-specific method, in accordance with Decision Tree of the Good Practice Guidance (2000) (Page 5.14, Fig. 5.2). Emissions were derived by multiplying the volume of sewage treated at sewage treatment plants by the emission factor (Refer to 6B-2006.xls¥6B2-D&C for details of the calculation process).
AEFE ×= E : Amount of CH4 or N2O emitted from sewage treatment plants in conjunction with
domestic/commercial wastewater treatment (kg-CH4, kg-N2O)
EF : Emission factor (kg-CH4/m3, kg-N2O/m3)
A : Yearly amount of sewage treated at a sewage treatment plant (m3)
Emission Factors
Emission factors were established by adding the simple averages for each treatment process, having taken the actual volume of methane and nitrous oxide released from sludge treatment and water treatment processes measured at sewage treatment plants from research studies conducted in Japan. (Water treatment process: 528.7 [mg-CH4/m3], 160.3 [mg-N2O/m3]; sludge treatment process: 348.0 [mg-CH4/m3], 0.6 [mg-N2O/m3])
Unit 1990 1995 2000 2003 2004BOD load kt-BOD 1,100 1,060 1,045 1,005 1,005TN load kt-N 91 90 78 81 81
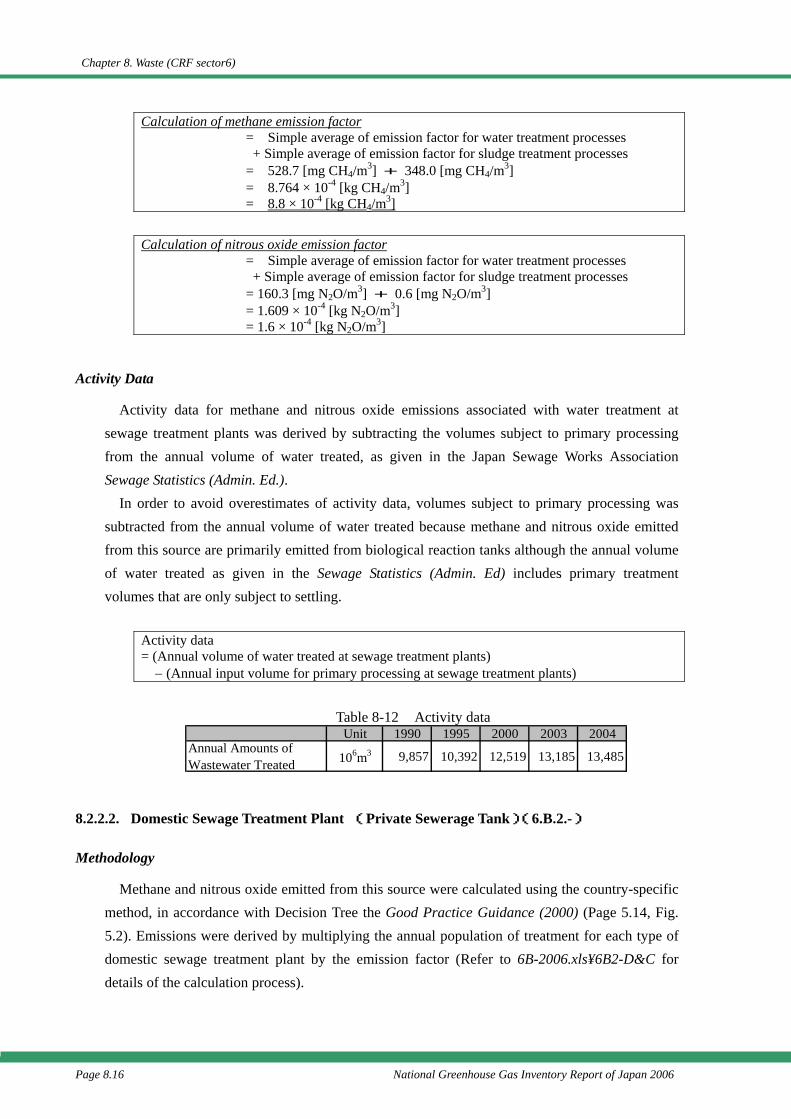
Chapter 8. Waste (CRF sector6)
Page 8.16 National Greenhouse Gas Inventory Report of Japan 2006
Calculation of methane emission factor = Simple average of emission factor for water treatment processes + Simple average of emission factor for sludge treatment processes
= 528.7 [mg CH4/m3] + 348.0 [mg CH4/m3] = 8.764 × 10⁻⁴ [kg CH4/m3] = 8.8 × 10⁻⁴ [kg CH4/m3]
Calculation of nitrous oxide emission factor
= Simple average of emission factor for water treatment processes + Simple average of emission factor for sludge treatment processes
= 160.3 [mg N2O/m3] + 0.6 [mg N2O/m3] = 1.609 × 10⁻⁴ [kg N2O/m3] = 1.6 × 10⁻⁴ [kg N2O/m3]
Activity Data
Activity data for methane and nitrous oxide emissions associated with water treatment at sewage treatment plants was derived by subtracting the volumes subject to primary processing from the annual volume of water treated, as given in the Japan Sewage Works Association Sewage Statistics (Admin. Ed.).
In order to avoid overestimates of activity data, volumes subject to primary processing was subtracted from the annual volume of water treated because methane and nitrous oxide emitted from this source are primarily emitted from biological reaction tanks although the annual volume of water treated as given in the Sewage Statistics (Admin. Ed) includes primary treatment volumes that are only subject to settling.
Activity data = (Annual volume of water treated at sewage treatment plants) − (Annual input volume for primary processing at sewage treatment plants)
Table 8-12 Activity data
8.2.2.2. Domestic Sewage Treatment Plant (Private Sewerage Tank)(6.B.2.-)
Methodology
Methane and nitrous oxide emitted from this source were calculated using the country-specific method, in accordance with Decision Tree the Good Practice Guidance (2000) (Page 5.14, Fig. 5.2). Emissions were derived by multiplying the annual population of treatment for each type of domestic sewage treatment plant by the emission factor (Refer to 6B-2006.xls¥6B2-D&C for details of the calculation process).
Unit 1990 1995 2000 2003 2004Annual Amounts ofWastewater Treated 106m3 9,857 10,392 12,519 13,185 13,485
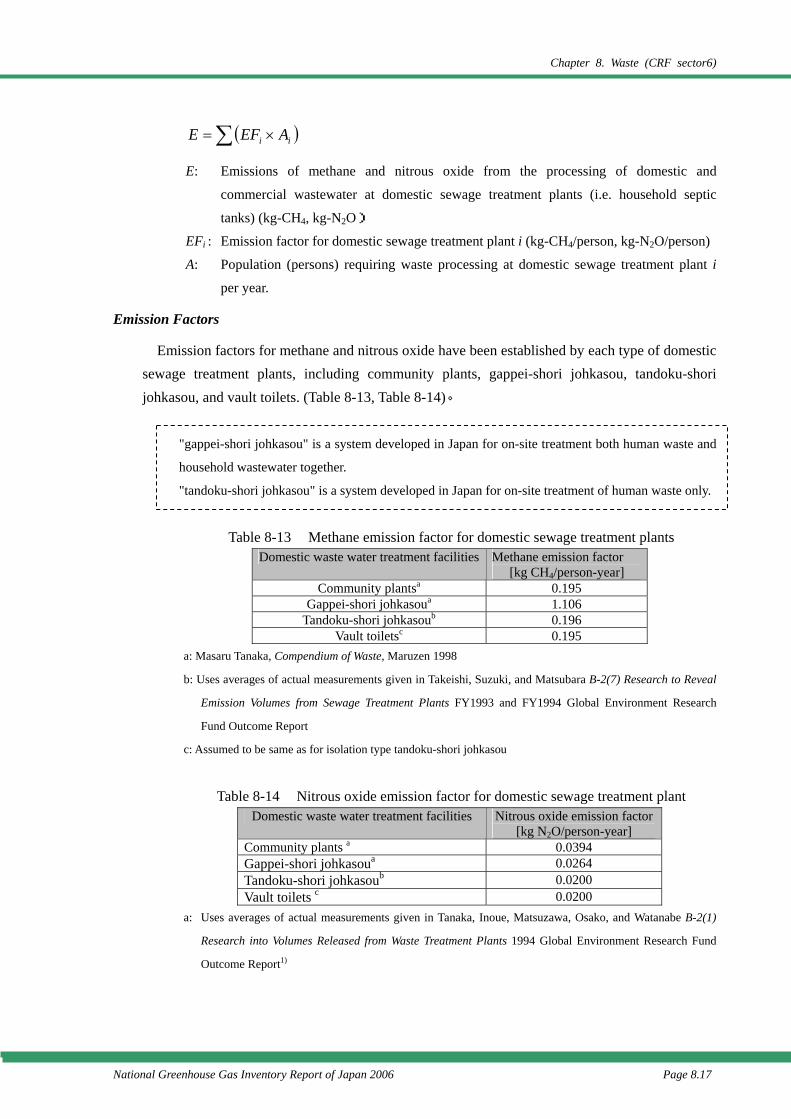
Chapter 8. Waste (CRF sector6)
National Greenhouse Gas Inventory Report of Japan 2006 Page 8.17
( )∑ ×= ii AEFE
E: Emissions of methane and nitrous oxide from the processing of domestic and
commercial wastewater at domestic sewage treatment plants (i.e. household septic
tanks) (kg-CH4, kg-N2O)
EFi : Emission factor for domestic sewage treatment plant i (kg-CH4/person, kg-N2O/person)
A: Population (persons) requiring waste processing at domestic sewage treatment plant i
per year.
Emission Factors
Emission factors for methane and nitrous oxide have been established by each type of domestic sewage treatment plants, including community plants, gappei-shori johkasou, tandoku-shori johkasou, and vault toilets. (Table 8-13, Table 8-14)。
"gappei-shori johkasou" is a system developed in Japan for on-site treatment both human waste and
household wastewater together.
"tandoku-shori johkasou" is a system developed in Japan for on-site treatment of human waste only.
Table 8-13 Methane emission factor for domestic sewage treatment plants
Domestic waste water treatment facilities Methane emission factor [kg CH4/person-year]
Community plantsa 0.195 Gappei-shori johkasoua 1.106
Tandoku-shori johkasoub 0.196 Vault toiletsc 0.195
a: Masaru Tanaka, Compendium of Waste, Maruzen 1998
b: Uses averages of actual measurements given in Takeishi, Suzuki, and Matsubara B-2(7) Research to Reveal
Emission Volumes from Sewage Treatment Plants FY1993 and FY1994 Global Environment Research
Fund Outcome Report
c: Assumed to be same as for isolation type tandoku-shori johkasou
Table 8-14 Nitrous oxide emission factor for domestic sewage treatment plant
Domestic waste water treatment facilities Nitrous oxide emission factor [kg N2O/person-year]
Community plants a 0.0394 Gappei-shori johkasoua 0.0264 Tandoku-shori johkasoub 0.0200 Vault toilets c 0.0200
a: Uses averages of actual measurements given in Tanaka, Inoue, Matsuzawa, Osako, and Watanabe B-2(1)
Research into Volumes Released from Waste Treatment Plants 1994 Global Environment Research Fund
Outcome Report1)
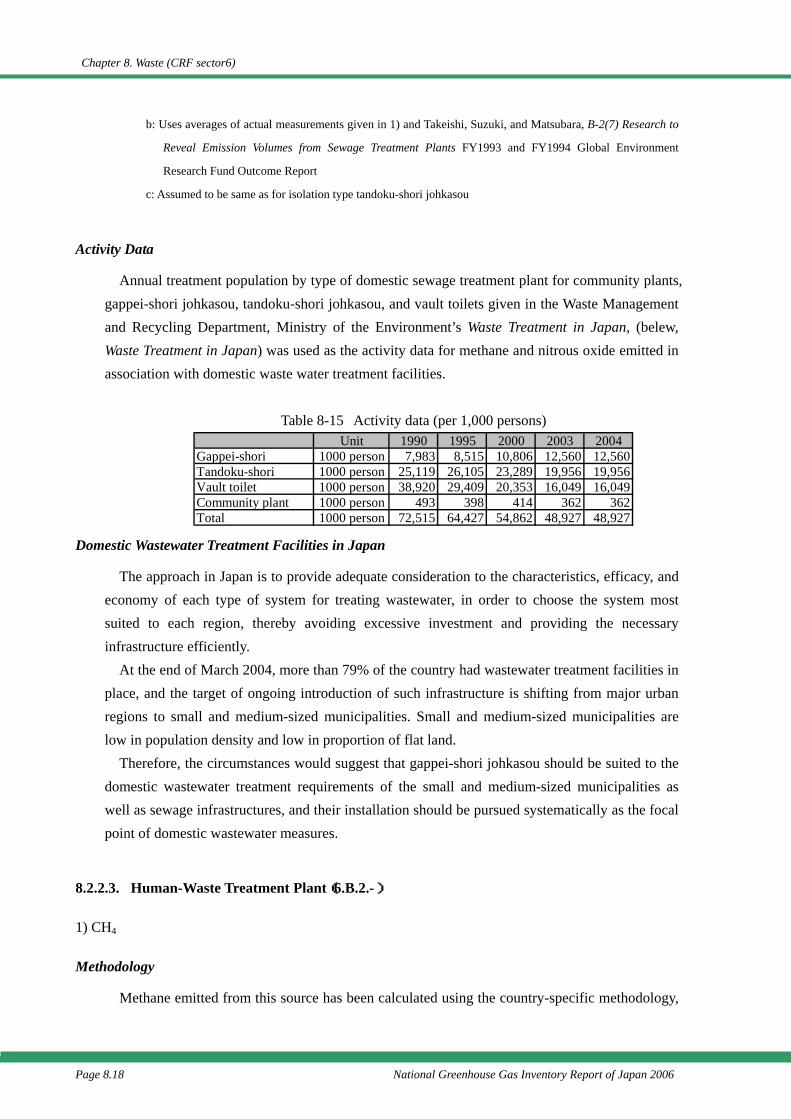
Chapter 8. Waste (CRF sector6)
Page 8.18 National Greenhouse Gas Inventory Report of Japan 2006
b: Uses averages of actual measurements given in 1) and Takeishi, Suzuki, and Matsubara, B-2(7) Research to
Reveal Emission Volumes from Sewage Treatment Plants FY1993 and FY1994 Global Environment
Research Fund Outcome Report
c: Assumed to be same as for isolation type tandoku-shori johkasou
Activity Data
Annual treatment population by type of domestic sewage treatment plant for community plants, gappei-shori johkasou, tandoku-shori johkasou, and vault toilets given in the Waste Management and Recycling Department, Ministry of the Environment’s Waste Treatment in Japan, (belew, Waste Treatment in Japan) was used as the activity data for methane and nitrous oxide emitted in association with domestic waste water treatment facilities.
Table 8-15 Activity data (per 1,000 persons)
Domestic Wastewater Treatment Facilities in Japan
The approach in Japan is to provide adequate consideration to the characteristics, efficacy, and economy of each type of system for treating wastewater, in order to choose the system most suited to each region, thereby avoiding excessive investment and providing the necessary infrastructure efficiently.
At the end of March 2004, more than 79% of the country had wastewater treatment facilities in place, and the target of ongoing introduction of such infrastructure is shifting from major urban regions to small and medium-sized municipalities. Small and medium-sized municipalities are low in population density and low in proportion of flat land.
Therefore, the circumstances would suggest that gappei-shori johkasou should be suited to the domestic wastewater treatment requirements of the small and medium-sized municipalities as well as sewage infrastructures, and their installation should be pursued systematically as the focal point of domestic wastewater measures.
8.2.2.3. Human-Waste Treatment Plant(6.B.2.-)
1) CH4
Methodology
Methane emitted from this source has been calculated using the country-specific methodology,
Unit 1990 1995 2000 2003 2004Gappei-shori 1000 person 7,983 8,515 10,806 12,560 12,560Tandoku-shori 1000 person 25,119 26,105 23,289 19,956 19,956Vault toilet 1000 person 38,920 29,409 20,353 16,049 16,049Community plant 1000 person 493 398 414 362 362Total 1000 person 72,515 64,427 54,862 48,927 48,927
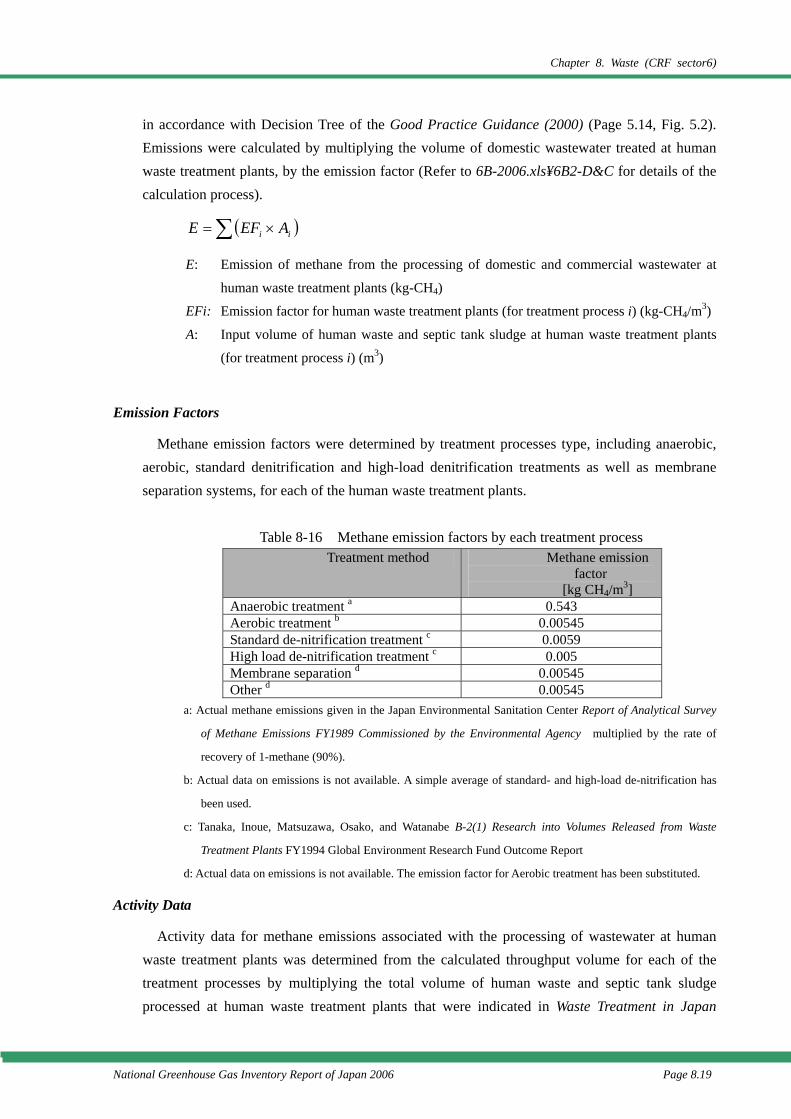
Chapter 8. Waste (CRF sector6)
National Greenhouse Gas Inventory Report of Japan 2006 Page 8.19
in accordance with Decision Tree of the Good Practice Guidance (2000) (Page 5.14, Fig. 5.2). Emissions were calculated by multiplying the volume of domestic wastewater treated at human waste treatment plants, by the emission factor (Refer to 6B-2006.xls¥6B2-D&C for details of the calculation process).
( )∑ ×= ii AEFE
E: Emission of methane from the processing of domestic and commercial wastewater at
human waste treatment plants (kg-CH4)
EFi: Emission factor for human waste treatment plants (for treatment process i) (kg-CH4/m3)
A: Input volume of human waste and septic tank sludge at human waste treatment plants
(for treatment process i) (m3)
Emission Factors
Methane emission factors were determined by treatment processes type, including anaerobic, aerobic, standard denitrification and high-load denitrification treatments as well as membrane separation systems, for each of the human waste treatment plants.
Table 8-16 Methane emission factors by each treatment process
Treatment method Methane emission factor
[kg CH4/m3] Anaerobic treatment a 0.543 Aerobic treatment b 0.00545 Standard de-nitrification treatment c 0.0059 High load de-nitrification treatment c 0.005 Membrane separation d 0.00545 Other d 0.00545
a: Actual methane emissions given in the Japan Environmental Sanitation Center Report of Analytical Survey
of Methane Emissions FY1989 Commissioned by the Environmental Agency multiplied by the rate of
recovery of 1-methane (90%).
b: Actual data on emissions is not available. A simple average of standard- and high-load de-nitrification has
been used.
c: Tanaka, Inoue, Matsuzawa, Osako, and Watanabe B-2(1) Research into Volumes Released from Waste
Treatment Plants FY1994 Global Environment Research Fund Outcome Report
d: Actual data on emissions is not available. The emission factor for Aerobic treatment has been substituted.
Activity Data
Activity data for methane emissions associated with the processing of wastewater at human waste treatment plants was determined from the calculated throughput volume for each of the treatment processes by multiplying the total volume of human waste and septic tank sludge processed at human waste treatment plants that were indicated in Waste Treatment in Japan
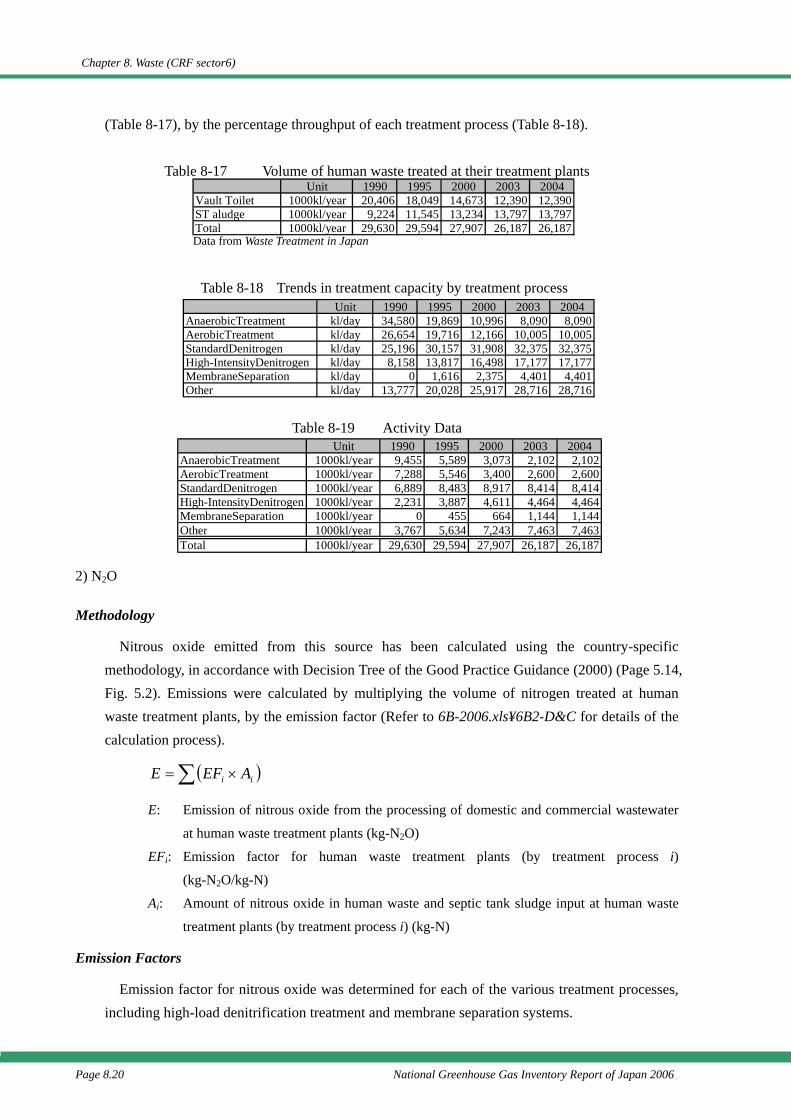
Chapter 8. Waste (CRF sector6)
Page 8.20 National Greenhouse Gas Inventory Report of Japan 2006
(Table 8-17), by the percentage throughput of each treatment process (Table 8-18).
Table 8-17 Volume of human waste treated at their treatment plants
Data from Waste Treatment in Japan
Table 8-18 Trends in treatment capacity by treatment process
Table 8-19 Activity Data
2) N2O
Methodology
Nitrous oxide emitted from this source has been calculated using the country-specific methodology, in accordance with Decision Tree of the Good Practice Guidance (2000) (Page 5.14, Fig. 5.2). Emissions were calculated by multiplying the volume of nitrogen treated at human waste treatment plants, by the emission factor (Refer to 6B-2006.xls¥6B2-D&C for details of the calculation process).
( )∑ ×= ii AEFE
E: Emission of nitrous oxide from the processing of domestic and commercial wastewater
at human waste treatment plants (kg-N2O)
EFi: Emission factor for human waste treatment plants (by treatment process i)
(kg-N2O/kg-N)
Ai: Amount of nitrous oxide in human waste and septic tank sludge input at human waste
treatment plants (by treatment process i) (kg-N)
Emission Factors
Emission factor for nitrous oxide was determined for each of the various treatment processes, including high-load denitrification treatment and membrane separation systems.
Unit 1990 1995 2000 2003 2004Vault Toilet 1000kl/year 20,406 18,049 14,673 12,390 12,390ST aludge 1000kl/year 9,224 11,545 13,234 13,797 13,797Total 1000kl/year 29,630 29,594 27,907 26,187 26,187
Unit 1990 1995 2000 2003 2004 AnaerobicTreatment kl/day 34,580 19,869 10,996 8,090 8,090
AerobicTreatment kl/day 26,654 19,716 12,166 10,005 10,005 StandardDenitrogen kl/day 25,196 30,157 31,908 32,375 32,375
High-IntensityDenitrogen kl/day 8,158 13,817 16,498 17,177 17,177 MembraneSeparation kl/day 0 1,616 2,375 4,401 4,401
Other kl/day 13,777 20,028 25,917 28,716 28,716
Unit 1990 1995 2000 2003 2004 AnaerobicTreatment 1000kl/year 9,455 5,589 3,073 2,102 2,102
AerobicTreatment 1000kl/year 7,288 5,546 3,400 2,600 2,600 StandardDenitrogen 1000kl/year 6,889 8,483 8,917 8,414 8,414
High-IntensityDenitrogen 1000kl/year 2,231 3,887 4,611 4,464 4,464 MembraneSeparation 1000kl/year 0 455 664 1,144 1,144
Other 1000kl/year 3,767 5,634 7,243 7,463 7,463Total 1000kl/year 29,630 29,594 27,907 26,187 26,187
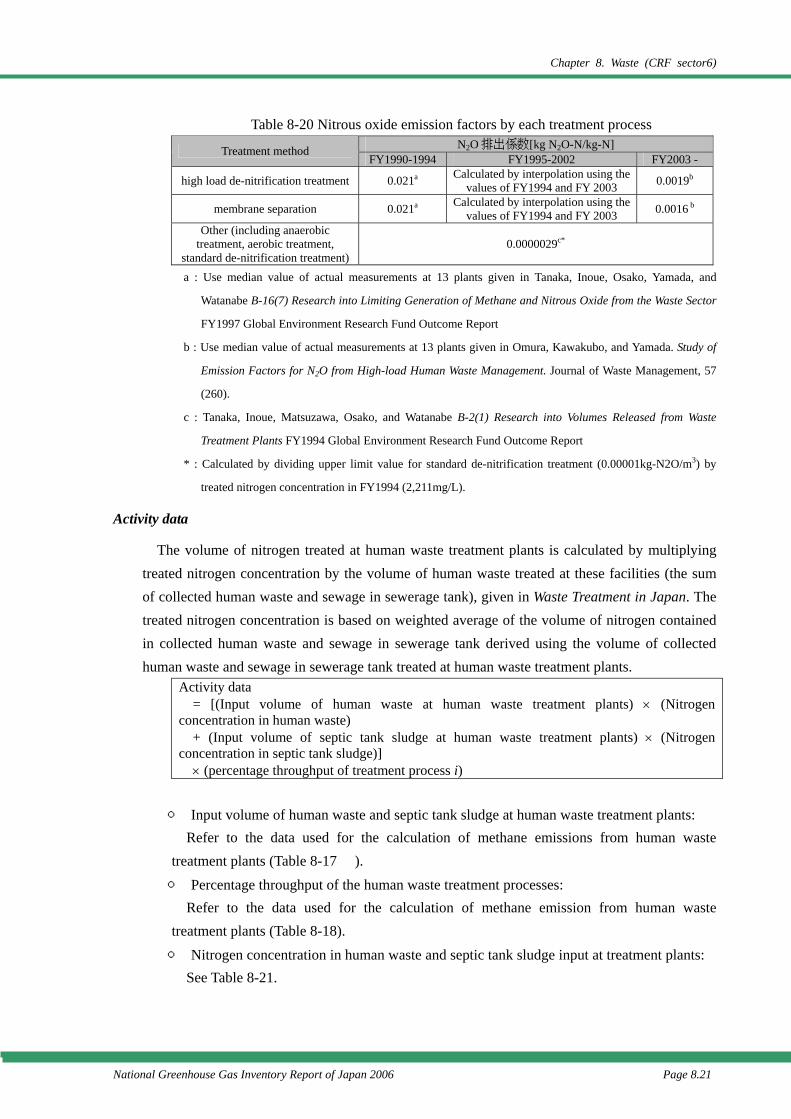
Chapter 8. Waste (CRF sector6)
National Greenhouse Gas Inventory Report of Japan 2006 Page 8.21
Table 8-20 Nitrous oxide emission factors by each treatment process N2O 排出係数[kg N2O-N/kg-N] Treatment method
FY1990-1994 FY1995-2002 FY2003 -
high load de-nitrification treatment 0.021a Calculated by interpolation using the values of FY1994 and FY 2003 0.0019b
membrane separation 0.021a Calculated by interpolation using the values of FY1994 and FY 2003 0.0016 b
Other (including anaerobic treatment, aerobic treatment,
standard de-nitrification treatment)0.0000029c*
a : Use median value of actual measurements at 13 plants given in Tanaka, Inoue, Osako, Yamada, and
Watanabe B-16(7) Research into Limiting Generation of Methane and Nitrous Oxide from the Waste Sector
FY1997 Global Environment Research Fund Outcome Report
b : Use median value of actual measurements at 13 plants given in Omura, Kawakubo, and Yamada. Study of
Emission Factors for N2O from High-load Human Waste Management. Journal of Waste Management, 57
(260).
c : Tanaka, Inoue, Matsuzawa, Osako, and Watanabe B-2(1) Research into Volumes Released from Waste
Treatment Plants FY1994 Global Environment Research Fund Outcome Report
* : Calculated by dividing upper limit value for standard de-nitrification treatment (0.00001kg-N2O/m3) by
treated nitrogen concentration in FY1994 (2,211mg/L).
Activity data
The volume of nitrogen treated at human waste treatment plants is calculated by multiplying treated nitrogen concentration by the volume of human waste treated at these facilities (the sum of collected human waste and sewage in sewerage tank), given in Waste Treatment in Japan. The treated nitrogen concentration is based on weighted average of the volume of nitrogen contained in collected human waste and sewage in sewerage tank derived using the volume of collected human waste and sewage in sewerage tank treated at human waste treatment plants.
Activity data = [(Input volume of human waste at human waste treatment plants) × (Nitrogen
concentration in human waste) + (Input volume of septic tank sludge at human waste treatment plants) × (Nitrogen
concentration in septic tank sludge)] × (percentage throughput of treatment process i)
○ Input volume of human waste and septic tank sludge at human waste treatment plants: Refer to the data used for the calculation of methane emissions from human waste
treatment plants (Table 8-17 ). ○ Percentage throughput of the human waste treatment processes:
Refer to the data used for the calculation of methane emission from human waste treatment plants (Table 8-18). ○ Nitrogen concentration in human waste and septic tank sludge input at treatment plants:
See Table 8-21.
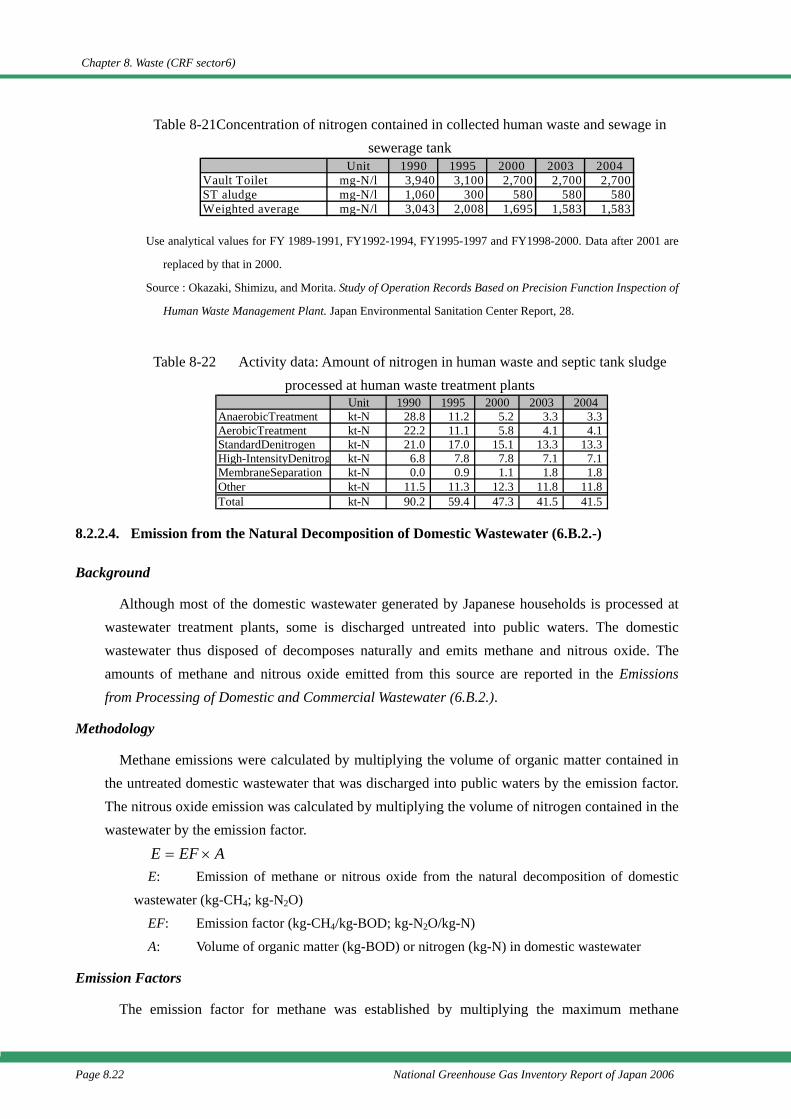
Chapter 8. Waste (CRF sector6)
Page 8.22 National Greenhouse Gas Inventory Report of Japan 2006
Table 8-21Concentration of nitrogen contained in collected human waste and sewage in sewerage tank
Use analytical values for FY 1989-1991, FY1992-1994, FY1995-1997 and FY1998-2000. Data after 2001 are
replaced by that in 2000.
Source : Okazaki, Shimizu, and Morita. Study of Operation Records Based on Precision Function Inspection of
Human Waste Management Plant. Japan Environmental Sanitation Center Report, 28.
Table 8-22 Activity data: Amount of nitrogen in human waste and septic tank sludge processed at human waste treatment plants
8.2.2.4. Emission from the Natural Decomposition of Domestic Wastewater (6.B.2.-)
Background
Although most of the domestic wastewater generated by Japanese households is processed at wastewater treatment plants, some is discharged untreated into public waters. The domestic wastewater thus disposed of decomposes naturally and emits methane and nitrous oxide. The amounts of methane and nitrous oxide emitted from this source are reported in the Emissions from Processing of Domestic and Commercial Wastewater (6.B.2.).
Methodology
Methane emissions were calculated by multiplying the volume of organic matter contained in the untreated domestic wastewater that was discharged into public waters by the emission factor. The nitrous oxide emission was calculated by multiplying the volume of nitrogen contained in the wastewater by the emission factor.
AEFE ×= E: Emission of methane or nitrous oxide from the natural decomposition of domestic
wastewater (kg-CH4; kg-N2O)
EF: Emission factor (kg-CH4/kg-BOD; kg-N2O/kg-N)
A: Volume of organic matter (kg-BOD) or nitrogen (kg-N) in domestic wastewater
Emission Factors
The emission factor for methane was established by multiplying the maximum methane
Unit 1990 1995 2000 2003 2004Vault Toilet mg-N/l 3,940 3,100 2,700 2,700 2,700ST aludge mg-N/l 1,060 300 580 580 580Weighted average mg-N/l 3,043 2,008 1,695 1,583 1,583
Unit 1990 1995 2000 2003 2004 AnaerobicTreatment kt-N 28.8 11.2 5.2 3.3 3.3
AerobicTreatment kt-N 22.2 11.1 5.8 4.1 4.1 StandardDenitrogen kt-N 21.0 17.0 15.1 13.3 13.3
High-IntensityDenitrog kt-N 6.8 7.8 7.8 7.1 7.1 MembraneSeparation kt-N 0.0 0.9 1.1 1.8 1.8
Other kt-N 11.5 11.3 12.3 11.8 11.8Total kt-N 90.2 59.4 47.3 41.5 41.5
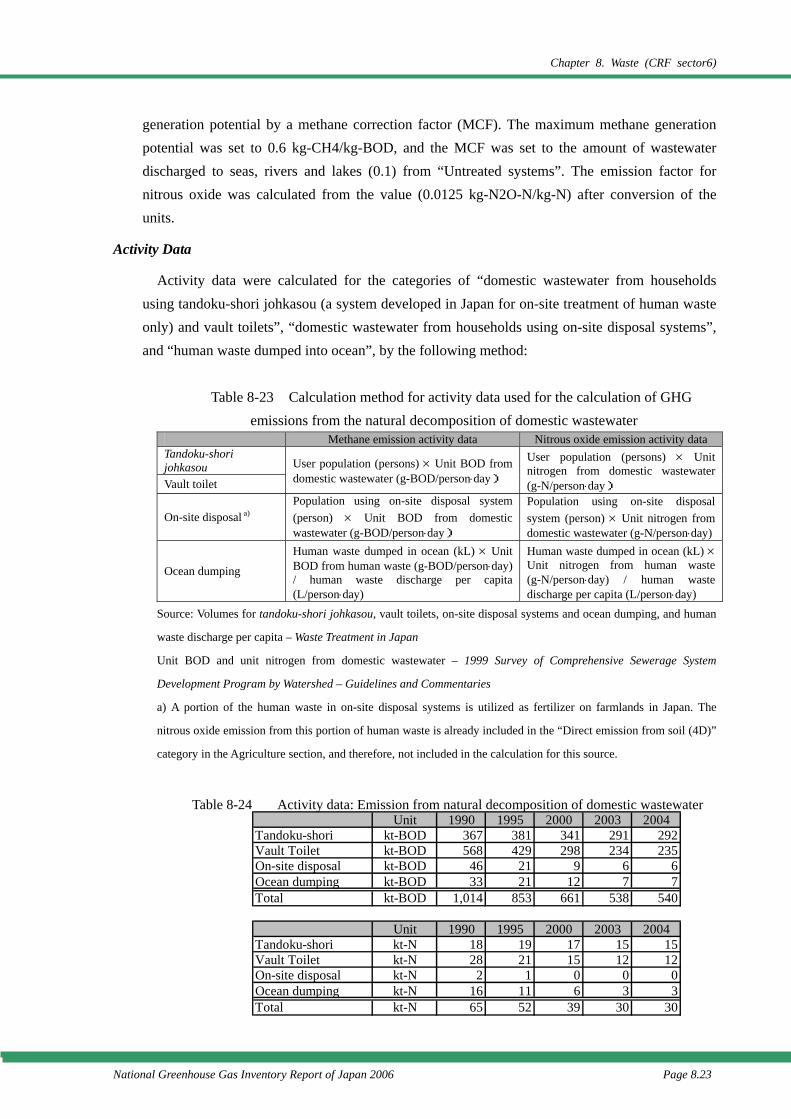
Chapter 8. Waste (CRF sector6)
National Greenhouse Gas Inventory Report of Japan 2006 Page 8.23
generation potential by a methane correction factor (MCF). The maximum methane generation potential was set to 0.6 kg-CH4/kg-BOD, and the MCF was set to the amount of wastewater discharged to seas, rivers and lakes (0.1) from “Untreated systems”. The emission factor for nitrous oxide was calculated from the value (0.0125 kg-N2O-N/kg-N) after conversion of the units.
Activity Data
Activity data were calculated for the categories of “domestic wastewater from households using tandoku-shori johkasou (a system developed in Japan for on-site treatment of human waste only) and vault toilets”, “domestic wastewater from households using on-site disposal systems”, and “human waste dumped into ocean”, by the following method:
Table 8-23 Calculation method for activity data used for the calculation of GHG
emissions from the natural decomposition of domestic wastewater Methane emission activity data Nitrous oxide emission activity data
Tandoku-shori johkasou Vault toilet
User population (persons) × Unit BOD from domestic wastewater (g-BOD/person⋅day)
User population (persons) × Unit nitrogen from domestic wastewater (g-N/person⋅day)
On-site disposal a) Population using on-site disposal system (person) × Unit BOD from domestic wastewater (g-BOD/person⋅day)
Population using on-site disposal system (person) × Unit nitrogen from domestic wastewater (g-N/person⋅day)
Ocean dumping
Human waste dumped in ocean (kL) × Unit BOD from human waste (g-BOD/person⋅day) / human waste discharge per capita (L/person⋅day)
Human waste dumped in ocean (kL) × Unit nitrogen from human waste (g-N/person⋅day) / human waste discharge per capita (L/person⋅day)
Source: Volumes for tandoku-shori johkasou, vault toilets, on-site disposal systems and ocean dumping, and human
waste discharge per capita – Waste Treatment in Japan
Unit BOD and unit nitrogen from domestic wastewater – 1999 Survey of Comprehensive Sewerage System
Development Program by Watershed – Guidelines and Commentaries
a) A portion of the human waste in on-site disposal systems is utilized as fertilizer on farmlands in Japan. The
nitrous oxide emission from this portion of human waste is already included in the “Direct emission from soil (4D)”
category in the Agriculture section, and therefore, not included in the calculation for this source.
Table 8-24 Activity data: Emission from natural decomposition of domestic wastewater
Unit 1990 1995 2000 2003 2004Tandoku-shori kt-BOD 367 381 341 291 292Vault Toilet kt-BOD 568 429 298 234 235On-site disposal kt-BOD 46 21 9 6 6Ocean dumping kt-BOD 33 21 12 7 7Total kt-BOD 1,014 853 661 538 540
Unit 1990 1995 2000 2003 2004Tandoku-shori kt-N 18 19 17 15 15Vault Toilet kt-N 28 21 15 12 12On-site disposal kt-N 2 1 0 0 0Ocean dumping kt-N 16 11 6 3 3Total kt-N 65 52 39 30 30
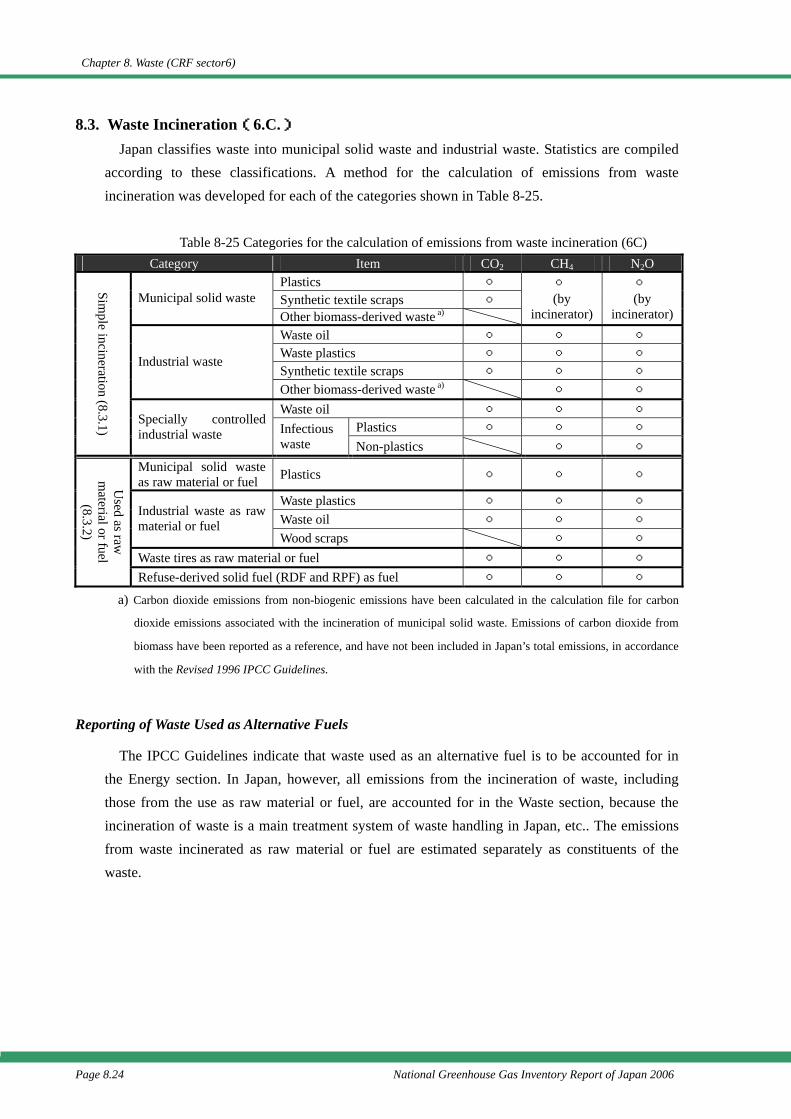
Chapter 8. Waste (CRF sector6)
Page 8.24 National Greenhouse Gas Inventory Report of Japan 2006
8.3. Waste Incineration(6.C.) Japan classifies waste into municipal solid waste and industrial waste. Statistics are compiled
according to these classifications. A method for the calculation of emissions from waste incineration was developed for each of the categories shown in Table 8-25.
Table 8-25 Categories for the calculation of emissions from waste incineration (6C) Category Item CO2 CH4 N2O
Plastics ○ Synthetic textile scraps ○ Municipal solid waste Other biomass-derived waste a)
○ (by
incinerator)
○ (by
incinerator)Waste oil ○ ○ ○ Waste plastics ○ ○ ○ Synthetic textile scraps ○ ○ ○
Industrial waste
Other biomass-derived waste a) ○ ○ Waste oil ○ ○ ○
Plastics ○ ○ ○
Simple incineration (8.3.1)
Specially controlled industrial waste Infectious
waste Non-plastics ○ ○ Municipal solid waste as raw material or fuel Plastics ○ ○ ○
Waste plastics ○ ○ ○ Waste oil ○ ○ ○
Industrial waste as raw material or fuel
Wood scraps ○ ○ Waste tires as raw material or fuel ○ ○ ○
Used as raw
m
aterial or fuel (8.3.2)
Refuse-derived solid fuel (RDF and RPF) as fuel ○ ○ ○
a) Carbon dioxide emissions from non-biogenic emissions have been calculated in the calculation file for carbon
dioxide emissions associated with the incineration of municipal solid waste. Emissions of carbon dioxide from
biomass have been reported as a reference, and have not been included in Japan’s total emissions, in accordance
with the Revised 1996 IPCC Guidelines.
Reporting of Waste Used as Alternative Fuels
The IPCC Guidelines indicate that waste used as an alternative fuel is to be accounted for in the Energy section. In Japan, however, all emissions from the incineration of waste, including those from the use as raw material or fuel, are accounted for in the Waste section, because the incineration of waste is a main treatment system of waste handling in Japan, etc.. The emissions from waste incinerated as raw material or fuel are estimated separately as constituents of the waste.
Chapter 8. Waste (CRF sector6)
National Greenhouse Gas Inventory Report of Japan 2006 Page 8.25
8.3.1. Incineration of Municipal Solid Waste, Industrial Waste, and Specially controlled Industrial Waste (6.C.-)
Background
Japan uses incinerators to reduce the volume of much of the municipal solid waste, waste oil from industry, some waste plastics, much of the synthetic textile scraps, and much of the specially controlled industrial waste. Emissions of carbon dioxide, methane, and nitrous oxide from the incineration of these wastes are accounted for in the category of the Emissions from Waste Incineration (6.C.).
Because municipal solid waste contains both biogenic and non-biogenic waste, methane and nitrous oxide emissions are estimated as the total that includes biogenic waste, and is reported in the “Plastic and other non-biogenic waste” category. The methane and nitrous oxide emissions from the incineration of industrial waste are reported in either the “biogenic” or “plastics and other non-biogenic waste” category, depending on the type of waste.
8.3.1.1. Municipal Solid Waste Incineration(6.C.-)
CO2
Methodology
Emissions of carbon dioxide from this source were derived by using the volume of waste plastic incinerated (dry base) and emission factor calculated Japan’s country-specific data, in accordance with Decision Tree of the Good Practice Guidance (2000) (Page 5.24, Fig 5.5). The calculation covered the waste plastics and synthetic textile scraps included in municipal solid waste. The portions of the waste used for heat recovery and power generation are included in the calculation of emissions from this source, since it is difficult to account for activity data separately from the data for simple incineration.
AEFE ×= E: Emission of carbon dioxide from the incineration of various types of waste (kg-CO2)
EF: Emission factor for the incineration of various types of waste (dry base) (kg-CO2/t)
A: Volume of each type of waste incinerated (dry basis) (t)
Emission Factors
○ Outline Based on the approach taken by the Revised 1996 IPCC Guidelines, the emission factor
for this source was calculated by multiplying the carbon content of each type of waste by the rate of combustion at each incinerator.
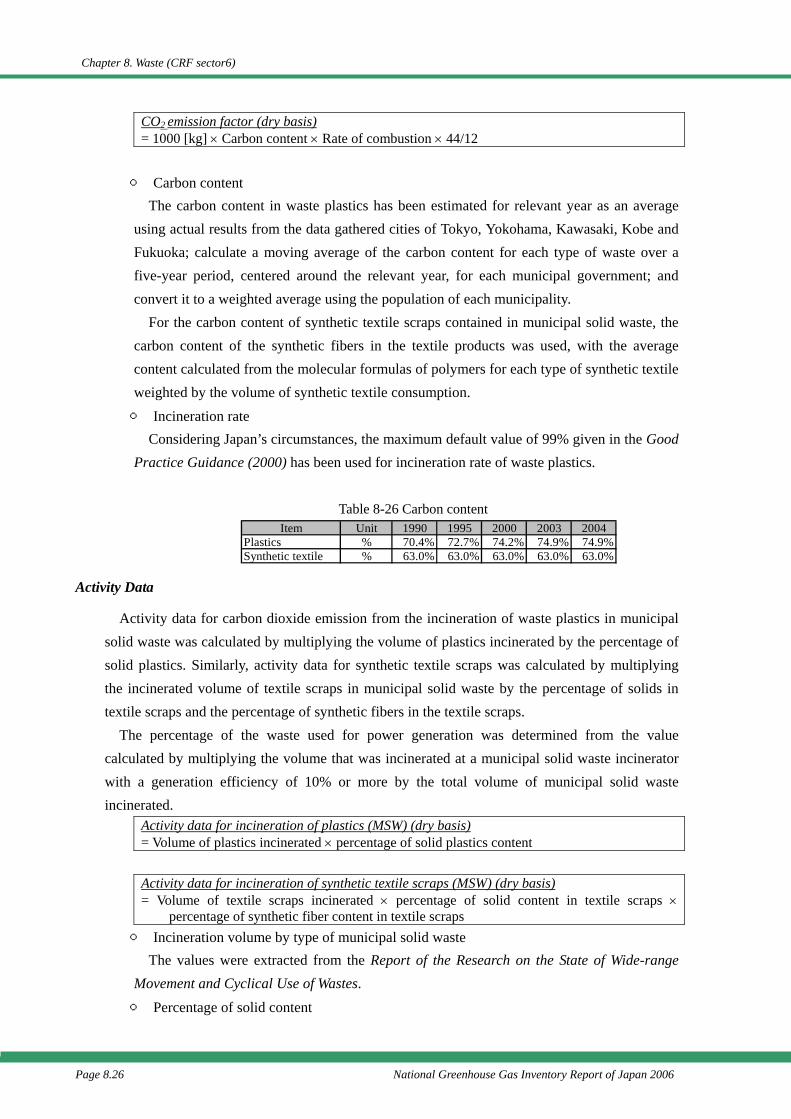
Chapter 8. Waste (CRF sector6)
Page 8.26 National Greenhouse Gas Inventory Report of Japan 2006
CO2 emission factor (dry basis) = 1000 [kg] × Carbon content × Rate of combustion × 44/12
○ Carbon content
The carbon content in waste plastics has been estimated for relevant year as an average using actual results from the data gathered cities of Tokyo, Yokohama, Kawasaki, Kobe and Fukuoka; calculate a moving average of the carbon content for each type of waste over a five-year period, centered around the relevant year, for each municipal government; and convert it to a weighted average using the population of each municipality.
For the carbon content of synthetic textile scraps contained in municipal solid waste, the carbon content of the synthetic fibers in the textile products was used, with the average content calculated from the molecular formulas of polymers for each type of synthetic textile weighted by the volume of synthetic textile consumption. ○ Incineration rate
Considering Japan’s circumstances, the maximum default value of 99% given in the Good Practice Guidance (2000) has been used for incineration rate of waste plastics.
Table 8-26 Carbon content
Activity Data
Activity data for carbon dioxide emission from the incineration of waste plastics in municipal solid waste was calculated by multiplying the volume of plastics incinerated by the percentage of solid plastics. Similarly, activity data for synthetic textile scraps was calculated by multiplying the incinerated volume of textile scraps in municipal solid waste by the percentage of solids in textile scraps and the percentage of synthetic fibers in the textile scraps.
The percentage of the waste used for power generation was determined from the value calculated by multiplying the volume that was incinerated at a municipal solid waste incinerator with a generation efficiency of 10% or more by the total volume of municipal solid waste incinerated.
Activity data for incineration of plastics (MSW) (dry basis) = Volume of plastics incinerated × percentage of solid plastics content
Activity data for incineration of synthetic textile scraps (MSW) (dry basis) = Volume of textile scraps incinerated × percentage of solid content in textile scraps ×
percentage of synthetic fiber content in textile scraps ○ Incineration volume by type of municipal solid waste
The values were extracted from the Report of the Research on the State of Wide-range Movement and Cyclical Use of Wastes. ○ Percentage of solid content
Item Unit 1990 1995 2000 2003 2004Plastics % 70.4% 72.7% 74.2% 74.9% 74.9%Synthetic textile % 63.0% 63.0% 63.0% 63.0% 63.0%
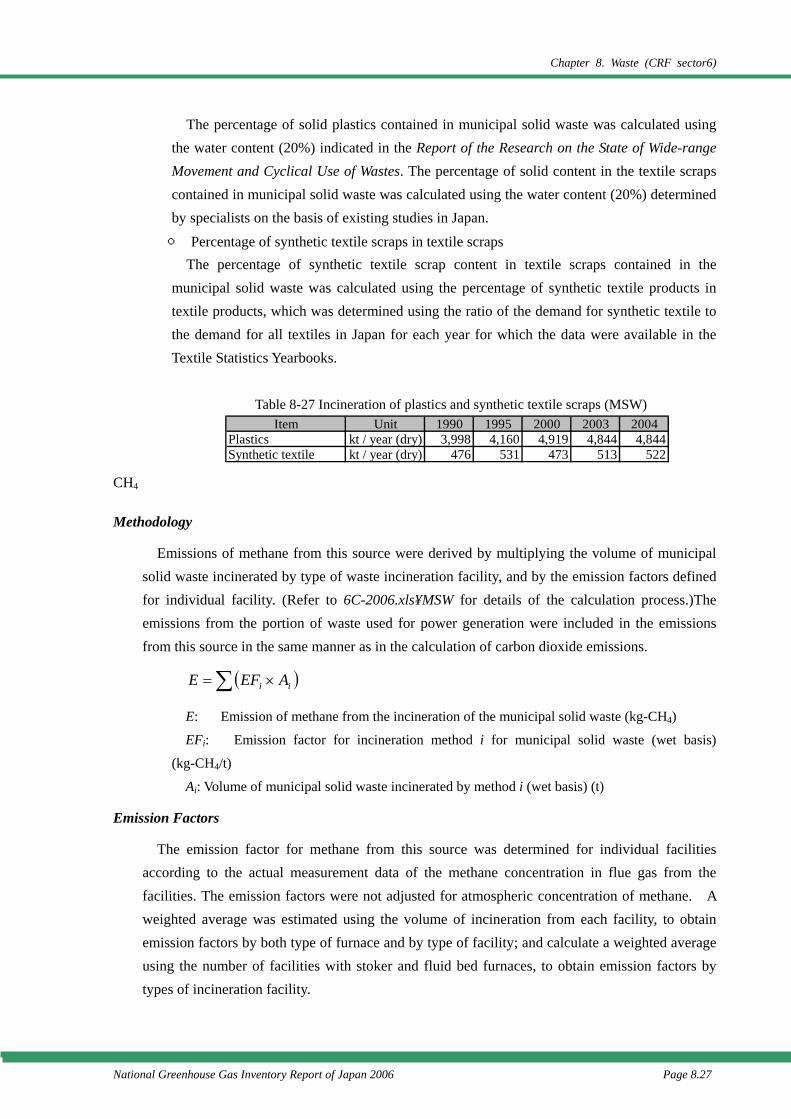
Chapter 8. Waste (CRF sector6)
National Greenhouse Gas Inventory Report of Japan 2006 Page 8.27
The percentage of solid plastics contained in municipal solid waste was calculated using the water content (20%) indicated in the Report of the Research on the State of Wide-range Movement and Cyclical Use of Wastes. The percentage of solid content in the textile scraps contained in municipal solid waste was calculated using the water content (20%) determined by specialists on the basis of existing studies in Japan. ○ Percentage of synthetic textile scraps in textile scraps
The percentage of synthetic textile scrap content in textile scraps contained in the municipal solid waste was calculated using the percentage of synthetic textile products in textile products, which was determined using the ratio of the demand for synthetic textile to the demand for all textiles in Japan for each year for which the data were available in the Textile Statistics Yearbooks.
Table 8-27 Incineration of plastics and synthetic textile scraps (MSW)
CH4
Methodology
Emissions of methane from this source were derived by multiplying the volume of municipal solid waste incinerated by type of waste incineration facility, and by the emission factors defined for individual facility. (Refer to 6C-2006.xls¥MSW for details of the calculation process.)The emissions from the portion of waste used for power generation were included in the emissions from this source in the same manner as in the calculation of carbon dioxide emissions.
( )∑ ×= ii AEFE
E: Emission of methane from the incineration of the municipal solid waste (kg-CH4)
EFi: Emission factor for incineration method i for municipal solid waste (wet basis)
(kg-CH4/t)
Ai: Volume of municipal solid waste incinerated by method i (wet basis) (t)
Emission Factors
The emission factor for methane from this source was determined for individual facilities according to the actual measurement data of the methane concentration in flue gas from the facilities. The emission factors were not adjusted for atmospheric concentration of methane. A weighted average was estimated using the volume of incineration from each facility, to obtain emission factors by both type of furnace and by type of facility; and calculate a weighted average using the number of facilities with stoker and fluid bed furnaces, to obtain emission factors by types of incineration facility.
Item Unit 1990 1995 2000 2003 2004Plastics kt / year (dry) 3,998 4,160 4,919 4,844 4,844Synthetic textile kt / year (dry) 476 531 473 513 522
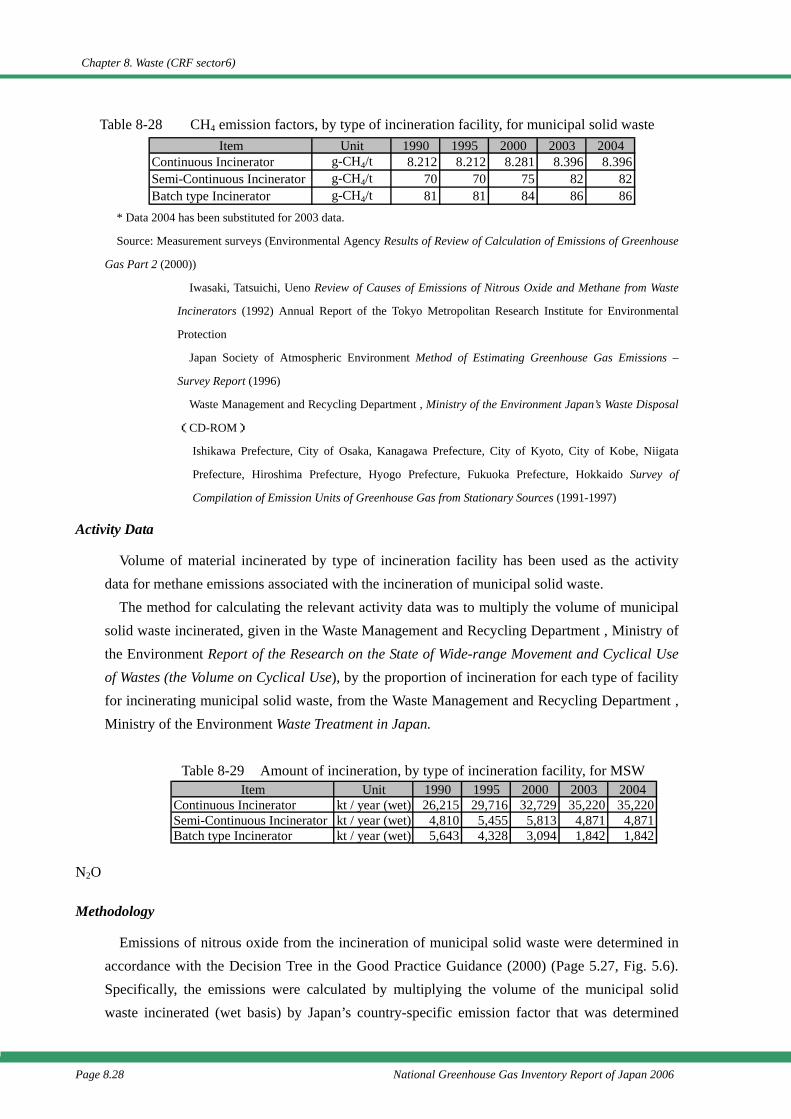
Chapter 8. Waste (CRF sector6)
Page 8.28 National Greenhouse Gas Inventory Report of Japan 2006
Table 8-28 CH4 emission factors, by type of incineration facility, for municipal solid waste
* Data 2004 has been substituted for 2003 data.
Source: Measurement surveys (Environmental Agency Results of Review of Calculation of Emissions of Greenhouse
Gas Part 2 (2000))
Iwasaki, Tatsuichi, Ueno Review of Causes of Emissions of Nitrous Oxide and Methane from Waste
Incinerators (1992) Annual Report of the Tokyo Metropolitan Research Institute for Environmental
Protection
Japan Society of Atmospheric Environment Method of Estimating Greenhouse Gas Emissions –
Survey Report (1996)
Waste Management and Recycling Department , Ministry of the Environment Japan’s Waste Disposal
(CD-ROM)
Ishikawa Prefecture, City of Osaka, Kanagawa Prefecture, City of Kyoto, City of Kobe, Niigata
Prefecture, Hiroshima Prefecture, Hyogo Prefecture, Fukuoka Prefecture, Hokkaido Survey of
Compilation of Emission Units of Greenhouse Gas from Stationary Sources (1991-1997)
Activity Data
Volume of material incinerated by type of incineration facility has been used as the activity data for methane emissions associated with the incineration of municipal solid waste.
The method for calculating the relevant activity data was to multiply the volume of municipal solid waste incinerated, given in the Waste Management and Recycling Department , Ministry of the Environment Report of the Research on the State of Wide-range Movement and Cyclical Use of Wastes (the Volume on Cyclical Use), by the proportion of incineration for each type of facility for incinerating municipal solid waste, from the Waste Management and Recycling Department , Ministry of the Environment Waste Treatment in Japan.
Table 8-29 Amount of incineration, by type of incineration facility, for MSW
N2O
Methodology
Emissions of nitrous oxide from the incineration of municipal solid waste were determined in accordance with the Decision Tree in the Good Practice Guidance (2000) (Page 5.27, Fig. 5.6). Specifically, the emissions were calculated by multiplying the volume of the municipal solid waste incinerated (wet basis) by Japan’s country-specific emission factor that was determined
Item Unit 1990 1995 2000 2003 2004Continuous Incinerator g-CH4/t 8.212 8.212 8.281 8.396 8.396Semi-Continuous Incinerator g-CH4/t 70 70 75 82 82Batch type Incinerator g-CH4/t 81 81 84 86 86
Item Unit 1990 1995 2000 2003 2004Continuous Incinerator kt / year (wet) 26,215 29,716 32,729 35,220 35,220Semi-Continuous Incinerator kt / year (wet) 4,810 5,455 5,813 4,871 4,871Batch type Incinerator kt / year (wet) 5,643 4,328 3,094 1,842 1,842
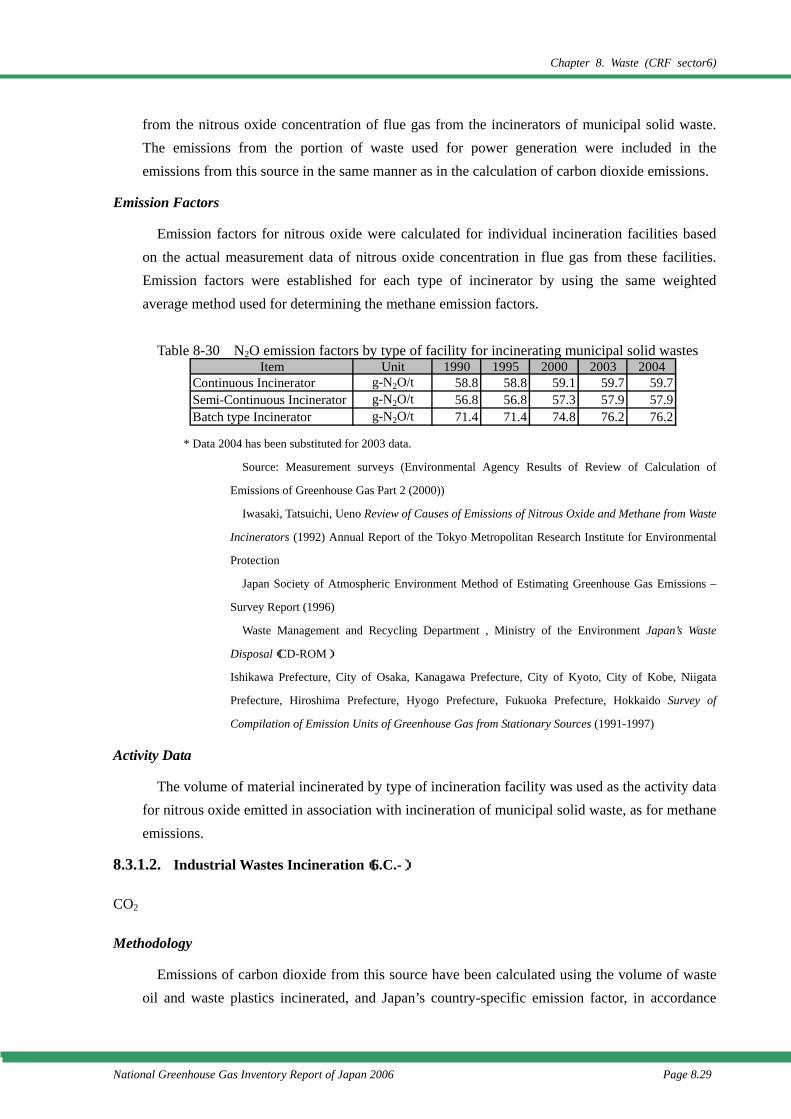
Chapter 8. Waste (CRF sector6)
National Greenhouse Gas Inventory Report of Japan 2006 Page 8.29
from the nitrous oxide concentration of flue gas from the incinerators of municipal solid waste. The emissions from the portion of waste used for power generation were included in the emissions from this source in the same manner as in the calculation of carbon dioxide emissions.
Emission Factors
Emission factors for nitrous oxide were calculated for individual incineration facilities based on the actual measurement data of nitrous oxide concentration in flue gas from these facilities. Emission factors were established for each type of incinerator by using the same weighted average method used for determining the methane emission factors.
Table 8-30 N2O emission factors by type of facility for incinerating municipal solid wastes
* Data 2004 has been substituted for 2003 data.
Source: Measurement surveys (Environmental Agency Results of Review of Calculation of
Emissions of Greenhouse Gas Part 2 (2000))
Iwasaki, Tatsuichi, Ueno Review of Causes of Emissions of Nitrous Oxide and Methane from Waste
Incinerators (1992) Annual Report of the Tokyo Metropolitan Research Institute for Environmental
Protection
Japan Society of Atmospheric Environment Method of Estimating Greenhouse Gas Emissions –
Survey Report (1996)
Waste Management and Recycling Department , Ministry of the Environment Japan’s Waste
Disposal(CD-ROM)
Ishikawa Prefecture, City of Osaka, Kanagawa Prefecture, City of Kyoto, City of Kobe, Niigata
Prefecture, Hiroshima Prefecture, Hyogo Prefecture, Fukuoka Prefecture, Hokkaido Survey of
Compilation of Emission Units of Greenhouse Gas from Stationary Sources (1991-1997)
Activity Data
The volume of material incinerated by type of incineration facility was used as the activity data for nitrous oxide emitted in association with incineration of municipal solid waste, as for methane emissions.
8.3.1.2. Industrial Wastes Incineration(6.C.-)
CO2
Methodology
Emissions of carbon dioxide from this source have been calculated using the volume of waste oil and waste plastics incinerated, and Japan’s country-specific emission factor, in accordance
Item Unit 1990 1995 2000 2003 2004Continuous Incinerator g-N2O/t 58.8 58.8 59.1 59.7 59.7Semi-Continuous Incinerator g-N2O/t 56.8 56.8 57.3 57.9 57.9Batch type Incinerator g-N2O/t 71.4 71.4 74.8 76.2 76.2
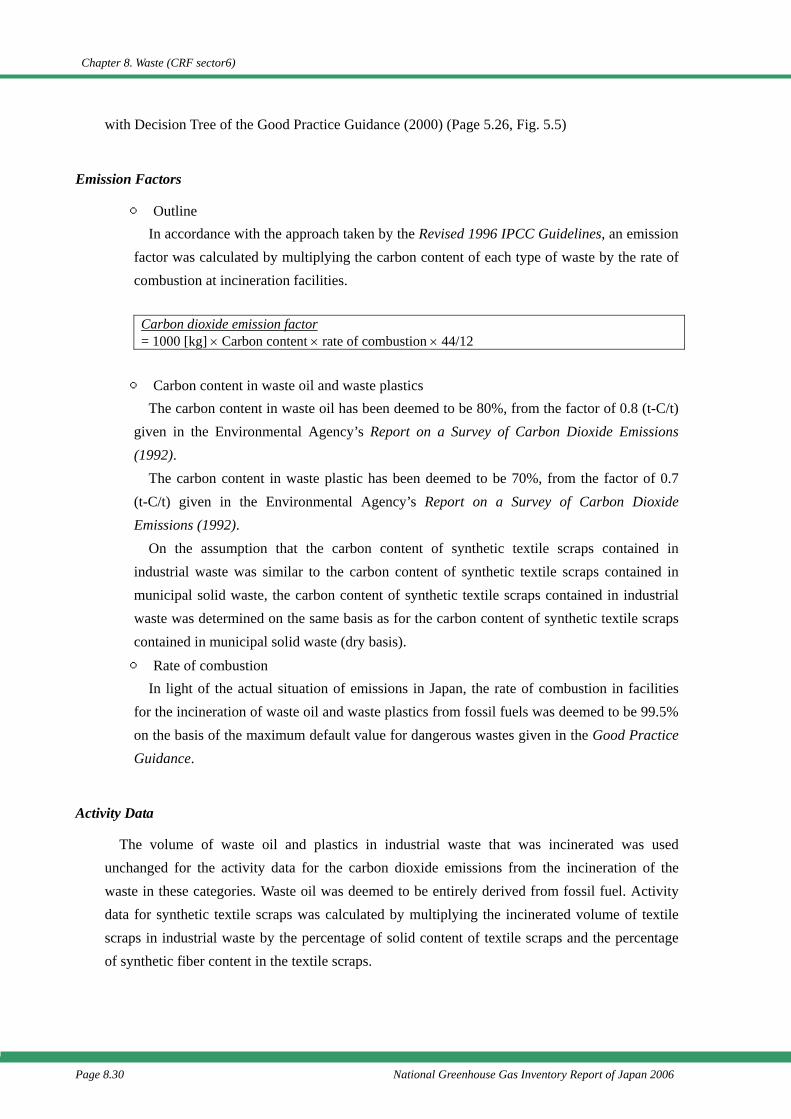
Chapter 8. Waste (CRF sector6)
Page 8.30 National Greenhouse Gas Inventory Report of Japan 2006
with Decision Tree of the Good Practice Guidance (2000) (Page 5.26, Fig. 5.5)
Emission Factors
○ Outline In accordance with the approach taken by the Revised 1996 IPCC Guidelines, an emission
factor was calculated by multiplying the carbon content of each type of waste by the rate of combustion at incineration facilities.
Carbon dioxide emission factor = 1000 [kg] × Carbon content × rate of combustion × 44/12
○ Carbon content in waste oil and waste plastics
The carbon content in waste oil has been deemed to be 80%, from the factor of 0.8 (t-C/t) given in the Environmental Agency’s Report on a Survey of Carbon Dioxide Emissions (1992).
The carbon content in waste plastic has been deemed to be 70%, from the factor of 0.7 (t-C/t) given in the Environmental Agency’s Report on a Survey of Carbon Dioxide Emissions (1992).
On the assumption that the carbon content of synthetic textile scraps contained in industrial waste was similar to the carbon content of synthetic textile scraps contained in municipal solid waste, the carbon content of synthetic textile scraps contained in industrial waste was determined on the same basis as for the carbon content of synthetic textile scraps contained in municipal solid waste (dry basis). ○ Rate of combustion
In light of the actual situation of emissions in Japan, the rate of combustion in facilities for the incineration of waste oil and waste plastics from fossil fuels was deemed to be 99.5% on the basis of the maximum default value for dangerous wastes given in the Good Practice Guidance.
Activity Data
The volume of waste oil and plastics in industrial waste that was incinerated was used unchanged for the activity data for the carbon dioxide emissions from the incineration of the waste in these categories. Waste oil was deemed to be entirely derived from fossil fuel. Activity data for synthetic textile scraps was calculated by multiplying the incinerated volume of textile scraps in industrial waste by the percentage of solid content of textile scraps and the percentage of synthetic fiber content in the textile scraps.
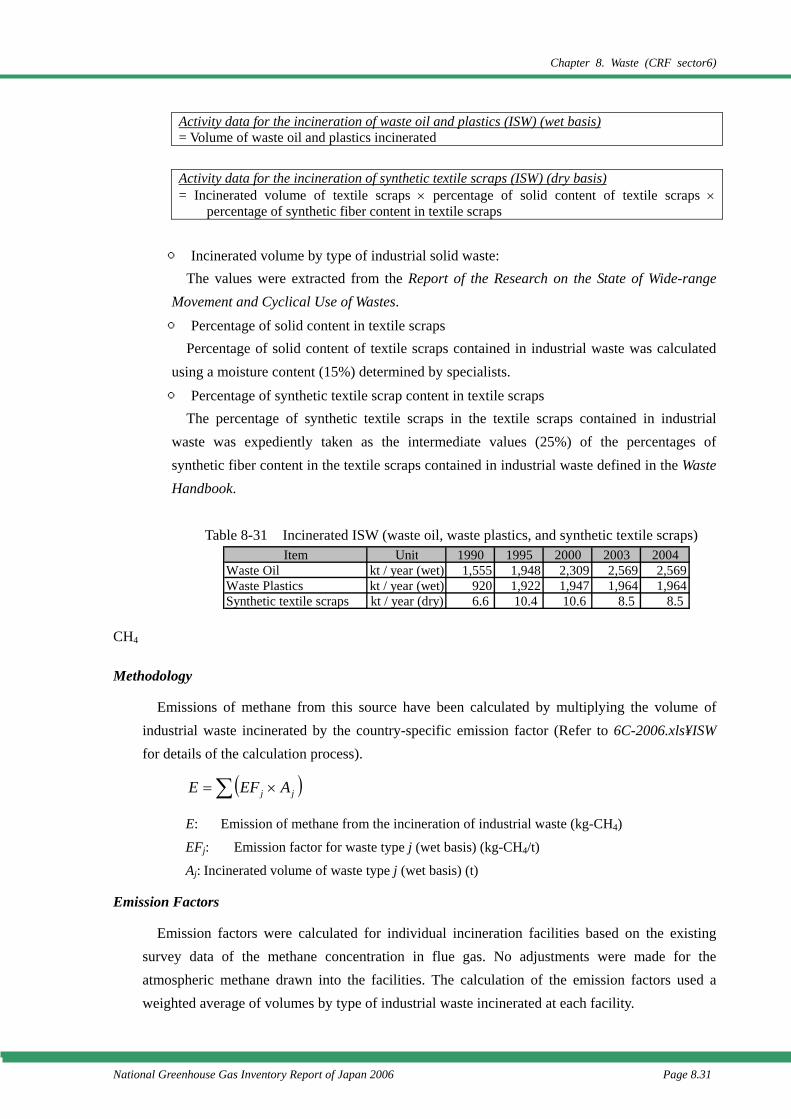
Chapter 8. Waste (CRF sector6)
National Greenhouse Gas Inventory Report of Japan 2006 Page 8.31
Activity data for the incineration of waste oil and plastics (ISW) (wet basis) = Volume of waste oil and plastics incinerated
Activity data for the incineration of synthetic textile scraps (ISW) (dry basis) = Incinerated volume of textile scraps × percentage of solid content of textile scraps ×
percentage of synthetic fiber content in textile scraps
○ Incinerated volume by type of industrial solid waste: The values were extracted from the Report of the Research on the State of Wide-range
Movement and Cyclical Use of Wastes. ○ Percentage of solid content in textile scraps
Percentage of solid content of textile scraps contained in industrial waste was calculated using a moisture content (15%) determined by specialists. ○ Percentage of synthetic textile scrap content in textile scraps
The percentage of synthetic textile scraps in the textile scraps contained in industrial waste was expediently taken as the intermediate values (25%) of the percentages of synthetic fiber content in the textile scraps contained in industrial waste defined in the Waste Handbook.
Table 8-31 Incinerated ISW (waste oil, waste plastics, and synthetic textile scraps)
CH4
Methodology
Emissions of methane from this source have been calculated by multiplying the volume of industrial waste incinerated by the country-specific emission factor (Refer to 6C-2006.xls¥ISW for details of the calculation process).
( )∑ ×= jj AEFE
E: Emission of methane from the incineration of industrial waste (kg-CH4)
EFj: Emission factor for waste type j (wet basis) (kg-CH4/t)
Aj: Incinerated volume of waste type j (wet basis) (t)
Emission Factors
Emission factors were calculated for individual incineration facilities based on the existing survey data of the methane concentration in flue gas. No adjustments were made for the atmospheric methane drawn into the facilities. The calculation of the emission factors used a weighted average of volumes by type of industrial waste incinerated at each facility.
Item Unit 1990 1995 2000 2003 2004Waste Oil kt / year (wet) 1,555 1,948 2,309 2,569 2,569Waste Plastics kt / year (wet) 920 1,922 1,947 1,964 1,964Synthetic textile scraps kt / year (dry) 6.6 10.4 10.6 8.5 8.5
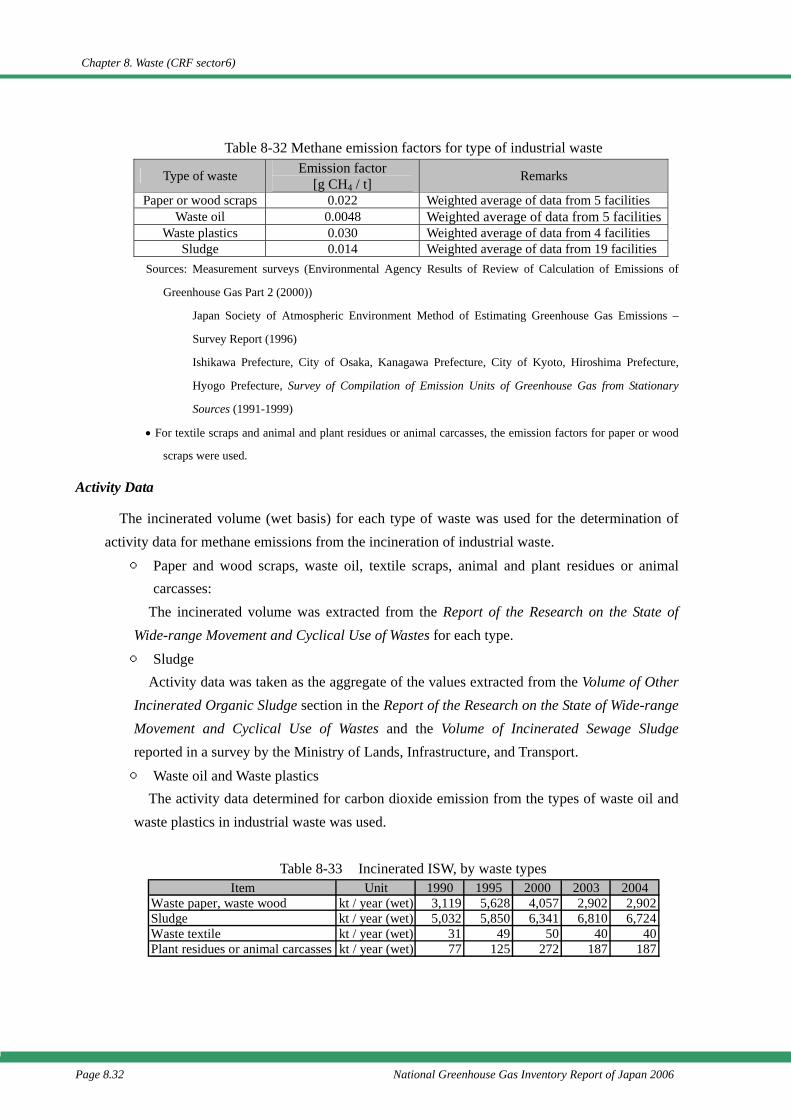
Chapter 8. Waste (CRF sector6)
Page 8.32 National Greenhouse Gas Inventory Report of Japan 2006
Table 8-32 Methane emission factors for type of industrial waste
Type of waste Emission factor [g CH4 / t]
Remarks
Paper or wood scraps 0.022 Weighted average of data from 5 facilities Waste oil 0.0048 Weighted average of data from 5 facilities
Waste plastics 0.030 Weighted average of data from 4 facilities Sludge 0.014 Weighted average of data from 19 facilities
Sources: Measurement surveys (Environmental Agency Results of Review of Calculation of Emissions of
Greenhouse Gas Part 2 (2000))
Japan Society of Atmospheric Environment Method of Estimating Greenhouse Gas Emissions –
Survey Report (1996)
Ishikawa Prefecture, City of Osaka, Kanagawa Prefecture, City of Kyoto, Hiroshima Prefecture,
Hyogo Prefecture, Survey of Compilation of Emission Units of Greenhouse Gas from Stationary
Sources (1991-1999)
• For textile scraps and animal and plant residues or animal carcasses, the emission factors for paper or wood
scraps were used.
Activity Data
The incinerated volume (wet basis) for each type of waste was used for the determination of activity data for methane emissions from the incineration of industrial waste.
○ Paper and wood scraps, waste oil, textile scraps, animal and plant residues or animal carcasses:
The incinerated volume was extracted from the Report of the Research on the State of Wide-range Movement and Cyclical Use of Wastes for each type. ○ Sludge
Activity data was taken as the aggregate of the values extracted from the Volume of Other Incinerated Organic Sludge section in the Report of the Research on the State of Wide-range Movement and Cyclical Use of Wastes and the Volume of Incinerated Sewage Sludge reported in a survey by the Ministry of Lands, Infrastructure, and Transport. ○ Waste oil and Waste plastics
The activity data determined for carbon dioxide emission from the types of waste oil and waste plastics in industrial waste was used.
Table 8-33 Incinerated ISW, by waste types
Item Unit 1990 1995 2000 2003 2004Waste paper, waste wood kt / year (wet) 3,119 5,628 4,057 2,902 2,902Sludge kt / year (wet) 5,032 5,850 6,341 6,810 6,724Waste textile kt / year (wet) 31 49 50 40 40Plant residues or animal carcasses kt / year (wet) 77 125 272 187 187
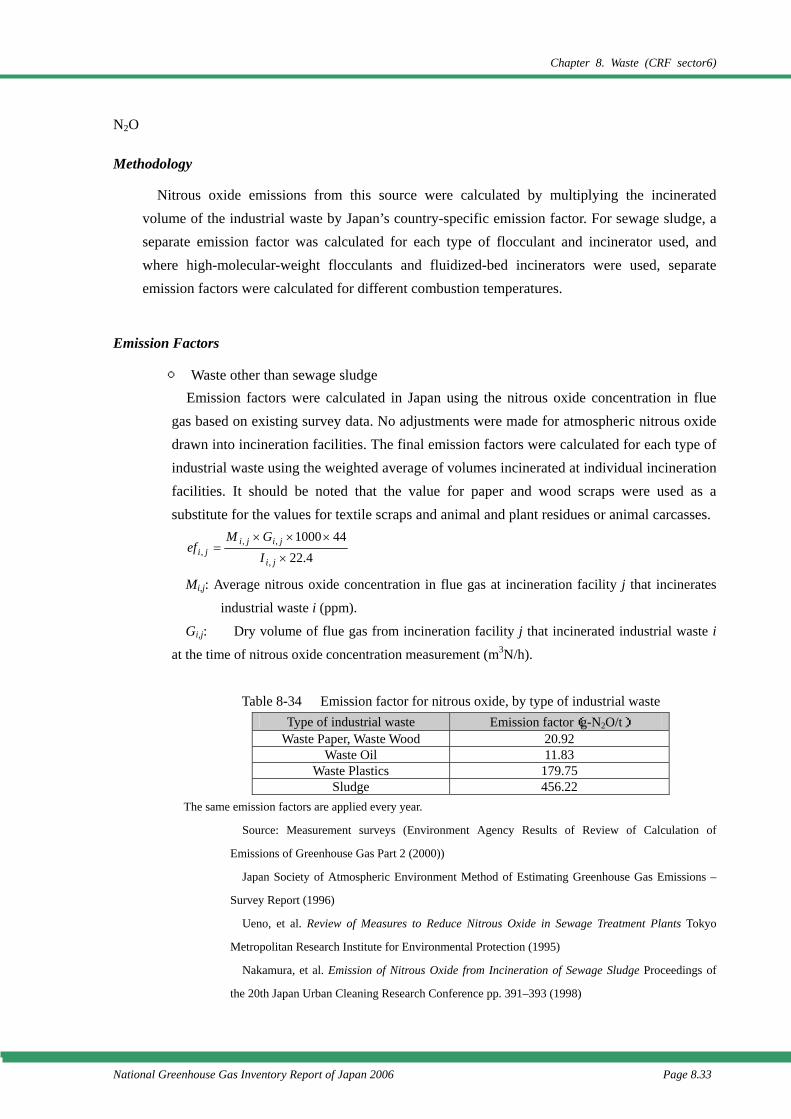
Chapter 8. Waste (CRF sector6)
National Greenhouse Gas Inventory Report of Japan 2006 Page 8.33
N2O
Methodology
Nitrous oxide emissions from this source were calculated by multiplying the incinerated volume of the industrial waste by Japan’s country-specific emission factor. For sewage sludge, a separate emission factor was calculated for each type of flocculant and incinerator used, and where high-molecular-weight flocculants and fluidized-bed incinerators were used, separate emission factors were calculated for different combustion temperatures.
Emission Factors
○ Waste other than sewage sludge Emission factors were calculated in Japan using the nitrous oxide concentration in flue
gas based on existing survey data. No adjustments were made for atmospheric nitrous oxide drawn into incineration facilities. The final emission factors were calculated for each type of industrial waste using the weighted average of volumes incinerated at individual incineration facilities. It should be noted that the value for paper and wood scraps were used as a substitute for the values for textile scraps and animal and plant residues or animal carcasses.
4.22441000
,
,,, ×
×××=
ji
jijiji I
GMef
Mi,j: Average nitrous oxide concentration in flue gas at incineration facility j that incinerates
industrial waste i (ppm).
Gi,j: Dry volume of flue gas from incineration facility j that incinerated industrial waste i
at the time of nitrous oxide concentration measurement (m3N/h).
Table 8-34 Emission factor for nitrous oxide, by type of industrial waste Type of industrial waste Emission factor(g-N2O/t)
Waste Paper, Waste Wood 20.92 Waste Oil 11.83
Waste Plastics 179.75 Sludge 456.22
The same emission factors are applied every year.
Source: Measurement surveys (Environment Agency Results of Review of Calculation of
Emissions of Greenhouse Gas Part 2 (2000))
Japan Society of Atmospheric Environment Method of Estimating Greenhouse Gas Emissions –
Survey Report (1996)
Ueno, et al. Review of Measures to Reduce Nitrous Oxide in Sewage Treatment Plants Tokyo
Metropolitan Research Institute for Environmental Protection (1995)
Nakamura, et al. Emission of Nitrous Oxide from Incineration of Sewage Sludge Proceedings of
the 20th Japan Urban Cleaning Research Conference pp. 391–393 (1998)
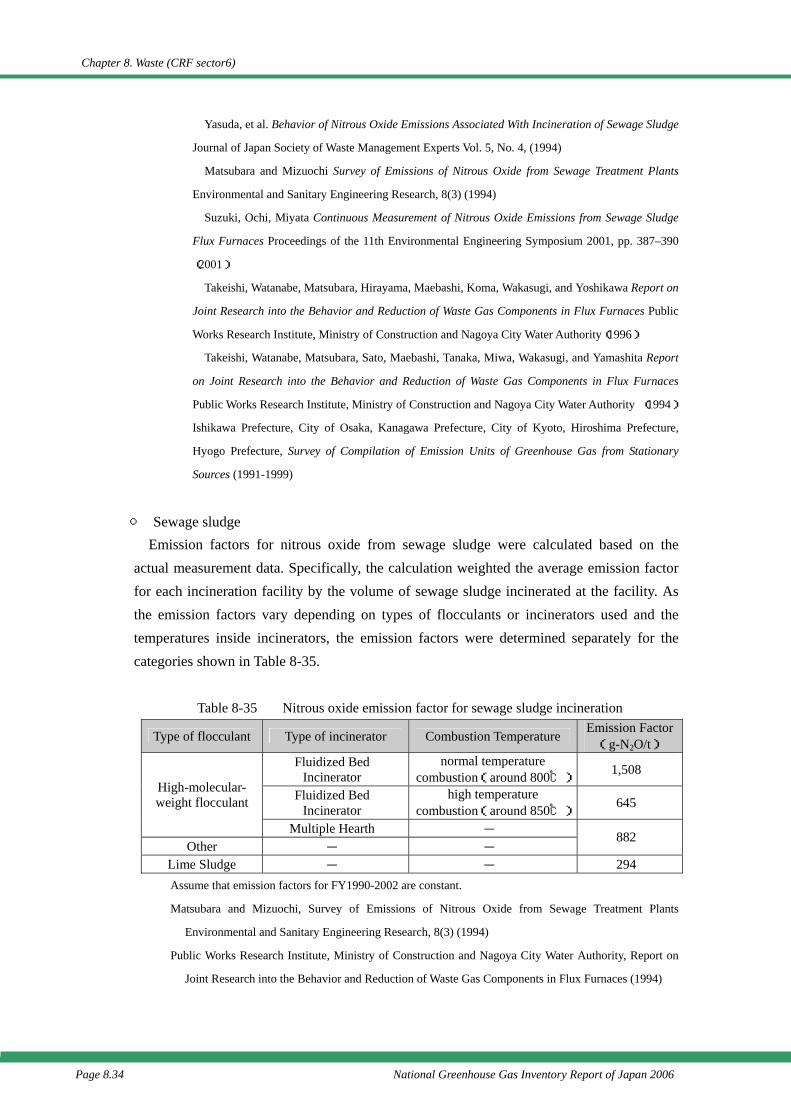
Chapter 8. Waste (CRF sector6)
Page 8.34 National Greenhouse Gas Inventory Report of Japan 2006
Yasuda, et al. Behavior of Nitrous Oxide Emissions Associated With Incineration of Sewage Sludge
Journal of Japan Society of Waste Management Experts Vol. 5, No. 4, (1994)
Matsubara and Mizuochi Survey of Emissions of Nitrous Oxide from Sewage Treatment Plants
Environmental and Sanitary Engineering Research, 8(3) (1994)
Suzuki, Ochi, Miyata Continuous Measurement of Nitrous Oxide Emissions from Sewage Sludge
Flux Furnaces Proceedings of the 11th Environmental Engineering Symposium 2001, pp. 387–390
(2001)
Takeishi, Watanabe, Matsubara, Hirayama, Maebashi, Koma, Wakasugi, and Yoshikawa Report on
Joint Research into the Behavior and Reduction of Waste Gas Components in Flux Furnaces Public
Works Research Institute, Ministry of Construction and Nagoya City Water Authority(1996)
Takeishi, Watanabe, Matsubara, Sato, Maebashi, Tanaka, Miwa, Wakasugi, and Yamashita Report
on Joint Research into the Behavior and Reduction of Waste Gas Components in Flux Furnaces
Public Works Research Institute, Ministry of Construction and Nagoya City Water Authority (1994)
Ishikawa Prefecture, City of Osaka, Kanagawa Prefecture, City of Kyoto, Hiroshima Prefecture,
Hyogo Prefecture, Survey of Compilation of Emission Units of Greenhouse Gas from Stationary
Sources (1991-1999)
○ Sewage sludge
Emission factors for nitrous oxide from sewage sludge were calculated based on the actual measurement data. Specifically, the calculation weighted the average emission factor for each incineration facility by the volume of sewage sludge incinerated at the facility. As the emission factors vary depending on types of flocculants or incinerators used and the temperatures inside incinerators, the emission factors were determined separately for the categories shown in Table 8-35.
Table 8-35 Nitrous oxide emission factor for sewage sludge incineration
Type of flocculant Type of incinerator Combustion Temperature Emission Factor(g-N2O/t)
Fluidized Bed Incinerator
normal temperature combustion(around 800℃) 1,508
Fluidized Bed Incinerator
high temperature combustion(around 850℃) 645
High-molecular- weight flocculant
Multiple Hearth - Other - -
882
Lime Sludge - - 294 Assume that emission factors for FY1990-2002 are constant.
Matsubara and Mizuochi, Survey of Emissions of Nitrous Oxide from Sewage Treatment Plants
Environmental and Sanitary Engineering Research, 8(3) (1994)
Public Works Research Institute, Ministry of Construction and Nagoya City Water Authority, Report on
Joint Research into the Behavior and Reduction of Waste Gas Components in Flux Furnaces (1994)
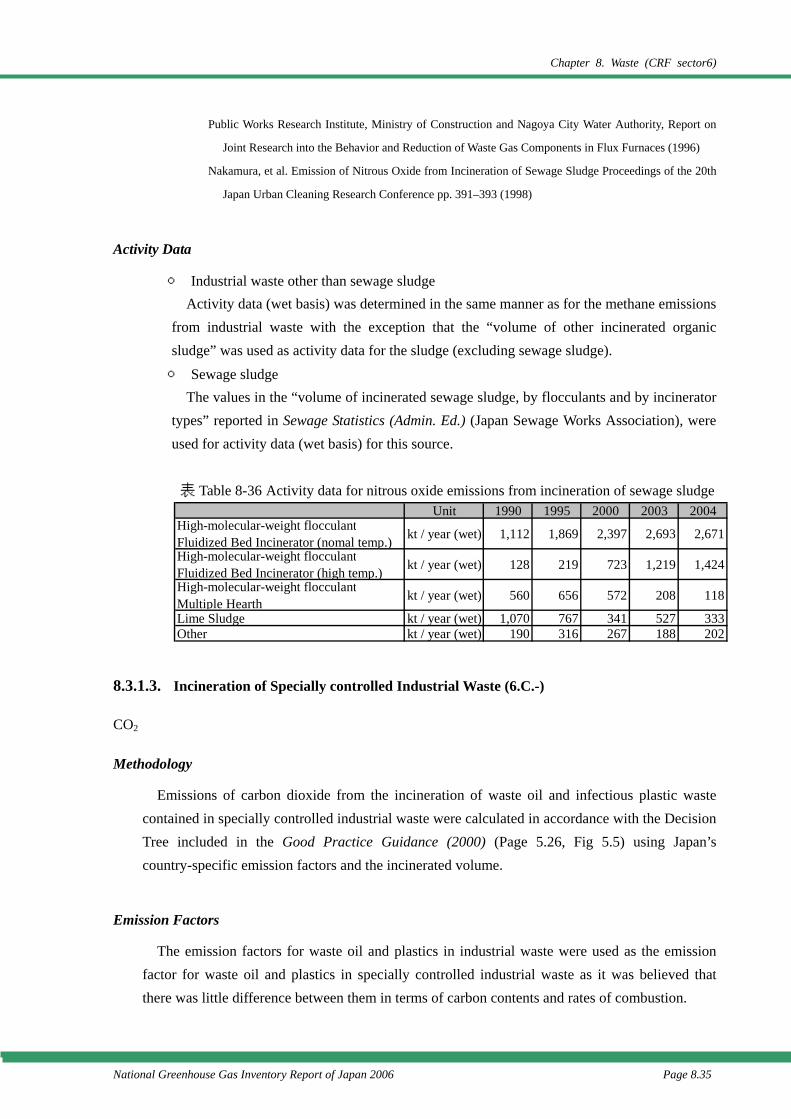
Chapter 8. Waste (CRF sector6)
National Greenhouse Gas Inventory Report of Japan 2006 Page 8.35
Public Works Research Institute, Ministry of Construction and Nagoya City Water Authority, Report on
Joint Research into the Behavior and Reduction of Waste Gas Components in Flux Furnaces (1996)
Nakamura, et al. Emission of Nitrous Oxide from Incineration of Sewage Sludge Proceedings of the 20th
Japan Urban Cleaning Research Conference pp. 391–393 (1998)
Activity Data
○ Industrial waste other than sewage sludge Activity data (wet basis) was determined in the same manner as for the methane emissions
from industrial waste with the exception that the “volume of other incinerated organic sludge” was used as activity data for the sludge (excluding sewage sludge). ○ Sewage sludge
The values in the “volume of incinerated sewage sludge, by flocculants and by incinerator types” reported in Sewage Statistics (Admin. Ed.) (Japan Sewage Works Association), were used for activity data (wet basis) for this source.
表 Table 8-36 Activity data for nitrous oxide emissions from incineration of sewage sludge
8.3.1.3. Incineration of Specially controlled Industrial Waste (6.C.-)
CO2
Methodology
Emissions of carbon dioxide from the incineration of waste oil and infectious plastic waste contained in specially controlled industrial waste were calculated in accordance with the Decision Tree included in the Good Practice Guidance (2000) (Page 5.26, Fig 5.5) using Japan’s country-specific emission factors and the incinerated volume.
Emission Factors
The emission factors for waste oil and plastics in industrial waste were used as the emission factor for waste oil and plastics in specially controlled industrial waste as it was believed that there was little difference between them in terms of carbon contents and rates of combustion.
Unit 1990 1995 2000 2003 2004High-molecular-weight flocculantFluidized Bed Incinerator (nomal temp.) kt / year (wet) 1,112 1,869 2,397 2,693 2,671
High-molecular-weight flocculantFluidized Bed Incinerator (high temp.) kt / year (wet) 128 219 723 1,219 1,424
High-molecular-weight flocculantMultiple Hearth kt / year (wet) 560 656 572 208 118
Lime Sludge kt / year (wet) 1,070 767 341 527 333Other kt / year (wet) 190 316 267 188 202
Chapter 8. Waste (CRF sector6)
Page 8.36 National Greenhouse Gas Inventory Report of Japan 2006
Activity Data
On the assumption that the entire volume of waste oil and infectious plastic waste contained in specially controlled industrial waste was incinerated, carbon emission activity data was calculated using the output volume of the waste oil indicated in the Report on Survey of Organizations in Industrial Waste Administration (Water Supply Division, Health Service Bureau, the Ministry of Health and Welfare) for the waste oil. For the plastics in infectious waste, the activity data was calculated by multiplying the output volume of infectious waste reported by the same survey by the percentage of plastic content in infectious waste indicated in the Waste Handbook as the result of a composition analysis of infectious waste.
Activity data for incineration of waste oil (specially controlled ISW) (wet basis) = Output volume of waste oil Activity data for incineration of plastics in infectious waste (specially controlled ISW)(wet basis) = Output volume of infectious waste × percentage of plastic content in infectious waste
CH4
Methodology
Emissions of methane from the incineration of waste categorized as “waste oil” and “infectious waste” of specially controlled industrial waste were calculated by multiplying the volume of incinerated waste by type (wet basis) by Japan’s country-specific emission factor.
Emission Factors
Because actual measurement data were not available, the emission factors for the incineration of industrial waste were used as substitutes for determining the emission factor for each type of specially controlled industrial waste. Specifically, the substitute emission factors used were the waste oil in industrial waste for the waste oil; the waste plastics in industrial waste for the infectious waste plastics; and paper and wood scraps in industrial waste for non-plastic infectious waste.
Activity Data
Activity data for the waste oil and infectious waste plastics were calculated using the same values as those used in the calculation of activity data associated with carbon dioxide emission. The volume of non-infectious waste plastics incinerated was deemed to be the same as the output volume, and calculated by multiplying the output volume of infectious waste by the percentage of non-plastic content in infectious waste.
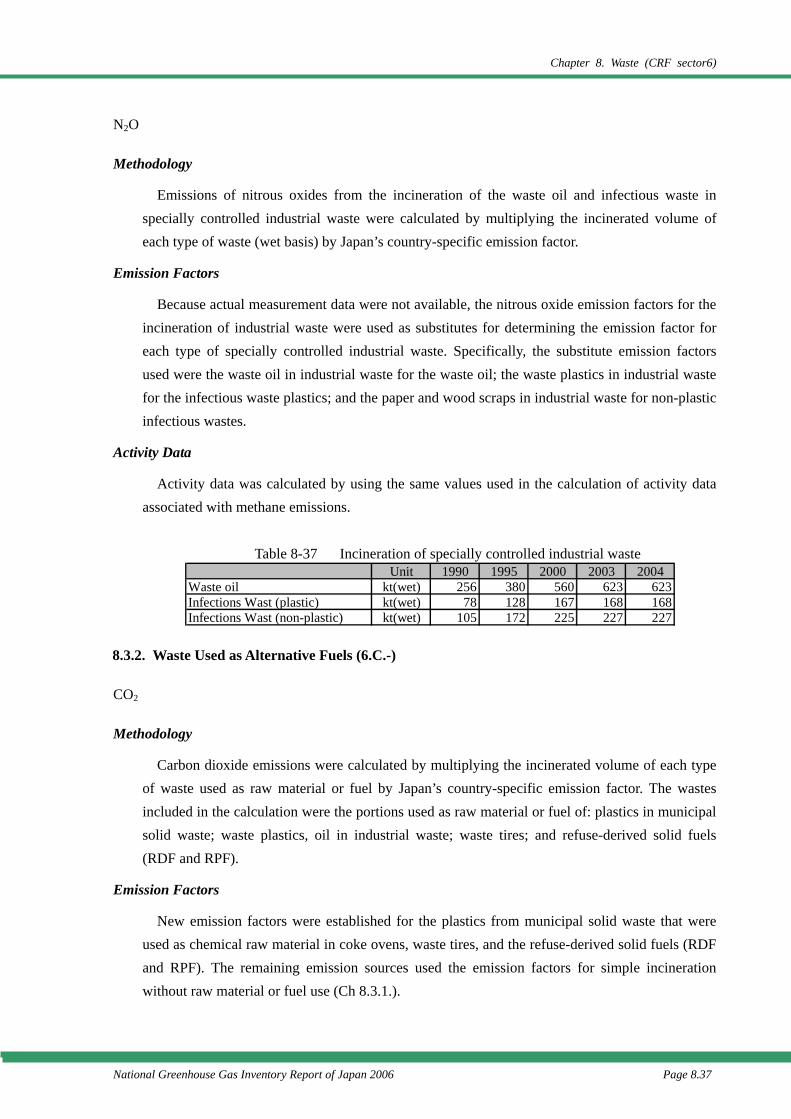
Chapter 8. Waste (CRF sector6)
National Greenhouse Gas Inventory Report of Japan 2006 Page 8.37
N2O
Methodology
Emissions of nitrous oxides from the incineration of the waste oil and infectious waste in specially controlled industrial waste were calculated by multiplying the incinerated volume of each type of waste (wet basis) by Japan’s country-specific emission factor.
Emission Factors
Because actual measurement data were not available, the nitrous oxide emission factors for the incineration of industrial waste were used as substitutes for determining the emission factor for each type of specially controlled industrial waste. Specifically, the substitute emission factors used were the waste oil in industrial waste for the waste oil; the waste plastics in industrial waste for the infectious waste plastics; and the paper and wood scraps in industrial waste for non-plastic infectious wastes.
Activity Data
Activity data was calculated by using the same values used in the calculation of activity data associated with methane emissions.
Table 8-37 Incineration of specially controlled industrial waste
8.3.2. Waste Used as Alternative Fuels (6.C.-)
CO2
Methodology
Carbon dioxide emissions were calculated by multiplying the incinerated volume of each type of waste used as raw material or fuel by Japan’s country-specific emission factor. The wastes included in the calculation were the portions used as raw material or fuel of: plastics in municipal solid waste; waste plastics, oil in industrial waste; waste tires; and refuse-derived solid fuels (RDF and RPF).
Emission Factors
New emission factors were established for the plastics from municipal solid waste that were used as chemical raw material in coke ovens, waste tires, and the refuse-derived solid fuels (RDF and RPF). The remaining emission sources used the emission factors for simple incineration without raw material or fuel use (Ch 8.3.1.).
Unit 1990 1995 2000 2003 2004Waste oil kt(wet) 256 380 560 623 623Infections Wast (plastic) kt(wet) 78 128 167 168 168Infections Wast (non-plastic) kt(wet) 105 172 225 227 227
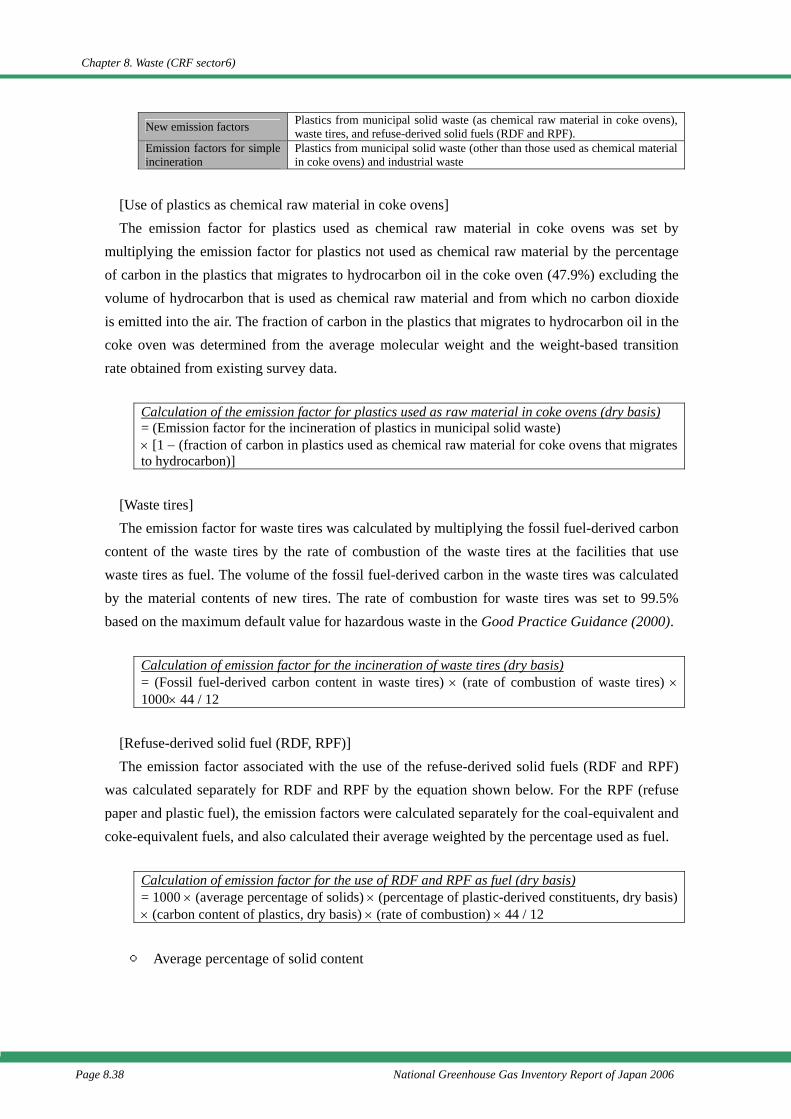
Chapter 8. Waste (CRF sector6)
Page 8.38 National Greenhouse Gas Inventory Report of Japan 2006
New emission factors Plastics from municipal solid waste (as chemical raw material in coke ovens), waste tires, and refuse-derived solid fuels (RDF and RPF).
Emission factors for simple incineration
Plastics from municipal solid waste (other than those used as chemical material in coke ovens) and industrial waste
[Use of plastics as chemical raw material in coke ovens] The emission factor for plastics used as chemical raw material in coke ovens was set by
multiplying the emission factor for plastics not used as chemical raw material by the percentage of carbon in the plastics that migrates to hydrocarbon oil in the coke oven (47.9%) excluding the volume of hydrocarbon that is used as chemical raw material and from which no carbon dioxide is emitted into the air. The fraction of carbon in the plastics that migrates to hydrocarbon oil in the coke oven was determined from the average molecular weight and the weight-based transition rate obtained from existing survey data.
Calculation of the emission factor for plastics used as raw material in coke ovens (dry basis) = (Emission factor for the incineration of plastics in municipal solid waste) × [1 − (fraction of carbon in plastics used as chemical raw material for coke ovens that migrates to hydrocarbon)]
[Waste tires] The emission factor for waste tires was calculated by multiplying the fossil fuel-derived carbon
content of the waste tires by the rate of combustion of the waste tires at the facilities that use waste tires as fuel. The volume of the fossil fuel-derived carbon in the waste tires was calculated by the material contents of new tires. The rate of combustion for waste tires was set to 99.5% based on the maximum default value for hazardous waste in the Good Practice Guidance (2000).
Calculation of emission factor for the incineration of waste tires (dry basis) = (Fossil fuel-derived carbon content in waste tires) × (rate of combustion of waste tires) × 1000× 44 / 12
[Refuse-derived solid fuel (RDF, RPF)] The emission factor associated with the use of the refuse-derived solid fuels (RDF and RPF)
was calculated separately for RDF and RPF by the equation shown below. For the RPF (refuse paper and plastic fuel), the emission factors were calculated separately for the coal-equivalent and coke-equivalent fuels, and also calculated their average weighted by the percentage used as fuel.
Calculation of emission factor for the use of RDF and RPF as fuel (dry basis) = 1000 × (average percentage of solids) × (percentage of plastic-derived constituents, dry basis) × (carbon content of plastics, dry basis) × (rate of combustion) × 44 / 12
○ Average percentage of solid content
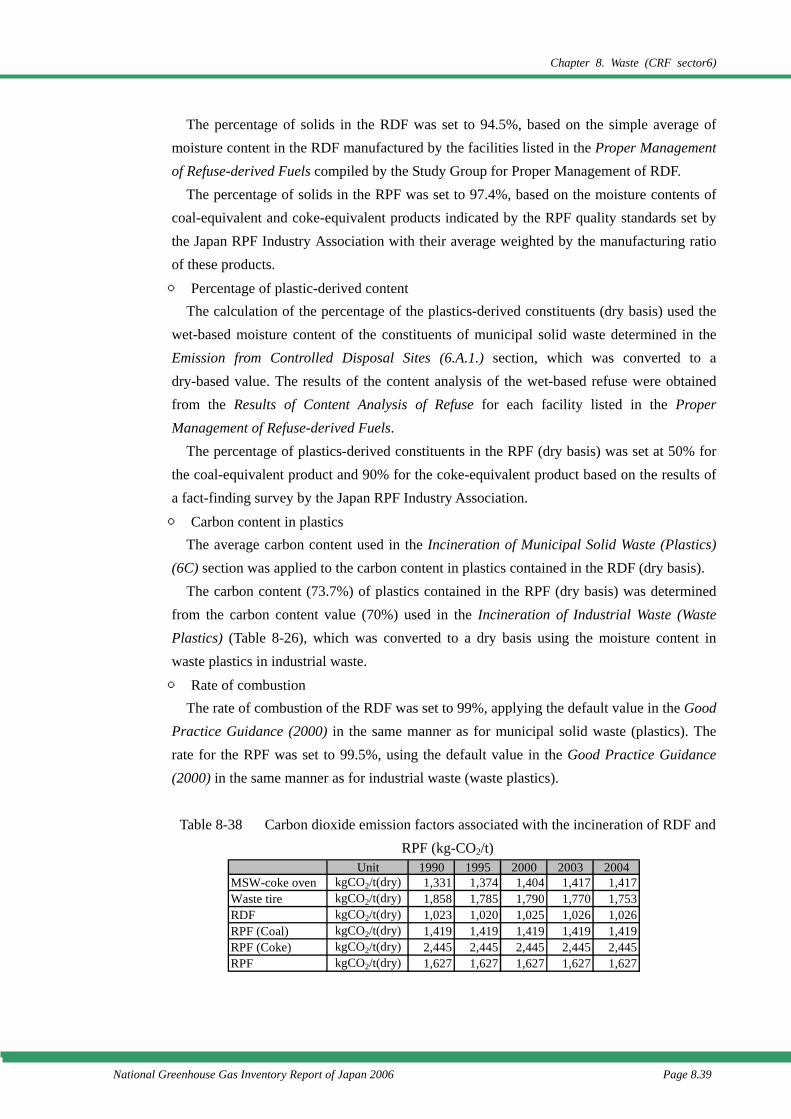
Chapter 8. Waste (CRF sector6)
National Greenhouse Gas Inventory Report of Japan 2006 Page 8.39
The percentage of solids in the RDF was set to 94.5%, based on the simple average of moisture content in the RDF manufactured by the facilities listed in the Proper Management of Refuse-derived Fuels compiled by the Study Group for Proper Management of RDF.
The percentage of solids in the RPF was set to 97.4%, based on the moisture contents of coal-equivalent and coke-equivalent products indicated by the RPF quality standards set by the Japan RPF Industry Association with their average weighted by the manufacturing ratio of these products. ○ Percentage of plastic-derived content
The calculation of the percentage of the plastics-derived constituents (dry basis) used the wet-based moisture content of the constituents of municipal solid waste determined in the Emission from Controlled Disposal Sites (6.A.1.) section, which was converted to a dry-based value. The results of the content analysis of the wet-based refuse were obtained from the Results of Content Analysis of Refuse for each facility listed in the Proper Management of Refuse-derived Fuels.
The percentage of plastics-derived constituents in the RPF (dry basis) was set at 50% for the coal-equivalent product and 90% for the coke-equivalent product based on the results of a fact-finding survey by the Japan RPF Industry Association. ○ Carbon content in plastics
The average carbon content used in the Incineration of Municipal Solid Waste (Plastics) (6C) section was applied to the carbon content in plastics contained in the RDF (dry basis).
The carbon content (73.7%) of plastics contained in the RPF (dry basis) was determined from the carbon content value (70%) used in the Incineration of Industrial Waste (Waste Plastics) (Table 8-26), which was converted to a dry basis using the moisture content in waste plastics in industrial waste. ○ Rate of combustion
The rate of combustion of the RDF was set to 99%, applying the default value in the Good Practice Guidance (2000) in the same manner as for municipal solid waste (plastics). The rate for the RPF was set to 99.5%, using the default value in the Good Practice Guidance (2000) in the same manner as for industrial waste (waste plastics).
Table 8-38 Carbon dioxide emission factors associated with the incineration of RDF and
RPF (kg-CO2/t)
Unit 1990 1995 2000 2003 2004MSW-coke oven kgCO2/t(dry) 1,331 1,374 1,404 1,417 1,417Waste tire kgCO2/t(dry) 1,858 1,785 1,790 1,770 1,753RDF kgCO2/t(dry) 1,023 1,020 1,025 1,026 1,026RPF (Coal) kgCO2/t(dry) 1,419 1,419 1,419 1,419 1,419RPF (Coke) kgCO2/t(dry) 2,445 2,445 2,445 2,445 2,445RPF kgCO2/t(dry) 1,627 1,627 1,627 1,627 1,627
Chapter 8. Waste (CRF sector6)
Page 8.40 National Greenhouse Gas Inventory Report of Japan 2006
Activity Data
[Municipal solid waste used as raw material and fuel] The portion of the plastics in municipal solid waste used as raw material or fuel (dry basis) was
determined by multiplying the total amount collected by designated legal bodies and municipalities and processed as raw material and fuel (wet basis) under the Containers and Packaging Recycling Law by the percentage of solids.
1. Processing of plastics collected by designated legal bodies The amount of the plastics collected by designated legal bodies and processed into raw
material and fuel was determined from the amount reported in the Plastic Containers and Packaging (Other Plastics, Food Trays) section of the Statistics of Commercial Recycling of Plastics (Recycling) compiled by the Japan Containers and Packaging Recycling Association. Usage in products that do not emit carbon dioxide was deducted. 2. Processing of plastics collected by municipalities
The amount of plastics collected by municipalities and processed into raw material and fuel was calculated by first subtracting the amount of plastics (wet basis) that was commercially recycled through designated legal bodies from the amount of all plastics that were commercially recycled under the Plastic Containers and Packaging Recycling Law (wet basis), and multiplying the result by the recycling rate of plastics by various methods and the percentage of recycled products in the total amount of the product. (a). Amount of plastics commercially recycled under the Plastic Containers and Packaging
Recycling Law (wet basis) The results of the selective collections by municipalities and commercial recycling under
the Plastic Containers and Packaging Recycling Law were determined from Annual Recycling Statistics by the Waste Management and Recycling Department of the Ministry of the Environment. (b). Amount of plastics commercially recycled through designated legal body channels (wet
basis) The amount was determined from the Actual Collection of Plastic Containers and
Packages section of the Statistics of Commercial Recycling of Plastics (Recycling). (c). Percentage of commercially recycled plastics by recycling method
The rates were obtained from the percentages for various methods of commercial recycling of the plastics collected through municipal channels in the Results of the 2001 Questionnaire to Municipalities on Waste Plastics Processing compiled by the Plastic Waste Management Institute. (d). Percentage of commercially recycled plastic products by recycling method
The values for the commercial recycling of the plastics collected through the municipal channels were substituted for the percentage of commercially recycled plastic products collected through designated legal body channels. The percentages were calculated by
Chapter 8. Waste (CRF sector6)
National Greenhouse Gas Inventory Report of Japan 2006 Page 8.41
dividing the amounts of commercially recycled plastic products by various recycling methods, which were established in the activity data for recycling through designated legal body channels, by the amount of commercially recycled plastics. The amount of commercially recycled plastics by each of the recycling methods was calculated by multiplying the amount of plastics commercially recycled through designated legal body channels, which was calculated in (b), by the percentage of commercially recycled plastics by recycling method obtained from reference documents Assessment and deliberation of the Plastic Containers and Packaging Recycling Law by the Japan Containers and Packaging Recycling Association.
[Industrial waste plastics used as raw materials and fuels] The calculation covered the amount (wet basis) of waste plastics in industrial waste that was
used as raw material or fuel in the Steel Industry and the Cement Manufacturing Industry categories. Usage of raw material or fuel in the steel industry was obtained from the Current State of Plastic Waste Recycling and Future Tasks published by the Japan Iron and Steel Federation. Usage in the cement manufacturing industry was obtained from the Cement Handbook published by Japan Cement Association.
[Industrial waste oil used as raw materials and fuels] The amount of waste oil used as raw material or fuel was extracted from the “fuel usage” in the
“direct recycle usage” and the “fuel usage” in the “recycle usage after treatment” in the Report of the Research on the State of Wide-range Movement and Cyclical Use of Wastes. The values before 1998 are estimated by using the amount of incineration all industrial waste oil.
[Waste tires used as raw materials and fuels] Activity data (dry basis) was calculated by multiplying the amount of waste tires used as raw
material or fuel (wet basis), published in the Tire Industry of Japan of the Japan Automobile Tire Manufacturers Association, by the percentage of solids calculated using the average moisture content in the waste tires determined from analyses of three constituents of divided tires reported in the Basic Waste Data (FactBook 2000) published by Japan Environmental Sanitation Center.
[Refuse-derived solid fuels (RDF and RPF)] The amount of RDF production was used as the substitute for the usage of the RDF fuel. The
activity data was calculated by multiplying the percentage of solids in the RDF by the amount of fuel produced by refuse-based fuel production facilities (wet basis) indicated in the Report on Survey of State of Treatment of Municipal Solid Waste compiled by the Waste Management and Recycling Department of the Ministry of the Environment. The values for the years for which data were unavailable were estimated using the refuse processing capacity.
Determining the usage of RPF covered the paper and cement manufacturing industries which consumed a significant amount of the RPF. The usage of the RPF was calculated by multiplying the average percentage of solids in the RPF by the value in the statistical data compiled by the Japan Paper Association (dry basis) for the paper industry and by the statistical data compiled by the Japan Cement Association (wet basis) for the cement industry.
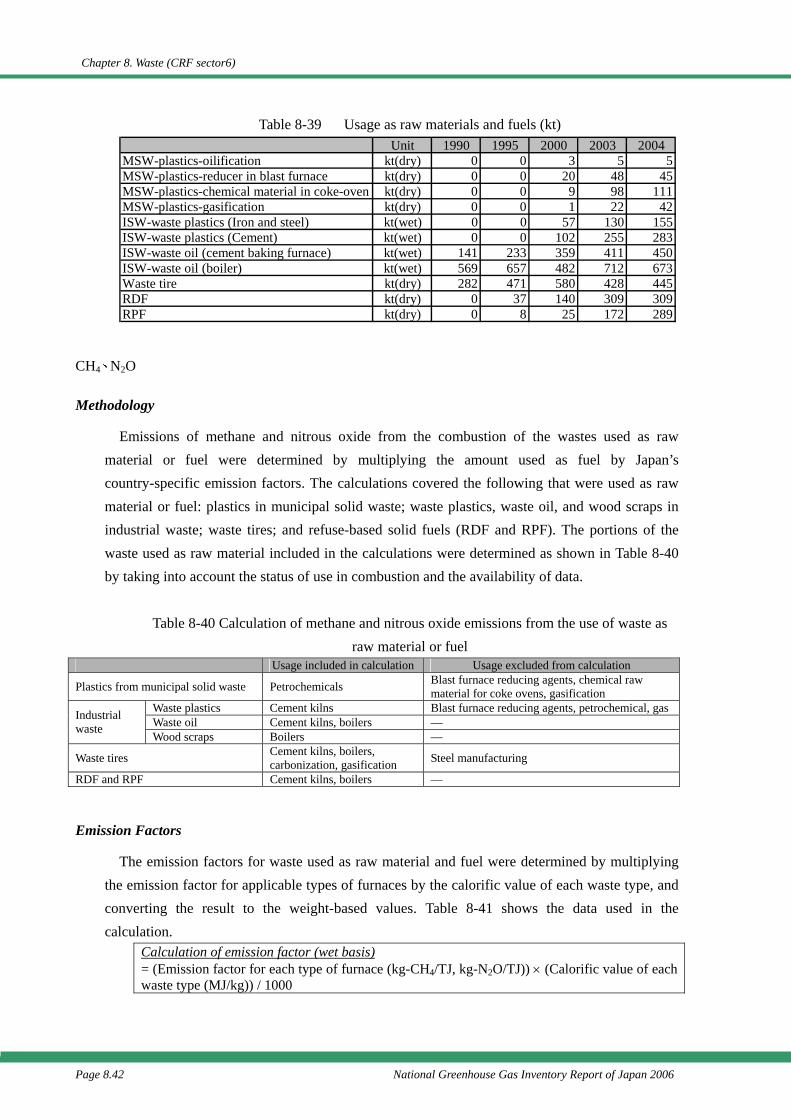
Chapter 8. Waste (CRF sector6)
Page 8.42 National Greenhouse Gas Inventory Report of Japan 2006
Table 8-39 Usage as raw materials and fuels (kt)
CH4、N2O
Methodology
Emissions of methane and nitrous oxide from the combustion of the wastes used as raw material or fuel were determined by multiplying the amount used as fuel by Japan’s country-specific emission factors. The calculations covered the following that were used as raw material or fuel: plastics in municipal solid waste; waste plastics, waste oil, and wood scraps in industrial waste; waste tires; and refuse-based solid fuels (RDF and RPF). The portions of the waste used as raw material included in the calculations were determined as shown in Table 8-40 by taking into account the status of use in combustion and the availability of data.
Table 8-40 Calculation of methane and nitrous oxide emissions from the use of waste as
raw material or fuel Usage included in calculation Usage excluded from calculation
Plastics from municipal solid waste Petrochemicals Blast furnace reducing agents, chemical raw material for coke ovens, gasification
Waste plastics Cement kilns Blast furnace reducing agents, petrochemical, gasWaste oil Cement kilns, boilers — Industrial
waste Wood scraps Boilers —
Waste tires Cement kilns, boilers, carbonization, gasification Steel manufacturing
RDF and RPF Cement kilns, boilers —
Emission Factors
The emission factors for waste used as raw material and fuel were determined by multiplying the emission factor for applicable types of furnaces by the calorific value of each waste type, and converting the result to the weight-based values. Table 8-41 shows the data used in the calculation.
Calculation of emission factor (wet basis) = (Emission factor for each type of furnace (kg-CH4/TJ, kg-N2O/TJ)) × (Calorific value of each waste type (MJ/kg)) / 1000
Unit 1990 1995 2000 2003 2004MSW-plastics-oilification kt(dry) 0 0 3 5 5MSW-plastics-reducer in blast furnace kt(dry) 0 0 20 48 45MSW-plastics-chemical material in coke-oven kt(dry) 0 0 9 98 111MSW-plastics-gasification kt(dry) 0 0 1 22 42ISW-waste plastics (Iron and steel) kt(wet) 0 0 57 130 155ISW-waste plastics (Cement) kt(wet) 0 0 102 255 283ISW-waste oil (cement baking furnace) kt(wet) 141 233 359 411 450ISW-waste oil (boiler) kt(wet) 569 657 482 712 673Waste tire kt(dry) 282 471 580 428 445RDF kt(dry) 0 37 140 309 309RPF kt(dry) 0 8 25 172 289
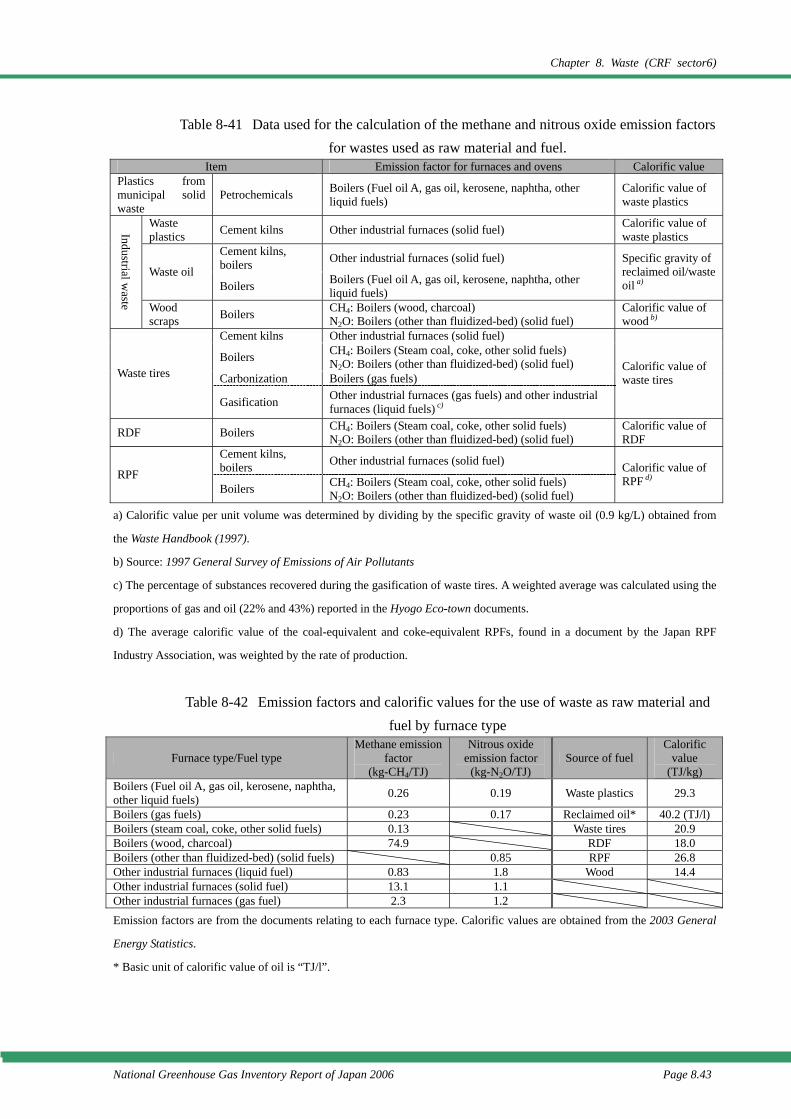
Chapter 8. Waste (CRF sector6)
National Greenhouse Gas Inventory Report of Japan 2006 Page 8.43
Table 8-41 Data used for the calculation of the methane and nitrous oxide emission factors for wastes used as raw material and fuel.
Item Emission factor for furnaces and ovens Calorific value Plastics from municipal solid waste
Petrochemicals Boilers (Fuel oil A, gas oil, kerosene, naphtha, other liquid fuels)
Calorific value of waste plastics
Waste plastics Cement kilns Other industrial furnaces (solid fuel) Calorific value of
waste plastics Cement kilns, boilers Other industrial furnaces (solid fuel)
Waste oil Boilers Boilers (Fuel oil A, gas oil, kerosene, naphtha, other
liquid fuels)
Specific gravity of reclaimed oil/waste oil a)
Industrial waste Wood
scraps Boilers CH4: Boilers (wood, charcoal) N2O: Boilers (other than fluidized-bed) (solid fuel)
Calorific value of wood b)
Cement kilns Other industrial furnaces (solid fuel)
Boilers CH4: Boilers (Steam coal, coke, other solid fuels) N2O: Boilers (other than fluidized-bed) (solid fuel)
Carbonization Boilers (gas fuels) Waste tires
Gasification Other industrial furnaces (gas fuels) and other industrial furnaces (liquid fuels) c)
Calorific value of waste tires
RDF Boilers CH4: Boilers (Steam coal, coke, other solid fuels) N2O: Boilers (other than fluidized-bed) (solid fuel)
Calorific value of RDF
Cement kilns, boilers Other industrial furnaces (solid fuel)
RPF Boilers CH4: Boilers (Steam coal, coke, other solid fuels)
N2O: Boilers (other than fluidized-bed) (solid fuel)
Calorific value of RPF d)
a) Calorific value per unit volume was determined by dividing by the specific gravity of waste oil (0.9 kg/L) obtained from
the Waste Handbook (1997).
b) Source: 1997 General Survey of Emissions of Air Pollutants
c) The percentage of substances recovered during the gasification of waste tires. A weighted average was calculated using the
proportions of gas and oil (22% and 43%) reported in the Hyogo Eco-town documents.
d) The average calorific value of the coal-equivalent and coke-equivalent RPFs, found in a document by the Japan RPF
Industry Association, was weighted by the rate of production.
Table 8-42 Emission factors and calorific values for the use of waste as raw material and
fuel by furnace type
Furnace type/Fuel type Methane emission
factor (kg-CH4/TJ)
Nitrous oxide emission factor
(kg-N2O/TJ) Source of fuel
Calorific value
(TJ/kg) Boilers (Fuel oil A, gas oil, kerosene, naphtha, other liquid fuels) 0.26 0.19 Waste plastics 29.3
Boilers (gas fuels) 0.23 0.17 Reclaimed oil* 40.2 (TJ/l) Boilers (steam coal, coke, other solid fuels) 0.13 Waste tires 20.9 Boilers (wood, charcoal) 74.9 RDF 18.0 Boilers (other than fluidized-bed) (solid fuels) 0.85 RPF 26.8 Other industrial furnaces (liquid fuel) 0.83 1.8 Wood 14.4 Other industrial furnaces (solid fuel) 13.1 1.1 Other industrial furnaces (gas fuel) 2.3 1.2 Emission factors are from the documents relating to each furnace type. Calorific values are obtained from the 2003 General
Energy Statistics.
* Basic unit of calorific value of oil is “TJ/l”.
Chapter 8. Waste (CRF sector6)
Page 8.44 National Greenhouse Gas Inventory Report of Japan 2006
Activity Data
Activity data were determined for each category using the wet-basis values. [Municipal solid waste used as raw material or fuel] The activity data determined during the calculation of the carbon dioxide emissions was used
on a wet basis. [Industrial waste used as raw material or fuel] The calculation of the usage of wastes plastics as raw material or fuel associated with the
source of methane and nitrous oxide emissions covered cement kilns. The activity data determined during the calculation of carbon dioxide emissions relevant to cement kilns was used.
The volume of usage of waste oil as raw material or fuel is calculated separately for cement kilns and boilers. The volume of use of reclaimed oil, which was produced from the waste oil contained in industrial waste and other waste oil, was determined for each of the subject facilities. The volume of waste oil and reclaimed oil used as fuel for cement kilns was determined from the annual data in the Cement Handbook. The volume used as fuel for boilers was determined by subtracting the volume used as fuel for cement kilns from the volume of waste oil used as raw material or fuel, which was determined during the calculation of the carbon dioxide emission from this source.
The amount of usage of waste wood waste oil as raw material or fuel was extracted from the “fuel usage” in the “direct recycle usage” and the “fuel usage” in the “recycle usage after treatment” in the Report of the Research on the State of Wide-range Movement and Cyclical Use of Wastes. The values before 1998 are used the average value in the period of 1998-2002.
[Waste tires used as raw materials and fuels] The “volume of waste tires used as raw material or fuel by usage” that was determined during
the calculation of the carbon dioxide emissions from this source was used. For the activity data, the volume of waste tires recorded in the following categories were used: “Cement kilns” for use in cement kilns; “Medium to small boilers”, “Use by tire factories”, “Use by paper manufacturers”, and “Power generation” for use in boilers; and “Gasification” for use in gasification processes.
[Refuse-based solid fuels (RDF and RPF)] The total production volume of RDF (wet basis) determined during the calculation of the
carbon dioxide emissions from this source was used as the volume of RDF burnt as boiler fuel. Of the total production volume of the RPF determined during the calculation of carbon dioxide
emission from this source, the volume used by the paper industry was used as the volume for the boiler fuel usage, and the volume used by the cement industry was used as the volume for the fuel usage by cement kilns. The fuel usage of the RPF in the paper industry was reported on a dry basis; this was converted to the wet-basis weight by dividing the value by the percentage of solids in the RPF determined during the calculation of the carbon dioxide emission.
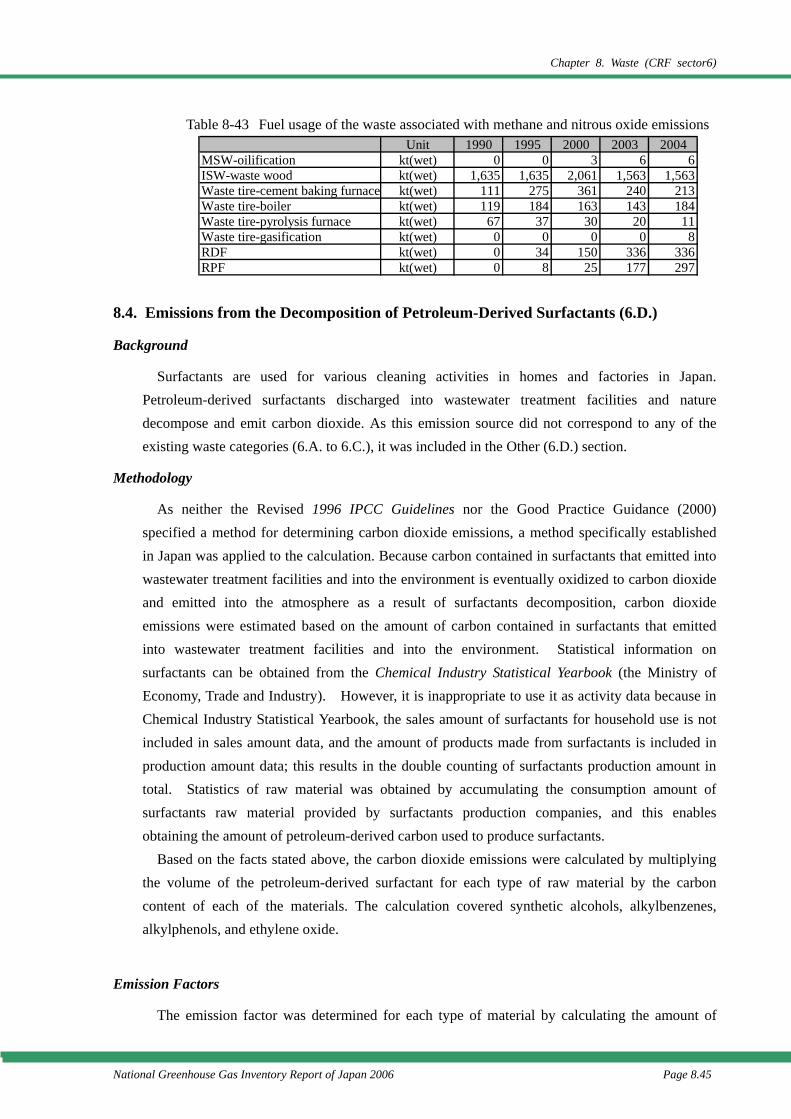
Chapter 8. Waste (CRF sector6)
National Greenhouse Gas Inventory Report of Japan 2006 Page 8.45
Table 8-43 Fuel usage of the waste associated with methane and nitrous oxide emissions
8.4. Emissions from the Decomposition of Petroleum-Derived Surfactants (6.D.)
Background
Surfactants are used for various cleaning activities in homes and factories in Japan. Petroleum-derived surfactants discharged into wastewater treatment facilities and nature decompose and emit carbon dioxide. As this emission source did not correspond to any of the existing waste categories (6.A. to 6.C.), it was included in the Other (6.D.) section.
Methodology
As neither the Revised 1996 IPCC Guidelines nor the Good Practice Guidance (2000) specified a method for determining carbon dioxide emissions, a method specifically established in Japan was applied to the calculation. Because carbon contained in surfactants that emitted into wastewater treatment facilities and into the environment is eventually oxidized to carbon dioxide and emitted into the atmosphere as a result of surfactants decomposition, carbon dioxide emissions were estimated based on the amount of carbon contained in surfactants that emitted into wastewater treatment facilities and into the environment. Statistical information on surfactants can be obtained from the Chemical Industry Statistical Yearbook (the Ministry of Economy, Trade and Industry). However, it is inappropriate to use it as activity data because in Chemical Industry Statistical Yearbook, the sales amount of surfactants for household use is not included in sales amount data, and the amount of products made from surfactants is included in production amount data; this results in the double counting of surfactants production amount in total. Statistics of raw material was obtained by accumulating the consumption amount of surfactants raw material provided by surfactants production companies, and this enables obtaining the amount of petroleum-derived carbon used to produce surfactants.
Based on the facts stated above, the carbon dioxide emissions were calculated by multiplying the volume of the petroleum-derived surfactant for each type of raw material by the carbon content of each of the materials. The calculation covered synthetic alcohols, alkylbenzenes, alkylphenols, and ethylene oxide.
Emission Factors
The emission factor was determined for each type of material by calculating the amount of
Unit 1990 1995 2000 2003 2004MSW-oilification kt(wet) 0 0 3 6 6ISW-waste wood kt(wet) 1,635 1,635 2,061 1,563 1,563Waste tire-cement baking furnace kt(wet) 111 275 361 240 213Waste tire-boiler kt(wet) 119 184 163 143 184Waste tire-pyrolysis furnace kt(wet) 67 37 30 20 11Waste tire-gasification kt(wet) 0 0 0 0 8RDF kt(wet) 0 34 150 336 336RPF kt(wet) 0 8 25 177 297
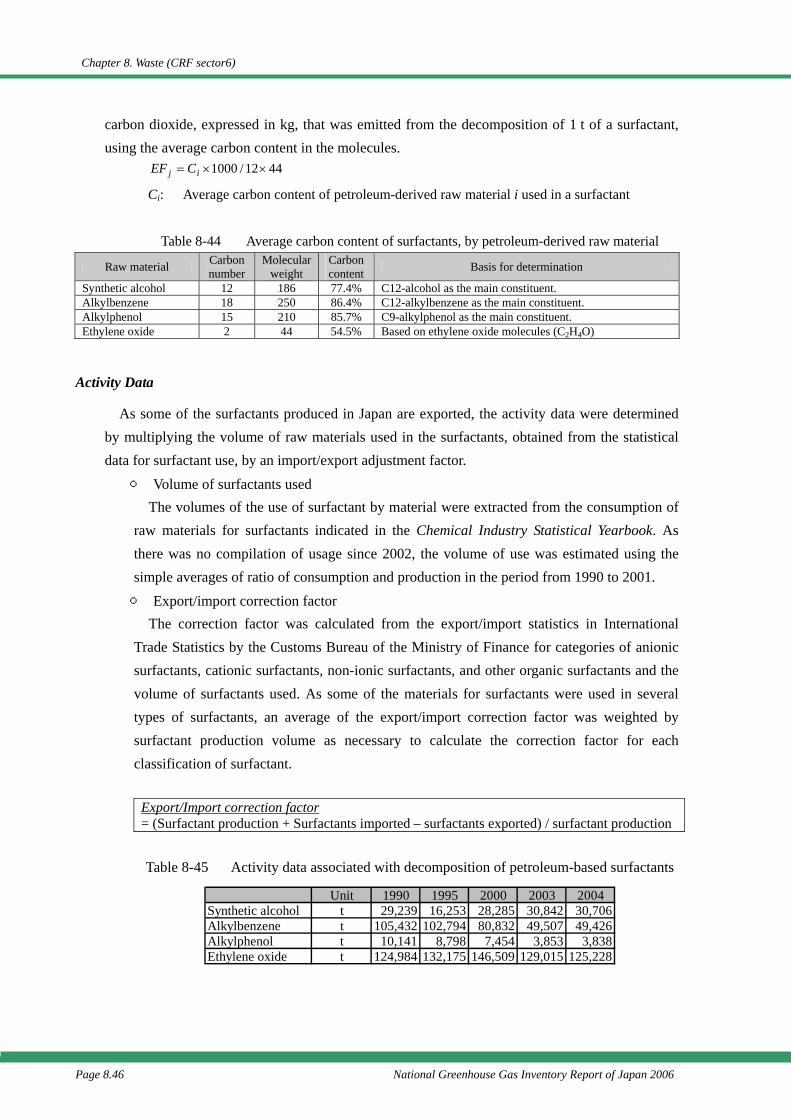
Chapter 8. Waste (CRF sector6)
Page 8.46 National Greenhouse Gas Inventory Report of Japan 2006
carbon dioxide, expressed in kg, that was emitted from the decomposition of 1 t of a surfactant, using the average carbon content in the molecules.
4412/1000 ××= ij CEF
Ci: Average carbon content of petroleum-derived raw material i used in a surfactant
Table 8-44 Average carbon content of surfactants, by petroleum-derived raw material
Raw material Carbon number
Molecular weight
Carbon content Basis for determination
Synthetic alcohol 12 186 77.4% C12-alcohol as the main constituent. Alkylbenzene 18 250 86.4% C12-alkylbenzene as the main constituent. Alkylphenol 15 210 85.7% C9-alkylphenol as the main constituent. Ethylene oxide 2 44 54.5% Based on ethylene oxide molecules (C2H4O)
Activity Data
As some of the surfactants produced in Japan are exported, the activity data were determined by multiplying the volume of raw materials used in the surfactants, obtained from the statistical data for surfactant use, by an import/export adjustment factor.
○ Volume of surfactants used The volumes of the use of surfactant by material were extracted from the consumption of
raw materials for surfactants indicated in the Chemical Industry Statistical Yearbook. As there was no compilation of usage since 2002, the volume of use was estimated using the simple averages of ratio of consumption and production in the period from 1990 to 2001. ○ Export/import correction factor
The correction factor was calculated from the export/import statistics in International Trade Statistics by the Customs Bureau of the Ministry of Finance for categories of anionic surfactants, cationic surfactants, non-ionic surfactants, and other organic surfactants and the volume of surfactants used. As some of the materials for surfactants were used in several types of surfactants, an average of the export/import correction factor was weighted by surfactant production volume as necessary to calculate the correction factor for each classification of surfactant.
Export/Import correction factor = (Surfactant production + Surfactants imported – surfactants exported) / surfactant production
Table 8-45 Activity data associated with decomposition of petroleum-based surfactants
Unit 1990 1995 2000 2003 2004Synthetic alcohol t 29,239 16,253 28,285 30,842 30,706Alkylbenzene t 105,432 102,794 80,832 49,507 49,426Alkylphenol t 10,141 8,798 7,454 3,853 3,838Ethylene oxide t 124,984 132,175 146,509 129,015 125,228
Chapter 8. Waste (CRF sector6)
National Greenhouse Gas Inventory Report of Japan 2006 Page 8.47
References IPCC, Revised 1996 IPCC Guidelines for National Greenhouse Gas Inventories, 1997 IPCC, Good Practice Guidance and Uncertainty Management in National Greenhouse Gas Inventories,
2000 Contracting Survey of Environmental Agency, Comprehensive Survey on Air Pollutant (1995) Environmental Agency, Report on a Survey of Carbon Dioxide Emissions, 1992 Environmental Agency, Results of Review of Calculation of Emissions of Greenhouse Gas Part 2, 2000 Environmental Agency Committee for the Greenhouse Gases Emissions Estimation Methods, GHGs
Estimation Methods Committee Report Part 1, September 2000 Environmental Agency Committee for the Greenhouse Gases Emissions Estimation Methods, Review of
Greenhouse Gases Emissions Estimation Methods Part 2, September 2000 Ministry of the Environment Committee for the Greenhouse Gases Emissions Estimation Methods,
Review of Greenhouse Gases Emissions Estimation Methods Part 3, August 2002 Ministry of the Environment Committee for the Greenhouse Gases Emissions Estimation Methods,
Review of Greenhouse Gases Emissions Estimation Methods, February 2006 Ministry of the Environment, Water Environment Department of the Environmental Management Bureau,
Comprehensive Survey of Emissions of Water Quality Contaminants Ministry of the Environment, Waste Management and Recycling Department , Japan’s Waste Disposal
(CD-ROM) Ministry of the Environment, Waste Management and Recycling Department report of the research on
the state of wide-range movement and cyclical use of wastes (the volume on cyclical use) Ministry of the Environment, Waste Management and Recycling Department , Waste Treatment in Japan Ministry of the Environment, Waste Management and Recycling Department , Study on Residual
Amounts of Industrial Waste from Illegal Dumping and other Sources Ministry of the Environment, Waste Management and Recycling Department , Annual Recycling
Statistics under the Plastic Containers and Packaging Recycling Law Japan Containers and Packaging Recycling Association, Statistics of Commercial Recycling of Plastics
(Recycling).
Japan Containers and Packaging Recycling Association, Assessment and deliberation of the Plastic Containers and Packaging Recycling Law
Ministry of Health, Labor and Welfare, Water Supply Division, Health Service Bureau, Report on Survey of Organizations in Industrial Waste Administration
Ministry of Economy, Trade and Industry, Table of Industrial Statistics - Land and Water Ministry of Economy, Trade and Industry, Chemical Industry Statistical Yearbook Ministry of Economy, Trade and Industry, Annual Textile Statistics Report Clean Japan Centre, Report on Results of Trend and Industry-Specific Studies on Industrial Wastes
(Mining Industry Waste) and Recyclable Waste Japan Chemical Fibers Association, Textile Handbook Japan Society of Waste Management Experts, Waste Handbook Society for the Study of autonomous control of Local Authorities, Directory of national municipalit
Chapter 8. Waste (CRF sector6)
Page 8.48 National Greenhouse Gas Inventory Report of Japan 2006
Japan Iron and Steel Federation, Current State of Plastic Waste Recycling and Future Tasks Japan Cement Association, Cement Handbook Japan Automobile Tire Manufacturers Association, Tire Industry of Japan The Chemical Daily, Chemical manufactured of 14705 Ministry of Land, Infrastructure and Transport, Statistical Yearbook of Motor Vehicle Transport Ministry of Land, Infrastructure and Transport, Sewage Sludge Incineration Volumes, by Flocculant Ministry of Land Infrastructure and Transport, National Institute for Land and Infrastructure
Management, 2000 Annual Report of Investigation and Research for Sewer, NILIM Report 10: pp93-96, 2001
Ministry of Land Infrastructure and Transport, National Institute for Land and Infrastructure Management, 2001 Annual Report of Investigation and Research for Sewer, NILIM Report 64: pp116-122, 2002
Japan Water Works Association, Wateworksr Statistics Hyogo Prefecture, Report of GHG Emission Factors from Stationary Combustion, 1994 Ishikawa Prefecture, City of Osaka, Kanagawa Prefecture, City of Kyoto, City of Kobe, Niigata
Prefecture, Hiroshima Prefecture, Hyogo Prefecture, Fukuoka Prefecture, Hokkaido, Survey of Compilation of Emission Units of Greenhouse Gas from Stationary Sources, 1991-1999
Ishikawa Prefecture, City of Osaka, Kanagawa Prefecture, City of Kyoto, Hiroshima Prefecture, Hyogo Prefecture, Survey of Compilation of Emission Units of Greenhouse Gas from Stationary Sources, 1991-1999
Kanagawa Prefecture, Report of GHG Emission Factors from Stationary Combustion, 1994 Japan Environmental Sanitation Center, Report of Analytical Survey of Methane Emissions, FY1989
Commissioned by the Environmental Agency Japan Sewage Works Association, Guidelines and Analysis of Comprehensive Planning Surveys for the
Provision of Water Mains, Catchment Area 1999 Edition Japan Sewage Works Association, Sewage Statistics (Admin. Ed.) Japan Society of Atmospheric Environment, Method of Estimating Greenhouse Gas Emissions -Survey
Report, 1996 Inamori and Mizuochi, “B-16(8) On-Site Surveys of Balance of Methane and Nitrous Oxide from Sewage
and Waste”, FY1998 Global Environment Research Fund Outcome Report Iwasaki, Tatsuichi, Ueno, “Review of Causes of Emissions of Nitrous Oxide and Methane from Waste
Incinerators”, Annual Report of the Tokyo Metropolitan Research Institute for Environmental Protection, 1992
Kyosai and Mizuochi, “B-2(7) Research to Reveal Emission Volumes from Sewage Treatment Plants”, FY1990 Global Environment Research Fund Outcome Report
Sato Mizuochi and Suzuki, “B-2(7) Research to Reveal Emission Volumes from Sewage Treatment Plants”, FY1992 Global Environment Research Fund Outcome Report
Masaru Tanaka, Compendium of Waste, Maruzen, 1998 Matsubara and Mizuochi, “Survey of Emissions of Nitrous Oxide from Sewage Treatment Plants”,
Environmental and Sanitary Engineering Research, 8(3), 1994
Chapter 8. Waste (CRF sector6)
National Greenhouse Gas Inventory Report of Japan 2006 Page 8.49
Matsuzawa et al., “Estimates of Volume of Methane Released from Sewage Treatment Plants”, Collection of research papers presented to the 4th Academic Conference on Waste, 1993
Nakamura et al., “Emission of Nitrous Oxide from Incineration of Sewage Sludge”, Proceedings of the 20th Japan Urban Cleaning Research Conference, pp391-393, 1998
Nakamura, Suzuki, Sonemura, Ochi, and Harada, “B-51(2) Sewage Treatment System Technology for Limiting Greenhouse Gases”, FY1997 Global Environment Research Fund Outcome Report
Okazaki, Shimizu, and Morita, “Study of Operation Records Based on Precision Function Inspection of Human Waste Management Plant”, Japan Environmental Sanitation Center Report 28
Omura, Kawakubo, and Yamada, “Study of Emission Factors for N2O from High-load Human Waste Management”, Journal of Waste Management 57, p260
Suzuki, Ochi, Miyata, “Continuous Measurement of Nitrous Oxide Emissions from Sewage Sludge Flux Furnaces”, Proceedings of the 11th Environmental Engineering Symposium 2001, pp387-390, 2001
Takeishi, Suzuki, and Matsubara, “B-2(7) Research to Reveal Emission Volumes from Sewage Treatment Plants”, FY1993 and FY1994 Global Environment Research Fund Outcome Reports
Takeishi, Suzuki, and Matsubara, “B-2(7) Research to Reveal Emission Volumes from Sewage Treatment Plants”, FY1993 Global Environment Research Fund Outcome Report
Takeishi, Watanabe, Matsubara, Hirayama, Maebashi, Koma, Wakasugi and Yoshikawa, “Report on Joint Research into the Behavior and Reduction of Waste Gas Components in Flux Furnaces”, Public Works Research Institute, Ministry of Construction and Nagoya City Water Authority, 1996
Takeishi, Watanabe, Matsubara, Sato, Maebashi, Tanaka, Miwa, Wakasugi and Yamashita, Report on Joint Research into the Behavior and Reduction of Waste Gas Components in Flux Furnaces, Public Works Research Institute, Ministry of Construction and Nagoya City Water Authority, 1994
Tanaka, Inoue, Matsuzawa, Osako, and Watanabe, “B-2(1) Research into Volumes Released from Waste Treatment Plants”, 1994 Global Environment Research Fund Outcome Report
Tanaka, Inoue, Osako, Yamada, and Watanabe, “B-16(7) Research into Limiting Generation of Methane and Nitrous Oxide from the Waste Sector”, FY1997 Global Environment Research Fund Outcome Report
Ueno et al., “Review of Measures to Reduce Nitrous Oxide in Sewage Treatment Plants”, Tokyo Metropolitan Research Institute for Environmental Protection, 1995
Watanabe et al. “Primary Screening of Greenhouse Gases Generated in Association with the Biological Breakdown of Organic Wastes”, Collection of papers presented to the 13th Japan City Cleaning Research Conference, 1992
Yasuda et al., “Behavior of Nitrous Oxide Emissions Associated With Incineration of Sewage Sludge”, Journal of Japan Society of Waste Management Experts Vol. 5, No. 4, 1994
Iwata, Kato, Sawada and Mori, Study on the Utilization of Sludge from Purification Plant for Agriculture II. Effects of application of sludge as soil amendment matter on rice plants, Aichi-ken Agricultural Research Center Report, 14, 46-52, 1982
Chapter 8. Waste (CRF sector6)
Page 8.50 National Greenhouse Gas Inventory Report of Japan 2006
Chapter 9. Other (CRF sector 7)
National Greenhouse Gas Inventory Report of Japan 2006 Page 9.1
Chapter 9. Other (CRF sector 7)
They have been reported as “NO.” UNFCCC Reporting Guidelines (FCCC/SBSTA/2004/8) para.29 indicates that Annex I Parties should report and explicitly describe the details of emissions from each country-specific source of gases which are not included in the IPCC Guidelines. According to this requirement, emissions from other category (CRF sector7) are indicated below.
9.1. CO2, CH4, N2O, HFCs, PFCs and SF6
The national inventory submitted this year does not include the emissions and removals of gases targeted under the Kyoto Protocol (CO2, CH4, N2O, HFCs, PFCs, SF6) from the sources which are not included in the IPCC Guideline.
9.2. NOx, CO, NMVOC and SO2
The inventory submitted this year includes CO emissions from smoking as the emissions of indirect greenhouse gases (NOx, CO, NMVOC) and SO2 from the sources which are not included in the IPCC Guideline (Refer to 7-2006.xls).
Chapter 9. Other (CRF sector 7)
Page 9.2 National Greenhouse Gas Inventory Report of Japan 2006
Chapter 10. Recalculation and Improvements
National Greenhouse Gas Inventory Report of Japan 2006 Page 10.1
Chapter 10. Recalculation and Improvements
10.1. Explanation and Justification for Recalculations
This section explains improvements on estimation of emissions and removals in the current inventory (submitted in 2006).
In accordance with the Good Practice and Uncertainty Management in National Greenhouse Gas Inventories (2000) (hereafter, the Good Practice Guidance (2000)) and the IPCC Good Practice Guidance for Land Use, Land-Use Change and Forestry (hereafter, LULUCF-GPG), recalculations of previously reported emissions and removals are recommended in the cases of 1) application of new estimation methods, 2) addition of new categories for emissions and removals and 3) data refinement. Major changes in the inventory submitted last year are indicated below.
10.1.1. General
In general, activity data for the latest year available at the time when the inventory is compiled are often revised in the year following the submission year because of such as the publication of data in the fiscal year basis. In the national inventory submitted this year, activity data in many sources for 2002 have been changed and as a result, the emissions from those sources for the inventory year have been recalculated.
The 2006 inventory includes many emission sources for which the calculation methods have changed or new emission sources have been added as the result of a review of the status of greenhouse gas emissions and the calculation methods for the categories for which the 2005 report returned “Not Estimated (NE)”, as well as an across-the-board review of the methodology for estimating emissions.
10.1.2. Energy sector
10.1.2.1. 1.A. Fuel Combustion Activities (Stationary Sources): CO2
1) Emission Factors for Fuels Some of the emission factors used in the prior inventories deviated from the IPCC default
values by 2% or more. As the result of validation, the following categories were identified for revision of emission factors:
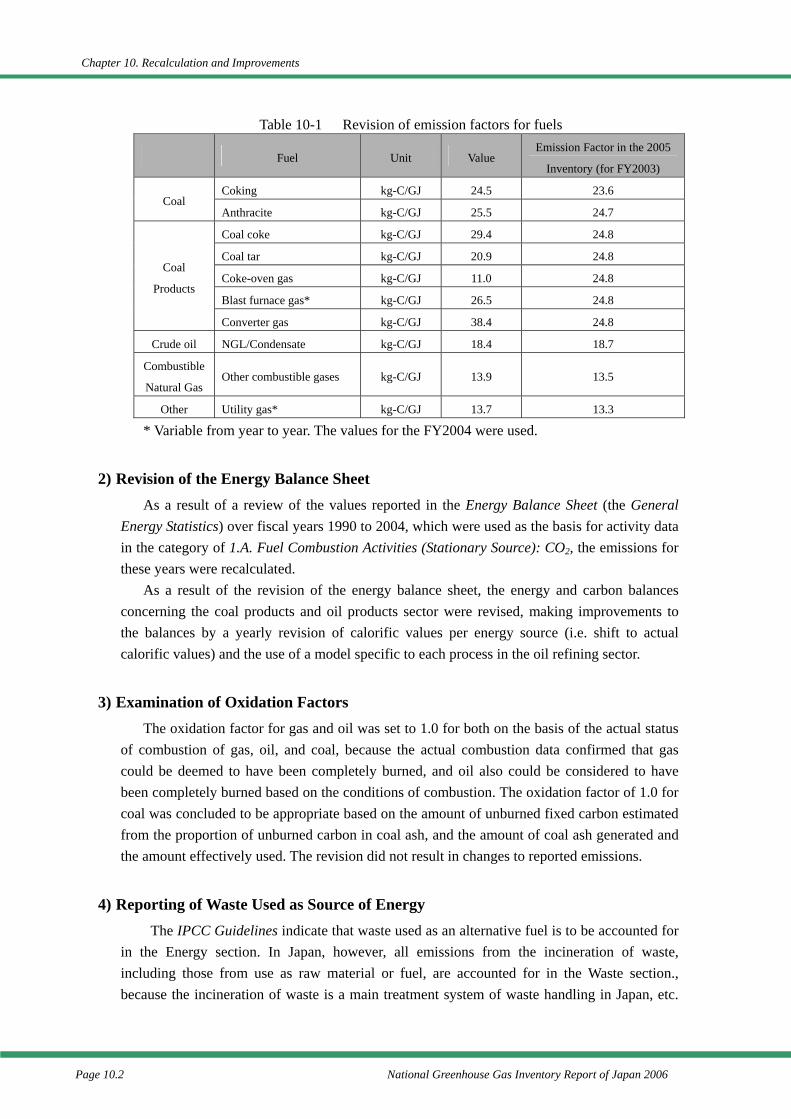
Chapter 10. Recalculation and Improvements
Page 10.2 National Greenhouse Gas Inventory Report of Japan 2006
Table 10-1 Revision of emission factors for fuels
Fuel Unit Value Emission Factor in the 2005
Inventory (for FY2003)
Coking kg-C/GJ 24.5 23.6 Coal
Anthracite kg-C/GJ 25.5 24.7
Coal coke kg-C/GJ 29.4 24.8
Coal tar kg-C/GJ 20.9 24.8
Coke-oven gas kg-C/GJ 11.0 24.8
Blast furnace gas* kg-C/GJ 26.5 24.8
Coal
Products
Converter gas kg-C/GJ 38.4 24.8
Crude oil NGL/Condensate kg-C/GJ 18.4 18.7
Combustible
Natural Gas Other combustible gases kg-C/GJ 13.9 13.5
Other Utility gas* kg-C/GJ 13.7 13.3
* Variable from year to year. The values for the FY2004 were used.
2) Revision of the Energy Balance Sheet As a result of a review of the values reported in the Energy Balance Sheet (the General
Energy Statistics) over fiscal years 1990 to 2004, which were used as the basis for activity data in the category of 1.A. Fuel Combustion Activities (Stationary Source): CO2, the emissions for these years were recalculated.
As a result of the revision of the energy balance sheet, the energy and carbon balances concerning the coal products and oil products sector were revised, making improvements to the balances by a yearly revision of calorific values per energy source (i.e. shift to actual calorific values) and the use of a model specific to each process in the oil refining sector.
3) Examination of Oxidation Factors The oxidation factor for gas and oil was set to 1.0 for both on the basis of the actual status
of combustion of gas, oil, and coal, because the actual combustion data confirmed that gas could be deemed to have been completely burned, and oil also could be considered to have been completely burned based on the conditions of combustion. The oxidation factor of 1.0 for coal was concluded to be appropriate based on the amount of unburned fixed carbon estimated from the proportion of unburned carbon in coal ash, and the amount of coal ash generated and the amount effectively used. The revision did not result in changes to reported emissions.
4) Reporting of Waste Used as Source of Energy The IPCC Guidelines indicate that waste used as an alternative fuel is to be accounted for
in the Energy section. In Japan, however, all emissions from the incineration of waste, including those from use as raw material or fuel, are accounted for in the Waste section., because the incineration of waste is a main treatment system of waste handling in Japan, etc.
Chapter 10. Recalculation and Improvements
National Greenhouse Gas Inventory Report of Japan 2006 Page 10.3
The emissions from waste incinerated as raw material or fuel are estimated separately as constituents of the waste.
10.1.2.2. 1.A. Fuel Combustion Activities (Stationary Source): CH4 and N2O
1) Elimination of adjustments for atmospheric intake and review of emission factors Methane and nitrous oxide emission factors associated with fuel combustion were adjusted
for methane or nitrous oxide intake from atmosphere in past reports to take account of the difference between the concentrations in exhaust gas and the gas drawn into facilities. The adjustments have been eliminated in the 2006 report in compliance with the IPCC Guidelines. The emission factors are calculated on the basis of the actual measurements of exhaust.
Outlier tests of actual measurements data are conducted again when the emission factors are altered.
2) Activity data of non-CO2 emission calculation The fuel consumption of Comprehensive Survey on Air Pollutant had been used as the
activity data of non-CO2 emission calculation from stationary sources until 2005 inventory submission. A part of these data were inconsistent to the activity data used for CO2 emission calculation from the same sources. Thus, the activity data used for non-CO2 emission calculation are changed and be consistent to the data used for CO2 emission calculation.
3) Calculation of emissions associated with consumption of biomass fuels (wood and charcoal) in the household sector Methane and nitrous emissions from this source, which were not estimated in past reports,
were calculated by multiplying the value for the Direct Use of Biomass given in the household sector category of the General Energy Statistics by the default values given for wood in the Revised 1996 IPCC Guidelines.
10.1.2.3. 1.A.3. Fuel Combustion Activities (Mobile Sources): CH4 and N2O
10.1.2.3.a. Emission Sources with New Estimation Methods
1) 1.A.3.b. Natural Gas-Powered Vehicles: CH4 and N2O In response to annual increases in the number of natural gas-powered vehicles, methane
and nitrous oxide emissions from this source are calculated by establishing the emission factors on the basis of the results of the actual measurements of emissions.
2) 1.A.3.b. Motorcycles: CH4 and N2O Methane emissions are calculated by establishing the methane emission factor and activity
data, using a calculation method for emissions from mobile sources which are subject to the PRTR Law (Pollutant Release and Transfer Register Law) of Japan. The default emission
Chapter 10. Recalculation and Improvements
Page 10.4 National Greenhouse Gas Inventory Report of Japan 2006
factor given in the Revised 1996 IPCC Guidelines is used for the calculation of nitrous oxide emissions.
3) 1.A.3.c. Steam Locomotives: CH4 and N2O Methane and nitrous oxide emissions are calculated by multiplying the newly estimated
coal consumption of steam locomotives by the default values given in the Revised 1996 IPCC Guidelines.
10.1.2.3.b. Emission Sources with Revised Estimation Method
1) 1.A.3.b. Gasoline-Powered Small Cargo Trucks, Diesel-Powered Small/Regular Cargo Trucks: CH4 and N2O Using newly obtained data on methane and nitrous oxide emission factors, the methane
emission factor for gasoline-powered small cargo trucks and the nitrous oxide emission factors for diesel-powered small and regular cargo trucks were changed from the default values to Japan’s country-specific values based on actual measurement data.
10.1.2.4. 1.B. Fugitive Fuel Emissions
10.1.2.4.a. Emission Sources with New Estimation Methods
1) 1.B.2.c. Venting in the Natural Gas Industry: CO2, CH4
In the absence of the default values in the IPCC Guidelines, emissions from the vents in gas fields are not reported. Emissions from the respiration of natural gas during transmission, which were accounted for in the Natural Gas Transmission (1.B.2.b.ii.)1 category in past reports, have been moved to this source.
2) 1.B.2.c. Flaring in the Natural Gas Industry: CO2, CH4, and N2O Emissions are calculated by the Tier 1 Method described in the Good Practice Guidance
(2000) using the default emission factors for flaring.
3) 1.B.2.c. Flaring in the Petroleum Industry: CO2, CH4, and N2O Emissions are calculated by the Tier 1 Method described in the Good Practice Guidance
(2000) using the default emission factors for flaring.
1 This category is “1.B.2.b.iii” in the CRF used 2006 submission.
Chapter 10. Recalculation and Improvements
National Greenhouse Gas Inventory Report of Japan 2006 Page 10.5
10.1.3. Industrial process sector
10.1.3.1. Emission Sources with New Estimation Methods
1) 2.A.4. Soda Ash Production and Use: CO2 In accordance with the technique described in the Revised 1996 IPCC Guidelines,
emissions are calculated by multiplying the soda ash consumption by the default emission factor (i.e. carbon dioxide emission per amount of soda ash consumption).
2) 2.B.4. Calcium Carbide Production: CO2 In accordance with the technique described in the Revised 1996 IPCC Guidelines,
emissions are calculated by multiplying the calcium carbide production by the default emission factor (i.e. limestone-derived, reducing agent-derived, and “during use” carbon dioxide emission from calcium carbide per amount of calcium carbide production.)
3) 2.B.4. Silicon Carbide Production: CO2 In accordance with the technique described in the Revised 1996 IPCC Guidelines,
emissions are calculated by multiplying the consumption of petroleum coke as raw material for silicon carbide by the default emission factor (i.e. carbon dioxide emission per amount of petroleum coke consumed as raw material for silicon carbide).
4) 2.C.1. Iron and Steel Production (Emissions from Electrodes of Electric Arc Furnaces): CO2 Emissions of carbon dioxide generated by the carbon electrodes of electric arc furnaces are
calculated by multiplying the amount of crude steel production by electric furnace by the default value shown in the GPG(2000) (i.e. carbon dioxide emissions per amount of crude steel production by electric furnace).
5) 2.F.3. Fire Extinguishers: HFCs, PFCs, SF6
Emission of HFCs at time of disposal is reported as “NO” on the assumption that there is no disposal because of the short history of the use of HFCs in fire extinguishers. Emissions of PFCs and SF6 are also reported as “NO” as there is no record of use in Japan.
10.1.3.1.b. Emission Sources with Revised Estimation Methods
1) 2.A.1. Cement Production: CO2
The limestone method used in past reports for the calculation of carbon dioxide emissions from cement production (i.e. multiplication of the consumption of limestone in cement production by the carbon dioxide emissions per limestone consumption) has been replaced in the 2006 report by the clinker method shown in the Good Practice Guidance (2000) (i.e. multiplication of the production of clinker, an intermediate product created during the
Chapter 10. Recalculation and Improvements
Page 10.6 National Greenhouse Gas Inventory Report of Japan 2006
manufacture of cement, by the carbon dioxide emission factor calculated from calcium oxide content in clinker).
2) 2.F.1. Refrigeration and Air Conditioning Equipment: PFCs A survey on the emission status of PFCs confirmed that PFCs were not used in Japan for
the manufacture of refrigeration/air conditioning products. As a result, the emission is reported as “NO” for “production”. Emissions from “use” and “disposal” are also reported as “NO” for household refrigerators and stationary air-conditioning equipment, after adjustments for the status of PFC use in the imported products.
3) 2.F.2. Foam Blowing: HFCs In past reports, the total emissions, including those from use and disposal, were reported
for “production”, with the indication of “NE” for “use” and “disposal”. The 2006 report separates the total emissions between “production” and “use”. Emission from “disposal” is reported as “IE” as this subcategory is combined with “use”, and the amount for “disposal” is deemed to be included in the amount calculated for “use”.
Emissions from certain HFCs (HFC-245fa and HFC-365mfc) are excluded from the reporting under “urethane foam” as their GWPs are not provided in the IPCC Guidelines.
4) 2.F.4. Aerosols/Medical Devices (Metered Dose Inhalers) : HFCs In past reports, the total emissions, including those from production and disposal, were
reported for “use”, with the indication of “NE” for “production” and “disposal”. The 2006 report separates the total emissions for aerosols between “production” and “use”. Emissions from “disposal” are reported as “IE” as the entire amount for “disposal” is included in “use”. Emission from “disposal” of medical devices (metered dose inhalers) is reported as “IE” as it is deemed to be included in the amount calculated for “use”.
10.1.3.1.c. Emission Sources with Revised Emission Factors
1) 2.A.3. Limestone and Dolomite Use: CO2
The determination of carbon dioxide emissions factors associated with the use of limestone took into consideration the magnesium carbonate content in limestone in addition to calcium carbonate content.
2) 2.B.3. Adipic Acid Production: N2O The rate of nitrous oxide generation by adipic acid production has been changed to reflect
the actual measurement results.
10.1.3.1.d. Change in data used for calculation of HFCs, PFCs, and SF6 emissions
The emission estimates of HFCs, PFCs, and SF6 were changed due to change in the data and
Chapter 10. Recalculation and Improvements
National Greenhouse Gas Inventory Report of Japan 2006 Page 10.7
actual emission data.
10.1.4. Agricultural sector
10.1.4.1. Emission Sources with New Estimation Methods
1) 4.A.2. Enteric Fermentation (Buffalo): CH4 In accordance with the technique described in the Revised 1996 IPCC Guidelines,
emissions are calculated by multiplying the number of buffaloes being kept for agricultural purposes by the default emission factor (i.e. bodily methane emission per head of buffalo per year).
2) 4.B.2. Manure Management (Buffalo): CH4 and 4.B.11.–13. Manure Management (Buffalo): N2O In accordance with the technique described in the Revised 1996 IPCC Guidelines,
emissions were calculated by multiplying the number of buffaloes being kept for agricultural purposes by the default emission factors (i.e. methane and nitrous oxide emissions associated with manure management per head of buffalo per year).
3) 4.D.1. Agricultural Residues: N2O Nitrous oxide emissions from crop residues plowed into the soil are calculated by
multiplying the amount of nitrogen contained in the crop residues used for soil amendment by the default emission factor given in the Revised 1996 IPCC Guidelines and the Good Practice Guidance (2000) (i.e. the amount of nitrogen contained in nitrous oxide emission from 1 kg of nitrogen fertilizer applied), based on Japan’s country-specific technique.
4) 4.D.1. Plowing of Organic Soil: N2O In accordance with the technique described in the Revised 1996 IPCC Guidelines,
emissions are calculated by multiplying the area of organic soil by the default emission factor (i.e. the amount of nitrous oxide emitted from the plowing of 1 hectare of organic soil).
10.1.4.2. Emission Sources with Revised Estimation Methods
1) 4.A.1. Enteric Fermentation (Cattle): CH4
Five- and six-month-old cattle are newly included in the scope of the calculation. Emission factors were revised by using the data published in the Japanese Feeding Standards, which are revised every several years, as the amount of dry matter intake.
2) 4.B. Manure Management : CH4 and N2O The double counting of emissions between manure management and pasture, range and
Chapter 10. Recalculation and Improvements
Page 10.8 National Greenhouse Gas Inventory Report of Japan 2006
paddock manure was eliminated for cattle. Emission factors for composted mixed manure of non-dairy cattle, which were reported at the same value as for composted urine in past reports, were revised to use the same value as for the composted dung. According to the result of an investigation of validity of the all emission factors for cattle, swine and poultry, some emission factors were revised where appropriate.
The reporting category of the emission from grazing was reallocated from the category of Pasture, Range and Paddock Manure (4.D.2.) to Manure Management (4.B.1.). Activity data was determined by using the grazing population in both public and private pastures, and also using the new data for grazing period.
3) 4.D.1. Direct Soil Emissions (Synthetic Fertilizer, Organic Fertilizer): N2O As a result of new findings that led to new emissions factors, emissions were calculated on
the basis of the new emission factor.
4) 4.D.3. Indirect Emissions (Atmospheric Deposition and Leaching/Run-off of Nitrogen): N2O For nitrogen excretions by cattle, swine, and poultry which were used for the calculation of
activity data, the default values given in the Revised 1996 IPCC Guidelines and the Good Practice Guidance (2000) were replaced by Japan’s country-specific nitrogen excretion data used in the Manure Management (4.B.) category. As a result of new findings that led to new emissions factors, amounts for “leaching and run-off” of nitrogen were calculated on the basis of 190 days of grazing.
5) 4.F.1. Field Burning of Agricultural Residues: CH4 and 4.F.1.–3. Field Burning of Agricultural Residues: N2O In the calculation of methane and nitrous oxide emissions associated with the burning of
“rice and wheat” crop residues, the default technique established in the Revised 1996 IPCC Guidelines and the Good Practice Guidance (2000) as a method for the estimation of emissions was used instead of Japan’s country-specific method that was used in past reports. In addition, country-specific data that became available in Japan were used for the “nitrogen content” parameter required for the calculation of activity data for the Other Crops category.
10.1.5. Land Use, Land-Use Change, and Forestry (LULUCF) Sector
1) 5.A. , and 5.B.2.-5.F.2. Categories of forest distribution Japan defined forest for estimation based on Forest Law Article 2 so far. Forest definition
for “Forest land” is redefined from 2006 inventory submission based on Forest Law Article 5 and Article 7.2. . The activity data were changed accordingly.
Chapter 10. Recalculation and Improvements
National Greenhouse Gas Inventory Report of Japan 2006 Page 10.9
2) 5.A.1. Forest land remaining Forest land :CO2 In the carbon stock change in biomass due to fires in private forests in "5.A.1. Forest land
remaining forest land: CO2", Japan had estimated the damaged timber volume in private forests using the data for damaged timber volume in national forests. Because data for damaged timber volume in private forests were obtained the activity data for private forest fire were changed.
3) 5.E.1. Settlements remaining Settlements :CO2 ” Because data for “Urban grove park” and “Square park” were obtained, these data are
added to the activity data for estimating carbon stock change in biomass in "5.E.1. Settlements remaining Settlements.
10.1.6. Waste Sector
10.1.6.1. New and Revised Estimation Methods
10.1.6.1.a. Emission Sources with New Estimation Methods
1) 6.A.1. Managed Waste Disposal on Land (Sludge): CH4 Methane emission associated with sludge disposed in landfill sites was added to
subcategory and newly calculated. The types of sludge included in the calculation are divided into the subcategories of “sewage sludge”, “sewage treatment and septic tank sludge”, “water purification sludge”, “organic sludge from manufacturing”, and “livestock waste treatment sludge”. Methane emission is calculated for each type of the sludge using the same method used for the Emissions from Managed Waste Disposal on Land (6.A.1.) category.
2) 6.A.3. Illegal Disposal on Land: CH4
Methane emission associated with industrial waste that was illegally disposed of on land was recalculated. The scope of the calculation includes wood scraps contained in the industrial waste illegally discarded. Methane emission for this category is calculated using the same method used in the Emissions from Managed Waste Disposal on Land (Wood Scraps) (6.A.1.) category.
3) 6.A.3. Composting of Organic Waste: CH4 and N2O Methane and nitrous oxide emissions associated with the composting of organic waste
were recalculated. The types of organic waste included in the calculation are divided into the subcategories of “paper scraps”, “textile scraps”, “wood scraps”, “kitchen garbage”, and “sewage sludge”. Emissions are calculated for methane and nitrous oxide using the method described in the 2006 IPCC Guidelines (Draft).
Chapter 10. Recalculation and Improvements
Page 10.10 National Greenhouse Gas Inventory Report of Japan 2006
4) 6.B.1. Industrial Waste Water: N2O Nitrous oxide emissions associated with the treatment of industrial wastewater were
recalculated. The scope of the calculation covers industrial wastewater that is treated at facilities using activated sludge or other advanced treatments. Emission is calculated by determining the nitrous oxide emission factor per amount of nitrogen contained in industrial wastewater.
5) 6.B.2. Decomposition of Domestic and Commercial Waste Water in Nature: CH4 and N2O Amounts of methane and nitrous oxide emitted from the natural decomposition of
domestic wastewater discharged untreated into public waters were recalculated. The scope of the calculation covers the subcategories of domestic wastewater discharged from households using septic tanks or vault toilets, domestic wastewater from households using on-site disposal systems, and human waste dumped into the ocean. Methane and nitrous emissions are calculated by the method shown in the 2006 IPCC Guidelines (Draft).
6) 6.C. Municipal Waste Incineration (Synthetic Textile Scraps): CO2 and 6.C. Industrial Waste Incineration (Synthetic Textile Scraps): CO2
Carbon dioxide emissions associated with the incineration of synthetic textile scraps contained in municipal and industrial wastes were recalculated. Carbon dioxide emissions are calculated by establishing the carbon dioxide emission factors from the proportion of petroleum-derived carbon in synthetic textiles, and using the proportion of synthetic textile scraps contained in textile scraps that are incinerated.
7) 6.C. Special Management Waste Incineration: CO2, CH4, and N2O Carbon dioxide, methane, and nitrous oxide emissions associated with the incineration of
special management industrial waste were recalculated. The scope of the calculation covers the subcategories of “waste oil” and “infectious waste”. Emissions are calculated using the same method as for the Waste Incineration (6.C.) category.
8) 6.C. Use of “Waste: CO2, CH4, and N2O” as Alternative Fuels: CO2, CH4, and N2O Carbon dioxide, methane, and nitrous oxide emitted when municipal and industrial wastes
are used as raw material or fuel (excluding those used as material for products) were added to the scope of the calculation. Methane and nitrous oxide emissions are calculated by establishing emission factors according to the status of usage as raw material or fuel of the waste that is covered by the scope of the calculation. 6.C. Emissions associated with the use of municipal waste (plastics) as raw material or fuel: CO2, CH4, and N2O Carbon dioxide, methane, and nitrous oxide emissions were added to the scope of the
calculation with respect to amounts of plastic containers and packaging (Other Plastics,
Chapter 10. Recalculation and Improvements
National Greenhouse Gas Inventory Report of Japan 2006 Page 10.11
Food Trays) that are recycled under the Plastic Containers and Packaging Recycling Law. Carbon dioxide emissions are calculated with respect to the plastics that are used in “chemical raw material for coke ovens”, “blast furnace reducing agents”, and “gasification” and “petrochemicals”, while methane and nitrous oxide are calculated with respect to those used in “petrochemicals”. 6.C. Emissions associated with the use of industrial waste (waste oil) as raw material or fuel: CO2, CH4, and N2O Carbon dioxide, methane, and nitrous oxide emissions associated with the use of waste oil
contained in industrial waste as raw material or fuel were added to the scope of the calculation. 6.C. Emissions associated with the use of industrial waste (waste plastics) as raw material or fuel: CO2, CH4, and N2O Carbon dioxide, methane and nitrous oxide emissions were added to the scope of the
calculation with respect to those associated with the use of waste plastics as raw material or fuel in the iron and steel industry and the cement industry, for which the statistical data are available at present. 6.C. Emissions associated with the use of industrial waste (wood scraps) as raw material or fuel: CO2 and CH4 Carbon dioxide and methane emissions associated with the use of wood scraps contained
in industrial waste used as raw material or fuel were added to the scope of the calculation. 6.C. Emissions associated with the use of waste tires as raw material or fuel: CO2, CH4, and N2O Carbon dioxide, methane, and nitrous oxide emissions associated with the use of waste
tires as raw material or fuel were added to the scope of the calculation. Carbon dioxide emissions are calculated using the emission factor established by deducting the percentage of carbon from natural rubber contained in the tires. 6.C. Emissions associated with the use of refuse-derived solid fuels (RDF/RPF) as raw material for fuel: CO2, CH4, and N2O Carbon dioxide, methane, and nitrous oxide emissions associated with the use of
refuse-derived solid fuels (RDF/RPF) as raw material or fuel were added to the scope of the calculation. Carbon dioxide emissions are calculated using emission factors which are established by taking the plastic components in RDF and RPF into consideration.
9) 6.D. Emissions Associated with Decomposition of Petroleum-Derived Surfactants: CO2 Carbon dioxide emissions were added to the scope of the calculation with respect to those
associated with the decomposition of petroleum-derived surfactants that are discharged into wastewater treatment facilities and nature. Petroleum-derived carbon content of surfactants is determined from the amount of petroleum-derived raw material used in surfactants.
Chapter 10. Recalculation and Improvements
Page 10.12 National Greenhouse Gas Inventory Report of Japan 2006
10.1.6.1.b. Emission Sources with Revised Estimation Methods
1) 6.A. Solid Waste Disposal on Land (Kitchen Garbage, Paper Scraps, Textile Scraps, Wood Scraps): CH4
A new methane emission factor was established for disposal in semi-aerobic landfill. Municipal waste was divided into disposal in semi-aerobic and anaerobic landfills for the calculation of methane emissions.
The calculation of methane emissions, which were calculated for paper and textile scraps combined in past reports, was divided into two categories. For textile scraps, the volume of synthetic textile disposed of in landfill has been excluded from the activity data because there is little biological decomposition. Contents of paper, textile, and wood scraps have been revised to more realistic values.
2) 6.B.1. Industrial Waste Water Handling: CH4
Activity data for this source in past reports covered the entire volume of industrial wastewater that was treated. In the 2006 report, activity data covers only the portion of industrial waste that was treated at facilities using activated sludge and advanced treatments.
3) 6.C. Municipal Waste Incineration: CH4 and N2O Adjustments for atmospheric intake were eliminated from emissions factors for the
calculation of methane and nitrous oxide emissions from this source. (See Paragraph 1. of 10.1.2.2. – 1.A. Fuel Combustion Activities (Stationary Sources): CH4 and N2O.)
4) 6.C. Industrial Waste Incineration: CH4 and N2O The adjustments for atmospheric intake were eliminated from emissions factors for the
calculation of methane and nitrous oxide emissions from this source. Methane and nitrous oxide emissions from incineration of “textile scraps” and “animal and
plant residues or animal carcasses” contained in industrial waste were added to the scope of the calculation.
10.1.6.2. Sector Reorganization for Reporting of Waste Used as Alternative Energy
Emissions from incineration of waste were reported in the Waste sector regardless of whether they were used as an alternative source of energy. The review by the UNFCCC Secretariat, however, found that that classification did not comply with the IPCC Guidelines. As the result of new estimations calculated for emissions from the use of waste as an alternative source of energy and raw material, sectors for which various emissions sources should be reported, including the use as alternative energy, have been reorganized. Specifically: ・ All emissions from incineration of waste, including those from the use of waste as fuel
and raw material, are reported in the Waste sector.
Chapter 10. Recalculation and Improvements
National Greenhouse Gas Inventory Report of Japan 2006 Page 10.13
・ From the point of view of the incentive for industry operators, however, emissions from waste used as alternative energy are accounted for as breakdown items in the incineration category. In addition, these emissions are reported separately for those from waste recycled for use as raw material in chemical recycling and those from heat recovery through use as alternative fuel.
・ A note has been added to the Energy Sector section of the CRF, stating that the “emissions associated with the use of waste as a source of energy and raw material are accounted for in the Waste sector.” The emissions reported in the subcategory of the use of waste as an alternative source of energy and material are included as reference information in the Energy Sector of the National Inventory Report.
・ From the point of view of promoting waste as an alternative energy source, it is very important to account for incinerated waste in different categories corresponding to levels of energy recovery because other types of waste incineration also recover energy at various stages. At present, emissions from this source are accounted for at least on the basis of power generation at municipal waste incinerators because some data (generation capacity, generation efficiency, and total power generated) are available in this field. The categorical reporting of emissions from other forms of the recovery of energy from waste will be promoted with an increased effort to improve the availability of statistical data.
10.2. Implications for Emission Levels
Table 10-2 shows the changes made to the overall emission estimates due to the recalculations indicated in “Section 10.1. Explanation and Justification for Recalculations”.
Total emissions excluding CO2 in LULUCF sector in the base year (1990) under the UNFCCC increased by 1.55%, and the total emissions in year 2003 increased by 1.43% compared to the data reported in last year.
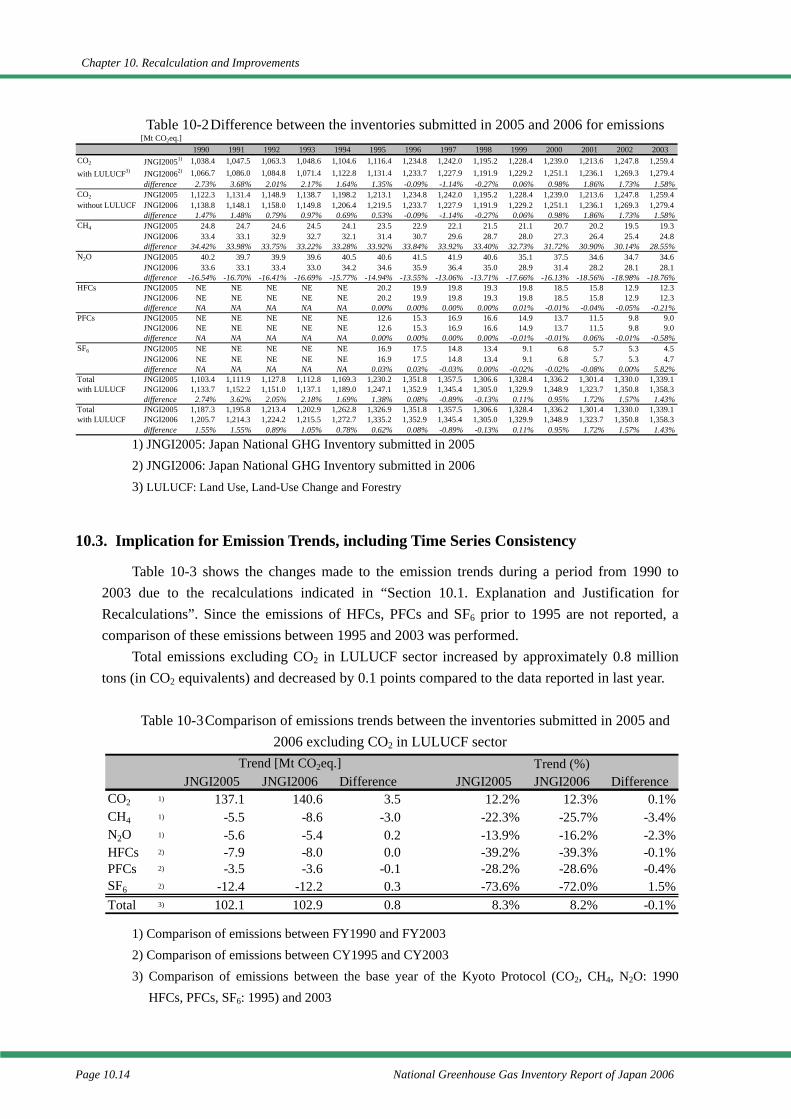
Chapter 10. Recalculation and Improvements
Page 10.14 National Greenhouse Gas Inventory Report of Japan 2006
Table 10-2 Difference between the inventories submitted in 2005 and 2006 for emissions 1) JNGI2005: Japan National GHG Inventory submitted in 2005 2) JNGI2006: Japan National GHG Inventory submitted in 2006 3) LULUCF: Land Use, Land-Use Change and Forestry
10.3. Implication for Emission Trends, including Time Series Consistency
Table 10-3 shows the changes made to the emission trends during a period from 1990 to 2003 due to the recalculations indicated in “Section 10.1. Explanation and Justification for Recalculations”. Since the emissions of HFCs, PFCs and SF6 prior to 1995 are not reported, a comparison of these emissions between 1995 and 2003 was performed.
Total emissions excluding CO2 in LULUCF sector increased by approximately 0.8 million tons (in CO2 equivalents) and decreased by 0.1 points compared to the data reported in last year.
Table 10-3 Comparison of emissions trends between the inventories submitted in 2005 and
2006 excluding CO2 in LULUCF sector 1) Comparison of emissions between FY1990 and FY2003 2) Comparison of emissions between CY1995 and CY2003 3) Comparison of emissions between the base year of the Kyoto Protocol (CO2, CH4, N2O: 1990
HFCs, PFCs, SF6: 1995) and 2003
Trend [Mt CO2eq.] Trend (%)JNGI2005 JNGI2006 Difference JNGI2005 JNGI2006 Difference
CO2 1) 137.1 140.6 3.5 12.2% 12.3% 0.1%CH4 1) -5.5 -8.6 -3.0 -22.3% -25.7% -3.4%N2O 1) -5.6 -5.4 0.2 -13.9% -16.2% -2.3%HFCs 2) -7.9 -8.0 0.0 -39.2% -39.3% -0.1%PFCs 2) -3.5 -3.6 -0.1 -28.2% -28.6% -0.4%SF6 2) -12.4 -12.2 0.3 -73.6% -72.0% 1.5%Total 3) 102.1 102.9 0.8 8.3% 8.2% -0.1%
[Mt CO2eq.]1990 1991 1992 1993 1994 1995 1996 1997 1998 1999 2000 2001 2002 2003
CO2 JNGI20051) 1,038.4 1,047.5 1,063.3 1,048.6 1,104.6 1,116.4 1,234.8 1,242.0 1,195.2 1,228.4 1,239.0 1,213.6 1,247.8 1,259.4with LULUCF3) JNGI20062) 1,066.7 1,086.0 1,084.8 1,071.4 1,122.8 1,131.4 1,233.7 1,227.9 1,191.9 1,229.2 1,251.1 1,236.1 1,269.3 1,279.4
difference 2.73% 3.68% 2.01% 2.17% 1.64% 1.35% -0.09% -1.14% -0.27% 0.06% 0.98% 1.86% 1.73% 1.58%CO2 JNGI2005 1,122.3 1,131.4 1,148.9 1,138.7 1,198.2 1,213.1 1,234.8 1,242.0 1,195.2 1,228.4 1,239.0 1,213.6 1,247.8 1,259.4without LULUCF JNGI2006 1,138.8 1,148.1 1,158.0 1,149.8 1,206.4 1,219.5 1,233.7 1,227.9 1,191.9 1,229.2 1,251.1 1,236.1 1,269.3 1,279.4
difference 1.47% 1.48% 0.79% 0.97% 0.69% 0.53% -0.09% -1.14% -0.27% 0.06% 0.98% 1.86% 1.73% 1.58%CH4 JNGI2005 24.8 24.7 24.6 24.5 24.1 23.5 22.9 22.1 21.5 21.1 20.7 20.2 19.5 19.3
JNGI2006 33.4 33.1 32.9 32.7 32.1 31.4 30.7 29.6 28.7 28.0 27.3 26.4 25.4 24.8difference 34.42% 33.98% 33.75% 33.22% 33.28% 33.92% 33.84% 33.92% 33.40% 32.73% 31.72% 30.90% 30.14% 28.55%
N2O JNGI2005 40.2 39.7 39.9 39.6 40.5 40.6 41.5 41.9 40.6 35.1 37.5 34.6 34.7 34.6JNGI2006 33.6 33.1 33.4 33.0 34.2 34.6 35.9 36.4 35.0 28.9 31.4 28.2 28.1 28.1difference -16.54% -16.70% -16.41% -16.69% -15.77% -14.94% -13.55% -13.06% -13.71% -17.66% -16.13% -18.56% -18.98% -18.76%
HFCs JNGI2005 NE NE NE NE NE 20.2 19.9 19.8 19.3 19.8 18.5 15.8 12.9 12.3JNGI2006 NE NE NE NE NE 20.2 19.9 19.8 19.3 19.8 18.5 15.8 12.9 12.3difference NA NA NA NA NA 0.00% 0.00% 0.00% 0.00% 0.01% -0.01% -0.04% -0.05% -0.21%
PFCs JNGI2005 NE NE NE NE NE 12.6 15.3 16.9 16.6 14.9 13.7 11.5 9.8 9.0JNGI2006 NE NE NE NE NE 12.6 15.3 16.9 16.6 14.9 13.7 11.5 9.8 9.0difference NA NA NA NA NA 0.00% 0.00% 0.00% 0.00% -0.01% -0.01% 0.06% -0.01% -0.58%
SF6 JNGI2005 NE NE NE NE NE 16.9 17.5 14.8 13.4 9.1 6.8 5.7 5.3 4.5JNGI2006 NE NE NE NE NE 16.9 17.5 14.8 13.4 9.1 6.8 5.7 5.3 4.7difference NA NA NA NA NA 0.03% 0.03% -0.03% 0.00% -0.02% -0.02% -0.08% 0.00% 5.82%
Total JNGI2005 1,103.4 1,111.9 1,127.8 1,112.8 1,169.3 1,230.2 1,351.8 1,357.5 1,306.6 1,328.4 1,336.2 1,301.4 1,330.0 1,339.1with LULUCF JNGI2006 1,133.7 1,152.2 1,151.0 1,137.1 1,189.0 1,247.1 1,352.9 1,345.4 1,305.0 1,329.9 1,348.9 1,323.7 1,350.8 1,358.3
difference 2.74% 3.62% 2.05% 2.18% 1.69% 1.38% 0.08% -0.89% -0.13% 0.11% 0.95% 1.72% 1.57% 1.43%Total JNGI2005 1,187.3 1,195.8 1,213.4 1,202.9 1,262.8 1,326.9 1,351.8 1,357.5 1,306.6 1,328.4 1,336.2 1,301.4 1,330.0 1,339.1with LULUCF JNGI2006 1,205.7 1,214.3 1,224.2 1,215.5 1,272.7 1,335.2 1,352.9 1,345.4 1,305.0 1,329.9 1,348.9 1,323.7 1,350.8 1,358.3
difference 1.55% 1.55% 0.89% 1.05% 0.78% 0.62% 0.08% -0.89% -0.13% 0.11% 0.95% 1.72% 1.57% 1.43%
Chapter 10. Recalculation and Improvements
National Greenhouse Gas Inventory Report of Japan 2006 Page 10.15
10.4. Recalculations, including in response to the review process, and planned improvements to the inventory
10.4.1. Improvements from inventory submitted last year
The major improvements carried out since submission of last year’s inventory are listed below.
10.4.1.1. Methodology for estimating emissions of GHGs
1. 1.A. Fuel Combustion Activities (Stationary Sources): CO2 – emission factors were
revised, and improvements were made to the carbon and energy balance. 2. The determination of oxidation factors for the combustion of gas, petroleum, and coal
was revised on the basis of actual conditions in Japan. 3. As the result of a review of methods for accounting for the use of waste as alternative
energy, estimations of emissions from this source were reported in the Waste sector under separate categories.
4. 1.A. Fuel Combustion Activities (Stationary Sources) – adjustments for atmospheric intake were eliminated from the calculation of methane and nitrous oxide emissions factors. The emission factors are now calculated based on the actual measurement of exhaust gas.
5. 1.A. Fuel Combustion Activities (Stationary Sources) – the activity data used for non-CO2 emission calculation are changed and be consistent to the data used for CO2 emission calculation.
6. Methane and nitrous oxide emissions associated with the consumption of biomass fuels (wood and charcoal) in the household sector were recalculated.
7. 1.A.3.b. Natural Gas-powered Automobiles: CH4 and N2O – Estimations were recalculated.
8. 1.A.3.b. Motorcycles: CH4 and N2O – Estimations were recalculated. 9. 1.A.3.c. Steam Locomotives: CH4 and N2O – Estimations were recalculated. 10. 1.A.3.b. Gasoline-powered Small Cargo Trucks, Diesel-powered Small/Regular Cargo
Trucks: CH4 and N2O – The new estimation method was adopted to reflect actual conditions in Japan.
11. Emissions from the respiration of natural gas in transmission, which had been reported in the subcategory of Natural Gas Transmission (1.B.2.b.ii), was moved to the subcategory of 1.B.2.c. Venting (Gas): CH4 and N2O.
12. 1.B.2.c. Flaring (Gas): CO2, CH4 and N2O – Estimations were recalculated. 13. 1.B.2.c. Flaring (Oil): CO2, CH4 and N2O – Estimations were recalculated. 14. 2.A.4. Soda Ash Production and Use: CO2 – Estimations were recalculated. 15. 2.B.4. Calcium Carbide Production: CO2 – Estimations were recalculated. 16. 2.B.4. Silicon Carbide Production: CO2 – Estimations were recalculated. 17. 2.C.1. Iron Steel Production (Carbon Dioxide Emissions from Electrodes in Electric
Chapter 10. Recalculation and Improvements
Page 10.16 National Greenhouse Gas Inventory Report of Japan 2006
Arc Furnaces: CO2 – Estimations were recalculated. 18. The notation keys relating to the disposal of HFCs, as well as PFCs and SF6 were
revised. 19. 2.A.1. Cement Production: CO2 – The calculation method was changed from a
limestone method to clinker method for estimation. 20. 2.F.2. Foam Blowing: HFCs – The accounting method of emissions was changed to
reflect the stages of production, use, and disposal. HFCs were excluded from estimations for urethane foam due to the absence of GWP.
21. 2.F.4. Aerosols and Medical Devices (Metered Dose Inhalers): HFCs – The accounting method of emissions was changed to reflect the stages of production, use, and disposal of the products.
22. 2.A.3. Limestone and Dolomite Use: CO2 – the values of emissions factors for carbon dioxide associated with the use of limestone were determined with consideration of the magnesium carbonate content in limestone in addition to calcium carbonate.
23. 2.B.3. Adipic Acid Production: N2O – The basis for the calculation of rate of nitrous oxide generation by adipic acid production was changed to actual measurements.
24. Data used for the calculation of emissions of HFCs, PFCs, and SF6 were revised. 25. 4.A.2. Enteric Fermentation (Buffalo): CH4 – Estimations were recalculated. 26. 4.B.2. Manure Management (Buffalo): CH4 and 4.B.11.–13: Manure Management
(Buffalo): N2O – Estimations were recalculated. 27. 4.D.1. Direct Soil Emissions (Agricultural Residues): N2O – Estimations were
recalculated. 28. 4.D.1. Direct Soil Emissions (Plowing of Organic Soil): N2O – Estimations were
recalculated. 29. 4.A.1. Enteric Fermentation (Cattle): CH4 – Five- and six-month-old cattle were added
to the scope of the calculation. In addition, the method for the calculation of emission factors was changed to take year-to-year changes into account.
30. 4.B. Manure Management: CH4 and N2O. – Double counting was eliminated for cattle. According to the result of an investigation of validity of the all emission factors for cattle, swine and poultry, some emission factors were revised where appropriate. For grazing, the reporting category was changed from 4.D.2. to 4.B. and the activity data were revised.
31. 4.D.1. Direct Soil Emissions (Synthetic Fertilizer, Organic Fertilizer): N2O –Emission factors were revised.
32. 4.D.2. Pasture, Range, and Paddock Manure: CH4 and N2O – Activity data were revised.
33. 4.D.3 Indirect Emissions (Atmospheric Deposition and Leaching/Run-off of Nitrogen): N2O – Data used for the determination of activity data and emission factors were changed to better reflect the actual conditions in Japan.
34. 4.F.1. Field Burning of Agricultural Residues: CH4 and 4.F.1.–3. Field Burning of Agricultural Residues: N2O – Calculation methods were changed to the default methods. In addition, Japan’s country-specific data were reflected in the parameters
Chapter 10. Recalculation and Improvements
National Greenhouse Gas Inventory Report of Japan 2006 Page 10.17
used in the calculation of activity data. 35. Activity data used for estimating CO2 emissions from LULUCF category (category 5),
were revised. 36. 5.A.1. Forest land remaining forest land: activity data used for estimating CO2
emissions from forest fires were revised. 37. 5.E.1. Settlements remaining settlements: activity data used for estimating CO2
emissions from were revised. 38. 6.A.1. Managed Waste Disposal on Land (Sludge): CH4 – Methane emissions
associated with landfill disposal of sludge were recalculated. 39. 6.A.3. Illegal Disposal on Land: CH4 – Estimations were recalculated. 40. 6.A.3. Composting of Organic Waste: CH4 and N2O – Estimations were recalculated. 41. 6.B.1. Industrial Waste Water: N2O – Estimations were recalculated 42. 6.B.2. Decomposition of Domestic and Commercial Waste Water in Nature: CH4 and
N2O – Estimations were recalculated. 43. 6.C. Municipal Waste Incineration (Synthetic Textile Scraps): CO2 and 6.C Industrial
Waste Incineration (Synthetic Textile Scraps): CO2 – Estimations were recalculated. 44. 6.C. Waste Incineration (Special Management Waste): CO2, CH4 and N2O –
Estimations were recalculated. 45. 6.C. Use of “Waste: CO2, CH4 and N2O” as Alternative Fuels: CO2, CH4 and N2O –
Carbon dioxide, methane, and nitrous oxide emissions from the use of municipal and industrial wastes as raw material or fuel were recalculated. The calculation methods for waste used as raw material or fuel were established in the subcategories of CO2, CH4, and N2O emissions from “Municipal Waste (Plastics)”, “Industrial Waste (Waste Oil)”, “Industrial Waste (Waste Plastics)”, “Industrial Waste (Wood Scraps)”, “Waste Tires” and “Refuse-derived Solid Fuels (RDF/RPF).
46. 6.D. Emissions Associated with Decomposition of Petroleum-derived Surfactants: CO2 – Estimations were recalculated.
47. New methane emission factors were established for semi-aerobic landfill under the subcategories of “Kitchen Garbage”, “Paper Scraps”, “Textile Scraps” and “Wood Scraps” 6.A. Solid Waste Disposal on Land: CH4. In addition, the scope of calculation was revised for textile scraps, as well as data used for the calculation of emission factors.
48. 6.B.1. Industrial Waste Water Handling: CH4 – Activity data was revised 49. 6.C. Municipal Waste Incineration: CH4 and N2O and 6.C. Industrial Waste
Incineration: CH4 and N2O – Adjustments for atmospheric intake have been eliminated from the calculation of emissions factors. Methane and nitrous oxide emissions from incineration of “textile scraps” and “animal and plant residues or animal carcasses” contained in industrial waste were added to the scope of the calculation.
* For further information, please see “10.1 Explanation and justification of recalculation”.
10.4.1.2. National Inventory Report (NIR)
1. Descriptions of estimating methods were updated based on the results of the current
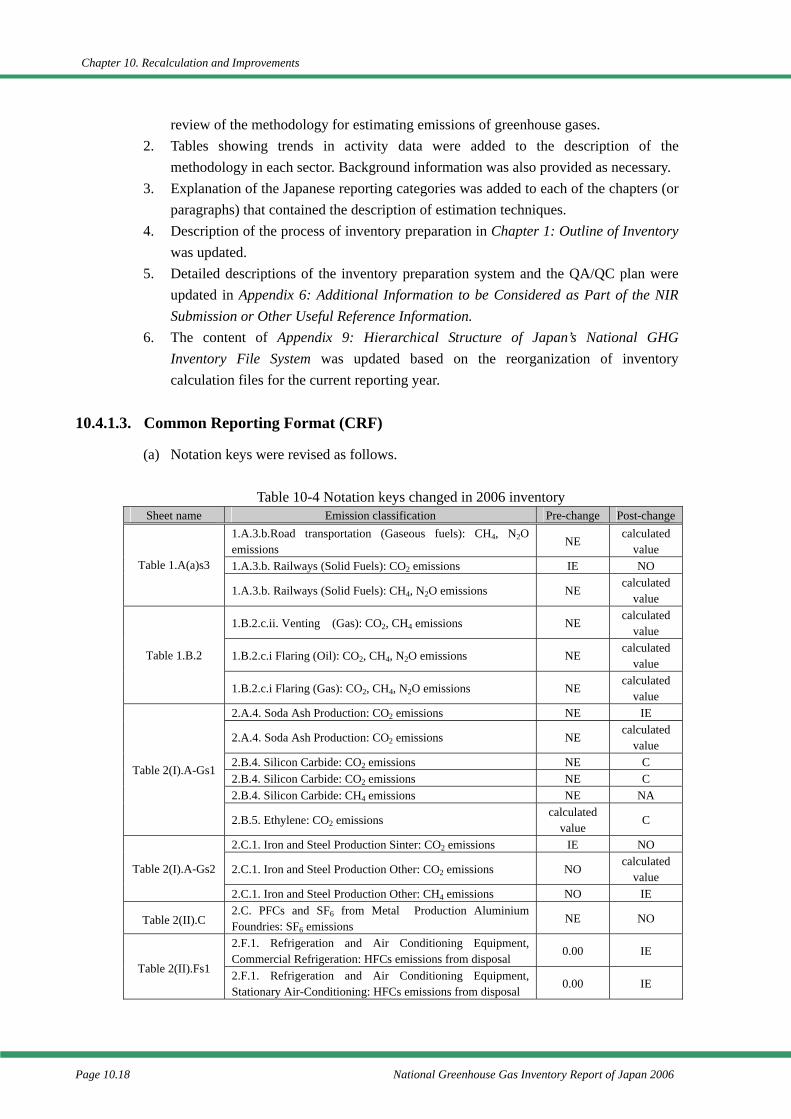
Chapter 10. Recalculation and Improvements
Page 10.18 National Greenhouse Gas Inventory Report of Japan 2006
review of the methodology for estimating emissions of greenhouse gases. 2. Tables showing trends in activity data were added to the description of the
methodology in each sector. Background information was also provided as necessary. 3. Explanation of the Japanese reporting categories was added to each of the chapters (or
paragraphs) that contained the description of estimation techniques. 4. Description of the process of inventory preparation in Chapter 1: Outline of Inventory
was updated. 5. Detailed descriptions of the inventory preparation system and the QA/QC plan were
updated in Appendix 6: Additional Information to be Considered as Part of the NIR Submission or Other Useful Reference Information.
6. The content of Appendix 9: Hierarchical Structure of Japan’s National GHG Inventory File System was updated based on the reorganization of inventory calculation files for the current reporting year.
10.4.1.3. Common Reporting Format (CRF)
(a) Notation keys were revised as follows.
Table 10-4 Notation keys changed in 2006 inventory Sheet name Emission classification Pre-change Post-change
1.A.3.b.Road transportation (Gaseous fuels): CH4, N2O emissions
NE calculated
value 1.A.3.b. Railways (Solid Fuels): CO2 emissions IE NO Table 1.A(a)s3
1.A.3.b. Railways (Solid Fuels): CH4, N2O emissions NE calculated
value
1.B.2.c.ii. Venting (Gas): CO2, CH4 emissions NE calculated
value
1.B.2.c.i Flaring (Oil): CO2, CH4, N2O emissions NE calculated
value Table 1.B.2
1.B.2.c.i Flaring (Gas): CO2, CH4, N2O emissions NE calculated
value 2.A.4. Soda Ash Production: CO2 emissions NE IE
2.A.4. Soda Ash Production: CO2 emissions NE calculated
value 2.B.4. Silicon Carbide: CO2 emissions NE C 2.B.4. Silicon Carbide: CO2 emissions NE C 2.B.4. Silicon Carbide: CH4 emissions NE NA
Table 2(I).A-Gs1
2.B.5. Ethylene: CO2 emissions calculated
value C
2.C.1. Iron and Steel Production Sinter: CO2 emissions IE NO
2.C.1. Iron and Steel Production Other: CO2 emissions NO calculated
value Table 2(I).A-Gs2
2.C.1. Iron and Steel Production Other: CH4 emissions NO IE
Table 2(II).C 2.C. PFCs and SF6 from Metal Production Aluminium Foundries: SF6 emissions
NE NO
2.F.1. Refrigeration and Air Conditioning Equipment, Commercial Refrigeration: HFCs emissions from disposal
0.00 IE Table 2(II).Fs1 2.F.1. Refrigeration and Air Conditioning Equipment,
Stationary Air-Conditioning: HFCs emissions from disposal 0.00 IE
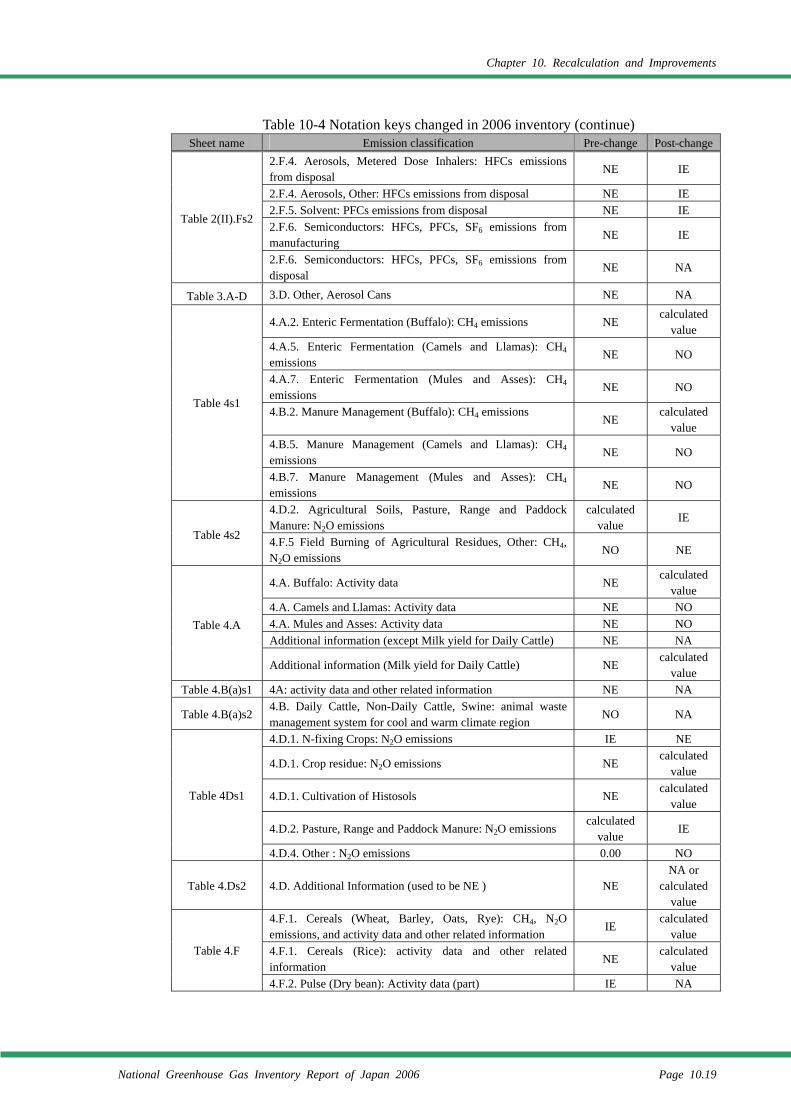
Chapter 10. Recalculation and Improvements
National Greenhouse Gas Inventory Report of Japan 2006 Page 10.19
Table 10-4 Notation keys changed in 2006 inventory (continue) Sheet name Emission classification Pre-change Post-change
2.F.4. Aerosols, Metered Dose Inhalers: HFCs emissions from disposal
NE IE
2.F.4. Aerosols, Other: HFCs emissions from disposal NE IE 2.F.5. Solvent: PFCs emissions from disposal NE IE 2.F.6. Semiconductors: HFCs, PFCs, SF6 emissions from manufacturing
NE IE Table 2(II).Fs2
2.F.6. Semiconductors: HFCs, PFCs, SF6 emissions from disposal
NE NA
Table 3.A-D 3.D. Other, Aerosol Cans NE NA
4.A.2. Enteric Fermentation (Buffalo): CH4 emissions NE calculated
value 4.A.5. Enteric Fermentation (Camels and Llamas): CH4 emissions
NE NO
4.A.7. Enteric Fermentation (Mules and Asses): CH4 emissions
NE NO
4.B.2. Manure Management (Buffalo): CH4 emissions NE
calculated value
4.B.5. Manure Management (Camels and Llamas): CH4 emissions
NE NO
Table 4s1
4.B.7. Manure Management (Mules and Asses): CH4 emissions
NE NO
4.D.2. Agricultural Soils, Pasture, Range and Paddock Manure: N2O emissions
calculated value
IE Table 4s2 4.F.5 Field Burning of Agricultural Residues, Other: CH4,
N2O emissions NO NE
4.A. Buffalo: Activity data NE calculated
value 4.A. Camels and Llamas: Activity data NE NO 4.A. Mules and Asses: Activity data NE NO Additional information (except Milk yield for Daily Cattle) NE NA
Table 4.A
Additional information (Milk yield for Daily Cattle) NE calculated
value Table 4.B(a)s1 4A: activity data and other related information NE NA
Table 4.B(a)s2 4.B. Daily Cattle, Non-Daily Cattle, Swine: animal waste management system for cool and warm climate region
NO NA
4.D.1. N-fixing Crops: N2O emissions IE NE
4.D.1. Crop residue: N2O emissions NE calculated
value
4.D.1. Cultivation of Histosols NE calculated
value
4.D.2. Pasture, Range and Paddock Manure: N2O emissions calculated
value IE
Table 4Ds1
4.D.4. Other : N2O emissions 0.00 NO
Table 4.Ds2 4.D. Additional Information (used to be NE ) NE NA or
calculated value
4.F.1. Cereals (Wheat, Barley, Oats, Rye): CH4, N2O emissions, and activity data and other related information
IE calculated
value 4.F.1. Cereals (Rice): activity data and other related information
NE calculated
value Table 4.F
4.F.2. Pulse (Dry bean): Activity data (part) IE NA

Chapter 10. Recalculation and Improvements
Page 10.20 National Greenhouse Gas Inventory Report of Japan 2006
Annex 1. Key Category
National Greenhouse Gas Inventory Report of Japan 2006 Annex 1.1
Annex 1. Key Categories
1.1. Outline of Key Category Analysis
The UNFCCC Inventory Reporting Guidelines require the application of the Good Practice Guidance (2000), and the key category analysis1 given in the Guidance.
The guidelines for national system under Article 5 of the Kyoto Protocol also require countries, in compiling their inventories, to follow the method given in Chapter 7 of the Good Practice Guidance (2000) and identify the key categories.
1.2. Results of Key Category Analysis
1.2.1. Key Categories
Key categories were assessed in accordance with the Good Practice Guidance (2000) assessment methods (Tier 1 level assessment, Tier.1 trend assessment, Tier 2 level assessment and Tier.2 trend assessment).
The results of an analysis using methods above (Tier1 Level Assessment, Tier1 Trend Assessment and Qualitative Analysis) are summarized in the following table 1 of 34 sources, which were Japan’s key categories in fiscal year 2004.
The categories in which mitigation techniques have been employed, emissions and removals have been newly estimated, and estimation methods have been changed, were recognized as the key categories according to the Qualitative Analysis. In this fiscal year, given that a number of categories with smaller emissions could be identified as the key categories in accordance with the existing qualitative analysis method since emissions were newly estimated or the estimation methods were changed in many categories in the fiscal year 2005, the key categories were identified following the results of the quantitative analysis mentioned above for this fiscal year. Those categories which can be recognized as the key categories in accordance with the existing qualitative analysis, are listed in “1.2.4 Qualitative Analysis”.
1 The IPCC Good Practice Guidance for Land Use, Land-Use Change and Forestry (2003), which was welcomed in COP9,
extends the key source analysis to LULUCF categories. In the latest UNFCCC reporting guidelines (FCCC/SBSTA/2004/8), the term “key source category” was revised to “key category”. Japan adopts the term “key category” according to these guidelines, although it has not conducted key category analysis covering the LULUCF categories.
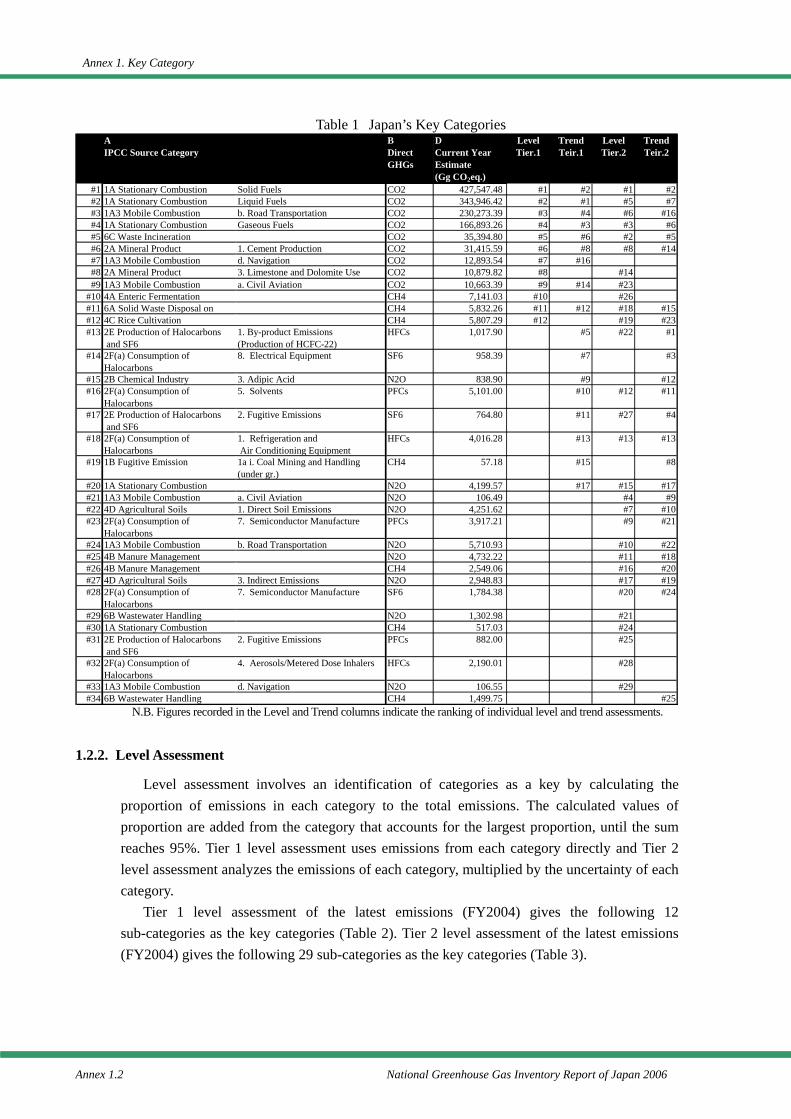
Annex 1. Key Category
Annex 1.2 National Greenhouse Gas Inventory Report of Japan 2006
Table 1 Japan’s Key Categories
N.B. Figures recorded in the Level and Trend columns indicate the ranking of individual level and trend assessments.
1.2.2. Level Assessment
Level assessment involves an identification of categories as a key by calculating the proportion of emissions in each category to the total emissions. The calculated values of proportion are added from the category that accounts for the largest proportion, until the sum reaches 95%. Tier 1 level assessment uses emissions from each category directly and Tier 2 level assessment analyzes the emissions of each category, multiplied by the uncertainty of each category.
Tier 1 level assessment of the latest emissions (FY2004) gives the following 12 sub-categories as the key categories (Table 2). Tier 2 level assessment of the latest emissions (FY2004) gives the following 29 sub-categories as the key categories (Table 3).
AIPCC Source Category
BDirectGHGs
DCurrent YearEstimate(Gg CO2eq.)
LevelTier.1
TrendTeir.1
LevelTier.2
TrendTeir.2
#1 1A Stationary Combustion Solid Fuels CO2 427,547.48 #1 #2 #1 #2#2 1A Stationary Combustion Liquid Fuels CO2 343,946.42 #2 #1 #5 #7#3 1A3 Mobile Combustion b. Road Transportation CO2 230,273.39 #3 #4 #6 #16#4 1A Stationary Combustion Gaseous Fuels CO2 166,893.26 #4 #3 #3 #6#5 6C Waste Incineration CO2 35,394.80 #5 #6 #2 #5#6 2A Mineral Product 1. Cement Production CO2 31,415.59 #6 #8 #8 #14#7 1A3 Mobile Combustion d. Navigation CO2 12,893.54 #7 #16#8 2A Mineral Product 3. Limestone and Dolomite Use CO2 10,879.82 #8 #14#9 1A3 Mobile Combustion a. Civil Aviation CO2 10,663.39 #9 #14 #23
#10 4A Enteric Fermentation CH4 7,141.03 #10 #26#11 6A Solid Waste Disposal on CH4 5,832.26 #11 #12 #18 #15#12 4C Rice Cultivation CH4 5,807.29 #12 #19 #23#13 2E Production of Halocarbons
and SF61. By-product Emissions(Production of HCFC-22)
HFCs 1,017.90 #5 #22 #1
#14 2F(a) Consumption ofHalocarbons
8. Electrical Equipment SF6 958.39 #7 #3
#15 2B Chemical Industry 3. Adipic Acid N2O 838.90 #9 #12#16 2F(a) Consumption of
Halocarbons5. Solvents PFCs 5,101.00 #10 #12 #11
#17 2E Production of Halocarbons and SF6
2. Fugitive Emissions SF6 764.80 #11 #27 #4
#18 2F(a) Consumption ofHalocarbons
1. Refrigeration andAir Conditioning Equipment
HFCs 4,016.28 #13 #13 #13
#19 1B Fugitive Emission 1a i. Coal Mining and Handling(under gr.)
CH4 57.18 #15 #8
#20 1A Stationary Combustion N2O 4,199.57 #17 #15 #17#21 1A3 Mobile Combustion a. Civil Aviation N2O 106.49 #4 #9#22 4D Agricultural Soils 1. Direct Soil Emissions N2O 4,251.62 #7 #10#23 2F(a) Consumption of
Halocarbons7. Semiconductor Manufacture PFCs 3,917.21 #9 #21
#24 1A3 Mobile Combustion b. Road Transportation N2O 5,710.93 #10 #22#25 4B Manure Management N2O 4,732.22 #11 #18#26 4B Manure Management CH4 2,549.06 #16 #20#27 4D Agricultural Soils 3. Indirect Emissions N2O 2,948.83 #17 #19#28 2F(a) Consumption of
Halocarbons7. Semiconductor Manufacture SF6 1,784.38 #20 #24
#29 6B Wastewater Handling N2O 1,302.98 #21#30 1A Stationary Combustion CH4 517.03 #24#31 2E Production of Halocarbons
and SF62. Fugitive Emissions PFCs 882.00 #25
#32 2F(a) Consumption ofHalocarbons
4. Aerosols/Metered Dose Inhalers HFCs 2,190.01 #28
#33 1A3 Mobile Combustion d. Navigation N2O 106.55 #29#34 6B Wastewater Handling CH4 1,499.75 #25
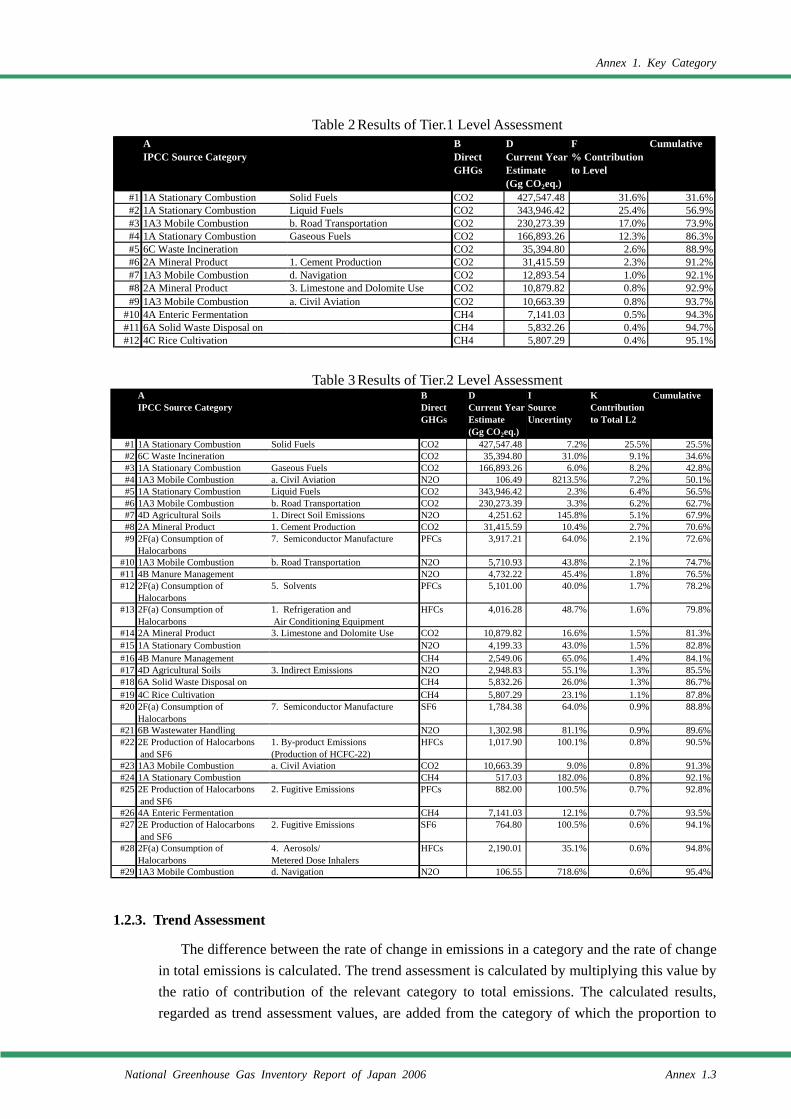
Annex 1. Key Category
National Greenhouse Gas Inventory Report of Japan 2006 Annex 1.3
Table 2 Results of Tier.1 Level Assessment
Table 3 Results of Tier.2 Level Assessment
1.2.3. Trend Assessment
The difference between the rate of change in emissions in a category and the rate of change in total emissions is calculated. The trend assessment is calculated by multiplying this value by the ratio of contribution of the relevant category to total emissions. The calculated results, regarded as trend assessment values, are added from the category of which the proportion to
AIPCC Source Category
BDirectGHGs
DCurrent YearEstimate(Gg CO2eq.)
F% Contributionto Level
Cumulative
#1 1A Stationary Combustion Solid Fuels CO2 427,547.48 31.6% 31.6%#2 1A Stationary Combustion Liquid Fuels CO2 343,946.42 25.4% 56.9%#3 1A3 Mobile Combustion b. Road Transportation CO2 230,273.39 17.0% 73.9%#4 1A Stationary Combustion Gaseous Fuels CO2 166,893.26 12.3% 86.3%#5 6C Waste Incineration CO2 35,394.80 2.6% 88.9%#6 2A Mineral Product 1. Cement Production CO2 31,415.59 2.3% 91.2%#7 1A3 Mobile Combustion d. Navigation CO2 12,893.54 1.0% 92.1%#8 2A Mineral Product 3. Limestone and Dolomite Use CO2 10,879.82 0.8% 92.9%#9 1A3 Mobile Combustion a. Civil Aviation CO2 10,663.39 0.8% 93.7%
#10 4A Enteric Fermentation CH4 7,141.03 0.5% 94.3%#11 6A Solid Waste Disposal on CH4 5,832.26 0.4% 94.7%#12 4C Rice Cultivation CH4 5,807.29 0.4% 95.1%
AIPCC Source Category
BDirectGHGs
DCurrent YearEstimate(Gg CO2eq.)
ISourceUncertinty
KContributionto Total L2
Cumulative
#1 1A Stationary Combustion Solid Fuels CO2 427,547.48 7.2% 25.5% 25.5%#2 6C Waste Incineration CO2 35,394.80 31.0% 9.1% 34.6%#3 1A Stationary Combustion Gaseous Fuels CO2 166,893.26 6.0% 8.2% 42.8%#4 1A3 Mobile Combustion a. Civil Aviation N2O 106.49 8213.5% 7.2% 50.1%#5 1A Stationary Combustion Liquid Fuels CO2 343,946.42 2.3% 6.4% 56.5%#6 1A3 Mobile Combustion b. Road Transportation CO2 230,273.39 3.3% 6.2% 62.7%#7 4D Agricultural Soils 1. Direct Soil Emissions N2O 4,251.62 145.8% 5.1% 67.9%#8 2A Mineral Product 1. Cement Production CO2 31,415.59 10.4% 2.7% 70.6%#9 2F(a) Consumption of
Halocarbons7. Semiconductor Manufacture PFCs 3,917.21 64.0% 2.1% 72.6%
#10 1A3 Mobile Combustion b. Road Transportation N2O 5,710.93 43.8% 2.1% 74.7%#11 4B Manure Management N2O 4,732.22 45.4% 1.8% 76.5%#12 2F(a) Consumption of
Halocarbons5. Solvents PFCs 5,101.00 40.0% 1.7% 78.2%
#13 2F(a) Consumption ofHalocarbons
1. Refrigeration and Air Conditioning Equipment
HFCs 4,016.28 48.7% 1.6% 79.8%
#14 2A Mineral Product 3. Limestone and Dolomite Use CO2 10,879.82 16.6% 1.5% 81.3%#15 1A Stationary Combustion N2O 4,199.33 43.0% 1.5% 82.8%#16 4B Manure Management CH4 2,549.06 65.0% 1.4% 84.1%#17 4D Agricultural Soils 3. Indirect Emissions N2O 2,948.83 55.1% 1.3% 85.5%#18 6A Solid Waste Disposal on CH4 5,832.26 26.0% 1.3% 86.7%#19 4C Rice Cultivation CH4 5,807.29 23.1% 1.1% 87.8%#20 2F(a) Consumption of
Halocarbons7. Semiconductor Manufacture SF6 1,784.38 64.0% 0.9% 88.8%
#21 6B Wastewater Handling N2O 1,302.98 81.1% 0.9% 89.6%#22 2E Production of Halocarbons
and SF61. By-product Emissions(Production of HCFC-22)
HFCs 1,017.90 100.1% 0.8% 90.5%
#23 1A3 Mobile Combustion a. Civil Aviation CO2 10,663.39 9.0% 0.8% 91.3%#24 1A Stationary Combustion CH4 517.03 182.0% 0.8% 92.1%#25 2E Production of Halocarbons
and SF62. Fugitive Emissions PFCs 882.00 100.5% 0.7% 92.8%
#26 4A Enteric Fermentation CH4 7,141.03 12.1% 0.7% 93.5%#27 2E Production of Halocarbons
and SF62. Fugitive Emissions SF6 764.80 100.5% 0.6% 94.1%
#28 2F(a) Consumption ofHalocarbons
4. Aerosols/Metered Dose Inhalers
HFCs 2,190.01 35.1% 0.6% 94.8%
#29 1A3 Mobile Combustion d. Navigation N2O 106.55 718.6% 0.6% 95.4%
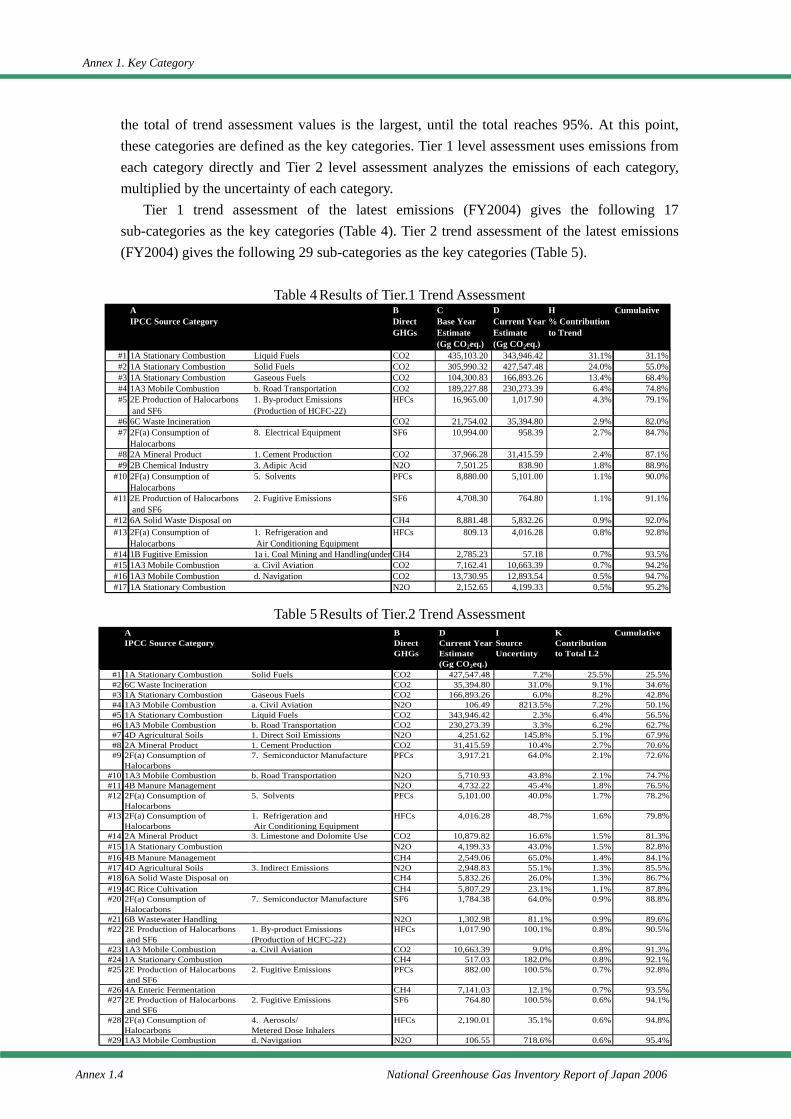
Annex 1. Key Category
Annex 1.4 National Greenhouse Gas Inventory Report of Japan 2006
the total of trend assessment values is the largest, until the total reaches 95%. At this point, these categories are defined as the key categories. Tier 1 level assessment uses emissions from each category directly and Tier 2 level assessment analyzes the emissions of each category, multiplied by the uncertainty of each category.
Tier 1 trend assessment of the latest emissions (FY2004) gives the following 17 sub-categories as the key categories (Table 4). Tier 2 trend assessment of the latest emissions (FY2004) gives the following 29 sub-categories as the key categories (Table 5).
Table 4 Results of Tier.1 Trend Assessment
Table 5 Results of Tier.2 Trend Assessment
AIPCC Source Category
BDirectGHGs
CBase YearEstimate(Gg CO2eq.)
DCurrent YearEstimate(Gg CO2eq.)
H% Contributionto Trend
Cumulative
#1 1A Stationary Combustion Liquid Fuels CO2 435,103.20 343,946.42 31.1% 31.1%#2 1A Stationary Combustion Solid Fuels CO2 305,990.32 427,547.48 24.0% 55.0%#3 1A Stationary Combustion Gaseous Fuels CO2 104,300.83 166,893.26 13.4% 68.4%#4 1A3 Mobile Combustion b. Road Transportation CO2 189,227.88 230,273.39 6.4% 74.8%#5 2E Production of Halocarbons
and SF61. By-product Emissions(Production of HCFC-22)
HFCs 16,965.00 1,017.90 4.3% 79.1%
#6 6C Waste Incineration CO2 21,754.02 35,394.80 2.9% 82.0%#7 2F(a) Consumption of
Halocarbons8. Electrical Equipment SF6 10,994.00 958.39 2.7% 84.7%
#8 2A Mineral Product 1. Cement Production CO2 37,966.28 31,415.59 2.4% 87.1%#9 2B Chemical Industry 3. Adipic Acid N2O 7,501.25 838.90 1.8% 88.9%
#10 2F(a) Consumption ofHalocarbons
5. Solvents PFCs 8,880.00 5,101.00 1.1% 90.0%
#11 2E Production of Halocarbons and SF6
2. Fugitive Emissions SF6 4,708.30 764.80 1.1% 91.1%
#12 6A Solid Waste Disposal on CH4 8,881.48 5,832.26 0.9% 92.0%#13 2F(a) Consumption of
Halocarbons1. Refrigeration and Air Conditioning Equipment
HFCs 809.13 4,016.28 0.8% 92.8%
#14 1B Fugitive Emission 1a i. Coal Mining and Handling(under CH4 2,785.23 57.18 0.7% 93.5%#15 1A3 Mobile Combustion a. Civil Aviation CO2 7,162.41 10,663.39 0.7% 94.2%#16 1A3 Mobile Combustion d. Navigation CO2 13,730.95 12,893.54 0.5% 94.7%#17 1A Stationary Combustion N2O 2,152.65 4,199.33 0.5% 95.2%
AIPCC Source Category
BDirectGHGs
DCurrent YearEstimate(Gg CO2eq.)
ISourceUncertinty
KContributionto Total L2
Cumulative
#1 1A Stationary Combustion Solid Fuels CO2 427,547.48 7.2% 25.5% 25.5%#2 6C Waste Incineration CO2 35,394.80 31.0% 9.1% 34.6%#3 1A Stationary Combustion Gaseous Fuels CO2 166,893.26 6.0% 8.2% 42.8%#4 1A3 Mobile Combustion a. Civil Aviation N2O 106.49 8213.5% 7.2% 50.1%#5 1A Stationary Combustion Liquid Fuels CO2 343,946.42 2.3% 6.4% 56.5%#6 1A3 Mobile Combustion b. Road Transportation CO2 230,273.39 3.3% 6.2% 62.7%#7 4D Agricultural Soils 1. Direct Soil Emissions N2O 4,251.62 145.8% 5.1% 67.9%#8 2A Mineral Product 1. Cement Production CO2 31,415.59 10.4% 2.7% 70.6%#9 2F(a) Consumption of
Halocarbons7. Semiconductor Manufacture PFCs 3,917.21 64.0% 2.1% 72.6%
#10 1A3 Mobile Combustion b. Road Transportation N2O 5,710.93 43.8% 2.1% 74.7%#11 4B Manure Management N2O 4,732.22 45.4% 1.8% 76.5%#12 2F(a) Consumption of
Halocarbons5. Solvents PFCs 5,101.00 40.0% 1.7% 78.2%
#13 2F(a) Consumption ofHalocarbons
1. Refrigeration and Air Conditioning Equipment
HFCs 4,016.28 48.7% 1.6% 79.8%
#14 2A Mineral Product 3. Limestone and Dolomite Use CO2 10,879.82 16.6% 1.5% 81.3%#15 1A Stationary Combustion N2O 4,199.33 43.0% 1.5% 82.8%#16 4B Manure Management CH4 2,549.06 65.0% 1.4% 84.1%#17 4D Agricultural Soils 3. Indirect Emissions N2O 2,948.83 55.1% 1.3% 85.5%#18 6A Solid Waste Disposal on CH4 5,832.26 26.0% 1.3% 86.7%#19 4C Rice Cultivation CH4 5,807.29 23.1% 1.1% 87.8%#20 2F(a) Consumption of
Halocarbons7. Semiconductor Manufacture SF6 1,784.38 64.0% 0.9% 88.8%
#21 6B Wastewater Handling N2O 1,302.98 81.1% 0.9% 89.6%#22 2E Production of Halocarbons
and SF61. By-product Emissions(Production of HCFC-22)
HFCs 1,017.90 100.1% 0.8% 90.5%
#23 1A3 Mobile Combustion a. Civil Aviation CO2 10,663.39 9.0% 0.8% 91.3%#24 1A Stationary Combustion CH4 517.03 182.0% 0.8% 92.1%#25 2E Production of Halocarbons
and SF62. Fugitive Emissions PFCs 882.00 100.5% 0.7% 92.8%
#26 4A Enteric Fermentation CH4 7,141.03 12.1% 0.7% 93.5%#27 2E Production of Halocarbons
and SF62. Fugitive Emissions SF6 764.80 100.5% 0.6% 94.1%
#28 2F(a) Consumption ofHalocarbons
4. Aerosols/Metered Dose Inhalers
HFCs 2,190.01 35.1% 0.6% 94.8%
#29 1A3 Mobile Combustion d. Navigation N2O 106.55 718.6% 0.6% 95.4%
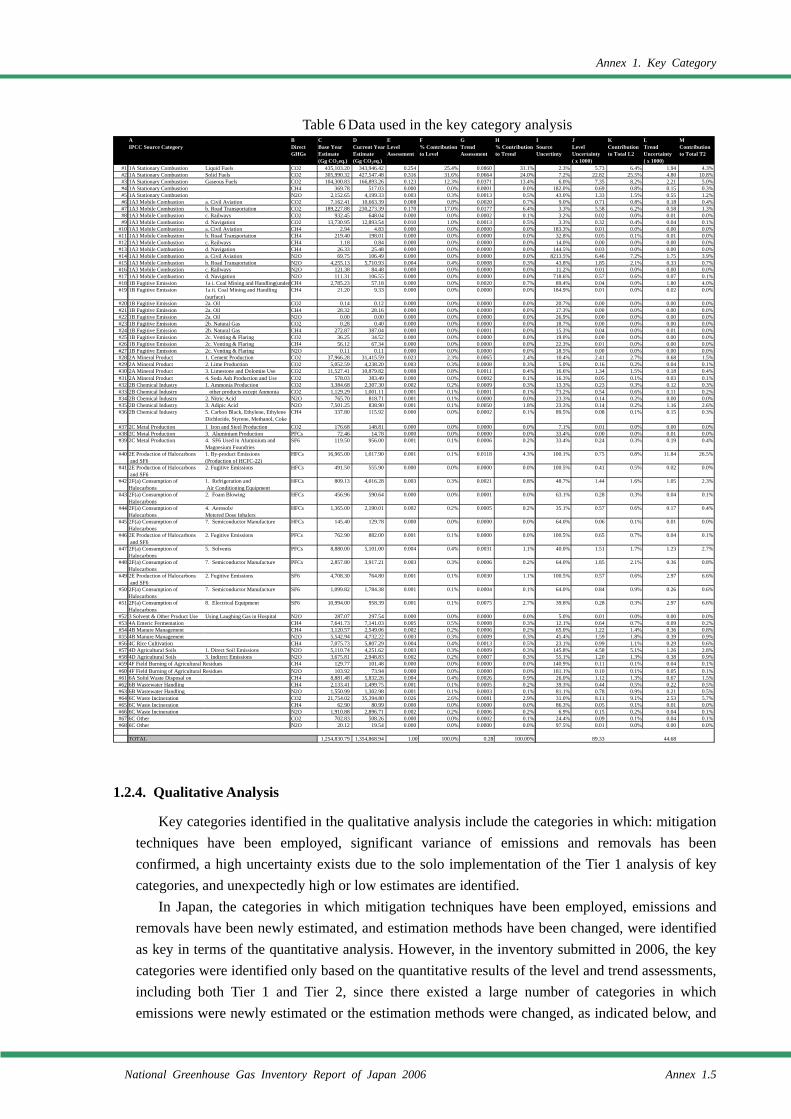
Annex 1. Key Category
National Greenhouse Gas Inventory Report of Japan 2006 Annex 1.5
Table 6 Data used in the key category analysis
1.2.4. Qualitative Analysis
Key categories identified in the qualitative analysis include the categories in which: mitigation techniques have been employed, significant variance of emissions and removals has been confirmed, a high uncertainty exists due to the solo implementation of the Tier 1 analysis of key categories, and unexpectedly high or low estimates are identified.
In Japan, the categories in which mitigation techniques have been employed, emissions and removals have been newly estimated, and estimation methods have been changed, were identified as key in terms of the quantitative analysis. However, in the inventory submitted in 2006, the key categories were identified only based on the quantitative results of the level and trend assessments, including both Tier 1 and Tier 2, since there existed a large number of categories in which emissions were newly estimated or the estimation methods were changed, as indicated below, and
AIPCC Source Category
BDirectGHGs
CBase YearEstimate(Gg CO2eq.)
DCurrent YearEstimate(Gg CO2eq.)
ELevelAssessment
F% Contributionto Level
GTrendAssessment
H% Contributionto Trend
ISourceUncertinty
JLevelUncertainty( x 1000)
KContributionto Total L2
LTrendUncertainty( x 1000)
MContributionto Total T2
#1 1A Stationary Combustion Liquid Fuels CO2 435,103.20 343,946.42 0.254 25.4% 0.0860 31.1% 2.3% 5.73 6.4% 1.94 4.3%#2 1A Stationary Combustion Solid Fuels CO2 305,990.32 427,547.48 0.316 31.6% 0.0664 24.0% 7.2% 22.82 25.5% 4.80 10.8%#3 1A Stationary Combustion Gaseous Fuels CO2 104,300.83 166,893.26 0.123 12.3% 0.0371 13.4% 6.0% 7.35 8.2% 2.21 5.0%#4 1A Stationary Combustion CH4 369.78 517.03 0.000 0.0% 0.0001 0.0% 182.0% 0.69 0.8% 0.15 0.3%#5 1A Stationary Combustion N2O 2,152.65 4,199.33 0.003 0.3% 0.0013 0.5% 43.0% 1.33 1.5% 0.55 1.2%#6 1A3 Mobile Combustion a. Civil Aviation CO2 7,162.41 10,663.39 0.008 0.8% 0.0020 0.7% 9.0% 0.71 0.8% 0.18 0.4%#7 1A3 Mobile Combustion b. Road Transportation CO2 189,227.88 230,273.39 0.170 17.0% 0.0177 6.4% 3.3% 5.58 6.2% 0.58 1.3%#8 1A3 Mobile Combustion c. Railways CO2 932.45 648.04 0.000 0.0% 0.0002 0.1% 3.2% 0.02 0.0% 0.01 0.0%#9 1A3 Mobile Combustion d. Navigation CO2 13,730.95 12,893.54 0.010 1.0% 0.0013 0.5% 3.3% 0.32 0.4% 0.04 0.1%
#10 1A3 Mobile Combustion a. Civil Aviation CH4 2.94 4.83 0.000 0.0% 0.0000 0.0% 183.3% 0.01 0.0% 0.00 0.0%#11 1A3 Mobile Combustion b. Road Transportation CH4 219.40 198.01 0.000 0.0% 0.0000 0.0% 32.8% 0.05 0.1% 0.01 0.0%#12 1A3 Mobile Combustion c. Railways CH4 1.18 0.84 0.000 0.0% 0.0000 0.0% 14.0% 0.00 0.0% 0.00 0.0%#13 1A3 Mobile Combustion d. Navigation CH4 26.33 25.48 0.000 0.0% 0.0000 0.0% 144.5% 0.03 0.0% 0.00 0.0%#14 1A3 Mobile Combustion a. Civil Aviation N2O 69.75 106.49 0.000 0.0% 0.0000 0.0% 8213.5% 6.46 7.2% 1.75 3.9%#15 1A3 Mobile Combustion b. Road Transportation N2O 4,255.13 5,710.93 0.004 0.4% 0.0008 0.3% 43.8% 1.85 2.1% 0.33 0.7%#16 1A3 Mobile Combustion c. Railways N2O 121.38 84.48 0.000 0.0% 0.0000 0.0% 11.2% 0.01 0.0% 0.00 0.0%#17 1A3 Mobile Combustion d. Navigation N2O 111.31 106.55 0.000 0.0% 0.0000 0.0% 718.6% 0.57 0.6% 0.07 0.1%#18 1B Fugitive Emission 1a i. Coal Mining and Handling(under CH4 2,785.23 57.18 0.000 0.0% 0.0020 0.7% 89.4% 0.04 0.0% 1.80 4.0%#19 1B Fugitive Emission 1a ii. Coal Mining and Handling
(surface)CH4 21.20 9.33 0.000 0.0% 0.0000 0.0% 184.9% 0.01 0.0% 0.02 0.0%
#20 1B Fugitive Emission 2a. Oil CO2 0.14 0.12 0.000 0.0% 0.0000 0.0% 20.7% 0.00 0.0% 0.00 0.0%#21 1B Fugitive Emission 2a. Oil CH4 28.32 28.16 0.000 0.0% 0.0000 0.0% 17.3% 0.00 0.0% 0.00 0.0%#22 1B Fugitive Emission 2a. Oil N2O 0.00 0.00 0.000 0.0% 0.0000 0.0% 26.9% 0.00 0.0% 0.00 0.0%#23 1B Fugitive Emission 2b. Natural Gas CO2 0.28 0.40 0.000 0.0% 0.0000 0.0% 18.7% 0.00 0.0% 0.00 0.0%#24 1B Fugitive Emission 2b. Natural Gas CH4 272.87 387.04 0.000 0.0% 0.0001 0.0% 15.3% 0.04 0.0% 0.01 0.0%#25 1B Fugitive Emission 2c. Venting & Flaring CO2 36.25 34.52 0.000 0.0% 0.0000 0.0% 19.0% 0.00 0.0% 0.00 0.0%#26 1B Fugitive Emission 2c. Venting & Flaring CH4 56.12 67.34 0.000 0.0% 0.0000 0.0% 22.3% 0.01 0.0% 0.00 0.0%#27 1B Fugitive Emission 2c. Venting & Flaring N2O 0.11 0.11 0.000 0.0% 0.0000 0.0% 18.5% 0.00 0.0% 0.00 0.0%#28 2A Mineral Product 1. Cement Production CO2 37,966.28 31,415.59 0.023 2.3% 0.0065 2.4% 10.4% 2.41 2.7% 0.68 1.5%#29 2A Mineral Product 2. Lime Production CO2 5,052.59 4,238.20 0.003 0.3% 0.0008 0.3% 5.0% 0.16 0.2% 0.04 0.1%#30 2A Mineral Product 3. Limestone and Dolomite Use CO2 11,527.41 10,879.82 0.008 0.8% 0.0011 0.4% 16.6% 1.34 1.5% 0.18 0.4%#31 2A Mineral Product 4. Soda Ash Production and Use CO2 578.03 383.49 0.000 0.0% 0.0002 0.1% 16.3% 0.05 0.1% 0.03 0.1%#32 2B Chemical Industry 1. Ammonia Production CO2 3,384.68 2,307.30 0.002 0.2% 0.0009 0.3% 13.3% 0.23 0.3% 0.12 0.3%#33 2B Chemical Industry other products except Anmonia CO2 1,129.29 1,001.11 0.001 0.1% 0.0001 0.1% 73.2% 0.54 0.6% 0.11 0.2%#34 2B Chemical Industry 2. Nitric Acid N2O 765.70 818.71 0.001 0.1% 0.0000 0.0% 23.3% 0.14 0.2% 0.00 0.0%#35 2B Chemical Industry 3. Adipic Acid N2O 7,501.25 838.90 0.001 0.1% 0.0050 1.8% 23.3% 0.14 0.2% 1.16 2.6%#36 2B Chemical Industry 5. Carbon Black, Ethylene, Ethylene
Dichloride, Styrene, Methanol, CokeCH4 337.80 115.92 0.000 0.0% 0.0002 0.1% 89.5% 0.08 0.1% 0.15 0.3%
#37 2C Metal Production 1 Iron and Steel Production CO2 176.68 148.81 0.000 0.0% 0.0000 0.0% 7.1% 0.01 0.0% 0.00 0.0%#38 2C Metal Production 3. Aluminium Production PFCs 72.46 14.78 0.000 0.0% 0.0000 0.0% 33.4% 0.00 0.0% 0.01 0.0%#39 2C Metal Production 4. SF6 Used in Aluminium and
Magnesium FoundriesSF6 119.50 956.00 0.001 0.1% 0.0006 0.2% 33.4% 0.24 0.3% 0.19 0.4%
#40 2E Production of Halocarbons and SF6
1. By-product Emissions(Production of HCFC-22)
HFCs 16,965.00 1,017.90 0.001 0.1% 0.0118 4.3% 100.1% 0.75 0.8% 11.84 26.5%
#41 2E Production of Halocarbons and SF6
2. Fugitive Emissions HFCs 491.50 555.90 0.000 0.0% 0.0000 0.0% 100.5% 0.41 0.5% 0.02 0.0%
#42 2F(a) Consumption ofHalocarbons
1. Refrigeration and Air Conditioning Equipment
HFCs 809.13 4,016.28 0.003 0.3% 0.0021 0.8% 48.7% 1.44 1.6% 1.05 2.3%
#43 2F(a) Consumption ofHalocarbons
2. Foam Blowing HFCs 456.96 590.64 0.000 0.0% 0.0001 0.0% 63.1% 0.28 0.3% 0.04 0.1%
#44 2F(a) Consumption ofHalocarbons
4. Aerosols/Metered Dose Inhalers
HFCs 1,365.00 2,190.01 0.002 0.2% 0.0005 0.2% 35.1% 0.57 0.6% 0.17 0.4%
#45 2F(a) Consumption ofHalocarbons
7. Semiconductor Manufacture HFCs 145.40 129.78 0.000 0.0% 0.0000 0.0% 64.0% 0.06 0.1% 0.01 0.0%
#46 2E Production of Halocarbons and SF6
2. Fugitive Emissions PFCs 762.90 882.00 0.001 0.1% 0.0000 0.0% 100.5% 0.65 0.7% 0.04 0.1%
#47 2F(a) Consumption ofHalocarbons
5. Solvents PFCs 8,880.00 5,101.00 0.004 0.4% 0.0031 1.1% 40.0% 1.51 1.7% 1.23 2.7%
#48 2F(a) Consumption ofHalocarbons
7. Semiconductor Manufacture PFCs 2,857.80 3,917.21 0.003 0.3% 0.0006 0.2% 64.0% 1.85 2.1% 0.36 0.8%
#49 2E Production of Halocarbons and SF6
2. Fugitive Emissions SF6 4,708.30 764.80 0.001 0.1% 0.0030 1.1% 100.5% 0.57 0.6% 2.97 6.6%
#50 2F(a) Consumption ofHalocarbons
7. Semiconductor Manufacture SF6 1,099.82 1,784.38 0.001 0.1% 0.0004 0.1% 64.0% 0.84 0.9% 0.26 0.6%
#51 2F(a) Consumption ofHalocarbons
8. Electrical Equipment SF6 10,994.00 958.39 0.001 0.1% 0.0075 2.7% 39.8% 0.28 0.3% 2.97 6.6%
#52 3 Solvent & Other Product Use Using Laughing Gas in Hospital N2O 287.07 297.54 0.000 0.0% 0.0000 0.0% 5.0% 0.01 0.0% 0.00 0.0%#53 4A Enteric Fermentation CH4 7,641.73 7,141.03 0.005 0.5% 0.0008 0.3% 12.1% 0.64 0.7% 0.09 0.2%#54 4B Manure Management CH4 3,120.57 2,549.06 0.002 0.2% 0.0006 0.2% 65.0% 1.22 1.4% 0.36 0.8%#55 4B Manure Management N2O 5,542.94 4,732.22 0.003 0.3% 0.0009 0.3% 45.4% 1.59 1.8% 0.39 0.9%#56 4C Rice Cultivation CH4 7,075.73 5,807.29 0.004 0.4% 0.0013 0.5% 23.1% 0.99 1.1% 0.29 0.6%#57 4D Agricultural Soils 1. Direct Soil Emissions N2O 5,110.74 4,251.62 0.003 0.3% 0.0009 0.3% 145.8% 4.58 5.1% 1.26 2.8%#58 4D Agricultural Soils 3. Indirect Emissions N2O 3,675.81 2,948.83 0.002 0.2% 0.0007 0.3% 55.1% 1.20 1.3% 0.38 0.9%#59 4F Field Burning of Agricultural Residues CH4 129.77 101.48 0.000 0.0% 0.0000 0.0% 140.9% 0.11 0.1% 0.04 0.1%#60 4F Field Burning of Agricultural Residues N2O 103.92 73.94 0.000 0.0% 0.0000 0.0% 181.1% 0.10 0.1% 0.05 0.1%#61 6A Solid Waste Disposal on CH4 8,881.48 5,832.26 0.004 0.4% 0.0026 0.9% 26.0% 1.12 1.3% 0.67 1.5%#62 6B Wastewater Handling CH4 2,133.41 1,499.75 0.001 0.1% 0.0005 0.2% 39.3% 0.44 0.5% 0.22 0.5%#63 6B Wastewater Handling N2O 1,550.99 1,302.98 0.001 0.1% 0.0003 0.1% 81.1% 0.78 0.9% 0.21 0.5%#64 6C Waste Incineration CO2 21,754.02 35,394.80 0.026 2.6% 0.0081 2.9% 31.0% 8.11 9.1% 2.53 5.7%#65 6C Waste Incineration CH4 62.90 80.99 0.000 0.0% 0.0000 0.0% 86.3% 0.05 0.1% 0.01 0.0%#66 6C Waste Incineration N2O 1,910.88 2,896.71 0.002 0.2% 0.0006 0.2% 6.9% 0.15 0.2% 0.04 0.1%#67 6C Other CO2 702.83 508.26 0.000 0.0% 0.0002 0.1% 24.4% 0.09 0.1% 0.04 0.1%#68 6C Other N2O 20.12 19.54 0.000 0.0% 0.0000 0.0% 97.5% 0.01 0.0% 0.00 0.0%
TOTAL 1,254,830.79 1,354,868.94 1.00 100.0% 0.28 100.00% 89.33 44.68
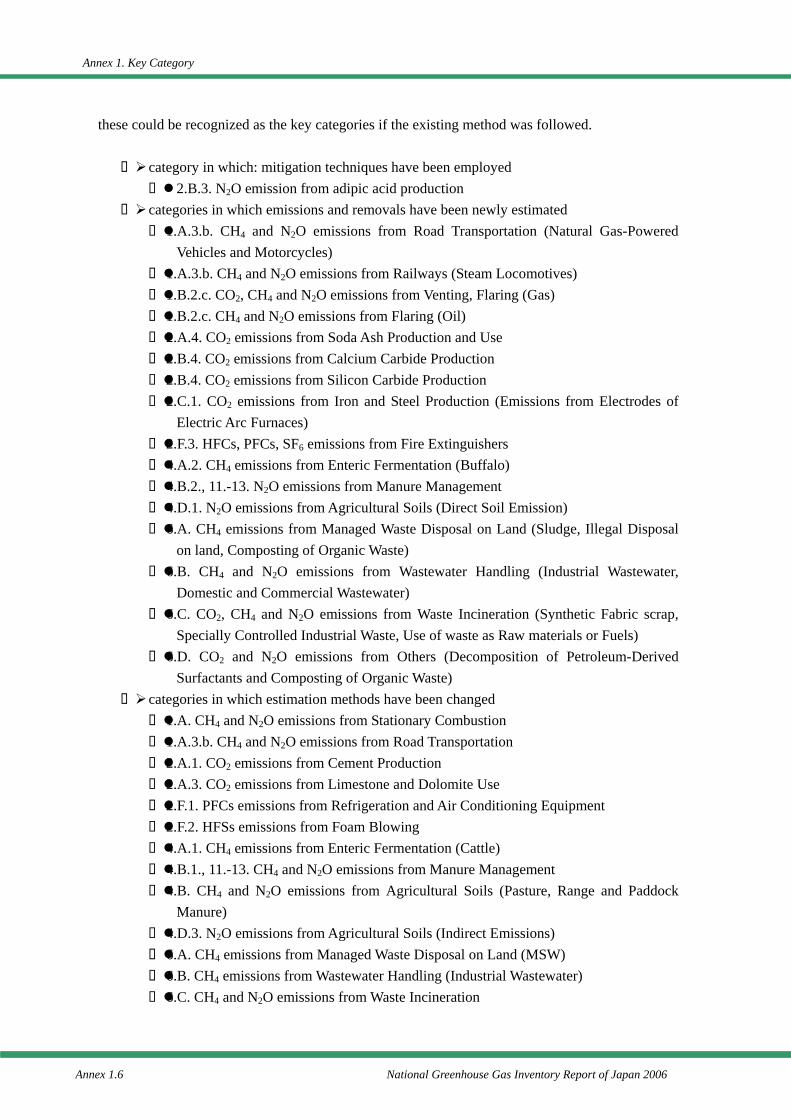
Annex 1. Key Category
Annex 1.6 National Greenhouse Gas Inventory Report of Japan 2006
these could be recognized as the key categories if the existing method was followed.
category in which: mitigation techniques have been employed 2.B.3. N2O emission from adipic acid production
categories in which emissions and removals have been newly estimated 1.A.3.b. CH4 and N2O emissions from Road Transportation (Natural Gas-Powered
Vehicles and Motorcycles) 1.A.3.b. CH4 and N2O emissions from Railways (Steam Locomotives) 1.B.2.c. CO2, CH4 and N2O emissions from Venting, Flaring (Gas) 1.B.2.c. CH4 and N2O emissions from Flaring (Oil) 2.A.4. CO2 emissions from Soda Ash Production and Use 2.B.4. CO2 emissions from Calcium Carbide Production 2.B.4. CO2 emissions from Silicon Carbide Production 2.C.1. CO2 emissions from Iron and Steel Production (Emissions from Electrodes of
Electric Arc Furnaces) 2.F.3. HFCs, PFCs, SF6 emissions from Fire Extinguishers 4.A.2. CH4 emissions from Enteric Fermentation (Buffalo) 4.B.2., 11.-13. N2O emissions from Manure Management 4.D.1. N2O emissions from Agricultural Soils (Direct Soil Emission) 6.A. CH4 emissions from Managed Waste Disposal on Land (Sludge, Illegal Disposal
on land, Composting of Organic Waste) 6.B. CH4 and N2O emissions from Wastewater Handling (Industrial Wastewater,
Domestic and Commercial Wastewater) 6.C. CO2, CH4 and N2O emissions from Waste Incineration (Synthetic Fabric scrap,
Specially Controlled Industrial Waste, Use of waste as Raw materials or Fuels) 6.D. CO2 and N2O emissions from Others (Decomposition of Petroleum-Derived
Surfactants and Composting of Organic Waste) categories in which estimation methods have been changed
1.A. CH4 and N2O emissions from Stationary Combustion 1.A.3.b. CH4 and N2O emissions from Road Transportation 2.A.1. CO2 emissions from Cement Production 2.A.3. CO2 emissions from Limestone and Dolomite Use 2.F.1. PFCs emissions from Refrigeration and Air Conditioning Equipment 2.F.2. HFSs emissions from Foam Blowing 4.A.1. CH4 emissions from Enteric Fermentation (Cattle) 4.B.1., 11.-13. CH4 and N2O emissions from Manure Management 4.B. CH4 and N2O emissions from Agricultural Soils (Pasture, Range and Paddock
Manure) 4.D.3. N2O emissions from Agricultural Soils (Indirect Emissions) 6.A. CH4 emissions from Managed Waste Disposal on Land (MSW) 6.B. CH4 emissions from Wastewater Handling (Industrial Wastewater) 6.C. CH4 and N2O emissions from Waste Incineration
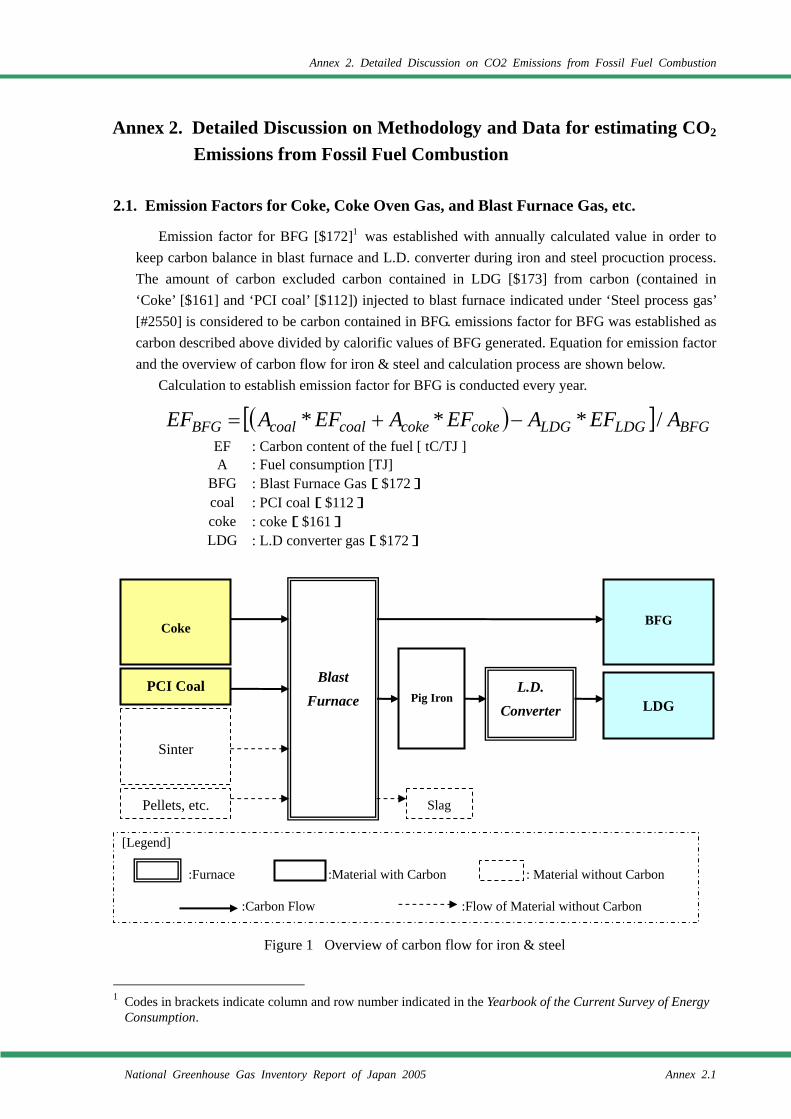
Annex 2. Detailed Discussion on CO2 Emissions from Fossil Fuel Combustion
National Greenhouse Gas Inventory Report of Japan 2005 Annex 2.1
Annex 2. Detailed Discussion on Methodology and Data for estimating CO2 Emissions from Fossil Fuel Combustion
2.1. Emission Factors for Coke, Coke Oven Gas, and Blast Furnace Gas, etc.
Emission factor for BFG [$172]1 was established with annually calculated value in order to keep carbon balance in blast furnace and L.D. converter during iron and steel procuction process. The amount of carbon excluded carbon contained in LDG [$173] from carbon (contained in ‘Coke’ [$161] and ‘PCI coal’ [$112]) injected to blast furnace indicated under ‘Steel process gas’ [#2550] is considered to be carbon contained in BFG. emissions factor for BFG was established as carbon described above divided by calorific values of BFG generated. Equation for emission factor and the overview of carbon flow for iron & steel and calculation process are shown below.
Calculation to establish emission factor for BFG is conducted every year.
EF : Carbon content of the fuel [ tC/TJ ] A : Fuel consumption [TJ]
BFG : Blast Furnace Gas[$172] coal : PCI coal[$112] coke : coke[$161] LDG : L.D converter gas[$172]
Figure 1 Overview of carbon flow for iron & steel
1 Codes in brackets indicate column and row number indicated in the Yearbook of the Current Survey of Energy
Consumption.
[Legend]
:Furnace :Material with Carbon : Material without Carbon
:Carbon Flow :Flow of Material without Carbon
PCI Coal
Sinter
Coke
Blast
Furnace
Pellets, etc.
BFG
LDG
Pig IronL.D.
Converter
Slag
( )[ ] BFGLDGLDGcokecokecoalcoalBFG AEFAEFAEFAEF /*** −+=
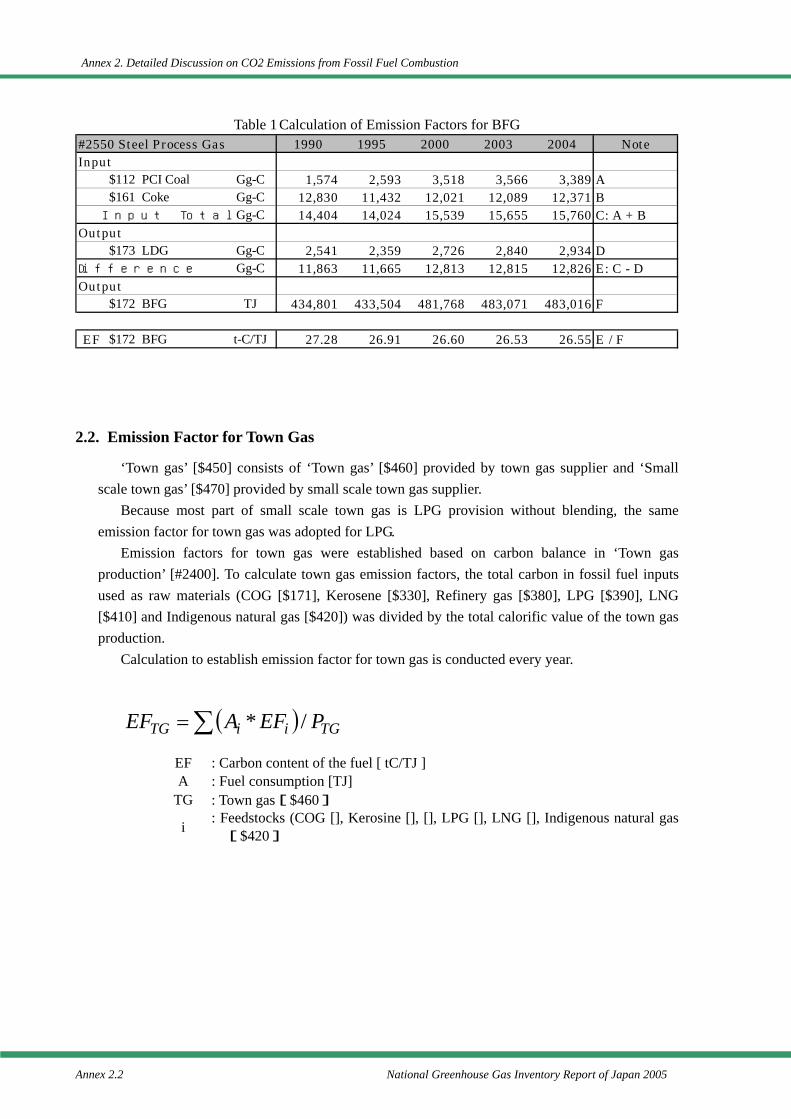
Annex 2. Detailed Discussion on CO2 Emissions from Fossil Fuel Combustion
Annex 2.2 National Greenhouse Gas Inventory Report of Japan 2005
Table 1 Calculation of Emission Factors for BFG #2550 Steel Process Gas 1990 1995 2000 2003 2004 NoteInput
$112 PCI Coal Gg-C 1,574 2,593 3,518 3,566 3,389 A$161 Coke Gg-C 12,830 11,432 12,021 12,089 12,371 B
Input Total Gg-C 14,404 14,024 15,539 15,655 15,760 C: A + BOutput
$173 LDG Gg-C 2,541 2,359 2,726 2,840 2,934 DDifference Gg-C 11,863 11,665 12,813 12,815 12,826 E: C - DOutput
$172 BFG TJ 434,801 433,504 481,768 483,071 483,016 F
EF $172 BFG t-C/TJ 27.28 26.91 26.60 26.53 26.55 E / F
2.2. Emission Factor for Town Gas
‘Town gas’ [$450] consists of ‘Town gas’ [$460] provided by town gas supplier and ‘Small scale town gas’ [$470] provided by small scale town gas supplier.
Because most part of small scale town gas is LPG provision without blending, the same emission factor for town gas was adopted for LPG.
Emission factors for town gas were established based on carbon balance in ‘Town gas production’ [#2400]. To calculate town gas emission factors, the total carbon in fossil fuel inputs used as raw materials (COG [$171], Kerosene [$330], Refinery gas [$380], LPG [$390], LNG [$410] and Indigenous natural gas [$420]) was divided by the total calorific value of the town gas production.
Calculation to establish emission factor for town gas is conducted every year.
EF : Carbon content of the fuel [ tC/TJ ] A : Fuel consumption [TJ]
TG : Town gas[$460]
i : Feedstocks (COG [], Kerosine [], [], LPG [], LNG [], Indigenous natural gas[$420]
( ) TGiiTG PEFAEF /*∑=
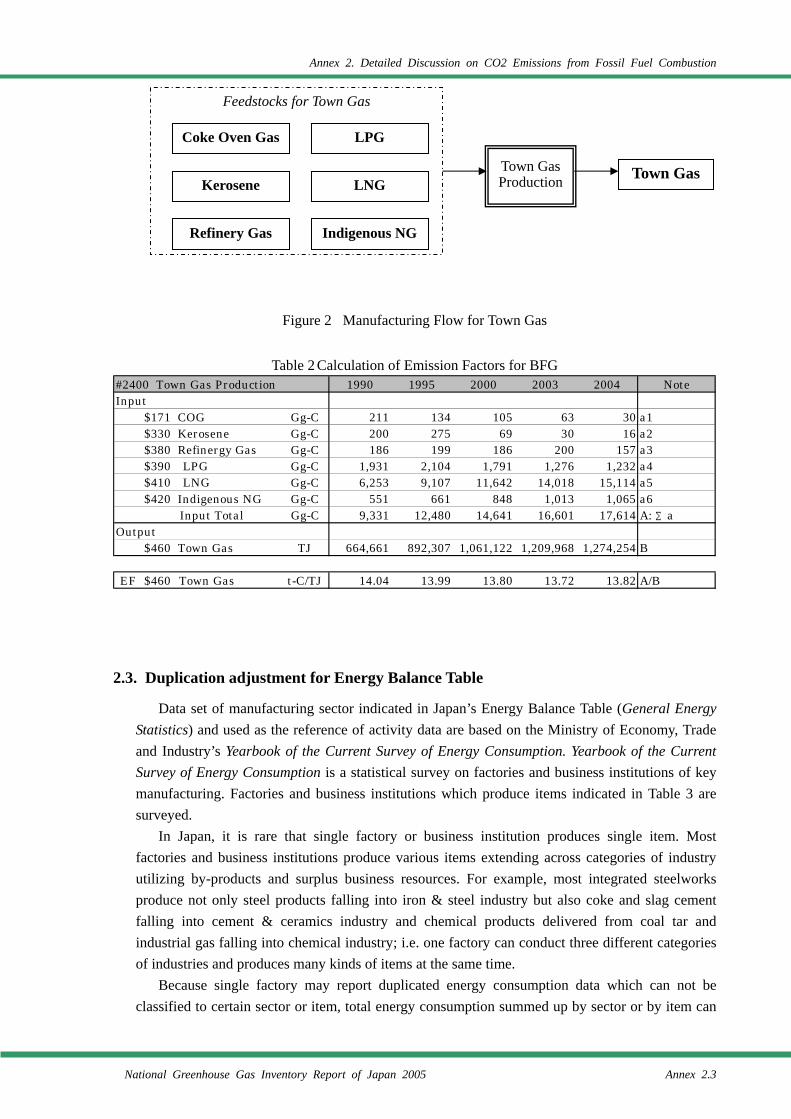
Annex 2. Detailed Discussion on CO2 Emissions from Fossil Fuel Combustion
National Greenhouse Gas Inventory Report of Japan 2005 Annex 2.3
Figure 2 Manufacturing Flow for Town Gas
Table 2 Calculation of Emission Factors for BFG #2400 Town Gas Production 1990 1995 2000 2003 2004 NoteInput
$171 COG Gg-C 211 134 105 63 30 a1$330 Kerosene Gg-C 200 275 69 30 16 a2$380 Refinergy Gas Gg-C 186 199 186 200 157 a3$390 LPG Gg-C 1,931 2,104 1,791 1,276 1,232 a4$410 LNG Gg-C 6,253 9,107 11,642 14,018 15,114 a5$420 Indigenous NG Gg-C 551 661 848 1,013 1,065 a6
Input Total Gg-C 9,331 12,480 14,641 16,601 17,614 A: ∑aOutput
$460 Town Gas TJ 664,661 892,307 1,061,122 1,209,968 1,274,254 B
EF $460 Town Gas t-C/TJ 14.04 13.99 13.80 13.72 13.82 A/B
2.3. Duplication adjustment for Energy Balance Table
Data set of manufacturing sector indicated in Japan’s Energy Balance Table (General Energy Statistics) and used as the reference of activity data are based on the Ministry of Economy, Trade and Industry’s Yearbook of the Current Survey of Energy Consumption. Yearbook of the Current Survey of Energy Consumption is a statistical survey on factories and business institutions of key manufacturing. Factories and business institutions which produce items indicated in Table 3 are surveyed.
In Japan, it is rare that single factory or business institution produces single item. Most factories and business institutions produce various items extending across categories of industry utilizing by-products and surplus business resources. For example, most integrated steelworks produce not only steel products falling into iron & steel industry but also coke and slag cement falling into cement & ceramics industry and chemical products delivered from coal tar and industrial gas falling into chemical industry; i.e. one factory can conduct three different categories of industries and produces many kinds of items at the same time.
Because single factory may report duplicated energy consumption data which can not be classified to certain sector or item, total energy consumption summed up by sector or by item can
Feedstocks for Town Gas
Town Gas Production
Coke Oven Gas
Kerosene
Refinery Gas
LPG
LNG
Indigenous NG
Town Gas
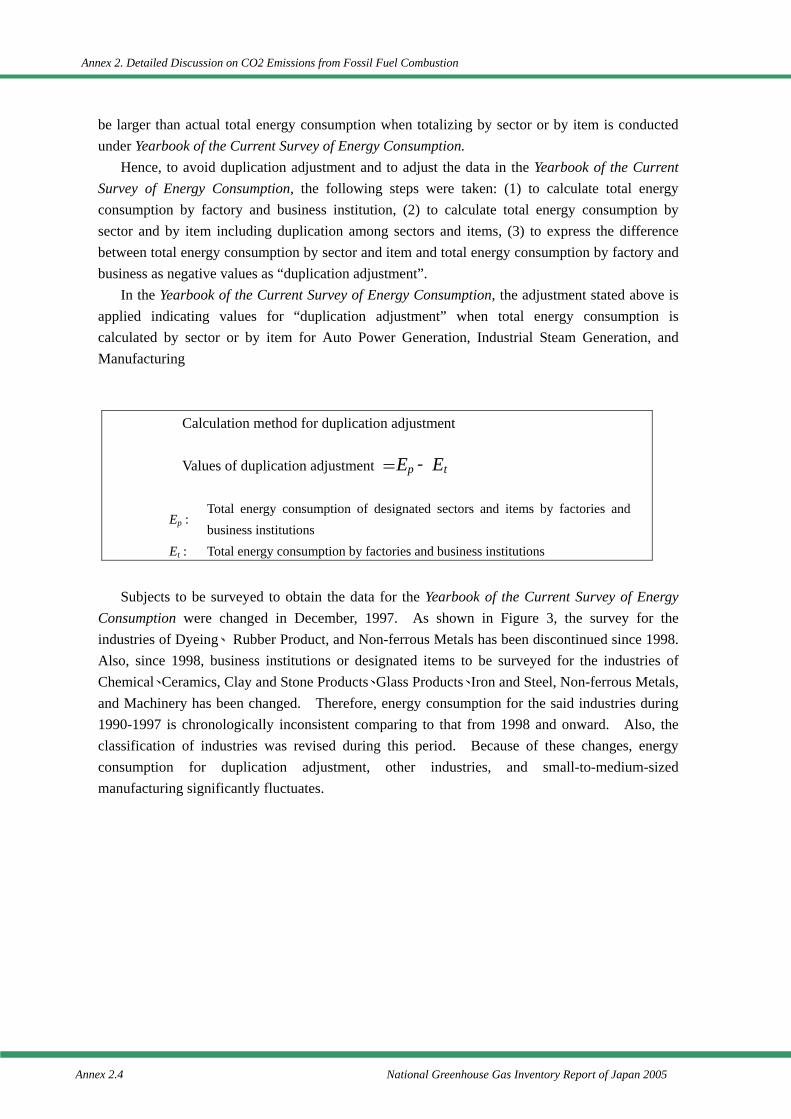
Annex 2. Detailed Discussion on CO2 Emissions from Fossil Fuel Combustion
Annex 2.4 National Greenhouse Gas Inventory Report of Japan 2005
be larger than actual total energy consumption when totalizing by sector or by item is conducted under Yearbook of the Current Survey of Energy Consumption.
Hence, to avoid duplication adjustment and to adjust the data in the Yearbook of the Current Survey of Energy Consumption, the following steps were taken: (1) to calculate total energy consumption by factory and business institution, (2) to calculate total energy consumption by sector and by item including duplication among sectors and items, (3) to express the difference between total energy consumption by sector and item and total energy consumption by factory and business as negative values as “duplication adjustment”.
In the Yearbook of the Current Survey of Energy Consumption, the adjustment stated above is applied indicating values for “duplication adjustment” when total energy consumption is calculated by sector or by item for Auto Power Generation, Industrial Steam Generation, and Manufacturing
Calculation method for duplication adjustment Values of duplication adjustment =Ep‐Et
Ep : Total energy consumption of designated sectors and items by factories and business institutions
Et : Total energy consumption by factories and business institutions
Subjects to be surveyed to obtain the data for the Yearbook of the Current Survey of Energy Consumption were changed in December, 1997. As shown in Figure 3, the survey for the industries of Dyeing、Rubber Product, and Non-ferrous Metals has been discontinued since 1998. Also, since 1998, business institutions or designated items to be surveyed for the industries of Chemical、Ceramics, Clay and Stone Products、Glass Products、Iron and Steel, Non-ferrous Metals, and Machinery has been changed. Therefore, energy consumption for the said industries during 1990-1997 is chronologically inconsistent comparing to that from 1998 and onward. Also, the classification of industries was revised during this period. Because of these changes, energy consumption for duplication adjustment, other industries, and small-to-medium-sized manufacturing significantly fluctuates.
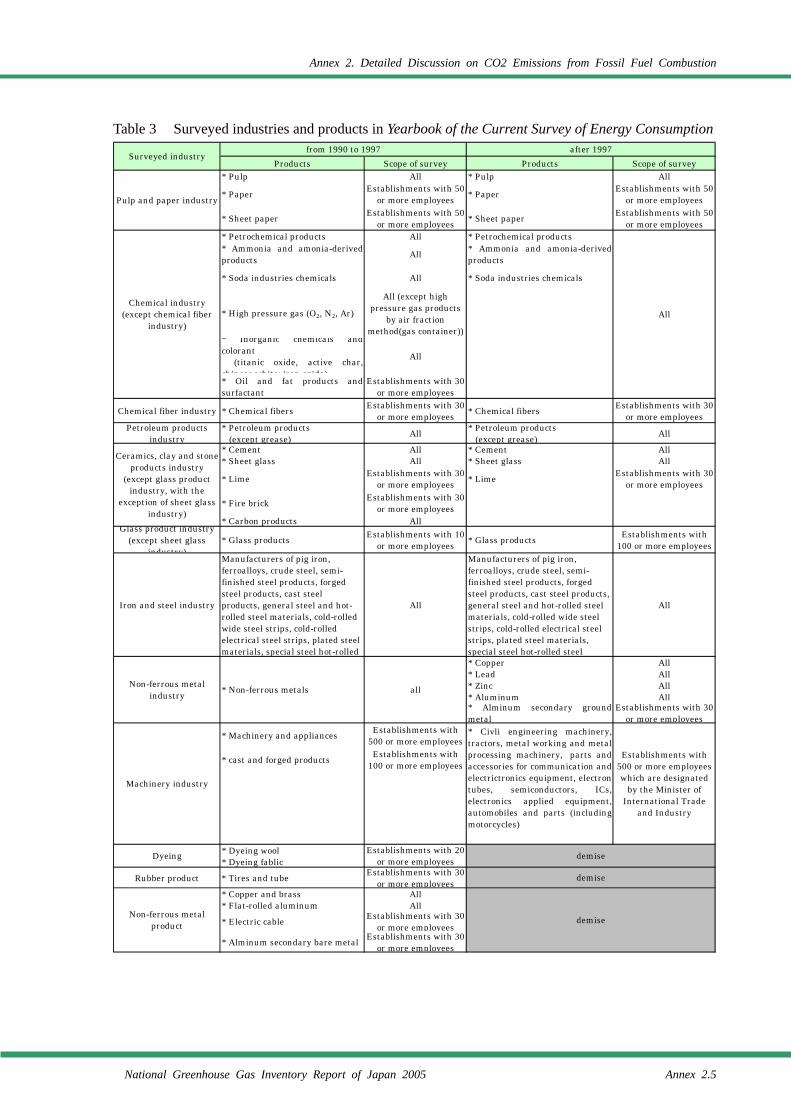
Annex 2. Detailed Discussion on CO2 Emissions from Fossil Fuel Combustion
National Greenhouse Gas Inventory Report of Japan 2005 Annex 2.5
Table 3 Surveyed industries and products in Yearbook of the Current Survey of Energy Consumption
Products Scope of survey Products Scope of survey* Pulp All * Pulp All
* Paper Establishments with 50or more employees * Paper Establishments with 50
or more employees
* Sheet paper Establishments with 50or more employees * Sheet paper Establishments with 50
or more employees* Petrochemical products All * Petrochemical products* Ammonia and amonia-derivedproducts All * Ammonia and amonia-derived
products
* Soda industries chemicals All * Soda industries chemicals
* High pressure gas (O2, N2, Ar)
All (except highpressure gas products
by air fractionmethod(gas container))
* Inorganic chemicals andcolorant
(titanic oxide, active char,chinese white iron oxide)
All
* Oil and fat products andsurfactant
Establishments with 30or more employees
Chemical fiber industry * Chemical fibers Establishments with 30or more employees * Chemical fibers Establishments with 30
or more employeesPetroleum products
industry* Petroleum products (except grease) All * Petroleum products
(except grease) All
* Cement All * Cement All* Sheet glass All * Sheet glass All
* Lime Establishments with 30or more employees * Lime Establishments with 30
or more employees
* Fire brick Establishments with 30or more employees
* Carbon products AllGlass product industry
(except sheet glassindustry)
* Glass products Establishments with 10or more employees * Glass products Establishments with
100 or more employees
Iron and steel industry
Manufacturers of pig iron,ferroalloys, crude steel, semi-finished steel products, forgedsteel products, cast steelproducts, general steel and hot-rolled steel materials, cold-rolledwide steel strips, cold-rolledelectrical steel strips, plated steelmaterials, special steel hot-rolled
All
Manufacturers of pig iron,ferroalloys, crude steel, semi-finished steel products, forgedsteel products, cast steel products,general steel and hot-rolled steelmaterials, cold-rolled wide steelstrips, cold-rolled electrical steelstrips, plated steel materials,special steel hot-rolled steel
All
* Copper All* Lead All* Zinc All* Aluminum All* Alminum secondary groundmetal
Establishments with 30or more employees
* Machinery and appliances Establishments with500 or more employees
* cast and forged products Establishments with100 or more employees
* Dyeing wool* Dyeing fablic
Rubber product * Tires and tube Establishments with 30or more employees
* Copper and brass All* Flat-rolled aluminum All
* Electric cable Establishments with 30or more employees
* Alminum secondary bare metal Establishments with 30or more employees
* Non-ferrous metals
demise
demise
Machinery industry
Dyeing
Establishments with500 or more employeeswhich are designated
by the Minister ofInternational Trade
and Industry
demise
Non-ferrous metalproduct
Establishments with 20or more employees
Surveyed industryfrom 1990 to 1997
* Civli engineering machinery,tractors, metal working and metalprocessing machinery, parts andaccessories for communication andelectrictronics equipment, electrontubes, semiconductors, ICs,electronics applied equipment,automobiles and parts (includingmotorcycles)
after 1997
Pulp and paper industry
all
Chemical industry(except chemical fiber
industry)All
Ceramics, clay and stoneproducts industry
(except glass productindustry, with the
exception of sheet glassindustry)
Non-ferrous metalindustry
Annex 2. Detailed Discussion on CO2 Emissions from Fossil Fuel Combustion
Annex 2.6 National Greenhouse Gas Inventory Report of Japan 2005
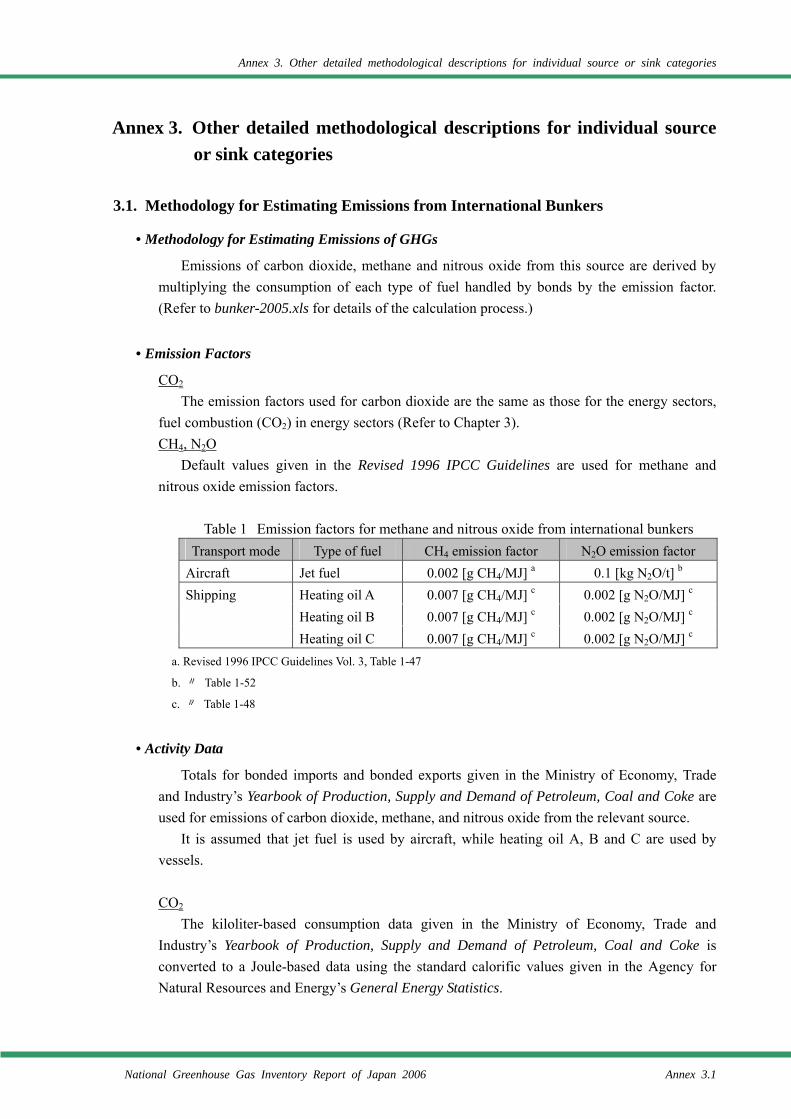
Annex 3. Other detailed methodological descriptions for individual source or sink categories
National Greenhouse Gas Inventory Report of Japan 2006 Annex 3.1
Annex 3. Other detailed methodological descriptions for individual source or sink categories
3.1. Methodology for Estimating Emissions from International Bunkers
• Methodology for Estimating Emissions of GHGs
Emissions of carbon dioxide, methane and nitrous oxide from this source are derived by multiplying the consumption of each type of fuel handled by bonds by the emission factor. (Refer to bunker-2005.xls for details of the calculation process.)
• Emission Factors
CO2 The emission factors used for carbon dioxide are the same as those for the energy sectors,
fuel combustion (CO2) in energy sectors (Refer to Chapter 3). CH4, N2O
Default values given in the Revised 1996 IPCC Guidelines are used for methane and nitrous oxide emission factors.
Table 1 Emission factors for methane and nitrous oxide from international bunkers
Transport mode Type of fuel CH4 emission factor N2O emission factor Aircraft Jet fuel 0.002 [g CH4/MJ] a 0.1 [kg N2O/t] b Shipping Heating oil A 0.007 [g CH4/MJ] c 0.002 [g N2O/MJ] c Heating oil B 0.007 [g CH4/MJ] c 0.002 [g N2O/MJ] c Heating oil C 0.007 [g CH4/MJ] c 0.002 [g N2O/MJ] c
a. Revised 1996 IPCC Guidelines Vol. 3, Table 1-47
b. 〃 Table 1-52
c. 〃 Table 1-48
• Activity Data
Totals for bonded imports and bonded exports given in the Ministry of Economy, Trade and Industry’s Yearbook of Production, Supply and Demand of Petroleum, Coal and Coke are used for emissions of carbon dioxide, methane, and nitrous oxide from the relevant source.
It is assumed that jet fuel is used by aircraft, while heating oil A, B and C are used by vessels.
CO2
The kiloliter-based consumption data given in the Ministry of Economy, Trade and Industry’s Yearbook of Production, Supply and Demand of Petroleum, Coal and Coke is converted to a Joule-based data using the standard calorific values given in the Agency for Natural Resources and Energy’s General Energy Statistics.
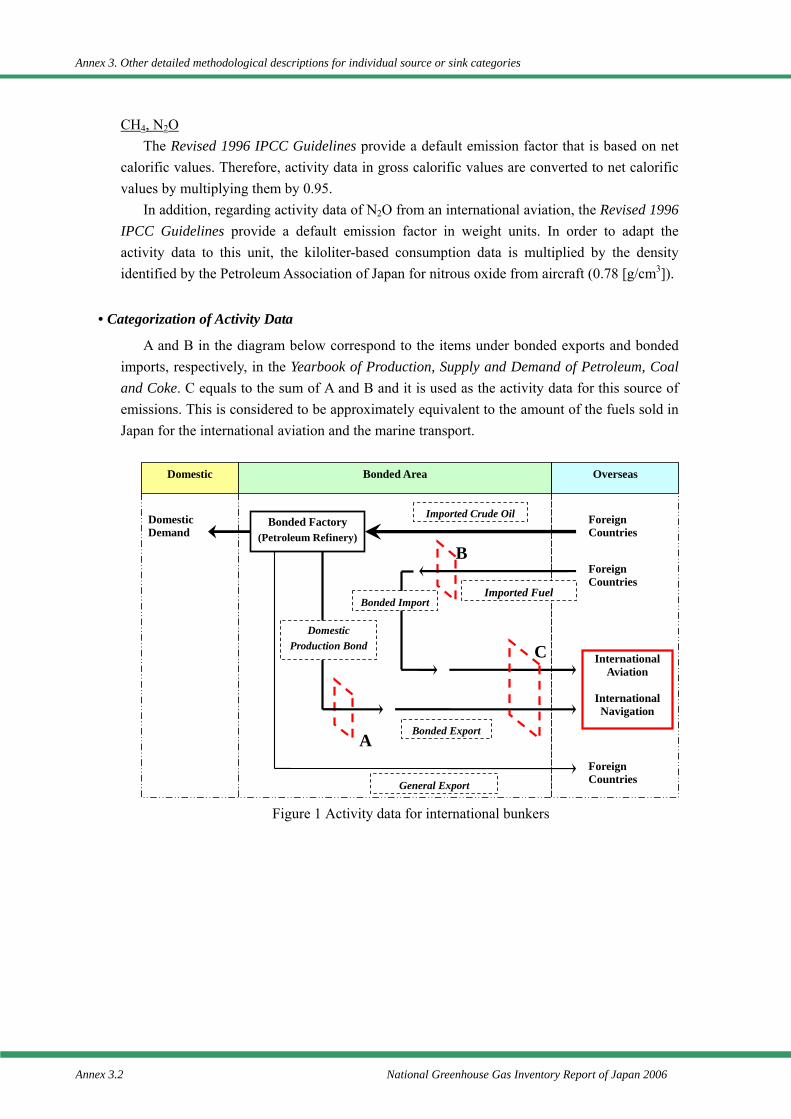
Annex 3. Other detailed methodological descriptions for individual source or sink categories
Annex 3.2 National Greenhouse Gas Inventory Report of Japan 2006
CH4, N2O The Revised 1996 IPCC Guidelines provide a default emission factor that is based on net
calorific values. Therefore, activity data in gross calorific values are converted to net calorific values by multiplying them by 0.95.
In addition, regarding activity data of N2O from an international aviation, the Revised 1996 IPCC Guidelines provide a default emission factor in weight units. In order to adapt the activity data to this unit, the kiloliter-based consumption data is multiplied by the density identified by the Petroleum Association of Japan for nitrous oxide from aircraft (0.78 [g/cm3]).
• Categorization of Activity Data
A and B in the diagram below correspond to the items under bonded exports and bonded imports, respectively, in the Yearbook of Production, Supply and Demand of Petroleum, Coal and Coke. C equals to the sum of A and B and it is used as the activity data for this source of emissions. This is considered to be approximately equivalent to the amount of the fuels sold in Japan for the international aviation and the marine transport.
Figure 1 Activity data for international bunkers
Domestic Bonded Area Overseas
Foreign Countries
InternationalAviation
InternationalNavigation
Domestic Demand
A
B
CDomestic
Production Bond
General Export
Imported Fuel
Imported Crude Oil
Bonded Import
Bonded Export
Bonded Factory (Petroleum Refinery)
Foreign Countries
Foreign Countries
Annex 3. Other detailed methodological descriptions for individual source or sink categories
National Greenhouse Gas Inventory Report of Japan 2006 Annex 3.3
Glossary Bonded Jet Fuel
Under the Tariff Law, aircrafts (Japanese and non-Japanese) flying international routes are deemed to be “overseas return aircraft”, and the fuel they consume is tariff-free, subject to the completion of the required procedures. The application of this legislation means that if fuel is refined from crude oil imported to Japanese refinery, both the crude oil import tariff and the petroleum tax are waived. Similarly, if fuel has been imported as a product, the product import tariff is waived. The foregoing is termed as “bonded jet fuel”.
Bonded Fuel Oil
Vessels that ply voyages between Japan and other countries are deemed to be “foreign trade vessels”, under the Tariff Law. The majority of their fuel is consumed outside Japanese territorial waters, and, therefore both tariffs and the petroleum tax are waived. The foregoing is termed as “bonded fuel oil”.
Bonded Export
The demand for fuel supplied to aircrafts (Japanese and non-Japanese) flying international routes and ships (Japanese and non-Japanese) that ply foreign ocean routes is termed as “bonded demand”. Jet fuel is supplied to aircrafts while fuel oil is supplied to ships. Of these bonded demand, the fuel supplied from products that was produced from crude oil is counted as bonded exports by the Ministry of Economy, Trade and Industry.
Bonded imports (Bond to Bond)
Fuel products that are imported from foreign countries, landed in a bonded area and supplied from the bonded area to bonded demand without going through domestic customs, is counted as bonded imports by the Ministry of Economy, Trade and Industry.
Annex 3. Other detailed methodological descriptions for individual source or sink categories
Annex 3.4 National Greenhouse Gas Inventory Report of Japan 2006
References IPCC, Revised 1996 IPCC Guidelines for National Greenhouse Gas Inventories, 1997 Agency for Natural Resources and Energy, General Energy Statistics Ministry Land, Infrastructure and Transport, A new method of calculating emissions of greenhouse
gas from bunkers, 2002 Ministry of Economy, Trade and Industry, Yearbook of Production, Supply and Demand of
Petroleum, Coal and Coke Petroleum Association of Japan(http://www.paj.gr.jp/html/statis/kansan.html)
Annex 3. Other detailed methodological descriptions for individual source or sink categories
National Greenhouse Gas Inventory Report of Japan 2006 Annex 3.5
3.2. Methodology for Estimating Emissions of Precursors
In addition to the greenhouse gases (e.g., CO2, CH4, N2O, HFCs, PFCs, SF6) reported under the Kyoto Protocol, Japan reports on the emissions of precursors (NOx, CO, NMVOC, SO2) calculated by established methods. This section explains the source categories for which methodologies for estimating emissions have been provided.
Emissions from the source categories for which estimation methods have not been established are considered to be minimal, and accordingly reported as either “NO” or “NE” (or as “IE” as the case may be) based on the results of historical investigations.
3.2.1. Energy Sector
3.2.1.1. Stationary Combustion (1.A.1., 1.A.2., 1.A.4.: NOx, CO, NMVOC, SO2)
a) Facilities emitting soot and smokes
1) NOx and SO2
• Methodology for Estimating Emissions
Research of Air Pollutant Emissions from Stationary Sources (“MAP Survey”) by the Ministry of the Environment (MoE) was used as the basis for estimation of NOx and SO2 emitted from fixed sources (see Page 3.12 for details of the survey). So as to ensure consistency with the Revised 1996 IPCC Guidelines and the IPCC Good Practice Guidance (2000), the following operation isolated the emissions from the energy sector from the emissions listed in the MAP Survey:
1. All emissions from the following facilities and operations are reported under Energy: Facility: [0101–0103: Boilers]; [0601–0618: Metal rolling furnaces, metal furnaces,
and metal forge furnaces]; [1101–1106: Drying ovens]; [2901–3202: Gas turbines, diesel engines, gas engines, and gasoline engines]
Operation: [A–D: Accommodation/eating establishments, health care/educational and academic institutions, pubic bathhouses, laundry services]; [F–L: Agriculture/fisheries, mining, construction, electricity, gas, heat distribution, building heating/other operations]
2. Emissions from the facilities and operations other than the above and [1301–1304: Waste incinerators], are reported under the Industrial Processes sector. Accordingly, the emissions from the specified sources, calculated by the following methods, are subtracted from the emissions listed in the MAP Survey to determine the emissions from the Energy sector.
○ NOX
If raw material falls under either [44: Metallurgical coal] or [45: Metallurgical coke], the following equation is used:
Annex 3. Other detailed methodological descriptions for individual source or sink categories
Annex 3.6 National Greenhouse Gas Inventory Report of Japan 2006
Calculation of NOx emissions from metallurgical coal or coke (to be included in the Industrial
Processes sector)
NOx emissions from metallurgical coal or coke [t-NOx]
= NOx emission factor per material [t-NOx/kcal] × energy consumed per material [kcal]
× (1 – denitrification rate [%])
If raw material falls under either [41: Iron/ironstone] or [46: Other], the following equation
is used:
Calculation of NOx emissions from iron/ironstone or other material (to be included in the
Industrial Processes sector)
NOx emissions from iron/ironstone or other material [t-NOx]
= Nitrogen content per material [t-NOx] × (1 – denitrification rate [%])
If, however, the emissions from the Industrial Processes sector calculated by the above
equations exceed the emission volume listed in the MAP Survey, the total emissions listed in the Survey are considered to be the emissions from the Industrial Processes sector. Materials listed in the categories [42: Sulfide minerals] and [43: Non-ferrous metal ores] are excluded from the calculation due to the lack of data.
○ SO2
Emissions from the Industrial Processes sector is calculated from the consumption and sulfur contents of the materials in categories from [41: Iron/ironstone] to [46: Other materials], and subtracted from the emissions listed in the MAP Survey to determine SO2 emissions in the energy sector.
Calculation of SOx emissions (in the Industrial Processes sector)
SOx emissions [t-SOx] = Sulfur content per material [t-SOx] × (1 – desulphurization rate [%])
• Emission factors
○ NOx emission factors for metallurgical coal and coke NOx emission factors for the materials used in the calculation of NOx emissions from
metallurgical coal and coke (in the Industrial Processes sector) were established for each facility and material type based on the MAP Survey.
Annex 3. Other detailed methodological descriptions for individual source or sink categories
National Greenhouse Gas Inventory Report of Japan 2006 Annex 3.7
○ Denitrification rate The denitrification rate was calculated by the following equation:
Calculation of denitrification rate
Denitrification rate [%]
= Denitrification efficiency [%] × (Hours of operation of denitrification unit [h/yr] /
Hours of operation of furnace [h/yr]) × (Processing capacity of denitrification unit [m3/yr] /
max exhaust gas emission [m3/yr])
The MAP Survey data were used for all items.
Denitrification efficiency: (NOx volume before treatment – NOx volume after treatment) / volume of smoke and
soot
○ Desulphurization rate Desulphurization rate was calculated by the following equation:
Calculation of desulphurization rate
Desulphurization rate [%]
= Desulphurization efficiency [%] × (Hours operation of desulphurization unit [h/yr] /
Hours operation of furnace [h/yr]) × (Processing capacity of desulphurization unit [m3/yr] /
max exhaust gas emission [m3/yr])
The MAP Survey data were used for all items.
Desulphurization efficiency: (SO2 volume before treatment – SO2 volume after treatment) / volume of smoke and
soot
• Activity data
○ Energy consumption of metallurgical coal or coke The activity data was calculated by multiplying the consumption of materials (under [44:
Metallurgical coal] and [45: Metallurgical coke]) provided in the MAP Survey by gross calorific value.
○ Nitrogen content of iron/ironstone and other materials
The activity data was calculated by multiplying the weighted average of nitrogen content, calculated from the nitrogen content and consumption of the materials (under [41: Iron/ironstone] and [46: Other materials]) provided in the MAP Survey, by the consumption volume of the material.
○ Sulfur content of various materials
The activity data was calculated by multiplying the weighted average of sulfur content, calculated on the basis of sulfur content and consumption of the material (under [44: Metallurgical coal] through [46:Other materials]) provided in the MAP Survey, by the consumption volume of the material.
Annex 3. Other detailed methodological descriptions for individual source or sink categories
Annex 3.8 National Greenhouse Gas Inventory Report of Japan 2006
2) CO
• Methodology for Estimating Emissions
Emissions of CO from the specified sources were calculated by multiplying the energy consumption per facility type by Japan’s own emission factor.
• Emission factors
CO emission factors were established based on the summary data in the Reports on Greenhouse gas emissions estimation methodology (Japan Sociality Atmospheric Environment, 1996).
• Activity data
Energy consumption according to facility type determined from General Energy Statistics was used for activity data.
3) NMVOC
• Methodology for Estimating Emissions
Emissions of NMVOC from the specified sources were calculated by multiplying the energy consumption per facility type by Japan’s own emission factor.
• Emission factors
NMVOC emission factors were established by multiplying the CH4 emission factor for each facility per fuel type by the ratio of NMVOC emission to CH4 emission factor per fuel type. The CH4 emission factors were established from the summary data provided in the Reports on Greenhouse gas emissions estimation methodology (Japan Sociality Atmospheric Environment, 1996), while the NMVOC/CH4 emission factor ratios were determined from the report on Screening Survey Regarding Measures to Counter Global Warming (Japan Environmental Sanitation Center) and Study of Establishment of Methodology for Estimation of Hydrocarbon Emissions (Institute of Behavioral Science).
• Activity data
Energy consumption according to facility type determined from General Energy Statistics was used for activity data.
b) Small facilities (commercial and other sector, manufacturing sector) • Methodology for Estimating Emissions
NOx, CO, NMVOC, and SO2 emitted by the specified sources were calculated by multiplying energy consumption per facility type by Japan’s own emission factor.
Annex 3. Other detailed methodological descriptions for individual source or sink categories
National Greenhouse Gas Inventory Report of Japan 2006 Annex 3.9
• Emission factors
○ NOx and SOx Emission factors for NOx and SOx were established for each fuel type for [0102: Heating
system boilers] for facilities listed in [L: Heating systems for buildings/other places of business] in the MAP Survey by aggregating emission and energy consumption per fuel type.
○ CO
The emission factors established for [0102: Heating system boilers] based on the Reports on Greenhouse gas emissions estimation methodology (Japan Sociality Atmospheric Environment, 1996) were adopted as the CO emission factors.
○ NMVOC
NMVOC emission factors were established by multiplying the CH4 emission factors for [0102: Heating system boilers] by the ratio of NMVOC emission to CH4 emission factor per fuel type. The CH4 emission factors were established from the Reports on Greenhouse gas emissions estimation methodology (Japan Sociality Atmospheric Environment, 1996), while the NMVOC/CH4 emission factor ratios were determined from the report on Screening Survey Regarding Measures to Counter Global Warming (Japan Environmental Sanitation Center) and Study of Establishment of Methodology for Estimation of Hydrocarbon Emissions (Institute of Behavioral Science).
• Activity data
To determine NOX and SOX, energy consumption by small facilities per fuel type was calculated by subtracting energy consumption per fuel type, identified by the MAP Survey, from energy consumption per fuel type provided in the General Energy Statistics (Agency for Natural Resources and Energy). If the activity data shown in the MAP Survey exceeded the activity data provided in the General Energy Statistics, the activity data for the specified sources was deemed to be zero. The fuels covered were town gas, LPG, kerosene, and heating oil A.
Energy consumption from General Energy Statistics was used for CO and NMVOCs.
c) Residential sector • Methodology for Estimating Emissions
NOx, CO, NMVOC, and SO2 emissions from the target source were calculated by multiplying energy consumed per facility type by Japan’s own emission factor or the IPCC default emission factor.
• Emission factors
○ NOX For solid fuels (steaming coal and coal briquettes), emission factors were established by
Annex 3. Other detailed methodological descriptions for individual source or sink categories
Annex 3.10 National Greenhouse Gas Inventory Report of Japan 2006
converting the default values provided in the Revised 1996 IPCC Guidelines to gross calorific values.
For liquid (kerosene) and gaseous (LPG, town gas) fuels, the emission factors per usage per fuel type provided in the reports by Air Quality Management Bureau, Ministry of the Environment were used. This report calculated the emission factors by weighting the average concentration of NOx emissions per source unit, obtained through questionnaires and interviews in the household gas appliances industry.
○ CO
For solid fuels (steaming coal and coal briquettes), emission factors were established by converting the default values provided in the Revised 1996 IPCC Guidelines to gross calorific values.
For liquid (kerosene) and gaseous (LPG, town gas) fuels, the emission factors per usage per fuel type provided in the reports by Institute of Behavioral Science were used. This report tabulated the emission factors by usage and fuel using the actual values measured in Tokyo, Yokohama city and Chiba Prefecture.
○ NMVOC
For all of the solid (steaming coal and coal briquettes), liquid (kerosene), and gaseous (LPG and town gas) fuels, emission factors were established by converting the default values provided in the Revised 1996 IPCC Guidelines to gross calorific values.
○ SO2
For solid fuels (steaming coal and coal briquettes), emission factors were established by converting the default values provided in the Revised 1996 IPCC Guidelines to gross calorific values.
For liquid fuel (kerosene), emission factors were calculated from energy consumption, specific gravity and sulfur content based on the fuel characteristics of kerosene described in information material compiled by the Petroleum Association of Japan.
• Activity data
Consumption by type of fuel for residential use in General Energy Statistics has been taken for the activity data. The fuels covered were steaming coal, coal briquettes, kerosene, LPG, and town gas.
3.2.1.2. Mobile Combustion (1.A.3: NOx, CO, NMVOC, and SO2)
3.2.1.2.a. Road Transportation (1.A.3.b.)
1) NOx, CO, and NMVOC
• Methodology for Estimating Emissions
NOx, CO, and NMVOC emissions from the specified mobile sources were calculated by
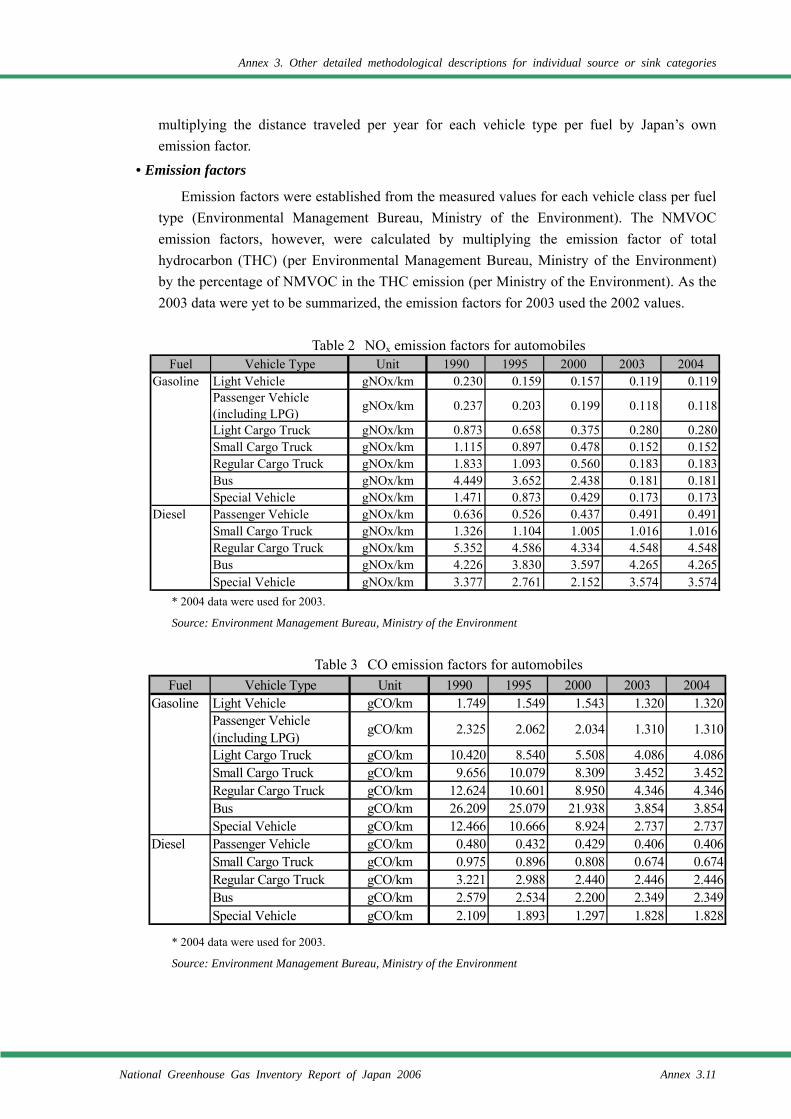
Annex 3. Other detailed methodological descriptions for individual source or sink categories
National Greenhouse Gas Inventory Report of Japan 2006 Annex 3.11
multiplying the distance traveled per year for each vehicle type per fuel by Japan’s own emission factor.
• Emission factors
Emission factors were established from the measured values for each vehicle class per fuel type (Environmental Management Bureau, Ministry of the Environment). The NMVOC emission factors, however, were calculated by multiplying the emission factor of total hydrocarbon (THC) (per Environmental Management Bureau, Ministry of the Environment) by the percentage of NMVOC in the THC emission (per Ministry of the Environment). As the 2003 data were yet to be summarized, the emission factors for 2003 used the 2002 values.
Table 2 NOx emission factors for automobiles
* 2004 data were used for 2003.
Source: Environment Management Bureau, Ministry of the Environment
Table 3 CO emission factors for automobiles
* 2004 data were used for 2003.
Source: Environment Management Bureau, Ministry of the Environment
Fuel Vehicle Type Unit 1990 1995 2000 2003 2004Gasoline Light Vehicle gNOx/km 0.230 0.159 0.157 0.119 0.119
Passenger Vehicle(including LPG) gNOx/km 0.237 0.203 0.199 0.118 0.118
Light Cargo Truck gNOx/km 0.873 0.658 0.375 0.280 0.280Small Cargo Truck gNOx/km 1.115 0.897 0.478 0.152 0.152Regular Cargo Truck gNOx/km 1.833 1.093 0.560 0.183 0.183Bus gNOx/km 4.449 3.652 2.438 0.181 0.181Special Vehicle gNOx/km 1.471 0.873 0.429 0.173 0.173
Diesel Passenger Vehicle gNOx/km 0.636 0.526 0.437 0.491 0.491Small Cargo Truck gNOx/km 1.326 1.104 1.005 1.016 1.016Regular Cargo Truck gNOx/km 5.352 4.586 4.334 4.548 4.548Bus gNOx/km 4.226 3.830 3.597 4.265 4.265Special Vehicle gNOx/km 3.377 2.761 2.152 3.574 3.574
Fuel Vehicle Type Unit 1990 1995 2000 2003 2004Gasoline Light Vehicle gCO/km 1.749 1.549 1.543 1.320 1.320
Passenger Vehicle(including LPG) gCO/km 2.325 2.062 2.034 1.310 1.310
Light Cargo Truck gCO/km 10.420 8.540 5.508 4.086 4.086Small Cargo Truck gCO/km 9.656 10.079 8.309 3.452 3.452Regular Cargo Truck gCO/km 12.624 10.601 8.950 4.346 4.346Bus gCO/km 26.209 25.079 21.938 3.854 3.854Special Vehicle gCO/km 12.466 10.666 8.924 2.737 2.737
Diesel Passenger Vehicle gCO/km 0.480 0.432 0.429 0.406 0.406Small Cargo Truck gCO/km 0.975 0.896 0.808 0.674 0.674Regular Cargo Truck gCO/km 3.221 2.988 2.440 2.446 2.446Bus gCO/km 2.579 2.534 2.200 2.349 2.349Special Vehicle gCO/km 2.109 1.893 1.297 1.828 1.828
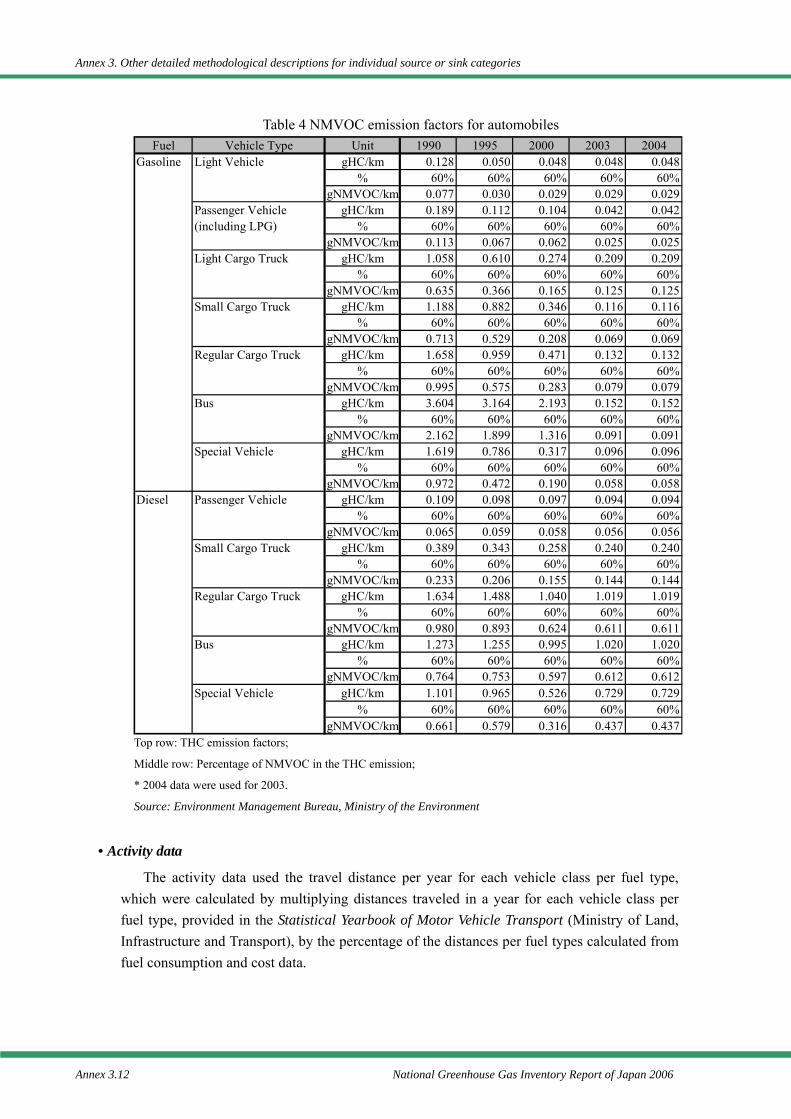
Annex 3. Other detailed methodological descriptions for individual source or sink categories
Annex 3.12 National Greenhouse Gas Inventory Report of Japan 2006
Table 4 NMVOC emission factors for automobiles
Top row: THC emission factors;
Middle row: Percentage of NMVOC in the THC emission;
* 2004 data were used for 2003.
Source: Environment Management Bureau, Ministry of the Environment
• Activity data
The activity data used the travel distance per year for each vehicle class per fuel type, which were calculated by multiplying distances traveled in a year for each vehicle class per fuel type, provided in the Statistical Yearbook of Motor Vehicle Transport (Ministry of Land, Infrastructure and Transport), by the percentage of the distances per fuel types calculated from fuel consumption and cost data.
Fuel Vehicle Type Unit 1990 1995 2000 2003 2004Gasoline Light Vehicle gHC/km 0.128 0.050 0.048 0.048 0.048
% 60% 60% 60% 60% 60%gNMVOC/km 0.077 0.030 0.029 0.029 0.029
Passenger Vehicle gHC/km 0.189 0.112 0.104 0.042 0.042(including LPG) % 60% 60% 60% 60% 60%
gNMVOC/km 0.113 0.067 0.062 0.025 0.025Light Cargo Truck gHC/km 1.058 0.610 0.274 0.209 0.209
% 60% 60% 60% 60% 60%gNMVOC/km 0.635 0.366 0.165 0.125 0.125
Small Cargo Truck gHC/km 1.188 0.882 0.346 0.116 0.116% 60% 60% 60% 60% 60%
gNMVOC/km 0.713 0.529 0.208 0.069 0.069Regular Cargo Truck gHC/km 1.658 0.959 0.471 0.132 0.132
% 60% 60% 60% 60% 60%gNMVOC/km 0.995 0.575 0.283 0.079 0.079
Bus gHC/km 3.604 3.164 2.193 0.152 0.152% 60% 60% 60% 60% 60%
gNMVOC/km 2.162 1.899 1.316 0.091 0.091Special Vehicle gHC/km 1.619 0.786 0.317 0.096 0.096
% 60% 60% 60% 60% 60%gNMVOC/km 0.972 0.472 0.190 0.058 0.058
Diesel Passenger Vehicle gHC/km 0.109 0.098 0.097 0.094 0.094% 60% 60% 60% 60% 60%
gNMVOC/km 0.065 0.059 0.058 0.056 0.056Small Cargo Truck gHC/km 0.389 0.343 0.258 0.240 0.240
% 60% 60% 60% 60% 60%gNMVOC/km 0.233 0.206 0.155 0.144 0.144
Regular Cargo Truck gHC/km 1.634 1.488 1.040 1.019 1.019% 60% 60% 60% 60% 60%
gNMVOC/km 0.980 0.893 0.624 0.611 0.611Bus gHC/km 1.273 1.255 0.995 1.020 1.020
% 60% 60% 60% 60% 60%gNMVOC/km 0.764 0.753 0.597 0.612 0.612
Special Vehicle gHC/km 1.101 0.965 0.526 0.729 0.729% 60% 60% 60% 60% 60%
gNMVOC/km 0.661 0.579 0.316 0.437 0.437
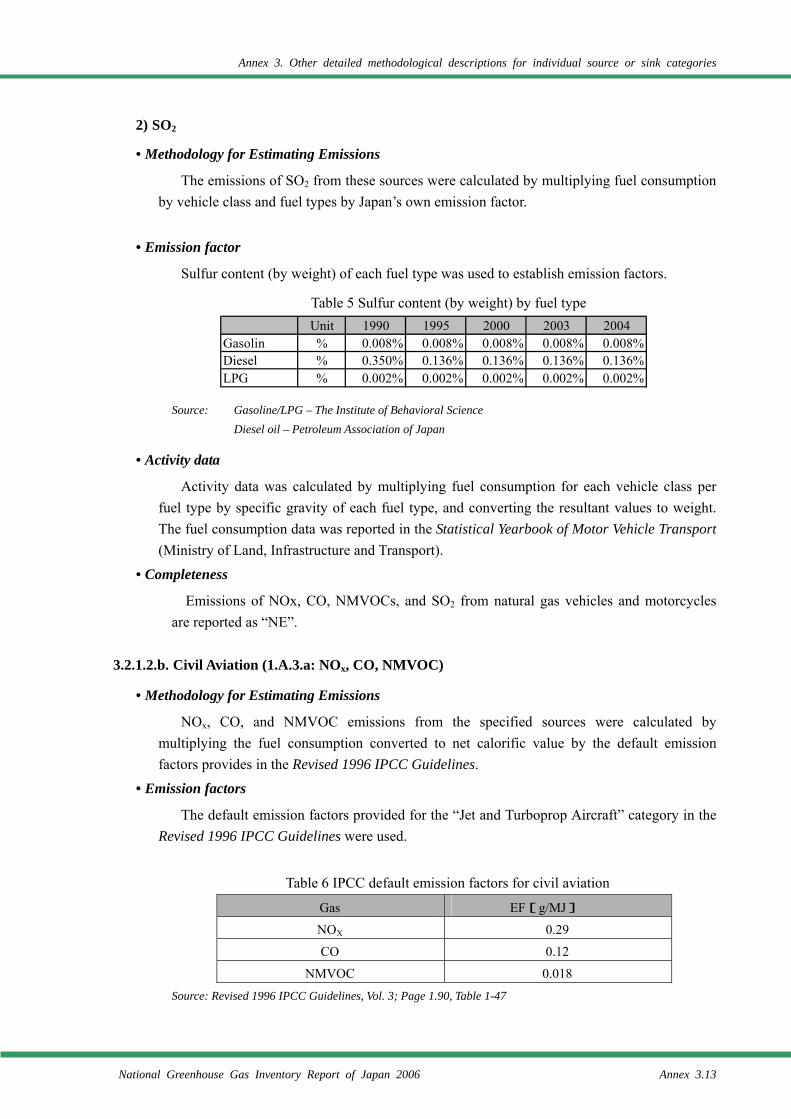
Annex 3. Other detailed methodological descriptions for individual source or sink categories
National Greenhouse Gas Inventory Report of Japan 2006 Annex 3.13
2) SO2
• Methodology for Estimating Emissions
The emissions of SO2 from these sources were calculated by multiplying fuel consumption by vehicle class and fuel types by Japan’s own emission factor.
• Emission factor
Sulfur content (by weight) of each fuel type was used to establish emission factors.
Table 5 Sulfur content (by weight) by fuel type
Source: Gasoline/LPG – The Institute of Behavioral Science Diesel oil – Petroleum Association of Japan
• Activity data
Activity data was calculated by multiplying fuel consumption for each vehicle class per fuel type by specific gravity of each fuel type, and converting the resultant values to weight. The fuel consumption data was reported in the Statistical Yearbook of Motor Vehicle Transport (Ministry of Land, Infrastructure and Transport).
• Completeness
Emissions of NOx, CO, NMVOCs, and SO2 from natural gas vehicles and motorcycles are reported as “NE”.
3.2.1.2.b. Civil Aviation (1.A.3.a: NOx, CO, NMVOC)
• Methodology for Estimating Emissions
NOx, CO, and NMVOC emissions from the specified sources were calculated by multiplying the fuel consumption converted to net calorific value by the default emission factors provides in the Revised 1996 IPCC Guidelines.
• Emission factors
The default emission factors provided for the “Jet and Turboprop Aircraft” category in the Revised 1996 IPCC Guidelines were used.
Table 6 IPCC default emission factors for civil aviation
Gas EF[g/MJ]
NOX 0.29
CO 0.12
NMVOC 0.018
Source: Revised 1996 IPCC Guidelines, Vol. 3; Page 1.90, Table 1-47
Unit 1990 1995 2000 2003 2004Gasolin % 0.008% 0.008% 0.008% 0.008% 0.008%Diesel % 0.350% 0.136% 0.136% 0.136% 0.136%LPG % 0.002% 0.002% 0.002% 0.002% 0.002%
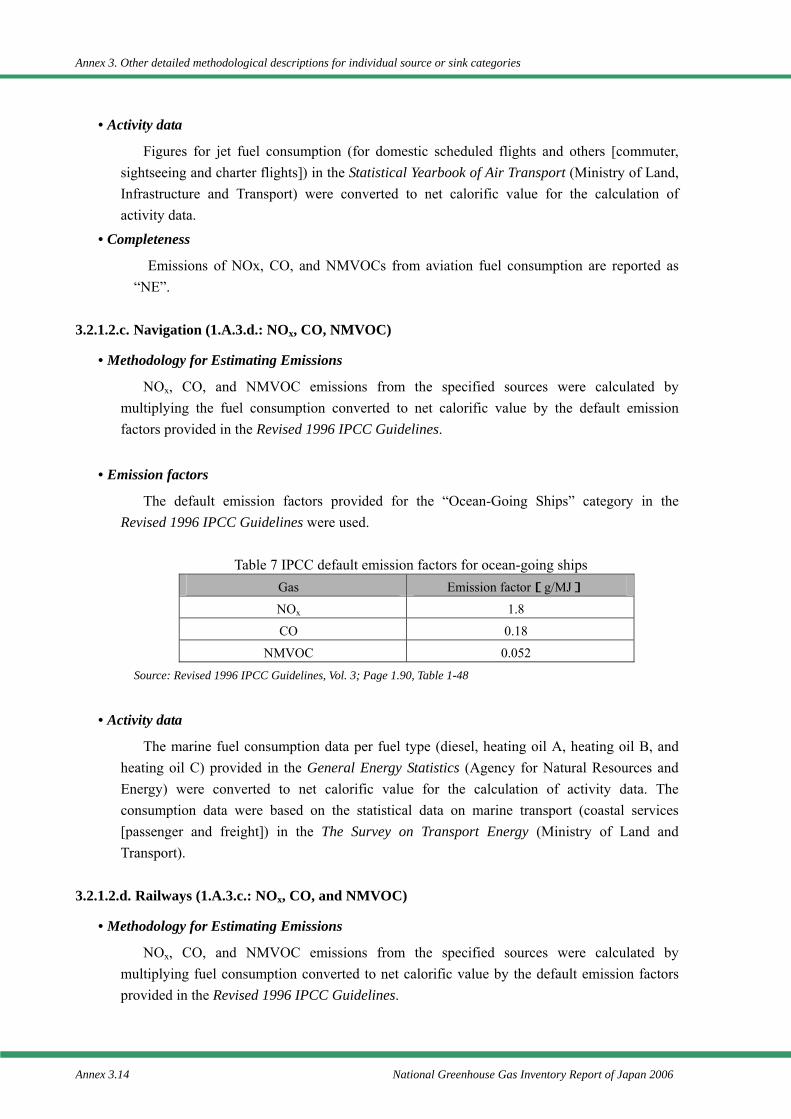
Annex 3. Other detailed methodological descriptions for individual source or sink categories
Annex 3.14 National Greenhouse Gas Inventory Report of Japan 2006
• Activity data
Figures for jet fuel consumption (for domestic scheduled flights and others [commuter, sightseeing and charter flights]) in the Statistical Yearbook of Air Transport (Ministry of Land, Infrastructure and Transport) were converted to net calorific value for the calculation of activity data.
• Completeness
Emissions of NOx, CO, and NMVOCs from aviation fuel consumption are reported as “NE”.
3.2.1.2.c. Navigation (1.A.3.d.: NOx, CO, NMVOC)
• Methodology for Estimating Emissions
NOx, CO, and NMVOC emissions from the specified sources were calculated by multiplying the fuel consumption converted to net calorific value by the default emission factors provided in the Revised 1996 IPCC Guidelines.
• Emission factors
The default emission factors provided for the “Ocean-Going Ships” category in the Revised 1996 IPCC Guidelines were used.
Table 7 IPCC default emission factors for ocean-going ships
Gas Emission factor[g/MJ]
NOx 1.8
CO 0.18
NMVOC 0.052
Source: Revised 1996 IPCC Guidelines, Vol. 3; Page 1.90, Table 1-48
• Activity data
The marine fuel consumption data per fuel type (diesel, heating oil A, heating oil B, and heating oil C) provided in the General Energy Statistics (Agency for Natural Resources and Energy) were converted to net calorific value for the calculation of activity data. The consumption data were based on the statistical data on marine transport (coastal services [passenger and freight]) in the The Survey on Transport Energy (Ministry of Land and Transport).
3.2.1.2.d. Railways (1.A.3.c.: NOx, CO, and NMVOC)
• Methodology for Estimating Emissions
NOx, CO, and NMVOC emissions from the specified sources were calculated by multiplying fuel consumption converted to net calorific value by the default emission factors provided in the Revised 1996 IPCC Guidelines.
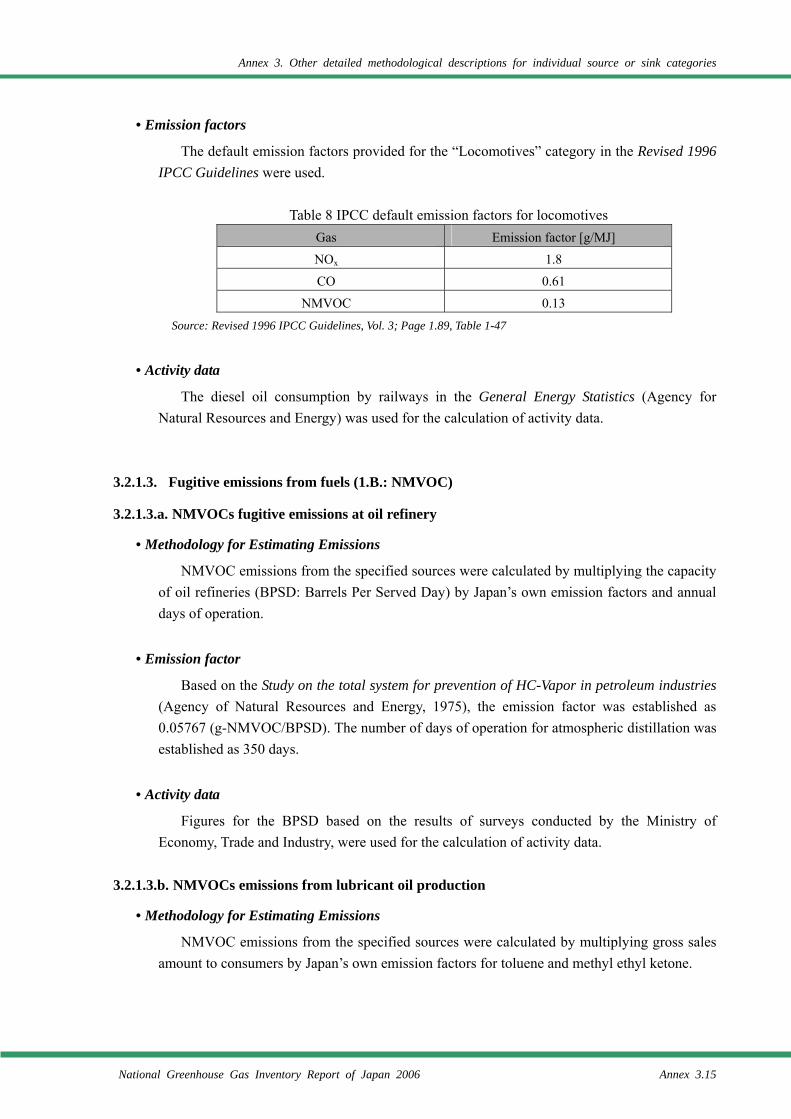
Annex 3. Other detailed methodological descriptions for individual source or sink categories
National Greenhouse Gas Inventory Report of Japan 2006 Annex 3.15
• Emission factors
The default emission factors provided for the “Locomotives” category in the Revised 1996 IPCC Guidelines were used.
Table 8 IPCC default emission factors for locomotives
Gas Emission factor [g/MJ]
NOx 1.8
CO 0.61
NMVOC 0.13
Source: Revised 1996 IPCC Guidelines, Vol. 3; Page 1.89, Table 1-47
• Activity data
The diesel oil consumption by railways in the General Energy Statistics (Agency for Natural Resources and Energy) was used for the calculation of activity data.
3.2.1.3. Fugitive emissions from fuels (1.B.: NMVOC)
3.2.1.3.a. NMVOCs fugitive emissions at oil refinery
• Methodology for Estimating Emissions
NMVOC emissions from the specified sources were calculated by multiplying the capacity of oil refineries (BPSD: Barrels Per Served Day) by Japan’s own emission factors and annual days of operation.
• Emission factor
Based on the Study on the total system for prevention of HC-Vapor in petroleum industries (Agency of Natural Resources and Energy, 1975), the emission factor was established as 0.05767 (g-NMVOC/BPSD). The number of days of operation for atmospheric distillation was established as 350 days.
• Activity data
Figures for the BPSD based on the results of surveys conducted by the Ministry of Economy, Trade and Industry, were used for the calculation of activity data.
3.2.1.3.b. NMVOCs emissions from lubricant oil production
• Methodology for Estimating Emissions
NMVOC emissions from the specified sources were calculated by multiplying gross sales amount to consumers by Japan’s own emission factors for toluene and methyl ethyl ketone.
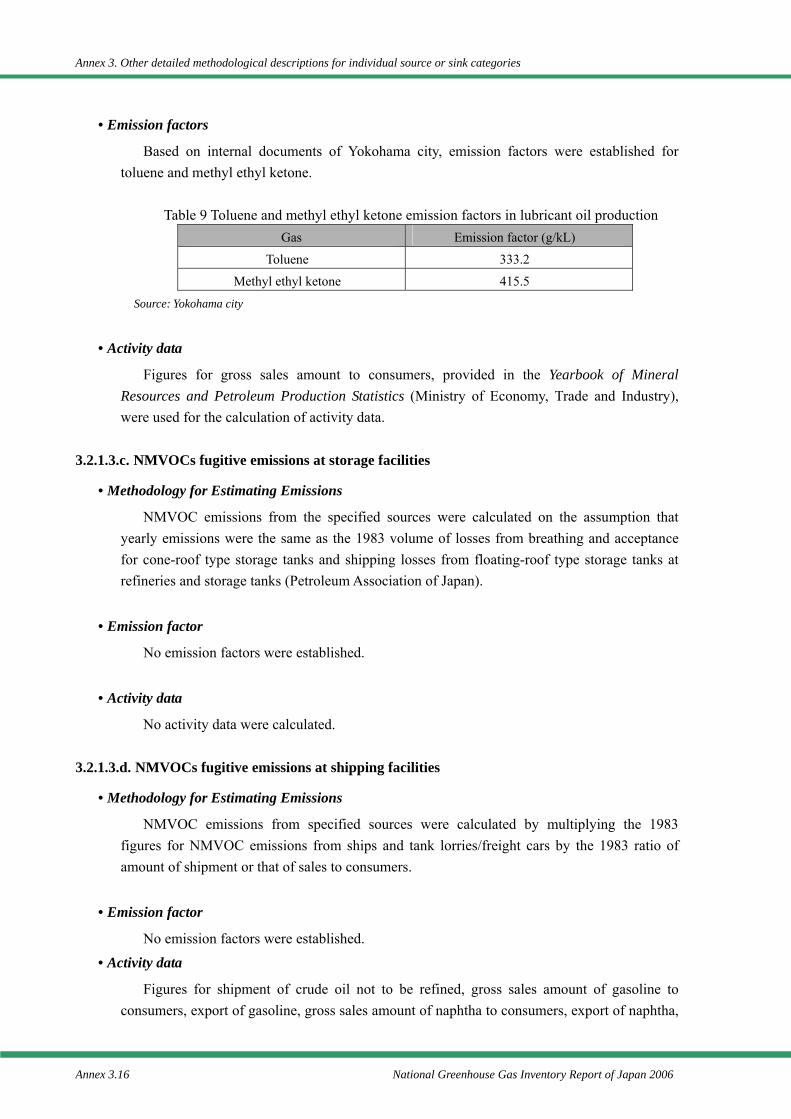
Annex 3. Other detailed methodological descriptions for individual source or sink categories
Annex 3.16 National Greenhouse Gas Inventory Report of Japan 2006
• Emission factors
Based on internal documents of Yokohama city, emission factors were established for toluene and methyl ethyl ketone.
Table 9 Toluene and methyl ethyl ketone emission factors in lubricant oil production
Gas Emission factor (g/kL)
Toluene 333.2
Methyl ethyl ketone 415.5
Source: Yokohama city
• Activity data
Figures for gross sales amount to consumers, provided in the Yearbook of Mineral Resources and Petroleum Production Statistics (Ministry of Economy, Trade and Industry), were used for the calculation of activity data.
3.2.1.3.c. NMVOCs fugitive emissions at storage facilities
• Methodology for Estimating Emissions
NMVOC emissions from the specified sources were calculated on the assumption that yearly emissions were the same as the 1983 volume of losses from breathing and acceptance for cone-roof type storage tanks and shipping losses from floating-roof type storage tanks at refineries and storage tanks (Petroleum Association of Japan).
• Emission factor
No emission factors were established.
• Activity data
No activity data were calculated.
3.2.1.3.d. NMVOCs fugitive emissions at shipping facilities
• Methodology for Estimating Emissions
NMVOC emissions from specified sources were calculated by multiplying the 1983 figures for NMVOC emissions from ships and tank lorries/freight cars by the 1983 ratio of amount of shipment or that of sales to consumers.
• Emission factor
No emission factors were established.
• Activity data
Figures for shipment of crude oil not to be refined, gross sales amount of gasoline to consumers, export of gasoline, gross sales amount of naphtha to consumers, export of naphtha,
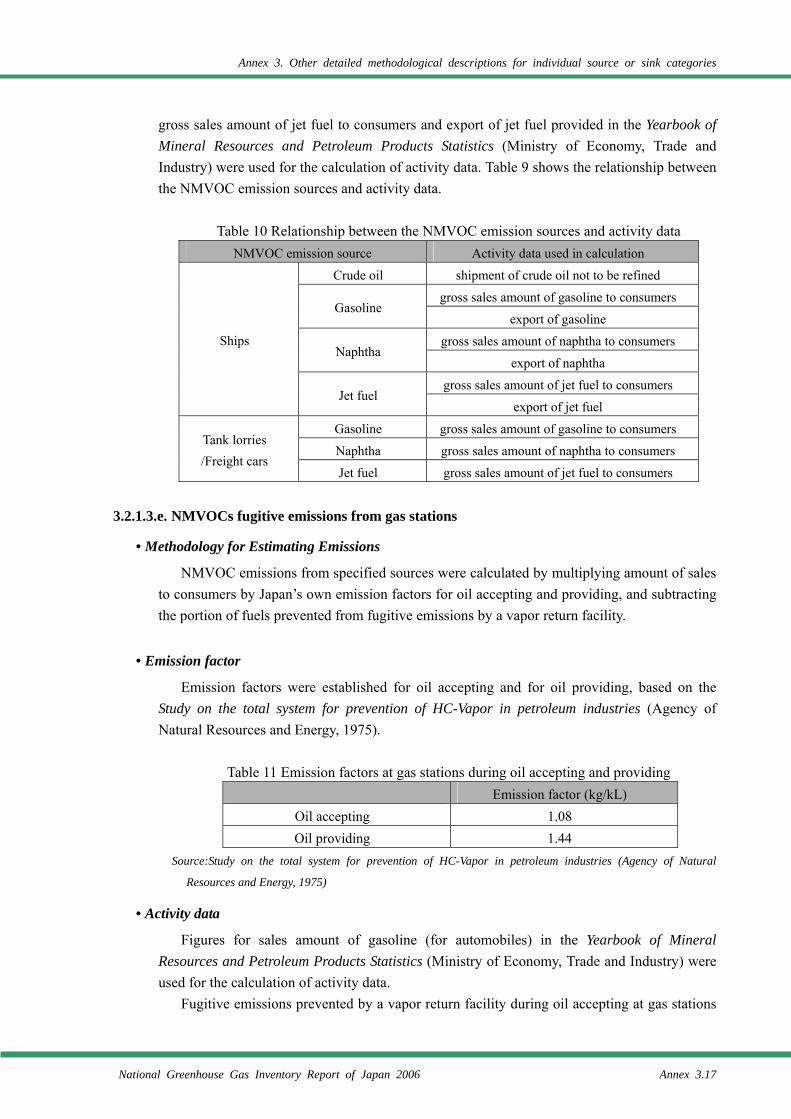
Annex 3. Other detailed methodological descriptions for individual source or sink categories
National Greenhouse Gas Inventory Report of Japan 2006 Annex 3.17
gross sales amount of jet fuel to consumers and export of jet fuel provided in the Yearbook of Mineral Resources and Petroleum Products Statistics (Ministry of Economy, Trade and Industry) were used for the calculation of activity data. Table 9 shows the relationship between the NMVOC emission sources and activity data.
Table 10 Relationship between the NMVOC emission sources and activity data
NMVOC emission source Activity data used in calculation
Crude oil shipment of crude oil not to be refined
gross sales amount of gasoline to consumers Gasoline
export of gasoline
gross sales amount of naphtha to consumers Naphtha
export of naphtha
gross sales amount of jet fuel to consumers
Ships
Jet fuel export of jet fuel
Gasoline gross sales amount of gasoline to consumers
Naphtha gross sales amount of naphtha to consumers Tank lorries /Freight cars
Jet fuel gross sales amount of jet fuel to consumers
3.2.1.3.e. NMVOCs fugitive emissions from gas stations
• Methodology for Estimating Emissions
NMVOC emissions from specified sources were calculated by multiplying amount of sales to consumers by Japan’s own emission factors for oil accepting and providing, and subtracting the portion of fuels prevented from fugitive emissions by a vapor return facility.
• Emission factor
Emission factors were established for oil accepting and for oil providing, based on the Study on the total system for prevention of HC-Vapor in petroleum industries (Agency of Natural Resources and Energy, 1975).
Table 11 Emission factors at gas stations during oil accepting and providing
Emission factor (kg/kL) Oil accepting 1.08 Oil providing 1.44
Source:Study on the total system for prevention of HC-Vapor in petroleum industries (Agency of Natural
Resources and Energy, 1975)
• Activity data
Figures for sales amount of gasoline (for automobiles) in the Yearbook of Mineral Resources and Petroleum Products Statistics (Ministry of Economy, Trade and Industry) were used for the calculation of activity data.
Fugitive emissions prevented by a vapor return facility during oil accepting at gas stations
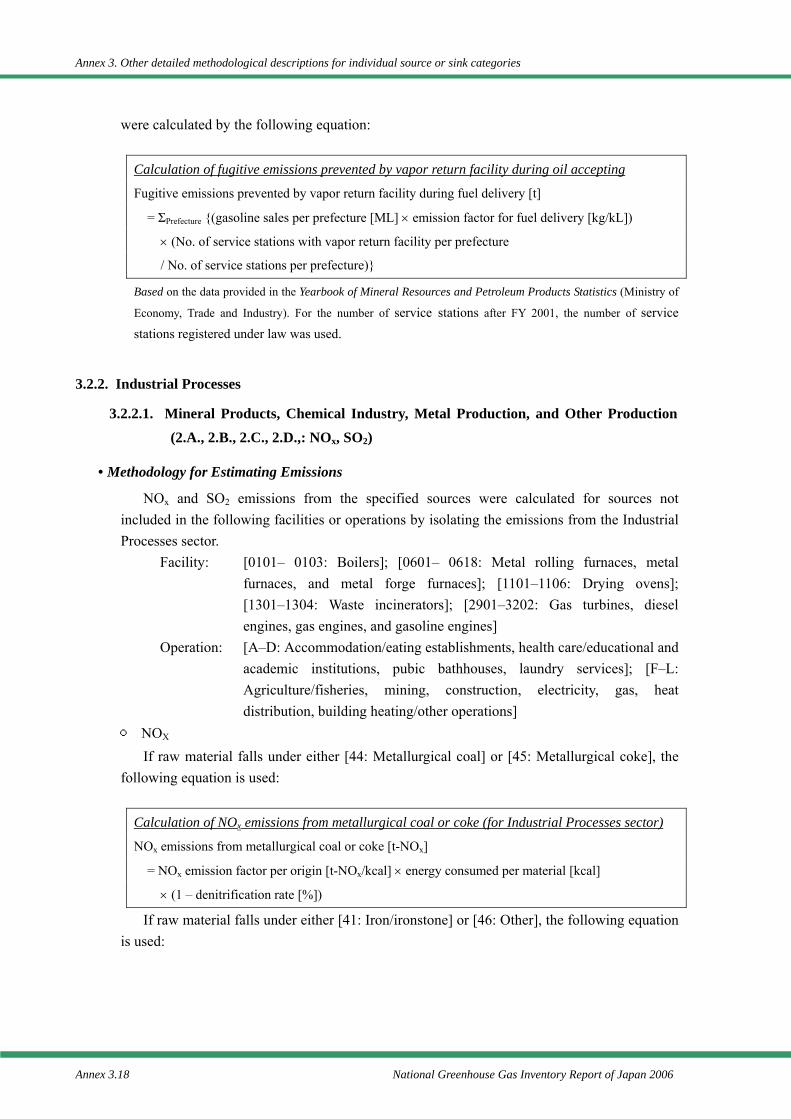
Annex 3. Other detailed methodological descriptions for individual source or sink categories
Annex 3.18 National Greenhouse Gas Inventory Report of Japan 2006
were calculated by the following equation:
Calculation of fugitive emissions prevented by vapor return facility during oil accepting
Fugitive emissions prevented by vapor return facility during fuel delivery [t]
= ΣPrefecture {(gasoline sales per prefecture [ML] × emission factor for fuel delivery [kg/kL])
× (No. of service stations with vapor return facility per prefecture
/ No. of service stations per prefecture)}
Based on the data provided in the Yearbook of Mineral Resources and Petroleum Products Statistics (Ministry of
Economy, Trade and Industry). For the number of service stations after FY 2001, the number of service stations registered under law was used.
3.2.2. Industrial Processes
3.2.2.1. Mineral Products, Chemical Industry, Metal Production, and Other Production (2.A., 2.B., 2.C., 2.D.,: NOx, SO2)
• Methodology for Estimating Emissions
NOx and SO2 emissions from the specified sources were calculated for sources not included in the following facilities or operations by isolating the emissions from the Industrial Processes sector.
Facility: [0101– 0103: Boilers]; [0601– 0618: Metal rolling furnaces, metal furnaces, and metal forge furnaces]; [1101–1106: Drying ovens]; [1301–1304: Waste incinerators]; [2901–3202: Gas turbines, diesel engines, gas engines, and gasoline engines]
Operation: [A–D: Accommodation/eating establishments, health care/educational and academic institutions, pubic bathhouses, laundry services]; [F–L: Agriculture/fisheries, mining, construction, electricity, gas, heat distribution, building heating/other operations]
○ NOX If raw material falls under either [44: Metallurgical coal] or [45: Metallurgical coke], the
following equation is used:
Calculation of NOx emissions from metallurgical coal or coke (for Industrial Processes sector)
NOx emissions from metallurgical coal or coke [t-NOx]
= NOx emission factor per origin [t-NOx/kcal] × energy consumed per material [kcal]
× (1 – denitrification rate [%])
If raw material falls under either [41: Iron/ironstone] or [46: Other], the following equation is used:
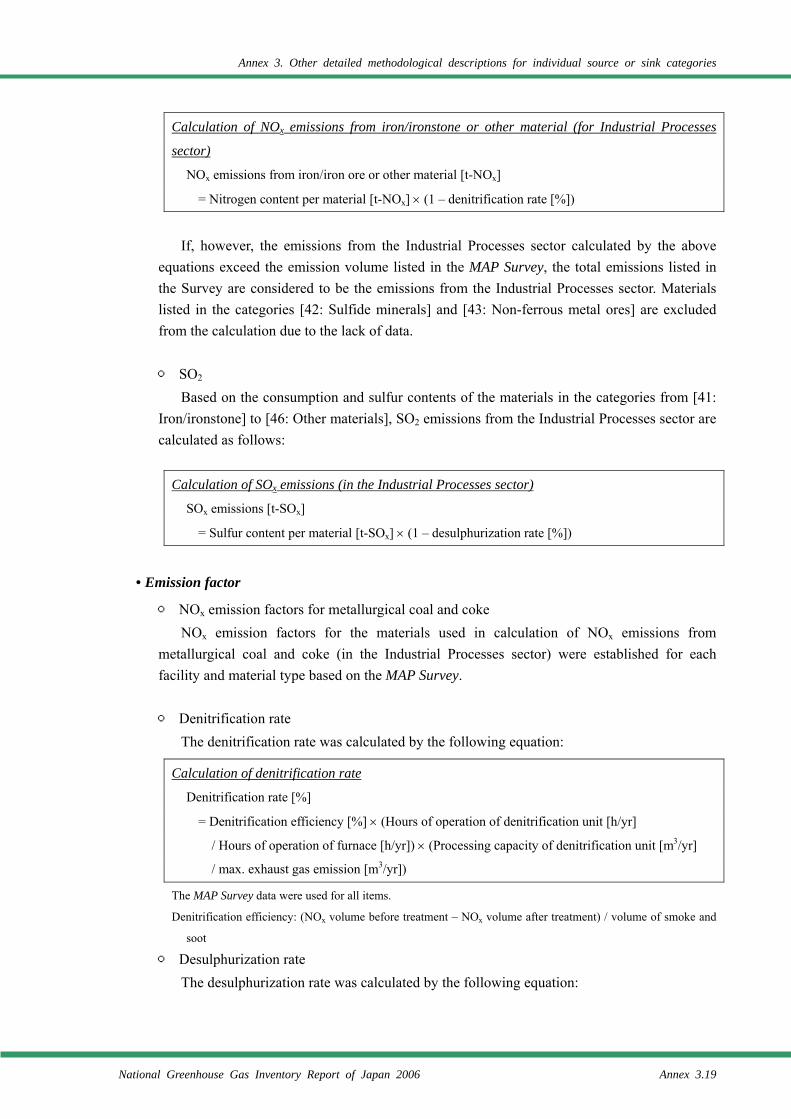
Annex 3. Other detailed methodological descriptions for individual source or sink categories
National Greenhouse Gas Inventory Report of Japan 2006 Annex 3.19
Calculation of NOx emissions from iron/ironstone or other material (for Industrial Processes
sector)
NOx emissions from iron/iron ore or other material [t-NOx]
= Nitrogen content per material [t-NOx] × (1 – denitrification rate [%])
If, however, the emissions from the Industrial Processes sector calculated by the above
equations exceed the emission volume listed in the MAP Survey, the total emissions listed in the Survey are considered to be the emissions from the Industrial Processes sector. Materials listed in the categories [42: Sulfide minerals] and [43: Non-ferrous metal ores] are excluded from the calculation due to the lack of data.
○ SO2
Based on the consumption and sulfur contents of the materials in the categories from [41: Iron/ironstone] to [46: Other materials], SO2 emissions from the Industrial Processes sector are calculated as follows:
Calculation of SOx emissions (in the Industrial Processes sector)
SOx emissions [t-SOx]
= Sulfur content per material [t-SOx] × (1 – desulphurization rate [%])
• Emission factor
○ NOx emission factors for metallurgical coal and coke NOx emission factors for the materials used in calculation of NOx emissions from
metallurgical coal and coke (in the Industrial Processes sector) were established for each facility and material type based on the MAP Survey.
○ Denitrification rate
The denitrification rate was calculated by the following equation:
Calculation of denitrification rate
Denitrification rate [%]
= Denitrification efficiency [%] × (Hours of operation of denitrification unit [h/yr]
/ Hours of operation of furnace [h/yr]) × (Processing capacity of denitrification unit [m3/yr]
/ max. exhaust gas emission [m3/yr])
The MAP Survey data were used for all items.
Denitrification efficiency: (NOx volume before treatment – NOx volume after treatment) / volume of smoke and
soot
○ Desulphurization rate The desulphurization rate was calculated by the following equation:
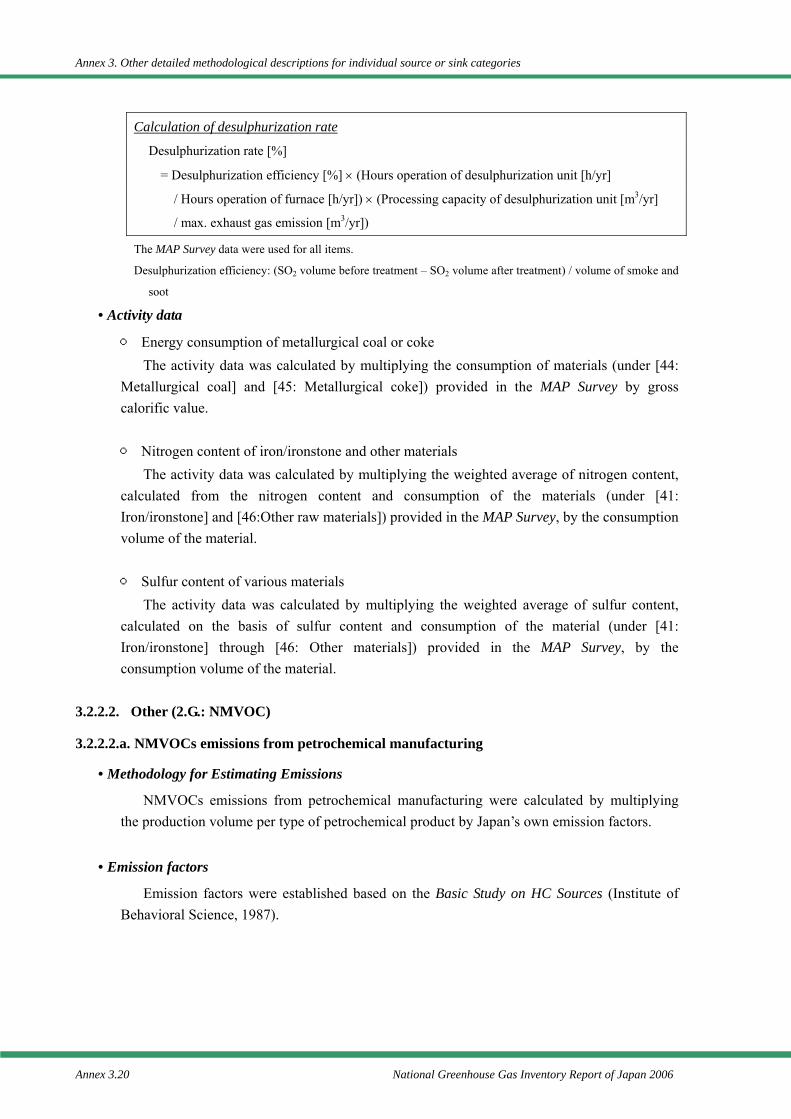
Annex 3. Other detailed methodological descriptions for individual source or sink categories
Annex 3.20 National Greenhouse Gas Inventory Report of Japan 2006
Calculation of desulphurization rate
Desulphurization rate [%]
= Desulphurization efficiency [%] × (Hours operation of desulphurization unit [h/yr]
/ Hours operation of furnace [h/yr]) × (Processing capacity of desulphurization unit [m3/yr]
/ max. exhaust gas emission [m3/yr])
The MAP Survey data were used for all items.
Desulphurization efficiency: (SO2 volume before treatment – SO2 volume after treatment) / volume of smoke and
soot
• Activity data
○ Energy consumption of metallurgical coal or coke The activity data was calculated by multiplying the consumption of materials (under [44:
Metallurgical coal] and [45: Metallurgical coke]) provided in the MAP Survey by gross calorific value.
○ Nitrogen content of iron/ironstone and other materials
The activity data was calculated by multiplying the weighted average of nitrogen content, calculated from the nitrogen content and consumption of the materials (under [41: Iron/ironstone] and [46:Other raw materials]) provided in the MAP Survey, by the consumption volume of the material.
○ Sulfur content of various materials
The activity data was calculated by multiplying the weighted average of sulfur content, calculated on the basis of sulfur content and consumption of the material (under [41: Iron/ironstone] through [46: Other materials]) provided in the MAP Survey, by the consumption volume of the material.
3.2.2.2. Other (2.G.: NMVOC)
3.2.2.2.a. NMVOCs emissions from petrochemical manufacturing
• Methodology for Estimating Emissions
NMVOCs emissions from petrochemical manufacturing were calculated by multiplying the production volume per type of petrochemical product by Japan’s own emission factors.
• Emission factors
Emission factors were established based on the Basic Study on HC Sources (Institute of Behavioral Science, 1987).
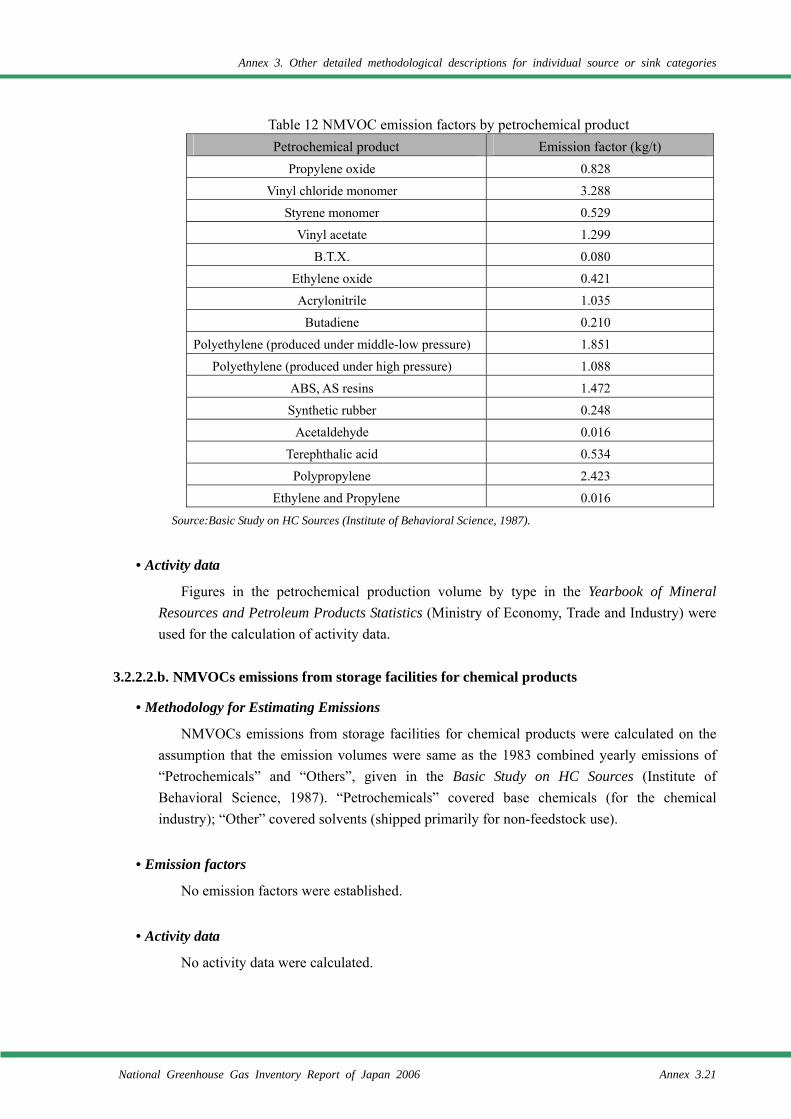
Annex 3. Other detailed methodological descriptions for individual source or sink categories
National Greenhouse Gas Inventory Report of Japan 2006 Annex 3.21
Table 12 NMVOC emission factors by petrochemical product Petrochemical product Emission factor (kg/t)
Propylene oxide 0.828
Vinyl chloride monomer 3.288
Styrene monomer 0.529
Vinyl acetate 1.299
B.T.X. 0.080
Ethylene oxide 0.421
Acrylonitrile 1.035
Butadiene 0.210
Polyethylene (produced under middle-low pressure) 1.851
Polyethylene (produced under high pressure) 1.088
ABS, AS resins 1.472
Synthetic rubber 0.248
Acetaldehyde 0.016
Terephthalic acid 0.534
Polypropylene 2.423
Ethylene and Propylene 0.016
Source:Basic Study on HC Sources (Institute of Behavioral Science, 1987).
• Activity data
Figures in the petrochemical production volume by type in the Yearbook of Mineral Resources and Petroleum Products Statistics (Ministry of Economy, Trade and Industry) were used for the calculation of activity data.
3.2.2.2.b. NMVOCs emissions from storage facilities for chemical products
• Methodology for Estimating Emissions
NMVOCs emissions from storage facilities for chemical products were calculated on the assumption that the emission volumes were same as the 1983 combined yearly emissions of “Petrochemicals” and “Others”, given in the Basic Study on HC Sources (Institute of Behavioral Science, 1987). “Petrochemicals” covered base chemicals (for the chemical industry); “Other” covered solvents (shipped primarily for non-feedstock use).
• Emission factors
No emission factors were established.
• Activity data
No activity data were calculated.
Annex 3. Other detailed methodological descriptions for individual source or sink categories
Annex 3.22 National Greenhouse Gas Inventory Report of Japan 2006
3.2.2.2.c. NMVOCs emissions from shipping facilities for chemical products
• Methodology for Estimating Emissions
NMVOCs emissions from shipping facilities for chemical products were calculated on the assumption that the emission volumes were same as the 1983 combined yearly emissions of “Petrochemicals” and “Others”, shown in the Basic Study on HC Sources (Institute of Behavioral Science, 1987). “Petrochemicals” covered base chemicals (for the chemical industry); “Other” covered solvents (shipped primarily for non-feedstock use).
• Emission factors
No emission factor has been established.
• Activity data
No activity data has been established.
3.2.3. Sectors that use solvents and other products
3.2.3.1. NMVOCs emissions from paint solvent use (3.A.: NMVOC)
• Methodology for Estimating Emissions
Emissions of NMVOC were calculated by multiplying the consumption of solvent by the NMVOC emission rate (the percentage of NMVOC not removed but released into atmosphere).
• Emission factors
The NMOVC emission rate (92.54[%] = 100[%] – 7.46[%]) calculated from the NMVOC removal rate (7.46[%]) estimated by the Ministry of the Environment (1983) was used as the emission factor.
• Activity data
Consumption of solvent was calculated by multiplying the 1990 data for solvent consumption per solvent type by the 1990 ratio of solvent consumption in paint production. The consumption data were extracted from the Present condition and prospect about VOCs in Paint Industry (Japan Paint Manufacturers Association). The solvent consumption ratio was provided in the Yearbook of Chemical Industries Statistics (Ministry of Economy, Trade and Industry). As the statistical records on solvent consumption in paint production were discontinued, the data for 2001 were substituted for values for years 2002 and beyond.
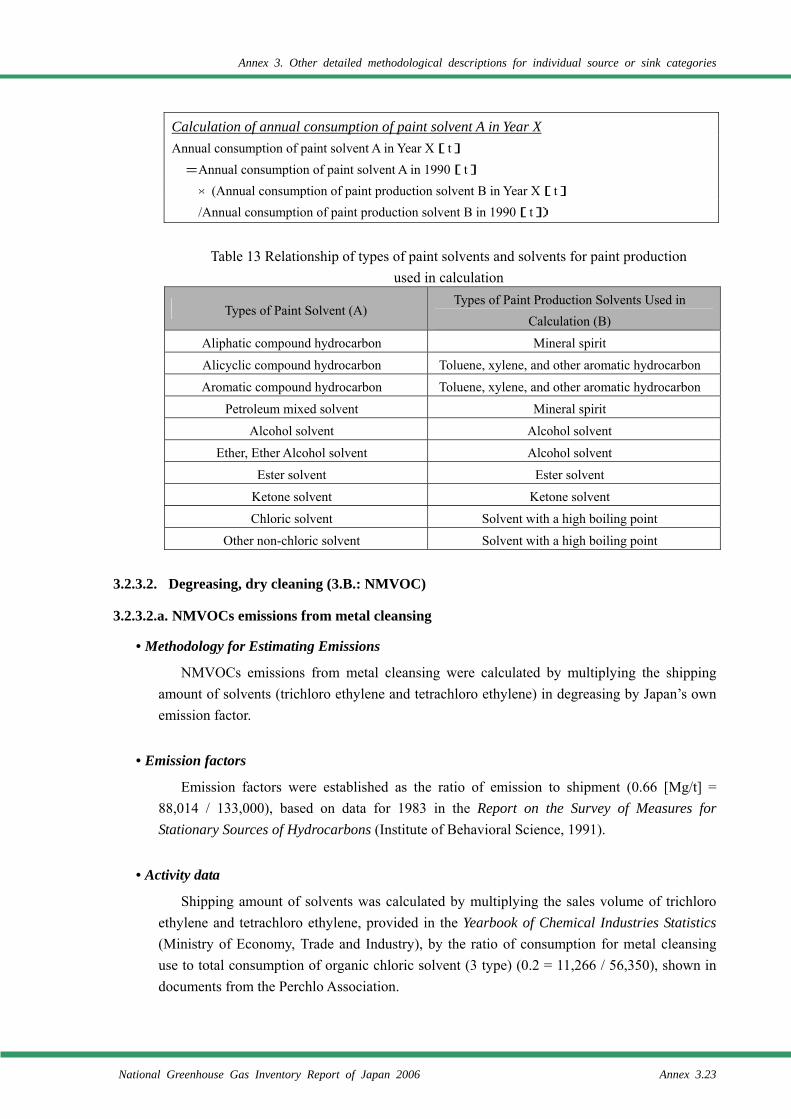
Annex 3. Other detailed methodological descriptions for individual source or sink categories
National Greenhouse Gas Inventory Report of Japan 2006 Annex 3.23
Calculation of annual consumption of paint solvent A in Year X Annual consumption of paint solvent A in Year X[t]
=Annual consumption of paint solvent A in 1990[t] ×(Annual consumption of paint production solvent B in Year X[t] /Annual consumption of paint production solvent B in 1990[t])
Table 13 Relationship of types of paint solvents and solvents for paint production
used in calculation
Types of Paint Solvent (A) Types of Paint Production Solvents Used in
Calculation (B)
Aliphatic compound hydrocarbon Mineral spirit
Alicyclic compound hydrocarbon Toluene, xylene, and other aromatic hydrocarbon
Aromatic compound hydrocarbon Toluene, xylene, and other aromatic hydrocarbon
Petroleum mixed solvent Mineral spirit
Alcohol solvent Alcohol solvent
Ether, Ether Alcohol solvent Alcohol solvent
Ester solvent Ester solvent
Ketone solvent Ketone solvent
Chloric solvent Solvent with a high boiling point
Other non-chloric solvent Solvent with a high boiling point
3.2.3.2. Degreasing, dry cleaning (3.B.: NMVOC)
3.2.3.2.a. NMVOCs emissions from metal cleansing
• Methodology for Estimating Emissions
NMVOCs emissions from metal cleansing were calculated by multiplying the shipping amount of solvents (trichloro ethylene and tetrachloro ethylene) in degreasing by Japan’s own emission factor.
• Emission factors
Emission factors were established as the ratio of emission to shipment (0.66 [Mg/t] = 88,014 / 133,000), based on data for 1983 in the Report on the Survey of Measures for Stationary Sources of Hydrocarbons (Institute of Behavioral Science, 1991).
• Activity data
Shipping amount of solvents was calculated by multiplying the sales volume of trichloro ethylene and tetrachloro ethylene, provided in the Yearbook of Chemical Industries Statistics (Ministry of Economy, Trade and Industry), by the ratio of consumption for metal cleansing use to total consumption of organic chloric solvent (3 type) (0.2 = 11,266 / 56,350), shown in documents from the Perchlo Association.
Annex 3. Other detailed methodological descriptions for individual source or sink categories
Annex 3.24 National Greenhouse Gas Inventory Report of Japan 2006
3.2.3.2.b. NMVOCs emissions from dry cleaning
• Methodology for Estimating Emissions
NMVOCs emissions from dry cleaning were calculated on the assumption that the volume of NMOVC emissions was the same as the volume of solvents used in dry cleaning (petroleum solvents and tetrachloro ethylene).
• Emission factors
No emission factors were established, as all the solvents used in dry cleaning were assumed to be discharged into the atmosphere.
• Activity data
Estimates by the Institute of Cleaning Research were used for the calculation of the annual consumption of petroleum solvents and tetrachloro ethylene in 1990 and 1991.
Annual consumption in 1992 and in subsequent years was calculated by the following equation on the assumption that solvent consumption was proportional to the number of machines in operation:
Calculation of annual consumption of solvents in Year X
Annual consumption of solvents in Year X [t]
= Σpetroleum-based solvent/tetrachloroethylene {annual consumption of petroleum solvents or tetrachloroethylene
in 1991 [t] × (the number of machines in operation in Year X / the number of machines in operation in
1991)}
3.2.3.3. Chemical products, manufacture and processing (3.C.: NMVOC)
3.2.3.3.a. NMVOCs emissions from paint production
• Methodology for Estimating Emissions
NMVOCs emissions from paint production were calculated by multiplying the amount of solvent treated in paint production by Japan’s own emission factors.
• Emission factors
Emission factors were established based on the Manual to control HC emissions (Air Quality Management Bureau, Ministry of the Environment, 1982).
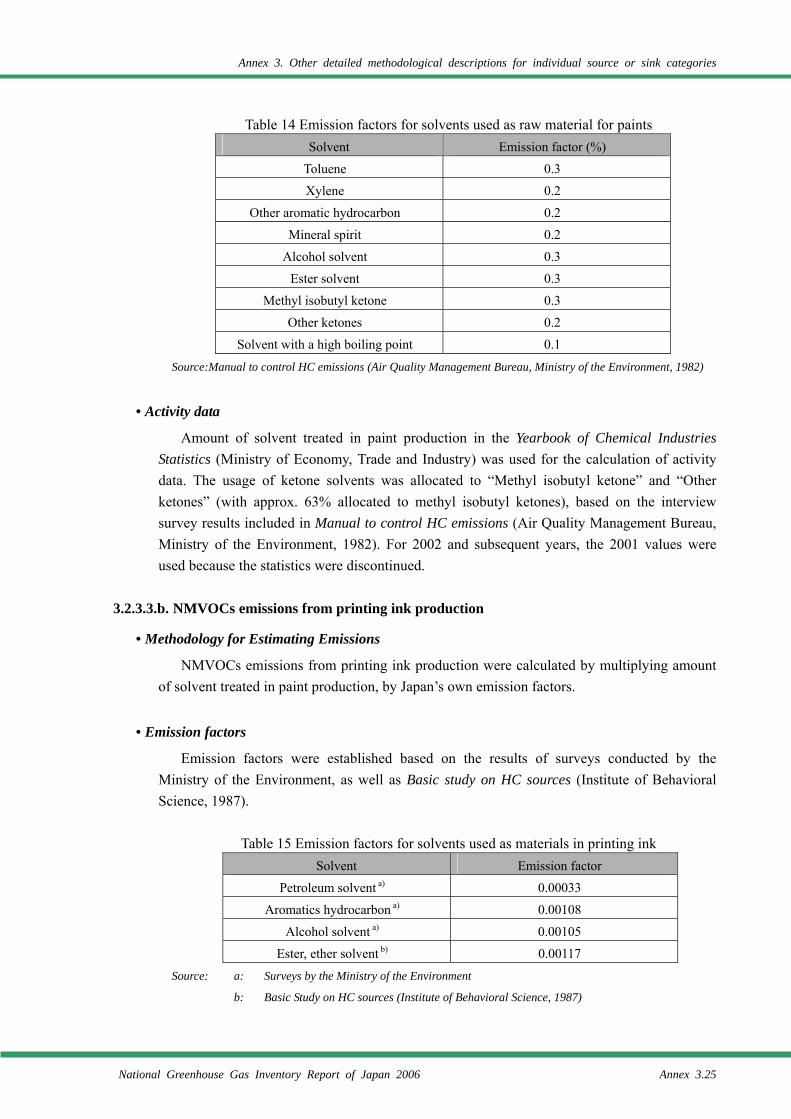
Annex 3. Other detailed methodological descriptions for individual source or sink categories
National Greenhouse Gas Inventory Report of Japan 2006 Annex 3.25
Table 14 Emission factors for solvents used as raw material for paints Solvent Emission factor (%)
Toluene 0.3
Xylene 0.2
Other aromatic hydrocarbon 0.2
Mineral spirit 0.2
Alcohol solvent 0.3
Ester solvent 0.3
Methyl isobutyl ketone 0.3
Other ketones 0.2
Solvent with a high boiling point 0.1
Source:Manual to control HC emissions (Air Quality Management Bureau, Ministry of the Environment, 1982)
• Activity data
Amount of solvent treated in paint production in the Yearbook of Chemical Industries Statistics (Ministry of Economy, Trade and Industry) was used for the calculation of activity data. The usage of ketone solvents was allocated to “Methyl isobutyl ketone” and “Other ketones” (with approx. 63% allocated to methyl isobutyl ketones), based on the interview survey results included in Manual to control HC emissions (Air Quality Management Bureau, Ministry of the Environment, 1982). For 2002 and subsequent years, the 2001 values were used because the statistics were discontinued.
3.2.3.3.b. NMVOCs emissions from printing ink production
• Methodology for Estimating Emissions
NMVOCs emissions from printing ink production were calculated by multiplying amount of solvent treated in paint production, by Japan’s own emission factors.
• Emission factors
Emission factors were established based on the results of surveys conducted by the Ministry of the Environment, as well as Basic study on HC sources (Institute of Behavioral Science, 1987).
Table 15 Emission factors for solvents used as materials in printing ink
Solvent Emission factor
Petroleum solvent a) 0.00033
Aromatics hydrocarbon a) 0.00108
Alcohol solvent a) 0.00105
Ester, ether solvent b) 0.00117
Source: a: Surveys by the Ministry of the Environment
b: Basic Study on HC sources (Institute of Behavioral Science, 1987)
Annex 3. Other detailed methodological descriptions for individual source or sink categories
Annex 3.26 National Greenhouse Gas Inventory Report of Japan 2006
• Activity data
Amount of solvent treated in paint production in the Yearbook of Chemical Industries Statistics (Ministry of Economy, Trade and Industry) were used for the calculation of activity data. For 2002 and subsequent years, the 2001 values were used because the statistics were discontinued.
3.2.3.3.c. NMVOCs emissions from printing ink solvent use
• Methodology for Estimating Emissions
NMVOCs emissions from printing ink solvent use were calculated by multiplying the 1983 figures for NMVOC emissions from printing ink solvent use by the ratio of 1983 and each year about shipment amount of solvent.
• Emission factor
Emission factors were established as “0.3”.
• Activity data
Shipment amount of solvent in the Yearbook of Chemical Industries Statistics (Ministry of Economy, Trade and Industry) were used for the calculation of activity data.
3.2.3.3.d. NMVOCs emissions from polyethylene laminate
• Methodology for Estimating Emissions
NMVOCs emissions from polyethylene laminate were calculated on the assumption that the yearly emissions equaled the 1983 emissions data provided in the Basic study on HC sources (Institute of Behavioral Science, 1987)
• Emission factor
No emission factors were established.
• Activity data
No activity data were calculated.
3.2.3.3.e. NMVOCs emissions from solvent-type adhesive use
• Methodology for Estimating Emissions
NMVOCs emissions from solvent-type adhesive use were assumed to equal the amount of solvents (xylene, toluene) used in adhesives.
• Emission factors
No emission factors were established as all the solvents used in adhesives were assumed to
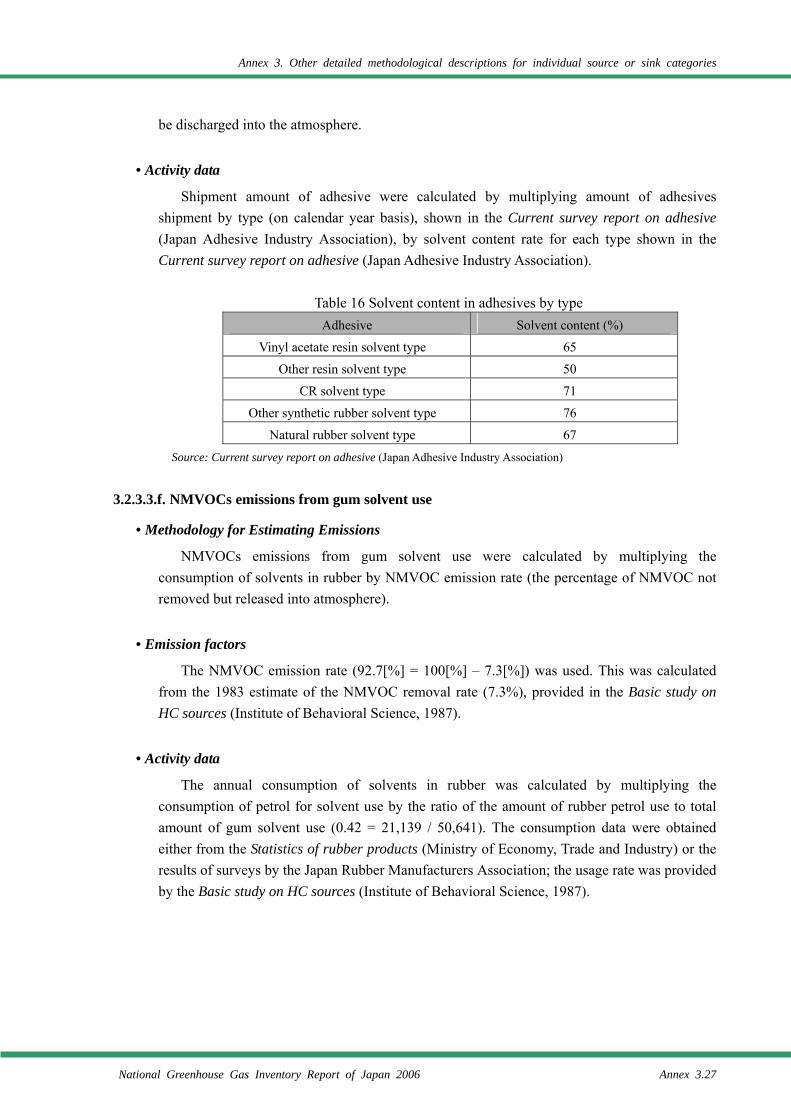
Annex 3. Other detailed methodological descriptions for individual source or sink categories
National Greenhouse Gas Inventory Report of Japan 2006 Annex 3.27
be discharged into the atmosphere.
• Activity data
Shipment amount of adhesive were calculated by multiplying amount of adhesives shipment by type (on calendar year basis), shown in the Current survey report on adhesive (Japan Adhesive Industry Association), by solvent content rate for each type shown in the Current survey report on adhesive (Japan Adhesive Industry Association).
Table 16 Solvent content in adhesives by type
Adhesive Solvent content (%)
Vinyl acetate resin solvent type 65
Other resin solvent type 50
CR solvent type 71
Other synthetic rubber solvent type 76
Natural rubber solvent type 67
Source: Current survey report on adhesive (Japan Adhesive Industry Association)
3.2.3.3.f. NMVOCs emissions from gum solvent use
• Methodology for Estimating Emissions
NMVOCs emissions from gum solvent use were calculated by multiplying the consumption of solvents in rubber by NMVOC emission rate (the percentage of NMVOC not removed but released into atmosphere).
• Emission factors
The NMVOC emission rate (92.7[%] = 100[%] – 7.3[%]) was used. This was calculated from the 1983 estimate of the NMVOC removal rate (7.3%), provided in the Basic study on HC sources (Institute of Behavioral Science, 1987).
• Activity data
The annual consumption of solvents in rubber was calculated by multiplying the consumption of petrol for solvent use by the ratio of the amount of rubber petrol use to total amount of gum solvent use (0.42 = 21,139 / 50,641). The consumption data were obtained either from the Statistics of rubber products (Ministry of Economy, Trade and Industry) or the results of surveys by the Japan Rubber Manufacturers Association; the usage rate was provided by the Basic study on HC sources (Institute of Behavioral Science, 1987).
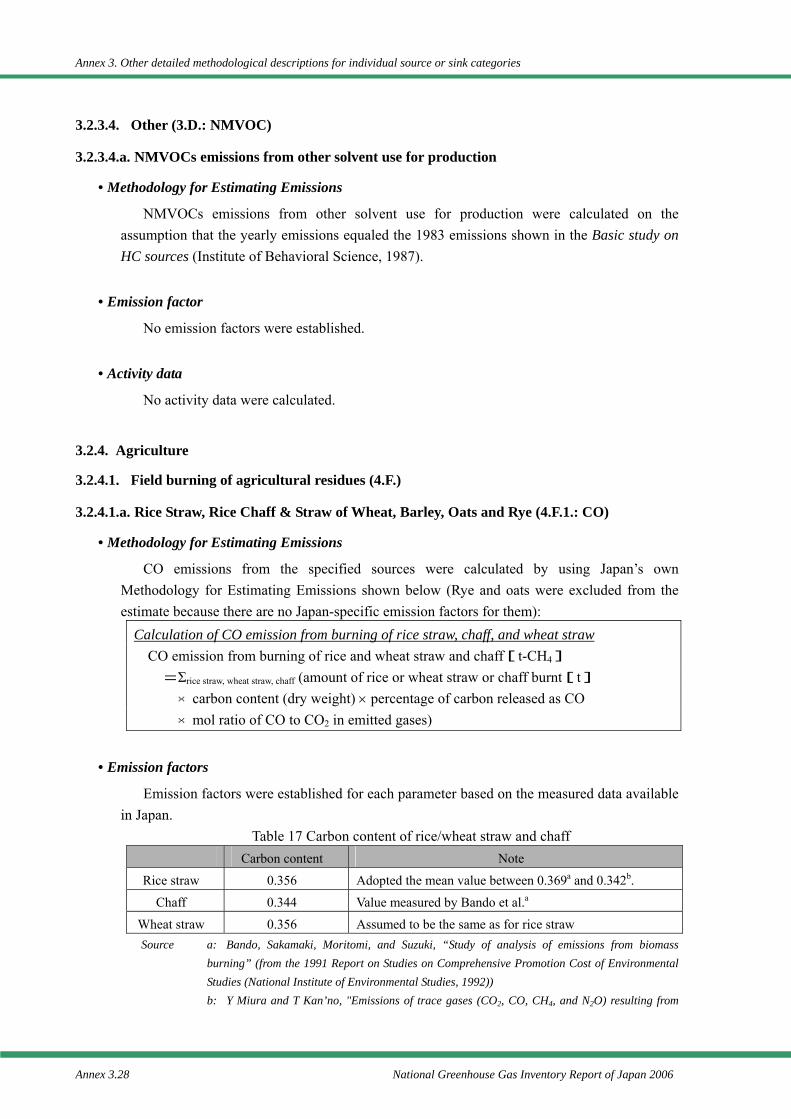
Annex 3. Other detailed methodological descriptions for individual source or sink categories
Annex 3.28 National Greenhouse Gas Inventory Report of Japan 2006
3.2.3.4. Other (3.D.: NMVOC)
3.2.3.4.a. NMVOCs emissions from other solvent use for production
• Methodology for Estimating Emissions
NMVOCs emissions from other solvent use for production were calculated on the assumption that the yearly emissions equaled the 1983 emissions shown in the Basic study on HC sources (Institute of Behavioral Science, 1987).
• Emission factor
No emission factors were established.
• Activity data
No activity data were calculated.
3.2.4. Agriculture
3.2.4.1. Field burning of agricultural residues (4.F.)
3.2.4.1.a. Rice Straw, Rice Chaff & Straw of Wheat, Barley, Oats and Rye (4.F.1.: CO)
• Methodology for Estimating Emissions
CO emissions from the specified sources were calculated by using Japan’s own Methodology for Estimating Emissions shown below (Rye and oats were excluded from the estimate because there are no Japan-specific emission factors for them):
Calculation of CO emission from burning of rice straw, chaff, and wheat straw CO emission from burning of rice and wheat straw and chaff[t-CH4]
=Σrice straw, wheat straw, chaff (amount of rice or wheat straw or chaff burnt[t] ×carbon content (dry weight) × percentage of carbon released as CO ×mol ratio of CO to CO2 in emitted gases)
• Emission factors
Emission factors were established for each parameter based on the measured data available in Japan.
Table 17 Carbon content of rice/wheat straw and chaff Carbon content Note
Rice straw 0.356 Adopted the mean value between 0.369a and 0.342b.
Chaff 0.344 Value measured by Bando et al.a
Wheat straw 0.356 Assumed to be the same as for rice straw Source a: Bando, Sakamaki, Moritomi, and Suzuki, “Study of analysis of emissions from biomass
burning” (from the 1991 Report on Studies on Comprehensive Promotion Cost of Environmental Studies (National Institute of Environmental Studies, 1992)) b: Y Miura and T Kan’no, "Emissions of trace gases (CO2, CO, CH4, and N2O) resulting from
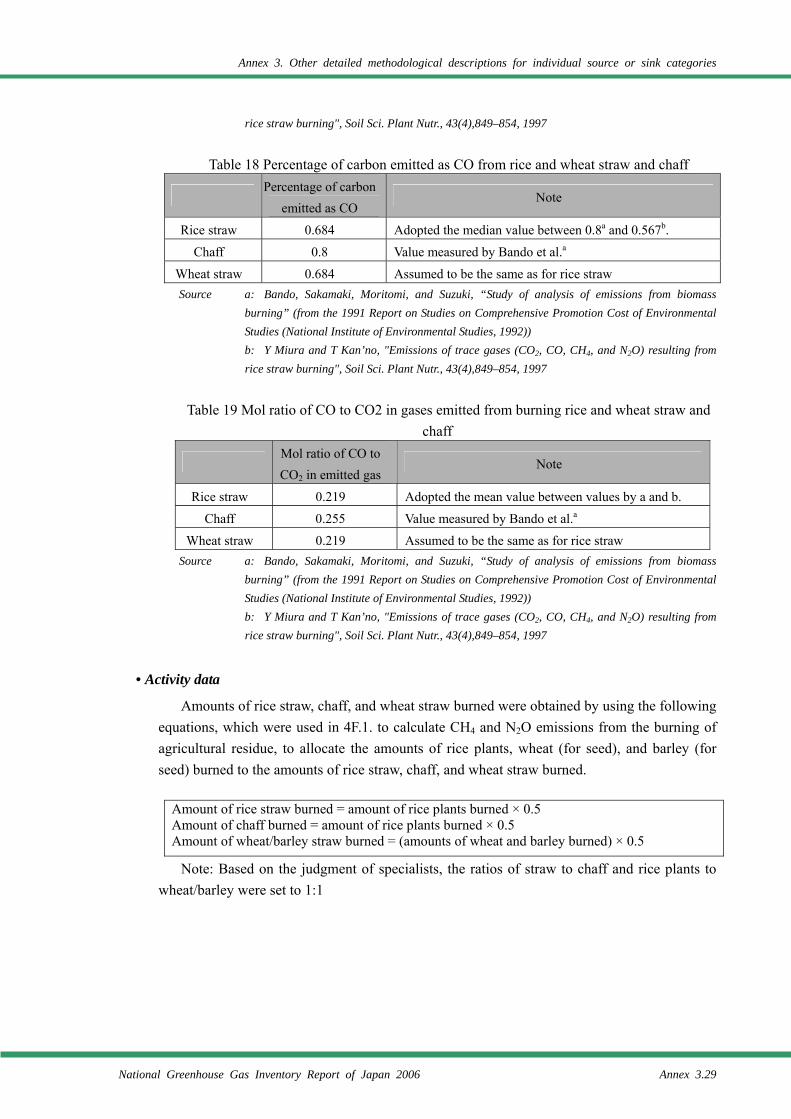
Annex 3. Other detailed methodological descriptions for individual source or sink categories
National Greenhouse Gas Inventory Report of Japan 2006 Annex 3.29
rice straw burning", Soil Sci. Plant Nutr., 43(4),849–854, 1997
Table 18 Percentage of carbon emitted as CO from rice and wheat straw and chaff
Percentage of carbon
emitted as CO Note
Rice straw 0.684 Adopted the median value between 0.8a and 0.567b.
Chaff 0.8 Value measured by Bando et al.a
Wheat straw 0.684 Assumed to be the same as for rice straw Source a: Bando, Sakamaki, Moritomi, and Suzuki, “Study of analysis of emissions from biomass
burning” (from the 1991 Report on Studies on Comprehensive Promotion Cost of Environmental Studies (National Institute of Environmental Studies, 1992)) b: Y Miura and T Kan’no, "Emissions of trace gases (CO2, CO, CH4, and N2O) resulting from rice straw burning", Soil Sci. Plant Nutr., 43(4),849–854, 1997
Table 19 Mol ratio of CO to CO2 in gases emitted from burning rice and wheat straw and
chaff
Mol ratio of CO to CO2 in emitted gas
Note
Rice straw 0.219 Adopted the mean value between values by a and b.
Chaff 0.255 Value measured by Bando et al.a
Wheat straw 0.219 Assumed to be the same as for rice straw Source a: Bando, Sakamaki, Moritomi, and Suzuki, “Study of analysis of emissions from biomass
burning” (from the 1991 Report on Studies on Comprehensive Promotion Cost of Environmental Studies (National Institute of Environmental Studies, 1992)) b: Y Miura and T Kan’no, "Emissions of trace gases (CO2, CO, CH4, and N2O) resulting from rice straw burning", Soil Sci. Plant Nutr., 43(4),849–854, 1997
• Activity data
Amounts of rice straw, chaff, and wheat straw burned were obtained by using the following equations, which were used in 4F.1. to calculate CH4 and N2O emissions from the burning of agricultural residue, to allocate the amounts of rice plants, wheat (for seed), and barley (for seed) burned to the amounts of rice straw, chaff, and wheat straw burned.
Amount of rice straw burned = amount of rice plants burned × 0.5 Amount of chaff burned = amount of rice plants burned × 0.5 Amount of wheat/barley straw burned = (amounts of wheat and barley burned) × 0.5
Note: Based on the judgment of specialists, the ratios of straw to chaff and rice plants to wheat/barley were set to 1:1
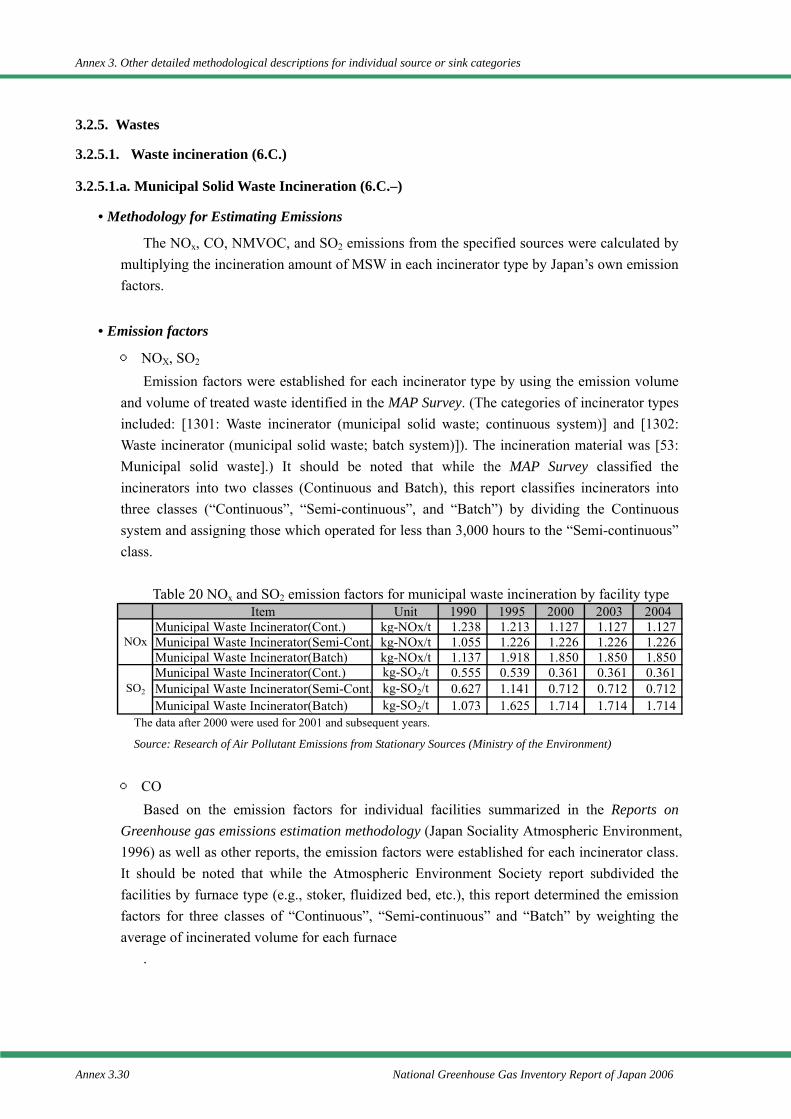
Annex 3. Other detailed methodological descriptions for individual source or sink categories
Annex 3.30 National Greenhouse Gas Inventory Report of Japan 2006
3.2.5. Wastes
3.2.5.1. Waste incineration (6.C.)
3.2.5.1.a. Municipal Solid Waste Incineration (6.C.–)
• Methodology for Estimating Emissions
The NOx, CO, NMVOC, and SO2 emissions from the specified sources were calculated by multiplying the incineration amount of MSW in each incinerator type by Japan’s own emission factors.
• Emission factors
○ NOX, SO2
Emission factors were established for each incinerator type by using the emission volume and volume of treated waste identified in the MAP Survey. (The categories of incinerator types included: [1301: Waste incinerator (municipal solid waste; continuous system)] and [1302: Waste incinerator (municipal solid waste; batch system)]). The incineration material was [53: Municipal solid waste].) It should be noted that while the MAP Survey classified the incinerators into two classes (Continuous and Batch), this report classifies incinerators into three classes (“Continuous”, “Semi-continuous”, and “Batch”) by dividing the Continuous system and assigning those which operated for less than 3,000 hours to the “Semi-continuous” class.
Table 20 NOx and SO2 emission factors for municipal waste incineration by facility type
The data after 2000 were used for 2001 and subsequent years.
Source: Research of Air Pollutant Emissions from Stationary Sources (Ministry of the Environment)
○ CO
Based on the emission factors for individual facilities summarized in the Reports on Greenhouse gas emissions estimation methodology (Japan Sociality Atmospheric Environment, 1996) as well as other reports, the emission factors were established for each incinerator class. It should be noted that while the Atmospheric Environment Society report subdivided the facilities by furnace type (e.g., stoker, fluidized bed, etc.), this report determined the emission factors for three classes of “Continuous”, “Semi-continuous” and “Batch” by weighting the average of incinerated volume for each furnace
.
Item Unit 1990 1995 2000 2003 2004Municipal Waste Incinerator(Cont.) kg-NOx/t 1.238 1.213 1.127 1.127 1.127
NOx Municipal Waste Incinerator(Semi-Cont. kg-NOx/t 1.055 1.226 1.226 1.226 1.226Municipal Waste Incinerator(Batch) kg-NOx/t 1.137 1.918 1.850 1.850 1.850Municipal Waste Incinerator(Cont.) kg-SO2/t 0.555 0.539 0.361 0.361 0.361
SO2 Municipal Waste Incinerator(Semi-Cont. kg-SO2/t 0.627 1.141 0.712 0.712 0.712Municipal Waste Incinerator(Batch) kg-SO2/t 1.073 1.625 1.714 1.714 1.714
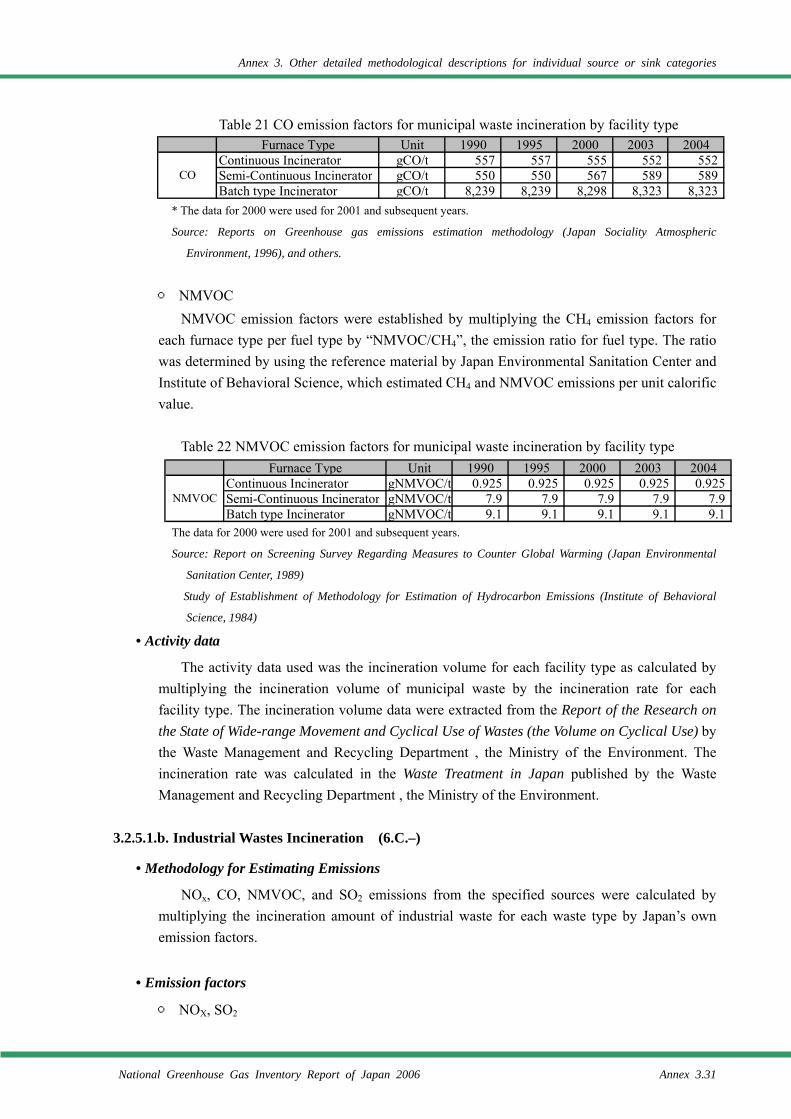
Annex 3. Other detailed methodological descriptions for individual source or sink categories
National Greenhouse Gas Inventory Report of Japan 2006 Annex 3.31
Table 21 CO emission factors for municipal waste incineration by facility type
* The data for 2000 were used for 2001 and subsequent years.
Source: Reports on Greenhouse gas emissions estimation methodology (Japan Sociality Atmospheric
Environment, 1996), and others.
○ NMVOC
NMVOC emission factors were established by multiplying the CH4 emission factors for each furnace type per fuel type by “NMVOC/CH4”, the emission ratio for fuel type. The ratio was determined by using the reference material by Japan Environmental Sanitation Center and Institute of Behavioral Science, which estimated CH4 and NMVOC emissions per unit calorific value.
Table 22 NMVOC emission factors for municipal waste incineration by facility type
The data for 2000 were used for 2001 and subsequent years.
Source: Report on Screening Survey Regarding Measures to Counter Global Warming (Japan Environmental
Sanitation Center, 1989)
Study of Establishment of Methodology for Estimation of Hydrocarbon Emissions (Institute of Behavioral
Science, 1984)
• Activity data
The activity data used was the incineration volume for each facility type as calculated by multiplying the incineration volume of municipal waste by the incineration rate for each facility type. The incineration volume data were extracted from the Report of the Research on the State of Wide-range Movement and Cyclical Use of Wastes (the Volume on Cyclical Use) by the Waste Management and Recycling Department , the Ministry of the Environment. The incineration rate was calculated in the Waste Treatment in Japan published by the Waste Management and Recycling Department , the Ministry of the Environment.
3.2.5.1.b. Industrial Wastes Incineration (6.C.–)
• Methodology for Estimating Emissions
NOx, CO, NMVOC, and SO2 emissions from the specified sources were calculated by multiplying the incineration amount of industrial waste for each waste type by Japan’s own emission factors.
• Emission factors
○ NOX, SO2
Furnace Type Unit 1990 1995 2000 2003 2004Continuous Incinerator gNMVOC/t 0.925 0.925 0.925 0.925 0.925
NMVOC Semi-Continuous Incinerator gNMVOC/t 7.9 7.9 7.9 7.9 7.9Batch type Incinerator gNMVOC/t 9.1 9.1 9.1 9.1 9.1
Furnace Type Unit 1990 1995 2000 2003 2004Continuous Incinerator gCO/t 557 557 555 552 552
CO Semi-Continuous Incinerator gCO/t 550 550 567 589 589Batch type Incinerator gCO/t 8,239 8,239 8,298 8,323 8,323
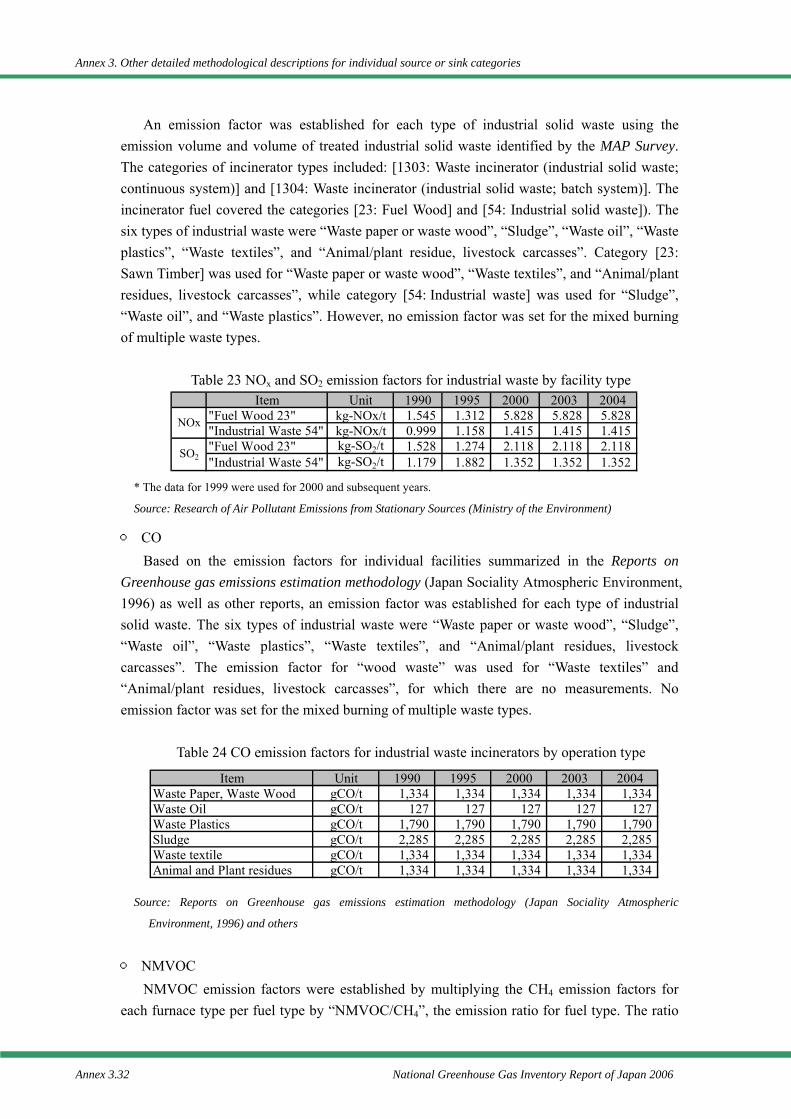
Annex 3. Other detailed methodological descriptions for individual source or sink categories
Annex 3.32 National Greenhouse Gas Inventory Report of Japan 2006
An emission factor was established for each type of industrial solid waste using the emission volume and volume of treated industrial solid waste identified by the MAP Survey. The categories of incinerator types included: [1303: Waste incinerator (industrial solid waste; continuous system)] and [1304: Waste incinerator (industrial solid waste; batch system)]. The incinerator fuel covered the categories [23: Fuel Wood] and [54: Industrial solid waste]). The six types of industrial waste were “Waste paper or waste wood”, “Sludge”, “Waste oil”, “Waste plastics”, “Waste textiles”, and “Animal/plant residue, livestock carcasses”. Category [23: Sawn Timber] was used for “Waste paper or waste wood”, “Waste textiles”, and “Animal/plant residues, livestock carcasses”, while category [54: Industrial waste] was used for “Sludge”, “Waste oil”, and “Waste plastics”. However, no emission factor was set for the mixed burning of multiple waste types.
Table 23 NOx and SO2 emission factors for industrial waste by facility type
* The data for 1999 were used for 2000 and subsequent years.
Source: Research of Air Pollutant Emissions from Stationary Sources (Ministry of the Environment)
○ CO Based on the emission factors for individual facilities summarized in the Reports on
Greenhouse gas emissions estimation methodology (Japan Sociality Atmospheric Environment, 1996) as well as other reports, an emission factor was established for each type of industrial solid waste. The six types of industrial waste were “Waste paper or waste wood”, “Sludge”, “Waste oil”, “Waste plastics”, “Waste textiles”, and “Animal/plant residues, livestock carcasses”. The emission factor for “wood waste” was used for “Waste textiles” and “Animal/plant residues, livestock carcasses”, for which there are no measurements. No emission factor was set for the mixed burning of multiple waste types.
Table 24 CO emission factors for industrial waste incinerators by operation type
Source: Reports on Greenhouse gas emissions estimation methodology (Japan Sociality Atmospheric
Environment, 1996) and others
○ NMVOC
NMVOC emission factors were established by multiplying the CH4 emission factors for each furnace type per fuel type by “NMVOC/CH4”, the emission ratio for fuel type. The ratio
Item Unit 1990 1995 2000 2003 2004Waste Paper, Waste Wood gCO/t 1,334 1,334 1,334 1,334 1,334Waste Oil gCO/t 127 127 127 127 127Waste Plastics gCO/t 1,790 1,790 1,790 1,790 1,790Sludge gCO/t 2,285 2,285 2,285 2,285 2,285Waste textile gCO/t 1,334 1,334 1,334 1,334 1,334Animal and Plant residues gCO/t 1,334 1,334 1,334 1,334 1,334
Item Unit 1990 1995 2000 2003 2004"Fuel Wood 23" kg-NOx/t 1.545 1.312 5.828 5.828 5.828"Industrial Waste 54" kg-NOx/t 0.999 1.158 1.415 1.415 1.415"Fuel Wood 23" kg-SO2/t 1.528 1.274 2.118 2.118 2.118"Industrial Waste 54" kg-SO2/t 1.179 1.882 1.352 1.352 1.352
NOx
SO2
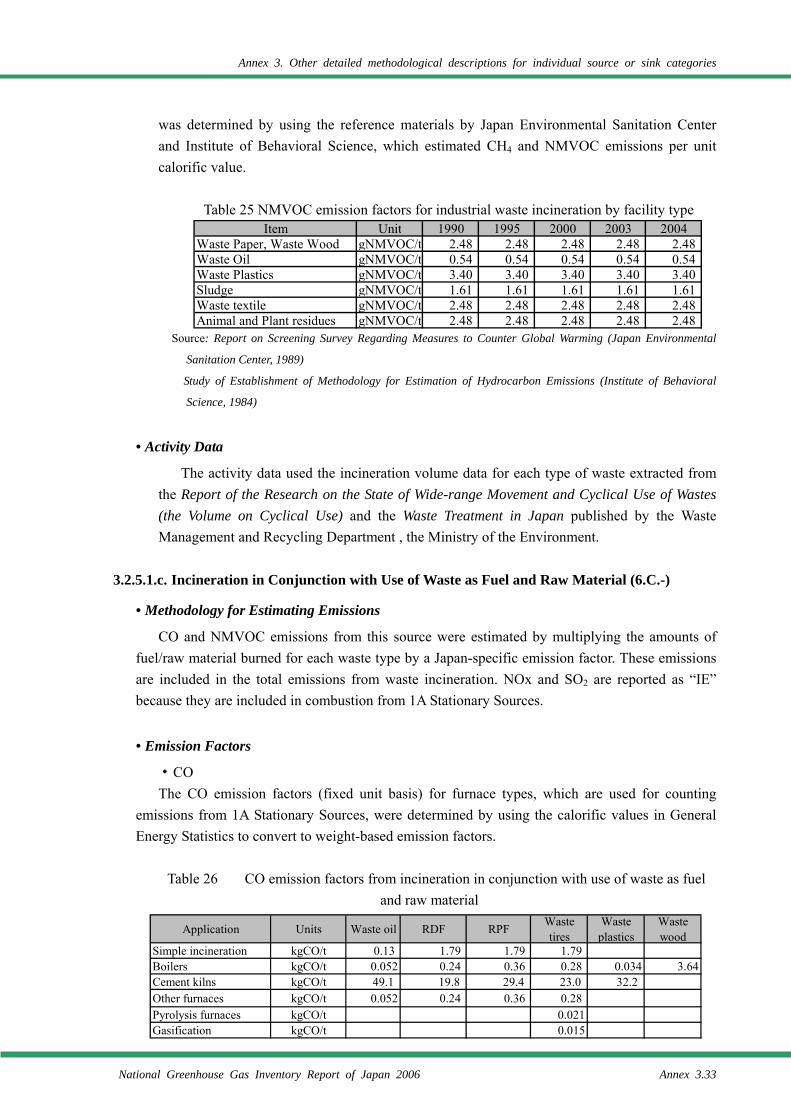
Annex 3. Other detailed methodological descriptions for individual source or sink categories
National Greenhouse Gas Inventory Report of Japan 2006 Annex 3.33
was determined by using the reference materials by Japan Environmental Sanitation Center and Institute of Behavioral Science, which estimated CH4 and NMVOC emissions per unit calorific value.
Table 25 NMVOC emission factors for industrial waste incineration by facility type
Source: Report on Screening Survey Regarding Measures to Counter Global Warming (Japan Environmental
Sanitation Center, 1989)
Study of Establishment of Methodology for Estimation of Hydrocarbon Emissions (Institute of Behavioral
Science, 1984)
• Activity Data
The activity data used the incineration volume data for each type of waste extracted from the Report of the Research on the State of Wide-range Movement and Cyclical Use of Wastes (the Volume on Cyclical Use) and the Waste Treatment in Japan published by the Waste Management and Recycling Department , the Ministry of the Environment.
3.2.5.1.c. Incineration in Conjunction with Use of Waste as Fuel and Raw Material (6.C.-)
• Methodology for Estimating Emissions
CO and NMVOC emissions from this source were estimated by multiplying the amounts of fuel/raw material burned for each waste type by a Japan-specific emission factor. These emissions are included in the total emissions from waste incineration. NOx and SO2 are reported as “IE” because they are included in combustion from 1A Stationary Sources.
• Emission Factors
・CO The CO emission factors (fixed unit basis) for furnace types, which are used for counting
emissions from 1A Stationary Sources, were determined by using the calorific values in General Energy Statistics to convert to weight-based emission factors.
Table 26 CO emission factors from incineration in conjunction with use of waste as fuel
and raw material
Item Unit 1990 1995 2000 2003 2004Waste Paper, Waste Wood gNMVOC/t 2.48 2.48 2.48 2.48 2.48Waste Oil gNMVOC/t 0.54 0.54 0.54 0.54 0.54Waste Plastics gNMVOC/t 3.40 3.40 3.40 3.40 3.40Sludge gNMVOC/t 1.61 1.61 1.61 1.61 1.61Waste textile gNMVOC/t 2.48 2.48 2.48 2.48 2.48Animal and Plant residues gNMVOC/t 2.48 2.48 2.48 2.48 2.48
Application Units Waste oil RDF RPF Wastetires
Wasteplastics
Wastewood
Simple incineration kgCO/t 0.13 1.79 1.79 1.79Boilers kgCO/t 0.052 0.24 0.36 0.28 0.034 3.64Cement kilns kgCO/t 49.1 19.8 29.4 23.0 32.2Other furnaces kgCO/t 0.052 0.24 0.36 0.28Pyrolysis furnaces kgCO/t 0.021Gasification kgCO/t 0.015
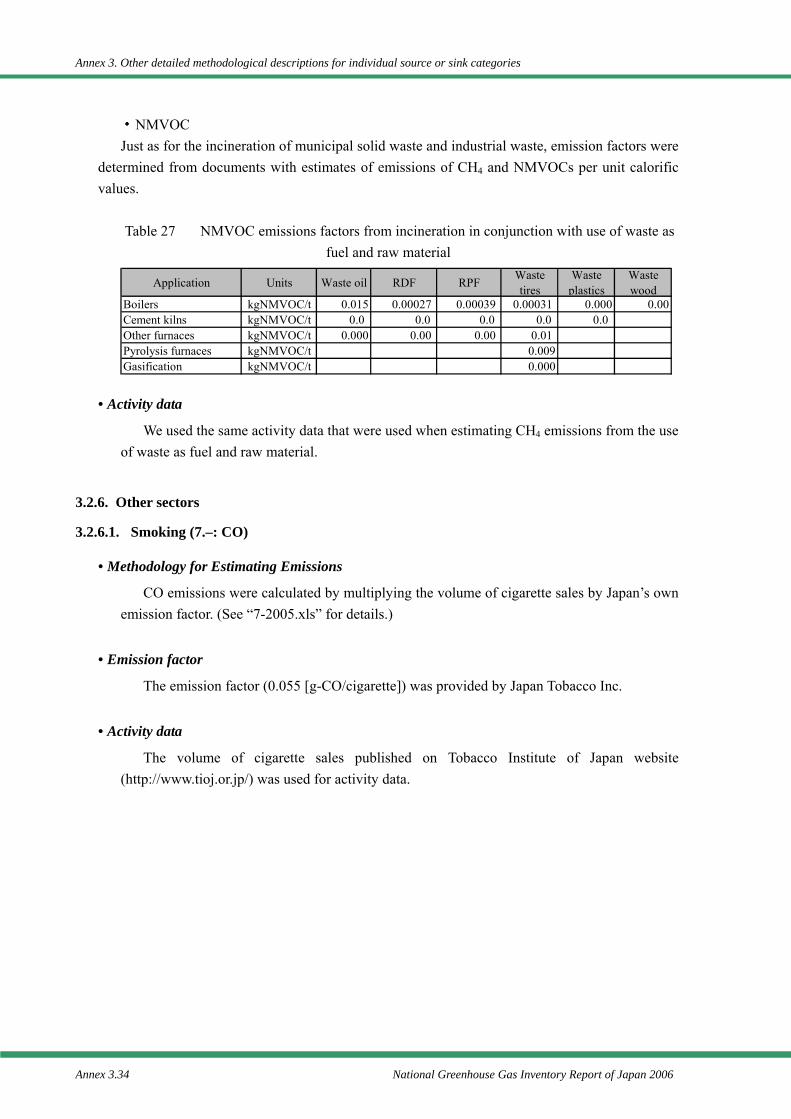
Annex 3. Other detailed methodological descriptions for individual source or sink categories
Annex 3.34 National Greenhouse Gas Inventory Report of Japan 2006
・NMVOC Just as for the incineration of municipal solid waste and industrial waste, emission factors were
determined from documents with estimates of emissions of CH4 and NMVOCs per unit calorific values.
Table 27 NMVOC emissions factors from incineration in conjunction with use of waste as
fuel and raw material
• Activity data
We used the same activity data that were used when estimating CH4 emissions from the use of waste as fuel and raw material.
3.2.6. Other sectors
3.2.6.1. Smoking (7.–: CO)
• Methodology for Estimating Emissions
CO emissions were calculated by multiplying the volume of cigarette sales by Japan’s own emission factor. (See “7-2005.xls” for details.)
• Emission factor
The emission factor (0.055 [g-CO/cigarette]) was provided by Japan Tobacco Inc.
• Activity data
The volume of cigarette sales published on Tobacco Institute of Japan website (http://www.tioj.or.jp/) was used for activity data.
Application Units Waste oil RDF RPF Wastetires
Wasteplastics
Wastewood
Boilers kgNMVOC/t 0.015 0.00027 0.00039 0.00031 0.000 0.00Cement kilns kgNMVOC/t 0.0 0.0 0.0 0.0 0.0Other furnaces kgNMVOC/t 0.000 0.00 0.00 0.01Pyrolysis furnaces kgNMVOC/t 0.009Gasification kgNMVOC/t 0.000
Annex 3. Other detailed methodological descriptions for individual source or sink categories
National Greenhouse Gas Inventory Report of Japan 2006 Annex 3.35
References IPCC, Revised 1996 IPCC Guidelines for National Greenhouse Gas Inventories, 1997 IPCC, Good Practice Guidance and Uncertainty Management in National Greenhouse Gas
Inventories, 2000 Agency for Natural Resources and Energy, General Energy Statistics Agency of Natural Resources and Energy, Study on the total system for prevention of HC-Vapor in
petroleum industries, 1975 Ministry of Agriculture, Forestry and Fisheries, Crop Statistics Ministry of Economy, Trade and Industry, Yearbook of Chemical Industries Statistics Ministry of Economy, Trade and Industry, Yearbook of Mineral Resources and Petroleum
Production Statistics Ministry of Economy, Trade and Industry, Yearbook of Production, Supply and Demand of
Petroleum, Coal, and Coke Ministry of Economy, Trade and Industry, Statistics of rubber products Ministry of Land, Infrastructure and Transport, Statistical Yearbook of Motor Vehicle Transport Ministry of Land and Transport, Statistical Yearbook of Air Transport Ministry of Land and Transport, The Survey on Transport Energy Ministry of the Environment, Research of Air Pollutant Emissions from Stationary Sources Ministry of the Environment, Air Quality Management Bureau, Manual to control HC emissions,
1982 Ministry of the Environment, Waste Management and Recycling Department , Report of the
Research on the State of Wide-range Movement and Cyclical Use of Wastes (the Volume on Cyclical Use)
Ministry of the Environment, Waste Management and Recycling Department , Waste Treatment in
Japan Institute of Behavioral Science, Basic Study on HC Sources, 1987 Institute of Behavioral Science, Report on the Survey of Measures for Stationary Sources of
Hydrocarbons, 1991 Institute of Behavioral Science, Study of Establishment of Methodology for Estimation of
Hydrocarbon Emissions, 1984 Japan Adhesive Industry Association, Current survey report on adhesive Japan Environmental Sanitation Center, Report on Screening Survey Regarding Measures to
Counter Global Warming, 1989 Japan Paint Manufacturers Association, Present condition and prospect about VOCs in Paint
Industry Japan Sociality Atmospheric Environment, Reports on Greenhouse gas emissions estimation
methodology, 1996 Tobacco Institute of Japan website (http://www.tioj.or.jp/)
Annex 3. Other detailed methodological descriptions for individual source or sink categories
Annex 3.36 National Greenhouse Gas Inventory Report of Japan 2006
Bando, Sakamaki, Moritomi, and Suzuki, “Study of analysis of emissions from biomass burning”, 1991 Report on Studies on Comprehensive Promotion Cost of Environmental Studies, National Institute of Environmental Studies, 1992
Yoshinori Miura and Tadanori Kanno, “Emissions of trace gases (CO2, CO, CH4, and N2O) resulting from rice straw burning”, Soil Sci. Plant Nutr. 43(4), pp849–854, 1997
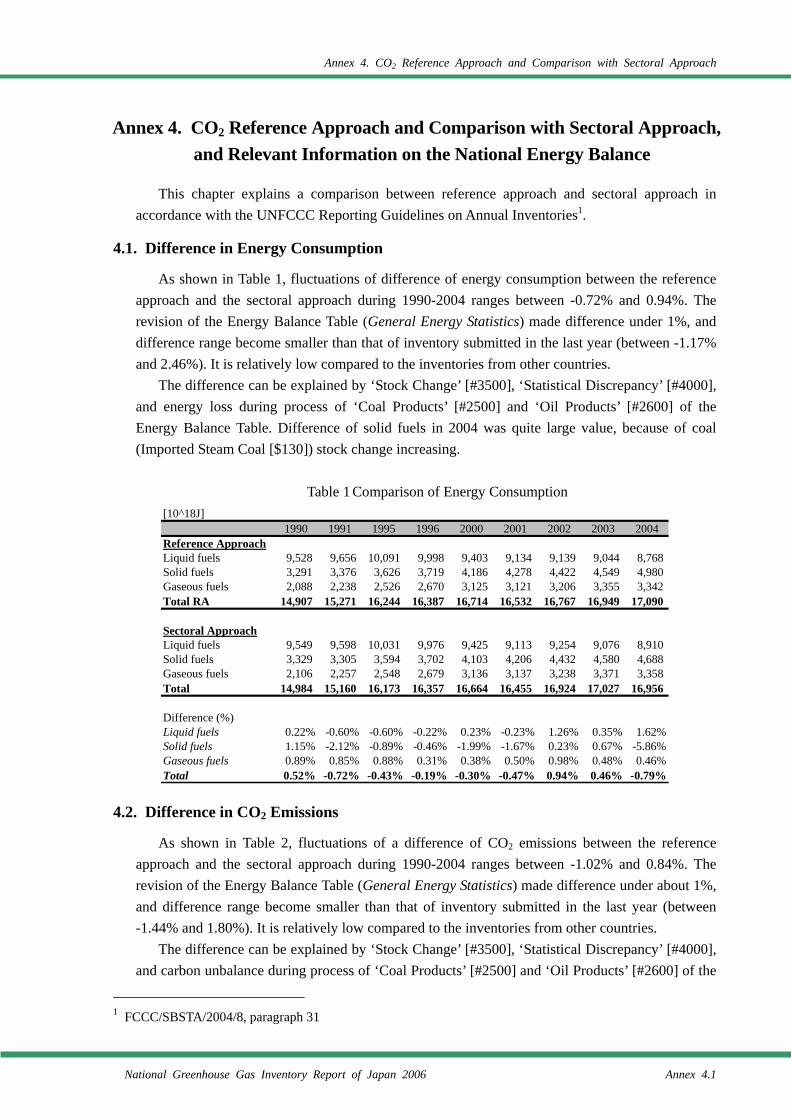
Annex 4. CO2 Reference Approach and Comparison with Sectoral Approach
National Greenhouse Gas Inventory Report of Japan 2006 Annex 4.1
Annex 4. CO2 Reference Approach and Comparison with Sectoral Approach, and Relevant Information on the National Energy Balance
This chapter explains a comparison between reference approach and sectoral approach in accordance with the UNFCCC Reporting Guidelines on Annual Inventories1.
4.1. Difference in Energy Consumption
As shown in Table 1, fluctuations of difference of energy consumption between the reference approach and the sectoral approach during 1990-2004 ranges between -0.72% and 0.94%. The revision of the Energy Balance Table (General Energy Statistics) made difference under 1%, and difference range become smaller than that of inventory submitted in the last year (between -1.17% and 2.46%). It is relatively low compared to the inventories from other countries.
The difference can be explained by ‘Stock Change’ [#3500], ‘Statistical Discrepancy’ [#4000], and energy loss during process of ‘Coal Products’ [#2500] and ‘Oil Products’ [#2600] of the Energy Balance Table. Difference of solid fuels in 2004 was quite large value, because of coal (Imported Steam Coal [$130]) stock change increasing.
Table 1 Comparison of Energy Consumption
[10^18J]1990 1991 1995 1996 2000 2001 2002 2003 2004
Reference ApproachLiquid fuels 9,528 9,656 10,091 9,998 9,403 9,134 9,139 9,044 8,768Solid fuels 3,291 3,376 3,626 3,719 4,186 4,278 4,422 4,549 4,980Gaseous fuels 2,088 2,238 2,526 2,670 3,125 3,121 3,206 3,355 3,342Total RA 14,907 15,271 16,244 16,387 16,714 16,532 16,767 16,949 17,090
Sectoral ApproachLiquid fuels 9,549 9,598 10,031 9,976 9,425 9,113 9,254 9,076 8,910Solid fuels 3,329 3,305 3,594 3,702 4,103 4,206 4,432 4,580 4,688Gaseous fuels 2,106 2,257 2,548 2,679 3,136 3,137 3,238 3,371 3,358Total 14,984 15,160 16,173 16,357 16,664 16,455 16,924 17,027 16,956
Difference (%)Liquid fuels 0.22% -0.60% -0.60% -0.22% 0.23% -0.23% 1.26% 0.35% 1.62%Solid fuels 1.15% -2.12% -0.89% -0.46% -1.99% -1.67% 0.23% 0.67% -5.86%Gaseous fuels 0.89% 0.85% 0.88% 0.31% 0.38% 0.50% 0.98% 0.48% 0.46%Total 0.52% -0.72% -0.43% -0.19% -0.30% -0.47% 0.94% 0.46% -0.79%
4.2. Difference in CO2 Emissions
As shown in Table 2, fluctuations of a difference of CO2 emissions between the reference approach and the sectoral approach during 1990-2004 ranges between -1.02% and 0.84%. The revision of the Energy Balance Table (General Energy Statistics) made difference under about 1%, and difference range become smaller than that of inventory submitted in the last year (between -1.44% and 1.80%). It is relatively low compared to the inventories from other countries.
The difference can be explained by ‘Stock Change’ [#3500], ‘Statistical Discrepancy’ [#4000], and carbon unbalance during process of ‘Coal Products’ [#2500] and ‘Oil Products’ [#2600] of the
1 FCCC/SBSTA/2004/8, paragraph 31
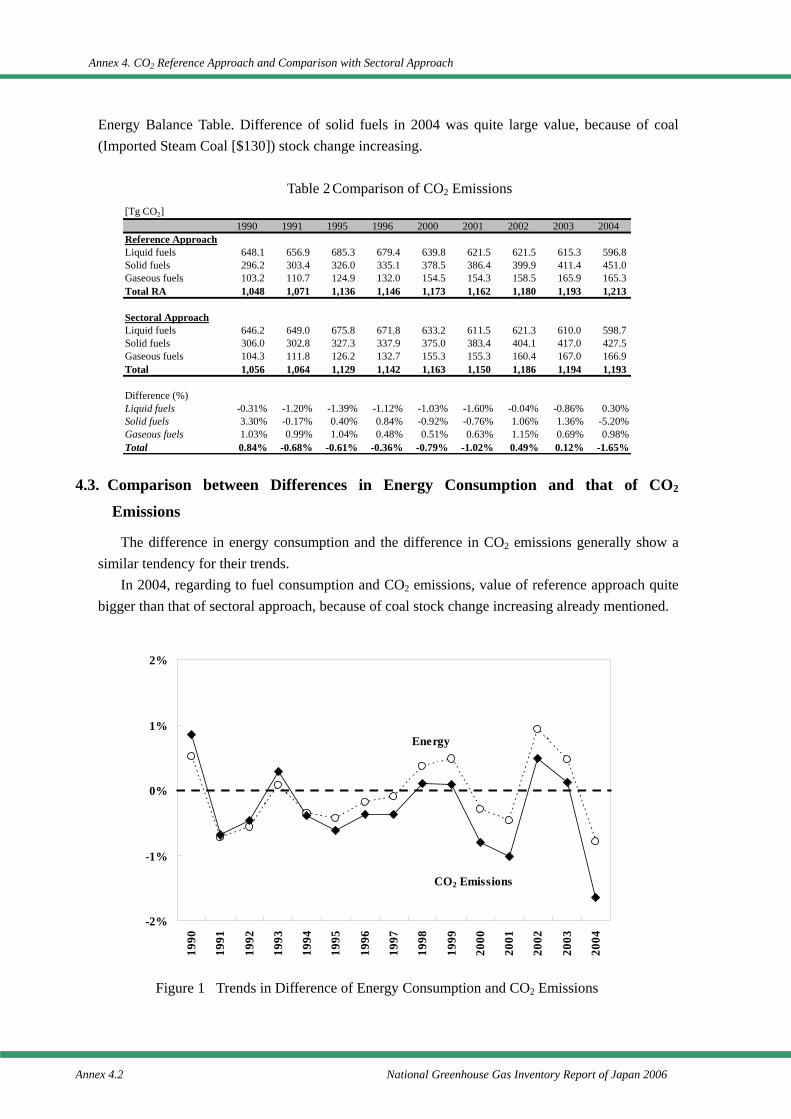
Annex 4. CO2 Reference Approach and Comparison with Sectoral Approach
Annex 4.2 National Greenhouse Gas Inventory Report of Japan 2006
Energy Balance Table. Difference of solid fuels in 2004 was quite large value, because of coal (Imported Steam Coal [$130]) stock change increasing.
Table 2 Comparison of CO2 Emissions
[Tg CO2]1990 1991 1995 1996 2000 2001 2002 2003 2004
Reference ApproachLiquid fuels 648.1 656.9 685.3 679.4 639.8 621.5 621.5 615.3 596.8Solid fuels 296.2 303.4 326.0 335.1 378.5 386.4 399.9 411.4 451.0Gaseous fuels 103.2 110.7 124.9 132.0 154.5 154.3 158.5 165.9 165.3Total RA 1,048 1,071 1,136 1,146 1,173 1,162 1,180 1,193 1,213
Sectoral ApproachLiquid fuels 646.2 649.0 675.8 671.8 633.2 611.5 621.3 610.0 598.7Solid fuels 306.0 302.8 327.3 337.9 375.0 383.4 404.1 417.0 427.5Gaseous fuels 104.3 111.8 126.2 132.7 155.3 155.3 160.4 167.0 166.9Total 1,056 1,064 1,129 1,142 1,163 1,150 1,186 1,194 1,193
Difference (%)Liquid fuels -0.31% -1.20% -1.39% -1.12% -1.03% -1.60% -0.04% -0.86% 0.30%Solid fuels 3.30% -0.17% 0.40% 0.84% -0.92% -0.76% 1.06% 1.36% -5.20%Gaseous fuels 1.03% 0.99% 1.04% 0.48% 0.51% 0.63% 1.15% 0.69% 0.98%Total 0.84% -0.68% -0.61% -0.36% -0.79% -1.02% 0.49% 0.12% -1.65%
4.3. Comparison between Differences in Energy Consumption and that of CO2
Emissions
The difference in energy consumption and the difference in CO2 emissions generally show a similar tendency for their trends.
In 2004, regarding to fuel consumption and CO2 emissions, value of reference approach quite bigger than that of sectoral approach, because of coal stock change increasing already mentioned.
-2%
-1%
0%
1%
2%
1990
1991
1992
1993
1994
1995
1996
1997
1998
1999
2000
2001
2002
2003
2004
Energy
CO2 Emissions
Figure 1 Trends in Difference of Energy Consumption and CO2 Emissions
Annex 5. Assessment of Completeness
National Greenhouse Gas Inventory Report of Japan 2006 Annex 5.1
Annex 5. Assessment of Completeness and (Potential) Sources and Sinks of Greenhouse Gas Emissions and Removals Excluded
5.1. Assessment of Completeness
Current inventory is submitted in accordance with the common reporting format (CRF), which requires entering emission data or a notation key1 such as “NO”, “NE”, or “NA” for all sources. This chapter presents the definition of notation keys and decision trees for the application of them, both of which are based on the UNFCCC reporting Guidelines (FCCC/CP/1999/7 or FCCC/CP/2002/8) and the results of Committee for Greenhouse Gases Emissions Estimation Methods in 2002.
This chapter also reports source categories which have not been estimated because i) applicability of IPCC default values is not assured, ii) default methodologies and default values are not provided, iii) activity data is not available, iv) actual condition of GHG emissions or removals is not understood clearly.
5.2. Definition of Notation Keys
When reviewing the appropriateness of applying notation keys shown in the UNFCCC reporting guideline, it is necessary to establish a common concept for an application of these keys for each sector, but unclear points described in Table 1 are found as below regarding the use of the notation keys.
The explanation of “NO” in the UNFCCC reporting guidelines can be taken that “NO” may
be applied to both situations when there are no emissions or removals because the activities do not exist in Japan, and when emissions or removals do not occur in principle although the activities do exist.
The first sentence of the “NA” explanation in the UNFCCC reporting guidelines seems to
imply that “NA” may be applied to both situations as for “NO”. However, because the second sentence states that “If categories... are shaded, they do not need to be filled in”, it also seems to mean that “NA” is applied only when the activities exist but there are no emissions or removals in principle.
1 These were called "standard indicators" in FCCC/CP/1999/7, but were changed to "notation keys" in
FCCC/CP/2002/8.
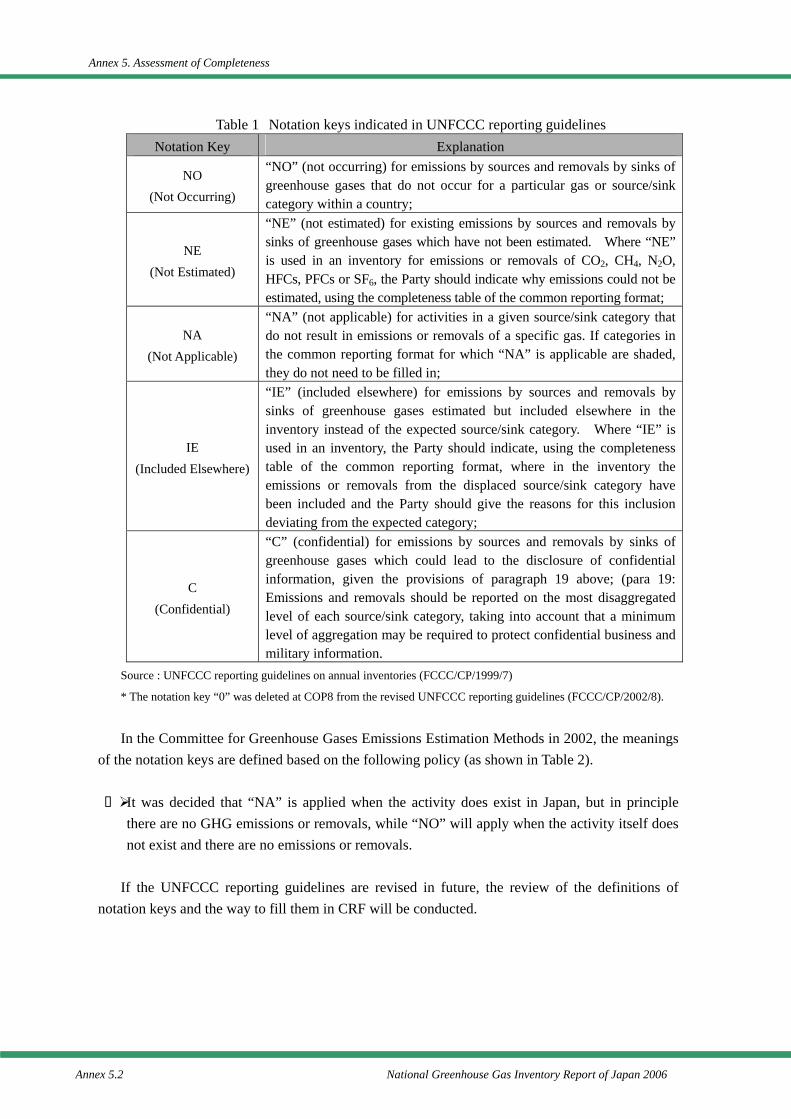
Annex 5. Assessment of Completeness
Annex 5.2 National Greenhouse Gas Inventory Report of Japan 2006
Table 1 Notation keys indicated in UNFCCC reporting guidelines Notation Key Explanation
NO (Not Occurring)
“NO” (not occurring) for emissions by sources and removals by sinks of greenhouse gases that do not occur for a particular gas or source/sink category within a country;
NE (Not Estimated)
“NE” (not estimated) for existing emissions by sources and removals by sinks of greenhouse gases which have not been estimated. Where “NE” is used in an inventory for emissions or removals of CO2, CH4, N2O, HFCs, PFCs or SF6, the Party should indicate why emissions could not be estimated, using the completeness table of the common reporting format;
NA (Not Applicable)
“NA” (not applicable) for activities in a given source/sink category that do not result in emissions or removals of a specific gas. If categories in the common reporting format for which “NA” is applicable are shaded, they do not need to be filled in;
IE (Included Elsewhere)
“IE” (included elsewhere) for emissions by sources and removals by sinks of greenhouse gases estimated but included elsewhere in the inventory instead of the expected source/sink category. Where “IE” is used in an inventory, the Party should indicate, using the completeness table of the common reporting format, where in the inventory the emissions or removals from the displaced source/sink category have been included and the Party should give the reasons for this inclusion deviating from the expected category;
C (Confidential)
“C” (confidential) for emissions by sources and removals by sinks of greenhouse gases which could lead to the disclosure of confidential information, given the provisions of paragraph 19 above; (para 19: Emissions and removals should be reported on the most disaggregated level of each source/sink category, taking into account that a minimum level of aggregation may be required to protect confidential business and military information.
Source : UNFCCC reporting guidelines on annual inventories (FCCC/CP/1999/7)
* The notation key “0” was deleted at COP8 from the revised UNFCCC reporting guidelines (FCCC/CP/2002/8).
In the Committee for Greenhouse Gases Emissions Estimation Methods in 2002, the meanings
of the notation keys are defined based on the following policy (as shown in Table 2).
It was decided that “NA” is applied when the activity does exist in Japan, but in principle there are no GHG emissions or removals, while “NO” will apply when the activity itself does not exist and there are no emissions or removals.
If the UNFCCC reporting guidelines are revised in future, the review of the definitions of
notation keys and the way to fill them in CRF will be conducted.
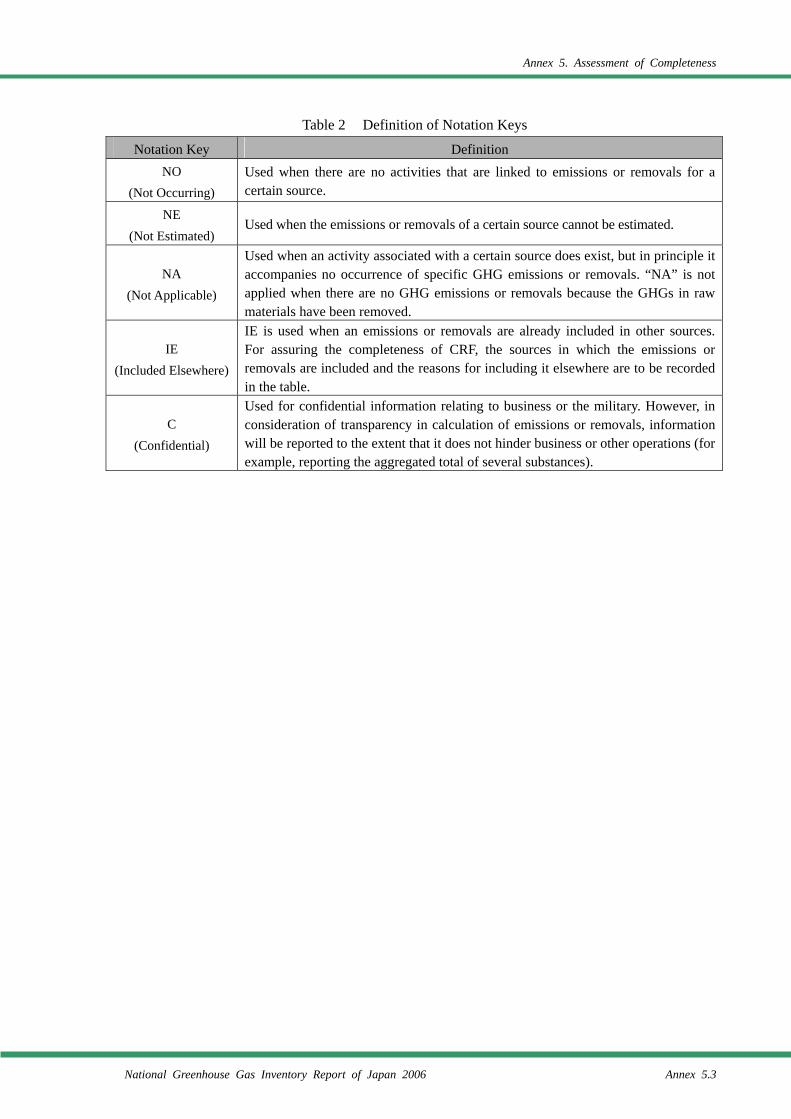
Annex 5. Assessment of Completeness
National Greenhouse Gas Inventory Report of Japan 2006 Annex 5.3
Table 2 Definition of Notation Keys
Notation Key Definition NO
(Not Occurring) Used when there are no activities that are linked to emissions or removals for a certain source.
NE (Not Estimated)
Used when the emissions or removals of a certain source cannot be estimated.
NA (Not Applicable)
Used when an activity associated with a certain source does exist, but in principle it accompanies no occurrence of specific GHG emissions or removals. “NA” is not applied when there are no GHG emissions or removals because the GHGs in raw materials have been removed.
IE (Included Elsewhere)
IE is used when an emissions or removals are already included in other sources.For assuring the completeness of CRF, the sources in which the emissions or removals are included and the reasons for including it elsewhere are to be recorded in the table.
C (Confidential)
Used for confidential information relating to business or the military. However, in consideration of transparency in calculation of emissions or removals, information will be reported to the extent that it does not hinder business or other operations (for example, reporting the aggregated total of several substances).
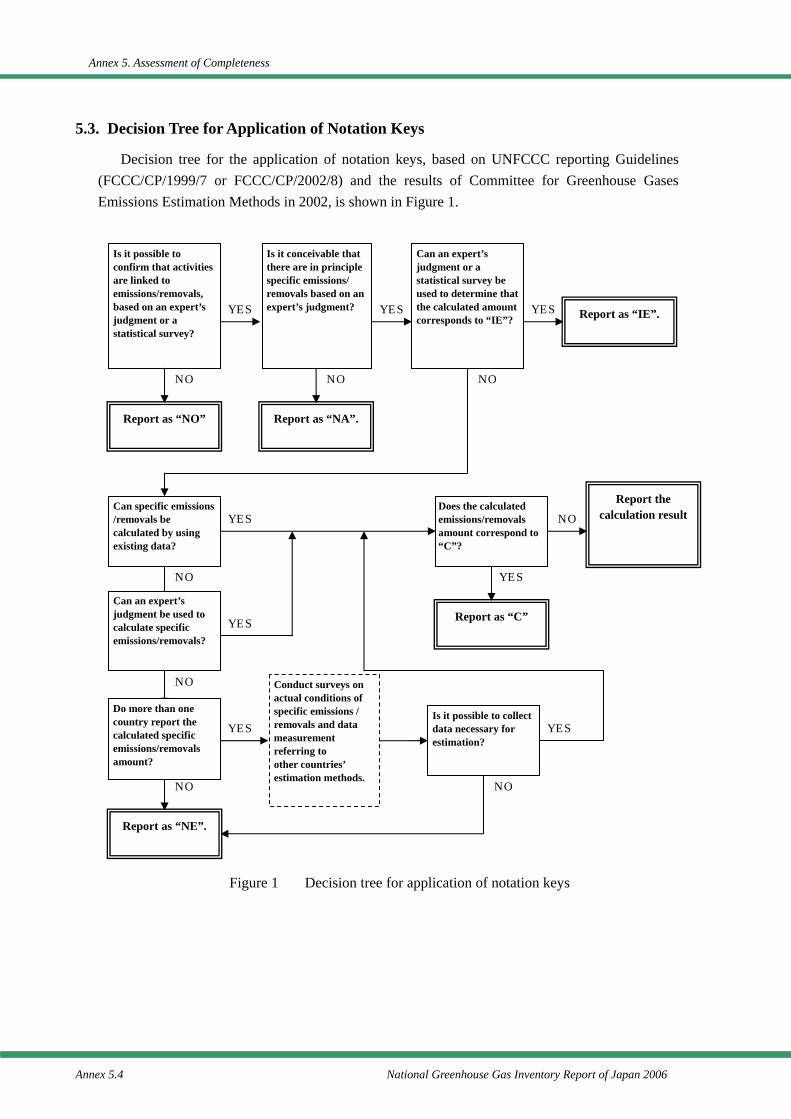
Annex 5. Assessment of Completeness
Annex 5.4 National Greenhouse Gas Inventory Report of Japan 2006
5.3. Decision Tree for Application of Notation Keys
Decision tree for the application of notation keys, based on UNFCCC reporting Guidelines (FCCC/CP/1999/7 or FCCC/CP/2002/8) and the results of Committee for Greenhouse Gases Emissions Estimation Methods in 2002, is shown in Figure 1.
Figure 1 Decision tree for application of notation keys
Does the calculated emissions/removals amount correspond to “C”?
YES
NO
Is it possible to confirm that activities are linked to emissions/removals, based on an expert’s judgment or a statistical survey?
NO
Report as “NO”
Is it conceivable that there are in principle specific emissions/ removals based on an expert’s judgment? YES
NO
Report as “NA”.
Can specific emissions /removals be calculated by using existing data?
Report the calculation result
NO
YES
Can an expert’s judgment or a statistical survey be used to determine that the calculated amount corresponds to “IE”? Report as “IE”.
Report as “C”
YES
YES
Can an expert’s judgment be used to calculate specific emissions/removals?
NO
YES
NO
Is it possible to collect data necessary for estimation?
YES
NO NO
Report as “NE”.
YES
Conduct surveys on actual conditions of specific emissions / removals and data measurement referring to other countries’ estimation methods.
Do more than one country report the calculated specific emissions/removals amount?
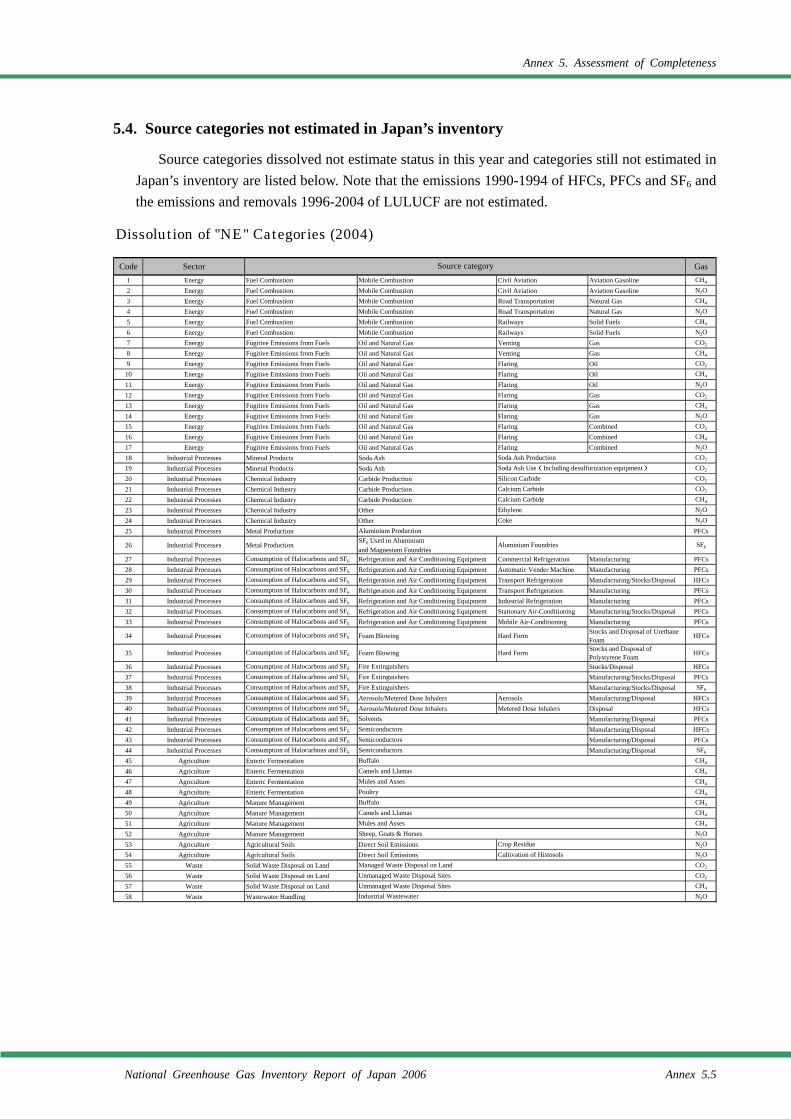
Annex 5. Assessment of Completeness
National Greenhouse Gas Inventory Report of Japan 2006 Annex 5.5
5.4. Source categories not estimated in Japan’s inventory
Source categories dissolved not estimate status in this year and categories still not estimated in Japan’s inventory are listed below. Note that the emissions 1990-1994 of HFCs, PFCs and SF6 and the emissions and removals 1996-2004 of LULUCF are not estimated.
Dissolution of "NE" Categories (2004)
Code Sector Gas1 Energy Fuel Combustion Mobile Combustion Civil Aviation Aviation Gasoline CH4
2 Energy Fuel Combustion Mobile Combustion Civil Aviation Aviation Gasoline N2O3 Energy Fuel Combustion Mobile Combustion Road Transportation Natural Gas CH4
4 Energy Fuel Combustion Mobile Combustion Road Transportation Natural Gas N2O5 Energy Fuel Combustion Mobile Combustion Railways Solid Fuels CH4
6 Energy Fuel Combustion Mobile Combustion Railways Solid Fuels N2O7 Energy Fugitive Emissions from Fuels Oil and Natural Gas Venting Gas CO2
8 Energy Fugitive Emissions from Fuels Oil and Natural Gas Venting Gas CH4
9 Energy Fugitive Emissions from Fuels Oil and Natural Gas Flaring Oil CO2
10 Energy Fugitive Emissions from Fuels Oil and Natural Gas Flaring Oil CH4
11 Energy Fugitive Emissions from Fuels Oil and Natural Gas Flaring Oil N2O12 Energy Fugitive Emissions from Fuels Oil and Natural Gas Flaring Gas CO2
13 Energy Fugitive Emissions from Fuels Oil and Natural Gas Flaring Gas CH4
14 Energy Fugitive Emissions from Fuels Oil and Natural Gas Flaring Gas N2O15 Energy Fugitive Emissions from Fuels Oil and Natural Gas Flaring Combined CO2
16 Energy Fugitive Emissions from Fuels Oil and Natural Gas Flaring Combined CH4
17 Energy Fugitive Emissions from Fuels Oil and Natural Gas Flaring Combined N2O18 Industrial Processes Mineral Products Soda Ash CO2
19 Industrial Processes Mineral Products Soda Ash CO2
20 Industrial Processes Chemical Industry Carbide Production CO2
21 Industrial Processes Chemical Industry Carbide Production CO2
22 Industrial Processes Chemical Industry Carbide Production CH4
23 Industrial Processes Chemical Industry Other N2O24 Industrial Processes Chemical Industry Other N2O25 Industrial Processes Metal Production PFCs
26 Industrial Processes Metal ProductionSF6 Used in Aluminiumand Magnesium Foundries
SF6
27 Industrial Processes Consumption of Halocarbons and SF6 Refrigeration and Air Conditioning Equipment Commercial Refrigeration Manufacturing PFCs28 Industrial Processes Consumption of Halocarbons and SF6 Refrigeration and Air Conditioning Equipment Automatic Vender Machine Manufacturing PFCs29 Industrial Processes Consumption of Halocarbons and SF6 Refrigeration and Air Conditioning Equipment Transport Refrigeration Manufacturing/Stocks/Disposal HFCs30 Industrial Processes Consumption of Halocarbons and SF6 Refrigeration and Air Conditioning Equipment Transport Refrigeration Manufacturing PFCs31 Industrial Processes Consumption of Halocarbons and SF6 Refrigeration and Air Conditioning Equipment Industrial Refrigeration Manufacturing PFCs32 Industrial Processes Consumption of Halocarbons and SF6 Refrigeration and Air Conditioning Equipment Stationary Air-Conditioning Manufacturing/Stocks/Disposal PFCs33 Industrial Processes Consumption of Halocarbons and SF6 Refrigeration and Air Conditioning Equipment Mobile Air-Conditioning Manufacturing PFCs
34 Industrial Processes Consumption of Halocarbons and SF6 Foam Blowing Hard Form Stocks and Disposal of UrethaneFoam HFCs
35 Industrial Processes Consumption of Halocarbons and SF6 Foam Blowing Hard Form Stocks and Disposal ofPolystyrene Foam HFCs
36 Industrial Processes Consumption of Halocarbons and SF6 Stocks/Disposal HFCs37 Industrial Processes Consumption of Halocarbons and SF6 Manufacturing/Stocks/Disposal PFCs38 Industrial Processes Consumption of Halocarbons and SF6 Manufacturing/Stocks/Disposal SF6
39 Industrial Processes Consumption of Halocarbons and SF6 Aerosols/Metered Dose Inhalers Aerosols Manufacturing/Disposal HFCs40 Industrial Processes Consumption of Halocarbons and SF6 Aerosols/Metered Dose Inhalers Metered Dose Inhalers Disposal HFCs41 Industrial Processes Consumption of Halocarbons and SF6 Manufacturing/Disposal PFCs42 Industrial Processes Consumption of Halocarbons and SF6 Manufacturing/Disposal HFCs43 Industrial Processes Consumption of Halocarbons and SF6 Manufacturing/Disposal PFCs44 Industrial Processes Consumption of Halocarbons and SF6 Manufacturing/Disposal SF6
45 Agriculture Enteric Fermentation CH4
46 Agriculture Enteric Fermentation CH4
47 Agriculture Enteric Fermentation CH4
48 Agriculture Enteric Fermentation CH4
49 Agriculture Manure Management CH4
50 Agriculture Manure Management CH4
51 Agriculture Manure Management CH4
52 Agriculture Manure Management N2O53 Agriculture Agricultural Soils Direct Soil Emissions N2O54 Agriculture Agricultural Soils Direct Soil Emissions N2O55 Waste Solid Waste Disposal on Land CO2
56 Waste Solid Waste Disposal on Land CO2
57 Waste Solid Waste Disposal on Land CH4
58 Waste Wastewater Handling N2O
Sheep, Goats & HorsesCrop ResidueCultivation of Histosols
Industrial Wastewater
Managed Waste Disposal on LandUnmanaged Waste Disposal SitesUnmanaged Waste Disposal Sites
PoultryBuffaloCamels and LlamasMules and Asses
SemiconductorsBuffaloCamels and LlamasMules and Asses
Fire Extinguishers
SolventsSemiconductorsSemiconductors
Aluminium Production
Aluminium Foundries
Fire ExtinguishersFire Extinguishers
Calcium CarbideCalcium CarbideEthyleneCoke
Source category
Soda Ash ProductionSoda Ash Use(Including desulfurization equipment)Silicon Carbide
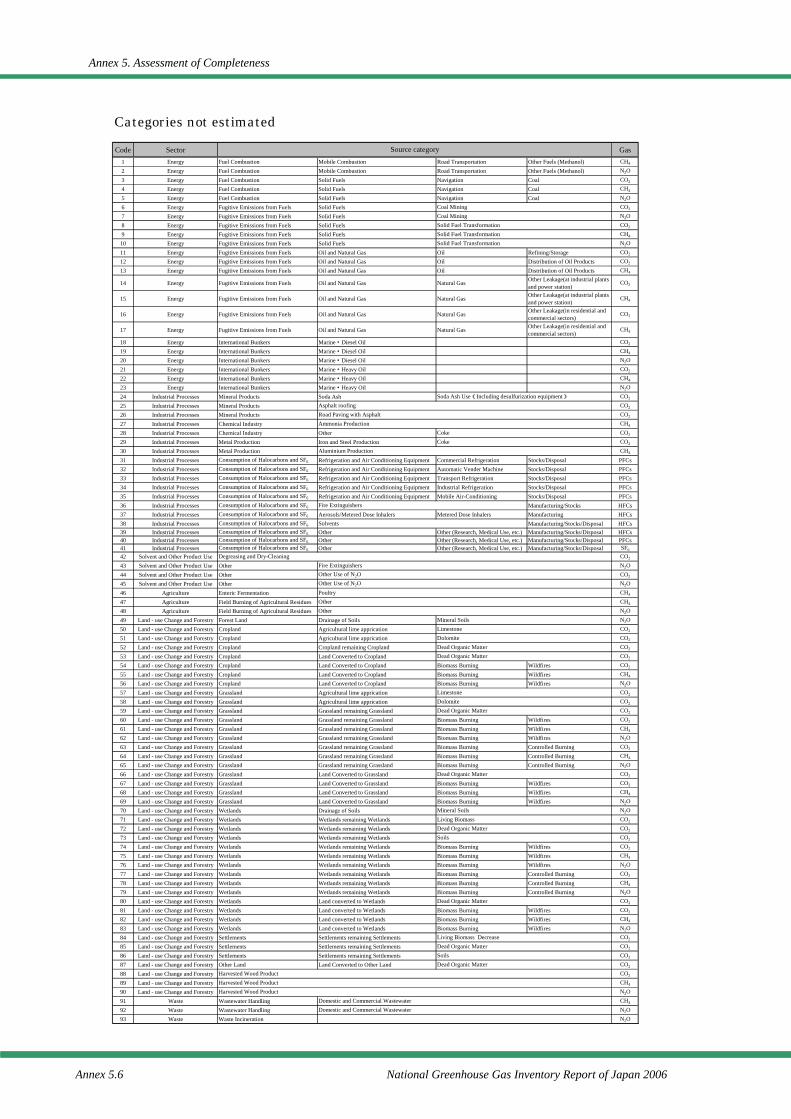
Annex 5. Assessment of Completeness
Annex 5.6 National Greenhouse Gas Inventory Report of Japan 2006
Categories not estimated
Code Sector Gas1 Energy Fuel Combustion Mobile Combustion Road Transportation Other Fuels (Methanol) CH4
2 Energy Fuel Combustion Mobile Combustion Road Transportation Other Fuels (Methanol) N2O3 Energy Fuel Combustion Solid Fuels Navigation Coal CO2
4 Energy Fuel Combustion Solid Fuels Navigation Coal CH4
5 Energy Fuel Combustion Solid Fuels Navigation Coal N2O6 Energy Fugitive Emissions from Fuels Solid Fuels CO2
7 Energy Fugitive Emissions from Fuels Solid Fuels N2O8 Energy Fugitive Emissions from Fuels Solid Fuels CO2
9 Energy Fugitive Emissions from Fuels Solid Fuels CH4
10 Energy Fugitive Emissions from Fuels Solid Fuels N2O11 Energy Fugitive Emissions from Fuels Oil and Natural Gas Oil Refining/Storage CO2
12 Energy Fugitive Emissions from Fuels Oil and Natural Gas Oil Distribution of Oil Products CO2
13 Energy Fugitive Emissions from Fuels Oil and Natural Gas Oil Distribution of Oil Products CH4
14 Energy Fugitive Emissions from Fuels Oil and Natural Gas Natural Gas Other Leakage(at industrial plantsand power station)
CO2
15 Energy Fugitive Emissions from Fuels Oil and Natural Gas Natural Gas Other Leakage(at industrial plantsand power station)
CH4
16 Energy Fugitive Emissions from Fuels Oil and Natural Gas Natural Gas Other Leakage(in residential andcommercial sectors)
CO2
17 Energy Fugitive Emissions from Fuels Oil and Natural Gas Natural Gas Other Leakage(in residential andcommercial sectors)
CH4
18 Energy International Bunkers Marine・Diesel Oil CO2
19 Energy International Bunkers Marine・Diesel Oil CH4
20 Energy International Bunkers Marine・Diesel Oil N2O21 Energy International Bunkers Marine・Heavy Oil CO2
22 Energy International Bunkers Marine・Heavy Oil CH4
23 Energy International Bunkers Marine・Heavy Oil N2O24 Industrial Processes Mineral Products Soda Ash CO2
25 Industrial Processes Mineral Products CO2
26 Industrial Processes Mineral Products CO2
27 Industrial Processes Chemical Industry CH4
28 Industrial Processes Chemical Industry Other CO2
29 Industrial Processes Metal Production Iron and Steel Production CO2
30 Industrial Processes Metal Production CH4
31 Industrial Processes Consumption of Halocarbons and SF6 Refrigeration and Air Conditioning Equipment Commercial Refrigeration Stocks/Disposal PFCs32 Industrial Processes Consumption of Halocarbons and SF6 Refrigeration and Air Conditioning Equipment Automatic Vender Machine Stocks/Disposal PFCs33 Industrial Processes Consumption of Halocarbons and SF6 Refrigeration and Air Conditioning Equipment Transport Refrigeration Stocks/Disposal PFCs34 Industrial Processes Consumption of Halocarbons and SF6 Refrigeration and Air Conditioning Equipment Industrial Refrigeration Stocks/Disposal PFCs35 Industrial Processes Consumption of Halocarbons and SF6 Refrigeration and Air Conditioning Equipment Mobile Air-Conditioning Stocks/Disposal PFCs36 Industrial Processes Consumption of Halocarbons and SF6 Manufacturing/Stocks HFCs37 Industrial Processes Consumption of Halocarbons and SF6 Aerosols/Metered Dose Inhalers Metered Dose Inhalers Manufacturing HFCs38 Industrial Processes Consumption of Halocarbons and SF6 Manufacturing/Stocks/Disposal HFCs39 Industrial Processes Consumption of Halocarbons and SF6 Other Other (Research, Medical Use, etc.) Manufacturing/Stocks/Disposal HFCs40 Industrial Processes Consumption of Halocarbons and SF6 Other Other (Research, Medical Use, etc.) Manufacturing/Stocks/Disposal PFCs41 Industrial Processes Consumption of Halocarbons and SF6 Other Other (Research, Medical Use, etc.) Manufacturing/Stocks/Disposal SF6
42 Solvent and Other Product Use CO2
43 Solvent and Other Product Use Other N2O44 Solvent and Other Product Use Other CO2
45 Solvent and Other Product Use Other N2O46 Agriculture Enteric Fermentation CH4
47 Agriculture Field Burning of Agricultural Residues CH4
48 Agriculture Field Burning of Agricultural Residues N2O49 Land - use Change and Forestry Forest Land Drainage of Soils N2O50 Land - use Change and Forestry Cropland Agricultural lime apprication CO2
51 Land - use Change and Forestry Cropland Agricultural lime apprication CO2
52 Land - use Change and Forestry Cropland Cropland remaining Cropland CO2
53 Land - use Change and Forestry Cropland Land Converted to Cropland CO2
54 Land - use Change and Forestry Cropland Land Converted to Cropland Biomass Burning Wildfires CO2
55 Land - use Change and Forestry Cropland Land Converted to Cropland Biomass Burning Wildfires CH4
56 Land - use Change and Forestry Cropland Land Converted to Cropland Biomass Burning Wildfires N2O57 Land - use Change and Forestry Grassland Agricultural lime apprication CO2
58 Land - use Change and Forestry Grassland Agricultural lime apprication CO2
59 Land - use Change and Forestry Grassland Grassland remaining Grassland CO2
60 Land - use Change and Forestry Grassland Grassland remaining Grassland Biomass Burning Wildfires CO2
61 Land - use Change and Forestry Grassland Grassland remaining Grassland Biomass Burning Wildfires CH4
62 Land - use Change and Forestry Grassland Grassland remaining Grassland Biomass Burning Wildfires N2O63 Land - use Change and Forestry Grassland Grassland remaining Grassland Biomass Burning Controlled Burning CO2
64 Land - use Change and Forestry Grassland Grassland remaining Grassland Biomass Burning Controlled Burning CH4
65 Land - use Change and Forestry Grassland Grassland remaining Grassland Biomass Burning Controlled Burning N2O66 Land - use Change and Forestry Grassland Land Converted to Grassland CO2
67 Land - use Change and Forestry Grassland Land Converted to Grassland Biomass Burning Wildfires CO2
68 Land - use Change and Forestry Grassland Land Converted to Grassland Biomass Burning Wildfires CH4
69 Land - use Change and Forestry Grassland Land Converted to Grassland Biomass Burning Wildfires N2O70 Land - use Change and Forestry Wetlands Drainage of Soils N2O71 Land - use Change and Forestry Wetlands Wetlands remaining Wetlands CO2
72 Land - use Change and Forestry Wetlands Wetlands remaining Wetlands CO2
73 Land - use Change and Forestry Wetlands Wetlands remaining Wetlands CO2
74 Land - use Change and Forestry Wetlands Wetlands remaining Wetlands Biomass Burning Wildfires CO2
75 Land - use Change and Forestry Wetlands Wetlands remaining Wetlands Biomass Burning Wildfires CH4
76 Land - use Change and Forestry Wetlands Wetlands remaining Wetlands Biomass Burning Wildfires N2O77 Land - use Change and Forestry Wetlands Wetlands remaining Wetlands Biomass Burning Controlled Burning CO2
78 Land - use Change and Forestry Wetlands Wetlands remaining Wetlands Biomass Burning Controlled Burning CH4
79 Land - use Change and Forestry Wetlands Wetlands remaining Wetlands Biomass Burning Controlled Burning N2O80 Land - use Change and Forestry Wetlands Land converted to Wetlands CO2
81 Land - use Change and Forestry Wetlands Land converted to Wetlands Biomass Burning Wildfires CO2
82 Land - use Change and Forestry Wetlands Land converted to Wetlands Biomass Burning Wildfires CH4
83 Land - use Change and Forestry Wetlands Land converted to Wetlands Biomass Burning Wildfires N2O84 Land - use Change and Forestry Settlements Settlements remaining Settlements CO2
85 Land - use Change and Forestry Settlements Settlements remaining Settlements CO2
86 Land - use Change and Forestry Settlements Settlements remaining Settlements CO2
87 Land - use Change and Forestry Other Land Land Converted to Other Land CO2
88 Land - use Change and Forestry CO2
89 Land - use Change and Forestry CH4
90 Land - use Change and Forestry N2O91 Waste Wastewater Handling CH4
92 Waste Wastewater Handling N2O93 Waste Waste Incineration N2O
Living Biomass
Dead Organic Matter
Dead Organic MatterSoils
Harvested Wood ProductHarvested Wood ProductHarvested Wood Product
Mineral Soils
Living Biomass Decrease
Dead Organic MatterSoils
Dead Organic Matter
Mineral Soils
Dead Organic Matter
DolomiteDead Organic Matter
Limestone
Other Use of N2OPoultryOtherOther
Domestic and Commercial WastewaterDomestic and Commercial Wastewater
Limestone
Dead Organic MatterDolomite
Solvents
Degreasing and Dry-CleaningFire ExtinguishersOther Use of N2O
Solid Fuel Transformation
Soda Ash Use(Including desulfurization equipment)Asphalt roofing
Fire Extinguishers
Aluminium Production
Road Paving with AsphaltAmmonia Production
CokeCoke
Source category
Coal MiningCoal MiningSolid Fuel TransformationSolid Fuel Transformation
Dead Organic Matter
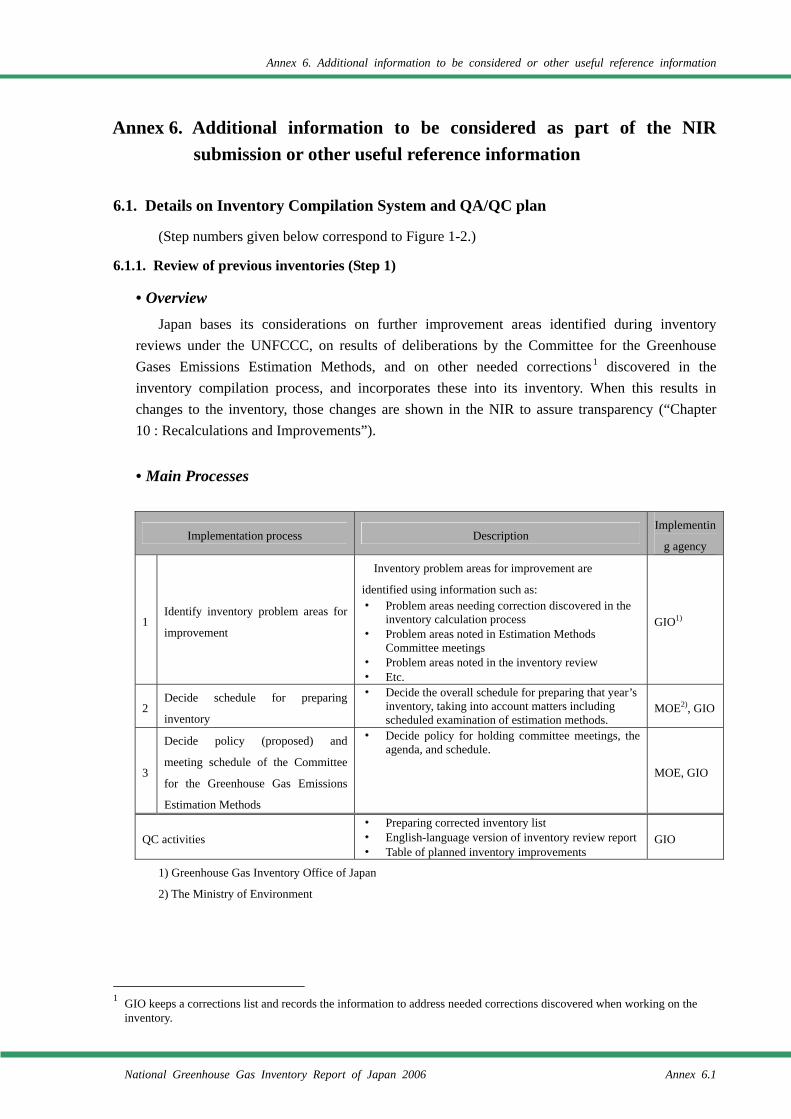
Annex 6. Additional information to be considered or other useful reference information
National Greenhouse Gas Inventory Report of Japan 2006 Annex 6.1
Annex 6. Additional information to be considered as part of the NIR submission or other useful reference information
6.1. Details on Inventory Compilation System and QA/QC plan
(Step numbers given below correspond to Figure 1-2.)
6.1.1. Review of previous inventories (Step 1)
• Overview Japan bases its considerations on further improvement areas identified during inventory
reviews under the UNFCCC, on results of deliberations by the Committee for the Greenhouse Gases Emissions Estimation Methods, and on other needed corrections1 discovered in the inventory compilation process, and incorporates these into its inventory. When this results in changes to the inventory, those changes are shown in the NIR to assure transparency (“Chapter 10 : Recalculations and Improvements”).
• Main Processes
Implementation process Description Implementin
g agency
1 Identify inventory problem areas for
improvement
Inventory problem areas for improvement are
identified using information such as: ・ Problem areas needing correction discovered in the
inventory calculation process ・ Problem areas noted in Estimation Methods
Committee meetings ・ Problem areas noted in the inventory review ・ Etc.
GIO1)
2 Decide schedule for preparing
inventory
・ Decide the overall schedule for preparing that year’s inventory, taking into account matters including scheduled examination of estimation methods.
MOE2), GIO
3
Decide policy (proposed) and
meeting schedule of the Committee
for the Greenhouse Gas Emissions
Estimation Methods
・ Decide policy for holding committee meetings, the agenda, and schedule.
MOE, GIO
QC activities ・ Preparing corrected inventory list ・ English-language version of inventory review report ・ Table of planned inventory improvements
GIO
1) Greenhouse Gas Inventory Office of Japan
2) The Ministry of Environment
1 GIO keeps a corrections list and records the information to address needed corrections discovered when working on the
inventory.
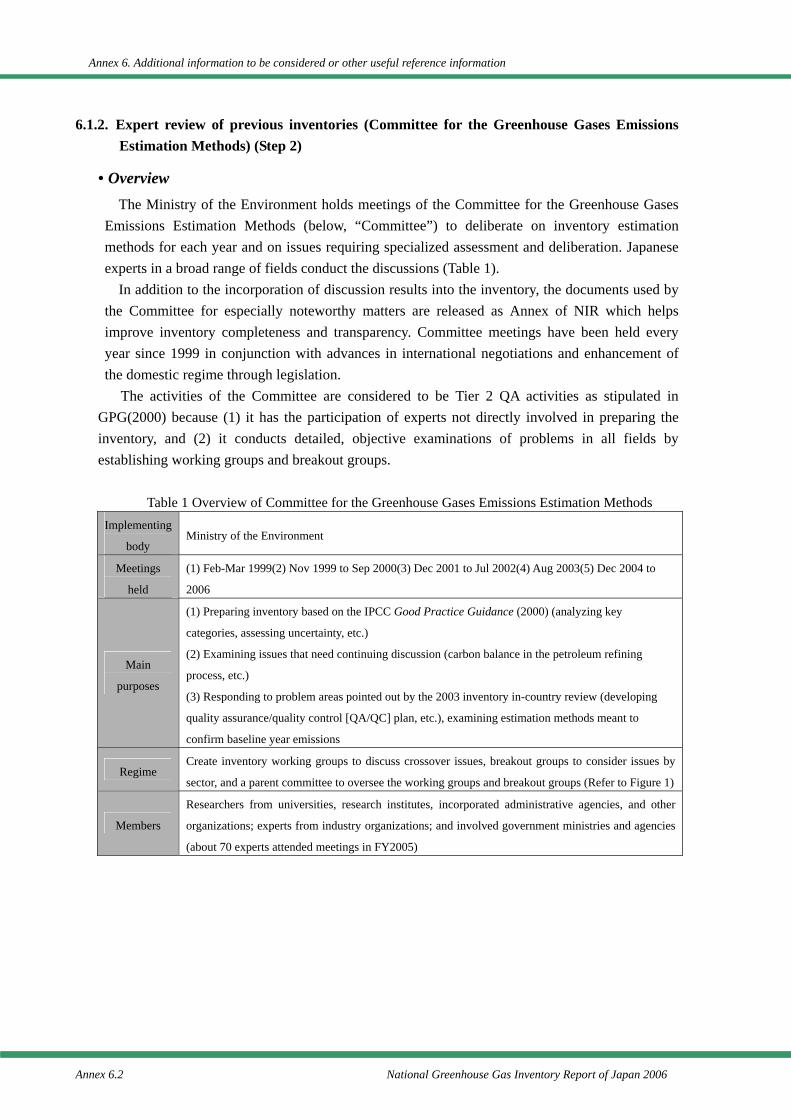
Annex 6. Additional information to be considered or other useful reference information
Annex 6.2 National Greenhouse Gas Inventory Report of Japan 2006
6.1.2. Expert review of previous inventories (Committee for the Greenhouse Gases Emissions Estimation Methods) (Step 2)
• Overview The Ministry of the Environment holds meetings of the Committee for the Greenhouse Gases
Emissions Estimation Methods (below, “Committee”) to deliberate on inventory estimation methods for each year and on issues requiring specialized assessment and deliberation. Japanese experts in a broad range of fields conduct the discussions (Table 1).
In addition to the incorporation of discussion results into the inventory, the documents used by the Committee for especially noteworthy matters are released as Annex of NIR which helps improve inventory completeness and transparency. Committee meetings have been held every year since 1999 in conjunction with advances in international negotiations and enhancement of the domestic regime through legislation.
The activities of the Committee are considered to be Tier 2 QA activities as stipulated in GPG(2000) because (1) it has the participation of experts not directly involved in preparing the inventory, and (2) it conducts detailed, objective examinations of problems in all fields by establishing working groups and breakout groups.
Table 1 Overview of Committee for the Greenhouse Gases Emissions Estimation Methods
Implementing
body Ministry of the Environment
Meetings
held
(1) Feb-Mar 1999(2) Nov 1999 to Sep 2000(3) Dec 2001 to Jul 2002(4) Aug 2003(5) Dec 2004 to
2006
Main
purposes
(1) Preparing inventory based on the IPCC Good Practice Guidance (2000) (analyzing key
categories, assessing uncertainty, etc.)
(2) Examining issues that need continuing discussion (carbon balance in the petroleum refining
process, etc.)
(3) Responding to problem areas pointed out by the 2003 inventory in-country review (developing
quality assurance/quality control [QA/QC] plan, etc.), examining estimation methods meant to
confirm baseline year emissions
Regime Create inventory working groups to discuss crossover issues, breakout groups to consider issues by
sector, and a parent committee to oversee the working groups and breakout groups (Refer to Figure 1)
Members
Researchers from universities, research institutes, incorporated administrative agencies, and other
organizations; experts from industry organizations; and involved government ministries and agencies
(about 70 experts attended meetings in FY2005)
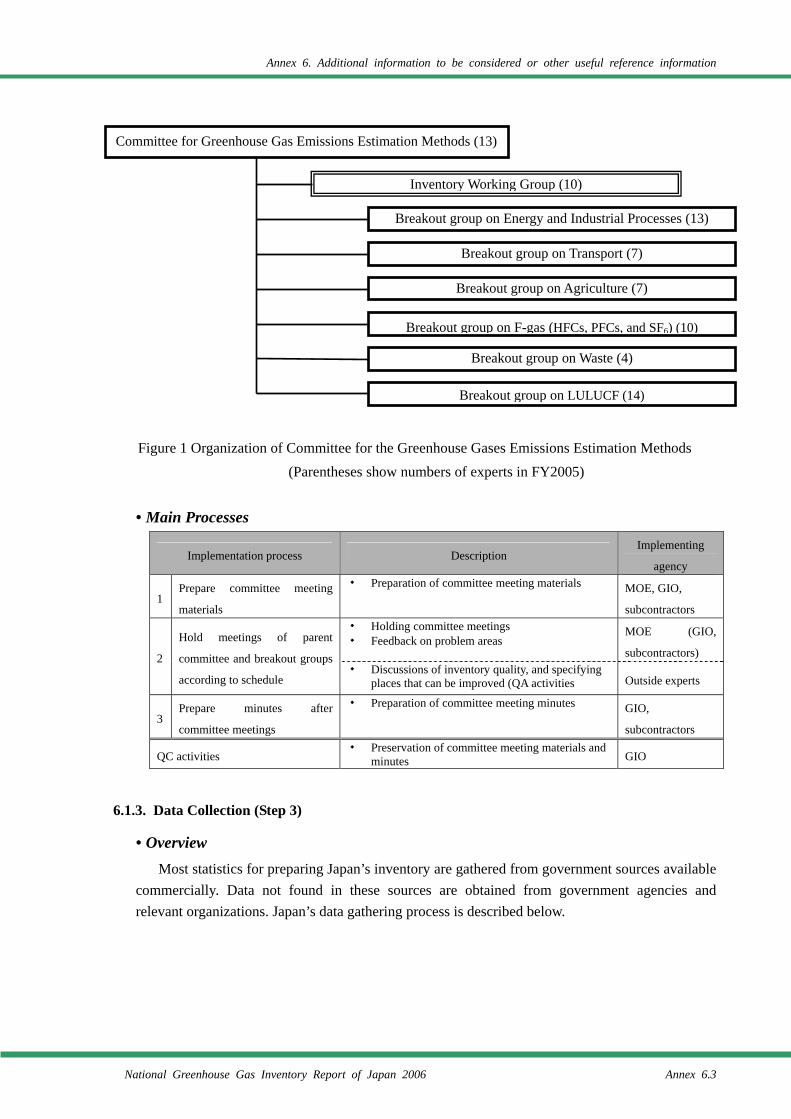
Annex 6. Additional information to be considered or other useful reference information
National Greenhouse Gas Inventory Report of Japan 2006 Annex 6.3
Committee for Greenhouse Gas Emissions Estimation Methods (13)
Inventory Working Group (10)
Breakout group on Energy and Industrial Processes (13)
Breakout group on Transport (7)
Breakout group on LULUCF (14)
Breakout group on Waste (4)
Breakout group on Agriculture (7)
Breakout group on F-gas (HFCs, PFCs, and SF6) (10)
Figure 1 Organization of Committee for the Greenhouse Gases Emissions Estimation Methods (Parentheses show numbers of experts in FY2005)
• Main Processes
Implementation process Description Implementing
agency
1 Prepare committee meeting
materials
・ Preparation of committee meeting materials MOE, GIO,
subcontractors ・ Holding committee meetings ・ Feedback on problem areas
MOE (GIO,
subcontractors) 2
Hold meetings of parent
committee and breakout groups
according to schedule ・ Discussions of inventory quality, and specifying
places that can be improved (QA activities Outside experts
3 Prepare minutes after
committee meetings
・ Preparation of committee meeting minutes GIO,
subcontractors
QC activities ・ Preservation of committee meeting materials and
minutes GIO
6.1.3. Data Collection (Step 3)
• Overview Most statistics for preparing Japan’s inventory are gathered from government sources available
commercially. Data not found in these sources are obtained from government agencies and relevant organizations. Japan’s data gathering process is described below.
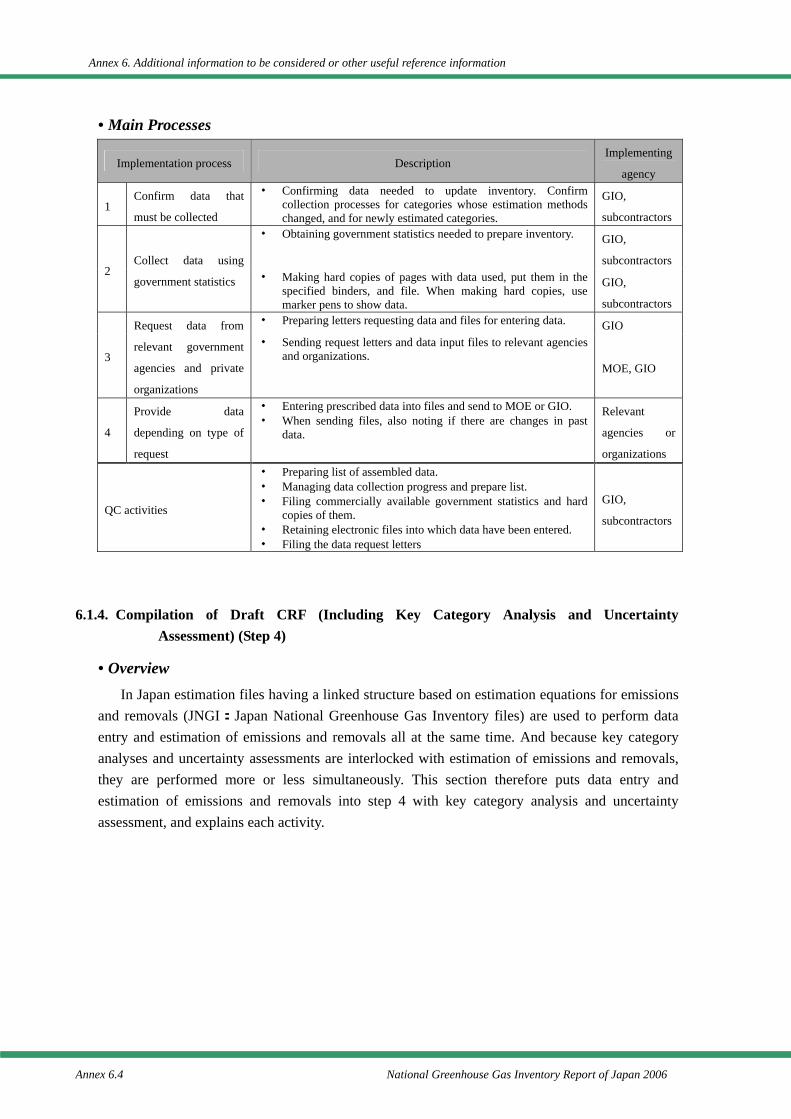
Annex 6. Additional information to be considered or other useful reference information
Annex 6.4 National Greenhouse Gas Inventory Report of Japan 2006
• Main Processes
Implementation process Description Implementing
agency
1 Confirm data that
must be collected
・ Confirming data needed to update inventory. Confirm collection processes for categories whose estimation methods changed, and for newly estimated categories.
GIO,
subcontractors・ Obtaining government statistics needed to prepare inventory. GIO,
subcontractors2
Collect data using
government statistics ・ Making hard copies of pages with data used, put them in the specified binders, and file. When making hard copies, use marker pens to show data.
GIO,
subcontractors・ Preparing letters requesting data and files for entering data. GIO
3
Request data from
relevant government
agencies and private
organizations
・ Sending request letters and data input files to relevant agencies and organizations.
MOE, GIO
4
Provide data
depending on type of
request
・ Entering prescribed data into files and send to MOE or GIO. ・ When sending files, also noting if there are changes in past
data.
Relevant
agencies or
organizations
QC activities
・ Preparing list of assembled data. ・ Managing data collection progress and prepare list. ・ Filing commercially available government statistics and hard
copies of them. ・ Retaining electronic files into which data have been entered. ・ Filing the data request letters
GIO,
subcontractors
6.1.4. Compilation of Draft CRF (Including Key Category Analysis and Uncertainty Assessment) (Step 4)
• Overview In Japan estimation files having a linked structure based on estimation equations for emissions
and removals (JNGI:Japan National Greenhouse Gas Inventory files) are used to perform data entry and estimation of emissions and removals all at the same time. And because key category analyses and uncertainty assessments are interlocked with estimation of emissions and removals, they are performed more or less simultaneously. This section therefore puts data entry and estimation of emissions and removals into step 4 with key category analysis and uncertainty assessment, and explains each activity.
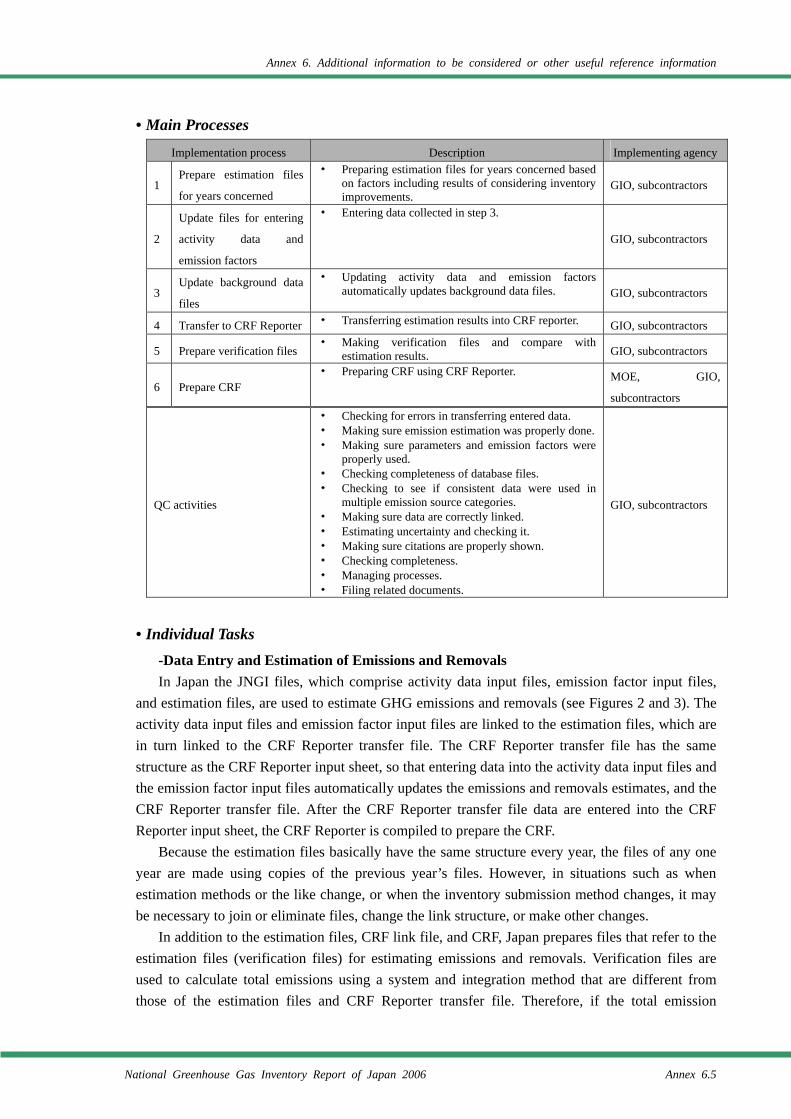
Annex 6. Additional information to be considered or other useful reference information
National Greenhouse Gas Inventory Report of Japan 2006 Annex 6.5
• Main Processes Implementation process Description Implementing agency
1 Prepare estimation files
for years concerned
・ Preparing estimation files for years concerned based on factors including results of considering inventory improvements.
GIO, subcontractors
2
Update files for entering
activity data and
emission factors
・ Entering data collected in step 3.
GIO, subcontractors
3 Update background data
files
・ Updating activity data and emission factors automatically updates background data files. GIO, subcontractors
4 Transfer to CRF Reporter ・ Transferring estimation results into CRF reporter. GIO, subcontractors
5 Prepare verification files ・ Making verification files and compare with
estimation results. GIO, subcontractors
6 Prepare CRF ・ Preparing CRF using CRF Reporter. MOE, GIO,
subcontractors
QC activities
・ Checking for errors in transferring entered data. ・ Making sure emission estimation was properly done. ・ Making sure parameters and emission factors were
properly used. ・ Checking completeness of database files. ・ Checking to see if consistent data were used in
multiple emission source categories. ・ Making sure data are correctly linked. ・ Estimating uncertainty and checking it. ・ Making sure citations are properly shown. ・ Checking completeness. ・ Managing processes. ・ Filing related documents.
GIO, subcontractors
• Individual Tasks -Data Entry and Estimation of Emissions and Removals In Japan the JNGI files, which comprise activity data input files, emission factor input files,
and estimation files, are used to estimate GHG emissions and removals (see Figures 2 and 3). The activity data input files and emission factor input files are linked to the estimation files, which are in turn linked to the CRF Reporter transfer file. The CRF Reporter transfer file has the same structure as the CRF Reporter input sheet, so that entering data into the activity data input files and the emission factor input files automatically updates the emissions and removals estimates, and the CRF Reporter transfer file. After the CRF Reporter transfer file data are entered into the CRF Reporter input sheet, the CRF Reporter is compiled to prepare the CRF.
Because the estimation files basically have the same structure every year, the files of any one year are made using copies of the previous year’s files. However, in situations such as when estimation methods or the like change, or when the inventory submission method changes, it may be necessary to join or eliminate files, change the link structure, or make other changes.
In addition to the estimation files, CRF link file, and CRF, Japan prepares files that refer to the estimation files (verification files) for estimating emissions and removals. Verification files are used to calculate total emissions using a system and integration method that are different from those of the estimation files and CRF Reporter transfer file. Therefore, if the total emission
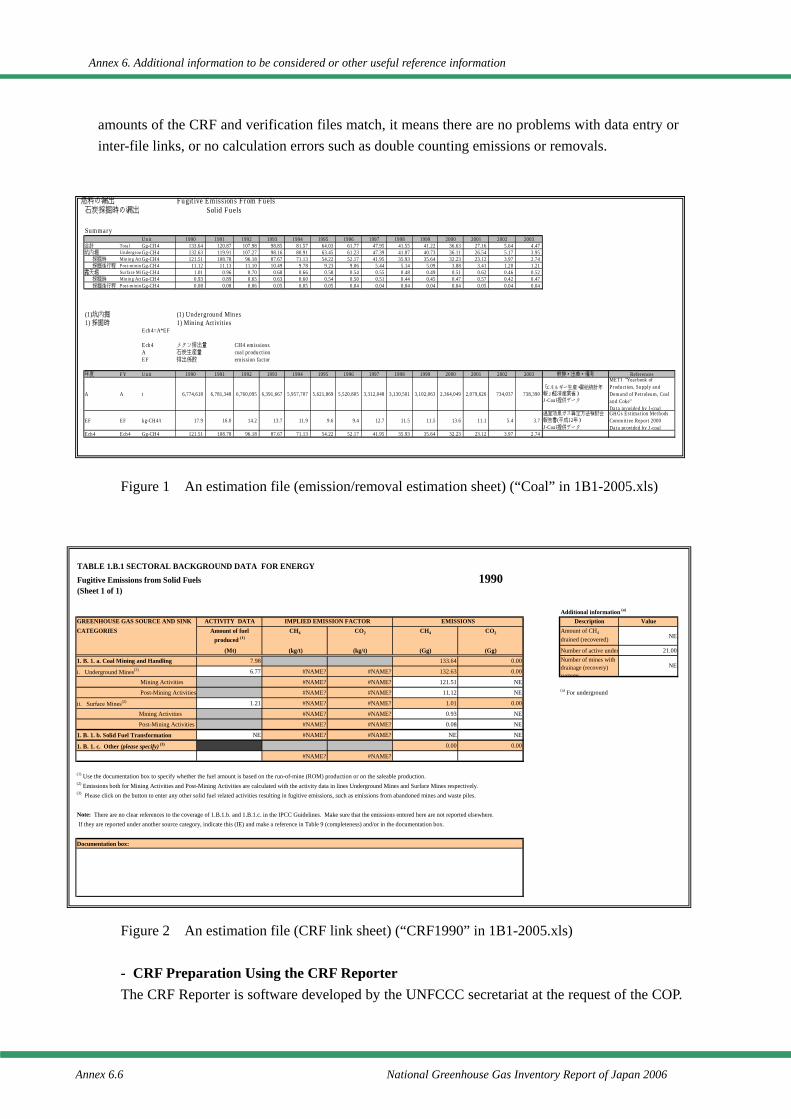
Annex 6. Additional information to be considered or other useful reference information
Annex 6.6 National Greenhouse Gas Inventory Report of Japan 2006
amounts of the CRF and verification files match, it means there are no problems with data entry or inter-file links, or no calculation errors such as double counting emissions or removals.
Figure 1 An estimation file (emission/removal estimation sheet) (“Coal” in 1B1-2005.xls)
Figure 2 An estimation file (CRF link sheet) (“CRF1990” in 1B1-2005.xls) - CRF Preparation Using the CRF Reporter The CRF Reporter is software developed by the UNFCCC secretariat at the request of the COP.
燃料の漏出 Fugitive Emissions From Fuels石炭採掘時の漏出 Solid Fuels
SummaryUnit 1990 1991 1992 1993 1994 1995 1996 1997 1998 1999 2000 2001 2002 2003
合計 Total Gg-CH4 133.64 120.87 107.98 98.85 81.57 64.03 61.77 47.95 41.55 41.22 36.63 27.16 5.64 4.47坑内堀 UndergrouGg-CH4 132.63 119.91 107.27 98.16 80.91 63.45 61.23 47.39 41.07 40.73 36.11 26.54 5.17 3.95
採掘時 Mining ActGg-CH4 121.51 108.78 96.18 87.67 71.13 54.22 52.17 41.95 35.93 35.64 32.23 23.12 3.97 2.74採掘後行程 Post-mininGg-CH4 11.12 11.13 11.10 10.49 9.78 9.23 9.06 5.44 5.14 5.09 3.88 3.41 1.20 1.21
露天堀 Surface MiGg-CH4 1.01 0.96 0.70 0.68 0.66 0.58 0.54 0.55 0.48 0.49 0.51 0.62 0.46 0.52採掘時 Mining ActGg-CH4 0.93 0.89 0.65 0.63 0.60 0.54 0.50 0.51 0.44 0.45 0.47 0.57 0.42 0.47採掘後行程 Post-mininGg-CH4 0.08 0.08 0.06 0.05 0.05 0.05 0.04 0.04 0.04 0.04 0.04 0.05 0.04 0.04
(1)坑内掘 (1) Underground Mines1) 採掘時 1) Mining Activities
Ech4=A*EF
Ech4 メタン排出量 CH4 emissionsA 石炭生産量 coal productionEF 排出係数 emission factor
年度 FY Unit 1990 1991 1992 1993 1994 1995 1996 1997 1998 1999 2000 2001 2002 2003 根拠・出典・備考 References
A A t 6,774,618 6,781,348 6,760,095 6,391,667 5,957,707 5,621,869 5,520,805 3,312,048 3,130,501 3,102,063 2,364,049 2,079,626 734,037 738,390「エネルギー生産・需給統計年報」(経済産業省)J-Coal提供データ
METI "Yearbook ofProduction, Supply andDemand of Petroleum, Coaland Coke"Data provided by J-coal
EF EF kg-CH4/t 17.9 16.0 14.2 13.7 11.9 9.6 9.4 12.7 11.5 11.5 13.6 11.1 5.4 3.7温室効果ガス算定方法検討会報告書(平成12年)
J-Coal提供データ
GHGs Estimation MethodsCommittee Report 2000Data provided by J-coal
Ech4 Ech4 Gg-CH4 121.51 108.78 96.18 87.67 71.13 54.22 52.17 41.95 35.93 35.64 32.23 23.12 3.97 2.74
TABLE 1.B.1 SECTORAL BACKGROUND DATA FOR ENERGYFugitive Emissions from Solid Fuels 1990(Sheet 1 of 1)
Additional information (a)
GREENHOUSE GAS SOURCE AND SINK ACTIVITY DATA Description ValueCATEGORIES Amount of fuel
produced (1)CH4 CO2 CH4 CO2 Amount of CH4
drained (recovered) NE
(Mt) (kg/t) (kg/t) (Gg) (Gg) Number of active under 21.00
1. B. 1. a. Coal Mining and Handling 7.98 133.64 0.00
i. Underground Mines(2) 6.77 #NAME? #NAME? 132.63 0.00
Mining Activities #NAME? #NAME? 121.51 NE
Post-Mining Activities #NAME? #NAME? 11.12 NE (a) For underground
ii. Surface Mines(2) 1.21 #NAME? #NAME? 1.01 0.00
Mining Activities #NAME? #NAME? 0.93 NE
Post-Mining Activities #NAME? #NAME? 0.08 NE
1. B. 1. b. Solid Fuel Transformation NE #NAME? #NAME? NE NE
1. B. 1. c. Other (please specify) (3) 0.00 0.00
#NAME? #NAME?
(1) Use the documentation box to specify whether the fuel amount is based on the run-of-mine (ROM) production or on the saleable production.(2) Emissions both for Mining Activities and Post-Mining Activities are calculated with the activity data in lines Underground Mines and Surface Mines respectively.(3) Please click on the button to enter any other solid fuel related activities resulting in fugitive emissions, such as emissions from abandoned mines and waste piles.
Note: There are no clear references to the coverage of 1.B.1.b. and 1.B.1.c. in the IPCC Guidelines. Make sure that the emissions entered here are not reported elsewhere. If they are reported under another source category, indicate this (IE) and make a reference in Table 9 (completeness) and/or in the documentation box.
Documentation box:
IMPLIED EMISSION FACTOR EMISSIONS
Number of mines withdrainage (recovery)systems
NE
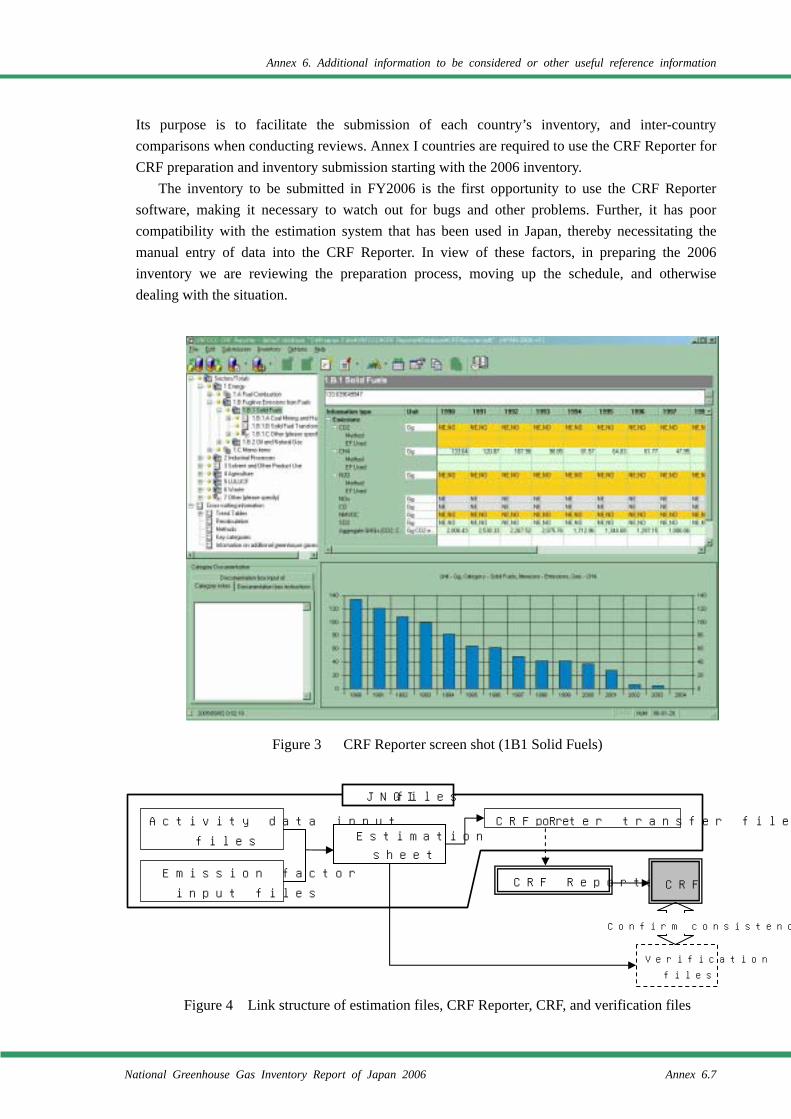
Annex 6. Additional information to be considered or other useful reference information
National Greenhouse Gas Inventory Report of Japan 2006 Annex 6.7
Its purpose is to facilitate the submission of each country’s inventory, and inter-country comparisons when conducting reviews. Annex I countries are required to use the CRF Reporter for CRF preparation and inventory submission starting with the 2006 inventory.
The inventory to be submitted in FY2006 is the first opportunity to use the CRF Reporter software, making it necessary to watch out for bugs and other problems. Further, it has poor compatibility with the estimation system that has been used in Japan, thereby necessitating the manual entry of data into the CRF Reporter. In view of these factors, in preparing the 2006 inventory we are reviewing the preparation process, moving up the schedule, and otherwise dealing with the situation.
Figure 3 CRF Reporter screen shot (1B1 Solid Fuels)
Figure 4 Link structure of estimation files, CRF Reporter, CRF, and verification files
Activity data input
files
Emission factor
input files
Estimation
sheet
CRF Reporter transfer file
CRF Reporter CRF
Verification
files
Confirm consistency
JNGI files
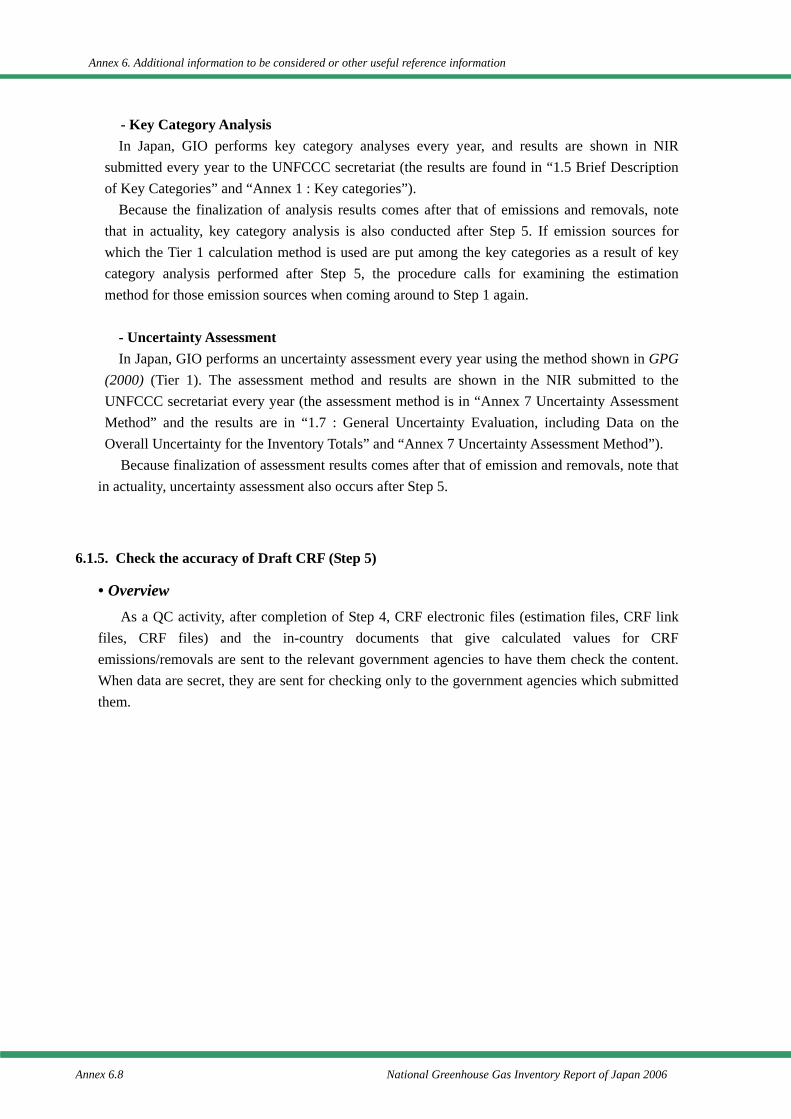
Annex 6. Additional information to be considered or other useful reference information
Annex 6.8 National Greenhouse Gas Inventory Report of Japan 2006
- Key Category Analysis In Japan, GIO performs key category analyses every year, and results are shown in NIR
submitted every year to the UNFCCC secretariat (the results are found in “1.5 Brief Description of Key Categories” and “Annex 1 : Key categories”).
Because the finalization of analysis results comes after that of emissions and removals, note that in actuality, key category analysis is also conducted after Step 5. If emission sources for which the Tier 1 calculation method is used are put among the key categories as a result of key category analysis performed after Step 5, the procedure calls for examining the estimation method for those emission sources when coming around to Step 1 again.
- Uncertainty Assessment In Japan, GIO performs an uncertainty assessment every year using the method shown in GPG
(2000) (Tier 1). The assessment method and results are shown in the NIR submitted to the UNFCCC secretariat every year (the assessment method is in “Annex 7 Uncertainty Assessment Method” and the results are in “1.7 : General Uncertainty Evaluation, including Data on the Overall Uncertainty for the Inventory Totals” and “Annex 7 Uncertainty Assessment Method”).
Because finalization of assessment results comes after that of emission and removals, note that in actuality, uncertainty assessment also occurs after Step 5.
6.1.5. Check the accuracy of Draft CRF (Step 5)
• Overview As a QC activity, after completion of Step 4, CRF electronic files (estimation files, CRF link
files, CRF files) and the in-country documents that give calculated values for CRF emissions/removals are sent to the relevant government agencies to have them check the content. When data are secret, they are sent for checking only to the government agencies which submitted them.
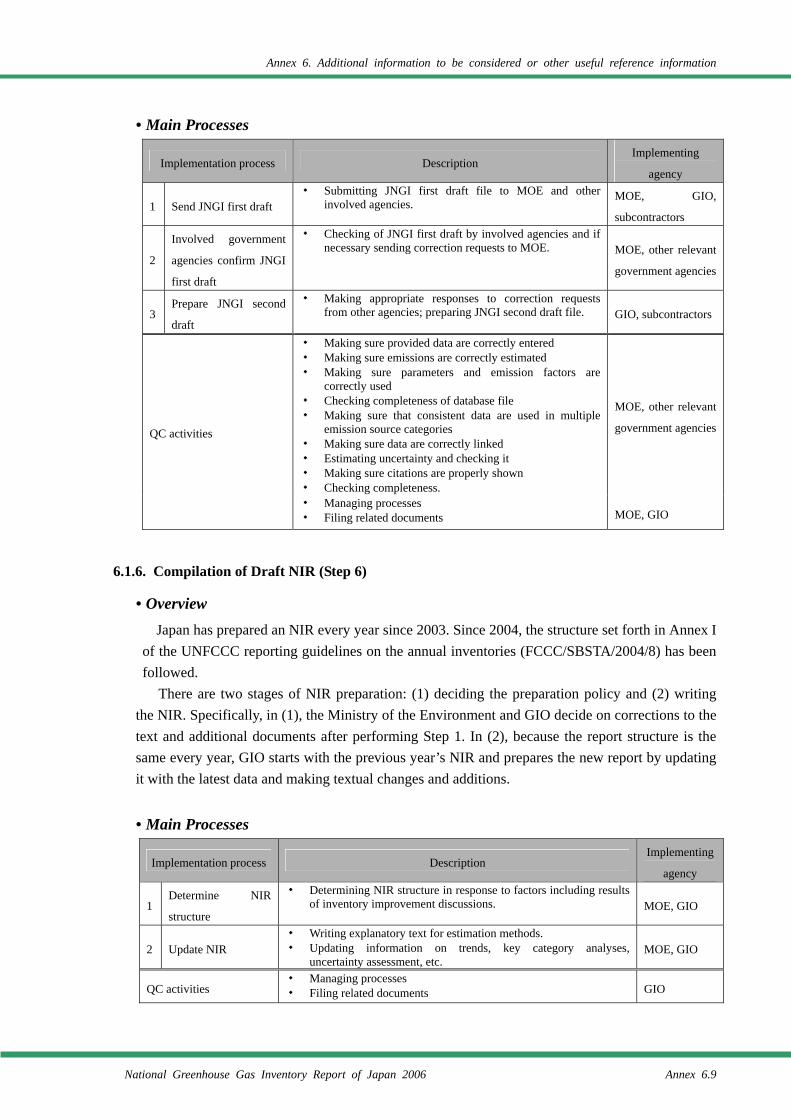
Annex 6. Additional information to be considered or other useful reference information
National Greenhouse Gas Inventory Report of Japan 2006 Annex 6.9
• Main Processes
Implementation process Description Implementing
agency
1 Send JNGI first draft ・ Submitting JNGI first draft file to MOE and other
involved agencies. MOE, GIO,
subcontractors
2
Involved government
agencies confirm JNGI
first draft
・ Checking of JNGI first draft by involved agencies and if necessary sending correction requests to MOE. MOE, other relevant
government agencies
3 Prepare JNGI second
draft
・ Making appropriate responses to correction requests from other agencies; preparing JNGI second draft file. GIO, subcontractors
・ Making sure provided data are correctly entered ・ Making sure emissions are correctly estimated ・ Making sure parameters and emission factors are
correctly used ・ Checking completeness of database file ・ Making sure that consistent data are used in multiple
emission source categories ・ Making sure data are correctly linked ・ Estimating uncertainty and checking it ・ Making sure citations are properly shown ・ Checking completeness.
MOE, other relevant
government agenciesQC activities
・ Managing processes ・ Filing related documents MOE, GIO
6.1.6. Compilation of Draft NIR (Step 6)
• Overview Japan has prepared an NIR every year since 2003. Since 2004, the structure set forth in Annex I
of the UNFCCC reporting guidelines on the annual inventories (FCCC/SBSTA/2004/8) has been followed.
There are two stages of NIR preparation: (1) deciding the preparation policy and (2) writing the NIR. Specifically, in (1), the Ministry of the Environment and GIO decide on corrections to the text and additional documents after performing Step 1. In (2), because the report structure is the same every year, GIO starts with the previous year’s NIR and prepares the new report by updating it with the latest data and making textual changes and additions.
• Main Processes
Implementation process Description Implementing
agency
1 Determine NIR
structure
・ Determining NIR structure in response to factors including results of inventory improvement discussions. MOE, GIO
2 Update NIR ・ Writing explanatory text for estimation methods. ・ Updating information on trends, key category analyses,
uncertainty assessment, etc. MOE, GIO
QC activities ・ Managing processes ・ Filing related documents GIO
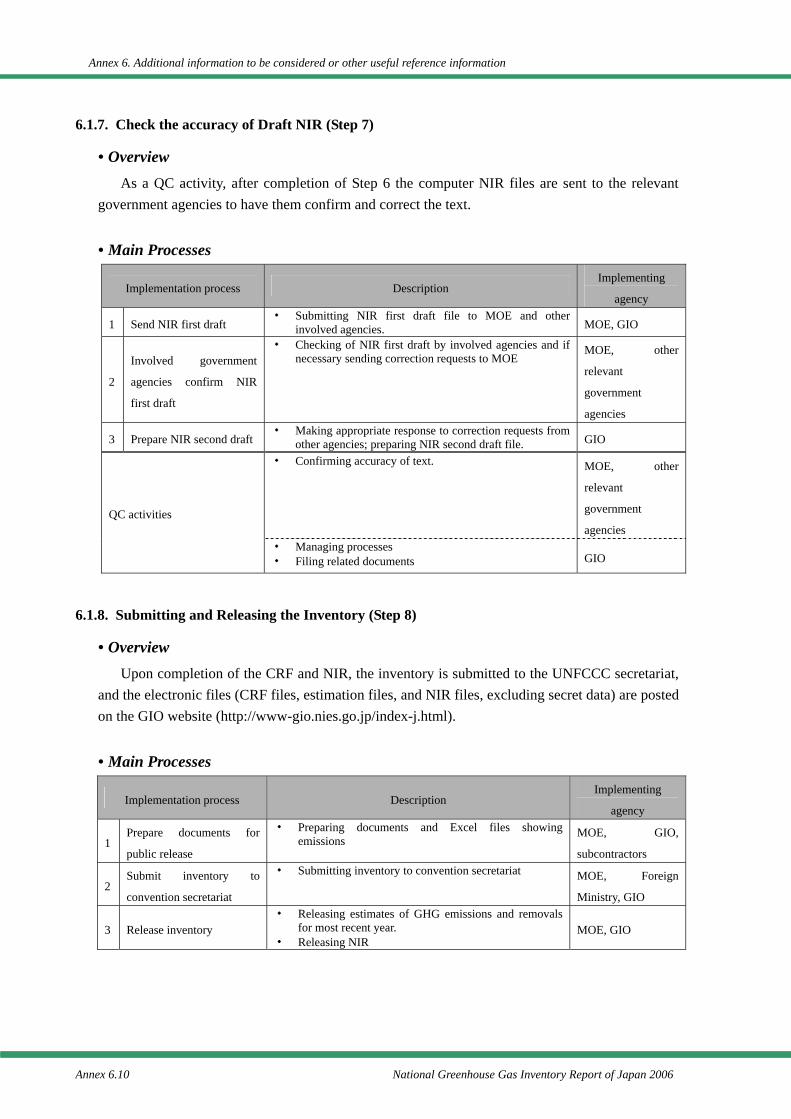
Annex 6. Additional information to be considered or other useful reference information
Annex 6.10 National Greenhouse Gas Inventory Report of Japan 2006
6.1.7. Check the accuracy of Draft NIR (Step 7)
• Overview As a QC activity, after completion of Step 6 the computer NIR files are sent to the relevant
government agencies to have them confirm and correct the text.
• Main Processes
Implementation process Description Implementing
agency
1 Send NIR first draft ・ Submitting NIR first draft file to MOE and other
involved agencies. MOE, GIO
2
Involved government
agencies confirm NIR
first draft
・ Checking of NIR first draft by involved agencies and if necessary sending correction requests to MOE
MOE, other
relevant
government
agencies
3 Prepare NIR second draft ・ Making appropriate response to correction requests from
other agencies; preparing NIR second draft file. GIO
・ Confirming accuracy of text. MOE, other
relevant
government
agencies QC activities
・ Managing processes ・ Filing related documents GIO
6.1.8. Submitting and Releasing the Inventory (Step 8)
• Overview Upon completion of the CRF and NIR, the inventory is submitted to the UNFCCC secretariat,
and the electronic files (CRF files, estimation files, and NIR files, excluding secret data) are posted on the GIO website (http://www-gio.nies.go.jp/index-j.html).
• Main Processes
Implementation process Description Implementing
agency
1 Prepare documents for
public release
・ Preparing documents and Excel files showing emissions
MOE, GIO,
subcontractors
2 Submit inventory to
convention secretariat
・ Submitting inventory to convention secretariat MOE, Foreign
Ministry, GIO
3 Release inventory ・ Releasing estimates of GHG emissions and removals
for most recent year. ・ Releasing NIR
MOE, GIO
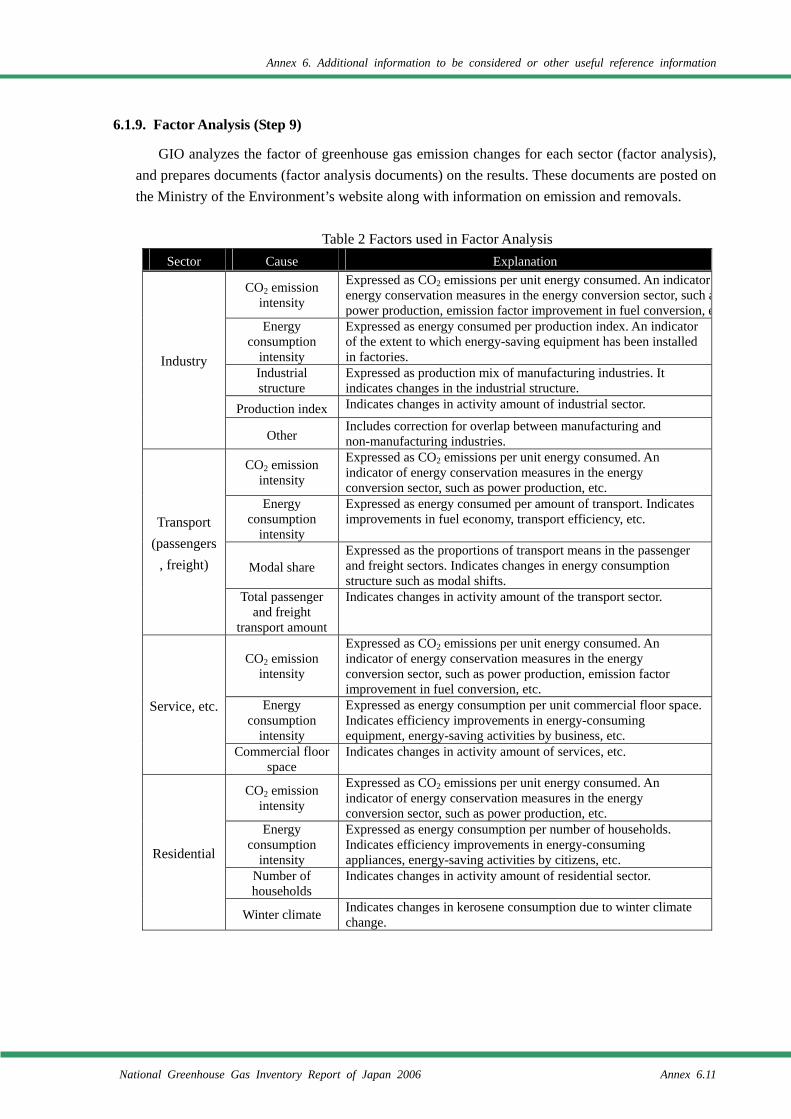
Annex 6. Additional information to be considered or other useful reference information
National Greenhouse Gas Inventory Report of Japan 2006 Annex 6.11
6.1.9. Factor Analysis (Step 9)
GIO analyzes the factor of greenhouse gas emission changes for each sector (factor analysis), and prepares documents (factor analysis documents) on the results. These documents are posted on the Ministry of the Environment’s website along with information on emission and removals.
Table 2 Factors used in Factor Analysis
Sector Cause Explanation
CO2 emission intensity
Expressed as CO2 emissions per unit energy consumed. An indicator energy conservation measures in the energy conversion sector, such apower production, emission factor improvement in fuel conversion, e
Energy consumption
intensity
Expressed as energy consumed per production index. An indicator of the extent to which energy-saving equipment has been installed in factories.
Industrial structure
Expressed as production mix of manufacturing industries. It indicates changes in the industrial structure.
Production index Indicates changes in activity amount of industrial sector.
Industry
Other Includes correction for overlap between manufacturing and non-manufacturing industries.
CO2 emission intensity
Expressed as CO2 emissions per unit energy consumed. An indicator of energy conservation measures in the energy conversion sector, such as power production, etc.
Energy consumption
intensity
Expressed as energy consumed per amount of transport. Indicates improvements in fuel economy, transport efficiency, etc.
Modal share Expressed as the proportions of transport means in the passenger and freight sectors. Indicates changes in energy consumption structure such as modal shifts.
Transport (passengers
, freight)
Total passenger and freight
transport amount
Indicates changes in activity amount of the transport sector.
CO2 emission intensity
Expressed as CO2 emissions per unit energy consumed. An indicator of energy conservation measures in the energy conversion sector, such as power production, emission factor improvement in fuel conversion, etc.
Energy consumption
intensity
Expressed as energy consumption per unit commercial floor space. Indicates efficiency improvements in energy-consuming equipment, energy-saving activities by business, etc.
Service, etc.
Commercial floor space
Indicates changes in activity amount of services, etc.
CO2 emission intensity
Expressed as CO2 emissions per unit energy consumed. An indicator of energy conservation measures in the energy conversion sector, such as power production, etc.
Energy consumption
intensity
Expressed as energy consumption per number of households. Indicates efficiency improvements in energy-consuming appliances, energy-saving activities by citizens, etc.
Number of households
Indicates changes in activity amount of residential sector. Residential
Winter climate Indicates changes in kerosene consumption due to winter climate change.
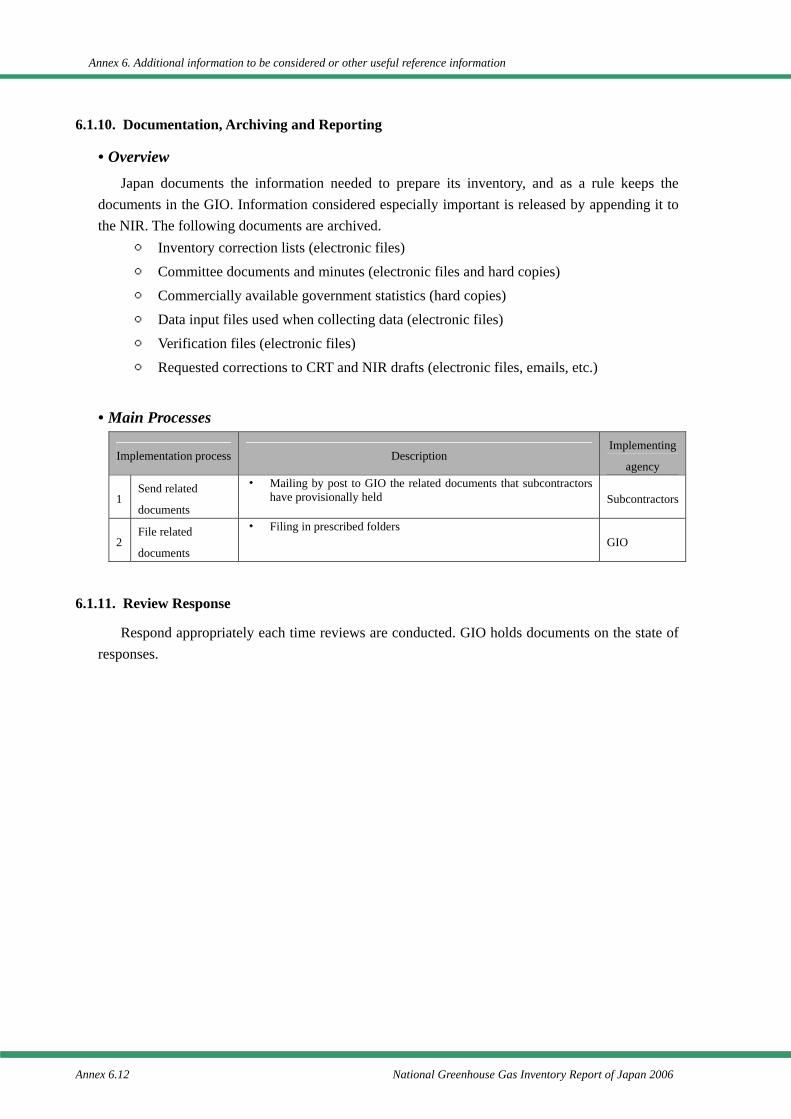
Annex 6. Additional information to be considered or other useful reference information
Annex 6.12 National Greenhouse Gas Inventory Report of Japan 2006
6.1.10. Documentation, Archiving and Reporting
• Overview Japan documents the information needed to prepare its inventory, and as a rule keeps the
documents in the GIO. Information considered especially important is released by appending it to the NIR. The following documents are archived.
○ Inventory correction lists (electronic files) ○ Committee documents and minutes (electronic files and hard copies) ○ Commercially available government statistics (hard copies) ○ Data input files used when collecting data (electronic files) ○ Verification files (electronic files) ○ Requested corrections to CRT and NIR drafts (electronic files, emails, etc.)
• Main Processes
Implementation process Description Implementing
agency
1 Send related
documents
・ Mailing by post to GIO the related documents that subcontractors have provisionally held Subcontractors
2 File related
documents
・ Filing in prescribed folders GIO
6.1.11. Review Response
Respond appropriately each time reviews are conducted. GIO holds documents on the state of responses.
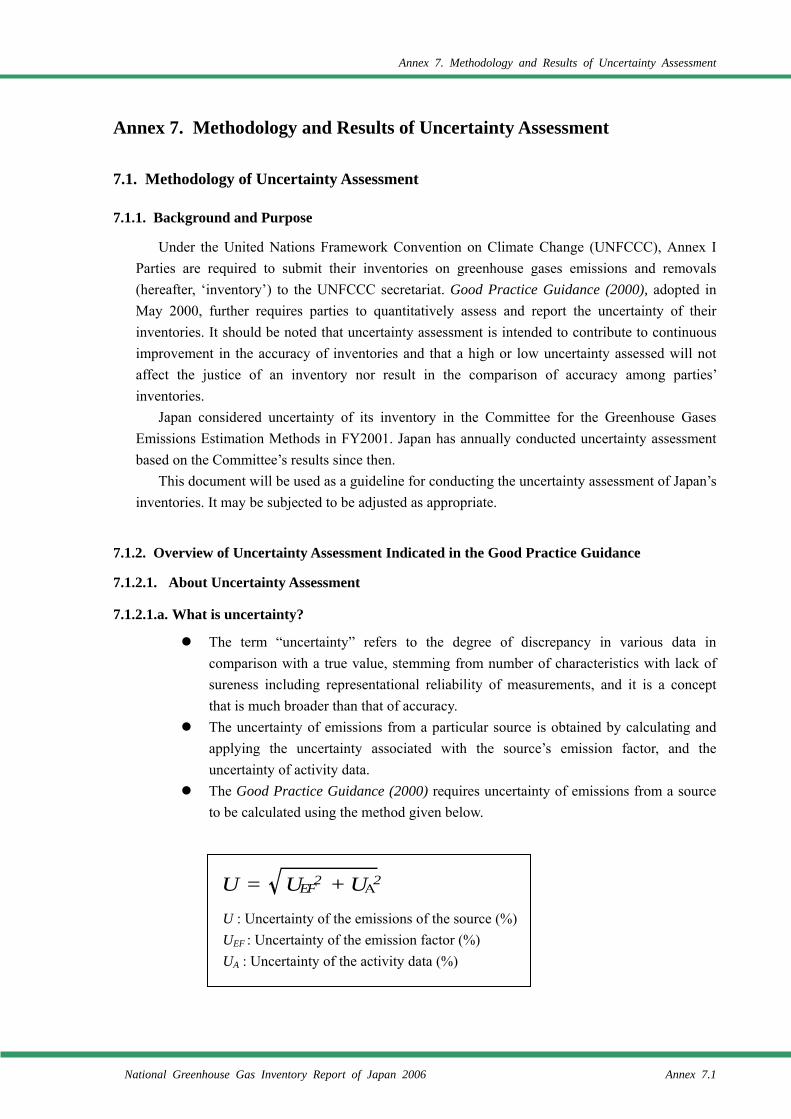
Annex 7. Methodology and Results of Uncertainty Assessment
National Greenhouse Gas Inventory Report of Japan 2006 Annex 7.1
Annex 7. Methodology and Results of Uncertainty Assessment
7.1. Methodology of Uncertainty Assessment
7.1.1. Background and Purpose
Under the United Nations Framework Convention on Climate Change (UNFCCC), Annex I Parties are required to submit their inventories on greenhouse gases emissions and removals (hereafter, ‘inventory’) to the UNFCCC secretariat. Good Practice Guidance (2000), adopted in May 2000, further requires parties to quantitatively assess and report the uncertainty of their inventories. It should be noted that uncertainty assessment is intended to contribute to continuous improvement in the accuracy of inventories and that a high or low uncertainty assessed will not affect the justice of an inventory nor result in the comparison of accuracy among parties’ inventories.
Japan considered uncertainty of its inventory in the Committee for the Greenhouse Gases Emissions Estimation Methods in FY2001. Japan has annually conducted uncertainty assessment based on the Committee’s results since then.
This document will be used as a guideline for conducting the uncertainty assessment of Japan’s inventories. It may be subjected to be adjusted as appropriate.
7.1.2. Overview of Uncertainty Assessment Indicated in the Good Practice Guidance
7.1.2.1. About Uncertainty Assessment
7.1.2.1.a. What is uncertainty?
The term “uncertainty” refers to the degree of discrepancy in various data in comparison with a true value, stemming from number of characteristics with lack of sureness including representational reliability of measurements, and it is a concept that is much broader than that of accuracy.
The uncertainty of emissions from a particular source is obtained by calculating and applying the uncertainty associated with the source’s emission factor, and the uncertainty of activity data.
The Good Practice Guidance (2000) requires uncertainty of emissions from a source to be calculated using the method given below.
U : Uncertainty of the emissions of the source (%) UEF : Uncertainty of the emission factor (%) UA : Uncertainty of the activity data (%)
U = UEF2 + UA2
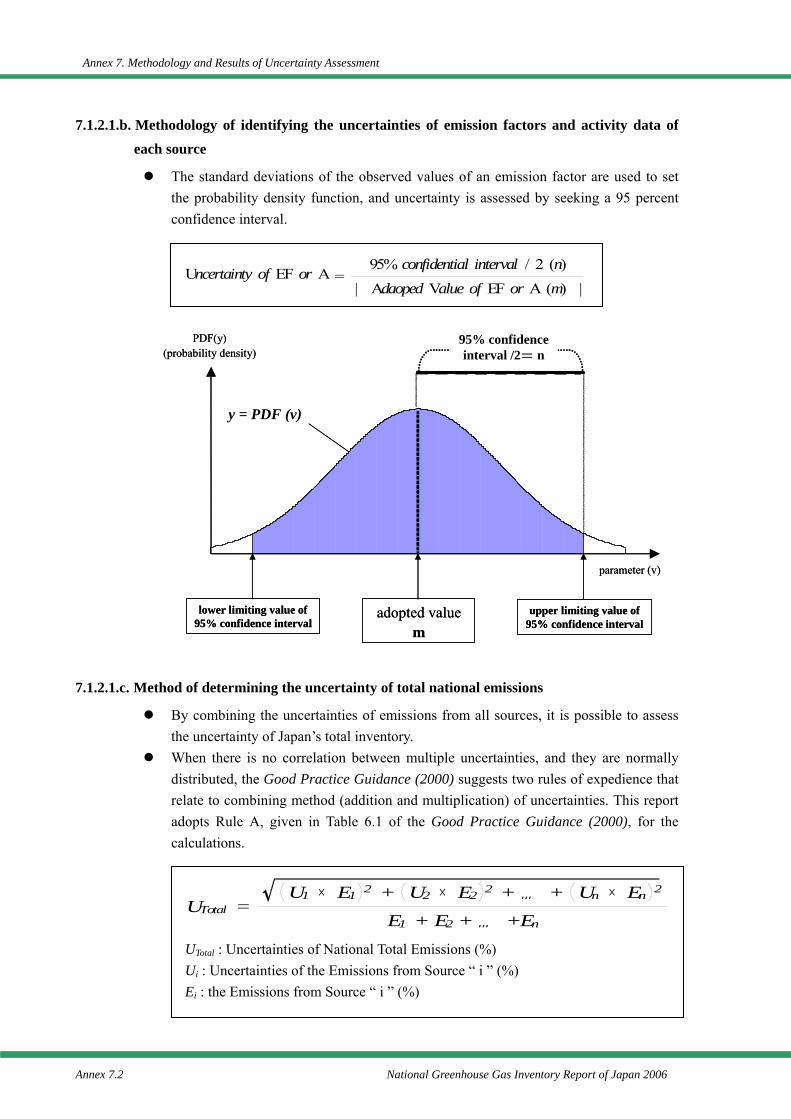
Annex 7. Methodology and Results of Uncertainty Assessment
Annex 7.2 National Greenhouse Gas Inventory Report of Japan 2006
7.1.2.1.b. Methodology of identifying the uncertainties of emission factors and activity data of each source
The standard deviations of the observed values of an emission factor are used to set the probability density function, and uncertainty is assessed by seeking a 95 percent confidence interval.
7.1.2.1.c. Method of determining the uncertainty of total national emissions
By combining the uncertainties of emissions from all sources, it is possible to assess the uncertainty of Japan’s total inventory.
When there is no correlation between multiple uncertainties, and they are normally distributed, the Good Practice Guidance (2000) suggests two rules of expedience that relate to combining method (addition and multiplication) of uncertainties. This report adopts Rule A, given in Table 6.1 of the Good Practice Guidance (2000), for the calculations.
UTotal : Uncertainties of National Total Emissions (%) Ui : Uncertainties of the Emissions from Source “ i ” (%) Ei : the Emissions from Source “ i ” (%)
Uncertainty of EF or A =| Adaoped Value of EF or A (m) |
95% confidential interval / 2 (n)
adopted valuem
PDF(y)(probability density)
95% confidence interval /2= n
y = PDF (v)
lower limiting value of 95% confidence interval
upper limiting value of 95% confidence interval
parameter (v)
adopted valuem
PDF(y)(probability density)
95% confidence interval /2= n
y = PDF (v)
lower limiting value of 95% confidence interval
upper limiting value of 95% confidence interval
parameter (v)
UTotal =U1 × E1 2 + U2 × E2 2 + … + Un × En 2
E1 + E2 + … +En
Annex 7. Methodology and Results of Uncertainty Assessment
National Greenhouse Gas Inventory Report of Japan 2006 Annex 7.3
7.1.2.2. Targets of the Uncertainty Assessment
The Good Practice Guidance (2000) suggests that all uncertainties be taken into account when estimating emissions. It indicates that the following may be the reasons of uncertainty in emission factors or activity data.
Examples of common reasons of uncertainty in emission factors
Uncertainties associated with a continuous monitoring of emissions - Refers to uncertainties arising from differences in conditions at the time of measurement,
such as measurements that are taken annually.
Uncertainties associated with an establishment of emission factors - Startup and shutdown in operation of machinery, etc., can give different emission rates
relative to activity data. In these cases, the data should be partitioned, with separate emission factors and probability density functions derived for steady-state, startup and shutdown conditions.
- Emission factors may depend on load of operation. In these cases, the estimation of total
emissions and the uncertainty analysis may need to be stratified to take account of load, which is expressed, for example, as a percentage of full capacity. This could be done by the regression analysis and scatter plots of the emission rate against seemingly influential variables (e.g., emissions versus load) with load becoming a part of the required activity data.
- Adoption of results from measurements taken for other purposes may not be representative.
For example, methane measurements made for safety reasons at coalmines and landfills may not reflect total emissions. In such cases, the ratio between the measured data and total emissions should be estimated for the uncertainty analysis.
Uncertainties associated with an estimation of emission factors from limited measured data
- The distribution of emission factors may often differ from the normal distribution. When the distribution is already known, it is appropriate to estimate according to expert judgment, by appending a document that provides the theoretical background.
Examples of common reasons of uncertainty in activity data Interpretation of statistical differences: Statistical differences in energy balances usually
represent a difference between amounts of primary fuels and amounts of fuels identified in the categories under ‘final consumption’ and ‘in transformation’. They can give an indication of sizes of the uncertainties of the data, especially where long time series are considered.
Interpretation of energy balances: Production, use, and import/export data should be consistent. If not, this may give an indication of the uncertainties.
Crosschecks: It may be possible to compare two types of activity data that apply to the same source to provide an indication of uncertainty ranges. For example, the sum of vehicle fuel consumption should be commensurate with the total of fuel consumption calculated by multiplying vehicle-km by fuel consumption efficiency for all types of vehicles.
Vehicle numbers and types: Some countries maintain detailed vehicle registration databases with data on vehicles by type, age, fuel type, and emission control technology, all of which can be important for a detailed bottom-up inventory of methane (CH4) and nitrous oxide (N2O) emissions from such vehicles. Others do not have such detailed information and this will tend to increase the uncertainty.
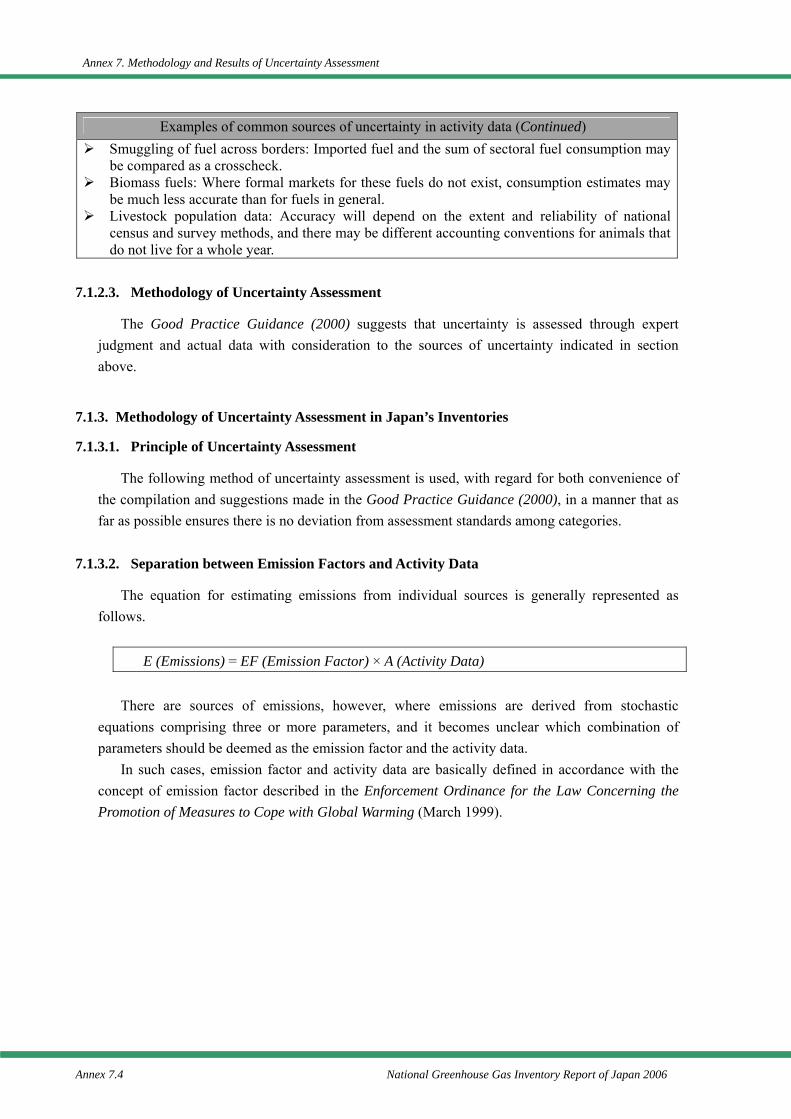
Annex 7. Methodology and Results of Uncertainty Assessment
Annex 7.4 National Greenhouse Gas Inventory Report of Japan 2006
Examples of common sources of uncertainty in activity data (Continued) Smuggling of fuel across borders: Imported fuel and the sum of sectoral fuel consumption may
be compared as a crosscheck. Biomass fuels: Where formal markets for these fuels do not exist, consumption estimates may
be much less accurate than for fuels in general. Livestock population data: Accuracy will depend on the extent and reliability of national
census and survey methods, and there may be different accounting conventions for animals that do not live for a whole year.
7.1.2.3. Methodology of Uncertainty Assessment
The Good Practice Guidance (2000) suggests that uncertainty is assessed through expert judgment and actual data with consideration to the sources of uncertainty indicated in section above.
7.1.3. Methodology of Uncertainty Assessment in Japan’s Inventories
7.1.3.1. Principle of Uncertainty Assessment
The following method of uncertainty assessment is used, with regard for both convenience of the compilation and suggestions made in the Good Practice Guidance (2000), in a manner that as far as possible ensures there is no deviation from assessment standards among categories.
7.1.3.2. Separation between Emission Factors and Activity Data
The equation for estimating emissions from individual sources is generally represented as follows.
E (Emissions) = EF (Emission Factor) × A (Activity Data)
There are sources of emissions, however, where emissions are derived from stochastic
equations comprising three or more parameters, and it becomes unclear which combination of parameters should be deemed as the emission factor and the activity data.
In such cases, emission factor and activity data are basically defined in accordance with the concept of emission factor described in the Enforcement Ordinance for the Law Concerning the Promotion of Measures to Cope with Global Warming (March 1999).
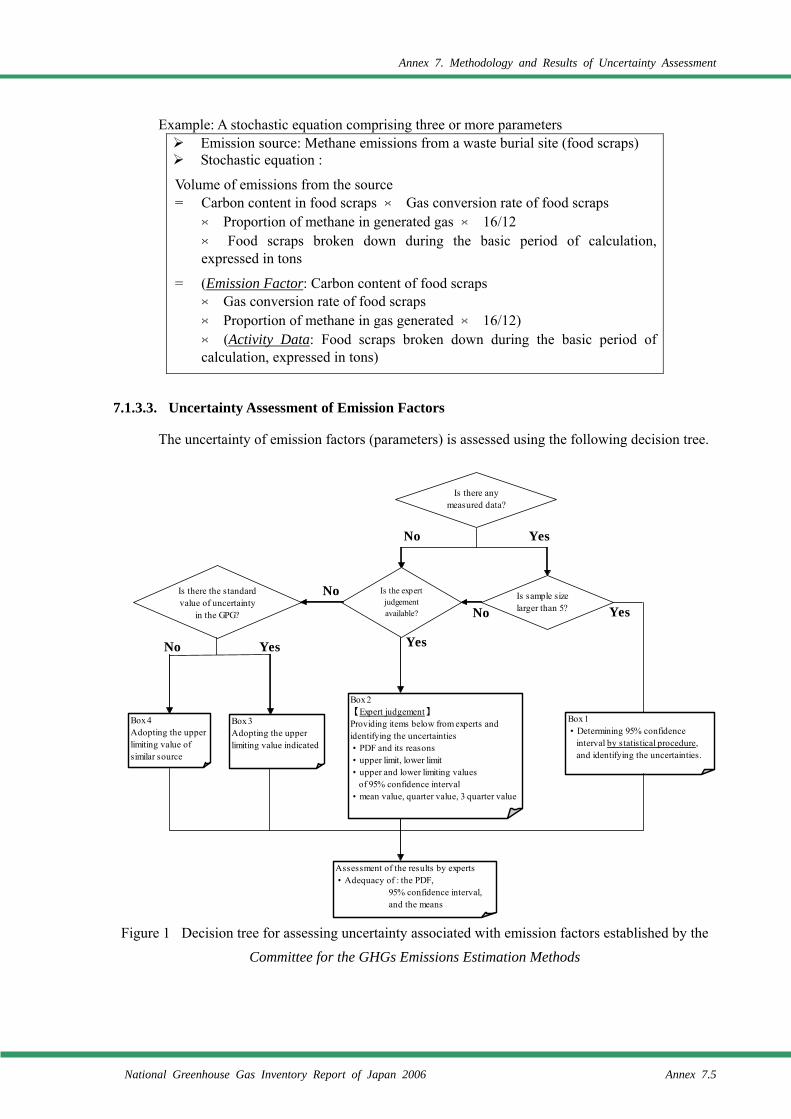
Annex 7. Methodology and Results of Uncertainty Assessment
National Greenhouse Gas Inventory Report of Japan 2006 Annex 7.5
Example: A stochastic equation comprising three or more parameters Emission source: Methane emissions from a waste burial site (food scraps) Stochastic equation :
Volume of emissions from the source = Carbon content in food scraps × Gas conversion rate of food scraps
× Proportion of methane in generated gas × 16/12 × Food scraps broken down during the basic period of calculation, expressed in tons
= (Emission Factor: Carbon content of food scraps × Gas conversion rate of food scraps × Proportion of methane in gas generated × 16/12) × (Activity Data: Food scraps broken down during the basic period of calculation, expressed in tons)
7.1.3.3. Uncertainty Assessment of Emission Factors
The uncertainty of emission factors (parameters) is assessed using the following decision tree.
Figure 1 Decision tree for assessing uncertainty associated with emission factors established by the
Committee for the GHGs Emissions Estimation Methods
Is there any
measured data?
Is sample sizelarger than 5?
Is the expertjudgementavailable?
YesNo
Yes
Assessment of the results by experts・Adequacy of : the PDF, 95% confidence interval, and the means
Is there the standardvalue of uncertainty
in the GPG?
Box 3Adopting the upperlimiting value indicated
YesNo
Box 2【Expert judgement】Providing items below from experts andidentifying the uncertainties・PDF and its reasons・upper limit, lower limit・upper and lower limiting values of 95% confidence interval・mean value, quarter value, 3 quarter value
Box 4Adopting the upperlimiting value ofsimilar source
No
Yes
No
Box 1・Determining 95% confidence interval by statistical procedure, and identifying the uncertainties.
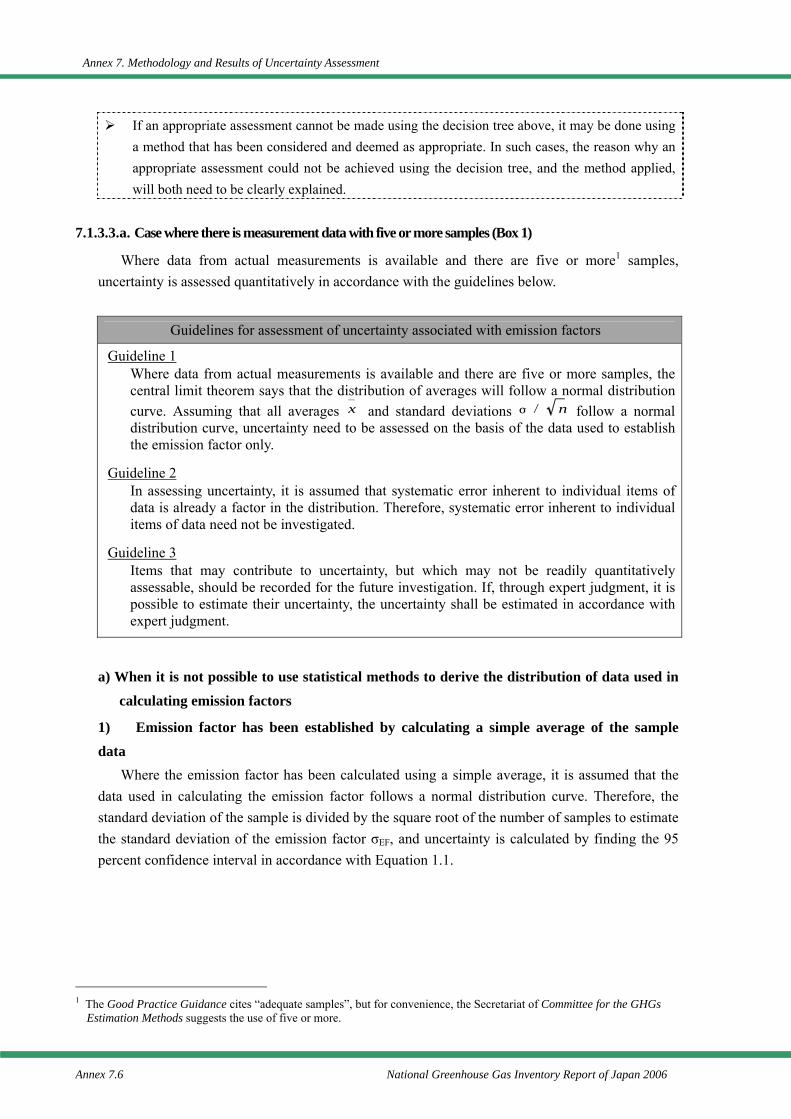
Annex 7. Methodology and Results of Uncertainty Assessment
Annex 7.6 National Greenhouse Gas Inventory Report of Japan 2006
If an appropriate assessment cannot be made using the decision tree above, it may be done using a method that has been considered and deemed as appropriate. In such cases, the reason why an appropriate assessment could not be achieved using the decision tree, and the method applied, will both need to be clearly explained.
7.1.3.3.a. Case where there is measurement data with five or more samples (Box 1)
Where data from actual measurements is available and there are five or more1 samples, uncertainty is assessed quantitatively in accordance with the guidelines below.
a) When it is not possible to use statistical methods to derive the distribution of data used in calculating emission factors
1) Emission factor has been established by calculating a simple average of the sample data
Where the emission factor has been calculated using a simple average, it is assumed that the data used in calculating the emission factor follows a normal distribution curve. Therefore, the standard deviation of the sample is divided by the square root of the number of samples to estimate the standard deviation of the emission factor σEF, and uncertainty is calculated by finding the 95 percent confidence interval in accordance with Equation 1.1.
1 The Good Practice Guidance cites “adequate samples”, but for convenience, the Secretariat of Committee for the GHGs
Estimation Methods suggests the use of five or more.
Guidelines for assessment of uncertainty associated with emission factors
Guideline 1 Where data from actual measurements is available and there are five or more samples, the central limit theorem says that the distribution of averages will follow a normal distribution curve. Assuming that all averages x and standard deviations s / n follow a normal distribution curve, uncertainty need to be assessed on the basis of the data used to establish the emission factor only.
Guideline 2 In assessing uncertainty, it is assumed that systematic error inherent to individual items of data is already a factor in the distribution. Therefore, systematic error inherent to individual items of data need not be investigated.
Guideline 3 Items that may contribute to uncertainty, but which may not be readily quantitatively assessable, should be recorded for the future investigation. If, through expert judgment, it is possible to estimate their uncertainty, the uncertainty shall be estimated in accordance with expert judgment.
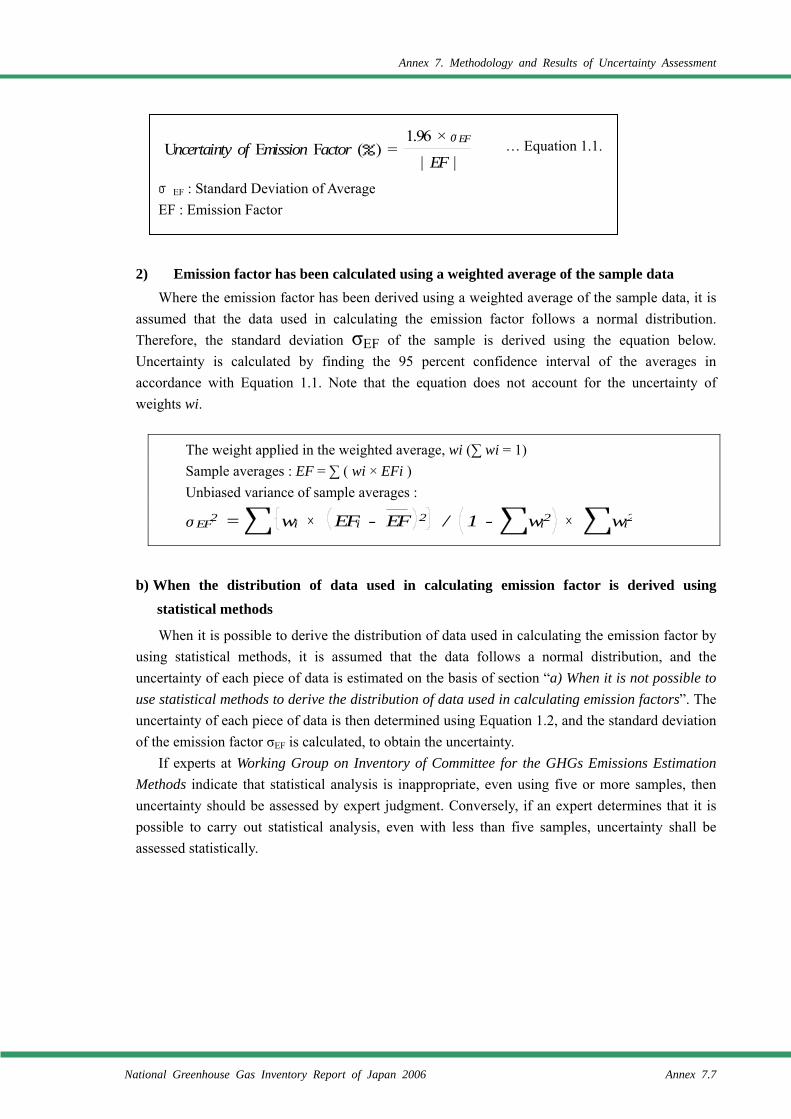
Annex 7. Methodology and Results of Uncertainty Assessment
National Greenhouse Gas Inventory Report of Japan 2006 Annex 7.7
… Equation 1.1. σEF : Standard Deviation of Average EF : Emission Factor
2) Emission factor has been calculated using a weighted average of the sample data Where the emission factor has been derived using a weighted average of the sample data, it is
assumed that the data used in calculating the emission factor follows a normal distribution. Therefore, the standard deviation σEF of the sample is derived using the equation below. Uncertainty is calculated by finding the 95 percent confidence interval of the averages in accordance with Equation 1.1. Note that the equation does not account for the uncertainty of weights wi.
The weight applied in the weighted average, wi (∑ wi = 1) Sample averages : EF = ∑ ( wi × EFi ) Unbiased variance of sample averages :
b) When the distribution of data used in calculating emission factor is derived using statistical methods
When it is possible to derive the distribution of data used in calculating the emission factor by using statistical methods, it is assumed that the data follows a normal distribution, and the uncertainty of each piece of data is estimated on the basis of section “a) When it is not possible to use statistical methods to derive the distribution of data used in calculating emission factors”. The uncertainty of each piece of data is then determined using Equation 1.2, and the standard deviation of the emission factor σEF is calculated, to obtain the uncertainty.
If experts at Working Group on Inventory of Committee for the GHGs Emissions Estimation Methods indicate that statistical analysis is inappropriate, even using five or more samples, then uncertainty should be assessed by expert judgment. Conversely, if an expert determines that it is possible to carry out statistical analysis, even with less than five samples, uncertainty shall be assessed statistically.
Uncertainty of Emission Factor (%) =1.96 × s EF
| EF |
sEF2 = wi × EFi - EF 2 / 1 - wi2 × wi2
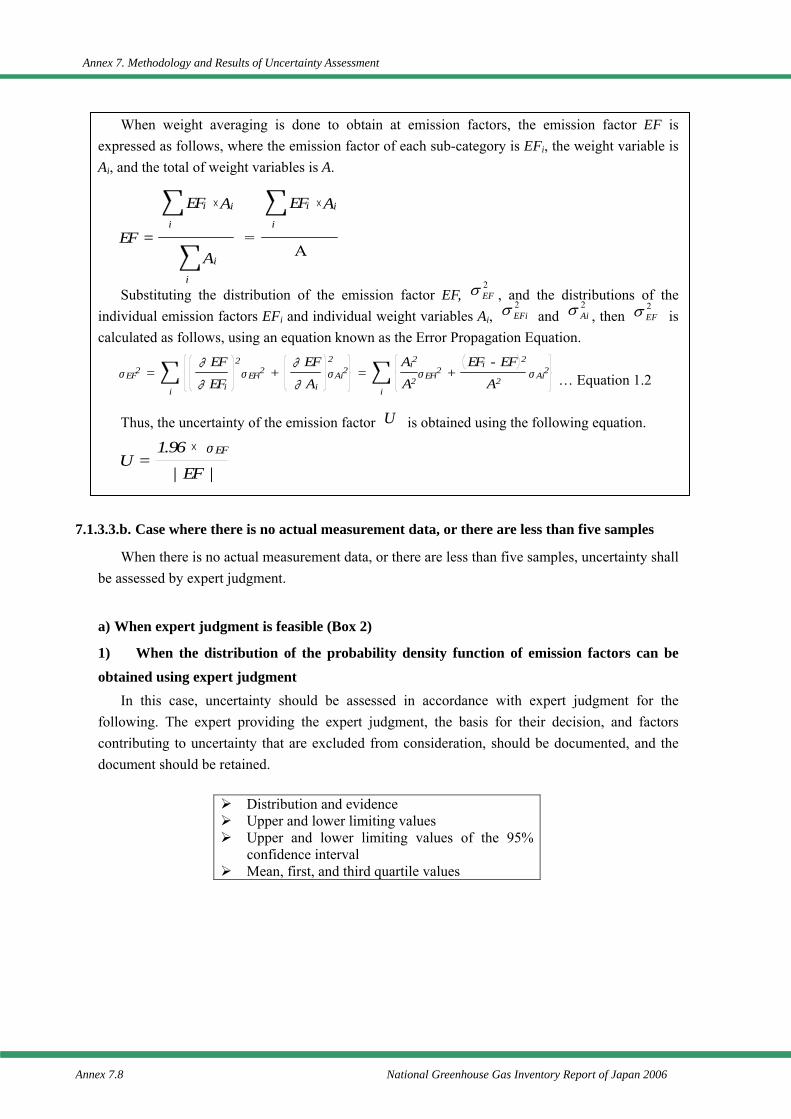
Annex 7. Methodology and Results of Uncertainty Assessment
Annex 7.8 National Greenhouse Gas Inventory Report of Japan 2006
When weight averaging is done to obtain at emission factors, the emission factor EF is expressed as follows, where the emission factor of each sub-category is EFi, the weight variable is Ai, and the total of weight variables is A.
Substituting the distribution of the emission factor EF,
2EFσ , and the distributions of the
individual emission factors EFi and individual weight variables Ai, 2EFiσ and
2Aiσ , then
2EFσ is
calculated as follows, using an equation known as the Error Propagation Equation. … Equation 1.2 Thus, the uncertainty of the emission factor U is obtained using the following equation.
7.1.3.3.b. Case where there is no actual measurement data, or there are less than five samples
When there is no actual measurement data, or there are less than five samples, uncertainty shall be assessed by expert judgment.
a) When expert judgment is feasible (Box 2)
1) When the distribution of the probability density function of emission factors can be obtained using expert judgment
In this case, uncertainty should be assessed in accordance with expert judgment for the following. The expert providing the expert judgment, the basis for their decision, and factors contributing to uncertainty that are excluded from consideration, should be documented, and the document should be retained.
Distribution and evidence Upper and lower limiting values Upper and lower limiting values of the 95%
confidence interval Mean, first, and third quartile values
sEF2 =i ∂EFi
∂EF 2sEFi2 +
∂EF
∂Ai
2
sAi2 =i
Ai2
A2sEFi2 +
EFi - EF 2
A2s Ai2
EF =i
EFi ×Ai
i
Ai
=i
EFi ×Ai
A
U =1.96 × sEF
| EF |
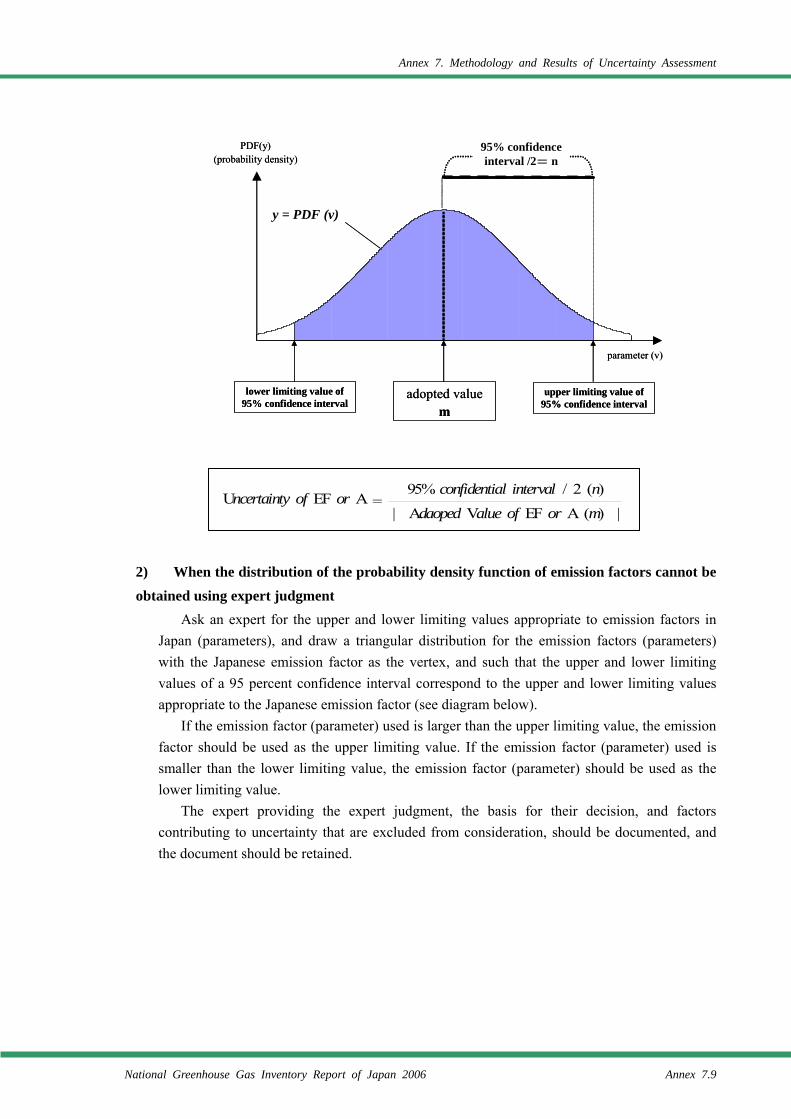
Annex 7. Methodology and Results of Uncertainty Assessment
National Greenhouse Gas Inventory Report of Japan 2006 Annex 7.9
2) When the distribution of the probability density function of emission factors cannot be obtained using expert judgment
Ask an expert for the upper and lower limiting values appropriate to emission factors in Japan (parameters), and draw a triangular distribution for the emission factors (parameters) with the Japanese emission factor as the vertex, and such that the upper and lower limiting values of a 95 percent confidence interval correspond to the upper and lower limiting values appropriate to the Japanese emission factor (see diagram below).
If the emission factor (parameter) used is larger than the upper limiting value, the emission factor should be used as the upper limiting value. If the emission factor (parameter) used is smaller than the lower limiting value, the emission factor (parameter) should be used as the lower limiting value.
The expert providing the expert judgment, the basis for their decision, and factors contributing to uncertainty that are excluded from consideration, should be documented, and the document should be retained.
adopted valuem
PDF(y)(probability density)
95% confidence interval /2= n
y = PDF (v)
lower limiting value of 95% confidence interval
upper limiting value of 95% confidence interval
parameter (v)
adopted valuem
PDF(y)(probability density)
95% confidence interval /2= n
y = PDF (v)
lower limiting value of 95% confidence interval
upper limiting value of 95% confidence interval
parameter (v)
Uncertainty of EF or A =| Adaoped Value of EF or A (m) |
95% confidential interval / 2 (n)
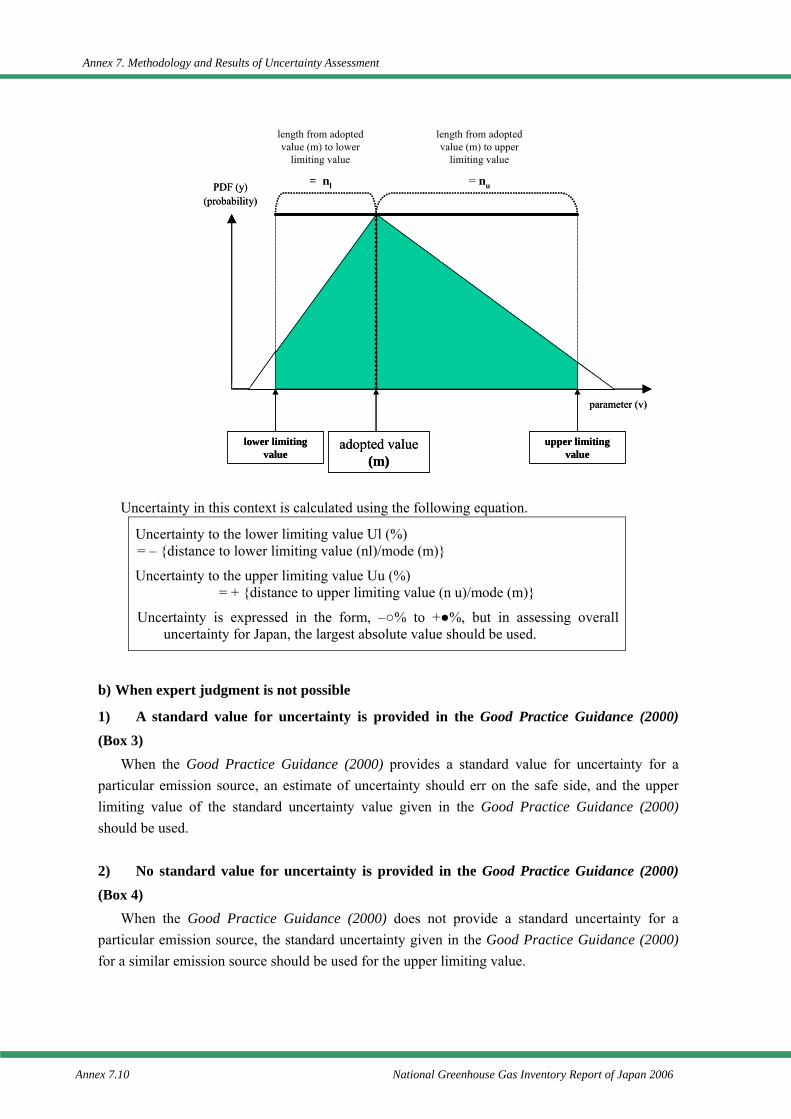
Annex 7. Methodology and Results of Uncertainty Assessment
Annex 7.10 National Greenhouse Gas Inventory Report of Japan 2006
Uncertainty in this context is calculated using the following equation.
Uncertainty to the lower limiting value Ul (%) = – {distance to lower limiting value (nl)/mode (m)}
Uncertainty to the upper limiting value Uu (%)
= + {distance to upper limiting value (n u)/mode (m)}
Uncertainty is expressed in the form, –○% to +●%, but in assessing overall uncertainty for Japan, the largest absolute value should be used.
b) When expert judgment is not possible
1) A standard value for uncertainty is provided in the Good Practice Guidance (2000) (Box 3)
When the Good Practice Guidance (2000) provides a standard value for uncertainty for a particular emission source, an estimate of uncertainty should err on the safe side, and the upper limiting value of the standard uncertainty value given in the Good Practice Guidance (2000) should be used.
2) No standard value for uncertainty is provided in the Good Practice Guidance (2000) (Box 4)
When the Good Practice Guidance (2000) does not provide a standard uncertainty for a particular emission source, the standard uncertainty given in the Good Practice Guidance (2000) for a similar emission source should be used for the upper limiting value.
adopted value (m)
PDF (y)(probability)
lower limiting value
length from adopted value (m) to lower
limiting value
= nl
upper limiting value
length from adopted value (m) to upper
limiting value
= nu
parameter (v)
adopted value (m)
PDF (y)(probability)
lower limiting value
length from adopted value (m) to lower
limiting value
= nl
upper limiting value
length from adopted value (m) to upper
limiting value
= nu
parameter (v)
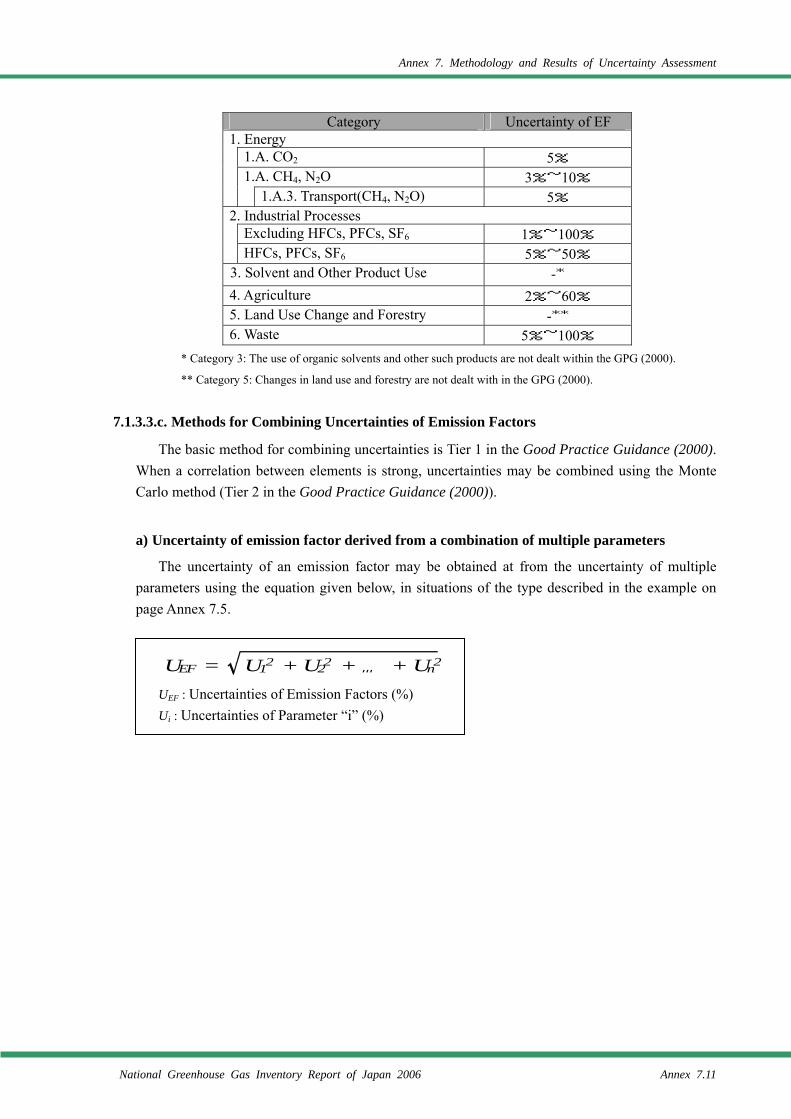
Annex 7. Methodology and Results of Uncertainty Assessment
National Greenhouse Gas Inventory Report of Japan 2006 Annex 7.11
Category Uncertainty of EF 1. Energy 1.A. CO2 5% 1.A. CH4, N2O 3%~10% 1.A.3. Transport(CH4, N2O) 5% 2. Industrial Processes Excluding HFCs, PFCs, SF6 1%~100% HFCs, PFCs, SF6 5%~50% 3. Solvent and Other Product Use -*
4. Agriculture 2%~60% 5. Land Use Change and Forestry -**
6. Waste 5%~100% * Category 3: The use of organic solvents and other such products are not dealt within the GPG (2000).
** Category 5: Changes in land use and forestry are not dealt with in the GPG (2000).
7.1.3.3.c. Methods for Combining Uncertainties of Emission Factors
The basic method for combining uncertainties is Tier 1 in the Good Practice Guidance (2000). When a correlation between elements is strong, uncertainties may be combined using the Monte Carlo method (Tier 2 in the Good Practice Guidance (2000)).
a) Uncertainty of emission factor derived from a combination of multiple parameters
The uncertainty of an emission factor may be obtained at from the uncertainty of multiple parameters using the equation given below, in situations of the type described in the example on page Annex 7.5.
UEF : Uncertainties of Emission Factors (%) Ui : Uncertainties of Parameter “i” (%)
UEF = U12 + U22 + … + Un2
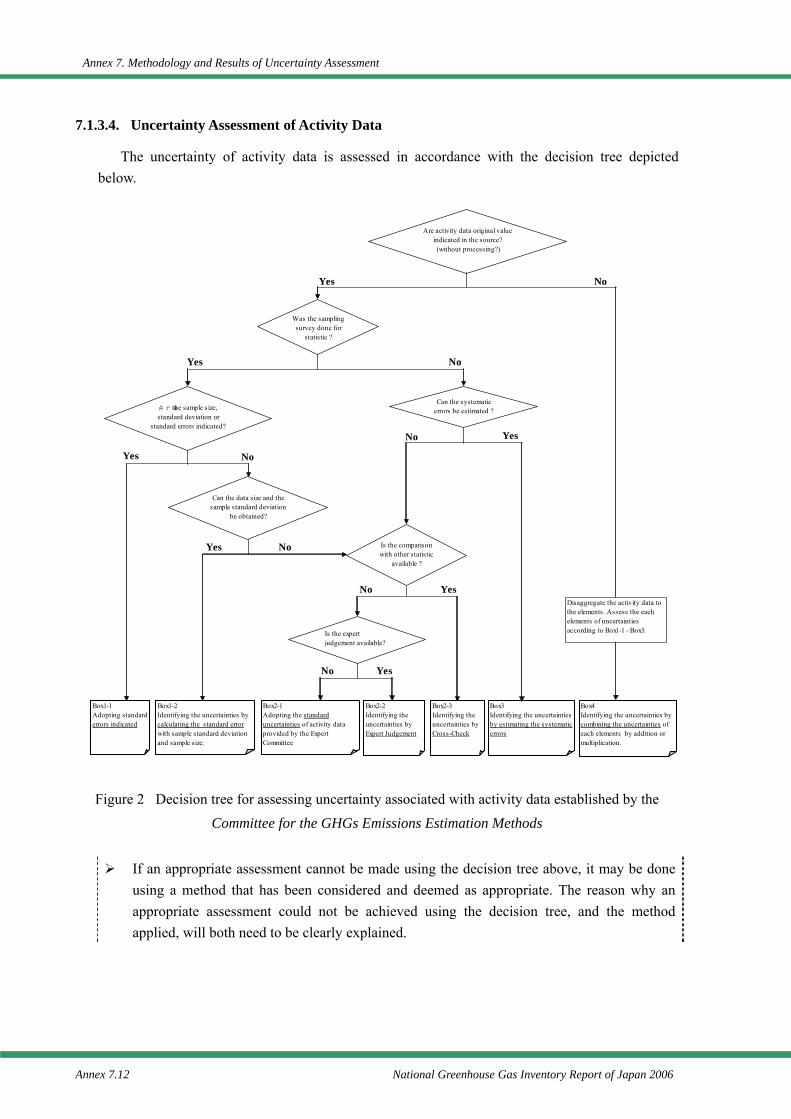
Annex 7. Methodology and Results of Uncertainty Assessment
Annex 7.12 National Greenhouse Gas Inventory Report of Japan 2006
7.1.3.4. Uncertainty Assessment of Activity Data
The uncertainty of activity data is assessed in accordance with the decision tree depicted below.
Figure 2 Decision tree for assessing uncertainty associated with activity data established by the
Committee for the GHGs Emissions Estimation Methods
If an appropriate assessment cannot be made using the decision tree above, it may be done using a method that has been considered and deemed as appropriate. The reason why an appropriate assessment could not be achieved using the decision tree, and the method applied, will both need to be clearly explained.
Are activity data original value
indicated in the source? (without processing?)
NoYes
Was the samplingsurvey done for
statistic ?
NoYes
Is the comparisonwith other statistic
available ?
Box1-2Identifying the uncertainties bycalculating the standard errorwith sample standard deviationand sample size.
Can the systematicerrors be estimated ?
Box2-1Adopting the standarduncertainties of activity dataprovided by the ExpertCommittee
No Yes
Box2-3Identifying theuncertainties byCross-Check
Is the expertjudgement available?
Are the sample size,standard deviation or
standard errors indicated?
No Yes
Box2-2Identifying theuncertainties byExpert Judgement
Box1-1Adopting standarderrors indicated
Box4Identifying the uncertainties bycombining the uncertainties ofeach elements by addition ormultiplication.
NoYes
Disaggregate the activity data tothe elements. Assess the eachelements of uncertaintiesaccording to Box1-1 - Box3.
Can the data size and thesample standard deviation
be obtained?
Yes No
Box3Identifying the uncertaintiesby estimating the systematicerrors
YesNo
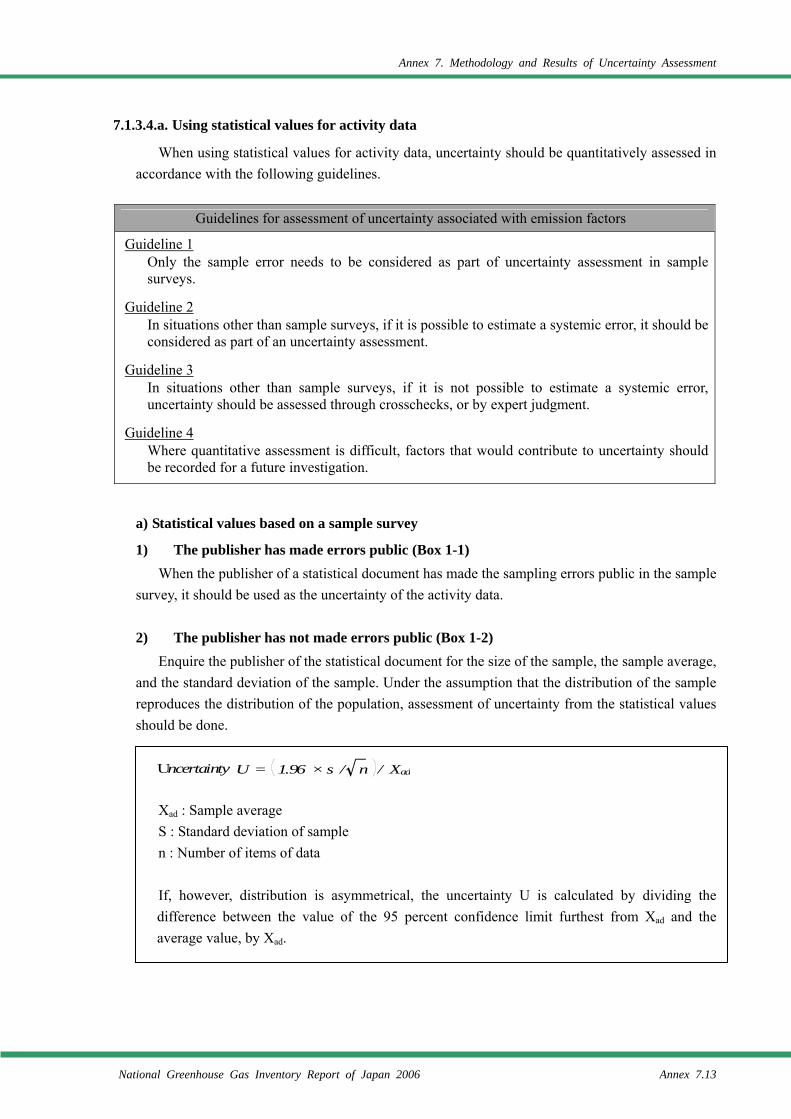
Annex 7. Methodology and Results of Uncertainty Assessment
National Greenhouse Gas Inventory Report of Japan 2006 Annex 7.13
7.1.3.4.a. Using statistical values for activity data
When using statistical values for activity data, uncertainty should be quantitatively assessed in accordance with the following guidelines.
Guidelines for assessment of uncertainty associated with emission factors
Guideline 1 Only the sample error needs to be considered as part of uncertainty assessment in sample surveys.
Guideline 2 In situations other than sample surveys, if it is possible to estimate a systemic error, it should be considered as part of an uncertainty assessment.
Guideline 3 In situations other than sample surveys, if it is not possible to estimate a systemic error, uncertainty should be assessed through crosschecks, or by expert judgment.
Guideline 4 Where quantitative assessment is difficult, factors that would contribute to uncertainty should be recorded for a future investigation.
a) Statistical values based on a sample survey
1) The publisher has made errors public (Box 1-1) When the publisher of a statistical document has made the sampling errors public in the sample
survey, it should be used as the uncertainty of the activity data.
2) The publisher has not made errors public (Box 1-2) Enquire the publisher of the statistical document for the size of the sample, the sample average,
and the standard deviation of the sample. Under the assumption that the distribution of the sample reproduces the distribution of the population, assessment of uncertainty from the statistical values should be done.
Xad : Sample average S : Standard deviation of sample n : Number of items of data If, however, distribution is asymmetrical, the uncertainty U is calculated by dividing the difference between the value of the 95 percent confidence limit furthest from Xad and the average value, by Xad.
Uncertainty U = 1.96 × s / n / Xad
Annex 7. Methodology and Results of Uncertainty Assessment
Annex 7.14 National Greenhouse Gas Inventory Report of Japan 2006
Confirmation of the estimation method for Japan from values drawn from the sample survey and, as far as possible, estimation of the uncertainty associated with the estimation method should be done also (e.g., multiply the sample average of the number of head of livestock raised per farm by the number of farms).
3) Amount of data and sample standard deviation are not available, and crosschecking is possible (Box 2-3)
In the case of statistics drawn from a sample survey, where the amount of data and the sample standard deviation are not available, but it is possible to compare the relevant statistical value with multiple other statistical values, uncertainty should be assessed using the same means as in the second case described at section A1.2.3 in the page A1.7 of the Good Practice Guidance (2000).
Xap : Value used for activity data s : Standard deviation (data to be cross-checked) However, if a distribution is asymmetrical, the uncertainty U may be calculated by dividing the difference between the value of the 95 percent confidence limit furthest from Xad and the average value, by Xad. Also, when there is a single other statistical value only, the assessment should be done using
the same method described at 2) “When the distribution of the probability density function of emission factors cannot be obtained using expert judgment” in Section 7.1.3.3.b..
4) Amount of data and sample standard deviation are not available, and expert judgment is available (Box 2-2)
In the case of statistics drawn from a sample survey where the amount of data and sample standard deviation are not available, ask an expert for the upper and lower limiting values appropriate to activity data in Japan, and draw a triangular distribution for activity data (see diagram at page Annex 7.9 ) with the Japanese activity data as the vertex, and such that the upper and lower limiting values of a 95 percent confidence interval correspond to the upper and lower limiting values appropriate to the Japanese activity data.
If the activity data used is larger than the upper limiting value, that activity data should be used as the upper limiting value. If the activity data used is smaller than the lower limiting value, that emission factor (parameter) should be taken as the lower limiting value.
The experts providing the expert judgment, the basis for their decision, and factors contributing to uncertainty that are excluded from consideration, should be documented, and the document should be retained.
Uncertainty U = 1.96 × s / Xap
Annex 7. Methodology and Results of Uncertainty Assessment
National Greenhouse Gas Inventory Report of Japan 2006 Annex 7.15
5) Amount of data and sample standard deviation are not available, and expert judgment is unavailable (Box 2-3)
The following standard values established by the Committee for the GHGs Emissions Estimations Methods will be used.
Table 1 Uncertainty of sample statistics established by the Committee for the GHGs Emissions
Estimation Methods The values for designated statistics, approved statistics, and reported statistics have been established by the Committee for the GHGs Emissions Estimation Methods, with reference to the Good Practice Guidance (2000) and other material. Statistics other than designated statistics have been deemed to be twice the designated statistics.
b) Statistical values not based on a sample survey
1) Systemic error can be estimated (Box 3) Where a systemic error can be estimated, it should be estimated and used. The method by
which the systemic error is calculated should be documented, and the document should be retained.
2) Systemic error cannot be estimated, and crosschecking is possible (Box 2-3)
Where systemic error cannot be estimated, but it is possible to compare the relevant statistical value with other statistical values, uncertainty should be assessed using the same means as in Case 2 described at A1.2.3 of Section A1.7 of the Good Practice Guidance (2000).
3) Systemic error cannot be estimated, crosschecking is not possible, and expert judgment is available (Box 2-2)
Same as for “4) Amount of data and sample standard deviation are not available, and expert judgment is available (Box 2-2)” on the previous page.
4) Systemic error cannot be estimated, crosschecking is not possible, and expert judgment is unavailable (Box 2-1)
The following standard values established by the Committee for the GHGs Emissions Estimation Methods should be used.
Designated statistics Other statistics Sample survey 50 [%] 100 [%]
Annex 7. Methodology and Results of Uncertainty Assessment
Annex 7.16 National Greenhouse Gas Inventory Report of Japan 2006
Table 2 Uncertainty of sample statistics established by the Committee for the GHGs Emissions Estimation Methods
The values for designated statistics, approved statistics, and reported statistics have been established by the Committee for the GHGs Emissions Estimation Methods with reference to the Good Practice Guidance and other material. Statistics other than designated statistics have been deemed to be twice the designated statistics.
7.1.3.4.b. Using statistical values processesd as activity data (Box 3)
a) Breakdown of each element of activity data and assessment
Activity data should be broken down as shown in the following example.
Emission source : Carbon dioxide emission from incineration of naphtha in the chemical industry
Stochastic equation :
Activity data for relevant emission source = Naphtha consumption × 20% (remaining 80% is fixed in the product) 2 - ammonia raw material
After being broken down, each element of the statistical values should be assessed for
uncertainty using the method shown at section “7.1.3.4.a. Using statistical values for activity data”.
In the example above, for elements based on survey research, such as the figure of 20%, uncertainty should be assessed on the basis of the method shown at section “7.1.3.3. Uncertainty Assessment of Emission Factors”.
b) Combining elements
Combine each element using the sum and product methods of combination, and assess the uncertainty.
Sum method (Rule A): Where uncertainty quantities are to be combined by addition.
Activity data is expressed as A1 + A2 UAn : Uncertainty of element An (%)
2 Environmental Agency, The Estimation of CO2 Emission in Japan, 1992
Designated statistics Other statistics Survey of total population (no rounding) 5 [%] 10 [%]
Survey of total population (rounding) 20 [%] 40 [%]
UA-total =UA1 ×A1 2 + UA2 ×A2 2
A1 + A2
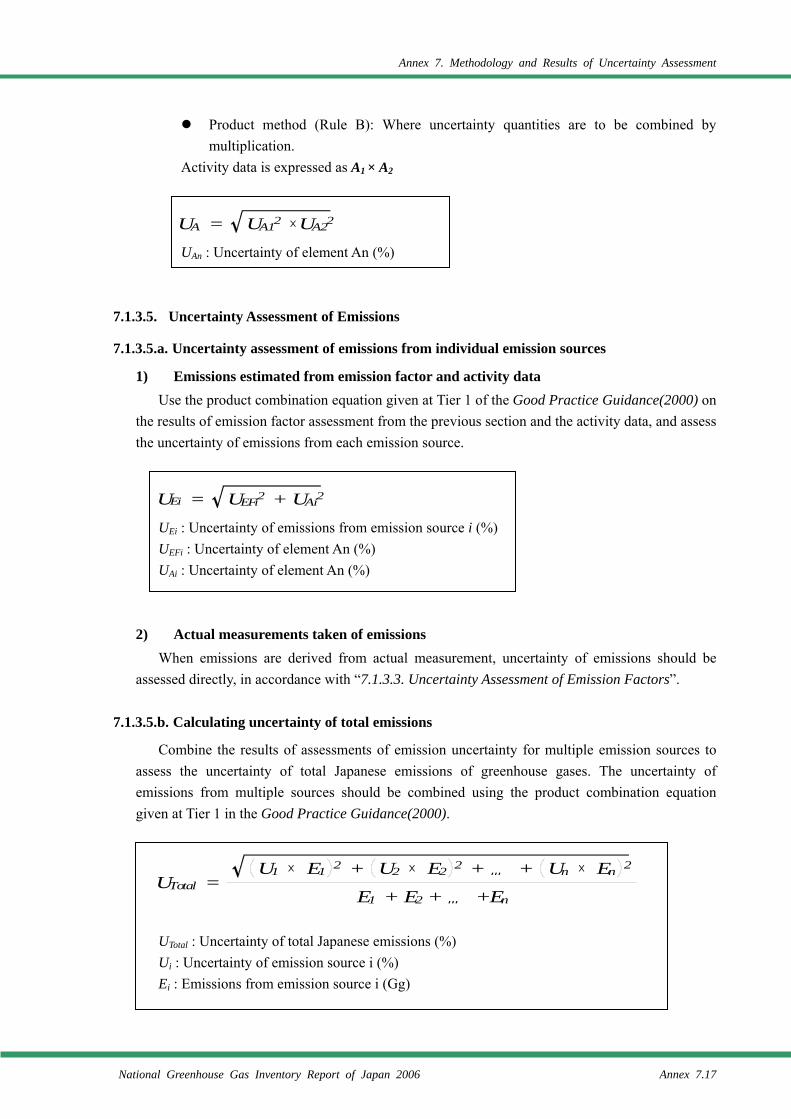
Annex 7. Methodology and Results of Uncertainty Assessment
National Greenhouse Gas Inventory Report of Japan 2006 Annex 7.17
Product method (Rule B): Where uncertainty quantities are to be combined by multiplication.
Activity data is expressed as A1 × A2 UAn : Uncertainty of element An (%)
7.1.3.5. Uncertainty Assessment of Emissions
7.1.3.5.a. Uncertainty assessment of emissions from individual emission sources
1) Emissions estimated from emission factor and activity data Use the product combination equation given at Tier 1 of the Good Practice Guidance(2000) on
the results of emission factor assessment from the previous section and the activity data, and assess the uncertainty of emissions from each emission source.
UEi : Uncertainty of emissions from emission source i (%) UEFi : Uncertainty of element An (%) UAi : Uncertainty of element An (%)
2) Actual measurements taken of emissions When emissions are derived from actual measurement, uncertainty of emissions should be
assessed directly, in accordance with “7.1.3.3. Uncertainty Assessment of Emission Factors”.
7.1.3.5.b. Calculating uncertainty of total emissions
Combine the results of assessments of emission uncertainty for multiple emission sources to assess the uncertainty of total Japanese emissions of greenhouse gases. The uncertainty of emissions from multiple sources should be combined using the product combination equation given at Tier 1 in the Good Practice Guidance(2000).
UTotal : Uncertainty of total Japanese emissions (%) Ui : Uncertainty of emission source i (%) Ei : Emissions from emission source i (Gg)
UA = UA12 ×UA22
UEi = UEFi2 + UAi2
UTotal =U1 × E1 2 + U2 × E2 2 + … + Un × En 2
E1 + E2 + … +En
Annex 7. Methodology and Results of Uncertainty Assessment
Annex 7.18 National Greenhouse Gas Inventory Report of Japan 2006
When the uncertainties of emissions from multiple sources are combined, only the uncertainty
of emissions should be indicated. Combination of the uncertainties for both emission factor and activity data should not be done.
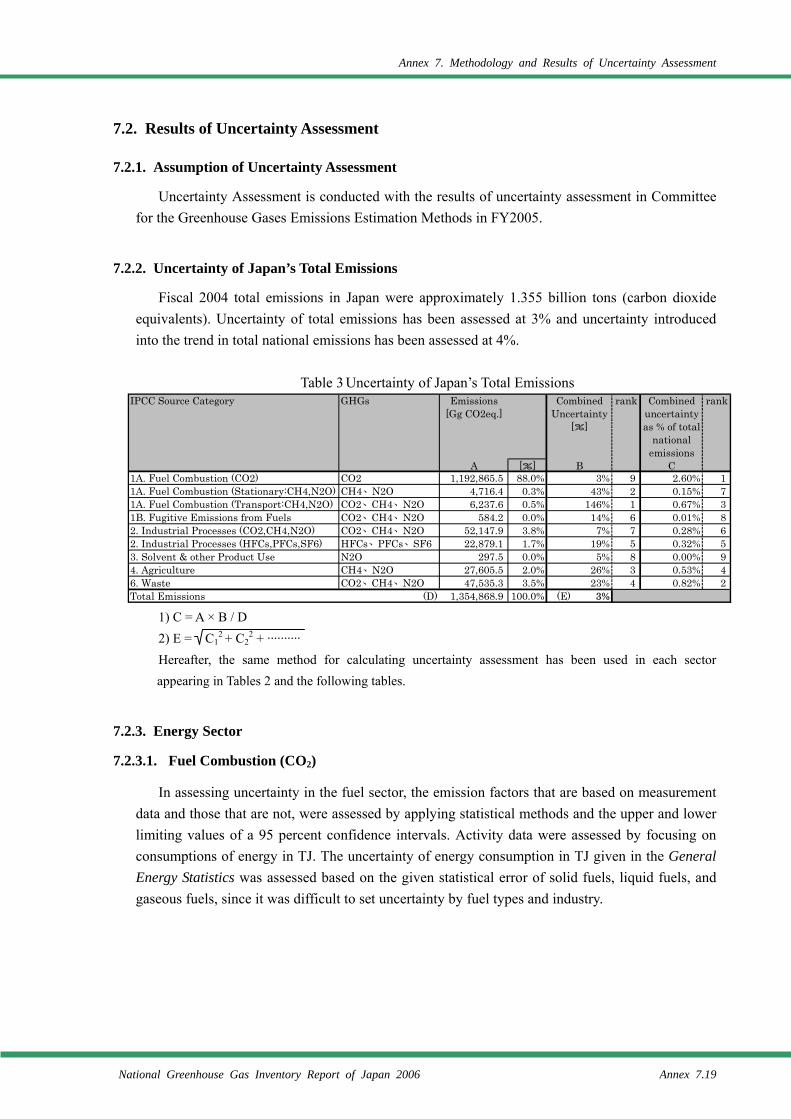
Annex 7. Methodology and Results of Uncertainty Assessment
National Greenhouse Gas Inventory Report of Japan 2006 Annex 7.19
7.2. Results of Uncertainty Assessment
7.2.1. Assumption of Uncertainty Assessment
Uncertainty Assessment is conducted with the results of uncertainty assessment in Committee for the Greenhouse Gases Emissions Estimation Methods in FY2005.
7.2.2. Uncertainty of Japan’s Total Emissions
Fiscal 2004 total emissions in Japan were approximately 1.355 billion tons (carbon dioxide equivalents). Uncertainty of total emissions has been assessed at 3% and uncertainty introduced into the trend in total national emissions has been assessed at 4%.
Table 3 Uncertainty of Japan’s Total Emissions
1) C = A × B / D 2) E = C1
2 + C22 + ··········
Hereafter, the same method for calculating uncertainty assessment has been used in each sector appearing in Tables 2 and the following tables.
7.2.3. Energy Sector
7.2.3.1. Fuel Combustion (CO2)
In assessing uncertainty in the fuel sector, the emission factors that are based on measurement data and those that are not, were assessed by applying statistical methods and the upper and lower limiting values of a 95 percent confidence intervals. Activity data were assessed by focusing on consumptions of energy in TJ. The uncertainty of energy consumption in TJ given in the General Energy Statistics was assessed based on the given statistical error of solid fuels, liquid fuels, and gaseous fuels, since it was difficult to set uncertainty by fuel types and industry.
IPCC Source Category GHGs Emissions[Gg CO2eq.]
rank Combineduncertaintyas % of total
nationalemissions
rank
A [%] C1A. Fuel Combustion (CO2) CO2 1,192,865.5 88.0% 3% 9 2.60% 11A. Fuel Combustion (Stationary:CH4,N2O) CH4、N2O 4,716.4 0.3% 43% 2 0.15% 71A. Fuel Combustion (Transport:CH4,N2O) CO2、CH4、N2O 6,237.6 0.5% 146% 1 0.67% 31B. Fugitive Emissions from Fuels CO2、CH4、N2O 584.2 0.0% 14% 6 0.01% 82. Industrial Processes (CO2,CH4,N2O) CO2、CH4、N2O 52,147.9 3.8% 7% 7 0.28% 62. Industrial Processes (HFCs,PFCs,SF6) HFCs、PFCs、SF6 22,879.1 1.7% 19% 5 0.32% 53. Solvent & other Product Use N2O 297.5 0.0% 5% 8 0.00% 94. Agriculture CH4、N2O 27,605.5 2.0% 26% 3 0.53% 46. Waste CO2、CH4、N2O 47,535.3 3.5% 23% 4 0.82% 2Total Emissions (D) 1,354,868.9 100.0% (E) 3%
CombinedUncertainty
[%]
B
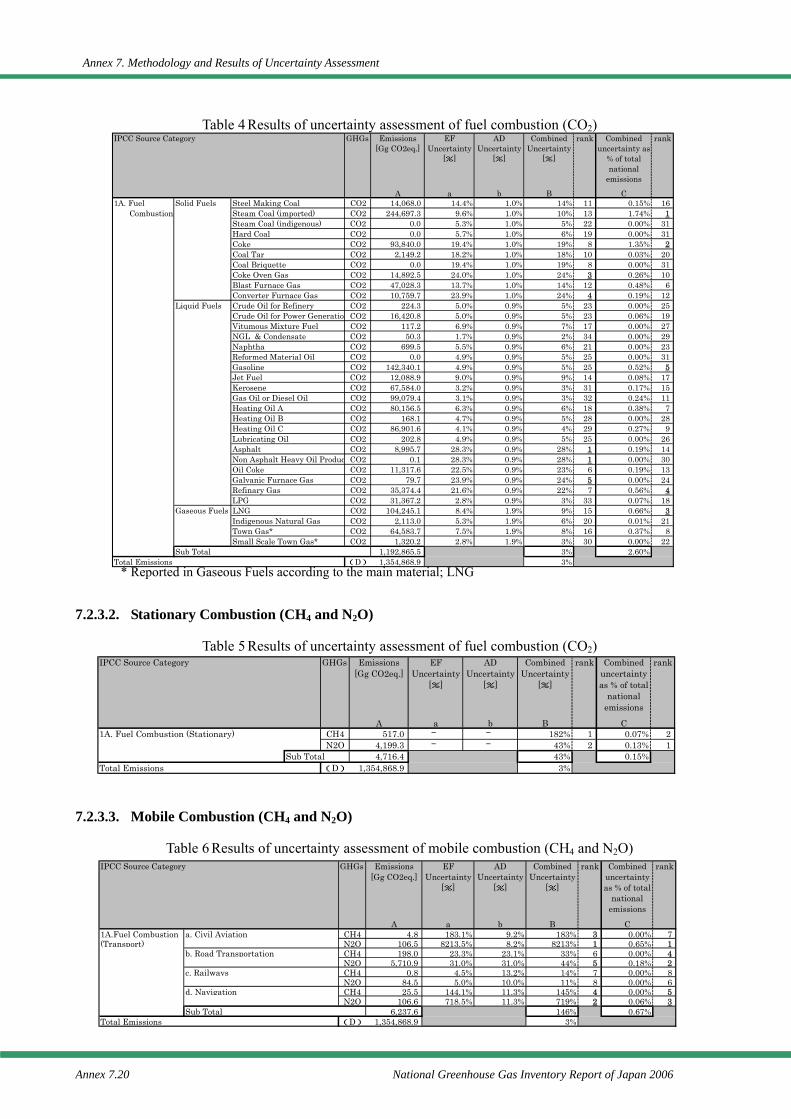
Annex 7. Methodology and Results of Uncertainty Assessment
Annex 7.20 National Greenhouse Gas Inventory Report of Japan 2006
Table 4 Results of uncertainty assessment of fuel combustion (CO2) * Reported in Gaseous Fuels according to the main material; LNG
7.2.3.2. Stationary Combustion (CH4 and N2O)
Table 5 Results of uncertainty assessment of fuel combustion (CO2)
7.2.3.3. Mobile Combustion (CH4 and N2O)
Table 6 Results of uncertainty assessment of mobile combustion (CH4 and N2O)
IPCC Source Category GHGs Emissions[Gg CO2eq.]
EFUncertainty
[%]
ADUncertainty
[%]
CombinedUncertainty
[%]
rank Combineduncertainty as
% of totalnational
emissions
rank
A a b B C1A. Fuel Solid Fuels Steel Making Coal CO2 14,068.0 14.4% 1.0% 14% 11 0.15% 16 Combustion Steam Coal (imported) CO2 244,697.3 9.6% 1.0% 10% 13 1.74% 1
Steam Coal (indigenous) CO2 0.0 5.3% 1.0% 5% 22 0.00% 31Hard Coal CO2 0.0 5.7% 1.0% 6% 19 0.00% 31Coke CO2 93,840.0 19.4% 1.0% 19% 8 1.35% 2Coal Tar CO2 2,149.2 18.2% 1.0% 18% 10 0.03% 20Coal Briquette CO2 0.0 19.4% 1.0% 19% 8 0.00% 31Coke Oven Gas CO2 14,892.5 24.0% 1.0% 24% 3 0.26% 10Blast Furnace Gas CO2 47,028.3 13.7% 1.0% 14% 12 0.48% 6Converter Furnace Gas CO2 10,759.7 23.9% 1.0% 24% 4 0.19% 12
Liquid Fuels Crude Oil for Refinery CO2 224.3 5.0% 0.9% 5% 23 0.00% 25Crude Oil for Power Generation CO2 16,420.8 5.0% 0.9% 5% 23 0.06% 19Vitumous Mixture Fuel CO2 117.2 6.9% 0.9% 7% 17 0.00% 27NGL & Condensate CO2 50.3 1.7% 0.9% 2% 34 0.00% 29Naphtha CO2 699.5 5.5% 0.9% 6% 21 0.00% 23Reformed Material Oil CO2 0.0 4.9% 0.9% 5% 25 0.00% 31Gasoline CO2 142,340.1 4.9% 0.9% 5% 25 0.52% 5Jet Fuel CO2 12,088.9 9.0% 0.9% 9% 14 0.08% 17Kerosene CO2 67,584.0 3.2% 0.9% 3% 31 0.17% 15Gas Oil or Diesel Oil CO2 99,079.4 3.1% 0.9% 3% 32 0.24% 11Heating Oil A CO2 80,156.5 6.3% 0.9% 6% 18 0.38% 7Heating Oil B CO2 168.1 4.7% 0.9% 5% 28 0.00% 28Heating Oil C CO2 86,901.6 4.1% 0.9% 4% 29 0.27% 9Lubricating Oil CO2 202.8 4.9% 0.9% 5% 25 0.00% 26Asphalt CO2 8,995.7 28.3% 0.9% 28% 1 0.19% 14Non Asphalt Heavy Oil Produc CO2 0.1 28.3% 0.9% 28% 1 0.00% 30Oil Coke CO2 11,317.6 22.5% 0.9% 23% 6 0.19% 13Galvanic Furnace Gas CO2 79.7 23.9% 0.9% 24% 5 0.00% 24Refinary Gas CO2 35,374.4 21.6% 0.9% 22% 7 0.56% 4LPG CO2 31,367.2 2.8% 0.9% 3% 33 0.07% 18
Gaseous Fuels LNG CO2 104,245.1 8.4% 1.9% 9% 15 0.66% 3Indigenous Natural Gas CO2 2,113.0 5.3% 1.9% 6% 20 0.01% 21Town Gas* CO2 64,583.7 7.5% 1.9% 8% 16 0.37% 8Small Scale Town Gas* CO2 1,320.2 2.8% 1.9% 3% 30 0.00% 22
Sub Total 1,192,865.5 3% 2.60%Total Emissions (D) 1,354,868.9 3%
IPCC Source Category GHGs Emissions[Gg CO2eq.]
EFUncertainty
[%]
ADUncertainty
[%]
CombinedUncertainty
[%]
rank Combineduncertaintyas % of total
nationalemissions
rank
A a b B C1A. Fuel Combustion (Stationary) CH4 517.0 ─ ─ 182% 1 0.07% 2
N2O 4,199.3 ─ ─ 43% 2 0.13% 1Sub Total 4,716.4 43% 0.15%
Total Emissions (D) 1,354,868.9 3%
IPCC Source Category GHGs Emissions[Gg CO2eq.]
EFUncertainty
[%]
ADUncertainty
[%]
CombinedUncertainty
[%]
rank Combineduncertaintyas % of total
nationalemissions
rank
A a b B C1A.Fuel Combustion a. Civil Aviation CH4 4.8 183.1% 9.2% 183% 3 0.00% 7(Transport) N2O 106.5 8213.5% 8.2% 8213% 1 0.65% 1
b. Road Transportation CH4 198.0 23.3% 23.1% 33% 6 0.00% 4N2O 5,710.9 31.0% 31.0% 44% 5 0.18% 2
c. Railways CH4 0.8 4.5% 13.2% 14% 7 0.00% 8N2O 84.5 5.0% 10.0% 11% 8 0.00% 6
d. Navigation CH4 25.5 144.1% 11.3% 145% 4 0.00% 5N2O 106.6 718.5% 11.3% 719% 2 0.06% 3
Sub Total 6,237.6 146% 0.67%Total Emissions (D) 1,354,868.9 3%
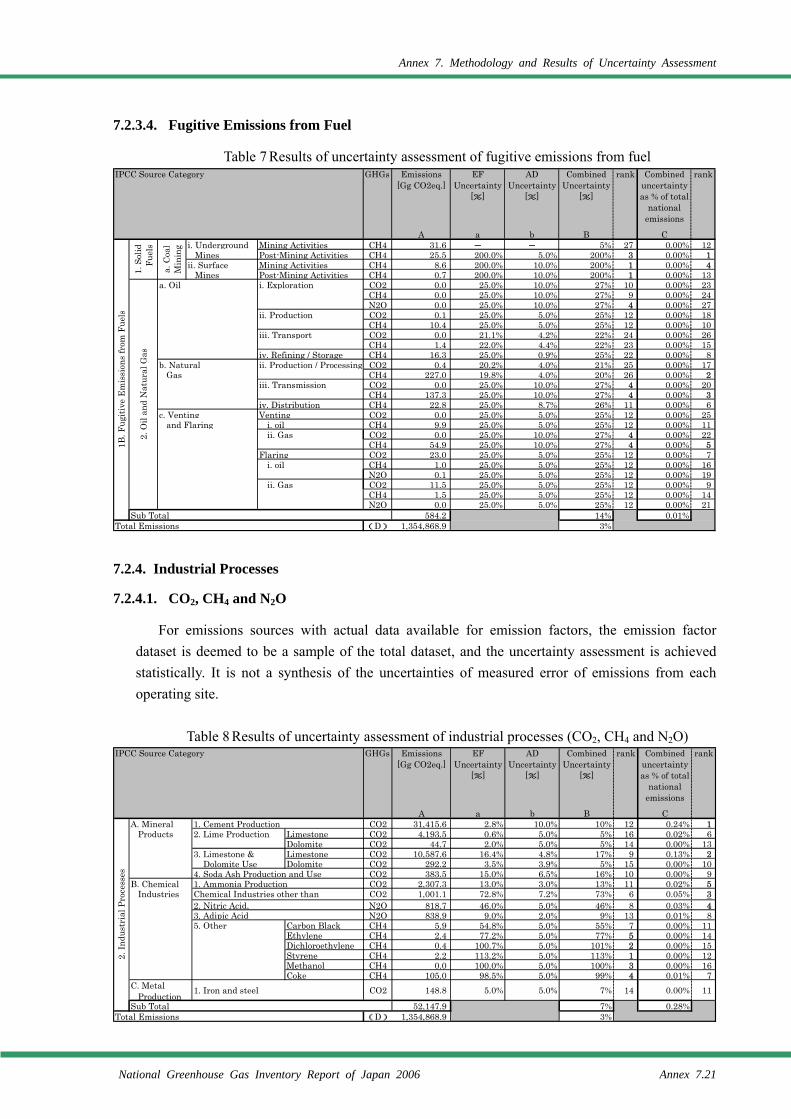
Annex 7. Methodology and Results of Uncertainty Assessment
National Greenhouse Gas Inventory Report of Japan 2006 Annex 7.21
7.2.3.4. Fugitive Emissions from Fuel
Table 7 Results of uncertainty assessment of fugitive emissions from fuel
7.2.4. Industrial Processes
7.2.4.1. CO2, CH4 and N2O
For emissions sources with actual data available for emission factors, the emission factor dataset is deemed to be a sample of the total dataset, and the uncertainty assessment is achieved statistically. It is not a synthesis of the uncertainties of measured error of emissions from each operating site.
Table 8 Results of uncertainty assessment of industrial processes (CO2, CH4 and N2O)
IPCC Source Category GHGs Emissions[Gg CO2eq.]
EFUncertainty
[%]
ADUncertainty
[%]
CombinedUncertainty
[%]
rank Combineduncertaintyas % of total
nationalemissions
rank
A a b B Ci. Underground Mining Activities CH4 31.6 ─ ─ 5% 27 0.00% 12 Mines Post-Mining Activities CH4 25.5 200.0% 5.0% 200% 3 0.00% 1ii. Surface Mining Activities CH4 8.6 200.0% 10.0% 200% 1 0.00% 4 Mines Post-Mining Activities CH4 0.7 200.0% 10.0% 200% 1 0.00% 13
a. Oil i. Exploration CO2 0.0 25.0% 10.0% 27% 10 0.00% 23CH4 0.0 25.0% 10.0% 27% 9 0.00% 24N2O 0.0 25.0% 10.0% 27% 4 0.00% 27
ii. Production CO2 0.1 25.0% 5.0% 25% 12 0.00% 18CH4 10.4 25.0% 5.0% 25% 12 0.00% 10
iii. Transport CO2 0.0 21.1% 4.2% 22% 24 0.00% 26CH4 1.4 22.0% 4.4% 22% 23 0.00% 15
iv. Refining / Storage CH4 16.3 25.0% 0.9% 25% 22 0.00% 8b. Natural ii. Production / Processing CO2 0.4 20.2% 4.0% 21% 25 0.00% 17 Gas CH4 227.0 19.8% 4.0% 20% 26 0.00% 2
iii. Transmission CO2 0.0 25.0% 10.0% 27% 4 0.00% 20CH4 137.3 25.0% 10.0% 27% 4 0.00% 3
iv. Distribution CH4 22.8 25.0% 8.7% 26% 11 0.00% 6c. Venting Venting CO2 0.0 25.0% 5.0% 25% 12 0.00% 25 and Flaring i. oil CH4 9.9 25.0% 5.0% 25% 12 0.00% 11
ii. Gas CO2 0.0 25.0% 10.0% 27% 4 0.00% 22CH4 54.9 25.0% 10.0% 27% 4 0.00% 5
Flaring CO2 23.0 25.0% 5.0% 25% 12 0.00% 7i. oil CH4 1.0 25.0% 5.0% 25% 12 0.00% 16
N2O 0.1 25.0% 5.0% 25% 12 0.00% 19ii. Gas CO2 11.5 25.0% 5.0% 25% 12 0.00% 9
CH4 1.5 25.0% 5.0% 25% 12 0.00% 14N2O 0.0 25.0% 5.0% 25% 12 0.00% 21
Sub Total 584.2 14% 0.01%Total Emissions (D) 1,354,868.9 3%
1B. F
ugiti
ve E
mis
sion
s fr
om F
uels
1. S
olid
Fu
els
a. C
oal
Min
ing
2. O
il an
d N
atur
al G
as
IPCC Source Category GHGs Emissions[Gg CO2eq.]
EFUncertainty
[%]
ADUncertainty
[%]
CombinedUncertainty
[%]
rank Combineduncertaintyas % of total
nationalemissions
rank
A a b B CA. Mineral 1. Cement Production CO2 31,415.6 2.8% 10.0% 10% 12 0.24% 1 Products 2. Lime Production Limestone CO2 4,193.5 0.6% 5.0% 5% 16 0.02% 6
Dolomite CO2 44.7 2.0% 5.0% 5% 14 0.00% 133. Limestone & Limestone CO2 10,587.6 16.4% 4.8% 17% 9 0.13% 2 Dolomite Use Dolomite CO2 292.2 3.5% 3.9% 5% 15 0.00% 104. Soda Ash Production and Use CO2 383.5 15.0% 6.5% 16% 10 0.00% 9
B. Chemical 1. Ammonia Production CO2 2,307.3 13.0% 3.0% 13% 11 0.02% 5 Industries CO2 1,001.1 72.8% 7.2% 73% 6 0.05% 3
2. Nitric Acid, N2O 818.7 46.0% 5.0% 46% 8 0.03% 43. Adipic Acid N2O 838.9 9.0% 2.0% 9% 13 0.01% 85. Other Carbon Black CH4 5.9 54.8% 5.0% 55% 7 0.00% 11
Ethylene CH4 2.4 77.2% 5.0% 77% 5 0.00% 14Dichloroethylene CH4 0.4 100.7% 5.0% 101% 2 0.00% 15Styrene CH4 2.2 113.2% 5.0% 113% 1 0.00% 12Methanol CH4 0.0 100.0% 5.0% 100% 3 0.00% 16Coke CH4 105.0 98.5% 5.0% 99% 4 0.01% 7
C. Metal Production
1. Iron and steel CO2 148.8 5.0% 5.0% 7% 14 0.00% 11
Sub Total 52,147.9 7% 0.28%Total Emissions (D) 1,354,868.9 3%
Chemical Industries other than
2. In
dust
rial
Pro
cess
es
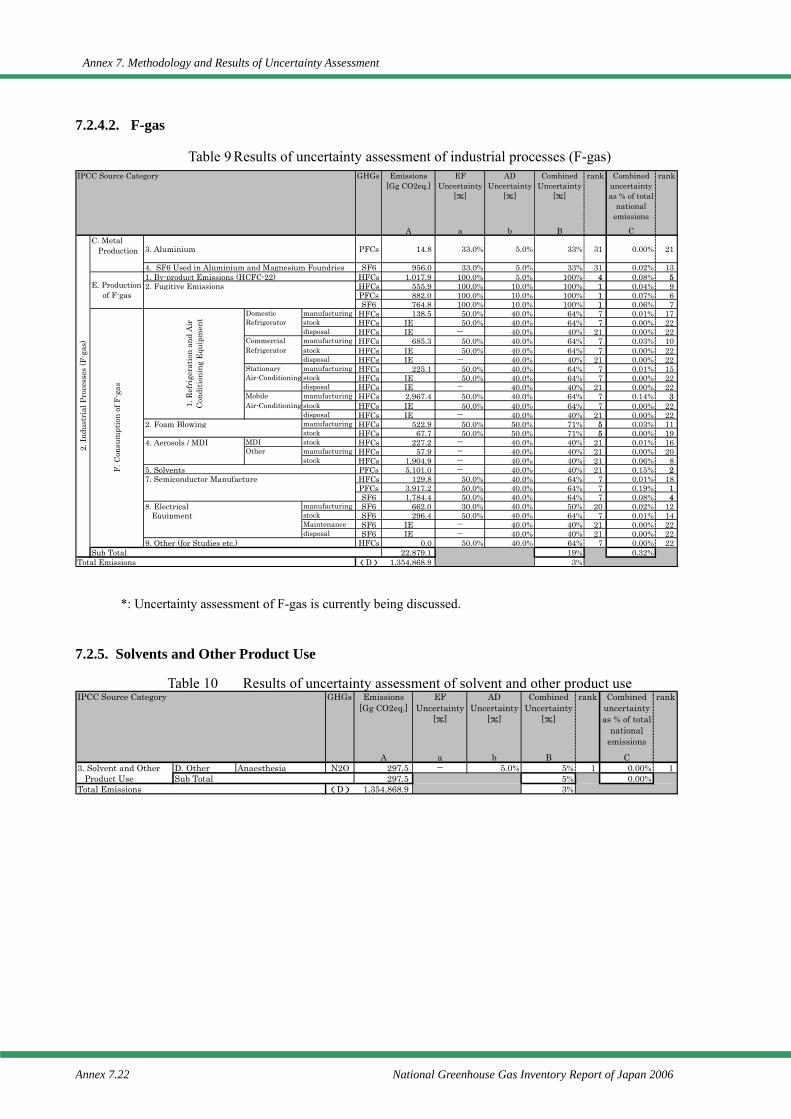
Annex 7. Methodology and Results of Uncertainty Assessment
Annex 7.22 National Greenhouse Gas Inventory Report of Japan 2006
7.2.4.2. F-gas
Table 9 Results of uncertainty assessment of industrial processes (F-gas) *: Uncertainty assessment of F-gas is currently being discussed.
7.2.5. Solvents and Other Product Use
Table 10 Results of uncertainty assessment of solvent and other product use
IPCC Source Category GHGs Emissions[Gg CO2eq.]
EFUncertainty
[%]
ADUncertainty
[%]
CombinedUncertainty
[%]
rank Combineduncertaintyas % of total
nationalemissions
rank
A a b B CC. Metal Production 3. Aluminium PFCs 14.8 33.0% 5.0% 33% 31 0.00% 21
4. SF6 Used in Aluminium and Magnesium Foundries SF6 956.0 33.0% 5.0% 33% 31 0.02% 131. By-product Emissions (HCFC-22) HFCs 1,017.9 100.0% 5.0% 100% 4 0.08% 52. Fugitive Emissions HFCs 555.9 100.0% 10.0% 100% 1 0.04% 9
PFCs 882.0 100.0% 10.0% 100% 1 0.07% 6SF6 764.8 100.0% 10.0% 100% 1 0.06% 7
Domestic manufacturing HFCs 138.5 50.0% 40.0% 64% 7 0.01% 17Refrigerator stock HFCs IE 50.0% 40.0% 64% 7 0.00% 22
disposal HFCs IE - 40.0% 40% 21 0.00% 22Commercial manufacturing HFCs 685.3 50.0% 40.0% 64% 7 0.03% 10Refrigerator stock HFCs IE 50.0% 40.0% 64% 7 0.00% 22
disposal HFCs IE - 40.0% 40% 21 0.00% 22Stationary manufacturing HFCs 225.1 50.0% 40.0% 64% 7 0.01% 15Air-Conditioning stock HFCs IE 50.0% 40.0% 64% 7 0.00% 22
disposal HFCs IE - 40.0% 40% 21 0.00% 22Mobile manufacturing HFCs 2,967.4 50.0% 40.0% 64% 7 0.14% 3Air-Conditioning stock HFCs IE 50.0% 40.0% 64% 7 0.00% 22
disposal HFCs IE - 40.0% 40% 21 0.00% 222. Foam Blowing manufacturing HFCs 522.9 50.0% 50.0% 71% 5 0.03% 11
stock HFCs 67.7 50.0% 50.0% 71% 5 0.00% 194. Aerosols / MDI MDI stock HFCs 227.2 - 40.0% 40% 21 0.01% 16
Other manufacturing HFCs 57.9 - 40.0% 40% 21 0.00% 20stock HFCs 1,904.9 - 40.0% 40% 21 0.06% 8
5. Solvents PFCs 5,101.0 - 40.0% 40% 21 0.15% 27. Semiconductor Manufacture HFCs 129.8 50.0% 40.0% 64% 7 0.01% 18
PFCs 3,917.2 50.0% 40.0% 64% 7 0.19% 1SF6 1,784.4 50.0% 40.0% 64% 7 0.08% 4
8. Electrical manufacturing SF6 662.0 30.0% 40.0% 50% 20 0.02% 12 Equipment stock SF6 296.4 50.0% 40.0% 64% 7 0.01% 14
Maintenance SF6 IE - 40.0% 40% 21 0.00% 22disposal SF6 IE - 40.0% 40% 21 0.00% 22
9. Other (for Studies etc.) HFCs 0.0 50.0% 40.0% 64% 7 0.00% 22Sub Total 22,879.1 19% 0.32%
Total Emissions (D) 1,354,868.9 3%
2. In
dust
rial
Pro
cess
es (F
-gas
)
E. Production of F-gas
F. C
onsu
mpt
ion
of F
-gas
1. R
efri
gera
tion
and
Air
Cond
ition
ing
Equ
ipm
ent
IPCC Source Category GHGs Emissions[Gg CO2eq.]
EFUncertainty
[%]
ADUncertainty
[%]
CombinedUncertainty
[%]
rank Combineduncertaintyas % of total
nationalemissions
rank
A a b B C3. Solvent and Other D. Other Anaesthesia N2O 297.5 - 5.0% 5% 1 0.00% 1 Product Use Sub Total 297.5 5% 0.00%Total Emissions (D) 1,354,868.9 3%
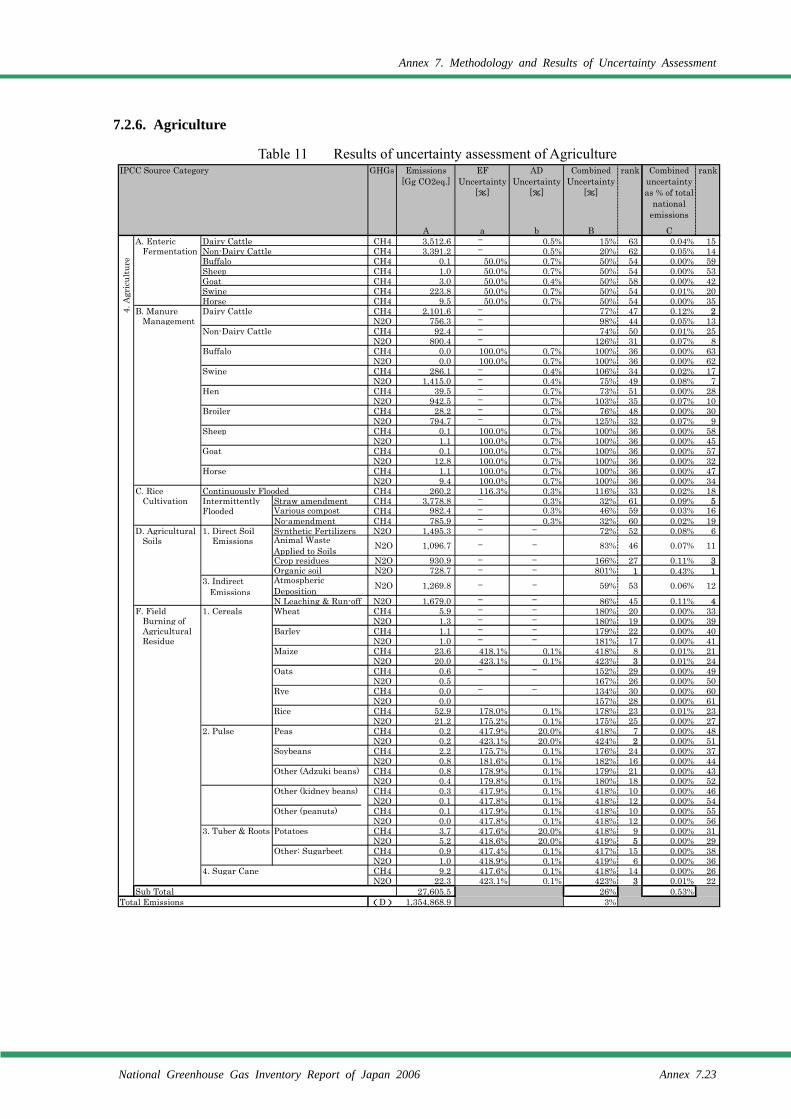
Annex 7. Methodology and Results of Uncertainty Assessment
National Greenhouse Gas Inventory Report of Japan 2006 Annex 7.23
7.2.6. Agriculture
Table 11 Results of uncertainty assessment of Agriculture
IPCC Source Category GHGs Emissions[Gg CO2eq.]
EFUncertainty
[%]
ADUncertainty
[%]
CombinedUncertainty
[%]
rank Combineduncertaintyas % of total
nationalemissions
rank
A a b B CA. Enteric Dairy Cattle CH4 3,512.6 ─ 0.5% 15% 63 0.04% 15 Fermentation Non-Dairy Cattle CH4 3,391.2 ─ 0.5% 20% 62 0.05% 14
Buffalo CH4 0.1 50.0% 0.7% 50% 54 0.00% 59Sheep CH4 1.0 50.0% 0.7% 50% 54 0.00% 53Goat CH4 3.0 50.0% 0.4% 50% 58 0.00% 42Swine CH4 223.8 50.0% 0.7% 50% 54 0.01% 20Horse CH4 9.5 50.0% 0.7% 50% 54 0.00% 35
B. Manure Dairy Cattle CH4 2,101.6 ─ 77% 47 0.12% 2 Management N2O 756.3 ─ 98% 44 0.05% 13
Non-Dairy Cattle CH4 92.4 ─ 74% 50 0.01% 25N2O 800.4 ─ 126% 31 0.07% 8
Buffalo CH4 0.0 100.0% 0.7% 100% 36 0.00% 63N2O 0.0 100.0% 0.7% 100% 36 0.00% 62
Swine CH4 286.1 ─ 0.4% 106% 34 0.02% 17N2O 1,415.0 ─ 0.4% 75% 49 0.08% 7
Hen CH4 39.5 ─ 0.7% 73% 51 0.00% 28N2O 942.5 ─ 0.7% 103% 35 0.07% 10
Broiler CH4 28.2 ─ 0.7% 76% 48 0.00% 30N2O 794.7 ─ 0.7% 125% 32 0.07% 9
Sheep CH4 0.1 100.0% 0.7% 100% 36 0.00% 58N2O 1.1 100.0% 0.7% 100% 36 0.00% 45
Goat CH4 0.1 100.0% 0.7% 100% 36 0.00% 57N2O 12.8 100.0% 0.7% 100% 36 0.00% 32
Horse CH4 1.1 100.0% 0.7% 100% 36 0.00% 47N2O 9.4 100.0% 0.7% 100% 36 0.00% 34
C. Rice Continuously Flooded CH4 260.2 116.3% 0.3% 116% 33 0.02% 18 Cultivation Intermittently Straw amendment CH4 3,778.8 ─ 0.3% 32% 61 0.09% 5
Flooded Various compost CH4 982.4 ─ 0.3% 46% 59 0.03% 16No-amendment CH4 785.9 ─ 0.3% 32% 60 0.02% 19
D. Agricultural 1. Direct Soil Synthetic Fertilizers N2O 1,495.3 ─ ─ 72% 52 0.08% 6 Soils Emissions Animal Waste
Applied to Soils N2O 1,096.7 ─ ─ 83% 46 0.07% 11Crop residues N2O 930.9 ─ ─ 166% 27 0.11% 3Organic soil N2O 728.7 ─ ─ 801% 1 0.43% 1
3. Indirect Emissions
AtmosphericDeposition N2O 1,269.8 ─ ─ 59% 53 0.06% 12
N Leaching & Run-off N2O 1,679.0 ─ ─ 86% 45 0.11% 4F. Field 1. Cereals Wheat CH4 5.9 ─ ─ 180% 20 0.00% 33 Burning of N2O 1.3 ─ ─ 180% 19 0.00% 39 Agricultural Barley CH4 1.1 ─ ─ 179% 22 0.00% 40 Residue N2O 1.0 ─ ─ 181% 17 0.00% 41
Maize CH4 23.6 418.1% 0.1% 418% 8 0.01% 21N2O 20.0 423.1% 0.1% 423% 3 0.01% 24
Oats CH4 0.6 ─ ─ 152% 29 0.00% 49N2O 0.5 167% 26 0.00% 50
Rye CH4 0.0 ─ ─ 134% 30 0.00% 60N2O 0.0 157% 28 0.00% 61
Rice CH4 52.9 178.0% 0.1% 178% 23 0.01% 23N2O 21.2 175.2% 0.1% 175% 25 0.00% 27
2. Pulse Peas CH4 0.2 417.9% 20.0% 418% 7 0.00% 48N2O 0.2 423.1% 20.0% 424% 2 0.00% 51
Soybeans CH4 2.2 175.7% 0.1% 176% 24 0.00% 37N2O 0.8 181.6% 0.1% 182% 16 0.00% 44
Other (Adzuki beans) CH4 0.8 178.9% 0.1% 179% 21 0.00% 43N2O 0.4 179.8% 0.1% 180% 18 0.00% 52
Other (kidney beans) CH4 0.3 417.9% 0.1% 418% 10 0.00% 46N2O 0.1 417.8% 0.1% 418% 12 0.00% 54
Other (peanuts) CH4 0.1 417.9% 0.1% 418% 10 0.00% 55N2O 0.0 417.8% 0.1% 418% 12 0.00% 56
3. Tuber & Roots Potatoes CH4 3.7 417.6% 20.0% 418% 9 0.00% 31N2O 5.2 418.6% 20.0% 419% 5 0.00% 29
Other: Sugarbeet CH4 0.9 417.4% 0.1% 417% 15 0.00% 38N2O 1.0 418.9% 0.1% 419% 6 0.00% 36
4. Sugar Cane CH4 9.2 417.6% 0.1% 418% 14 0.00% 26N2O 22.3 423.1% 0.1% 423% 3 0.01% 22
Sub Total 27,605.5 26% 0.53%Total Emissions (D) 1,354,868.9 3%
4. A
gric
ultu
re
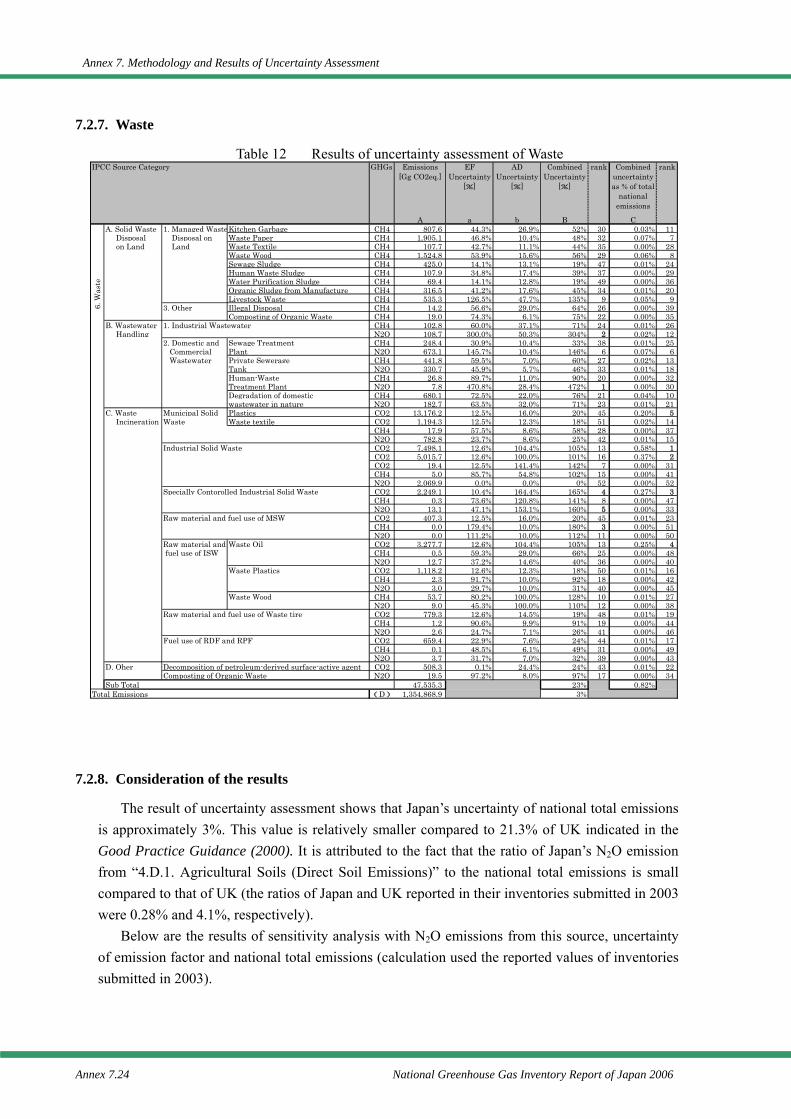
Annex 7. Methodology and Results of Uncertainty Assessment
Annex 7.24 National Greenhouse Gas Inventory Report of Japan 2006
7.2.7. Waste
Table 12 Results of uncertainty assessment of Waste
7.2.8. Consideration of the results
The result of uncertainty assessment shows that Japan’s uncertainty of national total emissions is approximately 3%. This value is relatively smaller compared to 21.3% of UK indicated in the Good Practice Guidance (2000). It is attributed to the fact that the ratio of Japan’s N2O emission from “4.D.1. Agricultural Soils (Direct Soil Emissions)” to the national total emissions is small compared to that of UK (the ratios of Japan and UK reported in their inventories submitted in 2003 were 0.28% and 4.1%, respectively).
Below are the results of sensitivity analysis with N2O emissions from this source, uncertainty of emission factor and national total emissions (calculation used the reported values of inventories submitted in 2003).
IPCC Source Category GHGs Emissions[Gg CO2eq.]
EFUncertainty
[%]
ADUncertainty
[%]
CombinedUncertainty
[%]
rank Combineduncertaintyas % of total
nationalemissions
rank
A a b B CA. Solid Waste 1. Managed WasteKitchen Garbage CH4 807.6 44.3% 26.9% 52% 30 0.03% 11 Disposal Disposal on Waste Paper CH4 1,905.1 46.8% 10.4% 48% 32 0.07% 7 on Land Land Waste Textile CH4 107.7 42.7% 11.1% 44% 35 0.00% 28
Waste Wood CH4 1,524.8 53.9% 15.6% 56% 29 0.06% 8Sewage Sludge CH4 425.0 14.1% 13.1% 19% 47 0.01% 24Human Waste Sludge CH4 107.9 34.8% 17.4% 39% 37 0.00% 29Water Purification Sludge CH4 69.4 14.1% 12.8% 19% 49 0.00% 36Organic Sludge from Manufacture CH4 316.5 41.2% 17.6% 45% 34 0.01% 20Livestock Waste CH4 535.3 126.5% 47.7% 135% 9 0.05% 9
3. Other Illegal Disposal CH4 14.2 56.6% 29.0% 64% 26 0.00% 39Composting of Organic Waste CH4 19.0 74.3% 6.1% 75% 22 0.00% 35
B. Wastewater 1. Industrial Wastewater CH4 102.8 60.0% 37.1% 71% 24 0.01% 26 Handling N2O 108.7 300.0% 50.3% 304% 2 0.02% 12
2. Domestic and Sewage Treatment CH4 248.4 30.9% 10.4% 33% 38 0.01% 25 Commercial Plant N2O 673.1 145.7% 10.4% 146% 6 0.07% 6 Wastewater Private Sewerage CH4 441.8 59.5% 7.0% 60% 27 0.02% 13
Tank N2O 330.7 45.9% 5.7% 46% 33 0.01% 18Human-Waste CH4 26.8 89.7% 11.0% 90% 20 0.00% 32Treatment Plant N2O 7.8 470.8% 28.4% 472% 1 0.00% 30Degradation of domestic CH4 680.1 72.5% 22.0% 76% 21 0.04% 10wastewater in nature N2O 182.7 63.5% 32.0% 71% 23 0.01% 21
C. Waste Municipal Solid Plastics CO2 13,176.2 12.5% 16.0% 20% 45 0.20% 5 Incineration Waste Waste textile CO2 1,194.3 12.5% 12.3% 18% 51 0.02% 14
CH4 17.9 57.5% 8.6% 58% 28 0.00% 37N2O 782.8 23.7% 8.6% 25% 42 0.01% 15
Industrial Solid Waste CO2 7,498.1 12.6% 104.4% 105% 13 0.58% 1CO2 5,015.7 12.6% 100.0% 101% 16 0.37% 2CO2 19.4 12.5% 141.4% 142% 7 0.00% 31CH4 5.0 85.7% 54.8% 102% 15 0.00% 41N2O 2,069.9 0.0% 0.0% 0% 52 0.00% 52
Specially Contorolled Industrial Solid Waste CO2 2,249.1 10.4% 164.4% 165% 4 0.27% 3CH4 0.3 73.6% 120.8% 141% 8 0.00% 47N2O 13.1 47.1% 153.1% 160% 5 0.00% 33
Raw material and fuel use of MSW CO2 407.3 12.5% 16.0% 20% 45 0.01% 23CH4 0.0 179.4% 10.0% 180% 3 0.00% 51N2O 0.0 111.2% 10.0% 112% 11 0.00% 50
Raw material and Waste Oil CO2 3,277.7 12.6% 104.4% 105% 13 0.25% 4 fuel use of ISW CH4 0.5 59.3% 29.0% 66% 25 0.00% 48
N2O 12.7 37.2% 14.6% 40% 36 0.00% 40Waste Plastics CO2 1,118.2 12.6% 12.3% 18% 50 0.01% 16
CH4 2.3 91.7% 10.0% 92% 18 0.00% 42N2O 3.0 29.7% 10.0% 31% 40 0.00% 45
Waste Wood CH4 53.7 80.2% 100.0% 128% 10 0.01% 27N2O 9.0 45.3% 100.0% 110% 12 0.00% 38
Raw material and fuel use of Waste tire CO2 779.3 12.6% 14.5% 19% 48 0.01% 19CH4 1.2 90.6% 9.9% 91% 19 0.00% 44N2O 2.6 24.7% 7.1% 26% 41 0.00% 46
Fuel use of RDF and RPF CO2 659.4 22.9% 7.6% 24% 44 0.01% 17CH4 0.1 48.5% 6.1% 49% 31 0.00% 49N2O 3.7 31.7% 7.0% 32% 39 0.00% 43
D. Oher Decomposition of petroleum-derived surface-active agent CO2 508.3 0.1% 24.4% 24% 43 0.01% 22Composting of Organic Waste N2O 19.5 97.2% 8.0% 97% 17 0.00% 34
Sub Total 47,535.3 23% 0.82%Total Emissions (D) 1,354,868.9 3%
6. W
aste
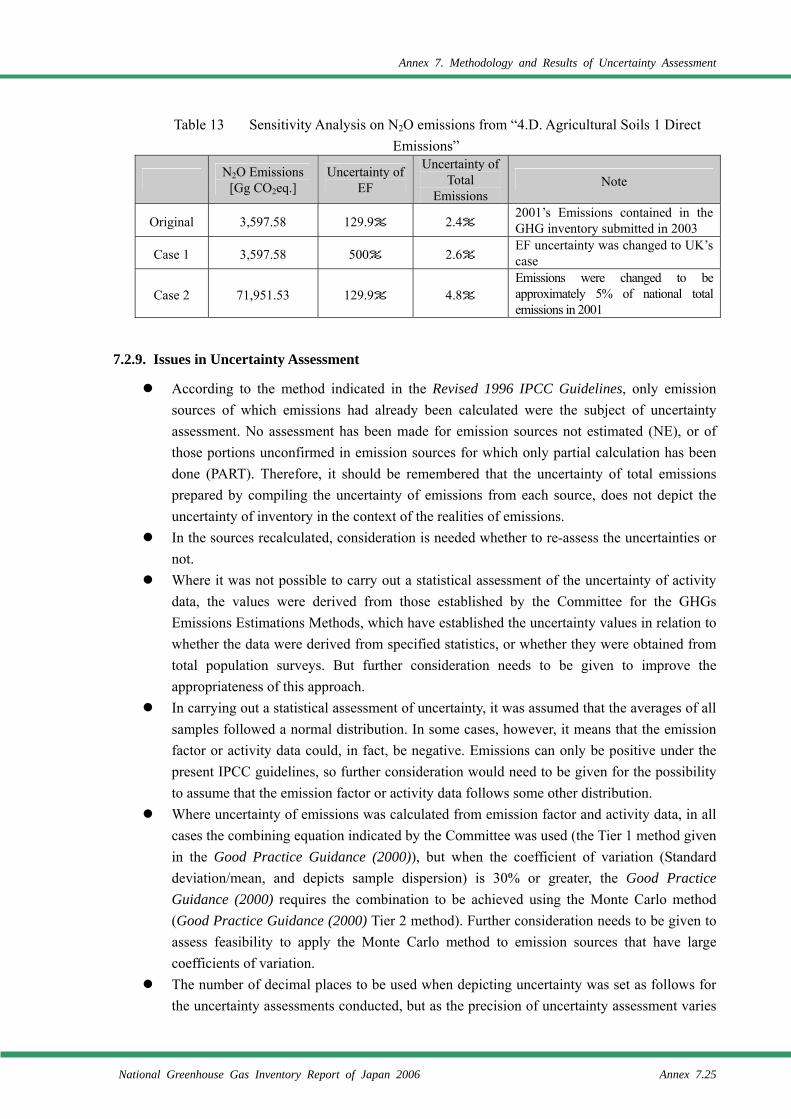
Annex 7. Methodology and Results of Uncertainty Assessment
National Greenhouse Gas Inventory Report of Japan 2006 Annex 7.25
Table 13 Sensitivity Analysis on N2O emissions from “4.D. Agricultural Soils 1 Direct Emissions”
N2O Emissions
[Gg CO2eq.] Uncertainty of
EF
Uncertainty of Total
Emissions Note
Original 3,597.58 129.9% 2.4% 2001’s Emissions contained in the GHG inventory submitted in 2003
Case 1 3,597.58 500% 2.6% EF uncertainty was changed to UK’s case
Case 2 71,951.53 129.9% 4.8% Emissions were changed to be approximately 5% of national total emissions in 2001
7.2.9. Issues in Uncertainty Assessment
According to the method indicated in the Revised 1996 IPCC Guidelines, only emission sources of which emissions had already been calculated were the subject of uncertainty assessment. No assessment has been made for emission sources not estimated (NE), or of those portions unconfirmed in emission sources for which only partial calculation has been done (PART). Therefore, it should be remembered that the uncertainty of total emissions prepared by compiling the uncertainty of emissions from each source, does not depict the uncertainty of inventory in the context of the realities of emissions.
In the sources recalculated, consideration is needed whether to re-assess the uncertainties or not.
Where it was not possible to carry out a statistical assessment of the uncertainty of activity data, the values were derived from those established by the Committee for the GHGs Emissions Estimations Methods, which have established the uncertainty values in relation to whether the data were derived from specified statistics, or whether they were obtained from total population surveys. But further consideration needs to be given to improve the appropriateness of this approach.
In carrying out a statistical assessment of uncertainty, it was assumed that the averages of all samples followed a normal distribution. In some cases, however, it means that the emission factor or activity data could, in fact, be negative. Emissions can only be positive under the present IPCC guidelines, so further consideration would need to be given for the possibility to assume that the emission factor or activity data follows some other distribution.
Where uncertainty of emissions was calculated from emission factor and activity data, in all cases the combining equation indicated by the Committee was used (the Tier 1 method given in the Good Practice Guidance (2000)), but when the coefficient of variation (Standard deviation/mean, and depicts sample dispersion) is 30% or greater, the Good Practice Guidance (2000) requires the combination to be achieved using the Monte Carlo method (Good Practice Guidance (2000) Tier 2 method). Further consideration needs to be given to assess feasibility to apply the Monte Carlo method to emission sources that have large coefficients of variation.
The number of decimal places to be used when depicting uncertainty was set as follows for the uncertainty assessments conducted, but as the precision of uncertainty assessment varies
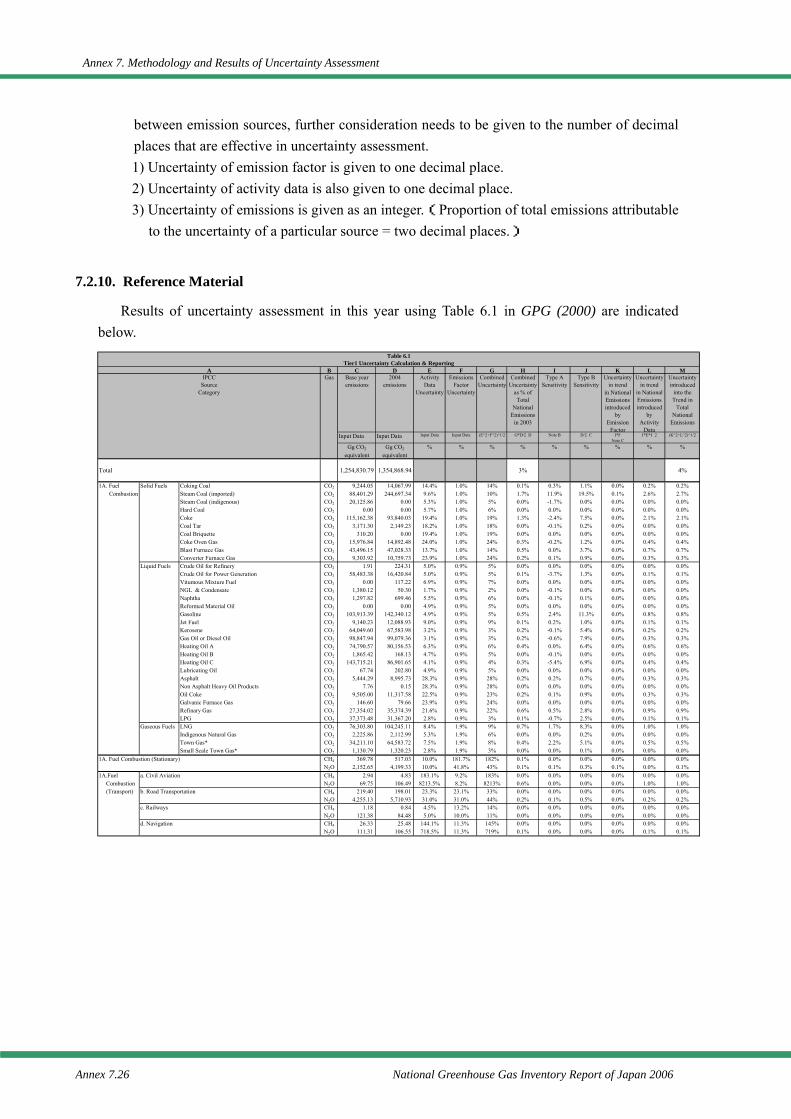
Annex 7. Methodology and Results of Uncertainty Assessment
Annex 7.26 National Greenhouse Gas Inventory Report of Japan 2006
between emission sources, further consideration needs to be given to the number of decimal places that are effective in uncertainty assessment. 1) Uncertainty of emission factor is given to one decimal place. 2) Uncertainty of activity data is also given to one decimal place. 3) Uncertainty of emissions is given as an integer.(Proportion of total emissions attributable
to the uncertainty of a particular source = two decimal places.)
7.2.10. Reference Material
Results of uncertainty assessment in this year using Table 6.1 in GPG (2000) are indicated below.
Table 6.1Tier1 Uncertainty Calculation & Reporting
A B C D E F G H I J K L MIPCC
SourceCategory
Gas Base yearemissions
2004emissions
ActivityData
Uncertainty
EmissionsFactor
Uncertainty
CombinedUncertainty
CombinedUncertainty
as % ofTotal
NationalEmissions
in 2003
Type ASensitivity
Type BSensitivity
Uncertaintyin trend
in NationalEmissionsintroduced
byEmission
Factor
Uncertaintyin trend
in NationalEmissionsintroduced
byActivity
Data
Uncertaintyintroduced
into theTrend in
TotalNational
Emissions
Input Data Input Data Input Data Input Data (E^2+F^2)^1/2 G*D/∑D Note B D/∑C I*FNote C
J*E*√2 (K^2+L^2)^1/2
Gg CO2
equivalentGg CO2
equivalent% % % % % % % % %
Total 1,254,830.79 1,354,868.94 3% 4%
1A. Fuel Solid Fuels Coking Coal CO2 9,244.05 14,067.99 14.4% 1.0% 14% 0.1% 0.3% 1.1% 0.0% 0.2% 0.2% Combustion Steam Coal (imported) CO2 88,401.29 244,697.34 9.6% 1.0% 10% 1.7% 11.9% 19.5% 0.1% 2.6% 2.7%
Steam Coal (indigenous) CO2 20,125.86 0.00 5.3% 1.0% 5% 0.0% -1.7% 0.0% 0.0% 0.0% 0.0%Hard Coal CO2 0.00 0.00 5.7% 1.0% 6% 0.0% 0.0% 0.0% 0.0% 0.0% 0.0%Coke CO2 115,162.38 93,840.03 19.4% 1.0% 19% 1.3% -2.4% 7.5% 0.0% 2.1% 2.1%Coal Tar CO2 3,171.30 2,149.23 18.2% 1.0% 18% 0.0% -0.1% 0.2% 0.0% 0.0% 0.0%Coal Briquette CO2 310.20 0.00 19.4% 1.0% 19% 0.0% 0.0% 0.0% 0.0% 0.0% 0.0%Coke Oven Gas CO2 15,976.84 14,892.48 24.0% 1.0% 24% 0.3% -0.2% 1.2% 0.0% 0.4% 0.4%Blast Furnace Gas CO2 43,496.15 47,028.33 13.7% 1.0% 14% 0.5% 0.0% 3.7% 0.0% 0.7% 0.7%Converter Furnace Gas CO2 9,303.92 10,759.73 23.9% 1.0% 24% 0.2% 0.1% 0.9% 0.0% 0.3% 0.3%
Liquid Fuels Crude Oil for Refinery CO2 1.91 224.31 5.0% 0.9% 5% 0.0% 0.0% 0.0% 0.0% 0.0% 0.0%Crude Oil for Power Generation CO2 58,483.38 16,420.84 5.0% 0.9% 5% 0.1% -3.7% 1.3% 0.0% 0.1% 0.1%Vitumous Mixture Fuel CO2 0.00 117.22 6.9% 0.9% 7% 0.0% 0.0% 0.0% 0.0% 0.0% 0.0%NGL & Condensate CO2 1,380.12 50.30 1.7% 0.9% 2% 0.0% -0.1% 0.0% 0.0% 0.0% 0.0%Naphtha CO2 1,297.82 699.46 5.5% 0.9% 6% 0.0% -0.1% 0.1% 0.0% 0.0% 0.0%Reformed Material Oil CO2 0.00 0.00 4.9% 0.9% 5% 0.0% 0.0% 0.0% 0.0% 0.0% 0.0%Gasoline CO2 103,913.39 142,340.12 4.9% 0.9% 5% 0.5% 2.4% 11.3% 0.0% 0.8% 0.8%Jet Fuel CO2 9,140.23 12,088.93 9.0% 0.9% 9% 0.1% 0.2% 1.0% 0.0% 0.1% 0.1%Kerosene CO2 64,049.60 67,583.98 3.2% 0.9% 3% 0.2% -0.1% 5.4% 0.0% 0.2% 0.2%Gas Oil or Diesel Oil CO2 98,847.94 99,079.36 3.1% 0.9% 3% 0.2% -0.6% 7.9% 0.0% 0.3% 0.3%Heating Oil A CO2 74,790.57 80,156.53 6.3% 0.9% 6% 0.4% 0.0% 6.4% 0.0% 0.6% 0.6%Heating Oil B CO2 1,865.42 168.13 4.7% 0.9% 5% 0.0% -0.1% 0.0% 0.0% 0.0% 0.0%Heating Oil C CO2 143,715.21 86,901.65 4.1% 0.9% 4% 0.3% -5.4% 6.9% 0.0% 0.4% 0.4%Lubricating Oil CO2 67.74 202.80 4.9% 0.9% 5% 0.0% 0.0% 0.0% 0.0% 0.0% 0.0%Asphalt CO2 5,444.29 8,995.73 28.3% 0.9% 28% 0.2% 0.2% 0.7% 0.0% 0.3% 0.3%Non Asphalt Heavy Oil Products CO2 7.76 0.15 28.3% 0.9% 28% 0.0% 0.0% 0.0% 0.0% 0.0% 0.0%Oil Coke CO2 9,505.00 11,317.58 22.5% 0.9% 23% 0.2% 0.1% 0.9% 0.0% 0.3% 0.3%Galvanic Furnace Gas CO2 146.60 79.66 23.9% 0.9% 24% 0.0% 0.0% 0.0% 0.0% 0.0% 0.0%Refinary Gas CO2 27,354.02 35,374.39 21.6% 0.9% 22% 0.6% 0.5% 2.8% 0.0% 0.9% 0.9%LPG CO2 37,373.48 31,367.20 2.8% 0.9% 3% 0.1% -0.7% 2.5% 0.0% 0.1% 0.1%
Gaseous Fuels LNG CO2 76,303.80 104,245.11 8.4% 1.9% 9% 0.7% 1.7% 8.3% 0.0% 1.0% 1.0%Indigenous Natural Gas CO2 2,225.86 2,112.99 5.3% 1.9% 6% 0.0% 0.0% 0.2% 0.0% 0.0% 0.0%Town Gas* CO2 34,211.10 64,583.72 7.5% 1.9% 8% 0.4% 2.2% 5.1% 0.0% 0.5% 0.5%Small Scale Town Gas* CO2 1,130.79 1,320.23 2.8% 1.9% 3% 0.0% 0.0% 0.1% 0.0% 0.0% 0.0%
1A. Fuel Combustion (Stationary) CH4 369.78 517.03 10.0% 181.7% 182% 0.1% 0.0% 0.0% 0.0% 0.0% 0.0%N2O 2,152.65 4,199.33 10.0% 41.8% 43% 0.1% 0.1% 0.3% 0.1% 0.0% 0.1%
1A.Fuel a. Civil Aviation CH4 2.94 4.83 183.1% 9.2% 183% 0.0% 0.0% 0.0% 0.0% 0.0% 0.0% Combustion N2O 69.75 106.49 8213.5% 8.2% 8213% 0.6% 0.0% 0.0% 0.0% 1.0% 1.0% (Transport) b. Road Transportation CH4 219.40 198.01 23.3% 23.1% 33% 0.0% 0.0% 0.0% 0.0% 0.0% 0.0%
N2O 4,255.13 5,710.93 31.0% 31.0% 44% 0.2% 0.1% 0.5% 0.0% 0.2% 0.2%c. Railways CH4 1.18 0.84 4.5% 13.2% 14% 0.0% 0.0% 0.0% 0.0% 0.0% 0.0%
N2O 121.38 84.48 5.0% 10.0% 11% 0.0% 0.0% 0.0% 0.0% 0.0% 0.0%d. Navigation CH4 26.33 25.48 144.1% 11.3% 145% 0.0% 0.0% 0.0% 0.0% 0.0% 0.0%
N2O 111.31 106.55 718.5% 11.3% 719% 0.1% 0.0% 0.0% 0.0% 0.1% 0.1%
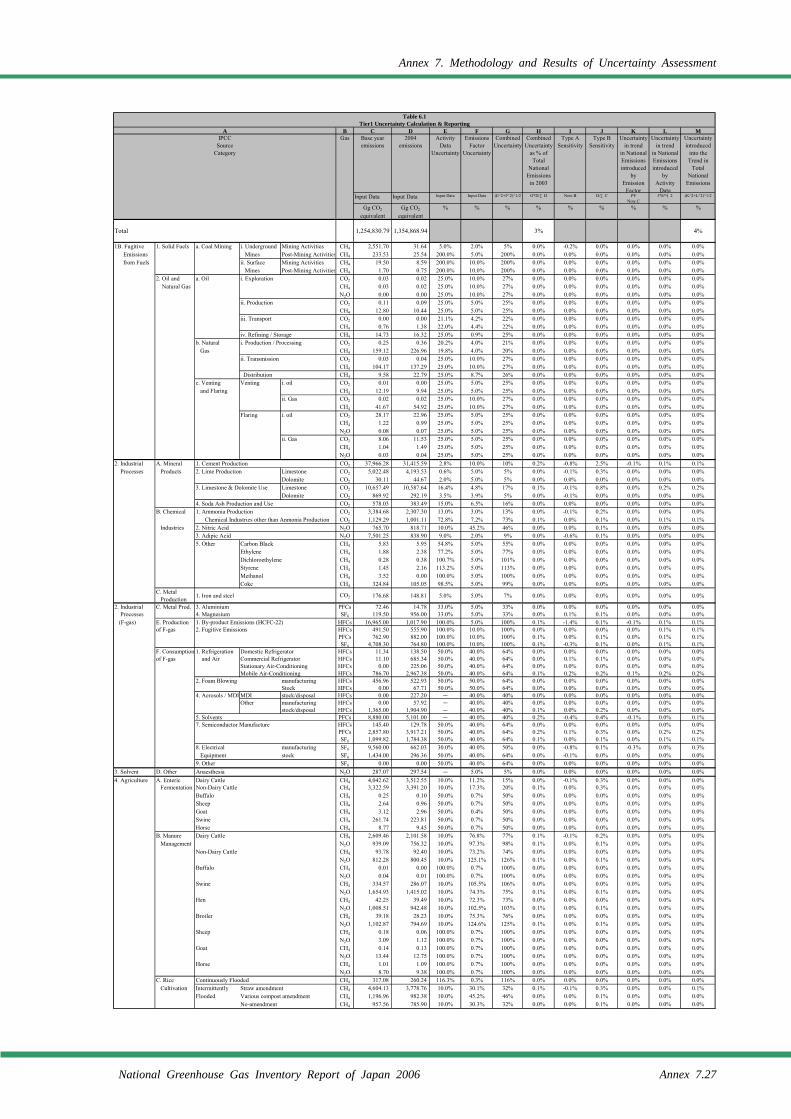
Annex 7. Methodology and Results of Uncertainty Assessment
National Greenhouse Gas Inventory Report of Japan 2006 Annex 7.27
Table 6.1Tier1 Uncertainty Calculation & Reporting
A B C D E F G H I J K L MIPCC
SourceCategory
Gas Base yearemissions
2004emissions
ActivityData
Uncertainty
EmissionsFactor
Uncertainty
CombinedUncertainty
CombinedUncertainty
as % ofTotal
NationalEmissions
in 2003
Type ASensitivity
Type BSensitivity
Uncertaintyin trend
in NationalEmissionsintroduced
byEmission
Factor
Uncertaintyin trend
in NationalEmissionsintroduced
byActivity
Data
Uncertaintyintroduced
into theTrend in
TotalNational
Emissions
Input Data Input Data Input Data Input Data (E^2+F^2)^1/2 G*D/∑D Note B D/∑C I*FNote C
J*E*√2 (K^2+L^2)^1/2
Gg CO2
equivalentGg CO2
equivalent% % % % % % % % %
Total 1,254,830.79 1,354,868.94 3% 4%
1B. Fugitive 1. Solid Fuels a. Coal Mining i. Underground Mining Activities CH4 2,551.70 31.64 5.0% 2.0% 5% 0.0% -0.2% 0.0% 0.0% 0.0% 0.0% Emissions Mines Post-Mining Activities CH4 233.53 25.54 200.0% 5.0% 200% 0.0% 0.0% 0.0% 0.0% 0.0% 0.0% from Fuels ii. Surface Mining Activities CH4 19.50 8.59 200.0% 10.0% 200% 0.0% 0.0% 0.0% 0.0% 0.0% 0.0%
Mines Post-Mining Activities CH4 1.70 0.75 200.0% 10.0% 200% 0.0% 0.0% 0.0% 0.0% 0.0% 0.0%2. Oil and a. Oil i. Exploration CO2 0.03 0.02 25.0% 10.0% 27% 0.0% 0.0% 0.0% 0.0% 0.0% 0.0% Natural Gas CH4 0.03 0.02 25.0% 10.0% 27% 0.0% 0.0% 0.0% 0.0% 0.0% 0.0%
N2O 0.00 0.00 25.0% 10.0% 27% 0.0% 0.0% 0.0% 0.0% 0.0% 0.0%ii. Production CO2 0.11 0.09 25.0% 5.0% 25% 0.0% 0.0% 0.0% 0.0% 0.0% 0.0%
CH4 12.80 10.44 25.0% 5.0% 25% 0.0% 0.0% 0.0% 0.0% 0.0% 0.0%iii. Transport CO2 0.00 0.00 21.1% 4.2% 22% 0.0% 0.0% 0.0% 0.0% 0.0% 0.0%
CH4 0.76 1.38 22.0% 4.4% 22% 0.0% 0.0% 0.0% 0.0% 0.0% 0.0%iv. Refining / Storage CH4 14.73 16.32 25.0% 0.9% 25% 0.0% 0.0% 0.0% 0.0% 0.0% 0.0%
b. Natural i. Production / Processing CO2 0.25 0.36 20.2% 4.0% 21% 0.0% 0.0% 0.0% 0.0% 0.0% 0.0% Gas CH4 159.12 226.96 19.8% 4.0% 20% 0.0% 0.0% 0.0% 0.0% 0.0% 0.0%
ii. Transmission CO2 0.03 0.04 25.0% 10.0% 27% 0.0% 0.0% 0.0% 0.0% 0.0% 0.0%CH4 104.17 137.29 25.0% 10.0% 27% 0.0% 0.0% 0.0% 0.0% 0.0% 0.0%
Distribution CH4 9.58 22.79 25.0% 8.7% 26% 0.0% 0.0% 0.0% 0.0% 0.0% 0.0%c. Venting Venting i. oil CO2 0.01 0.00 25.0% 5.0% 25% 0.0% 0.0% 0.0% 0.0% 0.0% 0.0% and Flaring CH4 12.19 9.94 25.0% 5.0% 25% 0.0% 0.0% 0.0% 0.0% 0.0% 0.0%
ii. Gas CO2 0.02 0.02 25.0% 10.0% 27% 0.0% 0.0% 0.0% 0.0% 0.0% 0.0%CH4 41.67 54.92 25.0% 10.0% 27% 0.0% 0.0% 0.0% 0.0% 0.0% 0.0%
Flaring i. oil CO2 28.17 22.96 25.0% 5.0% 25% 0.0% 0.0% 0.0% 0.0% 0.0% 0.0%CH4 1.22 0.99 25.0% 5.0% 25% 0.0% 0.0% 0.0% 0.0% 0.0% 0.0%N2O 0.08 0.07 25.0% 5.0% 25% 0.0% 0.0% 0.0% 0.0% 0.0% 0.0%
ii. Gas CO2 8.06 11.53 25.0% 5.0% 25% 0.0% 0.0% 0.0% 0.0% 0.0% 0.0%CH4 1.04 1.49 25.0% 5.0% 25% 0.0% 0.0% 0.0% 0.0% 0.0% 0.0%N2O 0.03 0.04 25.0% 5.0% 25% 0.0% 0.0% 0.0% 0.0% 0.0% 0.0%
2. Industrial A. Mineral 1. Cement Production CO2 37,966.28 31,415.59 2.8% 10.0% 10% 0.2% -0.8% 2.5% -0.1% 0.1% 0.1% Processes Products 2. Lime Production Limestone CO2 5,022.48 4,193.53 0.6% 5.0% 5% 0.0% -0.1% 0.3% 0.0% 0.0% 0.0%
Dolomite CO2 30.11 44.67 2.0% 5.0% 5% 0.0% 0.0% 0.0% 0.0% 0.0% 0.0%3. Limestone & Dolomite Use Limestone CO2 10,657.49 10,587.64 16.4% 4.8% 17% 0.1% -0.1% 0.8% 0.0% 0.2% 0.2%
Dolomite CO2 869.92 292.19 3.5% 3.9% 5% 0.0% -0.1% 0.0% 0.0% 0.0% 0.0%4. Soda Ash Production and Use CO2 578.03 383.49 15.0% 6.5% 16% 0.0% 0.0% 0.0% 0.0% 0.0% 0.0%
B. Chemical 1. Ammonia Production CO2 3,384.68 2,307.30 13.0% 3.0% 13% 0.0% -0.1% 0.2% 0.0% 0.0% 0.0%Chemical Industries other than Anmonia Production CO2 1,129.29 1,001.11 72.8% 7.2% 73% 0.1% 0.0% 0.1% 0.0% 0.1% 0.1%
Industries 2. Nitric Acid N2O 765.70 818.71 10.0% 45.2% 46% 0.0% 0.0% 0.1% 0.0% 0.0% 0.0%3. Adipic Acid N2O 7,501.25 838.90 9.0% 2.0% 9% 0.0% -0.6% 0.1% 0.0% 0.0% 0.0%5. Other Carbon Black CH4 5.83 5.95 54.8% 5.0% 55% 0.0% 0.0% 0.0% 0.0% 0.0% 0.0%
Ethylene CH4 1.88 2.38 77.2% 5.0% 77% 0.0% 0.0% 0.0% 0.0% 0.0% 0.0%Dichloroethylene CH4 0.28 0.38 100.7% 5.0% 101% 0.0% 0.0% 0.0% 0.0% 0.0% 0.0%Styrene CH4 1.45 2.16 113.2% 5.0% 113% 0.0% 0.0% 0.0% 0.0% 0.0% 0.0%Methanol CH4 3.52 0.00 100.0% 5.0% 100% 0.0% 0.0% 0.0% 0.0% 0.0% 0.0%Coke CH4 324.84 105.05 98.5% 5.0% 99% 0.0% 0.0% 0.0% 0.0% 0.0% 0.0%
C. Metal Production 1. Iron and steel CO2 176.68 148.81 5.0% 5.0% 7% 0.0% 0.0% 0.0% 0.0% 0.0% 0.0%
2. Industrial C. Metal Prod. 3. Aluminium PFCs 72.46 14.78 33.0% 5.0% 33% 0.0% 0.0% 0.0% 0.0% 0.0% 0.0% Processes 4. Magnesium SF6 119.50 956.00 33.0% 5.0% 33% 0.0% 0.1% 0.1% 0.0% 0.0% 0.0% (F-gas) E. Production 1. By-product Emissions (HCFC-22) HFCs 16,965.00 1,017.90 100.0% 5.0% 100% 0.1% -1.4% 0.1% -0.1% 0.1% 0.1%
of F-gas 2. Fugitive Emissions HFCs 491.50 555.90 100.0% 10.0% 100% 0.0% 0.0% 0.0% 0.0% 0.1% 0.1%PFCs 762.90 882.00 100.0% 10.0% 100% 0.1% 0.0% 0.1% 0.0% 0.1% 0.1%SF6 4,708.30 764.80 100.0% 10.0% 100% 0.1% -0.3% 0.1% 0.0% 0.1% 0.1%
F. Consumption 1. Refrigeration Domestic Refrigerator HFCs 11.34 138.50 50.0% 40.0% 64% 0.0% 0.0% 0.0% 0.0% 0.0% 0.0%of F-gas and Air Commercial Refrigerator HFCs 11.10 685.34 50.0% 40.0% 64% 0.0% 0.1% 0.1% 0.0% 0.0% 0.0%
Stationary Air-Conditioning HFCs 0.00 225.06 50.0% 40.0% 64% 0.0% 0.0% 0.0% 0.0% 0.0% 0.0%Mobile Air-Conditioning HFCs 786.70 2,967.38 50.0% 40.0% 64% 0.1% 0.2% 0.2% 0.1% 0.2% 0.2%
2. Foam Blowing manufacturing HFCs 456.96 522.93 50.0% 50.0% 64% 0.0% 0.0% 0.0% 0.0% 0.0% 0.0%Stock HFCs 0.00 67.71 50.0% 50.0% 64% 0.0% 0.0% 0.0% 0.0% 0.0% 0.0%
4. Aerosols / MDI MDI stock/disposal HFCs 0.00 227.20 - 40.0% 40% 0.0% 0.0% 0.0% 0.0% 0.0% 0.0%Other manufacturing HFCs 0.00 57.92 - 40.0% 40% 0.0% 0.0% 0.0% 0.0% 0.0% 0.0%
stock/disposal HFCs 1,365.00 1,904.90 - 40.0% 40% 0.1% 0.0% 0.2% 0.0% 0.0% 0.0%5. Solvents PFCs 8,880.00 5,101.00 - 40.0% 40% 0.2% -0.4% 0.4% -0.1% 0.0% 0.1%7. Semiconductor Manufacture HFCs 145.40 129.78 50.0% 40.0% 64% 0.0% 0.0% 0.0% 0.0% 0.0% 0.0%
PFCs 2,857.80 3,917.21 50.0% 40.0% 64% 0.2% 0.1% 0.3% 0.0% 0.2% 0.2%SF6 1,099.82 1,784.38 50.0% 40.0% 64% 0.1% 0.0% 0.1% 0.0% 0.1% 0.1%
8. Electrical manufacturing SF6 9,560.00 662.03 30.0% 40.0% 50% 0.0% -0.8% 0.1% -0.3% 0.0% 0.3% Equipment stock SF6 1,434.00 296.36 50.0% 40.0% 64% 0.0% -0.1% 0.0% 0.0% 0.0% 0.0%9. Other SF6 0.00 0.00 50.0% 40.0% 64% 0.0% 0.0% 0.0% 0.0% 0.0% 0.0%
3. Solvent D. Other Anaesthesia N2O 287.07 297.54 - 5.0% 5% 0.0% 0.0% 0.0% 0.0% 0.0% 0.0%4. Agriculture A. Enteric Dairy Cattle CH4 4,042.62 3,512.55 10.0% 11.2% 15% 0.0% -0.1% 0.3% 0.0% 0.0% 0.0%
Fermentation Non-Dairy Cattle CH4 3,322.59 3,391.20 10.0% 17.3% 20% 0.1% 0.0% 0.3% 0.0% 0.0% 0.0%Buffalo CH4 0.25 0.10 50.0% 0.7% 50% 0.0% 0.0% 0.0% 0.0% 0.0% 0.0%Sheep CH4 2.64 0.96 50.0% 0.7% 50% 0.0% 0.0% 0.0% 0.0% 0.0% 0.0%Goat CH4 3.12 2.96 50.0% 0.4% 50% 0.0% 0.0% 0.0% 0.0% 0.0% 0.0%Swine CH4 261.74 223.81 50.0% 0.7% 50% 0.0% 0.0% 0.0% 0.0% 0.0% 0.0%Horse CH4 8.77 9.45 50.0% 0.7% 50% 0.0% 0.0% 0.0% 0.0% 0.0% 0.0%
B. Manure Dairy Cattle CH4 2,609.46 2,101.58 10.0% 76.8% 77% 0.1% -0.1% 0.2% 0.0% 0.0% 0.0% Management N2O 939.09 756.32 10.0% 97.3% 98% 0.1% 0.0% 0.1% 0.0% 0.0% 0.0%
Non-Dairy Cattle CH4 93.78 92.40 10.0% 73.2% 74% 0.0% 0.0% 0.0% 0.0% 0.0% 0.0%N2O 812.28 800.45 10.0% 125.1% 126% 0.1% 0.0% 0.1% 0.0% 0.0% 0.0%
Buffalo CH4 0.01 0.00 100.0% 0.7% 100% 0.0% 0.0% 0.0% 0.0% 0.0% 0.0%N2O 0.04 0.01 100.0% 0.7% 100% 0.0% 0.0% 0.0% 0.0% 0.0% 0.0%
Swine CH4 334.57 286.07 10.0% 105.5% 106% 0.0% 0.0% 0.0% 0.0% 0.0% 0.0%N2O 1,654.93 1,415.02 10.0% 74.3% 75% 0.1% 0.0% 0.1% 0.0% 0.0% 0.0%
Hen CH4 42.25 39.49 10.0% 72.3% 73% 0.0% 0.0% 0.0% 0.0% 0.0% 0.0%N2O 1,008.51 942.48 10.0% 102.5% 103% 0.1% 0.0% 0.1% 0.0% 0.0% 0.0%
Broiler CH4 39.18 28.23 10.0% 75.3% 76% 0.0% 0.0% 0.0% 0.0% 0.0% 0.0%N2O 1,102.87 794.69 10.0% 124.6% 125% 0.1% 0.0% 0.1% 0.0% 0.0% 0.0%
Sheep CH4 0.18 0.06 100.0% 0.7% 100% 0.0% 0.0% 0.0% 0.0% 0.0% 0.0%N2O 3.09 1.12 100.0% 0.7% 100% 0.0% 0.0% 0.0% 0.0% 0.0% 0.0%
Goat CH4 0.14 0.13 100.0% 0.7% 100% 0.0% 0.0% 0.0% 0.0% 0.0% 0.0%N2O 13.44 12.75 100.0% 0.7% 100% 0.0% 0.0% 0.0% 0.0% 0.0% 0.0%
Horse CH4 1.01 1.09 100.0% 0.7% 100% 0.0% 0.0% 0.0% 0.0% 0.0% 0.0%N2O 8.70 9.38 100.0% 0.7% 100% 0.0% 0.0% 0.0% 0.0% 0.0% 0.0%
C. Rice Continuously Flooded CH4 317.08 260.24 116.3% 0.3% 116% 0.0% 0.0% 0.0% 0.0% 0.0% 0.0% Cultivation Intermittently Straw amendment CH4 4,604.13 3,778.76 10.0% 30.1% 32% 0.1% -0.1% 0.3% 0.0% 0.0% 0.1%
Flooded Various compost amendment CH4 1,196.96 982.38 10.0% 45.2% 46% 0.0% 0.0% 0.1% 0.0% 0.0% 0.0%No-amendment CH4 957.56 785.90 10.0% 30.3% 32% 0.0% 0.0% 0.1% 0.0% 0.0% 0.0%
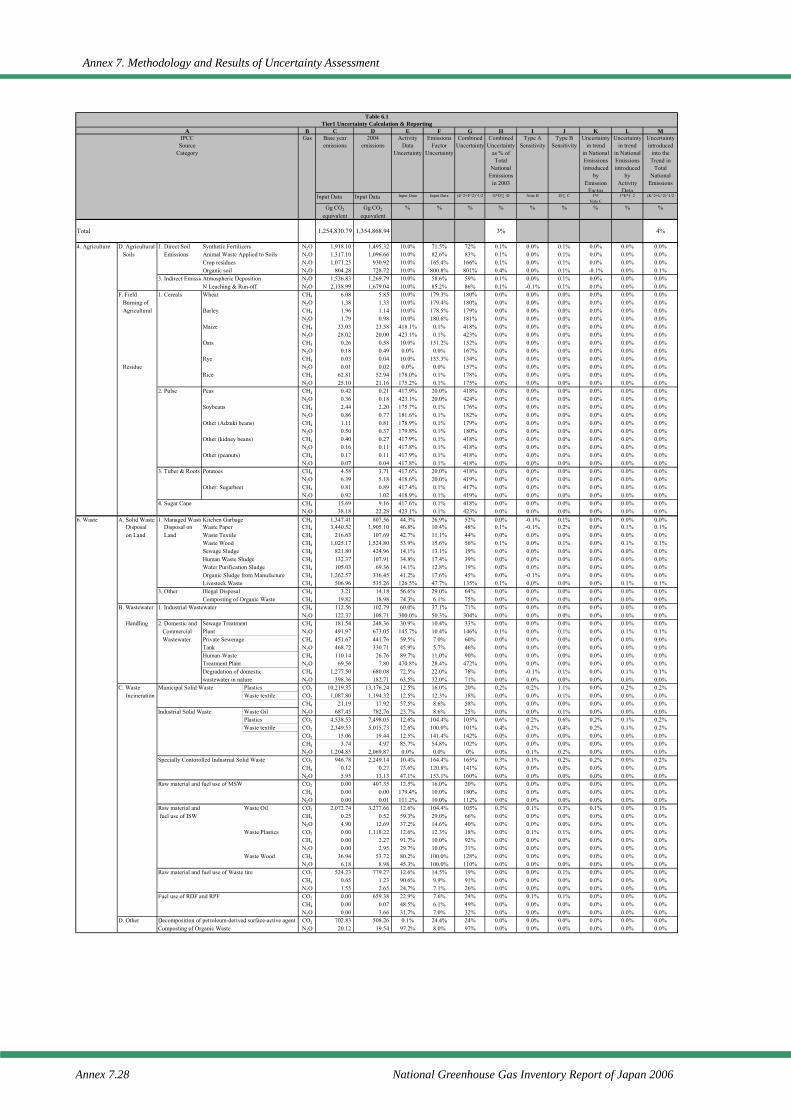
Annex 7. Methodology and Results of Uncertainty Assessment
Annex 7.28 National Greenhouse Gas Inventory Report of Japan 2006
Table 6.1Tier1 Uncertainty Calculation & Reporting
A B C D E F G H I J K L MIPCC
SourceCategory
Gas Base yearemissions
2004emissions
ActivityData
Uncertainty
EmissionsFactor
Uncertainty
CombinedUncertainty
CombinedUncertainty
as % ofTotal
NationalEmissions
in 2003
Type ASensitivity
Type BSensitivity
Uncertaintyin trend
in NationalEmissionsintroduced
byEmission
Factor
Uncertaintyin trend
in NationalEmissionsintroduced
byActivity
Data
Uncertaintyintroduced
into theTrend in
TotalNational
Emissions
Input Data Input Data Input Data Input Data (E^2+F^2)^1/2 G*D/∑D Note B D/∑C I*FNote C
J*E*√2 (K^2+L^2)^1/2
Gg CO2
equivalentGg CO2
equivalent% % % % % % % % %
Total 1,254,830.79 1,354,868.94 3% 4%
4. Agriculture D. Agricultural 1. Direct Soil Synthetic Fertilizers N2O 1,918.10 1,495.32 10.0% 71.5% 72% 0.1% 0.0% 0.1% 0.0% 0.0% 0.0% Soils Emissions Animal Waste Applied to Soils N2O 1,317.10 1,096.66 10.0% 82.6% 83% 0.1% 0.0% 0.1% 0.0% 0.0% 0.0%
Crop residues N2O 1,071.25 930.92 10.0% 165.4% 166% 0.1% 0.0% 0.1% 0.0% 0.0% 0.0%Organic soil N2O 804.28 728.72 10.0% 800.8% 801% 0.4% 0.0% 0.1% -0.1% 0.0% 0.1%
3. Indirect EmissioAtmospheric Deposition N2O 1,536.83 1,269.79 10.0% 58.6% 59% 0.1% 0.0% 0.1% 0.0% 0.0% 0.0%N Leaching & Run-off N2O 2,138.99 1,679.04 10.0% 85.2% 86% 0.1% -0.1% 0.1% 0.0% 0.0% 0.0%
F. Field 1. Cereals Wheat CH4 6.08 5.85 10.0% 179.3% 180% 0.0% 0.0% 0.0% 0.0% 0.0% 0.0% Burning of N2O 1.38 1.33 10.0% 179.4% 180% 0.0% 0.0% 0.0% 0.0% 0.0% 0.0% Agricultural Barley CH4 1.96 1.14 10.0% 178.5% 179% 0.0% 0.0% 0.0% 0.0% 0.0% 0.0%
N2O 1.79 0.98 10.0% 180.6% 181% 0.0% 0.0% 0.0% 0.0% 0.0% 0.0%Maize CH4 33.03 23.58 418.1% 0.1% 418% 0.0% 0.0% 0.0% 0.0% 0.0% 0.0%
N2O 28.02 20.00 423.1% 0.1% 423% 0.0% 0.0% 0.0% 0.0% 0.0% 0.0%Oats CH4 0.26 0.58 10.0% 151.2% 152% 0.0% 0.0% 0.0% 0.0% 0.0% 0.0%
N2O 0.18 0.49 0.0% 0.0% 167% 0.0% 0.0% 0.0% 0.0% 0.0% 0.0%Rye CH4 0.03 0.04 10.0% 133.3% 134% 0.0% 0.0% 0.0% 0.0% 0.0% 0.0%
Residue N2O 0.01 0.02 0.0% 0.0% 157% 0.0% 0.0% 0.0% 0.0% 0.0% 0.0%Rice CH4 62.81 52.94 178.0% 0.1% 178% 0.0% 0.0% 0.0% 0.0% 0.0% 0.0%
N2O 25.10 21.16 175.2% 0.1% 175% 0.0% 0.0% 0.0% 0.0% 0.0% 0.0%2. Pulse Peas CH4 0.42 0.21 417.9% 20.0% 418% 0.0% 0.0% 0.0% 0.0% 0.0% 0.0%
N2O 0.36 0.18 423.1% 20.0% 424% 0.0% 0.0% 0.0% 0.0% 0.0% 0.0%Soybeans CH4 2.44 2.20 175.7% 0.1% 176% 0.0% 0.0% 0.0% 0.0% 0.0% 0.0%
N2O 0.86 0.77 181.6% 0.1% 182% 0.0% 0.0% 0.0% 0.0% 0.0% 0.0%Other (Adzuki beans) CH4 1.11 0.81 178.9% 0.1% 179% 0.0% 0.0% 0.0% 0.0% 0.0% 0.0%
N2O 0.50 0.37 179.8% 0.1% 180% 0.0% 0.0% 0.0% 0.0% 0.0% 0.0%Other (kidney beans) CH4 0.40 0.27 417.9% 0.1% 418% 0.0% 0.0% 0.0% 0.0% 0.0% 0.0%
N2O 0.16 0.11 417.8% 0.1% 418% 0.0% 0.0% 0.0% 0.0% 0.0% 0.0%Other (peanuts) CH4 0.17 0.11 417.9% 0.1% 418% 0.0% 0.0% 0.0% 0.0% 0.0% 0.0%
N2O 0.07 0.04 417.8% 0.1% 418% 0.0% 0.0% 0.0% 0.0% 0.0% 0.0%3. Tuber & Roots Potatoes CH4 4.58 3.71 417.6% 20.0% 418% 0.0% 0.0% 0.0% 0.0% 0.0% 0.0%
N2O 6.39 5.18 418.6% 20.0% 419% 0.0% 0.0% 0.0% 0.0% 0.0% 0.0%Other: Sugarbeet CH4 0.81 0.89 417.4% 0.1% 417% 0.0% 0.0% 0.0% 0.0% 0.0% 0.0%
N2O 0.92 1.02 418.9% 0.1% 419% 0.0% 0.0% 0.0% 0.0% 0.0% 0.0%4. Sugar Cane CH4 15.69 9.16 417.6% 0.1% 418% 0.0% 0.0% 0.0% 0.0% 0.0% 0.0%
N2O 38.18 22.28 423.1% 0.1% 423% 0.0% 0.0% 0.0% 0.0% 0.0% 0.0%6. Waste A. Solid Waste 1. Managed WasteKitchen Garbage CH4 1,347.41 807.56 44.3% 26.9% 52% 0.0% -0.1% 0.1% 0.0% 0.0% 0.0%
Disposal Disposal on Waste Paper CH4 3,440.52 1,905.10 46.8% 10.4% 48% 0.1% -0.1% 0.2% 0.0% 0.1% 0.1% on Land Land Waste Textile CH4 216.63 107.69 42.7% 11.1% 44% 0.0% 0.0% 0.0% 0.0% 0.0% 0.0%
Waste Wood CH4 1,025.17 1,524.80 53.9% 15.6% 56% 0.1% 0.0% 0.1% 0.0% 0.1% 0.1%Sewage Sludge CH4 821.80 424.96 14.1% 13.1% 19% 0.0% 0.0% 0.0% 0.0% 0.0% 0.0%Human Waste Sludge CH4 132.37 107.91 34.8% 17.4% 39% 0.0% 0.0% 0.0% 0.0% 0.0% 0.0%Water Purification Sludge CH4 105.03 69.36 14.1% 12.8% 19% 0.0% 0.0% 0.0% 0.0% 0.0% 0.0%Organic Sludge from Manufacture CH4 1,262.57 316.45 41.2% 17.6% 45% 0.0% -0.1% 0.0% 0.0% 0.0% 0.0%Livestock Waste CH4 506.96 535.26 126.5% 47.7% 135% 0.1% 0.0% 0.0% 0.0% 0.1% 0.1%
3. Other Illegal Disposal CH4 3.21 14.18 56.6% 29.0% 64% 0.0% 0.0% 0.0% 0.0% 0.0% 0.0%Composting of Organic Waste CH4 19.82 18.98 74.3% 6.1% 75% 0.0% 0.0% 0.0% 0.0% 0.0% 0.0%
B. Wastewater 1. Industrial Wastewater CH4 112.56 102.79 60.0% 37.1% 71% 0.0% 0.0% 0.0% 0.0% 0.0% 0.0%N2O 122.37 108.71 300.0% 50.3% 304% 0.0% 0.0% 0.0% 0.0% 0.0% 0.0%
Handling 2. Domestic and Sewage Treatment CH4 181.54 248.36 30.9% 10.4% 33% 0.0% 0.0% 0.0% 0.0% 0.0% 0.0% Commercial Plant N2O 491.97 673.05 145.7% 10.4% 146% 0.1% 0.0% 0.1% 0.0% 0.1% 0.1% Wastewater Private Sewerage CH4 451.67 441.76 59.5% 7.0% 60% 0.0% 0.0% 0.0% 0.0% 0.0% 0.0%
Tank N2O 468.72 330.71 45.9% 5.7% 46% 0.0% 0.0% 0.0% 0.0% 0.0% 0.0%Human-Waste CH4 110.14 26.76 89.7% 11.0% 90% 0.0% 0.0% 0.0% 0.0% 0.0% 0.0%Treatment Plant N2O 69.56 7.80 470.8% 28.4% 472% 0.0% 0.0% 0.0% 0.0% 0.0% 0.0%Degradation of domestic CH4 1,277.50 680.08 72.5% 22.0% 76% 0.0% -0.1% 0.1% 0.0% 0.1% 0.1%wastewater in nature N2O 398.36 182.71 63.5% 32.0% 71% 0.0% 0.0% 0.0% 0.0% 0.0% 0.0%
C. Waste Municipal Solid Waste Plastics CO2 10,219.35 13,176.24 12.5% 16.0% 20% 0.2% 0.2% 1.1% 0.0% 0.2% 0.2% Incineration Waste textile CO2 1,087.80 1,194.32 12.5% 12.3% 18% 0.0% 0.0% 0.1% 0.0% 0.0% 0.0%
CH4 21.19 17.92 57.5% 8.6% 58% 0.0% 0.0% 0.0% 0.0% 0.0% 0.0%Industrial Solid Waste Waste Oil N2O 687.45 782.76 23.7% 8.6% 25% 0.0% 0.0% 0.1% 0.0% 0.0% 0.0%
Plastics CO2 4,538.53 7,498.05 12.6% 104.4% 105% 0.6% 0.2% 0.6% 0.2% 0.1% 0.2%Waste textile CO2 2,349.53 5,015.73 12.6% 100.0% 101% 0.4% 0.2% 0.4% 0.2% 0.1% 0.2%
CO2 15.06 19.44 12.5% 141.4% 142% 0.0% 0.0% 0.0% 0.0% 0.0% 0.0%CH4 3.74 4.97 85.7% 54.8% 102% 0.0% 0.0% 0.0% 0.0% 0.0% 0.0%N2O 1,204.85 2,069.87 0.0% 0.0% 0% 0.0% 0.1% 0.2% 0.0% 0.0% 0.0%
Specially Contorolled Industrial Solid Waste CO2 946.78 2,249.14 10.4% 164.4% 165% 0.3% 0.1% 0.2% 0.2% 0.0% 0.2%CH4 0.12 0.27 73.6% 120.8% 141% 0.0% 0.0% 0.0% 0.0% 0.0% 0.0%N2O 5.95 13.13 47.1% 153.1% 160% 0.0% 0.0% 0.0% 0.0% 0.0% 0.0%
Raw material and fuel use of MSW CO2 0.00 407.35 12.5% 16.0% 20% 0.0% 0.0% 0.0% 0.0% 0.0% 0.0%CH4 0.00 0.00 179.4% 10.0% 180% 0.0% 0.0% 0.0% 0.0% 0.0% 0.0%N2O 0.00 0.01 111.2% 10.0% 112% 0.0% 0.0% 0.0% 0.0% 0.0% 0.0%
Raw material and Waste Oil CO2 2,072.74 3,277.66 12.6% 104.4% 105% 0.3% 0.1% 0.3% 0.1% 0.0% 0.1% fuel use of ISW CH4 0.25 0.52 59.3% 29.0% 66% 0.0% 0.0% 0.0% 0.0% 0.0% 0.0%
N2O 4.90 12.69 37.2% 14.6% 40% 0.0% 0.0% 0.0% 0.0% 0.0% 0.0%Waste Plastics CO2 0.00 1,118.22 12.6% 12.3% 18% 0.0% 0.1% 0.1% 0.0% 0.0% 0.0%
CH4 0.00 2.27 91.7% 10.0% 92% 0.0% 0.0% 0.0% 0.0% 0.0% 0.0%N2O 0.00 2.95 29.7% 10.0% 31% 0.0% 0.0% 0.0% 0.0% 0.0% 0.0%
Waste Wood CH4 36.94 53.72 80.2% 100.0% 128% 0.0% 0.0% 0.0% 0.0% 0.0% 0.0%N2O 6.18 8.98 45.3% 100.0% 110% 0.0% 0.0% 0.0% 0.0% 0.0% 0.0%
Raw material and fuel use of Waste tire CO2 524.23 779.27 12.6% 14.5% 19% 0.0% 0.0% 0.1% 0.0% 0.0% 0.0%CH4 0.65 1.23 90.6% 9.9% 91% 0.0% 0.0% 0.0% 0.0% 0.0% 0.0%N2O 1.55 2.65 24.7% 7.1% 26% 0.0% 0.0% 0.0% 0.0% 0.0% 0.0%
Fuel use of RDF and RPF CO2 0.00 659.38 22.9% 7.6% 24% 0.0% 0.1% 0.1% 0.0% 0.0% 0.0%CH4 0.00 0.07 48.5% 6.1% 49% 0.0% 0.0% 0.0% 0.0% 0.0% 0.0%N2O 0.00 3.66 31.7% 7.0% 32% 0.0% 0.0% 0.0% 0.0% 0.0% 0.0%
D. Other Decomposition of petroleum-derived surface-active agent CO2 702.83 508.26 0.1% 24.4% 24% 0.0% 0.0% 0.0% 0.0% 0.0% 0.0%Composting of Organic Waste N2O 20.12 19.54 97.2% 8.0% 97% 0.0% 0.0% 0.0% 0.0% 0.0% 0.0%
Annex 8. National Greenhouse Gas Emissions in Fiscal Year 2004 (for Domestic Publication)
National Greenhouse Gas Inventory Report of Japan 2006 Annex 8.1
Annex 8. National Greenhouse Gas Emissions in Fiscal Year 2004 (for Domestic Publication)
In this annex, to review the achievement of Japan’s commitment of the Kyoto Protocol (6% reduction from the base year1 [1990 for CO2, CH4 and N2O, while 1995 for HFCs, PFCs and SF6]), national total greenhouse gas emissions without LUCF sector is expressed. CO2 emissions from power generation and heat generation (industrial steam generation and district heat supply) are allocated to the sector consuming the electricity and heat, in order to review the progress of countermeasures against global warming issues.
Summary
Greenhouse gas emission estimates reported in this submission were projected based on the current emission estimating methods which have been in the process of improvements. Greenhouse gas emission estimates are required to be annually submitted to the UNFCCC secretariat.
Since the assigned amount for the first commitment period (2008-2012) needs to be reported to the UNFCCC secretariat by September 1, 2006 after determining the base year emissions, improvements process on greenhouse gas emissions estimating methods has been still underway. Therefore, due to future improvements, recalculations may be conducted afterward on the emissions reported in this submission.
Total greenhouse gas emission in fiscal 2004 was 1,355 million tons (in CO2 equivalents)2 . Compared to that in the base year under the Kyoto Protocol (in principle: 1990), it
increased by 8.0% and have decreased by 0.2% from the previous year due to an improvement in nuclear power plant capacity utilization ratio.
Carbon Dioxide emissions from energy use which accounts for about 90% of the total greenhouse gas emissions is increased by 12.9% compared to that in the base year. Sectoral breakdown of Carbon Dioxide (CO2) emissions is as follows.
Assuming that the actual nuclear power plant capacity utilization ratio in FY2004 is equivalent to the ratio planned before a nuclear power plant shutdown in FY2002, the ratio of total greenhouse gas emissions in FY2004 compared to the base year increased by 5.2% and also exceeded the ratio of total emissions in FY2003 compared to the base year by 1.8%.
<Industrial Sector (Factories)> Decrease of 3.4% over fiscal 1990 (increase of 0.1% over previous fiscal year)
<Transportation Sector (Automobiles and Ships, etc.)> Increase of 20.3% over fiscal 1990 (decrease of 0.1% over previous fiscal year)
<Commercial and Other Sector (Commerce, Service, Office, etc.)> Increase of 37.9% over fiscal 1990 (decrease of 0.6% over previous fiscal year)
1 The base year of emissions of HFCs, PFCs and SF6 is permitted to set up the year for 1995 in accordance with
Article 3, paragraph 8 of the Kyoto Protocol. 2 This value is provisional and subject to change in accordance with the future revision of calculation methods.
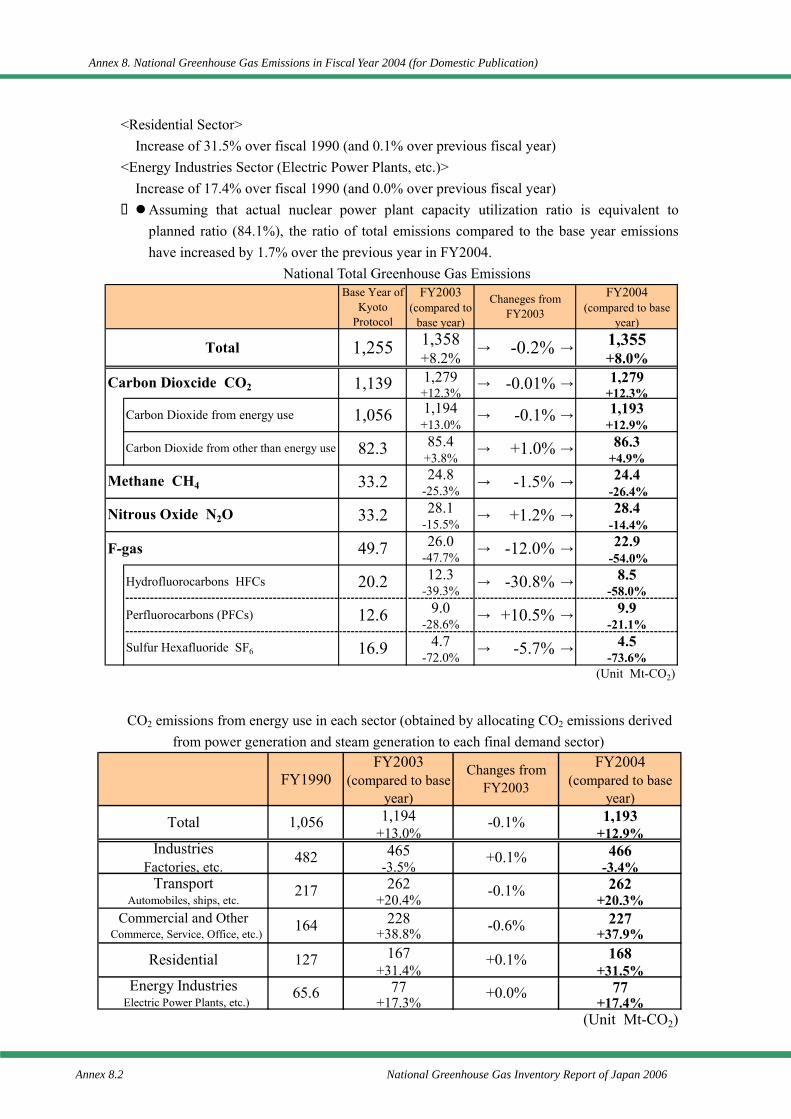
Annex 8. National Greenhouse Gas Emissions in Fiscal Year 2004 (for Domestic Publication)
Annex 8.2 National Greenhouse Gas Inventory Report of Japan 2006
<Residential Sector> Increase of 31.5% over fiscal 1990 (and 0.1% over previous fiscal year)
<Energy Industries Sector (Electric Power Plants, etc.)> Increase of 17.4% over fiscal 1990 (and 0.0% over previous fiscal year) Assuming that actual nuclear power plant capacity utilization ratio is equivalent to
planned ratio (84.1%), the ratio of total emissions compared to the base year emissions have increased by 1.7% over the previous year in FY2004.
National Total Greenhouse Gas Emissions CO2 emissions from energy use in each sector (obtained by allocating CO2 emissions derived
from power generation and steam generation to each final demand sector)
Base Year ofKyoto
Protocol
FY2003(compared to
base year)
FY2004(compared to base
year)1,358 1,355+8.2% +8.0%1,279 1,279+12.3% +12.3%1,194 1,193+13.0% +12.9%85.4 86.3
+3.8% +4.9%24.8 24.4
-25.3% -26.4%28.1 28.4
-15.5% -14.4%26.0 22.9
-47.7% -54.0%12.3 8.5
-39.3% -58.0%9.0 9.9
-28.6% -21.1%4.7 4.5
-72.0% -73.6%(Unit:Mt-CO2)
Chaneges fromFY2003
Total 1,255 → -0.2% →
→
Carbon Dioxide from energy use 1,056 → -0.1% →
Carbon Dioxcide(CO2) 1,139 → -0.01%
→
Methane(CH4) 33.2 → -1.5% →
Carbon Dioxide from other than energy use 82.3 → +1.0%
→
F-gas 49.7 → -12.0% →
Nitrous Oxide(N2O) 33.2 → +1.2%
→
Perfluorocarbons (PFCs) 12.6 → +10.5% →
Hydrofluorocarbons(HFCs) 20.2 → -30.8%
→Sulfur Hexafluoride(SF6) 16.9 → -5.7%
FY1990FY2003
(compared to baseyear)
FY2004(compared to base
year)1,194 1,193
+13.0% +12.9%465 466
-3.5% -3.4%262 262
+20.4% +20.3%228 227
+38.8% +37.9%167 168
+31.4% +31.5%77 77
+17.3% +17.4%(Unit:Mt-CO2)
→Energy Industries(Electric Power Plants, etc.)
65.6 → +0.0%
→
Residential 127 → +0.1% →
Commercial and Other(Commerce, Service, Office, etc.)
164 → -0.6%
→
Transport(Automobiles, ships, etc.)
217 → -0.1% →
Industries(Factories, etc.)
482 → +0.1%
Changes fromFY2003
Total 1,056 → -0.1% →
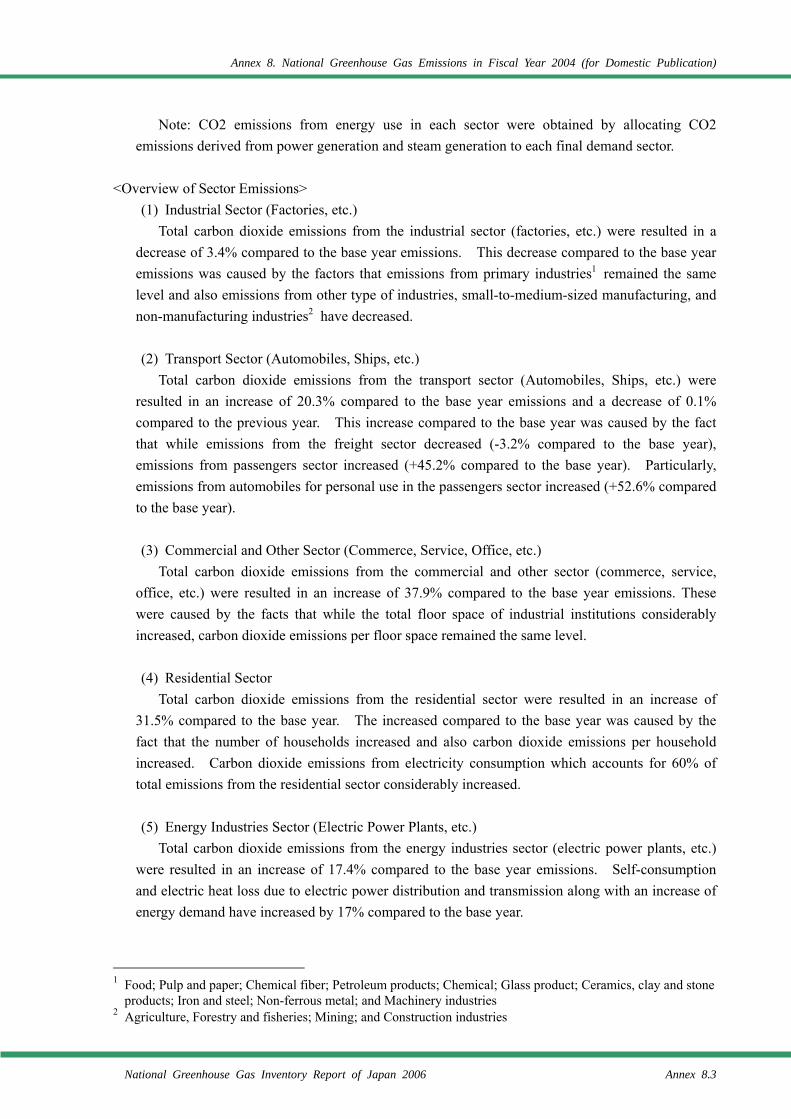
Annex 8. National Greenhouse Gas Emissions in Fiscal Year 2004 (for Domestic Publication)
National Greenhouse Gas Inventory Report of Japan 2006 Annex 8.3
Note: CO2 emissions from energy use in each sector were obtained by allocating CO2 emissions derived from power generation and steam generation to each final demand sector.
<Overview of Sector Emissions>
(1) Industrial Sector (Factories, etc.) Total carbon dioxide emissions from the industrial sector (factories, etc.) were resulted in a
decrease of 3.4% compared to the base year emissions. This decrease compared to the base year emissions was caused by the factors that emissions from primary industries1 remained the same level and also emissions from other type of industries, small-to-medium-sized manufacturing, and non-manufacturing industries2 have decreased.
(2) Transport Sector (Automobiles, Ships, etc.)
Total carbon dioxide emissions from the transport sector (Automobiles, Ships, etc.) were resulted in an increase of 20.3% compared to the base year emissions and a decrease of 0.1% compared to the previous year. This increase compared to the base year was caused by the fact that while emissions from the freight sector decreased (-3.2% compared to the base year), emissions from passengers sector increased (+45.2% compared to the base year). Particularly, emissions from automobiles for personal use in the passengers sector increased (+52.6% compared to the base year).
(3) Commercial and Other Sector (Commerce, Service, Office, etc.)
Total carbon dioxide emissions from the commercial and other sector (commerce, service, office, etc.) were resulted in an increase of 37.9% compared to the base year emissions. These were caused by the facts that while the total floor space of industrial institutions considerably increased, carbon dioxide emissions per floor space remained the same level.
(4) Residential Sector
Total carbon dioxide emissions from the residential sector were resulted in an increase of 31.5% compared to the base year. The increased compared to the base year was caused by the fact that the number of households increased and also carbon dioxide emissions per household increased. Carbon dioxide emissions from electricity consumption which accounts for 60% of total emissions from the residential sector considerably increased.
(5) Energy Industries Sector (Electric Power Plants, etc.)
Total carbon dioxide emissions from the energy industries sector (electric power plants, etc.) were resulted in an increase of 17.4% compared to the base year emissions. Self-consumption and electric heat loss due to electric power distribution and transmission along with an increase of energy demand have increased by 17% compared to the base year.
1 Food; Pulp and paper; Chemical fiber; Petroleum products; Chemical; Glass product; Ceramics, clay and stone
products; Iron and steel; Non-ferrous metal; and Machinery industries 2 Agriculture, Forestry and fisheries; Mining; and Construction industries
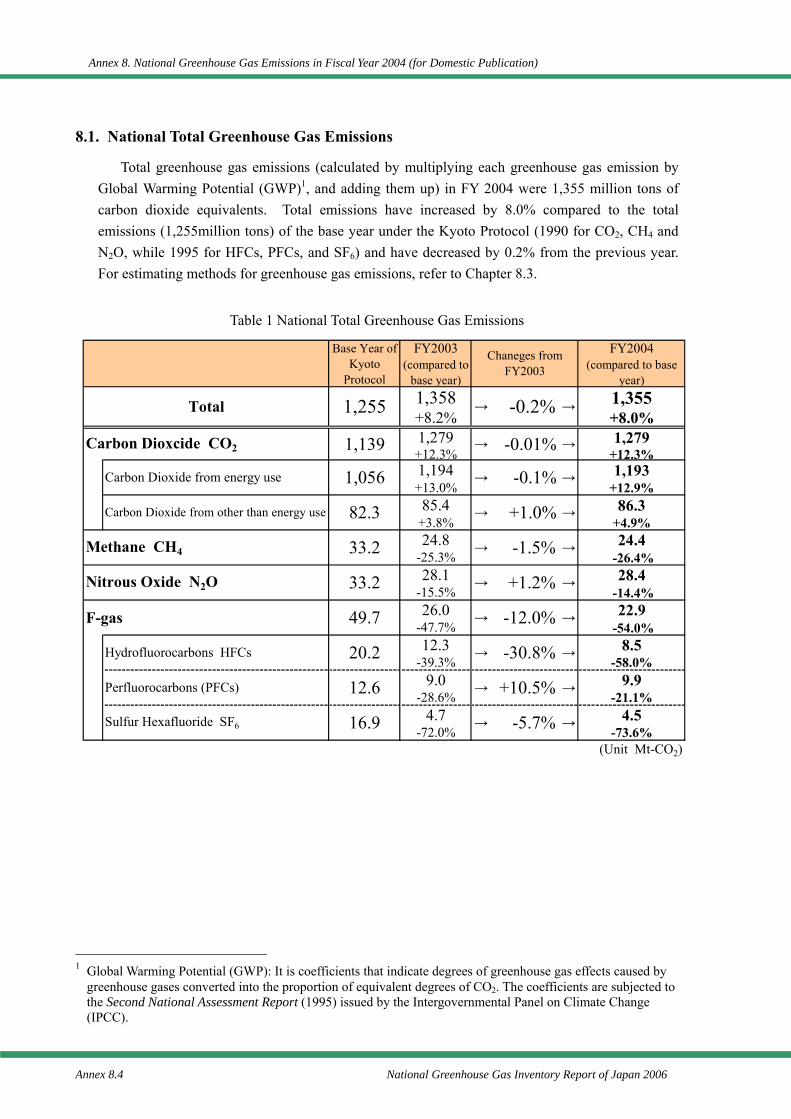
Annex 8. National Greenhouse Gas Emissions in Fiscal Year 2004 (for Domestic Publication)
Annex 8.4 National Greenhouse Gas Inventory Report of Japan 2006
8.1. National Total Greenhouse Gas Emissions
Total greenhouse gas emissions (calculated by multiplying each greenhouse gas emission by Global Warming Potential (GWP)1, and adding them up) in FY 2004 were 1,355 million tons of carbon dioxide equivalents. Total emissions have increased by 8.0% compared to the total emissions (1,255million tons) of the base year under the Kyoto Protocol (1990 for CO2, CH4 and N2O, while 1995 for HFCs, PFCs, and SF6) and have decreased by 0.2% from the previous year. For estimating methods for greenhouse gas emissions, refer to Chapter 8.3.
Table 1 National Total Greenhouse Gas Emissions
1 Global Warming Potential (GWP): It is coefficients that indicate degrees of greenhouse gas effects caused by
greenhouse gases converted into the proportion of equivalent degrees of CO2. The coefficients are subjected to the Second National Assessment Report (1995) issued by the Intergovernmental Panel on Climate Change (IPCC).
Base Year ofKyoto
Protocol
FY2003(compared to
base year)
FY2004(compared to base
year)1,358 1,355+8.2% +8.0%1,279 1,279+12.3% +12.3%1,194 1,193+13.0% +12.9%85.4 86.3
+3.8% +4.9%24.8 24.4
-25.3% -26.4%28.1 28.4
-15.5% -14.4%26.0 22.9
-47.7% -54.0%12.3 8.5
-39.3% -58.0%9.0 9.9
-28.6% -21.1%4.7 4.5
-72.0% -73.6%(Unit:Mt-CO2)
Chaneges fromFY2003
Total 1,255 → -0.2% →
→
Carbon Dioxide from energy use 1,056 → -0.1% →
Carbon Dioxcide(CO2) 1,139 → -0.01%
→
Methane(CH4) 33.2 → -1.5% →
Carbon Dioxide from other than energy use 82.3 → +1.0%
→
F-gas 49.7 → -12.0% →
Nitrous Oxide(N2O) 33.2 → +1.2%
→
Perfluorocarbons (PFCs) 12.6 → +10.5% →
Hydrofluorocarbons(HFCs) 20.2 → -30.8%
→Sulfur Hexafluoride(SF6) 16.9 → -5.7%
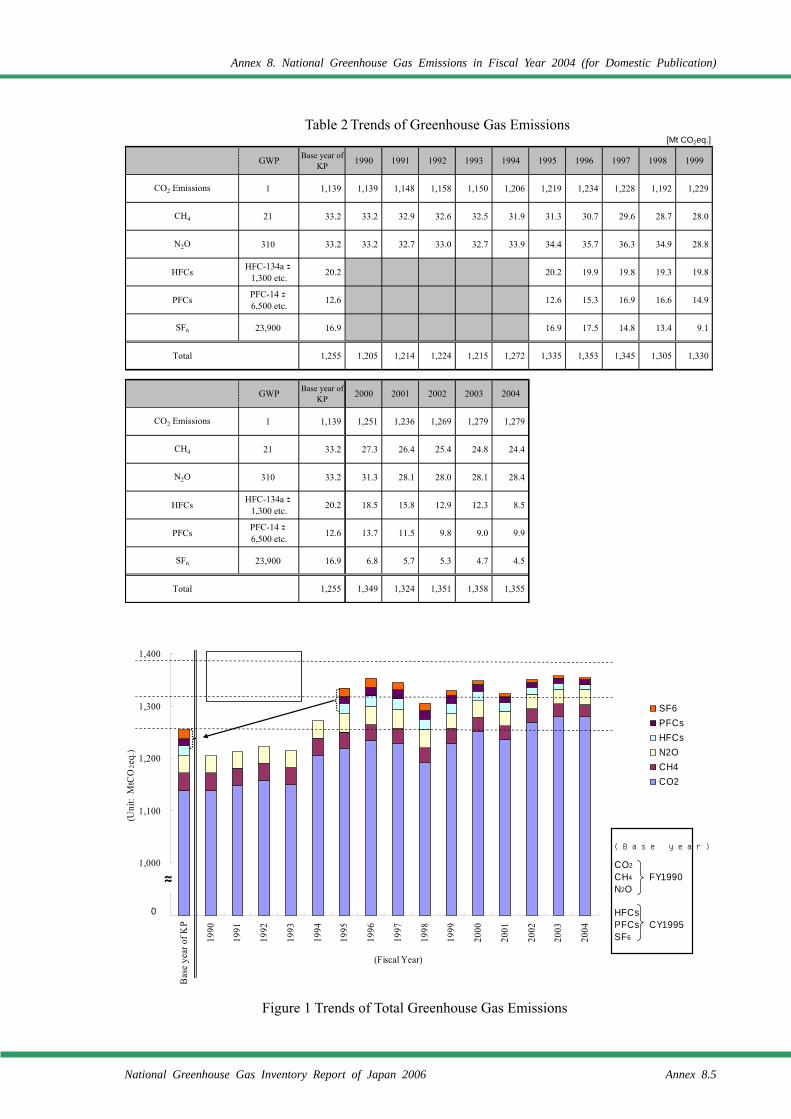
Annex 8. National Greenhouse Gas Emissions in Fiscal Year 2004 (for Domestic Publication)
National Greenhouse Gas Inventory Report of Japan 2006 Annex 8.5
Table 2 Trends of Greenhouse Gas Emissions
Figure 1 Trends of Total Greenhouse Gas Emissions
[Mt CO2eq.]
GWP Base year ofKP 1990 1991 1992 1993 1994 1995 1996 1997 1998 1999
CO2 Emissions 1 1,139 1,139 1,148 1,158 1,150 1,206 1,219 1,234 1,228 1,192 1,229
CH4 21 33.2 33.2 32.9 32.6 32.5 31.9 31.3 30.7 29.6 28.7 28.0
N2O 310 33.2 33.2 32.7 33.0 32.7 33.9 34.4 35.7 36.3 34.9 28.8
HFCs HFC-134a:1,300 etc. 20.2 20.2 19.9 19.8 19.3 19.8
PFCs PFC-14:6,500 etc. 12.6 12.6 15.3 16.9 16.6 14.9
SF6 23,900 16.9 16.9 17.5 14.8 13.4 9.1
Total 1,255 1,205 1,214 1,224 1,215 1,272 1,335 1,353 1,345 1,305 1,330
GWP Base year ofKP 2000 2001 2002 2003 2004
CO2 Emissions 1 1,139 1,251 1,236 1,269 1,279 1,279
CH4 21 33.2 27.3 26.4 25.4 24.8 24.4
N2O 310 33.2 31.3 28.1 28.0 28.1 28.4
HFCs HFC-134a:1,300 etc. 20.2 18.5 15.8 12.9 12.3 8.5
PFCs PFC-14:6,500 etc. 12.6 13.7 11.5 9.8 9.0 9.9
SF6 23,900 16.9 6.8 5.7 5.3 4.7 4.5
Total 1,255 1,349 1,324 1,351 1,358 1,355
900
1,000
1,100
1,200
1,300
1,400
Bas
e ye
ar o
f KP
1990
1991
1992
1993
1994
1995
1996
1997
1998
1999
2000
2001
2002
2003
2004
(Fiscal Year)
(Uni
t: M
tCO
2eq.
)
SF6PFCsHFCsN2OCH4CO2
(Base year)
CO2
CH4 FY1990N2O
HFCsPFCs CY1995SF6
0
±0%
+5%
+10%
≈
National total emissions inbase year are obtained by
adding HFCs、PFCs、SF6
emissions in 1995 to thetotal emissions in 1990.
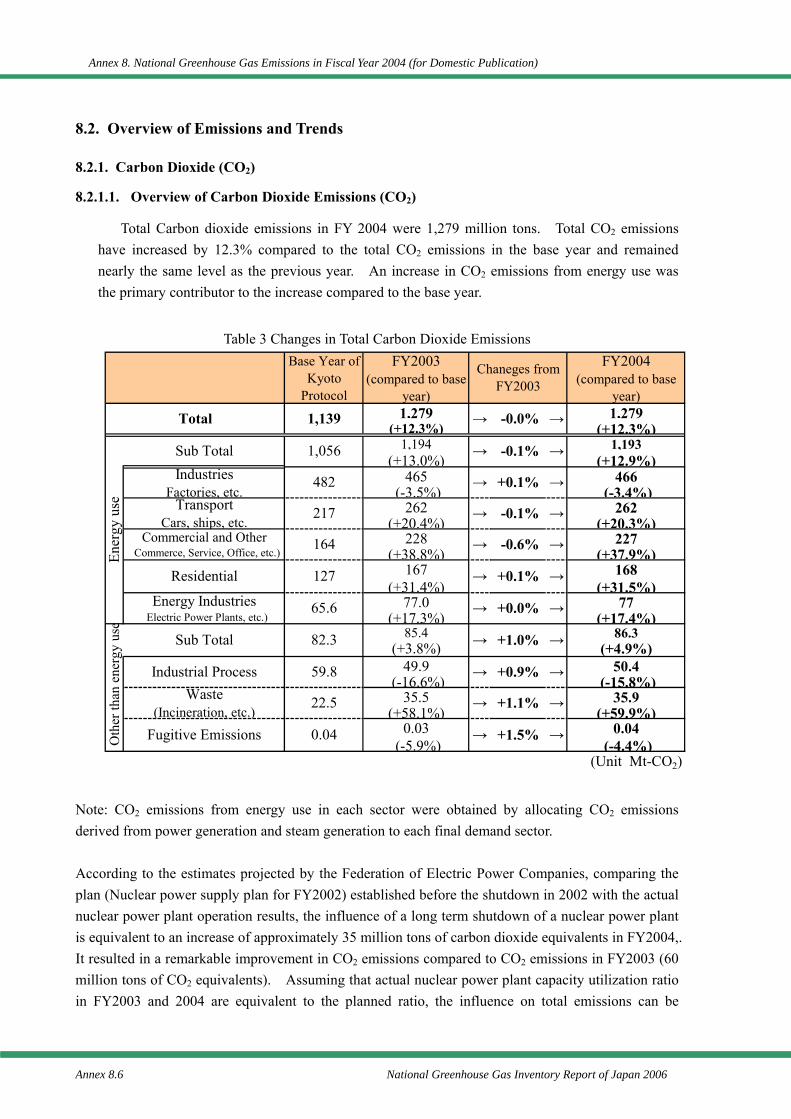
Annex 8. National Greenhouse Gas Emissions in Fiscal Year 2004 (for Domestic Publication)
Annex 8.6 National Greenhouse Gas Inventory Report of Japan 2006
8.2. Overview of Emissions and Trends
8.2.1. Carbon Dioxide (CO2)
8.2.1.1. Overview of Carbon Dioxide Emissions (CO2)
Total Carbon dioxide emissions in FY 2004 were 1,279 million tons. Total CO2 emissions have increased by 12.3% compared to the total CO2 emissions in the base year and remained nearly the same level as the previous year. An increase in CO2 emissions from energy use was the primary contributor to the increase compared to the base year.
Table 3 Changes in Total Carbon Dioxide Emissions
Note: CO2 emissions from energy use in each sector were obtained by allocating CO2 emissions derived from power generation and steam generation to each final demand sector. According to the estimates projected by the Federation of Electric Power Companies, comparing the plan (Nuclear power supply plan for FY2002) established before the shutdown in 2002 with the actual nuclear power plant operation results, the influence of a long term shutdown of a nuclear power plant is equivalent to an increase of approximately 35 million tons of carbon dioxide equivalents in FY2004,. It resulted in a remarkable improvement in CO2 emissions compared to CO2 emissions in FY2003 (60 million tons of CO2 equivalents). Assuming that actual nuclear power plant capacity utilization ratio in FY2003 and 2004 are equivalent to the planned ratio, the influence on total emissions can be
Base Year ofKyoto
Protocol
FY2003(compared to base
year)
FY2004(compared to base
year)1,279 1,279
(+12.3%) (+12.3%)1,194 1,193
(+13.0%) (+12.9%)465 466
(-3.5%) (-3.4%)262 262
(+20.4%) (+20.3%)228 227
(+38.8%) (+37.9%)167 168
(+31.4%) (+31.5%)77.0 77
(+17.3%) (+17.4%)85.4 86.3
(+3.8%) (+4.9%)49.9 50.4
(-16.6%) (-15.8%)35.5 35.9
(+58.1%) (+59.9%)0.03 0.04
(-5.9%) (-4.4%)(Unit:Mt-CO2)
Chaneges fromFY2003
Total 1,139 → -0.0% →
Ener
gy u
se
Sub Total 1,056 →
Transport(Cars, ships, etc.)
217 →
Residential 127 →
-0.1% →Industries
(Factories, etc.)482 → +0.1% →
-0.1% →Commercial and Other
(Commerce, Service, Office, etc.)164 → -0.6% →
+0.1% →
Energy Industries(Electric Power Plants, etc.)
65.6 → +0.0% →
Oth
er th
an e
nerg
y us
e
Sub Total 82.3 →
Waste(Incineration, etc.)
22.5 →
+1.0% →
Industrial Process 59.8 → +0.9% →
+1.1% →
Fugitive Emissions 0.04 → +1.5% →
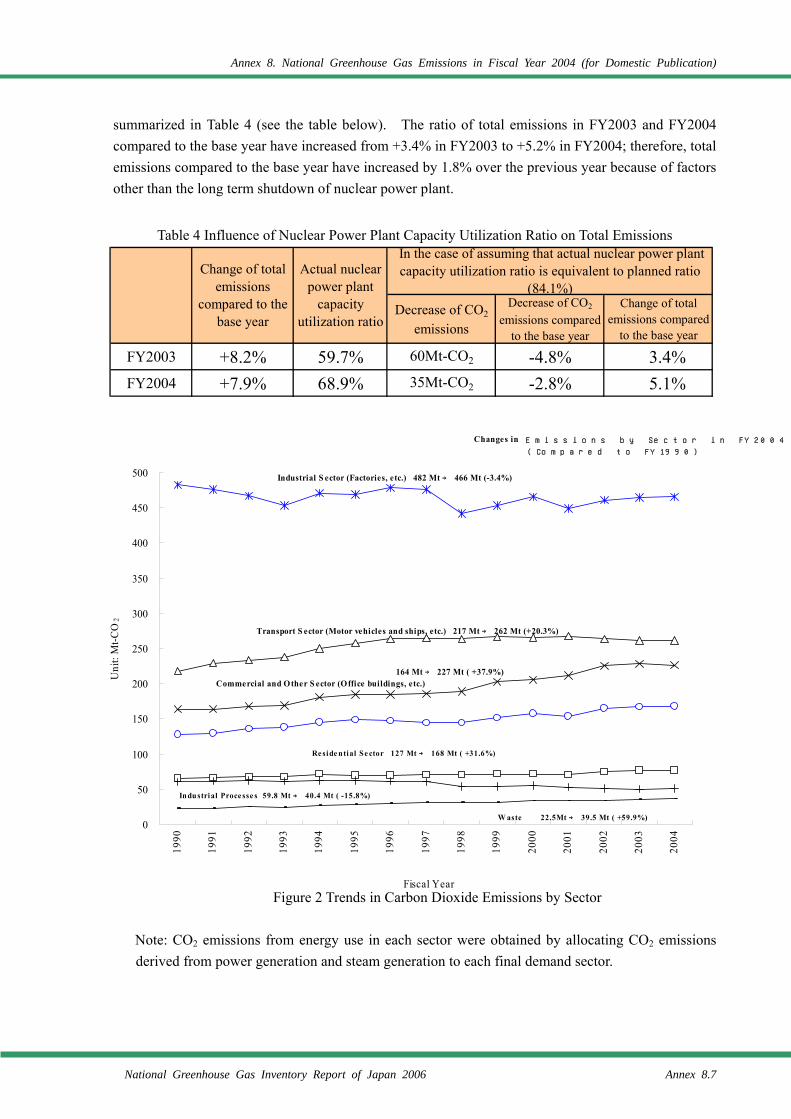
Annex 8. National Greenhouse Gas Emissions in Fiscal Year 2004 (for Domestic Publication)
National Greenhouse Gas Inventory Report of Japan 2006 Annex 8.7
summarized in Table 4 (see the table below). The ratio of total emissions in FY2003 and FY2004 compared to the base year have increased from +3.4% in FY2003 to +5.2% in FY2004; therefore, total emissions compared to the base year have increased by 1.8% over the previous year because of factors other than the long term shutdown of nuclear power plant.
Table 4 Influence of Nuclear Power Plant Capacity Utilization Ratio on Total Emissions
Figure 2 Trends in Carbon Dioxide Emissions by Sector
Note: CO2 emissions from energy use in each sector were obtained by allocating CO2 emissions derived from power generation and steam generation to each final demand sector.
Decrease of CO2
emissions
Decrease of CO2
emissions comparedto the base year
Change of totalemissions compared
to the base year
FY2003 +8.2% 59.7% 60Mt-CO2 -4.8% +3.4%FY2004 +7.9% 68.9% 35Mt-CO2 -2.8% +5.1%
Change of totalemissions
compared to thebase year
Actual nuclearpower plant
capacityutilization ratio
In the case of assuming that actual nuclear power plantcapacity utilization ratio is equivalent to planned ratio
(84.1%)
0
50
100
150
200
250
300
350
400
450
500
1990
1991
1992
1993
1994
1995
1996
1997
1998
1999
2000
2001
2002
2003
2004
(Fiscal Year)
(U
nit:
Mt-C
O2)
Changes in Emiss ions by Se c to r in FY 2004
(Compare d to FY 1990 )
Industrial S ector (Factories, etc.) 482 Mt → 466 Mt (-3.4%)
Transport S ector (Motor vehicles and ships, etc.) 217 Mt → 262 Mt (+20.3%)
164 Mt → 227 Mt ( +37.9%)Commercial and Other S ector (Office buildings, etc.)
Re side ntial Se ctor 127 Mt → 168 Mt ( +31.6%)
In du strial Proce sse s 59.8 Mt → 40.4 Mt ( -15.8%)
W aste 22.5Mt → 39.5 Mt ( +59.9%)
Annex 8. National Greenhouse Gas Emissions in Fiscal Year 2004 (for Domestic Publication)
Annex 8.8 National Greenhouse Gas Inventory Report of Japan 2006
8.2.1.2. Overview of Sector Emissions
(1) Industrial Sector (Factories, etc.) Total carbon dioxide emissions from the industrial sector (factories, etc.) in FY2004 were 466
million tons of CO2 equivalents and resulted in a decrease of 3.4% compared to the base year emissions and an increase of 0.1% compared to the previous year. A decrease of 3.4% compared to the base year emissions was caused by the factors that emissions from primary industries1 remained the same level and also emissions from other type of industries, small-to-medium-sized manufacturing, and non-manufacturing industries2 have decreased.
(2) Transport Sector (Automobiles, Ships, etc.)
Total carbon dioxide emissions from the transport sector (Automobiles, Ships, etc.) in FY2004 were 262 million tons of CO2 equivalents and resulted in an increase of 20.3% compared to the base year emissions and a decrease of 0.1% compared to the previous year. This increase compared to the base year was caused by the fact that while emissions from the freight sector decreased (-3.2% compared to the base year), emissions from passengers sector increased (+42.5% compared to the base year). Particularly, emissions from automobiles for personal use in the passengers sector increased (+52.6% compared to the base year).
(3) Commercial and Other Sector (Commerce, Service, Office, etc.)
Total carbon dioxide emissions from the commercial and other sector (Commerce, Service, Office, etc.) in FY2004 were 227 million tons of CO2 equivalents and resulted in an increase of 37.9% compared to the base year emissions and a decrease of 0.6% compared to the previous year. These were caused by the facts that while the total floor space of industrial institutions considerably increased (+35.5% compared to the base year), carbon dioxide emissions per floor space remained the same level.
(4) Residential Sector
Total carbon dioxide emissions from the residential sector in FY2004 were 168 million tons of CO2 equivalents and resulted in an increase of 31.5% compared to the base year and an increase of 0.1% compared to the previous year. The increased compared to the base year was caused by the fact that the number of households considerably increased (+20.5% compared to the base year) and also carbon dioxide emissions per household increased (+8.6% compared to the base year). Carbon dioxide emissions from electricity consumption which accounts for 60% of total emissions from the residential sector considerably increased (+45.8% compared to the base year).
(5) Energy Industries Sector (Electric Power Plants, etc.)
Total carbon dioxide emissions from the energy industries sector (electric power plants, etc.) in FY2004 were 77 million tons of CO2 equivalents and resulted in an increase of 17.4% compared to the base year emissions and remained the same level as the previous year. Self-consumption and
1 Food; Pulp and paper; Chemical fiber; Petroleum products; Chemical; Glass product; Ceramics, clay and stone
products; Iron and steel; Non-ferrous metal; and Machinery industries 2 Agriculture, Forestry and fisheries; Mining; and Construction industries
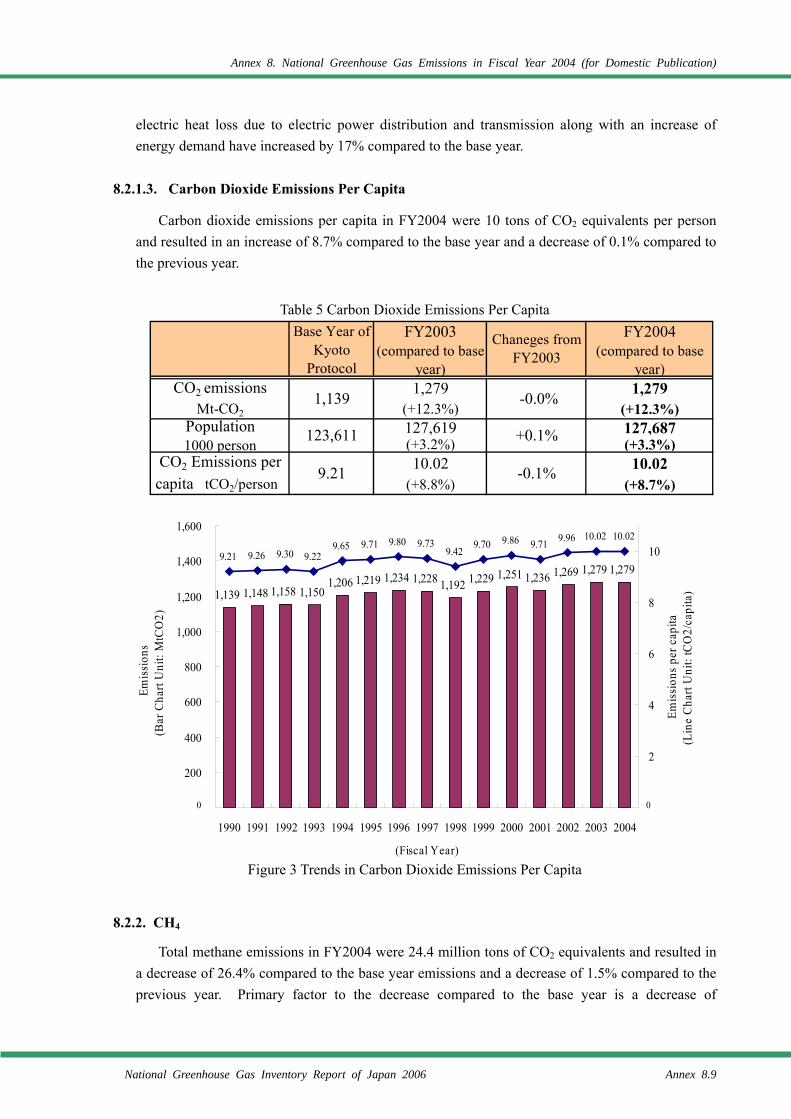
Annex 8. National Greenhouse Gas Emissions in Fiscal Year 2004 (for Domestic Publication)
National Greenhouse Gas Inventory Report of Japan 2006 Annex 8.9
electric heat loss due to electric power distribution and transmission along with an increase of energy demand have increased by 17% compared to the base year.
8.2.1.3. Carbon Dioxide Emissions Per Capita
Carbon dioxide emissions per capita in FY2004 were 10 tons of CO2 equivalents per person and resulted in an increase of 8.7% compared to the base year and a decrease of 0.1% compared to the previous year.
Table 5 Carbon Dioxide Emissions Per Capita
Figure 3 Trends in Carbon Dioxide Emissions Per Capita
8.2.2. CH4
Total methane emissions in FY2004 were 24.4 million tons of CO2 equivalents and resulted in a decrease of 26.4% compared to the base year emissions and a decrease of 1.5% compared to the previous year. Primary factor to the decrease compared to the base year is a decrease of
Base Year ofKyoto
Protocol
FY2003(compared to base
year)
FY2004(compared to base
year)1,279 1,279
(+12.3%) (+12.3%)127,619 127,687(+3.2%) (+3.3%)10.02 10.02
(+8.8%) (+8.7%)
+0.1%
Chaneges fromFY2003
1,139 → -0.0% →CO2 emissions
(Mt-CO2)Population
(1000 person)CO2 Emissions percapita (tCO2/person)
→
9.21 → -0.1% →
123,611 →
1,139 1,148 1,158 1,1501,206 1,219 1,234 1,228 1,192 1,229 1,251 1,236 1,269 1,279 1,279
9.21 9.26 9.30 9.229.65 9.71 9.80 9.73
9.429.70 9.86 9.71 9.96 10.02 10.02
0
200
400
600
800
1,000
1,200
1,400
1,600
1990 1991 1992 1993 1994 1995 1996 1997 1998 1999 2000 2001 2002 2003 2004
(Fiscal Year)
0
2
4
6
8
10
Emis
sion
s(B
ar C
hart
Uni
t: M
tCO
2)
0 0
Emis
sion
s pe
r cap
ita(L
ine
Cha
rt U
nit:
tCO
2/ca
pita
)
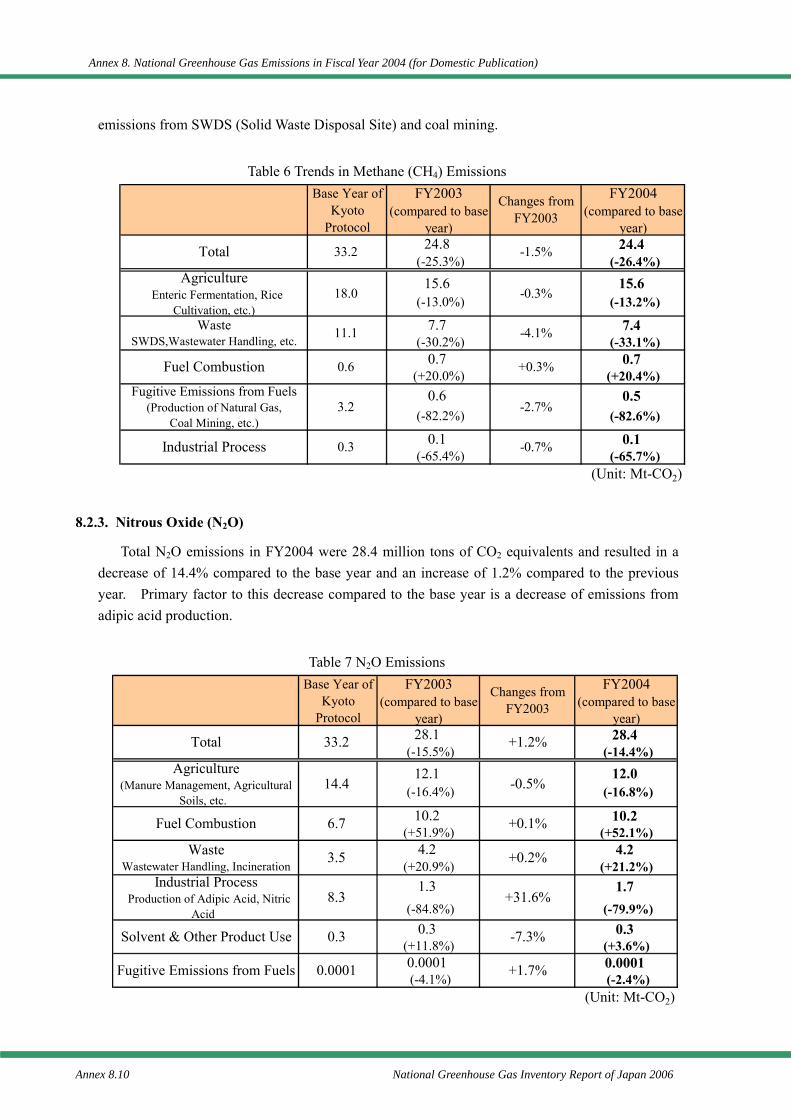
Annex 8. National Greenhouse Gas Emissions in Fiscal Year 2004 (for Domestic Publication)
Annex 8.10 National Greenhouse Gas Inventory Report of Japan 2006
emissions from SWDS (Solid Waste Disposal Site) and coal mining.
Table 6 Trends in Methane (CH4) Emissions
8.2.3. Nitrous Oxide (N2O)
Total N2O emissions in FY2004 were 28.4 million tons of CO2 equivalents and resulted in a decrease of 14.4% compared to the base year and an increase of 1.2% compared to the previous year. Primary factor to this decrease compared to the base year is a decrease of emissions from adipic acid production.
Table 7 N2O Emissions
Base Year ofKyoto
Protocol
FY2003(compared to base
year)
FY2004(compared to base
year)24.8 24.4
(-25.3%) (-26.4%)15.6 15.6
(-13.0%) (-13.2%)
7.7 7.4 (-30.2%) (-33.1%)
0.7 0.7(+20.0%) (+20.4%)
0.6 0.5 (-82.2%) (-82.6%)
0.1 0.1 (-65.4%) (-65.7%)
(Unit: Mt-CO2)
Changes fromFY2003
Total 33.2 → -1.5% →
→
Waste(SWDS,Wastewater Handling, etc.)
11.1 → -4.1% →
Agriculture(Enteric Fermentation, Rice
Cultivation, etc.)18.0 → -0.3%
→
Fugitive Emissions from Fuels(Production of Natural Gas,
Coal Mining, etc.)3.2 → -2.7% →
Fuel Combustion 0.6 → +0.3%
→Industrial Process 0.3 → -0.7%
Base Year ofKyoto
Protocol
FY2003(compared to base
year)
FY2004(compared to base
year)28.1 28.4
(-15.5%) (-14.4%)
12.1 12.0 (-16.4%) (-16.8%)
10.2 10.2(+51.9%) (+52.1%)
4.2 4.2(+20.9%) (+21.2%)
1.3 1.7 (-84.8%) (-79.9%)
0.3 0.3(+11.8%) (+3.6%)0.0001 0.0001 (-4.1%) (-2.4%)
(Unit: Mt-CO2)
Changes fromFY2003
→
Agriculture(Manure Management, Agricultural
Soils, etc.)14.4 → -0.5% →
Total 33.2 → +1.2%
→
Waste(Wastewater Handling, Incineration)
3.5 → +0.2% →
Fuel Combustion 6.7 → +0.1%
→
Solvent & Other Product Use 0.3 → -7.3% →
Industrial Process(Production of Adipic Acid, Nitric
Acid)
8.3 → +31.6%
→Fugitive Emissions from Fuels 0.0001 → +1.7%
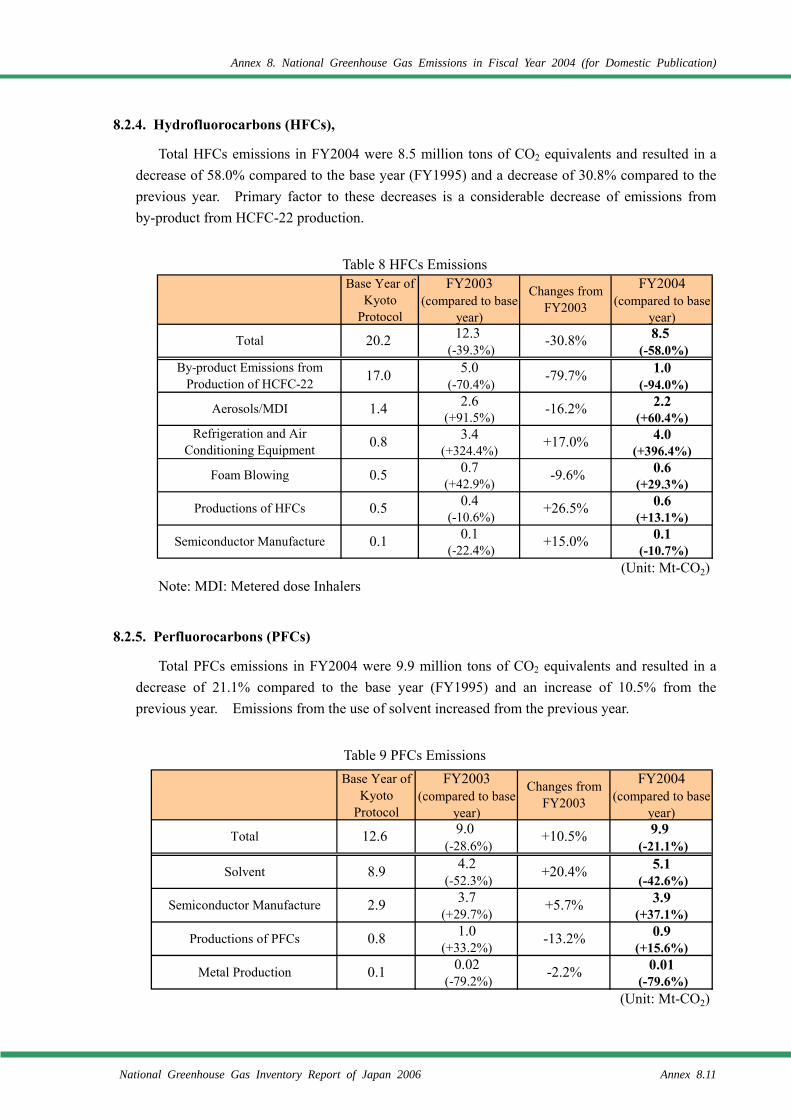
Annex 8. National Greenhouse Gas Emissions in Fiscal Year 2004 (for Domestic Publication)
National Greenhouse Gas Inventory Report of Japan 2006 Annex 8.11
8.2.4. Hydrofluorocarbons (HFCs),
Total HFCs emissions in FY2004 were 8.5 million tons of CO2 equivalents and resulted in a decrease of 58.0% compared to the base year (FY1995) and a decrease of 30.8% compared to the previous year. Primary factor to these decreases is a considerable decrease of emissions from by-product from HCFC-22 production.
Table 8 HFCs Emissions Note: MDI: Metered dose Inhalers
8.2.5. Perfluorocarbons (PFCs)
Total PFCs emissions in FY2004 were 9.9 million tons of CO2 equivalents and resulted in a decrease of 21.1% compared to the base year (FY1995) and an increase of 10.5% from the previous year. Emissions from the use of solvent increased from the previous year.
Table 9 PFCs Emissions
Base Year ofKyoto
Protocol
FY2003(compared to base
year)
FY2004(compared to base
year)12.3 8.5
(-39.3%) (-58.0%)5.0 1.0
(-70.4%) (-94.0%)2.6 2.2
(+91.5%) (+60.4%)3.4 4.0
(+324.4%) (+396.4%)0.7 0.6
(+42.9%) (+29.3%)0.4 0.6
(-10.6%) (+13.1%)0.1 0.1
(-22.4%) (-10.7%)(Unit: Mt-CO2)
Changes fromFY2003
Total 20.2 → -30.8% →
→
Aerosols/MDI 1.4 → -16.2% →
By-product Emissions fromProduction of HCFC-22 17.0 → -79.7%
→
Foam Blowing 0.5 → -9.6% →
Refrigeration and AirConditioning Equipment 0.8 → +17.0%
→
Semiconductor Manufacture 0.1 → +15.0% →
Productions of HFCs 0.5 → +26.5%
Base Year ofKyoto
Protocol
FY2003(compared to base
year)
FY2004(compared to base
year)9.0 9.9
(-28.6%) (-21.1%)4.2 5.1
(-52.3%) (-42.6%)3.7 3.9
(+29.7%) (+37.1%)1.0 0.9
(+33.2%) (+15.6%)0.02 0.01
(-79.2%) (-79.6%)(Unit: Mt-CO2)
→
Metal Production 0.1 → -2.2% →
Productions of PFCs 0.8 → -13.2%
→
Semiconductor Manufacture 2.9 → +5.7% →
Solvent 8.9 → +20.4%
Changes fromFY2003
Total 12.6 → +10.5% →
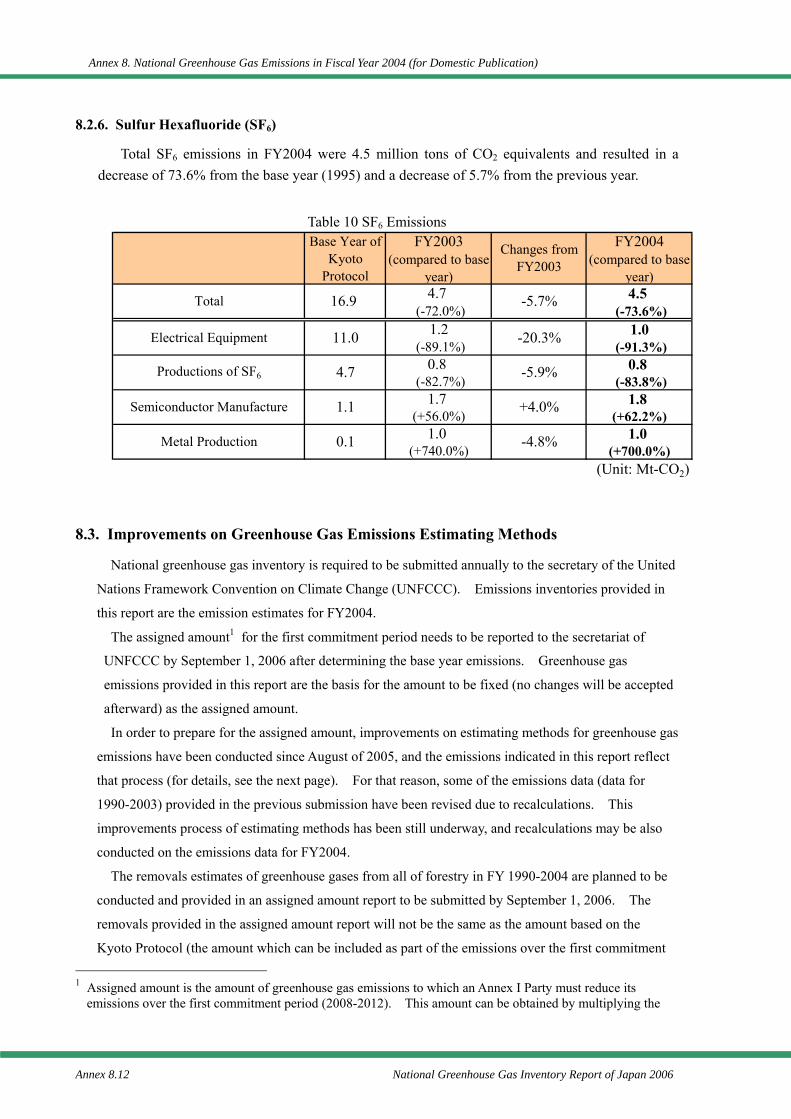
Annex 8. National Greenhouse Gas Emissions in Fiscal Year 2004 (for Domestic Publication)
Annex 8.12 National Greenhouse Gas Inventory Report of Japan 2006
8.2.6. Sulfur Hexafluoride (SF6)
Total SF6 emissions in FY2004 were 4.5 million tons of CO2 equivalents and resulted in a decrease of 73.6% from the base year (1995) and a decrease of 5.7% from the previous year.
Table 10 SF6 Emissions
8.3. Improvements on Greenhouse Gas Emissions Estimating Methods
National greenhouse gas inventory is required to be submitted annually to the secretary of the United
Nations Framework Convention on Climate Change (UNFCCC). Emissions inventories provided in
this report are the emission estimates for FY2004.
The assigned amount1 for the first commitment period needs to be reported to the secretariat of
UNFCCC by September 1, 2006 after determining the base year emissions. Greenhouse gas
emissions provided in this report are the basis for the amount to be fixed (no changes will be accepted
afterward) as the assigned amount.
In order to prepare for the assigned amount, improvements on estimating methods for greenhouse gas
emissions have been conducted since August of 2005, and the emissions indicated in this report reflect
that process (for details, see the next page). For that reason, some of the emissions data (data for
1990-2003) provided in the previous submission have been revised due to recalculations. This
improvements process of estimating methods has been still underway, and recalculations may be also
conducted on the emissions data for FY2004.
The removals estimates of greenhouse gases from all of forestry in FY 1990-2004 are planned to be
conducted and provided in an assigned amount report to be submitted by September 1, 2006. The
removals provided in the assigned amount report will not be the same as the amount based on the
Kyoto Protocol (the amount which can be included as part of the emissions over the first commitment 1 Assigned amount is the amount of greenhouse gas emissions to which an Annex I Party must reduce its
emissions over the first commitment period (2008-2012). This amount can be obtained by multiplying the
Base Year ofKyoto
Protocol
FY2003(compared to base
year)
FY2004(compared to base
year)4.7 4.5
(-72.0%) (-73.6%)1.2 1.0
(-89.1%) (-91.3%)0.8 0.8
(-82.7%) (-83.8%)1.7 1.8
(+56.0%) (+62.2%)1.0 1.0
(+740.0%) (+700.0%)(Unit: Mt-CO2)
→
Metal Production 0.1 → -4.8% →
Semiconductor Manufacture 1.1 → +4.0%
→
Productions of SF6 4.7 → -5.9% →
Electrical Equipment 11.0 → -20.3%
Changes fromFY2003
Total 16.9 → -5.7% →
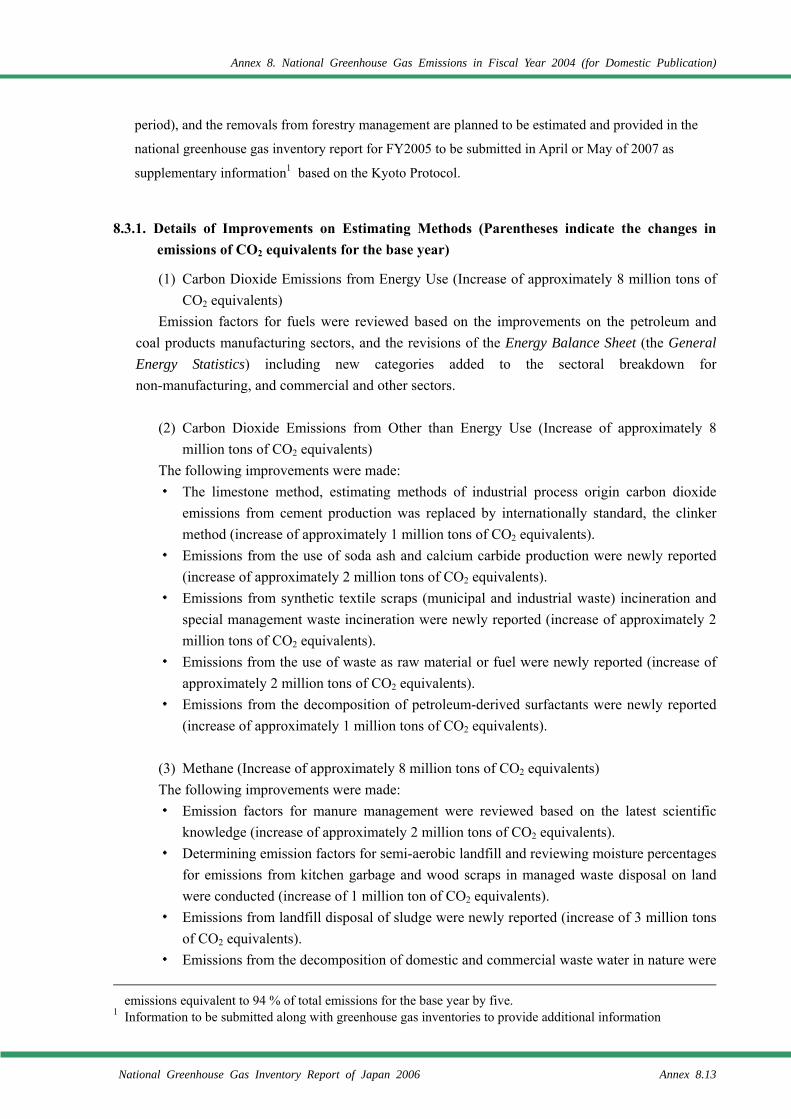
Annex 8. National Greenhouse Gas Emissions in Fiscal Year 2004 (for Domestic Publication)
National Greenhouse Gas Inventory Report of Japan 2006 Annex 8.13
period), and the removals from forestry management are planned to be estimated and provided in the
national greenhouse gas inventory report for FY2005 to be submitted in April or May of 2007 as
supplementary information1 based on the Kyoto Protocol.
8.3.1. Details of Improvements on Estimating Methods (Parentheses indicate the changes in emissions of CO2 equivalents for the base year)
(1) Carbon Dioxide Emissions from Energy Use (Increase of approximately 8 million tons of CO2 equivalents)
Emission factors for fuels were reviewed based on the improvements on the petroleum and coal products manufacturing sectors, and the revisions of the Energy Balance Sheet (the General Energy Statistics) including new categories added to the sectoral breakdown for non-manufacturing, and commercial and other sectors.
(2) Carbon Dioxide Emissions from Other than Energy Use (Increase of approximately 8
million tons of CO2 equivalents) The following improvements were made: ・ The limestone method, estimating methods of industrial process origin carbon dioxide
emissions from cement production was replaced by internationally standard, the clinker method (increase of approximately 1 million tons of CO2 equivalents).
・ Emissions from the use of soda ash and calcium carbide production were newly reported (increase of approximately 2 million tons of CO2 equivalents).
・ Emissions from synthetic textile scraps (municipal and industrial waste) incineration and special management waste incineration were newly reported (increase of approximately 2 million tons of CO2 equivalents).
・ Emissions from the use of waste as raw material or fuel were newly reported (increase of approximately 2 million tons of CO2 equivalents).
・ Emissions from the decomposition of petroleum-derived surfactants were newly reported (increase of approximately 1 million tons of CO2 equivalents).
(3) Methane (Increase of approximately 8 million tons of CO2 equivalents) The following improvements were made: ・ Emission factors for manure management were reviewed based on the latest scientific
knowledge (increase of approximately 2 million tons of CO2 equivalents). ・ Determining emission factors for semi-aerobic landfill and reviewing moisture percentages
for emissions from kitchen garbage and wood scraps in managed waste disposal on land were conducted (increase of 1 million ton of CO2 equivalents).
・ Emissions from landfill disposal of sludge were newly reported (increase of 3 million tons of CO2 equivalents).
・ Emissions from the decomposition of domestic and commercial waste water in nature were
emissions equivalent to 94 % of total emissions for the base year by five. 1 Information to be submitted along with greenhouse gas inventories to provide additional information
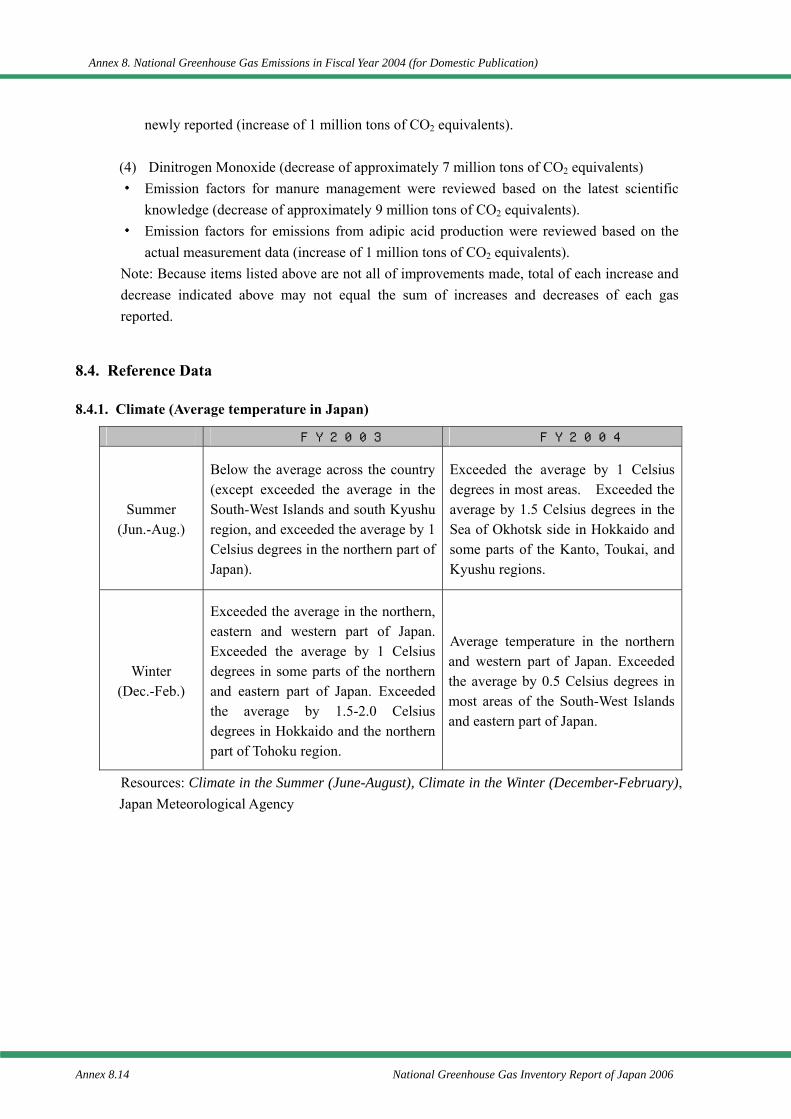
Annex 8. National Greenhouse Gas Emissions in Fiscal Year 2004 (for Domestic Publication)
Annex 8.14 National Greenhouse Gas Inventory Report of Japan 2006
newly reported (increase of 1 million tons of CO2 equivalents). (4) Dinitrogen Monoxide (decrease of approximately 7 million tons of CO2 equivalents) ・ Emission factors for manure management were reviewed based on the latest scientific
knowledge (decrease of approximately 9 million tons of CO2 equivalents). ・ Emission factors for emissions from adipic acid production were reviewed based on the
actual measurement data (increase of 1 million tons of CO2 equivalents). Note: Because items listed above are not all of improvements made, total of each increase and decrease indicated above may not equal the sum of increases and decreases of each gas reported.
8.4. Reference Data
8.4.1. Climate (Average temperature in Japan)
FY2003 FY2004
Summer (Jun.-Aug.)
Below the average across the country (except exceeded the average in the South-West Islands and south Kyushu region, and exceeded the average by 1 Celsius degrees in the northern part of Japan).
Exceeded the average by 1 Celsius degrees in most areas. Exceeded the average by 1.5 Celsius degrees in the Sea of Okhotsk side in Hokkaido and some parts of the Kanto, Toukai, and Kyushu regions.
Winter (Dec.-Feb.)
Exceeded the average in the northern, eastern and western part of Japan. Exceeded the average by 1 Celsius degrees in some parts of the northern and eastern part of Japan. Exceeded the average by 1.5-2.0 Celsius degrees in Hokkaido and the northern part of Tohoku region.
Average temperature in the northern and western part of Japan. Exceeded the average by 0.5 Celsius degrees in most areas of the South-West Islands and eastern part of Japan.
Resources: Climate in the Summer (June-August), Climate in the Winter (December-February), Japan Meteorological Agency
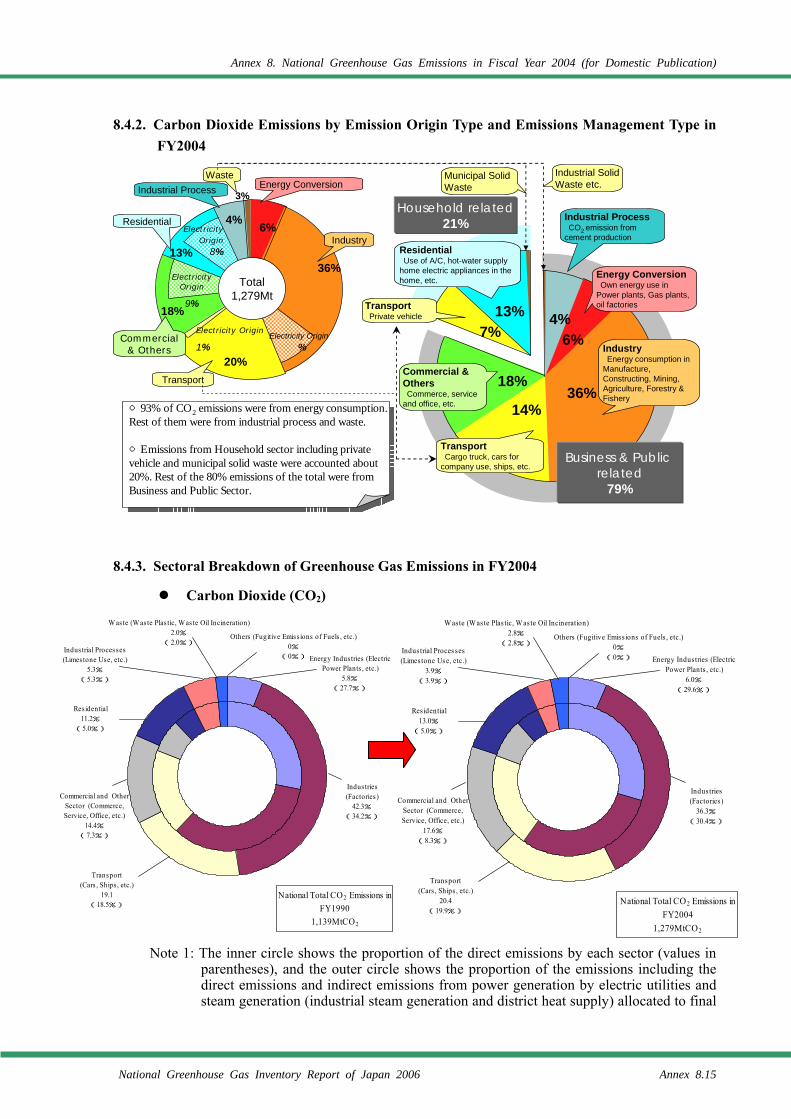
Annex 8. National Greenhouse Gas Emissions in Fiscal Year 2004 (for Domestic Publication)
National Greenhouse Gas Inventory Report of Japan 2006 Annex 8.15
8.4.2. Carbon Dioxide Emissions by Emission Origin Type and Emissions Management Type in FY2004
8.4.3. Sectoral Breakdown of Greenhouse Gas Emissions in FY2004
Carbon Dioxide (CO2)
Note 1: The inner circle shows the proportion of the direct emissions by each sector (values in parentheses), and the outer circle shows the proportion of the emissions including the direct emissions and indirect emissions from power generation by electric utilities and steam generation (industrial steam generation and district heat supply) allocated to final
National Total CO2 Emissions inFY1990
1,139MtCO2
Energy Industries (ElectricPower Plants , etc.)
5.8%( 27.7%)
Residential11.2%
(5.0%)
Industries(Factories )
42.3%( 34.2%)
Commercial and OtherSector (Commerce,Service, Office, etc.)
14.4%( 7.3%)
Transport(Cars , Ships, etc.)
19.1(18.5%)
Waste (Waste Plastic, Waste Oil Incineration)2.0%
( 2.0%)Others (Fugitive Emissions of Fuels , etc.)
0%(0%)
Indus trial Processes(Limestone Use, etc.)
5.3%(5.3%)
18%
6%
36%
20%
13%
4%
Electricity Origin6%
Electricity Origin
9%
Electricity Origin
8%
3%
Electricity Origin
1%7%
14%
18%
Industry(Energy consumption in Manufacture, Constructing, Mining, Agriculture, Forestry & Fishery)36%
Energy Conversion(Own energy use in Power plants, Gas plants, oil factories)
Transport(Cargo truck, cars for company use, ships, etc.)
13%
6%
Industrial Process(CO2 emission from cement production)
4%
Municipal Solid Waste
Industrial Solid Waste etc.Industrial Process
WasteEnergy Conversion
Industry
Transport
Commercial & Others
ResidentialHousehold related
21%
Business & Public related
79%
○93% of CO2 emissions were from energy consumption. Rest of them were from industrial process and waste.
○Emissions from Household sector including private vehicle and municipal solid waste were accounted about20%. Rest of the 80% emissions of the total were from Business and Public Sector.
○93% of CO2 emissions were from energy consumption. Rest of them were from industrial process and waste.
○Emissions from Household sector including private vehicle and municipal solid waste were accounted about20%. Rest of the 80% emissions of the total were from Business and Public Sector.
Total1,279Mt
Residential(Use of A/C, hot-water supply,home electric appliances in the home, etc.)
Transport(Private vehicle)
Commercial & Others (Commerce, service and office, etc.)
National Total CO2 Emissions inFY2004
1,279MtCO2
Energy Industries (ElectricPower Plants , etc.)
6.0%( 29.6%)
Residential13.0%
( 5.0%)
Indus tries(Factories )
36.3%(30.4%)
Commercial and OtherSector (Commerce,Service, Office, etc.)
17.6%( 8.3%)
Transport(Cars , Ships, etc.)
20.4( 19.9%)
Waste (Waste Plas tic, Waste Oil Incineration)2.8%
(2.8%)Others (Fugitive Emiss ions of Fuels , etc.)
0%(0%)
Industrial Processes(Limestone Use, etc.)
3.9%( 3.9%)
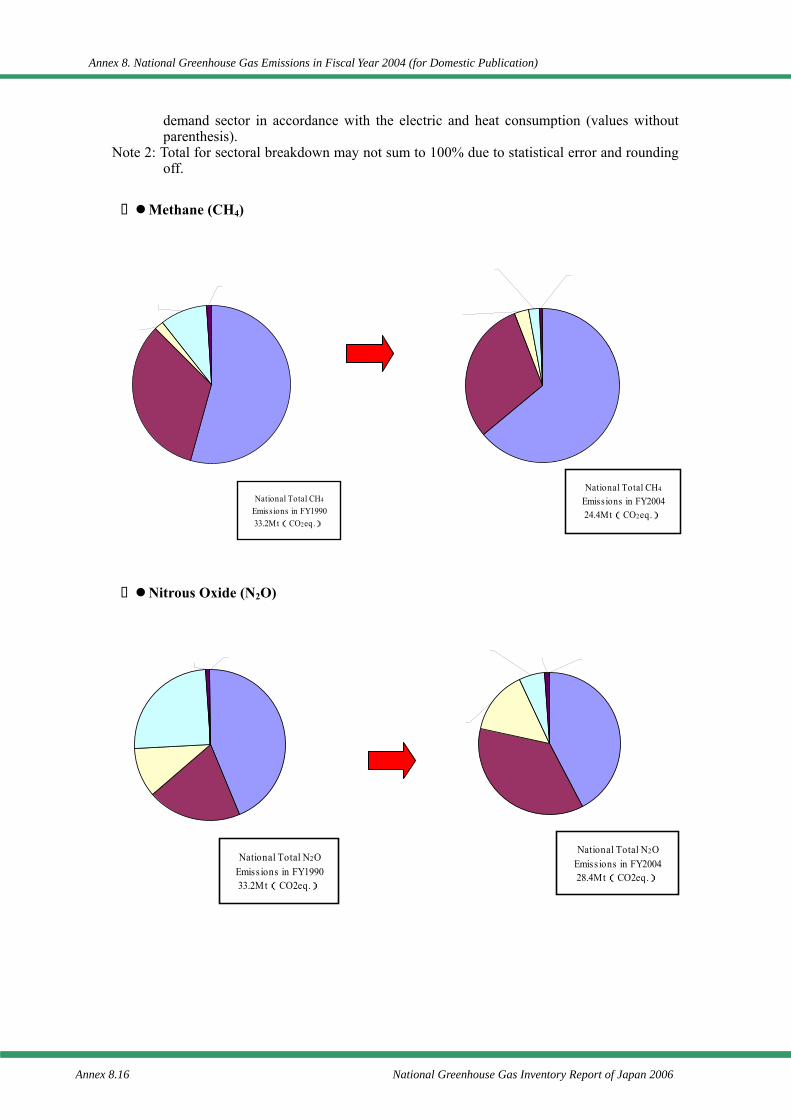
Annex 8. National Greenhouse Gas Emissions in Fiscal Year 2004 (for Domestic Publication)
Annex 8.16 National Greenhouse Gas Inventory Report of Japan 2006
demand sector in accordance with the electric and heat consumption (values without parenthesis).
Note 2: Total for sectoral breakdown may not sum to 100% due to statistical error and rounding off.
Methane (CH4)
Nitrous Oxide (N2O)
Waste(SWDS,Wastewater
Handling, etc.)
30%
Agriculture(Enteric
Fermentation,
Rice Cultivation,
etc.)
64%
FugitiveEmissions from
Fuels(Productio
n of Natural Gas,
Coal Mining,
etc.)
2%
IndustrialProcess
0%
FuelCombustion
3%
National Total CH4
Emissions in FY200424.4Mt(CO2eq.)
Fuel Combustion36%
Agriculture(Manure Management,
Agricultural Soils,
etc.)
42%
Solvent & OtherProduct Use
1%Fugitive
Emissions from
Fuels0%
IndustrialProcess
(Production of
Adipic Acid,
Nitric Acid)
6%
Waste(Wastewater
Handling、
Incineration)15%
National Total N2OEmissions in FY200428.4Mt(CO2eq.)
Agriculture(Enteric
Fermentation, Rice
Cultivation, etc.)
54%
Waste(SWDS,Wastewater
Handling, etc.)
33%
Fugitive Emissionsfrom
Fuels(Production
of Natural Gas, Coal
Mining, etc.)
10%
Fuel Combustion2%
Industrial Process1%
National Total CH4
Emiss ions in FY199033.2Mt(CO2eq.)
Agriculture(Manure Management,
Agricultural Soils,
etc.)
44%
Fuel Combustion20%
Waste(Wastewater
Handling、Incineration)
10%
IndustrialProcess
(Production ofAdipic Acid,
Nitric Acid)
25%
Solvent & OtherProduct Use
1%
FugitiveEmissions from
Fuels
0%
National Total N2OEmiss ions in FY199033.2Mt(CO2eq.)
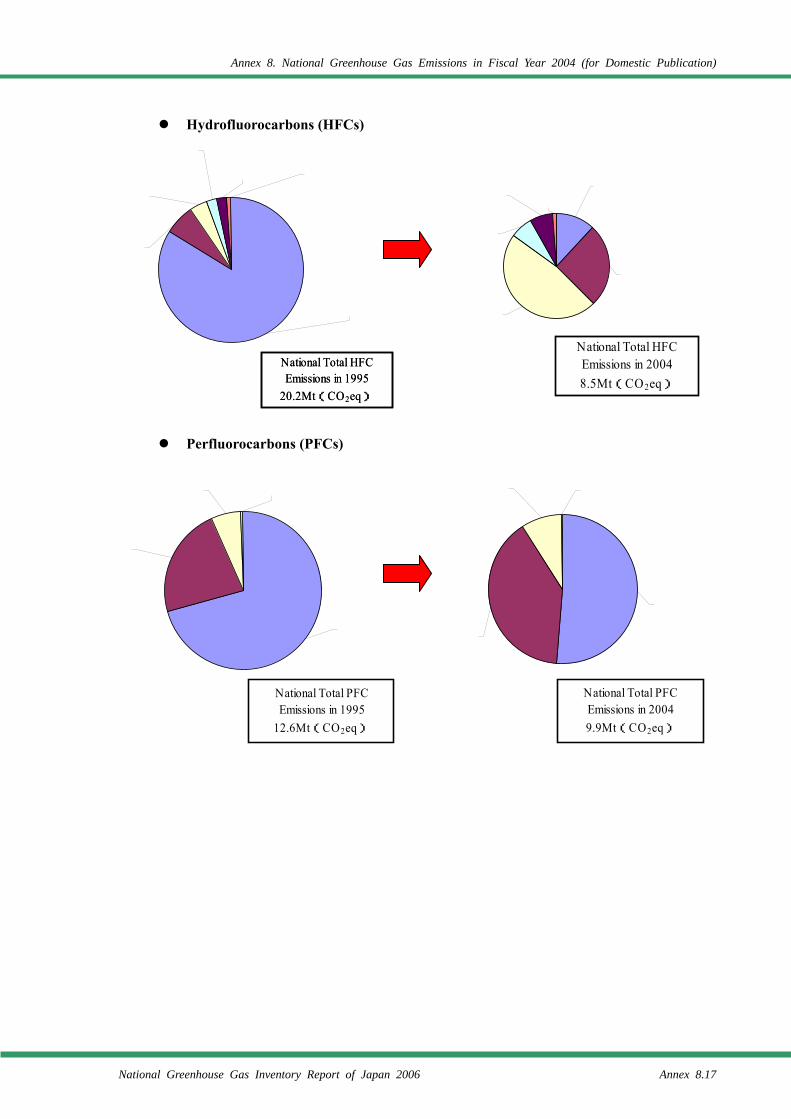
Annex 8. National Greenhouse Gas Emissions in Fiscal Year 2004 (for Domestic Publication)
National Greenhouse Gas Inventory Report of Japan 2006 Annex 8.17
Hydrofluorocarbons (HFCs)
Perfluorocarbons (PFCs)
Aerosols/MDI7%
Productions ofHFCs
2%Semiconductor
Manufacture
1%
Foam Blowing2%
Refrigeration andAir Conditioning
Equipment
4%
By-productEmissions from
Production of
HCFC-22
84%
National Total HFCEmissions in 1995
20.2Mt(CO2eq)
National Total HFCEmissions in 1995
20.2Mt(CO2eq)
Refrigeration andAir Conditioning
Equipment
47%
Aerosols/MDI26%
By-productEmissions from
Production of
HCFC-22
12%
Production ofHFCs
7%
SemiconductorManufacture
1%
Foam Blowing7%
National Total HFCEmissions in 20048.5Mt(CO2eq)
Semiconductor
Manufacture23%
Productionsof PFCs
6%
MetalProduction
1%
Solvent71%
National Total PFCEmissions in 1995
12.6Mt(CO2eq)
Semiconductor
Manufacture
40%
Productionsof PFCs
9%
MetalProduction
0%
Solvent51%
National Total PFCEmissions in 20049.9Mt(CO2eq)
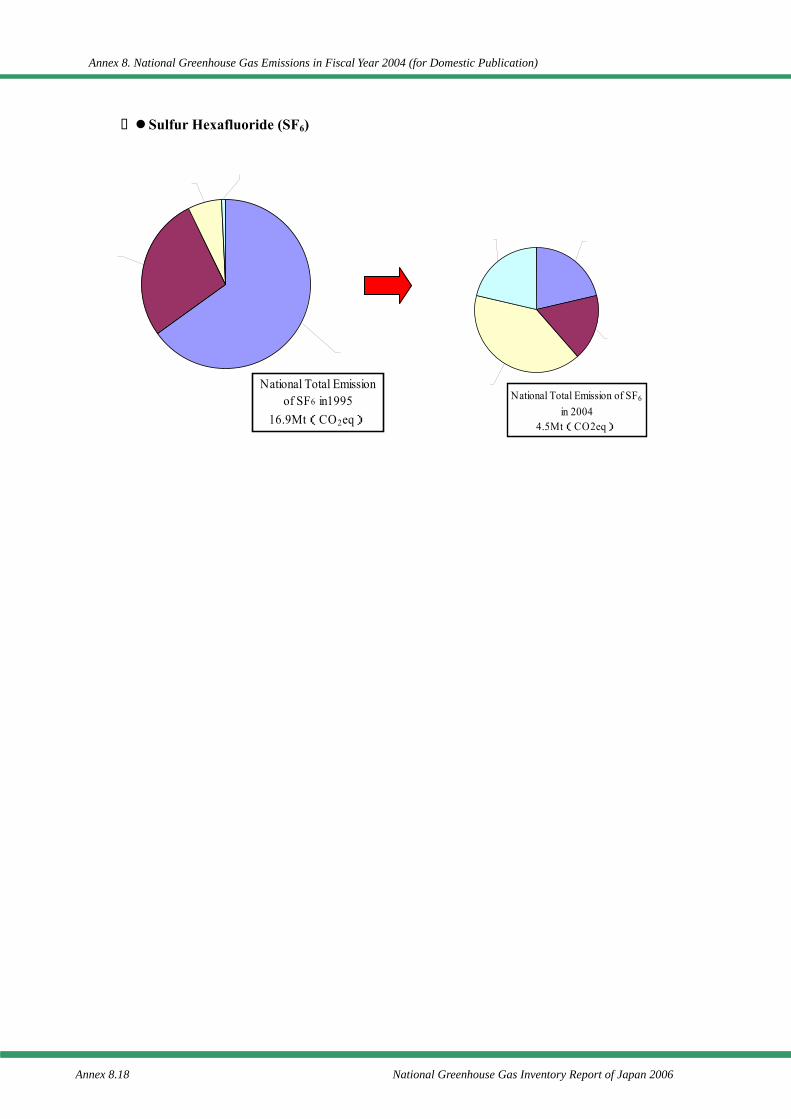
Annex 8. National Greenhouse Gas Emissions in Fiscal Year 2004 (for Domestic Publication)
Annex 8.18 National Greenhouse Gas Inventory Report of Japan 2006
Sulfur Hexafluoride (SF6)
MetalProduction
1%SemiconductorManufacture
6%
Productions ofSF628%
ElectricalEquipment
65%
National Total Emissionof SF6 in1995
16.9Mt(CO2eq)
SemiconductorManufacture
40%
Productions ofSF6
17%
ElectricalEquipment
21%
MetalProduction
21%
National Total Emission of SF6
in 20044.5Mt(CO2eq)
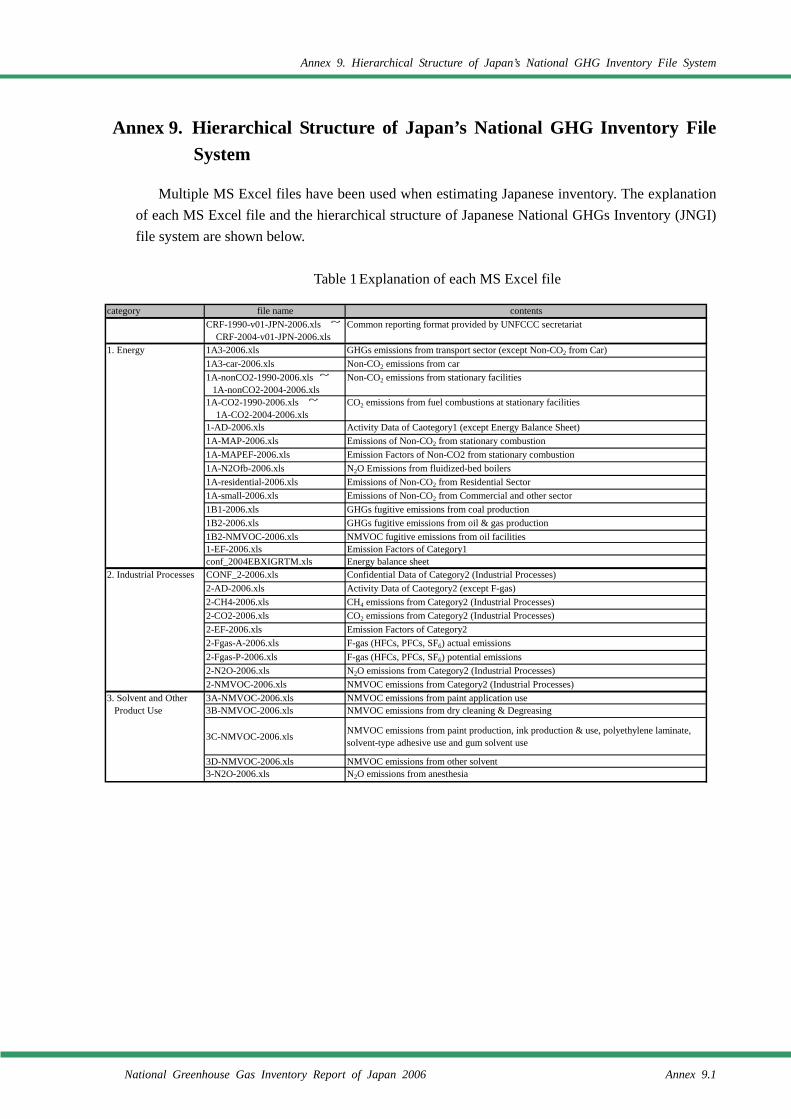
Annex 9. Hierarchical Structure of Japan’s National GHG Inventory File System
National Greenhouse Gas Inventory Report of Japan 2006 Annex 9.1
Annex 9. Hierarchical Structure of Japan’s National GHG Inventory File System
Multiple MS Excel files have been used when estimating Japanese inventory. The explanation of each MS Excel file and the hierarchical structure of Japanese National GHGs Inventory (JNGI) file system are shown below.
Table 1 Explanation of each MS Excel file
category file name contentsCRF-1990-v01-JPN-2006.xls ~
CRF-2004-v01-JPN-2006.xlsCommon reporting format provided by UNFCCC secretariat
1. Energy 1A3-2006.xls GHGs emissions from transport sector (except Non-CO2 from Car)1A3-car-2006.xls Non-CO2 emissions from car1A-nonCO2-1990-2006.xls ~
1A-nonCO2-2004-2006.xlsNon-CO2 emissions from stationary facilities
1A-CO2-1990-2006.xls ~
1A-CO2-2004-2006.xlsCO2 emissions from fuel combustions at stationary facilities
1-AD-2006.xls Activity Data of Caotegory1 (except Energy Balance Sheet)1A-MAP-2006.xls Emissions of Non-CO2 from stationary combustion1A-MAPEF-2006.xls Emission Factors of Non-CO2 from stationary combustion1A-N2Ofb-2006.xls N2O Emissions from fluidized-bed boilers1A-residential-2006.xls Emissions of Non-CO2 from Residential Sector1A-small-2006.xls Emissions of Non-CO2 from Commercial and other sector1B1-2006.xls GHGs fugitive emissions from coal production1B2-2006.xls GHGs fugitive emissions from oil & gas production1B2-NMVOC-2006.xls NMVOC fugitive emissions from oil facilities1-EF-2006.xls Emission Factors of Category1conf_2004EBXIGRTM.xls Energy balance sheet
2. Industrial Processes CONF_2-2006.xls Confidential Data of Category2 (Industrial Processes)2-AD-2006.xls Activity Data of Caotegory2 (except F-gas)2-CH4-2006.xls CH4 emissions from Category2 (Industrial Processes)2-CO2-2006.xls CO2 emissions from Category2 (Industrial Processes)2-EF-2006.xls Emission Factors of Category22-Fgas-A-2006.xls F-gas (HFCs, PFCs, SF6) actual emissions2-Fgas-P-2006.xls F-gas (HFCs, PFCs, SF6) potential emissions2-N2O-2006.xls N2O emissions from Category2 (Industrial Processes)2-NMVOC-2006.xls NMVOC emissions from Category2 (Industrial Processes)
3. Solvent and Other 3A-NMVOC-2006.xls NMVOC emissions from paint application use Product Use 3B-NMVOC-2006.xls NMVOC emissions from dry cleaning & Degreasing
3C-NMVOC-2006.xls NMVOC emissions from paint production, ink production & use, polyethylene laminate,solvent-type adhesive use and gum solvent use
3D-NMVOC-2006.xls NMVOC emissions from other solvent3-N2O-2006.xls N2O emissions from anesthesia
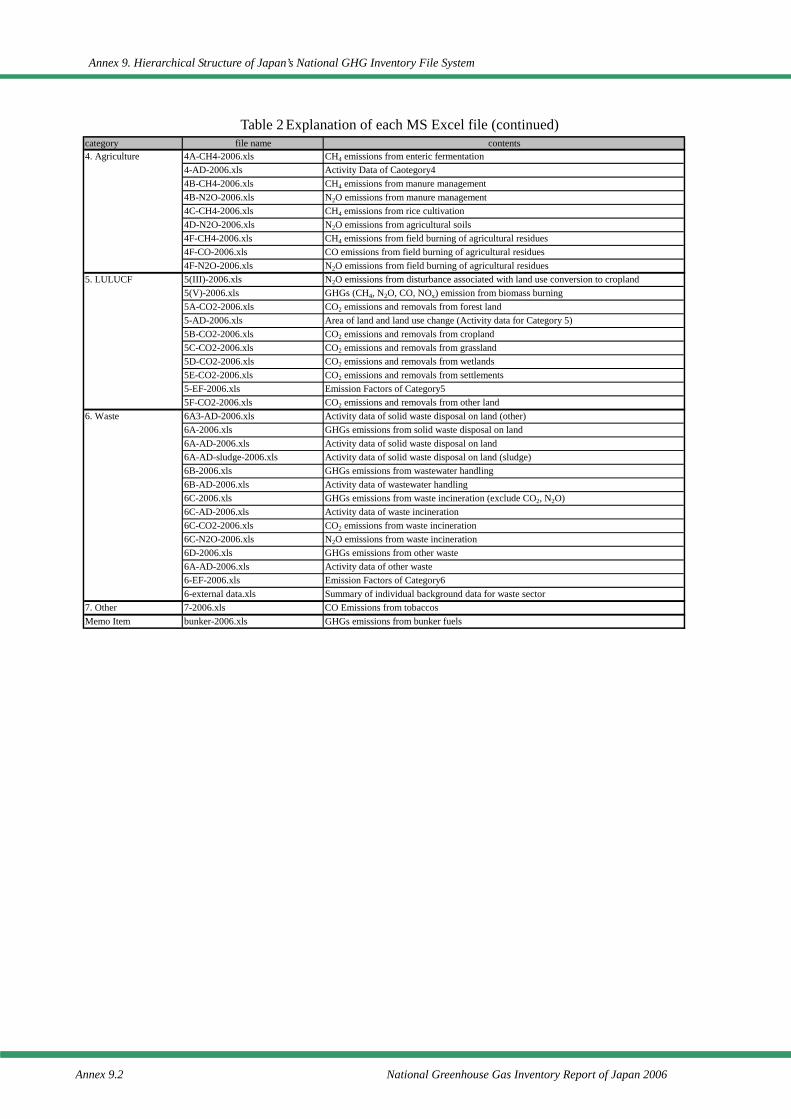
Annex 9. Hierarchical Structure of Japan’s National GHG Inventory File System
Annex 9.2 National Greenhouse Gas Inventory Report of Japan 2006
Table 2 Explanation of each MS Excel file (continued)
category file name contents4. Agriculture 4A-CH4-2006.xls CH4 emissions from enteric fermentation
4-AD-2006.xls Activity Data of Caotegory44B-CH4-2006.xls CH4 emissions from manure management4B-N2O-2006.xls N2O emissions from manure management4C-CH4-2006.xls CH4 emissions from rice cultivation4D-N2O-2006.xls N2O emissions from agricultural soils4F-CH4-2006.xls CH4 emissions from field burning of agricultural residues4F-CO-2006.xls CO emissions from field burning of agricultural residues4F-N2O-2006.xls N2O emissions from field burning of agricultural residues
5. LULUCF 5(III)-2006.xls N2O emissions from disturbance associated with land use conversion to cropland5(V)-2006.xls GHGs (CH4, N2O, CO, NOx) emission from biomass burning5A-CO2-2006.xls CO2 emissions and removals from forest land5-AD-2006.xls Area of land and land use change (Activity data for Category 5)5B-CO2-2006.xls CO2 emissions and removals from cropland5C-CO2-2006.xls CO2 emissions and removals from grassland5D-CO2-2006.xls CO2 emissions and removals from wetlands5E-CO2-2006.xls CO2 emissions and removals from settlements5-EF-2006.xls Emission Factors of Category55F-CO2-2006.xls CO2 emissions and removals from other land
6. Waste 6A3-AD-2006.xls Activity data of solid waste disposal on land (other)6A-2006.xls GHGs emissions from solid waste disposal on land6A-AD-2006.xls Activity data of solid waste disposal on land6A-AD-sludge-2006.xls Activity data of solid waste disposal on land (sludge)6B-2006.xls GHGs emissions from wastewater handling6B-AD-2006.xls Activity data of wastewater handling6C-2006.xls GHGs emissions from waste incineration (exclude CO2, N2O)6C-AD-2006.xls Activity data of waste incineration6C-CO2-2006.xls CO2 emissions from waste incineration6C-N2O-2006.xls N2O emissions from waste incineration6D-2006.xls GHGs emissions from other waste6A-AD-2006.xls Activity data of other waste6-EF-2006.xls Emission Factors of Category66-external data.xls Summary of individual background data for waste sector
7. Other 7-2006.xls CO Emissions from tobaccosMemo Item bunker-2006.xls GHGs emissions from bunker fuels
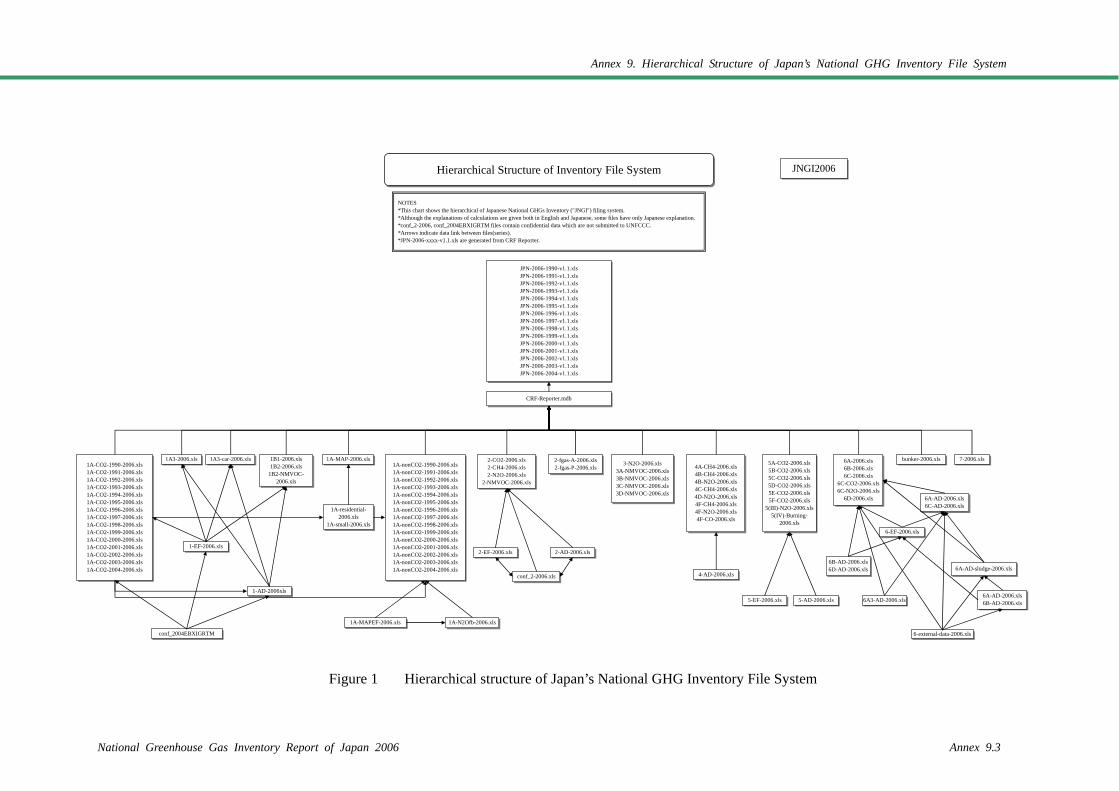
Annex 9. Hierarchical Structure of Japan’s National GHG Inventory File System
National Greenhouse Gas Inventory Report of Japan 2006 Annex 9.3
Figure 1 Hierarchical structure of Japan’s National GHG Inventory File System
CRF-Reporter.mdb
1A-CO2-1990-2006.xls1A-CO2-1991-2006.xls1A-CO2-1992-2006.xls1A-CO2-1993-2006.xls1A-CO2-1994-2006.xls1A-CO2-1995-2006.xls1A-CO2-1996-2006.xls1A-CO2-1997-2006.xls1A-CO2-1998-2006.xls1A-CO2-1999-2006.xls1A-CO2-2000-2006.xls1A-CO2-2001-2006.xls1A-CO2-2002-2006.xls1A-CO2-2003-2006.xls1A-CO2-2004-2006.xls
7-2006.xls2-fgas-A-2006.xls2-fgas-P-2006.xls
bunker-2006.xls5A-CO2-2006.xls5B-CO2-2006.xls5C-CO2-2006.xls5D-CO2-2006.xls5E-CO2-2006.xls5F-CO2-2006.xls
5(III)-N2O-2006.xls5(IV)-Burning-
2006.xls
2-CO2-2006.xls2-CH4-2006.xls2-N2O-2006.xls
2-NMVOC-2006.xls
3-N2O-2006.xls3A-NMVOC-2006.xls3B-NMVOC-2006.xls3C-NMVOC-2006.xls3D-NMVOC-2006.xls
4A-CH4-2006.xls4B-CH4-2006.xls4B-N2O-2006.xls4C-CH4-2006.xls4D-N2O-2006.xls4F-CH4-2006.xls4F-N2O-2006.xls4F-CO-2006.xls
1A-MAP-2006.xls1A3-2006.xls 1B1-2006.xls1B2-2006.xls
1B2-NMVOC-2006.xls
1-EF-2006.xls
1A3-car-2006.xls
1-AD-2006xls
1A-residential-2006.xls
1A-small-2006.xls
1A-MAPEF-2006.xls
2-EF-2006.xls 2-AD-2006.xls
conf_2-2006.xls 4-AD-2006.xls
5-AD-2006.xls
6-EF-2006.xls
6A-AD-2006.xls6C-AD-2006.xls
JNGI2006
NOTES *This chart shows the hierarchical of Japanese National GHGs Inventory ("JNGI") filing system. *Although the explanations of calculations are given both in English and Japanese, some files have only Japanese explanation. *conf_2-2006, conf_2004EBXIGRTM files contain confidential data which are not submitted to UNFCCC. *Arrows indicate data link between files(series). *JPN-2006-xxxx-v1.1.xls are generated from CRF Reporter.
Hierarchical Structure of Inventory File System
JPN-2006-1990-v1.1.xlsJPN-2006-1991-v1.1.xlsJPN-2006-1992-v1.1.xlsJPN-2006-1993-v1.1.xlsJPN-2006-1994-v1.1.xlsJPN-2006-1995-v1.1.xlsJPN-2006-1996-v1.1.xlsJPN-2006-1997-v1.1.xlsJPN-2006-1998-v1.1.xlsJPN-2006-1999-v1.1.xlsJPN-2006-2000-v1.1.xlsJPN-2006-2001-v1.1.xlsJPN-2006-2002-v1.1.xlsJPN-2006-2003-v1.1.xlsJPN-2006-2004-v1.1.xls
1A-nonCO2-1990-2006.xls1A-nonCO2-1991-2006.xls1A-nonCO2-1992-2006.xls1A-nonCO2-1993-2006.xls1A-nonCO2-1994-2006.xls1A-nonCO2-1995-2006.xls1A-nonCO2-1996-2006.xls1A-nonCO2-1997-2006.xls1A-nonCO2-1998-2006.xls1A-nonCO2-1999-2006.xls1A-nonCO2-2000-2006.xls1A-nonCO2-2001-2006.xls1A-nonCO2-2002-2006.xls1A-nonCO2-2003-2006.xls1A-nonCO2-2004-2006.xls
conf_2004EBXIGRTM
5-EF-2006.xls
1A-N2Ofb-2006.xls
6B-AD-2006.xls6D-AD-2006.xls
6A-2006.xls6B-2006.xls6C-2006.xls
6C-CO2-2006.xls6C-N2O-2006.xls
6D-2006.xls
6A-AD-sludge-2006.xls
6A-AD-2006.xls6B-AD-2006.xls
6-external-data-2006.xls
6A3-AD-2006.xls
Annex 9. Hierarchical Structure of Japan’s National GHG Inventory File System
Annex 9.4 National Greenhouse Gas Inventory Report of Japan 2006
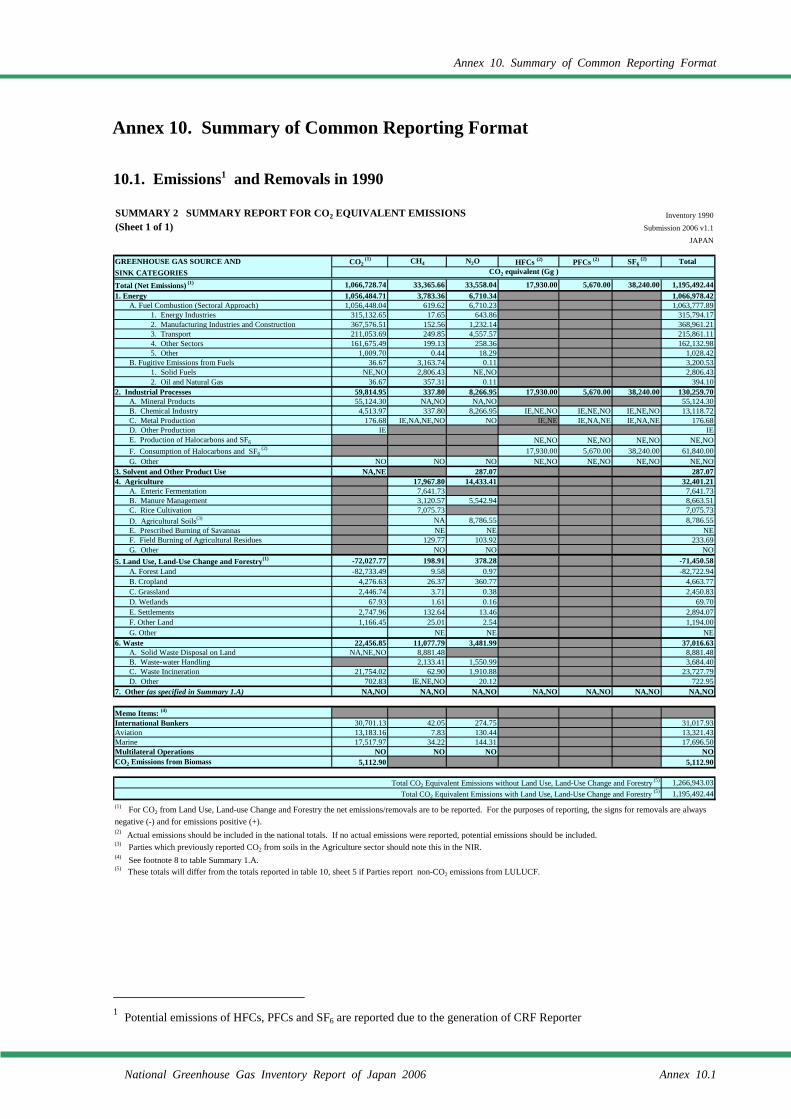
Annex 10. Summary of Common Reporting Format
National Greenhouse Gas Inventory Report of Japan 2006 Annex 10.1
Annex 10. Summary of Common Reporting Format
10.1. Emissions1 and Removals in 1990
1 Potential emissions of HFCs, PFCs and SF6 are reported due to the generation of CRF Reporter
SUMMARY 2 SUMMARY REPORT FOR CO2 EQUIVALENT EMISSIONS Inventory 1990(Sheet 1 of 1) Submission 2006 v1.1
JAPAN
GREENHOUSE GAS SOURCE AND CO2 (1) CH4 N2O HFCs (2) PFCs (2) SF6
(2) Total SINK CATEGORIESTotal (Net Emissions) (1) 1,066,728.74 33,365.66 33,558.04 17,930.00 5,670.00 38,240.00 1,195,492.441. Energy 1,056,484.71 3,783.36 6,710.34 1,066,978.42
A. Fuel Combustion (Sectoral Approach) 1,056,448.04 619.62 6,710.23 1,063,777.891. Energy Industries 315,132.65 17.65 643.86 315,794.172. Manufacturing Industries and Construction 367,576.51 152.56 1,232.14 368,961.213. Transport 211,053.69 249.85 4,557.57 215,861.114. Other Sectors 161,675.49 199.13 258.36 162,132.985. Other 1,009.70 0.44 18.29 1,028.42
B. Fugitive Emissions from Fuels 36.67 3,163.74 0.11 3,200.531. Solid Fuels NE,NO 2,806.43 NE,NO 2,806.432. Oil and Natural Gas 36.67 357.31 0.11 394.10
2. Industrial Processes 59,814.95 337.80 8,266.95 17,930.00 5,670.00 38,240.00 130,259.70A. Mineral Products 55,124.30 NA,NO NA,NO 55,124.30B. Chemical Industry 4,513.97 337.80 8,266.95 IE,NE,NO IE,NE,NO IE,NE,NO 13,118.72C. Metal Production 176.68 IE,NA,NE,NO NO IE,NE IE,NA,NE IE,NA,NE 176.68D. Other Production IE IEE. Production of Halocarbons and SF6 NE,NO NE,NO NE,NO NE,NOF. Consumption of Halocarbons and SF6
(2) 17,930.00 5,670.00 38,240.00 61,840.00G. Other NO NO NO NE,NO NE,NO NE,NO NE,NO
3. Solvent and Other Product Use NA,NE 287.07 287.074. Agriculture 17,967.80 14,433.41 32,401.21
A. Enteric Fermentation 7,641.73 7,641.73B. Manure Management 3,120.57 5,542.94 8,663.51C. Rice Cultivation 7,075.73 7,075.73D. Agricultural Soils(3) NA 8,786.55 8,786.55E. Prescribed Burning of Savannas NE NE NEF. Field Burning of Agricultural Residues 129.77 103.92 233.69G. Other NO NO NO
5. Land Use, Land-Use Change and Forestry(1) -72,027.77 198.91 378.28 -71,450.58A. Forest Land -82,733.49 9.58 0.97 -82,722.94B. Cropland 4,276.63 26.37 360.77 4,663.77C. Grassland 2,446.74 3.71 0.38 2,450.83D. Wetlands 67.93 1.61 0.16 69.70E. Settlements 2,747.96 132.64 13.46 2,894.07F. Other Land 1,166.45 25.01 2.54 1,194.00G. Other NE NE NE
6. Waste 22,456.85 11,077.79 3,481.99 37,016.63A. Solid Waste Disposal on Land NA,NE,NO 8,881.48 8,881.48B. Waste-water Handling 2,133.41 1,550.99 3,684.40C. Waste Incineration 21,754.02 62.90 1,910.88 23,727.79D. Other 702.83 IE,NE,NO 20.12 722.95
7. Other (as specified in Summary 1.A) NA,NO NA,NO NA,NO NA,NO NA,NO NA,NO NA,NO
Memo Items: (4)
International Bunkers 30,701.13 42.05 274.75 31,017.93Aviation 13,183.16 7.83 130.44 13,321.43Marine 17,517.97 34.22 144.31 17,696.50Multilateral Operations NO NO NO NOCO2 Emissions from Biomass 5,112.90 5,112.90
Total CO2 Equivalent Emissions without Land Use, Land-Use Change and Forestry (5) 1,266,943.03Total CO2 Equivalent Emissions with Land Use, Land-Use Change and Forestry (5) 1,195,492.44
(2) Actual emissions should be included in the national totals. If no actual emissions were reported, potential emissions should be included.(3) Parties which previously reported CO2 from soils in the Agriculture sector should note this in the NIR.(4) See footnote 8 to table Summary 1.A.
CO2 equivalent (Gg )
(1) For CO2 from Land Use, Land-use Change and Forestry the net emissions/removals are to be reported. For the purposes of reporting, the signs for removals are alwaysnegative (-) and for emissions positive (+).
(5) These totals will differ from the totals reported in table 10, sheet 5 if Parties report non-CO2 emissions from LULUCF.
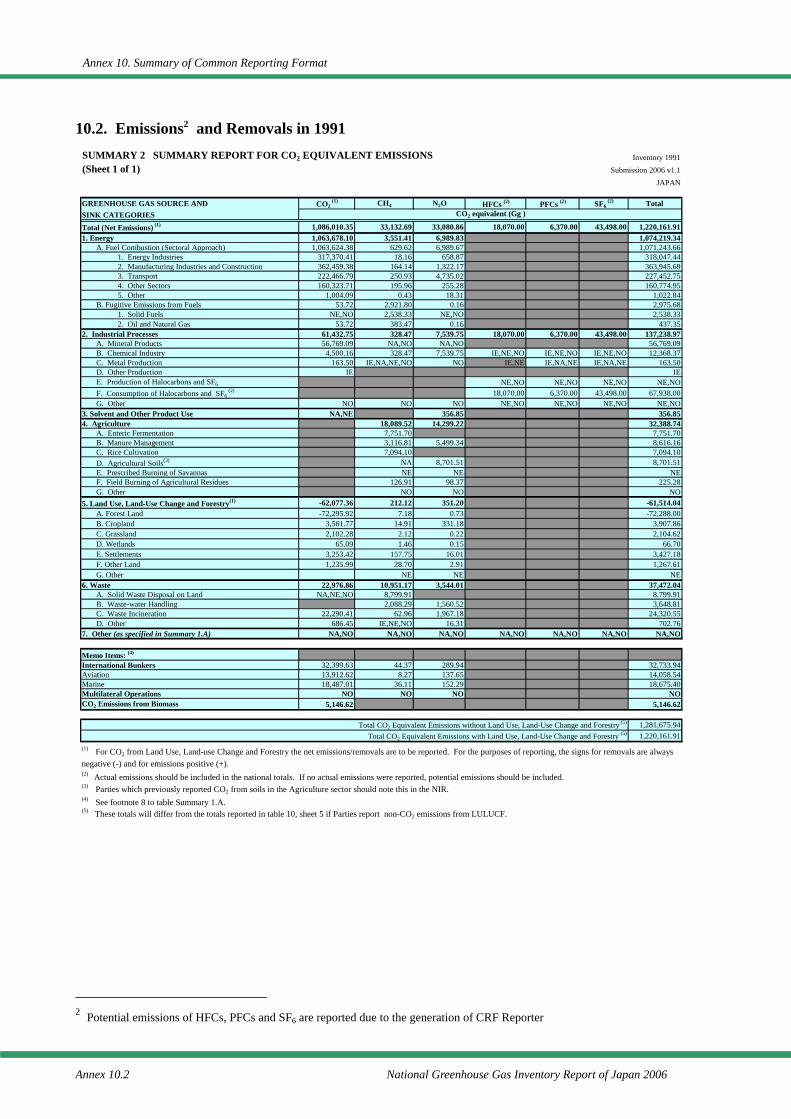
Annex 10. Summary of Common Reporting Format
Annex 10.2 National Greenhouse Gas Inventory Report of Japan 2006
10.2. Emissions2 and Removals in 1991
2 Potential emissions of HFCs, PFCs and SF6 are reported due to the generation of CRF Reporter
SUMMARY 2 SUMMARY REPORT FOR CO2 EQUIVALENT EMISSIONS Inventory 1991(Sheet 1 of 1) Submission 2006 v1.1
JAPAN
GREENHOUSE GAS SOURCE AND CO2 (1) CH4 N2O HFCs (2) PFCs (2) SF6
(2) Total SINK CATEGORIESTotal (Net Emissions) (1) 1,086,010.35 33,132.69 33,080.86 18,070.00 6,370.00 43,498.00 1,220,161.911. Energy 1,063,678.10 3,551.41 6,989.83 1,074,219.34
A. Fuel Combustion (Sectoral Approach) 1,063,624.38 629.62 6,989.67 1,071,243.661. Energy Industries 317,370.41 18.16 658.87 318,047.442. Manufacturing Industries and Construction 362,459.38 164.14 1,322.17 363,945.693. Transport 222,466.79 250.93 4,735.02 227,452.754. Other Sectors 160,323.71 195.96 255.28 160,774.955. Other 1,004.09 0.43 18.31 1,022.84
B. Fugitive Emissions from Fuels 53.72 2,921.80 0.16 2,975.681. Solid Fuels NE,NO 2,538.33 NE,NO 2,538.332. Oil and Natural Gas 53.72 383.47 0.16 437.35
2. Industrial Processes 61,432.75 328.47 7,539.75 18,070.00 6,370.00 43,498.00 137,238.97A. Mineral Products 56,769.09 NA,NO NA,NO 56,769.09B. Chemical Industry 4,500.16 328.47 7,539.75 IE,NE,NO IE,NE,NO IE,NE,NO 12,368.37C. Metal Production 163.50 IE,NA,NE,NO NO IE,NE IE,NA,NE IE,NA,NE 163.50D. Other Production IE IEE. Production of Halocarbons and SF6 NE,NO NE,NO NE,NO NE,NOF. Consumption of Halocarbons and SF6
(2) 18,070.00 6,370.00 43,498.00 67,938.00G. Other NO NO NO NE,NO NE,NO NE,NO NE,NO
3. Solvent and Other Product Use NA,NE 356.85 356.854. Agriculture 18,089.52 14,299.22 32,388.74
A. Enteric Fermentation 7,751.70 7,751.70B. Manure Management 3,116.81 5,499.34 8,616.16C. Rice Cultivation 7,094.10 7,094.10D. Agricultural Soils(3) NA 8,701.51 8,701.51E. Prescribed Burning of Savannas NE NE NEF. Field Burning of Agricultural Residues 126.91 98.37 225.28G. Other NO NO NO
5. Land Use, Land-Use Change and Forestry(1) -62,077.36 212.12 351.20 -61,514.04A. Forest Land -72,295.92 7.18 0.73 -72,288.00B. Cropland 3,561.77 14.91 331.18 3,907.86C. Grassland 2,102.28 2.12 0.22 2,104.62D. Wetlands 65.09 1.46 0.15 66.70E. Settlements 3,253.42 157.75 16.01 3,427.18F. Other Land 1,235.99 28.70 2.91 1,267.61G. Other NE NE NE
6. Waste 22,976.86 10,951.17 3,544.01 37,472.04A. Solid Waste Disposal on Land NA,NE,NO 8,799.91 8,799.91B. Waste-water Handling 2,088.29 1,560.52 3,648.81C. Waste Incineration 22,290.41 62.96 1,967.18 24,320.55D. Other 686.45 IE,NE,NO 16.31 702.76
7. Other (as specified in Summary 1.A) NA,NO NA,NO NA,NO NA,NO NA,NO NA,NO NA,NO
Memo Items: (4)
International Bunkers 32,399.63 44.37 289.94 32,733.94Aviation 13,912.62 8.27 137.65 14,058.54Marine 18,487.01 36.11 152.29 18,675.40Multilateral Operations NO NO NO NOCO2 Emissions from Biomass 5,146.62 5,146.62
Total CO2 Equivalent Emissions without Land Use, Land-Use Change and Forestry (5) 1,281,675.94Total CO2 Equivalent Emissions with Land Use, Land-Use Change and Forestry (5) 1,220,161.91
(2) Actual emissions should be included in the national totals. If no actual emissions were reported, potential emissions should be included.(3) Parties which previously reported CO2 from soils in the Agriculture sector should note this in the NIR.(4) See footnote 8 to table Summary 1.A.
CO2 equivalent (Gg )
(1) For CO2 from Land Use, Land-use Change and Forestry the net emissions/removals are to be reported. For the purposes of reporting, the signs for removals are alwaysnegative (-) and for emissions positive (+).
(5) These totals will differ from the totals reported in table 10, sheet 5 if Parties report non-CO2 emissions from LULUCF.

Annex 10. Summary of Common Reporting Format
National Greenhouse Gas Inventory Report of Japan 2006 Annex 10.3
10.3. Emissions3 and Removals in 1992
3 Potential emissions of HFCs, PFCs and SF6 are reported due to the generation of CRF Reporter
SUMMARY 2 SUMMARY REPORT FOR CO2 EQUIVALENT EMISSIONS Inventory 1992(Sheet 1 of 1) Submission 2006 v1.1
JAPAN
GREENHOUSE GAS SOURCE AND CO2 (1) CH4 N2O HFCs (2) PFCs (2) SF6
(2) Total SINK CATEGORIESTotal (Net Emissions) (1) 1,084,753.31 32,863.39 33,356.89 19,750.00 6,370.00 47,800.00 1,224,893.591. Energy 1,071,776.62 3,316.47 7,374.58 1,082,467.67
A. Fuel Combustion (Sectoral Approach) 1,071,719.62 662.14 7,374.41 1,079,756.171. Energy Industries 325,098.08 20.45 647.25 325,765.772. Manufacturing Industries and Construction 354,303.06 175.03 1,418.13 355,896.233. Transport 226,859.69 251.25 4,995.65 232,106.604. Other Sectors 164,472.68 214.95 295.41 164,983.045. Other 986.11 0.46 17.97 1,004.54
B. Fugitive Emissions from Fuels 57.00 2,654.33 0.17 2,711.501. Solid Fuels NE,NO 2,267.52 NE,NO 2,267.522. Oil and Natural Gas 57.00 386.81 0.17 443.98
2. Industrial Processes 61,775.86 303.51 7,452.41 19,750.00 6,370.00 47,800.00 143,451.77A. Mineral Products 57,236.94 NA,NO NA,NO 57,236.94B. Chemical Industry 4,380.50 303.51 7,452.41 IE,NE,NO IE,NE,NO IE,NE,NO 12,136.41C. Metal Production 158.42 IE,NA,NE,NO NO IE,NE IE,NA,NE IE,NA,NE 158.42D. Other Production IE IEE. Production of Halocarbons and SF6 NE,NO NE,NO NE,NO NE,NOF. Consumption of Halocarbons and SF6
(2) 19,750.00 6,370.00 47,800.00 73,920.00G. Other NO NO NO NE,NO NE,NO NE,NO NE,NO
3. Solvent and Other Product Use NA,NE 413.01 413.014. Agriculture 18,175.56 14,115.71 32,291.27
A. Enteric Fermentation 7,793.32 7,793.32B. Manure Management 3,089.85 5,447.13 8,536.98C. Rice Cultivation 7,176.75 7,176.75D. Agricultural Soils(3) NA 8,577.86 8,577.86E. Prescribed Burning of Savannas NE NE NEF. Field Burning of Agricultural Residues 115.64 90.72 206.36G. Other NO NO NO
5. Land Use, Land-Use Change and Forestry(1) -73,225.52 227.47 331.46 -72,666.59A. Forest Land -83,565.85 5.11 0.52 -83,560.22B. Cropland 3,457.99 17.07 310.11 3,785.16C. Grassland 2,010.33 2.49 0.25 2,013.07D. Wetlands 195.45 4.67 0.47 200.60E. Settlements 3,562.35 174.76 17.74 3,754.85F. Other Land 1,114.21 23.37 2.37 1,139.96G. Other NE NE NE
6. Waste 24,426.34 10,840.40 3,669.72 38,936.46A. Solid Waste Disposal on Land NA,NE,NO 8,730.13 8,730.13B. Waste-water Handling 2,046.98 1,544.17 3,591.15C. Waste Incineration 23,727.45 63.29 2,108.79 25,899.52D. Other 698.90 IE,NE,NO 16.76 715.66
7. Other (as specified in Summary 1.A) NA,NO NA,NO NA,NO NA,NO NA,NO NA,NO NA,NO
Memo Items: (4)
International Bunkers 32,852.43 44.86 294.20 33,191.49Aviation 14,210.12 8.44 140.60 14,359.16Marine 18,642.30 36.42 153.60 18,832.33Multilateral Operations NO NO NO NOCO2 Emissions from Biomass 5,023.44 5,023.44
Total CO2 Equivalent Emissions without Land Use, Land-Use Change and Forestry (5) 1,297,560.18Total CO2 Equivalent Emissions with Land Use, Land-Use Change and Forestry (5) 1,224,893.59
(2) Actual emissions should be included in the national totals. If no actual emissions were reported, potential emissions should be included.(3) Parties which previously reported CO2 from soils in the Agriculture sector should note this in the NIR.(4) See footnote 8 to table Summary 1.A.
CO2 equivalent (Gg )
(1) For CO2 from Land Use, Land-use Change and Forestry the net emissions/removals are to be reported. For the purposes of reporting, the signs for removals are alwaysnegative (-) and for emissions positive (+).
(5) These totals will differ from the totals reported in table 10, sheet 5 if Parties report non-CO2 emissions from LULUCF.
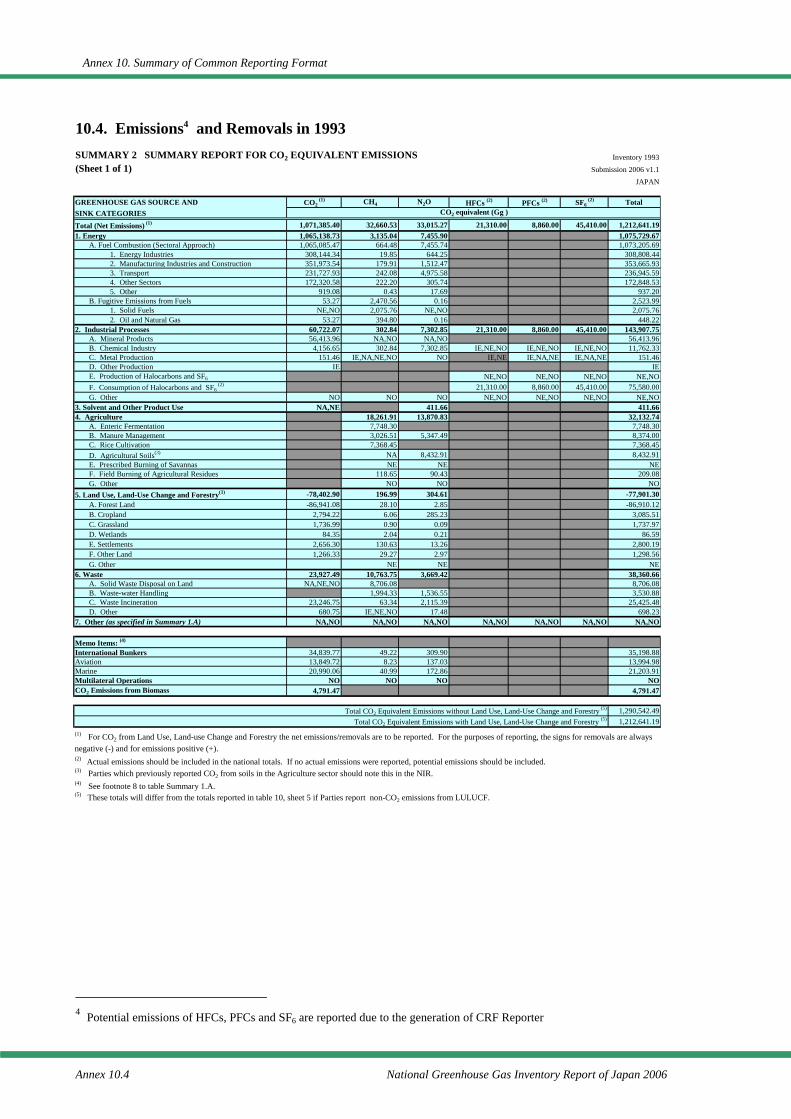
Annex 10. Summary of Common Reporting Format
Annex 10.4 National Greenhouse Gas Inventory Report of Japan 2006
10.4. Emissions4 and Removals in 1993
4 Potential emissions of HFCs, PFCs and SF6 are reported due to the generation of CRF Reporter
SUMMARY 2 SUMMARY REPORT FOR CO2 EQUIVALENT EMISSIONS Inventory 1993(Sheet 1 of 1) Submission 2006 v1.1
JAPAN
GREENHOUSE GAS SOURCE AND CO2 (1) CH4 N2O HFCs (2) PFCs (2) SF6
(2) Total SINK CATEGORIESTotal (Net Emissions) (1) 1,071,385.40 32,660.53 33,015.27 21,310.00 8,860.00 45,410.00 1,212,641.191. Energy 1,065,138.73 3,135.04 7,455.90 1,075,729.67
A. Fuel Combustion (Sectoral Approach) 1,065,085.47 664.48 7,455.74 1,073,205.691. Energy Industries 308,144.34 19.85 644.25 308,808.442. Manufacturing Industries and Construction 351,973.54 179.91 1,512.47 353,665.933. Transport 231,727.93 242.08 4,975.58 236,945.594. Other Sectors 172,320.58 222.20 305.74 172,848.535. Other 919.08 0.43 17.69 937.20
B. Fugitive Emissions from Fuels 53.27 2,470.56 0.16 2,523.991. Solid Fuels NE,NO 2,075.76 NE,NO 2,075.762. Oil and Natural Gas 53.27 394.80 0.16 448.22
2. Industrial Processes 60,722.07 302.84 7,302.85 21,310.00 8,860.00 45,410.00 143,907.75A. Mineral Products 56,413.96 NA,NO NA,NO 56,413.96B. Chemical Industry 4,156.65 302.84 7,302.85 IE,NE,NO IE,NE,NO IE,NE,NO 11,762.33C. Metal Production 151.46 IE,NA,NE,NO NO IE,NE IE,NA,NE IE,NA,NE 151.46D. Other Production IE IEE. Production of Halocarbons and SF6 NE,NO NE,NO NE,NO NE,NOF. Consumption of Halocarbons and SF6
(2) 21,310.00 8,860.00 45,410.00 75,580.00G. Other NO NO NO NE,NO NE,NO NE,NO NE,NO
3. Solvent and Other Product Use NA,NE 411.66 411.664. Agriculture 18,261.91 13,870.83 32,132.74
A. Enteric Fermentation 7,748.30 7,748.30B. Manure Management 3,026.51 5,347.49 8,374.00C. Rice Cultivation 7,368.45 7,368.45D. Agricultural Soils(3) NA 8,432.91 8,432.91E. Prescribed Burning of Savannas NE NE NEF. Field Burning of Agricultural Residues 118.65 90.43 209.08G. Other NO NO NO
5. Land Use, Land-Use Change and Forestry(1) -78,402.90 196.99 304.61 -77,901.30A. Forest Land -86,941.08 28.10 2.85 -86,910.12B. Cropland 2,794.22 6.06 285.23 3,085.51C. Grassland 1,736.99 0.90 0.09 1,737.97D. Wetlands 84.35 2.04 0.21 86.59E. Settlements 2,656.30 130.63 13.26 2,800.19F. Other Land 1,266.33 29.27 2.97 1,298.56G. Other NE NE NE
6. Waste 23,927.49 10,763.75 3,669.42 38,360.66A. Solid Waste Disposal on Land NA,NE,NO 8,706.08 8,706.08B. Waste-water Handling 1,994.33 1,536.55 3,530.88C. Waste Incineration 23,246.75 63.34 2,115.39 25,425.48D. Other 680.75 IE,NE,NO 17.48 698.23
7. Other (as specified in Summary 1.A) NA,NO NA,NO NA,NO NA,NO NA,NO NA,NO NA,NO
Memo Items: (4)
International Bunkers 34,839.77 49.22 309.90 35,198.88Aviation 13,849.72 8.23 137.03 13,994.98Marine 20,990.06 40.99 172.86 21,203.91Multilateral Operations NO NO NO NOCO2 Emissions from Biomass 4,791.47 4,791.47
Total CO2 Equivalent Emissions without Land Use, Land-Use Change and Forestry (5) 1,290,542.49Total CO2 Equivalent Emissions with Land Use, Land-Use Change and Forestry (5) 1,212,641.19
(2) Actual emissions should be included in the national totals. If no actual emissions were reported, potential emissions should be included.(3) Parties which previously reported CO2 from soils in the Agriculture sector should note this in the NIR.(4) See footnote 8 to table Summary 1.A.
CO2 equivalent (Gg )
(1) For CO2 from Land Use, Land-use Change and Forestry the net emissions/removals are to be reported. For the purposes of reporting, the signs for removals are alwaysnegative (-) and for emissions positive (+).
(5) These totals will differ from the totals reported in table 10, sheet 5 if Parties report non-CO2 emissions from LULUCF.

Annex 10. Summary of Common Reporting Format
National Greenhouse Gas Inventory Report of Japan 2006 Annex 10.5
10.5. Emissions5 and Removals in 1994
5 Potential emissions of HFCs, PFCs and SF6 are reported due to the generation of CRF Reporter
SUMMARY 2 SUMMARY REPORT FOR CO2 EQUIVALENT EMISSIONS Inventory 1994(Sheet 1 of 1) Submission 2006 v1.1
JAPAN
GREENHOUSE GAS SOURCE AND CO2 (1) CH4 N2O HFCs (2) PFCs (2) SF6
(2) Total SINK CATEGORIESTotal (Net Emissions) (1) 1,122,781.81 32,108.08 34,152.48 28,840.00 12,274.00 45,410.00 1,275,566.371. Energy 1,117,350.58 2,781.91 7,884.72 1,128,017.20
A. Fuel Combustion (Sectoral Approach) 1,117,299.37 666.89 7,884.56 1,125,850.821. Energy Industries 345,713.37 21.52 701.65 346,436.532. Manufacturing Industries and Construction 359,766.54 194.00 1,685.09 361,645.633. Transport 243,681.03 243.33 5,181.24 249,105.594. Other Sectors 167,275.64 207.64 299.11 167,782.385. Other 862.80 0.41 17.47 880.68
B. Fugitive Emissions from Fuels 51.20 2,115.02 0.16 2,166.371. Solid Fuels NE,NO 1,712.96 NE,NO 1,712.962. Oil and Natural Gas 51.20 402.05 0.16 453.41
2. Industrial Processes 61,811.65 302.31 8,298.10 28,840.00 12,274.00 45,410.00 156,936.07A. Mineral Products 57,217.22 NA,NO NA,NO 57,217.22B. Chemical Industry 4,433.31 302.31 8,298.10 IE,NE,NO IE,NE,NO IE,NE,NO 13,033.73C. Metal Production 161.12 IE,NA,NE,NO NO IE,NE IE,NA,NE IE,NA,NE 161.12D. Other Production IE IEE. Production of Halocarbons and SF6 NE,NO NE,NO NE,NO NE,NOF. Consumption of Halocarbons and SF6
(2) 28,840.00 12,274.00 45,410.00 86,524.00G. Other NO NO NO NE,NO NE,NO NE,NO NE,NO
3. Solvent and Other Product Use NA,NE 438.02 438.024. Agriculture 18,117.55 13,530.65 31,648.20
A. Enteric Fermentation 7,660.50 7,660.50B. Manure Management 2,956.18 5,220.04 8,176.22C. Rice Cultivation 7,384.52 7,384.52D. Agricultural Soils(3) NA 8,222.37 8,222.37E. Prescribed Burning of Savannas NE NE NEF. Field Burning of Agricultural Residues 116.35 88.24 204.59G. Other NO NO NO
5. Land Use, Land-Use Change and Forestry(1) -83,609.02 159.91 214.35 -83,234.76A. Forest Land -90,732.82 21.13 2.14 -90,709.54B. Cropland 1,990.07 5.94 198.72 2,194.72C. Grassland 1,783.95 0.89 0.09 1,784.93D. Wetlands 93.35 2.23 0.23 95.80E. Settlements 2,064.71 103.07 10.46 2,178.25F. Other Land 1,191.72 26.66 2.71 1,221.09G. Other NE NE NE
6. Waste 27,228.60 10,746.40 3,786.64 41,761.65A. Solid Waste Disposal on Land NA,NE,NO 8,754.89 8,754.89B. Waste-water Handling 1,926.93 1,485.90 3,412.83C. Waste Incineration 26,526.69 64.58 2,284.97 28,876.24D. Other 701.91 IE,NE,NO 15.77 717.68
7. Other (as specified in Summary 1.A) NA,NO NA,NO NA,NO NA,NO NA,NO NA,NO NA,NO
Memo Items: (4)
International Bunkers 35,909.90 49.65 320.67 36,280.23Aviation 15,059.45 8.95 149.00 15,217.40Marine 20,850.45 40.70 171.67 21,062.83Multilateral Operations NO NO NO NOCO2 Emissions from Biomass 4,855.47 4,855.47
Total CO2 Equivalent Emissions without Land Use, Land-Use Change and Forestry (5) 1,358,801.13Total CO2 Equivalent Emissions with Land Use, Land-Use Change and Forestry (5) 1,275,566.37
(2) Actual emissions should be included in the national totals. If no actual emissions were reported, potential emissions should be included.(3) Parties which previously reported CO2 from soils in the Agriculture sector should note this in the NIR.(4) See footnote 8 to table Summary 1.A.
CO2 equivalent (Gg )
(1) For CO2 from Land Use, Land-use Change and Forestry the net emissions/removals are to be reported. For the purposes of reporting, the signs for removals are alwaysnegative (-) and for emissions positive (+).
(5) These totals will differ from the totals reported in table 10, sheet 5 if Parties report non-CO2 emissions from LULUCF.
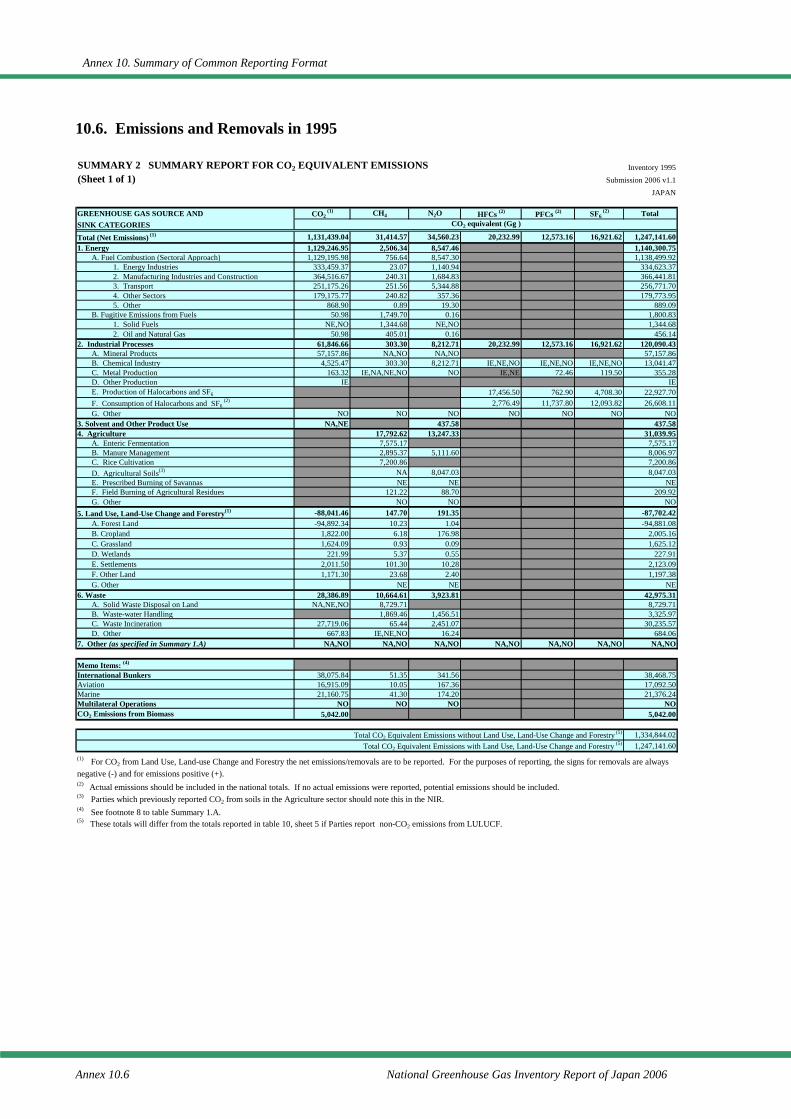
Annex 10. Summary of Common Reporting Format
Annex 10.6 National Greenhouse Gas Inventory Report of Japan 2006
10.6. Emissions and Removals in 1995
SUMMARY 2 SUMMARY REPORT FOR CO2 EQUIVALENT EMISSIONS Inventory 1995(Sheet 1 of 1) Submission 2006 v1.1
JAPAN
GREENHOUSE GAS SOURCE AND CO2 (1) CH4 N2O HFCs (2) PFCs (2) SF6
(2) Total SINK CATEGORIESTotal (Net Emissions) (1) 1,131,439.04 31,414.57 34,560.23 20,232.99 12,573.16 16,921.62 1,247,141.601. Energy 1,129,246.95 2,506.34 8,547.46 1,140,300.75
A. Fuel Combustion (Sectoral Approach) 1,129,195.98 756.64 8,547.30 1,138,499.921. Energy Industries 333,459.37 23.07 1,140.94 334,623.372. Manufacturing Industries and Construction 364,516.67 240.31 1,684.83 366,441.813. Transport 251,175.26 251.56 5,344.88 256,771.704. Other Sectors 179,175.77 240.82 357.36 179,773.955. Other 868.90 0.89 19.30 889.09
B. Fugitive Emissions from Fuels 50.98 1,749.70 0.16 1,800.831. Solid Fuels NE,NO 1,344.68 NE,NO 1,344.682. Oil and Natural Gas 50.98 405.01 0.16 456.14
2. Industrial Processes 61,846.66 303.30 8,212.71 20,232.99 12,573.16 16,921.62 120,090.43A. Mineral Products 57,157.86 NA,NO NA,NO 57,157.86B. Chemical Industry 4,525.47 303.30 8,212.71 IE,NE,NO IE,NE,NO IE,NE,NO 13,041.47C. Metal Production 163.32 IE,NA,NE,NO NO IE,NE 72.46 119.50 355.28D. Other Production IE IEE. Production of Halocarbons and SF6 17,456.50 762.90 4,708.30 22,927.70F. Consumption of Halocarbons and SF6
(2) 2,776.49 11,737.80 12,093.82 26,608.11G. Other NO NO NO NO NO NO NO
3. Solvent and Other Product Use NA,NE 437.58 437.584. Agriculture 17,792.62 13,247.33 31,039.95
A. Enteric Fermentation 7,575.17 7,575.17B. Manure Management 2,895.37 5,111.60 8,006.97C. Rice Cultivation 7,200.86 7,200.86D. Agricultural Soils(3) NA 8,047.03 8,047.03E. Prescribed Burning of Savannas NE NE NEF. Field Burning of Agricultural Residues 121.22 88.70 209.92G. Other NO NO NO
5. Land Use, Land-Use Change and Forestry(1) -88,041.46 147.70 191.35 -87,702.42A. Forest Land -94,892.34 10.23 1.04 -94,881.08B. Cropland 1,822.00 6.18 176.98 2,005.16C. Grassland 1,624.09 0.93 0.09 1,625.12D. Wetlands 221.99 5.37 0.55 227.91E. Settlements 2,011.50 101.30 10.28 2,123.09F. Other Land 1,171.30 23.68 2.40 1,197.38G. Other NE NE NE
6. Waste 28,386.89 10,664.61 3,923.81 42,975.31A. Solid Waste Disposal on Land NA,NE,NO 8,729.71 8,729.71B. Waste-water Handling 1,869.46 1,456.51 3,325.97C. Waste Incineration 27,719.06 65.44 2,451.07 30,235.57D. Other 667.83 IE,NE,NO 16.24 684.06
7. Other (as specified in Summary 1.A) NA,NO NA,NO NA,NO NA,NO NA,NO NA,NO NA,NO
Memo Items: (4)
International Bunkers 38,075.84 51.35 341.56 38,468.75Aviation 16,915.09 10.05 167.36 17,092.50Marine 21,160.75 41.30 174.20 21,376.24Multilateral Operations NO NO NO NOCO2 Emissions from Biomass 5,042.00 5,042.00
Total CO2 Equivalent Emissions without Land Use, Land-Use Change and Forestry (5) 1,334,844.02Total CO2 Equivalent Emissions with Land Use, Land-Use Change and Forestry (5) 1,247,141.60
(2) Actual emissions should be included in the national totals. If no actual emissions were reported, potential emissions should be included.(3) Parties which previously reported CO2 from soils in the Agriculture sector should note this in the NIR.(4) See footnote 8 to table Summary 1.A.
CO2 equivalent (Gg )
(1) For CO2 from Land Use, Land-use Change and Forestry the net emissions/removals are to be reported. For the purposes of reporting, the signs for removals are alwaysnegative (-) and for emissions positive (+).
(5) These totals will differ from the totals reported in table 10, sheet 5 if Parties report non-CO2 emissions from LULUCF.
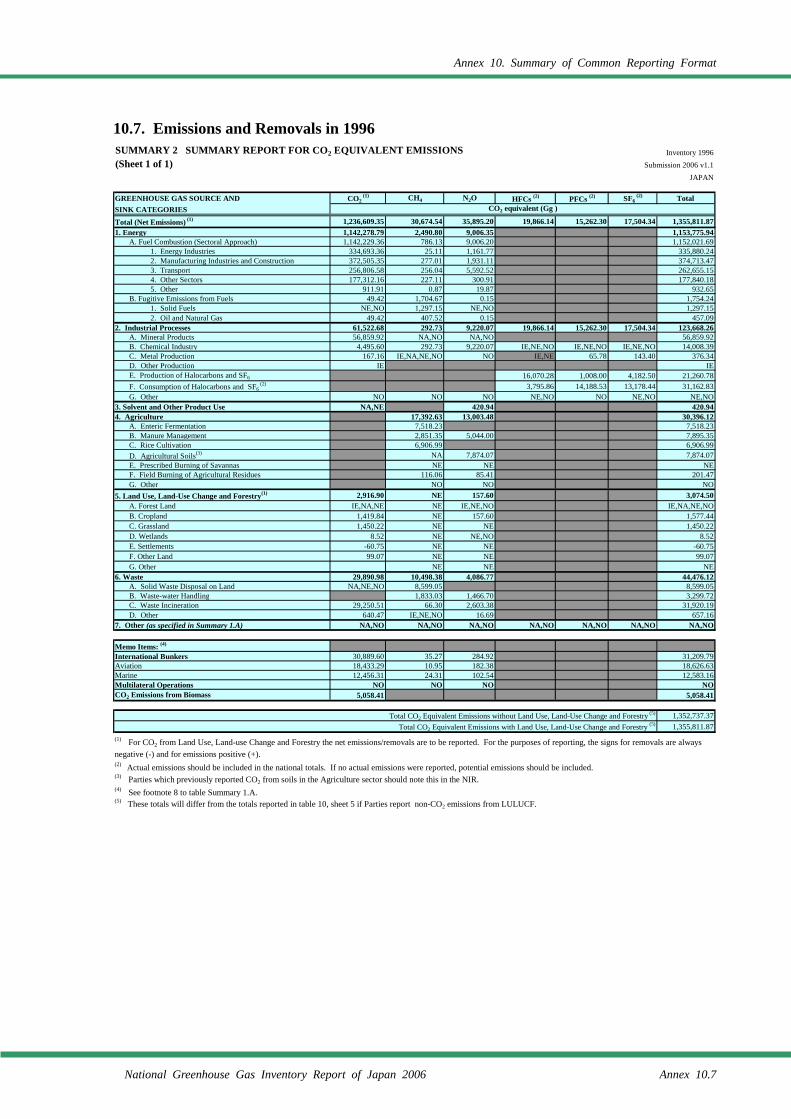
Annex 10. Summary of Common Reporting Format
National Greenhouse Gas Inventory Report of Japan 2006 Annex 10.7
10.7. Emissions and Removals in 1996
SUMMARY 2 SUMMARY REPORT FOR CO2 EQUIVALENT EMISSIONS Inventory 1996(Sheet 1 of 1) Submission 2006 v1.1
JAPAN
GREENHOUSE GAS SOURCE AND CO2 (1) CH4 N2O HFCs (2) PFCs (2) SF6
(2) Total SINK CATEGORIESTotal (Net Emissions) (1) 1,236,609.35 30,674.54 35,895.20 19,866.14 15,262.30 17,504.34 1,355,811.871. Energy 1,142,278.79 2,490.80 9,006.35 1,153,775.94
A. Fuel Combustion (Sectoral Approach) 1,142,229.36 786.13 9,006.20 1,152,021.691. Energy Industries 334,693.36 25.11 1,161.77 335,880.242. Manufacturing Industries and Construction 372,505.35 277.01 1,931.11 374,713.473. Transport 256,806.58 256.04 5,592.52 262,655.154. Other Sectors 177,312.16 227.11 300.91 177,840.185. Other 911.91 0.87 19.87 932.65
B. Fugitive Emissions from Fuels 49.42 1,704.67 0.15 1,754.241. Solid Fuels NE,NO 1,297.15 NE,NO 1,297.152. Oil and Natural Gas 49.42 407.52 0.15 457.09
2. Industrial Processes 61,522.68 292.73 9,220.07 19,866.14 15,262.30 17,504.34 123,668.26A. Mineral Products 56,859.92 NA,NO NA,NO 56,859.92B. Chemical Industry 4,495.60 292.73 9,220.07 IE,NE,NO IE,NE,NO IE,NE,NO 14,008.39C. Metal Production 167.16 IE,NA,NE,NO NO IE,NE 65.78 143.40 376.34D. Other Production IE IEE. Production of Halocarbons and SF6 16,070.28 1,008.00 4,182.50 21,260.78F. Consumption of Halocarbons and SF6
(2) 3,795.86 14,188.53 13,178.44 31,162.83G. Other NO NO NO NE,NO NO NE,NO NE,NO
3. Solvent and Other Product Use NA,NE 420.94 420.944. Agriculture 17,392.63 13,003.48 30,396.12
A. Enteric Fermentation 7,518.23 7,518.23B. Manure Management 2,851.35 5,044.00 7,895.35C. Rice Cultivation 6,906.99 6,906.99D. Agricultural Soils(3) NA 7,874.07 7,874.07E. Prescribed Burning of Savannas NE NE NEF. Field Burning of Agricultural Residues 116.06 85.41 201.47G. Other NO NO NO
5. Land Use, Land-Use Change and Forestry(1) 2,916.90 NE 157.60 3,074.50A. Forest Land IE,NA,NE NE IE,NE,NO IE,NA,NE,NOB. Cropland 1,419.84 NE 157.60 1,577.44C. Grassland 1,450.22 NE NE 1,450.22D. Wetlands 8.52 NE NE,NO 8.52E. Settlements -60.75 NE NE -60.75F. Other Land 99.07 NE NE 99.07G. Other NE NE NE
6. Waste 29,890.98 10,498.38 4,086.77 44,476.12A. Solid Waste Disposal on Land NA,NE,NO 8,599.05 8,599.05B. Waste-water Handling 1,833.03 1,466.70 3,299.72C. Waste Incineration 29,250.51 66.30 2,603.38 31,920.19D. Other 640.47 IE,NE,NO 16.69 657.16
7. Other (as specified in Summary 1.A) NA,NO NA,NO NA,NO NA,NO NA,NO NA,NO NA,NO
Memo Items: (4)
International Bunkers 30,889.60 35.27 284.92 31,209.79Aviation 18,433.29 10.95 182.38 18,626.63Marine 12,456.31 24.31 102.54 12,583.16Multilateral Operations NO NO NO NOCO2 Emissions from Biomass 5,058.41 5,058.41
Total CO2 Equivalent Emissions without Land Use, Land-Use Change and Forestry (5) 1,352,737.37Total CO2 Equivalent Emissions with Land Use, Land-Use Change and Forestry (5) 1,355,811.87
(2) Actual emissions should be included in the national totals. If no actual emissions were reported, potential emissions should be included.(3) Parties which previously reported CO2 from soils in the Agriculture sector should note this in the NIR.(4) See footnote 8 to table Summary 1.A.
CO2 equivalent (Gg )
(1) For CO2 from Land Use, Land-use Change and Forestry the net emissions/removals are to be reported. For the purposes of reporting, the signs for removals are alwaysnegative (-) and for emissions positive (+).
(5) These totals will differ from the totals reported in table 10, sheet 5 if Parties report non-CO2 emissions from LULUCF.
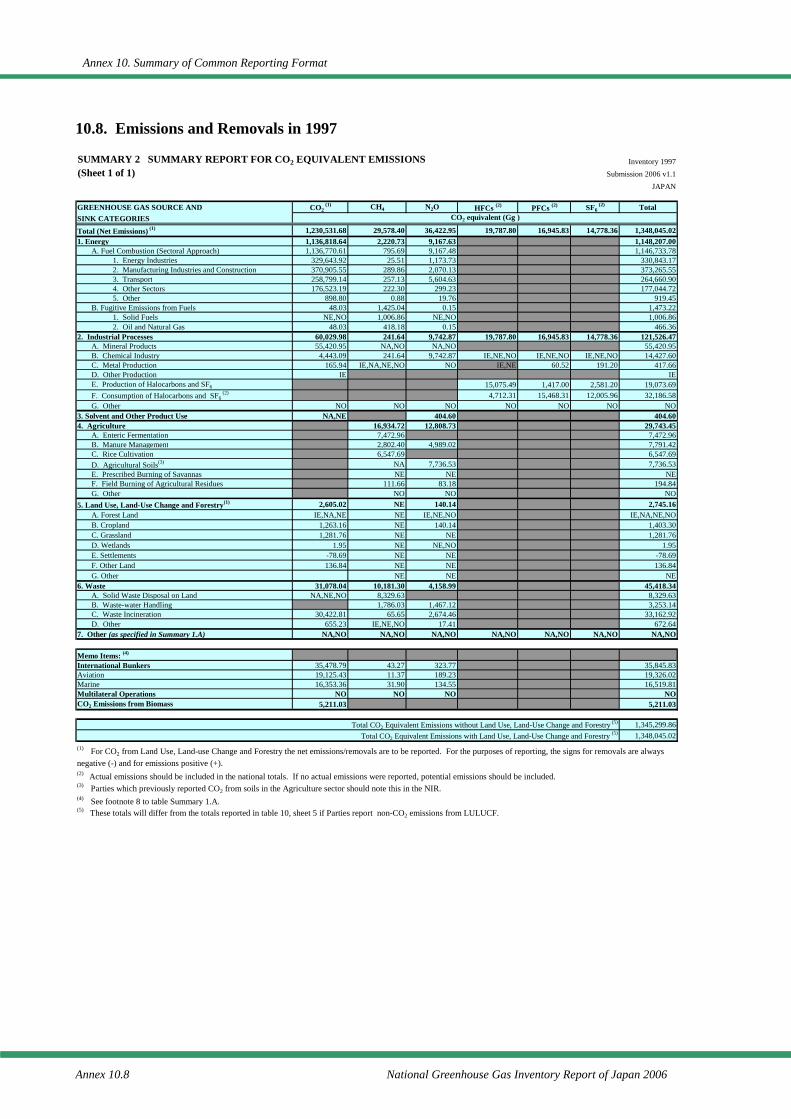
Annex 10. Summary of Common Reporting Format
Annex 10.8 National Greenhouse Gas Inventory Report of Japan 2006
10.8. Emissions and Removals in 1997
SUMMARY 2 SUMMARY REPORT FOR CO2 EQUIVALENT EMISSIONS Inventory 1997(Sheet 1 of 1) Submission 2006 v1.1
JAPAN
GREENHOUSE GAS SOURCE AND CO2 (1) CH4 N2O HFCs (2) PFCs (2) SF6
(2) Total SINK CATEGORIESTotal (Net Emissions) (1) 1,230,531.68 29,578.40 36,422.95 19,787.80 16,945.83 14,778.36 1,348,045.021. Energy 1,136,818.64 2,220.73 9,167.63 1,148,207.00
A. Fuel Combustion (Sectoral Approach) 1,136,770.61 795.69 9,167.48 1,146,733.781. Energy Industries 329,643.92 25.51 1,173.73 330,843.172. Manufacturing Industries and Construction 370,905.55 289.86 2,070.13 373,265.553. Transport 258,799.14 257.13 5,604.63 264,660.904. Other Sectors 176,523.19 222.30 299.23 177,044.725. Other 898.80 0.88 19.76 919.45
B. Fugitive Emissions from Fuels 48.03 1,425.04 0.15 1,473.221. Solid Fuels NE,NO 1,006.86 NE,NO 1,006.862. Oil and Natural Gas 48.03 418.18 0.15 466.36
2. Industrial Processes 60,029.98 241.64 9,742.87 19,787.80 16,945.83 14,778.36 121,526.47A. Mineral Products 55,420.95 NA,NO NA,NO 55,420.95B. Chemical Industry 4,443.09 241.64 9,742.87 IE,NE,NO IE,NE,NO IE,NE,NO 14,427.60C. Metal Production 165.94 IE,NA,NE,NO NO IE,NE 60.52 191.20 417.66D. Other Production IE IEE. Production of Halocarbons and SF6 15,075.49 1,417.00 2,581.20 19,073.69F. Consumption of Halocarbons and SF6
(2) 4,712.31 15,468.31 12,005.96 32,186.58G. Other NO NO NO NO NO NO NO
3. Solvent and Other Product Use NA,NE 404.60 404.604. Agriculture 16,934.72 12,808.73 29,743.45
A. Enteric Fermentation 7,472.96 7,472.96B. Manure Management 2,802.40 4,989.02 7,791.42C. Rice Cultivation 6,547.69 6,547.69D. Agricultural Soils(3) NA 7,736.53 7,736.53E. Prescribed Burning of Savannas NE NE NEF. Field Burning of Agricultural Residues 111.66 83.18 194.84G. Other NO NO NO
5. Land Use, Land-Use Change and Forestry(1) 2,605.02 NE 140.14 2,745.16A. Forest Land IE,NA,NE NE IE,NE,NO IE,NA,NE,NOB. Cropland 1,263.16 NE 140.14 1,403.30C. Grassland 1,281.76 NE NE 1,281.76D. Wetlands 1.95 NE NE,NO 1.95E. Settlements -78.69 NE NE -78.69F. Other Land 136.84 NE NE 136.84G. Other NE NE NE
6. Waste 31,078.04 10,181.30 4,158.99 45,418.34A. Solid Waste Disposal on Land NA,NE,NO 8,329.63 8,329.63B. Waste-water Handling 1,786.03 1,467.12 3,253.14C. Waste Incineration 30,422.81 65.65 2,674.46 33,162.92D. Other 655.23 IE,NE,NO 17.41 672.64
7. Other (as specified in Summary 1.A) NA,NO NA,NO NA,NO NA,NO NA,NO NA,NO NA,NO
Memo Items: (4)
International Bunkers 35,478.79 43.27 323.77 35,845.83Aviation 19,125.43 11.37 189.23 19,326.02Marine 16,353.36 31.90 134.55 16,519.81Multilateral Operations NO NO NO NOCO2 Emissions from Biomass 5,211.03 5,211.03
Total CO2 Equivalent Emissions without Land Use, Land-Use Change and Forestry (5) 1,345,299.86Total CO2 Equivalent Emissions with Land Use, Land-Use Change and Forestry (5) 1,348,045.02
(2) Actual emissions should be included in the national totals. If no actual emissions were reported, potential emissions should be included.(3) Parties which previously reported CO2 from soils in the Agriculture sector should note this in the NIR.(4) See footnote 8 to table Summary 1.A.
CO2 equivalent (Gg )
(1) For CO2 from Land Use, Land-use Change and Forestry the net emissions/removals are to be reported. For the purposes of reporting, the signs for removals are alwaysnegative (-) and for emissions positive (+).
(5) These totals will differ from the totals reported in table 10, sheet 5 if Parties report non-CO2 emissions from LULUCF.

Annex 10. Summary of Common Reporting Format
National Greenhouse Gas Inventory Report of Japan 2006 Annex 10.9
10.9. Emissions and Removals in 1998
SUMMARY 2 SUMMARY REPORT FOR CO2 EQUIVALENT EMISSIONS Inventory 1998(Sheet 1 of 1) Submission 2006 v1.1
JAPAN
GREENHOUSE GAS SOURCE AND CO2 (1) CH4 N2O HFCs (2) PFCs (2) SF6
(2) Total SINK CATEGORIESTotal (Net Emissions) (1) 1,194,174.58 28,740.96 35,015.77 19,269.26 16,626.94 13,392.55 1,307,220.071. Energy 1,106,424.85 2,063.94 9,131.90 1,117,620.68
A. Fuel Combustion (Sectoral Approach) 1,106,382.06 775.67 9,131.77 1,116,289.501. Energy Industries 319,283.34 25.46 1,168.38 320,477.182. Manufacturing Industries and Construction 351,555.81 280.15 2,021.40 353,857.363. Transport 257,779.33 247.59 5,623.77 263,650.694. Other Sectors 176,917.54 221.68 298.83 177,438.045. Other 846.04 0.80 19.40 866.23
B. Fugitive Emissions from Fuels 42.79 1,288.26 0.13 1,331.181. Solid Fuels NE,NO 872.46 NE,NO 872.462. Oil and Natural Gas 42.79 415.81 0.13 458.72
2. Industrial Processes 54,390.76 226.58 8,577.87 19,269.26 16,626.94 13,392.55 112,483.97A. Mineral Products 50,339.77 NA,NO NA,NO 50,339.77B. Chemical Industry 3,905.71 226.58 8,577.87 IE,NE,NO IE,NE,NO IE,NE,NO 12,710.16C. Metal Production 145.29 IE,NA,NE,NO NO IE,NE 54.49 406.30 606.08D. Other Production IE IEE. Production of Halocarbons and SF6 14,049.59 1,390.00 2,103.20 17,542.79F. Consumption of Halocarbons and SF6
(2) 5,219.67 15,182.45 10,883.05 31,285.17G. Other NO NO NO NO NO NO NO
3. Solvent and Other Product Use NA,NE 377.05 377.054. Agriculture 16,625.04 12,654.64 29,279.68
A. Enteric Fermentation 7,438.25 7,438.25B. Manure Management 2,744.51 4,940.29 7,684.80C. Rice Cultivation 6,333.03 6,333.03D. Agricultural Soils(3) NA 7,631.30 7,631.30E. Prescribed Burning of Savannas NE NE NEF. Field Burning of Agricultural Residues 109.24 83.05 192.30G. Other NO NO NO
5. Land Use, Land-Use Change and Forestry(1) 2,263.29 NE 123.95 2,387.24A. Forest Land IE,NA,NE NE IE,NE,NO IE,NA,NE,NOB. Cropland 1,117.75 NE 123.95 1,241.70C. Grassland 1,124.62 NE NE 1,124.62D. Wetlands 7.21 NE NE,NO 7.21E. Settlements -118.05 NE NE -118.05F. Other Land 131.76 NE NE 131.76G. Other NE NE NE
6. Waste 31,095.68 9,825.41 4,150.36 45,071.44A. Solid Waste Disposal on Land NA,NE,NO 8,023.86 8,023.86B. Waste-water Handling 1,739.01 1,437.65 3,176.66C. Waste Incineration 30,486.56 62.54 2,695.24 33,244.33D. Other 609.12 IE,NE,NO 17.47 626.59
7. Other (as specified in Summary 1.A) NA,NO NA,NO NA,NO NA,NO NA,NO NA,NO NA,NO
Memo Items: (4)
International Bunkers 36,806.98 45.12 335.64 37,187.74Aviation 19,675.26 11.69 194.67 19,881.62Marine 17,131.72 33.42 140.97 17,306.12Multilateral Operations NO NO NO NOCO2 Emissions from Biomass 4,788.16 4,788.16
Total CO2 Equivalent Emissions without Land Use, Land-Use Change and Forestry (5) 1,304,832.82Total CO2 Equivalent Emissions with Land Use, Land-Use Change and Forestry (5) 1,307,220.07
(2) Actual emissions should be included in the national totals. If no actual emissions were reported, potential emissions should be included.(3) Parties which previously reported CO2 from soils in the Agriculture sector should note this in the NIR.(4) See footnote 8 to table Summary 1.A.
CO2 equivalent (Gg )
(1) For CO2 from Land Use, Land-use Change and Forestry the net emissions/removals are to be reported. For the purposes of reporting, the signs for removals are alwaysnegative (-) and for emissions positive (+).
(5) These totals will differ from the totals reported in table 10, sheet 5 if Parties report non-CO2 emissions from LULUCF.

Annex 10. Summary of Common Reporting Format
Annex 10.10 National Greenhouse Gas Inventory Report of Japan 2006
10.10. Emissions and Removals in 1999
SUMMARY 2 SUMMARY REPORT FOR CO2 EQUIVALENT EMISSIONS Inventory 1999(Sheet 1 of 1) Submission 2006 v1.1
JAPAN
GREENHOUSE GAS SOURCE AND CO2 (1) CH4 N2O HFCs (2) PFCs (2) SF6
(2) Total SINK CATEGORIESTotal (Net Emissions) (1) 1,231,121.51 28,033.92 28,903.55 19,764.83 14,926.87 9,112.95 1,331,863.631. Energy 1,143,605.44 2,071.90 9,730.87 1,155,408.20
A. Fuel Combustion (Sectoral Approach) 1,143,567.32 786.00 9,730.75 1,154,084.071. Energy Industries 339,054.18 31.15 1,328.52 340,413.852. Manufacturing Industries and Construction 358,649.35 242.31 2,154.82 361,046.483. Transport 260,013.80 247.55 5,894.09 266,155.434. Other Sectors 185,032.12 264.50 334.90 185,631.515. Other 817.87 0.49 18.43 836.79
B. Fugitive Emissions from Fuels 38.12 1,285.90 0.12 1,324.141. Solid Fuels NE,NO 865.69 NE,NO 865.692. Oil and Natural Gas 38.12 420.21 0.12 458.45
2. Industrial Processes 53,983.12 219.48 2,000.86 19,764.83 14,926.87 9,112.95 100,008.11A. Mineral Products 49,594.65 NA,NO NA,NO 49,594.65B. Chemical Industry 4,241.98 219.48 2,000.86 IE,NE,NO IE,NE,NO IE,NE,NO 6,462.32C. Metal Production 146.49 IE,NA,NE,NO NO IE,NE 33.13 645.30 824.92D. Other Production IE IEE. Production of Halocarbons and SF6 14,257.00 1,273.70 1,529.60 17,060.30F. Consumption of Halocarbons and SF6
(2) 5,507.83 13,620.04 6,938.05 26,065.92G. Other NO NO NO NO NO NO NO
3. Solvent and Other Product Use NA,NE 362.53 362.534. Agriculture 16,297.95 12,512.34 28,810.29
A. Enteric Fermentation 7,379.06 7,379.06B. Manure Management 2,685.52 4,887.89 7,573.41C. Rice Cultivation 6,125.26 6,125.26D. Agricultural Soils(3) NA 7,542.49 7,542.49E. Prescribed Burning of Savannas NE NE NEF. Field Burning of Agricultural Residues 108.11 81.96 190.06G. Other NO NO NO
5. Land Use, Land-Use Change and Forestry(1) 1,966.53 NE 111.64 2,078.17A. Forest Land IE,NA,NE NE IE,NE,NO IE,NA,NE,NOB. Cropland 980.51 NE 111.64 1,092.16C. Grassland 1,027.24 NE NE 1,027.24D. Wetlands 5.65 NE NE,NO 5.65E. Settlements -160.50 NE NE -160.50F. Other Land 113.62 NE NE 113.62G. Other NE NE NE
6. Waste 31,566.42 9,444.60 4,185.31 45,196.32A. Solid Waste Disposal on Land NA,NE,NO 7,689.26 7,689.26B. Waste-water Handling 1,689.94 1,388.68 3,078.62C. Waste Incineration 30,913.84 65.39 2,779.07 33,758.30D. Other 652.58 IE,NE,NO 17.56 670.13
7. Other (as specified in Summary 1.A) NA,NO NA,NO NA,NO NA,NO NA,NO NA,NO NA,NO
Memo Items: (4)
International Bunkers 35,710.44 43.13 326.47 36,080.04Aviation 19,567.32 11.63 193.60 19,772.55Marine 16,143.12 31.50 132.87 16,307.49Multilateral Operations NO NO NO NOCO2 Emissions from Biomass 4,980.02 4,980.02
Total CO2 Equivalent Emissions without Land Use, Land-Use Change and Forestry (5) 1,329,785.45Total CO2 Equivalent Emissions with Land Use, Land-Use Change and Forestry (5) 1,331,863.63
(2) Actual emissions should be included in the national totals. If no actual emissions were reported, potential emissions should be included.(3) Parties which previously reported CO2 from soils in the Agriculture sector should note this in the NIR.(4) See footnote 8 to table Summary 1.A.
CO2 equivalent (Gg )
(1) For CO2 from Land Use, Land-use Change and Forestry the net emissions/removals are to be reported. For the purposes of reporting, the signs for removals are alwaysnegative (-) and for emissions positive (+).
(5) These totals will differ from the totals reported in table 10, sheet 5 if Parties report non-CO2 emissions from LULUCF.

Annex 10. Summary of Common Reporting Format
National Greenhouse Gas Inventory Report of Japan 2006 Annex 10.11
10.11. Emissions and Removals in 2000
SUMMARY 2 SUMMARY REPORT FOR CO2 EQUIVALENT EMISSIONS Inventory 2000(Sheet 1 of 1) Submission 2006 v1.1
JAPAN
GREENHOUSE GAS SOURCE AND CO2 (1) CH4 N2O HFCs (2) PFCs (2) SF6
(2) Total SINK CATEGORIESTotal (Net Emissions) (1) 1,252,855.59 27,292.79 31,422.69 18,546.30 13,684.52 6,818.49 1,350,620.391. Energy 1,163,439.73 1,987.93 9,741.62 1,175,169.28
A. Fuel Combustion (Sectoral Approach) 1,163,403.65 786.91 9,741.51 1,173,932.071. Energy Industries 347,086.10 31.44 1,373.38 348,490.932. Manufacturing Industries and Construction 369,907.25 248.37 2,168.97 372,324.593. Transport 259,230.32 248.39 5,842.58 265,321.294. Other Sectors 186,312.04 258.18 337.85 186,908.075. Other 867.93 0.53 18.74 887.20
B. Fugitive Emissions from Fuels 36.08 1,201.02 0.11 1,237.211. Solid Fuels NE,NO 769.13 NE,NO 769.132. Oil and Natural Gas 36.08 431.89 0.11 468.09
2. Industrial Processes 54,796.77 163.74 4,690.09 18,546.30 13,684.52 6,818.49 98,699.91A. Mineral Products 50,466.05 NA,NO NA,NO 50,466.05B. Chemical Industry 4,177.99 163.74 4,690.09 IE,NE,NO IE,NE,NO IE,NE,NO 9,031.81C. Metal Production 152.73 IE,NA,NE,NO NO IE,NE 18.29 1,027.70 1,198.72D. Other Production IE IEE. Production of Halocarbons and SF6 12,654.54 1,382.60 860.40 14,897.54F. Consumption of Halocarbons and SF6
(2) 5,891.76 12,283.63 4,930.39 23,105.78G. Other NO NO NO NO NO NO NO
3. Solvent and Other Product Use NA,NE 340.99 340.994. Agriculture 16,115.86 12,384.23 28,500.09
A. Enteric Fermentation 7,344.65 7,344.65B. Manure Management 2,644.16 4,844.01 7,488.17C. Rice Cultivation 6,018.51 6,018.51D. Agricultural Soils(3) NA 7,459.04 7,459.04E. Prescribed Burning of Savannas NE NE NEF. Field Burning of Agricultural Residues 108.54 81.18 189.72G. Other NO NO NO
5. Land Use, Land-Use Change and Forestry(1) 1,706.08 NE 98.16 1,804.24A. Forest Land IE,NA,NE NE IE,NE,NO IE,NA,NE,NOB. Cropland 868.26 NE 98.16 966.42C. Grassland 934.42 NE NE 934.42D. Wetlands 5.21 NE NE,NO 5.21E. Settlements -188.41 NE NE -188.41F. Other Land 86.60 NE NE 86.60G. Other NE NE NE
6. Waste 32,913.01 9,025.27 4,167.60 46,105.89A. Solid Waste Disposal on Land NA,NE,NO 7,308.40 7,308.40B. Waste-water Handling 1,640.77 1,365.12 3,005.89C. Waste Incineration 32,257.09 76.10 2,783.83 35,117.02D. Other 655.91 IE,NE,NO 18.66 674.57
7. Other (as specified in Summary 1.A) NA,NO NA,NO NA,NO NA,NO NA,NO NA,NO NA,NO
Memo Items: (4)
International Bunkers 36,605.54 44.90 332.18 36,982.62Aviation 19,543.48 11.61 191.78 19,746.88Marine 17,062.06 33.29 140.40 17,235.75Multilateral Operations NO NO NO NOCO2 Emissions from Biomass 5,139.83 5,139.83
Total CO2 Equivalent Emissions without Land Use, Land-Use Change and Forestry (5) 1,348,816.15Total CO2 Equivalent Emissions with Land Use, Land-Use Change and Forestry (5) 1,350,620.39
(2) Actual emissions should be included in the national totals. If no actual emissions were reported, potential emissions should be included.(3) Parties which previously reported CO2 from soils in the Agriculture sector should note this in the NIR.(4) See footnote 8 to table Summary 1.A.
CO2 equivalent (Gg )
(1) For CO2 from Land Use, Land-use Change and Forestry the net emissions/removals are to be reported. For the purposes of reporting, the signs for removals are alwaysnegative (-) and for emissions positive (+).
(5) These totals will differ from the totals reported in table 10, sheet 5 if Parties report non-CO2 emissions from LULUCF.
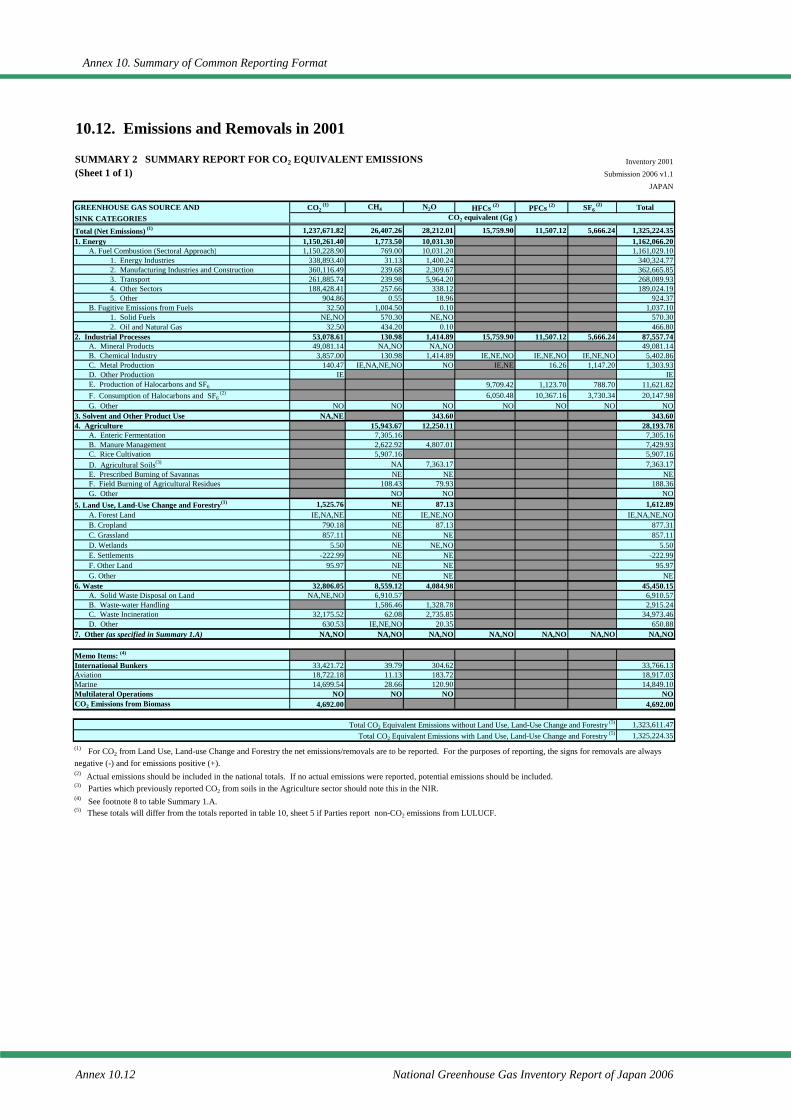
Annex 10. Summary of Common Reporting Format
Annex 10.12 National Greenhouse Gas Inventory Report of Japan 2006
10.12. Emissions and Removals in 2001
SUMMARY 2 SUMMARY REPORT FOR CO2 EQUIVALENT EMISSIONS Inventory 2001(Sheet 1 of 1) Submission 2006 v1.1
JAPAN
GREENHOUSE GAS SOURCE AND CO2 (1) CH4 N2O HFCs (2) PFCs (2) SF6
(2) Total SINK CATEGORIESTotal (Net Emissions) (1) 1,237,671.82 26,407.26 28,212.01 15,759.90 11,507.12 5,666.24 1,325,224.351. Energy 1,150,261.40 1,773.50 10,031.30 1,162,066.20
A. Fuel Combustion (Sectoral Approach) 1,150,228.90 769.00 10,031.20 1,161,029.101. Energy Industries 338,893.40 31.13 1,400.24 340,324.772. Manufacturing Industries and Construction 360,116.49 239.68 2,309.67 362,665.853. Transport 261,885.74 239.98 5,964.20 268,089.934. Other Sectors 188,428.41 257.66 338.12 189,024.195. Other 904.86 0.55 18.96 924.37
B. Fugitive Emissions from Fuels 32.50 1,004.50 0.10 1,037.101. Solid Fuels NE,NO 570.30 NE,NO 570.302. Oil and Natural Gas 32.50 434.20 0.10 466.80
2. Industrial Processes 53,078.61 130.98 1,414.89 15,759.90 11,507.12 5,666.24 87,557.74A. Mineral Products 49,081.14 NA,NO NA,NO 49,081.14B. Chemical Industry 3,857.00 130.98 1,414.89 IE,NE,NO IE,NE,NO IE,NE,NO 5,402.86C. Metal Production 140.47 IE,NA,NE,NO NO IE,NE 16.26 1,147.20 1,303.93D. Other Production IE IEE. Production of Halocarbons and SF6 9,709.42 1,123.70 788.70 11,621.82F. Consumption of Halocarbons and SF6
(2) 6,050.48 10,367.16 3,730.34 20,147.98G. Other NO NO NO NO NO NO NO
3. Solvent and Other Product Use NA,NE 343.60 343.604. Agriculture 15,943.67 12,250.11 28,193.78
A. Enteric Fermentation 7,305.16 7,305.16B. Manure Management 2,622.92 4,807.01 7,429.93C. Rice Cultivation 5,907.16 5,907.16D. Agricultural Soils(3) NA 7,363.17 7,363.17E. Prescribed Burning of Savannas NE NE NEF. Field Burning of Agricultural Residues 108.43 79.93 188.36G. Other NO NO NO
5. Land Use, Land-Use Change and Forestry(1) 1,525.76 NE 87.13 1,612.89A. Forest Land IE,NA,NE NE IE,NE,NO IE,NA,NE,NOB. Cropland 790.18 NE 87.13 877.31C. Grassland 857.11 NE NE 857.11D. Wetlands 5.50 NE NE,NO 5.50E. Settlements -222.99 NE NE -222.99F. Other Land 95.97 NE NE 95.97G. Other NE NE NE
6. Waste 32,806.05 8,559.12 4,084.98 45,450.15A. Solid Waste Disposal on Land NA,NE,NO 6,910.57 6,910.57B. Waste-water Handling 1,586.46 1,328.78 2,915.24C. Waste Incineration 32,175.52 62.08 2,735.85 34,973.46D. Other 630.53 IE,NE,NO 20.35 650.88
7. Other (as specified in Summary 1.A) NA,NO NA,NO NA,NO NA,NO NA,NO NA,NO NA,NO
Memo Items: (4)
International Bunkers 33,421.72 39.79 304.62 33,766.13Aviation 18,722.18 11.13 183.72 18,917.03Marine 14,699.54 28.66 120.90 14,849.10Multilateral Operations NO NO NO NOCO2 Emissions from Biomass 4,692.00 4,692.00
Total CO2 Equivalent Emissions without Land Use, Land-Use Change and Forestry (5) 1,323,611.47Total CO2 Equivalent Emissions with Land Use, Land-Use Change and Forestry (5) 1,325,224.35
(2) Actual emissions should be included in the national totals. If no actual emissions were reported, potential emissions should be included.(3) Parties which previously reported CO2 from soils in the Agriculture sector should note this in the NIR.(4) See footnote 8 to table Summary 1.A.
CO2 equivalent (Gg )
(1) For CO2 from Land Use, Land-use Change and Forestry the net emissions/removals are to be reported. For the purposes of reporting, the signs for removals are alwaysnegative (-) and for emissions positive (+).
(5) These totals will differ from the totals reported in table 10, sheet 5 if Parties report non-CO2 emissions from LULUCF.
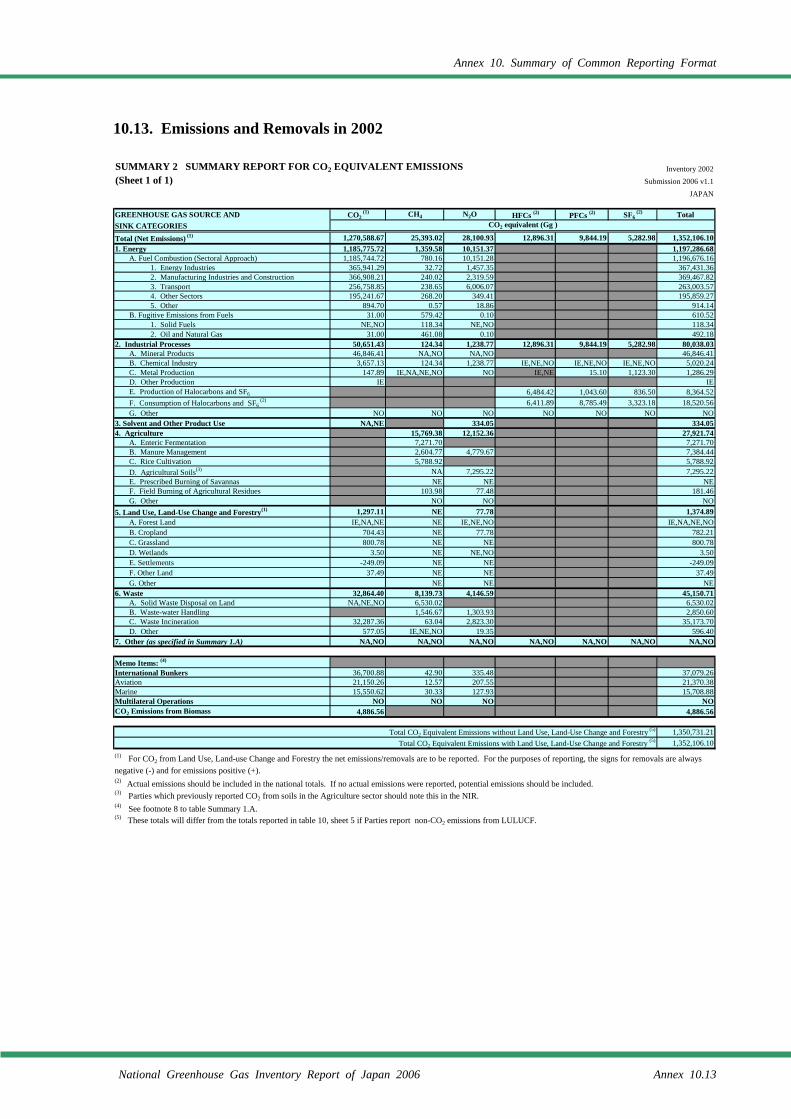
Annex 10. Summary of Common Reporting Format
National Greenhouse Gas Inventory Report of Japan 2006 Annex 10.13
10.13. Emissions and Removals in 2002
SUMMARY 2 SUMMARY REPORT FOR CO2 EQUIVALENT EMISSIONS Inventory 2002(Sheet 1 of 1) Submission 2006 v1.1
JAPAN
GREENHOUSE GAS SOURCE AND CO2 (1) CH4 N2O HFCs (2) PFCs (2) SF6
(2) Total SINK CATEGORIESTotal (Net Emissions) (1) 1,270,588.67 25,393.02 28,100.93 12,896.31 9,844.19 5,282.98 1,352,106.101. Energy 1,185,775.72 1,359.58 10,151.37 1,197,286.68
A. Fuel Combustion (Sectoral Approach) 1,185,744.72 780.16 10,151.28 1,196,676.161. Energy Industries 365,941.29 32.72 1,457.35 367,431.362. Manufacturing Industries and Construction 366,908.21 240.02 2,319.59 369,467.823. Transport 256,758.85 238.65 6,006.07 263,003.574. Other Sectors 195,241.67 268.20 349.41 195,859.275. Other 894.70 0.57 18.86 914.14
B. Fugitive Emissions from Fuels 31.00 579.42 0.10 610.521. Solid Fuels NE,NO 118.34 NE,NO 118.342. Oil and Natural Gas 31.00 461.08 0.10 492.18
2. Industrial Processes 50,651.43 124.34 1,238.77 12,896.31 9,844.19 5,282.98 80,038.03A. Mineral Products 46,846.41 NA,NO NA,NO 46,846.41B. Chemical Industry 3,657.13 124.34 1,238.77 IE,NE,NO IE,NE,NO IE,NE,NO 5,020.24C. Metal Production 147.89 IE,NA,NE,NO NO IE,NE 15.10 1,123.30 1,286.29D. Other Production IE IEE. Production of Halocarbons and SF6 6,484.42 1,043.60 836.50 8,364.52F. Consumption of Halocarbons and SF6
(2) 6,411.89 8,785.49 3,323.18 18,520.56G. Other NO NO NO NO NO NO NO
3. Solvent and Other Product Use NA,NE 334.05 334.054. Agriculture 15,769.38 12,152.36 27,921.74
A. Enteric Fermentation 7,271.70 7,271.70B. Manure Management 2,604.77 4,779.67 7,384.44C. Rice Cultivation 5,788.92 5,788.92D. Agricultural Soils(3) NA 7,295.22 7,295.22E. Prescribed Burning of Savannas NE NE NEF. Field Burning of Agricultural Residues 103.98 77.48 181.46G. Other NO NO NO
5. Land Use, Land-Use Change and Forestry(1) 1,297.11 NE 77.78 1,374.89A. Forest Land IE,NA,NE NE IE,NE,NO IE,NA,NE,NOB. Cropland 704.43 NE 77.78 782.21C. Grassland 800.78 NE NE 800.78D. Wetlands 3.50 NE NE,NO 3.50E. Settlements -249.09 NE NE -249.09F. Other Land 37.49 NE NE 37.49G. Other NE NE NE
6. Waste 32,864.40 8,139.73 4,146.59 45,150.71A. Solid Waste Disposal on Land NA,NE,NO 6,530.02 6,530.02B. Waste-water Handling 1,546.67 1,303.93 2,850.60C. Waste Incineration 32,287.36 63.04 2,823.30 35,173.70D. Other 577.05 IE,NE,NO 19.35 596.40
7. Other (as specified in Summary 1.A) NA,NO NA,NO NA,NO NA,NO NA,NO NA,NO NA,NO
Memo Items: (4)
International Bunkers 36,700.88 42.90 335.48 37,079.26Aviation 21,150.26 12.57 207.55 21,370.38Marine 15,550.62 30.33 127.93 15,708.88Multilateral Operations NO NO NO NOCO2 Emissions from Biomass 4,886.56 4,886.56
Total CO2 Equivalent Emissions without Land Use, Land-Use Change and Forestry (5) 1,350,731.21Total CO2 Equivalent Emissions with Land Use, Land-Use Change and Forestry (5) 1,352,106.10
(2) Actual emissions should be included in the national totals. If no actual emissions were reported, potential emissions should be included.(3) Parties which previously reported CO2 from soils in the Agriculture sector should note this in the NIR.(4) See footnote 8 to table Summary 1.A.
CO2 equivalent (Gg )
(1) For CO2 from Land Use, Land-use Change and Forestry the net emissions/removals are to be reported. For the purposes of reporting, the signs for removals are alwaysnegative (-) and for emissions positive (+).
(5) These totals will differ from the totals reported in table 10, sheet 5 if Parties report non-CO2 emissions from LULUCF.
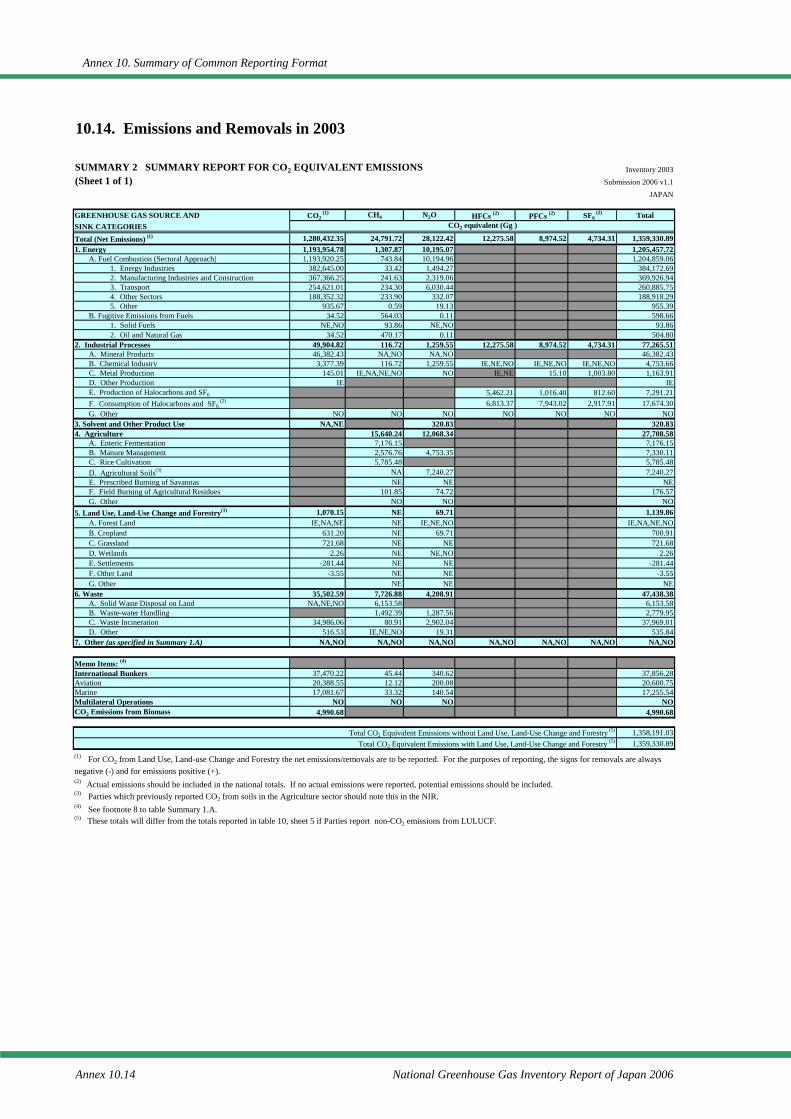
Annex 10. Summary of Common Reporting Format
Annex 10.14 National Greenhouse Gas Inventory Report of Japan 2006
10.14. Emissions and Removals in 2003
SUMMARY 2 SUMMARY REPORT FOR CO2 EQUIVALENT EMISSIONS Inventory 2003(Sheet 1 of 1) Submission 2006 v1.1
JAPAN
GREENHOUSE GAS SOURCE AND CO2 (1) CH4 N2O HFCs (2) PFCs (2) SF6
(2) Total SINK CATEGORIESTotal (Net Emissions) (1) 1,280,432.35 24,791.72 28,122.42 12,275.58 8,974.52 4,734.31 1,359,330.891. Energy 1,193,954.78 1,307.87 10,195.07 1,205,457.72
A. Fuel Combustion (Sectoral Approach) 1,193,920.25 743.84 10,194.96 1,204,859.061. Energy Industries 382,645.00 33.42 1,494.27 384,172.692. Manufacturing Industries and Construction 367,366.25 241.63 2,319.06 369,926.943. Transport 254,621.01 234.30 6,030.44 260,885.754. Other Sectors 188,352.32 233.90 332.07 188,918.295. Other 935.67 0.59 19.13 955.39
B. Fugitive Emissions from Fuels 34.52 564.03 0.11 598.661. Solid Fuels NE,NO 93.86 NE,NO 93.862. Oil and Natural Gas 34.52 470.17 0.11 504.80
2. Industrial Processes 49,904.82 116.72 1,259.55 12,275.58 8,974.52 4,734.31 77,265.51A. Mineral Products 46,382.43 NA,NO NA,NO 46,382.43B. Chemical Industry 3,377.39 116.72 1,259.55 IE,NE,NO IE,NE,NO IE,NE,NO 4,753.66C. Metal Production 145.01 IE,NA,NE,NO NO IE,NE 15.10 1,003.80 1,163.91D. Other Production IE IEE. Production of Halocarbons and SF6 5,462.21 1,016.40 812.60 7,291.21F. Consumption of Halocarbons and SF6
(2) 6,813.37 7,943.02 2,917.91 17,674.30G. Other NO NO NO NO NO NO NO
3. Solvent and Other Product Use NA,NE 320.83 320.834. Agriculture 15,640.24 12,068.34 27,708.58
A. Enteric Fermentation 7,176.15 7,176.15B. Manure Management 2,576.76 4,753.35 7,330.11C. Rice Cultivation 5,785.48 5,785.48D. Agricultural Soils(3) NA 7,240.27 7,240.27E. Prescribed Burning of Savannas NE NE NEF. Field Burning of Agricultural Residues 101.85 74.72 176.57G. Other NO NO NO
5. Land Use, Land-Use Change and Forestry(1) 1,070.15 NE 69.71 1,139.86A. Forest Land IE,NA,NE NE IE,NE,NO IE,NA,NE,NOB. Cropland 631.20 NE 69.71 700.91C. Grassland 721.68 NE NE 721.68D. Wetlands 2.26 NE NE,NO 2.26E. Settlements -281.44 NE NE -281.44F. Other Land -3.55 NE NE -3.55G. Other NE NE NE
6. Waste 35,502.59 7,726.88 4,208.91 47,438.38A. Solid Waste Disposal on Land NA,NE,NO 6,153.58 6,153.58B. Waste-water Handling 1,492.39 1,287.56 2,779.95C. Waste Incineration 34,986.06 80.91 2,902.04 37,969.01D. Other 516.53 IE,NE,NO 19.31 535.84
7. Other (as specified in Summary 1.A) NA,NO NA,NO NA,NO NA,NO NA,NO NA,NO NA,NO
Memo Items: (4)
International Bunkers 37,470.22 45.44 340.62 37,856.28Aviation 20,388.55 12.12 200.08 20,600.75Marine 17,081.67 33.32 140.54 17,255.54Multilateral Operations NO NO NO NOCO2 Emissions from Biomass 4,990.68 4,990.68
Total CO2 Equivalent Emissions without Land Use, Land-Use Change and Forestry (5) 1,358,191.03Total CO2 Equivalent Emissions with Land Use, Land-Use Change and Forestry (5) 1,359,330.89
(2) Actual emissions should be included in the national totals. If no actual emissions were reported, potential emissions should be included.(3) Parties which previously reported CO2 from soils in the Agriculture sector should note this in the NIR.(4) See footnote 8 to table Summary 1.A.
CO2 equivalent (Gg )
(1) For CO2 from Land Use, Land-use Change and Forestry the net emissions/removals are to be reported. For the purposes of reporting, the signs for removals are alwaysnegative (-) and for emissions positive (+).
(5) These totals will differ from the totals reported in table 10, sheet 5 if Parties report non-CO2 emissions from LULUCF.
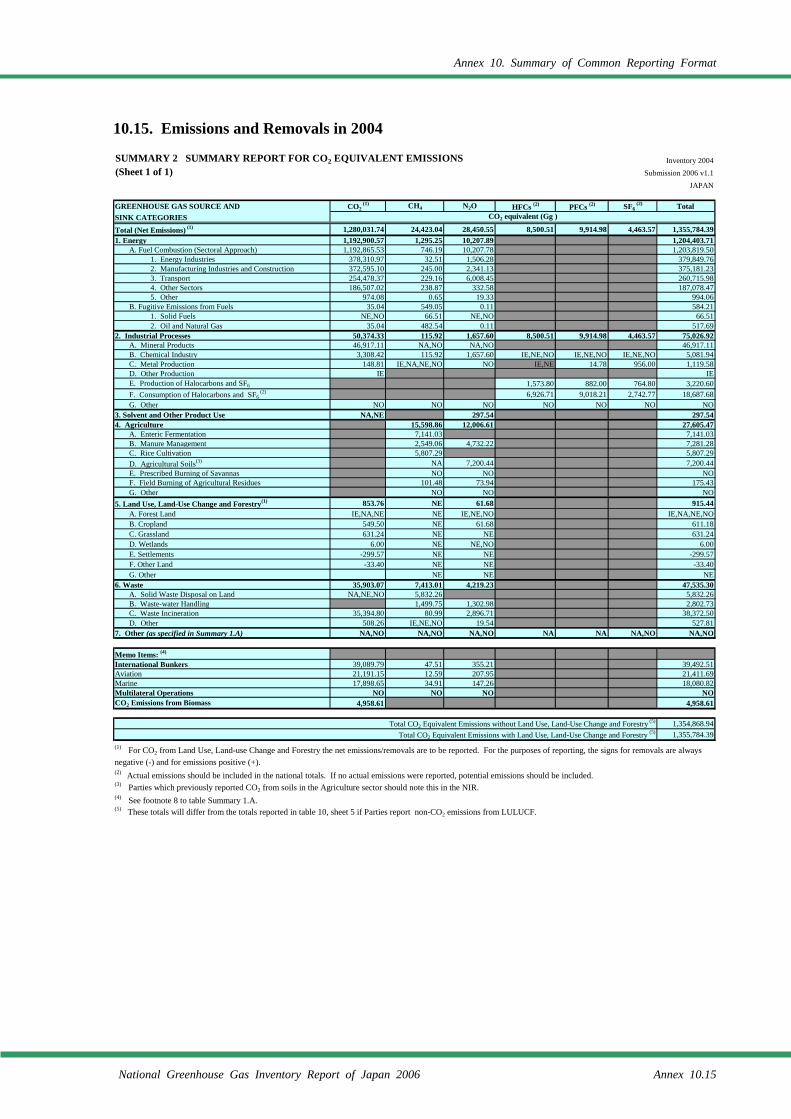
Annex 10. Summary of Common Reporting Format
National Greenhouse Gas Inventory Report of Japan 2006 Annex 10.15
10.15. Emissions and Removals in 2004
SUMMARY 2 SUMMARY REPORT FOR CO2 EQUIVALENT EMISSIONS Inventory 2004(Sheet 1 of 1) Submission 2006 v1.1
JAPAN
GREENHOUSE GAS SOURCE AND CO2 (1) CH4 N2O HFCs (2) PFCs (2) SF6
(2) Total SINK CATEGORIESTotal (Net Emissions) (1) 1,280,031.74 24,423.04 28,450.55 8,500.51 9,914.98 4,463.57 1,355,784.391. Energy 1,192,900.57 1,295.25 10,207.89 1,204,403.71
A. Fuel Combustion (Sectoral Approach) 1,192,865.53 746.19 10,207.78 1,203,819.501. Energy Industries 378,310.97 32.51 1,506.28 379,849.762. Manufacturing Industries and Construction 372,595.10 245.00 2,341.13 375,181.233. Transport 254,478.37 229.16 6,008.45 260,715.984. Other Sectors 186,507.02 238.87 332.58 187,078.475. Other 974.08 0.65 19.33 994.06
B. Fugitive Emissions from Fuels 35.04 549.05 0.11 584.211. Solid Fuels NE,NO 66.51 NE,NO 66.512. Oil and Natural Gas 35.04 482.54 0.11 517.69
2. Industrial Processes 50,374.33 115.92 1,657.60 8,500.51 9,914.98 4,463.57 75,026.92A. Mineral Products 46,917.11 NA,NO NA,NO 46,917.11B. Chemical Industry 3,308.42 115.92 1,657.60 IE,NE,NO IE,NE,NO IE,NE,NO 5,081.94C. Metal Production 148.81 IE,NA,NE,NO NO IE,NE 14.78 956.00 1,119.58D. Other Production IE IEE. Production of Halocarbons and SF6 1,573.80 882.00 764.80 3,220.60F. Consumption of Halocarbons and SF6
(2) 6,926.71 9,018.21 2,742.77 18,687.68G. Other NO NO NO NO NO NO NO
3. Solvent and Other Product Use NA,NE 297.54 297.544. Agriculture 15,598.86 12,006.61 27,605.47
A. Enteric Fermentation 7,141.03 7,141.03B. Manure Management 2,549.06 4,732.22 7,281.28C. Rice Cultivation 5,807.29 5,807.29D. Agricultural Soils(3) NA 7,200.44 7,200.44E. Prescribed Burning of Savannas NO NO NOF. Field Burning of Agricultural Residues 101.48 73.94 175.43G. Other NO NO NO
5. Land Use, Land-Use Change and Forestry(1) 853.76 NE 61.68 915.44A. Forest Land IE,NA,NE NE IE,NE,NO IE,NA,NE,NOB. Cropland 549.50 NE 61.68 611.18C. Grassland 631.24 NE NE 631.24D. Wetlands 6.00 NE NE,NO 6.00E. Settlements -299.57 NE NE -299.57F. Other Land -33.40 NE NE -33.40G. Other NE NE NE
6. Waste 35,903.07 7,413.01 4,219.23 47,535.30A. Solid Waste Disposal on Land NA,NE,NO 5,832.26 5,832.26B. Waste-water Handling 1,499.75 1,302.98 2,802.73C. Waste Incineration 35,394.80 80.99 2,896.71 38,372.50D. Other 508.26 IE,NE,NO 19.54 527.81
7. Other (as specified in Summary 1.A) NA,NO NA,NO NA,NO NA NA NA,NO NA,NO
Memo Items: (4)
International Bunkers 39,089.79 47.51 355.21 39,492.51Aviation 21,191.15 12.59 207.95 21,411.69Marine 17,898.65 34.91 147.26 18,080.82Multilateral Operations NO NO NO NOCO2 Emissions from Biomass 4,958.61 4,958.61
Total CO2 Equivalent Emissions without Land Use, Land-Use Change and Forestry (5) 1,354,868.94Total CO2 Equivalent Emissions with Land Use, Land-Use Change and Forestry (5) 1,355,784.39
(2) Actual emissions should be included in the national totals. If no actual emissions were reported, potential emissions should be included.(3) Parties which previously reported CO2 from soils in the Agriculture sector should note this in the NIR.(4) See footnote 8 to table Summary 1.A.
CO2 equivalent (Gg )
(1) For CO2 from Land Use, Land-use Change and Forestry the net emissions/removals are to be reported. For the purposes of reporting, the signs for removals are alwaysnegative (-) and for emissions positive (+).
(5) These totals will differ from the totals reported in table 10, sheet 5 if Parties report non-CO2 emissions from LULUCF.
Annex 10. Summary of Common Reporting Format
Annex 10.16 National Greenhouse Gas Inventory Report of Japan 2006