
Table 8. Analyses ofComStover. - University of … 8. Analyses ofComStover. Treatment N 2 K ......
48
104 Table 8. Analyses of Com Stover. Treatment N 2 K Ca Mg Mn 2q B 1 1.2 .17 1.2 .20 .14 34 25 6.2 2 1.1 .16 1.2 .21 .13 33 20 5.4 3 1.2 .19 1.2 .19 .15 31 20 5.2 5 1.2 .18 1.3 .21 .15 36 21 6.6 Table 9. Soybean Leaf Analyses at Initiation of Blossom. Treatment S P K Ca _te Mn Si B - ppm 4 .36 .46 2.7 1.1 .42 .01 68 54 6 .35 .46 2.8 1.0 .42 .01 56 52 Table 10. Soybean Stan Nutrient Analyses, 1986 Treatment S P K Ca Mg Mn Sj B ppm - 4 .16 .38 5.5 1.3 .47 53 34 42 6 .13 .39 5.5 1.2 .48 50 28 42 Table 11. Soybean Seed Nutrient Analyses, 1986 Treatment S P K ... Sk ..... C§ Mg Mn ZQ Cu B ppm - 4 .42 .69 2.2 .14 .27 27 34 8.5 42 6 .41 .69 2.2 .14 .27 30 54 8.2 34
Transcript of Table 8. Analyses ofComStover. - University of … 8. Analyses ofComStover. Treatment N 2 K ......
104
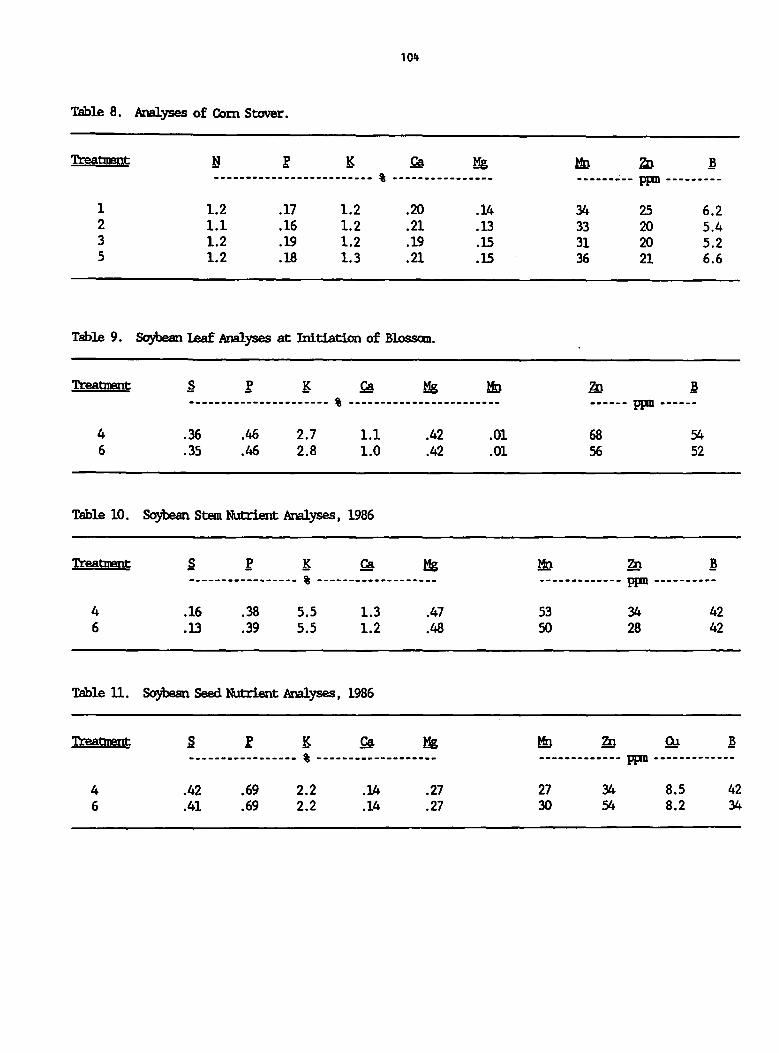
Table 8. Analyses of Com Stover.
Treatment N 2 K Ca Mg Mn 2q B
1 1.2 .17 1.2 .20 .14 34 25 6.22 1.1 .16 1.2 .21 .13 33 20 5.43 1.2 .19 1.2 .19 .15 31 20 5.25 1.2 .18 1.3 .21 .15 36 21 6.6
Table 9. Soybean Leaf Analyses at Initiation of Blossom.
Treatment S P K Ca _te Mn Si B
- ppm
4 .36 .46 2.7 1.1 .42 .01 68 54
6 .35 .46 2.8 1.0 .42 .01 56 52
Table 10. Soybean Stan Nutrient Analyses, 1986
Treatment S P K Ca Mg Mn Sj B
ppm -
4 .16 .38 5.5 1.3 .47 53 34 42
6 .13 .39 5.5 1.2 .48 50 28 42
Table 11. Soybean Seed Nutrient Analyses, 1986
Treatment S P K
... Sk .....
C§ Mg Mn ZQ Cu B
ppm -
4 .42 .69 2.2 .14 .27 27 34 8.5 42
6 .41 .69 2.2 .14 .27 30 54 8.2 34

105
Table 12. Soybean Seed Nutrient Removal, lb/A, 1986
Treatment S P K Ca Mg- lb/A —
Mn £> <_J B
4 12.4 20 64 4.0 7.8 .08 .17 .02 .10
6 13.1 22 69 4.3 8.5 .10 .17 .03 .11
Table 13. Yield of Soybeans, bu/A Summary.
1982
47.0
1983
47.0
1 1st year soybean following com^2nd year soybean following com
1984
37.6
1985
36.4
1986
49.21
1986
53.02

106
LUPIN BEAN STUDY
H.L. Meredith and M. Wiens1
Lupinus alba (white lupin) studies were initiated at the Staples Station in 1984 and these studiescontinue. Lupins grow best on well drained, slightly acidic soils. The plant is cold tolerant therebyallowing seeding with the earliest spring planted crops. Lupins have the potential for high yields; theyare highly palatable and are high in protein.
Yields from studies conducted to date appear in Table 1.
Table 1. Ultra Lupin Yields at the Staples Station, Staples, Minnesota, 1984-86. Yields are based on13.5 Moisture Basis and Bushel Weight of 60 lbs.
Yield. bu/A
Treatment 19842 19853 19863Exp. #1 Exd. #2
1. No fertilizer 39.1 71.4 40.6 32.0
2. 100# 8-32-16 4 39.4 64.1 41.8 37.4 53. 25# sulfur 43.2 71.2 44.0 31.7
4. 30O#K2O 40.5 63.8 40.6 43.3
5. PKS + 60# P2O5 39.4 68.8 39.2 40.2
6. PKS + 60*rN6 41.5 64.9 33.8 32.8
Avg. 40.5 67.4 40.0 36.0
No significant difference in yield as a result of any fertility treatments was observed. Yielddifferences were attributed to population variables and weed competition, especially in 1986.
Experiment #1 is continuous lupins while Experiment #2 is rotated with a cereal crop. Long term studiesare designed to determine if diseases are intensified in the continuous plot.
A Review of the 1986 Growing Season:
Lupin yields were quite disappointing in 1986 for more than one reason. We feel that we understand mostof the reasons.
The fall of 1985 was considered a poor environment for development and growth of seed quality. The cool
1 A special thanks for the assistance and interest shown by Dr. George Rehra,Brian Anderson, and Greg Cramers.
2 30-inch row spacing
3 6-inch grain drill
4 Changed to 160 # N split application in 1985, no fertilizer in 1986
5 Boron + SKPZn
6 N deleted in 1986, 10 lb. zinc (Zn) added.

107
(cold) wet weather prevented maturation. Normally harvest is acccnplished in late August-early September.In 1985 harvest could not be initiated prior to a hard freeze in mid to late October. Even then lupinscontained excessive moisture in many cases. We believe "poor" seed quality resulted even thoughgermination testing at room temperature (90%) indicated good, viable seed. However, given the soilenvironment in mid April when lupins should be planted, a germination temperature more in line with soiltemperatures would be more meaningful, such as 50-60°F.
Soil preparation: Sandy soils become quite "fluffy" when spring plowed. Grain drills have tension ondisks to push downward only and seed depth is not uniform. The result is excessively deep seed placement.Especially where seed viability was suspect, deep placed seed likely resulted in poor populations. Webelieve this accounted for the poor stands experienced in 1986.
Weed competition: Lupins are poor competitors with weeds. Especially where lupin populations were low,late germinating weeds were rampant. Ragweeds and wild buckwheat were perhaps the most troublesome weeds.The year was also one of high rainfall and the excessive moisture likely played a heavy role in thepremature dissipation of herbicides in the profile permitting a heavy infestation of weeds.
Flowarinp temperatures: Seed set occurred for the most part from the primary flowers and only partiallyfrom the secondary flowers. High temperatures during this stage prevented pod set thereby limiting yield.
Plans for 1987 to offset potential problems: Soils where lupins are to be planted will not be plowed inthe spring. Soils will receive a double disking and smoothed prior to planting.
A cold temperature (50-60°F) germination test will be administered prior to planting to test seedviability. The seed quality in 1986 should be excellent owing to the near ideal weather at maturation.
Experimental plots will be seeded at a heavy rate (200 lb/A or more) to ensure uniform population. Longseason herbicides are essential. To date Lasso, Dual, Prowl, and Lorox have been used on lupins withsuccess.
Fertility response: Poor stands, severe weed competition, and high temperatures during flowering put alid on yields. Yields of this nagnitude harvested in 1986 represent less than half the potential yieldfor this crop. The lupin plant is a vigorous forager of plant nutrients. To date, no yield increaseshave been attributed to any fertilizer nutrient. Only whenhigh yields are harvested from uniformpopulations free of weed competition will a nutrient response be more likely to occur.
Although yields varied from one fertilizer treatment to another, this should not be attributed to afertility response. Population variability and weed competition likely accounted for all of the variablesin yield observed.
Sulfur: Note that the sulfur concentration in the lupin bean increased rather dramatically with theaddition of 25 pounds of sulfur (S) per acre. The three sulfur containing amino acids, methionine,cysteine and cystine, require adequate sulfur be available in the soil medium. From a nutritional aspect,methionine becomes the first limiting amino acid in rations containing a high proportion of lupins orsoybean meal. Therefore, it is essential, that sufficient sulfur be present throughout the growth of theplant, but especially during the formation of the bean. It is of interest to note that one-sixth of themethionine requirement maybe replaced with cystine in studies with rats. It is likely all three aminoacids are enhanced in the presence of sufficient sulfur. Casein is a standard for nethionine. Soybeanmeal requires the addition of 0.1% supplementation with methionine, whereas lupins would require 0.3%addition of methionine to make it equivalent to casein.

108
Sequence of Events in 1986
4/8 - Area plowed4/16 - Area disked and fertilizer applied4/16 - Lupins planted @190 lb/A, variety ultra4/22 - Lasso applied @3 pt/A5/3 - Lupin emerging5/28 - Leaf and petiole sampling6/4 - Flowering begins, plants 6-10 inches tall6/23 - Pod set begins7/3 - Second leaf and petiole sampling7/21 - Third leaf and petiole sampling7/31 - First leaf drop8/16 - Plants 21-25 inches, flowering8/19 - 90% of pods are brown, readily shatter on contact9/5 - Harvest (could have harvested earlier as beans were at or below 14% and shattered easily)
4/15 - 8/15 Rainfall - 17.8; supplemental irrigation - 2.8"
Weeds: Wild buckwheat, ragweed and lanbsquarters.
Moisture Requirements: The lupin plant is very practical in regards to soil moisture. At flowering theplant reads the soil moisture status. If it is dry or inadequate moisture is available the plant willdeliver a low pod set. Likewise, moisture stress along with temperature and/or wind stress or anycombinations which trigger a perceived moisture stress will result in low pod set. Where irrigation isavailable it is imperative that the moisture status be monitored at least on a daily basis. Slightlyexcessive moisture at this stage would be in preference to any moisture stress.
In 1986 the primary pod set was excellent but the secondary pod set was essentially absent. Note thatyields were decreased about 40% over the previous year. Other factors along with moisture and temperaturewere responsible for the low yields. But, it should be duly noted that there was little to no pod setbeyond the primary stage. Ideally, a heavy primary and secondary pod set is desired. Solid stands arethe best bet for ensuring that pod set occurs predominately from the primary and secondary flowering.
Excessively high temperatures are known to cause abortion/poor pod set. Generally temperatures beyond85°F would be detrimental at flowering.
Discussion: It is noted that 2.8" of irrigation water was supplied. Table 8 lists 32 days when themaxlmm temperature reached 80°F or above, 17 days were 85°F or above and four days were 90°F or above.
The period May 27-31 was critical as flowering was initiated on June 4. During this five-day period noprecipitation was recorded, pan evaporation was 1.85 inches of water and the relative humidity ranged from32-37 percent, temperature maximum averaged 86.4°F. Truly a stressful period. Supplemental irrigationat this stage would be absolutely essential. When temperatures reach 85°F it would be advantages tosprinkle irrigate to cool the canopy and provide moisture for evaporation to aid in the cooling process(539 calories of heat required to vaporize one gram of water).
109
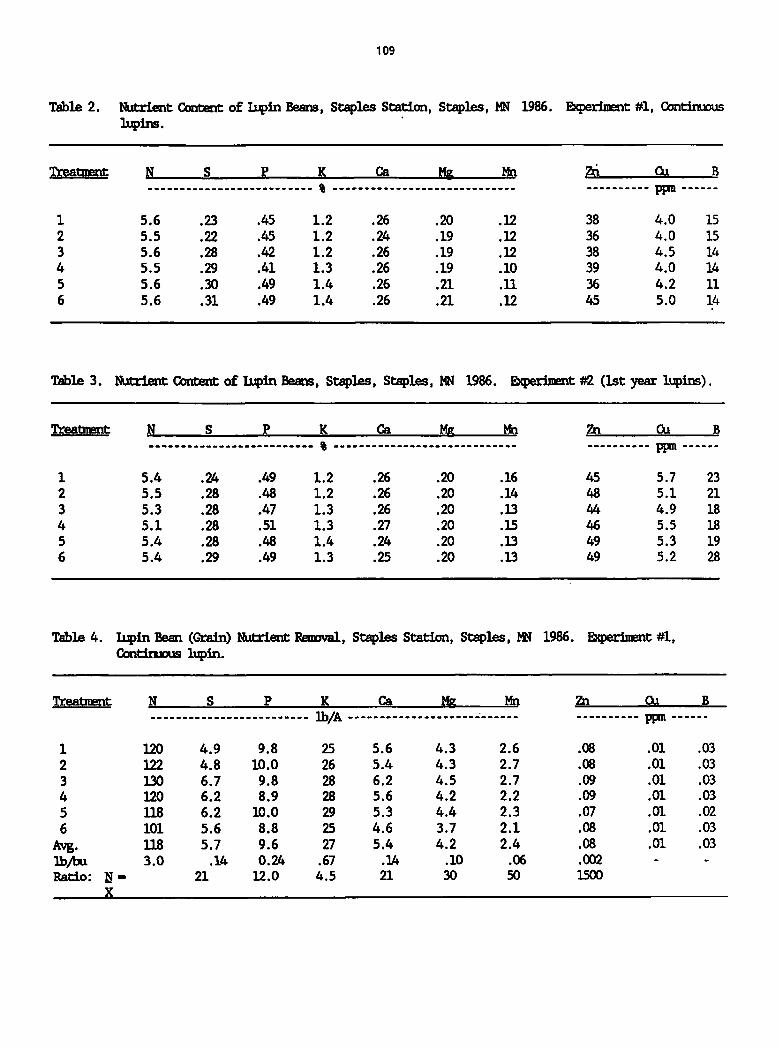
Table 2. Nutrient Content of Lupin Beans, Staples Station, Staples, MN 1986. Experiment #1, Continuouslupins.
Treatment N S P K Ca Me Mn Zn Cu B
... % .... ppm -•
1 5.6 .23 .45 1.2 .26 .20 .12 38 4.0 15
2 5.5 .22 .45 1.2 .24 .19 .12 36 4.0 15
3 5.6 .28 .42 1.2 .26 .19 .12 38 4.5 14
4 5.5 .29 .41 1.3 .26 .19 .10 39 4.0 14
5 5.6 .30 .49 1.4 .26 .21 .11 36 4.2 11
6 5.6 .31 .49 1.4 .26 .21 .12 45 5.0 14
Table 3. Nutrient Content of Lupin Beans, Staples, Staples, MN 1986. Experiment #2 (1st year lupins).
Treatment N S P K Ca Me Mn Zn Cu B
... ft ... ppm -
1 5.4 .24 .49 1.2 .26 .20 .16 45 5.7 23
2 5.5 .28 .48 1.2 .26 .20 .14 48 5.1 21
3 5.3 .28 .47 1.3 .26 .20 .13 44 4.9 18
4 5.1 .28 .51 1.3 .27 .20 .15 46 5.5 18
5 5.4 .28 .48 1.4 .24 .20 .13 49 5.3 19
6 5.4 .29 .49 1.3 .25 .20 .13 49 5.2 28
Table 4. Lupin Bean (Grain) Nutrient Removal, Staples Station, Staples, MN 1986. Experiment #1,Continuous lupin.
Treatment N S P K Ca Me Mn Zn Cu B
-- lb/A •-- ppm —
1 120 4.9 9.8 25 5.6 4.3 2.6 .08 .01 .03
2 122 4.8 10.0 26 5.4 4.3 2.7 .08 .01 .03
3 130 6.7 9.8 28 6.2 4.5 2.7 .09 .01 .03
4 120 6.2 8.9 28 5.6 4.2 2.2 .09 .01 .03
5 118 6.2 10.0 29 5.3 4.4 2.3 .07 .01 .02
6 101 5.6 8.8 25 4.6 3.7 2.1 .08 .01 .03
Avg. 118 5.7 9.6 27 5.4 4.2 2.4 .08 .01 .03
lb/bu 3.0 .14 0.24 .67 .14 .10 .06 .002 - -
Ratio: N - 21 12.0 4.5 21 30 50 1500
X

110
Table 5. Lupin Bean (Grain) Nutrient Removal, Staples Station, Staples, MN 1986. Experiment #2 (1styear lupins).
Treatmesnt N S P K Ca Me Itfo Zh • Cu B
•-- ppm --
1 91 4.0 8.2 20 4.4 3.3 2.6 .08 .01 .04
2 93 4.8 8.0 20 4.4 3.4 2.4 .08 .01 .04
3 123 6.5 11 30 6.0 4.6 3.1 .10 .01 .04
4 108 6.1 11 28 5.8 4.3 3.1 .10 .01 .04
5 94 5.0 8.3 23 4.3 3.5 2.3 .08 .01 .03
6 105 5.6 10 26 5.0 3.9 2.6 .10 .01 .05
Avg. 102 5.3 9.4 29 5.0 3.8 2.7 .09 .01 .04"
lb/bu 2.8 .15 0.26 .8 .15 .10 .07 .002 - -
Ratio:
X
19 11 3.5 19 28 40 1400
Table 6. Soil Test Data, Staples Station, Staples, MN 1986. Experiment #1, Continuous Lupins.
First Second Sampling
Soil Organic Soil Bray P K Soil Bray P KTreatment Texture Matter J_L 3VA lb/A Jfl- lb/A lb/A
1 SL M 7.0 79 123 6.9 70 129
2 SL M 7.1 87 128 7.1 70 111
3 SL M 6.9 82 110 7.0 83 128
4 SL M 7.1 73 288 7.2 68 192
5 SL M 7.1 111 330 7.1 96 289
6 SL M 6.8 109 249 6.7 97 218
Table 7. Soil Test Data, Staples Station, Staples, MN 1986. Experiment #2, Continuous Lupins.
First Second Sampling
Soil Organic Soil Bray P K Soil Bray P KTreatment Texture Matter _r_L lb/A lb/A _nH_ lb/A lb/A
1 SL M 6.4 72 132 6.8 69 98
2 SL M 7.0 71 89 69 65 87
3 SL M 6.9 90 149 6.8 90 139
4 SL M 6.3 98 154 6.3 95 162
5 SL M 6.7 70 171 6.8 81 160
6 SL M 6.5 80 177 6.5 76 125

111
Table 8. Maximum Air Temperature (above 80°F), Pan Evaporation, Precipitation, Relative Humidity, WindSpeed and Leaf wetness, Staples Station, Staples, MN 1986.
Max. Air Temp. °FPan Evaporation Water, inches/dayPrecipitation, inches/dayRelative Humidity, Minimum %Wind Speed, mean, miles/hrLeaf Wetness
0 - dry100 - wet
%of day wet
Max. Air Temp. °FPan Evaporation Water, inches/dayPrecipitation, inches/dayRelative Humidity, Minimum %Wind Speed, Mean, miles/hrLeaf wetness
0 - dry100 - wet
%of day wet
22 28
May
29 30 31
82 82 89 89 90
.29 .27 .17 .57 55
0 0 0 0 0
37 37 33 32 34
2.6 3.2 1.3 5.8 10.4
30 35 28
June
2 0
3 18 23 2Q 21 25 26 2Z 28
91 85 91 83 88 89 86 80 81
.25 .21 .26 .30 .38 .28 .18 .34 .26
.23 .02 0 0 1.06 0 0 0 0
37 66 ,59 75 66 56 65 32 43
9.5 7.4 3.9 8.1 3.9 8.6 8.4 5.6 4.2
20 40 13 4 64 0 4 27 9
3 ^ 5 2 S 15 I_
Max. Air Tanp. °F 83 91 85 85 83 80 84
Pan Evaporation .38 .27 .27 .31 .25 .14 .26Water, inches/day
Precipitation, .63 .11 0 0 0 .64 0inches/day
Relative ftaddity, 46 55 62 38 46 70 79Minimum %
Wind Speed, mean, 8.9 5.8 10.8 3.5 2.3 4.5 6.5miles/hr
July
!Zl_iS22232&2_2Z2_2i3g
88 87 81 86 86 85 81 84 81 84 81
.13 .37 .37 .24 .51 .02 .20 .24 .20 .24 .31
0 .99 0 0 .15 .01 0 0 .47 .06 0
68 62 52 52 66 51 40 59 72 62 45
5.8 4.4 7.8 4.3 11.4 5.2 3.5 3.8 3.4 5.4 7.0
Leaf wetness
0 - dry100 - wet
% of day wet
29 3651544 59 424450 32 28 2 27 4050543621

Table 9. Leaf and Petiole Samples of Lupinssampled on 5/28. Staples (sampledfrom Exp. #1).
112
Table 10. Leaf and Petiole Samples of Lupins sampled5/28/86, Staples (sampled from Exp. #2).
Treatment PKCaMgMnZnCuB% .. ppn —
Treatment P K Ca Mg Mn Zn Cu B
ppm
1 .32 2.8 .89 .21 .11 13 2.4 9.5 1 .29 2.8 .99 .21 .11 12 2.2 11
6 .29 1.7 1.18 .26 .11 15 2.8 12 2 .33 1.7 1.1 .31 .12 14 2.7 13
3 .31 2.0 1.1 .27 .12 14 2.4 12
4 .34 1.9 1.2 .26 .11 18 2.9 14
5 .36 3.1 .99 .22 .11 16 2.4 11
6 .30 2.9 .97 .27 .13 14 2.6 10
Table 11. Leaf Samples of Lupins sampled Table 12. Lupin Plant Samples, Top Four Inches When5/28/86, Staples (sampled from Plant Eight Inches Tall. 5/28, StaplesExp. #2) Plants Eight Inches Tall.
Treatment PKCaMgMnZnCuB% ppm --
Treatment P K Ca Mg Mn Zn Cu B
ppm
1 .33 1.6 1.15 .31 .12 20 3.1 27 1 .37 2.4 .85 .27 .11 26 2.7 24
2 .34 1.4 1.36 .37 .12 21 2.9 16 2 .35 1.8 1.08 .33 .11 32 2.9 18
3 .38 2.0 1.02 .20 .09 19 2.9 18 3 .38 2.5 .96 .19 .09 30 3.1 20
4 .40 1.7 1.12 .22 .10 22 2.9 21 4 .44 2.4 .93 .22 .10 30 2.9 18
5 .34 2.0 .96 .24 .11 21 3.0 25 5 .39 3.1 .82 .23 .11 26 3.3 20
6 .37 2.0 1.09 .19 .10 20 3.1 16 6 .44 2.1 .93 .19 .11 26 3.3 20

113
TRITICALE - RYE STUDY
H. Meredith and M. Weins
Triticale is a synthetic grain derived from durum wheat x rye. Although the crop has been around forsometime, only recently has the crop received new emphasis.
New varieties have been released and this study is intended to evaluate these varieties. Three newwintervarieties were planted in the fall of 1986 and one new spring variety will be planted in 1987.Additionally a new rye variety was planted in the fall of 1986 and this variety will be evaluated againstthe triticale varieties.
The data below lists limited data on the varieties harvested in 1986 at the Staples Station, Staples, MN.
Table 1. Composition of Whole Plant Harvested on 5/28/86 Just Prior to Heading.
Varietv N S P K Ca Me Mn Zn Cu B
% ppm
Rymin Rye 2.2 .17 .30 2.7 .33 .16 47 28 2.2 3.8
Triticale 1-18 2.4 .18 .35 3.3 .38 .13 73 30 2.1 3.0
Triticale 239 2.3 .20 .37 3.5 .36 .14 80 34 2.4 3.4
T-Double Crop 2.2 .19 .35 3.4 .40 .14 80 35 2.4 3.1
Table 2. Flag Leaf Harvested on 5/28/86 Just Prior to Heading.
Varietv P K Ca Me Mn Zn Cu B"
.27
.33
.34
.40
% -
1.6
2.3
2.3
2.4
• ppm •
Rymin RyeTriticale. 1-18
Triticale 239
T-Double Crop.29
.23
.23
.15
.14
.14
55
61
52
46
19
29
34
43
2.4
2.2
2.5
3.0
4.8
6.5
5.2
Table 3. Composition of Whole Plant at Forage Harvest.
Varietv N S p K Ca Me Mn Zn Cu B
ppm
Rymin Rye 1.2 .10 .22 2.0 .24 .13 25 14 5 4
Triticale 1-18 1.5 .10 .22 2.2 .25 .12 40 24 5 4
Triticale 239 1.4 .10 .23 2.3 .21 .12 37 26 6 4
T-Double Crop 1.5 .10 .25 2.5 .26 .12 42 36 6 5

11-r
Table 4. Yield of Rye and Triticale, Grain and Forage.
Varietv Bu/A
Ryadn Rye 53.81
Triticale 1-18 59.32
Triticale 239 39.22
Triticale Double Crop 30.I1Spring Triticale 34.22
1 Average of 2 replications2 Average of 3 replications
Table 5. Composition of Triticale and Rye Grain
Varietv JL
Tons/A (EM)
3.22
2.72
2.91
2.87
K -C_L _Mg_
Ryadn Rye 2.1 .16 .46 .58 .53 .17
Triticale 1-18 2.0 .16 .46 .60 .60 .18
Triticale 239 2.3 .17 .48 .62 .62 .19
T-Double Crop 2.4 .17 .47 .62 .64 .18
Spring Triticale 2.5 .18 .55 .68 .62 .21
Table 6. ConpositLon of Triticale and Rye Straw After Harvest.
Mn Zn Cu
52
w
51 1.3 1.2
63 52 1.7 1.2
63 59 1.8 1.1
69 63 1.9 1.2
70 63 1.5 1.6
Varietv N S P K Ca Me Mn Zn Cu B
ppm
Rymin Rye .33 .08 .07 1.2 .21 .04 42 14 1.1 1.6
Triticale 1-18 .67 .09 .10 1.0 .23 .06 30 16 1.6 1.7
Triticale 239 .43 .08 .10 1.2 .20 .06 44 16 1.2 1.9
T-Double Crop .61 .09 .15 1.4 .24 .07 45 23 1.3 1.8
T-Spring .35 .08 .10 1.4 .18 .04 39 10 1.3 1.4

115
SOUTHERN EXPERIMENT STATION
WASECA, MINNESOTA
WEATHER DATA - 1986
Month Period
Precipitation .,
1986 Normal17Avg.
1986
Air Temp. . ,Normal1'
Growing Degi
1986
cee Days.
Normal17
inches _ «F
January 1-31 0.89 0.84 14.5 10.0
February 1-28 0.52 0.99 13.4 16.4
March 1-31 2.18 1.99 31.4 27.6
April 1-30 4.13 2.64 48.4 44.7
May 1-10
11-20
21-31
Total
0.95
2.04
0.77
3.76 3.76
56.4
56.4
62.2
58.4 57.7
97.5
84.5
145.5
327.5 334
June 1-10
11-20
20-30
Total
0.91
1.77
5.21
7.89 4.48
66.5
68.8
70.9
68.7 67.1
165.0
186.5
204.0
555.5 518
July 1-10
11-20
21-31
Total
1.51
1.87
0.52
3.90 4.02
69.8
72.9
72.9
71.9 71.2
196.0
222.5
251.5
670.0 641
August 1-10
11-20
21-31
Total
0.11
0.40
1.90
2.41 3.99
67.2
66.6
61.2
64.9 68.8
173.5
170.0
136.5
480.0 579
September 1-30 5.57 3.36 59.8 59.8 340.5 311
October 1-31 2.83 2.08 48.3 48.9 37.0 38
November 1-30 1.42 1.43 25.6 32.5
December 1-31 0.35 1.02 21.6 18.0
Year Jan-Dec 35.85 30.60 44.1 43.6 2410.& 2421
GrowingSeason Hay-Sep 23.53 19.61 64.7 64.9 2373.5 2383
j. 30-year normal from 1951 - 1980.U 50 to 86°F base, May 1 until first fall frost.Notes:
1) Highest temperature on June 20 and July 19 —2) Highest 24-hour precipitation on June 21 — 2,3) Highest 48-hour precipitation on June 21-22 —4) Last spring frost — April 22.5) First fall frost — October 6.
92°.46".
• 4.64".
116
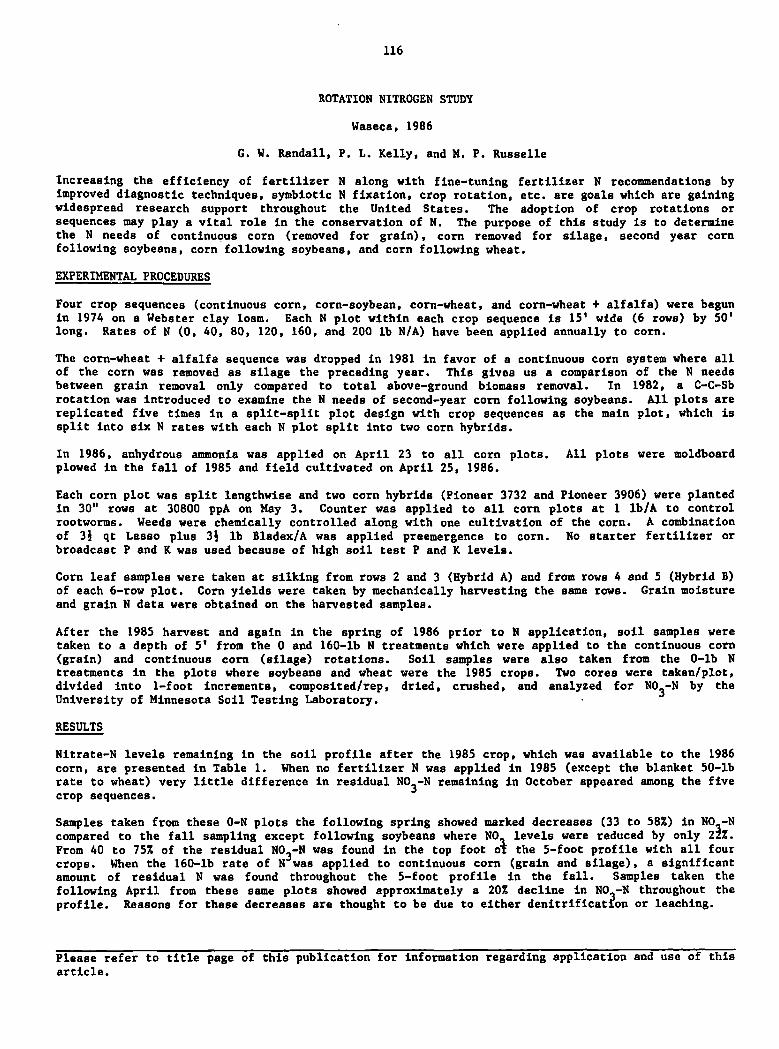
ROTATION NITROGEN STUDY
Waseca, 1986
G. W. Randall, P. L. Kelly, and M. P. Russelle
Increasing the efficiency of fertilizer N along with fine-tuning fertilizer N recommendations byimproved diagnostic techniques, symbiotic N fixation, crop rotation, etc. are goals which are gainingwidespread research support throughout the United States. The adoption of crop rotations orsequences may play a vital role in the conservation of N. The purpose of this study is to determinethe N needs of continuous corn (removed for grain), corn removed for silage, second year cornfollowing soybeans, corn following soybeans, and corn following wheat.
EXPERIMENTAL PROCEDURES
Four crop sequences (continuous corn, corn-soybean, corn-wheat, and corn-wheat + alfalfa) were begunin 1974 on a Webster clay loam. Each N plot within each crop sequence is 15' wide (6 rows) by 50'long. Rates of N (0, 40, 80, 120, 160, and 200 lb N/A) have been applied annually to corn.
The corn-wheat + alfalfa sequence was dropped in 1981 in favor of a continuous corn system where allof the corn was removed as silage the preceding year. This gives us a comparison of the N needsbetween grain removal only compared to total above-ground biomass removal. In 1982, a C-C-Sbrotation was introduced to examine the N needs of second-year corn following soybeans. All plots arereplicated five times in a split-split plot design with crop sequences as the main plot, which issplit into six N rates with each N plot split into two corn hybrids.
In 1986, anhydrous ammonia was applied on April 23 to all corn plots. All plots were moldboardplowed in the fall of 1985 and field cultivated on April 25, 1986.
Each corn plot was split lengthwise and two corn hybrids (Pioneer 3732 and Pioneer 3906) were plantedin 30" rows at 30800 ppA on May 3. Counter was applied to all corn plots at 1 lb/A to controlrootworms. Weeds were chemically controlled along with one cultivation of the corn. A combinationof 3) qt Lasso plus 3} lb Bladex/A was applied preemergence to corn. No starter fertilizer orbroadcast P and K was used because of high soil test P and K levels.
Corn leaf samples were taken at silking from rows 2 and 3 (Hybrid A) and from rows 4 and 5 (Hybrid B)of each 6-row plot. Corn yields were taken by mechanically harvesting the same rows. Grain moistureand grain N data were obtained on the harvested samples.
After the 1985 harvest and again in the spring of 1986 prior to N application, soil samples weretaken to a depth of 5* from the 0 and 160-lb N treatments which were applied to the continuous corn(grain) and continuous corn (silage) rotations. Soil samples were also taken from the 0-lb Ntreatments in the plots where soybeans and wheat were the 1985 crops. Two cores were taken/plot,divided into 1-foot increments, composited/rep, dried, crushed, and analyzed for N0.-N by theUniversity of Minnesota Soil Testing Laboratory.
RESULTS
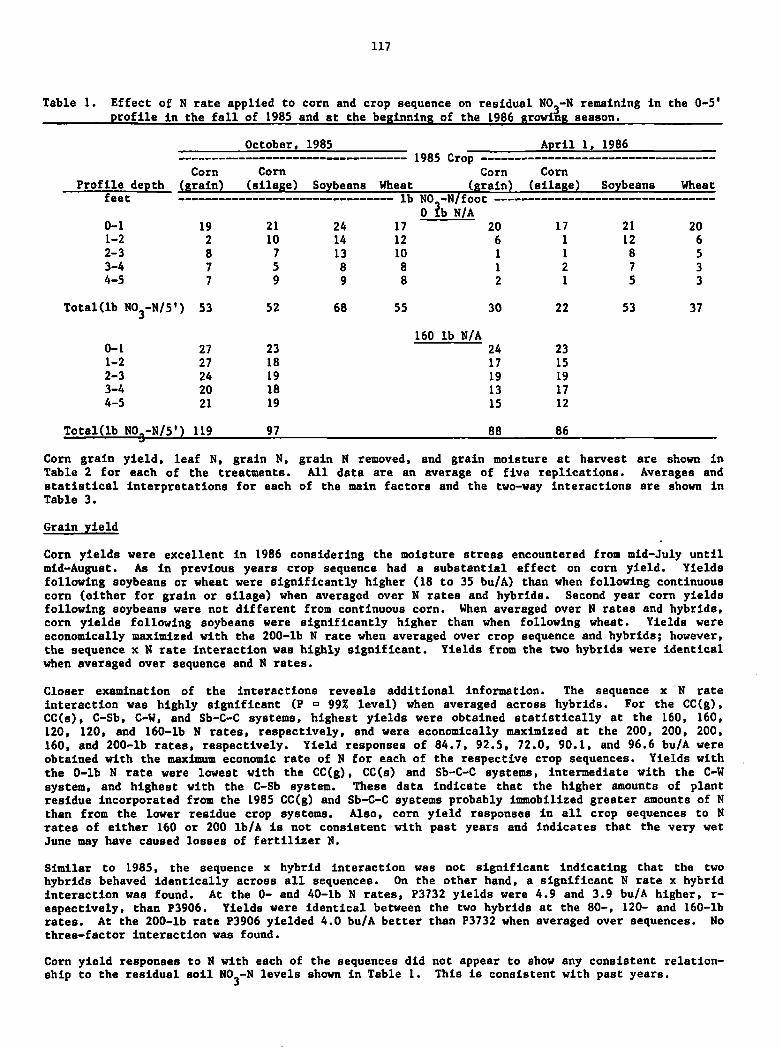
Nitrate-N levels remaining in the soil profile after the 1985 crop, which was available to the 1986corn, are presented in Table 1. When no fertilizer N was applied in 1985 (except the blanket 50-lbrate to wheat) very little difference in residual NO -N remaining in October appeared among the fivecrop sequences.
Samples taken from these 0-N plots the following spring showed marked decreases (33 to 58%) in NO -Ncompared to the fall sampling except following soybeans where NO. levels were reduced by only 22%.From 40 to 75% of the residual N0,-N was found in the top foot ot the 5-foot profile with all fourcrops. When the 160-lb rate of N was applied to continuous corn (grain and silage), a significantamount of residual N was found throughout the 5-foot profile In the fall. Samples taken thefollowing April from these same plots showed approximately a 20% decline in NO.-N throughout theprofile. Reasons for these decreases are thought to be due to either denitrification or leaching.
Please refer to title page of this publication for information regarding application and use of thisarticle.
117
Table 1. Effect of N rate applied to corn and crop sequence on residual NO.-N remaining in the 0-5'profile in the fall of 1985 and at the beginning of the 1986 growing season.
Profile depth
feet
Corn
(grain)
0-1 191-2 2
2-3 8
3-4 74-5 7
Total(lb NO -N/5') 53
0-1 27
1-2 27
2-3 24
3-4 20
4-5 21
TotaKlb NO -N/5') 119
October, 1985
- 1985 CropCorn
(grain)
Corn
(silage) Soybeans Wheat
lb NO -N/foot0 lb N/A
17
12
10
8
8
21
10
7
5
9
52
23
18
19
18
19
97
24
14
13
8
9
68 55
20
6
1
1
2
30
160 lb N/A24
17
19
13
15
88
April 1, 1986
Corn
(silage)
17
1
1
2
1
22
23
15
19
17
12
86
Soybeans Wheat
21
12
8
7
5
53
20
6
5
3
3
37
Corn grain yield, leaf N, grain N, grain N removed, and grain moisture at harvest are shown inTable 2 for each of the treatments. All data are an average of five replications. Averages andstatistical interpretations for each of the main factors and the two-way interactions are shown inTable 3.
Grain yield
Corn yields were excellent in 1986 considering the moisture stress encountered from mid-July untilmid-August. As in previous years crop sequence had a substantial effect on corn yield. Yieldsfollowing soybeans or wheat were significantly higher (18 to 35 bu/A) than when following continuouscorn (either for grain or silage) when averaged over N rates and hybrids. Second year corn yieldsfollowing soybeans were not different from continuous corn. When averaged over N rates and hybrids,corn yields following soybeans were significantly higher than when following wheat. Yields wereeconomically maximized with the 200-lb N rate when averaged over crop sequence and hybrids; however,the sequence x N rate interaction was highly significant. Yields from the two hybrids were identicalwhen averaged over sequence and N rates.
Closer examination of the interactions reveals additional Information. The sequence x N rateinteraction was highly significant (P = 99% level) when averaged across hybrids. For the CC(g),CC(s), C-Sb, C-W, and Sb-C-C systems, highest yields were obtained statistically at the 160, 160,120, 120, and 160-lb N rates, respectively, and were economically maximized at the 200, 200, 200,160, and 200-lb rates, respectively. Yield responses of 84.7, 92.5, 72.0, 90.1, and 96.6 bu/A wereobtained with the maximum economic rate of N for each of the respective crop sequences. Yields withthe 0-lb N rate were lowest with the CC(g), CC(s) and Sb-C-C systems, intermediate with the C-Wsystem, and highest with the C-Sb system. These data indicate that the higher amounts of plantresidue incorporated from the 1985 CC(g) and Sb-C-C systems probably immobilized greater amounts of Nthan from the lower residue crop systems. Also, corn yield responses in all crop sequences to Nrates of either 160 or 200 lb/A is not consistent with past years and indicates that the very wetJune may have caused losses of fertilizer N.
Similar to 1985, the sequence x hybrid interaction was not significant indicating that the twohybrids behaved identically across all sequences. On the other hand, a significant N rate x hybridinteraction was found. At the 0- and 40-lb N rates, P3732 yields were 4.9 and 3.9 bu/A higher, r-espectively, than P3906. Yields were identical between the two hybrids at the 80-, 120- and 160-lbrates. At the 200-lb rate P3906 yielded 4.0 bu/A better than P3732 when averaged over sequences. Nothree-factor interaction was found.
Corn yield responses to N with each of the sequences did not appear to show any consistent relationship to the residual soil NO -N levels shown in Table 1. This is consistent with past years.

Table 2.
118
Corn grain yield, leaf N, grain N, grain N removed, and grain moisture as influenced byprevious crop, N rate and hybrid at Waseca, 1986.
N rate (IbJkTPrevious Crop Hybrid 0 40 80 120 160 200
-------— ——-• Yield (bu/A)
Cont. Corn (grain) 3906 68.3 94.4 112.1 131.7 148.8 160.0
3732 75.8 97.8 111.8 135.6 153.0 153.6
Cont. Corn (silage) 3906 69.2 93.7 118.5 147.3 148.2 170.6
3732 76.8 96.7 115.9 141.8 144.4 160.5
Soybeans 3906 108.0 134.2 147.8 166.0 174.1 177.7
3732 106.0 141.8 145.8 169.0 175.0 180.3
Wheat 3906 80.7 111.1 143.4 169.4 170.3 172.3
3732 85.3 111.9 141.5 165.0 174.1 174.0
Corn after soybeans 3906 56.4 84.1 104.9 139.8 153.1 160.6
3732 63.2 89.1 110.9
Leaf
138.3
N (%)
148.1 152.3
_-«•-_«_•<•»•»-
Cont. Corn (grain) 3906 1.30 1.39 1.77 2.07 2.27 2.42
3732 1.33 1.48 1.77 2.20 2.54 2.62
Cont. Corn (silage) 3906 1.30 1.49 1.68 2.30 2.51 2.51
3732 1.29 1.51 1.78 2.21 2.38 2.67
Soybeans 3906 1.45 1.84 2.28 2.63 2.57 2.84
3732 1.55 2.01 2.27 2.62 2.73 2.80
Wheat 3906 1.34 1.76 2.07 2.35 2.74 2.65
3732 1.43 1.67 2.07 2.65 2.75 2.89
Corn after soybeans 3906 1.16 1.38 1.60 2.12 2.43 2.60
3732 1.18 1.41 1.81 2.29 2.34 2.66
Cont. Corn (grain) 3906 1.20 1.14 1.21 1.25 1.32 1.46
3732 1.07 .96 1.01 1.09 1.18 1.25
Cont. Corn (silage) 3906 1.14 1.14 1.16 1.29 1.29 .1.39
3732 1.00 .96 .96 1.07 1.14 1.23
Soybeans 3906 1.13 1.19 1.22 1.33 1.36 1.49
3732 .96 1.00 1.07 1.23 1.23 1.30
Wheat 3906 1.13 1.10 1.16 1.31 1.37 1.43
3732 .96 .97 1.04 1.14 1.21 1.32
Corn after soybeans 3906 1.14 1.10 1.10 1.25 1.29 1.46
3732 .97 .91 .97 1.08
Grain N Removed (lb/A)64.6 78.2
1.13 1.24
Cont. Corn (grain) 3906 38.8 51.1 93.1 109.9
3732 38.7 44.6 53.5 70.5 85.0 90.6
Cont. Corn (silage) 3906 37.2 50.4 65.0 90.1 90.7 112.2
3732 36.7 44.0 52.6 71.8 78.0 93.2
Soybeans 3906 58.3 76.0 85.5 104.6 112.1 125.1
3732 48.2 67.7 74.0 98.9 102.2 110.3
Wheat 3906 43.0 57.8 78.4 105.3 110.7 116.7
3732 38.7 51.2 69.3 88.9 99.3 108.2
Corn after soybeans 3906 30.4 43.8 54.6 82.8 93.5 110.7
3732 29.1 38.5 51.2 70.7 79.2 89.5
-.-..-,.--—..*._*-a_-»-t>••»•»>*_••»•>_. Gram moio.ulc \.*>/ —
Cont. Corn (grain) 3906 23.6 22.9 22.9 22.1 21.3 21.4
3732 28.6 26.0 24.6 23.3 22.5 22.8
Cont. Corn (silage) 3906 24.0 23.2 22.8 22.1 21.9 21.4
3732 28.9 26.1 25.1 24.1 23.3 22.8
Soybeans 3906 23.2 22.8 22.2 22.0 21.9 21.6
3732 26.3 24.9 23.7 22.0 23.4 22.7
Wheat 3906 24.5 23.3 22.6 22.5 22.0 22.3
3732 27.7 26.2 23.9 23.1 22.7 23.6
Corn after soybeans 3906 23.8 23.4 23.1 22.3 21.8 21.1
3732 28.1 26.0 24.2 23.2 22.7 22.0

119
Table 3. Main factor and two-factor interaction averages for corn yield, grain moisture, grain N,grain N removal and leaf N In 1986.
Grain Grain N
removed
Leaf
Source Yield Moisture N N
bu/A % lb/A %
MAIN FACTORS
Sequence
Cont. comi(grain) 120.2 23.5 1.18 68.2 1.93
Cont. corni (silage) 123.6 23.8 1.15 68.5 1.97
Sb-C 152.1 23.1 1.21 88.6 2.30
Wht-C 141.6 23.7 1.18 80.6 2.20
Sb-C-C* 116.7 23.5 1.14 64.5 1.91
Signif. Level (%): 99 55 96 99 99
BLSD (.05) : 7.9 -- .05 6.6 .10
N Rate (lb/A)0 79.0 25.9 1.07 39.9 1.33
40 105.5 24.5 1.05 52.5 1.59
80 125.3 23.5 1.09 64.9 1.91
120 150.4 22.8 1.21 86.2 2.34
160 158.9 22.4 1.25 94.4 2.53
200 166.2 22.2 1.36 106.6 2.67
Signif., Level (%): 99 99 99 99 99
BLSD (.05) : 4.8 0.3 0.03 2.9 0.08
HybridP 3906 130.6 22.5 1.25 79.0 2.03
P 3732 131.2 24.5 1.09 69.1 2.10
Signif., Level (%): 51 99 99 99 99
INTERACTIONS
Sequence x N Rate
CC(g) 0 72.1 26.1 1.13 38.7 1.32
40 96.1 24.5 1.05 47.9 1.43
80 111.9 23.8 1.11 59.1 1.77
120 133.6 22.7 1.17 74.3 2.13
160 150.9 21.9 1.25 89.1 2.40
200 156.8 22.1 1.35 100.3 2.52
CC(s) 0 73.0 26.4 1.07 36.9 1.30
40 95.2 24.7 1.05 47.2 1.50
80 117.2 24.0 1.06 58.8 1.73
120 144.6 23.1 1.18 81.0 2.26
160 146.3 22.6 1.21 84.4 2.45
200 165.5 22.1 1.31 102.7 2.59
Sb-C 0 107.0 24.8 1.04 53.2 1.50
40 138.0 23.8 1.10 71.8 1.92
80 146.8 22.9 1.15 79.7 2.28
120 167.5 22.5 1.28 101.8 2.62
160 174.6 22.7 1.30 107.2 2.65
200 179.0 22.2 1.39 117.7 2.82
Wht-C 0 83.0 26.1 1.04 40.8 1.38
40 111.5 24.7 1.03 54.5 1.72
80 142.5 23.2 1.10 73.9 2.07
120 167.2 22.8 1.23 97.1 2.50
160 172.2 22.4 1.29 105.0 2.74
200 173.1 22.9 1.37 112.4 2.77

120
Grain Grain N
removed
Leaf
Source Yield Moisture N N
bu/A % lb/A %
Sb-C-C* 0 59.8 25.9 1.05 29.7 1.17
40 86.6 24.7 1.00 41.2 1.39
80 107.9 23.6 1.04 52.9 1.71
120 139.1 22.7 1.17 76.7 2.20
160 150.6 22.2 1.21 86.4 2.38
200 156.4 21.6 1.35 100.1 2.63
Signif. Level (%) 99 90 94 96 69
BLSD (.05) 15.6 — — 10.4 —
BLSD (.10) 13.2 1.1 0.09 8.8 —
Sequence x Hvbrid
CC(g) 3906 119.2 22.4 1.26 72.6 1.87
3732 121.2 24.6 1.09 63.8 1.99
CC(s) 3906 124.6 22.6 1.23 74.3 1.97
3732 122.7 25.0 1.06 62.7 1.97
Sb-C 3906 151.3 22.3 1.29 93.6 2.27
3732 153.0 24.0 1.13 83.6 2.33
Wht-C 3906 141.2 22.9 1.25 85.3 2.15
3732 141.9 24.5 1.10 75.9 2.24
Sb-C-C* 3906 116.5 22.6 1.22 69.3 1.88
3732 117.0 24.4 1.05 59.7 1.95
Signif. Level (%): 34 94 40 23 59
BLSD (.10) — 0.3 — -- —
N rate x Hybrid0 3606 76.5 23.8 1.15 41.5 1.31
3732 81.4 27.9 .99 38.3 1.36
40 3906 103.5 23.1 1.13 55.8 1.57
3732 107.4 25.8 .96 49.2 1.61
80 3906 125.3 22.7 1.17 69.6 1.88
3732 125.2 24.3 1.01 60.1 1.94
120 3906 150.8 22.2 1.29 92.2 2.29
3732 150.0 23.3 1.12 80.1 2.39
160 3906 158.9 21.8 1.33 100.0 2.50
3732 158.9 22.9 1.18 88.7 2.55
200 2906 168.2 21.6 1.44 114.9 2.61
3732 164.2 22.8 1.27 98.4 2.73
Signif. Level (%) 96 99 23 99 28
BLSD (.05) 4.2 0.5 — 3.2 —
Seq. x N rate x HybridSignif. Level (%) 29 4 39 74 90
BLSD (.10) .25
CV (%) 5.8 3.8 4.8 8.0 7.7
* - Position in sequence for which measurements taken.
In summary, corn yields (averaged over hybrids) from the 200-lb rate were approximately 9% higherwhen following either soybeans or wheat compared to continuous corn (grain or silage). Thisadvantage was slightly below the advantages shown in previous dry years. Also, contrary to reportsfrom Purdue University, P3732 continued to respond to increasing N rates to 200 lb N/A. This same Nrate also maximized the P3906 yield when averaged over sequences.
Grain Moisture
Grain moisture at harvest was unaffected by crop sequence but was reduced significantly by each Nrate up through 160 lb/A. The shorter season hybrid (P3906) had significantly less moisture.

121
Interactions between crop sequence and N rate or hybrid were not significant at the 95% level. Thehighly significant interaction between N rate and hybrid was due to the greater difference in grainmoisture betwwen the two hybrids at the low N rates (4.1 and 2.7 points at the 0 and 40-lb rates,respectively) compared to a 1.1 point difference at N rates >120 lb/A.
Grain N
Grain N concentrations were influenced by the crop sequence when averaged over N rates and hybrids.Highest N concentrations were found when corn followed soybeans while lowest levels occurred withsecond year corn after soybeans and CC(s). Grain N concentrations were increased by N rates upthrough 200 lb/A. The P3906 hybrid averaged 0.16% higher grain N or 1.0% higher protein than P3732when averaged over sequence and N rate. The significant sequence by N rate interaction was due tothe higher concentrations of N at N rates of _1120 lb/A when corn followed soybeans or wheat comparedto corn. At the low N rates, grain N concentrations were quite similar among the crop sequencesexcept for CC(g) at the 0-lb rate. Interactions between sequence and hybrid and between N rate andhybrid were not found.
Grain N removed
Nitrogen removed in the grain crop was closely associated with both grain yield and grain Nconcentration. Highest grain N removal was when soybeans or wheat was the previous crop, when the200-lb N rate was applied, and when P3906 was grown.
Nitrogen efficiency, as measured by grain N removed divided by fertilizer application rate, averaged32, 30, 40, 47 and 35% for the N rates giving the highest yields (statistically) for the CC(g),CC(a), C-Sb, C-W, and Sb-C-C sequences, respectively. At the N rates where yields were maximizedeconomically, the efficiency values were 31, 33, 32, 45, and 35%, respectively. Similar to 1985, Nefficiency was highest in the corn-wheat sequence.
Leaf N
Concentrations in the earleaf at silking were significantly higher when corn followed either soybeansor wheat compared to following corn when averaged over N rates and hybrids. Leaf N was increased upthrough the 200-lb N rate when averaged over sequences and hybrids. Pioneer 3732 contained slightlymore N in the earleaf than did P3906. Interactions among sequence, rate and hybrid were notsignificant (P = 95% level).
Silage production
Measurements were taken from the CC(s) crop sequence to determine fodder yield, fodder Nconcentration, fodder N uptake, silage yield, and total N uptake. Data shown in Table 4 indicate asignificant effect of N up through the 120-lb rate on fodder yield. Similar to previous years,fodder yield of P3732 was significantly greater than P3906. The interaction between N rate andhybrid (P - 94% level) for fodder yield was due to P3906 responding to N rates up through 120 lb/Awhile P3732 only responded up through 80 lb/A. Fodder N concentration was maximized at the 200-lbrate and contrary to 1985 was significantly higher for P3732. Fodder N uptake was highest at the200-lb N rate with an advantage for P3732 compared to P3906. The significant interaction between Nrate and hybrid for fodder N concentration and uptake can be explained by P3906 maximizing both Nconcentration and uptake at the 120-lb rate while P3732 maximized both at the 200-lb rate.
Silage yields were increased significantly by N rates up through 160 lb/A and by the P3732 hybrid.Total N removed in the silage was increased with increasing N rates up through 200 lb/A. Equalamounts of N were removed by both hybrids. N efficiency with both hybrids fertilized at the 200-lbrate was 46%.
Summary - 1986
Corn grain yields averaged about 9% higher when corn followed either soybeans or wheat compared tocontinuous corn (grain or silage). Highest yields with minimum N input were found when corn followedeither soybeans or wheat and were maximized at the 120-lb N rate. Yields with both P3732 and P3906were maximized at the 160-lb N rate with the CC(g), CC(s), and Sb-C-C crop sequences. Grain Nconcentrations and grain N removal were significantly higher with the P3906 hybrid. Leaf N atsilking was maximized at between 2.54% and 2.82% with the 200-lb rate for all crop sequences.

122
Table 4. Silage production as influenced by N rate and hybrid in a silage corn rotation at Waseca,1986.
Fodder SilageFodder Fodder N Silage N
N rate Hybrid Yield N Uptake Yield Removal
lb/A T DM/A % lb N/A T DM/A lb N/A
0 3906 1.55 .41 12.5 3.36 49.8
3732 1.82 .42 15.2 3.86 53.6
40 3906 1.98 .34 13.3 4.48 63.9
3732 2.44 .38 18.4 4.93 61.3
80 3906 2.35 .38 17.9 5.44 82.6
3732 3.19 .38 24.3 6.41 82.2
120 3906 2.83 .42 23.6 6.53 106.7
3732 3.18 .46 29.4 6.89 103.0
160 3906 2.90 .44 25.8 7.06 127.9
3732 3.31 .44 29.5 7.64 127.6
200 3906 2.99 .45 26.9 7.29 142.0
3732 3.39 .58 39.5 7.79 145.4
MAIN FACTORS
N rate (lb/A)0 1.69 .41 13.9 3.66 51.7
40 2.21 .36 15.8 4.71 62.6
80 2.77 .38 21.1 5.93 82.4
120 3.01 .44 26.5 6.71 104.8
160 3.11 .44 27.6 7.35 127.8
200 3.19 .51 33.2 7.54 143.7
Signif. Level (%)-': 99 99 99 99 99
BLSD (.05) : .21 .04 3.0 .39 7.2
Hybrid3906 2.43 .40 20.0 5.69 95.5
3732 2.89 .44 26.0 6.27 95.5
Signif. Level (%)-': 99 99 99 99 2
INTERACTION Significance Level (%)JJN rate x Hybrid 94 99 97 55 11
CV (%) ; 7.5 9. 14. 5.7 8.9
— Probability level of significance
TWELVE-YEAR YIELD SUMMARY
Average corn yields over this 12-year period have been optimized with 175, 140, and 140 lb N/A forthe continuous corn, corn-soybean, and corn-wheat sequences, respectively. At these N rates, yieldsfor corn following soybeans and wheat where 15 and 13% higher than for continuous corn.
Table 5. Effect of previous crop on corn response to N from 1975-86 at Waseca.
N rate
lb N/A
0
40
80
120
160
200
Corn(g)
75
100
115
125
133
136
Previous Crop
Soybeansbu/A
109
134
146
153
158
158
Wheat
104
130
147
151
154
156

123
SPLIT APPLICATION OF N FOR
CORN ON A WEBSTER SOIL
Waseca, 1986
G. W. Randall and P. L. Kelly
Improved nitrogen (N) efficiency is a goal of many corn producers because of the enhanced economicreturn to their fertilizer dollar. One potential method of improving the efficiency of N is to applyit closer to the period of greatest demand by the plant. For corn this is the period from threeweeks prior to three weeks after tasseling. Applying N closer to this period limits the potentialfor N loss due to leaching or denitrification. Split applications of N have been shown to be quitebeneficial on coarse-textured soils where leaching losses are common. The primary purpose of thisstudy was to evaluate split applications of N to a naturally, poorly drained Webster clay loam whereleaching is thought not to be a problem.
EXPERIMENTAL PROCEDURES
A poorly drained Webster clay loam soil with lateral tile lines at 75-foot spacings was the experimental site. Corn, which had been fall moldboard plowed, was the previous crop. Soil tests of thesite showed a pH «• 6.9, OM - High, Bray ?l - 58 lb/A (VH), and exchangeable K - 358 lb/A (VH).
Sixteen N treatments were applied in a randomized, complete-block design with five replications(Table 1). Each plot measured 10' wide (4 - 30" rows) by 60' long. Split treatments consisted ofeither a 1/3-rate applied preplant with the remaining 2/3 sidedressed or 2/3 applied preplant and 1/3sidedressed. Preplant treatments of anhydrous ammonia (AA) and urea-ammonium nitrate solution (UAN)were applied on April 24 and May 5, respectively. Anhydrous ammonia was Injected while the UAN wasbroadcast applied on the soil surface. Immediately after UAN application, the entire experimentalarea was field cultivated.
Cora (Pioneer 3906) was planted at 30400 ppA on May 7. No starter fertilizer was used. Counter wasused at a rate of 1 lb(ai)/A to control rootworms. Weeds were chemically controlled with a pre-emergence application of Lasso (3} qt/A) plus Atrazine (3 qt/A). Rootworm and weed control wereexcellent.
The sldedress portions of the split treatments were applied at the 8-leaf stage (June 19). The AAwas injected while the UAN was applied either in bands to the soil surface 6" from the row using abicycle sprayer with no. 55 orifices or injected 4 to 5" deep using Yetter coulters and thin-profileknives. All plots were cultivated on the following day to incorporate the surface-applied UAN. OnJune 21 and 22, 2.46 and 2.18 inches of rain, respectively, fell to completely saturate the plots fora 7 to 10-day period.
Five randomly selected whole plants were harvested from the center two rows at the silk initiationstage (July 18 for the 60, 120 and 180-lb N rates and July 21 for the 0-lb rate), were chopped, driedand weighed for dry matter accumulation, and were analyzed for total N concentration. Stover andsilage yields were obtained at physiological maturity (PM) (Sept. 8) by hand harvesting 15' of row.Grain yields were determined on October 1 by harvesting the center two rows with a modified JD3300plot combine. Chemical analyses of the whole plants, stover, and grain were performed by theResearch Analytical Laboratory, University of Minnesota.
RESULTS
Whole plant N at silking
Severe N deficiency symptoms were very apparent for the lower N rates at the silking stage. Wholeplant N concentrations given in Table 1 show all N treatments with significantly more N than thecontrol. Factorial comparisions of the treatments show a linear response to N rate when averagedover source-time of application. When averaged over N rates significantly less whole plant N wasfound with the preplant AA and the split applications of 1/3 + 2/3 UAN and 2/3 AA + 1/3 UANtreatments compared to the 1/3 UAN + 2/3 AA treatment.
Please refer to title page of this publication for information regarding application and use of thisarticle.

124
Whole plant dry matter at silking
Total dry matter accumulation at silking was increased significantly over the control by all Ntreatments (Table 1). Factorial comparison of the treatments shows a linear response to N rate whenaveraged over method of application. Highest DM accumulation occurred with the preplant AA and the2/3 AA + 1/3 UAN split treatments. These two treatments also showed the lowest N concentrations,probably a result of plant dilution.
Table 1. Whole plant N, stover N, stover yield, and final population as influenced by splitapplications of N.
Nitrogen Whole plant
N
at silk
DM
Stover
N Yield
Final
Rate Time1' Source^' populationlbN/A % g/pl % TDM/A ppA x 10
0 CHECK ~ .68 73 .39 1.65 26.5
60 PP AA .95 95 .36 2.28 27.2
120 it ii1.27 98 .42 2.56 28.9
180 it ii1.37 99 .47 2.95 30.7
60 1/3PP+2/3SD UAN(PP)+AA(SD) 1.26 89 .39 2.11 27.6
120 ii ii1.36 88 .42 2.30 28.3
180 ii it1.48 89 .49 2.47 27.3
60 " UAN(PP)-HJAN(Drlb.SD) 1.04 88 .36 2.09 27.8
120 ii ii1.26 92 .36 2.26 27.1
180 ii ii1.42 95 .42 2.75 28.4
60 " UAN(PP)+UAN(Inj.SD) 1.11 85 .33 2.08 26.6
120 •i ii 1.36 89 .40 2.46 27.7
180 ii ii1.38 98 .42 2.46 27.7
60 2/3PP+1/3SD AA(PP)+UAN(Drib.SD) 1.06 91 .38 2.60 27.6
120 ii it1.27 95 .40 2.54 28.6
180 ii ii1.37 102 .41 2.65 28.9
Signif. Level <%>.*' 99 99 99 99 99
BLSD (.05) .10 7 .06 .28 1.1
CV (%) 6.5 5.9 11. 8.6 2.9
FACTORIAL COMPARISONS
Main Factors
N Rate (lb/A)60 1.08 90 .37 2.23 27.4
120 1.30 92 .40 2.42 28.1
180 1.40 97 .44 2.65 28.6
Signif. Level (%) -' 99 99 99 99 99
BLSD (.05) : .05 3 .02 .12 .47
Method (N Time-Source)PP - AA 1.20 97 .42 2.60 28.9
PP/SD - UAN/AAL 1.37 88 .44 2.29 27.7
PP/SD - UAN/UAN (Dribble) 1.24 92 .38 2.37 27.8
PP/SD - UAN/UAN (Inject) 1.28 91 .38 2.33 27.3
PP/SD - AA/UAK (Dribble) 1.23 96 .40 2.60 28.4
Signif. Level (%)^7 99 99 99 99 99
BLSD (.05) : .06 5 .04 .17 .63
Interaction Significance Level (%)3/
N Rate x Method 90 49 58 94 99
2/ PP •> preplant, SD - sldedress applied at the 8-leaf stage.=* AA - anhydrous ammonia, UAN •> 28-0-0, Inj - injected 4 to 5" deep,
2/Drib - dribbled in a band next to row.
Probability level of significance.
125
Stover N
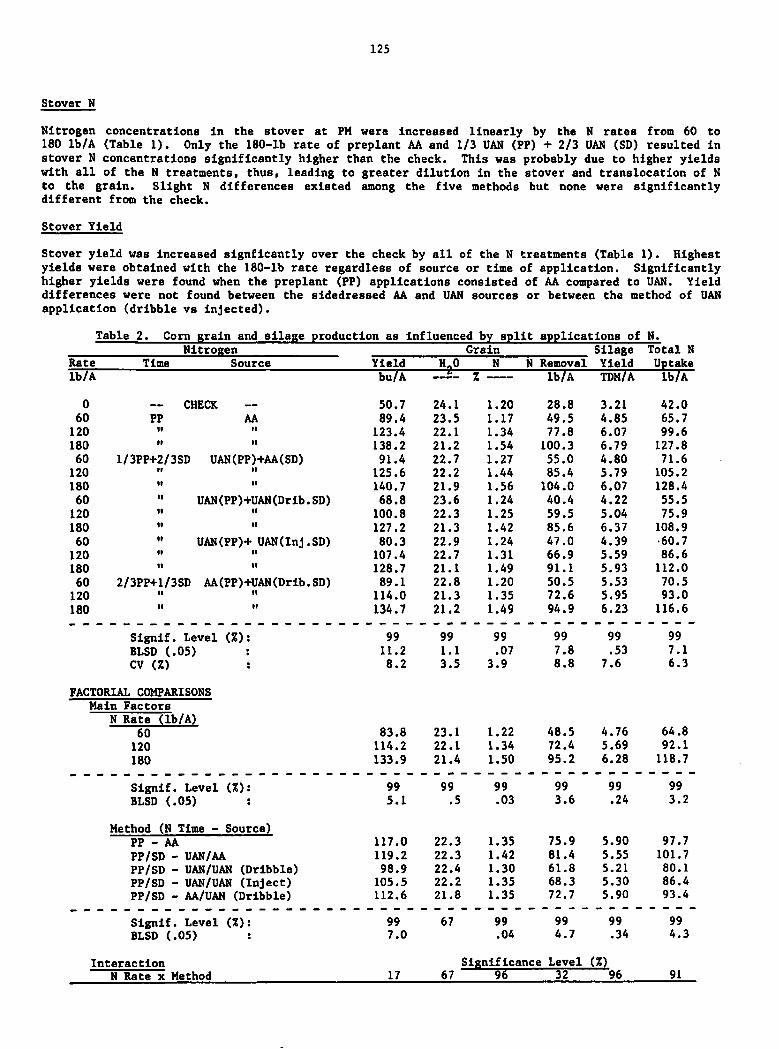
Nitrogen concentrations in the stover at PM were increased linearly by the N rates from 60 to180 lb/A (Table 1). Only the 180-lb rate of preplant AA and 1/3 UAN (PP) + 2/3 UAN (SD) resulted instover N concentrations significantly higher than the check. This was probably due to higher yieldswith all of the N treatments, thus, leading to greater dilution in the stover and translocation of Nto the grain. Slight N differences existed among the five methods but none were significantlydifferent from the check.
Stover Yield
Stover yield was increased signficantly over the check by all of the N treatments (Table 1). Highestyields were obtained with the 180-lb rate regardless of source or time of application. Significantlyhigher yields were found when the preplant (PP) applications consisted of AA compared to UAN. Yielddifferences were not found between the sidedressed AA and UAN sources or between the method of UAN
application (dribble vs injected).
Table 2. Cora grain and silage production as influenced by split applications of N.
Nitrogen
Yield H.OGrain
N N Removal
SilageYield
Total N
Rate Time Source Uptake
lb/A bu/A % lb/A TDM/A lb/A
0 CHECK 50.7 24.1 1.20 28.8 3.21 42.0
60 PP AA 89.4 23.5 1.17 49.5 4.85 65.7
120 ii it 123.4 22.1 1.34 77.8 6.07 99.6
180 ii n 138.2 21.2 1.54 100.3 6.79 127.8
60 1/3PP+2/3SD UAN(PP)+AA(SD) 91.4 22.7 1.27 55.0 4.80 71.6
120 ii it 125.6 22.2 1.44 85.4 5.79 105.2
180 ii it 140.7 21.9 1.56 104.0 6.07 128.4
60 " UAN(PP)+UAN(Drib.SD) 68.8 23.6 1.24 40.4 4.22 55.5
120 ii ii 100.8 22.3 1.25 59.5 5.04 75.9
180 ii ii 127.2 21.3 1.42 85.6 6.37 108.9
60 " UAN(PP)+ UAN(Inj.SD) 80.3 22.9 1.24 47.0 4.39 •60.7
120 ii ii 107.4 22.7 1.31 66.9 5.59 86.6
180 ii n 128.7 21.1 1.49 91.1 5.93 112.0
60 2/3PP+1/3SD AA(PP)+UAN(Drib.SD) 89.1 22.8 1.20 50.5 5.53 70.5
120 it it 114.0 21.3 1.35 72.6 5.95 93.0
180 ii it 134.7 21.2 1.49 94.9 6.23 116.6
Signif. Level (%): 99 99 99 99 99 99
BLSD (.05) : 11.2 1.1 .07 7.8 .53 7.1
CV (%) : 8.2 3.5 3.9 8.8 7.6 6.3
FACTORIAL COMPARISONS
Main Factors
N Rate (lb/A)60 83.8 23.1 1.22 48.5 4.76 64.8
120 114.2 22.1 1.34 72.4 5.69 92.1
180 133.9 21.4 1.50 95.2 6.28 118.7
Signif. Level (%): 99 99 99 99 99 99
BLSD (.05) : 5.1 .5 .03 3.6 .24 3.2
Method (N Time - Source)PP - AA 117.0 22.3 1.35 75.9 5.90 97.7
PP/SD - UAN/AA 119.2 22.3 1.42 81.4 5.55 101.7
PP/SD - UAN/UAN (Dribble) 98.9 22.4 1.30 61.8 5.21 80.1
PP/SD - UAN/UAN (Inject) 105.5 22.2 1.35 68.3 5.30 86.4
PP/SD - AA/UAN (Dribble) 112.6 21.8 1.35 72.7 5.90 93.4
Signif. Level (%): 99 67 99 99 99 99
BLSD (.05) : 7.0 .04 4.7 .34 4.3
Interaction Significance Level (*>N Rate x Method 17 67 96 32 96 91
126
Table 3. Time of N uptake as influenced by rates and split applications of N
Nitrogen Stover N Yield1'Silk PM Total
Grain„N
OLD27Yield.at
NEW*"PM3,NEW*"Rate Time Source
lb/A lb N/A % of total
0 CHECK 29.3 13.2 28.8 16.2 12.7 45
60 PP AA 54.0 16.2 49.5 37.8 11.7 24
120 ii ti 79.0 21.8 77.8 57.1 20.7 26
180 ii ti 92.4 27.5 100.3 64.8 35.4 35
60 1/3PP+2/3SD UAN(PP)+AA(SD) 67.6 16.6 55.0 50.9 4.0 6
120 ii it 74.4 19.8 85.i 54.5 30.8 36
180 ii it 79.4 24.4 104.0 55.0 49.0 46
60 " UAN(PP)+UAN(Drib.SD) 56.3 15.2 40.4 41.1 -0.8 -
120ti ti 69.5 16.4 59.5 53.1 6.4 10
180 ti ii 84.1 23.3 85.6 60.8 24.8 29
60 11 UAN(PP)+UAN(Inj.SD) 55.2 13.7 47.0 41.5 5.5 11
120 ii it 74.2 19.7 66.9 54.5 12.4 19
180 ii it 83.0 20.9 91.1 62.0 29.0 32
60 2/3PP+1/3SD AA(PP)+UAN(Drib.SD) 58.9 20.0 50.5 39.0 11.6 23
120 it ti 76.5 20.4 72.6 56.1 16.5 24
180it it 88.4 21.7 94.9 66.8 28.2 29
Signif. Level (%): 99 99 99 99 99 99
BLSD (.05) : 8.5 3.6 7.8 10.0 11.7 15.
CV (%) : 9.4 13.7 8.8 14.9 46.8 45.0
FACTORIAL COMPARISONS
Main Factors
N Rate (lb/A)60 58.4 16.3 48.5 42.1 6.4 12
120 74.7 19.6 72.4 55.1 17.4 23
180 85.5 23.6 95.2 61.9 33.3 •34
Signif. Level (%): 99 99 99 99 99 99
BLSD (.05) 3.8 1.5 3.6 4.4 5.2 6
Method (N Time - Source)PP - AA 75.1 21.8 75.9 53.3 22.6 28
PP/SD - UAN/AA 73.8 20.3 81.4 53.5 28.0 30
PP/SD - UAN/UAN (Dribble) 70.0 18.3 61.8 51.6 10.1 12
PP/SD - UAN/UAN (Inject) 70.8 18.1 68.3 52.7 15.6 21
PP/SD - AA/UAN (Dribble) 74.6 20.7 72.7 53.9 18.8 25
Signif. Level (%): 75 99 99 4 99 99
BLSD (.05) : - 2.3 4.7 - 7.2 9
Interaction Significance Level <*>N Rate x Method 95 97 32 84 86 92
1/2/
1/
Silk - silk stage, PM ° physiological maturity.OLD N - N in stover at silk - N in stover at PM; the difference is assumed to betranslocated to the grain.NEW N - Total N in grain - OLD N; the difference is assumed to be absorbed fromthe soil after silking and/or translocated from the roots.

127
Final Population
Final populations were higher with increasing rate of N (Table 1). Similar to stover yield,populations were highest with those treatments that received their preplant N as AA compared to UAN.Exact reasons for these relationships and the highly significant N rate x method interaction are notobvious.
Grain Yield
Grain yields were increased significantly over the control by all N treatments (Table 2). Highestyields were obtained at the 180-lb rate for all application methods. When averaged over N rates,there was no difference between the single preplant AA application and the split applications when AAwas either applied PP or SD in combination with UAN. However, split applications of N where UAN wasthe only source produced significantly lower yields. Yields were approximately 5 to 20% lower whenUAN was the sidedressed material. Injecting the UAN did not significantly improve grain yields overthe dribbled application method. These results indicate that significant losses of N occurred withthe sidedressed UAN treatments. It is quite likely that the 4.54" of rain 2 to 3 days after the SDtreatments were applied and the subsequent saturated soils may have contributed to denitrificatlonand/or leaching of the N applied as UAN. Under these conditions the AA would have been fixed to theexchange sites and would not have undergone significant nitrification during this period. Thus, itwas not susceptible to either denitrificatlon or leaching.
Grain Moisture
Grain moisture at harvest was reduced by all of the 120 and 180-lb N treatments but was not affectedsignificantly by the method of application (Table 2).
Grain N
Grain N was increased significantly over the control by all of the 120- and 180-lb N treatments andincreased linearly at N rates from 60 to 180 lb/A when averaged over methods of application(Table 2). Highest N concentration was found with the split application of preplant UAN and sidedressed AA. The split treatment using UAN for both PP and SD applications resulted in significantlylower N concentrations. The highly significant N rate x method interaction was probably due to thesmall differences between the 60 and 120-lb rates when UAN was the only N source.
Grain N Removal
Grain N removal (product of grain yield times grain N concentration) was increased significantly overthe check and linearly by all N rates (Table 2). Highest N removals were associated with the 180-lbrate with the single PP application of AA and the split application where AA was sidedressed. Whenaveraged over N rates, N removal was highest with the split application where AA was SD, intermediatewith the single PP application of AA and the split treatment where AA was applied PP, and lowest withthe split applications where UAN was the sole source.
Nitrogen efficiency based on grain N removal minus that removed by the check averaged 33, 36, and 37%for the 60, 120, and 180-lb rates, respectively. When averaged over N rates, methods of applicationranked according to highest efficiency were: split with UAN + AA (44%), single with preplant AA(39%), split with AA + UAN (37%), split with UAN both PP and SD injected (33%), and split with UANboth PP and SD dribbled (28%).
Silage Yield
Similar to grain yields, silage yields were increased significantly by all N treatments and continuedto increase up through the 180-lb N rate (Table 2). Application of AA either all PP or 2/3 PPresulted in yields significantly higher than the other treatments. Lowest silage yields occurredwith the split treatments when UAN was the sole N source, regardless of application method.
Total N Uptake
Total N uptake by the corn was calculated by multiplying the stover N concentration times stoveryield and adding it to grain N removal. Results of total N uptake were almost identical to those ofgrain N removal.

128
Nitrogen efficiency based on total N uptake minus that removed in the check averaged 38, 42, and 43%for the 60, 120, and 180-lb rates, respectively. When averaged over N rates, efficiency was 46, 50,32, 37 and 43% for the single PP application of AA, split UAN + AA, split UAN + UAN dribble, splitUAN + UAN injected, and split AA + UAN, respectively.
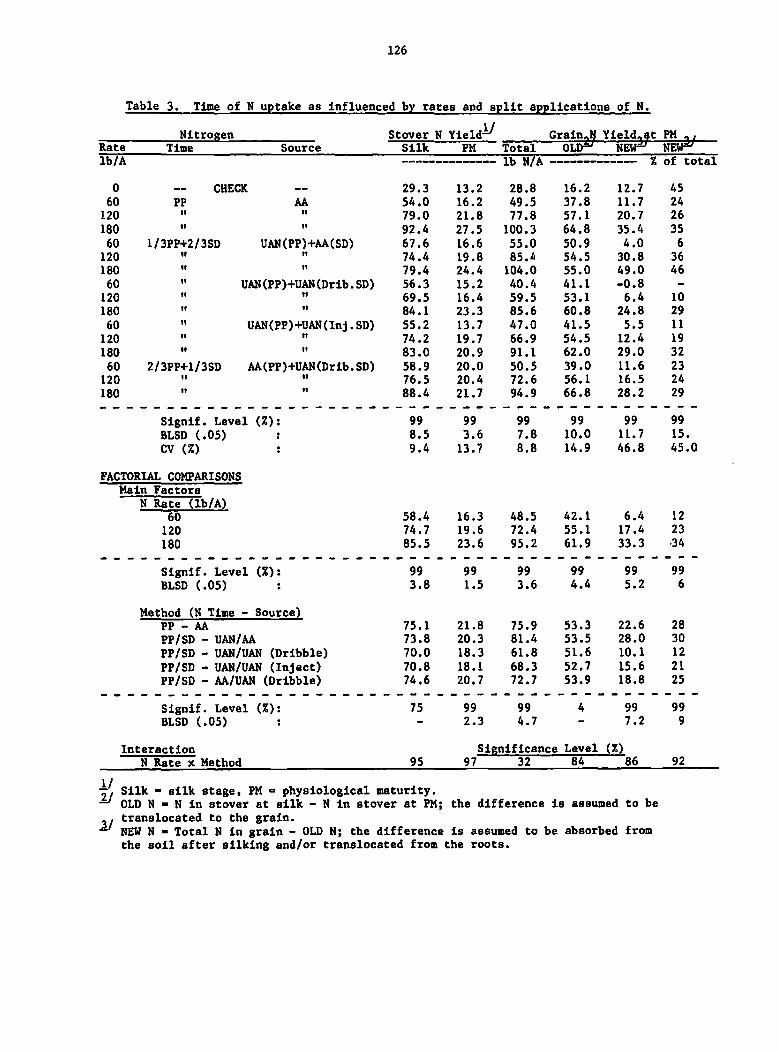
Time of N Uptake
To determine the effect of delayed/split applications of N on the time of N uptake relative tosilking, whole plants (above-ground portions) were analyzed for total N at the silking stage and atPM (both grain and stover). Nitrogen uptake at the time of silking was increased linearly over thecheck by all N treatments (Table 3). Method of application did not affect pre-silk N uptake. Thesignificant (P = 95% level) N rate x method interaction was due the minimal affect of N rate with theUAN(PP) + AA(SD) treatment compared to all other treatments.
Stover N yield was increased over the check by all of the 120 and 180-lb rates except the 120-lbUAN(PP) + UAN(Drib.SD) treatment (Table 3). Treatments that contained AA, either PP or SD, generallyshowed slightly more stover N than those that contained only UAN. The significant interactionbetween N rate and method was due to the lack of rate effect with the AA(PP) + UAN(SD) treatment incontrast to the significant rate effect with the other treatments. The difference between N yield atsilking minus that at PM was assumed to be translocated to the grain and is termed OLD N. The amountof OLD N was increased linearly by N rate but was not affected by method of application(time-source).
NEW N is assumed to be that N taken up into the above-ground portion of the plant after silking andis calculated by substracting the OLD N from the total N ln the grain at PM (Table 3). New N as apercent of the total N in the grain averaged 45% from the check treatment. This high amount wasprimarily due to the low N uptake by the N deficient plants prior to silking. NEW N was increasedsignificantly with increasing rate of application and averaged 12, 23 and 34% with the 60, 120 and180-lb rates, respectively. The method of application (time-source) had a highly significant effecton the time of N uptake. Averaged over N rates, NEW N ranged from a high of 30% with the UAN(PP) +AA(SD) treatment to a low of 12% with the UAN(PP) + UAN(Drib.SD) treatment. Highest NEW N levelswere found with the treatments that contained AA. Injecting the sidedressed UAN resulted insignificantly higher levels of NEW N compared to the dribbled application. Split applications of Ndid not result in greater amounts of late-season N uptake (NEW N) than the preplant AA treatment.These data further substantiate the poor efficiency of the split applications of UAN under theseclimatic conditions, especially when dribbled on the soil surface.
Residual Soil NO -N
Soil samples were taken in 1-foot increments to a depth of 5' from the check plots and all 180-lb Ntreatments to determine the effect of method (time-source) of N application on the amount of N0.-Nremaining in the soil after harvest. The data shown in Table 4 indicate only 22 to 35 lb/A moreN0.-N in the soil with the 180-lb rates compared to the check. Differences among methods of application were not significant for the total N0,-N in the 0-5" profile.
Check
-
Application method i/
Profile
depthPreplant
AA
SplitUAN+AA
SplitUAN+UAN(D)
SplitUAN+UAN(I)
SplitAA+UAN(D)
feet
0 - 1
1 - 2
2-3
3-4
4-5
N03-N/A
22.3
17.6
26.5
24.3
19.8
16.7
18.6
19.0
26.3
19.2
20.6
14.1
12.8
12.9
17.4
20.6
21.4
20.8
21.4
22.4
25.8
24.9
26.8
19.8
16.1
26.6
20.2
17.4
19.5
20.9
Total in
0-5' profile 78. 106. 113. no. 100. 105.
*J 180 lb N/A

129
N Recovery
A partial N budget can be obtained by adding the total N uptake shown in Table 2 to the residualNO.-N shown in Table 4 for each 180-lb treatment, and then subtracting out the uptake plus residualfrom the check treatment. From this one can calculate the percent recovery at the end of the seasonby dividing by the rate of N application. At the optimum 180-lb N rate, the percent recoveryaveraged: preplant AA (63%), UAN + AA (67%), UAN + dribbled UAN (55%), UAN + injected UAN (51%), andAA + dribbled UAN (56%).
CONCLUSIONS
Corn production was not improved in 1986 by split application of N to this Webster soil. Highestyields and greatest efficiency were obtained with the single preplant application of AA and the splitapplication of 1/3 UAN(PP) + 2/3 AA(SD). Poorest yields and N efficiency occurred with the splitapplications when UAN was the sole N source. Differences between dribbled and injected SD application of UAN generally did not exist. These tesults may have been heavily influenced by the4+ inches of rain that fell 2 to 3 days after the SD treatments were applied. However, one wouldhave thought that under these wet conditions split applications of N would have performed better thana single preplant application.
ACKNOWLEDGEMENT
Sincere appreciation is extended to Pioneer Hi-Bred International for their financial assistance inthis project.

130
NITROGEN SOURCES FOR CORN WITH
CONSERVATION TILLAGE IN SOUTHERN MINNESOTA
1986
G. W. Randall, P. L. Kelly and C. Zadak
Conservation tillage, which leaves plant residues on the soil surface, is frequently being practicedin southern Minnesota. These residues have been shown to affect N losses. Hence, best managementpractices, including proper N sources, are necessary to minimize loss of N and maximize economicreturn. The purpose of this study was to evaluate various N sources for corn production withconservation tillage on two contrasting soils in southern Minnesota.
EXPERIMENTAL PROCEDURES
Two sites which had been ridge-planted in 1985 were seletected for this study. One location was on aMount Carroll silt loam (Mollic Hapludalf) on the Doug Emerson farm ln Goodhue County. This soilrepresents a large acreage of well-drained, low organic matter, loessial soils cropped to corn insoutheastern Minnesota. The other location was at the Southern Experiment Station, University ofMinnesota in Waseca County. This Webster clay loam (Typic Haplaquoll) has inherently poor drainage,high organic matter content, and is extensively cropped to corn and soybeans. It represents a largeacreage of soils in Southern Minnesota and Northern Iowa.
Soybeans was the previous crop in Goodhue Co. while the Waseca site had been in continuous corn.Soil tests for the Goodhue and Waseca sites follow: pH - 5.7 and 7.1; Bray extractable P. - 28 and42 lb/A (High and Very High); exchangeable K •> 222 and 427 lb/A (Med-Hlgh and Very HighJ; and extractable SO, - S - 8 and 8 ppm (both Medium), respectively, for the two locations. Nitrate-Ntotaled 48 and 42 lb/A in the 0-5' profile (40 and 35 lb NO -N/A in 0-3') profile at the two sites.These were very low residual NO. levels. Surface coverage By plant residues averaged 32 and 44% atthe two sites, respectively. Ridge height averaged 5.4 inches at the Waseca site.
Sixteen N treatments were replicated four times at the Goodhue site while 13 treatments werereplicated four times at the Waseca site. A randomized, complete-block design was used at each site.Each plot measured 10' wide (4 - 30' rows) x 40' long in Goodhue County and 10' wide x 60' long inWaseca County.
Corn (Pioneer 3737) was planted with a John Deere Max-Emerge planter at a population of 27700plants/acre on May 8 in Goodhue Co. and on May 7 in Waseca Co. Excellent weed and corn rootwormcontrol was obtained with proper chemicals at both sites.
Nitrogen treatments were broadcast applied on the soil surface on May 14 in Goodhue Co. and on May 7in Waseca Co. Rainfall in the 10-day period following N application ln Goodhue Co. totaled 0.30"with .10" on the 1st day and 0.20" on the 10th day following application. At Waseca, 2.99" rainoccurred in the 10-day period with .02", .57", .36" 1.38", .11", .53" and .02" on the 1st, 2nd, 3rd,4th, 6th, 7th and 10th days, respectively, following application. Three quarters of the N (75 lb/A)for the split application was sldedress applied on the soil surface at the 7-leaf stage (June 19) atGoodhue Co. On the next day 1.80" of rain fell to move the AN into the surface soil.
Ten randomly selected leaves opposite and below the ear were taken at silking for N and S analyses.Fodder and grain yields were obtained at physiological maturity by hand harvest techniques at theGoodhue location while plots were combine harvested at Waseca. All stover and grain analyses wereconducted on samples gathered at harvest. Chemical analyses were performed by the ResearchAnalytical Laboratory, University of Minnesota.
Soil samples were taken in 1-foot increments to a depth of 3' from the 0, 60, 120, 180, and 240-lb ANtreatments on November 11 at the Goodhue Co. site. These samples were dried, ground, and analyzedfor N0_-N to determine the carryover and accumulation of NO. in the soil profile.
RESULTS AND DISCUSSION
Rainfall during the 1986 growing season was considerably above normal in Goodhue Co. and slightlyabove normal in Waseca Co. (Table 1). Conditions were exceptionally dry during the 5-week period
Please refer to title page of this publication for information regarding application and use of thisarticle.

131
from mid-July to mid-August at Waseca and resulted in lower yields than expected. Slight amounts ofrain occurred on the first day following application at both locations. However, these amounts wouldnot have been sufficient to incorporate the surface-applied N adequately and some volatilization mayhave occurred. In Goodhue Co. 0.20" and 0.75" of rain fell 10 and 12 days, respectively, afterapplication and should have incorporated the N sufficiently. During the 10-day period followingapplication at Waseca, 2.99" of rain occurred to incorporate the N. Saturated soils did result,however, and may have caused some denitrificatlon.
Table 1. Rainfall during the May thru October growing season in Goodhue and Waseca Counties.
LocationMonth Goodhue Waseca
inches
May 3.42 3.76 (0.00)^June 4.89 7.89 (+3.41)July 6.61 3.90 (- .12)August 2.30 2.41 (-1.58)September 10.54 5.57 (+2.21)October 2.85 2.83 (+ .75)
TOTAL 30.61 26.36 (+4.67)
Departure from 30-year normal.
Goodhue County
Even though low levels of NO. occurred in the soil profile at the beginning of the growing season,the combination of soybeans as the previous crop along with extremely favorable growing conditionsduring the season resulted in a minimal corn response to the N treatments (Tables 2 and 3). Thesesmall differences made it difficult to clearly establish the effects of the N sources and theirinteraction with rate of N application.
Nitrogen Concentrations
Leaf and grain N concentrations were increased over the control by the 100-lb N/A application ratebut generally not by the 50-lb rate (Table 2). When averaged over N rate, differences among the Nsources were not significant at the P = 95% level. At the 50-lb rate leaf N was lowest with the urea+ AS treatment while grain N was lowest with the UAN treatment. The 100-lb N rate averaged over thesix sources increased leaf, stover, and grain N significantly (P - 95% level). Increasing theapplication rate of AN from 100 to 200-lb N/A increased leaf N significantly but did not influencestover or grain N. The split application of AN did not improve the N concentrations ln the planttissue over the single, preemergence application. Significant (P - 90% level) Interactions between Nsource and N rate were not found for leaf N, stover N, and grain N. Final population was notinfluenced by N source or rate.
Yields
Stover, silage and grain yields were increased significantly over the check by most of the N treatments, especially the 100-lb N rate (Table 3). Only the 50-lb N rate as urea failed to increasesilage and grain yields over the check. When averaged over N rates, highly significant differenceswere found among the N sources. Stover and silage yields were lowest with urea and highest with theUAN, UAN + S and AS treatments. Grain yields were lowest with the urea + AS treatment and highestwith the AS and UAN + S treatments; although differences among the AN, AS, UAN, UAN + S and ureatreatments were not significant. Baaed on these results with AS and UAN + AS, one can speculate asto a S response, although the lower yields with the urea + AS treatment clouds the picture. The100-lb N rate significantly increased stover, silage and grain yields over the 50-lb rate. Yieldswere also Increased over the 100-lb rate by the 150-lb rate but not by the 200-lb rate or by thesplit treatment. No interaction between N rate and source was observed.
N Uptake
Uptake of N (product of N concentration times either the grain or grain + stover dry matter yield)was increased significantly over the check by all of the treatments except the 50-lb N rate as urea
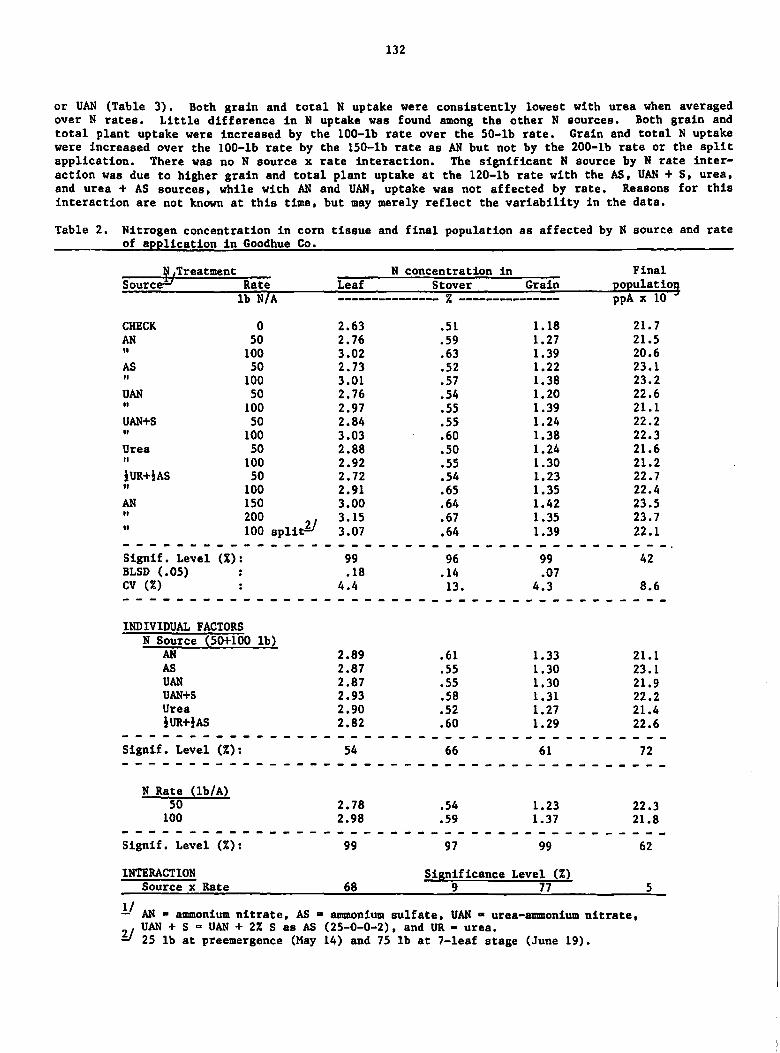
132
or UAN (Table 3). Both grain and total N uptake were consistently lowest with urea when averagedover N rates. Little difference in N uptake was found among the other N sources. Both grain andtotal plant uptake were increased by the 100-lb rate over the 50-lb rate. Grain and total N uptakewere increased over the 100-lb rate by the 150-lb rate as AN but not by the 200-lb rate or the splitapplication. There was no N source x rate interaction. The significant N source by N rate interaction was due to higher grain and total plant uptake at the 120-lb rate with the AS, UAN + S, urea,and urea + AS sources, while with AN and UAN, uptake was not affected by rate. Reasons for thisinteraction are not known at this time, but may merely reflect the variability in the data.
Table 2. Nitrogen concentration in corn tissue and final population as affected by N source and rateof application ln Goodhue Co.
N, Treatment N concentration in Final
Source—' Rate Leaf Stover Grain population
lb N/A
0
ppA x 10
21.7CHECK 2.63 .51 1.18
AN 50 2.76 .59 1.27 21.5ii 100 3.02 .63 1.39 20.6
AS 50 2.73 .52 1.22 23.1n
100 3.01 .57 1.38 23.2
UAN 50 2.76 .54 1.20 22.6ii
100 2.97 .55 1.39 21.1
UAN+S 50 2.84 .55 1.24 22.2ii
100 3.03 .60 1.38 22.3
Urea 50 2.88 .50 1.24 21.6n
100 2.92 .55 1.30 21.2
JUR+jAS 50 2.72 .54 1.23 22.7it
100 2.91 .65 1.35 22.4
AN 150 3.00 .64 1.42 23.5ti
200 3.15 .67 1.35 23.7ii 100 split*7 3.07 .64 1.39 22.1
Signif. Level (%): 99 96 99 42
BLSD (.05) .18 .14 .07
CV (%) 4.4 13. 4.3 8.6
INDIVIDUAL FACTORS
N Source (50+100 lb)AN 2.89 .61 1.33 21.1
AS 2.87 .55 1.30 23.1UAN 2.87 .55 1.30 21.9UAN+S 2.93 .58 1.31 22.2
Urea 2.90 .52 1.27 21.4JUR+JAS 2.82 .60 1.29 22.6
Signif. Level (%): 54 66 61 72
N Rate (lb/A)50 2.78 .54 1.23 22.3100 2.98 .59 1.37 21.8
Signif. Level (%): 99 97 99 62
INTERACTION Significance Level (%)Source x Rate 68 9 77 5
—AN - ammonium nitrate, AS a ammonium sulfate, UAN - urea-ammonium nitrate,. UAN + S - UAN + 2% S as AS (25-0-0-2), and UR - urea.
— 25 lb at preemergence (May 14) and 75 lb at 7-leaf stage (June 19).

133
Table 3. Corn yields and N uptake as influenced by N source and rate of application in Goodhue Co.
Treatment Yields Ear N UptakeSource Rate Stover Silage Grain Moisture Grain Total-
lb N/A TDM/A bu/A % lb N/A
CHECK 0 2.36 6.42 152.3 36.8 85.4 109.7
AN 50 2.60 7.26 173.3 36.4 104.2 134.5it
100 2.65 7.46 179.4 36.8 118.2 151.6
AS 50 2.67 7.46 179.0 36.2 103.4 131.4it
100 2.93 8.01 188.9 36.4 123.4 156.9
UAN 50 2.53 7.16 173.1 35.9 98.4 126.0it
100 3.19 8.20 186.5 36.4 122.9 158.2
UAN+S 50 2.82 7.51 175.6 36.3 103.0 134.0ti
100 3.00 8.13 191.6 35.7 125.4 161.8
Urea 50 2.49 6.82 161.6 36.3 94.8 119.9ti
100 2.52 7.15 172.8 35.1 106.6 134.2
JUR+jAS 50 2.72 7.38 174.4 36.7 102.0 131.4tt
100 2.77 7.55 177.7 36.6 113.4 149.5
AN 150 3.13 8.32 193.6 35.9 129.9 170.0tt
200 2.83 7.86 187.4 35.8 119.8 157.1ti 100 spl:Lt 2.80 7.51 175.1 36.8 115.1 151.1
Signif. Level (%)BLSD (.05)CV (%)
INDIVIDUAL FACTORS
99
.39
9.2
99
.67
6.2
99
16.5
6.2
29
2.9
99
12.5
8.3
99
17.1
8.8
N Source (50+100 lb)AN
AS
UAN
UAN+S
Urea
lUR+jAS
2.63
2.80
2.86
2.91
2.51
2.74
7.36
7.73
7.68
7.82
6.98
7.46
176.4
184.0
179.8
183.6
176.1
167.2
36.6
36.3
36.2
36.0
35.7
36.6
111.2
113.4
110.7
114.2
100.7
107.7
143.0
144.2
142.1
147.9
127.1
140.4
Signif. Level (%):BLSD (.05) :
N Rate (lb/A)50
100
98
.28
2.64
2.84
99
.46
7.27
7.75
98
11.7
172.8
182.8
59
36.3
36.2
95
10.6
101.0
118.3
95
15.3
129.5
152.1
Signif. Level (%):
INTERACTION
Source x Rate
99
88
99
65
99
Significance
17
34
Level (%)47
99
45
99
30
1 Grain + stover
Sulfur Concentrations
Sulfur applications totaled 114, 8, and 57 lb S/A with the AS, UAN + S, and urea + AS treatments,respectively. These amounts of S significantly increased leaf and stover S concentrations and Suptake at the P - 99% level and grain S at the P - 93% level (Table 4). Highest S concentrations anduptake were generally found with the 114-lb rate of S. The 8 lb/A S rate applied with UAN increasedleaf S over the UAN alone treatment but did not affect stover or grain S concentrations or S uptake.Nitrogen:S ratios ranged from 10.8 to 14.3 for leaves, 7.6 to 9.7 for stover, and from 13.6 to 14.5for grain. Lowest N:S ratios were associated with either the 114 or 57-lb S rates.

134
Table 4. Sulfur concentrations and uptake by corn as influenced by N sources in Goodhue Co.
N Source-
Leaf
S
Stover
S
Grain
S
Sulfur Uptake
Grain Total
AN
AS
UAN
UAN+S
Urea
iUR+jAS
*
.213 .065
.279 .075
.207 .059
.223 .067
.210 .057
.256 .077
.096
.100
.097
.095
.093
.099
lb
8.16 11.6
8.89 13.3
8.56 12.3
8.59 12.6
7.64 10.5
8.36 12.6
Signif. Level (%): 99 99 93 99 99
BLSD (.05) : .011 .011 .53 1.0
CV (%) : 3.3 11. 3.2 4.1 5.7
-1 100 lb N/A
Residual Nitrate - N
Samples taken to a 3-foot depth after harvest showed very little relationship between N applicationrate and the NO remaining in the soil profile (Table 5). Nitrate-N levels were very low.Apparently most of the N not taken up by the plants was leached beyond the 3-foot depth. (Because ofextremely wet conditions, it was impossible to get samples below this depth.)
Table 5. Residual soil NO.-N in the soil profile in November as influenced by N rate in Goodhue Co.
Profile
—-,
N Application Rate (lb/A)depth 0 60 120 180 240
feet
0-1
1-2
2-3
10
4
4
12
4
4
15 20
5 13
6 9
18
11
7
Totals
0-3 18 20 26 42 36
Nitrogen Budget
A partial N budget can be obtained by adding the total N uptake shown in Table 3 to the residualNO -N shown in Table 5 for each treatment, and then subtracting out the uptake plus residual from thecheck treatment. From this one can calculate the percent recovery by dividing by the respective Napplication rate. Using this method, % recovery totaled 54, 50, 56 and 33% for the 50, 100, 150, and200-lb N rates, respectively. These low recovery rates Indicate that substantial amounts of fertilizer N were lost from the soil or immobilized into the soil organic matter during the 1986 season.
Waseca County
Nitrogen Concentrations
Leaf N was increased significantly over the check by all N treatments (Table 6). Grain N was increased significantly by all of the 150-lb treatments except with the UAN and urea + AS sources.Stover N concentrations were generally not increased over the check by any of the N treatments due tothe high variability (CV = 14.0). Leaf, stover, and grain N concentrations with the 150-lb rateaveraged 16, 27 and 12% lower at this site than with the 100-lb rate at the Goodhue site.
When averaged over N rates, leaf N was significantly higher with the AA and AS treatments compared tothe UAN and UAN + S treatments with the urea treatments being intermediate. Stover N was highestwith the AA and AS treatments. Grain N was not affected by source of N. When averaged over the sixN sources, leaf and grain N were both increased significantly by the 150-lb N rate. Interactionsbetween N source and N rate were not significant for leaf, stover, or grain N.

135
Table 6. Nitrogen concentration in corn tissue, final population, and plant height as affected by N
N.Treatment N concentration in Final
populationppA x 10 J
PlantSource— Rate Leaf Stover Grain height
cmlb N/A %
CHECK 0 1.46 .39 1.01 23.7 90AA 75 2.30 .44 1.05 24.2 103
150 2.65 .51 1.21 24.5 103AS 75 2.15 .45 1.10 24.7 120
150 2.59 .44 1.25 24.8 120UAN 75 1.91 .38 1.02 24.2 109
150 2.35 .38 1.14 25.8 114UAN+S 75 1.75 .39 1.01 24.2 110
150 2.45 .43 1.20 24.4 120Urea 75 2.01 .39 1.06 24.2 115
150 2.65 .43 1.21 24.3 112lUR+lAS 75 2.06 .39 1.11 24.7 118ii
150 2.39 .37 1.15 24.9 119
Signif. Level (%)BLSD (.05)CV (%)
INDIVIDUAL FACTORS
N Source
AA
AS
UAN
UAN+S
Urea
JUR+JAS
99
.29
9.7
2.47
2.37
2.13
2.10
2.33
2.23
95
.11
14.
.48
.45
.38
.41
.41
.38
99
.15
8.7
1.13
1.18
1.08
1.11
1.13
1.13
26
4.9
24.4
24.7
25.0
24.3
24.3
24.8
99
6
4.2
103
120
112
115
114.
119
Signif. Level (%):BLSD (.05) :
99
.23
99
.06
50 24 99
4
N Rate (lb/A)75
150
2.03
2.51
.41
.43
1.06
1.20
24.3
24.8
112
115
Signif. Level (%): 99 75 99 80 90
INTERACTION
Source x Rate 58 35
Signifi cance22
Level (%)20 90
— AA - anhydrous ammonia, AS •» ammonium sulfate, UAN - urea-ammonium nitrate,UAN + S - UAN + 2% S as AS(25-0-0-2), and UR ° urea.
Final Population and Plant Height
Plant population was not influenced by any of the N treatments (Table 6). Plant height (extendedleaves) data taken on June 26 show plants to be 13 to 30 cm (5 to 12") taller with all of the Ntreatments compared to the check (Table 6). Plants were tallest with the AS and Urea + AS treatments, intermediate with the UAN, UAN + S and urea treatments, and significantly shorter with AA whenaveraged over N rates. Difference between the two N rates was not significant at the P - 95% level.
Yields
Grain and silage yields were Increased over the check by all of the N treatments while stover yieldswere increased by only the 150-lb treatments (Table 7). Grain moisture was reduced significantlyfrom the check by all of the N treatments.

136
When averaged over N rate, significant differences (P - 90% level) in stover and silage yields werenot found among the N source treatments. Grain yields were highest with the AA and AS treatments andwere significantly reduced (about 13%) with the UAN and UAN + S treatments. Stover, silage, andgrain yields were all increased significantly by the 150-lb N rate over the 75-lb rate. Interactionsbetween N source and N rate were not significant at the P = 95% level.
Table 7. Corn yields and N uptake as influenced by N source anc1 rate of application in Waseca Co.
N Treatment Yields Grain
Moisture
N Uptake . ,
Source Rate Stover Silage Grain Grain Total-
Lb N/A TDM/A bu/A % lb N/A
CHECK 0 1.37 3.53 67.4 24.3 32.4 43.2
AA 75 1.94 5.47 121.7 22.0 60.9 78.3ii
150 2.08 6.09 141.0 21.1 80.8 101.5
AS 75 2.36 5.76 120.6 21.5 63.1 84.3ii
150 2.23 6.07 143.2 20.4 84.8 104.2
UAN 75 1.90 5.16 102.9 22.2 49.9 64.4ii
150 2.32 6.05 122.4 20.8 66.2 84.4
UAN+S 75 1.74 4.57 104.4 21.4 50.4 63.9•t
150 2.38 6.34 129.9 21.0 74.7 94.8
Urea 75 1.83 4.88 108.9 22.7 55.0 69.4ii
150 2.61 6.68 143.0 22.2 82.3 104.6
JUR+JAS 75 1.98 5.31 124.4 21.9 66.0 81.4ii
150 2.19 5.85 131.3 20.3 72.0 88.5
Signif. Level (%): 99 99 99 99 99 99
BLSD (.05) .59 .89 19.1 1.3 16.4 20.5
CV (%) 18. 12. 12. 4.1 18. 18.
INDIVIDUAL FACTORS
N Source
AA 2.01 5.78 131.3 21.5 70.9 89.9
AS 2.29 5.92 131.9 20.9 74.0 94.3
UAN 2.11 5.60 112.7 21.5 58.1 74.4
UAN+S 2.06 5.46 117.1 21.2 62.6 79.3
Urea 2.22 5.78 126.0 22.5 68.6 87.0
JUR+iAS 2.08 5.58 127.9 21.1 69.0 85.0
Signif. Level (%): 46 29 95 98 88 88
BLSD (.05)•
16.8 .97
N Rate (lb/A)75 1.96 5.19 113.8 21.9 57.5 73.6
150 2.30 6.18 135.1 20.9 76.8 96.4
Signif. Level (%): 99 99 99 99 99 99
INTERACTION Significance Level (%)Source x Rate 91 91 45 26 43 51
Grain + stover
N Uptake
Nitrogen uptake in both the grain and total plant (grain + stover) was increased (P ° 95% level) overthe check by all treatments (Table 7). When averaged over N rates, differences among N sources werenot significant although N uptake was consistently lowest with the UAN and UAN + S treatments.Uptake of N was significantly (P - 99% level) increased by the 150-lb N rate over the 75-lb rate whenaveraged over N sources. There was no N source by N rate interaction.

137
Sulfur Concentrations
Sulfur application rates with the AS, UAN + S, and urea + AS treatments totaled 170, 12, and 85 lbS/A, respectively. The 170-lb S rate consistently resulted in highest leaf, stover, and grain S(Table 8). Leaf, stover, and grain S were also increased with the 85-lb rate. The 12-lb rateapplied with UAN did not affect leaf S concentrations but did increase stover and grain S slightly.Sulfur uptake in the grain was only increased with the AS treatment (170 lb S/A) while total plant Suptake was increassed with both the 85- and 170-lb S rates. Nitrogen:S ratios ranged from 8.7 to17.7 for leaves, 4.5 to 10.2 for stover, and 11.7 to 15.1 for grain. In all cases lowest N:S ratioswere found with the 85 and 170-lb S rates as AS while highest N:S ratios occurred with the AAtreatments. Slight reductions inthe N:S ratio were noted with the UAN + S treatment.
Table 8. Sulfur concentrations and uptake by corn as influenced by N sources in Waseca Co.
uN Source
Leaf
S
Stover
S
Grain
S
Sulfur UptakeGrain Total
lb S/A
AA .150 .050 .080 5.38
AS .297 .097 .104 7.07
UAN .150 .042 .080 4.68
UAN+S .162 .055 .089 5.50
Urea .160 .043 .080 5.45
1UR+JAS .235 .071 .098 6.13
Signif. Level (%)BLSD (.05)CV (%)
y 150 lb N/A
99
.034
13.
99
.010
12.
99
.008
6.1
99
1.12
12.
7.42
11.38
6.70
8.04
7.72
9.36
99
1.59
13.
SUMMARY
Although differences did exist among the N sources when averaged over N rates, these differences didnot show a consistent advantage for any one particular source. In Goodhue Co. slight advantagesappeared with AS and UAN + S while urea and urea + AS resulted in the poorest yields. In Waseca Co.,highest yields and N uptake were obtained with AA and AS while UAN and UAN + S resulted in the lowestyields. Corn production was maximized by the 150-lb rate at both locations.
Corn production was not enhanced significantly by the sulfur in the N treatments although S concentrations in the plant and S uptake were increased at both locations. A nitrogen budget calculatedfrom the plant N uptake and residual soil NO data in Goodhue Co. indicated N recovery to range from33 to 56%, indicating substantial loss of N in 1986. Since SOA-S is mobile and is easily leached,the extremely wet conditions during the growing season may have accounted for the rather consistentincreases in plant S concentrations and S uptake with the 57 and 114-lb rates of S applied as AS.
ACKNOWLEDGEMENT
Sincere appreciation is extended to Allied Corporation, Division of Fibers and Plastics, for theirfinancial assistance in this project.

138
NITROGEN LOSS TO TILE LINES
AS AFFECTED BY TILLAGE
Waseca, 1986
G. W. Randall and P. L. Kelly
Nitrogen losses to tile lines have been documented in a number of research studies including someconducted at Lamberton and Waseca, Minnesota. These studies primarily showed that N losses were afunction of the N application rate and amount of precipitation. To some degree the time ofapplication and crop grown have been shown to influence NO -N loss to tile lines. The purpose ofthis long-term study is to determine if tillage has an effect on N utilization, accumulation of NO.-Nin the soil profile, and the subsequent loss of NO.-N to tile lines.
EXPERIMENTAL PROCEDURES
A study was initiated in 1975 on a Webster clay loam at Waseca to monitor the movement of N into atile line installed in each of 12 plots measuring 45' by 50'. Each plot is enclosed with plasticsheeting to a 6' depth. Annual N rates of 0, 100, 200, and 300 lb N/A were applied from 1975-1979.No N was applied for the 1980 and 1981 crops. Residual N from N applied over the 5-year period(75-79) was utilized by the 1980 and 1981 corn crops. Soil samples to 10" and tile water samplestaken in late 1981 showed little remaining evidence of the previous treatments.
In the fall of 1981, eight plots with the most uniform tile flow rates over the 1975-81 period wereselected. Two tillage treatments (fall moldboard plow and no tillage) were replicated four times andrandomized over the previous plot histories. Corn was grown on these plots in 1982 through 1985.The stalks were chopped in October, 1985 and moldboard plots plowed.
On April 22, 180 lb N/A as ammonium nitrate was broadcast applied to the surface of all plots. Themoldboard treatment was then field cultivated. Corn (Pioneer 3732) was planted on May 3 at apopulation of 27700 plants/A with a John Deere Max-Emerge planter equipped with ripple coulters.Starter fertilizer was not used because of the high soil tests. Counter was applied at 1 lb (ai)/Ato control rootworms. Weeds were controlled with a preemergence application of Lasso (3. lb/A) andatrazine (3 lb/A) applied May 15. Weed and insect control was excellent.
The leaf opposite and below the ear was taken from 10 randomly selected plants per plot at silking(Moldboard plow = July 18, No tillage - July 21) and was analyzed for N. Silage and grain yieldswere taken at physiological maturity by hand harvesting 30 and 60' of row, respectively, from eachplot.
Tile lines began flowing in mid March, 1986 and continued to flow intermittently until mid-July.Conditions were extremely dry in late-July and August and no tile flow was recorded during thisperiod. Tile lines commenced flowing again in late September and flowed throughout October. Whentile lines were flowing, flow rates were measured daily and samples taken on a Monday, Friday,Wednesday two-week rotation for NO analysis. All analyses were done by the Research Analytical Lab.
Soil N0.J-N in the 0-8' profile was determined from two cores/plot taken in 1-foot increments onOctober "73, 1986.
RESULTS
Although yields and N removal tended to be consistently higher with the moldboard plow (MP) systemcompared to the no tillage (NT) system, differences between the two tillage systems were not significant at the P = 90% level (Table 1). Leaf and grain N and final population were not influencedby tillage system. Experimental variability was low as indicated by CV's below 5 for yield. Theseend-of-season results are markedly different from what was expected in mid-July. At that time, theMP plots exhibited larger corn growth with a dark green color, and advanced maturity compared to theshorter corn that showed N deficiency symptoms on the NT plots.
Please refer to title page of this publication for information regarding application and use of thisarticle.

139
Table 1. Influence of tillage system on corn production and N utilization at Waseca in 1986.
Tillage Final
population
Leaf
N
Silage Grain
system Yield N uptake Yield N N removal
Moldboard Plow
No Tillage
xlO-3
27.2
28.2
%
2.38
2.45
T DM/A
7.19
7.10
lb N/A
129.3
123.5
bu/A
143.4
136.1
%
1.32
1.25
lb N/A
90.0
80.6
Signif. Level (%)CV (%)
>M 81
2.8
35
7.8
30
4.0
43
10.
78
4.8
81
4.7
81
9.3
1/ Probability level of significance.
Precipitation for April, June and the September-October period was 1.5, 3.3 and 3.0 inches abovenormal, respectively. Thus, most of the tile flow shown in Table 2 occurred in April, May, June andOctober. Total tile flow was slightly higher from the NT plots, however, the flow-weighted NO.-Nconcentration was slightly lower. Total NO.-N lost via the tile lines was not different between thetwo tillage systems. Average NO.-N concentrations in the tile water continued their upward movementfrom about 11 mg/L in 1984 to 12 mg/L in 1985 to between 12.8 and 14.0 mg/L in 1986.
Table 2. Influence of tillage system on tile flow, NO.-N concentration and NO.-N loss in
Tillagesystem
Moldboard Plow
No Tillage
— Flow-weighted
Tile
flow
acre inches
15.8
17.4
Nitrate-N
Concentration—
mg/L
14.0
12.8
Loss
lb N/A
48.2
52.0
1986.
Month
Parameter Mar Apr May June July Sept Oct Nov Total
Tile Flow MP
NT
MP
NT
MP
NT
2.32
1.46
12.7
9.9
2.57
3.50
13.2
11.1
3.64
4.29
13.3
12.3
3.82 .34
4.26 .49
mg/L -15.6 14.717.8 14.0
.76
.53
2.38
2.82
.01
.03
15.83
17.38
NO.-N Concentration 12.6
13.6
15.0
13.3
15.0
10.8
14.0
12.8
NO -N Loss 6.1
3.4
7.7
9.0
11.6
11.7
13.2 1.2
17.9 1.6
1.9
1.5
7.6
8.2
0.02
0.07
48.2
52.0
Residual NO.-N in the soil profile at the end of the 1986 growing season showed about 80 lb/A more Nremaining with the NT system (Table 3). Greater amounts of NO. were found at each 1-foot Incrementwith the NT system. The largest differences between the two tillage systems occurred below 5' wheresubstantially more NO. had accumulated with NT. These results are somewhat different from 1985 whenonly about 30 lb moreTl remained under the NT system.

140
Table 3. Influence of tillage systems on residual NO -N in the soil profile in Oct.,
Profile
depth
feet
0-1
1-2
2-3
3-4
4-5
5-6
6-7
7-8
Total (lb N03-N/A 0-8')
Tillage SystemMb. Plow No Tillage
- N03-N (lb/A) -
14.2 18.5
13.2 28.7
24.2 26.4
29.0 36.2
27.2 28.9
19.3 37.3
17.4 32.0
15.8 29.9
160.3 237.9
1986.
FIVE-YEAR SUMMARY
The cumulative totals for the 5-year period (1982-1986) are shown in Table 4. Cora yields over thisperiod have averaged 8 bu/A better with moldboard plow tillage. Approximately 10% more N has beenremoved in the grain with moldboard plow tillage. This has been due to both higher yields andslightly higher grain N concentrations with the moldboard tillage system some years. Even so, verylittle difference in applied N removed in the grain exists between the two treatments (48% vs 44% forMP vs NT, respectively). Even though total water flow and NO -N lost through the tile lines wasabout 10% higher with no tillage, this small difference is considered to be insignificant whenconsidering tile flow variability among the eight plots over this 5-year period.
Table 4. Cumulative effects of the two tillage systems over the 5-year period.
Parameter
Fert. N applied (lb/A)Corn grain removed (bu/A)N removed in grain (lb/A)N removed in grain as a percent of
applied N (%)Tile flow (acre inches)Nitrate-N lost in tile (lb/A)N lost via tile lines as a percent of
applied N (%)
Mb. plow
Tillage System
No tillage
900
673
436
48
56.9
136.6
15
900
633
396
44
61.1
149.3
17

141
STARTER FERTILIZER PLACEMENT EFFECTS ON CORN PRODUCTION
Waseca, 1986
G. W. Randall and P. L. Kelly
Starter fertilizers will increase in popularity as farmers attempt to maximize return from theirfertilizer dollar and as reduced tillage becomes more popular. However, with less spring secondarytillage, farmers sometimes encounter problems with the conventional disk opener systems when moistsoil is dislodged by them and then sticks to the depth bands on the planter. The result can beuneven seeding depth. To correct this problem, farmers would like to remove the disk opener fertilizer attachment and Instead place the starter fertilizer directly with the seed rather than in theconventional 2 x 2" placement. The purpose of this study was to evaluate seed placement versus2 x 2" placement of three liquid fertilizers on the early growth, final stand, and yield of corn.
Experimental Procedures
A Nicollet clay loam soil planted to corn in 1985, moldboard plowed In the fall, and field cultivatedin the spring was the experimental site. The soil tests were: pH - 6.4, OM •= High,Bray P - 72 lb/A (VH), and exchangeable K - 390 lb/A (VH).
A randomized, complete block design with four replications was used. Factorial treatments consistingof three liquid starter fertilizers (10-34-0, 9-18-9 and 7-21-7), three rates and two placementmethods (directly with the seed and 2" to the side and below) plus a no starter fertilizer check wereapplied. The 10-34-0 and 7-21-7 were applied at rates of 5, 10 and 15 gal/A while the 9-18-9 wasapplied at 4, 8, and 12 gal/A to give similar salt rates among all three sources.
Corn (Pioneer 3732) was planted in 30" rows with a JD Max-Emerge planter at 27,700 plants per acre onMay 3. The liquid materials were applied either directly on the seed by running the delivery tubebetween the double disk openers on the planter or in the 2 x 2" position with the starter fertilizerdisk opener. Counter (1 lb al/A) was used as the rootworm insecticide. Chemical weed control
^"""Nnsisted of 3. qt. Lasso and 3i qt. Bladex/A applied preemergence.
Plant counts to obtain emergence rate and final stand were then taken daily from two rows each 55'long for 12 days beginning on the 9th day after planting. Grain yield was determined by harvestingeach plot with a modified JD 3300 plot combine.
Results and Discussion
Growing conditions following planting were excellent for corn germination and emergence. Soil temperature at the 2" depth averaged well above 50°F (Table 1). Soil moisture in the seed zone wasslightly below field moist capacity at planting. Six days after planting 0.57" of rain thoroughlywet the seed zone. This was followed by 1.74" on the next two days which more than likely leachedmuch of the salt from the seed zone.
The salt rate (N+K.0) of fertilizers has been shown to be important when applying fertilizer with theseed. Ammonia toxicity and/or salt burn can affect the germination of seedlings. A rule of thumb inMinnesota based on older research is not to apply more than 15 lb of N+K.0/A. The N+K.O applicationrates with the various treatments are shown in Table 2. Salt levels are higher for 7-21-7 and 9-18-9than for 10-34-0 because of the K component. Fifteen gallons of either 10-34-0 or 7-21-7 and 12 galof 9-18-9 clearly exceeded the 15 lb/A threshold.
Please refer to title page of this publication for information regarding application and use of thisarticle.
n

142
Table 1. Dally precipitation and average soil temperatures (2" depth) in the 2-week period followingplanting.
Days after Avg. Soilplanting temperature (2") Precipitation
*F inches
1 60 0
2 69 0
3 70 0
4 65 0
5 61 .02
6 59 .57
7 59 .36
8 56 1.38
9 62 0
10 66 .11
11 53 .53
12 60 0
13 57 T
14 56 .02
Table 2. Salt rate as influenced by starter fertilizer material and rate of application.
Application Liquid fertilizer
rate 7-21-7 10-34-0 9-18-9
gal/A
4 7.7
5 7.5 6
8 15.4
10 15.0 12
12 23.1
15 22.5 18
Emergence rate was generally delayed by about 1 day by the seed-placed fertilizers, especially withthe high rate of application (Table 3). Application of the high rate of all fertilizer materialswith the seed resulted in less than 50% of the plants emerged on the 10th day following plantingcompared to about 75% with the 2 x 2" placement. Emergence rates did not appear to be affecteddifferently by the three liquid fertilizers. By 14 days after planting emergence had approached 100%regardless of treatment.
Final populations of the starter fertilizer treatments were not significantly lower than the checktreatment (Table 4). Factorial analyses (Table 5) showed no population differences among the threeliquid fertilizer materials and the three application rates but did show a highly significantdifference (P =• 99% level) between the two placement positions. However, when averaged overmaterials and rates, seed placement reduced the final population by only 2% compared to 2 x 2" placement. Interactions between material and rate of application, material and placement, and rate andplacement were not significant at the P •> 90% level.
Grain yield and moisture were not affected significantly (P - 95% level) by any of the treatments(Tables 4 and 5). A yield response was not obtained over the check yield.
Conclusion
Application of 10-34-0, 7-21-7 and 9-18-9 at the higher rates with the seed resulted in about a 1-daydelay in emergence and a 2% reduction in population but did not affect yield. Moist conditions atplanting and the 2.33" of rain that occurred from 5 to 8 days after planting more than likely dilutedand moved the salts out of the seed zone. To be on the safe side, however, we cannot recommend ratesgreater than 10 gal/A with these materials when applied with the seed. Rates should be reducedfurther if soil conditions are very dry at planting and/or soils are lower in organic matter andcoarse to medium textured. Application of urea-containing starter fertilizers (9-18-9) is discouraged even at low rates because of potentially severe phytotoxicity of the urea.

143
Table 3. Influence of liquid starter fertilizer material, application rate, and placement onemergence rate of corn.
Treatment Days after plantingMaterial Rate Placement 9 10 11 12 13 14 16 18 20
gal/A E final stand
None 0 Check 16 72 89 99 99 99 99 100 1007-21-7 5 Seed 8 59 79 89 95 97 97 98 100
ti ii 2x2 12 78 91 99 100 100 100 100 100it
10 Seed 1 35 57 87 95 97 98 99 100it •i 2x2 8 77 92 97 100 100 100 100 100it
15 Seed 5 48 66 90 97 100 100 100 100ti ii 2x2 20 77 91 98 99 100 100 100 100
10-34-0 5 Seed 17 77 91 99 99 99 99 100 100ti ii 2x2 20 80 89 97 99 99 100 100 100ti
10 Seed 8 49 69 93 98 98 99 100 100it ti 2x2 15 67 89 98 100 100 100 100 100n
15 Seed 4 44 61 90 95 99 100 100 100it ii 2x2 10 75 89 98 100 100 100 100 100
9-18-9 4 Seed 11 69 87 95 97 98 99 100 100n ii 2x2 5 69 87 94 95 97 99 100 100n
8 Seed 5 62 82 93 99 100 100 100 100ii ii 2x2 11 68 87 94 99 99 100 100 100it
12 Seed 6 46 66 85 93 98 97 99 100it ii 2x2 17 79 93 99 99 99 100 100 100
Table 4. Influence of liquid starter fertilizer material, application rate and placement on plantpopulation, grain moisture and corn grain yield.
Rate Placement
Final
populationCorn grain
Material Moisture Yield
gal/A ppA x 10 % bu/A
None 0 Check 27.1 22.3 144.6
7-21-7 5 Seed 27.1 21.1 139.3ti ii 2x2 26.9 21.7 145.4tt 10 Seed 26.2 21.7 137.3tt ii 2x2 27.3 22.3 144.7ii 15 Seed 26.1 21.8 138.9it ii 2x2 27.1 21.4 146.4
10-34-0 5 Seed 26.1 21.4 137.8it ti 2x2 27.7 21.7 141.8ii 10 Seed 27.1 21.9 151.3it it 2x2 27.0 21.6 147.4it
15 Seed 26.2 21.6 143.9ti ii 2x2 26.6 21.7 143.9
9-18-9 4 Seed 27.1 21.7 143.4it ii 2x2 27.0 22.0 152.3ti 8 Seed 26.2 21.7 142.3ii ii 2x2 27.3 22.1 141.5ii 12 Seed 26.4 20.7 144.5ii it 2x2 27.5 21.4 141.6
Signif. Level (%):^ 99 81 60
BLSD (.05) 1.2 - -
CV (%) 2.5 3.0 5.4
1/ Probability level of significance.

144
Table 5. Factorial analyses of the effect of liquid starter fertilizer material, rate, and placementon corn production parameters.
Factors
MAIN FACTORS
Material
7-21-7
10-34-0
9-18-9
Signif. level (%) i
Rate (gal/A)57-T10/8
15/12
Signif. level (%):
Placement
Seed
2x2
Signif. level (%):
INTERACTIONS
Material x Rate
7-21-7 5ii
10it
15
10-34-0 5ii
10tt
15
9-18-9 4ii
8ii
12
Signif. level (%):
Material x Placement
7-21-7 Seedii 2x2
10-34-0 Seedii
2x2
9-18-9 Seedii
2x2
Signif. level (%)i
Rate x Placement
5/4 Seed2x2
10/8 Seed2x2
15/12 Seed" 2x2
Signif. level (%):
Material x Rate x Placement
Population
ppA x 10
26.8
26.8
26.9
27
Moisture
Corn grainYield
%
21.7
21.6
21.6
8
bu/A
142.0
144.3
144.3
51
27.0 21.6 143.3
26.9 21.9 144.1
26.6 21.4 143.2
75
26.5
27.1
99
94
21.5
21.8
91
142.1
145.0
89
27.0 21.4 142.3
26.8 22.0 141.0
26.6 21.6 142.6
26.9 21.5 139.8
27.1 21.7 149.4
26.4 21.7 143.9
27.0 21.9 147.9
26.7 21.9 141.9
27.0 21.1 143.1
53 89 92
26.5 21.6 138.5
27.1 21.8 145.5
26.5 21.6 144.3
27.1 21.7 144.4
26.6 21.4 143.4
27.3 21.8 145.1
56 73
26.8 21.4 140.2
27.2 21.8 146.5
26.5 21.8 143.6
27.2 22.0 144.5
26.2 21.4 142.4
27.1 21.5 144.0
40 19 58
Significance level (%)
99 60 26

145
SOIL TEST COMPARISON STUDY
Waseca, 1986
G. W. Randall and P. L. Kelly
Soil testing is one of the best and most economical methods of ascertaining the nutrient status ofthe soil. The test then serves as the basis for fertilizer recommendations for crops. Many privateand public laboratories provide that service to Corn Belt farmers. The purpose of this study is tocompare the soil analyses and fertilizer recommendations given by five regional laboratories for cornproduction in Southern Minnesota. Working with the laboratories in this comparison study we shouldbe able to improve and standardize fertilizer recommendations for corn and soybean production.
PROCEDURES '
Two experimental sites measuring 150' by approximately 300* were selected for sampling in October,1979. One of the sites had a history of high P and K fertilization while the other had not receivedP or K since 1974. The soil type in the former is a Nicollet clay loam while that in the latter isprimarily Webster clay loam with some Nicollet clay loam. Tile lines spaced at 75' intervals provideexcellent drainage at both siteB. Neither site can be irrigated.
Four samples consisting of approximately 35 cores each from a 0-7" depth were taken from each site.All samples were oven dried at 95°F, crushed and mixed thoroughly. The samples were then subdividedand sent to five laboratories which test the majority of the soil samples from Southern Minnesota.The laboratories were: A & L Agricultural Laboratories, Inc., Omaha, NE; Harris Laboratories, Inc.,Lincoln, NE; Minnesota Valley Testing Laboratories, Inc., New Ulm, MN; AMOCO/Cropmate Co.,Reinbeck, IA; and University of Minnesota Soil Testing Laboratory, St., Paul, MN. Soil analyses requested consisted of pH, OM, extractable P, exchangeable K, extractable S and the micronutrientsgenerally tested by each laboratory. Based on the results from the U of M laboratory these two siteswere then classified as being initially "very high" and "medium-high". The fertilizer recommendations given by the five laboratories were then applied as five treatments in the spring of 1980for corn. An additional check (no fertilizer) treatment was included in the randomized,complete-block design with six replications. Each plot measures 15' wide and 55' long.
After the 1980 crop, soil samples (5 cores/plot times 6 replications yielding 30 cores per treatment)were taken yearly from each treatment and sent to the respective laboratory. This allowed us tofollow the buildup or decline of nutrients in the soil as affected by the recommendations of aparticular laboratory over time. After 6 years (1980-85) the "very high" fertility site wasterminated.
Fertilizer amounts based on the analyses and recommendations from the summer 1985 samples wereapplied October 31 to the appropriate plots before moldboard plowing. These fertilizer recommendations were based on a soybean yield goal of 55 bu/A following corn. Soybeans (Hardin) were plantedin 15" rows on May 22. Chemical weed control consisted of 3i qt. Lasso and 6 qt. Amiben/A appliedpreemergence to all plots.
Seed yield and moisture were determined by harvesting each plot with a modified JD 3300 plot combine.Yields were converted to 13.5% moisture.
In August, 1986, 0-7" soil samples were taken from each treatment except Cropmate's and were sent tothe laboratory of the respective treatment. (The Cropmate laboratory Is no longer in operation.)The recommendations obtained from these samples will be used for the 1987 growing season.
Please refer to title page of this publication for information regarding application and use of thisarticle.

146
Medium-high testing site
The soil test results and the accompanying recommended fertilizer program of each laboratory areshown in Table 1. While the numeric values of the five laboratories were generally similar thecorresponding interpretation (whether the soil tested high, low, medium, deficient etc.) variedsubstantially. Phosphorus and K recommendations among the labs were quite different. Nitrogen wasrecommended by two of the labs. Also, sulfur and zinc were each recommended by a private lab. Onlyone of the four private labs recommended liming the soil.
Table 1. Soil test results and the recommended fertilizer program from each laboratory on the
Soil Test LaboratoryTest A&L Harris MVTL
« •Cropmate U of M
Soil Test Resultsi'
pH 6.3 6.7 6.3 6.5 6.8
pH (buffer) 6.7 7.0 7.0
Phosphorus 22 H 24 L 27 VH 36 H 17 H
Potassium 187 M 132 D 135 H 100 L 145 H
Organic matter (%) 4.7 H 4.2 A 4.3 M 5.6 H
Calcium 3200 H 3471 E 4350 2410 H
Magnesium 540 VH 440 A 590 363 H
Sulfur 8 M 8 A 16 VH 21 H 4 LM
Iron 74 VH 44 E 39 S
Manganese 31 VH 20 E 16 S 2.1 VH
Zinc 3.3 H 1.3 E 1.2 H 1.6 M 1.3 M
Copper 1.5 H 1.0 A 1.1 S
Boron 1.7 H 1.4 S
ENR (lb/A) 96 112
C.E.C. (meq/100 g) 23.4 21.4 27 15.3 _•>--
~ All soil test results are stated in ppm unless noted otherwise.
Nutrient A&L Harris MVTL Cropmate
- Recommended Fertilizer Progr
Nitrogen 10
Phosphorus (-?2°s)Potassium (K.O)Sulfur
25
40
10
Iron —
Manganese —
Zinc —
Lime (T/A) 1.5
>215'
U
1.5
0
0
43
0
283/124^'
U of M
0
20
40
II
II
All values indicate pounds of nutrients recommended per acre for a yield goal of 55 bushelsof soybeans per acre.
— Value includes maintenance recommendation, plus 50% of the buildup recommendation which wasto be applied over a two-year period.
The treatments that received fertilizer yielded significantly more than the unfertilized check(Table 2). However, there were no significant yield differences among the fertilizer treatments(recommendations).

Table 2.
147
Effect of fertilizer recommendations on soybean seed yield on the medium-high testing siteat Waseca in 1986.
Lab
A&L
Harris
MVTL
CropmateU of M
Check
Fertilizer Recommendations
10 N
20 N
lb/A*
25 P + 40 K + 10 S72 P + 215 K + 1.5 ZN
43 K
28 P + 124 K
20 P + 40 K
Signif. Level (%)BLSD (.05)CV (%)
2/
•j, P and K expressed on oxide baBis.— Probability level of significance.
Yield
bu/A
55.8
57.3
55.3
55.154.7
48.9
99
3.0
4.7
Seed
Moisture
14.9
15.0
14.9
15.0
14.8
14.7
99
.2
1.0
SUMMARY - 1986
Substantial differences again existed among the laboratories fertilizer recommendations. Highamounts of P were recommended by the Harris lab while high amounts of K were recommended by theHarris and Cropmate Labs. Nitrogen, micronutrients and sulfur were recommended by two of the fourprivate labs.
Differences in grain yield were not observed among the five laboratories' recommendations. Yieldswere excellent.
Fertilization resulted in highest profit from the MVTL recommendations and no profit from the Harrisrecommendations (Table 3). Fertilizer costs ranged from $4/A with the MVTL recommendation to $39/Awith the Harris recommendation.
Table 3. Effect of fertilizer recommendations on yield, value, fertilizer, cost and economic returnon the medium-high testing Bite at Waseca in 1986
Value Ferti/2/
Return-'Lab Yield @ 4.57/bu cost
bu/A $/A
A&L 55.8 255 13 19
Harris 57.3 262 39 0
MVTL 55.3 253 4 26
Cropmate 55.1 252 17 12
U of M 54.7 250 8 10
Check 48.9 223 —— ""
Using May, 1986 prices for each nutrient expressed as dollars/lb as follows:. N, .18; P 0 , .20; K,0, .09; S, .28; Zn, 1.09.
^ Return yiell value @4.57/bu - (fertilizer cost & value of check trt).
SEVEN-YEAR SUMMARY
Yield responses paid for the fertilizer recommendations made by all five laboratories (Table 4).However, net return was highest with the lowest cost fertilizer recommendations. The higher costrecommendations given by A&L, Harris, and Cropmate resulted in lowest economic return. It isinteresting to note the very narrow range in crop value among the five laboratories over this 7-yearperiod (a low of $2409/A to a high of $2421/A).

148
Table 4. Effect of fertilizer recommendations on total crop value, total fertilizer cost and result-Ing economics on the medium-high testing site at Waseca from 1980-86.
Lab
A&L
Harris
MVTL
CropmateU of M
Check
Crop .Value1'
2409
2421
2412
2411
2415
1826
7-Yr Total
Fertilizer
cost
%Tk
384
474
287
449
263
0
%iReturn-
+199
+121
+299
+136
+326
1/
U
3.00, 2.40, 3.00 and $2.07/bu used for corn in 1980, 1981, 1983 and 1985,respectively, and 5.50, 6.00 and $4.57/bu used for soybeans in 1982, 1984and 1986, respectively, for a seven-year total crop value.Return over 7-year period - crop value - (fertilizer cost & value of checktreatment.
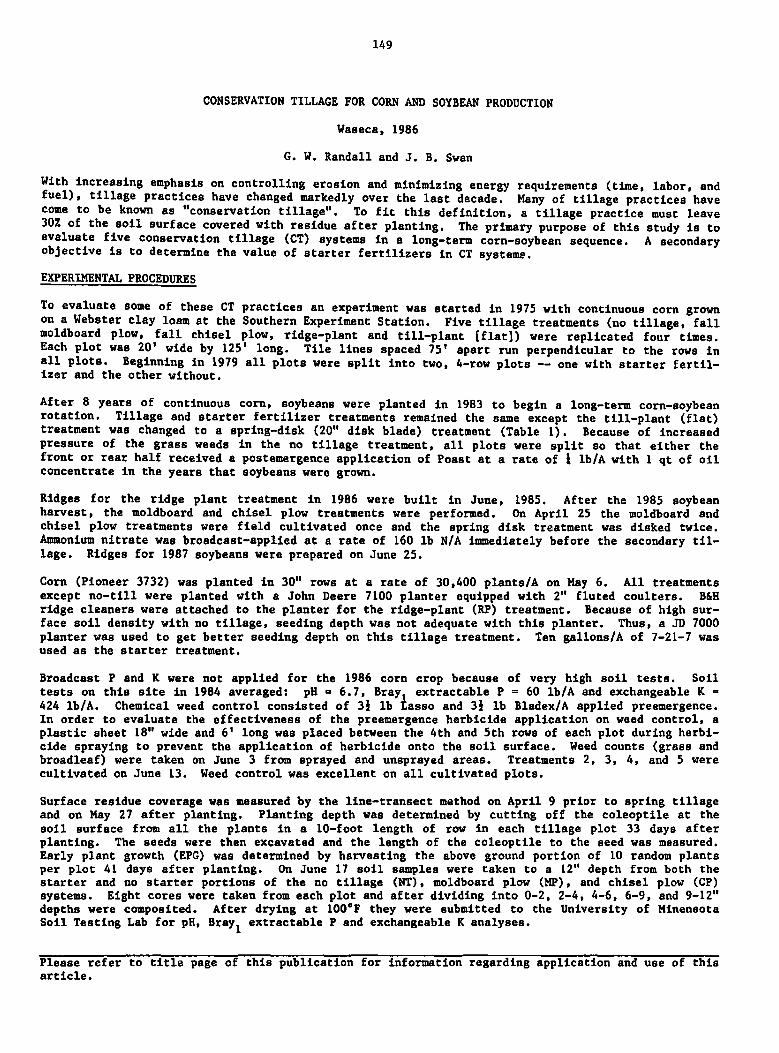
149
CONSERVATION TILLAGE FOR CORN AND SOYBEAN PRODUCTION
Waseca, 1986
G. W. Randall and J. B. Swan
With increasing emphasis on controlling erosion and minimizing energy requirements (time, labor, andfuel), tillage practices have changed markedly over the last decade. Many of tillage practices havecome to be known as "conservation tillage". To fit this definition, a tillage practice must leave30% of the soil surface covered with residue after planting. The primary purpose of this study is toevaluate five conservation tillage (CT) systems in a long-term corn-soybean sequence. A secondaryobjective is to determine the value of starter fertilizers in CT systems.
EXPERIMENTAL PROCEDURES
To evaluate some of these CT practices an experiment was started in 1975 with continuous corn grownon a Webster clay loam at the Southern Experiment Station. Five tillage treatments (no tillage, fallmoldboard plow, fall chisel plow, ridge-plant and till-plant [flat]) were replicated four times.Each plot was 20' wide by 125' long. Tile lines spaced 75' apart run perpendicular to the rows inall plots. Beginning in 1979 all plots were split into two, 4-row plots — one with starter fertilizer and the other without.
After 8 years of continuous corn, soybeans were planted in 1983 to begin a long-term corn-soybeanrotation. Tillage and starter fertilizer treatments remained the same except the till-plant (flat)treatment was changed to a spring-disk (20" disk blade) treatment (Table 1). Because of increasedpressure of the grass weeds in the no tillage treatment, all plots were split so that either thefront or rear half received a postemergence application of Poast at a rate of I lb/A with 1 qt of oilconcentrate in the years that soybeans were grown.
Ridges for the ridge plant treatment in 1986 were built in June, 1985. After the 1985 soybeanharvest, the moldboard and chisel plow treatments were performed. On April 25 the moldboard andchisel plow treatments were field cultivated once and the spring disk treatment was disked twice.Ammonium nitrate was broadcast-applied at a rate of 160 lb N/A immediately before the secondary tillage. Ridges for 1987 soybeans were prepared on June 25.
Corn (Pioneer 3732) was planted in 30" rows at a rate of 30,400 plants/A on May 6. All treatmentsexcept no-till were planted with a John Deere 7100 planter equipped with 2" fluted coulters. B&Hridge cleaners were attached to the planter for the ridge-plant (RP) treatment. Because of high surface soil density with no tillage, seeding depth was not adequate with this planter. Thus, a JD 7000planter was used to get better seeding depth on this tillage treatment. Ten gallons/A of 7-21-7 wasused as the starter treatment.
Broadcast P and K were not applied for the 1986 corn crop because of very high soil tests. Soiltests on this site in 1984 averaged: pH = 6.7, Bray, extractable P = 60 lb/A and exchangeable K =424 lb/A. Chemical weed control consisted of 3} lb Lasso and 3J lb Bladex/A applied preemergence.In order to evaluate the effectiveness of the preemergence herbicide application on weed control, aplastic sheet 18" wide and 6' long was placed between the 4th and 5th rows of each plot during herbicide spraying to prevent the application of herbicide onto the soil surface. Weed counts (grass andbroadleaf) were taken on June 3 from sprayed and unsprayed areas. Treatments 2, 3, 4, and 5 werecultivated on June 13. Weed control was excellent on all cultivated plots.
Surface residue coverage was measured by the line-transect method on April 9 prior to spring tillageand on May 27 after planting. Planting depth was determined by cutting off the coleoptlle at thesoil surface from all the plants in a 10-foot length of row in each tillage plot 33 days afterplanting. The seeds were then excavated and the length of the coleoptlle to the seed was measured.Early plant growth (EPG) was determined by harvesting the above ground portion of 10 random plantsper plot 41 days after planting. On June 17 soil samples were taken to a 12" depth from both thestarter and no starter portions of the no tillage (NT), moldboard plow (MP), and chisel plow (CP)systems. Eight cores were taken from each plot and after dividing into 0-2, 2-4, 4-6, 6-9, and 9-12"depths were composited. After drying at 100°F they were submitted to the University of MinensotaSoil Testing Lab for pH, Bray, extractable P and exchangeable K analyses.
Please refer to title page of this publication for information regarding application and use of thisarticle.
150
Corn leaf samples were taken on July 16 from all treatments except NT, which was sampled on July 18,by randomly sampling the leaf opposite and below the ear from the starter treatment within each tillage treatment. Yields were taken by combine harvesting the center two rows from each plot with amodified JD 3300 combine. Grain moisture and N concentrations were determined on each of thesesamples.
RESULTS
Since the 2-way and 3-way interactions at the bottom of Table 1 are non-significant (P * 90% level),the comparison of main effects (tillage, starter fertilizer, and previous Poast treatment) isappropriate.
Significant differences in final population, grain moisture and grain yield were found among thetillage treatments when averaged over starter fertilizer and previous Poast treatments (Table 1).Final population of the NT and RP plots averaged about 2500 plants/A fewer than with the othertreatments. Differences in final stand did not exist among the MP, CP and spring disk (SD)treatments. Final population was slightly higher with the starter fertilizer treatments but was notaffected by the previous application of Poast.
Grain moisture, an indication of maturity, was significantly higher with the NT treatment compared tothe CP, RP and SD treatments (Table 1). This was consistent with previous years when both continuouscorn and corn after soybeans were grown. Grain moisture for the MP, CP, RP and SD systems was notsignificantly different at the P = 95% level. Neither starter fertilizer nor the previous Poasttreatments affected grain moisture.
Grain yields were not significantly different (P = 95% level) among the MP, CP, RP and SD systemswhen averaged over starter fertilizer and Poast treatments (Table 1). The NT yields were closer tothose from the other tillage systems this year than in previous years but were still significantlylower than the MP, RP and SD systems. Starter fertilizer gave a highly significant 9.7 bu/A yieldincrease when averaged across tillage systems. Even though a statistically significant interactionbetween tillage system and starter fertilizer did not exist (18% level), largest responses to starterwere obtained with NT (12.7 bu/A), CP (12.1 bu/A), and RP (10.8 bu/A). Yield response to starterfertilizer averaged only 8.7 and 4.2 bu/A for the SD and MP systems, respectively. The. previousPoast treatments did show a 4.5 bu/A yield advantage which was significant at the P ° 92% level.This should perhaps be discounted because there was no Poast x tillage interaction and weed controlwas excellent with all tillage treatments except NT.
Early plant growth was affected significantly by the tillage systems (Table 2). Plants were largestwith the RP and CP systems, were intermediate in size with the MP and SD systems and weresignificantly smaller with NT. Starter fertilizer increased early plant weight by 9% when averagedacross tillage systems. The interaction between tillage and starter fertilizer was not significant(57% level). The correlation between EPG and grain yield was not significant when starter fertilizerwas used (r - +.397) but was significant at the 99% level when no starter was used (r - +.566). Alinear rather than curvilinear relationship was best for each. These relationships agree well withthose obtained in 1984.
Grain N was not influenced by tillage or starter fertilizer (Table 2.) However, N removal in thegrain (product of grain N concentration and grain yield) was affected significantly by both tillageand starter fertilizer. This effect was due largely to the yield differences among the treatments,which resulted in lowest N removal with the NT system and the plots without starter fertilizer.
Residue measurements taken prior to planting showed significant differences among the treatments forpercent of the soil surface covered with residue from the previous crops (Table 3). The treatmentsranked NT SD RP - CP MP. After planting, surface residue measurements were taken both within therow and randomly across the plot area. All tillage treatments showed significantly more residue thanthe MP treatment. However, only the RP and NT systems exceeded 30% and therefore met the definitionof "conservation tillage". Within the row measurements showed slightly less residue than randomacross the plot measurements for all tillage sytems except MP.
Planting depth was not affected significantly by the tillage systems (Table 3). This was notconsistent with previous years. The variability in the seeding depth as measured by standarddeviation and range in depths indicates least variability with the NT, CP, MP and SD systems andgreatest variability with the RP system. Seed placement averaged between 1.6" and 1.8" for the fivetillage systems. Even though these differences are less than in previous years with continuous corn,they do point out the need for careful adjustment of the planter even when following soybeans.
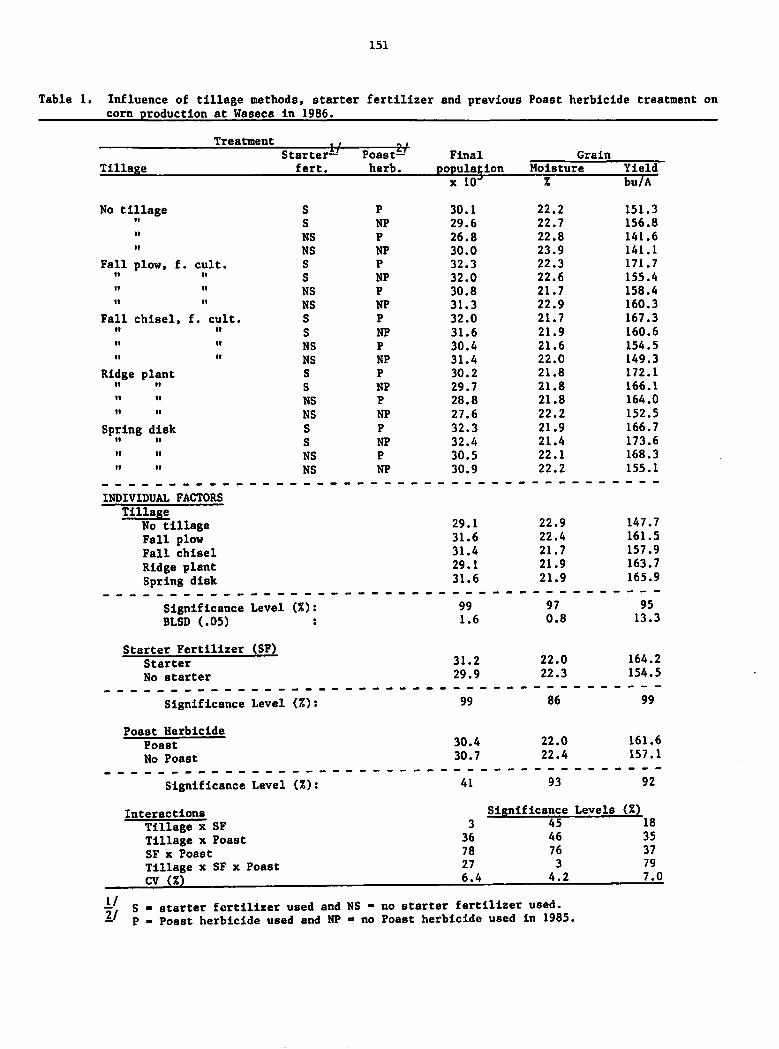
151
Table 1. Influence of tillage methods, starter fertilizer and previous Poast herbicide treatment oncorn production at Waseca ln 1986.
Treatment"/
Final
populationGrainStarter^-'
fert.
Poast-'herb.Tillage Moisture Yield
x 10J % bu/A
No tillage S P 30.1 22.2 151.3tt
S NP 29.6 22.7 156.8ii
NS P 26.8 22.8 141.6ii
NS NP 30.0 23.9 141.1
Fall plow, f. cult. S P 32.3 22.3 171.7ti ii
S NP 32.0 22.6 155.4ii it
NS P 30.8 21.7 158.4ii ii
NS NP 31.3 22.9 160.3
Fall chisel, f. cult. S P 32.0 21.7 167.3it ii
S NP 31.6 21.9 160.6n ii
NS P 30.4 21.6 154.5ii ii
NS NP 31.4 22.0 149.3
Ridge plant S P 30.2 21.8 172.1ti ii S NP 29.7 21.8 166.1ii ti
NS P 28.8 21.8 164.0ii it NS NP 27.6 22.2 152.5
Spring disk S P 32.3 21.9 166.7ii it S NP 32.4 21.4 173.6ii ti NS P 30.5 22.1 168.3ti ti NS NP 30.9 22.2 155.1
INDIVIDUAL FACTORS
TillageNo tillage 29.1 22.9 147.7
Fall plow 31.6 22.4 161.5
Fall chisel 31.4 21.7 157.9
Ridge plant 29.1 21.9 163.7
Spring disk 31.6 21.9 165.9
Significance Level (%): 99 97 95
BLSD (.05) ; 1.6 0.8 13.3
Starter Fertilizer (SF)Starter 31.2 22.0 164.2
No starter 29.9 22.3 154.5
Significance Level (%): 99 86 99
Poast Herbicide
Poast 30.4 22.0 161.6
No Poast 30.7 22.4 157.1
Significance Level (%): 41 93 92
Interactions Significance Levels (%)
Tillage x SF 3 45 18
Tillage x Poast 36 46 35
SF x Poast 78 76 37
Tillage x SF x Poast 27 3 79
CV (%) 6.4 4.2 7.0
y. S-starter fertilizer used and NS -no starter fertilizer used.—' p - Poast herbicide used and NP = no Poast herbicide used in 1985.