Solid Waste Management of Barangay Poblacion Almeria, Biliran
Upload
hoangkhanhCategory
view
213download
0
Table 1. Number of Malnourished Children Under 5 Years Old by Municipality, Biliran: 2000 and 2002
2000 2002 2000 2002 2000 2002 2000 2002Almeria 118 58 2,368 2,426 5.0 2.4 65 32Biliran 226 249 2,805 2,114 8.1 11.8 105 160Cabucgayan 285 233 2,882 2,943 9.9 7.9 129 107Caibiran 373 387 2,999 3,356 12.4 11.5 162 156Culaba 138 60 2,124 2,072 6.5 2.9 84 39Kawayan 181 134 2,933 3,025 6.2 4.4 80 60Maripipi 75 41 972 901 7.7 4.6 100 62Naval 346 556 5,561 6,469 6.2 8.6 81 117Biliran 1,742 1,718 22,644 23,306 7.7 7.4 100 1001 Malnourished children - moderately and severely underweight childrenSource of basic data: Provincial Health Office, Biliran
IndexNumber of Malnourished Children1 Under 5 Yrs OldMunicipality
Number of Children Under 5 Years Old Weighed
% Malnourished Children Under 5 Year Old

Table 2. Number and Percentage of Malnourished Elementary School Children 7-10 Years Old by Municipality, Biliran: 2000 and 2002
2000 2002 2000 2002 2000 2002 2000 2002Almeria 177 143 1667 1664 10.6 8.6 114 93Biliran 305 298 1992 2032 15.3 14.7 165 158Cabucgayan 265 236 2360 2315 11.2 10.2 121 110Caibiran 327 337 2764 2778 11.8 12.1 127 131Culaba 165 176 1571 1632 10.5 10.8 113 116Kawayan 186 133 2410 2419 7.7 5.5 83 59Maripipi 81 96 920 838 8.8 11.5 95 123Naval 205 320 4730 5049 4.3 6.3 47 68Biliran 1,711 1,739 18,414 18,727 9.3 9.3 100 100Source of basic data: Provincial Health Office, Biliran
Municipality IndexNumber of Malnourished
Elementary School Children 7-10 Years Old
Total Number of Elementary School Children 7-10 Years Old
Weighed
% Malnourished Elementary School Children 7-10 Years Old

Table 3. Number of Newborn with Weight of at Least 2.5 kgs by Municipality, Biliran: 2000 and 2002
2000 2002 2000 2002 2000 2002 2000 2002Almeria 317 252 324 257 2.2 1.9 165 83Biliran 204 262 205 262 0.5 0.0 37 0Cabucgayan 438 372 441 379 0.7 1.8 52 79Caibiran 695 654 701 673 0.9 2.8 65 120Culaba 288 216 291 233 1.0 7.3 79 310Kawayan 492 440 502 451 2.0 2.4 152 104Maripipi - 98 - 104 - 5.8 - 245Naval 962 864 977 875 1.5 1.3 117 53Biliran 3,396 3,158 3,441 3,234 1.3 2.4 100 100Source of basic data: Provincial Health Office, Biliran
MunicipalityPercentage of Newborn w/ Weight
Less than 2.5 kgs. IndexNumber of Newborn w/ Weight at Birth, 2.5 kgs. & greater Number of Livebirths
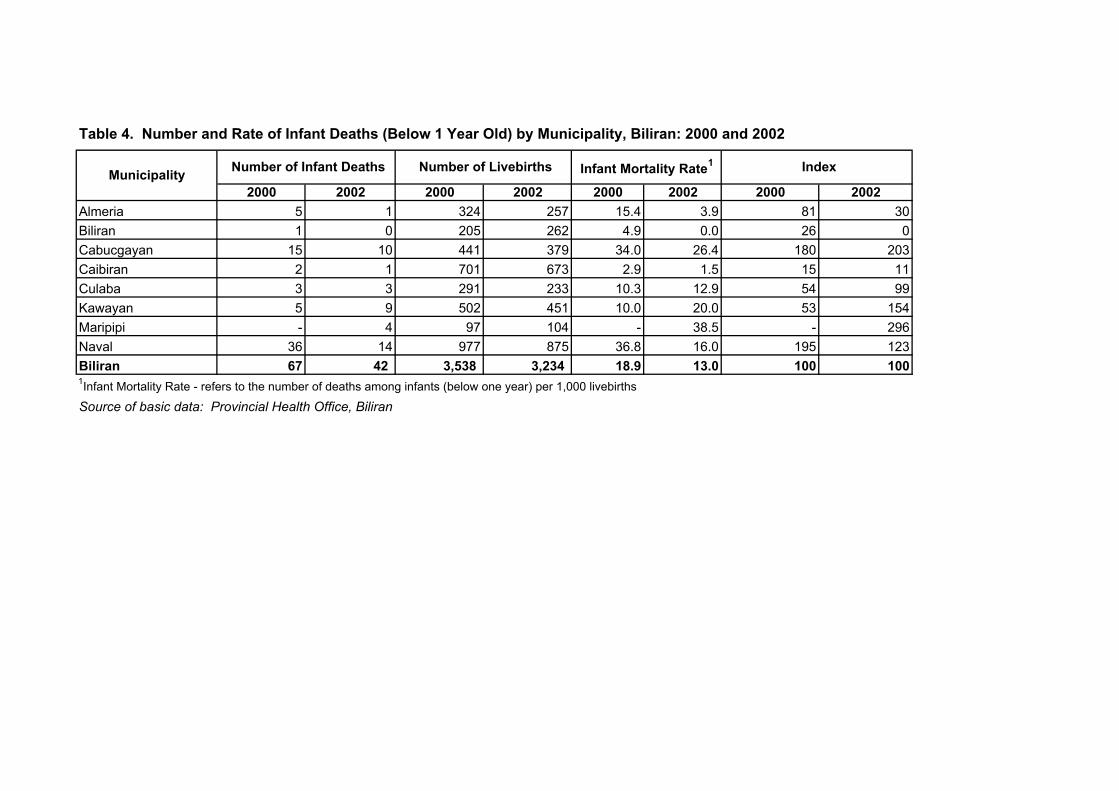
Table 4. Number and Rate of Infant Deaths (Below 1 Year Old) by Municipality, Biliran: 2000 and 2002
2000 2002 2000 2002 2000 2002 2000 2002Almeria 5 1 324 257 15.4 3.9 81 30Biliran 1 0 205 262 4.9 0.0 26 0Cabucgayan 15 10 441 379 34.0 26.4 180 203Caibiran 2 1 701 673 2.9 1.5 15 11Culaba 3 3 291 233 10.3 12.9 54 99Kawayan 5 9 502 451 10.0 20.0 53 154Maripipi - 4 97 104 - 38.5 - 296Naval 36 14 977 875 36.8 16.0 195 123Biliran 67 42 3,538 3,234 18.9 13.0 100 1001Infant Mortality Rate - refers to the number of deaths among infants (below one year) per 1,000 livebirths
Source of basic data: Provincial Health Office, Biliran
IndexMunicipality Number of Infant Deaths Number of Livebirths Infant Mortality Rate1
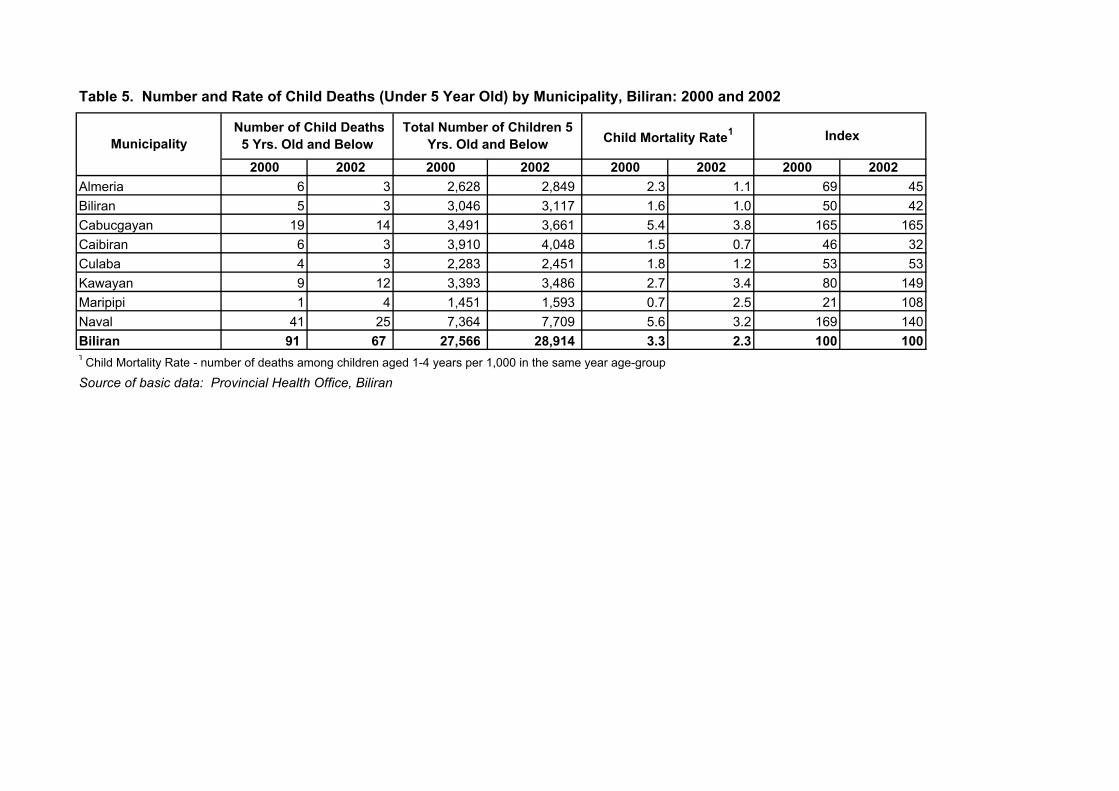
Table 5. Number and Rate of Child Deaths (Under 5 Year Old) by Municipality, Biliran: 2000 and 2002
2000 2002 2000 2002 2000 2002 2000 2002Almeria 6 3 2,628 2,849 2.3 1.1 69 45Biliran 5 3 3,046 3,117 1.6 1.0 50 42Cabucgayan 19 14 3,491 3,661 5.4 3.8 165 165Caibiran 6 3 3,910 4,048 1.5 0.7 46 32Culaba 4 3 2,283 2,451 1.8 1.2 53 53Kawayan 9 12 3,393 3,486 2.7 3.4 80 149Maripipi 1 4 1,451 1,593 0.7 2.5 21 108Naval 41 25 7,364 7,709 5.6 3.2 169 140Biliran 91 67 27,566 28,914 3.3 2.3 100 1001 Child Mortality Rate - number of deaths among children aged 1-4 years per 1,000 in the same year age-group
Source of basic data: Provincial Health Office, Biliran
IndexMunicipality Number of Child Deaths
5 Yrs. Old and BelowTotal Number of Children 5
Yrs. Old and Below Child Mortality Rate1

Table 6. Number of Health Workers by Municipality, Biliran 2000 and 2002
Municipality
2000 2002 2000 2002 2000 2002 2000 2002 2000 2002 2000 2002Almeria 13,854 15,631 8 10 118 122 23 22 93 102 78 84Biliran 13,817 16,747 8 8 95 130 21 18 111 107 94 88Cabucgayan 17,691 18,836 8 7 90 120 28 22 140 126 118 104Caibiran 19,606 21,071 10 9 100 102 38 32 132 147 111 121Culaba 11,506 15,172 8 9 70 83 24 24 113 131 95 108Kawayan 17,507 18,149 10 9 169 168 22 22 87 91 73 75Maripipi 8,319 8,369 8 8 66 53 13 10 96 118 80 97Naval 37,974 40,047 13 13 192 196 36 71 158 143 132 118Biliran 140,274 154,022 73 73 900 974 205 221 119 121 100 100Source of basic data: Provincial Health Office, Biliran National Statistics Office
Index Birth Attendant
Ratio of Health WorkersNumber of Trainedto PopulationBrgy. Health WorkersWorkers
Number ofPopulation Medical/Health Number of Active
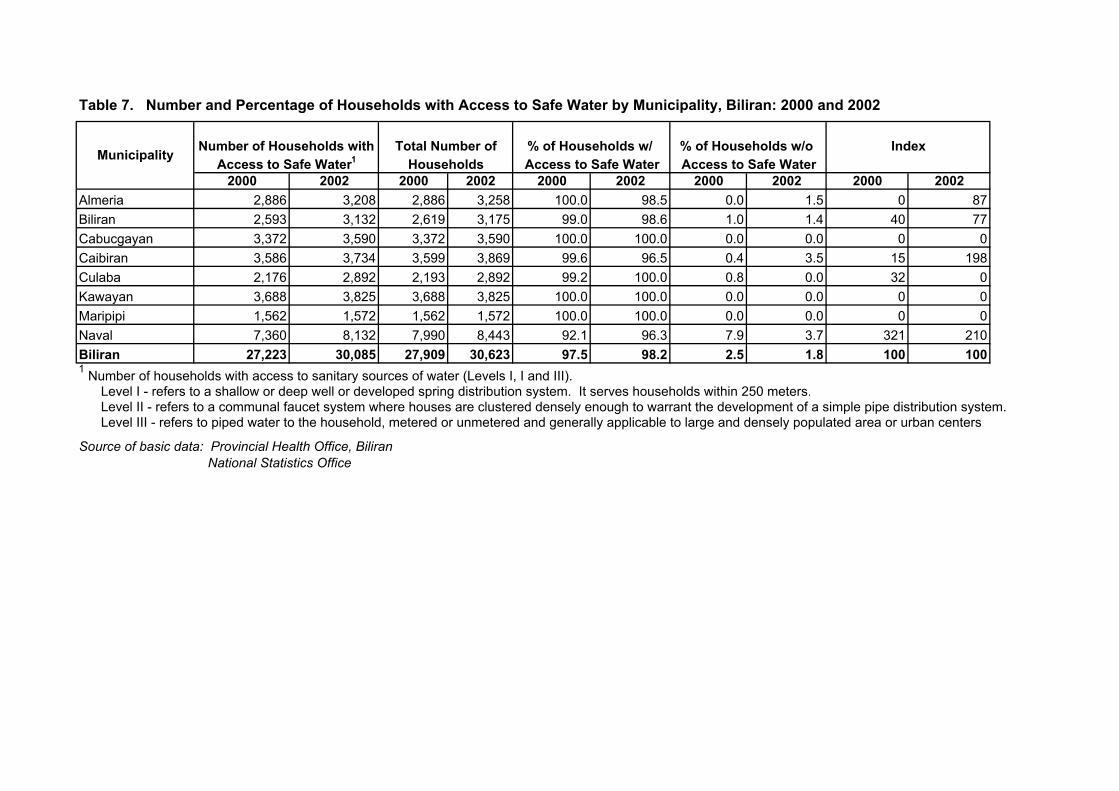
Table 7. Number and Percentage of Households with Access to Safe Water by Municipality, Biliran: 2000 and 2002
2000 2002 2000 2002 2000 2002 2000 2002 2000 2002Almeria 2,886 3,208 2,886 3,258 100.0 98.5 0.0 1.5 0 87Biliran 2,593 3,132 2,619 3,175 99.0 98.6 1.0 1.4 40 77Cabucgayan 3,372 3,590 3,372 3,590 100.0 100.0 0.0 0.0 0 0Caibiran 3,586 3,734 3,599 3,869 99.6 96.5 0.4 3.5 15 198Culaba 2,176 2,892 2,193 2,892 99.2 100.0 0.8 0.0 32 0Kawayan 3,688 3,825 3,688 3,825 100.0 100.0 0.0 0.0 0 0Maripipi 1,562 1,572 1,562 1,572 100.0 100.0 0.0 0.0 0 0Naval 7,360 8,132 7,990 8,443 92.1 96.3 7.9 3.7 321 210Biliran 27,223 30,085 27,909 30,623 97.5 98.2 2.5 1.8 100 1001 Number of households with access to sanitary sources of water (Levels I, I and III). Level I - refers to a shallow or deep well or developed spring distribution system. It serves households within 250 meters. Level II - refers to a communal faucet system where houses are clustered densely enough to warrant the development of a simple pipe distribution system. Level III - refers to piped water to the household, metered or unmetered and generally applicable to large and densely populated area or urban centers.
Source of basic data: Provincial Health Office, Biliran National Statistics Office
IndexNumber of Households withAccess to Safe Water1
% of Households w/ Total Number of % of Households w/o Access to Safe WaterMunicipality Households Access to Safe Water

Table 8. Number and Percentage of Households with Access to Sanitary Toilet by Municipality, Biliran: 2000 and 2002
2000 2002 2000 2002 2000 2002 2000 2002 2000 2002Almeria 2,068 2,394 2,886 3,258 71.7 73.5 28.3 26.5 77 75Biliran 1,624 1,695 2,619 3,175 62.0 53.4 38.0 46.6 103 132Cabucgayan 1,808 1,956 3,372 3,590 53.6 54.5 46.4 45.5 126 129Caibiran 1,567 1,799 3,599 3,869 43.5 46.5 56.5 53.5 153 151Culaba 1,511 1,579 2,193 2,892 68.9 54.6 31.1 45.4 84 128Kawayan 3,068 3,135 3,688 3,825 83.2 82.0 16.8 18.0 46 51Maripipi 1,269 1,437 1,562 1,572 81.2 91.4 18.8 8.6 51 24Naval 4,700 5,782 7,990 8,443 58.8 68.5 41.2 31.5 112 89Biliran 17,615 19,777 27,909 30,623 63.1 64.6 36.9 35.4 100 100Source of basic data: Provincial Health Office, Biliran National Statistics Office
IndexNumber of Households withSanitary Toilet
% of Households w/ Total Number of % of Households w/o Sanitary ToiletMunicipality Households Sanitary Toilet
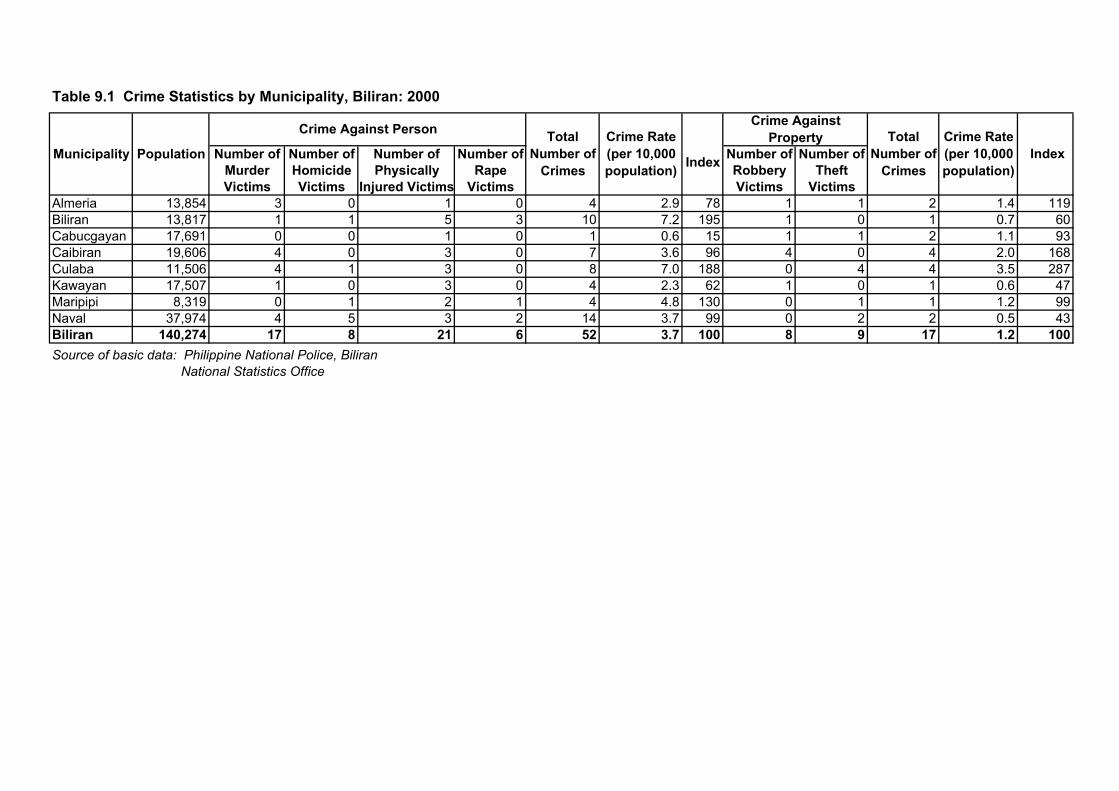
Table 9.1 Crime Statistics by Municipality, Biliran: 2000
Municipality Population Number of Number of Number of Number of Number of Number ofMurder Homicide Physically Rape Robbery TheftVictims Victims Injured Victims Victims Victims Victims
Almeria 13,854 3 0 1 0 4 2.9 78 1 1 2 1.4 119Biliran 13,817 1 1 5 3 10 7.2 195 1 0 1 0.7 60Cabucgayan 17,691 0 0 1 0 1 0.6 15 1 1 2 1.1 93Caibiran 19,606 4 0 3 0 7 3.6 96 4 0 4 2.0 168Culaba 11,506 4 1 3 0 8 7.0 188 0 4 4 3.5 287Kawayan 17,507 1 0 3 0 4 2.3 62 1 0 1 0.6 47Maripipi 8,319 0 1 2 1 4 4.8 130 0 1 1 1.2 99Naval 37,974 4 5 3 2 14 3.7 99 0 2 2 0.5 43Biliran 140,274 17 8 21 6 52 3.7 100 8 9 17 1.2 100Source of basic data: Philippine National Police, Biliran National Statistics Office
IndexCrime Rate (per 10,000 population)
Total Number of
Crimes
Crime Against Person Crime Against PropertyTotal
Number of Crimes
Crime Rate (per 10,000 population)
Index

Table 9.2 Crime Statistics by Municipality, Biliran: 2002
Municipality Population Number of Number of Number of Number of Number of Number ofMurder Homicide Physically Rape Robbery TheftVictims Victims Injured Victims Victims Victims Victims
Almeria 15,631 0 2 3 1 6 3.8 74 0 0 0 0.0 0Biliran 16,747 1 0 4 4 9 5.4 103 0 2 2 1.2 102Cabucgayan 18,836 2 3 4 3 12 6.4 123 0 1 1 0.5 45Caibiran 21,071 1 4 8 2 15 7.1 137 1 1 2 0.9 81Culaba 15,172 3 1 1 0 5 3.3 63 0 0 0 0.0 0Kawayan 18,149 1 1 3 1 6 3.3 64 4 3 7 3.9 330Maripipi 8,369 0 1 0 1 2 2.4 46 0 0 0 0.0 0Naval 40,047 2 10 10 3 25 6.2 120 1 5 6 1.5 128Biliran 154,022 10 22 33 15 80 5.2 100 6 12 18 1.2 100Source of basic data: Philippine National Police, Biliran National Statistics Office
Crime Against Person
IndexCrime Rate (per 10,000 population)
Total Number of
Crimes
Crime AgainstPropertyTotal
Number of Crimes
Crime Rate (per 10,000 population)
Index

Table 10. Elementary Participation and Completion Rates by Municipality, Biliran 2000 and 2002
2000 2002 2000 2002 2000 2002 2000 2002 2000 2002 2000 2002Almeria 91.7 92.3 60.8 72.7 8.3 7.7 39.2 27.3 210 84 115 82Biliran 98.2 97.9 63.5 74.5 1.8 2.1 36.5 25.5 46 23 107 77Cabucgayan 95.2 94.4 65.6 69.1 4.8 5.6 34.4 30.9 122 61 101 93Caibiran 85.0 80.0 62.6 58.6 15.0 20.0 37.4 41.4 380 218 110 125Culaba 93.1 84.5 66.8 70.8 6.9 15.5 33.2 29.2 175 169 98 88Kawayan 96.3 94.8 51.3 60.6 3.7 5.2 48.7 39.5 94 57 143 119Maripipi 92.3 98.6 60.6 65.5 7.7 1.4 39.5 34.5 196 15 116 104Naval 84.9 84.2 65.3 63.4 15.1 15.8 34.7 36.6 383 172 102 111Biliran 96.1 90.8 66.0 66.9 3.9 9.2 34.0 33.1 100 100 100 100Source of basic data: Department of Education, Biliran
Rate (%)Municipality Rate (%) Rate (%)Participation Completion Non-Participation Non-Completion
Rate IndexNon-Participation
Rate (%) Rate IndexNon-Completion

Table 11. Literacy Rate by Municipality, Biliran: 2000 and 2002
2000 2002 2000 2002 2000 2002Almeria 90.8 86.2 9.2 13.9 101 99Biliran 92.4 89.1 7.6 10.9 83 78Cabucgayan 84.7 87.1 15.3 12.9 168 92Caibiran 86.6 91.6 13.4 8.4 148 60Culaba 94.9 84.1 5.1 15.9 56 113Kawayan 91.0 88.3 9.0 11.7 99 83Maripipi 93.8 85.6 6.2 14.4 68 102Naval 90.9 80.9 9.1 19.2 100 136Biliran 90.9 86.0 9.1 14.0 100 100Source of basic data: Department of Education, Biliran National Statistics Office
Illiteracy Rate IndexLiteracy Rate (%)Municipality Illiteracy Rate (%)
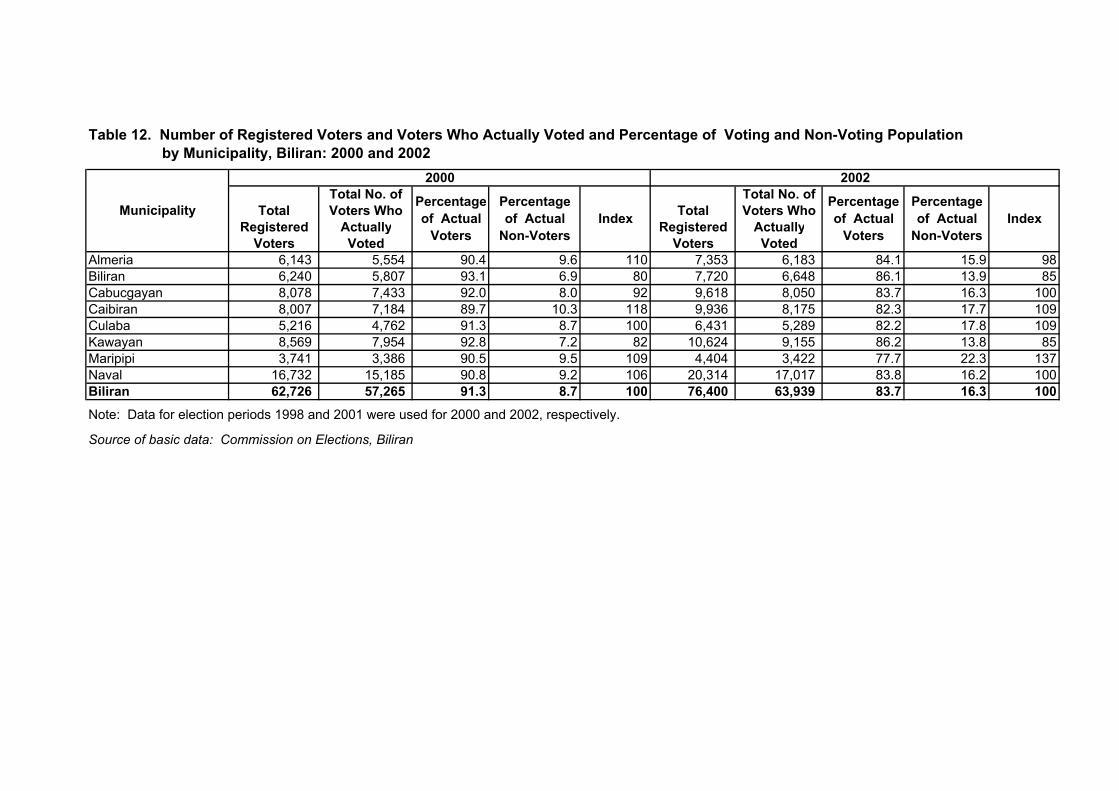
Table 12. Number of Registered Voters and Voters Who Actually Voted and Percentage of Voting and Non-Voting Population
Total No. of Total No. ofTotal Voters Who Total Voters Who
Registered Actually Registered ActuallyVoters Voted Voters Voted
Almeria 6,143 5,554 90.4 9.6 110 7,353 6,183 84.1 15.9 98Biliran 6,240 5,807 93.1 6.9 80 7,720 6,648 86.1 13.9 85Cabucgayan 8,078 7,433 92.0 8.0 92 9,618 8,050 83.7 16.3 100Caibiran 8,007 7,184 89.7 10.3 118 9,936 8,175 82.3 17.7 109Culaba 5,216 4,762 91.3 8.7 100 6,431 5,289 82.2 17.8 109Kawayan 8,569 7,954 92.8 7.2 82 10,624 9,155 86.2 13.8 85Maripipi 3,741 3,386 90.5 9.5 109 4,404 3,422 77.7 22.3 137Naval 16,732 15,185 90.8 9.2 106 20,314 17,017 83.8 16.2 100Biliran 62,726 57,265 91.3 8.7 100 76,400 63,939 83.7 16.3 100Note: Data for election periods 1998 and 2001 were used for 2000 and 2002, respectively.
Source of basic data: Commission on Elections, Biliran
Municipality
2000
by Municipality, Biliran: 2000 and 20022002
Percentage of Actual
Voters
Percentage of Actual
Non-VotersIndex
Percentage of Actual
Voters
Percentage of Actual
Non-VotersIndex
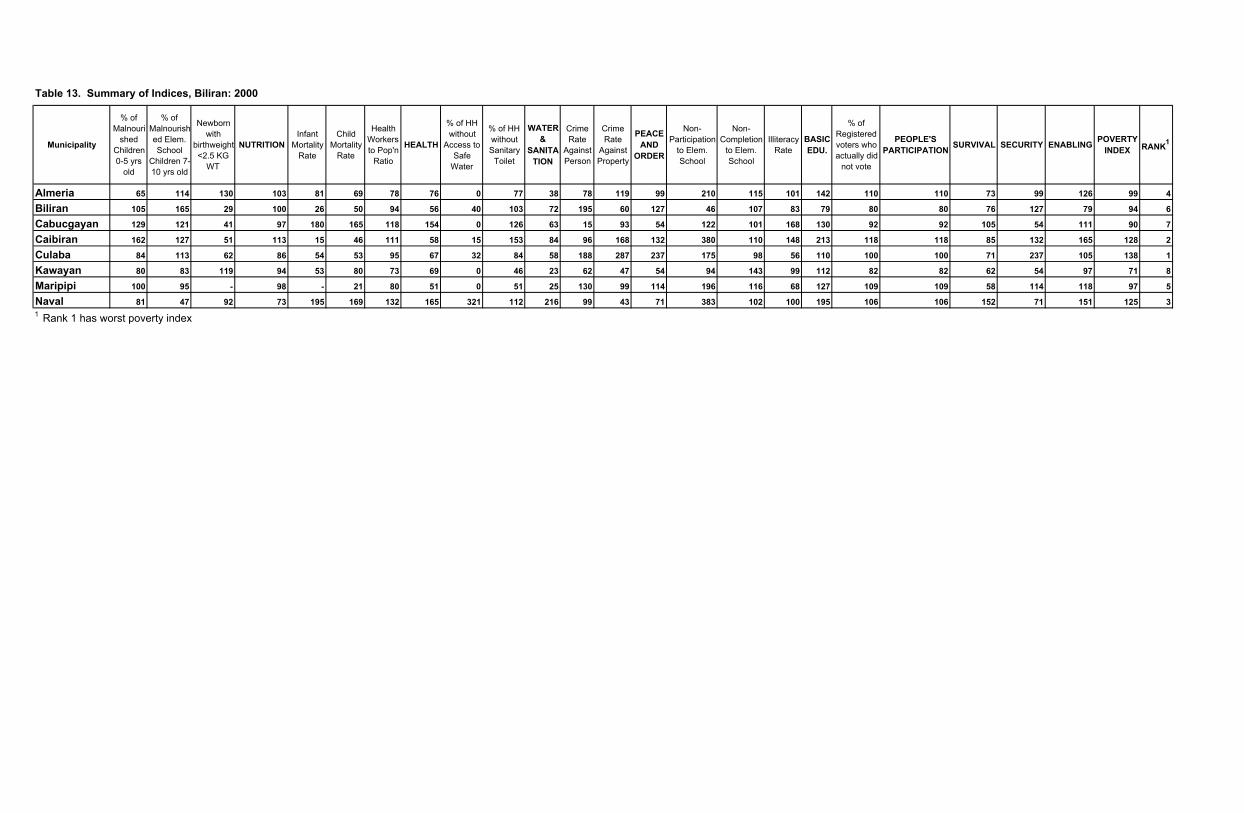
Table 13. Summary of Indices, Biliran: 2000
Municipality
% of Malnouri
shed Children 0-5 yrs
old
% of Malnourished Elem. School
Children 7-10 yrs old
Newborn with
birthweight <2.5 KG
WT
NUTRITIONInfant
Mortality Rate
Child Mortality
Rate
Health Workers to Pop'n
Ratio
HEALTH
% of HH without
Access to Safe
Water
% of HH without Sanitary
Toilet
WATER &
SANITATION
Crime Rate
Against Person
Crime Rate
Against Property
PEACE AND
ORDER
Non-Participation
to Elem. School
Non-Completion
to Elem. School
Illiteracy Rate
BASIC EDU.
% of Registered voters who actually did
not vote
PEOPLE'S PARTICIPATION SURVIVAL SECURITY ENABLING POVERTY
INDEX RANK1
Almeria 65 114 130 103 81 69 78 76 0 77 38 78 119 99 210 115 101 142 110 110 73 99 126 99 4
Biliran 105 165 29 100 26 50 94 56 40 103 72 195 60 127 46 107 83 79 80 80 76 127 79 94 6
Cabucgayan 129 121 41 97 180 165 118 154 0 126 63 15 93 54 122 101 168 130 92 92 105 54 111 90 7
Caibiran 162 127 51 113 15 46 111 58 15 153 84 96 168 132 380 110 148 213 118 118 85 132 165 128 2
Culaba 84 113 62 86 54 53 95 67 32 84 58 188 287 237 175 98 56 110 100 100 71 237 105 138 1
Kawayan 80 83 119 94 53 80 73 69 0 46 23 62 47 54 94 143 99 112 82 82 62 54 97 71 8
Maripipi 100 95 - 98 - 21 80 51 0 51 25 130 99 114 196 116 68 127 109 109 58 114 118 97 5
Naval 81 47 92 73 195 169 132 165 321 112 216 99 43 71 383 102 100 195 106 106 152 71 151 125 31 Rank 1 has worst poverty index

Table 14. Summary of Indices, Biliran: 2002
Municipality
% of Malnouri
shed Children 0-5 yrs
old
% of Malnourished Elem. School
Children 7-10 yrs old
Newborn with
birthweight <2.5 KG
WT
NUTRITIONInfant
Mortality Rate
Child Mortality
Rate
Health Workers to Pop'n
Ratio
HEALTH
% of HH without
Access to Safe
Water
% of HH without Sanitary
Toilet
WATER &
SANITATION
Crime Rate
Against Person
Crime Rate
Against Property
PEACE AND
ORDER
Non-Participation
to Elem. School
Non-Completion
to Elem. School
Illiteracy Rate
BASIC EDU.
% of Registered voters who actually did
not vote
PEOPLE'S PARTICIPATION SURVIVAL SECURITY ENABLING POVERTY
INDEX RANK1
Almeria 32 93 83 69 30 45 84 53 87 75 81 74 0 37 84 82 99 88 98 98 68 37 93 66 8
Biliran 160 158 0 106 0 42 88 43 77 132 104 103 102 103 23 77 78 59 85 85 85 103 72 87 5
Cabucgayan 107 110 79 99 203 165 104 157 0 129 64 123 45 84 61 93 92 82 100 100 107 84 91 94 4
Caibiran 156 131 120 136 11 32 121 55 198 151 175 137 81 109 218 125 60 134 109 109 122 109 122 117 3
Culaba 39 116 310 155 99 53 108 87 0 128 64 63 0 32 169 88 113 124 109 109 102 32 116 83 6
Kawayan 60 59 104 74 154 149 75 126 0 51 25 64 330 197 57 119 83 86 85 85 75 197 86 119 2
Maripipi 62 123 245 144 296 108 97 103 0 24 12 46 0 23 15 104 102 74 137 137 86 23 105 71 7
Naval 117 68 53 79 123 140 118 127 210 89 149 120 128 124 172 111 136 140 100 100 119 124 120 121 11 Rank 1 has worst poverty index
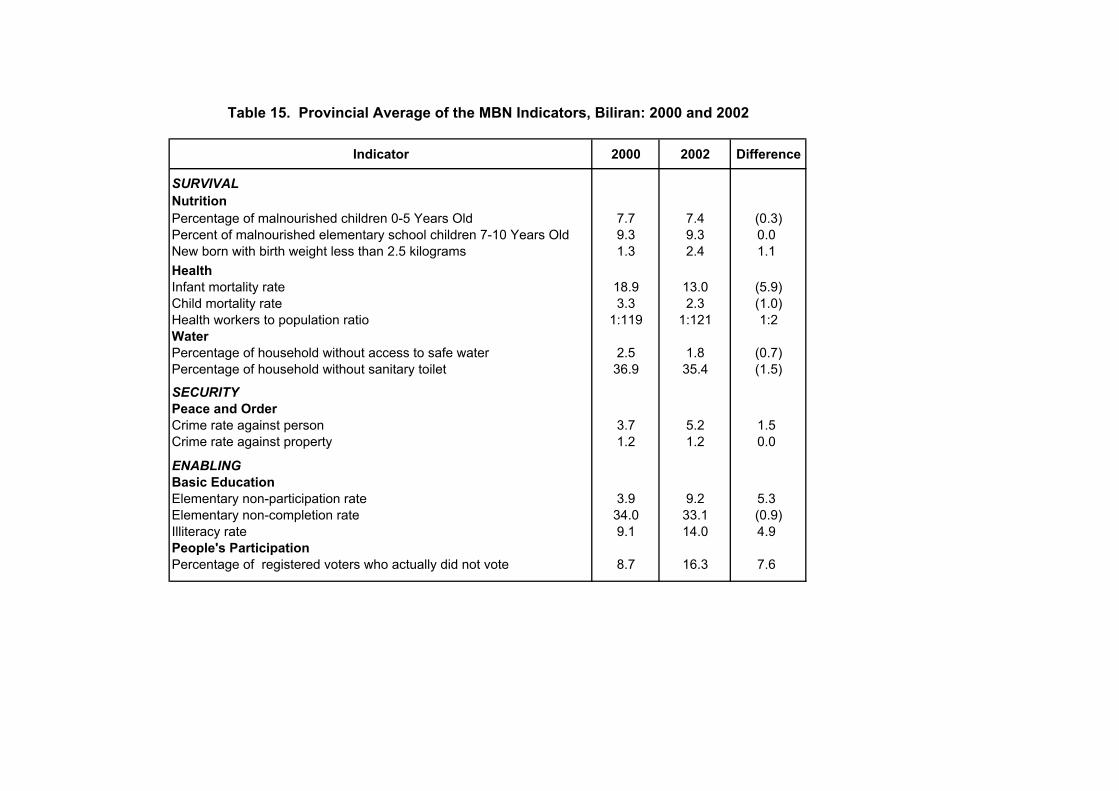
Indicator 2000 2002 Difference
SURVIVALNutritionPercentage of malnourished children 0-5 Years Old 7.7 7.4 (0.3)Percent of malnourished elementary school children 7-10 Years Old 9.3 9.3 0.0New born with birth weight less than 2.5 kilograms 1.3 2.4 1.1HealthInfant mortality rate 18.9 13.0 (5.9)Child mortality rate 3.3 2.3 (1.0)Health workers to population ratio 1:119 1:121 1:2WaterPercentage of household without access to safe water 2.5 1.8 (0.7)Percentage of household without sanitary toilet 36.9 35.4 (1.5)
SECURITYPeace and OrderCrime rate against person 3.7 5.2 1.5Crime rate against property 1.2 1.2 0.0
ENABLINGBasic EducationElementary non-participation rate 3.9 9.2 5.3Elementary non-completion rate 34.0 33.1 (0.9)Illiteracy rate 9.1 14.0 4.9People's ParticipationPercentage of registered voters who actually did not vote 8.7 16.3 7.6
Table 15. Provincial Average of the MBN Indicators, Biliran: 2000 and 2002