sustainability integration into building projects: malaysian ...
Upload
kirsten-sparksCategory
view
23download
1description
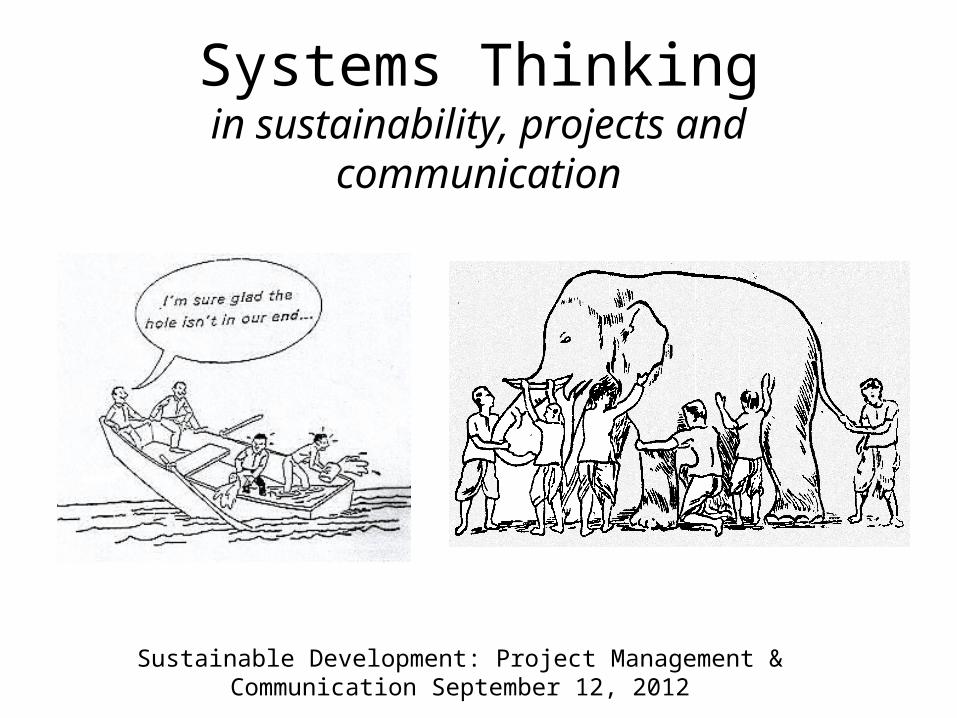
Systems Thinkingin sustainability, projects and communication
Sustainable Development: Project Management & Communication September 12, 2012
Systems Thinking
Systems thinking is the process of understanding how things influence one another within a whole. (Wikipedia)
Systems thinking is a way of understanding reality that emphasizes the relationships among a system's parts, rather than the parts themselves. (Pegasus Commnunications)
Intuition & Analysis
Right brain & Left brain
Complexity & Simplicity
Structure & Behavior


System
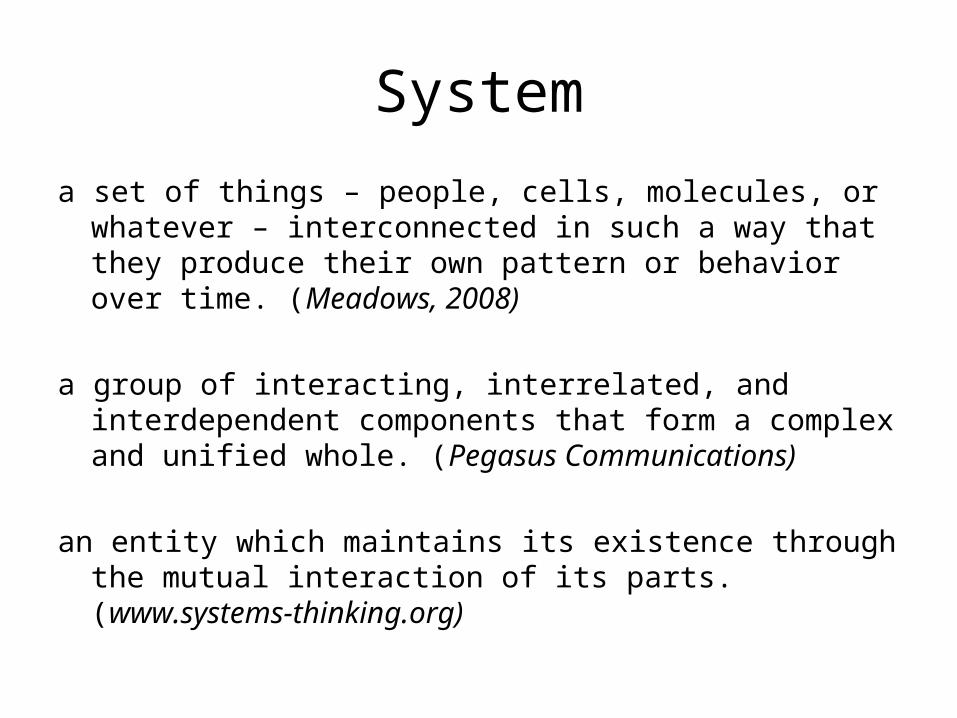
a set of things – people, cells, molecules, or whatever – interconnected in such a way that they produce their own pattern or behavior over time. (Meadows, 2008)
a group of interacting, interrelated, and interdependent components that form a complex and unified whole. (Pegasus Communications)
an entity which maintains its existence through the mutual interaction of its parts. (www.systems-thinking.org)

Aim
Using systems thinking to manage and communicate projects that contribute to a
sustainable development

System
1610s, "the whole creation, the universe," from L.L. systema "an arrangement, system," from Gk. systema "organized whole, body,"
Think
O.E. þencan "conceive in the mind, think, consider, intend" (past tense þohte, p.p. geþoht), probably originally "cause to appear to oneself,"

Sustainable
1610s, "bearable," from sustain + -able. Attested from 1845 in the sense "defensible;" from 1965 with the meaning "capable of being continued at a certain level."
Development
1756, "an unfolding;" see develop + -ment. Of property, with the sense "bringing out the latent possibilities," from 1885. Meaning "state of economic advancement" is from 1902. Meaning "advancement through progressive stages" is 1836.
Project
c.1400, "a plan, draft, scheme," from L. projectum "something thrown forth," noun use of neuter of projectus, pp. of projicere "stretch out, throw forth," from pro- "forward" (see pro-) + combining form of iacere (pp. iactus) "to throw" (see jet (v.)). Meaning "scheme, proposal, mental plan" is from c.1600.
Manage
1560s, probably from It. maneggiare "to handle," especially "to control a horse," ultimately from Latin noun manus "hand" (seemanual (adj.)). Influenced by Fr. manège "horsemanship" (earliest English sense was of handling horses), which also was from Italian. Extended to other objects or business from 1570s.
Communication
late 14c., from O.Fr. comunicacion (14c., Mod.Fr. communication), from L. communicationem (nom. communicatio), noun of action from communicare "to share, divide out; communicate, impart, inform; join, unite, participate in," lit. "to make common," fromcommunis (see common)
Aim - rephrased
Causing organized whole bodies to appear to oneself, in order to handle, and make
common, something thrown forth that contributes to a bearable unfolding.

Exercise: Paper Tear

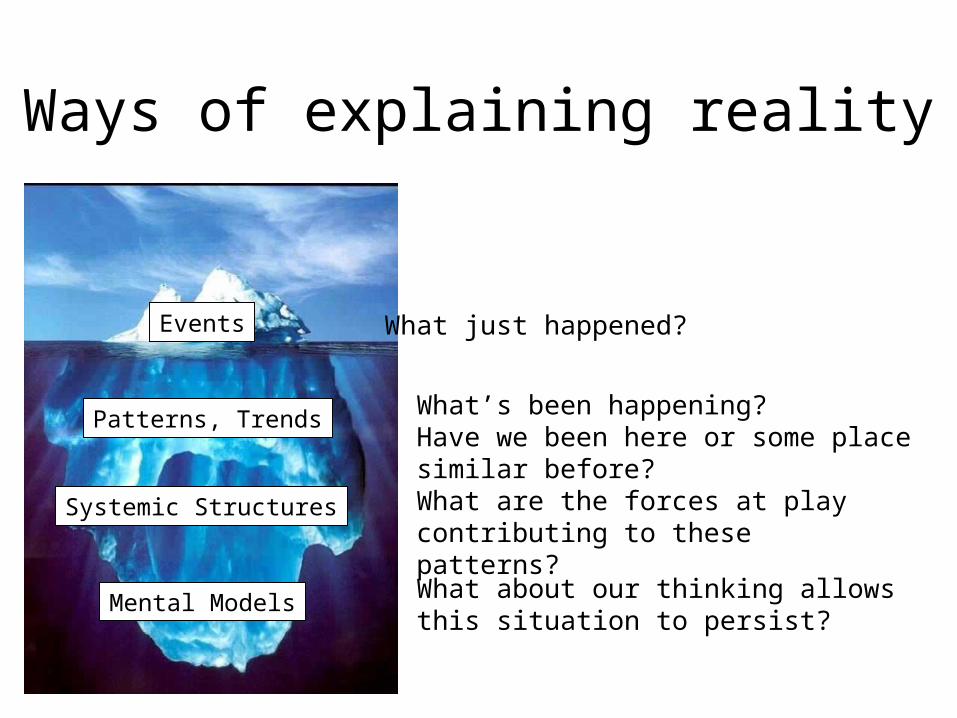
Ways of explaining reality

Ways of explaining reality
Ways of explaining reality
Events
Patterns, Trends
Systemic Structures
Mental Models
What just happened?
What’s been happening?Have we been here or some place similar before?
What are the forces at play contributing to these patterns?
What about our thinking allows this situation to persist?

Ways of explaining Ways of explaining realityreality
Events
Patterns, Trends
Systemic Structures
Mental Models
Drought
Declining Water Table
IrrigatedLands
ExpectedProfitability
Profitabilityfrom Irrigated
Lands
WaterDemand
WaterExcess/ Shortage
Surface WaterAvailability
+
-+
Pumping
External WaterResources
+
+
+
++
Pressure formore Water
-
Water in LocalAquifers
-
+
Planned Increaseof Water Resources
+
DamsDivertions +
+
+
+
+
PiezometricLevels
+
SeawaterIntrusion
-
Salinization ofAquifers
+
Water SupplyUnit Cost
- ++-
Available Areafor New
Irrigated Lands
-
+
-
B1
B2
Expand ifWater Available
Expand ifLand Available
B3
Water from Pumping
B4
Water fromDivertions
B5
Water fromReservoirs
B6
Costs Escalation
R6
Water Supply ExpectationsDrive Irrigation Development
NaturalVegetation
+

• One cause produces one effect. There must be a single cause, for example, of acid rain, or cancer, or the greenhouse effect. All we need to do is discover and remove it.
• All growth is good—and possible. There are no effective limits to growth.
• Technology can solve any problem that comes up.
• The future is to be predicted, not chosen or created. It happens to us; we do not shape it.
• A problem does not exist or is not serious until it can be measured.

””Without changing our patterns of Without changing our patterns of thought, we will not be able to solve thought, we will not be able to solve the problems we created with our the problems we created with our patterns of thought”patterns of thought”
Albert EinsteinAlbert Einstein
Mental Models – Patterns of Mental Models – Patterns of ThoughtThought
””Our life is what our thoughts make it”Our life is what our thoughts make it”Marcus Aurelius, Marcus Aurelius,
MeditationsMeditations
Color
Furniture
Tool

ISIS
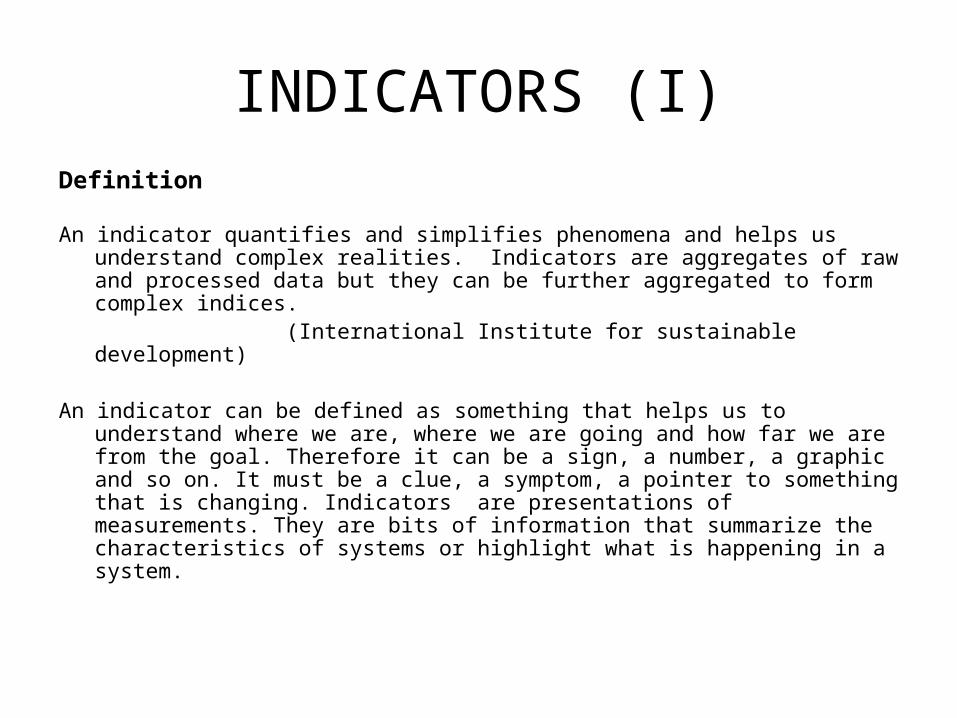
INDICATORS (I)Definition
An indicator quantifies and simplifies phenomena and helps us understand complex realities. Indicators are aggregates of raw and processed data but they can be further aggregated to form complex indices.
(International Institute for sustainable development)
An indicator can be defined as something that helps us to understand where we are, where we are going and how far we are from the goal. Therefore it can be a sign, a number, a graphic and so on. It must be a clue, a symptom, a pointer to something that is changing. Indicators are presentations of measurements. They are bits of information that summarize the characteristics of systems or highlight what is happening in a system.
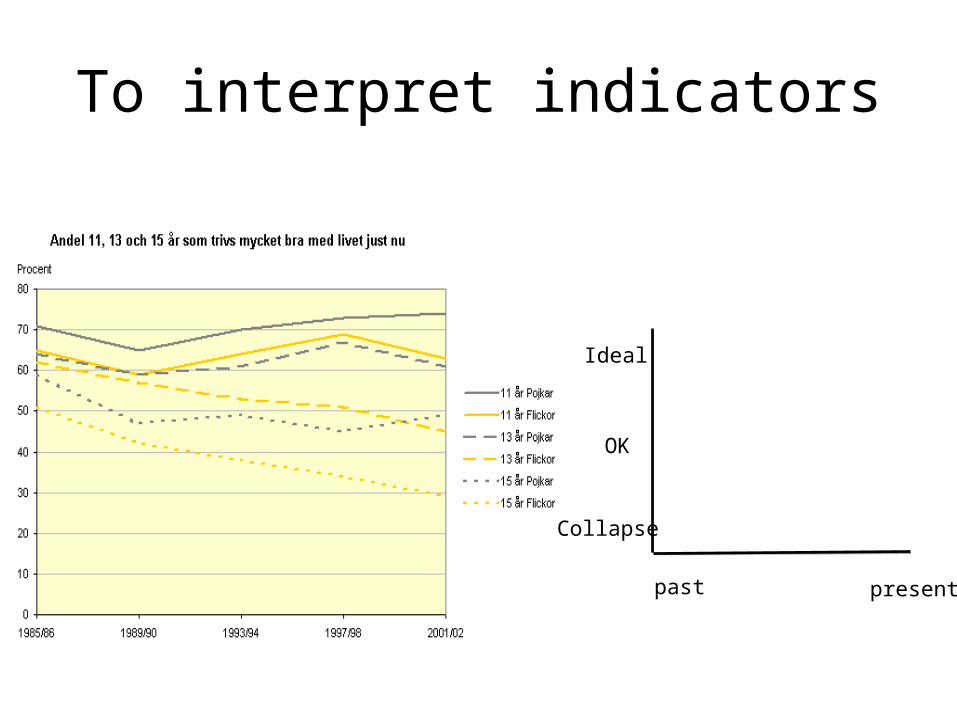
To interpret indicators
Ideal
Collapse
OK
past present

WHAT SYSTEM?
• Sweden• Uppsala• Uppsala University• The Geosciences building• CEMUS• Other?
System
a set of things – people, cells, molecules, or whatever – interconnected in such a way that they produce their own pattern or behavior over time. (Meadows, 2008)
a group of interacting, interrelated, and interdependent components that form a complex and unified whole. (Pegasus Communications)
an entity which maintains its existence through the mutual interaction of its parts. (www.systems-thinking.org)

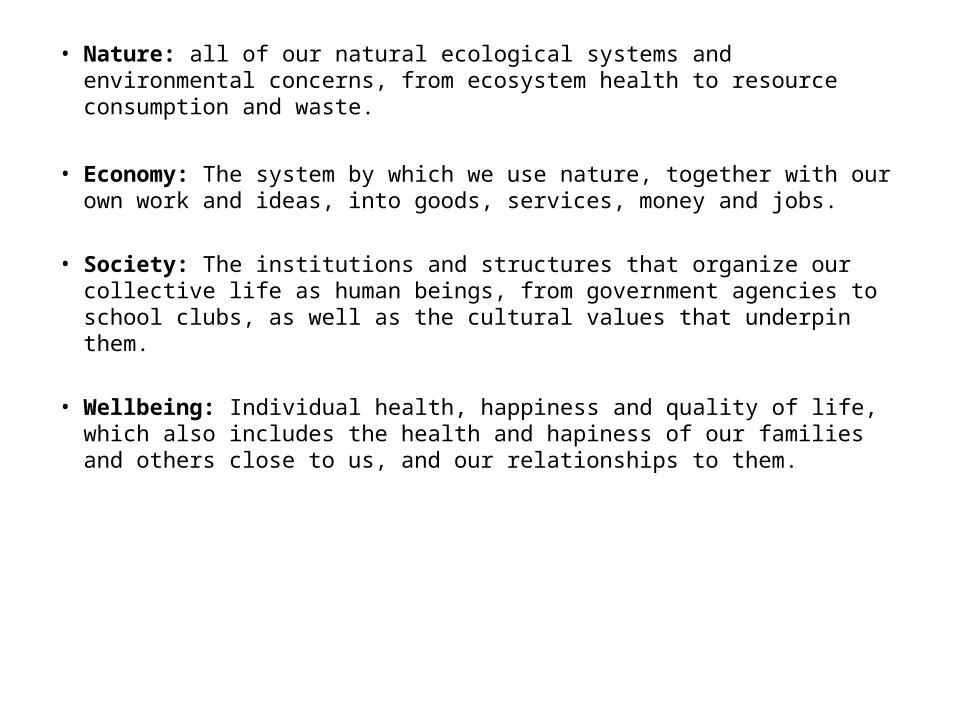
• Nature: all of our natural ecological systems and environmental concerns, from ecosystem health to resource consumption and waste.
• Economy: The system by which we use nature, together with our own work and ideas, into goods, services, money and jobs.
• Society: The institutions and structures that organize our collective life as human beings, from government agencies to school clubs, as well as the cultural values that underpin them.
• Wellbeing: Individual health, happiness and quality of life, which also includes the health and hapiness of our families and others close to us, and our relationships to them.
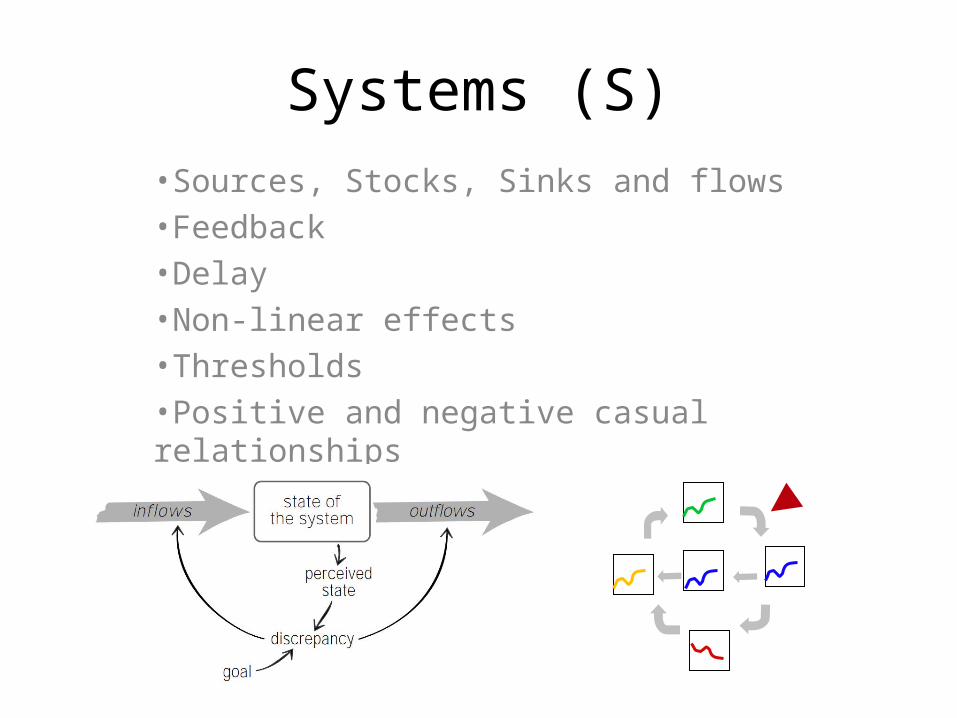
Systems (S)•Sources, Stocks, Sinks and flows•Feedback•Delay•Non-linear effects•Thresholds•Positive and negative casual relationships

Conceptual ModelingConceptual Modeling• Words• Pictures• Diagrams
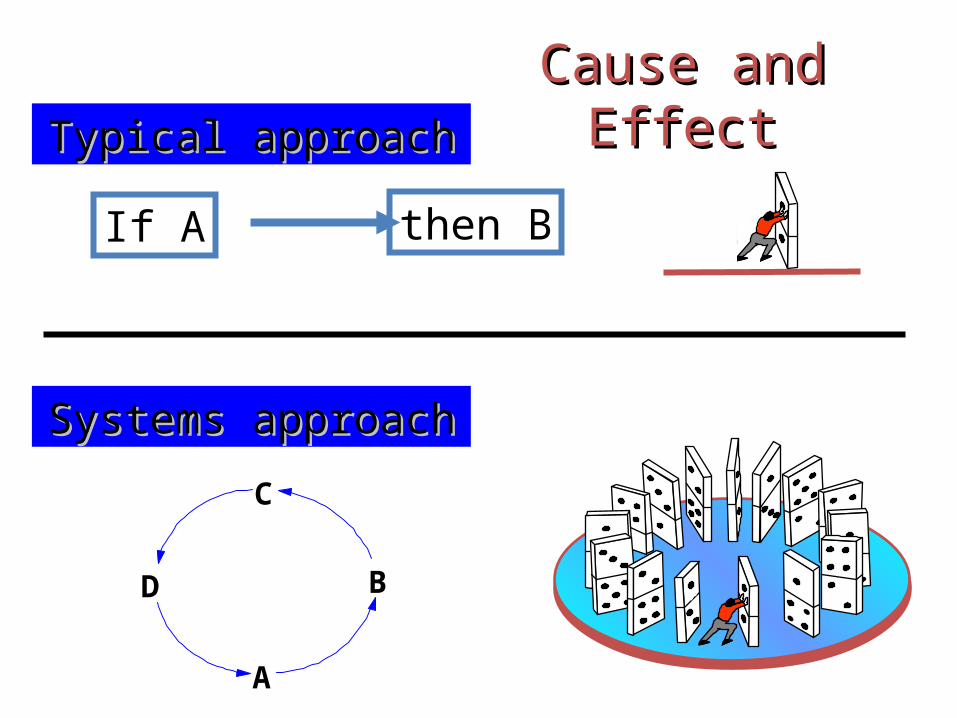
If A then B
A
B
C
D
Cause and EffectCause and EffectTypical approachTypical approach
Systems approachSystems approach

The term ’feedback’ has come to serve as a euphemism for critizing others, as in ’the boss gave me feedback on my presentation’. This use of ’feedback’ is not what we mean in systems dynamics. Further ’positive feedback’ does not mean ’praise’ and ’negative feedback’ does not mean ’criticism’. Positive feedback denotes a self-reinforcing process, and negative feedback denotes a self-correcting (balancing) one. Either type can be good or bad, depending on which way it is operating and of course your values.
John Sterman

Positive and negative causation?
If A goes up, then B goes up
If A goes down then B goes down
If A goes up, then B goes down
If A goes down, then B goes up
Exercise: Living Loops
Causal Loop DiagramCausal Loop Diagram
Causal -Causal -
refers to cause-and-effect refers to cause-and-effect relationshiprelationship
Loop -Loop -
refers to refers to closed chainclosed chain of cause and of cause and effecteffect
Casual Loop Diagrams
A causal loop diagram (CLD) is a diagram that helps you visualize and understand how the different key parts and elements in a complex system interact.

Causal Loop Diagram Notation
Birth Rate Population Death Rate
Fractional BirthRate
AverageLifetime
+ -
+ +-+
R B
Variable1 Variable2
+Link Polarity
Causal Link
R
B
+
-
or
or
Loop identifiers:
Positive (Reinforcing) Loop
Negative (Balancing) Loop
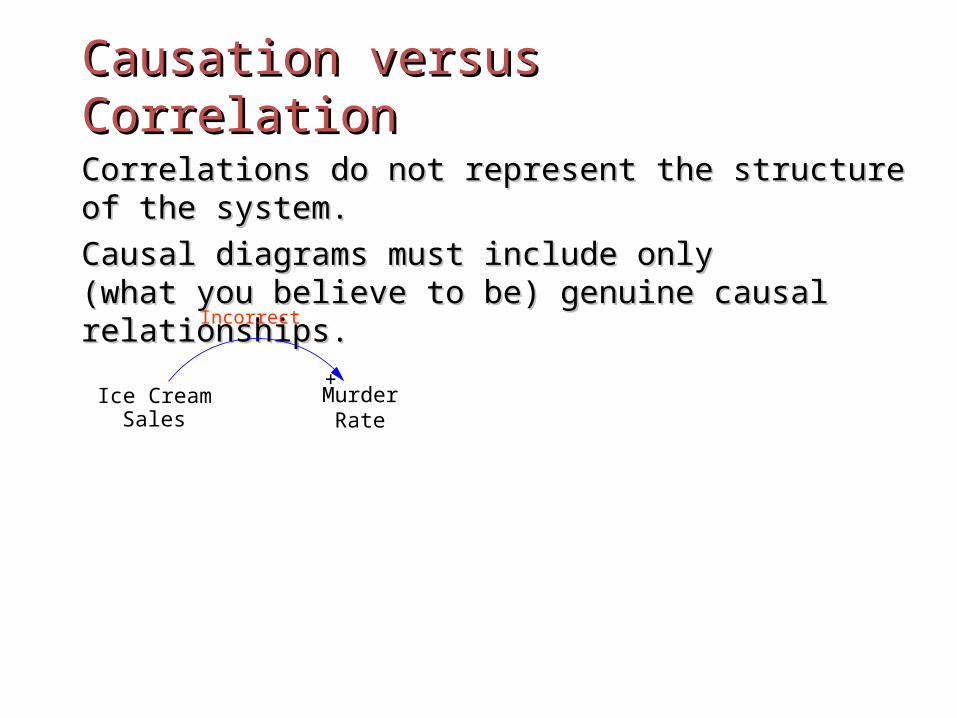
Causation versus CorrelationCausation versus Correlation
Correlations do not represent the structure of the Correlations do not represent the structure of the system. system.
Causal diagrams must include only Causal diagrams must include only (what you believe to be) genuine causal (what you believe to be) genuine causal relationships.relationships.
Ice CreamSales
MurderRate
+
Incorrect
Ice CreamSales
MurderRate
Correct
AverageTemperature
+ +
• Does vitamin C cure the common cold?• Can eating oat bran reduce cholesterol, and if it does, will
your risk of a heart attack drop?• Does economic growth lead to lower birth rate?

Costs Price
++
CorrectIncorrect
Costs Rise Price Rises
A causal diagram captures the structure of the system, not its A causal diagram captures the structure of the system, not its behaviorbehavior
Variable names should be nouns or noun phrasesVariable names should be nouns or noun phrases
Avoid verbs and action phrases since the action is conveyed in the arrows.Avoid verbs and action phrases since the action is conveyed in the arrows.

Exampel: Sahel Reforestation Process
1975 2003

Conceptual modell on a village/landscape scale
Tree Planting andCultivation
Tree Density
Soil Fertility
Wind Speed
Local Rainfall
Family FoodProduction
CropPlantingSuccess
FuelwoodAvailability
ForagingTime
HouseholdIncome
SoilMoisture
Crop Yield
++
+
-
+
+
+
++
-
Farmers' Sense of Crisis( Potential for Behavior
Shift)
-
+
+
-
+
Potential for Non-FarmIncome Generation
-
+
+
ET
+
Livestockvisiting
Farmers'Fields
+
ConflictsHerders/Farmers
LocalLivestockAccessDistant
Resources
HerderMonitoring
Time
+
-
HouseholdSubsistence
+
Drought Durationand Intensity
-
Foodpurchases
-
-
AdvancingDesert
FoodExport
+
+
Farmers'Livestock
++
+
FuelwoodSales
+
B1
- B2a-
B3a
B2b
B2c
B2d
B2e
B3b
B4a
B4b
B4c
R5
Tree Removal
-
+
Fodder infields
Forestry officersinterventions
+
Local Decisionand
EnforcementCapacity
+
-
-
+
-+
- -
HerderLivestock
EnvironmentalDegradation
+
+
+
Drawing casual loop diagrams
Draw a causal loop diagram (CLD) that portrays how your chosen indicators interact in a systematic way. Start with the indicators you have and add indicators that you think are important for the dynamics of the system.
LEVERAGE POINTS
Places within a complex system where a small shift in one thing can produce big changes in everything. Points of power.
Identified leverage points depend on
• What system we are looking at• How we are looking at it• How we have conceptualized it• Our mental models
And they are often counter-intuitive (J.W. Forrester)

Places to intervene in a system
12. Constants, parameters, numbers11. Sizes of the buffers and other stabilizing
stocks, relative to their flows10. The structure of material stocks and flows9. The length of delays, relative to the rate of
system change8. The strength of negative feedback loops,
relative to the impacts they are trying to correct against
7. The gain around driving positive feedback loops

Places to intervene in a system
6. The structure of information flows (who does and who does not have access to what kinds of information).
5. The rules of the system (such as incentives, punishments, constraints)
4. The power to add, change, evolve, or self-organize system structure
3. The goals of the system2. The mindset or paradigm out of which the system –it’s
goals, structure, rules, delays, parameters – arises1. The power to transcend paradigms

LEVERAGE POINTS
Try to classify the levarage points that you have found by using Dana Meadows categories
CLOSING WORDS