Systems Performance Report - Gas Networks Ireland
52
Systems Performance Report 2015
Transcript of Systems Performance Report - Gas Networks Ireland

Systems Performance Report
2015
2 | Gas Networks Ireland
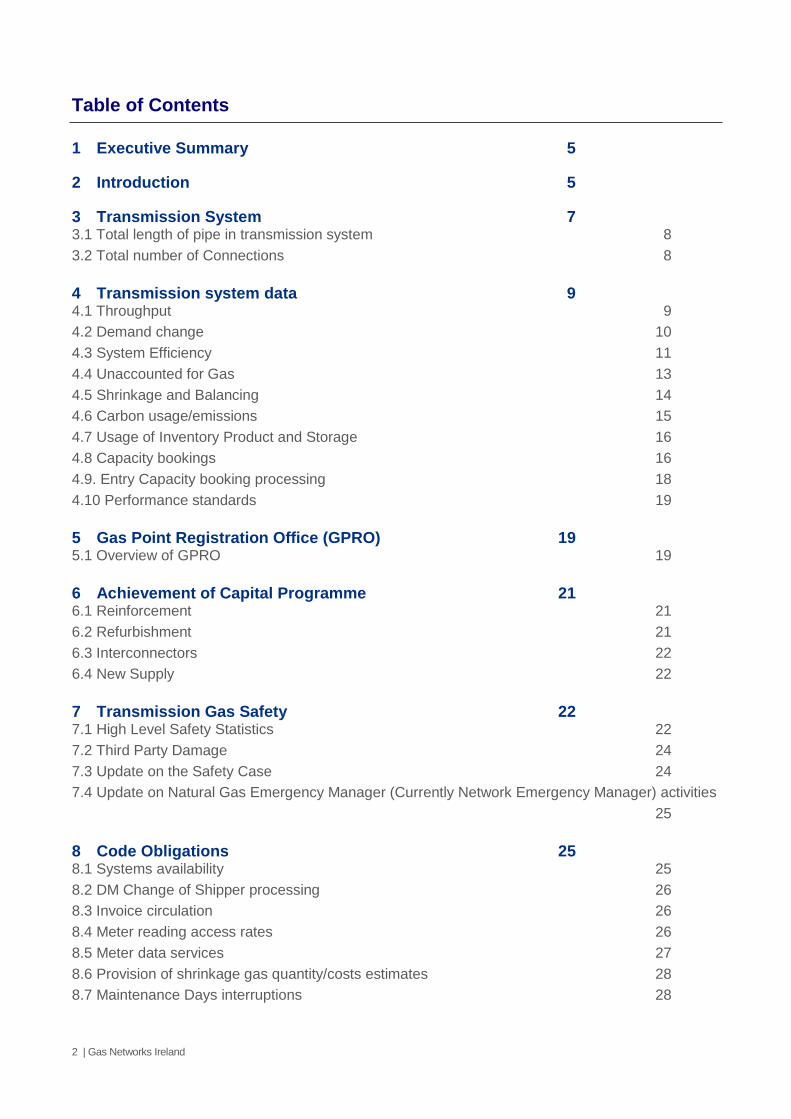
Table of Contents
1 Executive Summary 5
2 Introduction 5
3 Transmission System 7
3.1 Total length of pipe in transmission system 8
3.2 Total number of Connections 8
4 Transmission system data 9
4.1 Throughput 9
4.2 Demand change 10
4.3 System Efficiency 11
4.4 Unaccounted for Gas 13
4.5 Shrinkage and Balancing 14
4.6 Carbon usage/emissions 15
4.7 Usage of Inventory Product and Storage 16
4.8 Capacity bookings 16
4.9. Entry Capacity booking processing 18
4.10 Performance standards 19
5 Gas Point Registration Office (GPRO) 19
5.1 Overview of GPRO 19
6 Achievement of Capital Programme 21
6.1 Reinforcement 21
6.2 Refurbishment 21
6.3 Interconnectors 22
6.4 New Supply 22
7 Transmission Gas Safety 22
7.1 High Level Safety Statistics 22
7.2 Third Party Damage 24
7.3 Update on the Safety Case 24
7.4 Update on Natural Gas Emergency Manager (Currently Network Emergency Manager) activities
25
8 Code Obligations 25
8.1 Systems availability 25
8.2 DM Change of Shipper processing 26
8.3 Invoice circulation 26
8.4 Meter reading access rates 26
8.5 Meter data services 27
8.6 Provision of shrinkage gas quantity/costs estimates 28
8.7 Maintenance Days interruptions 28

3 | Gas Networks Ireland
9 Distribution System 29
9.1 Distribution System Data 29
9.2 Distribution UAG 30
9.3 Total number of connections (by category) 30
9.4 Total length of pipe in the distribution system 31
9.2 Achievement of Capital Programme 32
9.3 Reinforcement 32
9.7 New Connections during year (by category) 33
9.8 Update on new towns receiving gas 34
10 Distribution Gas Safety 35
10.1 Overview of Gas Safety 35
10.2 High level safety objectives 36
10.3 High Level Distribution Safety Statistics 37
10.4 Public Reported Escapes 38
10.5 Distribution safety performance 38
10.6 Promoting Public Awareness of Gas Safety 39
10.7 Addressing Gas Meter Tampering 39
11 Conclusion 39
12 Appendices 40
Glossary of Terms 40
13 Tables used for Chart Graphics 41
Transmission pipeline length (Km) 41
Transmission connections 41
System throughput 41
Demand change 42
System delivery 42
Fuel usage 42
Meter read verification 42
Unaccounted for Gas (UAG) 42
Shrinkage 43
Compressor stations carbon emissions 43
Demand change for the year (KWh) 43
Capacity bookings 44
Gas Point activity by category 45
Achievement of capital programme 46
Entry capacity bookings 47
Systems availability 47
Shipper operations 47
Meter reading 48
Trading and settlements 48
Maintenance days 48

4 | Gas Networks Ireland
Distribution gas flows 49
Distribution connections by category 49
Distribution system length 50
New Connections by category 50
14 List of figures 50
15 List of Tables 51

5 | Gas Networks Ireland
1 Executive Summary
The Gas Networks Ireland Performance Report has been published annually since 2008. However, 2015 sees
a change in format, the original report is being replaced with the introduction of two specific performance reports;
A Systems Performance Report; and
A Customer Performance Report.
The Systems Performance Report provides an overview of how both the natural gas transmission and
distribution networks have operated during the twelve month period of 2015 in relation to all systems activities.
In 2015 Gas Networks Ireland continued to build and operate one of the most modern and safe gas networks
in the world. The business maintained a strong safety record and successfully completed planned work
programmes.
Gas demand across all market areas has contracted over the past 5 years, this can be attributed to economic
factors during Ireland’s recessionary period, increased use of renewables in power generation and energy
efficiency schemes.
As the economy recovers, gas demand has shown a slight increase in 2015 and is forecast to grow in the
shorter term. However, climate change policies and technological advances in renewable technology and
storage will present Gas Networks Ireland with long term demand challenges.
Gas Networks Ireland endeavours to operate and maintain an efficient system by investing in replacement and
maintenance of the pipeline assets through capital programmes and growing the network to facilitate new
connections and towns, so that it can continue to deliver a safe, secure and cost effective energy and offset the
market demand challenges.
2 Introduction
The Gas Networks Ireland System Performance Report satisfies the licence conditions pertaining to “Overall
standards and performance” of the four licences held by Gas Networks Ireland.
Gas Networks Ireland is responsible for developing, maintaining and operating the gas transmission and
distribution systems. On the 1st of August 2015 the Transmission System Operator (TSO) and Distribution
System Operator (DSO) Licences and responsibilities were transferred from Gaslink to Gas Networks Ireland.
The Gas Networks Ireland System connects Republic of Ireland (RoI) to Scotland, Northern Ireland (NI) and the
Isle of Man (IoM). The natural gas is not owned by Gas Networks Ireland but it transports the gas on behalf of
suppliers and shippers who purchase the gas from the wholesale market and use the transportation services of
Gas Networks Ireland to deliver gas to over 23,000 businesses and almost 650,000 homes throughout
Ireland. The Gas Networks Ireland system includes infrastructure in RoI regulated by the Commission for Energy
Regulation (CER), NI is regulated by UReg and South West Scotland is regulated by Ofgem. The natural gas
network is differentiated by the prevailing pressure:
High pressure transmission infrastructure which operates above 16 barg (the total length of
transmission pipeline is 2,433km)
Distribution infrastructure which operates below 16 barg (the total length of distribution pipeline
is 11,339km)

6 | Gas Networks Ireland
The transmission system is detailed in figure 2.1 below.
Fig. 2.1 Overview of Gas Networks Ireland Transmission System
Gas Networks Ireland, operates, builds and maintains the natural gas network in Ireland, ensuring that over
670,000 natural gas customers receive a safe, efficient and secure supply of natural gas, 24 hours a day, 365
days a year. Natural gas is transported through a network of 13,722 km pipelines, both transmission and
distribution. Gas Networks Ireland is responsible for connecting all customers to the network, regardless of
their supplier. The company manages a 24 hour gas emergency service handling over 19,000 call-outs a year.
13,772km RoI, Scotland, 673,000 19,449
Network NI, IoM customers call-outs

7 | Gas Networks Ireland
Through the New Gas Networks Ireland Connections Policy, Gas Networks Ireland continually brings the
benefits of natural gas to new towns. The Connections Policy was revised in September 2015 and is a Gas
Networks Ireland policy approved by the CER.
Natural gas is a clean, efficient and cost effective fuel. Natural gas is actively promoted by Gas Networks Ireland
as a fuel of choice for homes, businesses and industry. The organisation is keen to see greater utilisation of
the natural gas network and explore opportunities to expand the network where viable. There is considerable
emphasis on investing in new business areas such as natural gas vehicles, renewable gas, and smart metering.
CNG Renewable Gas Smart Metering
3 Transmission System
This report satisfies condition 17 of the Transmission System Operator Licence and condition 13 of the
Transmission System Owner Licence. Gas Network Ireland’s primary responsibility is to transport gas from entry
to exit, on behalf of customers, while ensuring that the network is operated safely and efficiently. The overall
natural gas network in RoI consists of 13,772km of pipeline of this 2,433Km is made of high pressure steel
transmission pipelines. The RoI transmission system consists primarily of the high pressure (70 barg) ring-main
linking Dublin, Galway , Limerick, and a number of spur lines to Cork, Waterford and lower pressure (40 barg
and 19 barg) local area (regional) networks in large urban centres. In addition, the Mayo-Galway pipeline
connects the ring-main to the Bellanaboy terminal, Co. Mayo, where Corrib gas enters the Irish transmission
system. The natural gas network is comprised of high pressure steel transmission pipes and low pressure plastic
distribution pipes. The transmission pipes link Ireland’s major urban areas and also connect Ireland to the UK.
Electricity Generating Power Stations and some large Industrial customers are also directly connected to the
transmission network.
Fig. 3.1 Pipeline Network (RoI)
13,772km Pipeline Network
11,339km Distribution
2,433km
Transmission

8 | Gas Networks Ireland
3.1 Total length of pipe in transmission system
The transmission system pipeline network consists of both onshore and offshore pipes. The length of pipeline
has remained consistent over the last number of years with minor variations due to adding new transmission
customers or decommissioning; at the end of 2015 it was 2,433 kilometres in length.
Fig: 3.2 Transmission pipeline length
3.2 Total number of Connections
The total number of connections to the Gas Networks Ireland transmission networks in 2015 was 53, of these
35 were LDM and 18 were DM. There have been some slight variances over the past few years with a marked
0
500
1000
1500
2000
2500
3000
2011 2012 2013 2014 2015
Kilo
mete
r (k
m)
years
Transmission pipeline length
Onshore pipeline
Offshore pipeline
Total pipeline
53 Transmission connections
2015
35 Large Daily
Metered (LDM)
18 Daily Metered
(DM)

9 | Gas Networks Ireland
decline in 2012 and 2013, most likely due to economic reasons. A positive bounce in figures can be seen for
2014 and 2015 again most likely prompted by an uplift in the economy, see Figure 3.3.
Fig 3.3: Transmission connections
4 Transmission system data
Managing the flow of the gas from the entry points to the end consumer is a sophisticated 24-hour operation. It
involves constant monitoring of transmission gas flows and system pressures through a Supervisory Control
and Data Acquisition (SCADA) system and also via gas control management of the distribution system, through
a separate SCADA system, including the Geographical Information System (GIS) and on-line access to Gas
Networks Ireland systems. It uses telemetry data from all the operational sites to monitor the system.
The grid controllers man the control room 24/7 and are responsible for monitoring the alarms on the network
via SCADA. The grid controllers are also responsible for monitoring the Gas Transportation Management
System (GTMS) and managing the daily nomination and allocation process ensuring that the correct volume of
gas is being transported at all times to meet shippers and customers’ requirements.
4.1 Throughput
Throughput is the total amount of natural gas transported through the Irish gas network by Gas Networks Ireland
each year. The total gas transported in the calendar year 2015 was 50,192 GWh, which is down marginally
from 50,163 GWh in 2014. This includes 50 GWh of fuel gas transported for NI which was consumed at Beattock
Compressor Station. Gas transported for the RoI Power-Gen sector continued to show year on year decline
with a 2.4% decline for 2015 against 2014. A summary of the gas throughput from 2011 to 2015 is illustrated
in table 4.1 and figure 4.1.
33
31 32 3
4 35
18 19
17
17 18
2 0 1 1 2 0 1 2 2 0 1 3 2 0 1 4 2 0 1 5
Transmission connections
Transmission LDM Transmission DM

10 | Gas Networks Ireland
Fig: 4.1 System Throughput Ireland
4.2 Demand change
Demand is the total amount of gas physically off-taken from the gas network in the Republic of Ireland (RoI)
each year. Figure 4.2 reflects the demand for gas in in 2015 which was at a similar level to 2014. The decrease
in gas demand over the past number of years has been primarily due to reduction in demand within the power
generation sector. A continued increase in the dispatch of Renewable Electricity sources with the Single
Electricity Market combined with the low price of coal has seen gas fired plants running less, which has a direct
impact on gas demand. Growth in the Industrial and Commercial (I & C) sector is partially off-setting the decline,
with 2015 showing a slight increase of 0.2% in demand reflecting a changing economic situation within Ireland.
Total Gas Transported in 2015 (GWh)
Daily Average Gas Transported in 2015 (GWh)
Peak Day Gas Transported in 2015 (GWh)
0
50
100
150
200
250
300
0
10,000
20,000
30,000
40,000
50,000
60,000
70,000
2010 2011 2012 2013 2014 2015
Da
ily a
ve
rag
e/p
ea
k d
ay (
GW
h)
An
nu
al
tran
sp
ort
ed
ga
s (
GW
h)
System throughputIreland
Transported Gas Daily Average Peak Day
50,192
u138
204

11 | Gas Networks Ireland
Fig 4.2: Demand change
4.3 System Efficiency
(a) Delivery
Table 4.3 reflects the amount of gas delivered to shippers as a percentage of the actual nomination amount.
The target is to be within Key Performance Indicator (KPI) limits of 99% of the time. Low hourly flows at Inch
can lead to difficulties in achieving the end of day quantity nominated by shippers. Low hourly flows are a result
of shipper/producer requirements. At Inch, providing entry gas at low flow required recycling of the flow for the
safe and economical running of the Compressors. Bellanaboy entry point became active and delivered first
entry gas to ROI on 30th December 2015.
The amount of gas delivered to shippers as a percentage of the actual nomination amount is shown in table
4.3. The target is to be within KPI limits of 99% of the time, 100% was achieved at all entry points in 2015.
Fig: 4.3 Nominated v. target delivery
47,000
48,000
49,000
50,000
51,000
52,000
53,000
54,000
55,000
2011 2012 2013 2014 2015
GW
h
Demand change
0
20
40
60
80
100
120
2011 2012 2013 2014 2015
%
Nominated v. target delivery
Moffat Inch Bellanboy KPI 99 %

12 | Gas Networks Ireland
(b) Fuel Usage
Fuel usage of 648 GWh for 2015 was down on the 818 GWh for fuel usage for 2014. This decline can be
attributed to low throughput and reduced onshore delivery at Inch in 2015. This is shown in Figure 4.4.
Fig 4.4: Fuel usage
(c) Meter Read Verification
Transmission meter read verification gives an indication of the number of transmission connected gas points
that require meter reading adjustments as a result of failed meter reading validation1. Table 4.5 notes that 3.1%
of all site-metering validation checks carried out in 2015 resulted in adjustments (i.e. approximately 84 site-
metering adjustments were performed out of 2,721 meter reading validation checks in 2015). Adjustments are
required to ensure accurate reading when a meter is out of tolerance, configured incorrectly or replaced. Gas
Networks Ireland has increased the frequency of validation checks, from less than 2000 in 2013, which has
resulted in an increased number of adjustments being required. The rise in adjustments in 2015 up by 1.1% on
the previous year, is due to a review of consumption patterns of all fiscal metering sites of over 300 individual
metering streams. The review identified a number of sites where there was suspect metering, field operators’
visited the sites to rectify issues. Following the visit an adjustment was calculated and applied to each metering
stream so that billing was accurate.
1 Adjustments typically arise as a result of (i) a communications failure – e.g. a site telemetry failure resulting in advances in the site
meter not properly communicated to GTMS via SCADA. (ii) An issue with the meter correction equipment on site.
874
852
829
818
648
0
100
200
300
400
500
600
700
800
900
1000
2 0 1 1 2 0 1 2 2 0 1 3 2 0 1 4 2 0 1 5
GW
h
Fuel Usage
Fuel Usage Trend
13 | Gas Networks Ireland
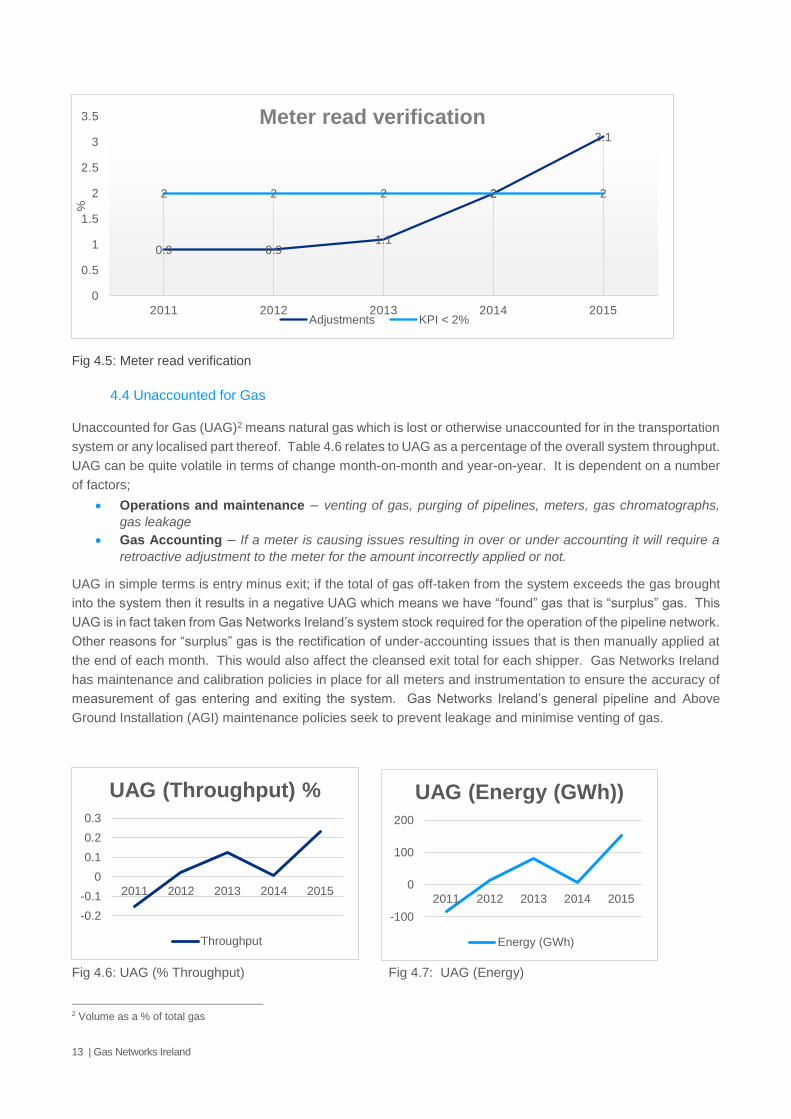
Fig 4.5: Meter read verification
4.4 Unaccounted for Gas
Unaccounted for Gas (UAG)2 means natural gas which is lost or otherwise unaccounted for in the transportation
system or any localised part thereof. Table 4.6 relates to UAG as a percentage of the overall system throughput.
UAG can be quite volatile in terms of change month-on-month and year-on-year. It is dependent on a number
of factors;
Operations and maintenance – venting of gas, purging of pipelines, meters, gas chromatographs,
gas leakage
Gas Accounting – If a meter is causing issues resulting in over or under accounting it will require a
retroactive adjustment to the meter for the amount incorrectly applied or not.
UAG in simple terms is entry minus exit; if the total of gas off-taken from the system exceeds the gas brought
into the system then it results in a negative UAG which means we have “found” gas that is “surplus” gas. This
UAG is in fact taken from Gas Networks Ireland’s system stock required for the operation of the pipeline network.
Other reasons for “surplus” gas is the rectification of under-accounting issues that is then manually applied at
the end of each month. This would also affect the cleansed exit total for each shipper. Gas Networks Ireland
has maintenance and calibration policies in place for all meters and instrumentation to ensure the accuracy of
measurement of gas entering and exiting the system. Gas Networks Ireland’s general pipeline and Above
Ground Installation (AGI) maintenance policies seek to prevent leakage and minimise venting of gas.
Fig 4.6: UAG (% Throughput) Fig 4.7: UAG (Energy)
2 Volume as a % of total gas
0.9 0.91.1
2
3.1
2 2 2 2 2
0
0.5
1
1.5
2
2.5
3
3.5
2011 2012 2013 2014 2015
%
Meter read verification
Adjustments KPI < 2%
-0.2
-0.1
0
0.1
0.2
0.3
2011 2012 2013 2014 2015
UAG (Throughput) %
Throughput
-100
0
100
200
2011 2012 2013 2014 2015
UAG (Energy (GWh))
Energy (GWh)

14 | Gas Networks Ireland
The rise in UAG seen in the 2015 figures as shown in Table 4.6 and figures 4.6 and 4.7 is due to a significant
configuration issue relating to Ballybeg AGI in November and December 2015. This caused a rise in UAG which
was subsequently balanced in January and February 2016. UAG is measured in “Gas Year” (October-
September), and therefore the calendar year calculation is not an accurate portrayal.
4.5 Shrinkage and Balancing
“Shrinkage Gas” means own use gas and/or natural gas required to replace “Unaccounted for Gas” (UAG) and
gas used for fuel within the network. Table 4.7 shows Shrinkage Gas attributed to the RoI system as a
percentage of throughputs which stood at 1.2% in 2015. This is illustrated in Figure 4.8.
Fig 4.8: Shrinkage as % of throughput
A balancing action means a balancing gas buy or sell in respect of a day as required to match the amount of
gas entering and leaving the system. The target is to have no more than 12 balancing actions per quarter –
equating to 48 per year.
Action KPI 2011 2012 2013 2014 2015
System balancing Actions 48 (12 per
Qtr.)
39 20 22 35 32
Shipper Imbalance as % of total flow3 N/A 0.14% 0.4% 0.22 0.39% 0.24%
Table 4.8: System balancing
The Shipper imbalance was 0.24% as % of total flow in 2015.
3 This relates to overall system throughput, i.e. section 4 that is RoI 2015 Total Gas Transported of 50192 GWh.
0
0.2
0.4
0.6
0.8
1
1.2
1.4
1.6
1.8
2011 2012 2013 2014 2015
Shrinkage as a % of throughput
Shrinkage

15 | Gas Networks Ireland
Fig 4.9: System balancing
4.6 Carbon usage/emissions
Gas Networks Ireland is committed to managing its impact on the environment. The transmission system
activities affect the environment and the organisation recognises its responsibility to manage and minimise this
impact.
As part of its commitment to sustainable environmental and energy practices, Gas Networks Ireland has
documented environmental and energy policies4. The environmental policy addresses the key areas of climate
change, biodiversity, waste, resource use and procurement. The energy policy specifically addresses issues
of energy performance and energy efficiency.
Gas compressors are used by Gas Networks Ireland to move gas through and around the transmission system.
As a participant of the European Emission Trading Scheme (ETS) Gas Networks Ireland has an emissions
allowance for CO2. Gas Networks Ireland is committed to monitoring and reducing emissions from these
compressors. The compressors are also required to meet environmental compliance legislations such as noise
monitoring and mitigation. In order to meet the legal obligations and compliance, it is essential to develop and
maintain a robust strategy for operations, maintenance, upgrading and replacement of the compressors. This
is being done through the Capital Programme, see section 6 for more detail.
Carbon usage is a measurement of the tonnes of carbon emissions produced at each of the compressor stations
based on fuel gas consumption. The emissions should reduce with lower throughput but can increase with high
flow variation (e.g. intra-day peaks) which mean the compressors can operate outside of their most efficient
operating range.
4 Environment and Energy Policies
39
2022
3532
48 48 48 48 48
0
10
20
30
40
50
60
2011 2012 2013 2014 2015
System balancing
Balancing actions kPI

16 | Gas Networks Ireland
Fig 4.10: Compressor station carbon emissions
There are a number of factors that influence the emissions levels in 2015. Contributing factors to the amount
of CO2 emitted by the stations include the number of units running, power generation demand in the 37.5 barg
network, and suction and discharge pressures on the network.
4.7 Usage of Inventory Product and Storage
The Kinsale storage facility is operated by PSE Kinsale Energy Limited using the depleted Southwest Kinsale
gas field.
The Interconnector (IC) Inventory space was not offered as a product in 2015 as it is suspended as part of the
EU Capacity Allocation Mechanism (CAM) Network Code implementation project, that was delivered in October
and November 2015. It was agreed with the CER to rule it out of scope of what was delivered. The reason for
so doing is that in order to maintain the product; systemisation changes would have been required that would
not have been possible to deliver together with all the other required system changes that took place on GTMS.
All requirements were prioritised with regards to progressing GTMS systemisation changes ahead of October
2015. The demand changes for the various compressor sites is shown in Table 4.9.
4.8 Capacity bookings
Gas Networks Ireland transports natural gas around the country on behalf of licensed natural gas suppliers
(shippers). These shippers are required to reserve capacity ‘space’ in the natural gas network to guarantee a
secure supply to each of their customers. Exit Capacity reflects the total amount of capacity booked by shippers
on the transmission system. The amount of space reserved by shippers for each customer on the Distribution
network is referred to as the Supply Point Capacity (SPC). On the 31st of December 2015, 245 GWh was the
total exit capacity booked for Power, DM, I & C, Non-Daily Metered (NDM) and Shrinkage. This is shown in
Table 4.11 and illustrated in Figure 4.11.
In the power sector, capacity bookings from 2011 to 2013 decreased, mainly due to increased wind generation
and the position of gas in with the Single Electricity Market (SEM) and depressed coal prices. Since 2014,
0
10,000
20,000
30,000
40,000
50,000
60,000
70,000
2011 2012 2013 2014 2015
Tonnes
Annual
Compressor station carbon emissions
Midleton Beattock Brighouse
Trend Midleton Trend Beattock Trend Brighouse

17 | Gas Networks Ireland
power capacity bookings have increased mainly due to increased power demand. However, bookings are still
less than 2012 levels.
The LDM bookings have increased since 2012 mainly due to the removal of secondary transfers (October 2013),
Aughinish calciners connection, New Towns connections and the economic recovery. NDM bookings have
decreased overall mainly due to increased energy efficiency.
Fig 4.11: Exit capacity bookings
On the 31st of December 2015, 116 GWh was the total SPC for Power, DM, I & C. Residential, NDM and
industrial commercial is also shown in Table 4.11 and illustrated in Figure 4.12.
0
20000000
40000000
60000000
80000000
100000000
120000000
140000000
2011 2012 2013 2014 2015
Exit capacity bookings
Power DM & IC NDM Shrinkage

18 | Gas Networks Ireland
Fig 4.12: Distribution SPC
4.9. Entry Capacity booking processing
Entry capacity means capacity at an Entry Point to the Transmission System required to take delivery of natural
gas to the Transportation System. There are various rules concerning the entry booking process outlined in the
Code of Operations. The first flow of natural gas from the Corrib field entered the natural gas network at the end
of December in 2015, which is why there is a minimal amount exhibited in Figure 4.12 for Corrib capacity
bookings in 2015. There will be a marked increase in these in the 2016 bookings.
Fig 4.13: Entry capacity bookings
0
10000000
20000000
30000000
40000000
50000000
60000000
70000000
80000000
2011 2012 2013 2014 2015
kW
h
Distribution SPC
DM & IC ResidentialNDM I&C NDM I&C
0
50
100
150
200
250
2011 2012 2013 2014 2015
GW
h
Entry capacity bookings
Inch Moffat Corrib

19 | Gas Networks Ireland
4.10 Performance standards
There was one reportable safety incident in 2015, when a small process leak was detected at Priorsland AGI,
Dundalk during our leak survey works programme in November 2015. The leak was repaired by
decommissioning the AGI and replacing the gasket at the leak location. The area was back-fed using the South
North pipeline via the Haynestown AGI with approval from the CER and UReg.
Customer Commitments KPI 2011 2012 2013 2014 2015
Safety & Quality
Reportable safety incidents
0
0
0
0
0
1
Table 4.13 Transmission Service Standards 2015
5 Gas Point Registration Office (GPRO)
5.1 Overview of GPRO
The function of the GPRO is to maintain the Gas Point Register for each Gas Point through which a natural gas
customer is supplied; this includes registrations and de-registrations.
The GPRO manages the Change of Shipper (CoS), process within Gas Networks Ireland. This process is
essential in order to facilitate an open market and enable supply competition by allowing customers to change
from one Shipper to another. It is responsible for all supply point ownership transfers within the Gas Point
Register.
673,858
Gas Points
8,392 Gas Points
Registered 2015
4,176 Tariff
exempt NDM 2015
6,514 Gas Points de-registered
106,862 Change of Shippers in 2015

20 | Gas Networks Ireland
The GPRO provides information and reports to the CER and industry on historic activity and processes
corrections and amendments, it maintains eligibility listing, the vulnerable customer list and the priority customer
list.
The total number of gas points registered on the 31st of December 2015 was 673,858. This was a 0.1% increase
in the number registered on the same date a year previous. The total number of Gas Points registered during
the year 2015 was 8,392. There were 6,514 Gas Points deregistered during the year, there is a significant rise
in this figure when compared with the figure of 98 the previous year. The increase is due to a data cleansing
exercise that was undertaken to ensure that Gas Point Registration Numbers (GPRN) that matched the criteria
for de-registration were removed from the database. The criteria for de-registration of GPRNs that were tariff
exempt is that they were locked, no end-user assigned and that no consumption is recorded at the premises for
18 months. If a meter is not in use for more than two months the supplier does not pay capacity charges. As
the meters that were de-registered in 2015 had not been in use for well over the two month period there was no
charge to suppliers as a result of the data cleansing exercise.
Shippers have been focused on getting existing gas customers to switch from one supplier to the other. Ireland
has one of the most active switching markets in Europe. The retail energy providers invest heavily on advertising
and marketing of incentives such as cheaper rates, and bundle offers. However, there was a 3% decline in this
activity in 2015 when compared to 2014. Many factors can influence this, such as consumer sentiment and
inertia, new entrants to the market and points of differentiation between the suppliers.
Fig 5.1: Total gas points and market activity
There was a marked increase in the number of historical consumption requests during 2015. This was mostly
due to requests for bulk data releases for the Central Statistics Office (CSO), Sustainable Energy Authority of
Ireland (SEAI) and the Office of Government Procurement (OGP). The data requests were to fulfil reporting
requirements on energy consumption at various sites and for populations as a whole.
656595 661890 666903 673160 673,858
113308 110579 117002 109750 106,862
0
100000
200000
300000
400000
500000
600000
700000
800000
2011 2012 2013 2014 2015
Total Gas Points and market activity
Total Gas Points Registered Change of shipper

21 | Gas Networks Ireland
Fig 5.2: GP activity by category
6 Achievement of Capital Programme
As part of the Price Control process, the CER and Gas Networks Ireland agree a 5 year programme of capital
works for the Transmission network. Gas Networks Ireland is currently in its third regulatory Price Control Period
(PC3), which runs from October 2012 to September 2017. The programme includes works relating to
reinforcement, refurbishment and new supply. Additional works outside of the programme can be undertaken
in the period if proposed by Gas Networks Ireland and agreed by the CER. Gas Networks Ireland continues to
work with stakeholders to extend the natural gas network to new towns. Gas Networks Ireland welcomes new
sources of gas supply and remains willing to discuss prospective projects with project promoters.
6.1 Reinforcement
Reinforcement programmes are carried out to increase the capacity of the network in response to increased
demand. Examples of reinforcement projects include upgrades to increase the capacity of an Above Ground
Installation (AGI) or major pipeline projects, such as Cluden to Brighouse Bay Pipeline where the twinning of
the existing pipeline will increase overall network capacity. In 2015, there were 3 reinforcement projects
progressed, these consisted of two AGI capacity upgrades and one pipeline project.
6.2 Refurbishment
Refurbishment programmes involve the upgrading or replacing of certain network assets upon establishing that
this is required due to the age or condition of the existing asset. Examples of refurbishment projects include:
Upgrade of the pipeline serving Limerick city to a pipe with increased wall thickness and delivering
increased capacity to the eastern side of the city.
Replacement of inefficient and aging boilers at AGI locations with reliable and more efficient units.
7896
65327007
7501
8,392
85 141 176 98
6,514
4861
6419
76318077
3,3733599
46274061 3828
4,1763599
46274061 3828
4,176
24374448
24821734
9,434
2011 2012 2013 2014 2015
Total GP YR GP Deregistered
Tariff exempt NDM @ yr end Total Tariff exempt NDM supply points
Historical consumption requests
22 | Gas Networks Ireland
Upgrading works to bring pressure reduction sites into compliance with the ATEX5 directive.
Installation of attenuation measures to limit noise emissions in the vicinity of pressure reduction sites.
There were a total of 109 refurbishment projects at various stages from design through to commissioning and
operation carried out during 2015, many of these were across multiple locations.
6.3 Interconnectors
This programme involves the refurbishment and upgrading of assets on the onshore Scotland network which is
connected to the Irish gas network via two sub-sea interconnectors. These projects primarily involve works on
the two compressor station sites at Beattock and Brighouse Bay in Scotland. Examples of these projects include:
Upgrade works to the turbine air intake equipment at Brighouse Bay to improve reliability and replace
equipment approaching obsolescence.
Replacement of ancillary equipment, supporting turbine operation at Beattock, which was approaching
end-of-life or obsolescence.
Installation of a station recycle valve at Beattock Compressor Station and connecting same to the
station control system.
6.4 New Supply
The Newtownfane to Haynestown (Mullagharlin) project is now commissioned and in operation. Construction
on the Drumbannon AGI is ongoing.
7 Transmission Gas Safety
7.1 High Level Safety Statistics
This section of the report is an extract from quarterly reports submitted to the CER under the natural gas safety
regulatory framework (the ‘Framework’). All information has been provided to the best ability of Gas Networks
Ireland at the time of submission to the CER. The report includes KPI measures and statistics that have been
under continuous monitoring during 2015. The purpose of the KPI’s are to identify opportunities for improvement
and to ensure the Network continues to be managed in a safe manner.
The reference number (ref: 1 – 5) denotes metrics grouping under the Key Safety Regulatory Objectives.
5 The ATEX directive consists of two EU directives describing what equipment and work environment is allowed in an environment with
an explosive atmosphere

23 | Gas Networks Ireland
Items Compliance Monitor
2011 2012 2013 2014 2015
1A Public Reported Escapes
(PREs)
(Reported Leaks)
Total Reported Escapes
4 9 13 6 11
1B Third Party Damage Development enquiries
requiring action 869 875 990 816 824
Third Party Damage
Prevention Detected
Encroachment Events
Category A - Pipeline Damage
or Leak 0 1 0 0 0
Category B - Serious Potential
for Damage 20 19 29 20 21
Category C - Limited Potential
for Damage
25
22 16 19 23
Total detected encroachment 45 42 45 39 44
1C Transmission Pipelines Line breaks (major leakage) 0 0 0 0 0
Line damaged (sustainable
level of leakage) 0 1 0 2 0
Line damaged (no leakage) 0 1 0 0 0
2A Pressure Control Occasions where pressure
drops below minimum design
pressure
0 0 0 0 0
Occasions where pressure is
greater than 1.1 x Maximum
Operating Pressure
0 0 0 0 0
2B Gas Outages Number of Unplanned Outages 0 0 0 0 0
3A Gas Quality Number of non-compliant
events (constituent parts
outside criteria)
0 0 1 0 0
3B Gas Quality % Availability of the gas
measurement equipment 100% 100% 100% 100% 100%
4A Gas Supply Emergencies Local Gas Supply Emergencies
1,000 - 9,999 customers
affected
0 0 0 0 0
NGEM Emergencies > 10,000
customers affected 0 0 0 0 0
4B Gas Emergency Exercises Emergency Exercises planned
per annum (Minimum)
2 2 2 2 2
Emergency Exercises
undertaken 4 5 3 2 5
5A Incidents Gas Related Incidents 0 0 0 0 0
Table 7.1: Safety statistics

24 | Gas Networks Ireland
7.2 Third Party Damage
Third Party Development works enquiries which potentially impacted on the transmission network and required
action from Gas Networks Ireland increased slightly from 816 in 2014 to 824 in 2015.
There were 44 encroachments detected in 2015 which is an increase on the 39 detected in 2014 but a slight
reduction on the 45 detected in 2013. Since 2011 Gas Networks Ireland has classified transmission pipeline
encroachments in line with the United Kingdom Onshore Pipeline-Operators Association (UKOPA) model, these
include:
Category A: Pipeline leak or damage;
Category B: Potential for damage
Category C: Limited or minimal potential for damage.
Category A is the most severe and would include actual damage to a transmission pipeline, wrap or sleeve.
There were no Category A encroachments in 2015, none in 2014 or 2013. Categories B and C relate to a level
of potential damage and are differentiated by the actual activity and method carried out in the vicinity of the
pipeline. Category B encroachments are deemed to have serious potential for damage while Category C have
limited potential for damage. Gas Networks Ireland reviews each encroachment and monitors trends closely.
7.3 Update on the Safety Case
Gas Networks Ireland fully complies with the Framework. The Gas Networks Ireland Transmission System
Operator Safety Case outlines in detail how this is achieved.
The Gaslink System Operator Safety Case was originally submitted to the CER and approved in June 2009.
Within the safety case framework a quarterly KPI report is submitted to the CER for review. A number of updates
to the Safety Case have been made since 2009 and have been accepted by the CER. In 2015, the CER
accepted from the 1st of August the Gas Networks Ireland Transmission system Safety Case. The Safety Case
demonstrates the arrangements that are in place for:
The safe control and operation of the transmission system.
The management of the life cycle of the assets including design, construction, commissioning,
maintenance and repair, reinforcement and renewal, and decommissioning and abandonment.
824 Development
enquiries
44
Detected encroachments

25 | Gas Networks Ireland
Ensuring that staff meet the required standards of qualification and competence.
Emergency preparedness.
Ensuring that gas transported in the network meets required standards for gas composition and quality.
Hazard assessment and mitigation of the risks to a level that is as low as is reasonably practicable
associated with the transportation of gas.
Compliance with relevant standards and codes of practice.
Cooperation with third parties.
The primary change to the Transmission Safety Case in 2015 was Gas Networks Ireland becoming a legal
entity, which was accepted as previously indicated on the 1st of August. Under the Framework, Gas Networks
Ireland is required to conduct a full review of its safety case every five years to ensure that the safety case
remains a ‘living document’ and fully reflects the current safety operating measures and practices. This review
will be due in 2020.
7.4 Update on Natural Gas Emergency Manager (Currently Network Emergency Manager)
activities
The CER appointed Gaslink as the National Gas Emergency Manager (NGEM) and approved the Natural Gas
Emergency Plan (NGEP) submitted to the CER in November 2008, pursuant to SI 697 Section 19B of 2007.
Revision 3 of the NGEP was updated in late 2013 and approved by the CER in January 2014. Gas Networks
Ireland assumed all responsibilities in this regard on the 1st of August 2015.
8 Code Obligations
The Code of Operations governs the relationship between the Transporter and the Shippers on the
transportation (transmission and distribution) network. By signing Framework Agreements, Shippers accept the
terms of the Code of Operations. In February 2005, the CER approved the implementation of a new Code of
Operations (the Code) which governs the rules for both the transmission and the distribution network. These
rules became effective on April 1st 2005. The latest version of the Code (Version 5.0) was published in August
20166. The Code is comprised of sections outlining the general principles of the Code, regulatory compliance,
the capacity arrangements (both entry and exit), the nomination and allocation arrangements, balancing,
Shipper registration, gas specification and quality, as well as the various sections on congestion management,
legal and general.
8.1 Systems availability
Grid control is responsible for monitoring the GTMS and managing the daily nomination and allocation process
ensuring that the correct volume of gas is being transported at all times to meet Shippers’ and customers’
requirements. The performance standard for the GTMS system availability is 99.8% this has been consistently
achieved over the past five years. In 2015, the system was available 99.96% of the time.
6 http://www.gasnetworks.ie/en-IE/Gas-Industry/Services-for-Suppliers/codeofoperations/

26 | Gas Networks Ireland
Fig 8.1: System availability
8.2 DM Change of Shipper processing
The Change of Shipper process governs the recording of a change of registration of NDM Supply Points
between Shippers on the Gas Point Register. A number of performance targets have been set in terms of
processing requests for change of shipper and entry and exit capacity booking requests. These are outlined in
table 4.12. The performance target has been consistently achieved over the past five years.
8.3 Invoice circulation
The trading and settlements team in Gas Networks Ireland generates and issues transportation invoices for all
shippers on a monthly basis. The invoices are for transmission and distribution capacity and commodity. The
team also issue shippers a letter each year regarding the pricing mechanism on the shrinkage contract and are
responsible for the disbursement of account invoices and credit notes. The performance targets for invoices is
to issue by the 12th day of the month, this has been achieved 100% of the time since 2011. The KPI for providing
shippers with the shrinkage pricing mechanism is prior to the October billing date. This too has been achieved
100% of the time since 2011.
8.4 Meter reading access rates
This process governs the receipt and validation of all meter read information for Generic and Volume Corrected
NDM Gas Points. The access rate in 2015 for both credit and PPM meters was 83%, this is above the KPI of
80% which has been consistently achieved by Gas Networks Ireland over the past five years. The read rate
per site in 2015 was 3.4 times, the KPI for how often a meter is read per calendar year is 3.2 times. The
performance has remained steady at circa 3.4 times in the past three years, this is illustrated in Figure 8.2.
However there has been a decline in total access rate since 2011, the introduction of PPM meters into the read
cycle has led to decrease in the figure as they have a lower access level.
99.7
99.75
99.8
99.85
99.9
99.95
100
2011 2012 2013 2014 2015
%
System availability
GTMS availability KPI

27 | Gas Networks Ireland
Fig 8.2: Meter read access rates
Fig 8.3 Meter read rate
8.5 Meter data services
In conjunction with the Code of Operations, procedures are in place that govern the forecasting demand at gas
points, determining allocations by the transporter and for the reconciliation process. The KPI for within accuracy
forecasting, allocation and reconciliation is 80% accuracy depending on the KWh. The accuracy rate has
steadily improved for credit meters and I & C meters in 2015.
76
78
80
82
84
86
88
2011 2012 2013 2014 2015
%
Meter read access rates
Access rate% KPI% Trend
3
3.1
3.2
3.3
3.4
3.5
3.6
2011 2012 2013 2014 2015
Read p
er
year
Meter read rate
Read Rate KPI Trend

28 | Gas Networks Ireland
Meter data services KPI 2011 2012 2013 2014 2015
Forecasting, Allocation
and Reconciliation
(FAR)7 – Domestic
Reconciliation (PPM8
Meters - 12 month
Rolling)
80% within
accuracy of
1,250 kWh
N/A N/A N/A 99.37% 94.58%
Forecasting, Allocation
and Reconciliation
(FAR) – Domestic
Reconciliation (Credit
Meters - 12 month
Rolling)
80% within
accuracy of
1,250 kWh
90.30% 92.43% 94% 89.54% 99.56%
Forecasting, Allocation
and Reconciliation
(FAR) – I & C
Reconciliation9
80% within
accuracy of
4,500 kWh
74.47% 74.54% 74% 74.98% 76.51%
Table 8.6: Meter data services
8.6 Provision of shrinkage gas quantity/costs estimates
“Shrinkage gas” is used to operate the System (own use gas) and to replace gas which is lost or unaccounted
for. The Transporter buys Shrinkage Gas to ensure the safe and efficient operation of the System and enters
into one or more contracts for Shrinkage Gas.
The Transporter recovers the cost of shrinkage gas for the transmission system from Shippers (by reference to
throughput). For distribution Shippers that are not subject to an additional Code charge for shrinkage, there is
a distribution shrinkage factor included in the tariff. Shrinkage charges are paid by Shippers based on throughput
(their entry and exit allocations).
Imbalance charges are paid to or by Shippers depending on whether they have positive or negative imbalances.
Overrun charges are charges payable by Shippers where their allocations exceed their relevant active capacity
on a day. Shrinkage charges are paid by Shippers based on throughput (their entry and exit allocations).
8.7 Maintenance Days interruptions
Gas Networks Ireland operates, maintains and repairs the transportation system in accordance with the
provisions of the Code of Operations10. Maintenance days are days nominated by Gas Networks Ireland where
part of the transportation system may be subject to maintenance. During maintenance days, natural gas
available for offtake from that part of the transportation system may be reduced, the maintenance programme
is planned in advance with the input of the Shippers. From time to time additional unscheduled maintenance
may need to be conducted due to unforeseen circumstances as considered necessary in order to ensure the
operational integrity and security of the transportation system. Reasonable notice will be given to each affected
7 http://www.gasnetworks.ie/en-IE/Gas-Industry/Services-for-Suppliers/Capacity-registerFAR/ 8 PPM figures were not reported from 2011-2013 9 The I & C band ranges between 73,000 kWh and 5,500,000 kWh so range of reconciliation accuracy can vary significantly given the wide range of annual volumes consumed at these sites. 10 part G, section 5, Code of Operations

29 | Gas Networks Ireland
Shipper as soon as is reasonably practicable, recognising that such maintenance is unscheduled. In 2015,
there were no scheduled or unscheduled maintenance days. In 2015 the in-line inspection programme was very
limited, which would be the primary cause of planned interruptions on the network. There was no planned
upgrade works at any of the connection points or AGIs which required flows to be interrupted. When carrying
out these types of planned maintenance activities Gas Networks Ireland will implement measures to prevent
interruptions on the network where possible. Upgrades and in-line inspection requirements occur every 10-15
years which may be an intermittent programme based on the age of the assets.
Unplanned/ reactive maintenance requiring flow interruption are unpredictable and is generally a result of 3rd
party intervention or asset failure. Gas Networks Ireland designs its network according to the appropriate codes
and standards which requires redundancy to be built to minimise interruptions.
2015 was an excellent year from a network performance perspective but this figure was influenced by the low
level of intrusive planned maintenance under taken. See Table 8.7.
9 Distribution System
9.1 Distribution System Data
In the DM I & C sector gas demand was up by circa 4.9%, compared to 2014. The key factors in terms of
increased gas demand within the I & C sector are economic growth and new connections growth. The I & C
sector as a whole witnessed an increase of 3.1% growth in connections.
In the NDM sector gas demand in 2015 was up by approximately 6% on the previous year. The NDM sector is
sensitive to weather and demand. In 2015 demand was up due to the fact that 2014 was particularly mild. On
a Degree Day (DD) basis 2014 was approximately 8% warmer than 2015, which was more in line with long run
averages. For the NDM I & C sub-sector growth was further driven by the increase in economic activity. In the
Residential NDM sub-sector, despite growth in new connections, growth was dampened, most likely due to the
impact of domestic energy efficiency measures/improvements. Table 9.1 illustrates the distribution system data.

30 | Gas Networks Ireland
Fig 9.1: Distribution system data
9.2 Distribution UAG
Distribution UAG is comprised of distribution shrinkage and the difference between NDM allocations and
meter reads. Distribution UAG as percentage of total distribution throughput in 2015 was 1.57%.
9.3 Total number of connections (by category)
The total number of distribution connections in 2015 stands at 668,159 this is up by 1.1% on 2014. The
largest increase was in the DM I & C sector experiencing a rise of 6% from 2014, see Table 9.2.
0
2000000
4000000
6000000
8000000
10000000
12000000
14000000
2011 2012 2013 2014 2015
MW
h
Distribution system data
Dx DM I &C Annual Total DX NDM I &C Dx NDM Res Annual Total DX NDM

31 | Gas Networks Ireland
Fig 9.2: Connections by category
9.4 Total length of pipe in the distribution system
The distribution network operates in two tiers; a medium pressure and a low pressure. The distribution network
is predominantly polyethylene distribution pipelines. As residents and business premises are added to the
network the length of pipe in the distribution network grows. The length of the distribution network at the end of
2015 is measured at 11,339 km. This has been growing incrementally in the last five years.
Figure 9.3: Distribution system length (Km)
0
100000
200000
300000
400000
500000
600000
700000
800000
2011 2012 2013 2014 2015
Connections by category
Dx DM I/C Dx NDM I/CDx NDM RES
DX NDM RES DX Total
Linear (DX Total)
10800
10900
11000
11100
11200
11300
11400
2011 2012 2013 2014 2015
Km
Distribution system length (Km)
Length (Km) Expon. (Length (Km))

32 | Gas Networks Ireland
9.2 Achievement of Capital Programme
As part of the Price Control process, the CER and Gas Networks Ireland agree a 5 year program of capital
works for the distribution network. Gas Networks Ireland is currently in its third regulatory Price Control Period
(PC3), it runs from October 2012 to September 2017. The programme includes works relating to reinforcement,
refurbishment and new supply related.
As part of the Price Control process, the CER and Gas Networks Ireland agree a 5 year programme of capital works. The programme includes works relating to reinforcement, refurbishment and new supply related which includes new connections and servicing increased loads at existing connections. Additional works outside of the programme can be undertaken in the period if proposed by Gas Networks Ireland and agreed by the CER, e.g. the connection of a new town.
Examples of projects undertaken as part of the Distribution capital programme are:
Replacement of meters at domestic locations and I &C locations which are 20 years old or older.
Remediation works required at bridge crossings over watercourses on the distribution network.
Removal of metallic mains from the distribution network and replacement with polyethylene mains.
Upgrading works to bring distribution installations sites into compliance with the ATEX Directive.
Illustrated below are some 2015 high volume programmes; the percentage of completion represents the
percentage scope completed for the project versus the target for PC3.
9.3 Reinforcement
The reinforcement works completed in 2015 are listed below:
Glasanaon Road
Zion Road
Ninth Lock Road
Wolfe Tone Street, Kilkenny Advance Works
St. Stephens Green
Phoenix Park Phase 1
G4 Domestic Meter Replacement
•Construction ongoing
•65% Complete
•Programme to run to end of PC3 in 2017
I & C Meter Replacement PC2
•Construction ongoing
•95% complete
•Finish date Q1 2016
PE in Porches
•Design and Construction Ongoing
•61% complete
•To run until the end of PC3
I & C Meter Replacement
•Design & construction ongoing
•40% Complete
•Finish Date Q4 2016
DX bridge crossings
•Design and construction ongoing
•88% complete
Dublin metallic mains
•Complete - all known metallic mains and services removed
DX AtEx Compliance
•Design stage

33 | Gas Networks Ireland
Design work has commenced on the following projects which are scheduled for construction in 2016:
Barrow Street
Kincora Avenue
Ormond Road
Willie Nolan Road
Phoenix Park Phase 2
Wolfe Tone Street, Kilkenny
Shangan Gardens, Ballymun
Dublin Road, Maynooth
Green Road, Blackrock
Catherine Street, Waterford
Gracedieu Road / Summerhill, Waterford
Newbridge
Dublin Road, Bray
Bellevue Park
Meadowbrook Avenue
Grange Castle Business Park
9.7 New Connections during year (by category)
Over the past decade Gas Networks Ireland has been involved in the economic analysis of connecting new
towns where gas is currently not available. The analysis was carried out over three phases, with circa 70 towns
being analysed and 21 towns approved for connection. Towns were only connected where the analysis of costs
and revenues resulted in the town having a positive net present value11, on its own or as part of a group. Gas
Networks Ireland will continue to periodically review non-gas towns to assess their viability for connection.
The Gas Networks Ireland sales team continues to promote connecting to natural gas in the residential sector
to households that are on the network but not connected to natural gas. These are categorised as “mature
housing”. Many external factors influence this household type in choice of energy, more recently low oil and
coal prices have acted as a deterrent in replacing older heating systems. Similarly access to finance, choice of
alternative fuels and investing in energy efficiency have been impacting the figures. As house building has
started to increase, the opportunity for growing the network in the new housing sector has increased. This has
been illustrated with year on year growth in new connections activity, confidence in the economy and an
improved property market with the consequential demand for property influencing this growth. The upturn in
the economy was first felt in the export and manufacturing sector, this increased economic activity has led to
the growth in the I & C sector, which saw a significant jump in 2014 from 2013, however this declined somewhat
in 2015 back to 2013 levels. Gas Networks Ireland will be targeting the various sectors with strategic marketing
activity.
11 Net present value analysis relates current investment to future returns taking inflation and other factors into account.

34 | Gas Networks Ireland
Fig 9.4: New Connections by category12
9.8 Update on new towns receiving gas
Through the Gas Networks Ireland Connections Policy13, Gas Networks Ireland continually brings the benefits
of natural gas to new towns. The Connections Policy is a Gas Networks Ireland policy that is approved by the
Commission for Energy Regulation (CER). The Connections Policy was revised in 2015, it encourages the
connection of new customers, offers transparency around charges, treats connections consistently and
minimises the impact on tariffs. The more customers that are connected to the gas network, the more
throughput on the system which in turn reduces the tariffs for all gas customers.
Gas Networks Ireland actively promotes natural gas as a fuel of choice for homes businesses and industry,
greater utilisation of the natural gas network and looks for opportunities to expand the network where
economically viable. In 2015, Arrabawn Co-op was connected as the anchor load which facilitated the viability
of connecting Nenagh town to the natural gas network, with construction on the town phase commencing in
October 2015. Water and waste water infrastructure will be delivered as part of the Ervia multi-utility project in
Nenagh in 2016; a joint collaboration between Irish Water and Gas Networks Ireland. Developing water and gas
infrastructures as one project will reduce costs and will also minimise disruption, avoiding the need for a second
major construction project in the town. On completion, Nenagh will have a future proofed infrastructure that will
benefit the town, its people and its businesses for many decades to come.
The first phase to extend the network from Great Island, Co. Wexford commenced in July 2015. The 40km
feeder main will bring natural gas to Wexford town in 2016. Towns connected to the gas network have a
significant competitive advantage compared to those that are not; there are economic possibilities, efficiencies
and lower emissions that are associated with gas.
12 There is often a time lag from when a new connection order is received to when it is installed. To ensure that the numbers reported are
for connections only rather than a mix of orders and connections there has been an adjustment in how new connections are reported in 2015. This is to ensure consistency across the business units that record connections. Note: there is a variation in reported figures in past performance reports. 13 Connections Policy
0
1000
2000
3000
4000
5000
6000
2011 2012 2013 2014 2015
New connections
Mature Housing New Housing I & C
Trend Mature Housing Trend New Housing Trend I & C

35 | Gas Networks Ireland
Natural gas helps attract Foreign Direct Investment (FDI) to cities and towns as it is appealing to multi-nationals
in terms of its low energy costs as well as being a low carbon fuel. FDI brings direct employment and injects
investment in the local economy by utilising local suppliers. Lower energy costs for residences provides more
disposable income to spend in the local economy benefiting the retail and service sectors.
The clear benefits of gas for the customer are that it is cheaper, cleaner, and more reliable than other fossil
fuels and it is a versatile energy source that can play a significant role in decarbonising the nation’s energy
consumption. Natural gas already contributes to competitiveness being at a lower cost than oil for domestic
consumers, it produces approximately 22% less CO2 than oil and 40% less than coal14. Natural gas provides
energy security for Ireland through existing infrastructure, indigenous sources at Corrib which will meet over
50% of RoI total gas requirement for a period of time, and interconnections to the UK market which has diverse
gas sources, thus ensuring a robust supply of gas and liquid pricing.
10 Distribution Gas Safety
10.1 Overview of Gas Safety
Safety performance is a core value and top priority for Gas Networks Ireland. It underpins the company brand
and its reputation of being a trusted and responsible gas infrastructure company. The network is constructed,
operated and maintained to the highest international safety standards, in line with the CER policies. The primary
function of the network is to transport gas from entry to exit, on behalf of our customers, while ensuring the
network is operated safely and efficiently. This is achieved by the use of sophisticated information systems and
grid controllers monitoring the system 24/7. The systems ensure that pressure is maintained within the system,
alarms are responded to and escalated in a timely manner, the quality of the gas meets regulated requirements
and that processes and procedures are in place to manage a natural gas emergency.
Compliance with national safety legislation including implementation of “A Safety Regulatory Framework for
Natural Gas” is core to the operation of the business. The Gas Networks Ireland Distribution Safety Case was
accepted by the CER on the 1st of August 2015 and it demonstrates the Gas Networks Ireland arrangement for
managing the distribution network. This is delivered through adherence to well established Irish and
International codes and standards, reflected through internal processes and procedures. For example:
Gas Networks Ireland’s management systems are accredited as follows:
- OHSAS 18001 for safety management;
- ISO 14001 for environmental management;
- ISO 9001 for quality management;
- ISO 55001 for asset management;
- ISO 50001 for energy management.
The safety and asset management systems received their accreditation in 2015
Gas Networks Ireland has an excellent record in meeting all its safety statutory and regulatory
obligations. Its average response time to 19,449 gas public reported escapes (PREs) in 2015 was 28
minutes and well within its target of 1 hour.
Gas Networks Ireland is committed to ensuring that all gas technical and operational personnel have
the necessary levels of experience, knowledge and skills appropriate to their range of duties.
14 The Irish Academy of Engineering Policy Advisory The Future of Oil and Gas, published February 2013

36 | Gas Networks Ireland
Gas Networks Ireland run numerous public safety promotion campaigns including advice on what to do
if someone smell’s gas and carbon monoxide awareness. The carbon monoxide awareness campaign
won a number of national and advertising awards in 2015.
10.2 High level safety objectives
The key safety regulatory objectives are outlined below:
1. Minimising the Risk of Loss of Containment
Gas undertakings are required to demonstrate that they have suitable management systems and
procedures in place for managing the risks that lead to, and arise from, loss of gas containment events.
2. Maintaining Safe System Operating Pressure
Gas undertakings are required to demonstrate that they have suitable management systems in place
for managing the risks that can result in dangerously high or low gas operating pressure in the pipeline
system(s).
3. Minimising the Risk of Injecting Gas of Non-Conforming Quality
Gas emergency incidents can arise due to gas of inappropriate quality being injected into the system
and, as such, gas undertakings are required to demonstrate that they have suitable management
systems in place for gas quality monitoring and managing the risks associated with the quality of gas
that is injected into the system.
4. Providing an Efficient and Coordinated Response to Gas Emergencies
Gas emergency events can and do occur for a variety of reasons including the actions of third parties.
For example, Gas Networks Ireland is required to demonstrate that it has suitable arrangements in
place for: (i) managing the response to ‘localised’ gas emergencies; and (ii) undertaking the role of
National Gas Emergency Manager (NGEM) during ‘network’ gas emergencies. Additionally, all natural
gas undertakings are required to demonstrate that they have suitable arrangements in place for
responding to the requirements of the NGEM in the event of large-scale ‘network’ gas emergencies
being declared by the NGEM.
5. Minimising the Safety Risks Associated with the Utilisation of Gas
The Framework provides for a comprehensive regime relating to the regulation of gas installers. The
key aim of this regime is that all categories of ‘gas works’ designated by the CER are only undertaken
by competent gas installers who are registered, and subject to ongoing regulation and inspection, by
the Gas Safety Supervisory Body appointed by the CER.
6. Promoting Public Awareness of Gas Safety
The Framework places duties and obligations on both individual gas undertakings and the industry
generally for the promotion of gas safety awareness. This involves a combination of both individual and
co-ordinated safety promotional activities by undertakings.
Gas Networks Ireland submits quarterly reports to the CER under the natural gas safety regulatory framework.
The report includes measures and statistics that have been under continuous monitoring and improvement
during the reported period of 2015.

37 | Gas Networks Ireland
10.3 High Level Distribution Safety Statistics
Ref Subject High Level KPI
2011 2012 2013 2014 2015
1A Public Reported
Escapes15
Number of External Leaks
Detected 3091 2605 2797 3538 3811
Number of Internal Leaks Detected 4693 4660 4806 4480 5007
1C Third Party
Damage No. of Main Damages 89 48 59 68 84
No. of Service Damages 482 404 408 457 395
1D
Gas in Buildings Number of ‘Gas in Buildings’
events (i.e. all gas ingress from
external infrastructure) 2 2 1 3 0
Evacuations No. of Gas Networks Ireland
initiated evacuations 2 0 1 5 2
2B Gas Outages > 15 Customer affected 1 1 1 0 1
> 100 Customer affected 0 1 1 0 2
4A Gas Supply
Emergencies
Local Gas Supply Emergencies
1,000 – 9,999 customers affected 0 0 0 0 0
NGEM Emergencies - >10,000
customers affected 0 0 0 0 0
4B Public Reported
Escapes
% attended within one hour 99.86 99.90 99.90 99.88 99.90
5A Incidents (Occurring on Gas Network)
Reportable under Gas Legislation 0 1 1 0 0
Incidents (Occurring on Gas Network)
Reportable under CER Guidelines 3 1 2 3 6
5B Incidents (Occurring on
Customer installations)
Reportable under Gas Legislation
1 0 2 2
0
15 In 2015 Gas Networks Ireland responded to 19,449 PREs. In many cases there is no trace of gas. The figures illustrated in the table are the actual number of leaks detected.

38 | Gas Networks Ireland
Ref Subject High Level KPI
2011 2012 2013 2014 2015
Incidents (Occurring on
Customer installations)
Reportable under CER Guidelines
0 1 3 6 7
5C Non Gas related incidents
Number of Non Gas related incidents attended by Gas
Networks Ireland
2 1 0 2 3
6A Emergency Reports
Total no. of calls received via the 24-hour emergency telephone
33206 29504 30672 30519 19198
6B Third Party Damage (inward communication) 1511 3442 3437 2706 2106
Total enquiries to
[email protected]/post/fax/
calls (inward communication) 4876 4533 4631 4700 5029
Total inward enquiries 6387 7975 8068 7406 7135
6C Carbon
Monoxide
Helpline
No. of CO-related calls received via
the 'Carbon Monoxide Helpline
2298 1845 1792 1718 1294
Table 10.1: High level gas safety statistics
10.4 Public Reported Escapes
There were 19,449 Public Reported Escapes (PREs) related to leaks on the Gas Networks Ireland distribution
network in 2015. This is consistent with the 19,031 reported in 2014. In approximately 55% of these cases, no
trace of gas was found. In the vast majority of cases where gas was detected, the leaks were minor in nature
and were repaired by Gas Networks Ireland technicians using standard reactive maintenance and repair
methods.
10.5 Distribution safety performance
There was a consistently high safety distribution performance over the year 2015, a brief summary is outlined
below.
0 gas in building events.
3 unplanned outages in 2015
0 non-compliant gas quality events reported
0 gas supply emergencies
(1800 79 79 79)
Total enquiries to 1800 427 747
number (1800 20 50 50)

39 | Gas Networks Ireland
10.6 Promoting Public Awareness of Gas Safety
The total number of calls received via the 24-
19,198 which was a decrease on the 2014 figure of 30,519. This was due to new scripting in the call receipt
process which helped to divert non-emergency calls to other locations. The number of incoming enquiries
received for “Dial-Before-You-Dig” enquiry phone line has decreased from 2,706 in 2014 to 2,106 in 2015 as
enquiries increasingly arrive by email.
Gas Networks Ireland launched a new carbon monoxide campaign in the latter quarter of 2014, this continued
in to 2015. Other initiatives included Carbon Monoxide awareness week in September 2015.
10.7 Addressing Gas Meter Tampering
Established in 2013/14, Gas Networks Ireland’s Revenue Protection Unit is tasked with the detection and
prevention of gas theft and unauthorised interference with gas metering equipment and pipework. The Revenue
Protection Unit also raises awareness of the dangers of gas meter tampering and the associated risk to life
through targeted media campaigns, including radio, print media, bill inserts, and door drops.
The Revenue Protection Unit investigated 941 suspected cases of meter tampering in 2015, of which 618 were
confirmed as tampered. In each of these cases, the meters were exchanged and made safe.
In the vast majority of cases of confirmed meter tampering, the Revenue Protection Unit seeks cost recovery
from the customer in respect of the damaged meter. In a select number of cases (approximately 12 per year is
typical), Gas Networks Ireland prosecutes individuals who have tampered with their gas meters in the District
Courts under the Energy (Miscellaneous Provisions) Act 1995. Successful prosecutions are publicised to
highlight the dangers of gas meter tampering and the potential consequences for the individual i.e. a criminal
conviction. A small number of criminal convictions of this sort is intended to act as a deterrent to others who
may be considering tampering with their gas meter.
11 Conclusion
The year 2015, marked a year of changes for Gas Networks Ireland, among these was the transfer of the
Gaslink system operator licences and all rights and responsibilities. Gas Networks Ireland continued to deliver
on key asset programmes and essential services to shippers and customers. The safety, integrity and
performance of the network remained the focus of Gas Networks Ireland in 2015. Gas Networks Ireland has
been positive in meeting targets across all measures, remaining committed to delivering to the highest standards
ensuring that gas is used to power homes, businesses and essential services 365 days a year regardless of the
weather and demand challenges that are placed on the system.
hour emergency telephone number (1800 20 50 50) in 2015 was

40 | Gas Networks Ireland
12 Appendices
Glossary of Terms
AGI Above Ground Installation
ALARP As Low as Reasonably Practical
CER Commission for Energy Regulation
CES Customer Effort Score
CO Carbon Monoxide
CSO Central Statistics Office
DM Daily Metered
DSO Distribution System Operator
Dx Distribution
FAR Forecasting, Allocation and Reconciliation
I & C Industrial & Commercial
IC Interconnector
Km Kilometre
KPI Key Performance indicator
KWh Kilowatt hour
GIS Geographical Information System
GMARG Gas Market Arrangements Retail Group
GTMS Gas Transportation Management System
GWh Gigawatt hour
LEL Lower Explosive Limit
MWh Megawatt hour
MOP Maximum Operating Pressure
N/A Not Applicable
NDM Non-Daily Metered
NGEM Natural Gas Emergency Manager
NGEP Natural Gas Emergency Plan
No. Number
OGP Office of Government Procurement
PPL Planned Performance Level
PREs Public Reported Escapes
RES Residential
RGI Registered Gas Installer
RoI Republic of Ireland
RuG Reportable under Guideline
SCADA Supervisory Control and Data Acquisition
SEAI Sustainable Energy Authority of Ireland
41 | Gas Networks Ireland
TPD Third Party Damage
TSO Transmission System Operator
UAG Unaccounted for Gas
UKOPA United Kingdom Onshore Pipeline-operators Association
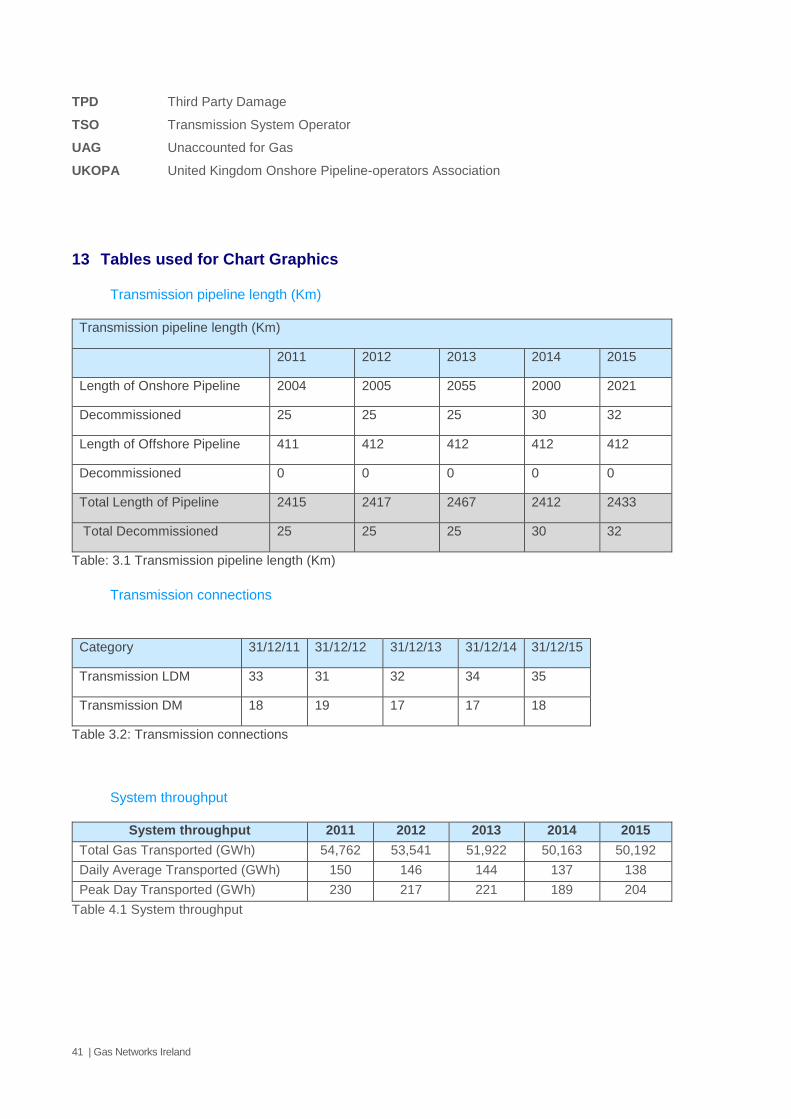
13 Tables used for Chart Graphics
Transmission pipeline length (Km)
Transmission pipeline length (Km)
2011 2012 2013 2014 2015
Length of Onshore Pipeline 2004 2005 2055 2000 2021
Decommissioned 25 25 25 30 32
Length of Offshore Pipeline 411 412 412 412 412
Decommissioned 0 0 0 0 0
Total Length of Pipeline 2415 2417 2467 2412 2433
Total Decommissioned 25 25 25 30 32
Table: 3.1 Transmission pipeline length (Km)
Transmission connections
Category 31/12/11 31/12/12 31/12/13 31/12/14 31/12/15
Transmission LDM 33 31 32 34 35
Transmission DM 18 19 17 17 18
Table 3.2: Transmission connections
System throughput
System throughput 2011 2012 2013 2014 2015
Total Gas Transported (GWh) 54,762 53,541 51,922 50,163 50,192
Daily Average Transported (GWh) 150 146 144 137 138
Peak Day Transported (GWh) 230 217 221 189 204
Table 4.1 System throughput

42 | Gas Networks Ireland
Demand change
Demand change
2011 2012 2013 2014 2015
Demand
(GWh)
54,007 52,721 50,981 49,970 50,069
Change (GWh) -7,293 -1,286 -1,740 -1,011 99
Change (%) -11.9 -2.38 -3.3 -1.98 .20
Table 4.2: Demand change
System delivery
Delivery KPI
For nominated v. target
Actual performance
2011 2012 2013 2014 2015
Moffat delivery 99% 100% 99.7% 100% 100% 100%
Inch delivery 99% 96% 96.7% 100% 100% 100%
Bellanboy 99% n/a n/a n/a n/a 100%
Table: 4.3 System delivery
Fuel usage
Fuel usage 2011 2012 2013 2014 2015
874GWh 852GWh 829 GWh 818 GWh 648 GWh
Table.4.4 Fuel usage
Meter read verification
No. of Adjustments
KPI 2011
Actual
2012
Actual
2013
Actual
2014
Actual
2015
Actual
Metering
Data
Validation
<2% of sites 0.9% 0.9% 1.1% 2.0% 3.1%16
Table 4.5: Meter read verification
Unaccounted for Gas (UAG)
UAG Target
%
2011 2012 2013 2014 2015
Throughput % < 1 - 0.153 +0.020 +0.123 +0.009 +0.229
Energy (GWh) < 1 - 83.8 +12.4 +82.3 +6.1 +153.2
Table 4.6: Unaccounted for gas
16 Putting a KPI on metering adjustments is not effective. Adjustments are required to ensure accurate reading when a meter is out of tolerance, configured incorrectly or replaced.

43 | Gas Networks Ireland
Shrinkage
Shrinkage 2011 2012 2013 2014 2015
Shrinkage as a % of throughput 1.30 1.58 1.2 1.3 1.2
Table 4.7: Shrinkage
Compressor stations carbon emissions
Compression
Site
2011
(tonnes)
2012
(tonnes)
2013
(tonnes)
2014
(tonnes)
2015
(tonnes)
Midleton 8,528 9,707 8,116 6,536 9,204
Beattock 41,002 44,012 43,186 40,257 38,269
Brighouse 62,619 58,896 57,302 60,783 57,740
Table 4.9 Compressor stations carbon emissions
Demand change for the year (KWh)
Compression site 2011
(GWh)
2012
(GWh)
2013
(GWh)
2014
(GWh)
2015
(GWh)
IC Inventory Space Utilised17 261 106 91
injection
91
withdrawal
9 injection
9
withdrawal
No longer
offered
as a
product
Inch Export to Storage18 1,576 1,670 2,122 2,179 1,804
Table 4.10: Demand change for the year (KWh)
17 “IC Inventory Space” related to the IC interconnector with GB 18 “Inch” relates to gas that is stored in the depleted Kinsale Gas Field.

44 | Gas Networks Ireland
Exit capacity bookings
Exit Capacity bookings
(kWh)
31/12/11 31/12/12 31/12/13 31/12/14 31/12/15
Power 116,104,901 107,200,391 92,616,149 95,862,000 101,872,899
DM I & C 15,900,008 11,485,874 17,441,235 37,692,205 40,652,518
NDM 100,011,382 99,602,449 98,419,126 97,127,877 97,543,678
Shrinkage 4,982,750 5,050,172 5,226,501 5,004,800 4,969,000
Total 236,999,040 223,338,886 207,325,745 235,730,081 245,038,095
Distribution SPC (kWh) 31/12/11 31/12/12 31/12/13 31/12/14 31/12/15
DM I & C 16,977,979 17,209,269 17,524,068 17,838,242 18,249,319
Residential 71,967,306 71,245,185 70,036,711 68,891,063 67,646,657
NDM I& C 27,941,225 28,389,133 29,309,426 28,903,865 29,811,248
Total 116,886,509 116,843,587 115,870,205 115,633,170 115,707,224
Table 4.11: Exit capacity bookings
Note: in recent years the annualised bookings (which includes short-term) are reported on.
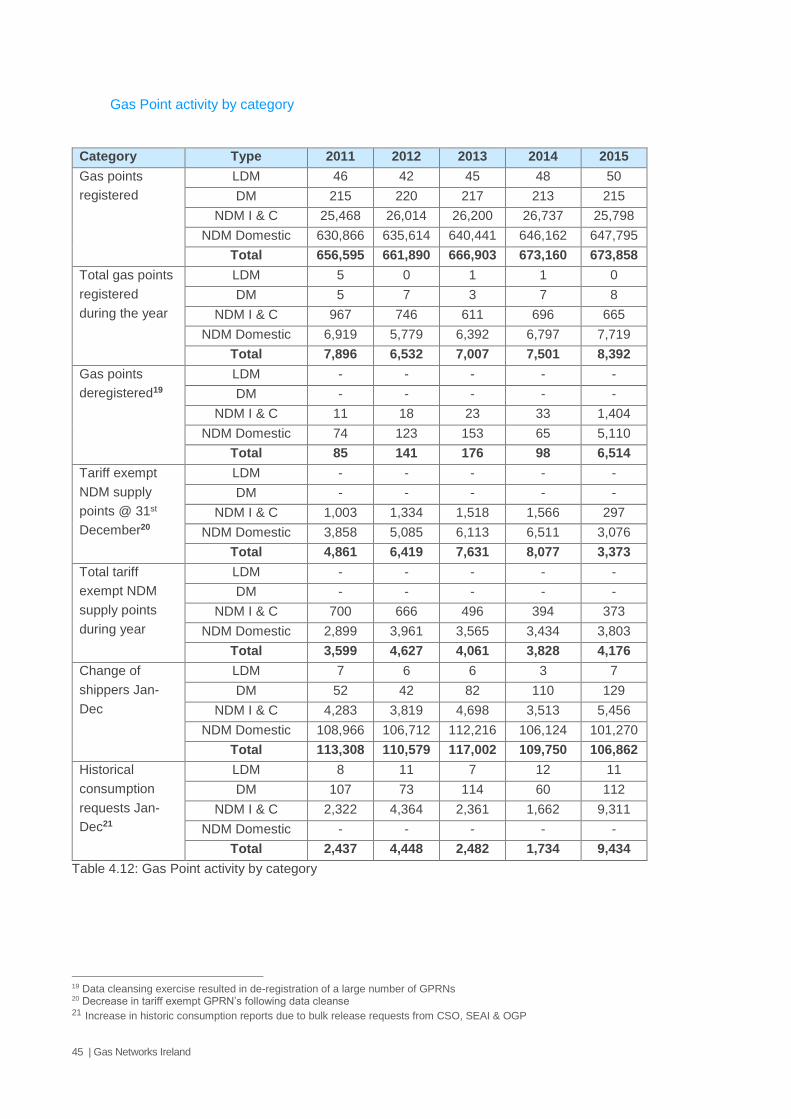
45 | Gas Networks Ireland
Gas Point activity by category
Category Type 2011 2012 2013 2014 2015
Gas points
registered
LDM 46 42 45 48 50
DM 215 220 217 213 215
NDM I & C 25,468 26,014 26,200 26,737 25,798
NDM Domestic 630,866 635,614 640,441 646,162 647,795
Total 656,595 661,890 666,903 673,160 673,858
Total gas points
registered
during the year
LDM 5 0 1 1 0
DM 5 7 3 7 8
NDM I & C 967 746 611 696 665
NDM Domestic 6,919 5,779 6,392 6,797 7,719
Total 7,896 6,532 7,007 7,501 8,392
Gas points
deregistered19
LDM - - - - -
DM - - - - -
NDM I & C 11 18 23 33 1,404
NDM Domestic 74 123 153 65 5,110
Total 85 141 176 98 6,514
Tariff exempt
NDM supply
points @ 31st
December20
LDM - - - - -
DM - - - - -
NDM I & C 1,003 1,334 1,518 1,566 297
NDM Domestic 3,858 5,085 6,113 6,511 3,076
Total 4,861 6,419 7,631 8,077 3,373
Total tariff
exempt NDM
supply points
during year
LDM - - - - -
DM - - - - -
NDM I & C 700 666 496 394 373
NDM Domestic 2,899 3,961 3,565 3,434 3,803
Total 3,599 4,627 4,061 3,828 4,176
Change of
shippers Jan-
Dec
LDM 7 6 6 3 7
DM 52 42 82 110 129
NDM I & C 4,283 3,819 4,698 3,513 5,456
NDM Domestic 108,966 106,712 112,216 106,124 101,270
Total 113,308 110,579 117,002 109,750 106,862
Historical
consumption
requests Jan-
Dec21
LDM 8 11 7 12 11
DM 107 73 114 60 112
NDM I & C 2,322 4,364 2,361 1,662 9,311
NDM Domestic - - - - -
Total 2,437 4,448 2,482 1,734 9,434
Table 4.12: Gas Point activity by category
19 Data cleansing exercise resulted in de-registration of a large number of GPRNs 20 Decrease in tariff exempt GPRN’s following data cleanse 21 Increase in historic consumption reports due to bulk release requests from CSO, SEAI & OGP

46 | Gas Networks Ireland
Achievement of capital programme
Reinforcement Design Construction
ongoing
Construction
Complete
Commissioned
and in operation
AGI Capacity Upgrades 1
AGI Capacity Upgrades 1
Cluden to Brighouse Bay
Pipeline
Refurbishment Design Construction
ongoing
Construction
Complete
Commissioned
and in operation
Ballybough bypass
Limerick Optimisation
AGI boiler replacement 4 4
AGI water bath replacement 3 1
AGI site instrumentation 21 10
AtEx Compliance 22 13
Noise Attenuation 3
Pipe Support Remediation 20 5
Interconnectors Design Construction
ongoing
Construction
Complete
Commissioned
and in operation
Brighouse bay and Beattock
pipeworks modifications
Brighouse Bay turbine air
intakes
Brighouse Bay fuel gas skid
upgrade
Beattock turbine ancillary
equipment upgrade
Beattock actuator upgrades
Beattock solenoid upgrades
Beattock volume control
Beattock odorant plant
upgrade
New Supply Design Construction
ongoing
Construction
Complete
Commissioned
and in operation
Newtownfane to Haynestown
(Mullagharlin)
Drumbannon AGI
Table 8.1: Achievement of capital programme

47 | Gas Networks Ireland
Entry capacity bookings
Entry capacity bookings (GWh) 31/12/11 31/12/12 31/12/13 31/12/14 31/12/15
Inch 34.49 34.3 37.65 35.7 31.1
Moffat 197 199.5 173.9 153.1 165.1
Corrib 0 0 0 0 0.1
Total 250.17 231.5 233.8 211.55 196.2
Table 8.1: Entry capacity bookings
Systems availability
Communications
&
instrumentation
KPI 2011 2012 2013 2014 2015
GTMS System
availability
99.8% 99.98% 99.98% 99.98% 99.95% 99.96%
Table 8.2 Systems availability
Shipper operations
Shipper Operations
Customer
Commitment
KPI 2011 2012 2013 2014 2015
Change of
Shipper
(NDM)
Process Change of
Shipper Requests- 100%
<=5 business days
100% 100% 100% 100% 100%
Change of
Shipper (DM)
Outgoing shipper notified
with >=10 business days’
notice
100% 100% 100% 100% 100%
Entry
Capacity
Booking
Requests
Process <=20 days –
100%
100% 100% 100% 100% 100%
Exit Capacity
Booking
Requests
Process <=20 days –
100%
100% 100% 100% 100% 100%
Table 8.3: Shipper operations

48 | Gas Networks Ireland
Meter reading
Meter reading
Customer
Commitment
KPI 2011 2012 2013 2014 2015
Access Rate 80% 86% 86.2% 86% 84% 83%
Read Rate Average 3.2
reads per site
per calendar
year
3.53 3.47 3.42 3.41 3.40
Table 8.4: Meter reading
Trading and settlements
Trading and settlements
Customer
Commitment
KPI 2011 2012 2013 2014 2015
Invoice circulation By 12th day of
month
100% 100% 100% 100% 100%
Provision of shrinkage
Pricing mechanism
Prior to October
billing
100% 100% 100% 100% 100%
Table 8.5: Trading and settlements
Maintenance days
Maintenance Days
KPI 2011 2012 2013 2014 2015
Maintenance Days
Unscheduled
maintenance/Interruptions
Interruptions due to
maintenance
0
0
5
0
5
0
5
0 0
Table 8.7: Maintenance days

49 | Gas Networks Ireland
Distribution gas flows
Dx* DM I & C
2011 2012 2013 2014 2015
%
Chan
ge
Annual Total MWh 2,997,560 3,312,979 3,407,738 3,460,876 3,629,253 4.9%
Annual Daily
Average MWh 8,212 9,052 8,412 9482 9,943 4.9%
Peak Day
Flow MWh 12,149 12,668 12,541 12,785 13,737 7.4%
Dx NDM I & C
Annual Total MWh 3,716,728 3,990,528 4,030,462 3,916,686 4,315,443
10.2
%
Annual Daily
Average MWh 10,183 10,903 11,025 10,731 11,823
10.2
%
Peak Day
Flow MWh
Dx NDM RES
Annual Total MWh 7,341,417 7,744,001 7,817,915 6,908,094 7,158,766 3.6%
Annual Daily
Average MWh 20,113 21,158 21,438 18,926 19,613 3.6%
Peak Day
Flow MWh
Dx NDM Total
Annual Total MWh 11,058,146 11,734,529 11,848,376 10,824,780 11,474,209 6.0%
Annual Daily
Average MWh 30,296 32,062 32,464 29,657 31,436 6.0%
Peak Day
Flow MWh 74,481 71,705 75,507 65,821 73,463
11.6
%
Dx Total
Annual Total MWh 14,055,705 15,047,508 15,256,114 14,285,656 15,103,462 5.7%
Annual Daily
Average MWh 38,509 41,113 40,875 39,139 41,379 5.7%
Peak Day
Flow MWh 85,525 84,373 87,913 78,393 86,402
10.2
%
Table 9.1: Distribution gas flows
Distribution connections by category
Connections 2011 2012 2013 2014 2015 % Change from 2014
Dx DM I &C 203 207 203 200 212 +6.0%
Dx NDM I &C 23,684 23,967 24,054 24,548 25,111 +2.3%
Dx NDM RES 622,573 626,791 630,921 636,012 642,836 +1.0%
Dx Total 646,460 650,965 655,178 660,760 668,159 +1.1%
Table 9.2 Distribution connections

50 | Gas Networks Ireland
Distribution system length
Table 9.3: Distribution Network Lengths - Systems Length at end 2015.
New Connections by category
Meters 2011 2012 2013 2014 2015
Mature Housing 5,378 4,722 5,321 4,841 4544
New Housing22 887 874 1,003 1,878 2,804
I & C 867 724 610 681 607
Table 9.4 New Connections by category
14 List of figures
Fig. 2.1 Overview of Gas Networks Ireland Transmission System
Fig. 3.1 Pipeline Network (RoI)
Fig 3.2 Transmission pipeline length
Fig 3.3: Transmission connections
Fig: 4.1: System Throughput Ireland
Fig 4.2: Demand change
Fig: 4.3 Nominated v. target delivery
Fig 4.4: Fuel usage
Fig 4.5: Meter read verification
Fig 4.6: UAG (% Throughput)
Fig 4.7: UAG (Energy)
Fig 4.8: Shrinkage as % of throughput
Fig 4.9: System balancing
Fig 4.10: Compressor station carbon emissions
Fig 4.11: Exit capacity bookings
22 New housing connection records do not currently differentiate between houses and apartments.
Distribution system length
2011 2012 2013 2014 2015
Total Length (km) 11,030 11,131 11,218 11,288 11,339

51 | Gas Networks Ireland
Fig 4.12: Distribution SPC
Fig 4.13: Entry capacity bookings
Fig 5.1: Total gas points and market activity
Fig 5.2: GP activity by category
Fig 8.1: System availability
Fig 8.2: Meter read access rates
Fig 8.3: Meter read rate
Fig 9.1: Distribution system data
Fig: 9.2: New Connections by category
Fig 9.3: Distribution system length (km)
Fig 9.4: New connections
15 List of Tables
Table: 3.1: Transmission pipeline length (Km)
Table 3.2: Transmission connections
Table 4.1: System throughput
Table 4.2: Demand change
Table 4.3: System delivery
Table 4.4: Fuel usage
Table 4.5: Meter read verification
Table 4.6: Unaccounted for gas
Table 4.7: Shrinkage
Table 4.12: Gas Point activity by category
Table 4.9: Compressor stations carbon emissions
Table 4.10: Demand change for the year (KWh)
Table 4.11: Exit capacity bookings
Table 4.12: Gas Point activity by category
Table 4.13: Transmission service standards 2015
Table 4.8: System balancing
Table 8.1: Entry capacity booking
Table 8.2: Systems availability

52 | Gas Networks Ireland
Table 8.3: Shipper operations
Table 8.4: Meter reading
Table: 8.5: Trading and settlements
Table 8.6: Meter data services
Table: 8.7: Maintenance days
Table 9.1: Distribution gas flows
Table 9.2: Distribution connections
Table 9.3: Distribution Network Lengths - Systems Length at end 2015
Table 10.1: High level gas safety statistics